Exhibit 99.1
Form NI 43-101F1 Technical Report Minnesota, USA Zachary J. Black, Jennifer J. Brown, Nicholas Dempers, Thomas L. Drielick, Art S. Ibrado, Erin L. Patterson, Thomas J. Radue, Jeff S. Ubl and Herbert E. Welhener Prepared For:
NorthMet Project
Form NI 43-101F1 Technical Report
DATE AND SIGNATURES PAGE
This report is effective as of March 26, 2018. The Technical Report Contributors’ Professional Qualifications and certificates are attached as Appendix A. These certificates are considered the date and signature of this report in accordance with Form NI 43-101F1.
 | M3-PN150164 26 March 2018 |
i
NorthMet Project
Form NI 43-101F1 Technical Report
Note: This Report contains “forward-looking statements”. Within the meaning of applicable Canadian securities legislation and Section 27A of the United States Securities Act of 1933 and Section 21E of the United States Securities Exchange Act of 1934, forward-looking statements are not, and cannot be, a guarantee of future results or events. Forward looking statements are based on, among other things, opinions, assumptions, estimates and analyses that are subject to significant risks, uncertainties, contingencies and other factors that may cause actual results and events to be materially different from those expressed or implied by the forward-looking statement. All statements in this Report that address events or developments that PolyMet expects to occur in the future are forward-looking statements and are generally, although not always, identified by words such as “expect”, “plan”, “anticipate”, “project”, “target”, “potential”, “schedule”, “forecast”, “budget”, “estimate”, “intend” or “believe” and similar expressions or their negative connotations, or that events or conditions “will”, “would”, “may”, “could”, “should” or “might” occur. These forward-looking statements include, but are not limited to, PolyMet’s objectives, strategies, intentions, expectations, production, costs, capital and exploration expenditures, including an estimated economics of future financial and operating performance and prospects for the possible expansion of the operation based on a PEA-level study and a ramp-up evaluation representing production growth and improved margins mine, life projections, recovery rate and concentrate grade projections, ability to obtain all necessary environmental and government approvals to completion and if undertaking an expansion case, ability to obtain at all, the viability and all information with respect to the ability to develop the Project to additional potential by mining additional resources beyond the permit design at a higher production rate. Prior to any decision to apply for permits to develop the project further, PolyMet would need to complete preliminary and definitive feasibility studies, as well as an analysis of the environmental impact and alternatives of any proposal. In addition, any future proposal would be subject to environmental review and permits, public notice and comment, and approval by appropriate federal and state Agencies. All forward-looking statements in this Report are qualified by this cautionary note.
The material factors or assumptions that PolyMet has identified and were applied by PolyMet in drawing the conclusions or making forecasts or projections set in the forward-looking statements include, but are not limited to:
| · | various economic assumptions, in particular, metal price estimates, set out in Section 22 of this Report and elsewhere; |
| · | certain operational assumptions set out in the Report, including mill recovery, operating scenarios; |
| · | construction schedules and timing issues; and |
| · | assumptions concerning timing and certainty regarding the environmental review and permitting process. |
The risks, uncertainties, contingencies and other factors that may cause actual results and events to differ materially from those expressed or implied by the forward-looking statement may include, but are not limited to, risks generally associated with the mining industry, such as: economic factors (including future commodity prices, currency fluctuations, inflation rates, energy prices and general cost escalation); uncertainties related to the development of the NorthMet Project; dependence on key personnel and employee relations; risks relating to political and social unrest or change, operational risk and hazards, including unanticipated environmental, industrial and geological events and developments and the inability to insure against all risks; failure of plant, equipment, processes, transposition and other infrastructure to operate as anticipated; compliance with governmental and environmental regulations, including permitting requirements; etc., as well as other factors identified and as described in more detail under the heading “Risk Factors” in PolyMet’s most recent Annual Information Form, which may be viewed on www.sedar.com and sec.gov. The list is not exhaustive of the factors that may affect the forward-looking statements. There can be no assurance that such statements will prove to be accurate, and actual results, performance or achievements could differ materially from those expressed in, or implied by, these forward-looking statements. Accordingly, no assurance can be given that any events anticipated by the forward-looking statements will transpire or occur, or if any of them do, what benefits or liabilities PolyMet will derive therefrom. The forward-looking statements reflect the current expectations regarding future events and operating performance and speak only as of the date hereof and PolyMet does not assume any obligation to update the forward-looking statements if circumstances or management’s beliefs, expectations or opinions should change other than as required by applicable law. For the reasons set forth above, undue reliance should not be placed on forward-looking statements.
| M3-PN150164 26 March 2018 |
ii
NorthMet Project
Form NI 43-101F1 Technical Report
Cautionary Note to U.S. Investors – Information Concerning Preparation of Resource Estimates
This Report has been prepared in accordance with the requirements of the securities laws in effect in Canada, which differ from the requirements of United States Securities laws. The terms “mineral reserve”, “proven mineral reserve” and “probable mineral reserve” are Canadian mining terms as defined in accordance with Canadian National Instrument 43-101 – Standards of Disclosure for Mineral Projects (“NI 43-101”) and the Canadian Institute of Mining Metallurgy and Petroleum (the “CIM”) – CIM Definition Standards on Mineral Resources and Mineral Reserves, adopted by the CIM Council, as amended. These definitions differ materially from the definitions in the United States Securities and Exchange Commission’s (“SEC”) Industry Guide 7 under the United States Securities Act of 1933, as amended. Under SEC Industry Guide 7 standards, mineralization cannot be classified as a “reserve” unless the determination has been made that the mineralization could be economically and legally extracted at the time the reserve determination is made. As applied under SEC Industry Guide 7, a “final” or “bankable” feasibility study is required to report reserves, the three-year historical average price is used in any reserve or cash flow analysis to designate reserves, and the primary environmental analysis or report must be filed with the appropriate governmental authority.
In addition, the terms “mineral resource”, “measured mineral resource”, “indicated mineral resource” and “inferred mineral resource” are defined in and required to be disclosed by NI 43-101; however, these terms are not defined terms under SEC Industry Guide 7 and are normally not permitted to be used in reports and registration statements filed with the SEC. Investors are cautioned not to assume that all or any part of a mineral deposit in these categories will ever be converted into SEC Industry Guide 7 reserves. “Inferred mineral resources” have a great amount of uncertainty as to their existence, and great uncertainty as to their economic and legal feasibility. It cannot be assumed that all or any part of an inferred mineral resource will ever be upgraded to a higher category. Under Canadian rules, estimates of inferred mineral resources may not form the basis of feasibility or pre-feasibility studies, except in rare cases. Investors are cautioned not to assume that all or any part of an inferred mineral resource exists or is economically or legally mineable. Disclosure of “contained metal” in a resource is permitted disclosure under Canadian regulations; however, the SEC normally only permits issuers to report mineralization that does not constitute “reserves” by SEC Industry Guide 7 standards as in place tonnage and grade without reference to unit measures.
Accordingly, information concerning mineral deposits contained in this Report may not be comparable to similar information made by public U.S. companies subject to the reporting and disclosure requirements under the United States federal securities laws and the rules and regulations thereunder.
| M3-PN150164 26 March 2018 |
iii
NorthMet Project
Form NI 43-101F1 Technical Report
NORTHMET PROJECT
FORM NI 43-101F1 TECHNICAL REPORT
FORM NI 43-101F1 TECHNICAL REPORT
TABLE OF CONTENTS
SECTION | PAGE |
DATE AND SIGNATURES PAGE | I |
TABLE OF CONTENTS | IV |
LIST OF FIGURES AND ILLUSTRATIONS | XIII |
| LIST OF TABLES | XV |
1 | EXECUTIVE SUMMARY | 19 |
1.1 | Key Results | 19 |
| 1.1.1 | Project Phases | 19 |
| 1.1.2 | Key Results for Both Phases | 20 | ||
| 1.1.3 | Phase I Key Results at 32,000 STPD | 20 | ||
| 1.1.4 | Phase II Key Results at 32,000 STPD | 21 |
1.2 | Location AND Ownership | 21 |
1.3 | Geology And Mineralization | 21 |
1.4 | Status of Exploration | 21 |
1.5 | Mineral Reserve Statement | 22 |
1.6 | Mineral Resource Estimate | 22 |
1.7 | Mining And Processing | 23 |
1.8 | Environmental | 24 |
1.9 | Economics | 24 |
1.10 | Potential Expansion Opportunities – Basis of 59,000 STPD and 118,000 STPD Scenarios | 26 |
1.11 | Conclusions And Recommendations | 27 |
2 | INTRODUCTION | 28 |
2.1 | Purpose | 28 |
2.2 | Sources of Information | 28 |
2.3 | Terms of Reference | 29 |
2.4 | Units of Measure | 31 |
3 | RELIANCE ON OTHER EXPERTS | 32 |
4 | PROPERTY DESCRIPTION AND LOCATION | 33 |
4.1 | Project Location | 33 |
4.2 | Project Ownership | 34 |
4.3 | Mineral Tenure | 34 |
| M3-PN150164 26 March 2018 |
iv
NorthMet Project
Form NI 43-101F1 Technical Report
4.4 | Surface Rights | 35 |
4.5 | Royalties And Encumbrances | 35 |
4.6 | Environmental Liabilities | 35 |
4.7 | Permits | 36 |
4.8 | Social License | 36 |
4.9 | Significant Risk Factors | 36 |
| 4.9.1 | Permitting | 36 |
| 4.9.2 | Project Financing | 36 | ||
| 4.9.3 | Commodity Prices | 37 |
4.10 | Comments on Section 4 | 37 |
5 | ACCESSIBILITY, CLIMATE, LOCAL RESOURCES, INFRASTRUCTURE AND PHYSIOGRAPHY | 38 |
5.1 | Accessibility | 38 |
5.2 | Climate | 38 |
5.3 | Local Resources and Infrastructure | 39 |
5.4 | Physiography | 39 |
5.5 | Sufficiency of Surface Rights | 39 |
6 | HISTORY | 40 |
6.1 | Ownership | 40 |
6.2 | Exploration and Sampling | 40 |
6.3 | Historical Mineral Resource and Reserve Estimates | 40 |
6.4 | Historical Production | 40 |
7 | GEOLOGICAL SETTING AND MINERALIZATION | 41 |
7.1 | Regional Geology | 41 |
| 7.1.1 | Felsic Series | 41 |
| 7.1.2 | Early Gabbro Series | 41 | ||
| 7.1.3 | Anorthositic Series | 41 | ||
| 7.1.4 | Layered Series | 41 |
7.2 | LOCAL AND PROPERTY GEOLOGY | 44 |
| 7.2.1 | Local Lithology | 45 |
| 7.2.2 | Unit Definitions and Descriptions | 47 |
8 | DEPOSIT TYPES | 51 |
9 | EXPLORATION | 52 |
9.1 | Geophysical Sounding | 52 |
9.2 | U.S. Steel Bulk Sampling | 52 |
| M3-PN150164 26 March 2018 |
v
NorthMet Project
Form NI 43-101F1 Technical Report
9.3 | Down-Hole Geophysical Testing | 53 |
10 | DRILLING | 54 |
10.1 | Introduction | 54 |
10.2 | Historic Drilling | 56 |
| 10.2.1 | U.S. Steel Drilling, 1969 – 1974 | 56 |
| 10.2.2 | NERCO Drilling 1991 | 56 |
10.3 | PolyMet Drilling | 56 |
| 10.3.1 | PolyMet Drilling, 1999 – 2000, Reverse Circulation Holes | 56 | ||
| 10.3.2 | PolyMet Drilling, 1999-2000, Diamond Core Holes | 56 | ||
| 10.3.3 | PolyMet Drilling, 2005, Diamond Core Holes | 57 | ||
| 10.3.4 | PolyMet Drilling, 2007, Diamond Core Holes | 57 | ||
| 10.3.5 | PolyMet Drilling, 2010, Diamond Core Holes | 57 |
10.4 | Relevant Results And Interpretation | 58 |
11 | SAMPLE PREPARATION, ANALYSES AND SECURITY | 59 |
11.1 | Historic Sample Preparation, Analysis and Security | 59 |
| 11.1.1 | U.S. Steel and NERCO | 59 | ||
| 11.1.2 | PolyMet Sample Preparation, Analysis and Security | 60 | ||
| 11.1.3 | Sample Preparation | 61 |
11.2 | Analytical History | 61 |
| 11.2.1 | Base Metals | 61 | ||
| 11.2.2 | Platinum Group Elements | 62 | ||
| 11.2.3 | Total Sulfur | 62 |
11.3 | Quality Assurance/Quality Control Procedures | 62 |
| 11.3.1 | Blanks | 63 | ||
| 11.3.2 | Standards | 64 | ||
| 11.3.3 | Duplicates | 66 |
11.4 | Data Entry Validation Controls | 69 |
11.5 | Core Storage And Sample Security | 69 |
11.6 | Opinion On Adequacy | 69 |
12 | DATA VERIFICATION | 70 |
12.1 | PolyMet Data Compilation And Verification 2004 | 70 |
12.2 | Database Audit | 70 |
12.3 | Certificates | 71 |
12.4 | Adequacy Of Data | 71 |
13 | MINERAL PROCESSING AND METALLURGICAL TESTING | 72 |
13.1 | Introduction | 72 |
13.2 | Comminution Circuit Test Work And Process Development | 74 |
| M3-PN150164 26 March 2018 |
vi
NorthMet Project
Form NI 43-101F1 Technical Report
13.3 | Flotation Circuit Test Work And Process Development | 75 |
13.4 | Flotation Circuit Design | 80 |
| 13.4.1 | Flotation Circuit Simulation | 82 |
13.5 | Metallurgical Modelling For Recovery And Concentrate Quality | 84 |
| 13.5.1 | Cobalt | 85 |
13.6 | Hydrometallurgical Test Work | 89 |
| 13.6.1 | PLATSOL™ Leaching Pilot Plant Testing | 90 | ||
| 13.6.2 | Precipitation of PGMs by Copper Sulfide | 92 | ||
| 13.6.3 | Copper Concentrate Enrichment | 93 | ||
| 13.6.4 | Residual Copper Precipitation | 95 | ||
| 13.6.5 | Bulk Iron/Aluminum Removal | 96 | ||
| 13.6.6 | Mixed Hydroxide Precipitation (MHP) | 97 | ||
| 13.6.7 | Magnesium Removal | 98 |
14 | MINERAL RESOURCE ESTIMATES | 99 |
14.1 | Data | 99 |
14.2 | Block Model Physical Limits | 99 |
14.3 | Geological Models | 99 |
| 14.3.1 | Density | 101 |
14.4 | Exploratory Data Analysis | 101 |
| 14.4.1 | Sample Statistics | 101 | ||
| 14.4.2 | Correlation Analysis | 104 | ||
| 14.4.3 | Contact Plot Analysis | 106 |
14.5 | Estimation Methodology | 110 |
| 14.5.1 | Capping | 110 | ||
| 14.5.2 | Composite Study | 113 | ||
| 14.5.3 | Variograms | 116 | ||
| 14.5.4 | Estimation Strategy | 118 | ||
| 14.5.5 | Mineral Resource Classification | 119 | ||
| 14.5.6 | Model Validation | 120 |
14.6 | Mineral Resources | 127 |
| 14.6.1 | Net Smelter Return (NSR) and Cutoff | 127 | ||
| 14.6.2 | Test for Reasonable Prospect for Eventual Economic Extraction | 127 | ||
| 14.6.3 | Resource Statement | 128 |
15 | MINERAL RESERVE ESTIMATES | 129 |
15.1 | Calculation Parameters | 129 |
| 15.1.1 | Pit Slopes | 129 | ||
| 15.1.2 | Dilution and Mining Losses | 129 | ||
| 15.1.3 | Cutoff and NSR Calculation | 130 |
15.2 | Mineral Reserve Estimate | 132 |
| M3-PN150164 26 March 2018 |
vii
NorthMet Project
Form NI 43-101F1 Technical Report
15.3 | Factors that may Affect the Mineral Reserve Estimate | 132 |
16 | MINING METHODS | 133 |
16.1 | Open Pit Mine Plan | 133 |
16.2 | Resource Model Review | 135 |
16.3 | Definition Of Material Types | 135 |
| 16.3.1 | Ore Classification | 135 | ||
| 16.3.2 | Waste Rock Classification | 135 | ||
| 16.3.3 | Waste Rock Stockpile Liners | 136 | ||
| 16.3.4 | Overburden Classification | 136 |
16.4 | Geotechnical | 137 |
16.5 | Pit Design | 137 |
16.6 | Preproduction Development | 138 |
16.7 | Production Schedule | 138 |
| 16.7.1 | Yearly Production | 139 | ||
| 16.7.2 | Pit and Stockpile Progression Maps | 142 |
16.8 | Water Management System | 145 |
16.9 | Mining Equipment | 147 |
| 16.9.1 | Production Schedule Parameters | 147 | ||
| 16.9.2 | Drill Equipment and Blast Parameters | 148 | ||
| 16.9.3 | Loading Equipment Requirements | 149 | ||
| 16.9.4 | Hauling Equipment Requirements | 150 | ||
| 16.9.5 | Auxiliary Equipment Requirements | 150 |
16.10 | Railroad | 151 |
16.11 | Mine Personnel | 152 |
17 | RECOVERY METHODS | 155 |
17.1 | Plant Design | 155 |
| 17.1.1 | Introduction | 155 | ||
| 17.1.2 | Crushing and Material Handling | 156 | ||
| 17.1.3 | Flotation | 159 | ||
| 17.1.4 | Concentrate Handling | 161 | ||
| 17.1.5 | Reagent Services | 161 | ||
| 17.1.6 | Piping Systems | 162 | ||
| 17.1.7 | Air Systems | 163 | ||
| 17.1.8 | Plant Electrical Distribution | 164 | ||
| 17.1.9 | Plant Instrumentation | 164 |
17.2 | Process Plant Flowsheet Development | 164 |
| 17.2.1 | Primary and Secondary Crushing | 164 | ||
| 17.2.2 | Milling | 165 | ||
| 17.2.3 | Flotation | 168 | ||
| 17.2.4 | Tailings Disposal | 171 |
| M3-PN150164 26 March 2018 |
viii
NorthMet Project
Form NI 43-101F1 Technical Report
| 17.2.5 | Concentrate Thickening and Filtration | 172 | ||
| 17.2.6 | Concentrate Storage | 174 | ||
| 17.2.7 | Reagents | 174 | ||
| 17.2.8 | Air Services | 176 | ||
| 17.2.9 | Water Circuits | 176 | ||
| 17.2.10 | Sampling and Metal Accounting | 176 |
17.3 | HYDROMETALLURGICAL PROCESSING | 177 |
17.4 | PHASE II – OPTIONAL HYDROMETALLURGICAL PLANT | 177 |
| 17.4.1 | Autoclave | 180 | ||
| 17.4.2 | Gold and Platinum Group Metals Recovery | 180 | ||
| 17.4.3 | Concentrate Enrichment | 181 | ||
| 17.4.4 | Copper Sulfide Precipitation | 181 | ||
| 17.4.5 | Iron, Aluminum and Acid Removal | 181 | ||
| 17.4.6 | Mixed Hydroxide Precipitation Recovery | 182 | ||
| 17.4.7 | Magnesium Removal | 182 | ||
| 17.4.8 | Process Consumables | 182 | ||
| 17.4.9 | Hydrometallurgical Plant Water | 183 | ||
| 17.4.10 | Metal Recoveries | 183 |
17.5 | PLANT SITE AIR QUALITY MANAGEMENT | 183 |
| 17.5.1 | Hydrometallurgical Residue Management | 184 | ||
| 17.5.2 | Hydrometallurgical Residue Cell Design and Operations | 184 |
| 17.6 | WATER MANAGEMENT | 184 |
| 17.6.1 | Hydrometallurgical Plant | 184 |
18 | PROJECT INFRASTRUCTURE | 185 |
18.1 | PLANT AND ADMINISTRATIVE INFRASTRUCTURE | 185 |
| 18.1.1 | Asset Preservation | 185 | ||
| 18.1.2 | Plant Workshops | 185 | ||
| 18.1.3 | Plant Warehouses | 185 | ||
| 18.1.4 | Administration Offices | 186 | ||
| 18.1.5 | Site First Aid Station | 186 | ||
| 18.1.6 | Laboratory | 186 |
18.2 | Mine Infrastructure | 186 |
| 18.2.1 | Mine Workshops, Warehouses and Offices | 186 | ||
| 18.2.2 | Mine Site Service and Refueling Facility | 186 | ||
| 18.2.3 | Rail Loadout | 186 |
18.3 | Haul and Access Roads | 187 |
18.4 | Rail Facilities | 187 |
18.5 | Water Supply | 187 |
| 18.5.1 | Raw Water Supply | 187 | ||
| 18.5.2 | Potable Water Distribution | 187 | ||
| 18.5.3 | Fire Water Distribution | 187 | ||
| 18.5.4 | Sewage Collection and Treatment | 187 |
| M3-PN150164 26 March 2018 |
ix
NorthMet Project
Form NI 43-101F1 Technical Report
18.6 | Flotation Tailings Basin (FTB) | 187 |
18.7 | Waste Water Treatment | 188 |
| 18.7.1 | Mine Site Waste Water Collection and Distribution | 188 | ||
| 18.7.2 | Waste Water Treatment System | 188 |
18.8 | Power Supply | 189 |
| 18.8.1 | Plant Power Supply | 189 | ||
| 18.8.2 | Mine Site Power Supply | 189 | ||
| 18.8.3 | Emergency Power Plant | 189 |
18.9 | Natural Gas Supply | 190 |
18.10 | Accommodations | 190 |
19 | MARKET STUDIES AND CONTRACTS | 191 |
19.1 | Commodity Price Projections | 191 |
19.2 | Contracts | 191 |
20 | ENVIRONMENTAL STUDIES, PERMITTING AND SOCIAL OR COMMUNITY IMPACT | 192 |
20.1 | Environmental Review and Permitting | 192 |
20.2 | Baseline Studies | 193 |
20.3 | Environmental Considerations | 193 |
| 20.3.1 | Waste Management | 194 | ||
| 20.3.2 | Water Management | 194 | ||
| 20.3.3 | Air Management | 195 | ||
| 20.3.4 | Land Management | 195 |
20.4 | Social Issues | 195 |
| 20.4.1 | Labor and Employment Support | 195 | ||
| 20.4.2 | Economic Impact | 195 | ||
| 20.4.3 | Treaties and Indigenous Groups | 196 |
20.5 | Closure Plan and Financial Assurance | 196 |
20.6 | Discussion on Permitting Risks to Mineral Resources and Mineral Reserves | 197 |
20.7 | Comments on Section 20 | 197 |
21 | CAPITAL AND OPERATING COSTS | 198 |
21.1 | Capital Cost Estimate | 198 |
| 21.1.1 | Basis of Phase I Capital Cost Estimate | 199 | ||
| 21.1.2 | Hydrometallurgical Plant Cost Estimate | 206 | ||
| 21.1.3 | Indirect Costs | 207 |
21.2 | Operating Cost Estimate | 210 |
| 21.2.1 | Mine Operating Cost | 210 | ||
| 21.2.2 | Process Plant and Assay Operating Cost Estimate Summary | 213 | ||
| 21.2.3 | Basis of Process Plant Operating Cost Estimate | 213 | ||
| 21.2.4 | Hydrometallurgical Plant (Phase II) Operating Cost Estimate Summary | 222 |
| M3-PN150164 26 March 2018 |
x
NorthMet Project
Form NI 43-101F1 Technical Report
| 21.2.5 | Basis of Hydrometallurgical Plant (Phase II) Operating Cost | 222 |
| 22 | ECONOMIC ANALYSIS | 224 |
| 22.1 | FEASIBILITY STUDY ECONOMIC ANALYSIS | 224 |
| 22.1.1 | Economic Assumptions | 225 | |
| 22.1.2 | Key Data and Economic Analysis | 225 | |
| 22.1.3 | Capital Costs | 228 | |
| 22.1.4 | Operating Plans and Costs | 228 | |
| 22.1.5 | Sustaining Capital | 228 |
| 22.2 | FINANCIAL MODEL | 229 |
| 23 | ADJACENT PROPERTIES | 231 |
| 24 | OTHER RELEVANT DATA AND INFORMATION | 232 |
| 24.1 | PROJECT IMPLEMENTATION | 232 |
| 24.1.1 | Engineering | 232 | |
| 24.1.2 | Demolition | 234 | |
| 24.1.3 | Execution and Construction | 234 | |
| 24.1.4 | Ramp-up Evaluation | 235 |
| 24.2 | POTENTIAL OPPORTUNITIES | 239 |
| 24.2.1 | Summary | 239 | |
| 24.2.2 | Introduction | 239 | |
| 24.2.3 | Mill Throughput Tonnages | 240 | |
| 24.2.4 | Mine Site Modifications | 241 | |
| 24.2.5 | Plant Site Modifications | 242 | |
| 24.2.6 | Financial Outlook | 243 |
| 24.3 | ECONOMIC ANALYSIS | 244 |
| 25 | INTERPRETATION AND CONCLUSIONS | 249 |
| 25.1 | INTRODUCTION | 249 |
| 25.2 | INTERPRETATION | 249 |
| 25.2.1 | Surface Rights, Royalties, and Mineral Tenure | 249 | |
| 25.2.2 | Geology and Mineralization | 249 | |
| 25.2.3 | Exploration | 249 | |
| 25.2.4 | Drilling and Sampling | 249 | |
| 25.2.5 | Data Verification | 249 | |
| 25.2.6 | Metallurgy | 250 | |
| 25.2.7 | Mineral Resources | 250 | |
| 25.2.8 | Mineral Reserves | 250 | |
| 25.2.9 | Mine Plan and Schedule | 250 | |
| 25.2.10 | Metallurgical Recovery | 250 | |
| 25.2.11 | Infrastructure | 250 | |
| 25.2.12 | Market Studies and Contracts | 250 | |
| 25.2.13 | Environment, Permits, and Social and Community Impacts | 251 | |
| 25.2.14 | Capital and Operating Costs | 251 | |
| 25.2.15 | Economic Analysis | 251 |
| M3-PN150164 26 March 2018 |
xi
NorthMet Project
Form NI 43-101F1 Technical Report
| 25.3 | Conclusions | 251 |
| 25.4 | Risks | 251 |
| 25.5 | Opportunities | 254 |
| 26 | RECOMMENDATIONS | 256 |
| 27 | REFERENCES | 257 |
| APPENDIX A – PROFESSIONAL QUALIFICATIONS AND CERTIFICATES OF QUALIFIED PERSONS | 261 | |
| M3-PN150164 26 March 2018 |
xii
NorthMet Project
Form NI 43-101F1 Technical Report
LIST OF FIGURES AND ILLUSTRATIONS
| FIGURE | DESCRIPTION | PAGE |
| Figure 4-1: Property Layout Map | 33 | |
| Figure 7-1: Regional Geology | 42 | |
| Figure 7-2: Copper-Nickel Deposits in the Duluth Complex (after Severson) | 43 | |
| Figure 7-3: NorthMet Stratigraphic Column (after Geerts, 1994) | 45 | |
| Figure 7-4: NorthMet Property Bedrock Geology | 46 | |
| Figure 7-5: NorthMet “Magenta Zone” in Cross Section | 50 | |
| Figure 10-1: Drill-hole Collar Location by Campaign | 55 | |
| Figure 11-1: Copper Blank Analysis | 64 | |
| Figure 11-2: Nickel Blank Analysis | 64 | |
| Figure 11-3: Copper Results for Standard 4-1 | 65 | |
| Figure 11-4: Nickel Results for Standard 4-1 | 65 | |
| Figure 11-5: Copper and Nickel ¼ Core Duplicate Analysis | 66 | |
| Figure 11-6: Copper and Nickel 1/8 Core Duplicate Analysis | 67 | |
| Figure 11-7: Copper Pulp Duplicate Analysis | 68 | |
| Figure 11-8: Nickel Pulp Duplicate Analysis | 68 | |
| Figure 13-1: NorthMet Process Block Flow | 73 | |
| Figure 13-2: Pilot Plant Flowsheet | 77 | |
| Figure 13-3: Comparative Recoveries between C9 Pilot Work and Previous Pilot Work | 78 | |
| Figure 13-4: General Block Flow – Rate Tested and Kinetic-Derived Process Streams from Report NM 1-2015 NorthMet Feb 2015 | 81 | |
| Figure 13-5: Total Cu Recovery vs. Cu Head | 86 | |
| Figure 13-6: Total Ni Recovery vs. Ni Head | 86 | |
| Figure 13-7: Total Co Recovery vs. Co Head | 86 | |
| Figure 13-8: Final Tail S Assay vs. S Head | 86 | |
| Figure 13-9: Total Pt Recovery vs. Pt Head | 87 | |
| Figure 13-10: Total Pd Recovery vs. Pd Head | 87 | |
| Figure 13-11: Total Au Recovery vs. Au Head | 87 | |
| Figure 13-12: Total Ag Recovery vs. Ag Head | 87 | |
| Figure 13-13: Hydrometallurgical Pilot Plant Flowsheet | 89 | |
| Figure 13-14: ACD Liquor Ni, Cu, Mg PLS Trends | 91 | |
| Figure 13-15: ACD Residue Trends | 91 | |
| Figure 13-16: Correlation between Cu and ORP Observed for Copper Enrichment Trials | 94 | |
| M3-PN150164 26 March 2018 |
xiii
NorthMet Project
Form NI 43-101F1 Technical Report
| Figure 13-17: Correlation Between ORP and Soluble Copper Concentration | 96 |
| Figure 14-1: Estimation Domains | 100 |
| Figure 14-2: Copper Correlation Plots | 105 |
| Figure 14-3: Contact Plot Virginia Formation and Unit 1 | 106 |
| Figure 14-4: Contact Plot Unit 1 and Unit 3 | 107 |
| Figure 14-5: Contact Plot Unit 3 and Unit 5 | 108 |
| Figure 14-6: Contact Plot Unit 5 and Unit 6 | 109 |
| Figure 14-7: Contact Plot Unit 6 and Unit 7 | 110 |
| Figure 14-8: Tukey Box Plots for Unit 1 | 112 |
| Figure 14-9: Copper Composite Study | 113 |
| Figure 14-10: North – South Section Looking East Displaying the Dynamic Search Ellipses | 119 |
| Figure 14-11: Model Comparison Cumulative Frequency Plot (NN red, ID blue, Composites Black, OK Green) | 123 |
| Figure 14-12: Domain 1 Copper Swath Plot Along Rotated Easting | 124 |
| Figure 14-13: Copper Cross Section Along Rotated Easting | 125 |
| Figure 14-14: Copper Long Section Along Rotated Northing | 126 |
| Figure 14-15: Copper Plan Section | 126 |
| Figure 16-1: Mine Site Layout | 134 |
| Figure 16-2: Pit Shell Map – End of Year 1 | 143 |
| Figure 16-3: Pit Shell Map – End of Year 20 | 144 |
| Figure 16-4: Process Plant Water Balance | 146 |
| Figure 17-1: Plant Aerial View | 156 |
| Figure 17-2: Current Concentrator Arrangement | 158 |
| Figure 17-3: Milling Circuit | 159 |
| Figure 17-4: Flotation Circuit | 160 |
| Figure 17-5: Overall Plant Process Flow Diagram | 167 |
| Figure 17-6: Phase I & II - Overall Plant Process Flow Diagram, Highlighting the Hydrometallurgical Plant Section | 179 |
| Figure 24-1: Project Execution Schedule Summary | 236 |
| Figure 24-2: Project Execution Schedule Summary Continued | 237 |
| Figure 24-3: Project Critical Path | 238 |
| M3-PN150164 26 March 2018 |
xiv
NorthMet Project
Form NI 43-101F1 Technical Report
LIST OF TABLES
| TABLE | DESCRIPTION | PAGE |
| Table 1-1: Mineral Reserve Statement – January 2018 | 22 | |
| Table 1-2: Summary Mineral Resource Statement for the NorthMet Project Inclusive of Mineral Reserves | 23 | |
| Table 1-3: Capital Expenditure & Operating Costs – Phase I and Phase I & II | 25 | |
| Table 1-4: Price Assumptions in the Financial Analysis | 25 | |
| Table 1-5: Financial Summary – 32,000 STPD | 26 | |
| Table 2-1: List of Qualified Persons | 28 | |
| Table 2-2: Units, Terms and Abbreviations | 29 | |
| Table 5-1: Current Iron Ore Mines on the Mesabi Iron Range | 38 | |
| Table 10-1: NorthMet Project Drill Hole Summary | 54 | |
| Table 10-2: Summary of Core Recoveries and RQD Measurements (includes all drilling through 2010) | 58 | |
| Table 11-1: Detection Limits of Elements | 62 | |
| Table 11-2: Detection Limits | 62 | |
| Table 11-3: Details of Sampling of U.S. Steel Core by PolyMet | 63 | |
| Table 12-1: Summary of the Analytical Data Used in the Estimation of Mineral Resources | 71 | |
| Table 13-1: Summary of Comminution Test Work Results | 74 | |
| Table 13-2: Summary of SMC Test Work Results Conducted by Hazen Research | 75 | |
| Table 13-3: Milling Circuit Design | 75 | |
| Table 13-4: Summary of Pilot Plant Test Work Results on Sample C9 | 77 | |
| Table 13-5: Projected Metallurgy of Cu-Ni Separation LCT of C9 Pilot Cleaner Concentrate | 79 | |
| Table 13-6: Summary of Laboratory Test Work Results on Sample C10 | 79 | |
| Table 13-7: Flotation Stage Design Parameters | 80 | |
| Table 13-8: Flotation Plant Simulation and Design Parameters | 82 | |
| Table 13-9: Summary of Flotation Circuit Simulation | 83 | |
| Table 13-10: NorthMet Tank Cell Sizing and Selection | 84 | |
| Table 13-11: Summary of C-9 and C-10 Metallurgy Compared to Model | 88 | |
| Table 13-12: Flotation Concentrate Head Assays Used in the Test Campaigns (C1 & C2) | 90 | |
| Table 13-13: Average Autoclave Feed Flowrates | 90 | |
| Table 13-14: Base Metal and PGM Recoveries | 92 | |
| Table 13-15: Summary of PGM Precipitation Operating Parameters | 92 | |
| Table 13-16: Comparison between PGM Precipitation Circuit Feed and Filtrate Concentrations | 93 | |
| Table 13-17: Operating Conditions and Feed Parameter for Copper Concentrate Enrichment | 94 | |
| M3-PN150164 26 March 2018 |
xv
NorthMet Project
Form NI 43-101F1 Technical Report
| Table 13-18: Head and Copper Enrichment Solids and Filtrate Composite Assays | 95 |
| Table 13-19: Soluble Copper Precipitation Parameters | 95 |
| Table 13-20: NaHS Product Filter Cake Assays | 96 |
| Table 13-21: Test Conditions, Target Ni Concentrations and Ni and Co Feed Concentrations for MHP Tests | 97 |
| Table 13-22: MHP Stage 1 Final Product Analysis and Distribution for Campaigns C1 & C2 | 97 |
| Table 13-23: Test Conditions for Bulk Magnesium Removal | 98 |
| Table 14-1: Specific Gravity Average per Unit (October 15 Dataset) | 101 |
| Table 14-2: Copper Sample Statistics | 101 |
| Table 14-3:Nickel Sample Statistics | 102 |
| Table 14-4: Platinum Sample Statistics | 102 |
| Table 14-5: Palladium Sample Statistics | 102 |
| Table 14-6: Gold Sample Statistics | 102 |
| Table 14-7: Silver Sample Statistics | 103 |
| Table 14-8:Cobalt Sample Statistics | 103 |
| Table 14-9: Sulfur Sample Statistics | 103 |
| Table 14-10: Spearman Rank Correlation Matrix | 104 |
| Table 14-11: Summary of Capped Values for Each Metal | 113 |
| Table 14-12: Copper Capped Composite Descriptive Statistics | 114 |
| Table 14-13: Nickel Capped Composite Descriptive Statistics | 114 |
| Table 14-14: Platinum Capped Composite Descriptive Statistics | 114 |
| Table 14-15: Palladium Capped Composite Descriptive Statistics | 114 |
| Table 14-16: Gold Capped Composite Descriptive Statistics | 115 |
| Table 14-17: Silver Capped Composite Descriptive Statistics | 115 |
| Table 14-18: Cobalt Capped Composite Descriptive Statistics | 115 |
| Table 14-19: Sulfur Capped Composite Descriptive Statistics | 115 |
| Table 14-20: Unit Variogram Parameters | 116 |
| Table 14-21: Units 20 and 3, 5, 6, and 7 Variogram Parameters | 117 |
| Table 14-22: Magenta Zone Variogram Parameters | 118 |
| Table 14-23: Search Volume Parameters for all Domains | 119 |
| Table 14-24: Mineral Resource Classification Criteria | 120 |
| Table 14-25: Copper Model Statistics | 120 |
| Table 14-26: Nickel Model Statistics | 120 |
| Table 14-27: Platinum Model Statistics | 121 |
| Table 14-28: Palladium Model Statistics | 121 |
| M3-PN150164 26 March 2018 |
xvi
NorthMet Project
Form NI 43-101F1 Technical Report
| Table 14-29: Gold Model Statistics | 121 |
| Table 14-30: Silver Model Statistics | 121 |
| Table 14-31: Cobalt Model Statistics | 122 |
| Table 14-32: Sulfur Model Statistics | 122 |
| Table 14-33: Resource Metal Prices and Estimated Recoveries | 127 |
| Table 14-34: Estimated Process Operating Costs | 127 |
| Table 14-35: Mineral Resource Statement for the NorthMet Project Inclusive of Mineral Reserves, Hard Rock Consulting, LLC, January 1, 2018 | 128 |
| Table 15-1: Mineral Reserve NSR Cutoff | 130 |
| Table 15-2: Mineral Reserve Metal Prices | 130 |
| Table 15-3: Plant Recovery to Concentrates of Reserve Blocks | 131 |
| Table 15-4: Summary of Concentrate Treatment Terms | 131 |
| Table 15-5: Mineral Reserve Statement – December 2017 | 132 |
| Table 16-1: Waste Rock Classification | 135 |
| Table 16-2: Pit Design Criteria | 138 |
| Table 16-3: Yearly Mine Production Schedule | 140 |
| Table 16-4: Yearly Mill Feed Schedule | 141 |
| Table 16-5: Mine Schedule Parameters | 147 |
| Table 16-6: Major Mine Equipment Mechanical Availability, Utilization and Fleet Size | 148 |
| Table 16-7: Drill Productivity | 148 |
| Table 16-8: Loading Equipment Productivity | 149 |
| Table 16-9: Truck Fleet Requirements | 150 |
| Table 16-10: Mine Operations and Maintenance Personnel | 153 |
| Table 16-11: Mine Operations and Maintenance Salary Personnel | 154 |
| Table 17-1: List of Major Equipment in the Hydrometallurgical Plant | 178 |
| Table 17-2: Materials Consumed by the Hydrometallurgical Plant Process | 182 |
| Table 17-3: Hydrometallurgical Plant Metal Recoveries | 183 |
| Table 20-1: Permits Under Application | 193 |
| Table 21-1: Phase I Direct Costs | 199 |
| Table 21-2: Summary of Mine Capital Cost ($USx1000) | 201 |
| Table 21-3: Mine Capital Cost by Year | 202 |
| Table 21-4: Phase II Direct Costs (Hydrometallurgical Plant) | 207 |
| Table 21-5: Direct and Indirect Costs (Phase I & II) | 209 |
| Table 21-6: Mine Operating Costs by Process | 210 |
| M3-PN150164 26 March 2018 |
xvii
NorthMet Project
Form NI 43-101F1 Technical Report
| Table 21-7: Mine Operating Costs Per Ton Moved ($000) by Cost Centers | 212 |
| Table 21-8: Phase I Operating Cost Estimate Summary | 213 |
| Table 21-9: Labor Schedule and Rates | 215 |
| Table 21-10: Summary of Electric Power Costs | 217 |
| Table 21-11: Process Equipment Power Draw Summary | 218 |
| Table 21-12: HVAC and Dust Collection Electric Power Summary | 219 |
| Table 21-13: Summary of Natural Gas Costs (Heating) | 219 |
| Table 21-14: HVAC Natural Gas Demand | 219 |
| Table 21-15: Process Plant Reagent and Consumable Consumption and Costs | 220 |
| Table 21-16: Maintenance, Parts and Supplies Factors | 221 |
| Table 21-17: Breakdown of Laboratory Assay Costs | 222 |
| Table 21-18: Phase II Operating Cost Estimate Summary | 222 |
| Table 22-1: LOM Operating Cost Highlights – Phase I and Phase I & II Combined | 225 |
| Table 22-2: 32,000 STPD Base Case (Phase I) Price and Operating Assumptions and Key Production Numbers | 226 |
| Table 22-3: Base Case (Phase I & II) Price and Operating Assumptions and Key Production Numbers | 226 |
| Table 22-4: Phase I Economic Projections on a Range of Metal Price Assumptions | 227 |
| Table 22-5: Phase I & II Economic Projections on a Range of Metal Price Assumptions | 227 |
| Table 22-6: Initial and Expansion Capital Summary | 228 |
| Table 22-7: Phase I and Phase I & II Operating Cost Summary | 228 |
| Table 22-8: Sustaining Capital Summary | 229 |
| Table 22-9: NorthMet Financial Model – 32,000 STPD with Hydrometallurgical Plant (Phase I and Phase II Combined | 230 |
| Table 24-1: A Comparison of the Mill Feed Tonnages between 59,000 and 118,000 STPD Throughputs | 240 |
| Table 24-2: Comparison of Cost Inputs to NSR Cutoff Grade for Various Throughputs (STPD) | 241 |
| Table 24-3: LOM Operating Highlights for 59,000 STPD & 118,000 STPD | 244 |
| Table 24-4: 59,000 STPD Economic Highlights | 245 |
| Table 24-5: 118,000 STPD Economic Highlights | 246 |
| Table 24-6: Metal Price Sensitivity Analysis for 59,000 STPD Phase I | 247 |
| Table 24-7: Metal Price Sensitivity Analysis for 59,000 STPD Phase I and II | 247 |
| Table 24-8: Metal Price Sensitivity Analysis for 118,000 STPD Phase I | 248 |
| Table 24-9: Metal Price Sensitivity Analysis for 118,000 STPD Phase I and II | 248 |
| Table 25-1: Project Risks Identified for the Feasibility Study | 252 |
| Table 25-2: Project Opportunities Identified for the Feasibility Study | 255 |
| M3-PN150164 26 March 2018 |
xviii
NorthMet Project
Form NI 43-101F1 Technical Report
| 1 | EXECUTIVE SUMMARY |
Poly Met Mining, Inc. (PolyMet US), a Minnesota company and a wholly owned subsidiary of PolyMet Mining Corp. (PolyMet), contracted M3 Engineering & Technology Corporation (M3) to complete an updated Technical Report (the “Study”), at a Feasibility Study level, for the NorthMet Copper and Nickel Project (the “Project” or “NorthMet”) located near Hoyt Lakes, Minnesota, US. PolyMet US also retained Independent Mining Consultants (IMC), Senet, (Pty) Ltd. (Senet), Hard Rock Consulting, LLC (HRC) and Barr Engineering Company (Barr) to contribute to this Study. The update is based on feasibility-study-level engineering as well as the Final Environmental Impact Statement (FEIS, Nov 2015) and recently released draft environmental permits (Jan 2018) for the development of a 32,000-short ton per day (STPD) 225 million short ton production schedule.
PolyMet US also requested that M3 investigate potential project economic valuations using scoping or preliminary economic assessment (PEA) level mine designs at higher throughputs (59,000 and 118,000 STPD). The estimates for these two scenarios are preliminary in nature and both scenarios include Inferred Mineral Resources that are considered too speculative geologically to have the economic considerations applied to them that would enable them to be categorized as Mineral Reserves. There is no certainty that the results for these two cases will be realized. Mineral Resources that are not Mineral Reserves do not have demonstrated economic viability and there is no certainty that Mineral Resources will become Mineral Reserves.
The purpose of the additional investigations is to quantify the potential viability of identified resources at higher throughputs that are not currently permitted for development. Development of those additional resources would require additional engineering, environmental review and permitting and would require changes in infrastructure that would require significant capital investment. The economic viability of these additional resources has not been demonstrated to date. These scenarios are only being presented in Section 1.10 and Section 24 of this report and, for clarity, they have not been included with the economic analysis presented in Section 22 of this report. In no way do these scenarios demonstrate economic viability.
Based on these results, M3 recommends that additional engineering and environmental studies be performed to further refine the costs, valuations and environmental requirements of the potential production scenarios which may have the opportunity to create additional value.
1.1 Key Results
1.1.1 Project Phases
This Study details the construction and operation of the Project in two distinct phases. These phases are:
| · | Phase I: Involves development of the NorthMet 225-million-ton orebody into an operating mine producing 32,000 STPD of ore over a 20-year life and rehabilitating an existing taconite processing plant, tailings storage facility and infrastructure (also referred to as the “Erie Plant”) located approximately eight miles to the west. Phase I would produce commercial grade copper and nickel concentrates for which Glencore AG (“Glencore”) currently holds offtake agreements payable at market terms. |
| · | Phase II: Involves construction and operation of a hydrometallurgical plant to treat nickel sulfide concentrates into upgraded nickel-cobalt hydroxide and recover additional copper and Platinum Group Metals (“PGM”). |
Execution of Phase II would be at the company’s discretion. However, both Phase I and Phase II are currently being permitted, having been included in the FEIS and draft permits.
For the purposes of this Study, all monetary values are in United States Dollars ($). All references to “ton” or “tons” in this Study refer to US short tons except as noted otherwise. Life of Mine (LOM capital and operating costs are reported in Table 1‑3. Metal pricing used for the financial analysis is shown in Table 1‑4. Key financial metrics and production figures are shown in Table 1‑5.
| M3-PN150164 26 March 2018 |
19
NorthMet Project
Form NI 43-101F1 Technical Report
| 1.1.2 | Key Results for Both Phases |
Both Phase I and Phase II were developed as Class 3 estimates as defined by AACE International (AACEI), which corresponds to estimates performed at a feasibility level. Key results common to both phases are as follows:
| · | Total proven and probable mineral reserves for the Project are estimated to be 254.669 million tons within the pit footprints evaluated in the FEIS and draft permits. Head grades for the reserve are shown in Table 1‑1. |
| · | Of the mineral reserve tonnage, 225 million tons (Proven and Probable) are included in the 32,000 STPD draft permit mine plan based on metal prices shown in Table 1‑4. For reference, the mill copper equivalent is 0.586%. |
| · | The mine plan at 32,000 STPD yields a mine life of approximately 20 years. |
| · | Measured and indicated resources total 649.3 million tons at a copper equivalent grade of 0.496%, inclusive of mineral reserves, and using the price assumptions reported in Table 14‑33. |
| · | Inferred resources are estimated at 508.9 million tons at a copper equivalent grade of 0.489% (See Table 1‑2). |
| · | Refurbishing the existing Erie Plant and associated infrastructure with a modern semi-autogenous grinding (SAG) mill and flotation plant is technically viable and will produce saleable copper and nickel concentrate products for the 32,000 STPD design used in this Study. PolyMet US plans to process 11.6 million tons of ore per year, or an average of 32,000 STPD, representing approximately one third of the historic capacity of the plant. |
| · | PolyMet US has secured offtake agreements at market terms for copper, nickel, cobalt and PGM products from Glencore. |
1.1.3 Phase I Key Results at 32,000 STPD
Under this phase, PolyMet US plans to refurbish the primary crushing circuit and replace the existing rod and ball mill circuits with a new modern semi autogenous grinding (SAG) mill, a new large ball mill and a new flotation circuit. Once upgraded, the Erie Plant will produce copper and nickel concentrates that will be transported by rail to third-party smelting facilities. For Phase I, the 32,000 STPD case for this Study shows:
| · | Initial Capital Cost Estimate (CAPEX) of $945 million, |
| · | After-tax Net Present Value at a 7% discount rate (NPV@7%) of $173.3 million, and |
| · | Internal Rate of Return (IRR) of 9.6%. |
Under Phase I, which only includes revenues based on concentrate sales, payable metals in the concentrate are estimated as 1,096 million lbs of copper, 133 million lbs of nickel, a combined 1.05 million oz of platinum, palladium and gold, 0.96 million oz of silver and 5.6 million lbs of cobalt. Palladium is the predominant PGM product, totalling 0.836 million oz.
Total life-of-mine (LOM) copper recovered in concentrates is expected to be 91.8%, with 63.5% recovery of nickel in concentrates under this phase.
| M3-PN150164 26 March 2018 |
20
NorthMet Project
Form NI 43-101F1 Technical Report
| 1.1.4 | Phase II Key Results at 32,000 STPD |
Phase II of the Project involves constructing a Hydrometallurgical Process that includes a 1,000 STPD autoclave to solubilize the nickel concentrates to produce a nickel-cobalt hydroxide and a precious metals precipitate. Copper precipitates from the process will be combined with the copper concentrate. Timing of Phase II will depend on the nickel concentrate market. For Phase II, the 32,000 STPD case for this Study shows improved economics as follows:
| · | Initial CAPEX of $1,204 million (inclusive of Phase I costs), |
| · | After-tax NPV@7% of $271 million, and |
| · | IRR of 10.3%. |
Under Phase II, payable metals in enriched copper concentrates and products from the hydrometallurgical plant are 1,155 million lbs of copper, 174 million lbs of nickel, 1.56 million combined oz of platinum, palladium and gold, 0.958 million oz of silver and 6.2 million lbs of cobalt. Palladium is the predominant PGM product, totalling 1.19 million oz.
| 1.2 | Location And Ownership |
The NorthMet Deposit is situated on a private mineral lease located in St Louis County in northeastern Minnesota, US, at approximately Latitude 47° 36’ north, Longitude 91° 58’ west, 90 road miles north of Duluth and 6.5 miles south of the town of Babbitt.
The NorthMet Project comprises two elements: The NorthMet Deposit and the nearby Erie Plant. PolyMet US leases the mineral rights to the NorthMet Deposit under a perpetually renewable lease and is acquiring the Erie Plant through contracts for deed with Cliffs Erie, L.L.C. (Cliffs Erie) a subsidiary of Cleveland Cliffs (Cliffs), which will be satisfied once the State of Minnesota issues the NorthMet permits to PolyMet US and assigns certain existing operating permits held by Cliffs Erie to PolyMet US or otherwise terminates those existing Cliffs Erie permits.
| 1.3 | Geology And Mineralization |
The NorthMet Deposit is one of twelve known copper-nickel-platinum group metal deposits along the northern margin of the Duluth Complex. The Duluth Complex is a large, composite, layered, mafic intrusion that was emplaced into comagmatic flood basalts along a portion of the Mesoproterozoic Midcontinent Rift System. The NorthMet deposit is hosted by the Partridge River Intrusion (PRI), which consists of troctolitic, anorthositic and minor gabbroic rock types that have been subdivided into seven igneous stratigraphic units. The ore-bearing units are primarily found in the basal unit of the Duluth Complex, which contains disseminated sulfides and minor massive sulfides hosted in troctolitic rocks. The Duluth Complex dips shallowly to the southeast in the western end of the deposit but steepens moving to the east.
The metals of interest at NorthMet are copper, nickel, cobalt, platinum, palladium, silver and gold. Minor amounts of rhodium, osmium, iridium and ruthenium are also present though these are considered to have no economic significance. The majority of the metals are concentrated in, or associated with, four sulfide minerals: chalcopyrite, cubanite, pentlandite, and pyrrhotite. Platinum, palladium and gold are found in bismuthides, tellurides, and alloys. In general, the metals have strong positive correlations with copper sulfide mineralization. Cobalt has a strong correlation with nickel. At the NorthMet Deposit, Duluth Complex rocks are overlain by up to 50 feet of overburden. Average overburden depth from all drill holes is 13 feet.
| 1.4 | Status of Exploration |
The NorthMet Deposit was formally discovered during drilling exploration carried out by U.S. Steel based on an anomaly identified during airborne survey work completed in 1966. Between 1969 and 1974, U.S. Steel drilled 112 holes for a total of 113,716 feet, producing 9,475 assay intervals, which are included in the Project database. U.S. Steel also collected three bulk surface samples for metallurgical testing from two discrete locations within the NorthMet Project area. In total, eight major exploration programs carried out at NorthMet (U.S. Steel, NERCO, and PolyMet US) have produced 436 boreholes, providing over 300,000 feet of stratigraphic control and extensive assay results.
| M3-PN150164 26 March 2018 |
21
NorthMet Project
Form NI 43-101F1 Technical Report
All exploration data have been collected in a drill-hole database used for geologic modeling, resource estimation, and mine planning. PolyMet US has verified and validated all drill-hole collar locations, down-hole surveys, lithologies, geotechnical properties, and assay data, organized all related records, and established procedures for ongoing database maintenance.
| 1.5 | Mineral Reserve Statement |
Proven and Probable Mineral Reserves of 255 million tons are reported within the final pit design used for the mine production schedule and shown in Table 1‑1. All inferred material was classified as waste and scheduled to the appropriate waste stockpile. The final mineral reserves are reported using a $7.98 NSR cut-off inside the pit design using the diluted grades. Both the mineral resource and mineral reserve estimates take into consideration metallurgical recoveries, concentrate grades, transportation costs, smelter treatment charges and royalties in determining NSR values. Table 1‑1 also shows the mineral reserves by classification category and grade. The Qualified Person responsible for the Mineral Reserve estimate is Herb Welhener, Vice President of IMC.
Table 1‑1: Mineral Reserve Statement – January 2018
| Class | Tonnage (x 1,000) | Grades (Diluted) | ||||||||||||||||||||||||||||||||||||||
| Copper | Nickel | Platinum | Palladium | Gold | Cobalt | Silver | NSR | Cu-Eq | ||||||||||||||||||||||||||||||||
| (%) | (%) | (ppb) | (ppb) | (ppb) | (ppm) | (ppm) | $/ton | (%) | ||||||||||||||||||||||||||||||||
| Proven | 121,849 | 0.308 | 0.087 | 82 | 282 | 41 | 74.81 | 1.11 | 19.87 | 0.612 | ||||||||||||||||||||||||||||||
| Probable | 132,820 | 0.281 | 0.081 | 78 | 256 | 37 | 74.06 | 1.02 | 18.02 | 0.559 | ||||||||||||||||||||||||||||||
| Total | 254,669 | 0.294 | 0.084 | 80 | 268 | 39 | 74.42 | 1.06 | 18.90 | 0.584 | ||||||||||||||||||||||||||||||
Notes: | |
(1) | Mineral reserve tonnage and contained metal have been rounded to reflect the accuracy of the estimate, and numbers may not add due to rounding |
(2) | All reserves are stated above a $7.98 NSR cutoff and bound within the final pit design. |
(3) | Tonnage and grade estimates are in Imperial units |
(4) | Total Tonnage within the pit is 628,499 ktons; average waste: ore ratio = 1.47 |
(5) | Copper Equivalent (CuEq) values are based on the metal prices in Table 15‑2 and total mill recoveries in Table 15‑3 and diluted mill feed. |
(6) | Copper Equivalent (CuEq) = ((Cu head grade x recovery x Cu Price) + (Ni head grade x recovery x Ni Price) + (Pt head grade x recovery x Pt Price) + (Pd head grade x recovery x Pd Price) + (Au head grade x recovery x Au Price) + (Co head grade x recovery x Co Price) (Ag head grade x recovery x Ag Price)) / (Cu recovery x Cu Price) |
(7) | NSR values include post property concentrate transportation, smelting and refining costs and payable metal calculations. |
| 1.6 | Mineral Resource Estimate |
Zachary J. Black, RM-SME, of Hard Rock Consulting, LLC (HRC) is a Qualified Person as defined by NI 43-101 for mineral resource estimation and classification. HRC estimated the mineral resource for the NorthMet Project from drill-hole data constrained by geologic boundaries using an Ordinary Kriging (“OK”) algorithm.
The NorthMet Deposit was divided into eight units for geological modeling: the Biwabik Iron Formation including banded iron formation, sedimentary marine rocks of the Virginia Formation that overlie the Biwabik Formation, and five distinct units within the Duluth Complex and overburden.
The Magenta Zone, a smaller mineralized zone that cuts through Units 3 through 7 but resides primarily within Units 5 and 6, was modeled from select intercepts provided by PolyMet US.
Grades that were estimated include copper, nickel, cobalt, platinum, palladium, gold, silver and total sulfur.
| M3-PN150164 26 March 2018 |
22
NorthMet Project
Form NI 43-101F1 Technical Report
HRC created a rotated three-dimensional (3D) block model in Datamine Studio 3® mining software. The block resource model was estimated using the lithologic boundaries of the Duluth Complex as the basis for an estimation domain. Units 1, 3, 5, 6, 7, the Magenta Zone, and Virginia Formation were all estimated using only samples that resided inside of the defined boundaries. Grades were estimated from 10-foot (ft) down-hole composites using Ordinary Kriging. Composites were coded according to their domain. Each metal was estimated using variogram parameters established by AGP Mining Consultants Inc. (AGP) in 2013, which were re-evaluated by HRC and deemed acceptable for use in the current mineral resource estimation.
The mineral resources reported herein are classified as Measured, Indicated and Inferred in accordance with standards defined by the Canadian Institute of Mining, Metallurgy and Petroleum (“CIM”) “CIM Definition Standards – For Mineral Resources and Mineral Reserves,” prepared by the CIM Standing Committee on Reserve Definitions and adopted by CIM Council on May 10, 2014. Each individual mineral resource classification reflects an associated relative confidence of the grade estimates.
The mineral resources estimated for the NorthMet Project includes 649.3 million tons of Measured and Indicated resources and 508.9 million tons Inferred resources. The resource has been limited to the material that resides above the optimized pit shell. All mineralization below the optimized pit shell has been excluded from any resource classification and is not considered to be part of the mineral resource.
The mineral resource estimate for the NorthMet Project is summarized in Table 1‑2. This mineral resource estimate includes all drill data obtained as of January 31, 2016 and has been independently verified by HRC. The Measured and Indicated mineral resources are inclusive of the mineral reserves. Inferred mineral resources are, by definition, always additional to mineral reserves. Encouraging results have prompted recommendations for additional exploration drilling to better define the Inferred mineral resources (see Note 1 in Table 1‑2).
Table 1‑2: Summary Mineral Resource Statement for the NorthMet Project Inclusive of Mineral Reserves
| Class | Tonnage (Mt) | Grades (UnDiluted) | ||||||||||||||||||||||||||||||||||||||
| Copper | Nickel | Platinum | Palladium | Gold | Cobalt | Silver | NSR | Cu-EQ | ||||||||||||||||||||||||||||||||
| (%) | (%) | (ppb) | (ppb) | (ppb) | (ppm) | (ppm) | $/ton | (%) | ||||||||||||||||||||||||||||||||
| Measured | 237.2 | 0.270 | 0.080 | 69 | 241 | 35 | 72 | 0.97 | 19.67 | 0.541 | ||||||||||||||||||||||||||||||
| Indicated | 412.2 | 0.230 | 0.070 | 63 | 210 | 32 | 70 | 0.87 | 16.95 | 0.470 | ||||||||||||||||||||||||||||||
| M&I | 649.3 | 0.245 | 0.074 | 65 | 221 | 33 | 71 | 0.91 | 17.94 | 0.496 | ||||||||||||||||||||||||||||||
| Inferred | 508.9 | 0.240 | 0.070 | 72 | 234 | 37 | 66 | 0.93 | 17.66 | 0.489 | ||||||||||||||||||||||||||||||
Source: Hard Rock Consulting, LLC, January 2018
Notes:
| (1) | Mineral resources are not mineral reserves and do not have demonstrated economic viability. |
| (2) | All resources are stated above a $7.35 NSR cut-off. Cut-off is based on estimated processing and G&A costs. Metal Prices and metallurgical recoveries used for the development of cut-off grade are presented in Table 14‑33. |
| (3) | Mineral resource tonnage and contained metal have been rounded to reflect the accuracy of the estimate, and numbers may not add due to rounding. |
| (4) | Cu-Eq (copper equivalent grade) is based on the mill recovery to concentrates and metal prices (Table 14‑33). |
| (5) | Copper Equivalent (Cu Eq) = ((Cu head grade x recovery x Cu Price)) + (Ni head grade x recovery x Ni Price) + (Pt head grade x recovery x Pt Price) + (Pd head grade x recovery x Pd Price) +(Au head grade x recovery x Au Price) + (Co head grade x recovery x Co Price) + (Ag head grade x recovery x Ag Price)) / (Cu recovery x Cu Price). |
| 1.7 | Mining And Processing |
The NorthMet Deposit will be mined from three pits: The East Pit, the Central Pit, and the West Pit. After mining in each pit is completed, waste from the West Pit will be backfilled into the East and Central Pits, along with waste rock from the temporary waste rock stockpiles.
| M3-PN150164 26 March 2018 |
23
NorthMet Project
Form NI 43-101F1 Technical Report
Run of Mine (ROM) ore will be loaded onto rail cars at the Mine Site and transported eight miles to the Erie Plant by private railroad.
The Erie Plant processed Taconite from 1957 to 2001, processing up to 100,000 tons per day.
PolyMet US plans to refurbish the plant and reuse the existing primary crusher, and replace the downstream mill circuit with a new 40’ diameter x 22.5’ Effective Grinding Length (EGL) SAG mill and one new 24’ diameter x 37’ ball mill.
Primary ground ore will be processed through a rougher flotation circuit to produce a bulk copper and nickel concentrate. The bulk concentrate will be reground and separated in cleaner flotation. The rougher tailing will be sent to the pyrrhotite flotation circuit so that PGM-rich iron sulfide can be captured as a pyrrhotite nickel concentrate.
Tailing from the flotation circuit will be disposed of in the existing tailings basin, which is partially filled with taconite tailings exclusively, but has more than sufficient capacity for the planned operations. The waste stream from the Hydrometallurgical Process Plant will be permanently stored in the Hydromet Residue Facility (HRF).
| 1.8 | Environmental |
Minnesota has stringent environmental standards and environmental review and permitting processes. The NorthMet environmental review process involved the Minnesota Department of Natural Resources (MDNR), the United States Army Corps of Engineers (USACE), and the United States Forest Service (USFS) as "Co-Lead Agencies." The United States Environmental Protection Agency (EPA) and tribal authorities served as cooperating agencies and the Minnesota Pollution Control Agency (MPCA) took part in the process as a permitting agency.
The most significant area of attention is water quality – the NorthMet Project is in the headwaters of the St Louis River, which flows into Lake Superior and is therefore governed by Great Lakes standards. It is important to note that NorthMet is south of the Laurentian Divide and in a separate watershed from the Boundary Waters Canoe Area Wilderness and Voyagers National Park located to the northeast.
Mineral and property tenure is secure. Permitting risks for the Project were reduced with the completion of a Final Environmental Impact Statement (FEIS) (Nov 2015) and Record of Decision (ROD) from the State of Minnesota (March 2016) indicating that the Project, as reviewed, can meet federal and state environmental standards. The State of Minnesota has also issued all major state environmental permits in draft form for public comment. See Section 20 for a listing of required permits.
The NorthMet Project is located within an established mining district of existing open pit iron ore mines that have been mined over the last 100 years. The Peter Mitchell pit of the Northshore operations of Cleveland Cliffs lies immediately north of the NorthMet Deposit. Major impacts from the Project are limited to tailings storage in a permitted Flotation Tailings Basin (FTB), hydromet residue facility, and waste rock stockpiles and mine pits in low-lying areas.
| 1.9 | Economics |
Phase I of the NorthMet Project involves development of the 225-million-ton orebody into an operating mine producing 32,000 tons per day of ore and rehabilitating an existing taconite processing plant, tailings storage facility and infrastructure located approximately eight miles to the west. Phase I would produce commercial grade copper and nickel concentrates for which Glencore currently holds offtake agreements payable at market terms. Phase II of the Project involves construction and operation of hydrometallurgical plant to process nickel sulfide concentrates into upgraded nickel-cobalt hydroxide and recover additional copper and PGMs. An estimate of Project capital expenditure and annual operating costs over the life of the mine for Phase I and the combined Phase I and Phase II are summarized in Table 1‑3.
| M3-PN150164 26 March 2018 |
24
NorthMet Project
Form NI 43-101F1 Technical Report
Table 1‑3: Capital Expenditure & Operating Costs – Phase I and Phase I & II
| Cost Category | UOM | Phase I | Phase I & II | ||||||
| Capital Costs | |||||||||
| Initial Project Capital | $M | 945 | 1,204 | ||||||
| LOM Sustaining Capital | $M | 221 | 221 | ||||||
| Operating Costs | LOM | ||||||||
| Mining & Delivery to Plant | $/t processed | 4.02 | 4.02 | ||||||
| Processing | $/t processed | 6.55 | 8.66 | ||||||
| G&A | $/t processed | 0.48 | 0.48 | ||||||
| Total | $/t processed | 11.05 | 13.16 | ||||||
To evaluate the economic potential of the capital investment, Phase I was structured to independently assess the overall economics both with and without Phase II (hydrometallurgical plant). The company compiled, with the aid of its financial partners, a commodity price forecast based on consensus estimates from an extensive list of financial and industry analysts. These prices are the basis for the financial analysis and are summarized in Table 1‑4.
Table 1‑4: Price Assumptions in the Financial Analysis
| Units | LOM | |
| Copper | US$/lb | 3.22 |
| Nickel | US$/lb | 7.95 |
| Cobalt | US$/lb | 20.68 |
| Platinum | US$/oz | 1,128 |
| Palladium | US$/oz | 973 |
| Gold | US$/oz | 1,308 |
| Silver | US$/oz | 18.92 |
The economic summary and financial analysis reflects processing 225 million tons of ore over a twenty-year mine life, at an average processing rate of 32,000 STPD. Key financial results for Phase I and combined Phase I and II are presented in Table 1‑5.
| M3-PN150164 26 March 2018 |
25
NorthMet Project
Form NI 43-101F1 Technical Report
Table 1‑5: Financial Summary – 32,000 STPD
| Phase I | Phase I & II | ||||||||||||
| Units | First 5 Yrs 1 | LOM | LOM 2 | ||||||||||
| Life of Mine | Yrs | 20 | 20 | ||||||||||
| Material Mined | Mt | 197 | 574 | 574 | |||||||||
| Ore Mined | Mt | 58 | 225 | 225 | |||||||||
| Waste: Ore Ratio | 2.4 | 1.6 | 1.6 | ||||||||||
| Ore Grade | |||||||||||||
| Copper | % | 0.343 | 0.295 | 0.295 | |||||||||
| Nickel | % | 0.092 | 0.085 | 0.085 | |||||||||
| Cobalt | ppm | 76 | 75 | 75 | |||||||||
| Palladium | ppm | 0.327 | 0.269 | 0.269 | |||||||||
| Platinum | ppm | 0.099 | 0.079 | 0.079 | |||||||||
| Gold | ppm | 0.048 | 0.039 | 0.039 | |||||||||
| Annual Payable Metal Produced | |||||||||||||
| Copper | mlb | 66.7 | 54.8 | 57.8 | |||||||||
| Nickel | mlb | 7.9 | 6.6 | 8.7 | |||||||||
| Cobalt | mlb | 0.33 | 0.28 | 0.31 | |||||||||
| Palladium | koz | 57.6 | 41.8 | 59.4 | |||||||||
| Platinum | koz | 12.4 | 8.5 | 14.3 | |||||||||
| Gold | koz | 3.4 | 2.2 | 4.3 | |||||||||
Copper Equivalent3 | mlb | 112.4 | 90.6 | 106.4 | |||||||||
| Cash Costs: by-product | $/lb Cu | 0.67 | 1.06 | 0.59 | |||||||||
| Cash Costs: Cu equivalent | $/lb CuEq | 1.71 | 1.91 | 1.79 | |||||||||
| Development Capital | $M | 945 | 945 | 1,204 | |||||||||
| Sustaining Capital | $M | 99 | 221 | 221 | |||||||||
| Annual Revenue | $M | 362 | 292 | 343 | |||||||||
| Annual EBITDA | $M | 170 | 118 | 152 | |||||||||
NPV7 (After Taxes) | $M | 173 | 271 | ||||||||||
| IRR (After Taxes) | % | 9.6 | 10.3 | ||||||||||
| Payback (after taxes, from first production) | Years | 7.3 | 7.5 | ||||||||||
1 Represents first five years at full concentrator production.
2 Phase II production is projected to commence in Year 3 of operations.
3 Cu Eq recovered payable metal, is based on prices shown in Table 1‑4, mill recovery assumptions shown in Table 15‑3 and Hydromet Phase II recoveries shown in Table 13‑14.
2 Phase II production is projected to commence in Year 3 of operations.
3 Cu Eq recovered payable metal, is based on prices shown in Table 1‑4, mill recovery assumptions shown in Table 15‑3 and Hydromet Phase II recoveries shown in Table 13‑14.
Financial returns for the Project are highly sensitive to changes in metal prices. A +/-10% change in prices results in a corresponding $265 million change in NPV@7% for Phase I. Inclusive of Phase II, the NPV@7% sensitivity is estimated to be +/-$300 million at an accuracy level of ±10%.
| 1.10 | Potential Expansion Opportunities – Basis of 59,000 STPD and 118,000 STPD Scenarios |
Metals prices for the financial analysis of both the 59,000 STPD and 118,000 STPD scenarios are based on prices shown in Table 1‑4. The 59,000 STPD and 118,000 STPD throughput values represent Class 5 estimates as defined by AACE International, corresponding to an Order of Magnitude, Scoping or Preliminary Economic Assessment. As such, further engineering, environmental studies and permitting would be required to prove the economic viability of these potential scenarios and to improve the economic uncertainties associated with these estimates. Further delineation drilling to move inferred resources into measured and indicated resources is also required in the 59,000 and 118,000 STPD cases. Overall, the expansion scenarios require significant capital investment.
| M3-PN150164 26 March 2018 |
26
NorthMet Project
Form NI 43-101F1 Technical Report
The results of this exercise were as follows:
| · | 59,000 STPD throughput |
| o | 293 million tons of mineralized material grading at 0.576% Cu-Eq, and |
| o | 14-year mine life. |
| · | 118,000 STPD throughput |
| o | 730 million tons of mineralized material grading at 0.533% Cu-Eq, and |
| o | 18-year mine life. |
See Section 24 of this report for further evaluation of these cases. Again, note that the estimates for these two scenarios are preliminary in nature and include Inferred Mineral Resources that are considered too speculative geologically to have the economic considerations applied to them that would enable them to be categorized as Mineral Reserves. There can be no certainty that the results for these two cases will be realized. Mineral Resources that are not Mineral Reserves do not have demonstrated economic viability and there is no certainty that Mineral Resources will become Mineral Reserves.
| 1.11 | Conclusions And Recommendations |
M3 offers the following recommendations:
| · | M3 recommends that PolyMet proceed with final design, construction and operation of the 32,000 STPD design that is discussed in this Technical Report, and |
| · | Review and update the scope of the Project design to reflect any changes resulting from the environmental review and permitting process. |
Recommendations for further work are presented below:
| · | Based on the initial results of the additional scoping level and PEA level estimates in Section 24 of this study M3 recommends that additional engineering and environmental studies be performed at a pre-feasibility study level to further refine the costs, valuations and environmental requirements for the potential 59,000 STPD and 118,000 STPD production scenarios. The estimated costs of these studies are expected to be $500,000. An estimated $2.5 million is required to move currently classified inferred material into measured and indicated categories. |
| M3-PN150164 26 March 2018 |
27
NorthMet Project
Form NI 43-101F1 Technical Report
| 2 | INTRODUCTION |
| 2.1 | Purpose |
This report has been prepared specifically for PolyMet by the Qualified Persons (QPs) listed in Table 2‑1 to provide ‘Expert Study’ on the NorthMet Project. The findings and conclusions are based on information available at the time of preparation and data supplied by other consultants as indicated.
This report has been prepared in accordance with the guidelines provided in Canadian National Instrument 43-101, Standards of Disclosure for Mineral Projects (NI 43-101) dated 24 June 2011 and updated on 10 May 2014. This Technical Report has been prepared to the level of a Feasibility Study. The effective date of this report is March 26, 2018.
| 2.2 | Sources of Information |
Table 2‑1 shows the list of Qualified Persons with their associated responsibilities.
Table 2‑1: List of Qualified Persons
| Name of Qualified Person | Certification | Company | Last Site Visit | Section Responsibilities |
Zachary J. Black | SME-RM | Hard Rock Consulting | 16 May 2017 | Sections 1.3, 1.4, 1.6, 7, 8, 9, 10, 11, 12, 14, 23, 25.2.2, 25.2.3, 25.2.4, 25.2.5 and 25.2.7. |
| Jennifer J. Brown | SME-RM | Hard Rock Consulting | N/A | Section 6. |
| Nicholas Dempers | Pr. Eng., SAIMM | Senet | 1 March 2018 | Section 13.1-13.5, 17.1, 17.2, 18.7, 18.9, 21, 21.2.2, 21.2.3, 24.2, 25.2.6 and 25.2.10. |
| Thomas L. Drielick | P.E. | M3 Engineering | N/A | Sections 1.9, 19, 21, 21.1, 21.2.4, 21.2.5, 22, 25.2.12, 25.2.14, and 25.2.15. |
| Art S. Ibrado | P.E. | M3 Engineering | N/A | Sections 13.6, 17.3, 17.4, 17.5.1, 17.6 and 25.2.6. |
| Erin L. Patterson | P.E. | M3 Engineering | 11 October 2017 | Sections 1.1, 1.2, 1.9, 1.10, 1.11, 2, 3, 4.1- 4.5, 4.7- 4.10, 5, 18.1-18.5, 18.8, 18.10, 24, 24.2 25.1- 25.2.1, 25.2.11, 25.3- 25.5, 26 and 27. |
| Thomas J. Radue | P.E. | Barr Engineering Co. | 11 October 2017 | Section 1.7, 1.8, 4.6, 16.3.3, 17.2.4, 17.5.2, 18.6, 20.1-20.6, 20.7, 21, 21.1, 25.2.13. |
| Jeff S. Ubl | P.E. | Barr Engineering Co. | N/A | 18.7 |
| Herbert E. Welhener | SME -RM | Independent Mining Consultants | 11 December 2000 | Sections 1.5, 15, 16, 21, 21.2.1, 24.2, 25.2.8, and 25.2.9. |
| M3-PN150164 26 March 2018 |
28
NorthMet Project
Form NI 43-101F1 Technical Report
| 2.3 | Terms of Reference |
Table 2‑2: Units, Terms and Abbreviation
| M3-PN150164 26 March 2018 |
29
NorthMet Project
Form NI 43-101F1 Technical Report
| M3-PN150164 26 March 2018 |
30
NorthMet Project
Form NI 43-101F1 Technical Report
| 2.4 | Units of Measure |
This report uses U.S. Customary Units expressed in short tons (ton, t, 2,000 lbs), feet, and gallons consistent with U.S. Standards – unless stated otherwise. The monetary units are expressed in United States Dollars.
| M3-PN150164 26 March 2018 |
31
NorthMet Project
Form NI 43-101F1 Technical Report
| 3 | RELIANCE ON OTHER EXPERTS |
M3 relied upon contributions from a range of technical and engineering consultants as well as PolyMet. Data used in this report has been verified where possible and this report is based upon information believed to be accurate at the time of completion. M3 is not aware of any reason why the information provided by these contributors cannot be relied upon.
Owner’s environmental and permitting costs were supplied by PolyMet. In addition, PolyMet provided all Owner’s costs in the capital cost estimate. Owners Costs are defined in section 21.1.3.3
An independent verification of land title and tenure was not performed. M3 has not verified the legality of any underlying agreement(s) that may exist concerning the licenses or other agreement(s) between third parties. Likewise, PolyMet has provided data for land ownership, and claim ownership. All mineral and surface title work on the project and land exchange is managed by the law firm Hanft Fride, a Professional Association, out of Duluth, Minnesota, USA.
| M3-PN150164 26 March 2018 |
32
NorthMet Project
Form NI 43-101F1 Technical Report
| 4 | PROPERTY DESCRIPTION AND LOCATION |
| 4.1 | Project Location |
The NorthMet Project comprises two key elements: the NorthMet Deposit (or Mine Site) and the Erie Plant. The NorthMet Deposit is situated on mineral leases located in St. Louis County in northeastern Minnesota at Latitude 47° 36’ north, Longitude 91° 58’ west, about 70 miles north of the City of Duluth and 6.5 miles south of the town of Babbitt, as shown in Figure 4‑1. The Erie Plant is approximately eight miles west of the NorthMet Deposit.
The NorthMet Deposit site totals approximately 4,300 acres and the Erie Plant site, including the existing tailings basin, covers approximately 12,400 acres.
The NorthMet Project is located immediately south of the eastern end of the historic Mesabi Iron Range and is in proximity to a number of existing iron ore mines including the Peter Mitchell open pit mine located approximately two miles to the north of the NorthMet Deposit. NorthMet is one of several known mineral deposits that have been identified within the 30-mile length of the Duluth Complex, a well-known geological formation containing copper, nickel, cobalt, platinum group metals, silver, gold and titanium.
The NorthMet Deposit is connected to the Erie Plant by a transportation and utility corridor that is comprised of an existing private railroad that will primarily be used to transport ore, a segment of the existing private Dunka Road that will be upgraded to provide vehicle access, and new water pipelines and electrical power network for the NorthMet Mine Site.
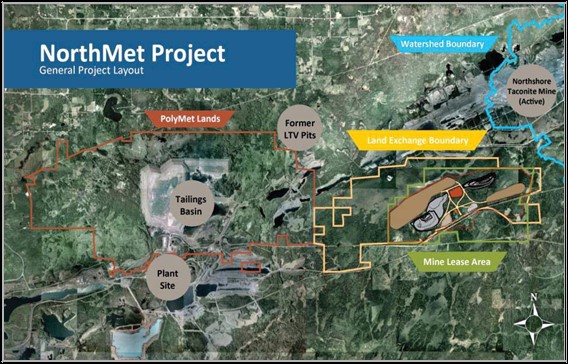
Figure 4‑1: Property Layout Map
| M3-PN150164 26 March 2018 |
33
NorthMet Project
Form NI 43-101F1 Technical Report
| 4.2 | Project Ownership |
PolyMet Mining Corporation (PolyMet) owns 100% of Poly Met Mining, Inc. (PolyMet US), a Minnesota corporation. PolyMet US controls 100% of the NorthMet Project. As PolyMet is the owner of PolyMet US, for the sake of simplicity this Study will for the most part refer to both entities as PolyMet, except when specific differentiation is required for legal clarity. The mineral rights covering 4,282 acres or 6.5 square miles at the NorthMet orebody are held through two mineral leases:
| · | The U.S. Steel Lease dated January 4, 1989, subsequently amended and assigned, covers 4,162 acres originally leased from U.S. Steel Corporation (U.S. Steel), which subsequently sold the underlying mineral rights to RGGS Land & Minerals Ltd., L.P. (RGGS). PolyMet has extended the lease indefinitely by making $150,000 annual lease payments on each successive anniversary date. The lease payments are advance royalty payments and will be deducted from future production royalties payable to RGGS, which range from 3% to 5% based on the net smelter return, subject to minimum payments of $150,000 per annum. |
| · | On December 1, 2008, PolyMet entered into an agreement with LMC Minerals ("LMC") whereby PolyMet leases 120 acres that are encircled by the RGGS property. The initial term of the renewable lease is 20 years with minimum annual lease payments of $3,000 on each successive anniversary date until the earlier of NorthMet commencing commercial production or for the first four years, after which the minimum annual lease payment increases to $30,000. The initial term may be extended for up to four additional five-year periods on the same terms. The lease payments are advance royalty payments and will be deducted from future production royalties payable to LMC, which range from 3% to 5% based on the net smelter return, subject to a minimum payment of $30,000 per annum. |
The surface rights are held by the USFS and are currently subject to a land exchange initiative with PolyMet– see Section 4.4.
PolyMet US holds various rights of ownership and use, and other property rights that currently give it control of 100% of the Erie Plant, which covers approximately 12,400 acres, or 19.4 square miles, through contracts for deed with Cliffs Erie, L.L.C. (Cliffs Erie). Further details on the arrangements with Cliffs Erie can be found in Section 4.6.
| 4.3 | Mineral Tenure |
In the 1940s, copper and nickel were discovered near Ely, Minnesota, following which, in the 1960s, U.S. Steel drilled what is now the NorthMet Deposit. U.S. Steel investigated the NorthMet Deposit as a high-grade, underground copper-nickel resource, but considered it to be uneconomic based on its inability to produce separate, clean nickel and copper concentrates with the metallurgical processes available at that time. In addition, prior to the development of the automobile-catalyst market in the 1970s, there was little market for platinum group metals (PGM) and there was no economic and reliable method to assay for low grades of these metals.
In 1987, the Minnesota Natural Resources Research Institute (NRRI) published data suggesting the possibility of a large resource of PGMs in the base of the Duluth Complex.
PolyMet, as Fleck Resources, acquired a 20-year perpetually renewable mineral rights lease to the NorthMet Deposit in 1989 from U.S. Steel. The lease is subject to yearly lease payments before production and then to a sliding scale Net Smelter Return (NSR) royalty ranging from 3% to 5%, with lease payments made before production considered as advance royalties and credited to the production royalty. PolyMet leases an additional 120 acres of mineral rights from LMC.
| M3-PN150164 26 March 2018 |
34
NorthMet Project
Form NI 43-101F1 Technical Report
Mineral and surface rights have been severed, with the USFS owning the surface rights within most of the lease area. U.S. Steel retained the mineral rights and certain rights to explore and mine on the site under the original documents that ceded surface title to the USFS.
| 4.4 | Surface Rights |
Surface rights of the NorthMet Deposit are held by the USFS. The United States acquired the surface rights from U.S. Steel in 1938 under provisions of the Weeks Act of 1922. U.S. Steel retained certain mining rights, which PolyMet secured under the U.S. Steel Lease, along with the mineral rights.
PolyMet and the USFS have proposed a land exchange to consolidate their respective land ownerships.
In this land exchange, the USFS will acquire, 6,690 acres of private land in four separate tracts currently held by PolyMet, to become part of the Superior National Forest and managed under the laws relating to the National Forest System. Already located within the Superior National Forest boundaries, these lands will have multiple uses including recreation, research and conservation. The USFS will convey 6,650 acres of federally-owned surface land to PolyMet, which includes the surface rights overlying and surrounding the NorthMet Deposit. These lands are located near an area heavily used for mining and mine infrastructure, are consistent with regional land uses, and will generate economic benefits to the region through employment and tax revenues.
Following the Final NorthMet Environmental Impact Statement (FEIS), the Superior National Forest of USFS issued a Final Record of Decision (ROD) to proceed with the administrative land exchange in January 2017. The ROD stated, among other things, that the proposed exchange will be beneficial to the USFS and is in the public’s interest. On November 28, 2017, H.R. 3115, the Superior National Forest Land Exchange Act of 2017, passed by voice vote in the House of Representatives. If enacted into law, H.R. 3115 will legislatively accomplish the same land exchange approved in the January 2017 USFS ROD. The administrative land exchange process is ongoing as of the date of this report.
| 4.5 | Royalties And Encumbrances |
The NorthMet Deposit mineral rights carry variable royalties of 3% to 5% based on the NSR per ton of ore mined. For a NMV of under $30 per ton, the royalty is 3%, for $30-35 per ton it is 4%, and above $35 per ton it is 5%. Both the U.S. Steel Lease (RGGS) and the LMC Lease carry advance royalties which can be recouped from future royalty payments, subject to minimum payments in any year. The US Steel leases were transferred through sale to RGGS though the underlying agreement terms remain the same.
| 4.6 | Environmental Liabilities |
Federal, state and local laws and regulations concerning environmental protection affect the PolyMet operation. As part of the consideration for the purchase of the Erie Plant and associated infrastructure, the Company indemnified Cliffs for reclamation and remediation obligations of the acquired property. Completion of that purchase remains subject to certain contingencies, including, among other things, issuance of final permits for the NorthMet Project under applicable environmental laws and release of Cliffs, and its subsidiary Cliffs Erie, from its obligations under existing state permits with respect to the Erie Plant and other assets acquired by PolyMet.
According to PolyMet US, the Company’s estimate of the environmental rehabilitation provision under International Financial Reporting Standards (IFRS) on October 31, 2017 was $72.772 million based on estimated cash flows required to settle this obligation in present day costs of $78.729 million, a projected inflation rate of 2.00%, a market risk-free interest rate of 2.66% and expenditures expected to occur over a period of approximately 30 years. This estimate includes but is not limited to water treatment and infrastructure closure and removals, with costs estimated by PolyMet and its consultants and construction contractors. This estimate has been reviewed and accepted by auditors for PolyMet’s financial statement.
| M3-PN150164 26 March 2018 |
35
NorthMet Project
Form NI 43-101F1 Technical Report
| 4.7 | Permits |
Prior to construction and operation of the NorthMet Project, PolyMet will require several permits from federal and state agencies – see Section 20.4.
| 4.8 | Social License |
The environmental review process is described in Section 20. The federal, state and local government permits needed for PolyMet to construct and operate the NorthMet Project are described in Section 20.4.
PolyMet has maintained an active community outreach program for many years. The focus of the program has been to provide information about the Project, its likely impact on the environment, and the socioeconomic benefits. The local communities are supportive of the Project. PolyMet continues to receive outstanding community and political support for the Project. The local mayors, U.S. Senators, Congressmen and elected state officials continue to express public support for both the process and the Project.
The Bois Forte Band of Chippewa (Bois Forte), Grand Portage Band of Chippewa (Grand Portage), and the Fond du Lac Band of Lake Superior Chippewa (Fond du Lac) have been cooperating agencies in preparation of the FEIS. Fond du Lac has expressed the strongest opposition, primarily related to cultural heritage issues and seeking to ensure that water quality is protected.
The most active environmental groups in the area are focused on protecting the Boundary Waters Canoe Area Wilderness, which is located approximately 25 miles northeast of the NorthMet site, in a different watershed.
| 4.9 | Significant Risk Factors |
| 4.9.1 | Permitting |
Permitting is the most significant risk factor for the Project. The NorthMet Project is the first copper-nickel project in Minnesota to seek permits for construction and operation. Environmental review and permitting is, perhaps, the biggest challenge facing any mining project in the United States.
Permitting risk falls into two primary categories:
| 1. | Permits may be denied or legally challenged, or |
| 2. | Operating requirements imposed by the permits could be so financially burdensome that the Project is unable to proceed. |
While all final permits remain to be issued and are potentially subject to legal challenge, permitting risk has decreased due to completion and acceptance of the FEIS, the associated state and USFS ROD issuance, and the issuance of the draft state permits.
| 4.9.2 | Project Financing |
PolyMet will require successful project financing in order to complete development and construction of the NorthMet Project. If PolyMet cannot raise the money necessary to fund the Project, development will be suspended. Sources of such external financing may include future equity and debt offerings. This risk is partially mitigated through the company’s ongoing relationship with Glencore.
| M3-PN150164 26 March 2018 |
36
NorthMet Project
Form NI 43-101F1 Technical Report
Phase II of the Project includes construction of a hydrometallurgical facility after Phase I operations have commenced. Financing risk associated with this phase of the Project is mitigated by Phase I financials.
| 4.9.3 | Commodity Prices |
If the price of metals in the PolyMet ore body decrease below a specified level it may no longer be profitable to develop the NorthMet Project. Once developed, if metal prices are, for a substantial period, below foreseeable costs of production PolyMet operations could be negatively affected.
See Section 25.4 of this Study for a discussion of additional risks.
| 4.10 | Comments on Section 4 |
Mineral and property tenure is secure, pending completion of the land exchange with the USFS and the contracts for deed with Cliffs Erie as referenced in Sections 4.4 and 4.6, respectively. Acquisition of surface rights is the subject of both the USFS Final ROD, issued in January 2017, and the administrative land exchange or HR 3115, which the US House of Representatives approved on November 28, 2017. Completion of the acquisition of the Erie Plant from Cliffs Erie is subject to, among other requirements, finalization of the draft permits issued by the State of Minnesota for the NorthMet Project and release of Cliffs Erie from certain existing state permits under processes anticipated and described in draft NorthMet permits issued by MDNR and MPCA. Permitting risks for the Project have been reduced with the completion of the FEIS (Nov 2015) and ROD from the State of Minnesota (March 2016) indicating that the Project, as reviewed, can meet federal and state environmental standards.
| M3-PN150164 26 March 2018 |
37
NorthMet Project
Form NI 43-101F1 Technical Report
| 5 | ACCESSIBILITY, CLIMATE, LOCAL RESOURCES, INFRASTRUCTURE AND PHYSIOGRAPHY |
The project site is located just south of the eastern end of the historically significant Mesabi Iron Range, a world-class mining district that has the capacity to produce, annually, approximately 44 million gross tons of iron ore pellets and concentrate from iron bearing ore named taconite. There are currently six iron ore mines on the Mesabi Iron Range, see Table 5‑1.
Table 5‑1: Current Iron Ore Mines on the Mesabi Iron Range
| Operation Name | Ownership | Annual Capacity | Location | Status as of June 1, 2016 |
| Minntac | 100% United States Steel | 16 million net tons | Mt. Iron, Minnesota | Operating |
| Keetac | 100% United States Steel | 6 million net tons | Keewatin, Minnesota | Idle |
| ArcelorMittal Minorca Mines | 100% ArcelorMittal | 2.9 million tons | Virginia, Minnesota | Operating |
| United Taconite | 100% Cleveland Cliffs | 5.4 million gross tons | The mine is located near Eveleth, Minnesota, the plant is located approximately 10 miles away in Forbes, Minnesota | Idle |
| Northshore Mining | 100% Cleaveland Cliffs | 6 million gross tons of pellets and concentrate | The mine is located near Babbitt, Minnesota, the plant is located approximately 47 miles away in Silver Bay, Minnesota | Operating |
| Hibtac | 62.3% ArcelorMittal 23% Cleaveland Cliffs 14.7% United States Steel Note: This operation is managed by Cleaveland Cliffs | 8 million gross tons | Hibbing, Minnesota | Operating |
The Northshore Mining Peter Mitchell Pit is located approximately two miles north of the NorthMet Deposit.
| 5.1 | Accessibility |
Access to the NorthMet Project is by a combination of good quality asphalt and gravel roads via the Erie Plant site. The nearest center of population is the town of Hoyt Lakes, which has a population of about 2,500 people. There are a number of similarly sized communities in the vicinity, all of which are well serviced, provide ready accommodations, and have been, or still are, directly associated with the region’s extensive taconite mining industry. The road network in the area is well developed, though not heavily trafficked, and there is an extensive railroad network which serves the taconite mining industry across the entire Range. There is access to ocean shipping via the ports at Taconite Harbor and Duluth/Superior (on the western end of Lake Superior) and the St. Lawrence Seaway.
| 5.2 | Climate |
Climate is continental and characterized by wide temperature variations and significant precipitation. The temperature in the town of Babbitt, about 6.5 miles north of the NorthMet Deposit, averages four degrees Fahrenheit (°F) in January and 66°F in July. During short periods in summer, temperatures may reach as high as 90°F with high humidity. Average annual precipitation is about 28 inches with about 30% of this falling mostly as snow between November and April. Annual snowfall is typically about 60 inches with 24 to 36 inches on the ground at any one time. The local taconite mines operate year-round and it is rare for snow or inclement weather to cause production disruption.
| M3-PN150164 26 March 2018 |
38
NorthMet Project
Form NI 43-101F1 Technical Report
| 5.3 | Local Resources and Infrastructure |
The area has been economically dependent on the mining industry for many years and while there is an abundance of skilled labor and local mining expertise, the closure in 2001 of the LTVSMC open pit mines and taconite processing facility has had a significant negative impact on the local economy and population growth. There are, however, several other operating mines in other parts of the Iron Range. Because of this, the mining support industries and industrial infrastructure remains well developed and of a high standard.
The Erie Plant site is connected to the electrical power supply grid and a main HV electrical power line (138 kV) runs parallel to the road and railroad that traverse the southern part of the mining lease area. PolyMet has a long-term power contract with Minnesota Power.
There are plentiful local sources of fresh water, and electrical power and water is available nearby. Previous operations at the site processed 100,000 STPD with adequate water supply, which is more than three times the plan for PolyMet.
| 5.4 | Physiography |
The Iron Range forms an extensive and prominent regional topographic feature. The Project site is located on the southern flank of the eastern Range where the surrounding countryside is characterized as being gently undulating. Elevation at the Project site is about 1,600 ft asl (1,000 ft above Lake Superior). Much of the region is poorly drained and the predominant vegetation comprises wetlands and boreal forest. Forestry is a major local industry and the Project site and much of the surrounding area has been repeatedly logged. Relief across the site is approximately 100 ft.
| 5.5 | Sufficiency of Surface Rights |
Tenure of surface rights is described in some detail in Section 4.4. The surface rights over the ore body are currently owned by the USFS. PolyMet has proposed a land exchange with the USFS which has been evaluated in the FEIS. The USFS issued a ROD in January 2017 indicating that the proposed exchange is in the public interest and meets the objectives of the Superior National Forest Plan.
| M3-PN150164 26 March 2018 |
39
NorthMet Project
Form NI 43-101F1 Technical Report
| 6 | HISTORY |
| 6.1 | Ownership |
U.S. Steel held mineral and surface rights over much of the region, including the NorthMet lease, until the 1930s when, for political and land management reasons, surface title was ceded to the USFS. In negotiating the deeds that separated the titles, U.S. Steel retained the mineral rights and the rights to explore and mine any mineral or group of minerals.
U.S. Steel first drilled what is now known as the modern day NorthMet deposit in the 1960s during exploration for a high-grade, underground copper-nickel resource. In 1989, Fleck Resources Ltd. of British Columbia, Canada, acquired a 20-year perpetually renewable mineral rights lease to the NorthMet deposit from U.S. Steel. Fleck Resources developed joint ventures with NERCO Inc. in 1991, and with Argosy Mining Corp. in 1995, in order to advance exploration of the NorthMet deposit.
In June 1998, Fleck Resources changed its name to PolyMet Mining Corp. U.S. Steel sold much of its real estate and mineral rights in the region in 2004, including the NorthMet deposit, to privately held RGGS of Houston Texas. PolyMet’s U.S. Steel lease was transferred to RGGS at that time without any change in conditions. With the exception of a hiatus between 2001 and 2003, PolyMet has continuously carried out exploration and evaluation of the NorthMet deposit since 1989, and currently holds 100% interest in the NorthMet Project.
| 6.2 | Exploration and Sampling |
The NorthMet deposit was formally discovered in 1969 during exploration carried out by U.S. Steel. Between 1969 and 1974, U.S. Steel drilled 112 holes for a total of 113,716 ft, producing 9,475 assay intervals which are included in the modern-day Project database. Assay data from U.S. Steel core samples was not necessarily collected at the time of the original drilling. U.S. Steel also collected three bulk surface samples for metallurgical testing from two discrete locations within the NorthMet Project area. The drill-hole and data accumulated during exploration by U.S. Steel provides important stratigraphic information, and is used to help define the edges of the NorthMet geologic model. U.S. Steel’s exploration efforts, including drilling and sampling procedures and general results, are described in greater detail in Sections 9 and 10 of this report.
| 6.3 | Historical Mineral Resource and Reserve Estimates |
A number of historic mineral resource estimates were completed (U.S. Steel, Fleck Resources, NERCO) prior to PolyMet’s acquisition of the NorthMet Project. These resource estimates predate current NI 43-101 reporting standards and the associated resource models, electronic or otherwise, are not available for verification. Although it is reasonable to presume that they were completed using industry best practices at the time, these mineral resources are not classified using current CIM definition standards, are not reported according to modern reporting codes, are not considered reliable, and therefore are not presented here.
| 6.4 | Historical Production |
There is no historical production data to report for the NorthMet Project.
| M3-PN150164 26 March 2018 |
40
NorthMet Project
Form NI 43-101F1 Technical Report
| 7 | GEOLOGICAL SETTING AND MINERALIZATION |
The information presented in this report section is largely excerpted and/or modified from the Geology and Mineral Potential of the Duluth Complex and Related Rocks of the Northeastern Minnesota (Miller et al., 2002).
| 7.1 | Regional Geology |
The NorthMet Deposit is situated on the western edge of the Duluth Complex in northeastern Minnesota (shown in Figure 7‑1). The Duluth complex is a series of distinct intrusions of mafic to felsic tholeiitic magmas that intermittently intruded at the base of a comagmatic volcanic edifice during the formation of the Midcontinental rift system between 1108 and 1098 Ma. The intrusives of the Duluth Complex represent a relatively continuous mass that extends in an arcuate fashion from Duluth to the northeastern border between Minnesota and Canada near the town of Grand Portage. Footwall rocks are predominantly comprised of Paleoproterozoic and Archean rocks, the hanging wall rocks are made up of mafic volcanic rocks and hypabyssal intrusions, and internally scattered bodies of strongly granoblastic mafic volcanic and sedimentary hornfels can be found.
The Duluth Complex has been subdivided into four general rock series based on age, dominant lithology, internal structure, and structural position within the complex.
| 7.1.1 | Felsic Series |
Massive granophyric granite and smaller amounts of intermediate rock that occur as a semi continuous mass of intrusions strung along the eastern and central roof zone of the complex emplaced during early stage magmatism (~1108 Ma).
| 7.1.2 | Early Gabbro Series |
Layered sequences of dominantly gabbroic cumulates that occur along the northeastern contact of the Duluth Complex that were also emplaced during early stage magmatism (~1108 Ma).
| 7.1.3 | Anorthositic Series |
A structurally complex suite of foliated, but rarely layered, plagioclase-rich gabbroic cumulates that was emplaced throughout the complex during main stage magmatism (~1099 Ma).
| 7.1.4 | Layered Series |
A suite of stratiform troctolitic to ferrogabbroic cumulates that comprises at least 11 variably differentiated mafic layered intrusions and occurs mostly along the base of the Duluth Complex. These intrusions were emplaced during main stage magmatism, but generally after the anorthositic series (~1099 Ma).
| M3-PN150164 26 March 2018 |
41
NorthMet Project
Form NI 43-101F1 Technical Report

Figure 7‑1: Regional Geology
Intrusive rocks of the layered series typically reside along the western edge of the Duluth Complex, and host the 11-known copper-nickel deposits (some contain platinum group elements) including the NorthMet Deposit (Figure 7‑2). The layered series is comprised of 11 discrete mafic layered intrusions spread throughout the Duluth Complex. The 11 known layered series intrusives are known as; Layered series at Duluth, Boulder Lake intrusion, Western Margin intrusion, Partridge River intrusion, South Kawishiwi intrusion, Lake One troctolite, Tuscarora intrusion, Wilder Lake intrusion, Bald Eagle intrusion, Greenwood Lake intrusion, Osier Lake intrusion.
| M3-PN150164 26 March 2018 |
42
NorthMet Project
Form NI 43-101F1 Technical Report
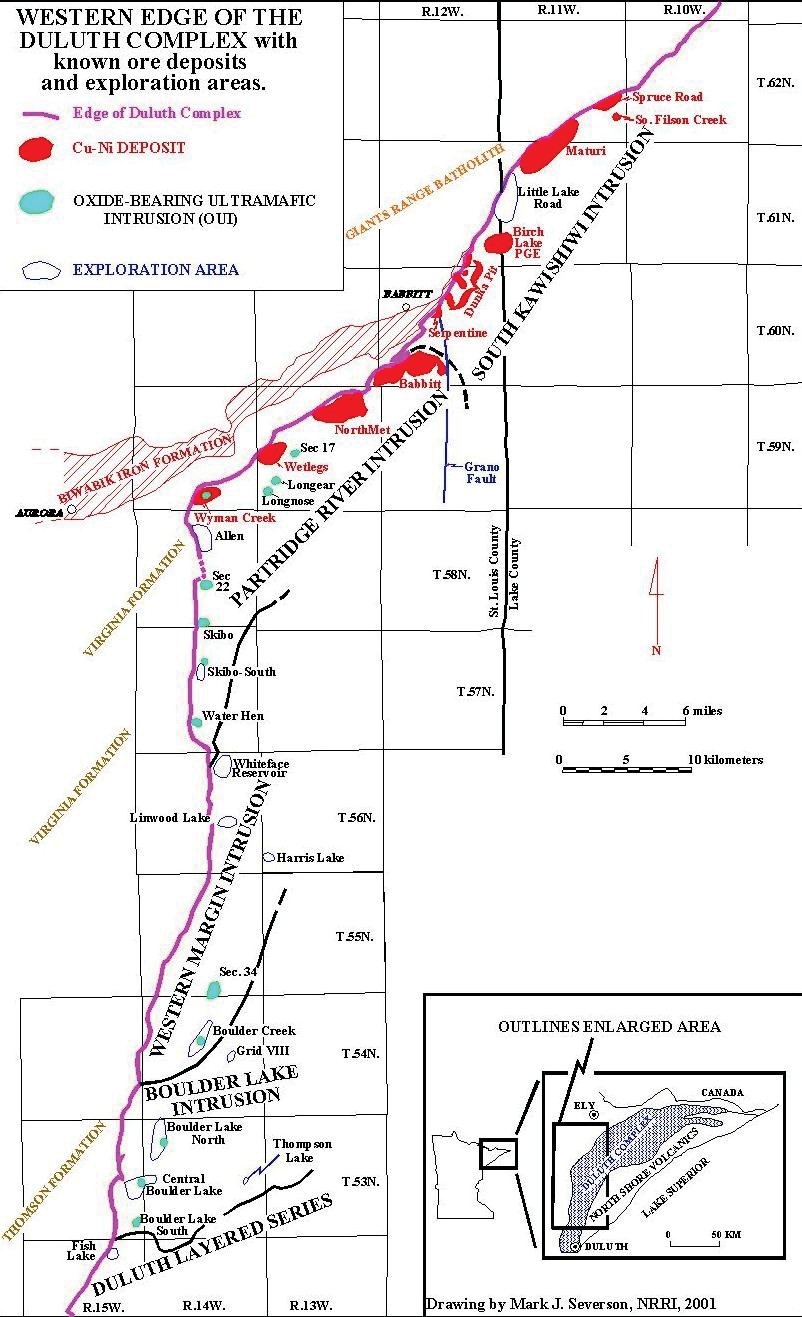
Figure 7‑2: Copper-Nickel Deposits in the Duluth Complex (after Severson)
| M3-PN150164 26 March 2018 |
43
NorthMet Project
Form NI 43-101F1 Technical Report
| 7.2 | Local And Property Geology |
The NorthMet Deposit is situated within the Partridge River Intrusion (“PRI”). The PRI has been mapped, drilled, and studied in detail because of its importance as a host for copper-nickel (“Cu-Ni”) and iron-titanium (“Fe-Ti”) deposits. The PRI consists of varied troctolitic and (minor) gabbroic rock types that are exposed in an arcuate shape that extends from the Water Hen (Fe-Ti) deposit in the south to the Babbitt (Cu-Ni) deposit in the North (Figure 7‑2). Miller and Ripley (1996) estimated the PRI to be nearly 8,000 feet thick. The PRI is bound on the west by the Paleoproterozoic Virginia Formation (slate and graywacke), and to a lessor extent, the Biwabik Iron Formation (“BIF”). The upper portion of the PRI forms a complex contact an assemblage of anorthositic, gabbroic, and hornfelsic rocks. This assemblage is also found as large inclusions within the interior of the PRI (Severson and Miller, 1999). The inclusions are thought to represent earlier roof zone screens that were overplated by later emplacement of Partridge River intrusion magmas.
The bottom 3,000 feet of the PRI is well defined from the abundance of exploration drill core. There are over 1,100 exploration drill holes in this part of the Complex, and nearly 1,000,000 feet of core has been logged or re-logged in the past fifteen years by a small group of company and university research geologists (see Patelke, 2003). This marginal zone, consisting of varied troctolitic and gabbroic rock types, is subdivided into seven stratigraphic units (Severson and Hauck, 1990, 1997; Geerts, 1991; Severson, 1991, 1994) that can be correlated over a strike length of 15 miles. These igneous units generally exhibit shallow dips (10º to 25°) to the southeast. The stratigraphy shown in Figure 7‑3 is based on the relogging of drill core.
| M3-PN150164 26 March 2018 |
44
NorthMet Project
Form NI 43-101F1 Technical Report
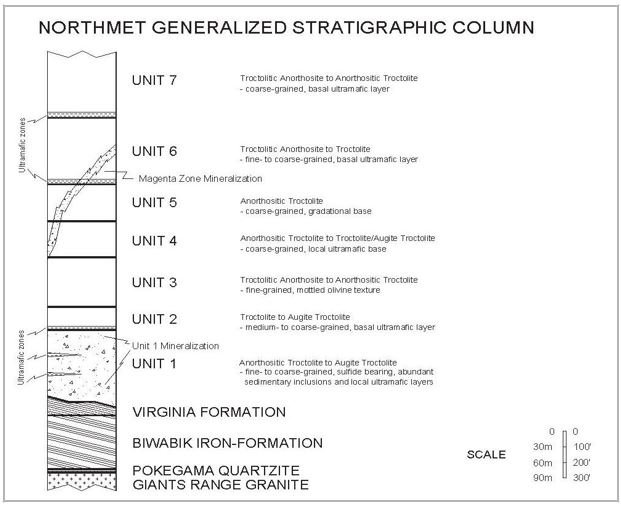
Figure 7‑3: NorthMet Stratigraphic Column (after Geerts, 1994)
| 7.2.1 | Local Lithology |
The following paragraphs describe the principal rock types (and associated map units) within the Project area.
Igneous rock types in the PRI are classified at NorthMet by visually estimating the modal percentages of plagioclase, olivine, and pyroxene. Due to subtle changes in the percentages of these minerals, a variation in the defined rock types within the rock units may be present from interval to interval or hole to hole. This is especially true for Unit 1.
Unit definitions are based on: overall texture of a rock type package; mineralogy; sulfide content; and context with respect to bounding surfaces (i.e., ultramafic horizons, oxide-rich horizons). Unit definitions are not always immediately clear in logging, but usually clarified when drill holes are plotted on cross-sections. In other words, to correctly identify a particular igneous stratigraphic unit, the context of the units directly above and below must also be considered. Figure 7‑4 shows a plan view of the NorthMet geological contacts within the mining lease area.
Based on drill hole logging, the generalized rock type distribution at NorthMet is about 83% troctolitic, 6% anorthositic, 4% ultramafic, 4% sedimentary inclusions, 2% noritic and gabbroic rocks, and the rest as pegmatites, breccia, basalt inclusions and others.
| M3-PN150164 26 March 2018 |
45
NorthMet Project
Form NI 43-101F1 Technical Report

Figure 7‑4: NorthMet Property Bedrock Geology
| M3-PN150164 26 March 2018 |
46
NorthMet Project
Form NI 43-101F1 Technical Report
| 7.2.2 | Unit Definitions and Descriptions |
The units of the NorthMet deposit are described below starting at the top of the PRI.
| 7.2.2.1 | Unit 7 |
Unit 7 is the uppermost unit intersected in drill holes at the NorthMet Deposit. It consists predominantly of homogeneous, coarse-grained, anorthositic troctolite and troctolitic anorthosite. The unit is characterized by a continuous basal ultramafic sub-unit that averages 20 ft thick. The ultramafic consists of fine to medium-grained melatroctolite to peridotite and minor dunite. The average thickness of Unit 7 is unknown due to the truncation by erosion on the surface exposure.
| 7.2.2.2 | Unit 6 |
Similar to Unit 7, Unit 6 is composed of homogeneous, fine to coarse-grained, troctolitic anorthosite and troctolite. It averages 400 ft thick and has a continuous basal ultramafic sub-unit that averages 15 ft thick. Sulfide mineralization is generally minimal, although many drill-holes in the southwestern portion of the NorthMet deposit contain significant copper sulfides and associated elevated platinum group elements (Geerts 1991, 1994). Sulfides within Unit 6 generally occur as disseminated chalcopyrite/cubanite with minimal pyrrhotite.
| 7.2.2.3 | Unit 5 |
Unit 5 exhibits an average thickness of 250 ft and is composed primarily of homogeneous, equigranular-textured, coarse-grained anorthositic troctolite. Anorthositic troctolite is the predominant rock type, but can locally grade into troctolite and augite troctolite towards the base of the unit. The lower contact of Unit 5 is gradational and lacks any ultramafic sub-unit; therefore, the contact with Unit 4 is a somewhat arbitrary pick. Due to the ambiguity of the contact, reported thicknesses of both units vary dramatically. The combined thickness of Units 4 and 5, however, is fairly consistent across the extent of the deposit.
| 7.2.2.4 | Unit 4 |
Unit 4 is somewhat more mafic than Unit 5, and is characterized by homogeneous, coarse-grained, ophitic augite troctolite with some anorthosite troctolitic. Unit 4 averages about 250 ft thick. At its base, Unit 4 may contain a thin (<6 in), discontinuous, local ultramafic layer or oxide-rich zone. The lower contact with Unit 3 is generally sharp. With the exception of the Magenta Zone (described further in Section 7.2), sulfides only occur in Unit 4 in trace amounts of finely disseminated grains of chalcopyrite and pyrrhotite.
| 7.2.2.5 | Unit 3 |
Unit 3 is the primary marker bed used to determine stratigraphic position in drill core. Unit 3 is composed of fine to medium-grained, poikilitic and/or ophitic, troctolitic anorthosite to anorthositic troctolite. Characteristic poikilitic olivine gives the rock an overall mottled appearance. On average, Unit 3 is 300 ft thick. The lower contact of Unit 3 can be disrupted, with multiple “false starts” into relatively homogeneous rocks typical of Unit 2, only to return to the mottled appearance characteristic of Unit 3 with depth. This roughly alternating sequence, or transitional zone, is commonly encountered in the southwestern portion of the NorthMet deposit, and can span for many tens of feet of core before the transition into Unit 2 can be confidently identified. The transitional zone between Units 2 and 3 suggests that Unit 3 is disturbed and intruded by Unit 2 near the base of Unit 3. As with Units 4 and 5, the independent thicknesses of Units 2 and 3 tend to be highly variable, whereas their combined depth is relatively consistent throughout the deposit (though not as consistent as Units 4 and 5).
| M3-PN150164 26 March 2018 |
47
NorthMet Project
Form NI 43-101F1 Technical Report
Unit 3 can contain both footwall meta-sedimentary (Virginia Formation) and hanging wall basalt inclusions, which are interpreted as an indication of earliest emplacement within the intrusive sequence of the NorthMet deposit. This interpretation is exemplified by the fact that few sedimentary inclusions are found above Unit 3, and few basalt inclusions are found below it, which can be attributed to the intrusion of Unit 3 between the two rock types.
| 7.2.2.6 | Unit 2 |
Unit 2 is characterized by homogeneous, medium to coarse-grained troctolite and pyroxene troctolite with a consistent basal ultramafic sub-unit. The continuity of the basal ultramafic sub-unit, in addition to the relatively uniform grain size and homogeneity of the troctolite, cause this unit to be distinguishable from Units 1 and 3. Unit 2 has an average thickness of 100 ft. The ultramafic sub-unit at the base of Unit 2 is the lowermost continuous basal ultramafic horizon at the NorthMet deposit, averaging 25 ft thick, and is composed of melatroctolite to peridotite and minor dunite.
The boundaries of Unit 2 and its arrangement within the sequence of intrusion are ambiguous; it can be interpreted as the lower part of Unit 3, the upper part of Unit 1, or a separate unit all together. Based on the continuity of the ultramafic sub-unit, it seems to be a lower, more mafic, counterpart to Unit 3. The general lack of footwall inclusions in Unit 2 counter the contention that Unit 2 is older than Unit 1, and instead indicate an intrusive sequence of 3, 1 then 2. Though Unit 2 has historically been described as barren, mineralization which is grossly continuous at the top of Unit 1, has been encountered in Unit 2 in the western portion of the NorthMet deposit.
| 7.2.2.7 | Unit 1 |
Of the seven igneous rock units represented within the NorthMet Deposit, Unit 1 is the only unit that contains significant, deposit-wide sulfide mineralization. Sulfides occur primarily as disseminated interstitial grains between a dominant silicate framework and are chalcopyrite > pyrrhotite > cubanite > pentlandite. Unit 1 is also the most complex unit, with internal ultramafic sub-units, increasing and decreasing quantities of mineralization, complex textural relations and varying grain sizes, and abundant metasedimentary inclusions. It averages 450 ft thick, but is locally 1,000 ft thick and is characterized lithologically by fine to coarse-grained heterogeneous rock ranging from anorthositic troctolite (more abundant in the upper half of Unit 1) to augite troctolite with lesser amounts of gabbro-norite and norite (becoming increasingly more abundant towards the basal contact) and numerous metasedimentary inclusions. By far, the dominant rock type in Unit 1 is medium-grained ophitic augite troctolite, though with wildly variable texture. Two internal ultramafic sub-units with an average thickness of 10 ft are encountered in drill holes in the southwest portion of the deposit.
| 7.2.2.8 | Footwall: Animikie Group and Archean Rocks |
The footwall rocks of the NorthMet deposit consist of Paleoproterozoic (meta) sedimentary rocks of the Animikie Group. These rocks are represented by the following three formations, from youngest to oldest: the Virginia Formation; the Biwabik Iron Formation; and the Pokegama Quartzite. They are generally underlain by Archean granite of the Giants Range Batholith, but there are Archean basalts and metasediments mapped in an outcrop near the Project area. The Virginia Formation is the only member of the Animikie Group in contact with the Duluth Complex in the NorthMet Project area.
The Virginia Formation was metamorphosed during emplacement of the Duluth Complex. Non-metamorphosed Virginia Formation (as found to the north of the site) consists of a thinly-bedded sequence of argillite and greywacke, with lesser amounts of siltstone, carbonaceous-sulfidic argillite/mudstone, cherty-limey layers, and possibly some tuffaceous material. However, in proximity to the Duluth Complex, the grade of metamorphism (and associated local deformation) progressively increases, and several metamorphic varieties and textures are superimposed on the original sedimentary package at an angle to the original stratigraphy. At least four distinctive metamorphosed Virginia Formation varieties are present at NorthMet and are informally referred to as the cordieritic metasediments; disrupted unit; recrystallized unit; and graphitic argillite (often with pyrrhotite laminae). These sub-units are fully described in Severson et al., 2000.
| M3-PN150164 26 March 2018 |
48
NorthMet Project
Form NI 43-101F1 Technical Report
| 7.2.2.9 | Inclusions in the Duluth Complex |
Two broad populations of inclusions occur at NorthMet: hanging wall basalts (Keweenawan) and footwall meta-sedimentary rocks. The basalts are fine-grained, generally gabbroic, with no apparent relation to any mineralization. Footwall inclusions may carry substantial sulfide (pyrrhotite) and often appear to contribute to the local sulfur content. Footwall inclusions are all Virginia Formation; no iron-formation, Pokegama Quartzite, or older granitic rock has been recognized as an inclusion at NorthMet.
| 7.3 | Local Structure |
Footwall faults are inferred from bedding dips in the underlying sedimentary rocks, considering the possibility that Keweenawan syn-rift normal faults may affect these underlying units and show less movement, or indeed no effect on the igneous units. Nonetheless, without faults, the footwall or igneous unit dips do not reconcile perfectly with the overall slope of the footwall. There are some apparent offsets in the igneous units, but definitive and continuous fault zones have not been identified. So far, no apparent local relation between the inferred location of faults and mineralization has been delineated.
Outcrop mapping (Severson and Zanko, 1996) shows apparent unit relations that require faults for perfect reconciliation. However, as with information derived from drill core, neither igneous stratigraphic unit recognition, nor outcrop density, is sufficiently definitive to establish exact fault locations without other evidence.
There is a wealth of regional (and some local) geophysical data available, though the resolution of core logging and field mapping is probably better than that of the geophysics, hence while the geophysical data is interesting, it has not yet been useful at delineating the structural geology of the site nor proved to be a guide to mineralization.
| 7.4 | Mineralization |
The metals of interest at NorthMet are copper, nickel, cobalt, platinum, palladium, silver, and gold. Minor amounts of rhodium and ruthenium are present though these are considered to have no economic significance. In general, except for cobalt and gold, the metals are positively correlated with copper mineralization. Cobalt is well correlated with nickel. Most of the metals are concentrated in, or associated with, four sulfide minerals: chalcopyrite, cubanite, pentlandite, and pyrrhotite, with platinum, palladium and gold also found as elements and in bismuthides, tellurides, and alloys.
Mineralization occurs in four broadly defined horizons or zones throughout the NorthMet property. Three of these horizons are within basal Unit 1, though they likely will not be discriminated in mining. The upper horizon locally extends upward into the base of Unit 2. The thickness of each of the three Unit 1 enriched horizons varies from 5 ft to more than 200 ft. Unit 1 mineralization is found throughout the base of the NorthMet deposit. A less extensive mineralized zone (the copper-rich, sulfur-poor Magenta Zone, Figure 7‑5) is found in Units 4, 5 and 6 in the western part of the NorthMet deposit.
| M3-PN150164 26 March 2018 |
49
NorthMet Project
Form NI 43-101F1 Technical Report
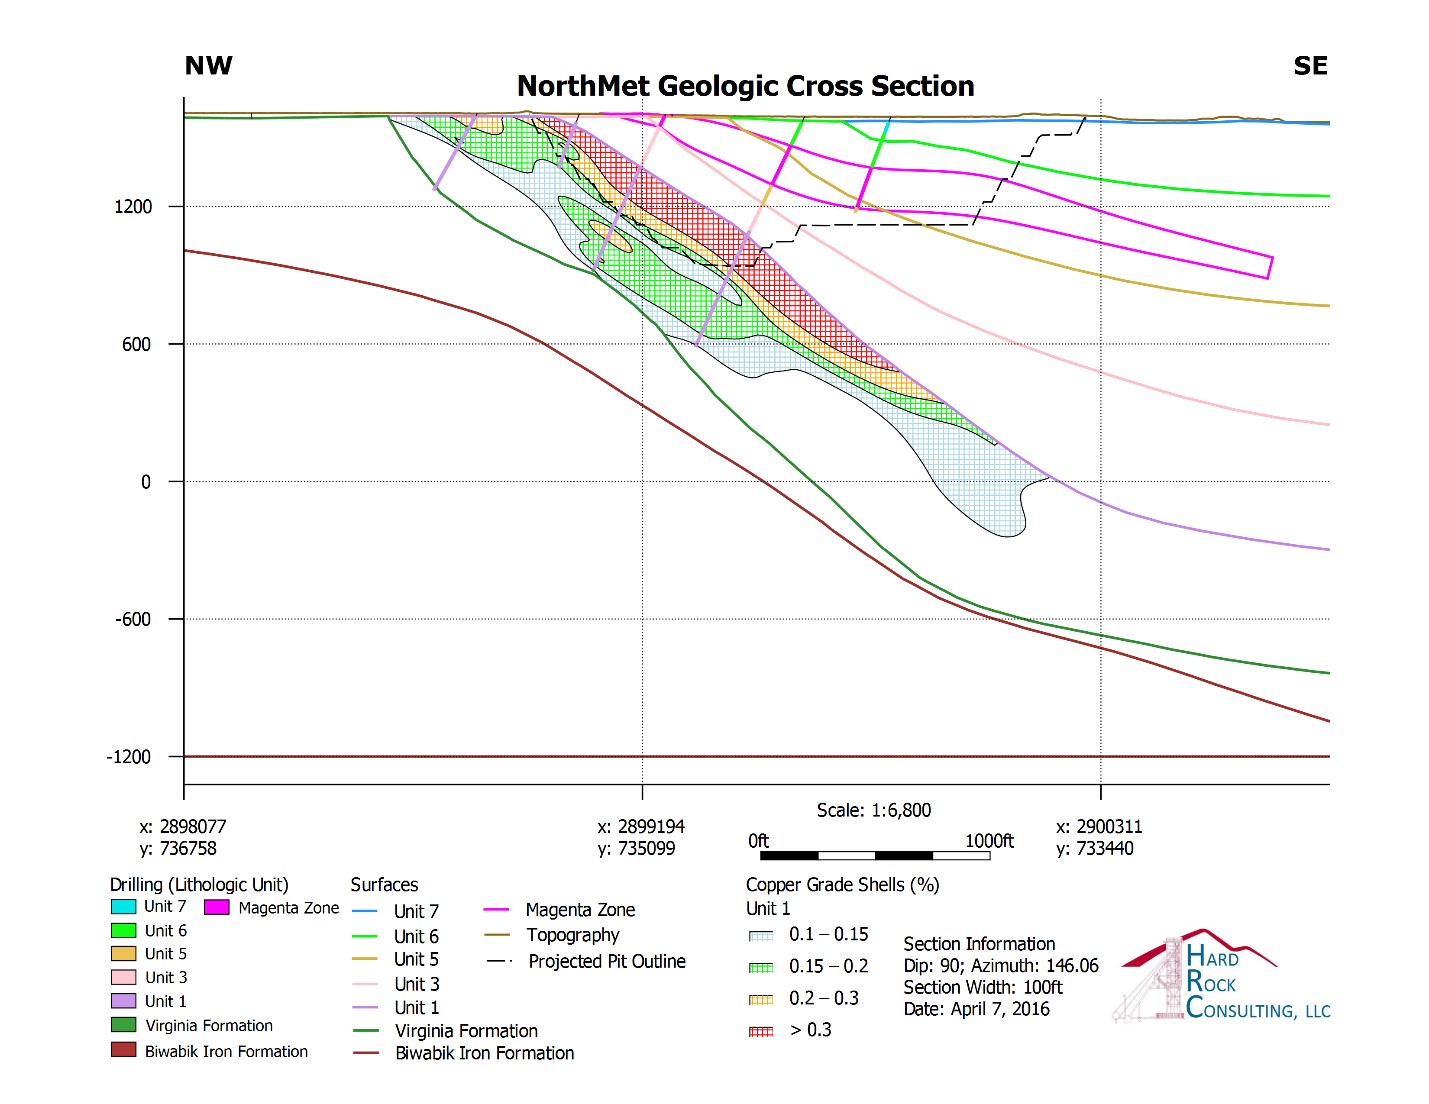
Figure 7‑5: NorthMet “Magenta Zone” in Cross Section
| M3-PN150164 26 March 2018 |
50
NorthMet Project
Form NI 43-101F1 Technical Report
| 8 | DEPOSIT TYPES |
Information in this section is largely excerpted and/or modified from the Occurrence Model for Magmatic Sulfide-Rich Nickel-Copper-(Platinum Group Element) Deposits Related to Mafic and Ultramafic Dike-Sill Complexes (Schulz et al., 2014).
The NorthMet deposit is considered a magmatic Copper - Nickel ± platinum group element (PGE) deposit. These are a broad group of deposits containing nickel, copper, and PGEs occurring as sulfide concentrations associated with a variety of mafic and ultramafic magmatic rocks (Zientek, 2012; Eckstrand and Hulbert 2007). Magmatic Cu-Ni sulfide deposits with or without PGEs account for approximately 60 percent of the world’s nickel production. Magmatic Ni-Cu±PGE sulfide deposits are spatially and genetically related to bodies of mafic and/or ultramafic rocks. The sulfide deposits form when the mantle-derived magmas become sulfide-saturated and segregate immiscible sulfide liquid, commonly following interaction with continental crustal rocks.
Deposits of magmatic Ni-Cu sulfides occur with mafic and/or ultramafic bodies in a wide array of geologic settings. The deposits range in age from Archean to Tertiary, but the largest number of deposits are Archean and Paleoproterozoic, as with the NorthMet deposit. Although deposits occur on most continents, ore deposits (deposits of sufficient size and grade to be economic to mine) are relatively rare; major deposits are present in Russia, China, Australia, Canada, and southern Africa. Ni-Cu sulfide ore deposits can occur as single or multiple sulfide lenses within mafic and/or ultramafic bodies with clusters of such deposits comprising a district. Typically, deposits contain grades of between 0.5 and 3.0 percent Ni and between 0.2 and 2.0 percent Cu. Tonnages of individual deposits range from a few tens of thousands to tens of millions of tons (Mt). Two giant Ni-Cu districts, with ≥10 Mt Ni, dominate world Ni sulfide resources and production. These are the Sudbury district, Ontario, Canada, where sulfide ore deposits are at the lower margins of a meteorite impact-generated igneous complex and contain 19.8 Mt Ni; and the Noril’sk-Talnakh district, Siberia, Russia, where the deposits are in subvolcanic mafic intrusions related to flood basalts and contain 23.1 Mt Ni. In the United States, the Duluth Complex in Minnesota, comprised of a group of mafic intrusions related to the Midcontinent Rift system, represents a major Ni resource of 8 Mt Ni. The Duluth Complex deposits generally exhibit lower grades of nickel and copper (0.2 percent Ni, 0.66 percent Cu).
The sulfides in magmatic Ni-Cu deposits generally constitute a small volume of the host rock(s) and tend to be concentrated in the lower parts of the mafic and/or ultramafic bodies, often in physical depressions or areas marking changes in the geometry of the footwall topography. In most deposits, the sulfide mineralization can be divided into disseminated, matrix, and massive sulfide, depending on a combination of the sulfide content of the rock and the silicate texture. The major Ni-Cu sulfide mineralogy typically consists of an intergrowth of pyrrhotite, pentlandite, and chalcopyrite. Cobalt, PGE, and gold (Au) are extracted from most magmatic Ni-Cu ores as by-products, and such elements can have a significant impact on the economics of the deposits, such as the Noril’sk-Talnakh deposits, which produces much of the world’s palladium. In addition, deposits may contain between 1 and 15 percent magnetite associated with the sulfides.
The NorthMet deposit is a large-tonnage, disseminated accumulation of sulfide in mafic rocks, with rare massive sulfides. Copper to nickel ratios generally range from 3:1 to 4:1. Primary mineralization is probably magmatic, though the possibility of structurally controlled re-mobilization of the mineralization (especially PGE) has not been excluded. The sulfur source is both local and magmatic (Theriault et al., 2011). Extensive detailed logging has shown no definitive relation between specific rock type and the quantity or grade quality of sulfide mineralization in the Unit 1 mineralized zone or in other units, though local noritic to gabbronoritic rocks (related to footwall assimilation) tend to be of poorer PGE grade and higher in sulfur.
| M3-PN150164 26 March 2018 |
51
NorthMet Project
Form NI 43-101F1 Technical Report
| 9 | EXPLORATION |
The information presented in this section is largely excerpted and/or modified from the Updated NI 43-101 Technical Report on the NorthMet deposit prepared by AGP Mining Consultants, Inc. (AGP, 2013).
U.S. Steel’s interest in the NorthMet deposit (also known as the Dunka deposit) was triggered by an anomaly identified during airborne survey work conducted in 1966. U.S. Steel mapped and ground surveyed the property the following year, and initiated drilling exploration in 1968. Drilling has been the primary method of exploration at the Project, however, 240 geophysical soundings, numerous test pits, and down-hole geophysical testing have been completed to better understand the depth to bedrock and the lithologic contacts.
| 9.1 | Geophysical Sounding |
Ninety-Eight Vertical Electrical Soundings (VES) were completed at the NorthMet project in 2006. The VES geophysical method was selected to determine the depth to bedrock and to characterize the overburden material. The method is based on the estimation of the electrical conductivity or resistivity of the material. The estimation is performed based on the measurement of voltage of electrical field induced by the grounded electrodes (current electrodes).
In general, the measured profiles consisted of three differing resistive layers. A high resistivity layer primarily consisting of the surficial frozen layer. Below the surficial layer a resistivity low represents the till. The resistivities varied widely in this layer, depending on the material properties of the till. The bottom layer is bedrock, either Duluth complex or Virginia formation. In nearly all of the measurements the bottom layer has a higher resistivity than the till above, with the exception of a few locations above the Virginia formation. Portions of the Virginia formation can be enriched in pyrite, pyrrhotite or graphite, making it more conductive than the till above.
| 9.2 | U.S. Steel Bulk Sampling |
U.S. Steel took at least three bulk samples from the Dunka Road deposit, labeled in their documentation as Bulk No. 1, Bulk No. 2, and Bulk No. 3. U.S Steel also took a few small trench samples and processed some drill core composites from the site. These are recorded in the sample receiving books at Coleraine Minerals Research Laboratory (Patelke and Severson, 2006).
Bulk No. 1 was collected in 1980 in NW¼ Section 10, T59N, R13W, near the location of U.S. Steel drill-hole DDH 26058. Historic records indicate that a 70 to 85-ton sample was collected from this site, which returned a reported bulk head grade of 0.39% Cu, 0.14% Ni, and 0.50% S, but there is no associated documentation regarding site selection or metallurgical testing (Patelke and Severson, 2006).
Bulk No. 2 was the first of two samples collected from the Project in 1971. This sample consisted of 300 tons of material from a pit located directly north of the up-dip projection of DDH 26105. According to U.S. Steel documents, the sample did not intersect the grades expected, and the low grade was attributed to contamination by barren footwall rock.
Bulk No. 3 was collected at the south edge (stratigraphically higher) Bulk No. 2 pit to move up-section from the footwall rock contamination encountered in Bulk No. 2. A 20-ton sample was collected, which returned a bulk head grade of 0.58% Cu, 0.22% Ni, and 0.98% S (Patelke and Severson, 2006).
Associated U.S. Steel documents only reference DDH 26105 prior to collecting the bulk samples. It is not known whether any blast holes or studies were completed in preparation or during the collection of the samples.
The pilot plant tests on three bulk samples of copper-nickel sulfides from the Project resulted in recoveries of 83 to 89 percent of the total copper and 72 to 85 percent of the sulfide nickel in a cleaned bulk sulfide concentrate containing 20 percent copper and 4.5 percent nickel. Mineral liberation required grinding to 75 percent passing a minus 200 mesh. Crushing and grinding consumed about 23 net kWh per ton.
| M3-PN150164 26 March 2018 |
52
NorthMet Project
Form NI 43-101F1 Technical Report
Differential flotation of the bulk sulfide concentrate was unsuccessfully attempted to make separate copper and nickel concentrates. It was determined that a selective flotation scheme maintained good selectivity and high metal recovery in bench scale tests. This was accomplished in two steps; 1) floating the copper sulfides, and 2) and floating the previously depressed nickel sulfides. However, this method was problematic in the pilot plant as it was difficult to control the critical parameters, notably pH of the pulp, during the various stages of flotation.
The historic documents indicate that U.S. Steel was confident that the extraction process would be economically feasible. However, the additional test work required for detailed costing was never completed (Patelke and Severson, 2006).
| 9.3 | Down-Hole Geophysical Testing |
In 1970 and 1971, a geophysical company and the United States Geological Survey (USGS) respectively, initiated two separate attempts to determine if down-hole geophysical methods could be used to:
| · | Determine the distribution of sulfide-mineralized material around a single drill hole, |
| · | Determine the continuity of sulfide-mineralized zones between drill holes, |
| · | Determine if lithologic rock type differences could be detected by geophysical methods, |
| · | Provide background information for surface exploration techniques, and/or |
| · | Test new and modified logging instruments. |
Hewitt Enterprises of Draper, UT, conducted two types of down-hole surveys on five U.S. Steel drill-holes in 1970. An in-hole electrical survey was used to make resistivity and induced polarization (IP) measurements at regular intervals in three drill holes, and five drill holes were logged using the potential drop method to measure self potential (SP), IP and electric potential (ΔV). Results from both surveys were judged to be ineffectual in responding to sulfide content or lithology (Severson and Heine, 2007).
In 1971, the USGS made in-hole logging measurements of seven U.S. Steel drill holes. Due to several unfortunate incidents with the probe becoming stuck in some of the holes, only a minimum of information was obtained. According to Severson and Heine (2007), preliminary results suggested that:
| · | Continuous in-hole logging is more advantageous than the spot measurements that were made in 1970, |
| · | IP measurements could not be made because of the extremely high resistivity of 20,000 to 30,000-ohm meters and relatively short delay time (12 milliseconds) after cessation of current pulse, |
| · | The gamma ray logs delineated the graphitic hornfels with an associated higher background radioactivity, |
| · | Resistivity and magnetic susceptibility measurements could be used collectively to distinguish between pyrrhotite-rich zones and magnetite-rich zones, |
| · | It appeared that resistivity could not be used to correlate sulfide zone in one hole to a nearby hole, and |
| · | In-hole logging does not appear to show any meaningful results for determining the continuity of mineralized zones between drill holes, and thus, does not appear to be a substitute for drilling. |
| M3-PN150164 26 March 2018 |
53
NorthMet Project
Form NI 43-101F1 Technical Report
| 10 | DRILLING |
| 10.1 | Introduction |
Exploration drilling was carried out by U.S. Steel between 1969 and 1974. In total, eight drilling programs have been conducted at NorthMet (U.S. Steel, NERCO, and PolyMet) resulting in 439 drill holes, representing over 300,000 feet of stratigraphic control and analytical results.
In addition to the data provided by the drilling exploration programs, stratigraphic data is available from another seventy exploration holes drilled in the area for nearby projects, hydrogeological studies, or water supply wells. All exploration data is maintained by PolyMet in a drill-hole database used for resource evaluation, reserve calculation, and mine planning. PolyMet has verified and validated all drilling locations, down-hole surveys, lithology, rock property, and assay data, organized all related records, and established procedures for ongoing database maintenance.
Prior to PolyMet’s involvement in the Project, 116 core holes were drilled in the main Project area by U.S. Steel and NERCO. Table 10‑1 lists the drill-holes by series, type and company drilled specifically for the NorthMet Project. Figure 10‑1 shows the drill-hole locations.
Table 10‑1: NorthMet Project Drill Hole Summary
| Date | Hole Identification Range | Exploration Company | Drill-hole Type | No. Of Holes Drilled | Reported/Actual Feet |
| 1969 -1974 | 26010 - 26143 | U.S. Steel | Core | 112 | 133,716 |
| 1991 | 26086A, 26101A | NERCO | Core | 2(4) | 842 |
| 1998-2000 | "98-," "99-," "00-" | PolyMet | RC | 52 | 24,650 |
| 1999-2000 | "99-," "00-" | PolyMet | Core | 32 | 22,156 |
| 2000 | "99-" | PolyMet | Core | 3 | 2,697 |
| 2005 | "05-" | PolyMet | Core | 109 | 77,167 |
| 2007 | "07-" | PolyMet | Core | 61 | 24,530 |
| 2010 | "10-" | PolyMet | Core | 66 | 20,132 |
| M3-PN150164 26 March 2018 |
54
NorthMet Project
Form NI 43-101F1 Technical Report
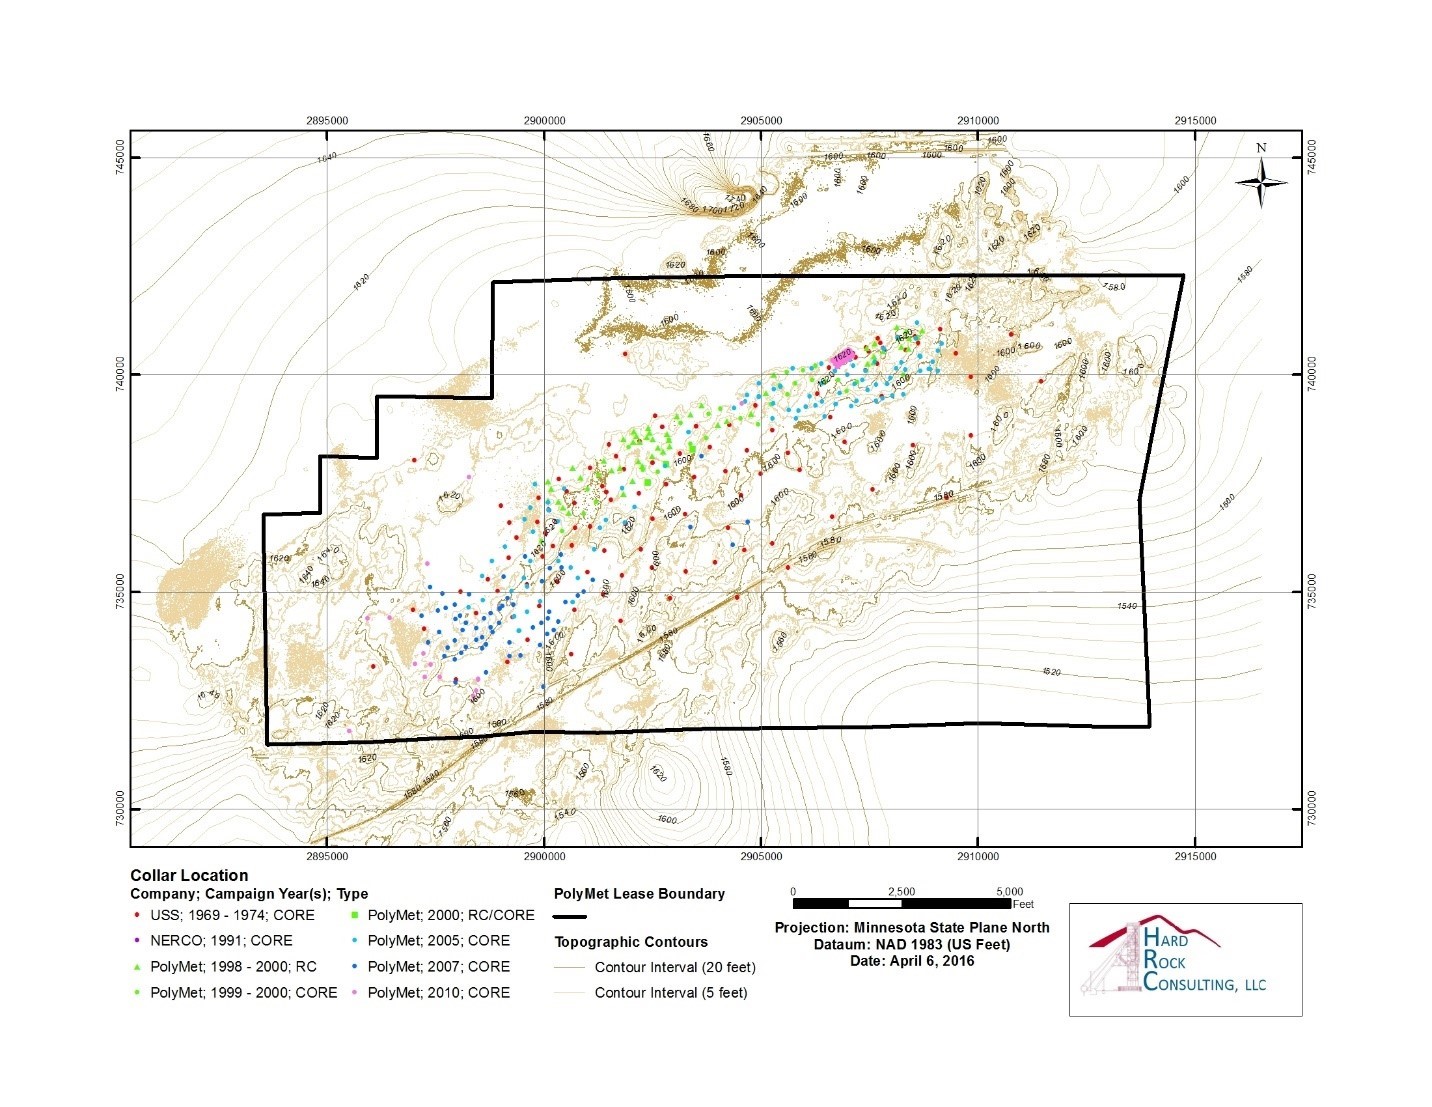
Figure 10‑1: Drill-hole Collar Location by Campaign
| M3-PN150164 26 March 2018 |
55
NorthMet Project
Form NI 43-101F1 Technical Report
| 10.2 | Historic Drilling |
| 10.2.1 | U.S. Steel Drilling, 1969 – 1974 |
From 1969 to 1974, U.S. Steel contracted Longyear to drill 112 diamond core holes across the property. Early exploration drilling programs were designed to test geophysical targets. The US Steel drilling was designed to intersect a potential geophysical conductor. The first hole drilled on the NorthMet deposit intersected 4.8% Cu in a 3-ft intersection of massive sulfide, 115 ft from the surface. Follow up drill results were less impressive, however drilling resulted in the delineation of a broad zone of low-grade copper-nickel sulfide mineralization. Further drilling indicated that the original geophysical target was graphitic argillite in the footwall, rather than mineralization in the Duluth Complex.
The majority of the core was BQ size. All but 14 of the holes drilled by US Steel were vertical. Hole depths ranged from 162 ft to 2,647 ft, averaging 1,193 ft. Five holes were drilled to depths exceeding 2,500 ft.
| 10.2.2 | NERCO Drilling 1991 |
NERCO conducted a minor drilling campaign in 1991, which consisted of four holes at two sites. At each site, a BQ sized core hole (1.43 inches) was drilled and the entire drill hole was sampled. A PQ (3.3 inch) hole twinned each of these holes, and the associated core was sent in its entirety for metallurgical work on the assumption that the assays on the smaller diameter core would represent the larger diameter core. Both sets of holes twinned existing U.S. Steel holes (Pancoast, 1991). A total of 165 assays from the smaller diameter cores were processed at ACME.
| 10.3 | PolyMet Drilling |
PolyMet completed 290 drill holes between 1998 and 2010 totaling 171,332 ft. Of the 290 holes drilled by PolyMet, 52 were drilled using reverse circulation, and 238 are diamond core holes. Drilling exploration conducted by PolyMet is summarized in Table 10‑1, and drill hole distribution is shown on Figure 10‑1.
| 10.3.1 | PolyMet Drilling, 1999 – 2000, Reverse Circulation Holes |
From 1998 to 2000, PolyMet drilled 52 vertical reverse circulation (RC) holes to supply material for a bulk sample. A portion of these drill-holes twinned U.S. Steel holes, and others served as in-fill over the extent of the NorthMet deposit. The RC holes averaged 474 ft, with a minimum of 65 ft and a maximum depth of 745 ft. The drilling was completed by a contractor from Duluth with extensive RC experience, and was carried out year-round. The type of bit and extraction system used (cross-over sub or face-sampling) is not known. Available recorded sample weights indicate a recovery of at least 85%. Metallurgical core drilling, in approximately February and March of 2005, twinned some of these RC holes.
| 10.3.2 | PolyMet Drilling, 1999-2000, Diamond Core Holes |
The first PolyMet core drilling program was carried out during the later parts of the RC program, with three holes drilled late in 1999 and the remainder in early 2000. There were seventeen BTW (1.65 inch) and fifteen NTW (2.2 inch) diameter holes all of which were vertical. Three RC holes were re-entered and deepened with AQ core. Core holes averaged 692 ft in depth, with a minimum of 229 ft and a maximum depth of 1,192 ft. (not including RC holes extended with AQ core). These holes were assayed from top to bottom (with minimal exception) on 5-foot intervals. Samples were split into half core at the PolyMet field office in Aurora, Minnesota. Core logging was completed at the PolyMet office by geologists trained to recognize the stratigraphic units and the subtleties of the mineralogy and textures described by Severson (1988).
| M3-PN150164 26 March 2018 |
56
NorthMet Project
Form NI 43-101F1 Technical Report
| 10.3.3 | PolyMet Drilling, 2005, Diamond Core Holes |
PolyMet’s 2005 drilling program had four distinct goals: collection of metallurgical sample, continued in-fill drilling for resource estimation, resource expansion, and collection of oriented core for geotechnical data. The program included 109 holes totaling 77,165 ft, including:
| · | 15 one-inch diameter holes for metallurgical samples (6,974 ft) drilled by Boart-Longyear of Salt Lake City (February - March 2005). |
| · | PQ sized holes (core diameter 3.3 inches) totaling 6,897 ft, to collect bulk sample material, and to improve the confidence in the known resource area (February - March 2005). |
| · | 52 NTW sized holes (2.2 inches) totaling 41,403 ft for resource definition. |
| · | 30 NQ2 sized holes (2.0 inches) totaling 21,892 ft for resource definition and geotechnical purposes. The NTW and NQ2 size core was drilled in the spring (February-March) and fall (September-December) of 2005. |
Roughly 11,650 multi-element assays were collected from the 2005 drilling program. Another 1,790 assays were performed on previously drilled U.S. Steel and PolyMet core during, as well. ALS-Chemex completed all the analytical test work for 2005 drilling and re-sampling program.
Of the 109 holes drilled in 2005, 93 were drilled at an angle. The angled holes were aligned on a grid oriented N34W with dips ranging from -60° to -75°. Sixteen NQ2 sized holes were drilled and marked for oriented core at varying dips, for geotechnical assessment across the Project. These holes targeted positions of the projected pit walls, as defined by Whittle pit shells (AMDAD mining consultants). The targeted locations and geotechnical data are continually reviewed as the project advances and are considered to be reasonable for the current iteration of the pit design.
PolyMet analyzed close to 900 core intervals for “whole rock” oxides, 300 samples were analyzed for Rare Earth Elements (REE), and thousands of density measurements were completed. This data is used to support resource evaluation as well as waste characterization efforts required for permitting.
Separately, about 100 samples from previously drilled and analyzed core were submitted for humidity cell testing. These samples represented a broad cross-section of units, rock-types, metal content, and sulfur content. In addition, these humidity cell samples were all re-assayed, analyzed for whole rock and assessed in thin-section and by micro-probe.
| 10.3.4 | PolyMet Drilling, 2007, Diamond Core Holes |
In 2007, PolyMet conducted two drilling programs, a winter program of 47 holes totaling 19,102.5 ft and a summer program of 14 holes totaling 5,437.5 ft. The initial 16 winter holes were NTW sized, the remaining drill holes from both programs were NQ2 core. Most of these holes were angled to north-northwest (azimuth 326°). The 2007 holes averaged 402 ft in depth, with a minimum of 148 ft and maximum of 768.5 ft.
| 10.3.5 | PolyMet Drilling, 2010, Diamond Core Holes |
In 2010, PolyMet conducted a winter drilling program with two objectives:
| 1. | Collect detailed geostatistical data across a grid in the initial mining area, and |
| 2. | Develop a geologic and assay framework around the west margin of the deposit. |
Secondary to these purposes was the gathering of approximately ten tons of potential bulk sample material.
| M3-PN150164 26 March 2018 |
57
NorthMet Project
Form NI 43-101F1 Technical Report
The grid area in the planned east pit encompassed 8,720 ft of drilling with 1,664 multi-element assays and the western drilling totaled 11,401 ft with 1,345 samples taken. Grid drilling was sampled by elevations representing bench levels. Data from this was used to establish appropriate sampling protocols during mining.
Assay results in the grid area were consistent with expectations from previous block models. In the west, Unit 1 and Magenta Zone ore grade mineralization continue well outside the planned pit boundaries with the furthest hole in this program 2,600 feet to the west of the planned pit edge.
| 10.4 | Relevant Results And Interpretation |
Very little documentation is available on drilling and sampling procedures employed by U.S. Steel and NERCO. However, the drilling was conducted by companies experienced in exploration and production and is considered reliable.
In all cases, drilling has shown a basal mineralized zone (Unit 1) in heterogeneous troctolitic rocks with the highest values in the upper portion with grades generally diminishing to depth along drill holes. Grade appears to increase down dip, but less information is available as the depth to the unit intersection increases. The main ore zone is 200 to 1,000 ft thick, averaging about 450 ft. The mineralization extends from base of the till at the north edge of the Project and continues to depths greater than 2,500 ft. Sampling on the deepest holes is sparse, with little in-fill work done since the original U.S. Steel drilling. PolyMet collected 700 samples from the deeper U.S. Steel holes in the spring of 2006, this data is included in the exploration database.
Core recovery is reported by PolyMet to be upwards of 99% (Table 10‑2) with rare zones of poor recovery. Rock quality designation (RQD) is also very high, averaging 85% for all units, excluding the Iron formation. Experience in the Duluth Complex indicates that core drilling has no difficulty in producing samples that are representative of the rock mass. Rock is fresh and competent and the types of alteration (when observed: sausserization, uralization, serpentinization and chloritization) do not affect recovery.
Values exceeding 100 may arise from errors associated with assembling broken core or from core runs that are slightly longer than the core barrel.
Table 10‑2: Summary of Core Recoveries and RQD Measurements (includes all drilling through 2010)
| Unit | Recovery Count | Recovery Percentage (%) | RQD Count | RQD Percent |
| 1 | 8,906 | 99.9 | 4,194 | 91.8 |
| 2 | 1,879 | 99.5 | 968 | 90.3 |
| 3 | 4,374 | 100 | 2,632 | 93.5 |
| 4 | 2,160 | 100 | 1,063 | 96.4 |
| 5 | 1,901 | 100 | 838 | 94.3 |
| 6 | 2,262 | 100 | 1,041 | 94.7 |
| 7 | 951 | 99.3 | 396 | 87.4 |
| Virginia Formation | 2,095 | 99.7 | 1,069 | 87.6 |
| Inclusions | 62 | 98.1 | 57 | 86.6 |
| Biwabik Iron Formation | 381 | 100 | 60 | 79.8 |
| Duluth Complex Average | 99.96 | 92.82 |
| M3-PN150164 26 March 2018 |
58
NorthMet Project
Form NI 43-101F1 Technical Report
| 11 | SAMPLE PREPARATION, ANALYSES AND SECURITY |
There are multiple generations of sample analyses that contribute to the overall project assay database:
| · | Original U.S. Steel core sampling, by U.S. Steel, 1969-1974 |
| · | Re-analysis of U.S. Steel pulps and rejects, selection by Fleck and NRRI, 1989-1991 |
| · | Analysis of previously un-sampled U.S. Steel core, sample selection by Fleck and NRRI in 1989-1991, and 1999-2001 |
| · | Analysis of 2 of the 4 NERCO drill-holes, 1991 |
| · | PolyMet RC cuttings, 1998-2000 |
| · | PolyMet core, 2000, 2005, 2007, and 2010 |
The laboratories utilized by U.S. Steel were not independent of the company, and no information regarding accreditation is available. All the labs that have provided analytical testing for PolyMet were or currently are fully accredited, independent, commercial labs that are not related to any of the exploration companies or any of its directors or management.
PolyMet's drill hole and assay database is administered by company geologic staff from the operational headquarters in Hoyt Lakes. PolyMet uses Excel and Gemcom GEMS to manage the geologic data. Paper logs are available at the operational headquarters.
| 11.1 | Historic Sample Preparation, Analysis and Security |
| 11.1.1 | U.S. Steel and NERCO |
There is no documentation indicating sample handling protocols at drill sites, and only limited documentation of sample handling between the drill site and assay laboratory for programs conducted by U.S. Steel and NERCO.
U.S. Steel assayed approximately 22,000 ft of the 133,716 ft drilled, on nominal 10-ft intervals. The drill programs were focused was on delineating an underground resource and sampling was restricted to zones of continuous “higher grade” mineralization. The selected sample intervals targeted the primary zone of mineralization (Unit 1) rather than intermittent mineralized intervals or presumed waste rock.
Core was split by U.S. Steel using a manual core splitter. Samples submitted for assay were typically half core.
Samples were shipped to Lerch Brothers of Hibbing Minnesota (Lerch) or to the State of Minnesota for preparation prior to analysis. Both laboratories used a jaw crusher to reduce the nominal sample size to minus 1/4 inch. The samples were then reduced to a 250-gram split and a Bico Type Plate grinder pulverized the remaining sample to minus 149 µm. Samples processed by Bondar Clegg were processed in the same manner but were pulverized in a ring mill to minus 106 µm.
U.S. Steel completed approximately 2,200 samples. Each sample was analyzed for copper, nickel, sulfur, and iron. Assays were completed at one of two U.S. Steel laboratories in Minnesota, the Applied Research Laboratory (ARL) in Coleraine (now the NRRI mineral processing laboratory), or at the Minnesota Ore Operations (MOO) laboratory at the Minntac Mine in Mountain Iron, MN. It is not known what type of certification ARL or MOO may have had between 1969-1974.
The analytical methods utilized at the U.S. Steel laboratories is unknown. While standards were developed and used (as evidenced by documents in PolyMet files), it is not thought the standards were inserted into the sample stream in a blind manner. It is likely that these were used for calibration or spot checks.
| M3-PN150164 26 March 2018 |
59
NorthMet Project
Form NI 43-101F1 Technical Report
U.S. Steel was cognisant of the potential PGEs from the assaying of concentrates derived from bench scale tests but did not systematically assay for these metals on drill core. Most of the U.S. Steel samples have been replaced in the database by the results of the reanalysis programs that include PGEs. There are less than 200 sample intervals of U.S. Steel copper-nickel values that remain in the database.
Seventeen of the U.S. Steel holes were “skeletonized” after assaying, with only 1 ft retained for each 5 or 10-ft “un-mineralized” and un-sampled run. Drilling by PolyMet adjacent to the locations of skeletonized core indicate the possibility that some mineralized intervals may have been missed and discarded in the skeletonizing process.
U.S. Steel geologists did not document any interpretation of comprehensive igneous stratigraphy during drill hole logging. Mark Severson of the Natural Resources Research Institute (NRRI), in Duluth, Minnesota began re-logging the U.S. Steel drill holes in the late 1980s as part of a Partridge River intrusion geochemistry project. He recognized Unit 3 as a marker horizon, which led to reliable correlations among the other units. Steve Geerts, working for the NRRI with Fleck Resources, refined the geologic model for the NorthMet Deposit considering the igneous stratigraphy. His interpretation is still considered valid by PolyMet, and currently guides the interpretation of the NorthMet Deposit (Severson 1988, Severson and Hauck 1990, Geerts et al. 1990, Geerts 1991, 1994).
Starting in 1989 Fleck and NRRI began to reanalyze pulp rejects and unsampled intervals from the U.S. Steel drill programs. Fleck, NRRI, and PolyMet continued the reanalysis through 2006. In total 5,032 samples intervals and 229 duplicates were submitted for analysis.
The remaining available core from the U.S. Steel drill programs is stored at the Project and is available for further analysis.
| 11.1.2 | PolyMet Sample Preparation, Analysis and Security |
Employees of PolyMet (or Fleck Resources) have been either directly or indirectly involved in all sample selection since the original U.S. Steel sampling. Sample cutting and preparation of core for shipping has been done by PolyMet employees or contract employees. Reverse circulation sampling at the rig was done by, or in cooperation with, PolyMet employees and the drilling contractor.
The diamond drillers remove the drill core samples from the rods and place them into covered core boxes. PolyMet representatives collect the trays and transport them to the core storage facility located near the processing plant each day where the core is inventoried prior to processing. Once the geologist is ready to log the hole, the core trays are laid out on core logging tables where all logging takes place prior to sampling.
Drill core samples are placed into plastic sample bags, sealed, and placed into a cardboard box. The cardboard box is sealed shut with tape and couriered to the laboratory. Once the laboratory has accepted delivery of the samples they remain under the control of the laboratory.
The RC holes were assayed on 5-ft intervals. Six-inch RC drill-holes produced about 135 lb to 150 lb of sample for every 5 feet of drilling. This material was split using a riffle splitter into two samples and placed in plastic bags and stored underwater in five-gallon plastic buckets. A 1/16th sample was taken by rotary splitter from each 5-ft interval of chip sample for assay. The assay values were used to develop a composite pilot plant sample from bucket samples. Actual compositing was completed after samples had been shipped to Lakefield (Patelke and Severson, 2006). A second 1/16th sample was sent to the Minnesota Department of Natural Resources for their archive.
There are 5,216 analyses from the RC drilling in the current PolyMet database. RC sample collection involved a 1/16 sample representing each five-foot run. These were sent to Lerch for preparation, and then sent to ACME or Chemex for analysis.
| M3-PN150164 26 March 2018 |
60
NorthMet Project
Form NI 43-101F1 Technical Report
Chip samples were collected and logged at the PolyMet office and are currently retained at the PolyMet warehouse. While the chip sample logging is less precise than logging of core samples, the major silicate and sulfide minerals are identifiable, and the location of marker horizons can be derived based on the composition of the individual samples. The underlying metasedimentary rocks (Virginia Formation) are readily recognized in chip sample, and the base of the NorthMet Deposit is relatively easy to define. Where rock recognition is difficult, the higher zinc content of the footwall rocks is used to help define the contact.
PolyMet geologists log all drill cores at the core storage facility located near the processing plant. The geologists record information for each drillhole (Supplemental Information, 2018) including the hole number, azimuth, total depth, coordinate datum, drilling company, hole logger, start and end of drilling dates, rock codes, and a written description of stratigraphy, alteration, texture, mineralogy, structure, grain size, ground conditions, and any notable geologic features. The rock quality designation (RQD) and recovery percentage are also recorded.
Sample intervals are determined by the geologist with respect to stratigraphy, mineralization, and sulfide content, otherwise a standard 10-ft interval is sampled. Zones of increased sulfide mineralization >2.5 ft are sampled down to 5-ft intervals. Core within Unit 1 is sampled on 5-ft intervals. Core samples are cut to ¼ or 1/8 of the total core with a diamond bladed saw by trained personnel following written procedures. Each sample is placed in a numbered plastic sample bag with the corresponding sample number tag and placed in a cardboard box for transport to the laboratory. All QA/QC samples are inserted into the sample stream prior to shipment.
| 11.1.3 | Sample Preparation |
Samples were prepared for analysis at Lerch, Acme, or Chemex facilities. In general, all the facilities followed a similar preparation procedure. Samples were crushed to an approximate -10 mesh, prior to being reduced to a 250-gram split for pulverization (149 to 106 µm range). Pulps were split again to separate a sample for the following analyses:
| · | Base metals (Cu, Co, Mo, Ni and Zn) - Four-acid digestion with ICP-AES finish, |
| · | Base metals (Ag, Cu, Co, Mo, Ni and Zn) – Aqua Regia digestion with ICP-AES finish, |
| · | PGEs (Au, Pt and Pd) – 30 gm fire assay with ICP-AES finish, and |
| · | Total Sulphur by LECO furnace. |
Select core samples were crushed to -1/2 inch and placed in a poly bottle, purged with nitrogen, and capped and sealed for special metallurgical and environmental analysis
| 11.2 | Analytical History |
Information in this section is largely excerpted and/or modified from the Review of the PolyMet 2005-2006 Quality Control Program (Bloom, 2006).
| 11.2.1 | Base Metals |
PolyMet samples were analyzed using a 0.250 g Aqua Regia or four-acid digestion with an Inductively Coupled Plasma – Atomic Emission Spectroscopy (ICP-AES) finish. Detection limits for the elements analyzed by these methods are presented in Table 11‑1.
| M3-PN150164 26 March 2018 |
61
NorthMet Project
Form NI 43-101F1 Technical Report
Table 11‑1: Detection Limits of Elements
| Element | Symbol | Detection Limit | Upper Limit | Units |
| Silver | Ag | 2 | 10 | ppm |
| Cobalt | Co | 1 | 10,000 | ppm |
| Copper | Cu | 0.001 | 1 | % |
| Molybdenum | Mo | 1 | 10,000 | ppm |
| Nickel | Ni | 0.001 | 1 | % |
| Zinc | Zn | 2 | 10,000 | ppm |
| 11.2.2 | Platinum Group Elements |
Samples analyzed for PGEs utilized 30 g Fire Assay (FA) with an ICP-AES finish. In this method a prepared sample (30 g) is mixed with a fluxing agent. The flux assists in melting, helps fuse the sample at a reasonable temperature and promotes separation of the gangue material from the precious metals. In addition to the flux, lead or nickel is added as a collector. The sample is then heated in a furnace where it fuses and separated from the collector material button, which contains the precious minerals. The button is digested for 2 minutes at high power by microwave in dilute nitric acid. The solution is cooled, and hydrochloric acid is added. The solution is digested for an additional 2 minutes at half power by microwave. The digested solution is then cooled, diluted to 4 ml with 2% hydrochloric acid, homogenized and then analyzed for gold, platinum and palladium by inductively coupled plasma – atomic emission spectrometry emission spectrometry. Detection limits for the elements analyzed by this method is presented in Table 11‑2.
Table 11‑2: Detection Limits
| Element | Symbol | Detection Limit | Upper Limit | Units |
| Gold | Ag | 1 | 10,000 | ppb |
| Platinum | Co | 1 | 10,000 | ppb |
| Palladium | Cu | 5 | 10,000 | ppb |
| 11.2.3 | Total Sulfur |
Total sulfur was analyzed by a LECO Furnace with Infrared Spectroscopy. In this method the sample is analyzed for total sulfur using a Leco analyzer. A stream of oxygen passes through a prepared sample (0.05 to 0.6 g) while it is heated in a furnace to approximately 1350°C. Sulfur dioxide released from the sample is measured by an infrared detection system and the total sulfur result is provided. This technique has a lower detection limit of 0.01% and an upper detection limit of 50%.
| 11.3 | Quality Assurance/Quality Control Procedures |
QA/QC samples used by PolyMet include blanks, standards and field duplicates. PolyMet inserts QA/QC samples into the sample stream at the following frequencies:
| · | Insertion of coarse blank every 40 samples; |
| · | Insertion of Standard Reference Material (SRM) every 40 samples; and |
| · | Submission of duplicate ¼ or 1/8 of the drill core every 40 samples. |
| M3-PN150164 26 March 2018 |
62
NorthMet Project
Form NI 43-101F1 Technical Report
A stockpile of crushed Biwabik Iron Formation rock was submitted as a coarse preparation blank. The blank is uncertified, but analysis has demonstrated that is below detection limit for the metals of interest.
PolyMet contracted CDN Resources Laboratories Ltd. (Vancouver) to prepare three SRMs for the drilling programs. The SRMs were prepared by CDN Resources Laboratories Ltd. (Vancouver) from 63 coarse reject U.S. Steel samples in 2004. The SRM performance range was determined through a round robin analysis in 2005. The round robin results are shown in Table 11‑3.
Table 11‑3: Details of Sampling of U.S. Steel Core by PolyMet
| Element | SM 4-1 | SM 4-2 | SM 4-3 | |||
| Average | Std. Dev | Average | Std. Dev | Average | Std. Dev | |
| Co (ppm) | 90.1 | 10.44 | 95.10 | 10.64 | 110.73 | 11.11 |
| Cu (%) | 0.201 | 0.008 | 0.378 | 0.009 | 0.589 | 0.019 |
| Mo (ppm) | 13.87 | 1.78 | 9.61 | 1.36 | 12.25 | 1.40 |
| Ni (%) | 0.109 | 0.007 | 0.143 | 0.009 | 0.197 | 0.015 |
| Zn (ppm) | 174.15 | 14.62 | 116.77 | 12.18 | 124.76 | 12.65 |
| Au (ppb) | 57.85 | 12.70 | 33.32 | 6.48 | 54.18 | 7.36 |
| Pt (ppb) | 36.54 | 9.50 | 55.76 | 11.15 | 125.52 | 15.55 |
| Pd (ppb) | 117.52 | 10.66 | 238.95 | 14.64 | 518.05 | 22.18 |
| S (%) | 1.17 | 0.04 | 0.91 | 0.04 | 1.15 | 0.005 |
Averages are based on twenty samples of each standard with 4-acid digestion ICP-AES assays completed in 2005.
PolyMet submitted ¼ or 1/8 of the core was submitted as a duplicate interval. During the drilling programs, PolyMet submitted coarse blanks, core duplicates, and SRMs.
| 11.3.1 | Blanks |
Coarse blanks monitor the integrity of sample preparation and are used to detect contamination during crushing and grinding of samples. Blank failures can also occur during laboratory analysis or as the result of a sample mix-up. A blank analysis ≥5 times the detection limit is considered a blank failure Table 11‑1 and Table 11‑2.
PolyMet submitted 697 coarse pulp blanks to monitor sample preparation during the drilling programs. Less than 4% of the samples blank samples submitted to reported values exceeding 5 times the detection limit for a particular element. In all cases 10 samples either side of the blank were re-submitted, and a new blank was inserted. Results were acceptable. Copper and nickel blank analyses are presented in graphical form in Figure 11‑1 and Figure 11‑2, respectively.
| M3-PN150164 26 March 2018 |
63
NorthMet Project
Form NI 43-101F1 Technical Report
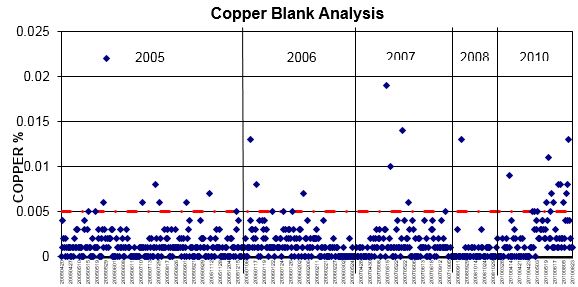
Figure 11‑1: Copper Blank Analysis
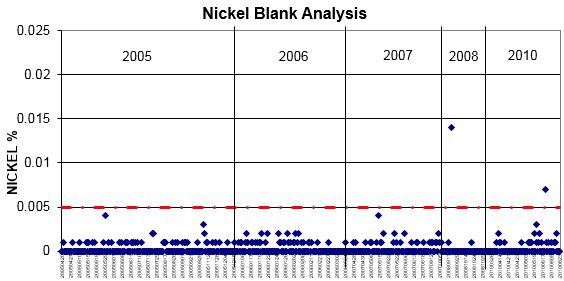
Figure 11‑2: Nickel Blank Analysis
| 11.3.2 | Standards |
Standards are used to monitor laboratory consistency and to identify sample mix-ups. PolyMet inserted standards into the sample stream at a rate of 1:40 for the drill programs conducted between 2005 and 2010. During the drilling programs, acceptable reference standards tolerances were established at ±2 standard deviations (“stdev” or “σ”) from the mean of the standard. In total 762 (301 SM4-1, 287 SM4-2, and 174 SM4-3) standards were submitted for analysis with approximately 5.0% of the samples exceeding the established thresholds. Overall the means of each standard were in line with the reference mean. Standards exceeding the tolerances established by PolyMet were reviewed and, depending on the nature of the failures, samples may be re-run or discarded from the dataset.
HRC reviewed the standards employed by PolyMet to insure reliable assay information throughout the database. The individual standards were plotted against ±2 and ±3 standard deviations of the expected standard mean (Figure 11‑3 and Figure 11‑4). The two types of failures can be identified by the red and orange colored symbols on the figures.
| M3-PN150164 26 March 2018 |
64
NorthMet Project
Form NI 43-101F1 Technical Report
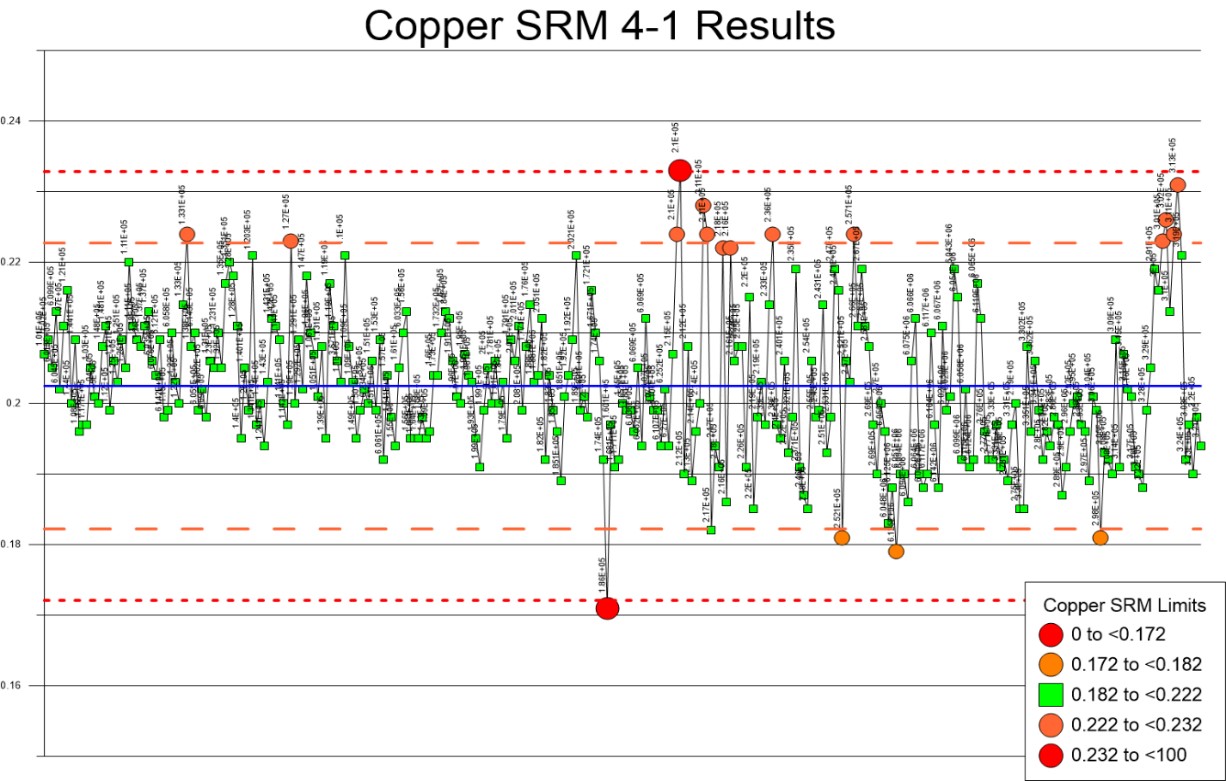
Figure 11‑3: Copper Results for Standard 4-1

Figure 11‑4: Nickel Results for Standard 4-1
| M3-PN150164 26 March 2018 |
65
NorthMet Project
Form NI 43-101F1 Technical Report
| 11.3.3 | Duplicates |
| 11.3.3.1 | Core Duplicates |
Duplicates are used to monitor sample batches for sample mix-ups, data variability due to laboratory error and sample homogeneity at each step of preparation. Sample duplicates should be inserted at every sample split during sample preparation and they should not be placed in sequential order. When original and duplicates samples are plotted in a scatterplot, perfect analytical precision will plot on x=y (45°) slope. Core duplicates are expected to perform within ±30% of the x=y slope, coarse preparation duplicates should perform within ±20% of the x=y slope while pulp duplicates are expected to perform within ±10% of the x=y slope on a scatterplot.
PolyMet submitted ¼ and 1/8 core duplicates in the drilling programs prior to 2007. A total of 236 quarter-core duplicate pairs were submitted. The Cu and Ni assays for the original and duplicate samples are compared in Figure 11‑5.
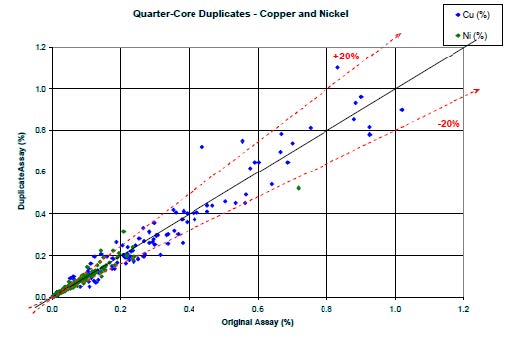
Figure 11‑5: Copper and Nickel ¼ Core Duplicate Analysis
A total of 87 one-eight-core duplicate pairs were submitted. The Cu and Ni assays for the original and duplicate samples are compared in Figure 11‑6.
| M3-PN150164 26 March 2018 |
66
NorthMet Project
Form NI 43-101F1 Technical Report
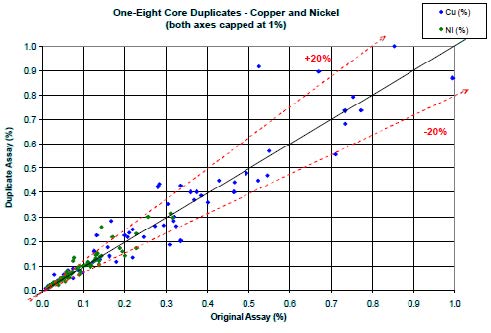
Figure 11‑6: Copper and Nickel 1/8 Core Duplicate Analysis
The core duplicate performance suggests that the sample size is adequate for copper and no bias is evident in the comparison.
| 11.3.3.2 | Historic Pulp Re-analysis |
The analysis of U.S. Steel pulps, sampling of previously un-sampled core, and two NERCO core holes was completed between 1989-1991 by Fleck Resources in cooperation with the NRRI in Duluth. Many pulps and coarse rejects from the original U.S. Steel drilling were re-assayed for copper, nickel, PGE, and a full suite of other elements. The NRRI selected, sampled, and re-logged the unsampled core. This was the first large-scale testing for PGE done on the Project. Figure 11‑6, Figure 11‑7 and Figure 11‑8 compare the U.S. Steel results with the reanalysis. The copper results generally agree, but the nickel results demonstrated a bias toward the U.S. Steel assays. Most of the U.S. Steel samples have been replaced in the database by the results of the reanalysis programs that include PGEs. There are less than 200 sample intervals of U.S. Steel copper-nickel values that remain in the database.
| M3-PN150164 26 March 2018 |
67
NorthMet Project
Form NI 43-101F1 Technical Report
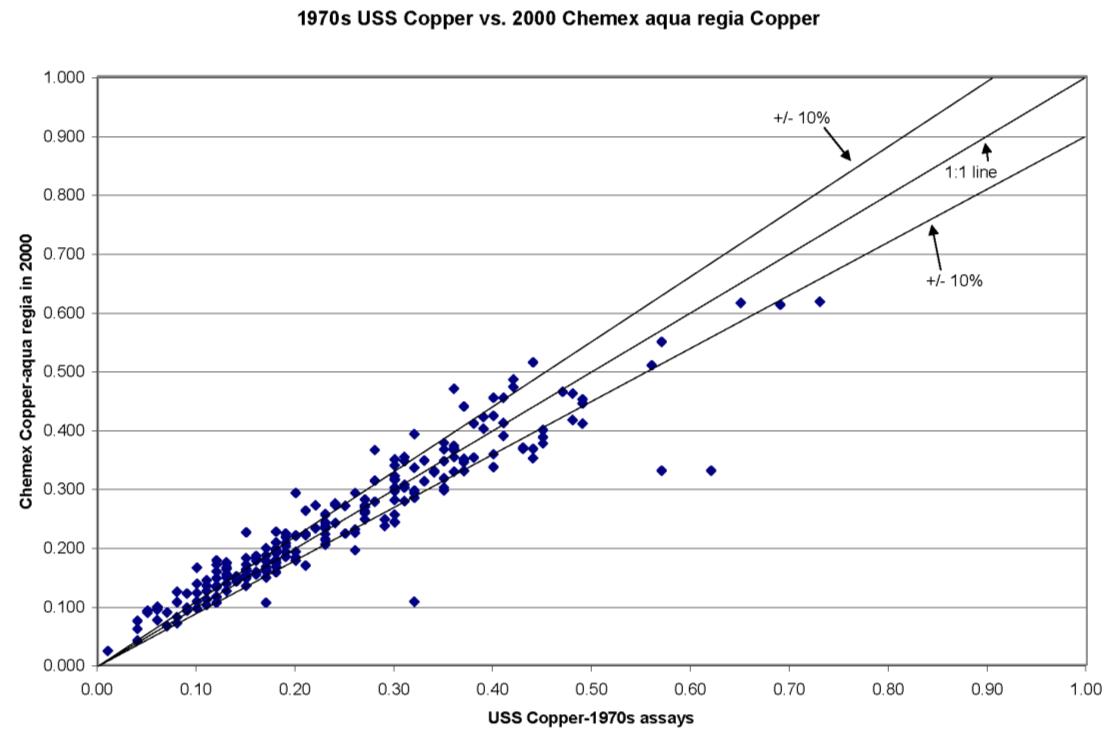
Figure 11‑7: Copper Pulp Duplicate Analysis
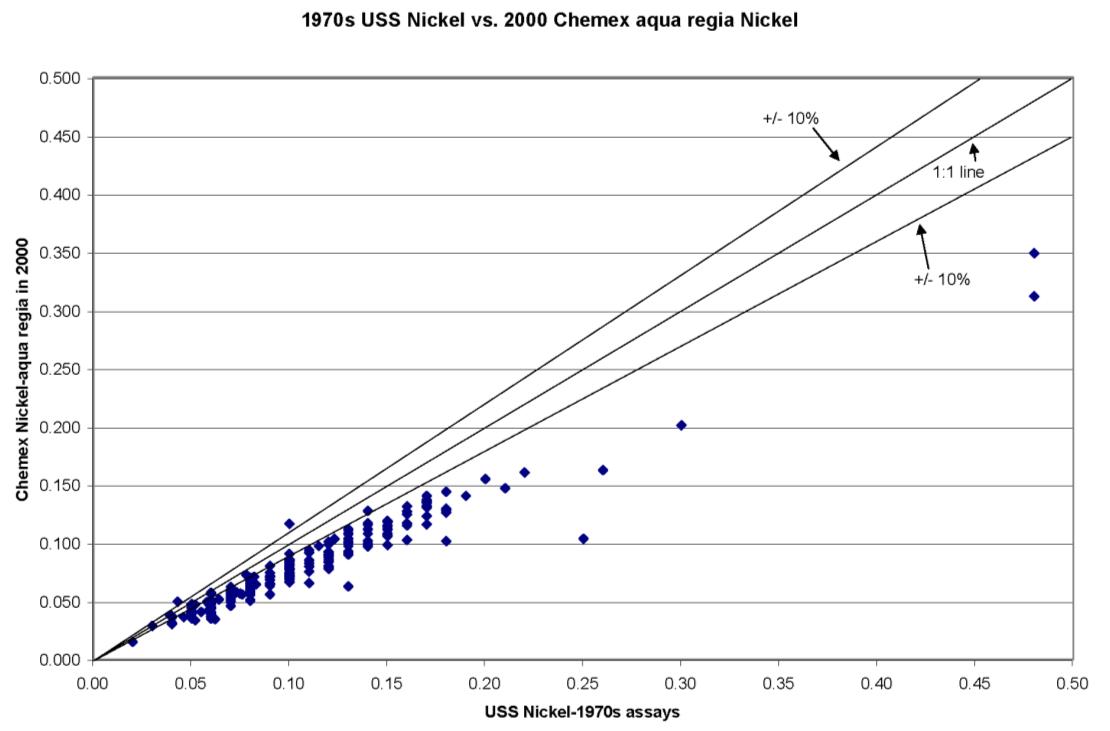
Figure 11‑8: Nickel Pulp Duplicate Analysis
| M3-PN150164 26 March 2018 |
68
NorthMet Project
Form NI 43-101F1 Technical Report
| 11.4 | Data Entry Validation Controls |
PolyMet manages the drill-hole assay data with a project specific Microsoft Access® database maintained in Gemcom Gems software and various excel spreadsheets. All information has been audited by HRC with limited errors identified. It is HRC’s opinion that PolyMet maintains a complete, well documented, and easily auditable geological and assay database.
| 11.5 | Core Storage And Sample Security |
The U.S. Steel core has been stored, either at the original U.S. Steel warehouse in Virginia, Minnesota during drilling, or more recently at the CMRL (now a part of the University of Minnesota). Core has been secured in locked buildings within a fenced area that is locked at night where a key must be checked out. The NERCO BQ size core is also stored at this facility.
The PolyMet core and RC reference samples were stored in a PolyMet leased warehouse in Aurora, Minnesota during drilling and pre-feasibility. Core and samples were then moved in 2002 to a warehouse in Mountain Iron, Minnesota where they remained until 2004. They were then moved to a warehouse at the Erie Plant site in Hoyt Lakes. Access to this warehouse is limited to PolyMet employees.
| 11.6 | Opinion On Adequacy |
HRC concludes that the sample preparation, security and analytical procedures are correct and adequate for the purpose of this Technical Report. The sample methods and density are appropriate, and the samples are of sufficient quality to comprise a representative, unbiased database.
| M3-PN150164 26 March 2018 |
69
NorthMet Project
Form NI 43-101F1 Technical Report
| 12 | DATA VERIFICATION |
| 12.1 | PolyMet Data Compilation And Verification 2004 |
The mineral resource and reserve estimates rely in part on the following information provided to HRC by PolyMet with an effective date of December 31, 2015:
| · | Discussions with PolyMet personnel, |
| · | An exploration drilling database received as .csv files, |
| · | Modeled solids for the 3 formations present at the Project; the Biwabik Iron Formation, the Duluth Complex, and the Virginia Formation; along with modeled solids for the site overburden and Magenta domain, and |
| · | The most recent Technical Report “Updated NI 43-101 Technical Report on the NorthMet Deposit Minnesota, USA” dated October 12, 2102 and amended January 14, 2013 and authored by AGP Mining Consultants, Inc. (Alsp, 2013). |
Topography was provided as 2-ft contours derived from air photo work in 1999.
| 12.2 | Database Audit |
The NorthMet mineral resource estimate is based on the exploration drill-hole database available as of April 17, 2014. Drill hole data including collar coordinates, down-hole surveys, sample assay intervals, and geologic logs were provided by PolyMet in Microsoft Excel spreadsheets. The database was reviewed and validated by HRC prior to estimating mineral resources. The NorthMet database includes 114 (116) historic drill holes, 323 PolyMet drill holes, 240 vertical sounding holes, 15 depths to bedrock test pits, and 47 geologic holes from the surrounding area. Of the 739 drill holes, only 437 drill holes were used in the estimation, although many of the 437 holes include only select analytical information. The database was validated using Leapfrog Geo 3D® Version 2.0.0 software. Validation checks performed prior to loading the database into Datamine’s Studio 3 Version 3.24.25.0 mining software included:
| · | No overlapping intervals, |
| · | Down-hole surveys at drill-hole collar, |
| · | Consistent drill-hole depths for all data tables, and |
| · | Gaps in the “from – to” data tables. |
The analytical information used for the resource estimate includes copper, nickel, platinum, palladium, gold, silver, cobalt and sulfur. All assay values Below Detection Limits (BDL) were assigned a value of one half of the detection limit, and missing or non-sampled intervals were assigned a value of zero (0). Table 12‑1 summarizes the validated analytical information utilized in the estimation of mineral resources.
| M3-PN150164 26 March 2018 |
70
NorthMet Project
Form NI 43-101F1 Technical Report
Table 12‑1: Summary of the Analytical Data Used in the Estimation of Mineral Resources
| Metal | Missing Intervals | Assay Values | BDL Intervals |
| Cu (%) | 1611 | 37196 | 791 |
| Ni (%) | 1611 | 37196 | 153 |
| Pt (ppb) | 1805 | 37002 | 10245 |
| Pd (ppb) | 1805 | 37002 | 1480 |
| Au (ppb) | 1805 | 37002 | 5211 |
| Ag (ppm) | 1731 | 37076 | 19304 |
| Co (ppm) | 1731 | 37076 | 1 |
| S (%) | 1971 | 36836 | 0 |
| 12.3 | Certificates |
HRC received original assay certificates in excel format for the samples collected in 2010 in the current database. A random manual check of 10% of the database against the original certificates was conducted. The error rate within the database is considered to be less than 1% based on the number of samples spot checked.
| 12.4 | Adequacy Of Data |
HRC reviewed PolyMet’s check assay programs and considers the programs to provide adequate confidence in the data. Samples that are associated with QA/QC failures were reviewed and reanalyzed as necessary.
Exploration drilling, sampling, security, and analysis procedures were conducted in a manner that meets or exceeds industry standard practice. All drill cores and cuttings from PolyMet’s drilling have been photographed. Drill logs have been digitally entered into an exploration database organized and maintained in Gemcom. The split core and cutting trays have been securely stored and are available for further checks.
| M3-PN150164 26 March 2018 |
71
NorthMet Project
Form NI 43-101F1 Technical Report
| 13 | MINERAL PROCESSING AND METALLURGICAL TESTING |
This section was adapted from Senet’s Engineering Report entitled, NorthMet Copper Project: Feasibility Study Technical Report, Revision 2, dated March 2016 and results from the most recent pilot study investigation conducted by SGS on hydrometallurgical processes entitled, An Investigation into PLATSOLTM Processing of the NorthMet Deposit, Project 12269-001 – Final Report dated April 20th, 2010.
| 13.1 | Introduction |
The NorthMet Deposit is hosted in the Duluth Complex in northeastern Minnesota. The Duluth Complex is a large, composite, grossly layered tholeiitic mafic intrusion. The sulfide mineralization of the complex contains metals (copper, nickel, cobalt, titanium and PGMs) that are of economic interest. A significant amount of metallurgical test work has been conducted on the Duluth Complex; therefore, the general metallurgy of the complex is fairly well understood.
Orway Mineral Consultants (OMC) in 2014 studied SAG Mill based comminution circuits for the Project. This was done to assess if a SAG Mill based circuit would be practical for the Project and capable of rationalizing the existing 4-stage crushing circuit (total of 11 crushers) and 12 lines of Rod Mill + Ball Mill grinding circuits in the existing Erie concentrator. Comminution test work results from SGS were interpreted by OMC and used to scope out a SAG mill based comminution circuit to process 32,000 STPD. Further comminution test work was conducted by Hazen Research (Golden, Co.) in 2015 to confirm the comminution parameters.
The development of the current NorthMet flotation process flowsheet was based on test work (SGS, 2015) and includes the following:
| · | Flotation Test work conducted by SGS Lakefield (SGS) between 1998 and 2014, and |
| · | Supplementary flotation test work conducted by SGS in 2015 and interpreted by Eurus Mineral Consultants (EMC) for circuit modeling and flotation plant design. |
SGS conducted extensive flotation test work up until 2010. The work covered by SGS included significant amounts of batch and rate flotation test work on a number of samples provided by PolyMet. A flotation process block flow diagram was developed from the results and observations of the initial batch test work conducted by SGS. The process block flow diagram shown in Figure 13‑1 can be summarized into three main circuits as follows:
| 1. | The Bulk Copper-Nickel Flotation circuit |
| 2. | The Copper-Nickel Separation Circuit |
| 3. | The Pyrrhotite Flotation Circuit |
Pilot scale test work was conducted by SGS to demonstrate the flowsheet developed for the NorthMet process as indicated in Figure 13‑1. The results of the pilot test work are also included in the SGS report.
Additional flotation test work was requested of SGS in 2015 to fill in gaps in the flotation test work. EMC conducted a flotation circuit simulation of the process flow based on the results obtained from both SGS's batch and pilot scale test work. The work that EMC conducted was initially targeted at simulating the pilot plant, and then to producing full production scale results. EMC's simulations were based on a throughput of 32,000 STPD. The results of the simulations were used to review the previous design and update the current process plant design basis and criteria.
| M3-PN150164 26 March 2018 |
72
NorthMet Project
Form NI 43-101F1 Technical Report
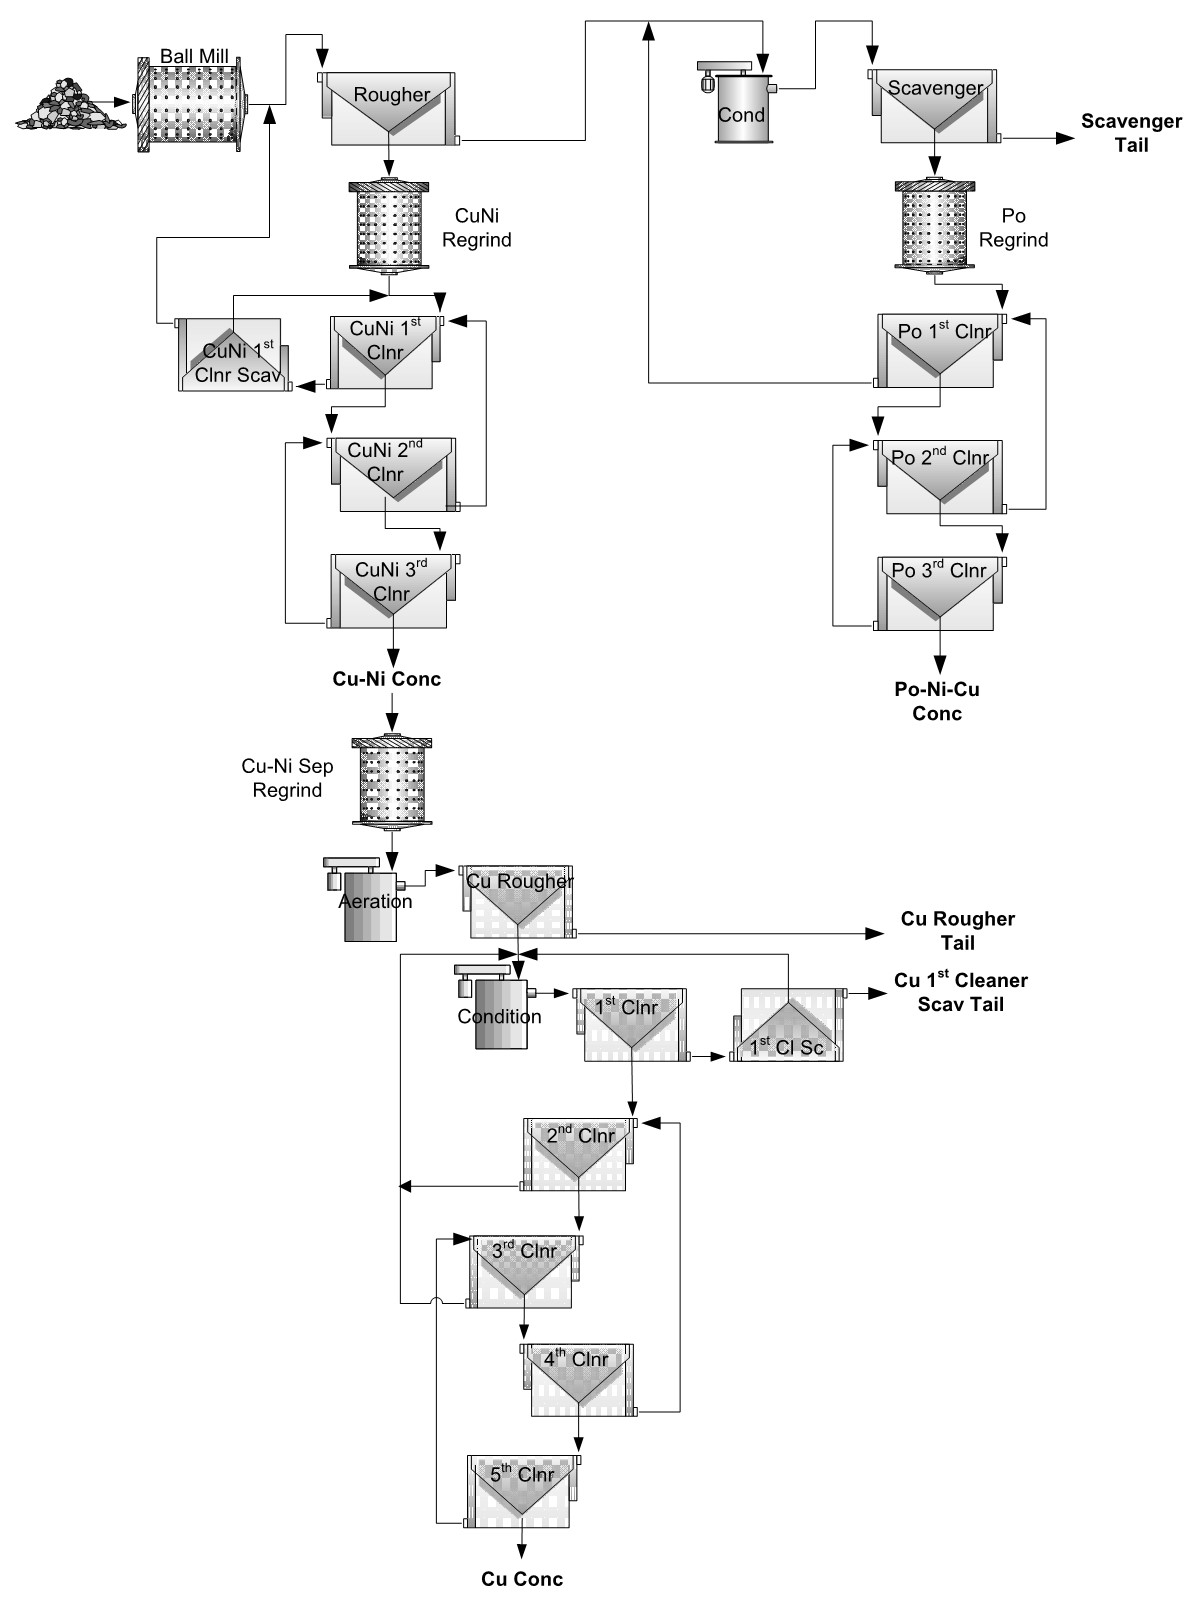
Source: SGS Flotation Report (2015).
Figure 13‑1: NorthMet Process Block Flow
| M3-PN150164 26 March 2018 |
73
NorthMet Project
Form NI 43-101F1 Technical Report
A second pilot plant program was carried out by SGS in 2009 to investigate hydrometallurgical processes. This is discussed in more detail starting from Section 13.6 of this report.
| 13.2 | Comminution Circuit Test Work And Process Development |
The comminution circuit was designed based on the work done by OMC and vendor information. The comminution circuit was modelled to be capable of processing 32,000 STPD and was based on the historical comminution results available from the test work conducted by SGS. The following comminution test work was conducted on three composite samples:
| · | SAG milling circuit (SMC) tests |
| · | Abrasion index (Ai) tests |
| · | Rod mill work index (RWi) tests |
| · | Bond ball work index (BWi) tests |
An Unconfined Compressive Strength (UCS) test was conducted on a composite of the 3 samples: Comp 1, Comp 2 and Comp 3. The comminution test work results are given in Table 13‑1.
Table 13‑1: Summary of Comminution Test Work Results
| Parameter | Unit | Comp 1 | Comp 2 | Comp 3 | UCS |
| BWi | |||||
| 1 | kWh/t | 14.8 | 15.0 | 16.0 | - |
| 2 | kWh/t | 16.3 | 15.4 | 15.1 | - |
| 3 | kWh/t | 15.7 | 15.2 | 15.7 | - |
| Average | kWh/t | 15.6 | 15.2 | 15.6 | - |
| RWi | kWh/t | 13.2 | 13.0 | 13.9 | - |
| Ai | g | 0.39 | 0.42 | 0.40 | - |
| UCS | |||||
| Min. | MPa | - | - | - | 41.3 |
| Max. | MPa | - | - | - | 234.2 |
| Average | MPa | - | - | - | 108.6 |
| JK Drop Weight Test | |||||
| A | 96.5 | 100 | 99.0 | - | |
| b | 0.38 | 0.38 | 0.36 | - | |
| A × b | 36.7 | 38.0 | 35.6 | - | |
| ta | 0.24 | 0.26 | 0.22 | - | |
| SG | 3.02 | 3.02 | 2.98 | - |
Further comminution test work was conducted by Hazen Research in February 2015 to confirm the historical comminution results. A summary of the comminution test work results is given in Table 13‑2.
| M3-PN150164 26 March 2018 |
74
NorthMet Project
Form NI 43-101F1 Technical Report
Table 13‑2: Summary of SMC Test Work Results Conducted by Hazen Research
| Parameter | Units | Value |
| BWi | kWh/t | 13.8 |
| RWI | kWh/t | 12.7 |
| Abrasion Index, Ai | g | 0.391 |
| JK Drop Weight Test: | ||
| A | 73.4 | |
| b | 0.54 | |
| A × b | 39.6 | |
| ta | 0.29 | |
| Solids SG | lb/ft3 | 164 |
Table 13‑3 summarizes the mill specifications when applying parameters obtained from OMC's simulation.
Table 13‑3: Milling Circuit Design
| Criteria | Unit | SAG Mill | Ball Mill |
| Diameter Inside Shell | m | 12.19 | 7.32 |
| Effective Grinding Length (EGL) | m | 6.86 | 11.28 |
| Imperial Mill Dimensions | ft × ft | 40.0 × 22.5 | 24.0× 37.0 |
| L:D Ratio | m/m | 0.56 | 1.54 |
| Discharge Arrangement | Grate | Overflow | |
| Cone Angle | ° | 15 | 20 |
| Speed Range | % Nc | 60 - 80 | Fixed |
| Speed – Duty | % Nc | 67 | 75 |
| Liner Thickness | mm | 120 | 100 |
| Ball Top Size | mm | 125 | 50 |
| Ball Charge – Duty | % Vol | 5 | 20 |
| Ball Charge – Maximum | % Vol | 18 | 33 |
| Total Load – Duty | % Vol | 25 | - |
| Total Load – Maximum | % Vol | 35 | - |
| Pinion/Shell Power – Duty | kW | 12,900 | 7,490 |
| Pinion/Shell Power – Maximum at 75% Critical Speed (Nc) | kW | 22,830 | 10,820 |
| 13.3 | Flotation Circuit Test Work And Process Development |
Previous test work reports authored by SGS, and G&T Metallurgical Services, Kamloops, Canada between 2006 and 2014 were received and reviewed by EMC. These reports covered laboratory batch and locked cycle tests (LCTs) as well as pilot scale campaigns for the Bulk Cu-Ni and pyrrhotite circuits. The work also included laboratory scale test work conducted on the Bulk Cu-Ni concentrate. Kinetics were only conducted on selected rougher and cleaner streams as follows:
| · | Cu-Ni Bulk rougher feed |
| · | Pyrrhotite rougher feed |
| · | Cu-Ni separation rougher feed |
| · | Cu-Ni Bulk rougher concentrate with regrind |
| · | Cu-Ni separation 1st cleaner |
| · | Pyrrhotite 1st cleaner feed with regrind |
| M3-PN150164 26 March 2018 |
75
NorthMet Project
Form NI 43-101F1 Technical Report
The current flotation design is based on all of the test work conducted by SGS. This includes the recent flotation test work carried out by SGS in June 2015 to cover information gaps from previous SGS test work and to confirm the repeatability of the results and generate additional kinetic data for the various flotation stages.
In June 2009, SGS completed a small laboratory scale test work program on an alternative split cleaner circuit for the NorthMet mineralization, shown in Figure 13‑2. The test work program produced encouraging results compared to results from previous test work. The previous flowsheet had produced a total Bulk sulphide concentrate and had a Cu-Ni separation on the concentrate to produce a salable Cu concentrate.
A decision was therefore made to carry out a small laboratory scale optimization program followed by a pilot plant campaign and a Cu-Ni separation program to demonstrate the suitability of this flowsheet option. The split cleaner flowsheet produces a good quality Bulk Cu+Ni concentrate which allows for easy separation of the Cu minerals from the Ni and Fe minerals to produce a good quality Cu concentrate and a salable Ni concentrate. The Bulk circuit is then followed by a Pyrrhotite “scavenger” circuit to recover all the remaining sulphides and valuable minerals. The circuit essentially treats the rougher and scavenger concentrates in separate cleaning circuits, and hence the label of “split cleaner” flowsheet.
On September 8, 2009, approximately 6.6 tons of a composite sample identified as C9 was delivered to SGS for the optimization test work and pilot program. A series of seven open circuit batch tests and two LCTs were carried out to establish the flotation kinetics of the C9 composite and to optimize process variables such as regrind targets, reagent dosages, and reagent addition points in preparation of the pilot plant campaign.
The pilot plant was only run on the front end of the circuit without the Cu/Ni separation stage. This was due to the fact that there was a very low mass recovery in the Cu-Ni 3rd cleaner concentrate. The pilot plant flowsheet including reagent addition points and dosages is shown in Figure 13‑2.
A total of six surveys were completed and each survey was balanced using the Bilmat mass-balancing software. The results of the pilot run are summarized in Table 13‑4.
Comparisons were made between the performance of the split cleaner flowsheet piloted in 2009 and the previous work conducted on different flowsheets. The performance of the 2009 pilot plant and the previous pilot work are shown in Figure 13‑3.
| M3-PN150164 26 March 2018 |
76
NorthMet Project
Form NI 43-101F1 Technical Report
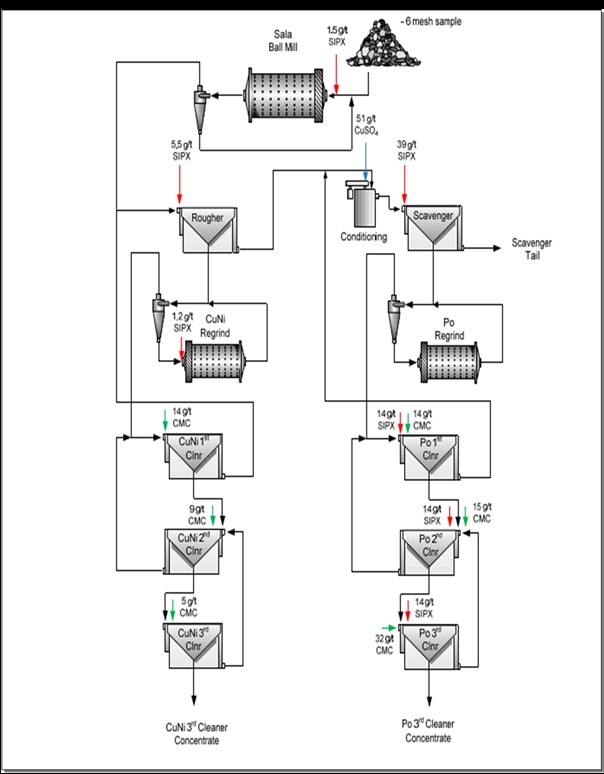
Source: SGS Report (2009)
Figure 13‑2: Pilot Plant Flowsheet
Table 13‑4: Summary of Pilot Plant Test Work Results on Sample C9
| Product | wt. % | Assays (%, ppm) | Distribution (%) | ||||||||||
| Cu | Ni | S | Pt | Pd | Au | Cu | Ni | S | Pt | Pd | Au | ||
| Cu-Ni 3rd Cleaner Concentrate | 1.48 | 18.2 | 3.41 | 27.7 | 2.41 | 10.5 | 1.33 | 89.1 | 58.0 | 66.1 | 65.1 | 69.4 | 61.3 |
| Po 3rd Cleaner Concentrate | 0.53 | 2.81 | 0.85 | 25.5 | 1.43 | 4.59 | 0.89 | 4.8 | 5.2 | 21.8 | 13.8 | 10.9 | 14.3 |
| Combined Concentrate | 2.01 | 14.1 | 2.74 | 27.0 | 2.15 | 8.97 | 1.21 | 93.9 | 63.2 | 87.9 | 78.9 | 80.3 | 75.6 |
| Scavenger Tails | 98 | 0.02 | 0.032 | 0.08 | 0.012 | 0.045 | 0.008 | 6.1 | 36.8 | 12.1 | 21.1 | 19.7 | 24.1 |
| Feed | 100 | 0.30 | 0.086 | 0.61 | 0.005 | 0.22 | 0.003 | 100 | 100 | 100 | 100 | 100 | 100 |
| Source: SGS Report 2009 | |||||||||||||
| M3-PN150164 26 March 2018 |
77
NorthMet Project
Form NI 43-101F1 Technical Report
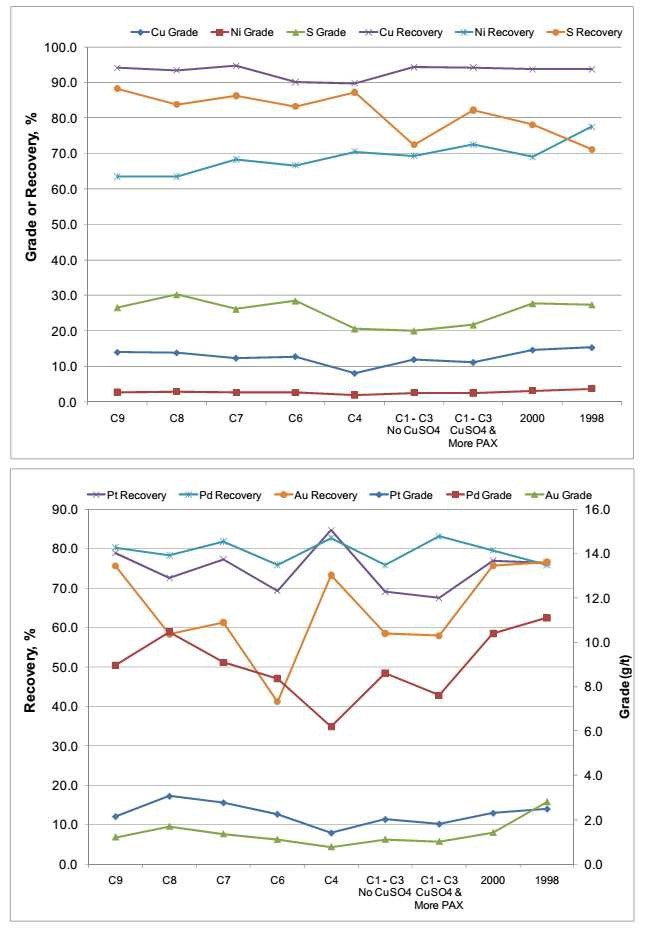
Figure 13‑3: Comparative Recoveries between C9 Pilot Work and Previous Pilot Work
| M3-PN150164 26 March 2018 |
78
NorthMet Project
Form NI 43-101F1 Technical Report
The following conclusions were drawn:
| · | The split cleaner flowsheet test work produced a combined concentrate grade and recovery that was comparable with the results that were achieved in the 2008 pilot plant campaign and even exceeded the performance of historic pilot plant operations when taking into account the composite head grades. |
| · | The Ni recovery in the final concentrate was the lowest of all the pilot plants. However, it must be noted that the head grade of 0.085% was also amongst the lowest with the exception of the C8 composite. |
| · | Considering the very efficient recovery of the sulfides in the current pilot plant campaign, it is postulated that the C9 composite may have had more Ni units associated with non-sulphide gangue minerals |
| · | The split cleaner flowsheet produced very good PGM recoveries when compared to previous pilot plant results, especially since the PGM head grades of the C9 composite were amongst the lowest of all samples tested. |
| · | The Cu-Ni 3rd cleaner concentrate that was generated in the pilot plant was subject to four small-scale open-circuit Cu/Ni separation tests to establish suitable flotation conditions for a larger scale Cu/Ni separation LCT. The separation was deemed to produce a better Cu concentrate with an easier to conduct separation than from the previous bulk flotation circuit. The projected metallurgy of this LCT combined with the Pilot Plant results is shown in Table 13‑5. |
Table 13‑5: Projected Metallurgy of Cu-Ni Separation LCT of C9 Pilot Cleaner Concentrate
Product | wt.% | Assays (%, ppm) | Distribution (%) | ||||
| Cu | Ni | S | Cu | Ni | S | ||
| Cu 5th Cleaner Concentrate | 0.85 | 26.9 | 0.56 | 30.0 | 80.0 | 5.6 | 54.6 |
| Po 3rd Cleaner Concentrate | 0.53 | 2.81 | 0.85 | 25.5 | 4.8 | 5.2 | 21.8 |
| Cu 1st Cleaner Scavenger Tail | 0.14 | 7.33 | 7.50 | 20.9 | 3.5 | 12.1 | 5.1 |
| Cu Rougher Tail (Ni Concentrate) | 0.49 | 3.87 | 7.94 | 25.2 | 5.6 | 40.3 | 15.4 |
| Combined Cu Tail (Ni Concentrate) | 0.63 | 3.81 | 4.48 | 24.8 | 13.9 | 57.6 | 42.3 |
| Calculated Head | 100 | 0.30 | 0.086 | 0.61 | 100 | 100 | 100 |
The test work was also conducted on a composite sample identified as C10. The C10 composite was obtained from a shallow part of the NorthMet Deposit. The EMC review also was to confirm the repeatability of the results and generate kinetic data for the various flotation stages. A total of fifteen batch tests and a LCTs were conducted on the C10 composite and the results are summarized in Table 13‑6.
Table 13‑6: Summary of Laboratory Test Work Results on Sample C10
wt.% | Assay (% or ppm) | Distribution (%) | |||||||||||
| Cu | Ni | S | Pt | Pd | Au | Cu | Ni | S | Pt | Pd | Au | ||
Cu Sep 4th Cl Concentrate | 0.79 | 28.2 | 0.66 | 31.8 | 1.26 | 13.7 | 2.79 | 76.5 | 5.5 | 35.8 | 13.9 | 43.2 | 46.2 |
| Cu Sep Ro Tail | 0.48 | 3.36 | 6.75 | 17.8 | 5.22 | 8.97 | 0.41 | 5.6 | 34.3 | 12.2 | 35.0 | 17.2 | 4.1 |
Cu Sep 1st Cl Scv Tail | 0.19 | 5.27 | 7.63 | 21.0 | 5.27 | 13.2 | 0.64 | 3.5 | 15.4 | 5.7 | 14.1 | 10.1 | 2.6 |
| Combined Ni Concentrate | 0.67 | 3.90 | 7.00 | 18.7 | 5.23 | 10.2 | 0.48 | 9.0 | 49.7 | 17.9 | 49.1 | 27.3 | 6.7 |
Po 3rd Cl Concentrate | 1.07 | 1.17 | 0.67 | 21.3 | 0.66 | 2.36 | 0.27 | 4.3 | 7.5 | 32.3 | 9.9 | 10.0 | 6.1 |
| Po Ro Tail | 97.5 | 0.03 | 0.036 | 0.10 | 0.02 | 0.05 | 0.02 | 10.2 | 37.3 | 13.9 | 27.2 | 19.5 | 40.9 |
| Feed | 100 | 0.30 | 0.095 | 0.70 | 0.07 | 0.25 | 0.05 | 100 | 100 | 100 | 100 | 100 | 100 |
The parameters that were used for the design of the flotation plant are summarized in Table 13‑7.
| M3-PN150164 26 March 2018 |
79
NorthMet Project
Form NI 43-101F1 Technical Report
Table 13‑7: Flotation Stage Design Parameters
| Parameter | Unit | Design |
| Cu-Ni Rougher Flotation | ||
Grind (P80) | µm | 120 |
| pH | 8.5 (natural) | |
| Activator | - | |
| Depressant | - | |
| Cu-Ni Cleaner Flotation | ||
Grind (P80) | µm | 35 |
| pH | 8.5 (natural) | |
| Activator | - | |
| Depressant | CMC | |
| Cu-Ni Separation Flotation | ||
Grind (P80) | µm | 15-25 |
| pH | 11.5 (lime) | |
| Activator | - | |
| Depressant | CMC | |
| Po Rougher Flotation | ||
Grind (P80) | µm | 120 |
| pH | 8.5 (natural) | |
| Activator | CuSO4 | |
| Depressant | CMC | |
| Po Cleaner Flotation | ||
Grind (P80) | µm | 35 |
| pH | 8.5 (natural) | |
| Activator | CuSO4 | |
| Depressant | CMC |
| 13.4 | Flotation Circuit Design |
The split cleaner flowsheet test work resulted in increased performance when compared to previous test work, and as such, formed the basis for the flotation circuit design. The simulation and scale-up of the pilot test results to the full- scale plant was carried out by EMC. EMC was requested to review all the existing flotation test work data and use the information available to simulate a full-scale plant design for the NorthMet Deposit using the split cleaner flowsheet. A summary of EMC's work is presented in this section.
EMC's review of the available test work data revealed that sufficient rate tests were performed to kinetically characterize the ore and the various sub-circuits. The flotation performance of the C9 composite was simulated using appropriate kinetics from the C9 and C10 rate tests. C10 kinetics were used, in as-is or modified state, when the C9 kinetics were not representative of the flotation performance in that section of the circuit.
The split circuit flowsheet in Figure 13‑4, shows the streams that were rate tested or where the kinetics were derived.
| M3-PN150164 26 March 2018 |
80
NorthMet Project
Form NI 43-101F1 Technical Report
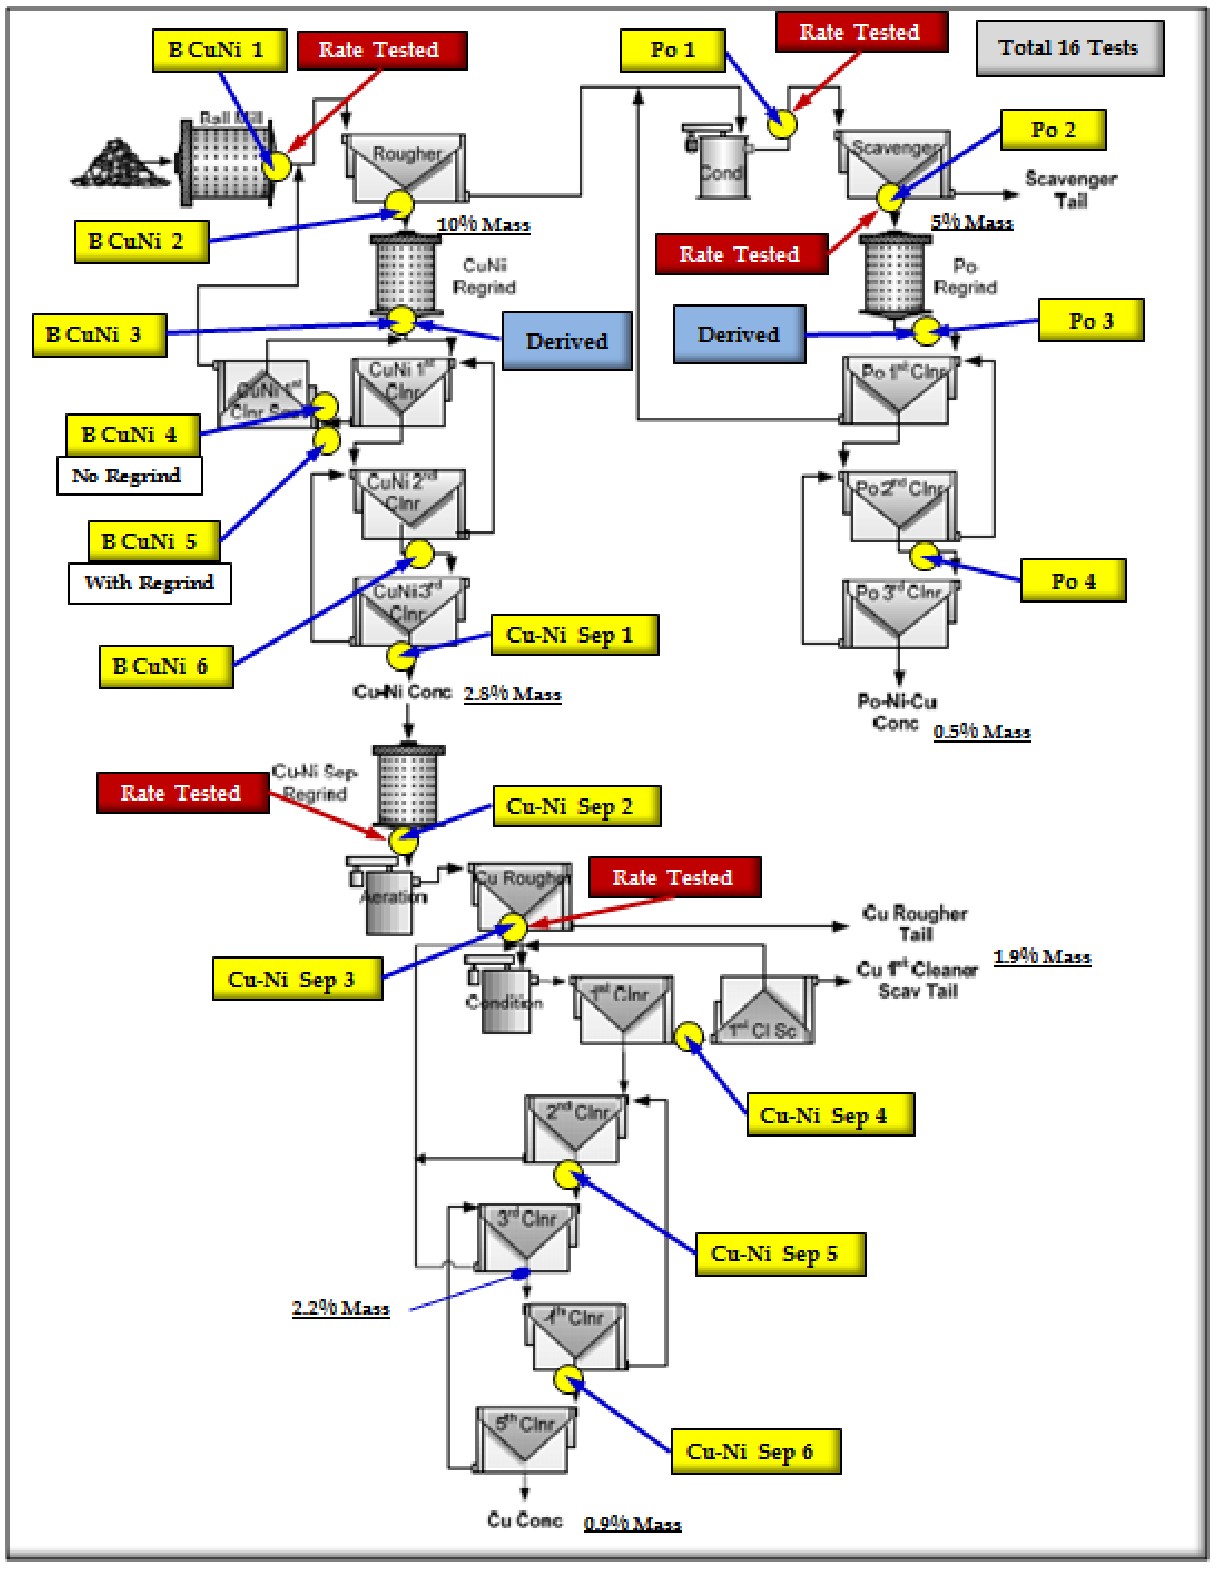
Figure 13‑4: General Block Flow – Rate Tested and Kinetic-Derived Process Streams from Report NM 1-2015 NorthMet Feb 2015
| M3-PN150164 26 March 2018 |
81
NorthMet Project
Form NI 43-101F1 Technical Report
| 13.4.1 | Flotation Circuit Simulation |
The simulation and scale-up of the pilot scale results into the production scale plant design were conducted using SUPASIM®, a proprietary flotation simulation program of EMC. SUPASIM® uses the rate data from the two component Kelsall rate equation as the input data and then adjusts the number of cells and cell aeration rate to project along the kinetic curves to determine the optimum time and hence cell volume requirements for each separation stage of the plant. A total of some 60 case studies have been made using this technology.
EMC simulated the production scale plant design based on a throughput of 32,000 STPD. The parameters used for the plant simulation and design are shown in Table 13‑8. These are the parameters that were adopted for the process plant design criteria.
Table 13‑8: Flotation Plant Simulation and Design Parameters
| Parameter | Unit | Value |
| Throughput | ||
| Throughput | STPD | 32,000 |
| Throughput | STPH | 1,340 |
| Flotation Feed Solids | % w/w | 33.2 |
| Head Grades | ||
| Cu | % w/w | 0.300 |
| Ni | % w/w | 0.086 |
| Co | % w/w | 0.010 |
| Fe | % w/w | 9.480 |
| S | % w/w | 0.610 |
| Au | ppm | 0.050 |
| PGM (Rh, Pd, Pt) | % w/w | 0.330 |
The production scale simulations were performed and parameters such as retention time and flotation volume requirements were produced. EMC produced a mass balance using the results of the simulation. The mass balance analyzed the copper, nickel and sulfur elements. Recoveries and concentrate mass yields were calculated for each stage of the circuit. The simulation for the circuit is summarized in Table 13‑9.
| M3-PN150164 26 March 2018 |
82
NorthMet Project
Form NI 43-101F1 Technical Report
Table 13‑9: Summary of Flotation Circuit Simulation
| Stream | Simulated Plant Mass Balance | ||||||||
| % Mass | % Solids | Pulp | % Cu | Cu % Rec | % Ni | Ni % Rec | % S | S % Rec | |
Gpm (m3/h) | |||||||||
| New Feed | 100.00 | 33.2 | 13838 (3143) | 0.300 | 100.0 | 0.086 | 100.0 | 0.61 | 100.0 |
| Cu-Ni Bulk Rougher Concentrate | 11.8 | 30.7 | 1810 (411) | 2.26 | 89.0 | 0.44 | 60.6 | 3.67 | 71.1 |
| Cu-Ni Bulk 1st Cleaner Concentrate | 4.11 | 28.0 | 705 (160) | 6.48 | 88.7 | 1.22 | 58.1 | 10.4 | 70.1 |
| Cu-Ni Bulk 2nd Cleaner Concentrate | 2.83 | 24.1 | 581 (132) | 9.52 | 89.8 | 1.79 | 58.9 | 15.7 | 72.6 |
| Cu-Ni Bulk 3rd Cleaner Concentrate | 1.82 | 23.5 | 387 (88) | 14.6 | 88.4 | 2.74 | 58.0 | 23.1 | 68.9 |
| Cu-Ni Bulk 4th Cleaner Concentrate | |||||||||
| Cu-Ni Bulk 1st Cleaner Tail | 10.00 | 32.5 | 1422 (323) | 0.018 | 0.6 | 0.022 | 2.6 | 0.14 | 2.2 |
| Feed to Cu-Ni Sep Rougher | 1.82 | 23.5 | 387 (88) | 14.6 | 88.4 | 2.74 | 58.0 | 23.1 | 68.9 |
| Cu-Ni Sep Rougher Concentrate | 1.56 | 23.2 | 335 (76) | 16.8 | 87.1 | 1.58 | 28.6 | 23.2 | 59.2 |
| Cu-Ni Sep 1st Cleaner Concentrate | 1.51 | 23.1 | 326 (74) | 17.8 | 89.1 | 1.12 | 19.6 | 23.7 | 58.5 |
| Cu-Ni Sep 2nd Cleaner Concentrate | 1.29 | 23.0 | 282 (64) | 20.1 | 86.3 | 0.81 | 12.2 | 27.1 | 57.3 |
| Cu-Ni Sep 3rd Cleaner Concentrate | 1.27 | 22.9 | 277 (63) | 21.6 | 91.8 | 0.65 | 9.6 | 30.1 | 62.8 |
| Cu-Ni Sep 4th Cleaner Concentrate | 0.90 | 22.8 | 198 (45) | 26 | 77.7 | 0.45 | 4.7 | 34.4 | 50.6 |
| Cu-Ni Sep 5th Cu Cleaner Concentrate | |||||||||
| Cu-Ni Sep 1st Cleaner Tail | 0.66 | 23.8 | 137 (31) | 4.30 | 9.4 | 3.13 | 23.9 | 7.93 | 8.6 |
| Cu-Ni Sep Tail (Ni Concentrate) | 0.92 | 24.2 | 189 (43) | 3.49 | 10.8 | 4.96 | 53.3 | 12.1 | 18.2 |
| Cu-Ni Bulk Rougher Tail | 98.2 | 33.5 | 13451 (3055) | 0.035 | 11.6 | 0.037 | 42.0 | 0.19 | 31.1 |
| Feed to Po Rougher | 98.2 | 33.5 | 13451(3055) | 0.035 | 11.6 | 0.037 | 42.0 | 0.19 | 31.1 |
| Po Rougher Concentrate | 5.79 | 29.2 | 942 (214) | 0.35 | 6.8 | 0.10 | 7.0 | 4.33 | 41.1 |
| Po 1st Cleaner Concentrate | 7.67 | 29.0 | 1321 (300) | 0.33 | 8.5 | 0.10 | 8.8 | 13.8 | 173.8 |
| Po 2nd Cleaner Concentrate | 5.65 | 29.0 | 945 (215) | 0.71 | 13.4 | 0.20 | 13.5 | 15.6 | 144.6 |
| Po 3rd Cleaner Concentrate | 0.52 | 28.9 | 88 (20) | 3.08 | 5.4 | 0.82 | 5.0 | 26.1 | 22.4 |
Po 1st Cleaner Tail | 5.23 | 29.3 | 854 (194) | 0.079 | 1.4 | 0.03 | 2.0 | 2.11 | 18.1 |
| Po Rougher Tail | 97.6 | 33.5 | 13363 (3035) | 0.019 | 6.2 | 0.033 | 37.0 | 0.050 | 8.0 |
| M3-PN150164 26 March 2018 |
83
NorthMet Project
Form NI 43-101F1 Technical Report
The results of the simulation were used to size the flotation equipment as given in Table 13‑10.
Table 13‑10: NorthMet Tank Cell Sizing and Selection
| EMC Tank Cell Sizing and Selection | ||||
| Flotation Bank | Number of Cells | Cell Volume yd3 (m3) | Total Bank Volume yd3 (m3) | Nominal Residence Time (min) |
| Cu-Ni Bulk Rougher Bank | 4 | 653 (500) | 2612 (2000) | 38 |
| Cu-Ni Bulk 1st Cleaner Bank | 4 | 210 (160) | 840 (640) | 60 |
| Cu-Ni Bulk 2nd Cleaner Bank | 3 | 131 (100) | 393 (300) | 88 |
| Cu-Ni Bulk 3rd Cleaner Bank | 2 | 131 (100) | 262 (200) | 83 |
| Cu-Ni Bulk 4th Cleaner Bank | - | - | - | - |
| Total | 13 | 4107 (3140) | 269 | |
| Cu-Ni Sep Rougher Bank | 3 | 65 (50) | 210 (150) | 91 |
| Cu-Ni Sep 1st Cleaner Bank | 3 | 65 (50) | 210 (150) | 107 |
| Cu-Ni Sep 2nd Cleaner Bank | 3 | 39 (30) | 117 (90) | 59 |
| Cu-Ni Sep 3rd Cleaner Bank | 3 | 39 (30) | 117 (90) | 63 |
| Cu-Ni Sep 4th Cleaner Bank | 3 | 39 (30) | 117 (90) | 69 |
| Cu-Ni Sep 5th Cleaner Bank | 3 | 26 (20) | 78 (60) | 50 |
| Total | 18 | 849 (630) | 439 | |
| Po Rougher Bank | 5 | 653 (500) | 3265 (2500) | 50 |
| Po 1st Cleaner Bank | 2 | 210 (160) | 420 (320) | 57 |
| Po 2nd Cleaner Bank | 2 | 131 (100) | 262 (200) | 83 |
| Po 3rd Cleaner Bank | 2 | 65 (50) | 131 (100) | 57 |
| Po 4th Cleaner Bank | - | - | ||
| Total | 11 | 4078 (3120) | 247 | |
| 13.5 | Metallurgical Modelling For Recovery And Concentrate Quality |
Total metal recovery was adapted from the SGS report “Flotation Grade-Recovery Study Phase II,” Project 11603-004. This report presented the recovery of all the relevant metals as a function of the Cu head grade. This data was then augmented with additional data from key laboratory samples and from pilot plant data. This was done for two primary purposes:
| · | To further add to the dataset |
| · | Compare pilot performance to the lab performance |
The data found that the pilot data fit well with the laboratory data. The data was then re-presented for all metals’ recovery as a function of their own head grade rather than to Cu head grade. Although the head grades for all elements generally follow the Cu head grade well, it seemed more appropriate to present each metal as a function of its own head grade. These plots are given in Figure 13‑5 through Figure 13‑12.
The next step was to build to a full metallurgical model from the total metal recovery curves as a function of the head grade. The primary data to fill in all the output streams from the flowsheet (3 concentrates and 1 tailings) were taken primarily from the C-9 and C-10 testing. These are the only two samples which have undergone rigorous “Split Cleaner” flowsheet testing. Testing prior to this used a different flowsheet (bulk concentrate production which eventually lead to a Cu-Ni separation) and hence this data is not fully relevant for the individual products. Data from two other lab samples tested were reviewed but were rejected since these samples only underwent simple batch testing and would therefore require data manipulation to reflect an LCT-type of result.
| M3-PN150164 26 March 2018 |
84
NorthMet Project
Form NI 43-101F1 Technical Report
The following steps were performed:
| 1. | Calculate the total metal recovery. |
| 2. | Estimate the Pyrrhotite concentrate recoveries. |
| a. | This was taken as the average recovery from the C-9 and C-10 samples. |
| b. | This then allows calculating the Bulk Cu+Ni concentrate (Cu Separation circuit feed) recovery. |
| 3. | Calculate the recovery to the Cu concentrate as a fixed recovery factor for each metal from the Bulk Cu+Ni concentrate (i.e. 90% for Cu, 40% for Pt, etc.). |
| a. | The Cu concentrate has some fixed grade targets of 27% Cu, 0.6% Ni and 31% S. These are average values from the C-9 and C-10 testing. |
| b. | The above recovery values and concentrate grade targets permit full calculation of the Cu concentrate assays, recoveries and the mass of product. |
| 4. | Calculate the Ni concentrate as the difference from Bulk Cu+Ni concentrate and the Cu concentrate. This is done at a fixed concentrate assay of 20% S, again averaged from the C-9 and C-10 test work. |
| 5. | The final tails recovery is calculated as the difference of 100 less the total metal recovery determined in Step 1) above. The %S in the tail is a function of the S head grade vs. recovery, which is different from the other elements. |
| 6. | The next step is a small iterative step (done within EXCEL) which estimates the total concentrate wt.% so that the Pyrrhotite concentrate and tails mass can be estimated. (Tails mass equates to 100 less the total concentrate mass, and Po concentrate mass equates to tails less Bulk Cu+Ni concentrate). |
| 7. | With the mass estimated, then all the assays for the Pyrrhotite concentrate can be determined from the known recoveries and the mass is then iterated for a small adjustment to make the balance whole. |
| 13.5.1 | Cobalt |
Cobalt is handled differently, mostly since the overall head grade vs. recovery trend is poor. Cobalt is similar to Ni in that a notable portion of it is tied up in olivine and hence much of the cobalt is non-recoverable as non-sulphide. Thus, for total recovery we have applied the average recovery for all the samples used for modelling. The next assumption was that all the sulphide Co was associated with pentlandite; hence, we calculated out the Co assays for the concentrate streams as a simple ratio to the Ni assay. The ratio was taken from the available mineral chemistry data. This last assumption is reasonable as most of the sulphide Co is in pentlandite and only a small portion of the Co is as discrete Co minerals. It is assumed that the discrete Co minerals will likely respond in a fashion similar to pentlandite.
| M3-PN150164 26 March 2018 |
85
NorthMet Project
Form NI 43-101F1 Technical Report
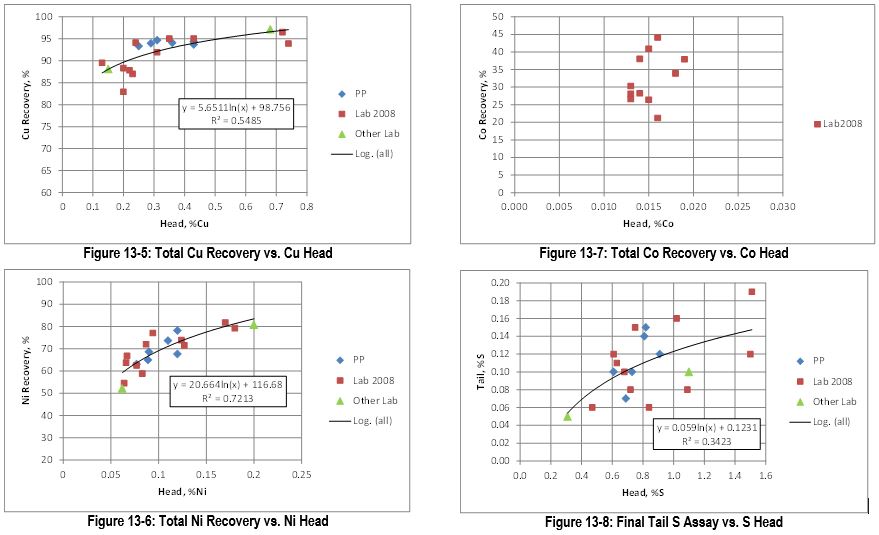
| M3-PN150164 26 March 2018 |
86
NorthMet Project
Form NI 43-101F1 Technical Report
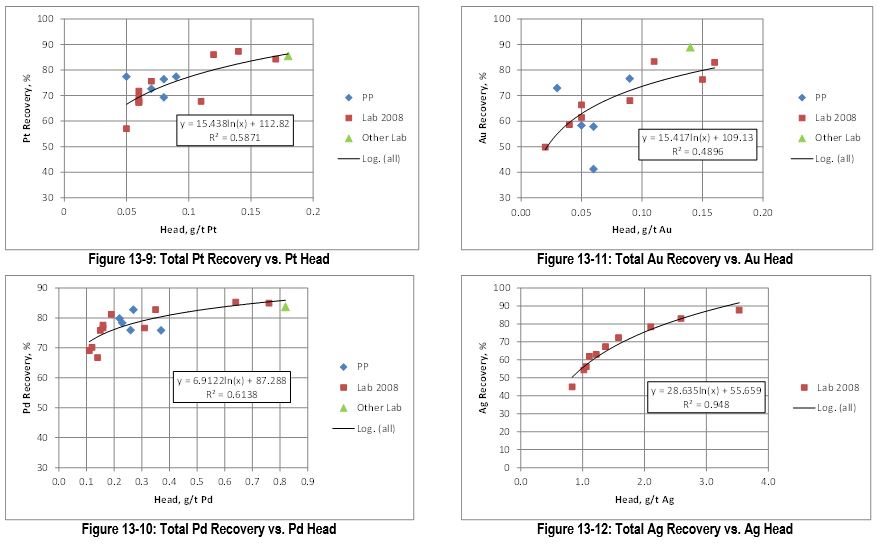
| M3-PN150164 26 March 2018 |
87
NorthMet Project
Form NI 43-101F1 Technical Report
Table 13‑11 shows the overall mass balance for C-9, C-10 compared to the result of modelling the C-10 heads.
Table 13‑11: Summary of C-9 and C-10 Metallurgy Compared to Model
| C-9 | C-10 | Model C-10 | ||||
| Assay | Recovery | Assay | Recovery | Assay | Recovery | |
| Feed | ||||||
| Wt.% | 100 | 100 | 100 | |||
| Cu | 0.30 | 0.29 | 0.29 | |||
| Ni | 0.065 | 0.095 | 0.095 | |||
| Co ppm | 86 | 75 | ||||
| Pt ppb | 70 | 72 | 72 | |||
| Pd ppb | 220 | 250 | 250 | |||
| Au ppb | 30 | 48 | 48 | |||
| Ag ppm | <2 | 1.3 | 1.3 | |||
| S | 0.61 | 0.70 | 0.70 | |||
| Cu Concentrate | ||||||
| Wt.% | 0.75 | 0.79 | 0.84 | |||
| Cu | 26.9 | 80.0 | 28.2 | 76.5 | 27.0 | 78.5 |
| Ni | 0.56 | 5.6 | 0.66 | 5.5 | 0.60 | 5.3 |
| Co ppm | 360 | 300 | 3.4 | |||
| Pt ppb | 1760 | 28.8 | 1260 | 13.9 | 2055 | 24.1 |
| Pd ppb | 11600 | 46.3 | 13700 | 43.2 | 13444 | 45.4 |
| Au ppb | 1280 | 40.9 | 2790 | 46.2 | 2381 | 41.9 |
| Ag ppm | 60 | 61.8 | 38.5 | 65.6 | 42.5 | |
| S | 30 | 45.6 | 31.8 | 35.8 | 31.0 | 37.4 |
| Ni Concentrate | ||||||
| Wt.% | 0.73 | 0.67 | 0.48 | |||
| Cu | 4.16 | 8.8 | 3.90 | 9 | 5.25 | 8.7 |
| Ni | 7.08 | 51.7 | 7.00 | 49.7 | 10.39 | 52.7 |
| Co ppm | 3300 | 5194 | 33.4 | |||
| Pt ppb | 3767 | 36.3 | 5230 | 49.1 | 5395 | 36.1 |
| Pd ppb | 11200 | 23.1 | 10170 | 27.3 | 11588 | 22.3 |
| Au ppb | 3060 | 20.4 | 480 | 6.7 | 1042 | 10.5 |
| Ag ppm | 33 | 30.4 | 16.1 | 28.7 | 10.6 | |
| S | 17.7 | 20.5 | 18.7 | 17.9 | 20.0 | 13.8 |
| Po Concentrate | ||||||
| Wt.% | 0.58 | 1.10 | 1.02 | |||
| Cu | 2.81 | 4.8 | 1.17 | 4.3 | 1.28 | 4.5 |
| Ni | 0.85 | 5.2 | 0.67 | 7.5 | 0.74 | 8.0 |
| Co ppm | 630 | 371 | 5.1 | |||
| Pt ppb | 1430 | 13.8 | 650 | 9.9 | 844 | 12.0 |
| Pd ppb | 4590 | 10.9 | 2360 | 10 | 2443 | 10.0 |
| Au ppb | 890 | 14.3 | 270 | 6.1 | 469 | 10.0 |
| Ag ppm | 18 | 8.2 | 6.9 | 12.7 | 10.0 | |
| S | 25.5 | 21.8 | 21.3 | 32.3 | 24.0 | 35.1 |
| Tails | ||||||
| Wt.% | 98.0 | 97.5 | 97.7 | |||
| Cu | 0.020 | 6.1 | 0.030 | 10.2 | 0.024 | 8.2 |
| Ni | 0.032 | 36.8 | 0.036 | 37.3 | 0.033 | 34.0 |
| Co ppm | 57 | 45 | 58.2 | |||
| Pt ppb | 12 | 21.1 | 20 | 27.2 | 20 | 27.8 |
| Pd ppb | 45 | 19.7 | 50 | 19.5 | 57 | 22.3 |
| Au ppb | 8 | 24.4 | 20 | 40.9 | 19 | 37.7 |
| Ag ppm | 0.5 | 38.5 | 0.5 | 36.8 | ||
| S | 0.08 | 12.1 | 0.10 | 13.9 | 0.10 | 13.8 |
| M3-PN150164 26 March 2018 |
88
NorthMet Project
Form NI 43-101F1 Technical Report
| 13.6 | Hydrometallurgical Test Work |
The development of the current Phase II process flowsheet (Figure 13‑13) was based on the results of the following test work:
| 1. | PLATSOL™ (autoclave) leaching of nickel and pyrrhotite concentrate, |
| 2. | Ferric iron reduction, |
| 3. | Copper Sulfide Precipitation of PGM, |
| 4. | Copper Concentrate Enrichment, |
| 5. | Residual Copper precipitation with NaHS, and |
| 6. | Mixed Hydroxide Precipitation (MHP) Recovery. |
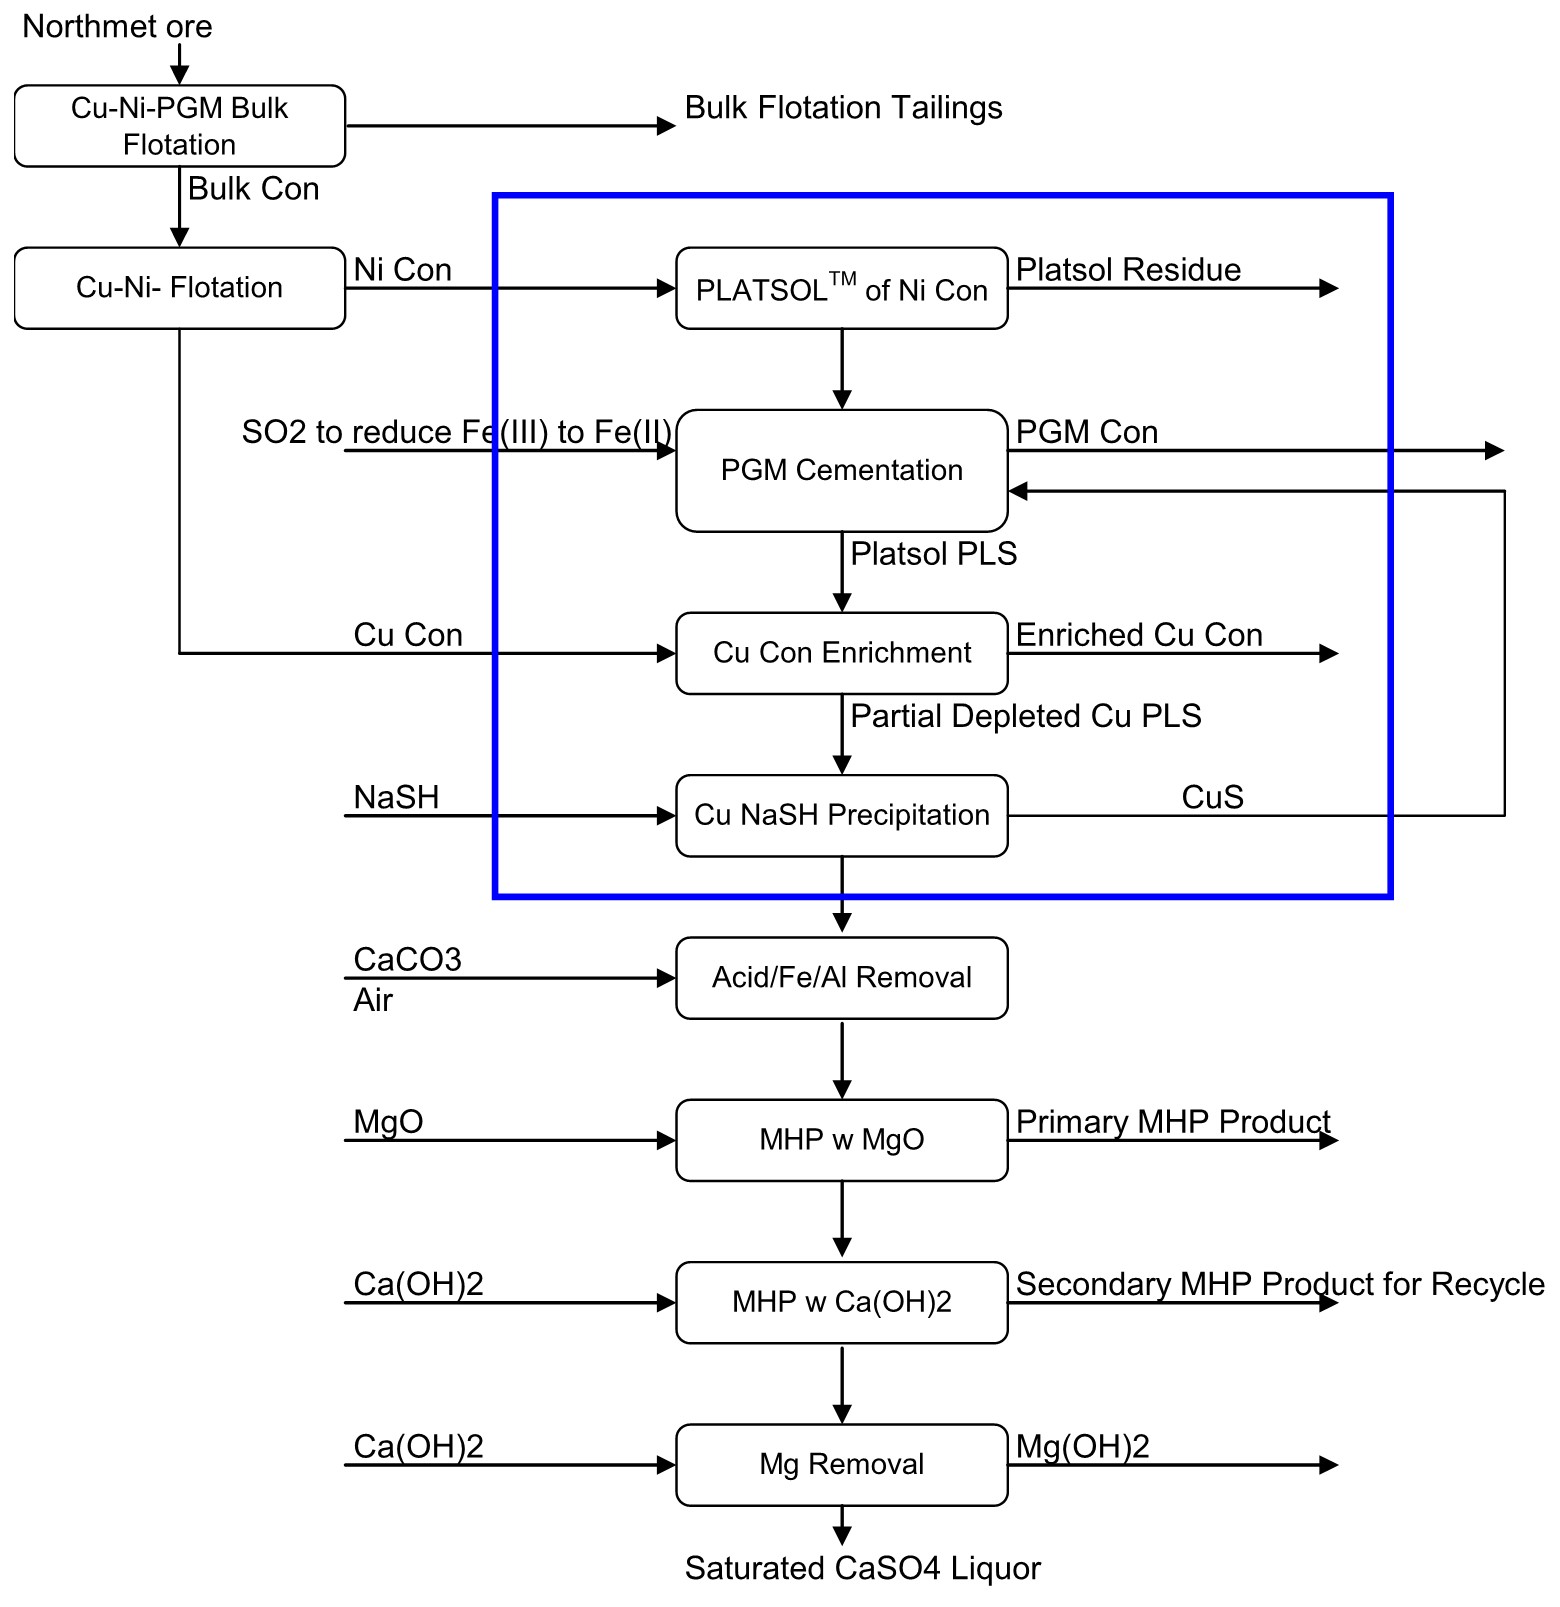
Figure 13‑13: Hydrometallurgical Pilot Plant Flowsheet
| M3-PN150164 26 March 2018 |
89
NorthMet Project
Form NI 43-101F1 Technical Report
Bench-scale tests and a pilot plant campaigns yielded promising PLATSOL™ autoclave leaching parameters for extraction of base metals and Au+PGMs from NorthMet concentrates (SGS Lakefield, 2006; SGS Minerals, 2005 and SGS, 2006). Results from the most recent continuous hydrometallurgical pilot plant program conducted by SGS (SGS, 2010) are summarized herein and are the basis for the hydrometallurgical process described in this Study.
| 13.6.1 | PLATSOL™ Leaching Pilot Plant Testing |
Nickel Concentrate and Copper Concentrate from 2008 flotation testing (C1) and a pyrrhotite concentrate and copper concentrate from 2009 flotation testing were tested with PLATSOL leach. Head assays for the concentrates are presented in Table 13‑12.
The single pass autoclave retention time based on a 33-liter autoclave working volume at approximately 225°C was 64 minutes for campaign C1 and 119 mins for campaign C2. The feed to the autoclave was 9.2-9.5% solid and O2 over pressure ranged from 100-110 psi. ACD pulp was filtered on filter pans without thickening or flocculation and residue recycling was initiated as soon as sufficient leach residue cake was available. Filter cakes were repulped in ACD PLS and adjusted to target pulp density to reach a target of 100% solids recycling.
In this study, two campaigns were conducted for PLATSOL leach and copper enrichment pilot tests, using two copper concentrates: A nickel concentrate from the 2008 flotation testing (C1), and a pyrrhotite concentrate from the 2009 flotation testing (C2). Each campaign had a runtime of 12-15 hours. Head assays for the concentrates are presented in Table 13‑12.
The PLATSOL continuous tests were conducted in a 33-liter (working volume) autoclave at approximately 225°C with residence times of 64 minutes for Concentrate C1 and 119 minutes for Concentrate C2, and an oxygen overpressure of 100 to 110 psi. The pulp densities in the autoclave ranged from 9.2 to 9.5% solids after cooling water injection. Part of the autoclave discharge residue was recycled to the autoclave feed such that the residue stream mass is equal to the mass of fresh feed. The autoclave discharge (ACD) was filtered on filter pans without thickening or flocculation and residue recycling was initiated as soon as sufficient leach residue cake was available. The recycled filter cakes were repulped with ACD pregnant leach solution (PLS) to the target feed pulp before feeding back to the autoclave.
Table 13‑12: Flotation Concentrate Head Assays Used in the Test Campaigns (C1 & C2)
| Campaign | Sample Type | Ni (%) | Cu (%) | Fe (%) | Co (%) | Al (%) | Mg (%) | Cr (%) | Ca (%) | Zn (%) | Si (%) | S (%) | S2- (%) | Au (g/t) | Pt (g/t) | Pd (g/t) |
| C1 | NiCon | 3.44 | 5.66 | 34.7 | 0.18 | 1.82 | 1.91 | 0.07 | 1.16 | 0.06 | 5.68 | 24.4 | 23.3 | 0.9 | 3.35 | 10.3 |
| C2 | PoCon | 0.8 | 2.17 | 32.4 | 0.04 | 1.39 | 2.07 | 0.04 | 0.84 | 0.07 | 5.21 | 25.3 | 23.2 | 0.62 | 0.97 | 3.32 |
Campaign C2 immediately followed Campaign C1, allowing uninterrupted solids recycling, which meant that campaign C1 leach residue was recycled with the new C2 feed early in the C2 campaign. PLS from campaign C1 was collected 2 hours into campaign C2 before collection of C2 PLS commenced. The pH of both liquors was adjusted to 2.
Average autoclave feed flowrates are reported in Table 13‑3.
Table 13‑13: Average Autoclave Feed Flowrates
| Campaign | Flot Con | ACD Recycling | Dilution Liquor | Total Flow | ||||
| % solids | PD, g/L | mL/min | % solids | PD, g/L | mL/min | mL/min | mL/min | |
| C1 | 57% | 1707 | 63 | 51% | 1764 | 64 | 391 | 518 |
| C2 | 51% | 1676 | 36 | 49% | 1721 | 41 | 201 | 278 |
| M3-PN150164 26 March 2018 |
90
NorthMet Project
Form NI 43-101F1 Technical Report
Average autoclave compartment temperatures over the last 4 hours of each campaign ranged from 220.3°C to 225.3 °C for C1 and 224.9°C to 227.0°C for C2. Overall oxygen flowrates for both campaigns ranged from 36 to 45 L/min.
Metal recoveries were calculated after correction for mass losses using Si assays as the tie element. While the amounts of silicon that dissolved were minor, they were still corrected for.
ACD liquor and residue trends are shown in Figure 13‑14 and Figure 13‑15 respectively. The change over to C2 happened shortly before 4 Nov 00:00, which caused the Ni content in the liquor to decrease. PLATSOLTM leaching was successful in both campaigns. Recoveries of base metal and PGMs into the leach liquors are reported in Table 13‑14.
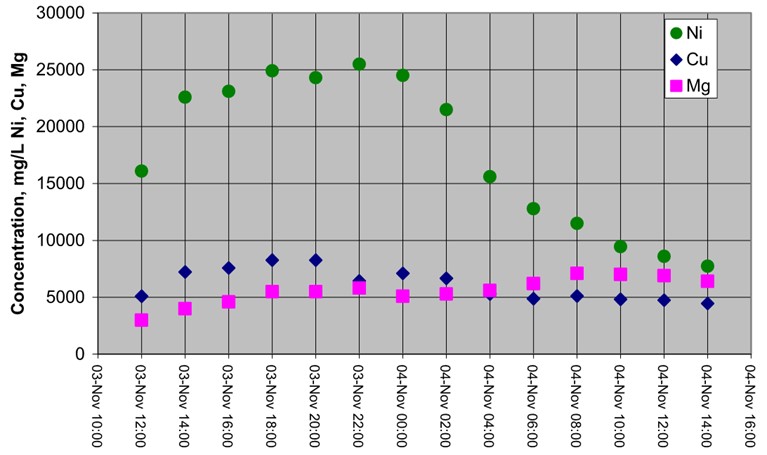
Source: SGS PLATSOL™ Processing Report (2010).
Figure 13‑14: ACD Liquor Ni, Cu, Mg PLS Trends
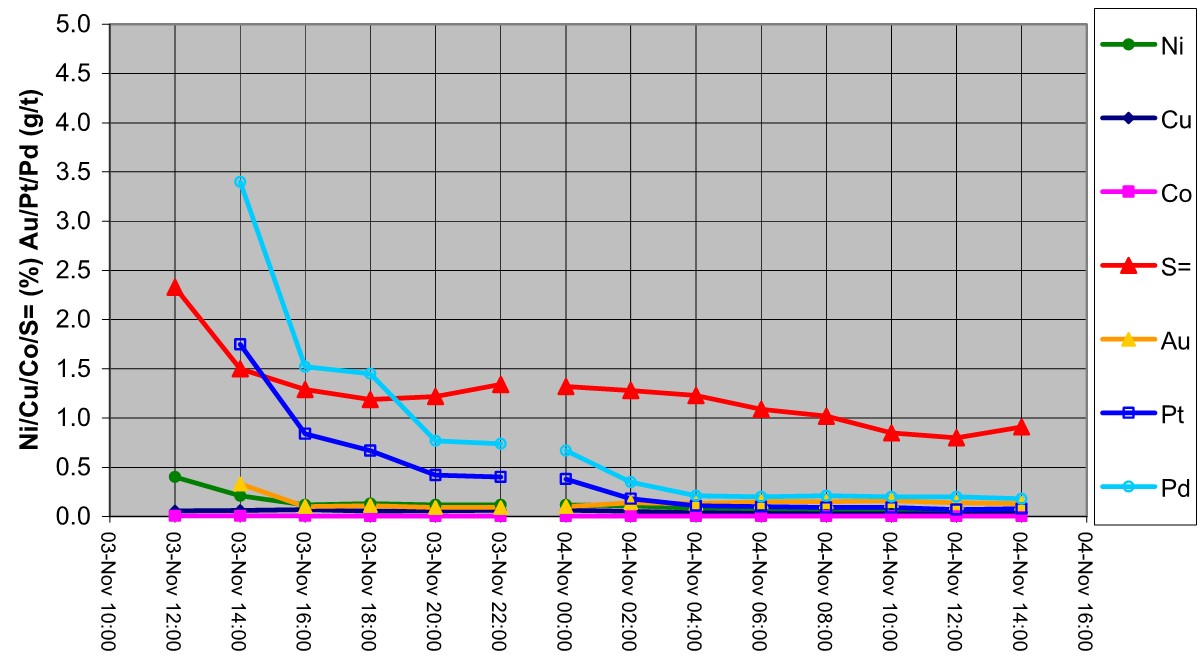
Source: SGS PLATSOL™ Processing Report (2010).
Figure 13‑15: ACD Residue Trends
PLATSOL™ Leaching was successful in both campaigns leading to the base metal recoveries reported in Table 13‑14.
| M3-PN150164 26 March 2018 |
91
NorthMet Project
Form NI 43-101F1 Technical Report
Table 13‑14: Base Metal and PGM Recoveries
| Campaign | Ni (%) | Cu (%) | Fe (%) | Co (%) | Al (%) | Mg (%) | Cr (%) | Ca (%) | Zn (%) | Si (%) | S2- (%) | Au (%) | Pt (%) | Pd (%) |
| C1 | 97.0 | 99.1 | -0.4 | 98.1 | 25.5 | 33.8 | 10.1 | -66.4 | 97.4 | 3.1 | 95.5 | 91.0 | 87.6 | 92.0 |
| C2 | 95.5 | 99.0 | 3.7 | 96.7 | 45.0 | 61.4 | -13.2 | -12.3 | 99.1 | 2.1 | 97.4 | 84.0 | 94.2 | 95.9 |
| 13.6.2 | Precipitation of PGMs by Copper Sulfide |
The precipitation of platinum group metals (PGM) by CuS is similar to the cementation process based on following reactions:
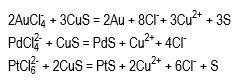
The CuS is less noble than each of the Au, PdS, PtS, hence the PGMs in solution precipitate in exchange for Cu going into solution. The reaction is conducted at elevated temperatures to accelerate the reactions. The result is a mixed CuS-S-Au-PtS-PdS precipitate for refining.
The PGM Precipitation circuit consisted of a preheat tank, two PGM precipitation tanks and a SO2 reduction tank. Autoclave filtrates from campaigns were heated to 95°C in the preheat tank, sparged with gaseous SO2 to reduce ferric iron in the SO2 reduction tank. The addition of SO2 was controlled by online ORP measurements.
In the first PGM tank, dissolved PGMs were precipitated onto synthetic CuS beads injected into the tank (target 10 g/L CuS concentration), then filtered onto Buchner filters. Filtered solids were repulped in the second tank filtrate and recycled back to the first tank to reduce the amount of CuS required. Summarized conditions for the PGM Circuit are presented in Table 13‑15.
Table 13‑15: Summary of PGM Precipitation Operating Parameters
| Campaign | Flow rate | RT | Temps | ORP | CuS (dry) | ||||||||
| Feed | PGM 1 | PGM 2/3 | PGM1 | PGM2 | PGM3 | PGM1 | PGM2 | PGM3 | fresh | rec. | total | conc | |
| mL/min | Min | °C | (mV) | g/min | g/l | ||||||||
| C1 | 61 | 73 | 87 | 97 | 96 | 95 | 446 | 452 | 498 | 0.2 | 0.0 | 0.2 | 3.9 |
| 64 | 69 | 84 | 98 | 96 | 95 | 401 | 390 | 375 | 0.6 | 0.1 | 0.7 | 10.4 | |
| 60 | 73 | 81 | 95 | 95 | 95 | 412 | 381 | 357 | 0.2 | 0.9 | 1.1 | 18.0 | |
| 60 | 73 | 78 | 96 | 96 | 95 | 445 | 382 | 359 | 0.2 | 0.8 | 1.0 | 16.2 | |
| C2 | 63 | 70 | 83 | 95 | 95 | 95 | 423 | 380 | 361 | 0.1 | 0.8 | 0.9 | 14.2 |
| 62 | 71 | 83 | 95 | 95 | 88 | 402 | 366 | 356 | 0.1 | 0.4 | 0.5 | 7.5 | |
| 63 | 70 | 84 | 95 | 95 | 95 | 417 | 369 | 360 | 0.0 | 0.7 | 0.8 | 12.0 | |
| 67 | 65 | 85 | 95 | 95 | 95 | 400 | 363 | 358 | 0.3 | 0.5 | 0.8 | 11.2 | |
Table 13‑16 compares the PGM Precipitation circuit feed liquor composition to the PGM Precipitation filtrate composition.
| M3-PN150164 26 March 2018 |
92
NorthMet Project
Form NI 43-101F1 Technical Report
Table 13‑16: Comparison between PGM Precipitation Circuit Feed and Filtrate Concentrations
| Campaign | Ni mg/L | Cu mg/L | Fe mg/L | Fe(II) mg/L | Co mg/L | Al mg/L | Mg mg/L | Cr mg/L | Ca mg/L | Zn mg/L | Si mg/L | Cl mg/L | Au mg/L | Pt mg/L | Pd mg/L |
| PGM Feed Liquor | |||||||||||||||
| C1 | 23000 | 7500 | 1970 | 50 | 1100 | 820 | 4800 | 21 | 540 | 480 | 430 | 9620 | 0.05 | 0.18 | 0.72 |
| C2 | 11000 | 4800 | 5500 | 79 | 540 | 1900 | 6600 | 32 | 670 | 520 | 350 | 10700 | 0.04 | 0.20 | 0.63 |
| PGM Filtrate | |||||||||||||||
| Ni mg/L | Cu mg/L | Fe mg/L | Co mg/L | Al mg/L | Mg mg/L | Cr mg/L | Ca mg/L | Zn mg/L | Si mg/L | Au mg/L | Pt mg/L | Pd mg/L | |||
| C1 | 18000 20000 | 6100 6700 | 2400 2000 | -- | 880 920 | 430 640 | 3900 4300 | 11 16 | 450 480 | 490 410 | 230 350 | -- -- | <0.01 <0.01 | 0.01 <0.01 | <0.01 0.01 |
| C2 | 18000 13000 12000 | 6500 5300 4800 | 3100 4900 5300 | -- -- -- | 840 580 550 | 1100 1700 1900 | 5400 6100 6400 | 25 27 27 | 560 640 690 | 460 520 530 | 380 380 360 | -- -- -- | <0.01 <0.01 0.01 | <0.01 <0.01 0.01 | 0.01 <0.01 0.01 |
Table 13‑16 shows that in both campaigns the precipitation with synthetic CuS beads was successful at clearing all PGM elements in solution to less than 0.01 mg/L. The final precipitate of the PGM Precipitation Circuit yielded as much as 244 g/t Pd.
| 13.6.3 | Copper Concentrate Enrichment |
In the copper enrichment (CuE) stage of the pilot study, soluble copper in the PGM filtrate is mixed with copper concentrate. The following metathesis reactions are thought to occur resulting in an enriched copper grade and Ni & Fe dissolution.
CuFeS2 + CuSO4 = 2CuS + FeSO4
CuFe2S3 + 2CuSO4 = 3CuS + 2FeSO4
Fe7S8 + 7CuSO4 = 7CuS + 7FeSO4 + S0
Nickel Sulfides also react to provide lower Ni in the copper concentrate.
NiS + CuSO4 = CuS + NiSO4
Campaign C1 PLS was contacted with the corresponding copper concentrate from the 2008 flotation test program and Campaign C2 PLS was contacted with copper concentrate from the corresponding 2009 flotation program. The process was conducted in three tanks CuE1, CuE2 and CuE3, with only the first tank heated to the reaction temperature and the last two tanks insulated.
Table 13‑17 presents the feed rates and operating conditions employed during copper enrichment of C1 and C2. Discharge from CuE3 was filtered on filter pans with no washing. The filter cakes were then repulped in CuE3 filtrate and recycled back to CuE1. The target weight ratio of recycled over fresh concentrate was 1. However, Table 13‑17 shows that actual values after commissioning were more in the order of 0.5 to 0.7.
| M3-PN150164 26 March 2018 |
93
NorthMet Project
Form NI 43-101F1 Technical Report
Table 13‑17: Operating Conditions and Feed Parameter for Copper Concentrate Enrichment
| Conc | Feed Rate, mL/min | Fresh Cu Conc, g/min | Recycle Cu Conc, g/min | Ratio, Recycle to Fresh | Temperature, °C | ORP, mV | Pulp Density, g/L | ||||||
| CuE1 | CuE2 | CuE3 | CuE1 | CuE2 | CuE3 | CuE1 | CuE2 | CuE3 | |||||
| C1 | 65 51 55 | 10.8 11.5 8.1 | 0 1.5 3.8 | 0 0.1 0.5 | 93 95 90 | 66 74 82 | 50 53 60 | 369 304 335 | 335 257 277 | 364 346 319 | 1189 1245 1270 | 1211 1200 1288 | 1203 1243 1278 |
| C2 | 58 63 63 64 | 9.9 12.6 13.5 9.6 | 4.6 4.4 6.1 7.0 | 0.5 0.3 0.5 0.7 | 89 87 82 81 | 79 63 66 66 | 62 54 54 55 | 319 298 301 308 | 227 262 250 277 | 326 309 298 324 | 1281 1265 1273 1271 | 1243 1270 1281 1311 | 1262 1269 1280 1263 |
Results indicated that the reactions were stable at temperatures as low as 60-70°C and retention times as little as 2-3 hours (data not shown) and that there was a distinct correlation between residual soluble copper and ORP (Figure 13‑16). Hence, ORP can be used to gauge the level of residual copper providing useful opportunities for process control.
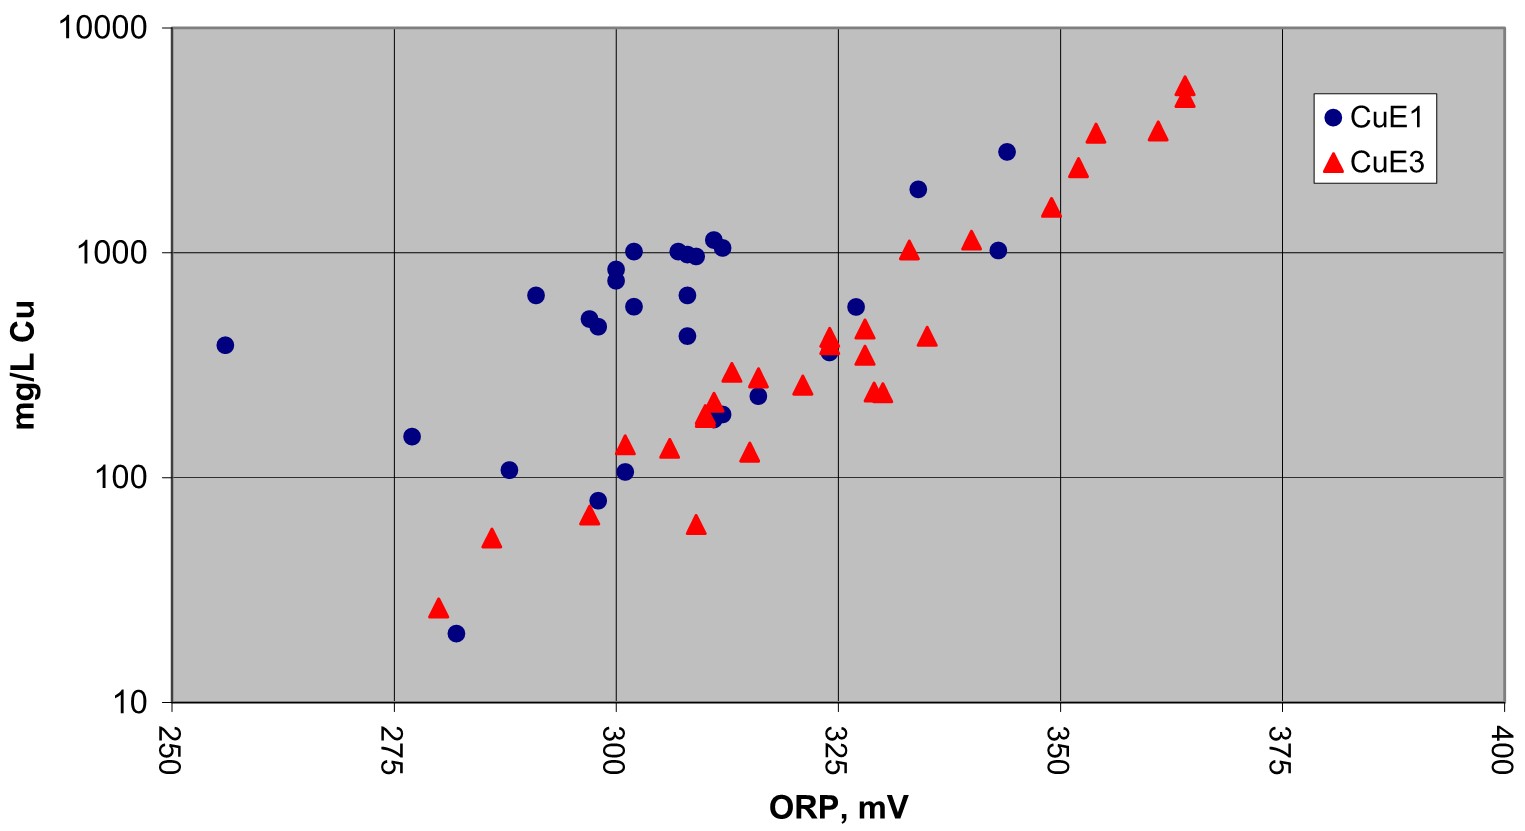
Figure 13‑16: Correlation between Cu and ORP Observed for Copper Enrichment Trials
The material was pulped to a target pulp density and head samples were assayed. Composite liquor and residue assays were also obtained and are presented in together with the head assays in Table 13‑18. These data show that no PGM metals were lost to the filtrate (all assays reported <0.01 mg/L).
| M3-PN150164 26 March 2018 |
94
NorthMet Project
Form NI 43-101F1 Technical Report
Table 13‑18: Head and Copper Enrichment Solids and Filtrate Composite Assays
| Campaign | NI % | Cu % | Fe % | Co % | Al % | Mg % | Cr % | Ca % | Zn % | Si % | S % | S2- % | Au g/t | Pt g/t | Pd g/t |
| Head Assays | |||||||||||||||
| Cu Con (C1) | 0.38 | 30.5 | 33.5 | 0.018 | 0.09 | 0.47 | <0.004 | 0.07 | 0.038 | 1.23 | 32.7 | 30.5 | 1.32 | 1.13 | 5.76 |
| Cu Con (C2) | 0.64 | 30.5 | 31.5 | 0.025 | 0.15 | 0.36 | <0.006 | 0.36 | 0.056 | 1.21 | 31.1 | 29.8 | 1.6 | 1.44 | 9.24 |
| Copper Enrichment Cu3 Solids Assays | |||||||||||||||
| Cu Con (C1) | 0.33 0.31 0.39 | 26.5 31.2 30.7 | 30.4 24.3 30.3 | 0.02 0.02 0.02 | 0.21 0.11 0.09 | 0.66 0.39 0.33 | <0.004 <0.004 <0.004 | 0.1 0.06 <0.04 | 0.062 0.045 0.043 | 1.95 1.1 0.9 | 31.4 31 31.6 | 29.8 30.9 31.6 | nss 1.3 1.7 | nss 1.1 1.5 | nss 5.2 6.4 |
| Cu Con (C2) | 0.39 0.52 0.55 | 30.7 30.5 29.7 | 30.3 28.5 29.4 | 0.02 0.02 0.02 | 0.09 0.12 0.14 | 0.33 0.38 0.41 | <0.004 <0.004 <0.004 | <0.04 <0.04 <0.04 | 0.043 0.049 0.054 | 0.9 1.11 1.23 | 31.6 32 32.7 | 31.6 32 31.3 | 1.7 1.6 1.6 | 1.5 1.3 1.3 | 6.4 7.7 8.5 |
| Copper Enrichment Cu3 Filtrate Assays | |||||||||||||||
Ni g/L | Cu g/L | Fe g/L | Co g/L | Al g/L | Mg g/L | Cr mg/L | Ca g/L | Zn g/L | Si mg/L | Cl g/L | Au mg/L | Pt mg/L | Pd mg/L | - | |
| Cu Con (C1) | 21 17 17 | 5.4 1.6 0.29 | 8.3 8.8 8.9 | 1.10 0.89 0.86 | 0.34 0.59 0.89 | 5.4 4.5 4.1 | 5 10 19 | 0.69 0.66 0.67 | 0.69 0.51 0.48 | 200 290 390 | 9.31 7.89 7.90 | <0.01 <0.01 <0.01 | <0.01 <0.01 <0.01 | <0.01 <0.01 <0.01 | - |
| Cu Con (C2) | 17 15 11 | 0.29 0.24 0.25 | 8.9 9.3 9.8 | 0.86 0.67 0.48 | 0.89 1.40 1.80 | 4.1 4.9 5.8 | 19 23 25 | 0.67 0.81 0.88 | 0.48 0.48 0.51 | 390 440 390 | 7.90 9.07 9.12 | <0.01 <0.01 <0.01 | <0.01 <0.01 <0.01 | <0.01 <0.01 <0.01 | - |
In campaign C1, copper levels decreased from ~6.5 g/L in PGM filtrates to <0.3 g/L Cu, while iron levels increased from ~2.5 g/L Fe to 8.9 g/L. In campaign C2, copper levels decreased from 0.29 g/L to 0.25 g/L Cu, while iron levels increased from 8.9 g/L to 9.8 g/L Fe. Nickel and cobalt dissolution from the copper concentrates was calculated to be 5.6% and 1.8%, respectively in campaign C1, and 29.1% and 20%, respectively in campaign C2.
No PGM losses from the copper flotation stream were observed based on the consistent filtrate assays of <0.01 mg/L for Au, Pt, and Pd compared to PGMs contained in the feed/head assays.
| 13.6.4 | Residual Copper Precipitation |
Residual soluble copper recovered in the depleted liquor from the copper enrichment stage was precipitated with NaHS (37.5 g/L) in duplicate titanium tanks. Table 13‑19 presents the parameters used for this stage in the process.
Table 13‑19: Soluble Copper Precipitation Parameters
| Tanks | 2 |
| Volume per tank (L) | 7.4 |
| Average NaHS Feed Flow (mL/min) | 65 |
| RT per tank (min) | 114 |
NaHS tanks were not heated (to minimize corrosion), but the copper enrichment filtrate was preheated in a separate glass vessel. NaHS addition/flows were governed by monitoring ORP levels; as a direct correlation between ORP measurements and soluble copper concentrations was observed (Figure 13‑17) in test samples and data acquisition. In general, an ORP level of less than 150 mV was required to achieve a target concentration of 10 mg/L soluble Cu or less. NaHS consumption was calculated to be 0.027 mol/h with a corresponding copper throughput of 0.015 mol/h for a 2:1 mole ratio of NaHS to copper. Copper recovered in the NaHS product filter cakes produced a copper grade of approximately 35% (Table 13‑20) for both campaigns, C1 & C2. Table 13‑20 also indicates that some PGMs were precipitated out of solution during this stage.
| M3-PN150164 26 March 2018 |
95
NorthMet Project
Form NI 43-101F1 Technical Report
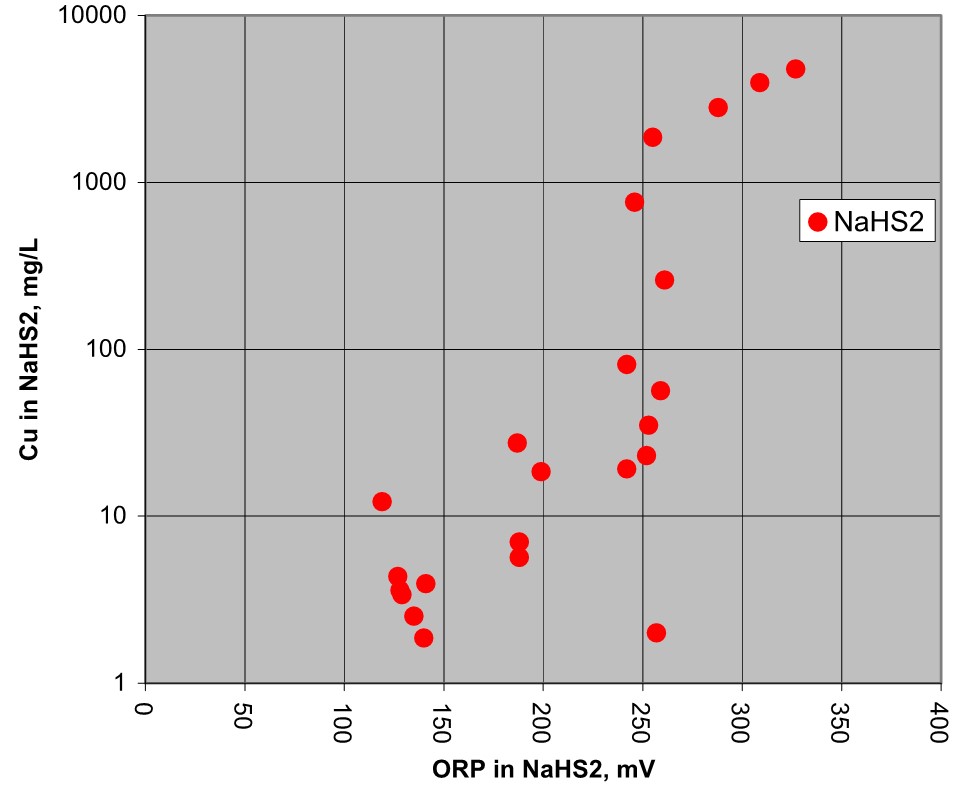
Figure 13‑17: Correlation Between ORP and Soluble Copper Concentration
Table 13‑20: NaHS Product Filter Cake Assays
| Ni % | Cu % | Fe % | Co % | Al % | Mg % | Cr % | Ca % | Zn % | Si % | S % | S= % | Au g/t | Pt g/t | Pd g/t | |
| Cake 1 | 2.04 | 35.0 | 1.12 | 0.16 | 0.05 | 0.041 | 0.005 | <0.05 | 0.029 | 0.62 | 30.3 | 25.3 | 0.05 | 0.09 | 0.19 |
| Cake 2 | 1.73 | 34.8 | 1.51 | 0.11 | 0.26 | 0.11 | <0.006 | <0.05 | 0.018 | 1.27 | 39.9 | 20.2 | 0.09 | 0.1 | 0.48 |
The Cu-NaHS filtrate streams were then subjected to an Fe/Al removal stage followed by two stages of mixed hydroxide precipitation (MHP), ending with a magnesium removal stage.
| 13.6.5 | Bulk Iron/Aluminum Removal |
Fresh lime (CaCO3) was used to precipitate the Fe and Al from the Cu-NaHS filtrate to achieve final soluble Fe and Al concentrations of less than 10 ppm and 30 ppm, respectively. The filtrate was heated to 80°C, agitated and sparged with oxygen. Dry lime was added to achieve a target pH of approximately 4.0. Supernatant samples were analyzed for Fe and Al periodically while maintaining the target pH. Once Fe and Al concentration targets had been achieved, pulps were filtered hot and the products assayed. Analysis of the final supernatant showed that Fe and Al concentrations had both been reduced to <5 mg/L. The amount of limestone used in the Fe/Al removal stage ranged from 61.3 kg limestone per m3 Cu-NaHS filtrate treated in C1 to 74.6 kg limestone per m3 Cu-NaHS filtrate treated in C2. Analysis of the precipitate also showed that some nickel and cobalt precipitated along with Fe and Al as was observed in a previous study (SGS, 2006).
| M3-PN150164 26 March 2018 |
96
NorthMet Project
Form NI 43-101F1 Technical Report
| 13.6.6 | Mixed Hydroxide Precipitation (MHP) |
Filtered Fe/Al precipitated solids were repulped in deionized water and combined with remaining filtrate from the Fe/Al removal stage for each campaign. The resultant solutions were heated and agitated prior to adding a Magnesium Oxide (MgO) pulp (Magchem 30™) to precipitate Ni and Co in Stage 1. Similarly, the filtrate and repulped filtrate produced in Stage 1 MHP was heated and mixed with hydrated lime to further recover more Ni and Co in the precipitate in Stage 2. Table 13‑21 shows test conditions employed for both stages of the MHP process for the two campaigns, C1 & C2. ORP and pH were monitored constantly for both stages and samples were taken periodically. When target Ni concentrations were achieved, testing was discontinued.
Table 13‑21: Test Conditions, Target Ni Concentrations and Ni and Co Feed Concentrations for MHP Tests
| Stage 1-C1 | Stage 1-C2 | Stage 1-C1 | Stage 1-C2 | |
| Feed Source | Fe/AL removal filtrate | Stage 1 MHP filtrate | ||
| Feed Volume (L) | 69.6 | 100 | 63.6 | 93.3 |
| Reagent | MgO | MgO | Ca(OH)2 | Ca(OH)2 |
| Reagent Pulp Density % (w/w) | 20 | 20 | 20 | 20 |
| Target initial pH | - | - | 7.3 | 7.3 |
| Cumulative Reagent Addition (g) | 3445 | 3189 | 1419 | 1508 |
Target Temp. °C | 70 | 70 | 65 | 65 |
| Target soluble Ni conc. (mg/L) | 20% | 20% | 10 | 10 |
For Stage 1, fresh 20% w/w MgO was added at an initial target dosage of approximately 0.65 kg of MgO per kg of Ni+Co based on previous results (SGS, 2006). Similar results were obtained for both campaigns whereby the Ni concentration in samples taken at the 0.65 dosage rate measured more than 99% of the 80% Ni precipitation anticipated. In the final Stage 1 filtrate for C1, 83% of the Ni was precipitated along with 94% of the Co; whereas, for C2, 78% of the Ni was precipitated and only 89% of the Co was precipitated as shown in Table 13‑22.
Table 13‑22: MHP Stage 1 Final Product Analysis and Distribution for Campaigns C1 & C2
Vol L, g | Assays | Distribution | |||||||||
Ni mg/L, % | Co mg/L, % | Zn mg/L, % | Fe Mg/L, % | Mg Mg/L, % | Ni % | Co % | Zn % | Fe % | Mg % | ||
| Campaign C1 | |||||||||||
| Feed (Bulk Fe/Al-C1) | 69.6 | 14900 | 595 | 350 | 0.8 | 4400 | - | - | - | - | - |
| Primary Filtrate | 63.6 | 2580 | 32.4 | <2 | <0.2 | 10000 | 17.1 | 4.4 | 0.6 | 1.0 | 99.0 |
| Repulp Wash 1 | 60.4 | 282 | 2.07 | 1.8 | 0.3 | 0.0 | 0.0 | 0.0 | |||
| Repulp Wash 2 | 56.1 | 141 | 1.2 | 0.8 | 0.1 | 0.0 | 0.0 | 0.0 | |||
Displ. Wash | 50.3 | 128 | 1.28 | 0.7 | 0.1 | 0.0 | 0.0 | 0.0 | |||
| Residue | 1.499 | 50.9 | 2.96 | 1.52 | 0.081 | 0.45 | 79.6 | 95.0 | 99.4 | 99.0 | 1.0 |
| Total | 100.0 | 100.0 | 100.0 | 100.0 | 100.0 | ||||||
| Campaign C2 | |||||||||||
| Feed (Bulk Fe/Al-C1) | 100.0 | 8760 | 354 | 270 | 0.8 | 4100 | - | - | - | - | - |
| Primary Filtrate | 93.3 | 1980 | 37.4 | 2 | <0.2 | 7600 | 21.7 | 8.7 | 0.7 | 3.3 | 98.7 |
| Repulp Wash 1 | 62.4 | 207 | 3.23 | 1.5 | 0.5 | 0.0 | 0.0 | 0.0 | |||
| Repulp Wash 2 | 59.9 | 115 | 1.6 | 0.8 | 0.2 | 0.0 | 0.0 | 0.0 | |||
Displ. Wash | 45.4 | 76.4 | 1.34 | 0.4 | 0.2 | 0.0 | 0.0 | 0.0 | |||
| Residue | 1.3 | 50.5 | 2.86 | 2.11 | 0.043 | 0.73 | 75.5 | 90.4 | 99.3 | 96.7 | 1.3 |
| Total | 100.0 | 100.0 | 100.0 | 100.0 | 100.0 | ||||||
For Stage 2, an initial dosage of 1211 g of 20% (w/w) Ca(OH)2 was estimated to precipitate the remainder of the Ni to below the 10 mg/L for C1 and 1361 g was estimated for C2 in Stage 2. Actual cumulative 20% (w/w) Ca(OH)2 additions in Stage 2 to precipitate Ni to at (or below) the 10 mg/L target concentration were within 20% and 10% for C1 and C2, respectively. Hydrated lime consumption to achieve a solution pH upwards of 7.5 ranged from 3.2 to 4.5 kg per m3 Stage 1 filtrate tested. The composition of the precipitate produced in Stage 2 ranged from 20.8% to 21.9% Ni and 0.29% to 0.38% Co. Mg co-precipitation was low (data not shown).
| M3-PN150164 26 March 2018 |
97
NorthMet Project
Form NI 43-101F1 Technical Report
| 13.6.7 | Magnesium Removal |
Bulk magnesium removal was carried out on Stage 2 MHP filtrates including the repulped filtrate. Test conditions for filtrates from both Campaigns (C1 & C2) in agitated heated tanks, are presented in Table 13‑23.
Table 13‑23: Test Conditions for Bulk Magnesium Removal
| Campaign | C1 | C2 |
| Feed Source | Stage 2 MHP filtrate | |
| Feed Volume (L) | 66.7 | 87.9 |
| Reagent | Ca(OH)2 | Ca(OH)2 |
| Reagent Pulp Density % (w/w) | 20 | 20 |
| Target initial pH | 8.0 | 8.0 |
| Estimated Reagent Addition (g) | 6220 | 6787 |
| Cumulative Reagent Addition (g) | 6257 | 6811 |
| Target Temp. °C | 50 | 50 |
| Target Mg precipitation | 50% | 50% |
The amount of hydrated 20% slurry w/w lime required to precipitate 50% of the Mg was calculated based stoichiometrically on the Mg assay obtained for the Stage 2 MHP filtrate. Test results for Mg assay in Stage 2 MHP filtrate for C1 decreased 59% from 9.3 g/L to 4.3 g/L at pH 8.6 and decreased 60% for C2 from 7.7 to 4 g/L at pH 8.3.
| M3-PN150164 26 March 2018 |
98
NorthMet Project
Form NI 43-101F1 Technical Report
| 14 | MINERAL RESOURCE ESTIMATES |
| 14.1 | Data |
Zachary J. Black, RM-SME, of HRC is responsible for the resource estimate presented here. Mr. Black is a qualified person as defined by NI 43-101 and is independent of PolyMet. HRC estimated the mineral resource for the NorthMet polymetallic Project from drill-hole data constrained by geologic boundaries with an Ordinary Kriging (“OK”) algorithm. Datamine Studio 3® software was used in combination with Sage 2001 for the variography and Leapfrog Geo® for the geologic model. The metals of interest at NorthMet are copper, nickel, cobalt, platinum, palladium, gold, silver, and sulfur.
The mineral resources reported in this technical report have been classified as Measured, Indicated and Inferred in accordance with standards defined by the Canadian Institute of Mining, Metallurgy and Petroleum (“CIM”) “CIM Definition Standards - For Mineral Resources and Mineral Reserves,” prepared by the CIM Standing Committee on Reserve Definitions and adopted by the CIM Council in May 2014. Each individual mineral resource classification reflects an associated relative confidence of the grade estimates.
| 14.2 | Block Model Physical Limits |
HRC created a rotated three-dimensional (“3D”) block model in Datamine Studio 3® mining software. The block model was created with individual block dimensions of 50x50x50 feet (xyz) rotated 33.94° west of north. The model origin is located at 727,575 northing, 2,896,310 easting, and at an elevation of 1,200 ft below sea level. The block model extends 22,500 ft (450 blocks) in the easting direction, 10,000 ft (200 blocks) in the northing direction, and vertically 3,000 ft (60 blocks) to an elevation of 1,800 ft asl. All of the block model coordinates are stored as UTM WGS 84, Zone 12 meters. All property and minerals within the block model extents are owned or claimed by PolyMet.
| 14.3 | Geological Models |
The NorthMet Project geology is divided into 3 formations consisting of the Biwabik Iron Formation (“BIF”), the Virginia Formation and the Duluth Complex. The Duluth Complex is comprised of 7 main lithological units (1 through 7) and is the primary host of mineralization. HRC used Leapfrog Geo to model the stratigraphic sequence (bottom to top) consisting of the BIF, Virginia Formation, Unit 1, Unit 2 (Units 2 and 3 combined), Unit 4 (Units 4 and 5 combined), Unit 6, Unit 7, and overburden. The Magenta Zone, a smaller mineralized zone that cuts through Units 3 through 7 but resides primarily within 5 and 6, was modeled from select intercepts provided by PolyMet. Figure 14‑1 depicts a typical easterly facing geologic cross-section from the geologic model with the Magenta Zone highlighted.
| M3-PN150164 26 March 2018 |
99
NorthMet Project
Form NI 43-101F1 Technical Report
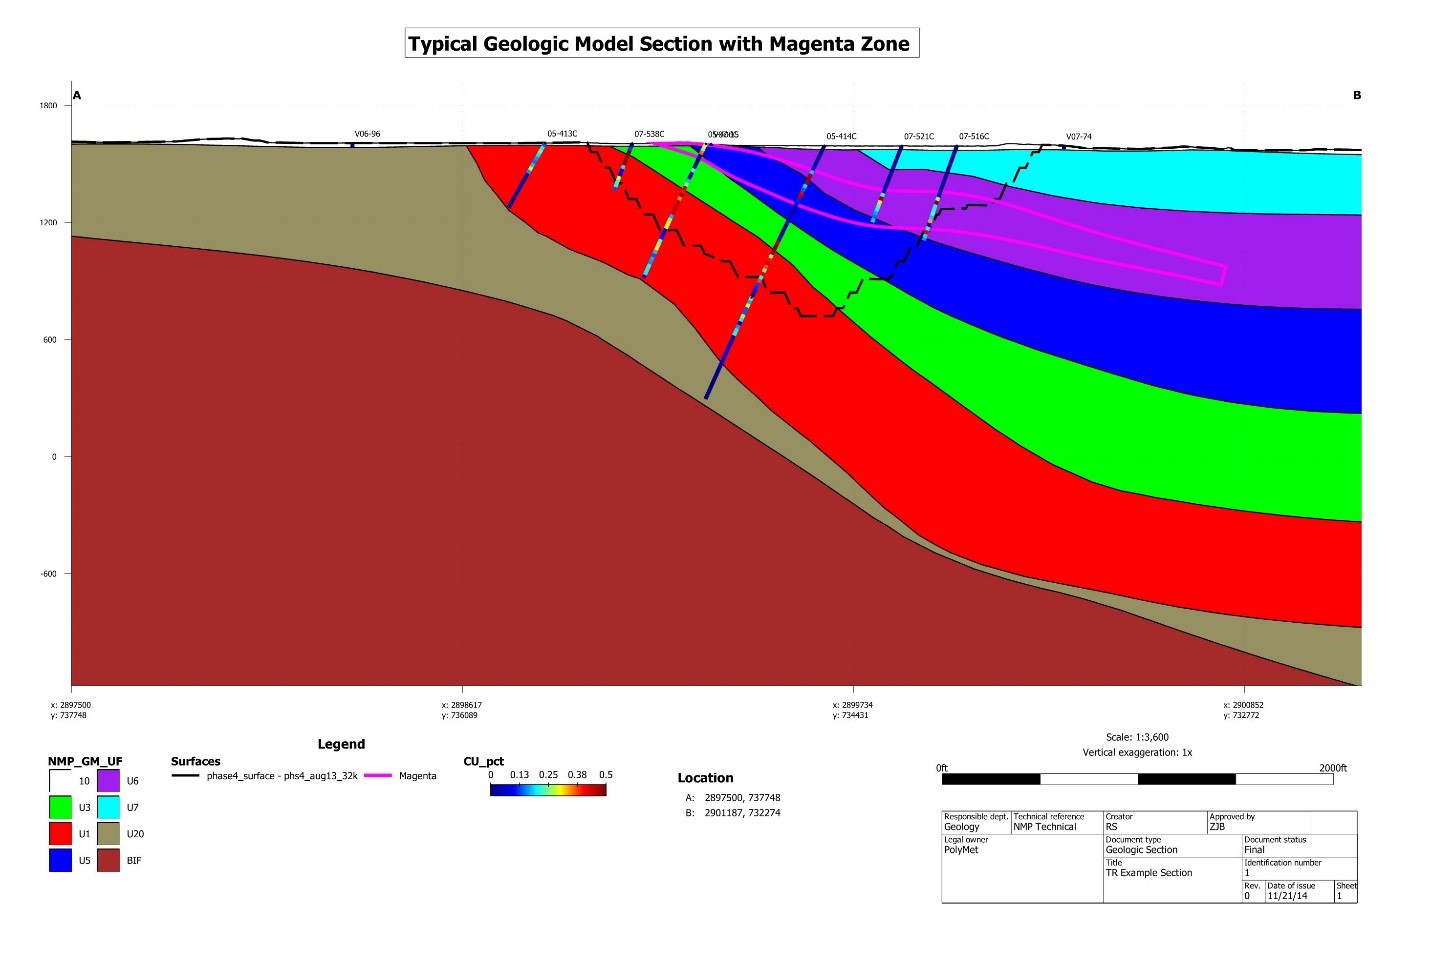
Figure 14‑1: Estimation Domains
| M3-PN150164 26 March 2018 |
100
NorthMet Project
Form NI 43-101F1 Technical Report
| 14.3.1 | Density |
A total of 6,975 density measurements have been made on core to date using a variety of methods. Typically, measurements have been completed on core samples that have not been oven dried or sealed. This can result in an overstatement in density due the inclusion of water that would typically be dried out in the oven; although the difference is expected to be less than 1%.
HRC considers that the densities presented in Table 14‑1, including the average specific gravity determinations sorted by unit (October 2007 dataset), are appropriate for use in estimation.
Table 14‑1: Specific Gravity Average per Unit (October 15 Dataset)
| Unit | Mean | Count |
| 1 | 2.98 | 2,381 |
| 3 (2+3) | 2.92 | 1,818 |
| 5 (4+5) | 2.90 | 1,266 |
| 6 | 2.90 | 902 |
| 7 | 2.92 | 326 |
| 20 | 2.77 | 273 |
| 30 | 3.17 | 9 |
| All Units | 2.93 | 6,975 |
| 14.4 | Exploratory Data Analysis |
HRC completed an Exploratory Data Analysis (“EDA”) on the copper, nickel, platinum, palladium, gold, silver, cobalt, and sulfur analytical information contained in the NorthMet exploration database. The purpose of an EDA is to summarize the main characteristics of the data provided using both statistical and visual methods. HRC utilized Leapfrog Geo (“Geo”) and ioGas Software to analyze the assay data.
| 14.4.1 | Sample Statistics |
A statistical analysis of each metal within each unit and the Magenta Zone was completed. Descriptive statistics by metal and domain are presented in Table 14‑2 through Table 14‑9.
Table 14‑2: Copper Sample Statistics
| Copper Sample Descriptive Statistics | |||||||
| Unit | Number | Minimum | Maximum | Mean | Median | Std. Dev. | COV |
| % | % | % | % | % | |||
| 1 | 22,050 | 0.001 | 4.89 | 0.21 | 0.13 | 0.23 | 1.08 |
| 3 | 9,269 | 0.001 | 4.17 | 0.07 | 0.02 | 0.15 | 2.12 |
| 5 | 3,968 | 0.001 | 1.96 | 0.11 | 0.03 | 0.17 | 1.56 |
| 6 | 2,016 | 0.001 | 2.13 | 0.13 | 0.03 | 0.2 | 1.55 |
| 7 | 573 | 0.001 | 1.21 | 0.03 | 0.02 | 0.08 | 2.57 |
| 20 | 1,342 | 0.001 | 1.50 | 0.06 | 0.02 | 0.13 | 2.24 |
| 30 | 4 | 0.001 | 0.013 | 0.01 | 0.01 | 0.01 | 0.88 |
| 2000 | 2,352 | 0.001 | 2.13 | 0.24 | 0.17 | 0.23 | 0.96 |
| M3-PN150164 26 March 2018 |
101
NorthMet Project
Form NI 43-101F1 Technical Report
Table 14‑3:Nickel Sample Statistics
| Nickel Sample Descriptive Statistics | |||||||
| Unit | Number | Minimum | Maximum | Mean | Median | Std. Dev. | COV |
| % | % | % | % | % | |||
| 1 | 22,050 | 0.001 | 1.170 | 0.07 | 0.05 | 0.06 | 0.86 |
| 3 | 9,269 | 0.001 | 0.460 | 0.03 | 0.03 | 0.03 | 0.93 |
| 5 | 3,968 | 0.001 | 2.359 | 0.04 | 0.03 | 0.05 | 1.25 |
| 6 | 2,016 | 0.001 | 0.294 | 0.05 | 0.04 | 0.03 | 0.7 |
| 7 | 573 | 0.011 | 0.183 | 0.04 | 0.03 | 0.02 | 0.58 |
| 20 | 1,342 | 0.001 | 0.462 | 0.02 | 0.01 | 0.04 | 1.56 |
| 30 | 4 | 0.002 | 0.012 | 0.01 | 0.01 | 0.01 | 0.75 |
| 2000 | 2,352 | 0.001 | 0.410 | 0.07 | 0.05 | 0.04 | 0.63 |
Table 14‑4: Platinum Sample Statistics
| Platinum Sample Descriptive Statistics | |||||||
| Unit | Number | Minimum | Maximum | Mean | Median | Std. Dev. | COV |
| ppb | ppb | ppb | ppb | ppb | |||
| 1 | 22,050 | 0.5 | 1535 | 45.71 | 20 | 65.87 | 1.44 |
| 3 | 9,269 | 0.5 | 4780 | 25.77 | 7 | 70.52 | 2.74 |
| 5 | 3,968 | 2.5 | 638 | 41.3 | 11 | 69.9 | 1.69 |
| 6 | 2,016 | 2.5 | 1430 | 57.63 | 19 | 105.97 | 1.84 |
| 7 | 573 | 2.5 | 1430 | 20.38 | 7 | 71.44 | 3.5 |
| 20 | 1,342 | 0.5 | 305 | 9.70 | 2.5 | 21.86 | 2.26 |
| 30 | 4 | 2.5 | 6 | 3.38 | 2.5 | 1.75 | 0.52 |
| 2000 | 2,351 | 2.5 | 1390 | 95.63 | 60 | 106.05 | 1.11 |
Table 14‑5: Palladium Sample Statistics
| Palladium Sample Descriptive Statistics | |||||||
| Unit | Number | Minimum | Maximum | Mean | Median | Std. Dev. | COV |
| ppb | ppb | ppb | ppb | ppb | |||
| 1 | 22,050 | 0.5 | 10386 | 175.12 | 72 | 263.18 | 1.5 |
| 3 | 9,269 | 0.5 | 6610 | 78.67 | 14 | 211.44 | 2.69 |
| 5 | 3,968 | 0.5 | 2690 | 106.02 | 18 | 205.89 | 1.94 |
| 6 | 2,016 | 0.5 | 3680 | 144.38 | 35 | 286.79 | 1.99 |
| 7 | 573 | 0.5 | 2860 | 36.60 | 9 | 147.23 | 4.02 |
| 20 | 1,342 | 0.5 | 2453 | 30.90 | 4 | 102.6 | 3.32 |
| 30 | 4 | 0.5 | 5 | 2.13 | 1.5 | 2.02 | 0.95 |
| 2000 | 2,351 | 0.5 | 3540 | 254.86 | 149 | 299.19 | 1.17 |
Table 14‑6: Gold Sample Statistics
| Gold Sample Descriptive Statistics | |||||||
| Unit | Number | Minimum | Maximum | Mean | Median | Std. Dev. | COV |
| ppb | ppb | ppb | ppb | ppb | |||
| 1 | 22,050 | 0.5 | 1926 | 24.12 | 12 | 43.06 | 1.79 |
| 3 | 9,269 | 0.5 | 3150 | 14.11 | 4 | 47.94 | 3.4 |
| 5 | 3,968 | 0.5 | 760 | 20.21 | 6 | 36.14 | 1.79 |
| 6 | 2,016 | 0.5 | 545 | 24.13 | 8 | 41.49 | 1.72 |
| 7 | 573 | 0.5 | 388 | 8.05 | 3 | 25.1 | 3.12 |
| 20 | 1,342 | 0.5 | 188 | 6.28 | 3 | 11.42 | 1.82 |
| 30 | 4 | 0.5 | 3 | 1.25 | 0.75 | 1.19 | 0.95 |
| 2000 | 2,351 | 0.5 | 3150 | 44.85 | 28 | 80.07 | 1.79 |
| M3-PN150164 26 March 2018 |
102
NorthMet Project
Form NI 43-101F1 Technical Report
Table 14‑7: Silver Sample Statistics
| Silver Sample Descriptive Statistics | |||||||
| Unit | Number | Minimum | Maximum | Mean | Median | Std. Dev. | COV |
| ppm | ppm | ppm | ppm | ppm | |||
| 1 | 22,050 | 0.05 | 50.5 | 0.79 | 0.5 | 0.97 | 1.23 |
| 3 | 9,269 | 0.05 | 15.6 | 0.35 | 0.25 | 0.54 | 1.53 |
| 5 | 3,968 | 0.05 | 11.1 | 0.51 | 0.25 | 0.62 | 1.24 |
| 6 | 2,016 | 0.05 | 12.1 | 0.57 | 0.25 | 0.74 | 1.31 |
| 7 | 573 | 0.1 | 4.5 | 0.3 | 0.25 | 0.29 | 0.95 |
| 20 | 1,342 | 0.1 | 3.9 | 0.45 | 0.25 | 0.47 | 1.04 |
| 30 | 4 | 0.25 | 0.7 | 0.43 | 0.38 | 0.22 | 0.51 |
| 2000 | 2,351 | 0.05 | 12.1 | 0.86 | 0.5 | 0.90 | 1.06 |
Table 14‑8:Cobalt Sample Statistics
| Cobalt Sample Descriptive Statistics | |||||||
| Unit | Number | Minimum | Maximum | Mean | Median | Std. Dev. | COV |
| ppm | ppm | ppm | ppm | ppm | |||
| 1 | 22,050 | 2 | 713 | 68.13 | 62 | 31.34 | 0.46 |
| 3 | 9,269 | 1 | 361 | 53.6 | 48 | 22 | 0.41 |
| 5 | 3,968 | 0.5 | 421 | 54.72 | 49 | 18.54 | 0.34 |
| 6 | 2,016 | 1 | 491 | 65.25 | 62 | 20.42 | 0.31 |
| 7 | 573 | 21 | 160 | 70.66 | 61 | 29.45 | 0.42 |
| 20 | 1,342 | 2 | 385 | 35.31 | 26 | 30.65 | 0.87 |
| 30 | 4 | 4 | 23 | 12.75 | 12 | 9.67 | 0.76 |
| 2000 | 2,351 | 1 | 232 | 66.00 | 64 | 19.04 | 0.29 |
Table 14‑9: Sulfur Sample Statistics
| Sulfur Sample Descriptive Statistics | |||||||
| Unit | Number | Minimum | Maximum | Mean | Median | Std. Dev. | COV |
| % | % | % | % | % | |||
| 1 | 22,050 | 0.01 | 26.1 | 0.63 | 0.4 | 0.81 | 1.29 |
| 3 | 9,269 | 0.01 | 10.8 | 0.19 | 0.05 | 0.5 | 2.58 |
| 5 | 3,968 | 0.01 | 12.22 | 0.24 | 0.07 | 0.43 | 1.81 |
| 6 | 2,016 | 0.01 | 3.62 | 0.20 | 0.05 | 0.31 | 1.56 |
| 7 | 573 | 0.01 | 2.67 | 0.06 | 0.03 | 0.17 | 2.75 |
| 20 | 1,342 | 0.01 | 10.75 | 1.62 | 0.89 | 1.62 | 1 |
| 30 | 4 | 0.24 | 2.29 | 0.75 | 0.24 | 1.02 | 1.36 |
| 2000 | 2,352 | 0.01 | 4.41 | 0.39 | 0.29 | 0.38 | 0.98 |
| M3-PN150164 26 March 2018 |
103
NorthMet Project
Form NI 43-101F1 Technical Report
| 14.4.2 | Correlation Analysis |
HRC completed a correlation analysis on each metal within each unit (restricted to the Duluth complex). The correlation matrix shown in Table 14‑10, created using the nonparametric Spearman Rank method, identifies a good overall correlation between the metals, particularly copper. The overall correlation between copper and the other metals is relatively consistent, as illustrated in Figure 14‑2.
Table 14‑10: Spearman Rank Correlation Matrix
| Correlation | Cu (%) | Ni (%) | Pt (ppb) | Pd (ppb) | Au (ppb) | Ag (ppm) | Co (ppm) | S (%) |
| Cu (%) | 1 | 0.85 | 0.78 | 0.86 | 0.86 | 0.76 | 0.62 | 0.86 |
| Ni (%) | 0.85 | 1 | 0.75 | 0.81 | 0.77 | 0.74 | 0.83 | 0.67 |
| Pt (ppb) | 0.78 | 0.75 | 1 | 0.9 | 0.84 | 0.67 | 0.52 | 0.59 |
| Pd (ppb) | 0.86 | 0.81 | 0.9 | 1 | 0.88 | 0.67 | 0.55 | 0.67 |
| Au (ppb) | 0.86 | 0.77 | 0.84 | 0.88 | 1 | 0.71 | 0.53 | 0.72 |
| Ag (ppm) | 0.76 | 0.74 | 0.67 | 0.67 | 0.71 | 1 | 0.56 | 0.67 |
| Co (ppm) | 0.62 | 0.83 | 0.52 | 0.55 | 0.53 | 0.56 | 1 | 0.51 |
| S (%) | 0.86 | 0.67 | 0.59 | 0.67 | 0.72 | 0.67 | 0.51 | 1 |
| M3-PN150164 26 March 2018 |
104
NorthMet Project
Form NI 43-101F1 Technical Report
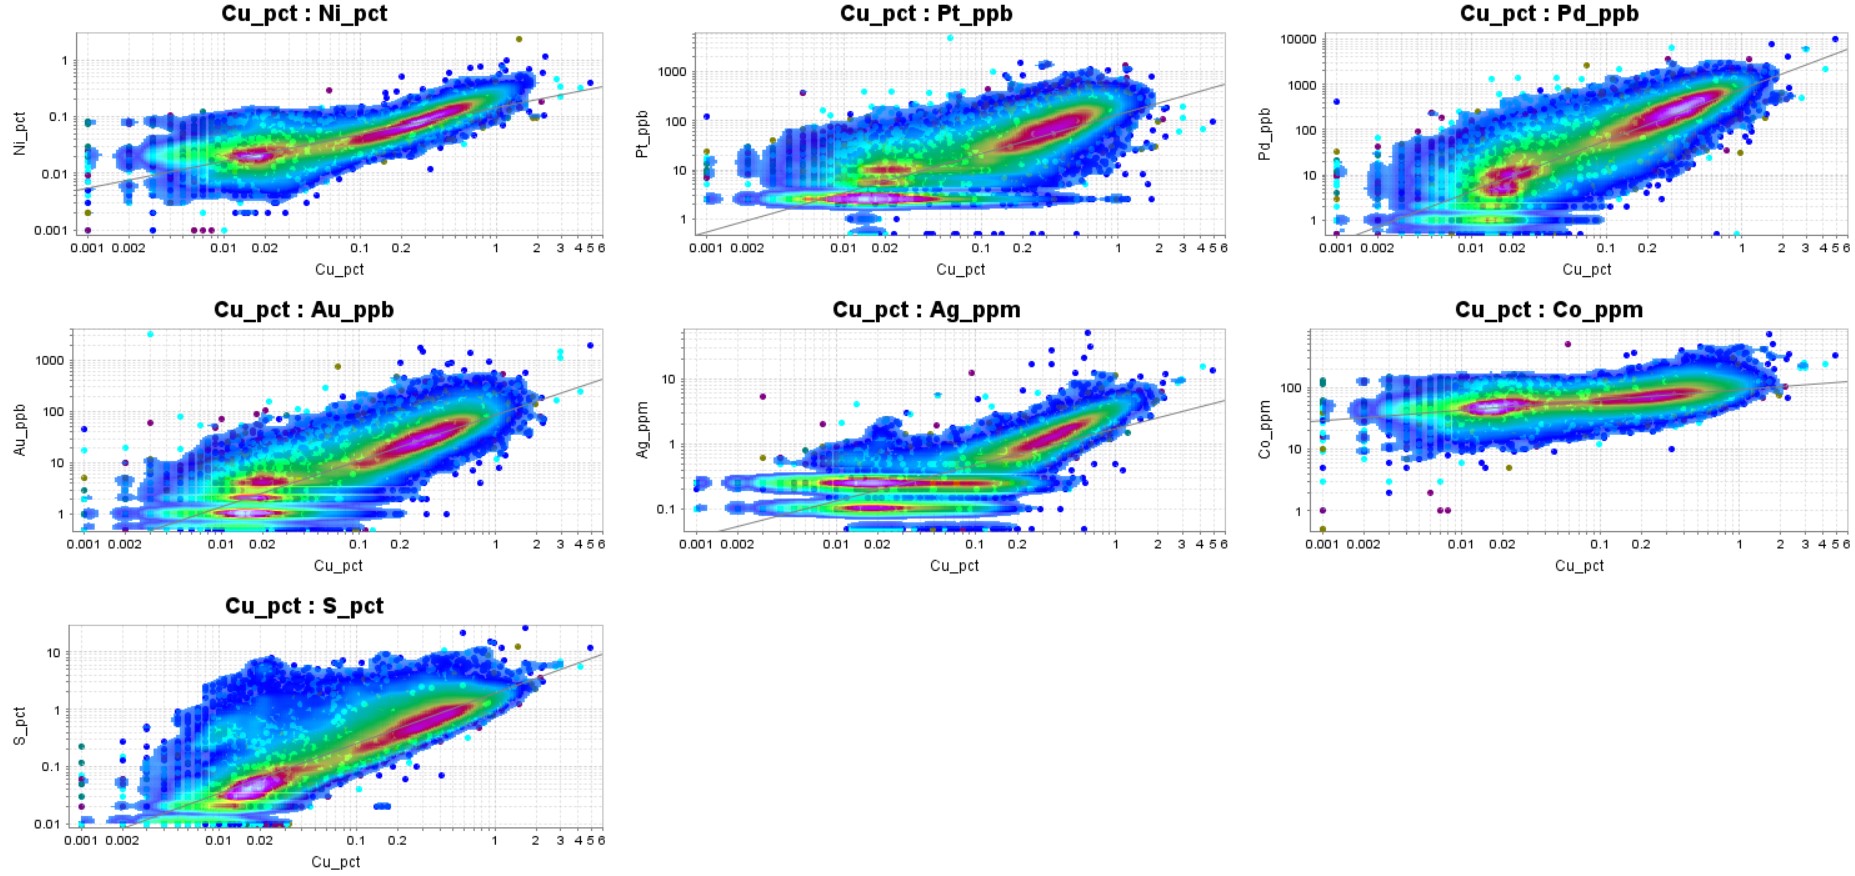
Figure 14‑2: Copper Correlation Plots
| M3-PN150164 26 March 2018 |
105
NorthMet Project
Form NI 43-101F1 Technical Report
| 14.4.3 | Contact Plot Analysis |
HRC examined the relationship of mineralization across the contacts of each unit model. This examination was completed on copper only, assuming that the other metals would behave in a similar manner due to the higher correlation coefficients.
Contact plots are created by averaging the grade of copper over a set distance from the modeled lithologic boundary. The plotted results assist in understanding the relationship of grades as they approach and cross geologic boundaries. This relationship is used in determining whether these boundaries are treated as hard or soft boundaries during the estimation process.
The contact between the Virginia Formation and the base of Unit 1 forms a hard boundary with the mineralized material residing within Unit 1, as shown in Figure 14‑3.
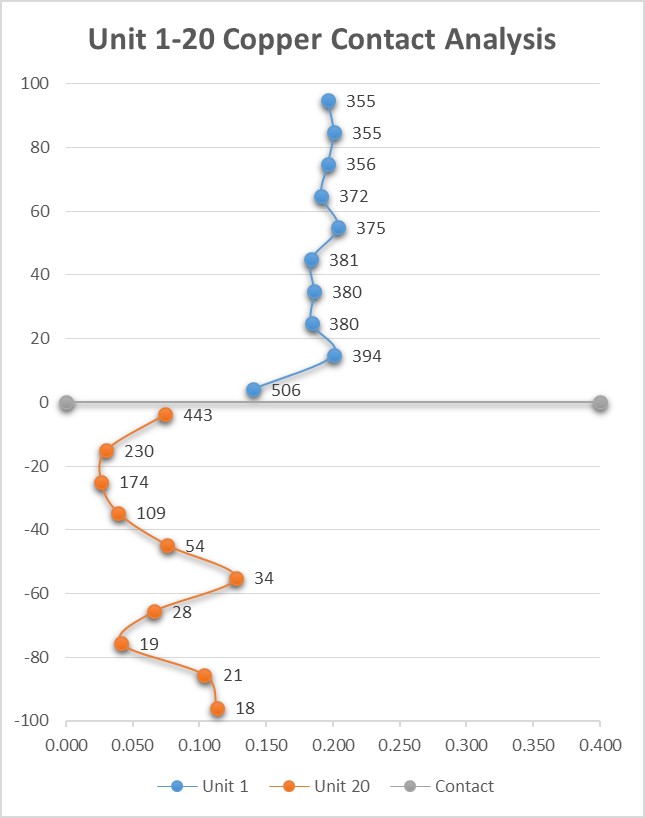
Figure 14‑3: Contact Plot Virginia Formation and Unit 1
| M3-PN150164 26 March 2018 |
106
NorthMet Project
Form NI 43-101F1 Technical Report
The contact between Unit 1 and Unit 3 is a hard boundary with higher grades found within Unit 1 trending along the contact. A decrease in average grade across the boundary into Unit 2 suggests two different sample populations in Units 1 and 3. See Figure 14‑4.
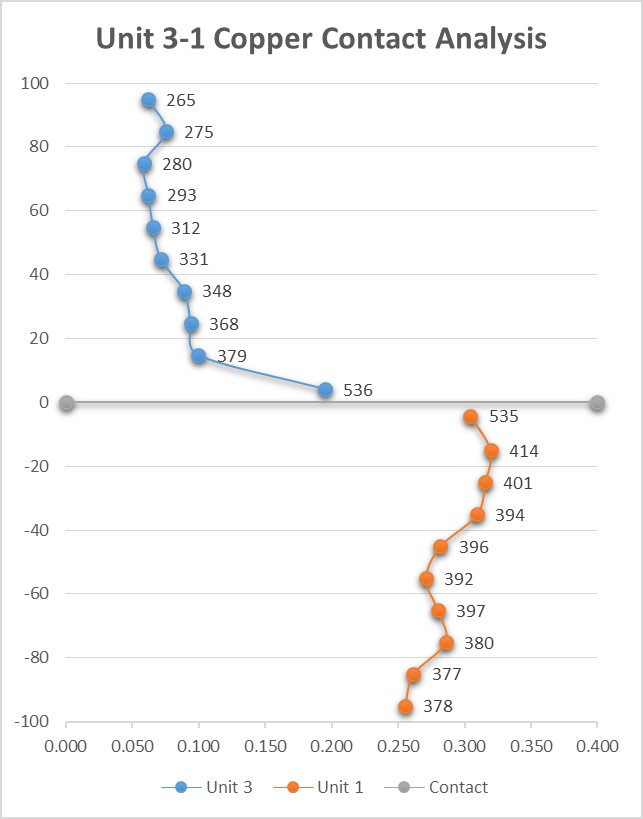
Figure 14‑4: Contact Plot Unit 1 and Unit 3
| M3-PN150164 26 March 2018 |
107
NorthMet Project
Form NI 43-101F1 Technical Report
Figure 14‑5 shows the contact between Units 3 and 5 is mineralized, and grading into lower grade material away from the contact.
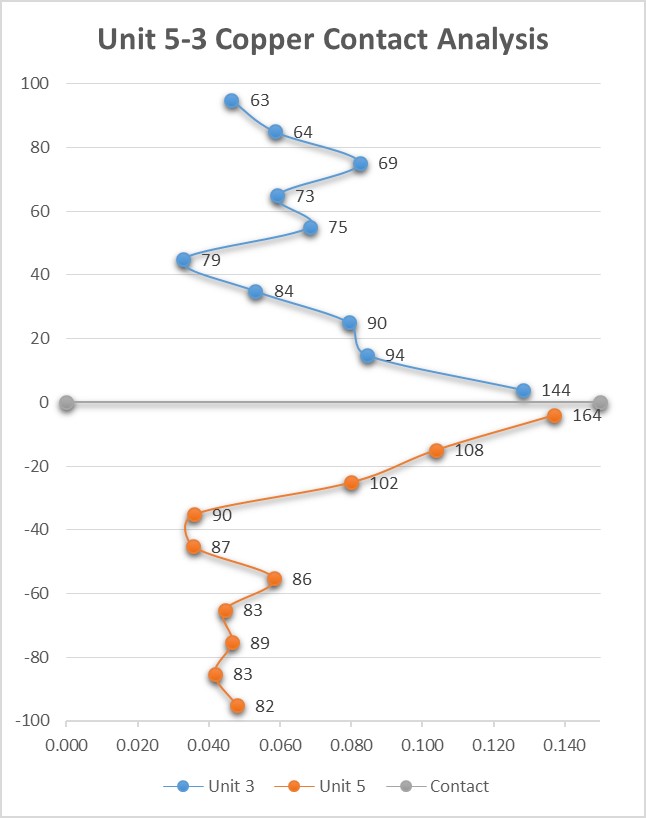
Figure 14‑5: Contact Plot Unit 3 and Unit 5
| M3-PN150164 26 March 2018 |
108
NorthMet Project
Form NI 43-101F1 Technical Report
The contact between Unit 5 and Unit 6 is gradational with a slight increase of grade in Unit 6. See Figure 14‑6.
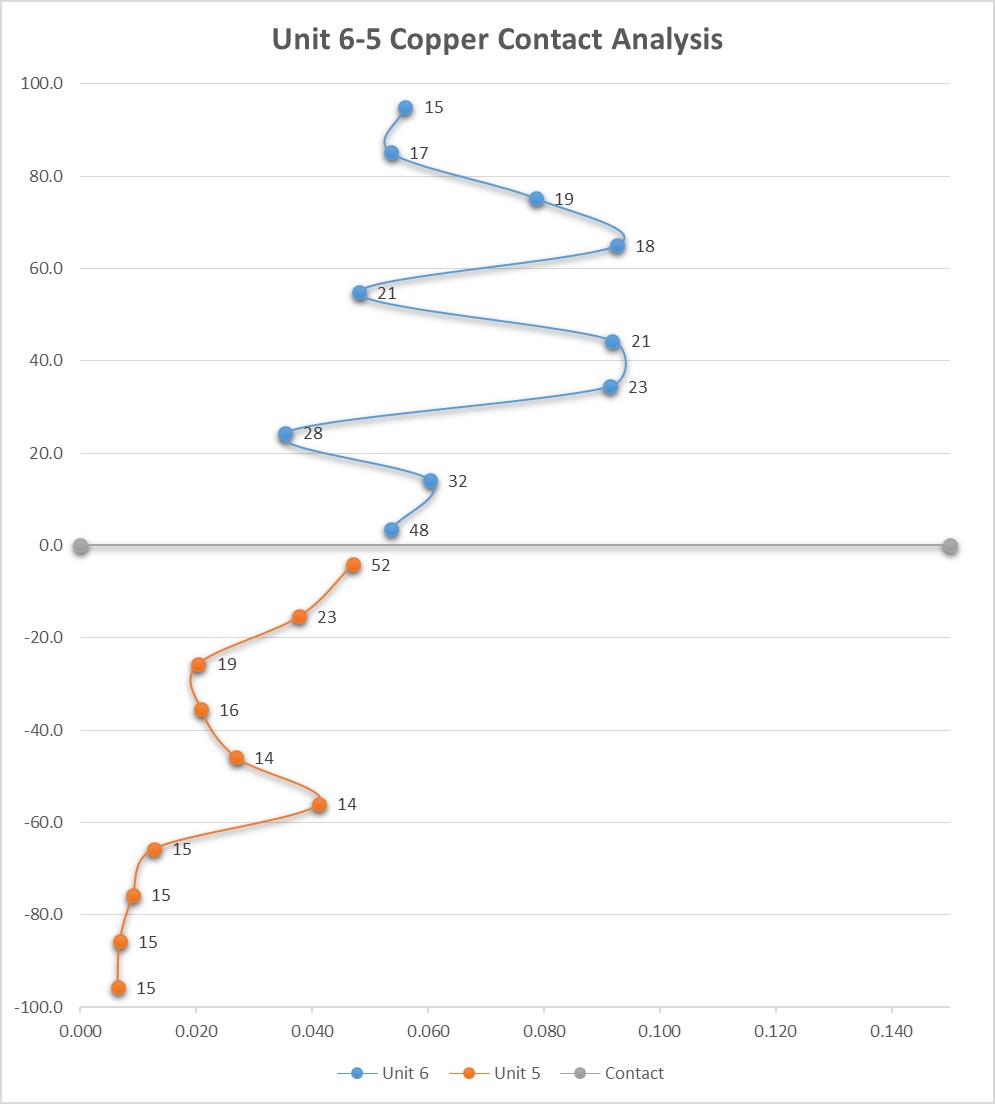
Figure 14‑6: Contact Plot Unit 5 and Unit 6
| M3-PN150164 26 March 2018 |
109
NorthMet Project
Form NI 43-101F1 Technical Report
Figure 14‑7 shows that the copper grades across the contact between Unit 6 and Unit 7 are relatively similar. An increase in grade is visible in Unit 6 as the distance from the contact increases.
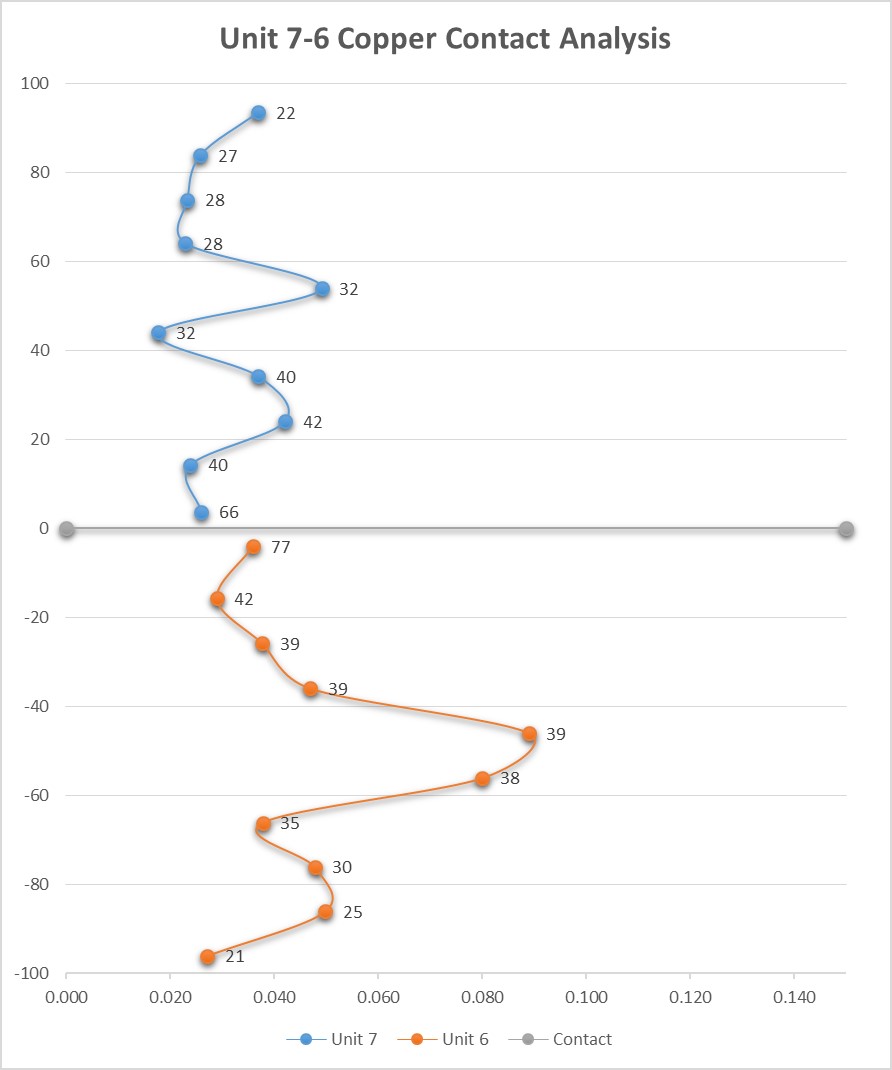
Figure 14‑7: Contact Plot Unit 6 and Unit 7
| 14.5 | Estimation Methodology |
The block model was estimated using the lithologic boundaries of the Duluth Complex as the basis for an estimation domain. Units 1, 3, 5, 6, 7, the Magenta Zone, and Virginia Formation were all estimated using only samples that resided inside of the defined boundaries. See Figure 14‑1. This was done to prevent the smearing of higher grades from the assayed mineralized zones into areas of limited mineralization that were not assayed in the older U.S. Steel drilling campaigns.
| 14.5.1 | Capping |
Grade capping assigns statistically high outliers a maximum value in order to arrive at a better estimate of the true mean for the metal being estimated. The cap values were determined by examining Tukey Box Plots (Supplemental Information, 2018) and the sample distribution on log scale cumulative frequency plots (“CFP”) of the assay data.
| M3-PN150164 26 March 2018 |
110
NorthMet Project
Form NI 43-101F1 Technical Report
Tukey Box Plots divide the ordered values of the data into four equal parts by defining Inter Quartile Range (“IQR”); the median, and 25th and 75th percentiles. The median is defined by a horizontal line within a box that spans the IQR and contains approximately 50% of the data. The mean is represented by a large black circle. The fence is defined here as the central box (IQR) extended by 1.5 times the length of the box towards the maximum and the minimum. The upper and lower whiskers are then drawn from each end of the box to the fence position. Figure 14‑8 is an example of a Tukey Box plot of Unit 1.
| M3-PN150164 26 March 2018 |
111
NorthMet Project
Form NI 43-101F1 Technical Report
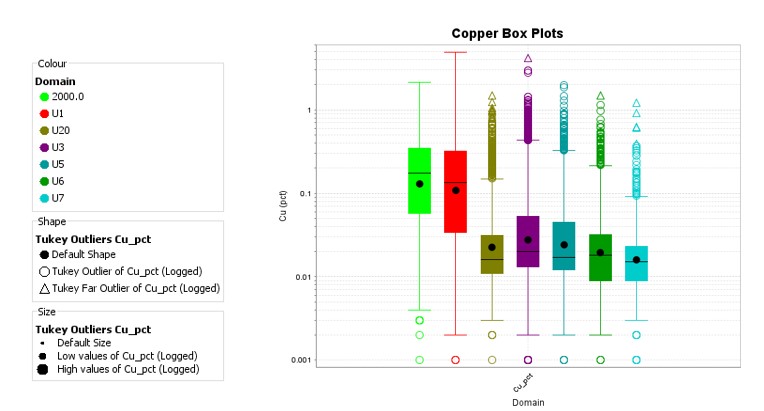
Figure 14‑8: Tukey Box Plots for Unit 1
| M3-PN150164 26 March 2018 |
112
NorthMet Project
Form NI 43-101F1 Technical Report
Samples outside of the fence are assumed to be Outliers and those that are three times the central box length from the upper or lower quartile boundaries are considered highly anomalous and are called Far Outliers. Table 14‑11 summarizes the capping values established for metals within each domain.
Table 14‑11: Summary of Capped Values for Each Metal
| Domain | Cu (%) | Ni (%) | Pt (ppb) | Pd (ppb) | Au (ppb) | Ag (ppm) | Co (ppm) | S (%) |
| 1 | 2.5 | --- | --- | 2250 | --- | --- | 330 | --- |
| 3 | 1.8 | 0.4 | 700 | 2500 | 500 | 3.9 | 150 | 8 |
| 5 | 1.6 | 0.15 | 600 | --- | --- | 3.3 | 130 | 4.6 |
| 6 | 1.6 | 0.15 | 600 | --- | --- | 3.3 | 130 | 4.6 |
| 7 | 0.4 | 0.14 | 251 | 305 | 160 | 2.8 | --- | --- |
| 20 | 0.7 | 0.17 | 82 | 400 | --- | --- | 160 | 8.8 |
| 2000 | --- | 0.3 | 900 | --- | 600 | 8 | 148 | --- |
| 14.5.2 | Composite Study |
HRC completed a composite study comparing the population variance and average grades, see Figure 14‑9. A composite length of 10-ft down-hole was selected for estimation as it is larger in length than the longest sample intervals; long enough to provide a variance reduction relative to using raw assay data, and still short enough to allow the estimate to show local variability of grade consistent with the sample distribution of the deposit. The composite statistics are summarized in Table 14‑12 through Table 14‑19.
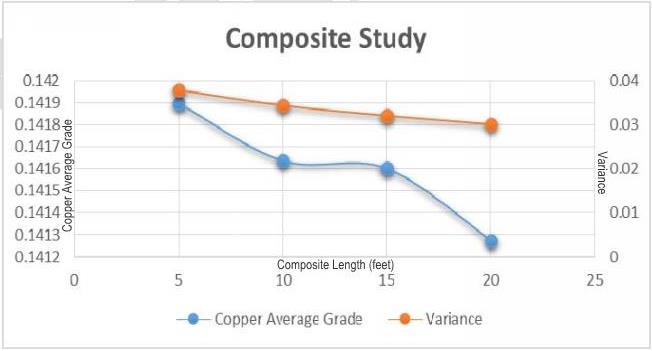
Figure 14‑9: Copper Composite Study
| M3-PN150164 26 March 2018 |
113
NorthMet Project
Form NI 43-101F1 Technical Report
Table 14‑12: Copper Capped Composite Descriptive Statistics
| Copper Capped and Composited Descriptive Statistics | ||||||
| Domain | Number | Minimum | Maximum | Mean | Std. Dev. | COV |
| % | % | % | % | |||
| 1 | 12,135 | 0.00 | 1.57 | 0.22 | 0.21 | 0.96 |
| 3 | 6,275 | 0.00 | 1.62 | 0.06 | 0.09 | 1.69 |
| 5 | 2,248 | 0.00 | 1.16 | 0.04 | 0.08 | 1.80 |
| 6 | 885 | 0.00 | 1.44 | 0.04 | 0.09 | 2.29 |
| 7 | 500 | 0.00 | 0.33 | 0.03 | 0.04 | 1.49 |
| 20 | 877 | 0.00 | 0.70 | 0.04 | 0.08 | 2.08 |
| 2000 | 1,349 | 0.00 | 1.46 | 0.22 | 0.20 | 0.89 |
Table 14‑13: Nickel Capped Composite Descriptive Statistics
| Nickel Capped and Composited Descriptive Statistics | ||||||
| Domain | Number | Minimum | Maximum | Mean | Std. Dev. | COV |
| % | % | % | % | |||
| 1 | 12,135 | 0.00 | 0.63 | 0.07 | 0.05 | 0.75 |
| 3 | 6,275 | 0.00 | 0.26 | 0.03 | 0.02 | 0.76 |
| 5 | 2,248 | 0.00 | 0.15 | 0.03 | 0.01 | 0.55 |
| 6 | 885 | 0.00 | 0.15 | 0.03 | 0.01 | 0.41 |
| 7 | 500 | 0.01 | 0.13 | 0.04 | 0.02 | 0.54 |
| 20 | 877 | 0.00 | 0.17 | 0.02 | 0.02 | 1.25 |
| 2000 | 1,349 | 0.00 | 0.22 | 0.06 | 0.03 | 0.55 |
Table 14‑14: Platinum Capped Composite Descriptive Statistics
| Platinum Capped and Composited Descriptive Statistics | ||||||
| Domain | Number | Minimum | Maximum | Mean | Std. Dev. | COV |
| ppb | ppb | ppb | ppb | |||
| 1 | 12,135 | 0.0 | 876.1 | 47.2 | 59.8 | 1.3 |
| 3 | 6,275 | 0.0 | 479.3 | 21.1 | 34.4 | 1.6 |
| 5 | 2,248 | 0.0 | 525.0 | 14.8 | 28.4 | 1.9 |
| 6 | 885 | 0.0 | 537.6 | 20.8 | 45.1 | 2.2 |
| 7 | 500 | 0.0 | 248.6 | 16.1 | 27.7 | 1.7 |
| 20 | 877 | 0.0 | 82.0 | 6.5 | 11.3 | 1.7 |
| 2000 | 1,349 | 2.5 | 595.5 | 89.3 | 86.1 | 1.0 |
Table 14‑15: Palladium Capped Composite Descriptive Statistics
| Palladium Capped and Composited Descriptive Statistics | ||||||
| Domain | Number | Minimum | Maximum | Mean | Std. Dev. | COV |
| ppb | ppb | ppb | ppb | |||
| 1 | 12,135 | 0.0 | 2250.0 | 178.5 | 230.7 | 1.3 |
| 3 | 6,275 | 0.0 | 2228.3 | 61.7 | 125.5 | 2.0 |
| 5 | 2,248 | 0.0 | 1568.0 | 30.0 | 83.8 | 2.8 |
| 6 | 885 | 0.0 | 2683.7 | 50.7 | 171.7 | 3.4 |
| 7 | 500 | 0.0 | 305.0 | 24.7 | 42.5 | 1.7 |
| 20 | 877 | 0.0 | 395.4 | 18.7 | 49.9 | 2.7 |
| 2000 | 1,349 | 0.5 | 1964.4 | 236.6 | 247.7 | 1.0 |
| M3-PN150164 26 March 2018 |
114
NorthMet Project
Form NI 43-101F1 Technical Report
Table 14‑16: Gold Capped Composite Descriptive Statistics
| Gold Capped and Composited Descriptive Statistics | ||||||
| Domain | Number | Minimum | Maximum | Mean | Std. Dev. | COV |
| ppb | ppb | ppb | ppb | |||
| 1 | 12,135 | 0.0 | 916.0 | 25.0 | 35.0 | 1.4 |
| 3 | 2,248 | 0.0 | 381.4 | 7.6 | 16.5 | 2.2 |
| 5 | 2,240 | 0.5 | 381.4 | 7.6 | 16.5 | 2.2 |
| 6 | 885 | 0.0 | 292.9 | 8.6 | 18.7 | 2.2 |
| 7 | 500 | 0.0 | 145.4 | 6.7 | 14.3 | 2.1 |
| 20 | 877 | 0.0 | 119.4 | 4.9 | 8.2 | 1.7 |
| 2000 | 1,349 | 0.5 | 571.5 | 41.1 | 41.2 | 1.0 |
Table 14‑17: Silver Capped Composite Descriptive Statistics
| Silver Capped and Composited Descriptive Statistics | ||||||
| Domain | Number | Minimum | Maximum | Mean | Std. Dev. | COV |
| ppm | ppm | ppm | ppm | |||
| 1 | 12,135 | 0.0 | 16.5 | 0.8 | 0.8 | 1.0 |
| 3 | 6,275 | 0.0 | 3.9 | 0.3 | 0.3 | 1.0 |
| 5 | 2,248 | 0.0 | 3.3 | 0.3 | 0.2 | 0.8 |
| 6 | 885 | 0.0 | 3.3 | 0.3 | 0.3 | 0.8 |
| 7 | 500 | 0.0 | 2.0 | 0.3 | 0.2 | 0.5 |
| 20 | 877 | 0.1 | 3.2 | 0.4 | 0.4 | 0.9 |
| 2000 | 1,349 | 0.1 | 5.5 | 0.8 | 0.7 | 0.9 |
Table 14‑18: Cobalt Capped Composite Descriptive Statistics
| Cobalt Capped and Composited Descriptive Statistics | ||||||
| Domain | Number | Minimum | Maximum | Mean | Std. Dev. | COV |
| ppb | ppb | ppb | ppb | |||
| 1 | 12,135 | 0.0 | 309.3 | 67.0 | 26.7 | 0.4 |
| 3 | 6,275 | 0.0 | 150.0 | 51.7 | 17.7 | 0.3 |
| 5 | 2,248 | 0.0 | 130.0 | 49.0 | 11.3 | 0.2 |
| 6 | 885 | 0.0 | 127.5 | 60.0 | 13.5 | 0.2 |
| 7 | 500 | 0.0 | 158.6 | 68.8 | 28.1 | 0.4 |
| 20 | 877 | 9.3 | 160.0 | 31.6 | 21.2 | 0.7 |
| 2000 | 1,349 | 1.8 | 132.5 | 64.8 | 16.2 | 0.3 |
Table 14‑19: Sulfur Capped Composite Descriptive Statistics
| Sulfur Capped and Composited Descriptive Statistics | ||||||
| Domain | Number | Minimum | Maximum | Mean | Std. Dev. | COV |
| % | % | % | % | |||
| 1 | 12,135 | 0.00 | 15.97 | 0.64 | 0.71 | 1.13 |
| 3 | 6,275 | 0.00 | 6.03 | 0.18 | 0.44 | 2.45 |
| 5 | 2,248 | 0.01 | 3.16 | 0.13 | 0.27 | 2.09 |
| 6 | 885 | 0.00 | 1.79 | 0.06 | 0.13 | 2.18 |
| 7 | 500 | 0.01 | 1.56 | 0.05 | 0.12 | 2.15 |
| 20 | 877 | 0.03 | 8.80 | 1.65 | 1.59 | 0.96 |
| 2000 | 1,349 | 0.01 | 2.49 | 0.36 | 0.32 | 0.88 |
| M3-PN150164 26 March 2018 |
115
NorthMet Project
Form NI 43-101F1 Technical Report
| 14.5.3 | Variograms |
HRC completed a variography analysis on the copper composites in order to evaluate the variography presented in the Updated Technical Report on the NorthMet Deposit dated January 13, 2013. HRC’s analysis of the copper variograms agreed with the structure, weights, and ranges of the variography analysis from the previous report. As such, HRC chose to utilize the parameters as previously stated. Table 14‑20 through Table 14‑22 summarize the variogram parameters utilized in estimation process.
Table 14‑20: Unit Variogram Parameters
| Domain | Component | Increment | Cumulative | Rotation | Angle 1 | Angle 2 | Angle 3 | Range 1 | Range 2 | Range 3 |
| Unit 1 – Au | Nugget C0 | 0.036 | 0.036 | |||||||
| Code 1 | Exponential C1 | 0.748 | 0.784 | ZYZ | -82.94 | -72 | 45 | 14.3 | 60.8 | 3.4 |
| Exponential C2 | 0.216 | 1 | ZYZ | -101.9 | -53 | 11 | 108.7 | 466.1 | 560.8 | |
| Unit 1 – Co | Nugget C0 | 0.044 | 0.044 | |||||||
| Code 1 | Exponential C1 | 0.697 | 0.741 | ZYZ | -99.94 | 58 | 4 | 105.9 | 221.1 | 24 |
| Exponential C2 | 0.259 | 1 | ZYZ | -135.9 | 23 | 93 | 18 | 630.2 | 773.2 | |
| Unit 1 – Cu | Nugget C0 | 0.005 | 0.005 | |||||||
| Code 1 | Exponential C1 | 0.605 | 0.61 | ZYZ | -85.94 | -75 | -4 | 26.1 | 74.9 | 7.9 |
| Exponential C2 | 0.39 | 1 | ZYZ | -202.9 | 72 | 36 | 76.1 | 611.7 | 473.7 | |
| Unit 1 – Ni | Nugget C0 | 0.006 | 0.006 | |||||||
| Code 1 | Exponential C1 | 0.6 | 0.606 | ZYZ | -41.94 | 21 | 42 | 58.3 | 11 | 33.3 |
| Exponential C2 | 0.394 | 1 | ZYZ | -84.94 | -46 | -5 | 67.4 | 488.4 | 369.3 | |
| Unit 1 – Pd | Nugget C0 | 0.008 | 0.008 | |||||||
| Code 1 | Exponential C1 | 0.671 | 0.679 | ZYZ | -52.94 | 15 | -16 | 8.2 | 44.6 | 22.3 |
| Exponential C2 | 0.321 | 1 | ZYZ | -110.9 | -51 | 12 | 103.9 | 699.9 | 441.8 | |
| Unit 1 – Pt | Nugget C0 | 0.014 | 0.014 | |||||||
| Code 1 | Exponential C1 | 0.745 | 0.759 | ZYZ | -108.9 | 21 | 21 | 6.5 | 33.4 | 24.1 |
| Exponential C2 | 0.241 | 1 | ZYZ | -150.9 | -71 | 31 | 108.3 | 494.6 | 895 | |
| Unit 1 – S | Nugget C0 | 0.015 | 0.015 | |||||||
| Code 1 | Exponential C1 | 0.558 | 0.573 | ZYZ | -92.94 | -56 | 9 | 19.4 | 157.1 | 8.8 |
| Exponential C2 | 0.427 | 1 | ZYZ | -100.9 | 52 | 51 | 162.3 | 357.3 | 56.2 |
| M3-PN150164 26 March 2018 |
116
NorthMet Project
Form NI 43-101F1 Technical Report
Table 14‑21: Units 20 and 3, 5, 6, and 7 Variogram Parameters
| Domain | Component | Increment | Cumulative | Rotation | Angle 1 | Angle 2 | Angle 3 | Range 1 | Range 2 | Range 3 |
| Unit 20 – Au | Nugget C0 | 0.368 | 0.368 | |||||||
Code 20 | Spherical C1 | 0.435 | 0.803 | ZYZ | -74.94 | 90 | 26 | 66.6 | 85.5 | 6.2 |
| Spherical C2 | 0.197 | 1 | ZYZ | -55.94 | -12 | 62 | 143.8 | 79.1 | 546.8 | |
| Unit 20 – Co | Nugget C0 | 0.398 | 0.398 | |||||||
Code 20 | Spherical C1 | 0.279 | 0.677 | ZYZ | -124.9 | -62 | 81 | 48.3 | 215.9 | 11.4 |
| Spherical C2 | 0.323 | 1 | ZYZ | -106.9 | 50 | 33 | 457 | 1,859.60 | 223.2 | |
| Unit 20 - Cu | Nugget C0 | 0.45 | 0.45 | |||||||
Code 20 | Spherical C1 | 0.381 | 0.831 | ZYZ | -94.94 | 87 | -49 | 163.5 | 152.2 | 9 |
| Spherical C2 | 0.169 | 1 | ZYZ | -60.94 | -5 | -54 | 155.5 | 500 | 1,200 | |
| Unit 20 – Ni | Nugget C0 | 0.406 | 0.406 | |||||||
Code 20 | Spherical C1 | 0.34 | 0.746 | ZYZ | -80.94 | 90 | 3 | 182.4 | 67.1 | 7.9 |
| Spherical C2 | 0.254 | 1 | ZYZ | -83.94 | 11 | 9 | 78.3 | 117.5 | 1,190.40 | |
| Unit 20 – Pd | Nugget C0 | 0.571 | 0.571 | |||||||
Code 20 | Spherical C1 | 0.198 | 0.769 | ZYZ | -68.94 | 61 | -55 | 44.1 | 140.4 | 163.5 |
| Spherical C2 | 0.231 | 1 | ZYZ | -14.94 | 0 | -24 | 5.4 | 50.9 | 609 | |
| Unit 20 – Pt | Nugget C0 | 0.434 | 0.434 | |||||||
Code 20 | Spherical C1 | 0.402 | 0.836 | ZYZ | -47.94 | 89 | -47 | 81.3 | 52.1 | 4.9 |
| Spherical C2 | 0.164 | 1 | ZYZ | -39.94 | 3 | 82 | 179.3 | 76.5 | 759.2 | |
| Unit 20 – S | Nugget C0 | 0.227 | 0.227 | |||||||
Code 20 | Spherical C1 | 0.389 | 0.616 | ZYZ | -150.9 | 28 | 3 | 28.4 | 60.8 | 138.8 |
| Spherical C2 | 0.384 | 1 | ZYZ | -48.94 | 0 | 13 | 47.9 | 105.4 | 1,410.50 | |
| Unit 3, 4, 5, 6, 7 – Au | Nugget C0 | 0.3 | 0.3 | |||||||
| Codes 3,4,5,6,7 | Exponential C1 | 0.7 | 1 | ZYZ | 5.06 | -22 | 18 | 210.6 | 78.5 | 20.2 |
| Unit 3, 4, 5, 6, 7 – Co | Nugget C0 | 0.152 | 0.152 | |||||||
| Codes 3,4,5,6,7 | Exponential C1 | 0.848 | 1 | ZYZ | -5.94 | 0 | 7 | 101.9 | 17.2 | 1321.8 |
| Unit 3, 4, 5, 6, 7 – Cu | Nugget C0 | 0.006 | 0.006 | |||||||
| Codes 3,4,5,6,7 | Exponential C1 | 0.994 | 1 | ZYZ | 69.06 | 20 | -55 | 410 | 29.7 | 21 |
| Unit 3, 4, 5, 6, 7 – Ni | Nugget C0 | 0.142 | 0.142 | |||||||
| Codes 3,4,5,6,7 | Exponential C1 | 0.858 | 1 | ZYZ | 12.06 | -13 | -11 | 318.9 | 19.4 | 58.2 |
| Unit 3, 4, 5, 6, 7 – Pd | Nugget C0 | 0.4 | 0.4 | |||||||
| Codes 3,4,5,6,7 | Exponential C1 | 0.6 | 1 | ZYZ | -47.94 | 25 | 31 | 216.2 | 66.1 | 27.7 |
| Unit 3, 4, 5, 6, 7 – Pt | Nugget C0 | 0.133 | 0.133 | |||||||
| Codes 3,4,5,6,7 | Exponential C1 | 0.867 | 1 | ZYZ | -11.94 | 37 | -14 | 133.4 | 87.8 | 9.8 |
| Unit 3, 4, 5, 6, 7 – S | Nugget C0 | 0.011 | 0.011 | |||||||
| Codes 3,4,5,6,7 | Exponential C1 | 0.989 | 1 | ZYZ | 79.06 | 18 | -55 | 176.4 | 56.9 | 28.2 |
| M3-PN150164 26 March 2018 |
117
NorthMet Project
Form NI 43-101F1 Technical Report
Table 14‑22: Magenta Zone Variogram Parameters
| Domain | Component | Increment | Cumulative | Rotation | Angle 1 | Angle 2 | Angle 3 | Range 1 | Range 2 | Range 3 |
| Magenta Zone – Au | Nugget C0 | 0.004 | 0.004 | |||||||
| Code 2000 | Exponential C1 | 0.796 | 0.8 | ZYZ | -47.94 | 41 | -57 | 34.7 | 77.2 | 13.1 |
| Exponential C2 | 0.2 | 1 | ZYZ | -102.9 | -69 | 3 | 48.5 | 1609.1 | 469.9 | |
| Magenta Zone – Co | Nugget C0 | 0.003 | 0.003 | |||||||
Code 2000 | Exponential C1 | 0.695 | 0.698 | ZYZ | -68.94 | 83 | -14 | 16.6 | 91.5 | 8.6 |
| Exponential C2 | 0.302 | 1 | ZYZ | -91.94 | 35 | 48 | 1415.2 | 297.2 | 134.7 | |
| Magenta Zone – Cu | Nugget C0 | 0.004 | 0.004 | |||||||
Code 2000 | Exponential C1 | 0.81 | 0.814 | ZYZ | -10.94 | 20 | -54 | 170.1 | 67.4 | 19.9 |
| Exponential C2 | 0.186 | 1 | ZYZ | -87.94 | -53 | -4 | 26.4 | 1004.3 | 911.1 | |
| Magenta Zone – Ni | Nugget C0 | 0.006 | 0.006 | |||||||
Code 2000 | Exponential C1 | 0.816 | 0.822 | ZYZ | -12.96 | 27 | -63 | 156.4 | 89 | 19 |
| Exponential C2 | 0.178 | 1 | ZYZ | -88.9 | -53 | -3 | 28.7 | 1396.2 | 424.5 | |
| Magenta Zone – Pd | Nugget C0 | 0.003 | 0.003 | |||||||
Code 2000 | Exponential C1 | 0.744 | 0.747 | ZYZ | -63.94 | 57 | 11 | 35.5 | 79.1 | 11.5 |
| Exponential C2 | 0.253 | 1 | ZYZ | -5.94 | -88 | -25 | 60.2 | 272.8 | 1068.1 | |
| Magenta Zone - Pt | Nugget C0 | 0.004 | 0.004 | |||||||
Code 2000 | Exponential C1 | 0.727 | 0.731 | ZYZ | -59.94 | 59 | 8 | 28.3 | 103.7 | 1.9 |
| Exponential C2 | 0.269 | 1 | ZYZ | -105.9 | -74 | 2 | 33.1 | 937.5 | 246.1 | |
| Magenta Zone – S | Nugget C0 | 0.082 | 0.082 | |||||||
Code 2000 | Exponential C1 | 0.723 | 0.805 | ZYZ | -4.94 | 21 | -97 | 149.2 | 87.1 | 19 |
| Exponential C2 | 0.195 | 1 | ZYZ | -88.94 | -68 | -2 | 26.5 | 551.9 | 332.2 |
| 14.5.4 | Estimation Strategy |
Because of the subtle changes in direction of the mineralized contacts, the estimation method selected to model the mineralization changes is an Ordinary Kriging (OK) using dynamic search ellipses for Domains 1, 3, 5, 6 and 7, as shown in Figure 14‑10. With this method, the orientation of the search and variogram ellipses changes on a block by block basis utilizing wireframe interpretations of each of the unit boundaries. In this model, five separate surfaces were created and utilized to model the structural fabric of the Duluth Complex in association with the mineral resource. These wireframes were created based on surface geology maps and drill-hole intercepts. The Magenta Zone was estimated using a single search ellipse oriented in the direction of the maximum geologic continuity.
| M3-PN150164 26 March 2018 |
118
NorthMet Project
Form NI 43-101F1 Technical Report

Figure 14‑10: North – South Section Looking East Displaying the Dynamic Search Ellipses
The grades were estimated from 10-foot down-hole composites using OK. Composites were coded according to their domain. Each metal was estimated using the variogram parameters outlined in Table 14‑20 through Table 14‑22. Table 14‑23 summarizes the search parameters used in the estimation of mineral resources.
Table 14‑23: Search Volume Parameters for all Domains
| Ellipsoid dimension (in ft.) | Number of Samples Used | ||||||
| X | Y | Z | Min | Max | Max per hole | Comment | |
| Pass 1 | 300 | 170 | 40 | 6 | 15 | 5 | Minimum of two holes required |
| Pass 2 | 600 | 340 | 80 | 6 | 15 | 5 | Minimum of two holes required |
| Pass 3 | 900 | 500 | 115 | 2 | 15 | 5 | |
| 14.5.5 | Mineral Resource Classification |
HRC used the anisotropic distance to the nearest composite of each block to classify mineral resources into measured, indicated and inferred. Table 14‑24 summarizes the distances and number of samples used for the mineral classification criteria.
| M3-PN150164 26 March 2018 |
119
NorthMet Project
Form NI 43-101F1 Technical Report
Table 14‑24: Mineral Resource Classification Criteria
| Classification | X | Y | Z | Samples | ||
| Feet | Feet | feet | Min | Max | Max per Hole | |
| Measured | ≤300 | ≤170 | ≤40 | 6 | 15 | 4 |
| Indicated | ≥300 and ≤600 | ≥170 and ≤340 | ≥40 and ≤80 | 6 | 15 | 4 |
| Inferred | ≥600 and ≤900 | ≥340 and ≤510 | ≥80 and ≤120 | 2 | 15 | 2 |
| 14.5.6 | Model Validation |
Overall, HRC utilized several methods to validate the results of the estimation method. The combined evidence from these validation methods verifies the OK estimation model results.
| 14.5.6.1 | Comparison with Inverse Distance and Nearest Neighbor Models |
Inverse Distance (ID) and Nearest Neighbor (NN) models were run to serve as comparison with the estimated results from the OK method. Descriptive statistics for the OK method along with those for the ID, NN, and drill-hole composites are shown in Table 14‑25 through Table 14‑32 “N” signifies number of samples in the tables.
Table 14‑25: Copper Model Statistics
| Cu (%) Grade Model Comparisons: All Domains | ||||||
| Model | N | Min | Max | Mean | Stan. Dev. | COV |
| Composites | 24,269 | 0.00 | 1.62 | 0.14 | 0.18 | 1.30 |
| OK | 595,727 | 0.00 | 1.29 | 0.10 | 0.12 | 1.20 |
| ID | 595,727 | 0.00 | 1.32 | 0.10 | 0.13 | 1.26 |
| NN | 595,727 | 0.00 | 1.62 | 0.10 | 0.15 | 1.51 |
Table 14‑26: Nickel Model Statistics
| Ni (%) Grade Model Comparisons: All Domains | ||||||
| Model | N | Min | Max | Mean | Stan. Dev. | COV |
| Composites | 24,269 | 0.00 | 0.63 | 0.05 | 0.04 | 0.86 |
| OK | 595,727 | 0.00 | 0.30 | 0.04 | 0.03 | 0.67 |
| ID | 595,727 | 0.00 | 0.40 | 0.04 | 0.03 | 0.70 |
| NN | 595,727 | 0.00 | 0.63 | 0.04 | 0.03 | 0.86 |
| M3-PN150164 26 March 2018 |
120
NorthMet Project
Form NI 43-101F1 Technical Report
Table 14‑27: Platinum Model Statistics
| Pt (ppb) Grade Model Comparisons: All Domains | ||||||
| Model | N | Min | Max | Mean | Stan. Dev. | COV |
| Composites | 24,269 | 0.0 | 876.1 | 36.7 | 55.2 | 1.5 |
| OK | 595,727 | 0.0 | 705.1 | 27.7 | 38.4 | 1.4 |
| ID | 595,727 | 0.0 | 799.4 | 27.6 | 40.0 | 1.5 |
| NN | 595,727 | 0.0 | 876.1 | 27.4 | 51.5 | 1.9 |
Table 14‑28: Palladium Model Statistics
| Pd (ppb) Grade Model Comparisons: All Domains | ||||||
| Model | N | Min | Max | Mean | Stan. Dev. | COV |
| Composites | 24,269 | 0.0 | 2683.7 | 124.1 | 201.9 | 1.6 |
| OK | 595,727 | 0.0 | 2195.3 | 86.5 | 138.0 | 1.6 |
| ID | 595,727 | 0.0 | 2176.7 | 85.8 | 144.7 | 1.7 |
| NN | 595,727 | 0.0 | 2683.7 | 86.4 | 181.7 | 2.1 |
Table 14‑29: Gold Model Statistics
| Au (ppb) Grade Model Comparisons: All Domains | ||||||
| Model | N | Min | Max | Mean | Stan. Dev. | COV |
| Composites | 24,269 | 0.0 | 916.0 | 19.0 | 30.8 | 1.6 |
| OK | 595,727 | 0.0 | 324.0 | 14.3 | 19.2 | 1.3 |
| ID | 595,727 | 0.0 | 530.4 | 14.2 | 20.1 | 1.4 |
| NN | 595,727 | 0.0 | 916.0 | 14.4 | 28.0 | 1.9 |
Table 14‑30: Silver Model Statistics
| Ag (ppm) Grade Model Comparisons: All Domains | ||||||
| Model | N | Min | Max | Mean | Stan. Dev. | COV |
| Composites | 24,269 | 0.0 | 16.5 | 0.6 | 0.7 | 1.1 |
| OK | 595,727 | 0.0 | 7.4 | 0.5 | 0.4 | 0.8 |
| ID | 595,727 | 0.0 | 12.7 | 0.5 | 0.4 | 0.9 |
| NN | 595,727 | 0.0 | 16.5 | 0.5 | 0.5 | 1.1 |
| M3-PN150164 26 March 2018 |
121
NorthMet Project
Form NI 43-101F1 Technical Report
Table 14‑31: Cobalt Model Statistics
| Co (ppb) Grade Model Comparisons: All Domains | ||||||
| Model | N | Min | Max | Mean | Stan. Dev. | COV |
| Composites | 24,269 | 0.0 | 309.3 | 59.8 | 24.2 | 0.4 |
| OK | 595,727 | 0.0 | 214.1 | 55.1 | 17.7 | 0.3 |
| ID | 595,727 | 0.0 | 269.0 | 55.0 | 18.3 | 0.3 |
| NN | 595,727 | 0.0 | 309.3 | 55.2 | 22.4 | 0.4 |
Table 14‑32: Sulfur Model Statistics
| S (%) Grade Model Comparisons: All Domains | ||||||
| Model | N | Min | Max | Mean | Stan. Dev. | COV |
| Composites | 24,269 | 0.00 | 15.97 | 0.46 | 0.72 | 1.57 |
| OK | 595,727 | 0.00 | 8.25 | 0.47 | 0.68 | 1.46 |
| ID | 595,727 | 0.00 | 8.25 | 0.47 | 0.71 | 1.53 |
| NN | 595,727 | 0.00 | 15.97 | 0.46 | 0.84 | 1.80 |
The overall reduction of the maximum, mean, standard deviation, and coefficient of variation (COV) within the OK and ID models represents an appropriate amount of smoothing to account for the point to block volume variance relationship. This is confirmed in Figure 14‑11, comparing the Unit 1 copper cumulative frequency plots of each of the models and drill-hole composites.
| M3-PN150164 26 March 2018 |
122
NorthMet Project
Form NI 43-101F1 Technical Report
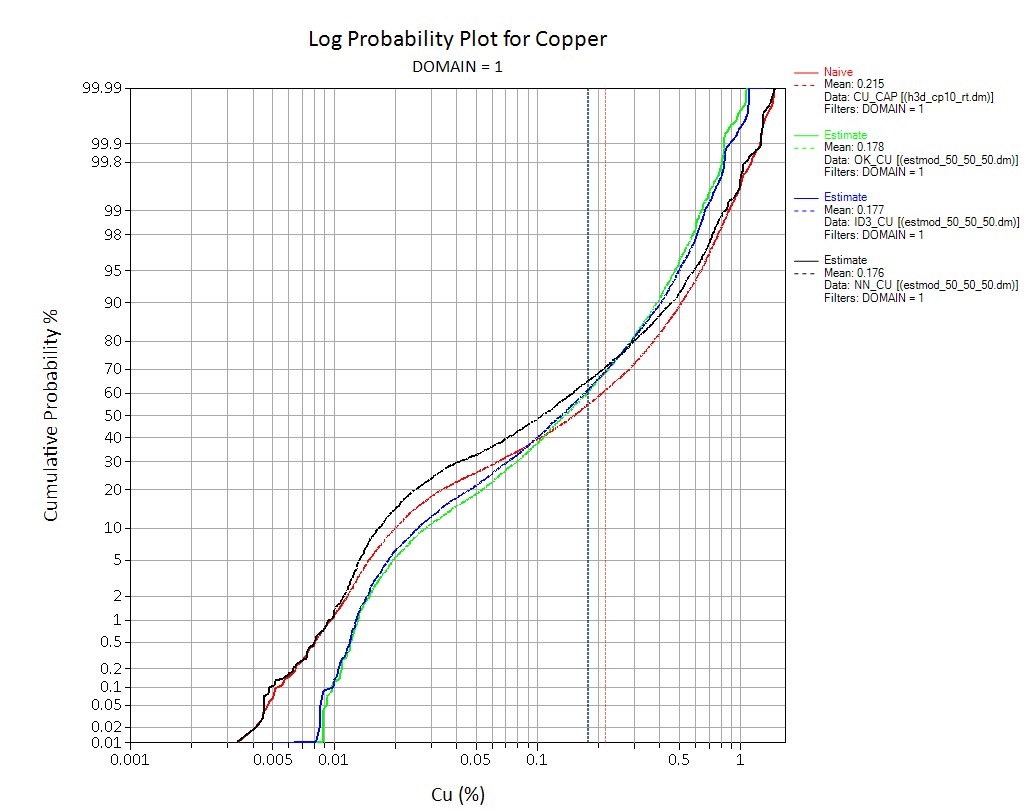
Figure 14‑11: Model Comparison Cumulative Frequency Plot (NN red, ID blue, Composites Black, OK Green)
| 14.5.6.2 | Swath Plots |
Swath plots (Supplemental Information, 2018) were generated to compare average estimated grade from the OK method to the two validation model methods (ID and NN). The results from the OK model, plus those for the validation ID model method are compared using the swath plot to the distribution derived from the NN model. Figure 14‑12 shows average copper grade within Unit 1 along the rotated easting.
| M3-PN150164 26 March 2018 |
123
NorthMet Project
Form NI 43-101F1 Technical Report
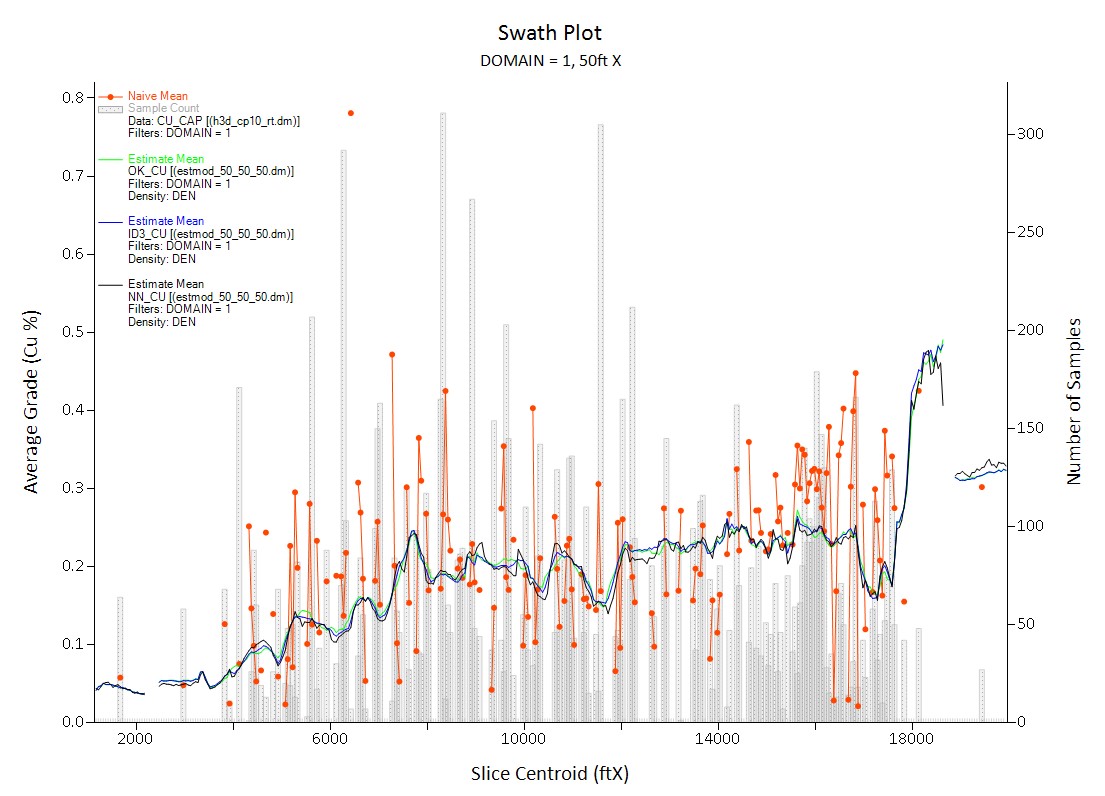
Figure 14‑12: Domain 1 Copper Swath Plot Along Rotated Easting
On a local scale, the nearest neighbor model does not provide a reliable estimate of grade, but on a much larger scale, it represents an unbiased estimation of the grade distribution based on the total dataset. Therefore, if the OK model is unbiased, the grade trends may show local fluctuations on a swath plot, but the overall trend should be similar to the distribution of grade from the nearest neighbor.
Overall, there is good correlation between the grade models, although deviations occur near the edges of the deposit and in areas where the density of drilling is less and material is classified as Inferred resources.
| 14.5.6.3 | Evaluation of Non-Sampled Intervals |
U.S. Steel did not assay a number of intervals that did not visually indicate mineralization, particularly in the deeper holes in the southeast area of the deposit. HRC estimated the resources by both replacing the non-sampled intervals with zeros and by ignoring the intercepts to understand the effect on the estimate. Additionally, hard boundaries were used in the estimate to prevent the smearing of higher grades from the assayed mineralized zones into areas of limited mineralization that were not sampled in the older U.S. Steel drilling campaigns.
Within the optimized pit shell used to determine reasonable prospects for eventual economic extraction there is only a 0.18% difference in material above cutoff between the two different methods for handling the non-sampled intervals. The difference between the models is considered to be within the margin of error of the estimate. HRC selected the model that ignored the non-sampled intervals for the reporting of mineral resources.
| M3-PN150164 26 March 2018 |
124
NorthMet Project
Form NI 43-101F1 Technical Report
| 14.5.6.4 | Sectional Inspection |
Bench plans, cross-sections, and long sections comparing modeled grades to the 10-ft composites were evaluated. Sections displaying copper estimated grades and composite grades are shown in Figure 14‑13 through Figure 14‑15. The figure shows good agreement between modeled grades and the composite grades. In addition, the modeled blocks display continuity of grades along strike and down dip.
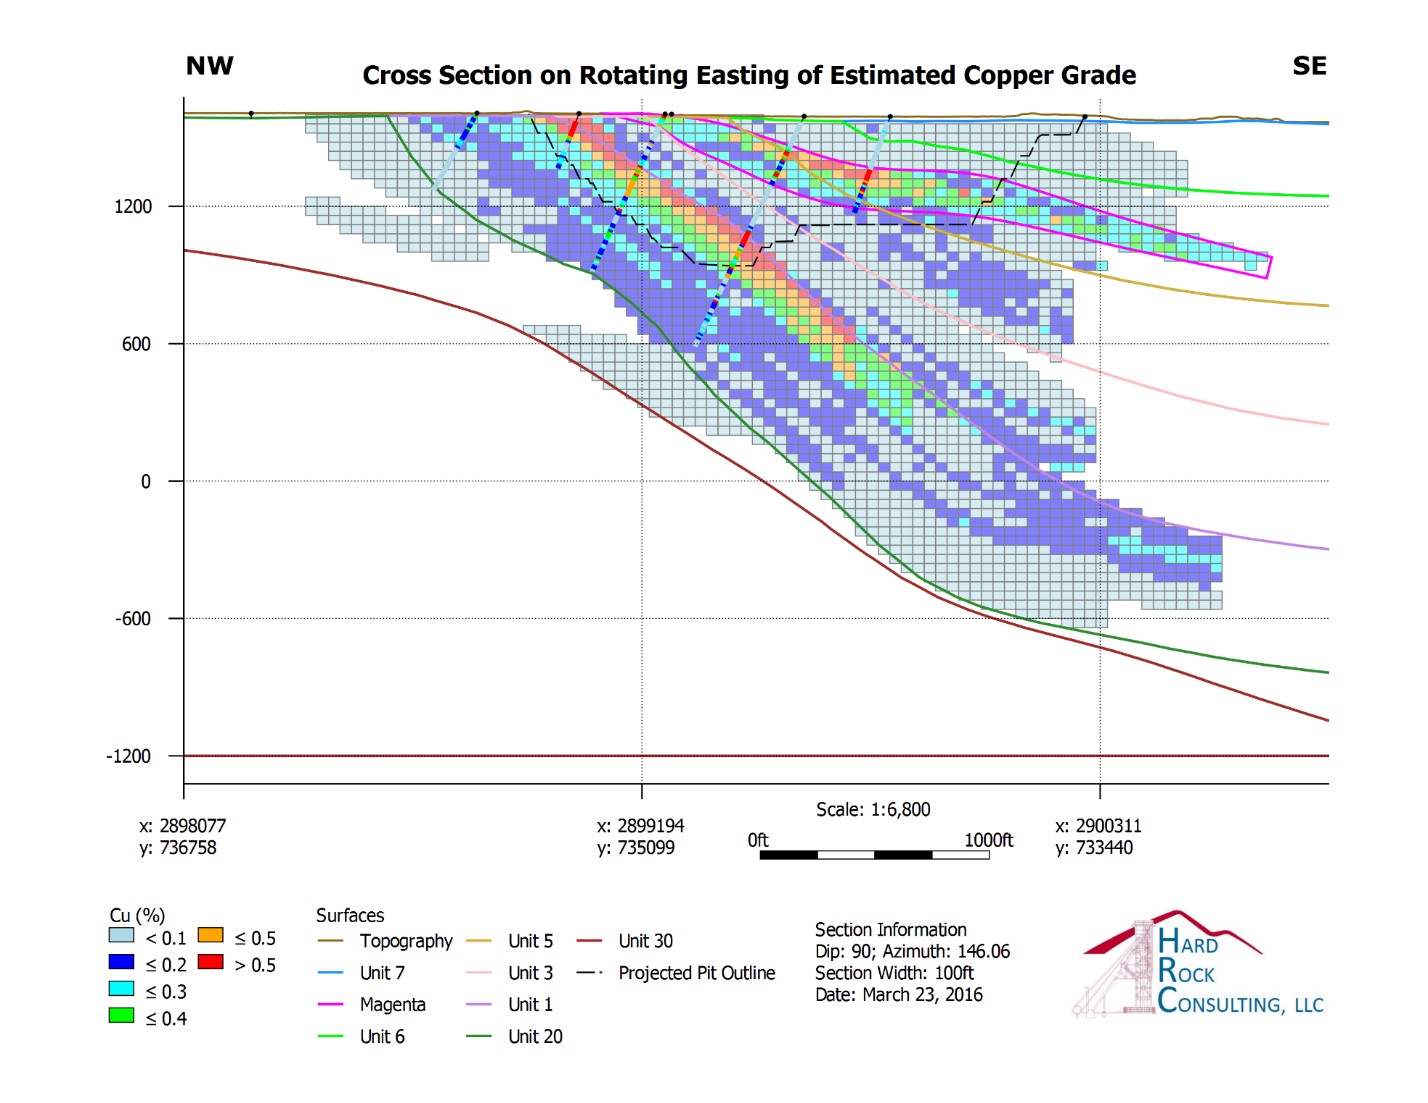
Figure 14‑13: Copper Cross Section Along Rotated Easting
| M3-PN150164 26 March 2018 |
125
NorthMet Project
Form NI 43-101F1 Technical Report
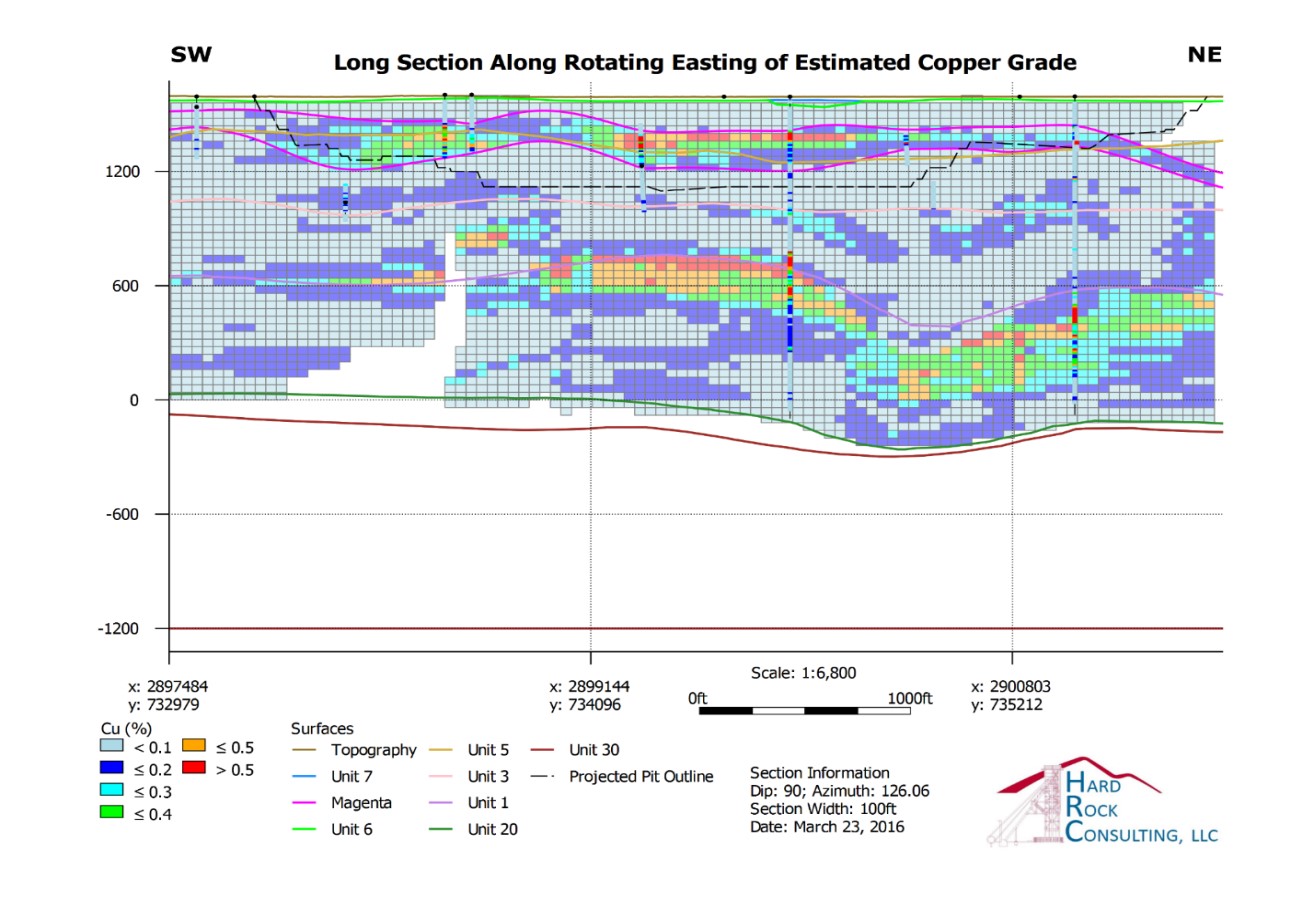
Figure 14‑14: Copper Long Section Along Rotated Northing
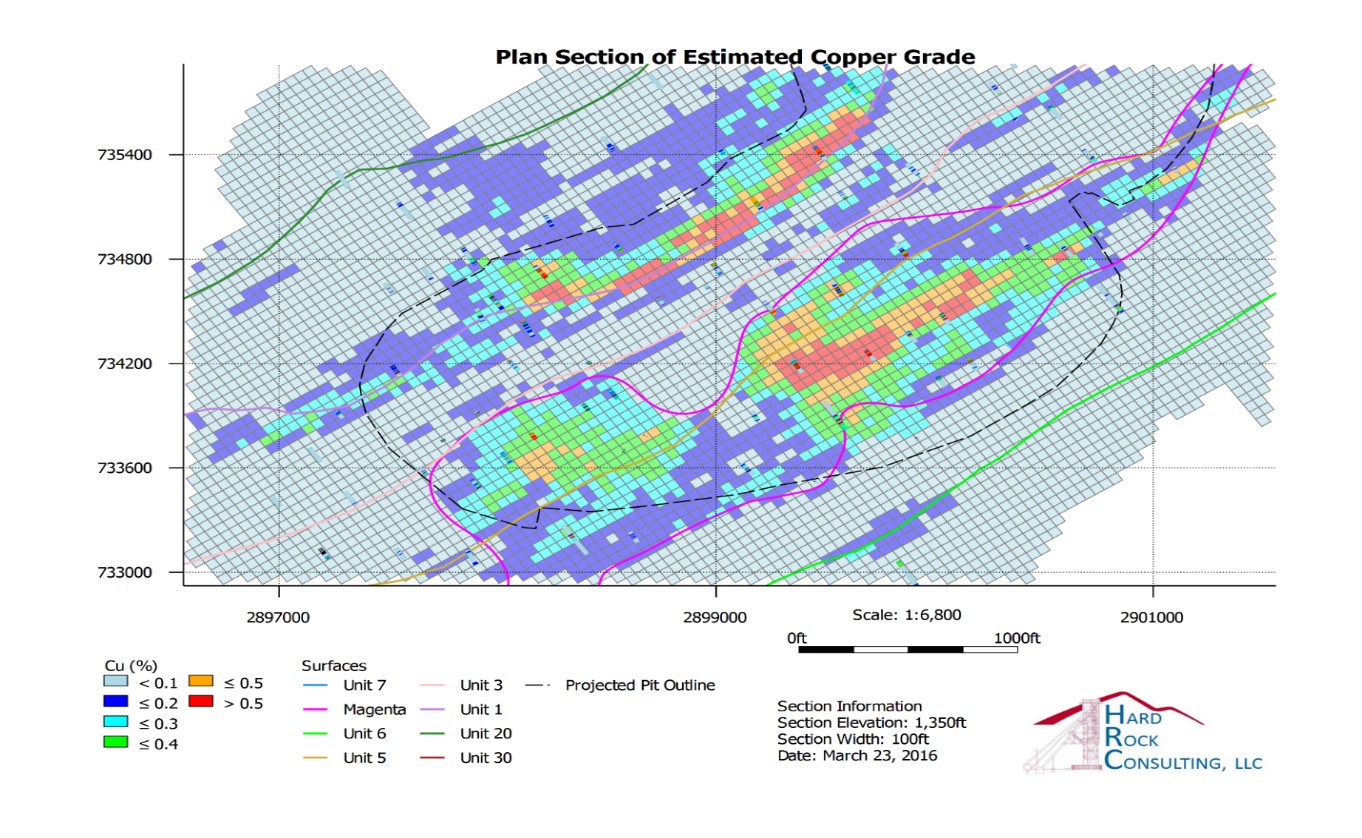
Figure 14‑15: Copper Plan Section
| M3-PN150164 26 March 2018 |
126
NorthMet Project
Form NI 43-101F1 Technical Report
| 14.6 | Mineral Resources |
The mineral resources for the NorthMet Project are calculated at 649.3 million tons measured and indicated and 508.9 million tons inferred. The mineral resources and grades are summarized in Table 14‑35 and are reported inclusive of mineral reserves.
| 14.6.1 | Net Smelter Return (NSR) and Cutoff |
For each block in the mineral resource model, the net smelter return (NSR) was calculated utilizing the same formulas utilized by IMC in calculating the mineral reserves (see Section 15.1.3). The NSR calculation takes into account the estimated metal recovery curves for each metal, the treatment charges, payment terms, deducts, penalties, shipping charges and royalties. HRC reviewed the smelter terms and found them to be within industry norms. The NSR formula utilized the metal prices as presented in Table 14‑33 and included royalty deducts of 5%if the NSR was $35.00/t or over, 4% if the NSR was under $35.00/t but $30.00 over and 3% if the NSR was under $30.00/t. Table 14‑33 also shows the estimated average metal recoveries for the resources which are calculated from the recovery curves presented in Section 13.6.
Table 14‑33: Resource Metal Prices and Estimated Recoveries
| Metal | Price | Recovery |
| Copper ($/lb) | 3.30 | 91.3 |
| Nickel ($/lb) | 8.50 | 61.4 |
| Cobalt ($/lb) | 13.28 | 30.0 |
| Palladium ($/oz) | 734 | 74.2 |
| Platinum ($/oz) | 1286 | 78.6 |
| Gold ($/oz) | 1263 | 59.9 |
| Silver ($/oz) | 19.06 | 56.5 |
Table 14‑34 summarizes the operating costs used to develop the $7.35/t NSR cutoff used as the base case for reporting of mineral resources. The estimated operating costs were provided by PolyMet and the cutoff reflects the potential economic, marketing, and other issues relevant to an open pit mining scenario based on a milling recovery process producing copper and nickel concentrates. HRC has reviewed the cost estimates and finds them to be within industry averages and adequate for reporting of the mineral resources.
Table 14‑34: Estimated Process Operating Costs
| Department | Cost |
| Process Cost ($/t) | 6.50 |
| Property G&A Costs ($/t) | 0.50 |
| Waste Water Treatment Costs ($/t) | 0.35 |
| Total Cost ($/t) | 7.35 |
| 14.6.2 | Test for Reasonable Prospect for Eventual Economic Extraction |
In order to identify the mineralization that meets the test for reasonable prospects of eventual economic extraction, and thus be classified as mineral resources, a Lerchs-Grossman pit shell was generated. The optimization parameters utilized the NSR values calculated in each block based on the metal prices presented in Table 14‑33 and the operating costs presented in Table 14‑34. Mining costs for the optimization were estimated at $1.15/t mined at surface and for every 50 feet of depth the mining costs increased $0.02/t. Pit slope angles were restricted to 48 degrees.
| M3-PN150164 26 March 2018 |
127
NorthMet Project
Form NI 43-101F1 Technical Report
The mineral resource estimate presented in Table 14‑35 is inclusive of the mineral reserves. The resource has been limited to the material that resides above the optimized pit shell. All mineralization below the optimized pit shell has been excluded from any resource classification and is not considered to be part of the mineral resource.
| 14.6.3 | Resource Statement |
The mineral resource estimate for the NorthMet Project is summarized in Table 14‑35. This mineral resource estimate includes all drill data obtained as of January 31, 2016 and has been independently verified by HRC. Mineral resources are not mineral reserves and may be materially affected by environmental, permitting, legal, socio-economic, marketing, political, or other factors. The measured and indicated mineral resources are inclusive of the mineral reserves. Inferred mineral resources are, by definition, always additional to mineral reserves.
Table 14‑35: Mineral Resource Statement for the NorthMet Project Inclusive of Mineral Reserves, Hard Rock Consulting, LLC, January 1, 2018
Volume (M ft3) | Density (st/ft3) | Tonnage (M st) | Cu (%) | Ni (%) | S (%) | Pt (ppb) | Pd (ppb) | Au (ppb) | Co (ppm) | Ag (ppm) | NSR (US$/t) | Cu-Eq (%) | |
| Measured | 2,564.9 | 0.092 | 237.2 | 0.270 | 0.080 | 0.66 | 69 | 241 | 35 | 72 | 0.97 | 19.67 | 0.541 |
| Indicated | 4,468.5 | 0.092 | 412.2 | 0.230 | 0.070 | 0.58 | 63 | 210 | 32 | 70 | 0.87 | 16.95 | 0.470 |
| M+I | 7,033.4 | 0.092 | 649.3 | 0.245 | 0.074 | 0.61 | 65 | 221 | 33 | 71 | 0.91 | 17.94 | 0.496 |
| Inferred | 5,545.5 | 0.092 | 508.9 | 0.240 | 0.070 | 0.54 | 72 | 234 | 37 | 66 | 0.93 | 17.66 | 0.489 |
*Notes:
| (1) | Mineral resources are not mineral reserves and do not have demonstrated economic viability. There is no certainty that all or any part of the mineral resources estimated will be converted into mineral reserves. |
(2) Mineral resource grades are reported undiluted.
| (3) | All resources are stated above a $7.35 NSR cutoff. |
| (4) | Cutoff is based on assumed processing and G&A costs of US $7.35 per ton. Metal Prices and metallurgical recoveries are presented in Table 14‑33. |
| (5) | Mineral resource tonnage and contained metal have been rounded to reflect the accuracy of the estimate, and numbers may not add due to rounding. |
| (6) | CuEq (copper equivalent grade) is based on the mill recovery to concentrates and metal prices (Table 14‑33). |
(7) Copper Equivalent (CuEq) = ((Cu head grade x recovery x Cu Price) + (Ni head grade x recovery x Ni Price) + (Pt head grade x recovery
x Pt Price) + (Pd head grade x recovery x Pd Price) + (Au head grade x recovery x Au Price) + (Co head grade x recovery x Co Price) +
(Ag head grade x recovery x Ag Price)) / (Cu recovery x Cu Price).
| M3-PN150164 26 March 2018 |
128
NorthMet Project
Form NI 43-101F1 Technical Report
| 15 | MINERAL RESERVE ESTIMATES |
The pits were evaluated according to the updated Measured and Indicated Resources and demonstrated to be economically viable; therefore, Measured and Indicated Mineral Resources within the final pit design have been converted to Proven and Probable Reserves. The mineral reserves use the terminology, definitions and guidelines given in the CIM Standards on Mineral Resource and Mineral Reserves (May 2014). All inferred material was classified as waste and scheduled to the appropriate waste stockpile.
| 15.1 | Calculation Parameters |
The pit designs used in this study were compared with pit optimizations run on the updated operating costs and metal prices used in this report and were found to be well within the optimized shells. The optimized shells were only used to confirm the validity of the pit designs and to report the minable resource.
| 15.1.1 | Pit Slopes |
The pit slopes for the pit and internal phase designs followed the recommendations from the June 2006 Golder NorthMet Open Pit Rock Slope Design Report which was reviewed by IMC, and the recommended inter-ramp and overall pit wall recommendations have been incorporated into the designs.
The Golder report indicated inter-ramp angles of 51.4 degrees for all sectors, except one, were possible. That one sector utilized an inter-ramp angle of 55.1 degrees and was achieved with a bench face angle of 70 degrees versus the other sectors’ 65-degree face angle. The area impacted by the increased bench face angle was minimal. To simplify the pit design, all areas were designed with a bench face angle of 65 degrees.
The Golder report also included the following design recommendations which are incorporated into the pit wall slopes:
| · | In cases where the vertical lift is less than 400 ft between haul ramps, a 33.2 ft catch bench is included every 100 ft of vertical lift to achieve an inter-ramp angle of 51.4 degrees. |
| · | In cases where the vertical lift exceeds 400 ft between haul ramps, an additional 27.2 ft is added to one of the normal 33.2 ft catch benches to achieve an overall slope angle of 49.1 degrees. |
| 15.1.2 | Dilution and Mining Losses |
The mineral resource estimate for NorthMet is considered to be internally diluted by compositing. HRC also calculated an external diluted grade for all of the grade elements; these diluted grades were used by IMC for the mineral reserve calculation. To apply the external dilution, each side of every ore block was queried to determine if it had a waste block adjacent to each side. If the adjacent block was determined to be waste, then 16.7% of the waste block was included in a weighted average grade estimate for the block. The 16.7% of the waste block is calculated based on a wedge with a twenty-foot-wide bottom included as dilution. If two sides of the block are adjacent to waste then the dilution percent is 28.6%, three sides would be 37.5% and all four sides would be 44.4%.
This was applied to all metals and on average, the dilution percentages for the blocks contained within the mineral reserve pit design and above the $7.35/t NSR cutoff grade are:
| · | Copper = 3.1% |
| · | Nickel = 2.4% |
| · | Platinum = 3.1% |
| · | Palladium = 3.5% |
| · | Gold = 3.3% |
| · | Cobalt = 0.9% |
| · | Silver = 2.3% |
| M3-PN150164 26 March 2018 |
129
NorthMet Project
Form NI 43-101F1 Technical Report
| 15.1.3 | Cutoff and NSR Calculation |
The mineral reserves are reported using a $7.98/t NSR cutoff inside of the final pit design which includes the estimated plant operating costs (including rail handling costs), all G&A costs, and the water treatment costs during pit operation and shown on Table 15‑1.
Table 15‑1: Mineral Reserve NSR Cutoff
| NSR Cutoff, $/t | ||||
| Process Cost (including rail haulage of ore) | $ | 6.74 | ||
| Property G&A Costs, per ton of ore | $ | 0.55 | ||
| Waste Water Treatment Costs, per ton of ore | $ | 0.69 | ||
| Total Cost per ton ore | $ | 7.98 | ||
In order to apply the cutoff for the tabulation of the mineral reserve, each block in the mineral resource model was assigned an NSR (Net Smelter Return) value calculated in $/ton. Three-year trialing average metal prices as of January 2016 were used for the estimate as presented in Table 15‑2.
Table 15‑2: Mineral Reserve Metal Prices
| 3 Year Average Metal Prices (January 31,2016) | |||||
| Copper | $ | 2.93 | $/lb | ||
| Nickel | $ | 6.50 | $/lb | ||
| Cobalt | $ | 13.28 | $/lb | ||
| Palladium | $ | 734 | $/oz | ||
| Platinum | $ | 1,286 | $/oz | ||
| Gold | $ | 1,263 | $/oz | ||
| Silver | $ | 19.06 | $/oz | ||
To account for the variable metal recoveries based on each block’s grade, the results from the Beneficiation Pilot Plant campaigns and various metallurgical sampling campaigns were used to model elemental recovery versus the head assay. The total average percent mill recovery based on averaged head grades for elements presented in Table 15‑3, except Co, is derived from the natural log (ln) of the head grade for that element. The mill produces three concentrates: Cu, Ni, and a low-grade Ni in Pyrrhotite. The average percent recovery of each element is distributed across each concentrate as shown in Table 15‑3.
| M3-PN150164 26 March 2018 |
130
NorthMet Project
Form NI 43-101F1 Technical Report
Table 15‑3: Plant Recovery to Concentrates of Reserve Blocks
| Metal | Overall Mill Recovery Formula | Average Recovery to Concentrates | |||
| Copper | Nickel | Pyrrhotite | Total | ||
| Copper (Cu), % | 5.6511 x ln(Cu) + 98.756 | 78.60% | 8.73% | 4.50% | 91.83% |
| Nickel (Ni), % | 20.664 x ln(Ni) + 114.68 | 6.11% | 49.38% | 8.00% | 63.50% |
| Cobalt (Co), ppm | 3.45% | 27.87% | 0.00% | 31.32% | |
| Palladium (Pd), ppb | 6.9122 x ln(Pd/1000) + 87.288 | 45.69% | 22.50% | 10.00% | 78.20% |
| Platinum (Pt), ppb | 15.438 x ln(Pt/1000) + 112.82 | 24.70% | 37.05% | 12.00% | 73.76% |
| Gold (Au), ppb | 15.417 x ln(Au/1000) + 109.13 | 39.40% | 9.85% | 10.00% | 59.25% |
| Silver (Ag), ppm | 28.635 x ln(Ag) + 55.659 | 37.95% | 9.49% | 10.00% | 57.44% |
The NSR calculation also takes into account all concentrate treatment charges, refining, payable deductions, and shipping charges for concentrates and precipitates produced. Only the copper and nickel concentrate values are included in the mineral reserve NSR value per ton. The costs for these charges were provided by PolyMet, use the terms in the Glencore concentrate purchase agreement and are summarized in Table 15‑4.
Table 15‑4: Summary of Concentrate Treatment Terms
| Copper Concentrate | Nickel Concentrate | ||||||
| Moisture Content | 10.40% | 10.40% | |||||
| Concentrate shipment $/wmt | $95.50 | $96.50 | |||||
| Smelting charge, $/mt | $85.00 | $0.00 | |||||
| Commercial Terms | Payable | Min. | Deduction | Refining | Values Internal to Glencore | ||
| Copper | 96.50% | 1.10 | units | 0.085 | $/lb. | ||
| Nickel | 0.00% | ||||||
| Cobalt | 0.00% | ||||||
| Palladium | 90% | 1.00 | g/dmt | 0.275 | $/g | ||
| Platinum | 90% | 1.00 | g/dmt | 0.50 | $/g | ||
| Gold | 97% | 1.00 | g/dmt | 5.00 | $/oz | ||
| Silver | 90% | 30.00 | g/dmt | 0.40 | $/oz | ||
| Nickel Penalty | |||||||
| Penalty | $/mt | 5.00 | |||||
| for every | 0.10% | ||||||
| in excess of | 0.20% | ||||||
| Maximum | 1.00% | ||||||
A royalty is applied to the combined NSR of the copper and nickel concentrates based on the following royalty schedule: NSR less than $30, 3% royalty; NSR between $30 and $35, 4% royalty; NSR greater than or equal to $35, 5% royalty is applied.
| M3-PN150164 26 March 2018 |
131
NorthMet Project
Form NI 43-101F1 Technical Report
| 15.2 | Mineral Reserve Estimate |
Proven and Probable Mineral Reserves of 254.7 million tons are reported within the final pit design used for the mine production schedule and shown in Table 15‑5. All inferred material was classified as waste and scheduled to the appropriate waste stockpile. The final mineral reserves are reported using a $7.98 NSR cutoff inside the pit design using the diluted grades. Both the mineral resource and mineral reserve estimates take into consideration metallurgical recoveries, concentrate grades, transportation costs, smelter treatment charges and royalties in determining NSR values. Table 15‑5 also shows the mineral reserves by classification category and grade. The Qualified Person responsible for the Mineral Reserve estimate is Herb Welhener, vice president of IMC.
Table 15‑5: Mineral Reserve Statement – December 2017
| Class | Tonnage (x 1,000) | Grades (Diluted) | ||||||||
| Copper | Nickel | Platinum | Palladium | Gold | Cobalt | Silver | NSR | Cu-EQ | ||
| (%) | (%) | (ppb) | (ppb) | (ppb) | (ppm) | (ppm) | $/ton | (%) | ||
| Proven | 121,849 | 0.308 | 0.087 | 82 | 282 | 41 | 74.81 | 1.11 | 19.87 | 0.612 |
| Probable | 132,820 | 0.281 | 0.081 | 78 | 256 | 37 | 74.06 | 1.02 | 18.02 | 0.559 |
| Total | 254,669 | 0.294 | 0.084 | 80 | 268 | 39 | 74.42 | 1.06 | 18.90 | 0.584 |
*Notes:
(1) Mineral reserve tonnage and contained metal have been rounded to reflect the accuracy of the estimate, and numbers may not add due to rounding.
(2) All reserves are stated above a $7.98 NSR cutoff and bound within the final pit design.
(3) Tonnage and grade estimates are in Imperial units
(4) Total Tonnage within the pit is 628,499 ktons; average waste: ore ratio = 1.47
(5) Cu-Eq values are based on the metal prices in Table 15‑2 and total mill recoveries in Table 15‑3.
(6) Copper Equivalent (CuEq) = ((Cu head grade x recovery x Cu Price) + (Ni head grade x recovery x Ni Price) + (Pt head grade x recovery
x Pt Price) + (Pd head grade x recovery x Pd Price) + (Au head grade x recovery x Au Price) + (Co head grade x recovery x Co Price) +
(Ag head grade x recovery x Ag Price)) / (Cu recovery x Cu Price)
| 15.3 | Factors that may Affect the Mineral Reserve Estimate |
The mineral reserves are based on pit designs within the currently established footprints for disturbance areas evaluated in the FEIS and permitting. Pit optimizations run on the updated operating costs and metal prices used in this report, suggested pits that are larger than the current pit designs. If PolyMet were to decide to extend the mine life, the additional material excluded from the current pit design could be reviewed in an updated detailed mine plan and economic evaluation. If positive results are achieved, that additional material could be converted to mineral reserves, indicating a potential upside to the Project. This would more than likely require an updated Feasibility Study as the current project has been designed and costs estimated to the pit size evaluated in the FEIS and permit applications. In addition, as discussed in other sections of this Study, such changes could require additional environmental review and permitting.
The mineral reserves are based on the resource model, metal prices and recoveries, and costs presented in this report. Any changes to these could impact the mineral reserves estimate.
| M3-PN150164 26 March 2018 |
132
NorthMet Project
Form NI 43-101F1 Technical Report
| 16 | MINING METHODS |
| 16.1 | Open Pit Mine Plan |
The NorthMet Project contains mineralization at or near the surface that is ideal for open pit mining methods.
Mining is planned on a 7 day per week schedule, with two 12-hour shifts per day. Other mining schedules may prove to be more effective, but are not expected to significantly change Project economics. The mine plan includes 225 million tons of ore at an overall strip ratio of 1.6:1. Mining is planned in three pits: The East Pit, the Central Pit, and the West Pit. As mining of the Central Pit commences, it will extend into the East Pit, thereby joining the pits. The combined pit will be referred to as the East Pit.
The method of material transport evaluated for this study is open pit mining using two 36.6-yd3 hydraulic front shovels as the main loading units with a 22.5-yd3 front end loader as a backup loading unit. The material will be loaded into 240-ton haul trucks and the ore will be hauled to the rail transfer hopper for rail haulage to the mill or ore surge pile (OSP) areas, and the waste rock to waste stockpiles or pit backfills.
During the first half of the operation, the more reactive waste rock mined will be placed in two temporary stockpiles (one west of the East Pit referred to as the Category 4 Stockpile, and one south of the East Pit referred to as the Category 2/3 Stockpile), and the least reactive waste rock will be placed in a permanent stockpile north of the West Pit (referred to as the Category 1 Stockpile). Once mining is completed in the East Pit, the more reactive waste rock mined will be placed directly in the East Pit as backfill. The more reactive waste rock in the Category 4 Stockpile (in the location of the future Central Pit) will then be relocated as backfill into the East Pit, thus clearing the area for mining of the Central Pit. the Category 2/3 Stockpile will then be moved into the East Pit as backfill. Once mining is completed in the Central Pit, waste rock will be backfilled into that pit, too. By the end of the mine life, all of the more reactive waste rock will be placed as backfill in the pits. As the least reactive waste rock is mined, it will be placed in the permanent Category 1 Stockpile or in the East and Central Pits as backfill. The three mine pits will flood with water after mining and backfilling are completed, which results in the more reactive waste rock being permanently disposed of subaqueously. The general Mine Site layout, including pits, waste rock stockpiles, ore surge pile, rail transfer facility, and overburden storage and laydown area are shown on Figure 16‑1.
| M3-PN150164 26 March 2018 |
133
NorthMet Project
Form NI 43-101F1 Technical Report
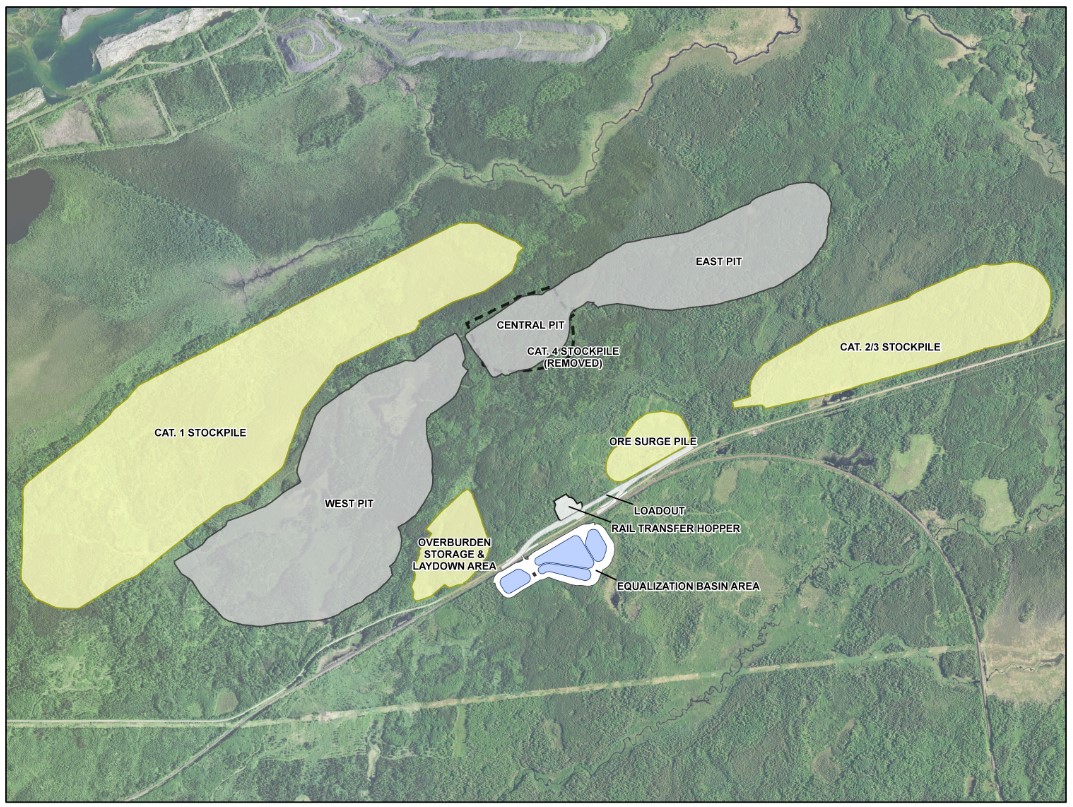
Figure 16‑1: Mine Site Layout
| M3-PN150164 26 March 2018 |
134
NorthMet Project
Form NI 43-101F1 Technical Report
| 16.2 | Resource Model Review |
IMC was requested to perform a brief review of the block model for the NorthMet Project in St. Louis County, Minnesota, US. The model review was based on a 40-ft bench model provided to IMC during August 2015 by HRC. IMC also received a report that described the modeling procedures for a prior block model based on 20-ft benches. It was reported to IMC that the procedures were similar between the 20 ft and 40 ft bench height models. IMC subsequently received a 50 ft bench height resource model (documented in Section 14) which caused the same grade estimation procedures as used for the 40 ft model reviewed by IMC. The difference in copper and nickel grades (the primary economic metals in the deposit) between the 40 ft and 50 ft models is in the third decimal place resulting in less than 0.5% difference in head grades.
The NorthMet deposit is a polymetallic deposit with copper, nickel, gold, silver, platinum, palladium, and cobalt contributing to economics.
It is also noted that IMC did work on the Project, including resource modeling, for the 2001 Preliminary Feasibility Study, and so has prior knowledge concerning the Project data and the geologic setting.
IMC has concluded that the resource block model appears to be adequate for mine planning studies and the mineral reserve estimate in the main deposit area where the open pit designs are located. The IMC review is documented in a memo to PolyMet from Michael Hester of IMC dated March 29, 2016.
| 16.3 | Definition Of Material Types |
The material mined from the open pit can be divided into three material types: ore, waste rock and overburden.
| 16.3.1 | Ore Classification |
The ore tonnage is subdivided into ore that is hauled from the pit to the rail transfer hopper for shipment to the processing plant and ore that is stored in a temporary stockpile. The discussion of the development of the NSR value per ton on the diluted model grades is included in Section 15.1.3 of this report.
| 16.3.2 | Waste Rock Classification |
Waste Rock has been categorized into four categories defined according to the geochemical and associated acid-producing and metal-leaching properties of the waste rock. These waste rock categories and classification parameters are summarized in .
Table 16‑1.
Table 16‑1: Waste Rock Classification
| Waste Rock Categorization | Sulfur Content (%S)(1) |
| Category 1 | %S ≤ 0.12 |
| Category 2 | 0.12 < %S ≤ 0.31 |
| Category 3 | 0.31 < %S ≤ 0.6 |
Category 4(2) | 0.6 < %S |
Note:
(1) In general, the higher the rock’s sulfur content, the higher its potential for generating Acid Rock Drainage (ARD) or leaching heavy metals.
(2) Category 4 Includes all Virginia Formation rock.
| M3-PN150164 26 March 2018 |
135
NorthMet Project
Form NI 43-101F1 Technical Report
The decision on where to haul the waste rock will depend on the rock’s waste category, which was developed through a sampling and analysis program approved by the MDNR. During the first half of mining, Category 2, 3 and 4 waste rock will be placed on the temporary Category 2/3 or Category 4 Stockpiles. After mining of the East Pit is completed, Category 2, 3 and 4 waste rock will be placed directly in the East Pit as backfill. Category 2, 3 and 4 waste rock will also be used to backfill the Central Pit, after mining ceases in that pit. The material in the temporary Category 2/3 and Category 4 Stockpiles will be relocated to the pits for subaqueous disposal, after mining ceases in each pit. The pit backfill tonnage represents approximately 45% of the waste rock mined during the production schedule. The remaining 55% of the rock waste is stored the permanent Category 1 Stockpile.
| 16.3.3 | Waste Rock Stockpile Liners |
With the exception of the Category 1 Stockpile, the waste rock stockpiles and the Ore Surge Pile (OSP) are all temporary and will include liner systems to capture water passing through the stockpiles. In liner construction areas where the underlying soils are not geotechnically stable, unsuitable material will be removed, and a stable foundation will be built with suitable construction material. Stockpiles will be constructed using foundation underdrains, if necessary, to provide gravity drainage where elevated groundwater is encountered to prevent or minimize the potential for excess pore pressures on the liner as the stockpile is loaded. In addition, the liner systems will consist of an impermeable barrier layer (geomembrane) underlain by a compacted soil liner to limit the downward infiltration of water through the liner system and an overliner drainage layer constructed above the impermeable barrier layer to promote the conveyance of water that reaches the barrier layer to a collection and removal point along the barrier layer via gravity. These three design details (impermeable barrier, compacted soil liner, and overliner drainage layer) and underdrains, if necessary, enhance liner effectiveness and integrity.
Category 1 waste rock will be disposed in the only permanent stockpile at the Mine Site, which will be located north and west of the West Pit. The Category 1 Stockpile contains non-acid rock drainage (ARD) generating rock; therefore, it will be constructed differently than the temporary Category 2/3 and Category 4 Stockpiles and Ore Surge Pile that will contain rock with potential to generate ARD. A groundwater containment system will be constructed around the Category 1 Stockpile to collect stockpile drainage. The groundwater containment system will consist of a low permeability compacted soil barrier combined with a drainage collection system along the toe of the stockpile.
The Category 2/3 and Category 4 Stockpiles and OSP will be temporary and will not have cover systems.
The Category 1 Stockpile will have a cover system to limit water infiltration through the stockpile during reclamation and long-term closure.
| 16.3.4 | Overburden Classification |
Overburden at the Mine Site has been divided into three categories based on physical and chemical properties; saturated mineral overburden (saturated overburden), unsaturated mineral overburden (unsaturated overburden) and organic soils (peat). The classification of the mineral overburden as saturated or unsaturated is based primarily on the location of the water table; unsaturated overburden is located above the water table, and saturated overburden is located below.
Waste characterization indicates that some of the saturated overburden contains iron sulfides and produces lower pH water in laboratory tests, implying that saturated overburden should be managed as a reactive mine waste. In certain applications, saturated overburden may be used as construction material. These applications include locations where drainage water will be collected, where the overburden will be placed back in a saturated location, or where applicable surface and groundwater standards will be met. Saturated overburden not used for construction will be commingled with waste rock in the temporary waste rock stockpiles that have membrane liners and ultimately relocated to the pits for subaqueous disposal.
| M3-PN150164 26 March 2018 |
136
NorthMet Project
Form NI 43-101F1 Technical Report
Unsaturated overburden will be used as general-purpose construction material on-site, as needed. At times when the construction demands are not as great as the supply, the excess unsaturated overburden will be temporarily stored in the Overburden Storage Laydown Area (OSLA). In reclamation and long-term closure, excess unsaturated overburden will be utilized in the East Pit wetland development or placed on the upper benches of the West Pit Lake.
Peat will be used for restoration and reclamation activities at the Mine Site. This may include the development of wetlands in the East Pit and within the reclaimed temporary stockpile footprints. Peat will also be mixed with unsaturated overburden to increase the organic content for restoration material across the Mine Site, including over the geomembrane cover of the Category 1 Waste Rock Stockpile. Excess peat will be stored in the OSLA until it is used for reclamation.
| 16.4 | Geotechnical |
The pit slopes for the pit and internal phase designs were based on the recommendations from the June 2006 Golder Rock Slope Design Report which was reviewed by IMC, and the recommended inter-ramp and overall pit wall recommendations have been incorporated into the designs.
The Golder report also included the following design recommendations which are incorporated into the pit wall slopes:
| · | In cases where the vertical lift is less than 400 ft between haul ramps, a 27.2 ft catch benches included every 100 ft of vertical lift to achieve an inter-ramp angle of 51.4 degrees. |
| · | In cases where the vertical lift exceeds 400 ft between haul ramps, a 32-ft catch bench is included every 100 ft of vertical lift to achieve an inter-ramp angle of 49.1 degrees. |
| 16.5 | Pit Design |
IMC compared the pit designs for this study with pit optimizations run on the updated costs and metal prices used in this report and found that the pit designs were well within the optimized shells. The pits were designed into six phases with the East Pit mined in two phases, the Central Pit in one phase and the West Pit in three phases.
Figure 16‑2 and Figure 16‑3 delineate the pits at Mine Year 1 and 20, but do not represent the exact mining sequence over time.
Pit slopes were designed based on the recommendations by Golder Associates, as noted above. Haul roads were designed at a width of 122 ft, which provides a safe truck width (27’3” canopy width) to running surface width ratio of 1:3.5, including a 26.5-ft width for a bench on the edge of the road. Maximum grade of the haul roads is 10%. The pit design criteria are presented in Table 16‑2.
| M3-PN150164 26 March 2018 |
137
NorthMet Project
Form NI 43-101F1 Technical Report
Table 16‑2: Pit Design Criteria
| Mine Design Criteria | |
| Pit Design Criteria | Parameter |
| Inter-ramp Angles with less than 400’ between ramps | 51.4° |
| Inter-ramp Angles with greater than 400’ between ramps | 49.1° |
| Face Angles | 65° |
| Catch Bench (< 400’ between ramps) | 33.2 ft |
| Catch Bench (> 400’ between ramps) | 33.2 ft plus an additional 27.2 ft to one of catch benches |
| Catch Bench Vertical Spacing | 100 ft |
| Minimum Turning Radius | 200 ft |
| Ramp Widths | 122 ft |
| Ramp Grade | 10% |
| 16.6 | Preproduction Development |
The preproduction mine development will be carried out by contractors until bedrock has been uncovered. Clearing, grubbing and harvesting of marketable timber and biomass will be completed as part of Mine Site development and mining. The surface overburden consists of glacial till and peat. Final pre-stripping overburden bank slopes will be maintained at a slope that is not steeper than 2.5H:1V. Excavated peat will be stockpiled in the OSLA or near construction footprints until it can be reused for construction and other on-site reclamation. The remaining glacial till fraction of the overburden will also be removed from the pit footprints and, where necessary, within the stockpile liner footprints, separated based on being saturated or unsaturated, and hauled to the appropriate construction or disposal areas, as described in Section 16.3.4.
Pre-production mine development will utilize on-site construction materials, where possible, including overburden materials and Category 1 waste rock, once available. Additional construction materials will be obtained, as approved by the MDNR. Potential construction materials include waste rock from the state-owned waste rock stockpile located approximately 5 miles west of the Mine Site along Dunka Road, and possibly waste rock and overburden from the inactive (LTVSMC) Area 5 Mine Site to the north and east of the FTB.
Before mining operations can begin, the Mine Site infrastructure, facilities and water management systems must be developed. Mine Site development will take 18-24 months.
| 16.7 | Production Schedule |
The production schedule is driven by the nominal ore rate of 32,000 STPD equivalent to 11.6 million tons per annum (average of 362.5 days per year, or 99% availability) with a 20-year mill life. Mining is planned on a 7 day per week schedule, with two 12-hour shifts per day. The mine plan includes 225 million tons of ore and an overall strip ratio of 1.6:1. The production schedule has been calculated on an annual basis for the life of the mine.
The cutoff grade used for the mine schedule is based on the NSR values assigned to the block model described in report Section 15.1.3. The NSR value is based on the diluted metal grades and the dilution approach is described in Section 15.1.2. An elevated cutoff is used in the early mining years to achieve a higher metal content in the mill feed tonnage. Material below mill cutoff is temporarily stockpiled for processing later in the mill schedule. The cutoff to the OSP is $8.50/t NSR and includes the tonnage between the mill cutoff NSR used in a particular year and the $8.50/t NSR stockpile cutoff value. The NSR cutoff ranges between $14.00/t to $10.00/t during years 1 through 10 and then is $7.98/t for years 11 through 18. The cutoffs for the mill ore are shown on Table 16‑3 as part of the annual production schedule. The $7.98/t NSR cutoff covers the cost of processing, site G&A and waste water treatment on a per ton of ore basis.
| M3-PN150164 26 March 2018 |
138
NorthMet Project
Form NI 43-101F1 Technical Report
| 16.7.1 | Yearly Production |
The Life of Mine (LOM) schedule was developed on an annual basis for all years. Milling of the mined ore begins in month four of Year 1 and ramps up to full production; a total of 7.250 Mt are milled during Year 1, approximately 63% of a full year’s production rate. The yearly mine production schedule showing ore and waste tonnages is presented in Table 16‑3. The mill feed schedule is presented in Table 16‑4.
| M3-PN150164 26 March 2018 |
139
NorthMet Project
Form NI 43-101F1 Technical Report
Table 16‑3: Yearly Mine Production Schedule
| Total | Year -1 | Year 1 | Year 2 | Year 3 | Year 4 | Year 5 | Year 6 | Year 7 | Year 8 | Year 9 | Year 10 | Year 11 | Year 12 | Year 13 | Year 14 | Year 15 | Year 16 | Year 17 | Year 18 | Year 19 | Year 20 | ||
| Ore Mined | NSR cutoff --> | 14.00 | 14.00 | 14.00 | 13.00 | 11.00 | 11.00 | 12.00 | 11.00 | 9.00 | 9.00 | 7.98 | 7.98 | 7.98 | 7.98 | 7.98 | 7.98 | 7.98 | 7.98 | ||||
| ktons | 198,867 | 7,250 | 11,600 | 11,600 | 11,600 | 11,600 | 11,600 | 11,600 | 11,600 | 11,600 | 11,600 | 11,600 | 11,600 | 11,600 | 11,600 | 11,600 | 11,600 | 11,600 | 6,017 | ||||
| DCu, % | 0.311 | 0.348 | 0.358 | 0.355 | 0.334 | 0.334 | 0.333 | 0.334 | 0.314 | 0.300 | 0.280 | 0.273 | 0.268 | 0.274 | 0.275 | 0.287 | 0.292 | 0.322 | 0.345 | ||||
| DNi, % | 0.088 | 0.103 | 0.105 | 0.095 | 0.087 | 0.086 | 0.089 | 0.097 | 0.093 | 0.085 | 0.083 | 0.082 | 0.083 | 0.083 | 0.081 | 0.080 | 0.081 | 0.088 | 0.094 | ||||
| Cu-Eq Mill, % | 0.617 | 0.688 | 0.712 | 0.716 | 0.674 | 0.662 | 0.664 | 0.664 | 0.619 | 0.597 | 0.555 | 0.559 | 0.562 | 0.548 | 0.540 | 0.563 | 0.564 | 0.613 | 0.650 | ||||
| Ore to Stockpile (8.50/t NSR cutoff) | |||||||||||||||||||||||
| ktons | 26,133 | 2,364 | 4,487 | 5,254 | 3,882 | 1,512 | 1,799 | 3,170 | 2,805 | 383 | 477 | ||||||||||||
| DCu, % | 0.171 | 0.182 | 0.184 | 0.182 | 0.171 | 0.153 | 0.160 | 0.164 | 0.157 | 0.137 | 0.137 | ||||||||||||
| DNi, % | 0.058 | 0.064 | 0.062 | 0.057 | 0.055 | 0.052 | 0.054 | 0.059 | 0.058 | 0.052 | 0.053 | ||||||||||||
| CuEq Mill, % | 0.348 | 0.364 | 0.364 | 0.370 | 0.355 | 0.324 | 0.324 | 0.335 | 0.322 | 0.293 | 0.292 | ||||||||||||
| Ore from Stockpile | |||||||||||||||||||||||
| ktons | 26,133 | 5,583 | 11,600 | 8,950 | |||||||||||||||||||
| DCu, % | 0.171 | 0.171 | 0.171 | 0.171 | |||||||||||||||||||
| DNi, % | 0.058 | 0.058 | 0.058 | 0.058 | |||||||||||||||||||
| Cu-Eq Mill, % | 0.348 | 0.348 | 0.348 | 0.348 | |||||||||||||||||||
| Mill Feed | |||||||||||||||||||||||
| ktons | 225,000 | 7,250 | 11,600 | 11,600 | 11,600 | 11,600 | 11,600 | 11,600 | 11,600 | 11,600 | 11,600 | 11,600 | 11,600 | 11,600 | 11,600 | 11,600 | 11,600 | 11,600 | 11,600 | 11,600 | 8,950 | ||
| DCu, % | 0.295 | 0.348 | 0.358 | 0.355 | 0.334 | 0.334 | 0.333 | 0.334 | 0.314 | 0.300 | 0.280 | 0.273 | 0.268 | 0.274 | 0.275 | 0.287 | 0.292 | 0.322 | 0.261 | 0.171 | 0.171 | ||
| DNi, % | 0.085 | 0.103 | 0.105 | 0.095 | 0.087 | 0.086 | 0.089 | 0.097 | 0.093 | 0.085 | 0.083 | 0.082 | 0.083 | 0.083 | 0.081 | 0.080 | 0.081 | 0.088 | 0.077 | 0.058 | 0.058 | ||
| CuEq Mill, % | 0.586 | 0.688 | 0.712 | 0.716 | 0.674 | 0.662 | 0.664 | 0.664 | 0.619 | 0.597 | 0.555 | 0.559 | 0.562 | 0.548 | 0.540 | 0.563 | 0.564 | 0.613 | 0.505 | 0.348 | 0.348 | ||
| Waste, ktons | Total | 348,823 | 25,868 | 23,913 | 20,204 | 24,518 | 26,888 | 26,601 | 17,142 | 16,743 | 18,379 | 19,923 | 20,400 | 17,280 | 15,509 | 16,440 | 15,085 | 16,433 | 18,030 | 9,467 | 0 | ||
| Cat 1 | 212,065 | 16,686 | 13,409 | 13,462 | 18,810 | 20,864 | 20,088 | 10,802 | 7,235 | 10,477 | 11,283 | 12,180 | 10,462 | 8,637 | 8,939 | 7,730 | 8,177 | 9,222 | 3,602 | ||||
| Cat 2 | 95,980 | 4,029 | 5,191 | 4,814 | 4,740 | 4,830 | 4,978 | 4,792 | 7,307 | 5,571 | 5,740 | 5,637 | 4,591 | 4,601 | 5,425 | 6,104 | 6,838 | 6,895 | 3,897 | ||||
| Cat 3 | 23,490 | 1,200 | 1,713 | 821 | 810 | 979 | 1,166 | 1,094 | 1,435 | 1,710 | 2,020 | 2,023 | 1,623 | 1,576 | 1,351 | 954 | 1,143 | 851 | 1,021 | ||||
| Cat 4 | 17,288 | 3,953 | 3,600 | 1,107 | 158 | 215 | 369 | 454 | 766 | 621 | 880 | 560 | 604 | 695 | 725 | 297 | 275 | 1,062 | 947 | ||||
| Total ktons mined | 573,823 | 35,482 | 40,000 | 37,058 | 40,000 | 40,000 | 40,000 | 31,912 | 31,148 | 30,362 | 32,000 | 32,000 | 28,880 | 27,109 | 28,040 | 26,685 | 28,033 | 29,630 | 15,484 | 0 | 0 | ||
| Re-handle, ktons | |||||||||||||||||||||||
| Stockpiled ore to mill | 26,133 | 0 | 0 | 0 | 0 | 0 | 0 | 0 | 0 | 0 | 0 | 0 | 0 | 0 | 0 | 0 | 0 | 0 | 5,583 | 11,600 | 8,950 | ||
| Waste rock to pit backfill | 60,521 | 0 | 0 | 0 | 0 | 0 | 0 | 0 | 0 | 7,384 | 7,385 | 2,000 | 2,000 | 2,000 | 1,000 | 3,021 | 2,812 | 1,000 | 10,000 | 18,270 | 3,649 | ||
| Total ktons moved | 660,477 | 35,482 | 40,000 | 37,058 | 40,000 | 40,000 | 40,000 | 31,912 | 31,148 | 37,746 | 39,385 | 34,000 | 30,880 | 29,109 | 29,040 | 29,706 | 30,845 | 30,630 | 31,067 | 29,870 | 12,599 | ||
| Year -1 | Year 1 | Year 2 | Year 3 | Year 4 | Year 5 | Year 6 | Year 7 | Year 8 | Year 9 | Year 10 | Year 11 | Year 12 | Year 13 | Year 14 | Year 15 | Year 16 | Year 17 | Year 18 | Year 19 | Year 20 | |||
| M3-PN150164 26 March 2018 |
140
NorthMet Project
Form NI 43-101F1 Technical Report
Table 16‑4: Yearly Mill Feed Schedule
| Total | Year -1 | Year 1 | Year 2 | Year 3 | Year 4 | Year 5 | Year 6 | Year 7 | Year 8 | Year 9 | Year 10 | Year 11 | Year 12 | Year 13 | Year 14 | Year 15 | Year 16 | Year 17 | Year 18 | Year 19 | Year 20 | ||
| Mill Feed | |||||||||||||||||||||||
| ktons | 225,000 | 7,250 | 11,600 | 11,600 | 11,600 | 11,600 | 11,600 | 11,600 | 11,600 | 11,600 | 11,600 | 11,600 | 11,600 | 11,600 | 11,600 | 11,600 | 11,600 | 11,600 | 11,600 | 11,600 | 8,950 | ||
| Cu, % | 0.295 | 0.348 | 0.358 | 0.355 | 0.334 | 0.334 | 0.333 | 0.334 | 0.314 | 0.300 | 0.280 | 0.273 | 0.268 | 0.274 | 0.275 | 0.287 | 0.292 | 0.322 | 0.261 | 0.171 | 0.171 | ||
| Ni, % | 0.085 | 0.103 | 0.105 | 0.095 | 0.087 | 0.086 | 0.089 | 0.097 | 0.093 | 0.085 | 0.083 | 0.082 | 0.083 | 0.083 | 0.081 | 0.080 | 0.081 | 0.088 | 0.077 | 0.058 | 0.058 | ||
| Co, ppm | 74.81 | 76.80 | 79.42 | 75.82 | 74.76 | 75.08 | 75.65 | 75.37 | 76.05 | 77.94 | 78.40 | 75.80 | 77.64 | 78.99 | 75.79 | 73.91 | 71.61 | 74.26 | 71.13 | 65.15 | 65.15 | ||
| Pt, ppb | 79.17 | 78.22 | 81.30 | 104.06 | 109.22 | 104.85 | 97.85 | 77.81 | 72.38 | 87.01 | 73.73 | 76.66 | 81.22 | 74.89 | 70.80 | 82.01 | 72.31 | 71.84 | 61.78 | 49.10 | 49.10 | ||
| Pd, ppb | 269.24 | 310.11 | 329.56 | 351.38 | 331.74 | 309.01 | 313.93 | 315.40 | 281.24 | 267.92 | 237.84 | 272.02 | 273.27 | 238.19 | 233.30 | 250.91 | 252.95 | 270.74 | 214.86 | 160.50 | 160.50 | ||
| Au, ppb | 39.01 | 38.53 | 41.95 | 51.50 | 52.27 | 49.22 | 46.14 | 39.16 | 36.31 | 41.39 | 36.23 | 37.91 | 38.38 | 35.49 | 34.39 | 38.32 | 37.13 | 39.29 | 32.56 | 25.38 | 25.38 | ||
| Ag, ppm | 1.06 | 1.24 | 1.28 | 1.23 | 1.19 | 1.23 | 1.20 | 1.21 | 1.19 | 1.08 | 1.02 | 0.98 | 0.96 | 0.98 | 0.99 | 1.01 | 1.05 | 1.11 | 0.92 | 0.65 | 0.65 | ||
| S, % | 0.66 | 0.92 | 0.95 | 0.72 | 0.55 | 0.57 | 0.64 | 0.79 | 0.78 | 0.62 | 0.72 | 0.60 | 0.60 | 0.69 | 0.65 | 0.58 | 0.55 | 0.68 | 0.62 | 0.48 | 0.48 | ||
| Cu-Eq Mill, % | 0.586 | 0.688 | 0.712 | 0.716 | 0.674 | 0.662 | 0.664 | 0.664 | 0.619 | 0.597 | 0.555 | 0.559 | 0.562 | 0.548 | 0.540 | 0.563 | 0.564 | 0.613 | 0.505 | 0.348 | 0.348 | ||
| Contained Copper Pounds x 1000 | |||||||||||||||||||||||
| per year | 50,460 | 83,056 | 82,360 | 77,488 | 77,488 | 77,256 | 77,488 | 72,848 | 69,600 | 64,960 | 63,336 | 62,176 | 63,568 | 63,800 | 66,584 | 67,744 | 74,704 | 60,630 | 39,711 | 30,639 | |||
| cumulative | 50,460 | 133,516 | 215,876 | 293,364 | 370,852 | 448,108 | 525,596 | 598,444 | 668,044 | 733,004 | 796,340 | 858,516 | 922,084 | 985,884 | 1,052,468 | 1,120,212 | 1,194,916 | 1,255,546 | 1,295,257 | 1,325,896 | |||
| Year -1 | Year 1 | Year 2 | Year 3 | Year 4 | Year 5 | Year 6 | Year 7 | Year 8 | Year 9 | Year 10 | Year 11 | Year 12 | Year 13 | Year 14 | Year 15 | Year 16 | Year 17 | Year 18 | Year 19 | Year 20 | |||
| M3-PN150164 26 March 2018 |
141
NorthMet Project
Form NI 43-101F1 Technical Report
| 16.7.2 | Pit and Stockpile Progression Maps |
Maps have been developed showing the progression of pit mining, stockpile geometries and backfilling of completed pits at the end of selected years based on the mine production schedule shown in Table 16‑3. The haul routes used to transport the material are also shown.
| M3-PN150164 26 March 2018 |
142
NorthMet Project
Form NI 43-101F1 Technical Report
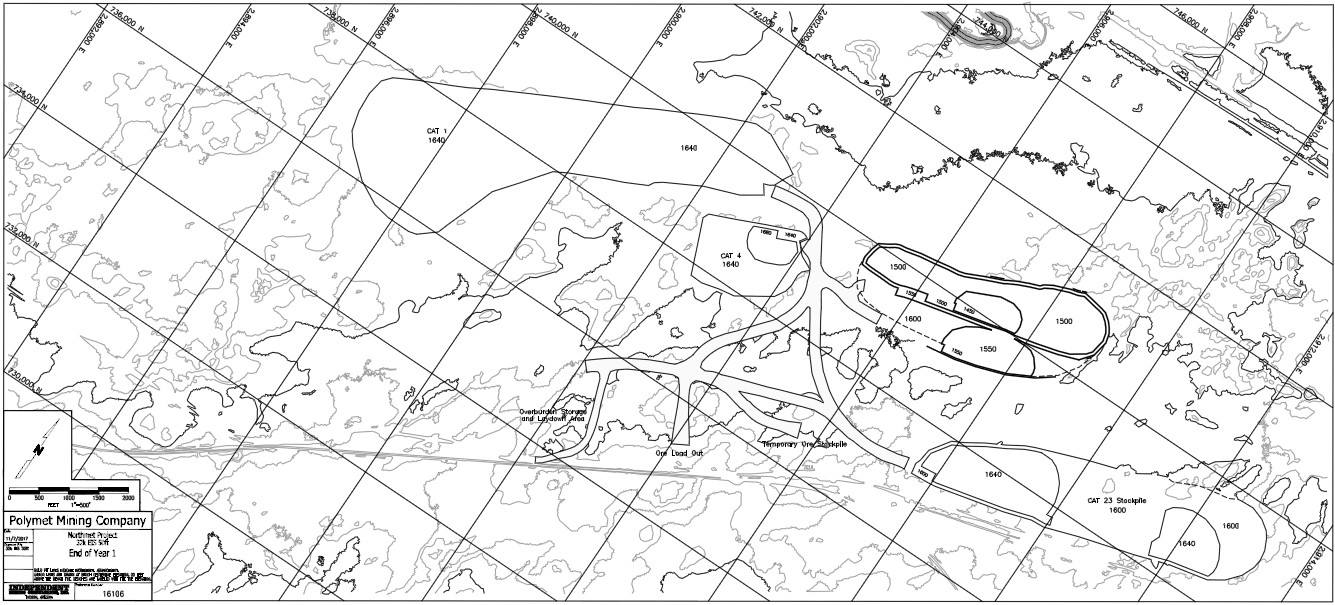
Figure 16‑2: Pit Shell Map – End of Year 1
| M3-PN150164 26 March 2018 |
143
NorthMet Project
Form NI 43-101F1 Technical Report
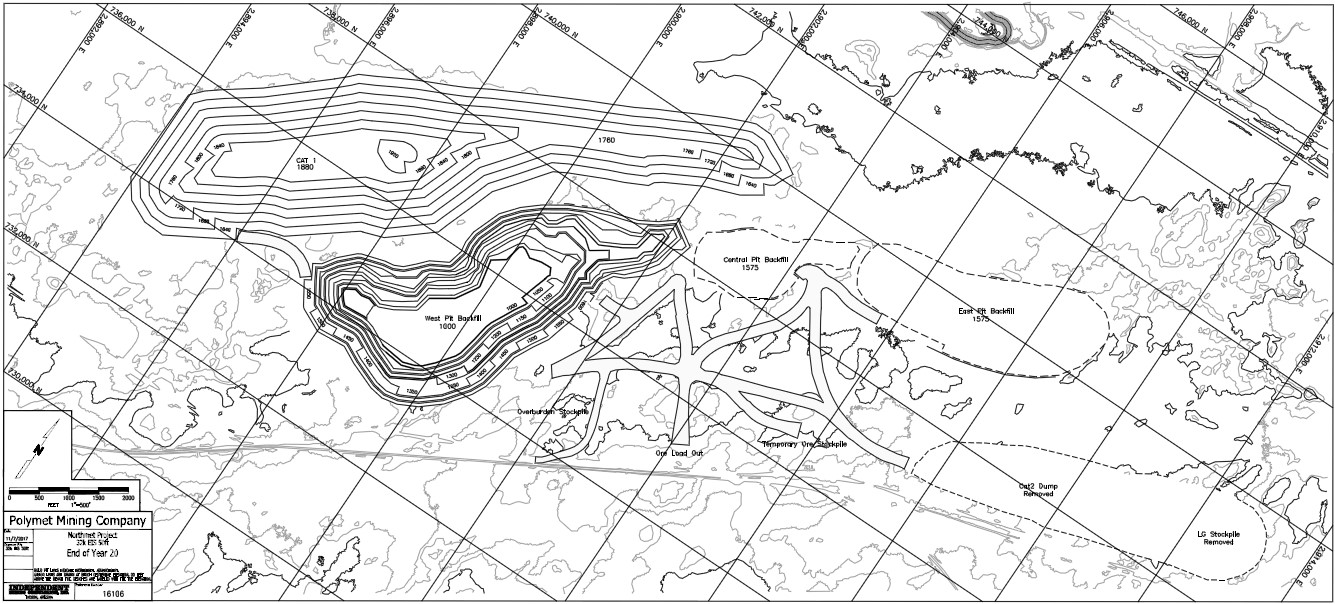
Figure 16‑3: Pit Shell Map – End of Year 20
| M3-PN150164 26 March 2018 |
144
NorthMet Project
Form NI 43-101F1 Technical Report
| 16.8 | Water Management System |
Water at the Mine Site will be segregated as mine water and stormwater. Mine water is defined for this Project as water that has contacted surfaces disturbed by mining activities, such as drainage collected on stockpile liners, pit dewatering water, saturated overburden dewatering water, and runoff contacting ore, waste rock, and Mine Site haul road surfaces. Mine water is collected by mine water management systems at the Mine Site. Mine water runoff from the overburden storage and laydown area or saturated overburden will be routed to the FTB or used to backfill the East Pit during later years of the operation. The rest of the mine water would go through treatment by chemical precipitation or membrane separation treatment prior to discharge to the FTB or, after closure, to the Mine Site
Water at the Plant Site will also be segregated into process water and stormwater. Water collected in the FTB seepage capture systems will be routed to the FTB or WWTS for treatment by membrane separation prior to discharge to wetlands downstream of the FTB seepage capture systems.
Stormwater includes runoff that has not been exposed to active mining activities and includes non-contact, industrial, and construction storm water. These include runoff from natural, stabilized, or reclaimed surfaces, or construction areas consisting primarily of unsaturated overburden or peat. Once areas are reclaimed, runoff is considered stormwater. Stormwater is routed to sedimentation ponds prior to discharge off-site to tributaries to the Partridge River.
A diagram of the Process Plant Water Balance is included in Figure 16‑4.
| M3-PN150164 26 March 2018 |
145
NorthMet Project
Form NI 43-101F1 Technical Report

Figure 16‑4: Process Plant Water Balance
| M3-PN150164 26 March 2018 |
146
NorthMet Project
Form NI 43-101F1 Technical Report
| 16.9 | Mining Equipment |
| 16.9.1 | Production Schedule Parameters |
The mine production schedule is based on a 7 day per week schedule, with two 12-hour shifts per day. There are four crews planned to cover the rotating schedule. Each 12-hour shift has a one-hour allowance for lunch, equipment inspections, and the start and ending of the shift for a total of 11 effective working hours. Blasting will take place during the day. A job efficiency factor of 50 minutes of work per 60 minutes of scheduled work is included to calculate the net productive operating hours per shift that equipment will be doing work. The job efficiency factor is an allowance for unscheduled delays throughout the shift which impede work. Table 16‑5 shows typical shift and yearly schedule parameters.
Table 16‑5: Mine Schedule Parameters
| Mine Schedule | |
| Crews | 4 |
| Shifts/Day | 2 |
| Hours/Shift | 12 hr. (720 minutes) |
| Lunch, Breaks, etc. | 30 minutes |
| Equipment Inspection | 10 minutes |
| Start-up, Shutdown & Blasting | 10 minutes |
| Fueling, Lube & Service | 10 minutes |
| Scheduled Productive Time | 660 minutes |
| Job Efficiency (50 minutes/hour) | 83.3% |
| Net Productive Minutes/Shift | 550 minutes |
| Days/Year | 360 days |
| Scheduled Shifts/Year | 720 |
The mine maintenance personnel work the same 12-hour shifts, two shifts per day. The schedule productive time for them is 680 minutes per shift (no fueling or vehicle inspection time) resulting in the net productive minutes per shift of 567 minutes. All vehicles shall be inspected per Mine Safety and Health Administration (MSHA) criteria.
The amount of equipment required to meet the scheduled tonnages is calculated based on the mine schedule, equipment availabilities, usages and haul and loading times for the equipment. The equipment requirements to accomplish this mine production schedule are based on PolyMet using a fleet of new equipment and the associated predicted productive time.
Equipment mechanical availabilities and utilization are shown on Table 16‑6. Table 16‑6 also shows the number of units purchased for the mine start-up in Year 1 (initial units) and the maximum number of equipment type in the fleet, for which the utilization values were calculated. Table 16‑6 does not include the replacement or re-build requirements.
Some references to the equipment in the fleet use sizes or type nomenclature related to a particular manufacturer. This is to reference the size or type of equipment and does not imply a recommendation by IMC for a particular manufacturer.
| M3-PN150164 26 March 2018 |
147
NorthMet Project
Form NI 43-101F1 Technical Report
Table 16‑6: Major Mine Equipment Mechanical Availability, Utilization and Fleet Size
| Equipment Type | Mechanical Availability | Utilization of Availability | Maximum Utilization | Initial Units | Maximum Units |
| Rotary Drill (12.25 in) | 0.90 | 0.90 | 0.81 | 2 | 2 |
| Hydraulic Shovel (36.6 cy) | 0.85 | 0.90 | 0.765 | 2 | 2 |
| Front End Loader (22.5 cy) | 0.90 | 0.90 | 0.81 | 1 | 1 |
| Haul Truck (240t) | 0.90 | 0.90 | 0.81 | 6 | 9 |
| Track Dozers (i.e. D8, D9 & D10) or equivalent | 0.90 | 0.75 | 0.675 | 2 | 3 |
| Wheel Dozer (i.e. 562 HP) | 0.88 | 0.75 | 0.66 | 2 | 2 |
| Motor Graders (i.e. 16M & 14M) or equivalent | 0.89 | 0.75 | 0.668 | 2 | 2 |
| Water Truck (i.e. 30,000 Gal) | 0.90 | 0.75 | 0.675 | 1 | 1 |
| Auxiliary Loader (i.e. 992K) or equivalent | 0.90 | 0.75 | 0.675 | 1 | 1 |
| Auxiliary Truck (i.e. 777G) or equivalent | 0.90 | 0.75 | 0.675 | 1 | 1 |
| Excavator (396 HP) | 0.89 | 0.95 | 0.846 | 1 | 1 |
| Multi Engine Locomotive (i.e. 2100 HP) | 0.90 | 0.95 | 0.855 | 4 | 4 |
| Switch Locomotive (i.e. 700 HP) | 0.90 | 0.95 | 0.855 | 1 | 1 |
| 16.9.2 | Drill Equipment and Blast Parameters |
Two 12.25-inch rotary blast hole drills will meet the drilling requirements of the mine production schedule.
Table 16‑7 shows the drill productivity for each material type. Both machines are new, one being electric and one being diesel powered as specified by PolyMet.
Table 16‑7: Drill Productivity
| ORE | CAT1 | CAT23 | CAT4 | ||
| 50 ft | 50 ft | 50 ft | 50 ft | ||
| Dry | Dry | Dry | Dry | ||
| Hole Diameter | (in) | 12.25 | 12.25 | 12.25 | 12.25 |
| Bench Height | (ft.) | 50 | 50 | 50 | 50 |
| Subgrade | (ft.) | 6.3 | 7.5 | 7.5 | 7.5 |
| Powder Spg. Loaded | (none) | 1.25 | 1.25 | 1.25 | 1.25 |
| Powder Factor | (lbs./st) | 0.70 | 0.46 | 0.46 | 0.46 |
| Bank Density | (cu ft./st) | 10.909 | 10.909 | 10.909 | 10.909 |
| Powder Load | (lbs./ft.) | 63.84 | 63.84 | 63.84 | 63.8401 |
| Powder Height | (ft.) | 31.33 | 28.25 | 28.25 | 28.2518 |
| Powder Per Hole | (lbs.) | 2000.20 | 1803.60 | 1803.60 | 1803.6 |
| Stemming Height | (ft.) | 24.97 | 29.25 | 29.25 | 29.2482 |
| Rock Mass Per Hole | (st) | 2857.43 | 3920.87 | 3920.87 | 3920.87 |
| Spacing and Burden | (ft.) | 24.97 | 29.25 | 29.25 | 29.25 |
| Drilling Rate | (ft./hr.) | 92.5 | 102.5 | 102.5 | 102.5 |
| Shift Drill Time | (hr.) | 9.17 | 9.17 | 9.17 | 9.17 |
| Shift Total Drilling | (ft.) | 848.13 | 939.59 | 939.59 | 939.59 |
| Shift Production | (st) | 43,046 | 64,070 | 64,070 | 64,070 |
Penetration and Drilling Rate | |||||
| Hole Depth | (ft.) | 56.3 | 57.5 | 57.5 | 57.5 |
| Penetration Rate | (ft./min) | 2.1 | 2.4 | 2.4 | 2.4 |
| Penetration Time Per Hole | (min) | 26.8 | 24.0 | 24.0 | 24.0 |
| Move Time | (min) | 8.2 | 8.2 | 8.2 | 8.2 |
| Steel Changes | (none) | 1 | 1 | 1 | 1 |
| Time Per Steel Change | (min) | 1.5 | 1.5 | 1.5 | 1.5 |
| Operator Efficiency | (%) | 100% | 100% | 100% | 100% |
| Total Time Per Hole | (min) | 36.5 | 33.7 | 33.7 | 33.7 |
| Holes Per Hour | (holes) | 1.64 | 1.78 | 1.78 | 1.78 |
| Average Drilling Rate | (ft./hr.) | 92.5 | 102.5 | 102.5 | 102.5 |
| M3-PN150164 26 March 2018 |
148
NorthMet Project
Form NI 43-101F1 Technical Report
| 16.9.3 | Loading Equipment Requirements |
The loading of the blasted material will be done with two 36.6-cy hydraulic front shovels and one 22.5-cy front end loader. The hydraulic shovels will be the primary loading equipment with the front-end loader working as a back-up to the shovels and in the lower productivity areas of small tonnage benches or clean up areas. Table 16‑8 shows the loading equipment productivities for waste rock.
Table 16‑8: Loading Equipment Productivity
| Hydraulic Shovel | Front End Loader | ||||
| Units | Cat 1 Rock | Cat 2,3,4 Rk | Cat 1 Rock | Cat 2,3,4 Rk | |
| Bucket Capacity | (lcy) | 36.6 | 36.6 | 22.5 | 22.5 |
| Dry Bank Density | (cu ft./st) | 11.28 | 10.91 | 11.28 | 10.91 |
| Swell | (%) | 35% | 35% | 3.50% | 35.0% |
| Moisture Content | (%) | 2.5% | 2.5% | 2.5% | 2.5% |
| Bucket Fill Factor | (None) | 0.95 | 0.95 | 0.90 | 0.90 |
| Tons / Pass (Dry) | (st) | 63.19 | 65.33 | 35.90 | 37.12 |
| Tons/ Pass (Wet) | (st) | 61.65 | 63.74 | 36.80 | 38.05 |
| Shovel Cycle Time / Pass | (min) | 0.55 | 0.55 | 0.66 | 0.66 |
| Waiting for Truck | (min) | 0.00 | 0.00 | 0.00 | 0.00 |
| Truck Spot Time | (min) | 0.50 | 0.50 | 0.75 | 0.75 |
| Shovel Dump Time | (min) | N.A. | N.A. | N.A. | N.A. |
| Passes / Truck | (passes) | 4.0 | 4.0 | 7.0 | 7.0 |
| Tons Per Truck (Dry) | (st) | 234.5 | 234.5 | 234.5 | 234.5 |
| Tons Per Truck (Wet) | (st) | 240.3 | 240.3 | 240.3 | 240.3 |
| Payload Fill Factor | (none) | 1.00 | 1.00 | 0.98 | 0.98 |
| Last Bucket | (none) | Partial | Partial | Partial | Partial |
| Total Time / Truck | (min) | 2.70 | 2.70 | 5.37 | 5.37 |
| Shift Loading Time | (min) | 550 | 550 | 550 | 550 |
| Truck Loads / Shift | (loads) | 203.70 | 203.70 | 102.42 | 102.42 |
| Shift Production (Dry) | (st) | 47,760 | 47,760 | 24,013 | 24,013 |
| Truck Specifications: | |||||
| Gross Vehicle Weight | (lbs.) | 860,000 | 860,000 | 860,00 | 860,000 |
| Empty Vehicle Weight | (lbs.) | 379,360 | 379,360 | 379,360 | 379,36 |
| Truck Rated Payload | (st) | 240.3 | 240.3 | 240.3 | 240.3 |
| Truck Body Capacity | (lcy) | 250.0 | 250.0 | 250.0 | 250.0 |
| Allowable GVW Overload | (%) | 0% | 0% | 0% | 0% |
| Payload Limit (Dry Tons) | (st) | 234.5 | 234.5 | 234.5 | 234.5 |
| Body Limit (Dry Tons) | (st) | 443.3 | 458.3 | 443.3 | 458.3 |
| M3-PN150164 26 March 2018 |
149
NorthMet Project
Form NI 43-101F1 Technical Report
| 16.9.4 | Hauling Equipment Requirements |
The haulage equipment requirements have been developed based on the tonnage moved each year. All of the haul routes have been measured and the travel times simulated. Table 16‑9 shows the truck requirements by year. A maximum fleet of nine 240-ton haul trucks is needed with a maximum of eight trucks operating in any year. The inputs to the truck simulation runs include:
| · | Fixed time for loading and dumping when loaded by the hydraulic shovel |
| o | Ore, 4.00 minutes; waste, 3.90 minutes |
| · | Fixed time for loading and dumping when loaded by the front-end loader |
| o | Ore, 6.67 minutes; waste 6.57 minutes |
| · | Maximum speeds: downhill > 6% is 18 mph, switchbacks are 15 mph, flats are 35 mph |
The truck fleet requirements are based on 90% of the material being loaded by the hydraulic shovels during year 1 through 3 and 97% by the hydraulic shovels during years 3 through 17. The number of average operating trucks shown in Table 16‑9 is before mechanical availability is included. The required truck fleet is the total number of trucks necessary to be ready and available for service. After year 6 there may be more trucks on the property than required as fleet requirements will reduce.
Table 16‑9: Truck Fleet Requirements
| Year | Average Operating | Required Fleet | Utilization |
| 1 | 4.48 | 6 | 0.75 |
| 2 | 6.55 | 8 | 0.82 |
| 3 | 5.21 | 7 | 0.74 |
| 4 | 5.51 | 7 | 0.79 |
| 5 | 6.53 | 8 | 0.82 |
| 6 | 7.40 | 9 | 0.82 |
| 7 | 6.96 | 9 | 0.77 |
| 8 | 5.39 | 7 | 0.77 |
| 9 | 7.20 | 9 | 0.80 |
| 10 | 7.34 | 9 | 0.82 |
| 11 | 6.21 | 8 | 0.78 |
| 12 | 6.10 | 8 | 0.76 |
| 13 | 5.99 | 8 | 0.75 |
| 14 | 6.27 | 8 | 0.78 |
| 15 | 6.08 | 8 | 0.76 |
| 16 | 6.67 | 9 | 0.74 |
| 17 | 7.46 | 9 | 0.83 |
| 18 | 6.38 | 8 | 0.80 |
| 19 | 4.60 | 6 | 0.77 |
| 20 | 2.03 | 3 | 0.68 |
| 16.9.5 | Auxiliary Equipment Requirements |
The auxiliary equipment fleet is sized to handle all of the on-going road construction and maintenance, dump maintenance and clean up around the loading areas. Four multi-engine locomotives (2100 HP) are included in the fleet to transport the loaded ore cars from the Mine Site to the process plant, located eight miles west from the mine. Smaller support equipment is included in the fleet and a complete list is included in the mine capital cost section of this report. This equipment includes 700 HP switch locomotive, fuel truck, lube truck, light plants, blast hole stemmer, cable handler, dewatering pumps, mine pickup trucks, and additional support equipment.
| M3-PN150164 26 March 2018 |
150
NorthMet Project
Form NI 43-101F1 Technical Report
| 16.10 | Railroad |
PolyMet will utilize existing, private railroad infrastructure to transport ore from the Mine Site to the Coarse Crusher at the Plant Site, receive incoming process consumables and supplies and to stage outgoing railcars containing the final products on common carrier Canadian National (CN) track for shipping. The existing private railroad infrastructure was constructed by the original operator, Erie Mining Company, and consisted of two railroads; one for hauling run-of-mine ore from the operating pits to the Coarse Crusher and the second for hauling the product, taconite pellets, to Taconite Harbor on Lake Superior. To insure consistent operations, it was critical to the previous site operators that the two railroads were reliable, therefore the railroad infrastructure was well maintained. The track to be used by PolyMet for ore haulage between the Mine Site and the Plant Site is 136-pound per yard (#) and 140# rail, with much of the 140# rail being welded. In 1999 a major railroad tie replacement program took place. PolyMet has agreements in place with Cliffs Erie as part of its contract for deed arrangements with Cliffs Erie to utilize the existing railroad lines that will continue to be owned by Cleveland Cliffs.
As noted in Section 16.6.3, two new segments of railroad tracks will be constructed and as noted in Section 18.2.3, an ore storage and loading pocket, also known as the rail transfer hopper, will be re-constructed at the Mine Site. The rail transfer hopper is the transfer point where the run-of-mine ore is placed into the side dump rail cars for hauling to the Coarse Crusher.
In addition to the railroads and the loading pocket, infrastructure such as fueling stations, sand towers and maintenance facilities, are in place and will be refurbished and returned to service by PolyMet.
PolyMet acquired 120, 100-ton Difco side dump cars, for carrying the run-of-mine ore, from the previous operator. These ore cars need inspections of the air and braking systems, wheel sets and draft gears and pockets. Repairs will be made prior to being released for duty. In addition, adjustments will be made to the doors, dumping arms and linkages to minimize the gaps along the hinges and joint areas by replacing and tightening worn linkages, pins and bushings to insure proper operation while in transit from the Mine Site and when being dumped at the Coarse Crusher. Components such as brake shoes, hoses and bearings will also be replaced as needed.
Locomotives for the hauling of run-of-mine ore duty and switching incoming and outgoing product and consumable railcars will be obtained by purchase or lease.
The rail road requirements are based on the following assumptions:
| · | Live Capacity of the RTH as currently planned is 3000 to 3500 tons |
| · | Capacity of each rail car is 100 tons |
| · | Availability of the Crusher and RTH is 22 hrs/day |
| · | There are four trains; three in service, one as a spare |
| · | Train sets are comprised of 1 locomotive with 16 cars. |
| · | Dumping/Loading/Spotting of a 16-car train can be accomplished in approximately 30 to 40 minutes |
| · | Each loaded train set shall deliver ore to the existing primary crusher dump pocket at a rate of approximately 6-7 trains per day. |
A round trip between the crusher and RTH/Transfer Yard takes 1.8 hours. 20 trains/day split over 3 shifts, requiring 3 crews/shift (or 6 crews/day) to deliver the necessary tonnage.
This operating scenario will require 64 active rail cars.
Plans are to rehabilitate 4300 ft of the rail road tracks and road bed from the Primary Crusher to the Area 2 shops and replace worn rail along the route from the Area 2 shops to the mine. Sixty-four of the existing 120 rail cars requiring minor repairs will be refurbished and put into operation initially. Additionally, sixty-four (64) rail cars will be completely overhauled in lots of 16 spread over 4 years. These 64 overhauled railcars will replace the 64 initially put into service.
| M3-PN150164 26 March 2018 |
151
NorthMet Project
Form NI 43-101F1 Technical Report
| 16.11 | Mine Personnel |
The mine personnel requirements are based on the annual shift schedule, the tonnages of material mined and moved and the number of pieces of equipment in operation. The equipment operator requirements assume that the operators are trained on multiple types of equipment and can move between types of equipment as needed to achieve the mine production schedule. Blasting personnel and tire crews are not required as these tasks will be contracted out. A fuel crew is not required. It is assumed that operators of rubber tired equipment will fuel their own machines and tracked equipment will be fueled by the mine operations service crew. See Table 16‑10 and Table 16‑11.
| M3-PN150164 26 March 2018 |
152
NorthMet Project
Form NI 43-101F1 Technical Report
Table 16‑10: Mine Operations and Maintenance Personnel
| JOB TITLE | 1 | 2 | 3 | 4 | 5 | 6 | 7 | 8 | 9 | 10 | 11 | 12 | 13 | 14 | 15 | 16 | 17 | 18 | 19 | 20 | ||
| MINE OPERATIONS: | ||||||||||||||||||||||
| Drill Operator | 8 | 8 | 8 | 8 | 8 | 8 | 8 | 8 | 8 | 8 | 8 | 8 | 8 | 8 | 8 | 8 | 8 | 8 | 0 | 0 | ||
| Shovel Operator | 8 | 8 | 8 | 8 | 8 | 8 | 8 | 8 | 8 | 8 | 8 | 8 | 4 | 4 | 4 | 8 | 8 | 4 | 4 | 4 | ||
| Loader Operator | 4 | 4 | 4 | 4 | 4 | 4 | 4 | 4 | 4 | 4 | 4 | 4 | 4 | 4 | 4 | 4 | 4 | 4 | 4 | 4 | ||
| Haul Truck Driver | 21 | 31 | 25 | 26 | 31 | 35 | 33 | 26 | 34 | 35 | 30 | 29 | 29 | 30 | 29 | 32 | 35 | 30 | 22 | 10 | ||
| Track & RT Dozer Operator | 7 | 7 | 8 | 8 | 8 | 8 | 8 | 9 | 9 | 9 | 9 | 9 | 10 | 9 | 9 | 9 | 9 | 8 | 5 | 5 | ||
| Grader Operator | 5 | 5 | 6 | 5 | 5 | 5 | 6 | 6 | 6 | 6 | 6 | 6 | 7 | 6 | 6 | 6 | 6 | 5 | 3 | 3 | ||
| Water Truck Operator | 3 | 3 | 3 | 3 | 3 | 3 | 3 | 3 | 3 | 3 | 3 | 3 | 4 | 3 | 3 | 3 | 3 | 3 | 2 | 2 | ||
| Utility Equip Operator (Service Crew) | 5 | 5 | 9 | 9 | 9 | 9 | 9 | 9 | 9 | 9 | 9 | 9 | 9 | 9 | 9 | 9 | 9 | 9 | 9 | 9 | ||
| Locomotive Operator | 12 | 12 | 12 | 12 | 12 | 12 | 12 | 12 | 12 | 12 | 12 | 12 | 12 | 12 | 12 | 12 | 12 | 12 | 12 | 12 | ||
| Switch Operators | 4 | 4 | 4 | 4 | 4 | 4 | 4 | 4 | 4 | 4 | 4 | 4 | 4 | 4 | 4 | 4 | 4 | 4 | 4 | 4 | ||
| Rail Maintenance | 8 | 8 | 8 | 8 | 8 | 8 | 8 | 8 | 8 | 8 | 8 | 8 | 8 | 8 | 8 | 8 | 8 | 8 | 8 | 8 | ||
| WWTS Process Tech | 5 | 6 | 6 | 6 | 6 | 6 | 6 | 6 | 6 | 6 | 6 | 6 | 6 | 6 | 6 | 6 | 6 | 6 | 6 | 6 | ||
| WWTS Maintenance Tech | 5 | 6 | 6 | 6 | 6 | 6 | 6 | 6 | 6 | 6 | 6 | 6 | 6 | 6 | 6 | 6 | 6 | 6 | 6 | 6 | ||
| Mine Dispatcher | 4 | 4 | 4 | 4 | 4 | 4 | 4 | 4 | 4 | 4 | 4 | 4 | 4 | 4 | 4 | 4 | 4 | 4 | 4 | 4 | ||
| Operations Total | 99 | 111 | 111 | 111 | 116 | 120 | 119 | 113 | 121 | 122 | 117 | 116 | 115 | 113 | 112 | 119 | 122 | 111 | 89 | 77 | ||
| MINE MAINTENANCE: | ||||||||||||||||||||||
| Senior Maintenance Mechanics | 14 | 17 | 17 | 17 | 18 | 19 | 19 | 18 | 18 | 19 | 18 | 18 | 18 | 18 | 17 | 20 | 19 | 18 | 13 | 11 | ||
| Maintenance Technicians | 7 | 9 | 9 | 9 | 9 | 10 | 10 | 9 | 9 | 10 | 9 | 9 | 9 | 9 | 9 | 10 | 10 | 9 | 7 | 6 | ||
| Welder / Mechanic | 6 | 8 | 8 | 8 | 8 | 9 | 9 | 8 | 8 | 9 | 8 | 8 | 8 | 8 | 8 | 9 | 9 | 8 | 6 | 5 | ||
| Electrician | 6 | 8 | 8 | 8 | 8 | 9 | 9 | 8 | 8 | 9 | 8 | 8 | 8 | 8 | 8 | 9 | 9 | 8 | 6 | 5 | ||
| Maintenance Total | 33 | 42 | 42 | 42 | 43 | 47 | 47 | 43 | 43 | 47 | 43 | 43 | 43 | 43 | 42 | 48 | 47 | 43 | 32 | 27 | ||
| GS&A at | 10.0% | 13 | 15 | 15 | 15 | 16 | 17 | 17 | 16 | 16 | 17 | 16 | 16 | 16 | 16 | 15 | 17 | 17 | 15 | 12 | 10 | |
| TOTAL LABOR REQUIREMENT | 145 | 168 | 168 | 168 | 175 | 184 | 183 | 172 | 180 | 186 | 176 | 175 | 174 | 172 | 169 | 184 | 186 | 169 | 133 | 114 | ||
| Maint/Operations Ratio | 0.33 | 0.38 | 0.38 | 0.38 | 0.37 | 0.39 | 0.39 | 0.38 | 0.36 | 0.39 | 0.37 | 0.37 | 0.37 | 0.38 | 0.38 | 0.40 | 0.39 | 0.39 | 0.36 | 0.35 | ||
| Maint/Operations Ratio NO RAIL (mine only) | 0.44 | 0.48 | 0.48 | 0.48 | 0.47 | 0.49 | 0.49 | 0.48 | 0.44 | 0.48 | 0.46 | 0.47 | 0.47 | 0.48 | 0.48 | 0.51 | 0.48 | 0.49 | 0.49 | 0.51 | ||
| Notes: 1. Utility Crew operates Aux Loader, Aux Trucks, Excavators, etc. | ||||||||||||||||||||||
| M3-PN150164 26 March 2018 |
153
NorthMet Project
Form NI 43-101F1 Technical Report
Table 16‑11: Mine Operations and Maintenance Salary Personnel
| JOB TITLE | 1 | 2 | 3 | 4 | 5 | 6 | 7 | 8 | 9 | 10 | 11 | 12 | 13 | 14 | 15 | 16 | 17 | 18 | 19 | 20 | |
| MINE OPERATIONS: | |||||||||||||||||||||
| Mine Division Manager | 1 | 1 | 1 | 1 | 1 | 1 | 1 | 1 | 1 | 1 | 1 | 1 | 1 | 1 | 1 | 1 | 1 | 1 | 1 | ||
| Mine Operations Manager | 1 | 1 | 1 | 1 | 1 | 1 | 1 | 1 | 1 | 1 | 1 | 1 | 1 | 1 | 1 | 1 | 1 | 1 | 1 | 1 | |
| FL Supervisors | 4 | 4 | 4 | 4 | 4 | 4 | 4 | 4 | 4 | 4 | 4 | 4 | 4 | 4 | 4 | 4 | 4 | 4 | 4 | 4 | |
| Rail Operations Manager | 1 | 1 | 1 | 1 | 1 | 1 | 1 | 1 | 1 | 1 | 1 | 1 | 1 | 1 | 1 | 1 | 1 | 1 | 1 | 1 | |
| Rail Supervisors | 3 | 4 | 4 | 4 | 4 | 4 | 4 | 4 | 4 | 4 | 4 | 4 | 4 | 4 | 4 | 4 | 4 | 4 | 4 | 4 | |
| Mine Operations Total | 10 | 11 | 11 | 11 | 11 | 11 | 11 | 11 | 11 | 11 | 11 | 11 | 11 | 11 | 11 | 11 | 11 | 11 | 11 | 10 | |
| MINE MAINTENANCE: | |||||||||||||||||||||
| Maint. Superintendent (None) | |||||||||||||||||||||
| Mine Maintenance Manager | 1 | 1 | 1 | 1 | 1 | 1 | 1 | 1 | 1 | 1 | 1 | 1 | 1 | 1 | 1 | 1 | 1 | 1 | 1 | ||
| FL Supervisors Mnt | 4 | 4 | 4 | 4 | 4 | 4 | 4 | 4 | 4 | 4 | 4 | 4 | 4 | 4 | 4 | 4 | 4 | 4 | 4 | 2 | |
| Planner/Clerk | 1 | 1 | 1 | 1 | 1 | 1 | 1 | 1 | 1 | 1 | 1 | 1 | 1 | 1 | 1 | 1 | 1 | 1 | 1 | ||
| Mine Maintenance Total | 6 | 6 | 6 | 6 | 6 | 6 | 6 | 6 | 6 | 6 | 6 | 6 | 6 | 6 | 6 | 6 | 6 | 6 | 6 | 2 | |
| MINE ENGINEERING: | |||||||||||||||||||||
| Senior Mining Engineer | 1 | 1 | 1 | 1 | 1 | 1 | 1 | 1 | 1 | 1 | 1 | 1 | 1 | 1 | 1 | 1 | 1 | 1 | 1 | 1 | |
| Junior Mining Engineer | 2 | 2 | 2 | 2 | 2 | 2 | 2 | 2 | 2 | 2 | 2 | 2 | 2 | 2 | 2 | 2 | 1 | ||||
| Mine Dispatcher | 1 | 1 | 1 | 1 | 1 | 1 | 1 | 1 | 1 | 1 | 1 | 1 | 1 | 1 | 1 | 1 | 1 | ||||
| Chief Surveyor | 1 | 1 | 1 | 1 | 1 | 1 | 1 | 1 | 1 | 1 | 1 | 1 | 1 | 1 | 1 | 1 | 1 | ||||
| Surveyor | 1 | 1 | 1 | 1 | 1 | 1 | 1 | 1 | 1 | 1 | 1 | 1 | 1 | 1 | 1 | 1 | 1 | ||||
| WWTS Supervisor | 1 | 1 | 1 | 1 | 1 | 1 | 1 | 1 | 1 | 1 | 1 | 1 | 1 | 1 | 1 | 1 | 1 | 1 | 1 | 1 | |
| WWTS Foreman | 3 | 4 | 4 | 4 | 4 | 4 | 4 | 4 | 4 | 4 | 4 | 4 | 4 | 4 | 4 | 4 | 4 | 4 | 4 | 4 | |
| Mine Engineering Total | 10 | 11 | 11 | 11 | 11 | 11 | 11 | 11 | 11 | 11 | 11 | 11 | 11 | 11 | 11 | 11 | 10 | 6 | 6 | 6 | |
| MINE GEOLOGY: | |||||||||||||||||||||
| Senior Mine Geologist | 1 | 1 | 1 | 1 | 1 | 1 | 1 | 1 | 1 | 1 | 1 | 1 | 1 | 1 | 1 | 1 | 1 | 1 | |||
| Mine Geologist | 2 | 2 | 2 | 2 | 2 | 2 | 2 | 2 | 2 | 2 | 2 | 2 | 2 | 2 | 2 | 2 | 2 | 2 | |||
| Geo Tech - Sampler | 2 | 2 | 2 | 2 | 2 | 2 | 2 | 2 | 2 | 2 | 2 | 2 | 2 | 2 | 2 | 2 | 2 | 2 | |||
| Mine Geology Total | 5 | 5 | 5 | 5 | 5 | 5 | 5 | 5 | 5 | 5 | 5 | 5 | 5 | 5 | 5 | 5 | 5 | 5 | 0 | 0 | |
| TOTAL PERSONNEL | 31 | 33 | 33 | 33 | 33 | 33 | 33 | 33 | 33 | 33 | 33 | 33 | 33 | 33 | 33 | 33 | 32 | 28 | 23 | 18 |
| M3-PN150164 26 March 2018 |
154
NorthMet Project
Form NI 43-101F1 Technical Report
| 17 | RECOVERY METHODS |
| 17.1 | Plant Design |
| 17.1.1 | Introduction |
The NorthMet Project plant design is based on utilizing as much of the existing infrastructure as feasible, while ensuring a safe and cost effective operating philosophy by incorporating the latest technology.
The original plan for refurbishing the existing Erie plant comminution circuit was reviewed and the following was taken into consideration:
| · | The existing circuit design and equipment is more than 50 years old |
| · | The plant has been idle for more than 15 years |
| · | The complex’s operational and maintenance requirements associated with running a tertiary and quaternary crushing circuit as well as 12 milling streams |
| · | The large number of transfer points associated with the above |
Based on this, the viability of replacing the existing milling circuit with larger, modern mills capable of handling the throughput requirements through a single stream was investigated. A single stream SAG and ball mill circuit with a pebble crusher would mean significant changes to the layout within the concentrator building, but has the following benefits:
| · | Tertiary and quaternary crushing would no longer be required. This eliminates a large portion of the current circuit which is highly maintenance intensive, and also requires significant dust control measures and building heating requirements. |
| · | The ore storage bin operating and discharge methodology would be changed to allow a greater volume of the bin to be used, while also reducing the number of operating transfer points. This would significantly reduce the dust emissions within the concentrator building. |
| · | The new milling circuit would have variable speed control on both mills allowing for greater process control and adaptability to cater to any potential variability in the upstream and downstream process characteristics. |
| · | New larger mills have greater operating efficiencies and less maintenance requirements, therefore reducing operating costs. |
| · | Simplified milling control system as a result of reduced service requirements to the mills. These include process water addition points, lubrication systems monitoring, discharge density and grind size control and ore feed. |
Based on all of the above, the decision to change the milling philosophy to incorporate a new semi autogenous ball-mill-crushing (SABC), circuit was made. The concentrator building was modelled to accommodate the new equipment, while ensuring that the building structure remained as per the original design. The new circuit also allowed for the existing electrical rooms, cranes and process water tanks to be utilized.
Existing equipment was analysed to determine its suitability to the new process. Generally, existing equipment that was found to be compatible with the new process design would require refurbishment. Where possible, the original equipment manufacturers (OEMs) were utilised to determine the refurbishment requirements and costs.
Detailed plant models were developed to identify existing infrastructure and to determine the space available for the new process equipment. Figure 17‑1 illustrates the main buildings that would be utilised in the new plant design.
| M3-PN150164 26 March 2018 |
155
NorthMet Project
Form NI 43-101F1 Technical Report
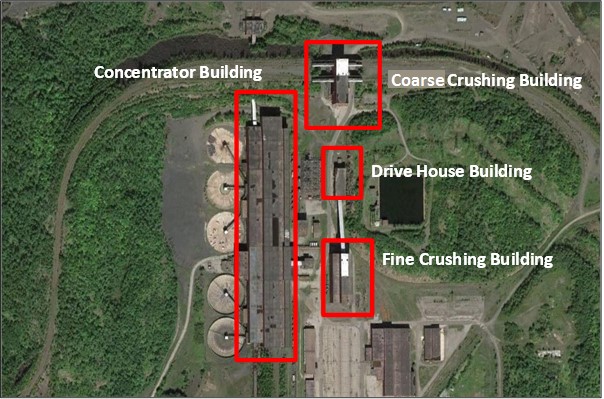
Figure 17‑1: Plant Aerial View
The sections below give a detailed description of the proposed scopes of work associated with incorporating the new design in the different process plant areas.
| 17.1.2 | Crushing and Material Handling |
The Coarse Crushing building and equipment would be used for primary and secondary crushing of the plant ore feed. The building and most structures were found to be in good condition.
A new 60” primary crusher would be installed in the South Coarse Crushing facility. This crusher needs to be replaced as the existing Crusher is beyond economical repair to ensure maximum plant availability. Only one primary crusher would be required to achieve the plant throughput. All crusher auxiliaries including the lubrication unit, drive, counter shaft assembly and hydraulic pack would be replaced with new units and control systems.
The four existing 36” secondary crushers associated with the primary crushing system would require complete refurbishment. The 36” gyratory crusher is no longer a standard available size. In addition to this, modifications were made to these crushers during previous operations to alter the crusher product size. These units would need to be brought back to OEM specification, and all lubrication units, drives, counter shaft assemblies and hydraulic packs for these units would be replaced with new units and control systems.
A new power unit would be installed for the rail car dump system with a manifold type arrangement with new generation valves and proportional control. This would enable the controls to be linked to the plant control system, allowing for finite control and interlocking of the feed system.
| M3-PN150164 26 March 2018 |
156
NorthMet Project
Form NI 43-101F1 Technical Report
All coarse crushing building ancillary systems, including apron discharge chute actuators, HVAC and dust extraction systems would be replaced and refurbished, as required, in order to ensure that the equipment is brought in line with modern operating practices.
The coarse crushing area cranes and rigging equipment would all need to be refurbished and upgraded. It is anticipated that most of these cranes would be refurbished to assist with asset preservation.
The Coarse Crusher conveyor (1A) would need extensive refurbishment and a complete replacement of the entire tail section of this conveyor would be required, as it is currently under ice.
Most chute work would need to be refurbished, modified or replaced to provide for the material properties and throughputs to ensure a simplistic and maintenance friendly operation.
Numerous conveyor leg supports would require replacement. All conveyor pulleys would require new bearings and to be re-lagged. The conveyor take-up systems would require complete refurbishment with new ropes, take-up trolleys and possibly sheaves. These would also need to be checked and adjusted according to the conveyor throughputs and duties. The 2A conveyor drives would be fully refurbished and fitted with new VS drives. Numerous conveyor idlers would require replacement. The conveyor belting would be entirely replaced with a new belt correctly specified according to the conveyor duties. New scrapers and belt cleaners would be installed to ensure simplistic belt cleaning and ease of operation.
A new HVAC and dust extraction system would be installed in the drive / transfer house. New conveyor guarding and safety devices would be installed to ensure that the installation is brought in line with relevant MSHA standards. All walkways and access ways would be refurbished to ensure safe access.
Conveyor 2A, along with the conveyor gallery and support structure, would be modified such that it could then feed onto the existing 4B conveyor. Conveyor 2A is currently equipped with a tripper car that feeds into an ore storage bin for the tertiary and quaternary cone crushers, which will no longer be required. The modified conveyor 2A would discharge into a bin arrangement directly above conveyor 4B. This modification would result in only a portion of the existing Fine Crushing building being utilized. Currently tertiary/third stage and quaternary/fourth stage crushing equipment is located in the fine crushing building. As such, a wall will be built between the operating and redundant section of the building to reduce the HVAC requirements and to allow for the reclamation of equipment and demolition of the redundant section during operations.
The existing 4A and 4B conveyor tail ends are also under water and ice and as such would require extensive refurbishment. 4A and 4B conveyor legs, pulleys, take-ups, drives, idlers and belting would be refurbished or replaced as required. Conveyor 4B discharges onto conveyor 5N, located in the Concentrator building.
Conveyor 5N is equipped with a tripper car that discharges into the concentrator ore storage bins. Modifications to the tripper car trouser leg discharge chutes would be required to provide for the larger ore lump size. Certain 5N conveyor legs, pulleys, take-ups, drives, idlers and belting would be refurbished or replaced as required.
The existing concentrator building would require major demolition work and modifications to accommodate the new SAG and ball mill, as well as their associated feed and slurry handling systems. Figure 17‑2 shows the current Concentrator building arrangement, with the proposed area to be cleared and demolished (where required) to accommodate the new milling circuit.
| M3-PN150164 26 March 2018 |
157
NorthMet Project
Form NI 43-101F1 Technical Report
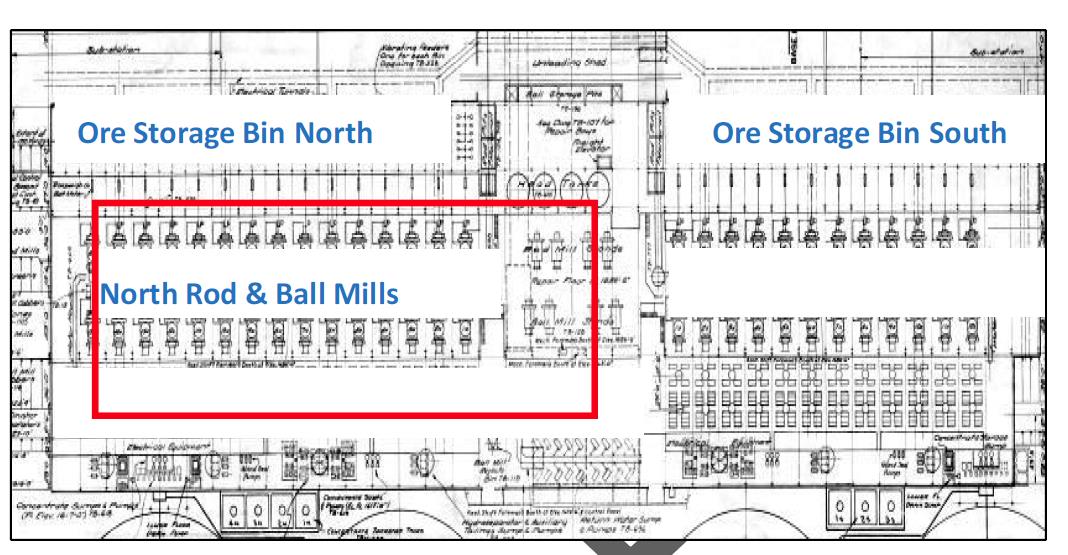
Figure 17‑2: Current Concentrator Arrangement
The existing ore storage bin has a live capacity of approximately 36,000 t, equating to more than 26 hours of residence time. The bin’s discharge slots would require modifications to facilitate the flow of the larger size ore. In addition to this, the existing rod mill feed conveyors and chute work would be entirely removed to allow two new conveyors to be installed below the ore storage bin. The two conveyors would run the length of the ore storage bin allowing for ore to be extracted from different zones within the bin in a controlled manner. These conveyors would feed onto a transfer conveyor. This arrangement reduces the number of transfer points when compared to the old design, from 157 to 62, therefore reducing the dust handling requirements. It also has the added benefit of maximizing the plant ore storage capabilities by allowing for the entire length of the ore storage bin to be utilized.
Modifications would be required to the existing grinding rod storage bays to accommodate the new transfer conveyor. The transfer conveyor would in turn feed a new mill feed conveyor. The mill feed conveyor would be fitted with a weightometer to track and control the rate of ore addition to the SAG mill. A grinding ball loading station incorporating a programmable ball loading table would be installed, to facilitate the loading of steel grinding media onto the mill feed conveyor.
Extensive demolition work would be required within the existing concentrator building to accommodate the following new equipment and infrastructure:
| · | Mill feed conveyor with ball loading table |
| · | 40’ SAG mill with feed chute, 28 MW Gearless Mill Drive (GMD) and lubrication units |
| · | SAG mill structural steel, including the suspended slab for the operation of the mill relining equipment |
| · | Civil bases, spillage containment areas, sumps and surface beds for the SAG mill and structures |
| · | SAG mill liner handler and bolt removal tool |
| · | SAG mill discharge screen |
| · | SAG mill discharge sump |
| · | SAG mill discharge pumps |
| · | 24’ x 37’ Ball mill with feed chute, 14 MW low speed drives and lubrication units |
| · | Two (2) Ball mill cyclone clusters |
| · | Ball mill structural steel, including a suspended slab for the operation of the mill relining equipment |
| M3-PN150164 26 March 2018 |
158
NorthMet Project
Form NI 43-101F1 Technical Report
| · | Civil bases, spillage containment areas, sumps and surface beds for the ball mill and structures |
| · | Ball mill liner handler and bolt removal tool |
| · | Ball mill trommel screen and chute work |
| · | Ball mill discharge sump and pumps |
| · | 2358 cy flotation feed tank, agitator and pumps |
| · | Grinding Media Scats (ore that is not grindable and ejected from the grinding circuit) handling conveyors, bin, chutes, pebble crusher and associated structural steel and civil bases |
| · | Pipe racks |
It is estimated that approximately 2,500 t of existing structural steel would need to be removed from the Concentrator building. Steel that is found to be in good condition could be re-used where possible, while the remaining steel could be sold as scrap. In particular, existing rod mill feed conveyors will be utilized for scats conveyors.
Demolition of the rod and ball mill civil bases, surface beds, suspended slabs and structural steel bases would also be required to ensure a safe and accessible working floor. Additional rock blasting would be required in a limited area to accommodate the SAG mill civil bases, which need to be cast directly onto solid rock below the existing civils. It is estimated that approximately 8371 cy of concrete would need to be demolished.
Figure 17‑3 below illustrates the proposed equipment layout within the concentrator building.
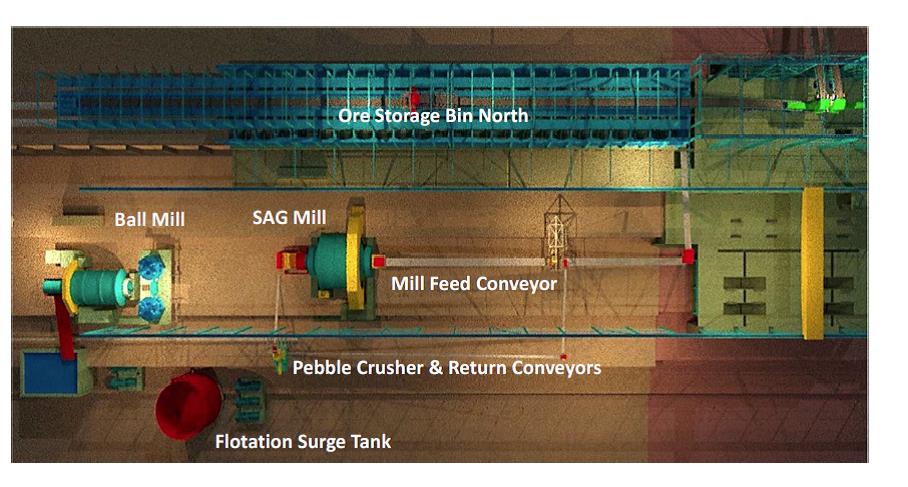
Figure 17‑3: Milling Circuit
The 200-ton maintenance overhead crane that currently spans the proposed position of the SAG and ball mill and runs the length of the building would be refurbished and utilized for mill installation and maintenance.
| 17.1.3 | Flotation |
A new Flotation building would be located adjacent, on the west side, to the existing Concentrator building. The old tailings thickeners are currently located in this area and these would need to be demolished to accommodate the new building. The Flotation building would require insulation in line with local conditions, regulations and codes, as well as an HVAC system.
| M3-PN150164 26 March 2018 |
159
NorthMet Project
Form NI 43-101F1 Technical Report
The Flotation building would accommodate the entire flotation circuit, the three (3) re-grind mills, flotation blowers and the associated electrical Motor Control Centers (MCCs). Two new 50 t overhead gantry cranes would be installed, operating over the length of the building.
The civil works for the flotation building, including structural support bases and spillage containment sumps for complete containment would be required.
The design allows for the use of new, larger rougher flotation cells which were not available for the previous design. The cleaner and separation stages have generally greater volumes than the previous design to better tolerate variability from the ore and process disruptions. The new regrind mills are the current technology stirred mills which have been proven to be more efficient than the previously proposed ball mills within the Erie concentrator building.
The following equipment forms part of the new flotation circuit:
| · | Four (4) 654 cy Cu/Ni Bulk rougher flotation cells |
| · | M15000 Cu/Ni rougher concentrate regrind mill, including new cyclone cluster |
| · | Four (4) 210 cy, and five (5) 131 cy Cu/Ni Bulk cleaner flotation cells |
| · | M5000 Cu/Ni Separation regrind mill, including new cyclone cluster |
| · | Three (3) 65 cy Cu/Ni separation rougher cleaner flotation cells |
| · | Three (3) 65 cy, nine (9) 39 cy and three (3) 26 cy Cu/Ni separation cleaner flotation cells |
| · | Five (5) 654 cy Po rougher flotation cells |
| · | M5000 Po rougher concentrate regrind mill, including new cyclone cluster |
| · | Two (2) 210 cy, two (2) 131 cy and two (2) 65 cy Po cleaner flotation cells |
| · | Three (3) air blowers to supply air to the flotation cells |
| · | Concentrate and tailings sumps, tanks and splitter boxes |
| · | Pumps, interconnecting pipework and manual and actuated valves |
| · | Samplers, size analyzers and slurry analyzers with any intermediate pumps and piping |
| · | Flotation cell support structures, pipe racks and access platforms |
The proposed flotation building and equipment layout is illustrated in Figure 17‑4.
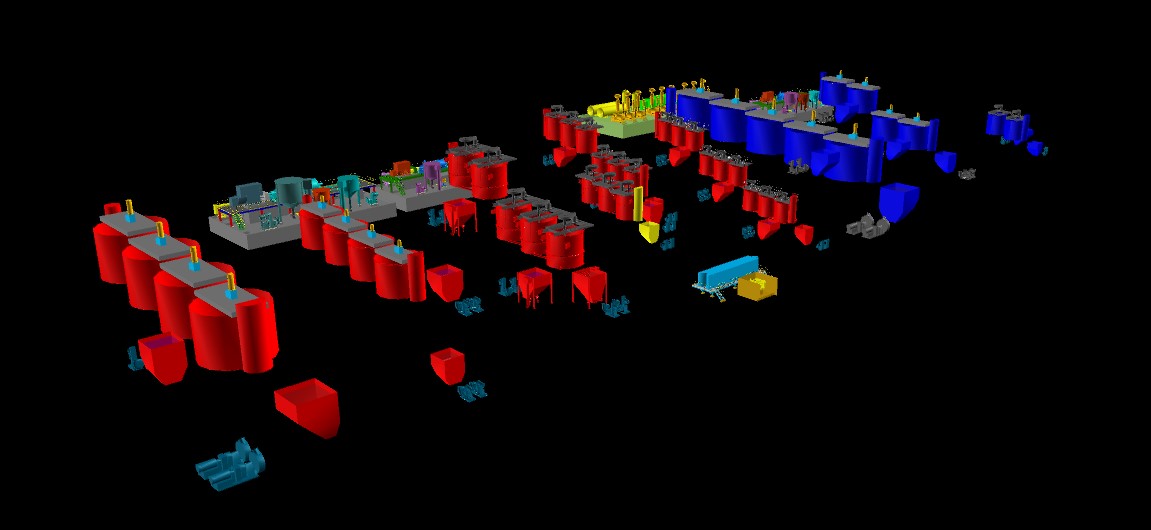
Figure 17‑4: Flotation Circuit
| M3-PN150164 26 March 2018 |
160
NorthMet Project
Form NI 43-101F1 Technical Report
| 17.1.4 | Concentrate Handling |
The Cu, Ni and Po concentrate thickening, filtration and loadout facilities would be located on the South end of the plant. The existing pipe tunnel would be refurbished to accommodate the slurry and service piping along with the electrical supply equipment.
A new concentrate thickening building would be required to accommodate the following equipment for the 3 circuits:
| · | Concentrate trash screens prior to thickening |
| · | Three (3) concentrate thickeners |
| · | All ancillary compressors, hydraulic actuators and control systems associated with the filters |
| · | Filter feed, wash water and manifold flush tanks, pumps and piping |
| · | Electrical MCCs |
A concentrate storage shed will adjoin the concentrate thickening building. The three (3) concentrate filters would be located above the concentrate storage area and would feed onto concentrate discharge conveyors.
The concentrate storage shed would consist of the following equipment:
| · | Three (3) vertical filter presses in an enclosed area with HVAC |
| · | Three (3) filter cake discharge conveyors located below the filter presses |
| · | Dedicated concentrate storage areas below the filters and conveyors |
| · | Two (2) concentrate conveyors with hoppers that feed into the loadout station |
A concentrate loadout station would be required for the loading of rail cars. The station would have loadout bins which would be fed by the two (2) concentrate conveyors. A small reversible conveyor below each of the loadout bins would ensure even distribution of the concentrate within the rail cars.
The concentrate loadout station would be equipped with an auger sampler to sample the concentrate in each rail car for accounting and tracking purposes.
The loadout station would also require facilities for the removal of the rail car lids as the rail cars enter the station and for transfer of the lids to the end of the station for refitting once the rail car has been loaded.
| 17.1.5 | Reagent Services |
The following flotation reagents would be required for the new plant:
| · | Collector (SIPX) |
| · | Activator (CuSO4) |
| · | Depressant (CMC) |
| · | Frother (MIBC) |
| · | Lime (Hydrated) |
| · | Flocculant (Magna Floc 10) |
Each reagent has a separate system that would include make-up tanks, transfer pumps, dosing tanks, dosing pumps and distribution piping.
The reagent building would be located adjacent to the Flotation building and would include a storage area, make-up and dosing tanks and allow for vehicle access for reagent off-loading and handling. The make-up areas would have dedicated hoists for the loading of reagents into the make-up tanks. The reagent make-up tanks would also include extraction systems for the control of fugitive reagent dust.
| M3-PN150164 26 March 2018 |
161
NorthMet Project
Form NI 43-101F1 Technical Report
| 17.1.6 | Piping Systems |
The existing process water, raw water, spray water, fire water and gland water systems would require major modifications to suit the new process plant design. Some of the major existing infrastructure including the FTB, fire water reservoir, return water barge and pipeline and Colby Lake supply system are still usable however.
New pipe racks would be required for the piping distribution systems within the concentrator building as well as all new buildings, although wherever practical the distribution system would utilize existing pipe tunnels to access these areas.
| 17.1.6.1 | Slurry Distribution Piping |
New process piping would be required to suit the new process within the milling, flotation and concentrate handling sections, including manual and actuated valves.
New tailings tanks, pumps and tailings pipelines would be installed to provide for the plant’s tailings requirements.
| 17.1.6.2 | Raw Water |
Raw water would be supplied to the plant from Colby Lake via a refurbished pipeline which PolyMet is acquiring under its agreements with Cliffs Erie. The draft water appropriation permit PolyMet has authorizes the withdrawal of the necessary water from Colby Lake. The existing 60-year-old pipeline, that conveys raw water 5.6 miles, will be lined in part or fully with a 34” diameter HDPE pipe. The process plant raw water distribution system would require modifications to suit the proposed plant modifications and the supply from the FTB would need to be routed to the new flotation and concentrate handling buildings. Raw water would be required for the following areas and services:
| · | Process water make-up |
| · | Potable water treatment plant feed |
| · | Gland seal water feed |
| · | Mill cooling water feed |
| · | Reagent make-up |
| · | Filter press cloth wash |
| 17.1.6.3 | Process Water |
The five (5) existing 1,179 cy process water tanks would be utilized for the plant process water storage requirements. The process water distribution system would require modifications to suit the proposed plant modifications and the supply from the process water tanks would need to be routed to the new flotation and concentrate handling buildings. New distribution piping would be installed to feed the following areas and applications:
| · | Mill dilution water |
| · | Flotation dilution water |
| · | Thickener dilution water |
| · | Regrind milling |
| · | Spray water feed |
| · | Spillage containment areas wash water |
| M3-PN150164 26 March 2018 |
162
NorthMet Project
Form NI 43-101F1 Technical Report
| 17.1.6.4 | Spray Water |
The plant spray water system would be fed by the process water system and would include a tank and pumps to deliver pressurized spray water to the following facilities:
| · | Scalping screens |
| · | Flotation spray water |
| 17.1.6.5 | Gland Water |
The gland seal water system would be fed by the raw water system and would include a tank, pumps, filters and reticulation piping. These services would be routed to the mill building and flotation area.
| 17.1.6.6 | Mill Cooling Water |
The mill cooling water system would be fed by the raw water system and would include a tank, pumps and reticulation piping. These services would be routed to the SAG mill and ball mill.
| 17.1.6.7 | Fire Water |
The fire water system would be fed directly by the raw water reservoir and would include new pumps, reticulation piping, valves, hydrants and hose reels. These services would be routed to the new plant areas (flotation and concentrate handling) and would be refurbished in the existing plant areas (conveyors and crushing) where required. Monitoring systems would be installed for fire suppression control and surveillance.
| 17.1.6.8 | Potable Water |
The potable water system is fed by the raw water system and would include a refurbished water treatment plant, new pumps, reticulation piping, valves and safety showers. These services would be routed to all plant areas. Safety showers would be fitted with a shower and eye wash basin.
| 17.1.7 | Air Systems |
New blowers would be required to supply air to the flotation cells and compressors for plant and instrument air requirements.
| 17.1.7.1 | Flotation Blower Air |
The blower air system consists of blowers and distribution piping to the flotation cells. The blowers would be located in close proximity to the flotation cells to reduce distribution requirements, but would be housed in an enclosed structure to reduce noise.
| 17.1.7.2 | Plant and Instrument Air |
New compressors, refrigerant dryers, filters, receivers and the piping distribution system would be required for the plant and instrument air services. To the extent possible, the compressors would be located in close proximity to major instrument air consumers (pneumatic actuators) to reduce distribution requirements and housed in an enclosed structure to reduce noise.
The filter press compressors and ancillary equipment would be supplied as part of the filter package and would be located in close proximity to the filter.
| M3-PN150164 26 March 2018 |
163
NorthMet Project
Form NI 43-101F1 Technical Report
| 17.1.8 | Plant Electrical Distribution |
Only one main medium voltage 13.8 kV panel is proposed for the plant. The panel will be housed in a dedicated main consumer substation building. From this main 13.8 kV the following will be fed:
| · | 28 MW GMD SAG Mill |
| · | 14 MW Ball Mill |
| · | One (1)13.8 kV overhead power line (existing) to the Administration Building |
| · | Six (6) 4.16 kV medium voltage switchboards throughout the plant area |
| · | Twenty-one (21) feeders to the 480 Volt MCCs |
All the distribution circuit breakers will be 3-pole and rated at a standard size of 630A, which will enable all circuits to carry continuous load and momentary short circuits. Shunt trips will be 110 V DC fed from a single battery tripping unit and shunt trip circuit.
The MCCs will provide power and contain motor starters for the various process plant areas. Motors up to 700 kW will be fed from 480 V MCCs. MCCs will be of the compartmentalized type with molded case circuit breakers, magnetic contactors, intelligent protection relays and ground bus, and will comply with the relevant statutory codes and standards.
Dedicated Distribution Switchboards (DBS) will distribute power to the offices, laboratory, workshops, warehouses, change rooms, toilets, kitchen, dining rooms, and security areas. These switchboards will be fed from suitably located switch rooms.
| 17.1.9 | Plant Instrumentation |
The entire plant instrumentation system would be replaced with modern instruments and infrastructure including the following:
| · | All conveyor process monitoring and safety instruments |
| · | Level, flow, density and temperature monitoring instruments |
| · | All process safety and monitoring instruments such as gas analyzers |
| · | Complete PLC system linked to the SCADA monitoring and control system |
| · | Fiber optic backbone for the plant control system |
The instrumentation control voltage would be 120 V, with 24 V DC signal voltage.
| 17.2 | Process Plant Flowsheet Development |
The overall plant process flows for the NorthMet Project are shown in Figure 17‑5.
| 17.2.1 | Primary and Secondary Crushing |
ROM are delivered to the crushing plant for size reduction of the host rock, making it suitable for further liberation and beneficiation of the target economic metals. Two-stage crushing is used to achieve a final crushed product size of 80% passing 4 in, which is fed into the milling circuit for further liberation of the mineral.
The crushing circuit has a primary crusher feed bin, a gyratory primary crusher, a primary crusher product surge bin, and four gyratory secondary crushers.
| M3-PN150164 26 March 2018 |
164
NorthMet Project
Form NI 43-101F1 Technical Report
Ore with a top-size of approximately 55 in is delivered by side-dumping rail cars to the primary crushing circuit. The rail cars dump their load directly into the gyratory crusher feed bin that in turn feeds the new 60" × 113" Traylor Type NT gyratory crusher on primary crushing duty. The product, 80% passing 7 in from the primary crusher is discharged by chute arrangement to the primary crusher product surge bin from where it is withdrawn via sliding gates into four parallel 36" × 72" Traylor gyratory secondary crushers. Each secondary crusher discharges 80% passing 4 in ore onto a dedicated variable speed apron feeder which in turn feeds the secondary crusher discharge conveyor. These parameters will be finalized during detailed design and optimized during plant commissioning.
Weightometers installed on the belt conveyor measure, display and record the instantaneous and totalized tonnages.
The crushed ore transfer conveyor receives ore from the secondary crusher discharge conveyor and transports the crushed ore to the crusher product surge bin. Ore is withdrawn from the surge bin using an apron feeder, onto a conveyor which then discharges onto the tripper conveyor. The tripper belt conveyor transports the crushed ore to the crushed ore storage bin.
Dust in and around the crushers, conveyors, and the apron feeder discharge points is extracted using a dust extraction system.
Spillage within the crushed ore storage area is washed down to a spillage sump, from which, the spillage is pumped to the SAG mill discharge sump.
| 17.2.2 | Milling |
The milling section consists of a SAG mill operating in open circuit and a ball mill operating in closed circuit with two clusters of classifying hydro cyclone clusters to give a product of 80% passing 120 µm. A pebble crushing circuit is incorporated to handle the SAG mill scats.
Ore is transferred from the crushed ore storage bin to the SABC circuit, which consists of a SAG mill, ball mill and pebble crusher. The ball mill is fed by cyclone clusters. The overflow from the cyclones will discharge into a flotation feed tank that feeds the flotation circuit.
Crushed ore is withdrawn from the crushed ore storage bin using 62 variable speed driven vibrating pan feeders. The pan feeders discharge through chute arrangements onto two reclaim conveyors. Between four and eight pan feeders per conveyor will operate at any one time.
Both reclaim conveyors discharge onto the transfer conveyor which in turn delivers ore to the SAG mill feed conveyor. The SAG mill feed is measured and recorded using a weightometer installed on the SAG mill feed conveyor. The 40’ diameter × 22.5’ EGL SAG mill has a grate discharge and is fitted with a 28 MW motor.
Process water is added to the SAG mill to achieve a slurry solids content of 75% by mass within the mill. Mill cooling water is provided by the mill cooling water pumps operating on a duty/standby configuration. The SAG mill discharge flows over a vibrating screen and the screen oversize is either conveyed to the pebble crushing circuit or to the scats bunker, via a diverter chute.
The pebbles that are diverted to the pebble crusher feed conveyor are conveyed to the pebble crusher surge bin. A weightometer installed on the pebble crusher feed conveyor measures and records pebble crusher feed tonnage. A belt magnet removes ball scats prior to the pebble crusher and discharges the scats onto the scats removal conveyor. Pebbles are withdrawn from the pebble crusher surge bin using a variable speed driven pan feeder, fed through the crusher, and discharged onto the pebble crusher discharge conveyor. The crushed pebble transfer conveyor receives material from the crusher discharge conveyor and returns crushed pebbles to the SAG mill feed conveyor.
| M3-PN150164 26 March 2018 |
165
NorthMet Project
Form NI 43-101F1 Technical Report
Undersize from the SAG mill discharge screen discharges into the SAG mill discharge sump from where it is transferred to the cyclone cluster feed sump. Process water is added to both the SAG mill discharge sump and the cyclone feed sump at a controlled rate to achieve the required slurry solids content at the respective discharge points.
Diluted slurry is pumped to the hydro cyclone clusters using hydro cyclone feed pumps. Overflow slurry from the cyclone clusters (33.2% solids by mass) gravitates to the flotation feed surge tank. Cyclone cluster underflow slurry (75% solids by mass) feeds the ball mill.
The 24’ diameter × 37’ EGL ball mill has an overflow discharge and is fitted with a 14 MW motor and operates in closed circuit with the cyclone clusters. The discharge from the ball mill flows through a trommel screen and discharges into the cyclone cluster feed sump. Trommel screen oversize will be transferred by conveyor to the milling scats bunker.
Spillage within the milling area is contained in a containment area and washed down to the spillage sump, from where it is pumped back into the cyclone cluster feed sump.
| M3-PN150164 26 March 2018 |
166
NorthMet Project
Form NI 43-101F1 Technical Report
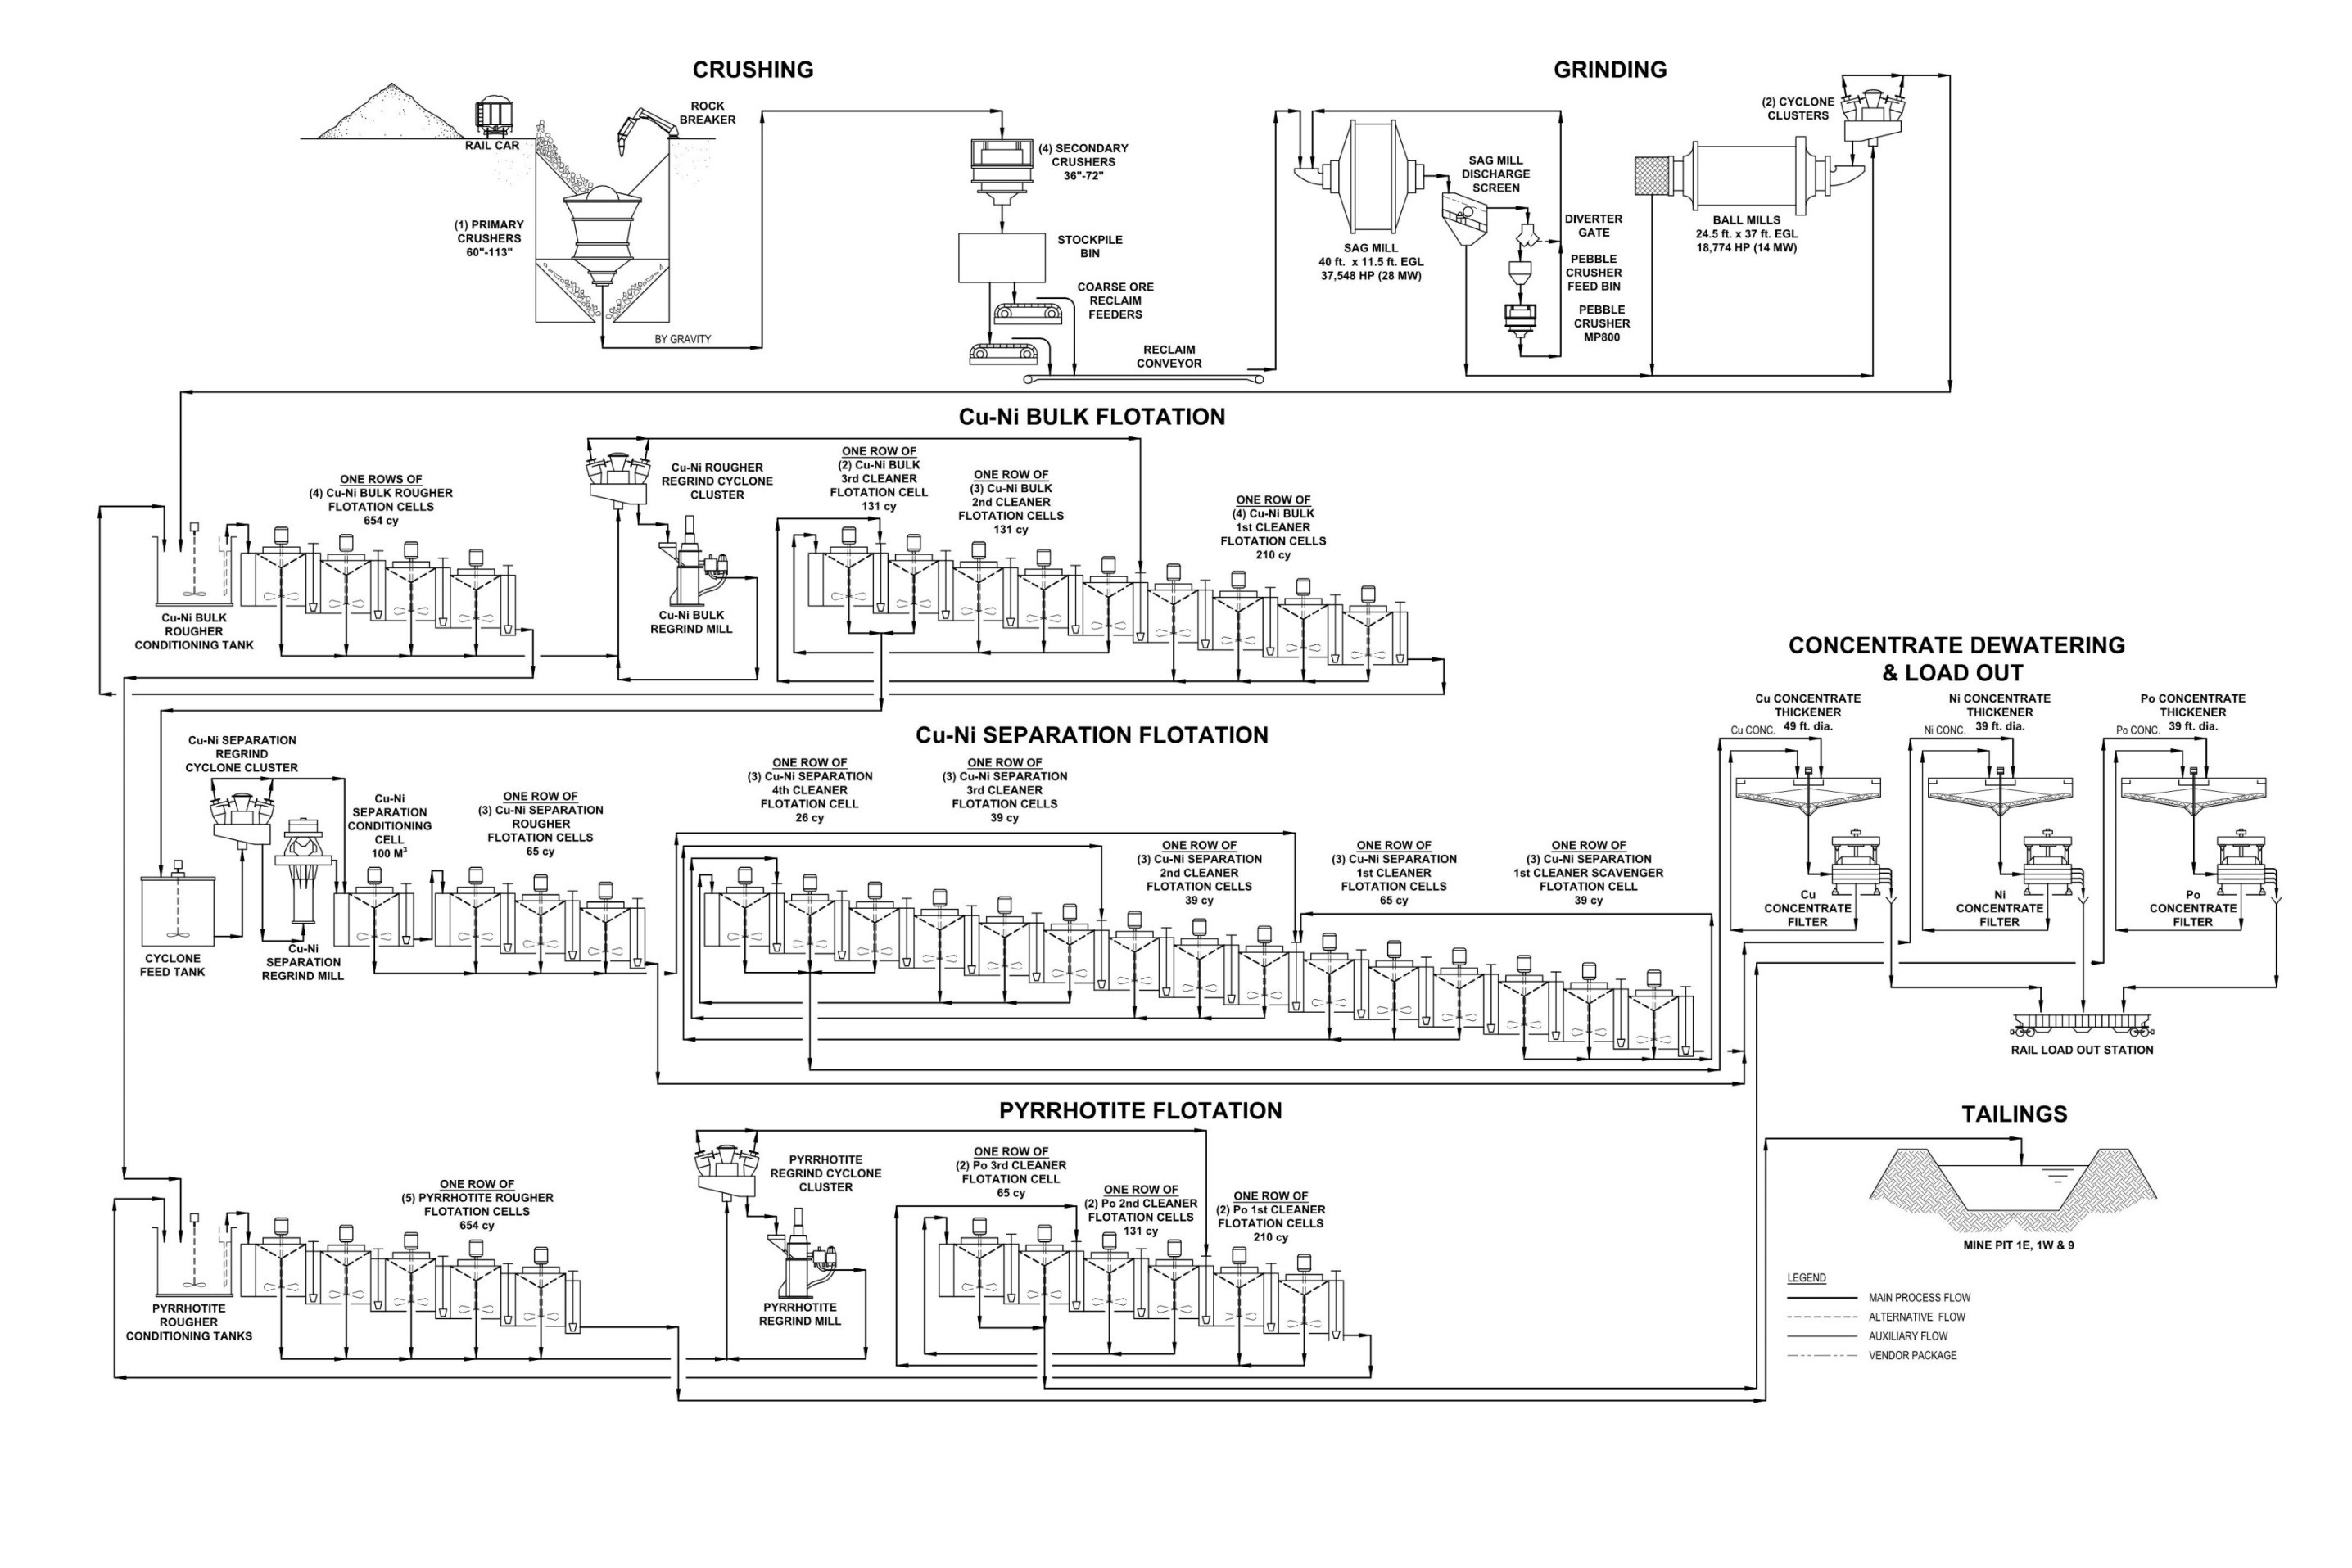
Figure 17‑5: Overall Plant Process Flow Diagram
| M3-PN150164 26 March 2018 |
167
NorthMet Project
Form NI 43-101F1 Technical Report
| 17.2.3 | Flotation |
The overflow from the milling cyclone is pumped to the flotation feed tank. The flotation circuit consists of three separate flotation stages each with a regrind step:
| · | Bulk Cu-Ni circuit |
| · | Cu-Ni concentrate separation circuit |
| · | Pyrrhotite (Po) circuit |
The three flotation circuits are detailed in the subsections below.
| 17.2.3.1 | Bulk Cu-Ni Rougher Flotation and Regrind |
Classified cyclone overflow slurry, at 33.2% solids by weight, is pumped from the agitated flotation feed surge tank to the rougher flotation feed box at a combined flow rate of 13,882 gpm.
The Cu-Ni rougher flotation cells bank consists of four (4) 654 cy forced air flotation cells with a design retention time of 38 min. The cells are fed by gravity from the Cu-Ni rougher flotation feed box. The cells are arranged in series, each with an agitator drive and a dart valve that controls the froth level in the cells. Low pressure air is added to the shaft of each of the four agitators at 2,841 standard cubic feet per minute (scfm) per cell. Provisions have been made for addition of reagents (frother and collector) to all four flotation cells. Water sprays are also provided in the concentrate launders to aid in the breakdown of froth.
Spillage within the Cu-Ni rougher flotation containment area flows to three spillage sumps, from where the spillage is pumped to the first Cu-Ni rougher cell feed box.
Float tailings from the rougher tails sump are pumped to the agitated pyrrhotite (Po) rougher flotation conditioning tank.
Froth containing Cu-Ni concentrate overflows from the flotation cell launder lip into the concentrate launder. Concentrate from the four rougher cells flows by launder and pipe arrangement to the Cu-Ni rougher flotation concentrate froth hopper. Combined concentrate is then pumped to the Cu-Ni rougher regrind mill cyclone cluster. The cyclone underflow reports to the Bulk Cu-Ni rougher regrind screen. Screen oversize reports to a trash basket while the undersize gravitates to the mechanically agitated Cu-Ni rougher regrind mill feed tank as regrind mill feed. Cyclone overflow slurry is discharged into the Cu-Ni rougher regrind cyclone overflow sump.
Slurry from the Cu-Ni rougher regrind mill feed tank is pumped to the Cu-Ni rougher regrind mill. The feed is ground to give a product size of 80% passing 35 µm. Part of the regrind mill discharge is recycled back to the regrind mill feed tank while the balance flows to the Cu-Ni rougher regrind sump. A sample is taken from the rougher regrind discharge, using a Vezin sampler, which measures the grinding performance of the mill and ensures that the correct size distribution is sent to Bulk Cu-Ni cleaning.
Cu-Ni concentrate slurry from the rougher regrind sump is pumped to the first Cu-Ni cleaning bank flotation tank feed box.
Spillage within the Cu-Ni rougher concentrate regrind area flows to a spillage sump, from where it is pumped to the Cu-Ni rougher regrind mill feed tank.
| 17.2.3.2 | Bulk Cu-Ni Cleaner Flotation |
The Bulk Cu-Ni cleaner flotation bank includes a feed box and three cleaning stages consisting of the following:
| M3-PN150164 26 March 2018 |
168
NorthMet Project
Form NI 43-101F1 Technical Report
| · | Cleaner bank 1: four (4) 210 cy forced air flotation cells |
| · | Cleaner bank 2: three (3) 131 cy forced air flotation cells |
| · | Cleaner bank 3: two (2) 131 cy forced air flotation cells. The cells are fed by gravity from the flotation feed box. |
Low pressure air is added to the shafts of the cell agitators at about 1,196 scfm per cell in the first cleaner bank, 748 scfm per cell in the second and third cleaner banks. Provisions have been made to add frother to all the cleaning cells and to add collector only into selected cleaning cells. Water sprays are provided in the launders to aid in breakdown of froth. The cells are arranged in series, each with an agitator drive and a dart valve that controls the froth level in individual cells.
Tailings from each of the Cu-Ni cleaner banks are pumped back to the previous cleaning bank via a cleaner tails hopper and pump. The tails from the first cleaner bank are pumped to the Cu-Ni rougher flotation bank feed box.
Concentrate from each of the cleaner banks flows by launder and pipe arrangement to dedicated concentrate froth hoppers. The respective concentrates are then pumped to the next Cu-Ni cleaner bank. The concentrate from the second to last and last cleaner bank is pumped to the Cu-Ni separation regrind cyclone feed tank.
Spillage from the first cleaner bank gravitates into a dedicated spillage sump and is pumped to the feed box of the first cleaner bank. The spillage from the second and third cleaner banks gravitates to a separate sump from where it is pumped to the second cleaner bank feed box.
| 17.2.3.3 | Cu-Ni Separation Regrind |
Concentrate slurry from the Bulk Cu-Ni cleaner flotation is pumped to the Cu-Ni separation regrind mill cyclone cluster. Cyclone underflow reports to the regrind mill feed tank as mill feed. Feed is ground to give a product size of 80% passing 15 µm. Part of the regrind mill discharge is recycled back to the regrind mill feed tank while the balance flows to the Cu-Ni separation cyclone overflow hopper. Process water is added to the cyclone feed tank to ensure the correct densities for cyclone separation.
Cyclone overflow is discharged into the regrind hopper. A sample is taken using a Vezin sampler prior to the regrind mill product being pumped to the concentrate aeration tank. This measures the grinding performance of the mill and ensures that the correct size distribution is sent to the Cu-Ni separation rougher flotation. Lime slurry is added to the regrind mill discharge tank for pH adjustment.
Concentrate slurry from the hopper is pumped to the Cu-Ni separation aeration tank. In the aeration tank, concentrate is injected with low pressure air from the blowers to keep the slurry in suspension. Slurry overflows from the aeration tank to the Cu-Ni separation rougher flotation feed tank box.
Spillage within the Cu-Ni separation regrind area gravitates to a spillage sump, from where the spillage is pumped to the regrind hopper.
| 17.2.3.4 | Cu-Ni Separation Rougher Flotation |
The Cu-Ni separation rougher bank includes three (3) 65 cy cells, a rougher tails sump, and a rougher concentrate sump. The bank is fed by the overflow from the Cu-Ni separation aeration tank. The cells are arranged in series, each with an agitator drive and a dart valve that controls the froth level in individual cells. Low pressure air is added to the shaft of each of the three agitators at 486 scfm per cell. Provisions have been made for the addition of reagents (frother and collector) to selected cell feed boxes. Water sprays are provided in the launders to aid in breakdown of froth.
| M3-PN150164 26 March 2018 |
169
NorthMet Project
Form NI 43-101F1 Technical Report
Tailings from the rougher bank are predominantly Ni concentrate and are pumped to the mechanically agitated Ni concentrate thickening surge tank.
Froth containing mainly Cu concentrate overflows from the cell launder lips into the concentrate launders. Concentrate from the three rougher cells flows by launder and pipe arrangement to the separation rougher cleaner concentrate sump. The concentrate is then pumped to the separation cleaning conditioning tank. Provisions have been made for the addition of lime slurry and process water to the separation rougher cleaner concentrate sump.
Spillage within the Cu-Ni separation rougher flotation area gravitates to a spillage sump, from where it is pumped to the Cu-Ni separation rougher tails sump.
| 17.2.3.5 | Cu-Ni Separation Cleaner Flotation |
The Cu-Ni separation cleaner bank consists of a conditioning tank, four (4) banks of flotation cells with provisions for a fifth bank, and is made up of the following:
| · | Cleaner bank 1: three (3) 65.5 cy forced air flotation cells |
| · | Cleaner bank 2: three (3) 39 cy forced air flotation cells |
| · | Cleaner bank 3: three (3) 39 cy forced air flotation cells |
| · | Cleaner bank 4: three (3) 39 cy forced air flotation cells |
| · | Cleaner bank 5: three (3) 26 cy forced air flotation cells |
The Cu-Ni separation cleaner cells are fed via pumps from the conditioning tank. Low pressure air is added to the shafts of the cell agitators at about 492 scfm per cell in the first cleaner bank, 486 scfm per cell in the second, third and fourth cleaner banks and 262 scfm per cell in the fifth bank. Provision has been made to add frother to all the cleaning cells and to add collector only into selected cleaning cells. Water sprays are provided in the launders to aid in breakdown of froth. The cells are arranged in series, each with an agitator drive and a dart valve that controls the froth level in individual cells.
Separation rougher concentrate is pumped from the separation cleaner conditioning tank to the first cleaner bank feed box. The tailings from the first cleaner bank discharge into the tails hopper and are pumped back to the separation rougher bank feed box. Tailings from the rest of the separation cleaner banks are pumped back to the previous cleaning bank via a cleaner tails hopper and pump.
Concentrate from the first separation cleaner bank flows by launder and pipe arrangement to dedicated concentrate froth hoppers to the second bank. Concentrate flows through each subsequent cleaner bank to continually improve the final grade. The concentrate from the last cleaner bank is the final Cu concentrate and is pumped to the mechanically agitated Cu concentrate thickening surge tank.
Spillage from the first and second cleaning banks gravitates into a dedicated spillage sump and is pumped to the conditioning tank. The spillage from the third, fourth and fifth cleaner banks gravitates to a separate sump, from where the spillage is pumped to the third cleaner bank feed box.
| 17.2.3.6 | Po Concentrate Rougher Flotation and Regrind |
Bulk Cu-Ni rougher tails are pumped from the agitated Po conditioning tank to the rougher flotation bank feed box.
The Po rougher flotation bank consists of five (5) 654 cy forced air flotation cells. The cells are arranged in series, each with an agitator drive and a dart valve that controls the froth level in individual cells. Low pressure air is added to the shafts of the cell agitators at approximately 2,841 scfm. Provisions have been made to add frother to all the cells, collector to the rougher bank feed box, and activator to the conditioning tank. Water sprays are provided in the launders to aid in breakdown of froth. Tailings from the Po rougher tails sump are pumped to the final tailings tank.
| M3-PN150164 26 March 2018 |
170
NorthMet Project
Form NI 43-101F1 Technical Report
Froth containing concentrate overflows from the cell launder lips into the concentrate launders. Concentrate from the rougher cells flows by launder and pipe arrangement to the Po rougher concentrate sump and is then pumped to the mechanically agitated Po rougher regrind cyclone feed tank.
Spillage within the Po rougher flotation containment area gravitates between two spillage sumps from where it is pumped to either the Po conditioning tank or the Po rougher tails sump.
Po concentrate slurry from the Po rougher regrind cyclone feed tank is pumped to the Po regrind mill cyclone cluster. Cyclone underflow reports to the Po rougher regrind mill as mill feed. Part of the regrind mill discharge is recycled back to the regrind mill feed tank while the balance flows to the cyclone overflow hopper. Cyclone overflow is discharged into the Po regrind cyclone overflow hopper. Provisions have been made for process water to be added to the cyclone feed tank and the cyclone overflow hopper. The overflow slurry is pumped to the Po concentrate cleaning bank.
Spillage within the Po regrind area gravitates to a spillage sump, from where it is pumped to the regrind cyclone feed tank.
| 17.2.3.7 | Po Concentrate Cleaner Flotation |
The Po cleaner flotation bank includes a feed box and three banks of flotation cells as follows:
| · | Cleaner bank 1: two 210 cy forced air flotation cells |
| · | Cleaner bank 2: two 131 cy forced air flotation cells |
| · | Cleaner bank 3: two 65 cy forced air flotation cells |
The cells are arranged in series, each with an agitator drive and a dart valve that controls the froth level in the cells. Low pressure air is added to the shafts of the cell agitators at about 1,196 scfm per cell in the first cleaner bank, 748 scfm per cell in the second cleaner bank, and 486 scfm per cell in the third cleaner bank. Provisions have been made to add frother to all the cleaning cells and to add collector only into selected cleaning cells. Water sprays are provided in the launders to aid in breakdown of froth.
Tailings from each of the Po cleaner banks are pumped back to the previous cleaning bank via a cleaner tails hopper and pump. The tails from the first cleaner bank are pumped to the Po rougher flotation bank feed box.
Concentrate from each of the cleaner banks flows by launder and pipe arrangement to dedicated concentrate froth hoppers. The respective concentrates are then pumped to the next Po cleaner bank. The concentrate from the last cleaner bank is pumped to the mechanically agitated pyrrhotite concentrate thickening surge tank.
Spillage from the Po cleaning area gravitates into a dedicated spillage sump and is pumped to the feed box of the first cleaner bank.
| 17.2.4 | Tailings Disposal |
Po rougher flotation tails slurry is pumped from the Po rougher mechanically agitated final tails tank and is sampled using a vezin sampler. The assay from the sample taken is used for metal accounting purposes.
The tailings are pumped to the FTB with a complete tailings pipeline available on standby in case one of the final tails pumps or pipelines fails or is offline for maintenance. FTB return water is pumped back to the process water tanks for reuse in the process plant.
| M3-PN150164 26 March 2018 |
171
NorthMet Project
Form NI 43-101F1 Technical Report
Spillage within the in-plant tailings containment area gravitates to the spillage sump, from where it is pumped back to the respective thickener dilution tanks.
| 17.2.5 | Concentrate Thickening and Filtration |
The three flotation concentrate products are dewatered via 2 stages, thickening followed by filtration. The recovered water from the dewatering stages is returned to the process water tanks for redistribution into the process plant.
The thickened concentrate is then filtered using a filter press to achieve a cake moisture of less than 12.1%.
| 17.2.5.1 | Cu Concentrate Thickening |
Cu concentrate slurry from the thickener feed surge tank is pumped onto a vibrating trash screen to remove any oversize particles to a trash handling basket prior to thickening. The screen undersize gravitates to a Cu concentrate thickener dilution tank. The slurry in the thickener dilution tank gravitates into the center feed well of the thickener. Provisions have been made to add a flocculant solution to the slurry in the dilution tanks and/or to the feed well of the thickener.
The thickener is equipped with a thickener drive which directs the thickened slurry to the discharge cone. The thickener thickens the slurry to produce an underflow with a solids content of 65% by mass and a clear concentrate thickener overflow.
The thickener underflow is withdrawn and pumped to the filter feed tank. The thickener underflow slurry is then pumped to the Cu concentrate filtration area where it will undergo further dewatering.
The thickener overflow solution is collected in the thickener overflow storage tank and is then pumped to the process water storage tanks.
Spillage within the thickener containment area gravitates to the spillage sump, from where it is pumped to the dilution tank.
| 17.2.5.2 | Cu Concentrate Filtration |
Thickened Cu concentrate slurry is received from the filter feed tank in the Cu thickening area and pumped to the Cu concentrate filter.
The filtration cycle is a batch process and involves a filtration stage, a pressing/squeezing stage, a drying stage, and a cake discharge stage. The slurry is filtered to produce a filter cake with a moisture content of 10.4% by mass. The filter cake is dropped onto the filter cake discharge conveyor located below the filter press. The filter cake discharge conveyor discharges the filter cake onto the Cu concentrate stockpile.
Raw water is available for cloth wash water once each filtration cycle has been completed.
The filtrate, excess flushing and cloth wash water is collected in the filtrate hopper. Any solids that discharge into the filtrate tank settle at the bottom and are discharged back into the Cu concentrate thickener feed surge tank along with the filtrate overflow. The filtrate is retained and pumped back to the filter press to be used as filter manifold flush water.
| 17.2.5.3 | Ni Concentrate Thickening |
Ni concentrate slurry from the thickener feed surge tank is pumped onto a vibrating trash screen to remove any oversize particles to a trash handling basket prior to thickening. The screen undersize gravitates to a Ni concentrate thickener dilution tank. The slurry in the thickener dilution tank gravitates into the center feed well of the thickener. Provisions have been made to add a flocculant solution to the slurry in the dilution tanks and/or to the feed well of the thickener.
| M3-PN150164 26 March 2018 |
172
NorthMet Project
Form NI 43-101F1 Technical Report
The thickener is equipped with a thickener drive which directs the thickened slurry to the discharge cone. The thickener thickens the slurry to produce an underflow with a solids content of 65% by mass and a clear concentrate thickener overflow.
The thickener underflow is withdrawn and pumped to the filter feed tank. The thickener underflow slurry is then pumped to the Ni concentrate filtration area, where it will undergo further dewatering.
The thickener overflow solution is collected in the thickener overflow storage tank and is then pumped to the process water storage tanks.
Spillage within the thickener containment area gravitates to the spillage sump, from where it is pumped to the dilution tank.
| 17.2.5.4 | Ni Concentrate Filtration |
Thickened Ni concentrate slurry is received from the filter feed tank in the Ni thickening area and is pumped to the Ni concentrate filter.
The filtration cycle is a batch process and involves a filtration stage, a pressing/squeezing stage, a drying stage, and a cake discharge stage. The slurry is filtered to produce a filter cake with a moisture content of 10.3% by mass. The filter cake is dropped onto the filter cake discharge conveyor located below the filter press. The filter cake discharge conveyor discharges the filter cake onto the Ni concentrate stockpile.
Raw water is available for cloth wash water once each filtration cycle has been completed.
The filtrate, excess flushing and cloth wash water is collected in the filtrate hopper. Any solids that discharge into the filtrate tank settle at the bottom and are discharged back into the Ni concentrate thickener feed surge tank along with the filtrate overflow. The filtrate is retained and pumped back to the filter press to be used as filter manifold flush water.
| 17.2.5.5 | Po Concentrate Thickening |
Po concentrate slurry from the thickener feed surge tank is pumped onto a vibrating trash screen to remove any oversize particles to a trash handling basket prior to thickening. The screen undersize gravitates to a Po concentrate thickener dilution tank. The slurry in the thickener dilution tank gravitates into the center feed well of the thickener. Provisions have been made to add a flocculant solution to the slurry in the dilution tanks and/or to the feed well of the thickener.
The thickener is equipped with a thickener drive which directs the thickened slurry to the discharge cone. The thickener thickens the slurry to produce an underflow with a solids content of 65% by mass and a clear concentrate thickener overflow.
The thickener underflow is withdrawn and pumped to the filter feed tank. The thickener underflow slurry is then pumped to the Po concentrate filtration area where it will undergo further dewatering.
The thickener overflow solution is collected in the thickener overflow storage tank and is then pumped to the process water storage tanks.
Spillage within the thickener containment area gravitates to the spillage sump, from where it is pumped to the dilution tank.
| M3-PN150164 26 March 2018 |
173
NorthMet Project
Form NI 43-101F1 Technical Report
| 17.2.5.6 | Po Concentrate Filtration |
Thickened Po concentrate slurry is received from the filter feed tank in the Po thickening area and pumped to the Po concentrate filter.
The filtration cycle is a batch process and involves a filtration stage, a pressing/squeezing stage, a drying stage, and a cake discharge stage. The slurry is filtered to produce a filter cake with a moisture content of 10.3% by mass. The filter cake is dropped onto the filter cake discharge conveyor located below the filter press. The filter cake discharge conveyor discharges the filter cake onto the Po concentrate stockpile.
Raw water is available for cloth wash water once each filtration cycle has been completed.
The filtrate, excess flushing and cloth wash water is collected in the filtrate hopper. Any solids that discharge into the filtrate tank settle at the bottom and are discharged back into the Po concentrate thickener feed surge tank along with the filtrate overflow. The filtrate is retained and pumped back to the filter press to be used as filter manifold flush water.
| 17.2.6 | Concentrate Storage |
Front-end loaders transfer the selected filtered concentrate from the product stockpile onto the product transfer conveyors. The concentrate is then discharged into the rail cars via a bin and reversible shuttle conveyor. The transfer of concentrate to the rail cars is done separately so as not to contaminate the individual products.
| 17.2.7 | Reagents |
Various reagents are used in the flotation and regrinding circuits to achieve a concentrate grade that is as rich in the value-bearing mineral as possible. The following reagents are added at selected points within the flotation circuit:
| · | Collector – SIPX |
| · | pH modifier – Lime |
| · | Frother – MIBC |
| · | Depressant – CMC |
| · | Activator – Copper sulphate (CuSO4) |
Flocculant is added to the concentrate thickeners to assist in the settling process.
| 17.2.7.1 | Collector |
Collector is delivered in powder form in bags. The bags are lifted, using a hoist, over the bag splitter which breaks the bags dropping the collector powder into the collector mixing tank. A batch of the collector is mixed with raw water in the mixing tank and then transferred to the collector dosing tank. Collector solution is distributed to the selected flotation areas. Each tank is fitted with an overflow seal pot system as a means of fire protection because the collector is flammable. A dust extraction system removes the fine dust particles that are generated during bag splitting and reagent make-up.
The collector sump pump is situated locally to ensure the maximum recovery of any spilled collector, which is pumped back into the mixing tank. The area is equipped with a safety shower.
| M3-PN150164 26 March 2018 |
174
NorthMet Project
Form NI 43-101F1 Technical Report
| 17.2.7.2 | pH Modifier |
Trucks carrying hydrated lime, equipped with blowers, will deliver the lime directly into the lime silo. The lime required for a batch make-up will be added to the mixing tank at a controlled rate using a rotary feeder. Raw water is pumped into the mixing tank for lime slurry make-up.
The lime slurry is pumped from the lime mixing tank into the agitated lime dosing tank. Lime slurry is distributed via a ring main around the flotation circuit with take-off points where necessary. A lime silo dust extraction system is installed to remove fine lime dust.
| 17.2.7.3 | Frother |
Frother is supplied in a one-ton intermediate bulk container (IBC) tote at the required concentration. A drum pump is used to transfer the frother from the IBC tote to the header tank. The frother is pumped from the header tanks to each bank in the flotation circuit. Frother spillage is recovered by the spillage pump that discharges back into the header tank.
| 17.2.7.4 | Depressant |
Depressant is supplied in powder form in bags. The depressant bags required for a batch are lifted using a hoist onto the bag splitter. Prior to adding the depressant powder, the required amount of raw water is added to the mixing tank to ensure that a solution of the required concentration by mass will be made up for each batch. The bag splitter is used to open each bag and the contents of the bag are added to the water in the mixing tank. The depressant solution is transferred from the mixing tank to the storage tank, from where it is pumped to the selected areas in the flotation circuit.
A dust extraction system is used to remove and capture any airborne depressant powder.
| 17.2.7.5 | Activator |
Activator is supplied in powder form in bags. The activator bags required for a batch make-up are lifted using a hoist onto the bag splitter. Prior to adding the activator powder, the required amount of raw water is added to the mixing tank to ensure that a solution of the required concentration by mass will be made up for each batch. The bag splitter is used to open each bag and the contents of the bag are added to the water in the mixing tank. The activator solution is transferred from the mixing tank to the storage tank, from where it is pumped to the Po rougher flotation conditioning tank.
A spillage pump will recover any spillage, which is pumped back into the storage tank. A dust extraction system is used to remove and capture any airborne powder during make-up.
| 17.2.7.6 | Concentrate Thickening Flocculant |
Thickener flocculant is supplied in powder form in bags. Flocculant bags are lifted using a hoist and loaded into the flocculant hopper. The flocculant screw feeder withdraws the flocculant powder from the hopper into the flocculant eductor where it is mixed with raw water before flowing into the agitated make-up tank. The flocculant solution is then transferred to the flocculant dosing tank from where the flocculant is distributed to each thickening area. Dilution water is added to the respective flocculant discharge lines to achieve the final flocculant concentration required for thickening.
| M3-PN150164 26 March 2018 |
175
NorthMet Project
Form NI 43-101F1 Technical Report
| 17.2.8 | Air Services |
| 17.2.8.1 | Compressed Air |
A total of three compressors are situated inside the plant area and are shared between plant and instrument air. An instrument air take-off prior to the plant air receiver is used to supply instrument air to the plant. The take-off line includes a duty and standby air dryer and additional filters in order to produce clean air for instruments. Dedicated plant and instrument air receivers offer storage of the respective air grades.
| 17.2.8.2 | Blower Air |
Three air blowers will be in operation to supply the total air requirements for the flotation circuit, with a fourth air blower on standby. Blower air will be fed to the agitator shafts of the flotation cells and the aeration tanks ahead of selected flotation banks.
| 17.2.9 | Water Circuits |
| 17.2.9.1 | Process Water Circuit |
The process water circuit consists of four interlinked process water header tanks, from where process water gravitates to various areas around the plant. A dedicated spray water tank and pumps are used to supply high pressure process water to the flotation cell launders to assist in froth breakdown.
Hosing water is also gravitated from the header tanks to selected containment areas for spillage wash down.
| 17.2.9.2 | Raw Water Circuit |
Raw water will be supplied from Colby Lake to the raw water reservoir for mostly make-up purposes; however, the raw water reservoir (10,000,000 gallons ~ 40,328 cy) is the primary source of raw water. Raw water is distributed by gravity to areas selected around the plant.
The fire water system consists of two electric pumps (duty and standby) and a diesel pump. The diesel fire water pump is only used in the event of a fire that affects the power supply to the plant; when the electric fire water pump cannot be used.
| 17.2.9.3 | Potable Water Circuit |
Raw water is gravitated to the water treatment plant where it is treated and pumped to the potable water tank. Potable water is supplied to the safety showers situated around the plant via a hydrosphere to maintain the required pressure. The potable water header is also supplied with potable water via a dedicated hydrosphere.
| 17.2.9.4 | Gland Water |
Raw water is pumped from the raw water reservoir through filters to supply gland water to the slurry pumps in milling, flotation, tailings handling and lime slurry make-up. Gland water is also distributed to the sampling analyzer system for flushing of the multiplexer.
| 17.2.10 | Sampling and Metal Accounting |
A sampling analyzer system is used to achieve real-time analysis of elemental compositions in selected streams for metal accounting and process control purposes. Various feed, concentrate and tailings streams in the flotation area are installed with primary samplers for elemental concentration measurement.
| M3-PN150164 26 March 2018 |
176
NorthMet Project
Form NI 43-101F1 Technical Report
The analyzer consists of primary in-line sampling units, a multiplexer, and a calibration sampler. The primary samplers take a representative sample from the process flow which is pumped to the multiplexers of the analyzer. The multiplexers send the sample streams into the measurement cell and the calibration sampler provides a representative sample for calibration.
Vezin samplers are used to take accurate representative samples from the flotation feed, regrind cyclone overflows, tailings and the concentrate streams in order to determine the performance of the flotation and regrind circuits.
| 17.3 | Hydrometallurgical Processing |
The 2006 PolyMet Technical Report (Bateman,2006) described in detail the hydrometallurgical recovery methods that were proposed for the NorthMet Project. The previous process design included two autoclaves and a copper solvent extraction/electrowinning (“SX-EW”) circuit to produce copper metal. In addition, the process included the precipitation processes of nickel-cobalt hydroxide and precious metals as value-added by-products.
PolyMet has now simplified this metallurgical process to recover base metals, gold and PGMs. PolyMet intends to construct the plant in two phases:
| · | Phase I: The Beneficiation Plant, as described in Sections 17.1 & 17.2, consisting of crushing, grinding, flotation, concentrate thickening and concentrate filtration. The Beneficiation Plant will produce and market concentrates containing copper, nickel, cobalt and precious metals. |
| · | Phase II: In mine year 2, a hydrometallurgical plant is expected to be commissioned to process nickel sulfide and pyrrhotite concentrates, with processing starting in mine year 3. This concentrate stream will be processed through a single autoclave to recover high-grade copper concentrate, and recover the nickel-cobalt hydroxide and precious metals precipitates as by-products. |
The advantages of the phased approach to building the complete plant is to delay capital expenditure by deferring the hydrometallurgical plant. This deferral of costs reduces capital-at-risk in the initial years of production of the NorthMet deposit.
The plan to phase in the hydrometallurgical plant reduces the technical risks during start-up because initial production of concentrates uses well established technologies. Permitting delays have provided PolyMet with an unusual opportunity to review and analyze plans which result in a technically and economically stronger project, including eliminating the biggest technical risk of starting the hydrometallurgical circuit. Fine-tuning the process chemistry to achieve expected recoveries and commercial product standards takes time and with the revised schedule, PolyMet can commence with commercial sales of copper and nickel concentrates in the meantime. The hydrometallurgical circuit is an option included in the draft permits that can be implemented if economics indicates an improvement in the financial performance of the Project.
The NorthMet process plant will consist of an initial beneficiation plant in Phase I, and a hydrometallurgical plant in Phase II. The specific processing steps that will be involved in the hydrometallurgical plant include pressure treatment of concentrates and precipitation of gold and PGMs in separate processes. Additional facilities also include a hydrometallurgical residue facility.
| 17.4 | Phase II – Optional Hydrometallurgical Plant |
Hydrometallurgical processing will be used for downstream treatment and enrichment of concentrates. The process involves high pressure and temperature autoclave leaching, followed by solution purification steps to extract and isolate PGMs, precious metals and base metals. All equipment used in the hydrometallurgical process would be located in a dedicated Hydrometallurgical Plant Building.
| M3-PN150164 26 March 2018 |
177
NorthMet Project
Form NI 43-101F1 Technical Report
Once the hydrometallurgical plant becomes operational some of the concentrates produced in the beneficiation plant will be feedstock to the hydrometallurgical process. The feedstock would be a combination of the separate nickel and pyrrhotite concentrates produced by the beneficiation plant. The decision to ship or process concentrates will be based on equipment maintenance schedules, customer requirements and overall project economics.
PolyMet expects the hydrometallurgical plant to be operational within two to three years after the beneficiation plant becomes operational. Error! Reference source not found. shows the overall process flow diagram, where the hydrometallurgical plant section is highlighted with darker lines and bold text. A list of major equipment in the hydrometallurgical plant is given in Table 17‑1 below.
Table 17‑1: List of Major Equipment in the Hydrometallurgical Plant
| Equipment | Size or Description | Installed Power |
| Autoclave (A/C) | Dia. 188 in (inside shell) Length 84 ft (T/T), Operating volume 11,240 ft3. 4 compartments, 6 agitators, membrane + 3-layer brick lining | 4 agit, 125 hp ea 2 agit, 75 hp ea |
| Flash Vessel | Dia. 20.7 ft (inside shell), Height 21 ft (T/T), Overall Height 36 ft | |
| A/C Feed Pump | 2 units, positive displacement piston pump, Flow Rate 504 gpm, Discharge Pressure 495 psi(g) | 163 hp ea |
| Leach Residue Thickener | High Rate, Dia. 34 ft | 3 hp |
| Iron Reduction Tank | Dia. 11 ft, Height 12 ft, Closed Top, FRP | 5 hp |
| Au/PGM Cementation Tanks | 2 units, Dia. 13 ft, Height 15 ft, Closed Top, FRP | 2 hp ea |
| Au/PGM Thickener | High Rate, Dia. 45 ft | 3 hp |
| Au/PGM Filter | Plate and Frame Filter | |
| Cu Conc Enrichment Tank | 3 units, Dia. 19 ft, Height 21 ft, Closed Top, FRP | 10 hp ea |
| Cu Conc Enrichment Thickener | High Rate, Dia. 25 ft | 3 hp |
| Cu Conc Enrichment Filter | Plate and Frame Filter | |
| Cu Sulfide Precip Preheat Tank | 1 unit, Dia. 15 ft, Height 17 ft, Closed Top, FRP, | 20 hp |
| Cu Sulfide Precipitation Tanks | 2 units, Dia. 18 ft, Height 18 ft, Closed Top, FRP | 25 hp ea |
| Cu Sulfide Precipitation Thickener | High Rate, Dia. 25 ft | 3 hp |
| Iron Removal Preheat Tanks | Dia. 18 ft, Height 20 ft, Closed Top, FRP | 15 |
| Iron Removal Tanks | 5 units, Dia. 19 ft, Height 21 ft, Closed Top, FRP | 15 hp ea |
| Iron Removal Thickener | High Rate, Dia. 34 ft | 3 hp |
| Iron Removal Belt Filter | Belt Filter, Filtration Area 237 ft2 | 15 hp |
1st Stage Mixed Hydroxide Precip Tanks | 3 units, Dia. 16 ft, Height 17 ft, Closed Top, FRP | 15 hp ea |
1st Stage Mixed Hydroxide Thickener | High Rate, Dia. 16 ft | 3 hp |
| Mixed Hydroxide Precipitated Filter | Plate and Frame Filter | |
2nd Stage Mixed Hydroxide Precip Tank | 2 units, Dia. 13.5 ft, Height 14.5 ft, Closed Top, FRP | 3 hp |
2nd Stage Mixed Hydroxide Thickener | High Rate, Dia. 16 ft | 3 hp |
| Mg Removal Tanks | 2 units, Dia. 15 ft, Height 16 ft, Closed Top, FRP | 5 hp ea |
| M3-PN150164 26 March 2018 |
178
NorthMet Project
Form NI 43-101F1 Technical Report
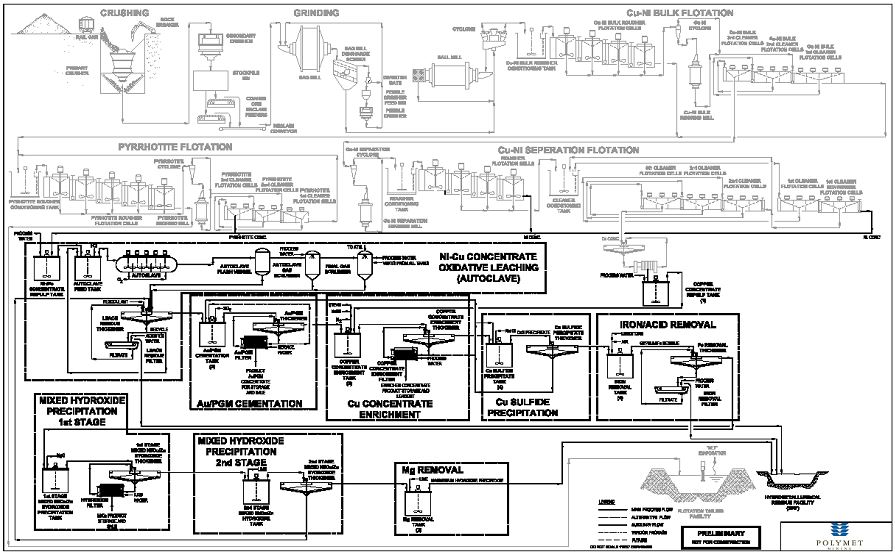
Figure 17‑6: Phase I & II - Overall Plant Process Flow Diagram, Highlighting the Hydrometallurgical Plant Section
| M3-PN150164 26 March 2018 |
179
NorthMet Project
Form NI 43-101F1 Technical Report
| 17.4.1 | Autoclave |
The autoclave serves to oxidize sulfide minerals in the concentrates into soluble sulfates. Gold and PGMs, once liberated from encapsulating sulfides form soluble chloride salt complexes. Conversion of the metal sulfides into soluble metals species is achieved using under 440°F and 504 psi leaching conditions, in an acidic liquor and the presence of chloride ions in the autoclave slurry. The autoclave is injected with oxygen gas supplied from a cryogenic oxygen plant to oxidize the sulfides and metal species into solution. The solid residue produced contains iron oxide, jarosite (iron sulfate) and any insoluble gangue (non-ore silicate and oxide minerals) from the two concentrate streams generated in the Beneficiation Plant.
Leach residue will be recycled (up to 230%) back to the mineral concentrate feed stream prior to introduction into the autoclave to maximize the extraction of Au/PGMs, thereby mitigating the requirement for a larger autoclave. Hydrochloric acid will also be added to maintain the proper chloride concentration in solution to enable leaching of the gold and PGMs. To ensure complete oxidation of all sulfide sulfur in the concentrate, and oxygen overpressure of 100 psi will be maintained in the autoclave.
Leached slurry exiting the autoclave will be reduced to atmospheric pressure using a dedicated flash vessel, which allows the removal of excess heat through the release of steam from the slurry.
An autoclave gas scrubber will be provided to the flash vessel for initial scrubbing of the vapor streams to remove the majority of entrained process solids and liquor. Slurry discharging from the flash vessel is further reduced to 140°F using dedicated spiral heat exchangers. The cooled slurry is pumped to the leach residue thickener. The heat transferred in the heat exchangers will be used to pre-heat the feed solution for residual copper removal and mill process water. The contained solids will then be settled in a high-rate thickener, producing a thickened underflow containing 55% (w/w) solids. The underflow is split, with the majority of the slurry being recycled to the autoclave feed tanks. The remainder of the slurry reports to the leach residue filter, which separates the barren autoclave residue solids from the process liquor containing the solubilized metals. Residual entrained metals are recovered by washing the autoclave residue with filter wash water. The washed residue is filtered tails with process water and pumped to the hydrometallurgical residue facility (HRF). The HRF is being permitted for conventional tailing deposition. Due to high precipitation in the area adding moisture and producing erosion, potential instability of frozen filtered residue during spring thaw, high potential for air quality impacts from particulates on dry winter and summer days, and the need for an ancillary residue storage facility to contain tailings for which filtering is not effective in achieving tailings sufficiently dry enough for stacking, a filtered tailings storage facility was not pursued.
The leach residue thickener overflow is then sent to other circuits to recover gold and PGMs by precipitation.
| 17.4.2 | Gold and Platinum Group Metals Recovery |
The leach residue thickener overflow is first reacted with SO2 to reduce ferric ions in solution, followed by reaction with CuS to precipitate Au and PGMs in the second and third tanks. Complete reduction of ferric ions is subsequently achieved by the addition of CuS, recycled from the Residual Copper Sulfide Precipitation Thickener underflow. Secondly, CuS is also used to recover platinum, palladium and gold from the autoclave leach liquor. This circuit produces a mixed Au/PGM sulfide with a large proportion of CuS and elemental sulfur. The discharge from the Au/PGM precipitation reactors is pumped to the Au/PGM thickener where CuS, enriched with Au/PGM metals, settles to produce thickened slurry suitable for filtration. The Au/PGM Thickener underflow is then pumped to the Au/PGM Filter which separates the Au/PGM precipitate solids from the process liquor which contain copper, nickel and cobalt metal values. Residual entrained metal values are recovered by washing the Au/PGM precipitate with raw water and recycling to the Au/PGM thickener. The Au/PGM filter produces an Au/PGM Concentrate cake of 80% (w/w) solids.
The Au/PGM cementation process will produce a filter cake, which comprises a mixture of gold and PGM sulfide precipitate. The filter cake will be put into either bulk bags or drums for sale to a third-party refinery. The Au/PGM thickener overflow is pumped to a candle filter to ensure all solids that contain residual Au/PGMs are recovered. The resulting clear solution reports to the Copper Enrichment area. Solids collected by the candle filter are returned to the Au/PGM thickener.
| M3-PN150164 26 March 2018 |
180
NorthMet Project
Form NI 43-101F1 Technical Report
| 17.4.3 | Concentrate Enrichment |
Copper concentrate from the dry concentrate storage will be re-pulped and reacted with the barren solution from Au/PGM cementation. Copper flotation concentrate will be enriched by mixing the depleted Au/PGM pregnant leach solution (PLS) with the concentrate. Soluble copper in the PLS reacts with chalcopyrite, cubanite and pyrite to produce CuS and FeSO4, as shown in the following metathesis reactions:
| · | CuFeS2 + CuSO4 = 2CuS + FeSO4 |
| · | CuFe2S3+ 2CuSO4 = 2CuS + 2FeSO4 |
| · | Fe7S8+ CuSO4 = 7CuS + 7FeSO4 + So |
The copper concentrate is enriched by the addition of copper into the solids and by the dissolution of iron. Copper would precipitate mostly in the form of copper sulfide. The enriched copper concentrate slurry will be thickened and filtered, then re-pulped and pumped back into the copper concentrate stream in the beneficiation plant ahead of filtration. All solutions will remain in the hydrometallurgical process.
The overflow solution from the copper concentrate enrichment thickener will be clarified and then pumped to the copper sulfide precipitation circuit to remove residual copper in solution.
| 17.4.4 | Copper Sulfide Precipitation |
The copper-depleted PLS from the concentrate enrichment process is reacted with NaHS liquor to further precipitate residual copper as CuS. The objective is to reduce the concentration of residual copper to less than 1 ppm.
Slurry from the final residual copper sulfide precipitation tank flows by gravity to the residual copper sulfide removal thickener. With the aid of flocculant, an underflow density of 18% (w/w) solids is achieved in the thickener. Nominally 75% of the thickener underflow is recycled to the residual copper sulfide precipitation tanks to provide a seed for the sulfide precipitation process. The remaining 25% supplies the CuS requirement of the Au/PGM precipitation reactors, where is it used for Au/PGM precipitation, and the excess CuS being sent to the copper enrichment concentrate filter to combine with the enriched copper concentrate product.
The copper sulfide precipitation thickener overflow is pumped to the iron/acid removal circuit.
| 17.4.5 | Iron, Aluminum and Acid Removal |
Residual copper sulfide precipitation thickener overflow will be pumped to the iron/acid removal reactors, where limestone and air are added to precipitate iron and aluminum as hydroxides, and sulfates (acid) as gypsum. The objective of the iron/aluminum removal step is to precipitate iron to less than 10 ppm and aluminum to less than 30 ppm. The reaction will be conducted at 176 ºF (80ºC) with dry calcium carbonate being added to reach an initial target pH of 3.8. The iron/acid removal reaction slurry discharge is thickened and filtered to produce iron and aluminum hydroxide filter cake. The precipitated metals in the filter cake, will be washed, re-pulped, combined with other hydrometallurgical residues and pumped to the hydrometallurgical residue facility. The thickener overflow will then be pumped to the mixed hydroxide precipitation (MHP) area for Ni/Co recovery.
| M3-PN150164 26 March 2018 |
181
NorthMet Project
Form NI 43-101F1 Technical Report
| 17.4.6 | Mixed Hydroxide Precipitation Recovery |
The recovery of nickel and cobalt will be achieved by producing a mixed hydroxide precipitate for sale to a third-party refinery. The copper/iron-free solution from the iron removal thickener overflow tank will be reacted with magnesium hydroxide in a two-stage process, with the majority of the nickel and cobalt being precipitated in the first stage. The pH will be controlled to limit magnesium co-precipitation to ensure that a clean nickel/cobalt precipitate is achieved. The solution will be heated to 158ºF (70ºC) and reacted with 20% w/w MgO to precipitate out nickel and cobalt. The resulting discharge from the first stage of mixed hydroxide precipitation flows by gravity to the first mixed hydroxide precipitation thickener. With the aid of flocculant, the underflow of about 40% (w/w) solids containing the precipitated metals is achieved. The underflow will be pumped to a filter feed tank, which has a capacity to hold 12 hours’ worth of slurry to allow for filter maintenance. The slurry will then be pumped at a controlled rate into the hydroxide filter to produce a filter cake of about 75% (w/w) solids. The filter cake will be washed with raw water to remove entrained process solution. The final mixed hydroxide product has an approximate composition totaling 97% nickel, cobalt and zinc hydroxides, with the remainder as magnesium hydroxide.
Thickener overflow from the first-stage precipitation will be pumped to two the second-stage mixed hydroxide precipitation tanks. Lime will be added to the tanks to raise the pH higher than what was achieved in the first stage to ensure precipitation of all remaining nickel and cobalt. Slurry from the second stage will flow by gravity to the second-stage mixed hydroxide thickener. Flocculant is added to help settle the hydroxide precipitates and produce an underflow product at a density of 40% (w/w) solids. The underflow product is then pumped to the leach residue thickener feed tank, to join the leach residue tailing stream. The second-stage thickener overflow will then be pumped to a final stage for partial magnesium removal.
| 17.4.7 | Magnesium Removal |
Solution from the second-stage mixed hydroxide precipitation thickener overflow will be pumped to the first of two magnesium (Mg) removal tanks. Lime slurry will be added in stages to each tank as required to facilitate magnesium precipitation. Approximately 50% of the remaining magnesium will be precipitated to produce process water that is essentially free of dissolved metal species. The resulting slurry will be pumped to the hydrometallurgical residue facility along with other residues where solids settle to be stored permanently in the tailing basin and water is reclaimed back to the hydrometallurgical plant process water system.
| 17.4.8 | Process Consumables |
Table 17‑2 is a list of reagents consumed in the hydrometallurgical plant processes. Information regarding reagent deliveries, capacity and nominal use are provided.
Table 17‑2: Materials Consumed by the Hydrometallurgical Plant Process
| Reagent | Quantity1 | Mode of Delivery | Delivery Condition | Storage Location | Containment |
| Sulfuric acid | 152 t/a | Tanker (2 tank cars/mo) | Bulk | Adjacent to General Shop Building | 31,965-gal storage tank with secondary containment |
| Hydrochloric acid | 3,376 t/a | Tanker (3 tank cars/mo) | Bulk | Adjacent to General Shop Building | 36,120-gal storage tank with secondary containment |
| Liquid Sulfur Dioxide | 8.2 t/a | Tanker (2 tank cars/mo) | Bulk | Adjacent to General Shop Building | 30,000-gal pressurized storage tank with secondary containment |
| M3-PN150164 26 March 2018 |
182
NorthMet Project
Form NI 43-101F1 Technical Report
| Reagent | Quantity1 | Mode of Delivery | Delivery Condition | Storage Location | Containment |
| Sulfuric acid | 152 t/a | Tanker (2 tank cars/mo) | Bulk | Adjacent to General Shop Building | 31,965-gal storage tank with secondary containment |
| Hydrochloric acid | 3,376 t/a | Tanker (3 tank cars/mo) | Bulk | Adjacent to General Shop Building | 36,120-gal storage tank with secondary containment |
| Liquid Sulfur Dioxide | 8.2 t/a | Tanker (2 tank cars/mo) | Bulk | Adjacent to General Shop Building | 30,000-gal pressurized storage tank with secondary containment |
| Sodium Hydrosulfide | 1,040 t/a | Tanker Truck (2-3 tankers/mo) | Bulk as a 45% solution with water (w/w) | Adjacent to General Shop Building | 25,750-gal storage tank |
| Limestone | 99,076 t/a | Rail (1 100-car train/week from April to October) | Bulk | Stockpiled on-site | Berms/ditches around outdoor stockpile with water that has contacted limestone collected and added to the plant process water. |
| Lime | 6,961 t/a | Freight (75 loads/mo) | Bulk | Adjacent to General Shop Building | Lime Silo and 21,000-gal storage tank |
| Magnesium Hydroxide | 6,389 t/a | Tanker (7 tank cars/mo) | 60% w/w magnesium hydroxide slurry | Adjacent to General Shop Building | Magnesium Hydroxide 270,000-gallon Storage Tank |
| Caustic (NaOH) | 91 t/a | Tanker Truck (1 load/mo) | 50% w/w solution | General Shop Building | 1,300-gal storage tank |
| Flocculant | 11.7 t/a | Freight | 1,543 lb. bulk bags of powder | Main Warehouse | In bags and batch mixed regularly as 0.3% w/w solution |
1Note: t/a = short tons per annum.
| 17.4.9 | Hydrometallurgical Plant Water |
A separate hydrometallurgical plant process water stream is required due to the nature of the different process solutions involved in the hydrometallurgical versus the beneficiation processes. Hydrometallurgical process water is likely to contain significant levels of chloride relative to the water in the milling and flotation circuits. The process water line would distribute reclaim water to various addition points throughout the hydrometallurgical plant from the hydrometallurgical residue facility. Make-up water could come from flotation concentrate water or raw water when required.
| 17.4.10 | Metal Recoveries |
The anticipated metal recoveries for the Hydrometallurgical Plant are provided in Table 17‑3:
Table 17‑3: Hydrometallurgical Plant Metal Recoveries
| Metal | Expected % Recovery |
| Copper | 97.0 |
| Nickel | 92.0 |
| Cobalt | 90.0 |
| Gold | 77.3 |
| Platinum | 77.6 |
| Palladium | 77.5 |
| 17.5 | Plant Site Air Quality Management |
A Fugitive Emissions Control Plan has been developed for the Beneficiation Plant and the Tailings Basin and approved by MPCA. The emission control systems on plant processes will have automated monitoring and alarming of operating parameters that indicate off-spec performance with auditable procedures to track the actions taken by operating and maintenance personnel in response to the alarm. Periodic stack testing would demonstrate compliance and confirm the proper alarm points.
| M3-PN150164 26 March 2018 |
183
NorthMet Project
Form NI 43-101F1 Technical Report
As is proposed for the Beneficiation Plant, all active areas of the Hydrometallurgical Plant Site, including the HRF, will be subject to a Fugitive Emissions Control Plan approved by MPCA. The emission control systems on plant processes will have automated monitoring and alarming of operating parameters that indicate off-spec performance with auditable procedures to track the actions taken by operating and maintenance personnel in response to the alarm. Periodic stack testing would demonstrate compliance and confirm the proper alarm points.
| 17.5.1 | Hydrometallurgical Residue Management |
The hydrometallurgical process would generate residues from four sources:
| · | Autoclave residue from the leach residue filter |
| · | Gypsum, iron and aluminum hydroxides from the iron/acid removal filter |
| · | Magnesium hydroxide precipitate from the magnesium removal tank |
| · | Other minor plant spillage sources that report to sumps in the plant |
In addition to the above listed sources, solid waste or sludge from the WWTS will be recycled directly into the Hydrometallurgical Plant to recover metals. The WWTS solids should resemble the Hydrometallurgical Residue Facility materials, consisting primarily of gypsum, metal hydroxides and calcite. These hydrometallurgical residues, which will include the non-recoverable metal portion of the solid waste from the WWTS, will be combined and disposed of in the Hydrometallurgical Residue Facility as described below.
| 17.5.2 | Hydrometallurgical Residue Cell Design and Operations |
The Hydrometallurgical Residue Facility will consist of a double-lined cell located adjacent the southwest corner of Cell 2W of the former LTVSMC tailings basin. The cell will be developed incrementally as needed, expanding vertically and horizontally from the initial construction and will initially be designed to accommodate approximately 2,000,000 tons or six years’ worth of operations. The cell will be filled by pumping the combined hydrometallurgical residues as slurry from the Hydrometallurgical Plant. A pond will be maintained within the cell so that as solids settle out, the liquid can be recovered by a pump system and returned to the plant for reuse. The residue discharge point into the cell will be relocated as needed to distribute residue solids evenly throughout the cell.
| 17.6 | Water Management |
Water will be consumed at the Plant Site in both the Beneficiation Plant and the Hydrometallurgical Plant. For the most part, water operations within these two plants would be independent of each other. The only exceptions would be the transfer of flotation concentrates from the Beneficiation Plant to the Hydrometallurgical Plant and the combining of filtered copper concentrate and solution from Au/PGM Recovery in the Copper Concentrate Enrichment process step.
| 17.6.1 | Hydrometallurgical Plant |
All water that enters the Hydrometallurgical Plant will be recycled at each step of the process. The average annual water demand for the Hydrometallurgical Plant is estimated at 240 gpm, but may vary from 114 to 406 gpm monthly as operating and climatological variations occur. To the extent possible, water used to transport residue to the tailing facility would be returned to the Hydrometallurgical Plant; however, losses may occur via evaporation and storage within the pores of the deposited residue. In addition, spilled fluids will be returned to the appropriate process streams.
| M3-PN150164 26 March 2018 |
184
NorthMet Project
Form NI 43-101F1 Technical Report
| 18 | PROJECT INFRASTRUCTURE |
The NorthMet Project has a large amount of existing infrastructure that is well established but requires modifications and refurbishment to support the process application. The existing usable infrastructure includes the following:
| · | 138 kV incoming HV power supply from the Minnesota Power grid |
| · | Power distribution to the existing facilities |
| · | Process plant buildings complete with distribution services |
| · | Administration and site offices |
| · | Site and mine access roads |
| · | Rail network including locomotive services and re-fueling facilities |
| · | Natural gas supply |
| · | FTB with return water barge and pumps |
| · | Mining and plant workshops |
A description of the existing and new infrastructure required for the NorthMet Project is given below, along with details of the work required to bring these facilities into operation.
| 18.1 | Plant and Administrative Infrastructure |
| 18.1.1 | Asset Preservation |
The existing processing plant infrastructure facilities are being refurbished to ensure that the plant is safe and allows for effective plant operation and maintenance. The following pre-construction, upfront, asset preservation work is required for safe access by construction crews and to preserve any existing equipment and infrastructure required by the project. The following work is contemplated by PolyMet’s agreements with Cliffs Erie:
| · | Asbestos abatement, |
| · | Mold and lead-based paint removal, |
| · | Temporary heating and ventilation, |
| · | General cleaning, |
| · | Refurbishment of damaged roofs and side sheeting of buildings, |
| · | Adequate lighting in working areas, and |
| · | Refurbishment of cranes and hoists. |
The costs associated with these activities are not included in the capital cost estimate.
| 18.1.2 | Plant Workshops |
The existing plant general workshops also need to be refurbished and equipped to meet the plant general workshop requirements. This also includes refurbishing and restoring services to these facilities.
| 18.1.3 | Plant Warehouses |
The existing plant warehouses will be refurbished and will serve as the main warehouses. All large equipment will be stored in either the old fine crusher building or a section of the general workshop, depending on the final plant layout.
| M3-PN150164 26 March 2018 |
185
NorthMet Project
Form NI 43-101F1 Technical Report
| 18.1.4 | Administration Offices |
The existing PolyMet administration offices can accommodate approximately 200 personnel and will serve in the same capacity in addition to serving as a temporary construction management facility during construction. The offices are equipped with telecommunications, networking and fiber optic connections, but require minor refurbishment and an upgrade of the heating and cooling system.
| 18.1.5 | Site First Aid Station |
There are currently no existing facilities for a site first aid station, and as such this will need to be established in the general workshop or the administration office to provide for construction and operational medical cases. The first aid station will only serve to treat minor cases and provide stabilization prior to dispatch to the local hospital.
| 18.1.6 | Laboratory |
Assay and analytical capacity will be established on a contract basis to serve the mining assay requirements. A separate area will be designated to store samples. The laboratory will be operated by a reputable contractor and is included in the operating costs.
| 18.2 | Mine Infrastructure |
| 18.2.1 | Mine Workshops, Warehouses and Offices |
The existing Area 1 truck shop, which is located approximately 1 mile west of the process plant and approximately 9 miles west of the mining pits, would be utilized for the maintenance of the mining fleet. The workshop comprises six bays capable of accommodating 240 t trucks, three heavy equipment bays, truck wash down bay, and miscellaneous workshops, warehouses, offices, change house and messing facilities. The workshops require cleaning and minor refurbishment.
| 18.2.2 | Mine Site Service and Refueling Facility |
A covered Mine Site services building and refueling depot is scheduled to be erected within the Mine Site. This services building would handle minor maintenance requirements for the mining fleet. Fuel delivery and storage will be handled by a contractor.
| 18.2.3 | Rail Loadout |
The plan is to mine the ore using shovels and haul the ore via haul truck to the rail transfer hopper (RTH) located to the south of the proposed pits. The rail transfer hopper provides 3000 to 3500 t of live storage above an apron feeder that feeds the ore into rail cars. The Ore Surge Pile (OSP) located adjacent to the RTH would allow for additional buffer storage.
The existing rail transfer hopper “super pocket”, utilized by LTVSMC during taconite mining operations, will be refurbished. Provisions have also been made, in the design, for loading rail cars by means of front-end loaders from the OSP, to ensure continuous plant feed when the RTH is down for maintenance.
A new rail spur from the RTH and a connection to the main rail line feeding the primary crushing building will be established. Sections of the main line are also scheduled to be refurbished with new track.
| M3-PN150164 26 March 2018 |
186
NorthMet Project
Form NI 43-101F1 Technical Report
| 18.3 | Haul and Access Roads |
The mine has a well-established access road from the Plant Site called Dunka Road. Roads to the existing facilities at the Plant Site require varying levels of refurbishment. A new access road from Dunka Road will be established along with the haul road network within the Mine Site connecting mine pits with stockpiles, the rail transfer hopper, the Ore Surge Pile, the Overburden Storage and Laydown Area, and the Mine Site Fueling and Maintenance Facility.
| 18.4 | Rail Facilities |
The mine has a well-established rail network connecting to most of the existing facilities at the Plant Site. Sections of the rail system require refurbishment and new sections are needed to service the new mining and concentrate loadout facilities. All rail design and engineering was carried out by Krech Ojard (KO).
| 18.5 | Water Supply |
| 18.5.1 | Raw Water Supply |
The plant has an existing raw water supply from Colby Lake, which is situated 5 miles south of the Erie Plant. Raw water from Colby Lake would be supplied to the plant using an existing pump station and pipeline. Plans are to replace the pumps and replace sections of pipe, as needed. Raw water will be used to supplement the mine water and FTB return water to meet the plant’s process water requirement when necessary.
| 18.5.2 | Potable Water Distribution |
Bottled drinking water will be available at the Mine Site. Raw water will be treated to meet potable water standards for the plant.
| 18.5.3 | Fire Water Distribution |
The existing Plant Site fire water distribution system requires complete refurbishment. New fire water pumps, new piping in certain sections and new hydrants and hose reels are required. The distribution piping will also be extended into the new plant areas.
| 18.5.4 | Sewage Collection and Treatment |
The existing sewage treatment plant would be replaced with sewage treatment ponds in accordance with current requirements. The sewage collection system would be refurbished and extended to the new facilities as required.
| 18.6 | Flotation Tailings Basin (FTB) |
The existing tailings facility would be utilized for the NorthMet project FTB. The current facility is unlined and divided into three adjacent cells; 1E, 2E, and 2W. Cell 2E would be utilized initially until it is brought up to the same level as cell 1E and thereafter, both cells would be utilized.
The FTB perimeter dams would be raised in eight lifts in an upstream construction method using compacted bulk tailings from the existing tailings facility, consisting primarily of coarse tailings, and imported structural fill. These tailings and fill would be placed and compacted in accordance with the FTB design specifications. Rock buttress would be built along the north side of the cell 2E north dam (incrementally from project start through year 7), and along a portion of the south edge of cell 1E during the fifth lift (year 7). To limit air infiltration into the tailings deposit, a bentonite barrier layer would also be included on the exterior sides of the dams at a depth of 30 inches below the surface. Tailings beaches would exist along the northern and north-eastern dams of cell 2E and the southern and eastern dams of cell 1E.
| M3-PN150164 26 March 2018 |
187
NorthMet Project
Form NI 43-101F1 Technical Report
The flotation tailings from the flotation process would be pumped to the FTB by means of a single pumping station located in the concentrator building. Minimal particle segregation of the tailings on the FTB is expected due to the small and fairly uniform grind size of the tailings. On the FTB, the flotation tailings would settle out of the slurry and the decanted water would pond and get pumped back to the beneficiation process by a return water system consisting of pump barges.
The flotation tailings from the flotation process would be pumped to the FTB by means of a single pumping station located in the concentrator building. Minimal particle segregation of the tailings on the FTB is expected due to the small and fairly uniform grind size of the tailings. On the FTB, the flotation tailings would settle out of the slurry and the decanted water would pond and get pumped back to the beneficiation process by a return water system consisting of pump barges.
Pump barges for return will be located on both cells. The auxiliary barge in cell 2E would transfer decanted water to cell 1E from where the primary barge would pump the water back to the plant. Once the two cells have combined, the auxiliary barge would become obsolete.
During periods of shutdown over winter operations, the return water would be drained back to the ponds to avoid pipe damage due to freezing. The return water pipes would be fitted with relief drain valves.
Any water that discharges around the perimeter of the FTB as seepage water would be collected through the FTB seepage capture systems and returned to the FTB Pond or pumped to WWTS.
| 18.7 | Waste Water Treatment |
The treatment of waste water generated from the NorthMet Project process and mining operations is a critical factor for the Project. Stringent discharge requirements dictate the need for a comprehensive water treatment solution that meets environmental and Project requirements. A diagram of the Process Plant Water Balance is included in Figure 16‑4.
A Waste Water Treatment System (WWTS) will be located between the process plant and the FTB. The WWTS will treat water collected from the tailings basin seepage capture systems, pit dewatering, stockpile drainage, haul road drainage, and rail transfer hopper.
To transport mine water to the Plant Site for treatment, a three-pipeline system will be constructed. The three Mine to Plant Pipelines will deliver three types of mine water (high concentration mine water, low concentration mine water, and construction mine water) to their respective destinations at the Plant Site.
The permeate (treated water) from the WWTS would be discharged to the stream augmentation system around the perimeter of the FTB, while the filtered sludge from the chemical precipitation process would be disposed off-site at an appropriately permitted facility or, once constructed, in the hydrometallurgical residue facility.
| 18.7.1 | Mine Site Waste Water Collection and Distribution |
The Mine Site Equalization Basin Area would consist of the following:
| · | Equalization and construction water basins |
| · | Pump stations |
| 18.7.2 | Waste Water Treatment System |
The WWTS at the plant would consist of the following:
| · | A pre-treatment basin |
| · | Greensand filtration |
| · | Reverse Osmosis (RO) membrane system |
| · | Nanofiltration (NF) membrane system |
| · | Secondary membrane system (VSEP) |
| M3-PN150164 26 March 2018 |
188
NorthMet Project
Form NI 43-101F1 Technical Report
| · | Chemical precipitation incorporating 3 stages of mix tanks, reactor tanks, clarifiers and sludge filtration |
| · | Limestone contactors and de-gasifiers |
| · | Plant building incorporating reagent handling and storage, pumping, piping, power supply and control equipment |
| · | Access roads |
| 18.8 | Power Supply |
| 18.8.1 | Plant Power Supply |
The power for the Plant Site will be provided by Minnesota Power at a voltage level of 138 kV via overhead lines to the switchyard located adjacent to the milling/concentrator building. Minnesota Power reports that 220 MW is available to provide to the Project. The power requirements for the proposed plant will be 95 MVA under base load steady state conditions, providing for 120 MVA during start-up, excluding the mine and auxiliary feeders. The mine and auxiliary feeders have a combined power requirement of 7.45 MW.
The 138-kV plant switchyard would require extensive refurbishment. Most of the equipment is obsolete and would require replacement. The 138-kV switchyard terminates on the HV terminals of 3 off 50/66 MVA step-down transformers which in turn will provide 13.8 kV to the main MV consumer substation by means of three 2500 A feeders. The existing 50 MVA transformers are more than 50 years old and would require replacement to ensure the plant meets the required utilization.
| 18.8.2 | Mine Site Power Supply |
The mining facilities would receive power from the Plant Site substation. A new 7.5-mile 13.8 kV overhead power line would be constructed between the plant and the Mine Site, following Dunka Road.
The distribution system will deliver power to the following major facilities:
| · | Mining locations for mining equipment and dewatering pumps |
| · | Central pumping station and construction water basin pumping station |
| · | Equalization Basin Area |
| · | Rail transfer hopper |
| · | Stockpile collection sumps |
| · | Mine Site fuelling and maintenance facility |
| 18.8.3 | Emergency Power Plant |
Provisions have been made for 5 MW of emergency power to be installed next to the PolyMet substation for the mine feeder, as well as 5 MW in the process plant area. The emergency power would be supplied to keep critical systems operational during any power failure, including plant heating, water treatment and storage, spillage handling, and slurry management to prevent settling out and potential lengthy operational delays. The plant emergency power would be powering the following equipment:
| · | HVAC system |
| · | Certain valves |
| · | Lighting |
| · | Selected equipment from the equipment list, including sump pumps, hoists, cranes and key agitators |
| M3-PN150164 26 March 2018 |
189
NorthMet Project
Form NI 43-101F1 Technical Report
The exact locations of the generating sets as well as the distribution system would be finalized during the detailed design phase.
| 18.9 | Natural Gas Supply |
The Plant Site is served by a natural gas pipeline with up to 13,000 million cubic ft per day of natural gas at 125 psi, which is sufficient for the project needs.
| 18.10 | Accommodations |
It is the opinion of the PolyMet staff that temporary construction accommodations would not be required. Preference would be given to sourcing locally based contractor personnel, and any contractor personnel not based in the area would source their own accommodations.
Additional accommodations would also not be provided for operations personnel as sufficient housing is available for all staff within the surrounding areas.
| M3-PN150164 26 March 2018 |
190
NorthMet Project
Form NI 43-101F1 Technical Report
| 19 | MARKET STUDIES AND CONTRACTS |
Saleable products from the NorthMet project will initially be copper and nickel concentrates under the Phase I scenario. These products will be sold to smelting and refining complexes capable of recovering a number of metals contained in these products. It is estimated copper will contribute 61% of net revenues, nickel 18%, PGMs 18%, cobalt 2%, gold and silver 1%.
Phase II of the project includes construction of a hydrometallurgical facility that will result in upgrading the nickel concentrates into a higher purity nickel-cobalt hydroxide and a precious metals precipitate. Including copper concentrate sales, it is estimated net revenues will comprise copper 54%, nickel 20%, PGMs 22%, cobalt 2% and gold and silver 2%.
| 19.1 | Commodity Price Projections |
PolyMet relies on a number of industry bodies and banks with dedicated market research groups for market analysis and metal price forecasts. Metal prices used in this report are derived from the average of long-term price projections
Metal price projections are presented in Table 14‑33 for resource estimations, Table 15‑2 for reserve estimations and in Table 22‑2 for economic analyses.
| 19.2 | Contracts |
PolyMet has entered into a long-term marketing agreement with Glencore whereby Glencore will purchase all products (metals, concentrates or intermediate products) on independent commercial terms at the time of sale. Glencore will take possession of the products at site and be responsible for transportation and ultimate sale. Pricing is based on London Metal Exchange with market terms for processing. In the case of copper concentrates, the benchmark is annual Japanese smelter contracts.
In view of Glencore’s position as one of the world’s largest traders of commodities, with especially strong positions in copper and nickel, there are no material risks associated with product marketing for the Project.
| M3-PN150164 26 March 2018 |
191
NorthMet Project
Form NI 43-101F1 Technical Report
| 20 | ENVIRONMENTAL STUDIES, PERMITTING AND SOCIAL OR COMMUNITY IMPACT |
The NorthMet Project has undergone extensive state and federal environmental review culminating in publication of the Final Environmental Impact Statement (FEIS) in November 2015. The FEIS concluded that the Project could be constructed and operated in a manner that meets both federal and state environmental standards and is protective of human health and the environment. The FEIS provides a detailed description of the NorthMet Project, the potential impacts to the environment, and the associated design and mitigating measures. PolyMet made numerous refinements during the environmental review process to incorporate avoidance or mitigation measures that will produce substantial environmental benefits and other advantages to the Project.
PolyMet is in process of obtaining a number of state and federal permits in reliance on the FEIS that will guide PolyMet's construction, operations, reclamation, closure, and post-closure maintenance activities.
| 20.1 | Environmental Review and Permitting |
The United States Forest Service (USFS), together with the U.S. Army Corps of Engineers (USACE) and the Minnesota Department of Natural Resources (MDNR) (collectively, the “Co-Lead Agencies”) led a joint federal and state environmental review of the NorthMet Mining Project and Land Exchange under the National Environmental Policy Act (NEPA) and the Minnesota Environmental Policy Act (MEPA) over the course of ten years. The United States Environmental Protection Agency (EPA) and tribal authorities were cooperating agencies in the process, and the Minnesota Pollution Control Agency (MPCA) assisted in the preparation of the FEIS. This comprehensive process included multiple rounds of agency, tribal, and public review and comment.
In December 2013, the Co-lead Agencies published the Supplemental Draft EIS. As required, the EPA issued comments on the Supplemental Draft EIS, including an EC-2 rating, which is the highest rating for a proposed mining project in the US known to PolyMet.
The Co-Lead Agencies published the Final Environmental Impact Statement (FEIS) in November 2015. In March 2016, the Minnesota Department of Natural Resources (MDNR) issued a Record of Decision (ROD) concluding that the FEIS addresses the objectives defined in the EIS scoping review, meets procedural requirements, and responds appropriately to public comments. The 30-day period allowed by state law to challenge the ROD passed without any legal challenge being filed.
The USFS completed its administrative review process and issued a Final ROD for the proposed land exchange on January 9, 2017. The USACE will use the analysis developed in the FEIS to prepare a Record of Decision (ROD) for PolyMet’s pending CWA Section 404 permit application.
The environmental review process that culminated in the FEIS provides governmental decision makers and the public with information about the potential effects of the Project, as well as the mitigation measures that will be taken to eliminate or reduce the effects of the Project on the surrounding environment. As required by NEPA and MEPA, agency decision makers will consider the information in the FEIS before issuing the various permits and approvals needed to build and operate the Project.
PolyMet has submitted the permit applications needed for all applicable major state and federal permits. The MDNR and the Minnesota Pollution Control Agency (MPCA) are now proceeding with the permitting processes, which will allow them to determine whether, and on what conditions, to issue state permits for the Project. Both agencies issued all major draft state permits by the end of January 2018. The public review and comment periods for those permits presently were completed in mid-March 2018. The agencies will then consider public comments as part of their determinations on whether to issue final state permits.
| M3-PN150164 26 March 2018 |
192
NorthMet Project
Form NI 43-101F1 Technical Report
Table 20‑1 below lists the permits PolyMet has applied for, which agency oversees the permit, and what subjects are covered by the permit.
Table 20‑1: Permits Under Application
| Permit | Agency | Subject(s) Covered |
| NPDES/SDS Permit | MPCA | Treated water discharge; groundwater and surface water monitoring; water quality |
| 401 Certification | MPCA | State water quality certification of federal 404 related activities |
| Air Quality Permit | MPCA | Air emissions; sources and limits |
| Construction Stormwater Permit | MPCA | Addresses runoff from land-disturbing construction activities |
| Permit to Mine | MDNR | Construction and development; financial assurance |
| Dam Safety Permit | MDNR | Construction, operation and maintenance of dams |
| Public Waters Work Permit | DNR | Construction within a public water |
| Water Appropriation Permit | MDNR | Water quantity and use |
| Wetland Replacement Plan | MDNR | Wetland impacts and mitigation |
| 404 Permit | USACE | Wetland impacts and mitigation |
The Project incorporates, consistent with Minnesota policy, the refurbishment and reuse of existing ferrous mining facilities at the Plant Site. These existing ferrous mining facilities remain subject to several permits issued to Cliffs Erie, including a ferrous Permit to Mine for closure activities issued by the DNR and two existing NPDES/SDS permits issued by MPCA for closure purposes. Only portions of these existing permits are applicable to the Project, and they also include many facilities and locations that will not be used in the Project. The portions of these existing DNR and MPCA permits held by Cliffs Erie that are subject to the Project are expected to be either assigned to PolyMet or terminated at or before issuance of the NorthMet permits by DNR and MPCA if those final state permits are issued. The draft permit to mine and NPDES/SDS permit for the Project contain provisions addressing these existing Cliffs Erie permits applicable to the Project. PolyMet’s contract for deed arrangement with Cliffs Erie also address these permitting matters, and release of Cliffs Erie from its existing DNR and MPCA permitting obligations and assumption of those obligations by PolyMet are among the conditions for final closing on the contracts for deed and ultimate conveyance of fee title of certain properties, including the Erie Plant, from Cliffs Erie to PolyMet.
| 20.2 | Baseline Studies |
Extensive baseline studies were completed for the Project and are described in Section 4 (Affected Environment) of the FEIS. These studies include extensive data on local lakes and rivers, including: meteorological conditions, ground and surface water, wetlands, hydrology, geotechnical stability, waste characterization, air quality, vegetation (types, invasive non-native plants, and threatened and endangered species), wildlife (listed species and species of special concern, species of greatest conservation need and regionally sensitive species), aquatic species (surface water habitat, special status fish and macroinvertebrates), noise, socioeconomics, recreational and visual resources, and wilderness and other special designation areas.
| 20.3 | Environmental Considerations |
There are no known environmental issues for the NorthMet Project that cannot be successfully mitigated through implementation of the various management plans that have been developed based on accepted scientific and engineering practices. Adaptive management will be employed at the Project by using flexible engineering controls that can be adjusted to continue achieving compliance with applicable water quality standards and permit conditions when site-specific conditions vary.
| M3-PN150164 26 March 2018 |
193
NorthMet Project
Form NI 43-101F1 Technical Report
| 20.3.1 | Waste Management |
PolyMet plans to re-use an existing taconite tailings basin for storage of NorthMet’s Flotation Tailings. The stability and design of the FTB have been investigated and reviewed by numerous geotechnical consultants, including Barr Engineering, Knight Piésold, Scott Olson (geotechnical professor at the University of Illinois), and Dirk Van Zyl (University of British Columbia). The results and recommendations of these third-party peer reviews have been incorporated into the design and operating plans for the FTB.
The results of PolyMet’s waste characterization program were used for multiple purposes in support of the design, environmental review, and permitting of the Project. At early stages of Project design, results from the waste characterization program were used to form the conceptual models for metal leaching and potential acid generation from Project materials. The characterization data on mineralogy, petrology, chemistry (including dissolved solids release), acid-base accounting, and static leach tests on Project materials were used to identify the minerals with potential to release metals or acidity during weathering, and the Project-specific mechanisms that are expected to consume acidity. Results from the waste characterization program were used to identify the sulfur criteria thresholds used to classify waste rock as part of the Project’s waste rock management program.
Custom test work on tailings deposition, conducted by Saint Anthony Falls Laboratory, University of Minnesota, informed decisions on management of the Flotation Tailings. Additional custom test work on potential interactions between Flotation Tailings and LTVSMC tailings was used to identify potential chemical interaction, or lack thereof, that would need to be incorporated into predictions of the chemistry of the FTB seepage. In the case of the hydrometallurgical residue, waste characterization results were used to compare leachate chemistry with criteria values for classification of hazardous waste.
In addition to the testing listed above, results from the waste characterization program were used to define input parameters for PolyMet’s probabilistic water models developed to predict water quantity and quality at the Mine Site and the Plant Site used for environmental review and permitting. Input parameters from PolyMet’s waste characterization program included constituent release rates, concentration caps, constituent flushing loads, time lag to formation of acidic conditions, and parameters that are used to model residual saturation of Flotation Tailings.
For over 10 years, PolyMet has conducted a mine waste characterization program to determine the potential of acid rock drainage and/or metal leaching. Also, numerous geotechnical consultants have studied and modeled the stability of the tailings basin. PolyMet and its engineering team used the results of these studies and analyses to design facilities that, through proposed management practices, can be constructed, operated, and reclaimed so as to be structurally sound and minimize environmental impacts. PolyMet’s draft Permit to Mine contains achievable terms and conditions to protect human health and the environment.
| 20.3.2 | Water Management |
The overall Project water management strategy includes reusing water from the Mine Site at the Plant Site, as well as reusing water within various Plant Site facilities, to maximize water recycling and minimize discharges to the environment. Water will be treated using chemical precipitation and/or membrane separation treatment. Treated water discharge will be used to augment streamflow, where needed, in watersheds around the FTB. The Project design includes systems for managing and monitoring water to comply with applicable surface water and groundwater quality standards at appropriate compliance points. PolyMet designed the water management systems to achieve compliance based on modeling of expected water quantity and quality (See Section 16.8). The key treatment technologies include membrane filtration and high-density sludge chemical precipitation. Additionally, PolyMet has created adaptive management and contingency mitigation procedures for water management that it will utilize as necessary to maintain regulatory compliance.
| M3-PN150164 26 March 2018 |
194
NorthMet Project
Form NI 43-101F1 Technical Report
PolyMet draft water quality and quantity permits contain achievable terms and conditions to protect human health and the environment as applicable to water management.| 20.3.3 | Air Management |
PolyMet will use conventional air pollution control techniques common to mining and other industrial operations. These control techniques include fabric filters, venturi and packed-bed scrubbers, and fugitive dust control procedures at various facilities, locations, and phases within the Project to provide levels of emission control that will protect human health and the environment. These control techniques are considered to be state-of-the art with respect to air pollution control.
The MPCA, pursuant to its authority under state law and under the federal CAA as delegated by the USEPA, will be responsible for the air permitting for the Project. PolyMet’s draft air permit contains achievable terms and conditions to protect human health and the environment as applicable to air quality management.
| 20.3.4 | Land Management |
PolyMet has control of the mineral rights necessary for the Project. Control of the surface rights at the Mine Site is the subject of the land exchange with the USFS discussed in Section 20.1. As noted above, the USFS issued its Record of Decision (ROD) to transfer title to PolyMet on January 9, 2017, with the administrative title transfer process underway. Pending litigation could affect the title transfer process.
PolyMet holds various legal interests (including equitable title, leasehold interests, option agreements (which have been exercised), contracts for deed, use rights, and other property interests) to certain surface lands within the Plant Site and Mine Site pursuant to several agreements with Cliffs Erie and its affiliates (the Cliffs Agreements). As discussed above, the Cliffs Agreements are subject to completion of various contingencies, including requirements regarding final issuance of permits for the NorthMet Project and disposition of existing DNR and MPCA permits held by Cliffs Erie. There also are certain additional lands within the Plant Site for which PolyMet has agreements in place with parties other than Cliffs Erie.
| 20.4 | Social Issues |
| 20.4.1 | Labor and Employment Support |
The NorthMet Project has strong support from labor and business groups, local citizens, communities and counties in northeastern Minnesota and statewide. More than 30 elected bodies and business organizations have passed resolutions of support for the Project.
For employment, it is estimated that approximately 2 million manhours will be required to construct the project, and that 360 direct jobs will be created during operations. These direct jobs would generate additional indirect and induced employment, estimated to be 332 additional construction-phase jobs and 631 additional operations-phase jobs. Indirect and induced effect employment numbers are calculated by IMPLAN and may include temporary, part-time, full-time, long-term, or short-term jobs. While some skilled workers would be involved only temporarily and would possibly relocate from outside the region, the majority of the NorthMet Project-related jobs are expected to be filled by those currently residing in the Arrowhead region.
| 20.4.2 | Economic Impact |
According to a study by the UMD Labovitz School of Business and Economics (2009), during operations, there would be approximately $231 million per year in direct value added through wages and rents and $332 million per year in direct output related to the value of the extracted minerals. As with employment, these direct economic contributions would create indirect and induced contributions, estimated at $99 million in value added and $182 million in output.
| M3-PN150164 26 March 2018 |
195
NorthMet Project
Form NI 43-101F1 Technical Report
| 20.4.3 | Treaties and Indigenous Groups |
The NorthMet Project area is located within the territory ceded by the Chippewa of Lake Superior to the United States in 1854. The Chippewa hunt, fish, and gather on lands in the 1854 Ceded Territory. Harvest levels and other activities are governed by either individual tribal entities (in the case of the Fond du Lac Band) or the 1854 General Codes and subsequent Amendments under the 1854 Treaty Authority (in the case of the Grand Portage and Bois Forte bands). Pursuant to Section 106 of the National Historic Preservation Act, the federal Co-lead Agencies identified several historic properties in consultation with the State Historic Preservation Office (SHPO), Bands, and PolyMet. A Memorandum of Agreement under Section 106 was signed by PolyMet, USFS, USACE, and SHPO in December 2016.
| 20.5 | Closure Plan and Financial Assurance |
PolyMet plans to build and operate the NorthMet Project in a manner that will facilitate concurrent reclamation, in order to minimize the portion of the Project that will need to be reclaimed at closure.
The overall objectives of the Closure Plan are to meet the following criteria:
| · | The closed Mining Area or portion is safe, secure, and free of hazards, |
| · | It is in an environmentally stable condition, and |
| · | It minimizes hydrologic impacts and the release of hazardous substances that adversely affect natural resources; and it is maintenance free |
The items are covered in detail in the Closure Plan and include:
| · | Mine Site Reclamation, Closure, and Postclosure Maintenance – structure demolition and reclamation, temporary stockpiles and haul road reclamation, mine pit reclamation, water management infrastructure reclamation, water management, and maintenance of reclaimed areas. |
| · | Plant Site Reclamation, Closure, and Postclosure Maintenance – structure and infrastructure demolition and reclamation, Areas of Potential Concern, FTB reclamation, HRF reclamation, water management infrastructure reclamation, water management, maintenance of FTB and HRF dams and facilities, and maintenance of reclaimed areas. |
| · | Transportation and Utility Corridors Reclamation, Closure, and Postclosure Maintenance. |
| · | Colby Lake Pipeline Corridor Reclamation, Closure, and Postclosure Maintenance. |
| · | Auxiliary Facilities Reclamation, Closure, and Postclosure Maintenance. |
| · | Waste disposal. |
| · | Plans to transition from mechanical to non-mechanical water treatment. |
| · | Monitoring during Reclamation, Closure, and Postclosure Maintenance. |
| · | Reporting during Reclamation, Closure, and Postclosure Maintenance. |
Before a final Permit to Mine can be granted, financial assurance instruments covering the estimated cost of reclamation, should the mine be required to close in the upcoming year, must be submitted and approved by the MDNR. Minnesota Rules require PolyMet to annually update its financial assurance. These costs have been accounted for in the overall project economics. The draft permit to mine includes detailed conditions regarding the financial assurance that will be required in connection with the final permit to mine, if it issued, and possible future changes to the financial assurance, including possible changes based on any revisions to applicable law or to the mining plans.
| M3-PN150164 26 March 2018 |
196
NorthMet Project
Form NI 43-101F1 Technical Report
Under Minnesota law, the reclamation cost estimates that form the basis of the financial assurance will be updated annually. This process acknowledges possible future changes to the financial assurance, including possible changes based on any revisions to applicable law or to the mine plan. For purposes of this Study, PolyMet has assumed that the Minnesota water quality standards governing sulfate in wild rice water will be revised, as required by law, after the Project is in operations.| 20.6 | Discussion on Permitting Risks to Mineral Resources and Mineral Reserves |
The mine plan considered in the FEIS and draft permits contemplates mining and processing approximately 225 million tons of ore over a twenty-year Project life. Section 3.0 of the NorthMet Project Description, one of the technical documents that support the FEIS, recognizes that “new data collected from drilling conducted prior to the start of mining and during mining operations will provide additional information that will be incorporated into the Block Model, and hence, mine scheduling. The pit configuration, staging, and stockpile layout will be progressively refined throughout the 20-year life of the mine. Prices of metals, energy, labor, and other factors determine the optimum mining schedule; as these change, the Mine Plan will be adjusted, potentially on an annual basis.”
In some cases, modifications to PolyMet’s mine plan would be subject to state and federal regulatory review. Economic development of mineral resources outside the mine plan, if PolyMet should decide to pursue such development, will require additional environmental review and permitting.
| 20.7 | Comments on Section 20 |
Environmental review and permitting is arguably the greatest challenge facing any mining project in the United States. The EPA’s participation in the environmental review as a Co-operating Agency, the EPA’s high rating of the supplemental draft EIS and its subsequent letters to the Co-lead Agencies on the FEIS, as well as publication of the FEIS and subsequent ROD by the state of Minnesota and ROD from the USFS, and draft state permits out for public review, form a foundation for completion of permitting. The Project is supported in the local communities and is projected to have local and regional socio-economic benefits.
The federal and state permitting process, however, remains ongoing. Draft permits issued by Minnesota agencies remain subject to public review and comment and other procedures. The federal and state agencies also retain their authority to review any refinements that PolyMet may propose to its mine plan, including refinements that are analyzed as part of this Study. If final permits are issued, they may also be subject to legal challenges.
| M3-PN150164 26 March 2018 |
197
NorthMet Project
Form NI 43-101F1 Technical Report
| 21 | CAPITAL AND OPERATING COSTS |
Capital and operating costs for the PolyMet project were developed and estimated based on feasibility-level design and engineering performed by Senet, Barr, IMC, Krech Ojard (KO) and M3. Site inspections were conducted (with vendors where possible) to evaluate the condition of the plant, the mine and the equipment. Key contributions made by each group were as follows:
| · | IMC estimated major mining equipment capital and operating costs utilizing the production schedule presented in Section 16. |
| · | Barr developed capital cost estimates for major earthworks required for the predevelopment of the mine site as well as other environmental scopes of work associated with the project (e.g. the flotation tailings basin). |
| · | KO developed costs for ore delivery via rail. |
| · | Senet developed the capital and operating cost estimates for the communition and processing plant including plant utilities and the refurbishment of the existing Erie Plant (or Phase I) infrastructure. |
Much of the Barr and Senet data used in the analysis were derived from internal data collected over several years and escalated to reflect fourth quarter, 2017 (Q4 2017) pricing. 14 of the major equipment packages were revalidated in Q4 2017; the escalation percentages of these packages from 2015 to 2017 were used to escalate the balance of the capital equipment from the 2015 quotations. M3 reviewed Barr’s and KO’s engineering design estimates. M3 also developed the capital and operating cost estimates for the Hydrometallurgical Plant utilizing a detailed feasibility-level design, first principals and 2016 quotes, which were escalated to reflect Q4 2017 pricing.
| 21.1 | Capital Cost Estimate |
The capital cost estimate is divided into the following major sections:
| · | Mine CAPEX which includes cost estimates for mine site development and major mining equipment costs, |
| · | Mine ore loadout and mine and plant railroad refurbishment costs, |
| · | Comminution, processing, utilities and plant refurbishment costs, |
| · | Costs to build out the existing tailings basin, and |
| · | Costs for water treatment and water management. |
In general, equipment schedules, duty sheets and material take-offs were developed for the new equipment and infrastructure required for the mine site, beneficiation plant and hydrometallurgical plant. These were derived from process flow diagrams, process mass balance calculations, a plant model, and preliminary designs. Inquiries were issued to reputable vendors for quotations on most major packages including, but not limited to, mine equipment, earthworks, building infrastructure, and major process equipment for both the beneficiation and hydrometallurgical plant. Quotations were valid as of Q4 2016 and Q1 2017 for the hydrometallurgical plant and were escalated to Q4 2017 pricing. Installation and civil related works were obtained from local contractors as far back as 2014 for the Beneficiation Plant and Mine Site. Man-hour all-inclusive rates were updated Q4 2017. Prices reported herein have been escalated to Q4 2017 prices. The cost estimates are provided in U.S. Dollars ($). The following exchange rates were used:
| · | ZAR to USD: 12.30 |
| · | ZAR to EUR: 13.15 |
| · | EUR to USD: 0.86 |
The capital cost estimate is based on the following assumptions:
| · | The Project utilizes a 20-year LOM plan. |
| · | It is not anticipated that final operating permits will result in any material changes to mine or plant design. |
| · | Most of the process equipment would be procured and fabricated in the US and is transportable to site by road or rail. |
| M3-PN150164 26 March 2018 |
198
NorthMet Project
Form NI 43-101F1 Technical Report
Table 21‑1 depicts the initial direct capital requirement for the development of the NorthMet Project. This estimate includes capital costs compiled by the firms associated with numerous scopes of work for the mine, mine equipment and refurbishing the Erie Plant (Phase I) which have been escalated to reflect Q4 2017 pricing.Table 21‑1: Phase I Direct Costs
| Description | PHASE I ($000) |
| ***DIRECT COST*** | |
| MINE CAPEX | |
| Mine Site | 65,395 |
| Construction Material Testing | 1,490 |
| Mine Equipment | 99,710 |
| RAILROAD AND ORE DELIVERY | 20,200 |
| COMMINUTION | 135,013 |
| COPPER & NICKEL CONCENTRATION | 120,609 |
| CONCENTRATES LOADOUT FACILITIES | 49,895 |
| WATER MANAGEMENT | 62,651 |
| PLANT CONTROL SYSTEM (PCS) | 1,919 |
| FLOTATION TAILINGS BASIN | 39,684 |
| PLANT INFRASTRUCTURE | 10,879 |
| PLANT UTILITIES | 99,245 |
| Subtotal DIRECT COST (MINE & CONCENTRATOR) | 706,690 |
| 21.1.1 | Basis of Phase I Capital Cost Estimate |
A brief description of the capital costs presented in Table 21‑1 is provided in the sections that follow.
| 21.1.1.1 | Mine Capital Cost Estimate (CAPEX) |
The mine capital cost estimate includes the following mine pre-production and development work to be performed prior to Year 1 mining operations:
| 1) | Initial haul road construction and preparation, |
| 2) | Site access road upgrades, |
| 3) | Removal of the overburden from the pit area, |
| 4) | Ground preparation and liner placement beneath the temporary, low grade Cat 2/3 waste and Cat 4 waste stockpiles, |
| 5) | Ground preparation around the permanent Cat 1 waste stockpile as well as cutoff wall and piping infrastructure to capture seepage and contain groundwater movement, and |
| 6) | Ground preparation and lined foundation for the construction of the Ore Surge Pile (OSP) situated near the Rail Transfer Hopper (RTH) to allow for temporary storage of ore. |
| M3-PN150164 26 March 2018 |
199
NorthMet Project
Form NI 43-101F1 Technical Report
The Mine Site estimate also includes costs for mine electrical distribution and communications/dispatch and a Mine Site Fuel and Maintenance Facility (MSFMF) which will be located to the northeast of the RTH. The facility will consist of two buildings, one for fueling mobile equipment (Fueling Station) and the second for mobile equipment maintenance (Maintenance Building).The following major civil Scope of Work (SOW) packages and cost estimates were quantified and developed by Barr and M3 and priced by mostly local civil contractors:
| · | Haul Road Construction, |
| · | Dunka Road Upgrade, |
| · | Stockpile Construction, |
| · | Dikes, Perimeter Ditches, Storm Water Pond & Outlet Structure, |
| · | Process Water Piping, |
| · | Pre-Stripping of Mine Pits, |
| · | Truck Fueling & Maintenance Facility, |
| · | Mine Electrical Distribution, |
| · | Mine Communications & Dispatch Systems, and |
| · | Category 1 Groundwater Containment System. |
| 21.1.1.1.1 | Quantity Basis |
Barr developed the quantities for the major earthwork accounts from the drawing packages produced in support of the individual scopes of work. For the sub-areas estimated with ACCE, the estimated quantities for civil works were determined via material take-offs based on the provided engineering drawings or sketches. M3 reviewed the engineering design provided by Barr.
| 21.1.1.1.2 | Pricing Basis |
Fill is expected to come from on-site non-reactive sources. The fill material is to be freely issued to the Civil Contractor. The estimate allows $12.00 per cubic yard for screening required to get proper compaction.
An allowance (approximately $1.5 million) was included in the Mine Site estimate for earthworks and civil works material testing. These testing requirements were primarily associated with all stockpile and pond liner tests at the mine but also included costs for test work associated with the tailings facility and plant concrete work.
After thoroughly reviewing the extent of the engineering design to date, M3 escalated Barr’s costs to Q4 2017 pricing using an ENR construction cost index associated with the year in which the estimate was developed.
| 21.1.1.1.3 | Assumptions, Clarifications, and Specific Exclusions |
Listed below are assumptions, clarifications and specific exclusion respecting the mine capital cost estimates Barr developed:
| · | Supplied soils and suitable for backfill with proper compaction. |
| · | Assumed a haul distance to spoils of 1,500 ft. |
| · | Assumed a haul distance for purchased fill of 20 miles. |
| · | Estimate assumes no underground obstructions or pipelines. |
| · | Any cemented soils are rippable and can be removed without blasting. |
| · | The estimate assumes that the site is free of all pre-existing hazardous wastes and contamination, archeological interests and avoids wetlands where possible. |
| · | The estimate includes costs to control environmental impacts such as dust suppression and the disposition of hazardous and non-hazardous wastes generated as part of a normal construction activities. |
| M3-PN150164 26 March 2018 |
200
NorthMet Project
Form NI 43-101F1 Technical Report
Specific exclusions are as follows:| · | Blasting associated with excavation associated with new process areas. |
| · | Traffic impact studies. |
| 21.1.1.2 | Mine Equipment and Services |
IMC developed the mine equipment requirements and all costs associated with them (e.g. shop tools, and spare parts). These costs have been captured in separate Mine Capital and Operating Cost estimates. The cost of the ANFO/slurry truck, explosives storage and blaster’s flatbed truck is to be carried by the explosives supplier.
Table 21‑2 provides a summary of the initial (Year -1) and total sustaining mine capital (Years 2 through 20) developed by IMC. Some of the existing major mine equipment will be rebuilt instead of replaced if the remaining years they operate is less than about 60% of the useful life hours of the machine. In years 2 and 3, more cable and accessories will be procured. In years 5, 9 and 13, the fleet of pickup trucks will be replaced. Two (2) track dozers will be rebuilt in year 16. More haul trucks will be purchased in years 2 and 6; and in year 10, graders will be rebuilt. The equipment purchases scheduled for initial capital are shown in Year -1 of Table 21‑3.
The equipment purchases for sustaining mine capital are shown in the year the equipment is required to be put into operation; thus, for financial planning, the capital may need to be spent the prior year. Annual Mine Sustaining Capital Costs are presented in the last row of Table 21‑3 and includes shop tools and initial spares associated with the equipment. After the initial purchase, other engineering supplies, software and safety equipment are included in mine operating costs.
Table 21‑2: Summary of Mine Capital Cost ($USx1000)
| Initial Capital | Sustaining | Total | |||||||
| Category | Year -1 | Capital | Capital | ||||||
| Major Equipment | $ | 82,998 | $ | 35,836 | $ | 118,833 | |||
| Mine Support Equipment | $ | 8,913 | $ | 4,100 | $ | 13,013 | |||
| Engineering/Safety Equipment | $ | 150 | 0 | $ | 150 | ||||
| Shop Tools | $ | 2,869 | $ | 2,031 | $ | 4,900 | |||
| Spare Parts | $ | 4,781 | $ | 3,385 | $ | 8,166 | |||
| TOTAL | $ | 99,710 | $ | 45,352 | $ | 145,062 | |||
Notes: Physical Structures such as the mine shop and warehouse, and fuel storage facilities are included in the Mine CAPEX costs in Table 21‑1.
| M3-PN150164 26 March 2018 |
201
NorthMet Project
Form NI 43-101F1 Technical Report
Table 21‑3: Mine Capital Cost by Year
| Unit Cost | Life | -1 | 1 | 2 | 3 | 4 | 5 | 6 | 7 | 8 | 9 | 10 | 11 | 12 | 13 | 14 | 15 | 16 | 17 | 18 | 19 | 20 | Project | |
| ($1000) | Hours | ($1000) | ($1000) | ($1000) | ($1000) | ($1000) | ($1000) | ($1000) | ($1000) | ($1000) | ($1000) | ($1000) | ($1000) | ($1000) | ($1000) | ($1000) | ($1000) | ($1000) | ($1000) | ($1000) | ($1000) | ($1000) | Total | |
| MINE MAJOR EQUIPMENT: | ||||||||||||||||||||||||
| ATLAS PV351 Electric Rotary Drill (12.25 in) | 5,013 | 65,000 | 5,013 | - | - | - | - | - | - | - | - | - | - | - | - | - | - | - | - | - | - | - | - | 5,013 |
| CAT 6060 Hydraulic shovel (36.6 CuYd) | 10,580 | 80,000 | 21,160 | - | - | - | - | - | - | - | - | - | - | - | - | - | - | - | - | - | - | - | - | 21,160 |
| CAT 994H Front End Loader (22.5 CuYd) | 4,618 | 45,000 | 4,618 | - | - | - | - | - | - | - | - | - | - | - | - | - | - | - | - | - | - | - | - | 4,618 |
| CAT 793F Haul Truck (250 t) | 4,011 | 120,000 | 24,066 | 8,022 | - | - | - | 4,011 | - | - | - | - | - | - | - | - | - | - | - | - | - | - | - | 36,099 |
| ATLAS PV351 Diesel Rotary Drill (12.25 in) | 4,747 | 65,000 | 4,747 | - | - | - | - | - | - | - | - | - | - | - | - | - | - | - | - | - | - | - | - | 4,747 |
| CAT D10, D9 & D8 Track Dozers | 1,027 | 35,000 | 2,055 | - | 1,027 | - | - | - | - | - | 2,055 | - | 1,027 | - | - | - | - | 1,027 | - | - | - | - | - | 7,191 |
| CAT 834K Wheel Dozer (562 HP) | 1,136 | 35,000 | 2,272 | - | - | - | - | - | - | - | - | - | 2,272 | - | - | - | - | - | - | - | - | - | - | 4,544 |
| CAT 16M&14M Motor Graders (312/274 HP) | 924 | 35,000 | 1,848 | - | - | - | - | - | - | - | - | 1,848 | - | - | - | - | - | - | 924 | - | - | - | - | 4,620 |
| CAT 785D Water Truck (30,000 Gal) | 2,453 | 120,000 | 2,453 | - | - | - | - | - | - | - | - | - | - | - | - | - | - | - | - | - | - | - | - | 2,453 |
| CAT 992K Aux Loader (814 HP) | 2,132 | 45,000 | 2,132 | - | - | - | - | - | - | - | - | - | - | 2,132 | - | - | - | - | - | - | - | - | - | 4,264 |
| CAT 777G Aux Truck (100 t) | 1,589 | 120,000 | 1,589 | - | - | - | - | - | - | - | - | - | - | - | - | - | - | - | - | - | - | - | - | 1,589 |
| CAT 349F Excavator (396 HP) | 445 | 25,000 | 445 | - | - | - | - | - | - | - | 445 | - | - | - | - | - | - | 445 | - | - | - | - | - | 1,335 |
| N-Viromotive 1GS-7B-R Locomotive (700 HP) | 1,400 | 75,000 | 1,400 | - | - | - | - | - | - | - | - | - | - | - | 1,400 | - | - | - | - | - | - | - | - | 2,800 |
| N-Viromotive 3GS-21-C Locomotive (2100 HP) | 2,300 | 75,000 | 9,200 | - | - | - | - | - | - | - | - | - | - | - | 9,200 | - | - | - | - | - | - | - | - | 18,400 |
| Subtotal Major Equipment | 82,998 | 8,022 | 1,027 | - | - | 4,011 | - | - | 2,500 | 1,848 | 3,299 | 2,132 | 10,600 | - | - | 1,472 | 924 | - | - | - | - | 118,833 | ||
| MINE SUPPORT EQUIPMENT: | Years | |||||||||||||||||||||||
| Cat 745 Fuel/Lube truck 5,000 gal | 1,010 | 8 | 1,010 | - | - | - | - | - | - | - | 1,010 | - | - | - | - | - | - | - | - | - | - | - | - | 2,020 |
| Cherry Picker / Basket Truck | 231 | 8 | 231 | - | - | - | - | - | - | - | 231 | - | - | - | - | - | - | - | - | - | - | - | - | 462 |
| Cat 226D Skid Steer for RTH Clean-out | 50 | 8 | 50 | - | - | - | - | - | - | - | 50 | - | - | - | - | - | - | - | - | - | - | - | - | 100 |
| Pickup Truck (4x4) | 40 | 8 | 480 | - | - | - | 480 | - | - | - | 480 | - | - | - | 480 | - | - | - | - | - | - | - | - | 1,920 |
| Light Plants | 10 | 4 | 57 | - | - | - | - | - | - | - | 57 | - | - | - | - | - | - | - | - | - | - | - | - | 114 |
| Pressure Washer | 15 | 8 | 15 | - | - | - | - | - | - | - | - | - | - | - | - | - | - | - | - | - | - | - | - | 15 |
| Generator Set w/ tractor | 995 | 18 | 995 | - | - | - | - | - | - | - | - | - | - | - | - | - | - | - | - | - | - | - | - | 995 |
| Compressor | 17 | 18 | 17 | - | - | - | - | - | - | - | 17 | - | - | - | - | - | - | - | - | - | - | - | - | 34 |
| CAT IT62 - Integrated Tool Carrier | 225 | 8 | 225 | - | - | - | - | - | - | - | - | - | - | - | - | - | - | - | - | - | - | - | - | 225 |
| Grove TR600E Crane (50 ton) - Road Machinery | 540 | 18 | 540 | - | - | - | - | - | - | - | - | - | - | - | - | - | - | - | - | - | - | - | - | 540 |
| Dewatering Pump | 26 | 18 | 26 | - | - | - | - | - | - | - | 26 | - | - | - | - | - | - | - | - | - | - | - | - | 52 |
| Man Bus | 100 | 8 | 100 | - | - | - | 100 | - | - | - | 100 | - | - | - | 100 | - | - | - | - | - | - | - | - | 400 |
| Compactor | 325 | 4 | 325 | - | - | - | - | - | - | - | - | - | - | - | - | - | - | - | - | - | - | - | - | 325 |
| Tractor & Lowboy (off-highway) | 575 | 18 | 575 | - | - | - | - | - | - | - | - | - | - | - | - | - | - | - | - | - | - | - | - | 575 |
| Haul Truck Retriever | 1,200 | 18 | 1,200 | - | - | - | - | - | - | - | - | - | - | - | - | - | - | - | - | - | - | - | - | 1,200 |
| Wenco Mine Communications Network | 1,079 | 18 | 1,079 | - | - | - | - | - | - | - | - | - | - | - | - | - | - | - | - | - | - | - | - | 1,079 |
| Rock Breaker (Surestrike MDL 6000) | 152 | 18 | 152 | - | - | - | - | - | - | - | 152 | - | - | - | - | - | - | - | - | - | - | - | - | 304 |
| Welding Truck | 226 | 8 | 226 | - | - | - | - | - | - | - | 226 | - | - | - | - | - | - | - | - | - | - | - | - | 452 |
| Mechanics Truck | 226 | 8 | 226 | - | - | - | - | - | - | - | 226 | - | - | - | - | - | - | - | - | - | - | - | - | 452 |
| Cable Handler (Builtrite 2200) | 462 | 8 | 462 | - | - | - | - | - | - | - | - | - | - | - | - | - | - | - | - | - | - | - | - | 462 |
| Cable & Accessories (Per 1000 ft.) | 24 | 18 | 146 | 146 | 73 | - | - | - | - | - | - | - | - | - | - | - | - | - | - | - | - | - | - | 366 |
| Cable Stands | 26 | 18 | 78 | - | - | - | - | - | - | - | - | - | - | - | - | - | - | - | - | - | - | - | - | 78 |
| Cable Boats | 15 | 18 | 45 | - | - | - | - | - | - | - | - | - | - | - | - | - | - | - | - | - | - | - | - | 45 |
| Drill Tender Truck | 50 | 9 | 50 | - | - | - | - | - | - | - | - | 50 | - | - | - | - | - | - | - | - | - | - | - | 100 |
| 10 cy Dump Truck with Sand Spreader | 75 | 9 | 75 | - | - | - | - | - | - | - | - | 75 | - | - | - | - | - | - | - | - | - | - | - | 150 |
| Hy-Rail Gear for One Pickup Truck | 20 | 20 | - | - | - | - | - | - | - | 20 | - | - | - | - | - | - | - | - | - | - | - | - | 40 | |
| Rock/Sand Spreader Box for Water Truck | 456 | 18 | 456 | - | - | - | - | - | - | - | - | - | - | - | - | - | - | - | - | - | - | - | - | 456 |
| Shop Forklift (Hyster H100XM) | 51 | 51 | - | - | - | - | - | - | - | - | - | - | - | - | - | - | - | - | - | - | - | - | 51 | |
| Subtotal Mine Support Equipment | 8,913 | 146 | 73 | - | 580 | - | - | - | 2,595 | 125 | - | - | 580 | - | - | - | - | - | - | - | - | 13,013 | ||
| Engineering/Geology Equipment | 150 | 18 | 150 | - | - | - | - | - | - | - | - | - | - | - | - | - | - | - | - | - | - | - | - | 150 |
| Shop Tools (3% of Major Equipment) | 3.0% | 2,869 | 334 | - | - | - | 334 | - | - | 41 | 142 | 53 | 77 | 220 | 76 | - | 625 | 79 | 50 | - | - | - | 4,900 | |
| Initial Spare Parts (5% of Major Equipment) | 5.0% | 4,781 | 556 | - | - | - | 556 | - | - | 68 | 237 | 88 | 129 | 366 | 127 | - | 1,042 | 131 | 84 | - | - | - | 8,166 | |
| Contingency (0%) | 0.0% | - | - | - | - | - | - | - | - | - | - | - | - | - | - | - | - | - | - | - | - | - | - | |
| TOTAL EQUIPMENT/FACILITIES CAPITAL | 99,710 | 9,059 | 1,101 | - | 580 | 4,901 | - | - | 5,204 | 2,352 | 3,441 | 2,338 | 11,766 | 203 | - | 3,139 | 1,134 | 134 | - | - | - | 145,062 |
| M3-PN150164 26 March 2018 |
202
NorthMet Project
Form NI 43-101F1 Technical Report
| 21.1.1.3 | Railroad and Ore Delivery |
KO provided railroad and ore delivery costs, in October 2014, based on detailed SOWs that were issued to multiple vendors for pricing in May 2013. The costs include the following items associated with the refurbishment and installation of the overall Mine Site rail systems:
| · | Earthworks and civil works, |
| · | Supply of new rail infrastructure, |
| · | Construction of a pad and mechanical equipment refurbishment for the ore transfer hopper, and |
| · | Upgrade and refurbishment of the existing rail systems. |
| 21.1.1.3.1 | Rail Transfer Hopper (RTH) |
KO developed an estimate and supplied costs to replace or refurbish the hydraulic equipment, motor control center (MCC), control/electrical/hydraulic rooms, walkways and platforms, lighting and salvaged wear materials associated with RTH system used by LTVSMC to load the rail cars. Also included were costs for earthworks to stabilize and fortify the RTH structure and dump pocket.
| 21.1.1.4 | Comminution |
The capital costs for the comminution circuit were developed by Senet and based on the following:
| · | Quotations for new and refurbished mechanical equipment based on detailed enquiries including specifications and equipment duty sheets, and in certain instances, included site inspections by vendors. Previously obtained pricing was recently revalidated in 2017. The mechanical equipment was sized based on test work results, system modelling and in certain cases equipment sizing was dictated by physical layout/footprint constraints. |
| · | Preliminary designs for new and modified structures, bins and chutes. |
| · | Preliminary civil and earthworks designs associated with new and modified structures, new equipment and operational requirements including access and spillage containment. |
| · | Conveyor designs for new and existing conveyors in line with feed rates and material properties. |
| · | Priced piping and valve MTOs developed from Process Flow Diagrams (PFD) and layouts. |
| · | Quotations for electrical and instrumentation equipment based on detailed enquiries, including installation. |
| · | Man-hour estimations for the refurbishment and modifications to existing infrastructure and for the installation of new equipment, structures and associated civil works. These were based on industry standards and consultations with local contractors. |
| · | Construction rates from local contractors are inclusive of all indirect costs. |
| 21.1.1.5 | Flotation, Regrind and Reagents |
The capital costs for the flotation circuit were developed by Senet and were based on the following:
| · | Quotations for new mechanical equipment based on detailed enquiries including specifications and equipment duty sheets. The mechanical equipment was sized based on test work results, system modelling and simulation. |
| · | Preliminary designs for structural support steel and building infrastructure. |
| · | Preliminary civil and earthworks designs associated with new structures, equipment and operational requirements including access and spillage containment. |
| · | Priced piping and valve MTOs developed from PFDs, layouts and Senet’s in-house database. |
| · | Quotations for electrical and instrumentation equipment based on detailed inquiries, including installation. |
| · | Man-hour estimations for the installation of new equipment, structures and associated civil works. |
| · | Construction rates from local contractors, inclusive of all indirect costs. |
| M3-PN150164 26 March 2018 |
203
NorthMet Project
Form NI 43-101F1 Technical Report
| 21.1.1.6 | Concentrate Loadout Facilities |
The capital costs for the concentrate loadout circuit were developed by Senet were based on the following:
| · | Quotations for new mechanical equipment based on detailed enquiries including specifications and equipment duty sheets. The mechanical equipment was sized based on test work results and ensures the concentrate adheres to Glencore’s requirements for final product processing. |
| · | Preliminary designs for structural support steel, bins, chutes and building infrastructure. The building storage requirements were based on consultation with Glencore. |
| · | Conveyor designs for the new conveyors, in line with the new feed rates and material properties. |
| · | Preliminary civil and earthworks designs associated with new structures, equipment and operational requirements including access and spillage containment. |
| · | Priced piping and valve MTOs were developed from PFDs, layouts and Senet’s in-house database. |
| · | Quotations for electrical and instrumentation equipment based on detailed enquiries, including installation. |
| · | Man-hour estimations for the installation of new equipment, structures and associated civil works. |
| · | Construction rates from local contractors, inclusive of all indirect costs. |
| 21.1.1.7 | Water Management |
The water management capital costs were developed primarily by Senet and relate to all earthworks, civil works, infrastructure, services and equipment relating to the construction of a single water treatment plant and mine waste water pipeline in accordance with the requirements of the FEIS. Detailed SOWs were issued for quotations to combine the two facilities into one water treatment facility. Pricing for the mechanical water treatment process equipment in each facility was obtained at an earlier date and used to develop the estimate for the WWTS.
| 21.1.1.8 | Plant Control System |
The plant control system incorporates all costs relating to the plant PLC system linked to the SCADA monitoring and control system, including the fiber optic backbone. These costs were developed by Senet and are based on the mechanical equipment list, PFDs and the plant layout to determine the equipment that would require monitoring and its location.
| 21.1.1.9 | Flotation Tailings Basin |
The FTB capital costs were developed primarily by Barr and relate to all earthworks, civil works, infrastructure, services and equipment relating to the construction of the tailings facility and the associated seepage handling systems. A detailed Scope of Work (SOW) was issued for quotations, and pricing was obtained for the tailings handling process equipment.
| 21.1.1.10 | Plant Infrastructure |
Senet developed the following plant infrastructure capital cost estimate. It incorporates all costs relating to the supply and upgrade of plant infrastructure for the following items:
| · | Security related infrastructure including fencing and guard houses |
| · | Upgrade of the administration building including furniture |
| · | Installation of an on-site laboratory |
| · | A sewage treatment plant |
| · | Communications systems and infrastructure |
| · | Refurbishment of plant offices and general areas |
| M3-PN150164 26 March 2018 |
204
NorthMet Project
Form NI 43-101F1 Technical Report
| 21.1.1.11 | Plant Utilities |
The capital costs for the plant utilities were based on the replacement and refurbishment, where applicable. Plant utility systems include:
| · | All water services |
| · | Air services |
| · | Natural gas distribution |
| · | Instrumentation system |
| · | Plant Medium Voltage (MV) power distribution system |
| · | Plant electrical distribution system |
The mechanical equipment list, PFDs and the plant layout were used to develop piping MTOs, an overall electrical single-line diagram and an instrument index.
The piping MTOs for relevant piping facilities, including valve schedules, were issued for pricing. The overall single-line diagram, together with the mechanical equipment list, was used to develop an electrical Bill of Materials (BOM). A transformer schedule was developed in line with the Low Voltage (LV) and MV design. An overall electrical BOM was developed for the installation contract. Multiple bids were obtained for the various electrical equipment packages.
A complete instrument index, including a comprehensive bill of materials, was developed and issued for pricing.
| 21.1.1.12 | Senet Estimate Methodology, Assumptions and Qualifications |
Prior to escalation, some of the cost estimates Senet provided were developed using AspenTech ACCE software (formerly ICARUS/Kbase). This software was used as the database and as a delivery system for areas where the engineering design had not progressed as far as other SOWs. The AspenTech ACCE software is an estimating tool that includes project specifications, design data, equipment data, and project specific parameters to generate reliable and consistent estimates through the use of volumetric models and labor/material databases. ACCE is based on volumetric models that represent industry standard calculations coupled with related project specifications.
Using equipment design conditions such as design pressures, equipment sizes, flow rates, etc., the system first simulates the pricing of the equipment item in a manner similar to a vendor. From the weights and sizes of the equipment, the software determines foundations and labor setting hours. Then, using the equipment specific volumetric models, the system develops piping, instrument, electrical, painting and insulation. From the systems databases labor and pricing functions, labor and material pricing is generated. Other project components such as buildings and pipe racks are then added to complete the estimate.
The system’s generated MTOs were then modified to reflect the current layouts and project definition. Where vendor quotes were available, the system pricing was overridden with the quoted prices. When MTOs were provided, these data were input into the system to use the power of the database and the adjustments described above to generate the new labor and material pricing estimates. In other accounts, labor installation was adjusted to reflect feedback from contractors. The instrument installation hours were modified to reflect the use of the Asset Management System that allows calibration of field instruments to be done by the selected control system versus field calibration. Bulk material pricing was adjusted in the electrical cable and conduit accounts to reflect vendor pricing.
| M3-PN150164 26 March 2018 |
205
NorthMet Project
Form NI 43-101F1 Technical Report
Estimates for the following areas were generated in ACCE using available PFD’s, P&ID’s, layouts, equipment list and scope documents. Vendor budgetary quotes were reviewed for pricing, scope of supply and items excluded in the bid submittal:| · | Truck Fueling and Maintenance Facility |
| · | Flotation and Concentrate Grinding |
| · | Flotation Reagents Facilities |
| · | Concentrate Load-out Facilities |
Estimates such as Water Management included major civil works in addition to new facilities construction. Here, the Water Treatment System was estimated using the ACCE software but civil scopes of work (such as the equalization basins) were estimated by Barr using contractor pricing.
Listed below are general assumptions and qualifications respecting the capital cost estimates Senet developed:
| · | Construction schedule and productivities assume normal weather conditions for the site. No allowance has been made for dramatic weather events. |
| · | New construction is estimated as non-turnaround work in a Greenfield environment for Phase I scopes of work. |
| · | Any removal/encapsulation of asbestos containing materials will be completed prior to the start of construction. Costs for asbestos abatement are included in the capital estimate. |
| 21.1.2 | Hydrometallurgical Plant Cost Estimate |
The capital costs for the Phase II Hydrometallurgical Plant (Table 21‑4) were developed by M3 and were based on the following:
| · | Recent quotations (Q4 2016 and Q1 2017) were obtained for new mechanical equipment based on detailed enquiries including specifications and equipment duty sheets. The mechanical equipment was sized based on test work results, system modelling and in certain cases equipment sizing was dictated by physical layout/foot print constraints. |
| · | Preliminary designs for new structures, bins and chutes. |
| · | Preliminary civil and earthworks designs associated with the new structures, equipment and operational requirements including access and spillage containment. |
| · | Priced piping and valve MTOs developed from preliminary PFDs and General Arrangement drawings. |
| · | Quotations for electrical and instrumentation equipment based on recent enquiries, including installation on similar projects. |
| · | A complete instrument index including a comprehensive BOM was developed and issued for pricing. |
| · | Man-hour estimations for the installation of new equipment, electrical, instrumentation, structures and associated civil works. These were based on industry standards. |
| M3-PN150164 26 March 2018 |
206
NorthMet Project
Form NI 43-101F1 Technical Report
Table 21‑4: Phase II Direct Costs (Hydrometallurgical Plant)
| ***DIRECT COST*** | PHASE II ($000) | |
| HYDROMET | ||
| Site General | 24,152 | |
| Ni-Cu Concentrate Oxidative Leaching | 68,880 | |
| Au/PGM Recovery | 3,780 | |
| Cu Concentrate | 3,743 | |
| Cu Sulfide Precipitation | 1,621 | |
| Iron/Acid Removal | 5,808 | |
| Mixed Hydroxide Precipitation | 3,486 | |
| Magnesium Removal | 736 | |
| Hydromet Tailings | 840 | |
| Hydrometallurgical Residue Facility | 43,903 | |
| Reagent Storage and Mixing | 15,671 | |
| Plant Scrubber | 1,591 | |
| Hydromet Raw Water | 1,647 | |
| Hydromet Process Water | 1,241 | |
| Steam Systems | 1,085 | |
| Gas Systems | 784 | |
| Subtotal DIRECT COST (PHASE II) | 178,966 | |
| 21.1.3 | Indirect Costs |
| 21.1.3.1 | EPCM |
The Project’s Engineering, Procurement and Construction Management (EPCM) capital costs were estimated by determining the number of man-hours required to complete the following:
| · | Overall process plant engineering design. |
| · | Design of Environmental and site infrastructure, including ancillary buildings. |
| · | Preparation and issuing of procurement packages for all equipment and services related to the process plant and infrastructure on behalf of the client. |
| · | Logistical, inspection and expediting services. |
| · | On-site technical support and commissioning. |
| · | Production and collation of all process plant operating and maintenance manuals. |
| · | Construction Management of all Plant, Environmental, Infrastructure and Ancillary facilities. |
| 21.1.3.2 | Contingencies |
Contingency allowances are provided for any estimating uncertainties. The contingency does not consider future risks, time delays, project scope deviations and cost implications associated with these, currency fluctuations and escalation.
| · | Phase I contingency is estimated at 9.9% of Total Contracted Costs as shown in Table 21‑5, and is based on the percent engineering complete or percent of the project defined. |
| · | A contingency of 15% was applied to the Total Contracted Cost of the Hydrometallurgical Plant to reflect the level of engineering complete for Phase II. |
| M3-PN150164 26 March 2018 |
207
NorthMet Project
Form NI 43-101F1 Technical Report
| 21.1.3.3 | Other Indirect Costs |
Project indirect costs were also included in the capital cost estimate to provide for the following items:
| · | Logistical costs associated with the transport of equipment and materials to site. It has been assumed that most of the equipment and materials would be sourced in the US. Phase I cost for freight is estimated at 6% of Plant Equipment and Material costs. Freight is included at 8% of equipment and material costs for the Hydrometallurgical Plant. |
| · | Cost for commissioning spares and vendor services to ensure the timely and faultless installation and commissioning of major equipment are as follows: Costs for Supervision of Specialty Construction are assumed to be included in the Phase I direct costs. Capital Spares (Insurance Spares) are not included in Phase I costs, but are included at 2% of the equipment cost for Phase II. Specialty Supervision is included for the Hydrometallurgical Plant estimate at 1.5% of the equipment cost. |
| · | Plant first fills for operational start-up and the costs of reagents have been included as part of the Owner’s cost. |
| · | General Contractor direct costs include: scheduling, reporting, change management, cost control, program monitoring, project accounting, claims adjudication, work orders and estimate to complete and are included in Labor Rates and Subcontracts unit cost; as are, mobilization and busing costs for contractors during construction. |
| · | Mobilization and busing is included for the Hydrometallurgical Plant at 1% the total Direct Cost and two dollars ($2) per man hour, respectively. |
| · | Existing facilities are to be used for Temporary Construction Facilities and Power for construction and commissioning of the NorthMet Plant (Phase I). M3 included these costs at 0.50% and 0.1%, respectively for Phase II. |
| · | Management & Accounting (M&A was built up from first principles using a detailed staffing chart and man hours, as well as, typical project durations. For the Hydrometallurgical Plant, M&A is estimated at 0.75% Total Constructed Cost. |
| · | Engineering for Phase I was built up based on an expected number of deliverables and their corresponding manhours. For Phase II it is estimated at 6% of Total Constructed Cost. |
| · | Project Services costs were built up from first principles using a detailed staffing chart and man hours, as well as, typical project durations for Phase I. For the Hydrometallurgical Plant, these costs are estimated at 1% of the Total Constructed Cost. |
| · | Project Controls costs were built up from first principles using a detailed staffing chart and man hours, as well as typical project durations for Phase I. For the Hydrometallurgical Plant, these costs are estimated at 0.75% of the Total Constructed Cost. |
| · | Indirect costs also include estimated fees for consultants and external engineering to cover the cost to complete the engineering design for the tailings facility, WTP, rail and flotation simulation. |
| · | Construction Management (CM) costs for Phase I were built up from first principles using a detailed staffing chart and man hours, as well as expected project durations. CM Indirect costs were also built up to account for such things as transportation and living out costs. For the Hydrometallurgical Plant, these costs are estimated at 6.5% of the Total Constructed Cost. |
| M3-PN150164 26 March 2018 |
208
NorthMet Project
Form NI 43-101F1 Technical Report
| · | Costs for Commissioning Services were built up from first principles for Phase I and are included in the CM costs for the Hydrometallurgical Plant. |
| · | M3 estimates temporary EPCM facilities and construction support at 0.3% and 0.1% of the Total Constructed Costs for both Phase I and for the Hydrometallurgical Plant. |
| · | Initial fills and reagents are included in the Owner’s Cost. |
| · | Owner’s Cost include: Owner's Project Management, Support & Consultants, Operator Training, Early Staffing, Communications & Computer Equipment, Furniture, Remote Administrative Office, Personnel Safety Equipment, and Builder's All Risk Insurance. |
| · | EIP Credits |
| · | A tire adjustment against the mine equipment costs for previously purchased and stored 240-ton haul truck tires. |
| · | All costs have been escalated to Q4 2017 dollars. |
Table 21‑5: Direct and Indirect Costs (Phase I & II)
| PHASE I ($000) | PHASE II ($000) | |
| TOTAL DIRECT COST (Excluding Mine Equipment) | 606,980 | 178,966 |
| FREIGHT - LOGISTICS | 19,393 | 7,017 |
| MOBILIZATION, TEMPORARY FACILITIES AND POWER | 4,523 | |
| TOTAL CONSTRUCTED COST | 626,373 | 190,506 |
| EPCM | 90,999 | 32,196 |
| COMMISSIONING | 7,790 | 1,394 |
| CAPITAL SPARES | 929 | |
| TOTAL CONTRACTED COST | 725,162 | 225,025 |
| CONTINGENCY | 71,597 | 33,754 |
| AVERAGE CONTINGENCY | 9.9% | 15% |
| ADDED OWNER'S COST (including initial fills & reagents) | 24,489 | |
| TOTAL CONTRACTED AND OWNER'S COST | 821,248 | 258,779 |
| Owner's Cost Mine Equipment (Initial Capital) | 99,710 | |
| Haul Truck Tire Adjustment | (900 | |
| EIP Credits | 25,065 | |
| TOTAL EVALUATED PROJECT COST | 945,124 | 258,779 |
| COMBINED TOTALS | 1,203,903 | |
| M3-PN150164 26 March 2018 |
209
NorthMet Project
Form NI 43-101F1 Technical Report
21.2 | Operating Cost Estimate |
| 21.2.1 | Mine Operating Cost |
Mine operating costs were developed by IMC and include the costs of consumables, parts and repairs, operating and maintenance labor, supervision and the mine general and administrative costs, including but not limited to the following tasks:
| · | Drill and blast all the ore and waste rock, |
| · | Load the material and deliver to the respective destinations, |
| · | Build and maintain all mine haul road, stockpiles and pit work areas, |
| · | Haul the ore by train from the pit loadout area to the process plant, |
| · | Contract analytical laboratory to perform ore and rock assays |
| · | Maintain mine equipment fleet, and |
| · | All supervision and engineering to follow the mine production schedule. |
The mine operating costs do not include:
| · | Removal of the timber, soil and overburden from the pit and stockpile areas (initial & sustaining capital costs) |
| · | Installation of the liner and runoff capture systems for the Cat 2/3 and Cat 4 stockpile area pre-stripping (initial capital), |
| · | Final contouring of Cat 1 stockpile and reclamation (reclamation costs), |
| · | Reclamation of the stockpile areas, mine haul roads and ore loadout area after conclusion of mining and milling (reclamation costs), |
| · | Reclamation costs, or |
| · | Operation of the rail load-out facility. |
Table 21‑6 is a summary of the mine operating costs by the major categories of labor, consumables and repair parts.
Table 21‑6: Mine Operating Costs by Process
| % of Total | ||
| CATEGORY | ($000) | Mining Cost |
| Drilling | 50,662 | 5.6 |
| Blasting | 97,144 | 10.7 |
| Loading | 99,297 | 11.0 |
| Hauling | 257,502 | 28.5 |
| Auxiliary | 147,737 | 16.3 |
| General Mine | 32,512 | 3.6 |
| General Maintenance | 33,888 | 3.7 |
| Mine G&A | 98,338 | 10.9 |
| Locomotive | 79,884 | 8.8 |
| Analytical Lab Contract | 6,000 | 0.7 |
| TOTAL MINING COST | 904,553 | 100 |
| M3-PN150164 26 March 2018 |
210
NorthMet Project
Form NI 43-101F1 Technical Report
Table 21‑7 is a summary of the mine operating costs by major cost centers. The costs included within each cost center are:| · | Drilling: parts and consumables for drills, operating and maintenance labor. |
| · | Blasting: Based on 30% dry holes, 70% wet holes and 80 holes per blast pattern; explosives, ignition supplies, and stemming. Operating labor is provided by the explosives supplier. |
| · | Loading: parts and consumables for shovels and loader, operating and maintenance labor. |
| · | Hauling: parts and consumables for 240t haul trucks, operating and maintenance labor. |
| · | Auxiliary: parts and consumables for major auxiliary equipment (dozers, graders, water truck, auxiliary loader & truck, excavator), operating and maintenance labor. |
| · | General Mine: costs for dispatch, assaying, pit dewatering, software licenses, road base material, and parts & consumables allocation at $0.03/t of material moved. |
| · | General Maintenance: tire services contract, minor support equipment maintenance, equipment service contracts, and parts and consumables allocation at $0.03/t of material moved. |
| · | Mine G&A: salaried staff and VS&A allocation. |
| · | Ore Transport to Mill: parts and consumables for locomotives, service contracts, operating and maintenance labor. |
The inputs to the operating costs for the analytical lab contract were provided by PolyMet and are not presented in Table 21‑7.
| M3-PN150164 26 March 2018 |
211
NorthMet Project
Form NI 43-101F1 Technical Report
Table 21‑7: Mine Operating Costs Per Ton Moved ($000) by Cost Centers
| Total | Total | Total | |||||||||||
| Mining | Moved | Mined | Milled | General | General | Total | |||||||
| Year | (kt) | (kt) | (kt) | Drilling | Blasting | Loading | Hauling | Auxiliary | Mine | Maint. | G&A | Locomotive | Cost |
| -1 | 0 | 0 | 0 | 0 | 0 | 0 | 0 | 0 | 0 | 0 | 0 | 0 | 0 |
| 1 | 35,845 | 35,482 | 7,250 | 2,994 | 5,701 | 5,348 | 9,580 | 5,641 | 1,804 | 1,696 | 4,732 | 3,517 | 41,014 |
| 2 | 40,580 | 40,000 | 11,600 | 3,447 | 6,800 | 5,926 | 14,102 | 5,691 | 1,896 | 1,912 | 5,150 | 4,068 | 48,992 |
| 3 | 37,638 | 37,058 | 11,600 | 3,295 | 6,439 | 5,587 | 11,218 | 7,821 | 1,781 | 1,822 | 5,144 | 4,068 | 47,175 |
| 4 | 40,580 | 40,000 | 11,600 | 3,422 | 6,757 | 5,936 | 11,817 | 7,494 | 1,874 | 1,910 | 5,144 | 4,068 | 48,422 |
| 5 | 40,580 | 40,000 | 11,600 | 3,344 | 6,589 | 5,922 | 13,951 | 7,426 | 1,870 | 1,919 | 5,196 | 4,068 | 50,285 |
| 6 | 40,580 | 40,000 | 11,600 | 3,360 | 6,609 | 5,931 | 15,856 | 7,472 | 1,897 | 1,953 | 5,266 | 4,070 | 52,413 |
| 7 | 32,492 | 31,912 | 11,600 | 2,942 | 5,563 | 4,972 | 14,989 | 7,837 | 1,615 | 1,709 | 5,257 | 4,068 | 48,951 |
| 8 | 31,728 | 31,148 | 11,600 | 2,891 | 5,429 | 4,885 | 11,664 | 8,029 | 1,588 | 1,654 | 5,169 | 4,068 | 45,377 |
| 9 | 38,326 | 30,362 | 11,600 | 2,749 | 5,146 | 5,636 | 15,258 | 8,018 | 1,762 | 1,852 | 5,238 | 4,068 | 49,726 |
| 10 | 39,965 | 32,000 | 11,600 | 2,859 | 5,384 | 5,852 | 15,707 | 8,133 | 1,813 | 1,933 | 5,282 | 4,068 | 51,031 |
| 11 | 34,580 | 32,000 | 11,600 | 2,845 | 5,350 | 5,207 | 13,323 | 8,125 | 1,673 | 1,739 | 5,204 | 4,070 | 47,534 |
| 12 | 31,460 | 28,880 | 11,600 | 2,669 | 4,909 | 4,838 | 13,062 | 8,155 | 1,553 | 1,645 | 5,195 | 4,068 | 46,095 |
| 13 | 29,689 | 27,109 | 11,600 | 2,567 | 4,658 | 4,258 | 12,877 | 8,618 | 1,497 | 1,593 | 5,183 | 4,068 | 45,319 |
| 14 | 29,620 | 28,040 | 11,600 | 2,620 | 4,790 | 4,249 | 13,442 | 8,144 | 1,496 | 1,590 | 5,167 | 4,068 | 45,567 |
| 15 | 30,286 | 26,685 | 11,600 | 2,544 | 4,598 | 4,330 | 13,029 | 7,933 | 1,514 | 1,601 | 5,149 | 4,068 | 44,766 |
| 16 | 31,425 | 28,033 | 11,600 | 2,637 | 4,789 | 4,855 | 14,473 | 8,075 | 1,571 | 1,684 | 5,265 | 4,070 | 47,419 |
| 17 | 31,210 | 29,630 | 11,600 | 2,514 | 5,015 | 4,811 | 15,963 | 7,953 | 1,546 | 1,670 | 5,156 | 4,068 | 48,696 |
| 18 | 31,368 | 15,484 | 11,600 | 961 | 2,618 | 4,430 | 13,740 | 7,183 | 1,520 | 1,643 | 4,621 | 4,068 | 40,784 |
| 19 | 29,870 | 0 | 11,600 | 0 | 0 | 4,256 | 9,957 | 5,534 | 1,444 | 1,509 | 3,901 | 4,068 | 30,669 |
| 20 | 12,599 | 0 | 8,950 | 0 | 0 | 2,068 | 3,495 | 4,455 | 800 | 855 | 1,920 | 3,136 | 16,729 |
| TOTAL | 670,421 | 573,823 | 225,000 | 50,662 | 97,144 | 99,297 | 257,502 | 147,737 | 32,512 | 33,888 | 98,338 | 79,884 | 896,966 |
| M3-PN150164 26 March 2018 |
212
NorthMet Project
Form NI 43-101F1 Technical Report
| 21.2.2 | Process Plant and Assay Operating Cost Estimate Summary |
Process plant operating costs were developed by Senet for Phase I and verified by M3. Table 21‑8 provides a summary of the operating cost estimate for the Erie Process Plant and assay.
Table 21‑8: Phase I Operating Cost Estimate Summary
| 32,000 STPD | |||
| OPEX Parameter | Units | Value | Fraction (%) |
| Tonnage Processed | tpa | 11,600,000 | |
| Labor | USD/t | 1.04 | 15.9 |
| Power | USD/t | 2.11 | 32.2 |
| Natural Gas | USD/t | 0.27 | 4.1 |
| Consumables/Water Treatment | USD/t | 2.44 | 37.3 |
| Maintenance Supplies & Plant Vehicles | USD/t | 0.66 | 10.1 |
| Assay Costs | USD/t | 0.02 | 0.3 |
| Phase I Plant Costs | USD/t | 6.55 | 100 |
| 21.2.3 | Basis of Process Plant Operating Cost Estimate |
The Erie Plant operating costs were derived from a variety of sources, including:
| · | First principles, where applicable. |
| · | Supplier quotations on reagents and consumables. |
| · | Senet’s in-house database. |
| · | Client input. |
The following are the main cost elements for the Erie plant:
| · | Operating and maintenance labor. |
| · | Power. |
| · | Consumables and reagents. |
| · | Maintenance, parts and supplies. |
| · | Process plant assays. |
The all-in CAPEX/OPEX and sustaining capital to install, maintain and operate the WWTS is $0.497 per ton ore processed.
| 21.2.3.1 | Labor Costs |
Labor includes operating labor and plant maintenance labor. The following basis was used:
| · | Cost of employment burden (insurances, medical benefits, social security, etc.) for management, technical and supervisory staff was determined as a fixed percentage of 35% of the base rate. |
| · | Cost of employment burden for equipment and plant operators was determined as a fixed percentage of 40% of the base rate. |
| · | Overtime costs were also included for equipment and plant operations based on a fixed percentage of 5% of the base wage rate. |
| M3-PN150164 26 March 2018 |
213
NorthMet Project
Form NI 43-101F1 Technical Report
The following costs have been excluded as they are assumed to have been included in the client’s G&A operating cost:| · | Safety supplies |
| · | Training |
| · | Consultants’ fees |
The positions and quantities were developed from Senet’s typical labor schedule for a generic flotation plant and additional positions and quantities were included to suit the NorthMet process plant requirements for the Erie Plant. The quantity of operational labor was based on a shift roster of two 12-hour shifts per day with one shift relief. There is no expatriate labor complement in this schedule.
The operating and maintenance labor costs for the Erie plant were derived from a staffing plan and based on labor rates from an industry survey of this region.
The Erie Process Plant labor schedule and costs are shown in Table 21‑9.
| M3-PN150164 26 March 2018 |
214
NorthMet Project
Form NI 43-101F1 Technical Report
Table 21‑9: Labor Schedule and Rates
| Position | Staff/ Operations | No. of Employees | Annual Cost to Company (USD) |
| Plant Management | |||
| Process Plant Manager | Staff | 1 | 195,750 |
| Production Superintendent | Staff | 1 | 155,250 |
| Technical Metallurgical Superintendent | Staff | 1 | 155,250 |
| Laboratory Manager | Staff | 1 | 135,000 |
| Senior Plant Metallurgist | Staff | 1 | 155,250 |
| Plant Metallurgist | Staff | 2 | 243,000 |
| Mechanical Engineer | Staff | 1 | 121,500 |
| Electrical Engineer | Staff | 1 | 121,500 |
| Metallurgical Training Officer | Staff | 1 | 101,250 |
| Metallurgical Safety Officer | Staff | 1 | 101,250 |
| Operations Supervisor | Operations | 4 | 470,938 |
| Control Room | |||
| Control Room Operator | Operations | 4 | 336,384 |
| ROM Feed | |||
| Operator | Operations | 4 | 269,107 |
| Crushing | |||
| Operator - Primary Crushing | Operations | 4 | 291,533 |
| Attendant | Operations | 4 | 269,107 |
| Operator - Secondary Crushing | Operations | 4 | 291,533 |
| Attendant | Operations | 4 | 269,107 |
| Operator - Ore Storage and Reclaim | Operations | 4 | 291,533 |
| Attendant | Operations | 4 | 269,107 |
| Crane Operator | Operations | 1 | 72,883 |
| Milling | |||
| Operator | Operations | 4 | 291,533 |
| Attendant | Operations | 4 | 269,107 |
| Crane Operator | Operations | 1 | 72,883 |
| Flotation and Regrind | |||
| Operator - Bulk Cu-Ni circuit (Roughers, Cleaners and Regrind) | Operations | 3 | 218,650 |
| Attendant | Operations | 3 | 201,830 |
| Operator - Cu-Ni separation (Regrind, Rougher and Cleaner) | Operations | 3 | 218,650 |
| Attendant | Operations | 3 | 201,830 |
| Operator - Po circuit (Rougher, Regrind and Cleaners) | Operations | 3 | 218,650 |
| Attendant | Operations | 3 | 201,830 |
| Crane Operator | Operations | 1 | 72,883 |
| Thickening and Filtration | |||
| Operator | Operations | 4 | 291,533 |
| Concentrate Storage and Loadout | |||
| Operator | Operations | 2 | 145,766 |
| Tailings and Return | |||
| Tailings Operator | Operations | 4 | 291,533 |
| Water Supply and Distribution | |||
| Attendant | Operations | 4 | 269,107 |
| Reagents (Only Day Shift) | |||
| Operator | Operations | 2 | 145,766 |
| Attendant | Operations | 2 | 134,554 |
| Metallurgical Laboratory (Only Day Shift) | |||
| M3-PN150164 26 March 2018 |
215
NorthMet Project
Form NI 43-101F1 Technical Report
| Position | Staff/ Operations | No. of Employees | Annual Cost to Company (USD) |
| Laboratory Technician | Operations | 2 | 134,554 |
| Plant Sampler and Preparer | Operations | 4 | 269,107 |
| Plant Maintenance Management | |||
| Maintenance Superintendent | Staff | 1 | 155,250 |
| Training Officer | Staff | 1 | 101,250 |
| Planning Coordinator/Scheduler | Staff | 1 | 121,500 |
| Process Plant Maintenance | |||
| Mechanical Supervisor | Operations | 3 | 252,288 |
| Rigger | Operations | 2 | 156,979 |
| Rigger Assistant | Operations | 2 | 145,766 |
| Crushing and Milling | |||
| Fitter | Operations | 3 | 218,650 |
| Fitter Assistant | Operations | 3 | 201,830 |
| Boilermaker | Operations | 2 | 145,766 |
| Boilermaker Assistant | Operations | 2 | 134,554 |
| Rubber Liner | Operations | 2 | 168,192 |
| Greaser | Operations | 2 | 123,341 |
| Flotation Plant | |||
| Fitter | Operations | 3 | 218,650 |
| Fitter Assistant | Operations | 3 | 201,830 |
| Boilermaker | Operations | 2 | 145,766 |
| Boilermaker Assistant | Operations | 2 | 134,554 |
| Rubber Liner | Operations | 2 | 168,192 |
| Greaser | Operations | 2 | 123,341 |
| Electrical Maintenance Labor | |||
| Electrical Supervisor - Crushing and Milling | Operations | 2 | 168,192 |
| Electrical Supervisor - Flotation and Dewatering | Operations | 2 | 168,192 |
| Electrical Assistant | Operations | 2 | 145,766 |
| Phase II – Hydrometallurgical Plant | |||
| Control Room Operator | Operations | 4 | 375,648 |
| Process Technician | Operations | 12 | 976,680 |
| Mechanic | Operations | 6 | 525,906 |
| Mechanic Helper | Operations | 4 | 300,520 |
| Electrical/ Instrumentation | Operations | 4 | 375,648 |
| Electrician Helper | Operations | 2 | 150,260 |
| Instrumentation Maintenance Labor | |||
| Instrumentation Supervisor - Crushing and Milling | Operations | 2 | 168,192 |
| Instrumentation Supervisor - Flotation and Dewatering | Operations | 2 | 168,192 |
| Instrumentation Assistant | Operations | 2 | 145,766 |
| Power Plant and Fuel Farm | |||
| Foreman | Operations | 2 | 213,043 |
| Operator | Operations | 2 | 145,766 |
| Total | 186 | 14,911,450 | |
Lastly, general and administration costs include labor and fringes for the administrative employees, accounting department, purchasing, human resources, community relations, safety and environmental departments as well as office supplies, communications, legal fees, community relations, and insurance cost and outside services.
| M3-PN150164 26 March 2018 |
216
NorthMet Project
Form NI 43-101F1 Technical Report
| 21.2.3.2 | Power |
A summary of the power costs, based on the Erie Plant power draw summary and the plant buildings’ heating power requirements, is given in Table 21‑10 with the basis of the estimate detailed below.
Operating fixed power was determined by using the installed power supplied by vendors and applying a factor to this. This excluded standby equipment power. Where vendors did not supply operating power, an assumed operating power was used. The estimated operating hours for the mechanical equipment were determined and used with the operating power to determine the annual power usage (kWh/a).
Table 21‑10: Summary of Electric Power Costs
| Item | Unit | Value |
| Erie Plant Power Consumption | kWh/a | 385,381,244 |
| Erie Plant Buildings’ Heating Power | kWh/a | 27,569,472 |
| Hydrometallurgical Plant Power Consumption | kWh/a | 20,594,216 |
| Hydrometallurgical Plant Buildings’ Heating Power | kWh/a | 2,468,798 |
| Total Power Consumption | kWh/a | 436,013,730 |
| Power Cost | USD/kWh | 0.0597 |
| Combined Power Consumption Per Ton of Ore Processed | USD/t | 2.33 |
| *annual power estimate includes energy required (electric and natural gas) for Phase II HVAC | ||
Operating variable power for the SAG and ball mills was determined by using the specific energy of the NorthMet deposit which was modelled by OMC. The specific energy of each mill was used with the mill throughput to calculate the variable annual power usage (kWh/a).
The operating variable power for the Cu, Ni and Po regrind mills was calculated by using the specific energy of each concentrate that was provided by the regrind mill vendor. The specific energy and the throughput to each regrind mill was thereafter used to calculate the annual power usage (kWh/a).
Power consumption for the hydrometallurgical plant was estimated using the installed horse power (HP) of the process equipment. The plant buildings’ heating power requirements allowed for HVAC in the various plant buildings and together with an annual running time of 8,760 hours, the annual heating power usage was calculated (kW/a).
The power costs were produced using the total operating power consumption basis detailed above and a grid power cost of USD 0.0597/kWh supplied by the Client.
Refer to Table 21‑11 for the plant equipment power draw summary and Table 21 12 for the plant buildings’ heating and dust collection power requirements.
| M3-PN150164 26 March 2018 |
217
NorthMet Project
Form NI 43-101F1 Technical Report
Table 21‑11: Process Equipment Power Draw Summary
| Plant Areas | Total kW Installed | kWh/a |
| Primary Crushing | 1,554 | 5,227,436 |
| Dust Suppression | 30 | 146,324 |
| Secondary Crushing | 2,020 | 9,907,636 |
| Ore Storage and Reclaim | 2,178 | 9,443,808 |
| Sampling Analyser System | 75 | 81,994 |
| Milling | 53,582 | 217,708,190 |
| Pebble Crushing | 534 | 3,368,045 |
| Bulk Cu-Ni Rougher Flotation and Regrind | 10,181 | 42,911,537 |
| Bulk Cu-Ni Cleaning | 2,586 | 10,987,145 |
| Cu-Ni Concentrate Separation Rougher Flotation and Regrind | 2,122 | 13,367,786 |
| Cu-Ni Concentrate Separation Cleaning | 1,522 | 5,625,721 |
| Po Concentrate Rougher Flotation and Regrind | 6,579 | 24,466,518 |
| Po Concentrate Cleaning | 1,874 | 8,938,412 |
| Tailings Disposal | 1,372 | 1,220,380 |
| Tailings Dam Storage and Return | 2,013 | 12,696,394 |
| Cu Concentrate Thickening | 187 | 562,794 |
| Cu Concentrate Filtration | 317 | 900,659 |
| Ni Concentrate Thickening | 212 | 643,250 |
| Ni Concentrate Filtration | 317 | 959,811 |
| Po Concentrate Thickening | 228 | 760,192 |
| Po Concentrate Filtration | 370 | 992,114 |
| Concentrate Storage and Loadout | 254 | 354,152 |
| Collector | 19 | 61,200 |
| Lime | 150 | 362,559 |
| Concentrate Thickening Flocculant | 19 | 34,182 |
| Frother | 11 | 14,194 |
| Depressant | 19 | 76,591 |
| Activator | 17 | 15,461 |
| Air Services | 564 | 1,425,427 |
| Blower Air | 2,000 | 9,460,800 |
| Process Water | 30 | 94,608 |
| Raw Water | 702 | 2,118,746 |
| Potable and Gland Water | 127 | 447,180 |
| Hydrometallurgical Plant | ||
| Ni-Cu Concentrate Oxidative Leaching (Autoclave) | 1,136 | 7,719,048 |
| Au/PGM Recovery | 75 | 437,640 |
| Cu Concentrate Enrichment | 86 | 558,203 |
| Cu Sulfide Precipitation | 90 | 584,512 |
| Iron/Acid Removal | 269 | 1,805,696 |
| Mixed Hydroxide Precipitation | 136 | 863,842 |
| Magnesium Removal | 26 | 137,263 |
| Hydromet Tailings | 95 | 670,873 |
| Hydrometallurgical Residue Facility (HRF) | 13 | 92,081 |
| Reagent Storage and Mixing | 651 | 2,289,211 |
| Plant Scrubber | 8 | 10,981 |
| Hydromet Raw Water | 12 | 84,188 |
| Hydromet Process Water | 11 | 78,926 |
| Steam Systems | 298 | 2,104,701 |
| Gas Systems | 447 | 3,157,051 |
| Total Plant Power Usage | 97,118 | 405,975,462 |
| M3-PN150164 26 March 2018 |
218
NorthMet Project
Form NI 43-101F1 Technical Report
Table 21‑12: HVAC and Dust Collection Electric Power Summary
| Building | HVAC (kW) | Dust Collection (kW) | Total (kW) |
| HVAC-Coarse crushing | 866 | 840 | 1,706 |
| HVAC-Drive house 1 | 5 | 100 | 105 |
| HVAC-Drive house 2 | 5 | 100 | 105 |
| HVAC-Fine crushing | 37 | 100 | 137 |
| HVAC-Concentrator | 659 | 470 | 1,129 |
| HVAC-Flotation | 440 | - | 440 |
| HVAC-Concentrate handling | 312 | - | 312 |
| HVAC-Hydrometallurgical Plant | 352 | 352 | |
| Total Installed Power | 1,610 | 4,286 | |
| Running Time (hrs pa) | 8,760 | ||
| Load Factor | 0.8 | ||
| Annual Power Usage (kWh/a) | 30,038,270 |
| 21.2.3.3 | Natural Gas for HVAC |
A summary of the natural gas costs, based on the plant’s HVAC natural gas requirements are detailed in Table 21‑13 below.
Table 21‑13: Summary of Natural Gas Costs (Heating)
| Item | Unit | Value |
| Erie Plant Natural Gas Consumption | scf/a | 766,280,000 |
| Natural Gas Cost | USD/scf | 0.00415 |
| Annual Natural Gas Cost | USD/a | 3,180,062 |
| Natural Gas Cost Phase I | USD/ore ton | 0.30 |
| Natural Gas Cost Phase II | USD/ore ton | Included in Error! Not a valid result for table.; calculated in terms of electrical power. |
The natural gas consumptions for the different plant buildings are detailed in Table 21‑14 below.
Table 21‑14: HVAC Natural Gas Demand
| Building | Total (scf/h) |
| HVAC-Coarse crushing | 11,000 |
| HVAC-Drive house 1 | 3,900 |
| HVAC-Drive house 2 | 3,900 |
| HVAC-Fine crushing | 8,600 |
| HVAC-Concentrator | 58,156 |
| HVAC-Flotation | 38,700 |
| HVAC-Concentrate handling | 29,000 |
| Total Natural Gas Demand | 153,256 |
| Running Time (hrs pa) | 5,000 |
| Annual Natural Gas Usage (scf/a) | 766,280,000 |
| 21.2.3.4 | Consumables and Reagents |
The Plant consumables and reagent costs (USD/tore) were derived as shown in Table 21‑15, as are consumables for the Hydrometallurgical Plant.
| M3-PN150164 26 March 2018 |
219
NorthMet Project
Form NI 43-101F1 Technical Report
Table 21‑15: Process Plant Reagent and Consumable Consumption and Costs
| Consumable/Reagent | Function | Consumption (lb./t) | Cost | Cost |
| ($US/a) | (USD/t) | |||
| Primary Crusher Liners | Crushing | 842,154 | 0.08 | |
| Secondary Crusher Liners | Crushing | 881,436 | 0.08 | |
| Pebble Crusher Liners | Crushing | 56,074 | 0.01 | |
| Steel Grinding Balls - SAG Mill | Milling | 0.533 | 5,611,281 | 0.53 |
| Steel Grinding Balls - Ball Mill | Milling | 0.675 | 7,034,669 | 0.66 |
| SAG Mill Liner | Milling | 3,524,853 | 0.33 | |
| Ball Mill Liner | Milling | 1,705,045 | 0.16 | |
| Ceramic Beads - Cu-Ni Rougher Conc | Regrind Milling | 0.013 | 729,260 | 0.07 |
| Ceramic Beads - Cu-Ni Cleaner Conc | Regrind Milling | 0.006 | 108,586 | 0.01 |
| Ceramic Beads - Po Rougher Conc | Regrind Milling | 0.006 | 158,277 | 0.01 |
| Liner - Cu-Ni Rougher Conc | Regrind Milling | 157,914 | 0.01 | |
| Liner - Cu-Ni Cleaner Conc | Regrind Milling | 72,613 | 0.01 | |
| Liner - Po Rougher Conc | Regrind Milling | 72,613 | 0.01 | |
| SIPX (sodium isobutyl xanthate) | Collector - flotation | 0.091 | 1,327,260 | 0.13 |
| CMC (carboxymethycellulose) | Depressant - flotation | 0.057 | 1,661,550 | 0.16 |
| MIBC (methyl isobutyl carbinol) | Frother - flotation | 0.083 | 1,875,211 | 0.18 |
| Copper Sulphate | Activator - flotation | 0.051 | 1,043,358 | 0.10 |
| Lime | pH Modifier | 0.0845 | 103,006 | 0.01 |
| Magnafloc 10 | Flocculant - Cu Conc Thickening | 0.0168 | 3,099 | 0.0003 |
| Magnafloc 10 | Flocculant - Ni Conc Thickening | 0.0154 | 2,841 | 0.0003 |
| Magnafloc 10 | Flocculant - Po Conc Thickening | 0.0173 | 1,862 | 0.0002 |
| Hydrometallurgical Plant Reagents | ||||
Hydrochloric Acid | Autoclave | 0.578 | 810,125 | 0.069 |
| Sulfuric Acid | Filter Wash | 0.026 | 16,702 | 0.001 |
| Sodium Hydrosulfide | CuS Precipitation | 0.178 | 748,454 | 0.064 |
| Sodium Hydroxide | 0.0155 | 53,407 | 0.005 | |
| Flocculant | Thickener | 0.002 | 31,770 | 0.003 |
| Limestone | MHP | 16.965 | 2,427,352 | 0.208 |
| Lime | Iron Removal | 1.192 | 1,044,192 | 0.089 |
| Magnesium Hydroxide | MHP | 1.094 | 3,274,981 | 0.280 |
| Liquid Sulfur Dioxide | AW/PGM Recovery | 0.0014 | 4,568 | >0.001 |
| Oxygen | Autoclave | 9,940,560 | 0.85 | |
| Total Consumable/Reagent Cost | 45,325,073 | 4.12 | ||
Reagent consumption rates were determined from the metallurgical test data and modeling for the hydrometallurgical plant. Budgetary quotations or historical data were used to estimate the costs of the reagents to be utilized. A summary of the hydrometallurgical process reagent consumption and cost is also shown in Table 21‑15.
| 21.2.3.5 | Crusher and Mill Liners |
Crusher liner costs were obtained by estimating the number of liner changes per annum using the data given by the vendor. Quotations for the crusher liners, including the weights of the liners, were obtained from the crusher vendors, from which delivered costs were estimated per liner set. Mill liner costs were obtained by estimating the number of liner changes per annum using the consumptions modelled by OMC. Quotations for the mill liners, including the weights of the liners, were obtained from the vendors, from which delivered costs were estimated per liner set.
| M3-PN150164 26 March 2018 |
220
NorthMet Project
Form NI 43-101F1 Technical Report
| 21.2.3.6 | SAG and Ball Mill Grinding Media |
SAG and ball mill grinding media consumptions were determined by using the consumption rates modelled by OMC. The grinding media consumption and quotations obtained from grinding media suppliers were thereafter used to calculate the grinding media costs.
| 21.2.3.7 | Regrind Mill Grinding Media and Liner |
The regrind mill grinding media and liner consumptions were determined using projected wear rates obtained from equipment vendors based on their experience in similar applications. The quotations for regrind media and liner costing were also received from regrind mill suppliers and used with the consumptions to determine the regrind mill grinding media and liner costs.
| 21.2.3.8 | Flotation Reagents |
Flotation reagent costs were determined using the projected consumptions obtained from previous pilot plant test work conducted in and quotations from reagent suppliers.
| 21.2.3.9 | Maintenance, Parts and Supplies |
Plant maintenance, parts and supplies costs refer to the costs of operating spares and lubricants for mechanical equipment and piping in the plant. It has been assumed that the plant will experience a moderate amount of wear and maintenance costs have been calculated accordingly. A factor of 5.5% was applied to the estimated capital cost of the process plant equipment and piping to calculate the maintenance, parts and supplies costs (see Table 21‑16 below).
An additional allowance of 10% of the direct capital costs of the hydrometallurgical process equipment was made to cover the cost of maintenance for the additional facilities. The maintenance annual cost is estimated to be $5.7 million.
An annual allowance was also estimated for items such as lubricants, diesel fuel, safety gear and tools. Also included are water charges. The allowances were estimated from historical information or from other operations and projects.
Table 21‑16: Maintenance, Parts and Supplies Factors
| Item | Unit | Phase I | Phase II | Phase I & II |
| Mechanical Equipment | $000 | 120,989 | 41,723 | 162,712 |
| Piping and Valves | $000 | 13,925 | 15,630 | 29,555 |
| Annual Maintenance Parts and Spares Cost | % | 5.50 | 10 | - |
| Annual Maintenance Parts and Spares Cost | $000/a | 7,420 | 5,735 | 13,155 |
| Maintenance Parts and Spares Cost | USD/t | 0.70 | 0.58 | 1.28 |
| 21.2.3.10 | Assay |
The laboratory assay costs were taken from a review performed by Senet and included in the PolyMet Financial Model. The total assay costs included maintenance spare parts, reagents and consumables, power and administration costs. The costs calculated for steady-state plant operations were incorporated into the operating costs and a breakdown of the assay costs is shown in Table 21‑17.
| M3-PN150164 26 March 2018 |
221
NorthMet Project
Form NI 43-101F1 Technical Report
Table 21‑17: Breakdown of Laboratory Assay Costs
| Item | Unit | Cost USD |
| Laboratory Equipment Maintenance and Spares | USD/a | 202,026 |
| Reagents and Consumables | USD/a | 36,000 |
| Power | USD/a | 38,621 |
| Administration | USD/a | 10,145 |
| Total Assay Cost | USD/a | 286,792 |
| Total Assay Cost | USD/t | 0.027 |
| 21.2.4 | Hydrometallurgical Plant (Phase II) Operating Cost Estimate Summary |
M3 developed the on-site operating costs associated with the hydrometallurgical plant (or Phase II) which are summarized by cost element of labor, electric power, reagents, maintenance parts and supplies and services and shown in Table 21‑18. Sustaining capital expenditure is captured in the maintenance annual cost shown above in Table 21‑16.
Table 21‑18: Phase II Operating Cost Estimate Summary
| 32,000 STPD | |||
| OPEX Parameter | Units | Value | Fraction (%) |
| Tonnage Processed | tpa | 11,600,000 | |
| Labor | USD/t | 0.21 | 9.9 |
| Power | USD/t | 0.11 | 5.2 |
| Consumables and Reagents | USD/t | 1.17 | 55.2 |
| Maintenance | USD/t | 0.57 | 26.9 |
| Supplies & Services | USD/t | 0.06 | 2.8 |
| Phase II Plant Costs | USD/t | 2.12 | 100 |
| 21.2.5 | Basis of Hydrometallurgical Plant (Phase II) Operating Cost |
| 21.2.5.1 | Labor |
Labor operating costs were developed based on an operational and maintenance staffing plan developed in accordance with PolyMet’s intended operating philosophy. Labor rates are based on an industry survey for this region of the US and includes benefits for both salaried and hourly employees. The labor schedule and rates for the hydrometallurgical plant are presented in Table 21‑9.
| 21.2.5.2 | Power |
Power costs were based on the horsepower of the designed Hydromet facility and the current utility power rate of $0.0597 per kWh. Discounts for operating time and the anticipated operating load level were taken. Table 21‑11 lists the process equipment and installed power as well as the power draw per annum for the hydrometallurgical process. HVAC power draw and natural gas demands associated with the hydrometallurgical plant are shown in Table 21‑12 through Table 21‑14.
| M3-PN150164 26 March 2018 |
222
NorthMet Project
Form NI 43-101F1 Technical Report
| 21.2.5.3 | Consumables and Reagents |
Reagent usage rates (Table 21‑15) were determined from the results of the completed metallurgical test data and/or industry standard practice. M3 requested and used budgetary quotations from local or national sources, as available, in the operating cost estimate. Oxygen rates were based on the intended operation of utilizing an “over the fence” agreement with an oxygen supplier. In this type of agreement, the supplier will provide supply, operations and maintenance of the oxygen facility for a monthly fee.
| 21.2.5.4 | Maintenance |
An allowance of 10% was included to cover the cost of maintenance for the facilities and other items. Major annual maintenance, not included in the allowance, includes relining of the autoclaves and replacement of the high wear, specialty piping lines and valves (Table 21‑16).
| 21.2.5.5 | Supplies & Services |
M3 estimates an allowance of $0.06 per ton processed was used for estimating operational items such as lubricants, safety supplies, tools, and outside services (Table 21‑18).
| M3-PN150164 26 March 2018 |
223
NorthMet Project
Form NI 43-101F1 Technical Report
| 22 | ECONOMIC ANALYSIS |
M3 was tasked to perform the financial evaluation of the project as well as analyze project opportunities. Financial analysis was performed to determine the Net Present Value (NPV), payback period (time in years to recapture the initial capital investment), and the Internal Rate of Return (IRR) for the Project. Annual cash flow projections were estimated over the anticipated life of the mine (20 years) based on estimates of capital expenditures, production cost and sales revenue. The sales revenue is based on the estimated production of copper and nickel concentrates containing PGMs, cobalt and precious metals. The economic analysis uses the estimated capital expenditure and site production costs developed for this Project and presented in Section 21.
The following economic analysis reflects the current Technical Report whereby PolyMet is planning to build the Project in two phases (with Phase II being the addition of a Hydrometallurgical Plant)
| · | Phase I: produce and market concentrates containing copper, nickel, PGMs, cobalt and precious metals. |
| · | Phase II: once processed via Phase I, continue processing the nickel concentrate through a single autoclave, resulting in production and sale of high grade copper concentrate, value added nickel-cobalt hydroxide, and precious metals precipitate products. |
The analysis reflects metallurgical and mining processes as well as environmental controls that have been incorporated into the FEIS.
| 22.1 | Feasibility Study Economic Analysis |
The economic evaluation presented herein reflects processing 225 million tons of ore at a mining rate of 32,000 STPD (11.6 million tons per annum) for 20 years.
| M3-PN150164 26 March 2018 |
224
NorthMet Project
Form NI 43-101F1 Technical Report
| 22.1.1 | Economic Assumptions |
Life of mine and the first five years at full production (years 2 – 6) operating cost highlights, for Phase I and Phase I & II combined, are shown in Table 22‑1.
Table 22‑1: LOM Operating Cost Highlights – Phase I and Phase I & II Combined
| Cost Category | UOM | Phase I | Phase I & II |
| Capital Costs | |||
| Initial Capital | $ millions | 945.1 | 1,203.9 |
| LOM Sustaining Capital | $ millions | 220.6 | 220.6(1) |
| Operating Costs | LOM | ||
| Mining & Delivery to Plant | $/st processed | 4.02 | 4.02 |
| Processing | $/st processed | 6.55 | 8.66 |
| G&A | $/st processed | 0.48 | 0.48 |
| Total | $/st processed | 11.05 | 13.16 |
| LOM Average Annual Payable Metal in Cons. Produced | |||
| Copper | 000 lbs | 54,792 | 57,754 |
| Nickel | 000 lbs | 6,646 | 8,711 |
| Cobalt | 000 lbs | 281 | 311 |
| Platinum | koz | 8 | 14 |
| Palladium | koz | 42 | 59 |
| Gold | koz | 2 | 4 |
| Silver | koz | 48 | 48 |
| Average Annual Payable Metal in Cons Produced (Yrs 2-6) | |||
| Copper | 000 lbs | 66,748 | 69,384 |
| Nickel | 000 lbs | 7,867 | 9,647 |
| Cobalt | 000 lbs | 333 | 352 |
| Platinum | koz | 12 | 19 |
| Palladium | koz | 58 | 73 |
| Gold | koz | 3 | 6 |
| Silver | koz | 68 | 68 |
| (1) | Sustaining capex for Phase II is included as OPEX for replacement parts, piping liners etc. |
| 22.1.2 | Key Data and Economic Analysis |
The economics reflect an ore processing rate of 32,000 STPD for an initial period of 20 years.
Base Case metal price assumptions, process plant recoveries and key operating data for the average over the life of mine are presented in Table 22‑2 and Table 22‑3 for Phase I only and Phase I and II respectively. These data comprise metal content of the anticipated concentrates previously described and the contribution to net revenue after third-party processing costs. It also includes estimates of cash costs for each metal using a copper equivalent basis whereby total costs are allocated to each metal according to that metal’s contribution to net revenue, as well as cash costs on a by-product basis whereby revenues from other metals are offset against total costs and those costs divided by production (this analysis is included for copper only).
Over the mine life for Phase I, costs are expected to average $1.91/lb on a copper equivalent basis and $1.06/lb copper on a by-product basis. Combined Phase I and II cash costs of production on a copper equivalent and by-product basis are projected to be $1.79/lb copper equivalent and $0.59/lb copper, respectively.
| M3-PN150164 26 March 2018 |
225
NorthMet Project
Form NI 43-101F1 Technical Report
Table 22‑2: 32,000 STPD Base Case (Phase I) Price and Operating Assumptions and Key Production Numbers
| Base Case ($/lb or $/oz) | Metal Recovery to Conc. (%) | Production (million lbs or oz) | Contribution to net revenue (%) | Cash Cost per lb Cu Eq | Cash Cost per lb Cu | |
| Cu Eq$/lb or $/oz | by-product $/lb or $/oz | |||||
| Assumptions | LOM | |||||
| Phase I | ||||||
| Copper (lb) | 3.22 | 91.8 | 1,096 | 60.5 | 1.91 | 1.06 |
| Nickel (lb) | 7.95 | 63.5 | 133 | 18.1 | ||
| Cobalt (lb) | 20.68 | 35.9 | 5.6 | 2.0 | ||
| Platinum (oz) | 1,128 | 73.4 | 170 | 3.3 | ||
| Palladium (oz) | 973 | 78.1 | 836 | 13.9 | ||
| Gold (oz) | 1,308 | 58.9 | 45 | 1.0 | ||
| Silver (oz) | 18.92 | 56.9 | 958 | 0.3 | ||
Low-grade Nickel PGM conc. (Ktonne) | 55.00 | N/A | 912 | 0.9 | ||
Table 22‑3: Base Case (Phase I & II) Price and Operating Assumptions and Key Production Numbers
| Base Case ($/lb or $/oz) | Metal Recovery to Conc. (%) | Production (million lbs or oz) | Contribution to net revenue (%) | Cash Cost per lb Cu Eq | Cash Cost per lb Cu | |
| Cu Eq$/lb or $/oz | by-product $/lb or $/oz | |||||
| Assumptions | LOM | |||||
| Phase I & II | ||||||
| Copper (lb) | 3.22 | 91.8 | 1,155 | 54.3 | 1.79 | 0.59 |
| Nickel (lb) | 7.95 | 63.5 | 174 | 20.2 | ||
| Cobalt (lb) | 20.68 | 35.9 | 6.2 | 1.9 | ||
| Platinum (oz) | 1,128 | 73.4 | 286 | 4.7 | ||
| Palladium (oz) | 973 | 78.1 | 1,189 | 16.9 | ||
| Gold (oz) | 1,308 | 58.9 | 86 | 1.6 | ||
| Silver (oz) | 18.92 | 56.9 | 958 | 0.3 | ||
| Low-grade Nickel PGM conc. (Ktonne) | 55.00 | N/A | 175 | 0.1 | ||
Table 22‑4 and Table 22‑5 set out metal price assumptions and key financial financial returns for future cash flows (including capital costs) using a 7% discount rate on both a pre-tax and an after-tax basis revenue is shown on both a gross (before royalties and third-party processing fees) and net (after those costs) basis.
Price assumptions used in the financial model are based on consensus estimates from a list of financial and industry analysts. Sensitivities to changes in metal prices are also shown.
| M3-PN150164 26 March 2018 |
226
NorthMet Project
Form NI 43-101F1 Technical Report
Table 22‑4: Phase I Economic Projections on a Range of Metal Price Assumptions
| Sensitivity | |||||
| Base -10% | Base -5% | Base Case | Base +5% | Base +10% | |
| Metal Prices | |||||
| Copper $/lb | 2.90 | 3.06 | 3.22 | 3.38 | 3.54 |
| Nickel $/lb | 7.16 | 7.55 | 7.95 | 8.35 | 8.75 |
| Cobalt $/lb | 18.61 | 19.65 | 20.68 | 21.71 | 22.75 |
| Palladium $/oz | 875 | 924 | 973 | 1,022 | 1,070 |
| Platinum $/oz | 1,015 | 1,072 | 1,128 | 1,184 | 1,241 |
| Gold $/oz | 1,177 | 1,243 | 1,308 | 1,373 | 1,439 |
| Silver $/oz | 17.03 | 17.97 | 18.92 | 19.87 | 20.81 |
| Financial Summary | |||||
| Pre-tax | |||||
| IRR % | 6.0 | 8.2 | 10.2 | 12.1 | 13.9 |
| NPV discounted at 7% - $M | (63) | 76 | 217 | 358 | 499 |
| Post-tax | |||||
| IRR % | 5.5 | 7.6 | 9.6 | 11.4 | 13.2 |
| NPV discounted at 7% - $M | (94) | 39 | 173 | 307 | 438 |
| First 5 Years (2 -6) | |||||
| Average gross revenue $M | 325 | 344 | 362 | 380 | 398 |
| Average EBITDA $M | 135 | 153 | 170 | 188 | 205 |
Table 22‑5: Phase I & II Economic Projections on a Range of Metal Price Assumptions
| Sensitivity | |||||
| Base -10% | Base -5% | Base Case | Base +5% | Base +10% | |
| Metal Prices | |||||
| Copper $/lb | 2.90 | 3.06 | 3.22 | 3.38 | 3.54 |
| Nickel $/lb | 7.16 | 7.55 | 7.95 | 8.35 | 8.75 |
| Cobalt $/lb | 18.61 | 19.65 | 20.68 | 21.71 | 22.75 |
| Palladium $/oz | 875 | 924 | 973 | 1,022 | 1,070 |
| Platinum $/oz | 1,015 | 1,072 | 1,128 | 1,184 | 1,241 |
| Gold $/oz | 1,177 | 1,243 | 1,308 | 1,373 | 1,439 |
| Silver $/oz | 17.03 | 17.97 | 18.92 | 19.87 | 20.81 |
| Financial Summary | |||||
| Pre-tax | |||||
| IRR % | 7.0 | 9.0 | 10.9 | 12.7 | 14.4 |
| NPV discounted at 7% - $M | (3.0) | 159 | 322 | 485 | 648 |
| Post-tax | |||||
| IRR % | 6.5 | 8.5 | 10.3 | 12.0 | 13.6 |
| NPV discounted at 7% - $M | (40) | 115 | 271 | 421 | 563 |
| First 5 Years (3 -7) | |||||
| Average gross revenue $M | 371 | 389 | 419 | 430 | 461 |
| Average EBITDA $M | 165 | 185 | 211 | 224 | 252 |
| M3-PN150164 26 March 2018 |
227
NorthMet Project
Form NI 43-101F1 Technical Report
| 22.1.3 | Capital Costs |
Total capital carried in the financial model for new construction, expansion capital, heavy mine equipment and pre-production mine development is shown in Table 22‑6 for the Phase I and Phase II.
Table 22‑6: Initial and Expansion Capital Summary
| Phase I | Phase I & II | |
| Period | Amount | Amount |
| Year -2 | $331,751 | $,751 |
| Year -1 | $613,372 | $613,372 |
| Year 2 | $258,779 | |
| Total | $945,124 | $1,203,903 |
PolyMet intends to sell concentrate during construction and commissioning of the Hydrometallurgical Plant (Phase II). This staged approach shortens the initial construction period, makes the Project less sensitive to the delivery schedule for long lead-time equipment such as autoclave vessels, and means PolyMet can commence operations of the mine, existing crushing, milling and tailings disposal facilities and the new flotation circuit, before starting the Hydrometallurgical Plant.
| 22.1.4 | Operating Plans and Costs |
PolyMet intends to mine 32,000 STPD for an operating life of 20 years, processing a total of 225 million tons of ore. Operating costs are presented in Table 22‑7 for both Phase I and Phase II.
Table 22‑7: Phase I and Phase I & II Operating Cost Summary
| LOM | |||
| Phase I | Phase I & II | ||
| Mining & Delivery to Plant | $/st processed | 4.02 | 4.02 |
| Processing | $/st processed | 6.55 | 8.66 |
| G&A | $/st processed | 0.48 | 0.48 |
| Total | $/st processed | 11.05 | 13.16 |
| 22.1.4.1 | Economic Summary |
Phase I key economic metrics are presented in Table 22‑4 and include EBITDA which is projected to average $170 million over the first five years of operations. The NPV of future cash flow (after tax) discounted at 7.0% is estimated to be $173 million.
Combined Phase I and Phase II key economic metrics are presented in Table 22‑5 and include EBITDA which is projected to average $211 million over the first five years of operations. The NPV of future cash flow (after tax) discounted at 7.0% is estimated to be $271 million.
| 22.1.5 | Sustaining Capital |
A schedule of capital expenditures during the production period was estimated and included in the financial model under the category of sustaining capital. This capital will be expended during the 20-year mine life, starting in Year 1 and ending in Year 20.
Table 22‑8 shows the annual sustaining capital expenditures.
| M3-PN150164 26 March 2018 |
228
NorthMet Project
Form NI 43-101F1 Technical Report
Table 22‑8: Sustaining Capital Summary
| Period | Phase I & II | ||
| Year -1 | |||
| Year 1 | $ | 8,268 | |
| Year 2 | $ | 26,640 | |
| Year 3 | $ | 35,054 | |
| Year 4 | $ | 8,494 | |
| Year 5 | $ | 7,518 | |
| Year 6 | $ | 21,209 | |
| Year 7 | $ | 8,967 | |
| Year 8 | $ | 5,643 | |
| Year 9 | $ | 9,909 | |
| Year 10 | $ | 17,259 | |
| Year 11 | $ | 8,224 | |
| Year 12 | $ | 5,903 | |
| Year 13 | $ | 14,844 | |
| Year 14 | $ | 3,955 | |
| Year 15 | $ | 5,677 | |
| Year 16 | $ | 8,747 | |
| Year 17 | $ | 6,818 | |
| Year 18 | $ | 4,735 | |
| Year 19 | $ | 4,558 | |
| Year 20 | $ | 8,195 | |
| Total | $ | 220,617 | |
| 22.2 | Financial Model |
Table 22‑9 (Phase I & II) shows the financial model for the main case of this study, which considers a processing rate of 32,000 STPD and includes the Hydrometallurgical plant. The financial model in this table is truncated to the life of mine (January 2040) for ease of viewing. Information for years 2041 to 2100 primarily includes values for reclamation and taxes.
Key Phase I and II combined results from this financial model include a pre-tax IRR of 10.9%, a pre-tax NPV@7% of $322 million, an after-tax IRR of 10.3%, an after-tax NPV@7% of $271 million and an after-tax payback period of 7.5 years.
Key Phase I results (data not shown) include a pre-tax IRR of 10.2%, a pre-tax NPV@7% of $217 million, an after-tax IRR of 9.6%, an after-tax NPV@7% of $173 million and an after-tax payback period of 7.3 years.
| M3-PN150164 26 March 2018 |
229
NorthMet Project
Form NI 43-101F1 Technical Report
Table 22‑9: NorthMet Financial Model – 32,000 STPD with Hydrometallurgical Plant (Phase I and Phase II Combined)
| Period Start | Jan-19 | Jan-20 | Jan-21 | Jan-22 | Jan-23 | Jan-24 | Jan-25 | Jan-26 | Jan-27 | Jan-28 | Jan-29 | Jan-30 | Jan-31 | Jan-32 | Jan-33 | Jan-34 | Jan-35 | Jan-36 | Jan-37 | Jan-38 | Jan-39 | Jan-40 | Jan-41 | Jan-42 | Jan-43 | Jan-44 | |||
| Period End | Dec-19 | Dec-20 | Dec-21 | Dec-22 | Dec-23 | Dec-24 | Dec-25 | Dec-26 | Dec-27 | Dec-28 | Dec-29 | Dec-30 | Dec-31 | Dec-32 | Dec-33 | Dec-34 | Dec-35 | Dec-36 | Dec-37 | Dec-38 | Dec-39 | Dec-40 | Dec-41 | Dec-42 | Dec-43 | Dec-44 | |||
| Project Year | Total | -2 | -1 | 1 | 2 | 3 | 4 | 5 | 6 | 7 | 8 | 9 | 10 | 11 | 12 | 13 | 14 | 15 | 16 | 17 | 18 | 19 | 20 | 21 | 22 | 23 | 24 | ||
| Payable Metal (prices from Table 1-4) | |||||||||||||||||||||||||||||
| Copper (klb) | 1,155,070 | - | - | 41,819 | 68,943 | 72,978 | 68,405 | 68,405 | 68,188 | 68,405 | 64,066 | 61,039 | 56,727 | 55,223 | 54,149 | 55,437 | 55,652 | 58,234 | 59,312 | 65,800 | 52,720 | 25,942 | 25,942 | - | - | - | - | ||
| Nickel (klb) | 174,226 | - | - | 5,458 | 8,949 | 10,702 | 9,473 | 9,312 | 9,801 | 11,110 | 10,524 | 9,276 | 9,029 | 8,895 | 9,073 | 9,051 | 8,729 | 8,526 | 8,667 | 9,679 | 8,089 | 4,305 | 4,305 | - | - | - | - | ||
| Cobalt (klb) | 6,223 | - | - | 231 | 379 | 376 | 333 | 327 | 344 | 390 | 370 | 326 | 317 | 312 | 319 | 318 | 307 | 299 | 304 | 340 | 284 | 151 | 151 | - | - | - | - | ||
| Platinum (koz) | 286 | - | - | 4 | 7 | 22 | 24 | 22 | 20 | 15 | 13 | 17 | 14 | 15 | 16 | 14 | 13 | 16 | 13 | 13 | 11 | 7 | 7 | - | - | - | - | ||
| Palladium (koz) | 1,189 | - | - | 29 | 50 | 85 | 80 | 74 | 75 | 76 | 67 | 63 | 56 | 64 | 65 | 56 | 54 | 59 | 59 | 64 | 50 | 28 | 28 | - | - | - | - | ||
| Gold (koz) | 86 | - | - | 1 | 2 | 7 | 8 | 7 | 6 | 4 | 4 | 5 | 4 | 5 | 5 | 4 | 4 | 5 | 4 | 4 | 3 | 2 | 2 | - | - | - | - | ||
| Silver (koz) | 958 | - | - | 43 | 76 | 66 | 64 | 71 | 65 | 67 | 69 | 51 | 45 | 40 | 37 | 38 | 40 | 40 | 47 | 50 | 31 | 7 | 7 | - | - | - | - | ||
| CuEq (klb) | 2,128,112 | - | - | 68,685 | 114,296 | 138,400 | 129,735 | 126,782 | 127,210 | 128,380 | 119,150 | 113,662 | 104,671 | 105,923 | 105,939 | 103,514 | 101,986 | 106,759 | 107,310 | 117,852 | 94,947 | 49,176 | 49,176 | - | - | - | - | ||
| (All Financial Amounts in US$000) | |||||||||||||||||||||||||||||
| Gross Revenue | |||||||||||||||||||||||||||||
| Copper | 3,719,326 | - | - | 134,656 | 221,997 | 234,988 | 220,266 | 220,266 | 219,566 | 220,266 | 206,294 | 196,544 | 182,662 | 177,817 | 174,360 | 178,509 | 179,200 | 187,515 | 190,985 | 211,877 | 169,760 | 108,267 | 83,534 | - | - | - | - | ||
| Nickel | 1,385,097 | - | - | 43,394 | 71,143 | 85,078 | 75,310 | 74,028 | 77,915 | 88,325 | 83,664 | 73,744 | 71,779 | 70,714 | 72,127 | 71,953 | 69,393 | 67,784 | 68,899 | 76,948 | 64,307 | 44,363 | 34,229 | - | - | - | - | ||
| Cobalt | 128,694 | - | - | 4,776 | 7,830 | 7,772 | 6,878 | 6,761 | 7,117 | 8,072 | 7,646 | 6,738 | 6,559 | 6,462 | 6,592 | 6,576 | 6,341 | 6,192 | 6,294 | 7,030 | 5,876 | 4,054 | 3,128 | - | - | - | - | ||
| Platinum | 322,826 | - | - | 4,749 | 8,215 | 24,623 | 26,583 | 25,135 | 22,847 | 16,413 | 14,957 | 19,734 | 15,779 | 16,775 | 18,269 | 16,211 | 14,930 | 18,296 | 15,196 | 14,695 | 12,338 | 9,642 | 7,439 | - | - | - | - | ||
| Palladium | 1,156,463 | - | - | 27,826 | 48,616 | 82,662 | 77,653 | 71,886 | 73,132 | 73,504 | 64,887 | 61,550 | 54,063 | 62,576 | 62,889 | 54,150 | 52,940 | 57,307 | 57,815 | 62,255 | 48,396 | 35,199 | 27,158 | - | - | - | - | ||
| Other | 140,116 | - | - | 5,764 | 10,232 | 10,527 | 11,057 | 10,163 | 9,038 | 6,804 | 6,213 | 7,682 | 6,198 | 6,727 | 6,888 | 5,917 | 5,593 | 6,670 | 6,349 | 6,681 | 5,052 | 2,704 | 2,858 | - | - | - | - | ||
| Gross Revenue | 6,852,522 | - | - | 221,165 | 368,033 | 445,649 | 417,747 | 408,238 | 409,615 | 413,384 | 383,662 | 365,992 | 337,040 | 341,072 | 341,125 | 333,315 | 328,396 | 343,764 | 345,538 | 379,485 | 305,728 | 205,230 | 158,346 | - | - | - | - | ||
| Selling Costs | (513,884) | - | - | (25,034) | (41,552) | (31,079) | (29,750) | (28,707) | (29,656) | (28,656) | (27,593) | (26,824) | (23,787) | (23,520) | (23,221) | (23,473) | (23,511) | (25,188) | (25,398) | (27,945) | (22,802) | (14,146) | 12,044 | - | - | - | |||
| Net Revenue | 6,338,638 | - | - | 196,131 | 326,482 | 414,570 | 387,997 | 379,531 | 379,959 | 384,728 | 356,069 | 339,167 | 313,253 | 317,552 | 317,905 | 309,842 | 304,885 | 318,576 | 320,139 | 351,540 | 282,926 | 191,084 | 147,037 | - | - | - | - | ||
| Site Costs | |||||||||||||||||||||||||||||
| Mining | (806,215) | - | - | (36,711) | (44,272) | (42,461) | (43,707) | (45,519) | (47,499) | (44,051) | (40,564) | (44,845) | (46,120) | (42,701) | (41,270) | (40,507) | (40,770) | (39,979) | (42,516) | (43,902) | (36,525) | (27,130) | (15,164) | - | - | - | - | ||
| Processing - Concentrator | (1,473,921) | - | - | (48,979) | (76,891) | (76,891) | (76,891) | (76,891) | (75,417) | (75,516) | (75,516) | (75,516) | (75,773) | (75,773) | (75,773) | (75,773) | (75,773) | (75,613) | (75,613) | (75,613) | (75,613) | (75,613) | (58,483) | - | - | - | - | ||
| Processing - Hydromet | (473,845) | - | - | - | - | (27,792) | (20,312) | (21,488) | (24,848) | (32,288) | (32,842) | (25,634) | (31,183) | (25,781) | (26,117) | (30,213) | (27,968) | (24,277) | (22,371) | (27,272) | (27,443) | (24,676) | (21,338) | - | - | - | - | ||
| G&A, Royalties, & Reclamation | (477,970) | (10,800) | (800) | (20,854) | (34,064) | (34,434) | (33,785) | (34,044) | (28,020) | (29,184) | (28,124) | (28,031) | (27,759) | (27,084) | (26,940) | (26,233) | (26,654) | (26,767) | (26,656) | (27,822) | (24,873) | (21,376) | (17,722) | (11,602) | (10,945) | (11,236) | (3,989) | ||
| Cash Flow After Site Cost | 3,106,687 | (10,800) | (800) | 89,587 | 171,254 | 232,992 | 213,301 | 201,589 | 204,176 | 203,689 | 179,023 | 165,141 | 132,419 | 146,212 | 147,803 | 137,115 | 133,720 | 151,940 | 152,983 | 176,931 | 118,472 | 42,289 | 34,330 | (12,337) | (10,945) | (11,236) | (3,989) | ||
| Net Working Capital | (0) | 27,267 | 23,009 | (65,426) | 10,046 | (21,956) | (7,096) | 6,390 | (8,281) | 9,637 | (2,678) | (1,878) | 10,450 | (4,934) | 2,256 | 1,900 | (620) | (5,614) | (830) | 2,315 | 1,749 | 13,371 | 2,059 | 3,216 | 5,651 | - | - | ||
| Initial Capex - Process Plant and Mining Fleet | (945,124) | (331,751) | (613,372) | - | - | - | - | - | - | - | - | - | - | - | - | - | - | - | - | - | - | - | - | - | - | - | - | ||
| Initial Capex - HydroMet Plant | (258,779) | - | - | - | (258,779) | - | - | - | - | - | - | - | - | - | - | - | - | - | - | - | - | - | - | - | - | - | - | ||
| Sustaining Capital Costs | (220,617) | - | - | (8,268) | (26,640) | (35,054) | (8,494) | (7,518) | (21,209) | (8,967) | (5,643) | (9,909) | (17,259) | (8,224) | (5,903) | (14,844) | (3,955) | (5,677) | (8,747) | (6,818) | (4,735) | (4,558) | (8,195) | - | - | - | - | ||
| Cash Flow Before Taxes | 1,682,167 | (315,284) | (591,163) | 15,892 | (104,118) | 175,983 | 197,710 | 200,460 | 174,685 | 204,359 | 170,701 | 153,354 | 125,609 | 133,054 | 144,156 | 124,171 | 129,145 | 140,648 | 143,405 | 172,428 | 115,486 | 51,102 | 28,195 | (9,121) | (5,294) | (11,236) | (3,989) | ||
| Taxes | (108,348) | - | - | (2,985) | (5,747) | (7,345) | (7,070) | (6,731) | (6,747) | (6,741) | (5,804) | (5,448) | (4,227) | (4,831) | (4,940) | (4,483) | (4,353) | (5,193) | (5,249) | (6,305) | (3,807) | (212) | (0) | - | - | - | - | ||
| Cash Flow After Taxes | 1,573,820 | (315,284) | (591,163) | 12,907 | (109,866) | 168,638 | 190,640 | 193,729 | 167,938 | 197,618 | 164,898 | 147,906 | 121,383 | 128,223 | 139,216 | 119,688 | 124,792 | 135,456 | 138,156 | 166,123 | 111,679 | 50,891 | 28,195 | (9,121) | (5,294) | (11,236) | (3,989) | ||
Note: The financial model above is truncated for ease of viewing. Information for years 2045 to 2100 primarily includes values for reclamation and taxes
| M3-PN150164 26 March 2018 |
230
NorthMet Project
Form NI 43-101F1 Technical Report
| 23 | ADJACENT PROPERTIES |
There are no adjacent properties that PolyMet is proposing to explore or drill as part of any drilling program or other evaluation. There are several other deposits in the Duluth Complex, including the Mesaba project owned by Teck Resources Limited, Serpentine owned by Encampment Resources, and the Maturi project owned by Twin Metals Minnesota, a wholly owned subsidiary of Antofagasta plc.
| M3-PN150164 26 March 2018 |
231
NorthMet Project
Form NI 43-101F1 Technical Report
| 24 | OTHER RELEVANT DATA AND INFORMATION |
| 24.1 | Project Implementation |
The proposed execution of the NorthMet Project, as covered in this section, assumes a seamless transition between critical Project phases, minimal Project interruptions and a reduction in potential risks. Section 24.2 addresses potential incremental add-ons that may be implemented, subject to certain infrastructure changes that would require significant capital investment.
The project implementation would consist of the following phases:
| · | Engineering – Basic and Detailed |
| · | Demolition |
| · | Construction |
It is anticipated that the stages may somewhat overlap depending on receipt of final permits.
This approach assumes that all work associated with Asset Preservation has been accomplished prior to Demolition. Asset preservation includes the removal of all asbestos, mold, and lead paint as well as some basic infrastructure repairs such as repair of the fire water loop and pumping system. This work is all out of the scope of this study and has been handled as a separate project, under the Owner’s existing operating budget. It is being performed prior to the project start in order to ensure optimum health and safety conditions for the plant demolition and construction works. Removal of existing saleable equipment will be handled under the Asset preservation scope as well.
| 24.1.1 | Engineering |
| 24.1.1.1 | Phase I Design (Concentrate only) |
The engineering scope of work shall comprise all activities associated with the final design of the plant, site infrastructure, and ancillary buildings. This will include the following:
| · | Process engineering, including the generation of the process equipment schedules, PFDs, P&IDs, process design criteria, process description and the plant control philosophy. |
| · | Mechanical engineering, including development of mechanical schedules and the design of proprietary equipment. |
| · | Civil and earthworks design, based on geotechnical information to be supplied by the Client, and structural loads and process requirements in accordance with the relevant codes and regulations. |
| · | Structural and platework design, taking cognizance of the required materials of construction to ensure suitability for the process application. |
| · | Piping design, including development of detailed piping schedules, pump selections, fire water distribution design, service distribution design, and pipe insulation requirements, taking cognizance of the required materials of construction to ensure suitability for the process application. |
| · | Electrical and instrumentation design including the plant and site overall power supply, distribution, lighting, grounding, monitoring and control systems. |
| · | Any design requirements associated with plant infrastructure. |
| · | Production of an overall plant model depicting all infrastructure, equipment and utilities. |
| M3-PN150164 26 March 2018 |
232
NorthMet Project
Form NI 43-101F1 Technical Report
| · | Design of the refurbishment of existing ancillary buildings that will be reused. |
| · | Tails basin and dam upgrades (subcontract). |
| · | Water Treatment Plant design. |
| · | Final design of all environmental infrastructure and controls, including basins, stockpiles, pipelines, and sewage treatment. Design of the HRF will be included here. |
| · | Generation of technical procurement documentation for all disciplines listed above. The procurement packages would be finalized to the point of order placement. Orders for the mills and GMD engineering portion would only need to be placed to ensure that certified information is available sufficiently early to complete the civil and structural designs associated with this equipment. |
The Water Treatment Plant is expected to take 9 months to complete and would allow seamless transition into construction.
| 24.1.1.2 | Phase II Design (Hydrometallurgical Plant) |
The engineering scope of work shall comprise all activities associated with the final design, specification and procurement of hydrometallurgical plant and its needed infrastructure. This will include:
| · | Process engineering, including the generation of the process equipment schedules, PFDs, P&IDs, process design criteria, process description and the plant control philosophy. Included in this would be the specification of the Autoclave and any specialized engineering analysis required for its specification and purchase as early as possible. |
| · | Development of the General Arrangement plans and a fully functional 3D plant model. |
| · | Mechanical engineering, including generation and maintenance of the equipment list, mechanical system designs (such as conveying and material handling) and applicable specifications and data sheets. Chute design and simulation is included here. |
| · | Civil and earthworks design for the facilities, based on Owner provided geotechnical information. |
| · | Structural steel design for the building and internal platforms as needed as well as any specialized embeds. |
| · | Piping design, including development of the piping schedules (including line lists and valve lists), materials specifications, pump selections, pipe insulation requirements, and any special stress calculations needed. |
| · | Electrical and instrumentation design including the plant power supply, distribution, lighting, grounding, monitoring and control systems. |
| · | Any design requirements associated with plant infrastructure, such as the utilities needed for the “over the fence” oxygen plant. |
| · | Architectural design and specification of the hydrometallurgical plant building |
| · | Procurement packages would be developed for all major process equipment as well as specialized piping and valves, instrumentation, and electrical equipment. The pre-engineered metal building for the hydrometallurgical plant would likely be purchased by the EPCM as well. |
The hydrometallurgical plant design and procurement is currently scheduled to begin one year after the initiation of Phase I and continue for roughly 20 months.
| M3-PN150164 26 March 2018 |
233
NorthMet Project Form NI 43-101F1 Technical Report |
| 24.1.2 | Demolition |
The existing concentrator building will have the majority of the structural steel related to elevated slabs and the elevated slabs themselves, removed. The fine crushing and coarse crushing buildings would undergo selective removal of existing steel and equipment where it is either damaged or not to be reused. The existing ore bins in the Concentrator would remain but would have their discharges reworked.
Temporary heating and ventilation would be provided in the existing buildings during these works.
The approach would be to sell off the removed steel as scrap in the aims of mitigating some of the demolition costs.
General cleaning and maintenance of existing facilities would occur during this phase as well.
It would be preferable for this work to commence in the summer months to limit the temporary heating requirements. It is expected to take 6 to 9 months to complete.
| 24.1.3 | Execution and Construction |
The construction phase would follow both Phase I and Phase II (with some overlap) and would include the following:
| · | Placement of orders for all Owner supplied equipment and materials. |
| · | Development of contracting philosophy and all contract packages. |
| · | Incorporation of certified vendor documentation into all final designs |
| · | Factory inspections, expediting and logistical services |
| · | Site clearing, all earthworks, pond and stockpile liner installation and access and water management system works |
| · | Excavations and demolition for new buildings and structures |
| · | Refurbishment and installation of new rail systems |
| · | Modifications to existing infrastructure |
| · | Refurbishment of existing equipment intended for re-use |
| · | Fabrication of all mechanical, piping, electrical and instrumentation equipment |
| · | Fabrication of all structures, platework and piping (including piping spool, steel and chute detailing). |
| · | Erection and installation of new and refurbished plant equipment, structures, civils, infrastructure and utilities |
| · | Tie-in of the new electrical distribution system to the plant power supply |
| · | Installation of the complete plant control system |
| · | Plant commissioning up to the point of handover. Initial ore processing will be by Owner’s personnel. |
The schedule does not include any plant ramp-up and optimization period which would occur after handover.
The Project execution schedule summary is presented in Figure 24‑1 and continues in Figure 24‑2.
The construction phase is expected to take approximately 23 months including commissioning and the critical path (Figure 24‑3) is defined by all activities associated with the mills and the mill GMDs.
| M3-PN150164 26 March 2018 |
234
NorthMet Project
Form NI 43-101F1 Technical Report
| 24.1.4 | Ramp-up Evaluation |
| 24.1.4.1 | Suggested Schedule |
Design engineering should commence as soon as funding allows. Demolition should proceed as soon as permitting allows. In addition, prior to construction, PolyMet should:
| · | Review and update the scope of the Project design to reflect changes resulting from the permitting process, if any, and other Project enhancements. |
| · | Commence selection of a water treatment plant equipment provider once the final permits are in place |
| · | Update/Complete basic engineering on all designs in preparation for detailed design |
| · | Establish Construction contract formats |
| · | Establish Procurement documents that will be used for all equipment purchases |
| · | Finalize permitting activities |
| · | Finalize the contract for deed with Cliffs |
| M3-PN150164 26 March 2018 |
235
NorthMet Project
Form NI 43-101F1 Technical Report
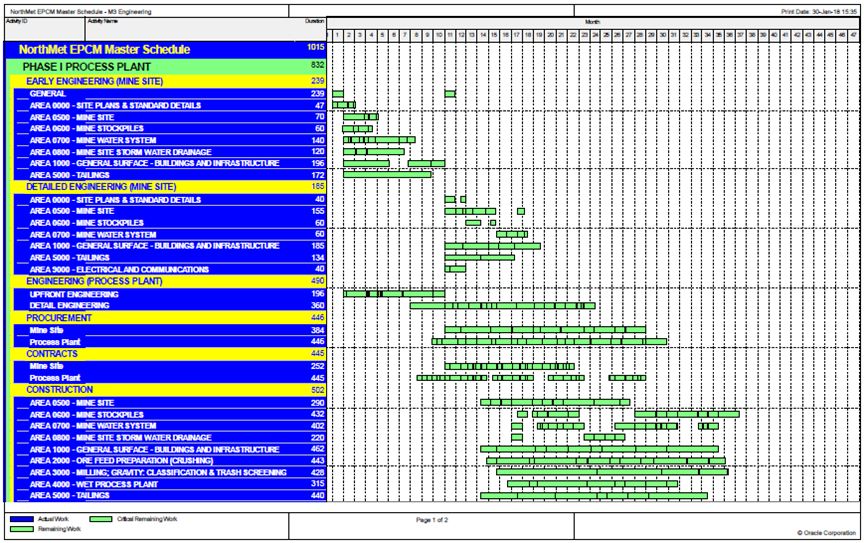
Figure 24‑1: Project Execution Schedule Summary
| M3-PN150164 26 March 2018 |
236
NorthMet Project
Form NI 43-101F1 Technical Report
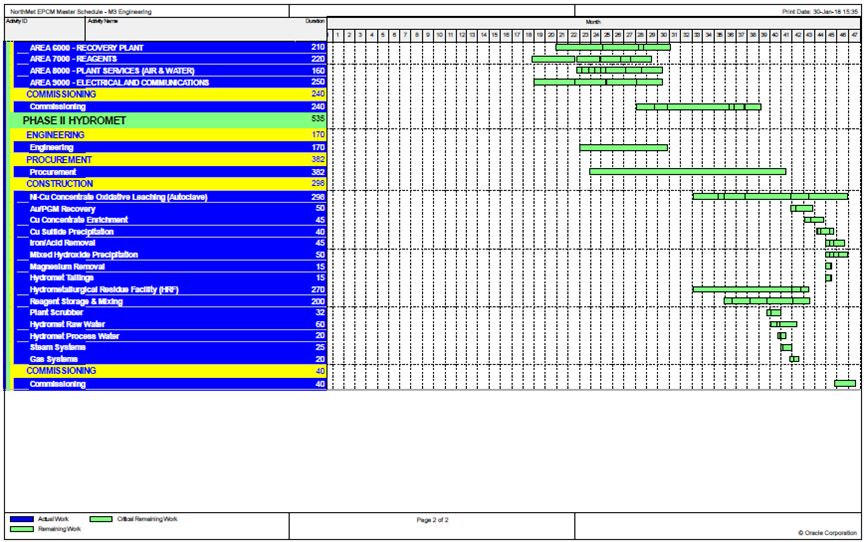
Figure 24‑2: Project Execution Schedule Summary Continued
| M3-PN150164 26 March 2018 |
237
NorthMet Project
Form NI 43-101F1 Technical Report
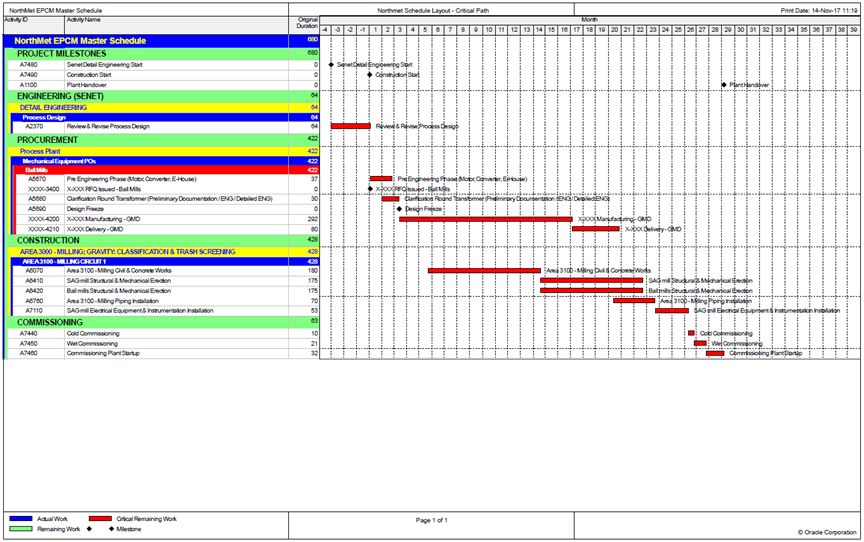
Figure 24‑3: Project Critical Path
| M3-PN150164 26 March 2018 |
238
NorthMet Project
Form NI 43-101F1 Technical Report
| 24.2 | Potential Opportunities |
PolyMet has considered opportunities to improve annual operating costs and LOM strategies using the existing block resource model tons and grades as a basis for alternate economic scenarios. The scenarios presented in this section should not be misconstrued as proposals or detailed plans or strategies. PolyMet would need to prepare preliminary and definitive feasibility studies, as well as conduct an analysis of the environmental impact and alternatives and budget and cost decisions prior to any decision to apply for permits to pursue these opportunities. Any such opportunities would be subject to various regulatory requirements and would require significant capital investment. Because the steps in this process have not been undertaken by PolyMet, the results presented in this section should be considered speculative. In addition, any future project proposal would be subject to additional environmental review and permitting requirements and or public notice and comment, and approval by appropriate Federal and State Agencies. The NorthMet FEIS evaluates the reasonably foreseeable environmental effects of the NorthMet Project (as described in Sections 2 through 23), based in part on a mine plan that identified an average production rate of 32,000 STPD (approximately 225 million short tons over the 20-year life of the mine). PolyMet’s focus and intention is to put into operation the 32,000 STPD plan detailed in this Technical Report as soon as possible.
| 24.2.1 | Summary |
The following two additional scenarios were evaluated for the NorthMet deposit:
| · | Increase the daily mill feed rate to 59,000 STPD and mine to the completion of the West Pit design, |
| · | Increase the daily mill feed rate to 118,000 STPD by expanding the pit limits outside the current limits. |
The same parameters described in Section 15 were applied to evaluate the potential for alternative mining strategies beyond the current maximum mill tonnage of 225 million tons that are included in the draft permits. For the 59,000 STPD, all measured, indicated and inferred classified tonnage within the EIS and permit pit limit design was used. At the 118,000 STPD milling rate, all measured, indicated and inferred classified tonnage within an expanded pit limit was used.
The PEA-level investigation presents an average throughput of 59,000 STPD over a 15-year period (with year 15 not being a full year of production) once the Erie Plant has been modified to meet the new process rate. An additional initial capital investment of $150 million USD is estimated to modify the plant to meet 59,000 STPD. Preliminary analysis indicates an estimated NPV@7% of $751 million for Phase I, concentrates sales only. With Phase II implemented, the after tax NPV@7% is $963 million. The additional investment to implement Phase II is $408 million (plant expansion and Hydromet). Overall operating costs on a per ton basis milled, decreased in this study compared to the 32,000 STPD base case, largely reflecting increased utilization of existing and planned base case infrastructure.
The higher tonnage scenario assumes an average throughput of 118,000 STPD over a 19-year period. In this case, an additional, initial capital investment of $668 million USD is estimated to meet the new process flow. This higher throughput results in an estimated NPV@7% of $1,737 million for Phase I and an after tax NPV@7% of $2,243 million for Phase II. The additional investment to implement Phase II is $926 million (plant expansion and Hydromet). Overall operating costs on a per ton basis milled, decreased in this study compared to the 32,000 STPD base case.
| 24.2.2 | Introduction |
A preliminary investigation was undertaken to evaluate the potential of developing the NorthMet Deposit to achieve higher throughputs than the current 32,000 STPD mine plan. For the sake of clarity, only technical information differing from that presented in previous sections has been incorporated into this section. It is important to note that both the 59,000 STPD and 118,000 STPD scenarios include materials classified as inferred in addition to measured and indicated material. Inferred material is considered too poorly defined to include in most mine planning exercises except at the Preliminary Economic Assessment (PEA) level and are too speculative geologically to have the economic considerations applied to them that would enable them to be categorized as Mineral Reserves. Hence, the results predicted for 59,000 STPD and 118,000 STPD throughput are speculative and may not be realized.
| M3-PN150164 26 March 2018 |
239
NorthMet Project
Form NI 43-101F1 Technical Report
| 24.2.3 | Mill Throughput Tonnages |
According to NI 43-101 definitions, a PEA implies a study that does or does not include an economic analysis of the potential viability of all mineral resources. NI 43-101 also states that an issuer may disclose the results of a preliminary assessment that includes or is based on inferred mineralized materials. It must be emphasized that the economic assessment presented herein is preliminary and the inferred material included in the mine plans developed for these scenarios is speculative with respect to the economic considerations applied to them. These scenarios include mineralized material classified as measured, indicated and inferred for the NorthMet deposit. Recoveries for Cu and Ni have been extrapolated for the higher throughput case.
Table 24‑1 compares the tonnages by mineral resource classification for the NorthMet Project at a throughput of mineralized material for the 59,000 STPD and 118,000 STPD scenarios. For the 59,000 and 118,000 STPD scenarios, the NSR calculations for the mine production schedule were calculated based on a new mining sequences and different minimum NSR cutoffs. The set of mining phases for the 118,000 STPD schedule, were not restricted to the EIS permit application pit limits and are based on mineralization which included the inferred category.
Table 24‑1: A Comparison of the Mill Feed Tonnages between 59,000 and 118,000 STPD Throughputs
| Classification | STPD | Tonnage (M st) | Cu (%) | Ni (%) | S (%) | Pt (ppb) | Pd (ppb) | Au (ppb) | Co (ppm) | Ag (ppm) | CuEq (%) |
| Measured | 118K | 192.1 | 0.286 | 0.083 | 0.70 | 73 | 258 | 37 | 73 | 1.04 | 0.566 |
| 59K | 129.1 | 0.306 | 0.087 | 0.69 | 82 | 281 | 41 | 75 | 1.10 | 0.608 | |
| Indicated | 118K | 285.4 | .258 | 0.07 | 0.62 | 69 | 233 | 35 | 72 | 0.95 | 0.511 |
| 59K | 153.7 | 0.280 | 0.080 | 0.61 | 77 | 253 | 38 | 74 | 1.02 | 0.556 | |
| M+I | 118K | 477.5 | 0.269 | 0.078 | 0.65 | 71 | 243 | 36 | 73 | 0.99 | 0.533 |
| 59K | 282.8 | 0.292 | 0.083 | 0.64 | 79 | 266 | 39 | 74 | 1.06 | 0.580 | |
| Inferred | 118K | 252.3 | 0.264 | 0.072 | 0.58 | 77 | 254 | 40 | 65 | 1.01 | 0.524 |
| 59K | 10.3 | 0.241 | 0.072 | 0.66 | 66 | 213 | 33 | 73 | 0.93 | 0.478 |
*Notes:
Mineral resource tonnage and contained metal have been rounded to reflect the accuracy of the estimate, and numbers may not add due to rounding. Cu-Eq is based on the mill recovery to concentrates and metal prices presented in Section 15. Source: IMC, October 2017
Combined, the mineralized material for the 118,000 STPD scenario above the cutoff is estimated at 477 million tons of measured, indicated, and 252 million tons of inferred material. This tonnage has been limited to the material that resides above the optimized pit shell. All mineralization below the optimized pit shell has been excluded from the 118,000 STPD study tonnages or economic evaluation. The inclusion of the 118,000 STPD tonnages into the future studies may be materially affected by environmental, permitting, legal socio-economic, marketing, political, future exploration results or other factors.
For the 59,000 STPD scenario, the LOM copper and nickel recovered in concentrates is expected to be 83% (Phase I) / 87% (Phase II) and 35% (Phase I) /45% (Phase II), respectively, based on mining approximately 293 million tons of mill feed grading on average at 0.29% Cu, 0.08% Ni, 79 ppb Pt, 264 ppb Pd, 39 ppb Au, 74 ppm Co and 1 ppm Ag. For the 118,000 STPD scenario, total LOM copper recovered in concentrates is expected to be 82% (Phase I) / 84% (Phase II) and 33% (Phase I) /40% (Phase II) recovery of nickel in concentrates based on mining approximately 730 million tons of mill feed grading on average at 0.27% Cu, 0.08% Ni, 73 ppb Pt, 247 ppb Pd, 37 ppb Au, 70 ppm Co and 1 ppm Ag.
| M3-PN150164 26 March 2018 |
240
NorthMet Project
Form NI 43-101F1 Technical Report
The 59,000 and 118,000 alternate mine plan scenarios were developed using conventional hard rock open pit mining methods for the mine production schedule at the corresponding throughput, with two (2) 12-hour shifts per day, 360 days per year for 15 and 19 years, respectively. Reactive waste rock would initially be placed in temporary stockpiles then backfilled into inactive pits and submerged below the water table as is the case for the 32,000 STPD scenario. Less reactive waste rock would be stockpiled and used for construction purposes. The pit footprint for 59,000 STPD is the same as for the 32,000 STPD (see Figures 16-2 and 16-3 for 32,000 STPD footprints at the end of Mine Year 1 and 20, respectively).
The metal pricing for the higher throughput pit definition is the same as the 32,000 STPD base case (Table 1‑4). Total mill recovery for elements, except Co, is based on the same logarithmic curves of recovery vs. head grade shown for the 32,000 STPD case in Table 16‑6. Similarly, at the higher throughputs, the mill would produce three concentrates and the overall recovery for the metals is distributed to each of the concentrates based on various formulas. The NSR calculation also takes into account all concentrate treatment charges, refining, payable deductions, shipping charges for concentrates and precipitates produced, along with any royalties. A comparison between the cost inputs to the NSR calculation for the two throughputs is shown in Table 24‑1.
The cutoff grade used for the higher throughput mine schedules are based on the NSR values assigned to the block model as shown in Table 24‑2.
Table 24‑2: Comparison of Cost Inputs to NSR Cutoff Grade for Various Throughputs (STPD)
| Cost Inputs | 59,000 STPD NSR Cutoff, $/t | 118,000 STPD NSR Cutoff, $/t |
| Process Cost (including primary crushing & transporting to the plant) | 6.74 | 6.50 |
| Property G&A Costs, per ton of feed | 0.46 | 0.50 |
| Waste Water Treatment Costs, per ton of feed | 0.69 | 0.35 |
| Total Cost per ton feed | 7.89 | 7.35 |
24.2.4 | Mine Site Modifications |
24.2.4.1 | Site Access and Haul Roads |
The construction of haul roads would change to include the larger footprint proposed for 118,000 STPD mine and are captured in sustaining capital. Haul roads for the 32,000 STPD are deemed sufficient for the 59,000 STPD.
| 24.2.4.2 | Mine to Plant Pipelines |
The costs for the Mine to Plant Pipelines (MPP) which convey mine water from the Equalization Basins to the WWTS and the Flotation Tailing Basin are sufficient to cover flows anticipated at the mine for the 59,000 STPD scenario. Costs were scaled upward to accommodate larger pipeline diameters to account for larger flow volumes in response to the larger mine footprint under the 118,000 STPD scenario.
| 24.2.4.3 | 13.8 kV Mine Site Power Distribution System |
An electrical service upgrade from 13.8 kV up to 34.5 kV is required to manage the power draw required for additional shovels, the crushers and overland conveyor for the 118,000 STPD scenario.
| M3-PN150164 26 March 2018 |
241
NorthMet Project
Form NI 43-101F1 Technical Report
| 24.2.4.4 | Primary Crushing Facility & Overland Conveyor |
For the 59,000 STPD scenario, mill feed would be hauled to the Rail Transfer Hopper (RTH) and loaded onto railcars for delivery to the dump pocket at the plant and the primary crushing undertaken at the plant site as discussed below. The plan for the 118,000 STPD scenario would be to crush mill feed at the pit by installing two semi-mobile crushing facilities and convey mill feed via a series of transfer conveyors and an overland conveyor to the Erie Plant. Truck hauling would be minimized by in pit conveying mill feed to the 8-mile long overland conveyor which effectively replaces the existing RTH and rail line.
| 24.2.4.5 | Other |
The Mine Site Fueling and Maintenance Facility would require retrofitting to accommodate the larger haul trucks planned for 118,000 STPD but would be of sufficient size for the 240-ton haul trucks scheduled for 59,000 STPD.
| 24.2.5 | Plant Site Modifications |
Much of the existing infrastructure at the Erie Plant would be of sufficient size, if retrofitted, to accommodate the layout of new state-of-the-art equipment required for all three throughput scenarios. Only a few new structures such as a coarse mill feed storage dome would have to be erected to meet the material processing demands for the 118,000 STPD scenario.
| 24.2.5.1 | Coarse Mill Feed Storage Dome |
Mill feed would be delivery by rail to the existing primary crushing facility in both the 32,000 and 59,000 STPD scenarios. Additional costs have been estimated for locomotives, rail car refurbishment and some additional track for the 59,000 STPD scenario. Additional mill feed storage is not planned for the 59,000 STPD scenario. For the 118,000 STPD scenario, a 150,000-ton storage dome is planned to minimize operation disruption at the plant should the overland conveyor be down for repairs or maintenance. A preliminary material takeoff was developed for concrete and steel needed for the dome structure and reclaim tunnels to support the 118,000 case CAPEX. This estimate also includes costs of dust collectors, transfer conveyors, SAG mill feed conveyors, apron feeders and all associated electrical, piping and instrumentation.
| 24.2.5.2 | Crushing and Comminution |
The primary and secondary crushing facilities at the Erie Plant is of sufficient capacity to handle 59,000 STPD, but it would be necessary to modify the crusher settings and upgrade the material transfer facilities.
To process 118,000 STPD primary crushing would be accomplished in-pit. At the plant, two additional secondary crushers would be needed to meet throughput. It would also be necessary to install a full plant feed transfer and storage system.
The comminution estimate for 59,000 STPD case includes an additional ball mill and pebble crusher for approximately $36 million along with demolition costs to retrofit the facility. For the 118,000 STPD case, additional conveyors, pebble crushers and a second grinding line (consisting of a SAG mill and two large ball mills) would be needed as well. Additional flotation cells are also required to meet the higher throughputs and recover the same proportion of copper and nickel concentrates as in the 32,000 STPD base case scenario.
24.2.5.3 Flotation (or Copper and Nickel Concentration)
To process 59,000 STPD it is necessary to expand the flotation capacity by installing an additional flotation circuit with a similar design to the flotation circuit sized for 32,000 STPD.
| M3-PN150164 26 March 2018 |
242
NorthMet Project
Form NI 43-101F1 Technical Report
To process 118,000 STPD it is necessary to expand the flotation capacity by installing an additional, full flotation circuit with a similar design to the full flotation circuit sized for 59,000 STPD.
Copper and nickel concentrates would be recovered as per the 32,000 STPD base case scenario.
24.2.5.4 Thickening and Filtration
It is necessary to upgrade the thickening and filtration sections for the 59,000 STPD and 118,000 STPD scenarios.
24.2.5.5 Concentrate Loadout Facilities
The concentrate loadout facilities sized for 32,000 STPD at the Erie Plant is of sufficient capacity to handle 59,000 STPD, but it would be necessary to upgrade the concentrate loadout facilities for the 118,000 STPD scenario.
| 24.2.5.6 | Phase II Hydrometallurgical Plant |
The Phase II hydrometallurgical plant capital cost is the same for both the 59,000 and 118,000 STPD scenarios and as presented in the base case 32,000 STPD. This is because the maximum throughput of concentrate processed in the hydrometallurgical plant is fixed. The composition of the feed is anticipated to change and it is estimated that, under the 118,000 STPD scenario, the hydrometallurgical plant would be processing primarily Ni concentrate.
| 24.2.5.7 | Tailings Disposal |
Additional capital would be required to buildout the existing FTB to accommodate the tails volumes anticipated for the 59,000 STPD scenario. PolyMet has evaluated placing tailings from the 118,000 STPD flotation circuit by gravity to two existing taconite mine pits near the Erie plant. This is a less costly alternative than building out the existing FTB large enough to contain the additional volume anticipated under this scenario.
| 24.2.6 | Financial Outlook |
| 24.2.6.1 | Preliminary Capital & Operating Cost Estimates |
PEA-level initial and sustaining capital estimates were developed for the 59,000 and 118,000 STPD scenarios, as were operating costs for each scenario. For the 118,000 STPD scenario, M3 developed an estimate from current 2017 budgetary quotes and quotes from recently constructed projects of similar size. In some cases, costs were scaled from the original estimate using the “0.6 power rule” formula:
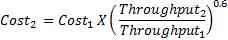
Examples of scaled costs from the 32,000 STPD CAPEX include revised civil/site work estimates, reagent & clear service pumps, HVAC, material quantity take-offs for structural steel and concrete, as well as piping and electrical allowances. For 59,000 STPD, cost estimates for the 32,000 STPD case were escalated to reflect current fourth quarter 2017 pricing using an ENR factor and then scaled using the 0.6 power rule to meet the new tonnage. In a few cases, the modifications/additions in plant equipment and process needs listed above were estimated separately and added to escalated totals. Capital costs for the 59,000 & 118,000 scenarios are presented in Table 24‑3.
| 24.2.6.2 | Operating Costs |
For the 59,000 STPD scenario (Phase I and II), operating cost over the LOM is estimated to be $13.43 per ton of mineralized material processed. For the 118,000 STPD scenario (Phase I and II), operating cost over the LOM is estimated to be $12.32 per ton of mineralized material processed. This represents a cost savings per ton processed for $2.28 and $3.40 for the 59,000 STPD and the 118,000 STPD scenarios, respectively, over the 32,000 STPD case.
| M3-PN150164 26 March 2018 |
243
NorthMet Project
Form NI 43-101F1 Technical Report
Table 24‑3: LOM Operating Highlights for 59,000 STPD & 118,000 STPD
| Operating Plan | Unit of Measure | 59,000 STPD | 118,000 STPD | ||
| Phase I | Phase I & II | Phase I | Phase I & II | ||
| Mineralized Material Processed | Million st | 293 | 293 | 730 | 730 |
| Operating Life | years | 15 | 15 | 19 | 19 |
| LOM Strip Ratio | 1.5 | 1.5 | 2.2 | 2.2 | |
| Capital Costs | |||||
| Initial Capital | $ millions | 1,095 | 1,354 | 1,614 | 1,872 |
| LOM Sustaining Capital | $ millions | 249 | 249 | 900 | 900 |
| Operating Costs | |||||
| Mining & Delivery to Plant | $/st processed | 3.16 | 3.16 | 3.36 | 3.36 |
| Processing | $/st processed | 5.32 | 6.94 | 5.36 | 6.34 |
| G&A | $/st processed | 0.78 | 0.78 | 0.28 | 0.28 |
| Subtotal Operating Costs | $/st processed | 9.26 | 10.88 | 9.00 | 9.98 |
| Selling Costs | $/st processed | 3.23 | 2.55 | 2.94 | 2.34 |
| Total Operating Costs | $/st processed | 12.49 | 13.43 | 11.94 | 12.32 |
Note: 118,000 STPD case mining and delivery costs to plant include G&A costs.
| 24.3 | Economic Analysis |
The preliminary estimate developed for a throughput of 59,000 STPD (using total Phase I and II) amounts to an additional $150 million dollars in initial capital over the 32,000 STPD base case (Phase I and II) and $28 million US dollars in additional sustaining capital. Estimated financial indicators for the 59,000 STPD case improved over the 32,000 STPD throughput to $963 million US dollars NPV@ 7% and 18.5% IRR for Phase I and II. The economic summary reflects processing 293 million tons of mineralized material grading at 0.576% Cu-Eq over a 15-year mine life, at an average of 59,000 STPD.
The 118,000 STPD case (Phase I and II) improves economics over the 32,000 STPD case. The post-tax NPV@7% is approximately $2,243 million with an IRR of 23.6% and a payback period of 4.1 years for Phase I and II. The economic summary reflects processing 730 million tons of mineralized material grading at 0.530% Cu-Eq over a 19-year mine life, at an average of 118,000 STPD.
| M3-PN150164 26 March 2018 |
244
NorthMet Project
Form NI 43-101F1 Technical Report
Table 24‑4: 59,000 STPD Economic Highlights
| Phase I | Phase I & II | ||||
| Units | First 5 Yrs 1 | LOM | LOM 2 | ||
| Life of Mine | Yrs | 154 | 154 | ||
| Material Mined | Mt | 294 | 724 | 724 | |
| Mill Feed Mined | Mt | 106 | 293 | 293 | |
| Waste: Mill Feed Ratio | 1.8 | 1.5 | 1.5 | ||
| Mill Feed Grade | |||||
| Copper | % | 0.313 | 0.290 | 0.290 | |
| Nickel | % | 0.087 | 0.083 | 0.083 | |
| Cobalt | ppm | 75 | 74 | 74 | |
| Palladium | ppm | 0.293 | 0.264 | 0.264 | |
| Platinum | ppm | 0.087 | 0.079 | 0.079 | |
| Gold | ppm | 0.043 | 0.039 | 0.039 | |
| Annual Payable Metal Produced | |||||
| Copper | mlb | 110.5 | 93.6 | 98.2 | |
| Nickel | mlb | 13.2 | 11.3 | 14.5 | |
| Cobalt | mlb | 0.56 | 0.48 | 0.52 | |
| Palladium | koz | 90.5 | 71.4 | 99.2 | |
| Platinum | koz | 19.1 | 14.8 | 24.1 | |
| Gold | koz | 5.0 | 3.9 | 7.3 | |
Copper Equivalent3 | mlb | 184.7 | 154.7 | 179.7 | |
| Cash Costs: by-product | $/lb Cu | 0.45 | 0.72 | 0.23 | |
| Cash Costs: Cu equivalent | $/lb CuEq | 1.56 | 1.71 | 1.59 | |
| Development Capital | $M | 1,095 | 1,095 | 1,354 | |
| Sustaining Capital | $M | 128 | 249 | 249 | |
| Annual Revenue | $M | 595 | 498 | 579 | |
| Annual EBITDA | $M | 307 | 234 | 294 | |
NPV7 | $M | 751 | 963 | ||
| IRR | % | 17.5 | 18.5 | ||
| Payback (from first production) | Years | 4.6 | 4.8 | ||
1 Represents first five years at full concentrator production.
2 Phase II production is projected to commence in Year 3 of operations.
3 Cu Eq recovered payable metal, is based on prices shown in Table 1‑4, mill recovery assumptions shown in Table 15‑3 and HydroMet Phase II recoveries shown in Table 13‑14.
4 The 15th year is not a full year of production.
| M3-PN150164 26 March 2018 |
245
NorthMet Project
Form NI 43-101F1 Technical Report
Table 24‑5: 118,000 STPD Economic Highlights
| Phase I | Phase I & II | ||||
| Units | First 5 Yrs 1 | LOM | LOM 2 | ||
| Life of Mine | Yrs | 194 | 194 | ||
| Material Mined | Mt | 767 | 2,366 | 2,366 | |
| Mill Feed Mined | Mt | 212 | 730 | 730 | |
| Waste: Mill Feed Ratio | 2.6 | 2.2 | 2.2 | ||
| Mill Feed Grade | |||||
| Copper | % | 0.292 | 0.268 | 0.268 | |
| Nickel | % | 0.084 | 0.076 | 0.076 | |
| Cobalt | ppm | 74 | 70 | 70 | |
| Palladium | ppm | 0.281 | 0.247 | 0.247 | |
| Platinum | ppm | 0.074 | 0.073 | 0.073 | |
| Gold | ppm | 0.038 | 0.037 | 0.037 | |
| Annual Payable Metal Produced | |||||
| Copper | mlb | 203.5 | 167.8 | 172.4 | |
| Nickel | mlb | 23.8 | 19.0 | 23.3 | |
| Cobalt | mlb | 1.01 | 0.80 | 0.83 | |
| Palladium | koz | 163.5 | 129.7 | 170.9 | |
| Platinum | koz | 28.0 | 26.0 | 38.5 | |
| Gold | koz | 7.8 | 7.6 | 11.6 | |
Copper Equivalent3 | mlb | 336.9 | 275.6 | 309.5 | |
| Cash Costs: by-product | $/lb Cu | 0.56 | 0.85 | 0.39 | |
| Cash Costs: Cu equivalent | $/lb CuEq | 1.61 | 1.78 | 1.64 | |
| Development Capital | $M | 1,614 | 1,614 | 1,872 | |
| Sustaining Capital | $M | 226 | 900 | 900 | |
| Annual Revenue | $M | 1085 | 887 | 997 | |
| Annual EBITDA | $M | 542 | 397 | 488 | |
NPV7 | $M | 1737 | 2243 | ||
| IRR | % | 21.9 | 23.6 | ||
| Payback (from first production) | Years | 4.1 | 4.1 | ||
1 Represents first five years at full concentrator production.
2 Phase II production is projected to commence in Year 3 of operations.
3 Cu Eq recovered payable metal, is based on prices shown in Table 1‑4, mill recovery assumptions shown in Table 15‑3 and HydroMet Phase II recoveries shown in Table 13‑14.
4 The 20th year is not a full year of production.
The foregoing economic analyses of the 59,000 STPD and 118,000 STPD scenarios is of a preliminary economic assessment level, is preliminary in nature and includes mineral resources that are considered too speculative geologically to have economic considerations applied to them that would enable them to be categorized as mineral reserves, and there is no certainty the preliminary economic assessment would be realized.
Metal price sensitivity data for the 59,000 STPD and 118,000 STPD cases for Phase I and Phase I & II are shown in Table 24‑6 through Table 24‑9.
| M3-PN150164 26 March 2018 |
246
NorthMet Project
Form NI 43-101F1 Technical Report
Table 24‑6: Metal Price Sensitivity Analysis for 59,000 STPD Phase I
| Sensitivity | |||
| Base -10% | Base Case | Base +10% | |
| Metal Prices | |||
| Copper $/lb | 2.90 | 3.22 | 3.54 |
| Nickel $/lb | 7.16 | 7.95 | 8.75 |
| Cobalt $/lb | 18.61 | 20.68 | 22.75 |
| Palladium $/oz | 875 | 973 | 1,070 |
| Platinum $/oz | 1,015 | 1,128 | 1,241 |
| Gold $/oz | 1,177 | 1,308 | 1,439 |
| Silver $/oz | 17.03 | 18.92 | 20.81 |
| Financial Summary | |||
| Pre-tax | |||
| IRR % | 13.6 | 18.7 | 23.2 |
| NPV discounted at 7% - $M | 445 | 854 | 1,292 |
| Post-tax | |||
| IRR % | 12.7 | 17.5 | 21.7 |
| NPV discounted at 7% - $M | 385 | 751 | 1,089 |
| First 5 Years (2 -6) | |||
| Average gross revenue $M | 535 | 595 | 654 |
| Average EBITDA $M | 249 | 307 | 364 |
Table 24‑7: Metal Price Sensitivity Analysis for 59,000 STPD Phase I and II
| Sensitivity | |||
| Base -10% | Base Case | Base +10% | |
| Metal Prices | |||
| Copper $/lb | 2.90 | 3.22 | 3.54 |
| Nickel $/lb | 7.16 | 7.95 | 8.75 |
| Cobalt $/lb | 18.61 | 20.68 | 22.75 |
| Palladium $/oz | 875 | 973 | 1,070 |
| Platinum $/oz | 1,015 | 1,128 | 1,241 |
| Gold $/oz | 1,177 | 1,308 | 1,439 |
| Silver $/oz | 17.03 | 18.92 | 20.81 |
| Financial Summary | |||
| Pre-tax | |||
| IRR % | 14.9 | 19.8 | 24.2 |
| NPV discounted at 7% - $M | 647 | 1,115 | 1,582 |
| Post-tax | |||
| IRR % | 14.1 | 18.5 | 22.4 |
| NPV discounted at 7% - $M | 567 | 963 | 1,346 |
| First 5 Years (3 -7) | |||
| Average gross revenue $M | 609 | 676 | 744 |
| Average EBITDA $M | 303 | 369 | 434 |
| M3-PN150164 26 March 2018 |
247
NorthMet Project
Form NI 43-101F1 Technical Report
Table 24‑8: Metal Price Sensitivity Analysis for 118,000 STPD Phase I
| Sensitivity | |||
| Base -10% | Base Case | Base +10% | |
| Metal Prices | |||
| Copper $/lb | 2.90 | 3.22 | 3.54 |
| Nickel $/lb | 7.16 | 7.95 | 8.75 |
| Cobalt $/lb | 18.61 | 20.68 | 22.75 |
| Palladium $/oz | 875 | 973 | 1,070 |
| Platinum $/oz | 1,015 | 1,128 | 1,241 |
| Gold $/oz | 1,177 | 1,308 | 1,439 |
| Silver $/oz | 17.03 | 18.92 | 20.81 |
| Financial Summary | |||
| Pre-tax | |||
| IRR % | 17.6 | 23.4 | 28.7 |
| NPV discounted at 7% - $M | 1,198 | 2,019 | 2,841 |
| Post-tax | |||
| IRR % | 16.5 | 21.9 | 26.6 |
| NPV discounted at 7% - $M | 1,036 | 1,737 | 2,412 |
| First 5 Years (2 -6) | |||
| Average gross revenue $M | 976 | 1,085 | 1,193 |
| Average EBITDA $M | 436 | 542 | 647 |
Table 24‑9: Metal Price Sensitivity Analysis for 118,000 STPD Phase I and II
| Sensitivity | |||
| Base -10% | Base Case | Base +10% | |
| Metal Prices | |||
| Copper $/lb | 2.90 | 3.22 | 3.54 |
| Nickel $/lb | 7.16 | 7.95 | 8.75 |
| Cobalt $/lb | 18.61 | 20.68 | 22.75 |
| Palladium $/oz | 875 | 973 | 1,070 |
| Platinum $/oz | 1,015 | 1,128 | 1,241 |
| Gold $/oz | 1,177 | 1,308 | 1,439 |
| Silver $/oz | 17.03 | 18.92 | 20.81 |
| Financial Summary | |||
| Pre-tax | |||
| IRR % | 19.9 | 25.4 | 30.5 |
| NPV discounted at 7% - $M | 1,725 | 2,639 | 3,552 |
| Post-tax | |||
| IRR % | 18.6 | 23.6 | 28.1 |
| NPV discounted at 7% - $M | 1,483 | 2,243 | 2,979 |
| First 5 Years (3 -7) | |||
| Average gross revenue $M | 1,110 | 1,223 | 1,345 |
| Average EBITDA $M | 544 | 662 | 780 |
| M3-PN150164 26 March 2018 |
248
NorthMet Project
Form NI 43-101F1 Technical Report
| 25 | INTERPRETATION AND CONCLUSIONS |
| 25.1 | Introduction |
According to CIM definition standards for Mineral Resources and Mineral Reserves prepared by the CIM Standing Committee on Reserve Definitions and adopted by CIM Council on May 10, 2014, a Feasibility Study is a comprehensive technical and economic study of the selected development option for a mineral project. It includes appropriately detailed assessments of applicable Modifying Factors together with any other relevant operational factors and detailed financial analysis that are necessary to demonstrate, at the time of reporting, that extraction is reasonably justified (economically mineable). The results of the study may reasonably serve as the basis for a final decision by a proponent or financial institution to proceed with, or finance, the development of the project. The confidence level of the study will be higher than that of a Pre-Feasibility Study.
| 25.2 | Interpretation |
The QPs of this Report have reviewed the data for the Project and are of the opinion that the NorthMet Project meets the requirements for a Feasibility Study. Opinions from individual QPs on the sections of the Technical Report that they are responsible for (see Section 2 for responsibilities) are set out in the following subsections.
| 25.2.1 | Surface Rights, Royalties, and Mineral Tenure |
PolyMet is vested with fee simple, mineral, or possessory record title to, or an option to purchase, the NorthMet Project properties described in Section 4 of this Report, subject to the royalties, agreements, limitations and encumbrances described in Section 4.
| 25.2.2 | Geology and Mineralization |
The understanding of the regional and local geology with regards to the lithology, structure, alteration and mineralization for each of the mineralized zones and deposit types discussed in Sections 7 and 8 of this Report are sufficient to estimate the Mineral Resources and Mineral Reserves contained herein.
| 25.2.3 | Exploration |
The previous drilling exploration programs, along with the geologic mapping, geochemical and geophysical studies, and petrology and mineralogy research carried out to date, reasonably supports the defined mineral deposits. The potential for discovery of additional mineable prospects is limited but not completely closed off at depth. The potential for discovery of new bulk mineable resources is discussed in Section 9 of this Report.
| 25.2.4 | Drilling and Sampling |
The drilling methods, recovery, collar survey, downhole survey, and material handling for the samples used in the Mineral Resource and Mineral Reserve estimates for this Report are sufficient to support the Mineral Resource and Mineral Reserve estimates contained in this Report, subject to the assumptions and qualifications contained in Sections 10 and 11 of this Report.
| 25.2.5 | Data Verification |
The data used for estimating the Mineral Resources for the NorthMet deposit are adequate for the purposes of this Report and may be relied upon to report Mineral Resources and Mineral Reserves based on the conditions and limitations set out in Section 12 of this Report.
| M3-PN150164 26 March 2018 |
249
NorthMet Project
Form NI 43-101F1 Technical Report
| 25.2.6 | Metallurgy |
Metallurgical testing was conducted on samples from the NorthMet deposit for both the conventional concentrator (Beneficiation Plant) and the hydrometallurgical plant. Testing included extensive mineralogical studies and developmental metallurgical testing on various ore types from each of the deposits. The developmental metallurgical testing and analyses, detailed in Section 13 of this Report, supports the selection of the processes developed for both plants that proved successful when applied to the deposit, making it possible to design a phased plant as ore is mined subject to the conditions and limitations set out in Section 13 of this Report.
| 25.2.7 | Mineral Resources |
The Mineral Resource estimates in Section 14 of this Report are accurate to within the level of estimate required for categorization as Measured, Indicated, and Inferred Mineral Resources suitable for use in a Feasibility Study, subject to the conditions and limitations set out in Section 14 of this Report. These estimates were performed consistent with industry best practices and demonstrate reasonable prospects for economic extraction.
| 25.2.8 | Mineral Reserves |
A thorough review of the designs, schedules, risks, and constraints of the Project detailed within this Report and given that there is, in the opinion of the QP, a basis for an economically viable Project after taking into account mining, processing, metallurgical, infrastructure, economic, marketing, legal, environmental, social, governmental factors and other such modifying factors, thereby supporting the declaration of Mineral Reserves. Subject to the conditions and limitations in this Report, this Technical Report demonstrates that, as of the date of this Report, extraction can reasonably be justified. The term ‘Mineral Reserve’ does not necessarily signify that all governmental approvals have been received; it does signify that there are reasonable expectations that such approvals will be granted.
| 25.2.9 | Mine Plan and Schedule |
The mine plan and schedule detailed in Section 16 of this Report have been developed to maximize mining efficiencies, while utilizing the current level of geotechnical, hydrological, mining and processing information available and are, subject to the conditions and limitations set out in Section 16, sufficient to support the declaration of Mineral Reserves.
| 25.2.10 | Metallurgical Recovery |
The recovery methods including the major unit operations detailed in Section 17 of this Report comprise primary crushing, SAG and ball mill grinding, flotation for copper, nickel and pyrrhotite (PGM-bearing) mineral concentrates. The hydrometallurgical scheme presented in Section 17 for the hydrometallurgical plant is sufficient to demonstrate recoveries for copper, nickel and PGMs. These plant designs and the engineering behind them support the mine planning and economics detailed herein, and the declaration of Mineral Reserves.
| 25.2.11 | Infrastructure |
The infrastructure detailed in Section 18 of this Report, including the FTB, the WWTS, Dunka mine access road, power line upgrades, and other utilities are designed and cost estimated to a level of detail that supports Project viability and the economics detailed herein.
| 25.2.12 | Market Studies and Contracts |
The concentrate market studies detailed in Section 19 of this Report are consistent with industry standards and market patterns, and are similar to contracts found throughout the world. The metal prices selected for copper, nickel, cobalt, and PGMs in this Report represent a forward-looking forecast based on professional mineral economists and banking industry research that supports a feasibility-level economic analysis.
| M3-PN150164 26 March 2018 |
250
NorthMet Project
Form NI 43-101F1 Technical Report
| 25.2.13 | Environment, Permits, and Social and Community Impacts |
Section 20 of this Report summarizes the reasonable available information on: environmental studies conducted to date and the related known environmental issues associated with the Project, the Project related social and community impacts, the Project permitting requirements, and the requirements and plans for waste rock and tailings storage. Additionally, mine closure, reclamation and mitigation are discussed and cost estimated to a level of detail that supports Project economic and technical viability to the level of a Feasibility Study and the economics detailed herein.
| 25.2.14 | Capital and Operating Costs |
The capital and operating costs detailed in Section 21 of this Report, which were derived from several previous Sections, are designed and cost-estimated to a level of detail that supports Project economic and technical viability to the level of a Feasibility Study and the economics detailed herein.
| 25.2.15 | Economic Analysis |
The economic analysis presented in Section 22 of this Report illustrates that the Project economics, subject to the conditions and limitations in this Report, are positive and can support estimation of Mineral Reserves and the demonstration of technical and economic viability to the level of a Feasibility Study.
25.3 CONCLUSIONS
The financial analysis presented in Section 22 demonstrates that the NorthMet Project is technically viable and has the potential to generate positive economic returns based on the assumptions and conditions set out in this Report. This conclusion warrants continued work to advance the Project to the next level of engineering and development which is basic engineering and long lead procurement of mine and plant equipment.
The QPs of this Report are not aware of any unusual, significant risks or uncertainties that could be expected to affect the reliability or confidence in the Project based on the data and information available to date.
25.4 RISKS
As with most projects at the feasibility level, there continues to be risks that could affect the economic potential of the Project as described in Table 25‑1. Many of the risks relate to the need for additional field information, laboratory testing, or engineering to confirm the assumptions and parameters used in this Report. External risks are, to a certain extent, beyond the control of the Project proponents and are much more difficult to anticipate and mitigate, although, in many instances, some risk reduction can be achieved.
| M3-PN150164 26 March 2018 |
251
NorthMet Project
Form NI 43-101F1 Technical Report
Table 25‑1: Project Risks Identified for the Feasibility Study
| Risk | Explanation / Potential Impact | Possible Risk Mitigation | |
| General Risks Common to the Mining Industry | |||
| GR1 | CAPEX and OPEX | The ability to achieve the estimated CAPEX and OPEX costs are important elements of Project success. If OPEX increases, then the mining cut-off grade would increase and, all else being equal, the size of the optimized pit would reduce, yielding fewer mineable tons. | Further cost estimation accuracy with the next level of study, as well as the active investigation of potential cost-reduction measures would assist in the accuracy of cost estimates. |
| GR2 | Permit Acquisition or Delay | The ability to secure all of the permits to build and operate the Project is of paramount importance. Failure to secure the necessary permits could stop or delay the Project. | The development of close relationship with local communities, other stakeholders. Continue to work with government regulators to obtain final permits that are consistent with the draft permits. |
| GR3 | Ability to Attract Experienced Professionals | The ability of PolyMet to attract and retain competent, experienced professionals is a key success factor for the Project. High turnover or the lack of appropriate technical and management staff and qualified operators at the Project could result in difficulties meeting Project goals. | The early search for, and retention of, professionals may help identify and attract critical people. |
| GR4 | Falling Metal Prices | A drop-in metal prices during the mine development process could have a negative impact on the profitability of the operation, especially in the critical first years. | Begin construction when the outlook is good for price improvement and have mitigating strategies, such as hedging or purchase of puts, and supporting analyses to address the risk of a downturn. |
| GR5 | Change in Permit Standards, Processes, or Regulations | A change in standards, processes, or regulations can have a significant impact in project schedules, operation cost and capital cost. | Maintain relationships and continue to work with legislators and regulatory agencies to ensure that the project will meet applicable standards and obtain required permits. |
| NorthMet Project Specific Risks | |||
| PR1 | Loss of Copper into Ni Concentrate and vice versa | The flotation circuit design is based on sequential flotation (the flotation and removal of copper and nickel sulfides). The bulk flotation tailing is then processed to make the pyrrhotite concentrate. Clean concentrates are required to minimize concentrate penalties. | The NorthMet concentrator will have to be fine-tuned to produce good separations of copper and nickel and to prevent losses of these metals to the pyrrhotite concentrate. |
| PR2 | Metallurgical Recoveries | Changes to metallurgical assumptions could lead to reduced metal recovery and revenue, increased processing costs, and/or changes to the processing circuit design, which would all negatively impact the project economics. | Confirm pilot plant runs with larger samples sizes if available. |
| M3-PN150164 26 March 2018 |
252
NorthMet Project
Form NI 43-101F1 Technical Report
| Risk | Explanation / Potential Impact | Possible Risk Mitigation | |
| PR3 | Water Management | Water management is a critical component of the Project. While a comprehensive site‑wide water balance model, surface water model and groundwater model were used to design the containment, waste dumps, stockpiles, surface water diversions and interception systems, more field information will further improve the accuracy of the water balance, size diversion channels and settling ponds, design treatment facilities, and will help finalize comprehensive long-term closure designs. | Continue to collect and analyze on-site groundwater, surface water, and meteorological data to enhance hydrological knowledge of the site. |
| M3-PN150164 26 March 2018 |
253
NorthMet Project
Form NI 43-101F1 Technical Report
25.5 OPPORTUNITIESThere are many significant opportunities that could improve the economics, and/or schedule of the Project. The major opportunities that have been identified at this time are summarized in Table 25‑2. Further information and assessments are needed before these opportunities could be included in the Project economics. Taking advantage of these opportunities could also require additional environmental review and permitting.
The opportunities are separated into general opportunities common to the mining industry, and Project-specific opportunities unique to the NorthMet Project. The Project-specific opportunities are further categorized into three broad categories of potential to improve the Project Net Present Value (NPV); the categories, and a brief listing the opportunities, are provided below:
| · | In-pit conversion of Inferred Mineral Resources to Mineral Reserves, |
| · | Out of pit conversion of Inferred Mineral Resources to Mineral Reserves adjacent to the current Mineral Reserves, |
| · | In-pit conversion of unclassified material currently treated as waste rock to Mineral Reserves, |
| · | Additional assaying of legacy drill core will be undertaken to test for high PGM low sulfide mineralization, |
| · | Increase in throughput by expanding the Erie plant), |
| · | Deeper exploration for potential for higher grade mineral resources, |
| · | Metallurgical improvements that improve the Project economics, |
| · | Metals prices could improve, |
| · | Potential definition of cobalt as a critical mineral in US legislation, |
| · | Government funding towards off-site infrastructure, and |
| · | Utilizing and refurbishing used mining and process equipment to reduce CAPEX and development timelines. |
| M3-PN150164 26 March 2018 |
254
NorthMet Project
Form NI 43-101F1 Technical Report
Table 25‑2: Project Opportunities Identified for the Feasibility Study
| Opportunity | Explanation | Potential Benefit | |
| General Opportunities Common to the Mining Industry | |||
| GO1 | Permit Acquisition | In the same way that permit acquisition is a potential risk to the Project schedule, it may also be an opportunity. Acceleration of remediation would allow the construction schedule to move forward in time. | The opportunity to shorten the permitting schedule exists. |
| GO2 | Rising Metal Prices | Increases in metal prices, especially copper, nickel, and cobalt increase the revenue and Project economics. | Increased revenue increases financial factors. |
| GO3 | Reagent/Fuel Price Decreases | Reduction in reagent and consumable prices, especially lime, fuel, grinding media and reagents for the hydrometallurgical plant, has the potential to decrease operating costs and enhance the Project economics. | Lower OPEX may lead to higher net revenue and enhanced Project economics. |
| Project Specific Opportunities | |||
| PO1 | In-pit conversion of Inferred Mineral Resources to the Indicated category | Significant Inferred Mineral Resources exist in each of the Project deposits, including material within the Mineral Reserve pits; these Mineral Resources are currently treated as waste rock. Conversion of Inferred Mineral Resources within the Mineral Reserve pits to the Measured and Indicated Mineral Resources categories could increase Mineral Reserves, reduce strip ratios and improve overall Project economics. | A tabulation of the Inferred Mineral Resources within the 59,000 STPD case pits, using a cutoff grade of $7.98/ton NSR, results in contained mineralization above cutoff, 6.7million tons containing approximately 16.8 ktons of copper, 4.9 ktons of Nickel, and 976,600 lbs of cobalt at average grades of 0.250% Cu, 0.0.073% Ni and 73 ppm Co. 100% conversion of this mineralization to Mineral Reserves would reduce the Project strip ratio from 1.47:1 to 1.40:1. |
| PO2 | Out of pit conversion of Inferred Mineral Resources to the Indicated category | Additional drilling in the vicinity of the NorthMet pits has the potential of increasing the grade and tonnage of the Mineral Reserves by (a) converting above cutoff Inferred Mineral Resources to Indicated, (b) supporting expanded pits that bring current above cutoff Indicated Mineral Resources outside the pits into Mineral Reserves and (c) adding new above cutoff mineralization in currently under-drilled areas. | Increases in Mineral Reserve tonnages, especially at higher grades, could improve the Project economics, especially if those improvements could be realized in the early stages of development. |
| PO3 | Higher Throughput | PolyMet has begun to explore the economies of scale for a higher throughput for the project (See Section 24.2). Cases for 59,000 STPD within the current NorthMet permit footprint and 118,000 STPD extending outside the current NorthMet permit footprint have been investigated at a PEA level only. | The economies of scale permit lowering of the cutoff grade allowing more material to be processed and lower overall operating costs, resulting in a higher NPV and IRR. |
| PO4 | Carrying out passive treatment studies | PolyMet is investigating passive treatment studies regarding the management of mine water. | If mine water can be effectively treated with a passive system, financial assurance costs could be reduced. |
| M3-PN150164 26 March 2018 |
255
NorthMet Project
Form NI 43-101F1 Technical Report
| 26 | RECOMMENDATIONS |
This section describes recommendations for further work and includes the following:
PolyMet should proceed with final design engineering and initiate asset preservation and demolition activities of the Erie Plant as soon as permitting allows.
Prior to construction of the NorthMet Project, PolyMet should:
| · | Review and update the scope of the Project design to reflect changes resulting from the permitting process, if any, and other Project enhancements. |
| · | Select a water treatment plant design and supply provider once the final permits are in place. |
| · | Complete basic engineering on all designs, and initiate detailed design. |
| · | Establish construction contracts formats. |
| · | Establish documents that will be used for all equipment purchases. |
| · | Finalize permitting activities. |
Other recommendations for further work resulting from this and the scoping-level expansion study include the potential for expansion and increasing mine mineralized material production.
The NorthMet resource base and the geometry of the deposits could allow for an increase in mineralized material tonnage. Section 24 details these resources and possible expansion and ramp-up scenarios. The following are recommendations to pursue expansion of the mine and maximize throughput and economic value.
| · | Commence a NI-43-101 Pre-feasibility Study to increase the level of accuracy of the capital and operating estimates presented in Section 24. |
| · | Design general arrangement drawings of the plant area to develop more accurate material take-offs for both the maximum and ramp-up throughput capital cost estimates. |
| · | Update the financial model based on any changes to the current capital and operating cost estimates and to reflect current metal prices. Metal prices and terms for mine planning purposes may not be reflective of the prices presented in this report at the commencement of mining. |
| · | M3 recommends reviewing the design of the WWTS with respect to the building costs and construction schedule. |
| · | Design an infill drilling program on inferred resources in an attempt to move inferred into the measured and indicated classification. |
The cost of performing this work to a pre-feasibility level is estimated to be approximately $500,000.
| M3-PN150164 26 March 2018 |
256
NorthMet Project
Form NI 43-101F1 Technical Report
| 27 | REFERENCES |
AGP Mining Consultants Inc., 2013. Updated NI 43-101 Technical Report on the NorthMet Deposit, Minnesota, USA. Prepared for PolyMet Mining Corp. Amended 14 January 2013.
Bateman Engineering Pty Ltd., 2006. Definitive Feasibility Study PolyMet Mining Corp. Volume 1. NorthMet Project Minnesota, USA
Bloom, L, Review of the PolyMet 2005-2006 Quality Control Program, unpublished report, Report Date August 2006
Bright, K., 2000: Memo to S Gatehouse. History of prep of the PolyMet project in Minnesota. ALS Chemex.
Canadian Institute of Mining, Metallurgy and Petroleum (“CIM”), 2014 “CIM Definition Standards - For Mineral Resources and Mineral Reserves.”
Canadian National Instrument 43-101, 24 June 2011. Standards of Disclosure for Mineral Projects (NI 43-101).
Gatehouse, S., 2000: Interim QC report. Internal Memo, North Ltd. Status Report on NorthMet Sampling and Assays 28/6/2000.
Geerts, S.D., 1991: Geology, stratigraphy, and mineralization of the Dunka Road Cu-Ni prospect, northeastern Minnesota: Natural Resources Research Institute, University of Minnesota Duluth, Technical Report, NRRI/TR-91/14, 63 p.
Geerts, S.D., 1994: Petrography and geochemistry of a platinum group element-bearing mineralized horizon in the Dunka Road prospect (Keweenawan) Duluth Complex northeastern Minnesota: Unpublished M.S. Thesis, University of Minnesota Duluth, 155 p., 8 plates.
Geerts, S.D., Barnes, R.J., and Hauck, S.A., 1990: Geology and mineralization in the Dunka Road copper-nickel mineral deposit, St. Louis County, Minnesota: Natural Resources Research Institute, University of Minnesota Duluth, Technical Report, NRRI/GMIN-TR-89-16, 69 pp.
Golder Associates Ltd., 2006. Recommendations for NorthMet Open Pit Rock Slope Designs NorthMet Mine Project. prepared for PolyMet Mining Corp.
Hazen Research Inc., 2015. Drop weight test report on a single sample from confidential client. Hazen job no. 12057. Golden, Colorado, USA.
Hauck, S.A., Severson, M.J., Zanko, L., Barnes, S.-J., Morton, P., Alminas, H., Foord, E.E., and Dahlberg, E.H., 1997, An overview of the geology and oxide, sulfide, and platinum group element mineralization along the western and northern contacts of the Duluth Complex: in Ojakangas, R.W., Dickas, A.B., and Green, J.C., eds., Middle Proterozoic to Cambrian Rifting, Central North America: Boulder, Geological Society of America Special Paper 312, p. 137-185.
Hay, Martyn. 2015. NorthMet deposit: Analysis of flotation kinetics and flotation performance. Report NM 1/2015. Eurus Mineral Consultants.
Hard Rock Consulting, 2012. Updated technical report on the NorthMet deposit. Unpublished report.
| M3-PN150164 26 March 2018 |
257
NorthMet Project
Form NI 43-101F1 Technical Report
Hellman & Schofield Pty Ltd., 2005, Mineral resource update, NorthMet poly-metallic deposit, Minnesota, USA. NI 43-101, available on-line at www.sedar.com.
IMC, April 2001, 'NorthMet Project, Minnesota, Pre-Feasibility Study', prepared for PolyMet Mining Corp.
M3, PolyMet NI 43-101 Technical Report - Supplemental Information (2018), prepared for PolyMet Mining Corp.
Miller, J.D., Jr., Green, J.C., Severson, M.J., Chandler, V.W., and Peterson, D.M., 2001, Geologic map of the Duluth Complex and related rocks, northeastern Minnesota: Minnesota Geological Survey Miscellaneous Map 119, Scale 1: 200,000.
Miller, J.D., Jr., Green, J.C., Severson, M.J., Chandler, V.W., Hauck, S.A., Peterson, D.M., and Wahl, T.E., 2002, Geology and Mineral Potential of the Duluth Complex and related rocks of northeastern Minnesota: Minnesota Geological Survey Report of Investigations 58, 207 p., one CD-ROM.
Orway Mineral Consultants, 2014. NorthMet grinding circuit design. Report No. 7572 Final. Prepared for PolyMet Mining Inc.
Pancoast, L., 1991, 1991 Dunka Road metallurgical drill program, Nerco Exploration Company, unpublished company report, 12 pages, plus drill logs and analytical sheets.
Patelke, R.L., 2001, NorthMet (former USS Dunka Road) Cu-Ni deposit drill hole geochemical (assay) sampling: Phase II: Natural Resources Research Institute, University of Minnesota Duluth, Technical Report, NRRI/TR-2001/05, 26 p., 1 CD-ROM.
Patelke, R.L., 2003, Exploration drill hole lithology, geologic unit, copper-nickel assay, and location database for the Keweenawan Duluth Complex, northeastern Minnesota: Natural Resources Research Institute, University of Minnesota Duluth, Technical Report, NRRI/TR-2003/21, 97 pages, 1 CD-ROM.
Patelke, R.L., and Geerts, S.D.M., 2006, PolyMet NorthMet Drill Hole / Geological Database Recompilation: Location, Downhole Survey, Assay, Lithology, Geotechnical Data, and Related Information, 2004 to 2006. PolyMet Mining Inc. Internal report, 86 p.
Patelke R.L., and Severson, M.J., 2006, A history of copper-nickel and titanium oxide test pits, bulk samples, and related metallurgical testing in the Keweenawan Duluth Complex, northeastern Minnesota, Natural Resources Research Institute, University of Minnesota Duluth, Technical Report, NRRI/TR-2005, CD-ROM.
Peatfield, G.R., 1999: technical review report on the NorthMet Cu-Ni-PGE project, St Louis County, Minnesota, USA. September 1999.
Schulz, K.J., Woodruff, L.G., Nicholson, S.W., Seal, R.R., II, Piatak, N.M., Chandler, V.W., and Mars, J.L., 2014, Occurrence model for magmatic sulfide-rich nickel-copper-(platinum-group element) deposits related to mafic and ultramafic dike-sill complexes: U.S. Geological Survey Scientific Investigations Report 2010–5070–I, 80 p., <http://dx.doi.org/10.3133/sir20105070I>
Senet Engineering, 2016. NorthMet copper project: Feasibility study technical report. Revision 2.
Severson, M.J., 1988, Geology and structure of a portion of the Partridge River intrusion: A progress report: Natural Resources Research Institute, University of Minnesota Duluth, Technical Report, NRRI/GMIN-TR-88-08, Duluth, Minnesota, 78 p., 5 plates.
| M3-PN150164 26 March 2018 |
258
NorthMet Project
Form NI 43-101F1 Technical Report
Severson, M.J., and Hauck, S.A., 1990, Geology, geochemistry, and stratigraphy of a portion of the Partridge River intrusion: Natural Resources Research Institute, University of Minnesota Duluth, Technical Report, NRRI/GMIN-TR-89-11, 235 p., 4 plates, 1 diskette.
Severson, M.J., and Hauck, S.A., 1997, Igneous stratigraphy and mineralization in the basal portion of the Partridge River intrusion, Duluth Complex, Allen Quadrangle, Minnesota: University of Minnesota Duluth, Natural Resources Research Institute, Technical Report, NRRI/TR-97/19, 102 p.
Severson, M. J. and Heine, John J., 2007, Data compilation of United States Steel Corporation (USSC) exploration records in Minnesota, Technical Report NRRI/TR-2007/25, Project Nos. 1663-187-6569 1896-783-1222 Natural Resources Research Institute University of Minnesota Duluth.
Severson, M.J., and Zanko, L.M., 1996, Geologic map of the Dunka Road deposit, Duluth Complex, northeastern Minnesota: Natural Resources Research Institute, University of Minnesota Duluth, Confidential Technical Report (for Argosy-Fleck Resources), NRRI/TR-96/05, 26 p., 5 plates.
Severson, M.J, and Hauck, S.A., 1997, Igneous stratigraphy and mineralization in the basal portion of the Partridge River intrusion, Duluth Complex, Allen Quadrangle, Minnesota: Natural Resources Research Institute, University of Minnesota Duluth, Technical Report, NRRI/TR-97/19, 102 p., 4 plates, 1 diskette.
Severson, M.J., and Miller, J.D. Jr., 1999, Bedrock geologic map of Allen Quadrangle: Minnesota Geological Survey, Miscellaneous Map —91, 1: 24,000. Severson, M.J., Zanko, L.M., and Jahn, W., 2000, NorthMet (former USS Dunka Road) Cu-Ni deposit drill hole geochemical sampling, density determinations, and geology revisited: Natural Resources Research Institute, University of Minnesota Duluth, Technical Report, NRRI/TR-2000/31, 136 p., 8 plates, 1 CD-ROM.
Severson, M.J., Zanko, L.M., and Jahn, W., 2000, NorthMet (former USS Dunka Road) Cu-Ni deposit drill hole geochemical sampling, density determinations, and geology revisited: Natural Resources Research Institute, University of Minnesota Duluth, Technical Report, NRRI/TR-2000/31, 136 p., 8 plates, 1 CD-ROM.
SGS, 2006. The Recovery of Base and Precious Metals from NorthMet Concentrates by the PLATSOL™ Process (Additional Autoclave Pilot Run) Project 11263-001 Report No. 2 (May 1, 2006)
SGS Lakefield Research Limited, 2006. PolyMet PGM Recovery Processes Bench Program – Phase 3 Project 10914-003/11044-001/11044-004 - Report No 5 (February 9, 2006).
SGS Minerals/SGS Canada Inc., 2005. Upgrading of PolyMet’s PGM Concentrate, Letter Report, Project 11044-003 Letter Report (Nov. 21, 2005).
SGS Mineral Services, 2010. An investigation into the evaluation of a flowsheet variation for the NorthMet mineralization. Prepared for PolyMet Mining Corp. Project no. 11603-006-Final report.
SGS Mineral Services, 2015. An investigation into flotation test work on NorthMet ore to generate flotation rate data. Prepared for PolyMet Mining Corp. Project no. 15135-001-Final Report.
SGS Mineral Services, 2015. An Investigation into PLATSOL™ Processing of The NorthMet Deposit. Prepared for PolyMet Mining Corp. Project no. 12269-001-Final report.
| M3-PN150164 26 March 2018 |
259
NorthMet Project
Form NI 43-101F1 Technical Report
Theriault, Stephanie Ann. 2011. Mineralogy, spatial distribution, and isotope geochemistry of sulfide minerals in the Biwabik Iron Formation. Retrieved from the University of Minnesota Digital Conservancy, http://hdl.handle.net/11299/118089.
UMD Labovitz School of Business and Economics, 2009. The Economic Impact of Ferrous and Non-Ferrous Mining on the State of Minnesota And on the Arrowhead Region and Douglas County, WI. March 2009. Made for the Minnesota Department of Employment and Economic Development, Minnesota Power, Natural Resources Research Institute, University of Minnesota, Iron Range Resources, Iron Mining Association of Minnesota, and Mining Minnesota. https://lsbe-apps.d.umn.edu/departments/bber/projects/2009MNMiningImpact.pdf
USFS, 2015, Draft ROD on the NorthMet Mining Project and Land Exchange FEIS. http://a123.g.akamai.net/7/123/11558/abc123/forestservic.download.akamai.com/11558/www/nepa/72870_FSPLT3_2582016.pdf).
| M3-PN150164 26 March 2018 |
260
NorthMet Project
Form NI 43-101F1 Technical Report
APPENDIX A – PROFESSIONAL QUALIFICATIONS AND CERTIFICATES OF QUALIFIED PERSONS
| M3-PN150164 26 March 2018 |
261
NorthMet Project
Form NI 43-101F1 Technical Report
CERTIFICATE OF QUALIFIED PERSON
Zachary J. Black
I, Zachary J. Black, SME-RM, do hereby certify that:
| 1. | I am currently employed as Principal Resource Geologist by: |
Hard Rock Consulting, LLC
7114 W. Jefferson Ave., Ste. 308
Lakewood, Colorado 80235 USA
| 2. | I am a graduate of the University of Nevada, Reno with a Bachelor of Science in Geological Engineering, and have practiced my profession continuously since 2005. |
| 3. | I am a registered member of the Society of Mining and Metallurgy and Exploration (No. 4156858RM) |
| 4. | I have worked as a Geological Engineer/Resource Geologist for a total of twelve years since my graduation from university; as an employee of a major mining company, a major engineering company, and as a consulting engineer with extensive experience in structurally controlled precious and base metal deposits. |
| 5. | I have read the definition of “qualified person” set out in National instrument 43-101 (“NI 43-101”) and certify that by reason of my education, affiliation with a professional association (as defined in NI 43-101) and past relevant work experience, I fulfill the requirements to be a “qualified person” for the purposes of NI 43-101. |
| 6. | I am responsible for the Sections 1.3, 1.4, 1.6, 7,8, 9, 10, 11, 12, 14, 23, 25.2.2, 25.2.3, 25.2.4, 25.2.5 and 25.2.7 of the technical report titled “NorthMet Project Form NI 43-101F1 Technical Report” (the “Technical Report”), dated March 26, 2018, prepared for Poly Met Mining, Inc. (PolyMet US). |
| 7. | I have not had prior involvement with the property that is the subject of the Technical Report |
| 8. | I visited the NorthMet Site on May 16, 2017. |
| 9. | As of the date of this certificate, to the best of my knowledge, information and belief, the parts of the Technical Report for which I am responsible contain all scientific and technical information required to be disclosed to make the report not misleading. |
| 10. | I am independent of the issuer applying all of the tests in Section 1.5 of National Instrument 43-101. |
| 11. | I have read National Instrument 43-101 and Form 43-101F1, and the Technical Report has been prepared in compliance with that instrument and form. |
| 12. | I consent to the filing of the Technical Report with any stock exchange and other regulatory authority and any publication by them for regulatory purposes, including electronic publication in the public company files on their websites accessible by the public, of the Technical Report. |
Signed and dated this 26th day of March 2018.
(Signed) (Sealed) Zachary J. Black
Signature of Qualified Person
Zachary J. Black
Print name of Qualified Person
| M3-PN150164 26 March 2018 |
262
NorthMet Project
Form NI 43-101F1 Technical Report
CERTIFICATE OF QUALIFIED PERSON
Jennifer J. Brown
I, Jennifer J. Brown, do hereby certify that:
| 1. | I am currently employed as a Director of Geology and Exploration by: |
Hard Rock Consulting, LLC
7114 W. Jefferson Ave., Ste. 308
Lakewood, Colorado 80235 U.S.A.
| 2. | I am a graduate of the University of Montana and received a Bachelor of Arts degree in Geology in 1996. |
| 3. | I am a: |
| · | Licensed Professional Geologist in the State of Wyoming (PG-3719) |
| · | Registered Professional Geologist in the State of Idaho (PGL-1414) |
| · | Registered Member of the Society for Mining, Metallurgy, and Exploration, Inc. (4168244RM) |
| 4. | I have worked as a geologist for a total of 20 years since graduation from the University of Montana, as an employee of various engineering and consulting firms and the U.S.D.A. Forest Service. I have more than 10 collective years of experience directly related to mining and or economic and saleable minerals exploration and resource development, including geotechnical exploration, geologic analysis and interpretation, resource evaluation, and technical reporting. |
| 5. | I have read the definition of “qualified person” set out in National Instrument 43-101 (“NI 43-101”) and certify that by reason of my education, affiliation with a professional association (as defined in NI 43-101) and past relevant work experience, I fulfill the requirements to be a “qualified person” for the purposes of NI 43-101. |
| 6. | I am responsible for the Section 6 of the technical report titled “NorthMet Project Form NI 43-101F1 Technical Report” (the “Technical Report”), dated March 26, 2018, prepared for Poly Met Mining, Inc., (PolyMet US). |
| 7. | As of the date of this certificate and as of the effective date of the Technical Report, to the best of my knowledge, information and belief, the Technical Report contains all scientific and technical information required to be disclosed to make the report not misleading. |
| 8. | I have read National Instrument 43-101 and Form 43-101F1, and the Technical Report has been prepared in compliance with that instrument and form. |
| 9. | I am independent of the issuer applying all of the tests in section 1.5 of NI 43-101, and have had no prior involvement with the property that is the subject of the Technical Report. |
| 10. | I consent to the filing of the Technical Report with any stock exchange and other regulatory authority and any publication by them for regulatory purposes, including electronic publication in the public company files on their websites accessible by the public, of the Technical Report. |
Signed and dated this 26th day of March 2018.

| (Signed) (Sealed) Jennifer J. (J.J.) Brown |
Signature of Qualified Person
| Jennifer J. (J.J.) Brown |
Print name of Qualified Person
| M3-PN150164 26 March 2018 |
263
NorthMet Project
Form NI 43-101F1 Technical Report
CERTIFICATE OF QUALIFIED PERSON
Nicholas Dempers
I, Nicholas Dempers, do hereby certify that:
| 1. | I am a Principal Process Engineer at SENET (Pty) Ltd, Building 12, Greenstone Hill Office Park, Emerald Boulevard, Greenstone Hill, Greenstone 1609, Modderfontein, Gauteng, South Africa, and have been employed in this position since 2015. |
| 2. | I graduated with a BSc Chemical Engineering from the University of Cape Town in 1998. In addition, I have also obtained a MSc Chemical Engineering Degree from the University of Cape Town in 2000 and a BCom from the University of South Africa in 2007. |
| 3. | I am a Professional Engineer with Engineering Council of South Africa (Reg. No. 20150196), and I am fellow of the Sothern African Institute of Mining and Metallurgy (SAIMM). |
| 4. | I am a practicing Process Engineer/Metallurgist and have practiced my profession continuously since 2001. I have over 15 years’ experience in the minerals industry. I have been involved in the process operation (production) and plant design, from conceptualization to complete project execution, of more than 10 mineral process projects, as well as more than five process plant studies for major commodities including cobalt, copper, gold, uranium and platinum group metals (PGMs). |
| 5. | I have read the definition of “qualified person” set out in National instrument 43-101 (“NI 43-101”) and certify that by reason of my education, affiliation with a professional association (as defined in NI 43-101) and past relevant work experience, I fulfill the requirements to be a “qualified person” for the purposes of NI 43-101. |
| 6. | I am responsible as Qualified Person for Sections 13.1-13.5, 17.1, 17.2, 18.7, 18.9, 21, 21.2.2, 21.2.3, 24.2, 25.2.6 and 25.2.10 of the technical report titled, “NorthMet Project Form NI 43-101F1 Technical Report” (the “Technical Report”) dated March 26, 2018. |
| 7. | I have had prior involvement with the property that is the subject of the Technical Report. |
| 8. | I visited the NorthMet Site on March 1, 2018. |
| 9. | As of the date of this certificate, to the best of my knowledge, information and belief, the parts of the Technical Report for which I am responsible contain all scientific and technical information required to be disclosed to make the report not misleading. |
| 10. | I am independent of the issuer applying all of the tests in Section 1.5 of National Instrument 43-101. |
| 11. | I have read National Instrument 43-101 and Form 43-101F1, and the Technical Report has been prepared in compliance with that instrument and form. |
| 12. | I consent to the filing of the Technical Report with any stock exchange and other regulatory authority and any publication by them for regulatory purposes, including electronic publication in the public company files on their websites accessible by the public, of the Technical Report. |
Signed and dated this 26th day of March 2018.
(Signed) (Sealed) Nicholas Dempers
Signature of Qualified Person
Nicholas Dempers
Print name of Qualified Person
| M3-PN150164 26 March 2018 |
264
NorthMet Project
Form NI 43-101F1 Technical Report
CERTIFICATE OF QUALIFIED PERSON
Thomas L. Drielick
I, Thomas L. Drielick, P.E., do hereby certify that:
| 1. | I am currently employed as Sr. Vice President by: |
M3 Engineering & Technology Corporation
2051 W. Sunset Rd., Suite 101
Tucson, Arizona 85704 U.S.A.
| 2. | I am a graduate of Michigan Technological University and received a Bachelor of Science degree in Metallurgical Engineering in 1970. I am also a graduate of Southern Illinois University and received an M.B.A. degree in 1973. |
| 3. | I am a: |
| · | Registered Professional Engineer in the State of Arizona (No. 22958) |
| · | Registered Professional Engineer in the State of Michigan (No. 6201055633) |
| · | Member in good standing of the Society for Mining, Metallurgy and Exploration, Inc. (No 850920) |
| · | Member in good standing of AACE (Association for the Advancement of Cost Engineering) Internation, Inc. (No.05031). |
| 4. | I have practiced metallurgical and mineral processing engineering and project management for 47 years. I have worked for mining and exploration companies for 18 years and for M3 Engineering & Technology Corporation for 29 years. |
| 5. | I have read the definition of “qualified person” set out in National instrument 43-101 (“NI 43-101”) and certify that by reason of my education, affiliation with a professional association (as defined in NI 43-101) and past relevant work experience, I fulfill the requirements to be a “qualified person” for the purposes of NI 43-101. |
| 6. | I am responsible for the Sections 1.9, 19, 21, 21.1, 21.2.4, 21.2.5, 22, 25.2.12, 25.2.14 and 25.2.15 of the technical report titled “NorthMet Project Form NI 43-101F1 Technical Report” (the “Technical Report”), dated March 26, 2018, prepared for Poly Met Mining, Inc. (PolyMet US). |
| 7. | I have not had prior involvement with the property that is the subject of the Technical Report. |
| 8. | I have not visited the NorthMet Project site. |
| 9. | As of the date of this certificate, to the best of my knowledge, information and belief, the parts of the Technical Report for which I am responsible contain all scientific and technical information required to be disclosed to make the report not misleading. |
| 10. | I am independent of the issuer applying all of the tests in Section 1.5 of National Instrument 43-101. |
| 11. | I have read National Instrument 43-101 and Form 43-101F1, and the Technical Report has been prepared in compliance with that instrument and form. |
| 12. | I consent to the filing of the Technical Report with any stock exchange and other regulatory authority and any publication by them for regulatory purposes, including electronic publication in the public company files on their websites accessible by the public, of the Technical Report. |
Signed and dated this 26th day of March 2018.
(Signed) (Sealed) Thomas L. Drielick
Signature of Qualified Person
| M3-PN150164 26 March 2018 |
265
NorthMet Project
Form NI 43-101F1 Technical Report
Thomas L. Drielick
Print name of Qualified Person
| M3-PN150164 26 March 2018 |
266
NorthMet Project
Form NI 43-101F1 Technical Report
CERTIFICATE OF QUALIFIED PERSON
Art S. Ibrado
I, Art S. Ibrado, PhD, P.E., do hereby certify that:
| 1. | I am employed as a project manager and metallurgist at M3 Engineering & Technology Corp., 2051 W Sunset Rd, Suite 101, Tucson, AZ 85704, USA. |
| 2. | I hold the following academic degrees: |
| · | Bachelor of Science in Metallurgical Engineering, University of the Philippines, 1980 |
| · | Master of Science (Metallurgy), University of California at Berkeley, 1986 |
| · | Doctor of Philosophy (Metallurgy), University of California at Berkeley, 1993 |
| 3. | I am a registered professional engineer in the State of Arizona (No. 58140) and a Qualified Professional (QP) member of the Mining and Metallurgical Society of America (MMSA). |
| 4. | I have worked as a metallurgist in the academic and research setting for five years, excluding graduate school research, and in the mining industry for 13 years, before joining M3 Engineering in July 2009. |
| 5. | I have read the definition of “qualified person” set out in National Instrument 43-101 (“NI 43-101”) and certify that by reason of my education, affiliation with a professional association (as defined in NI 43-101) and past relevant experience, I fulfill the requirements to be a “qualified person” for the purposes of NI 43-101. |
| 6. | I am responsible for Sections 13.6, 17.3, 17.4, 17.5.1, 17.6, 25.2.6 and corresponding items of Section 1 of the technical report entitled, “NorthMet Project Form NI 43-101F1 Technical Report” (the “Technical Report”) dated March 26, 2018. |
| 7. | I have no prior involvement with the property that is subject of the Technical Report. |
| 8. | I have not visited the property that is proposed as the project site. |
| 9. | As of the date of this certificate, to the best of my knowledge, information and belief, the Technical Report contains all scientific and technical information that is required to be disclosed to make the Technical Report not misleading. |
| 10. | I am independent of Poly Met Mining, Inc. (PolyMet US) as defined by Section 1.5 of NI 43-101 and do not own any shares or stocks of the Company. |
| 11. | I have read National Instrument 43-101 and Form 43-101F1, and the Technical Report has been prepared in compliance with that instrument and form. |
| 12. | I consent to the filing of the Technical Report with any stock exchange and other regulatory authority and any publication by them for regulatory purposes, including electronic publication in the public company files on their website accessible by the public, of the Technical Report. |
Dated this 26th day of March 2018.
(Signed) (Sealed) Art S. Ibrado
Signature of Qualified Person
Art S. Ibrado, PhD, PE
Print name of Qualified Person
| M3-PN150164 26 March 2018 |
267
NorthMet Project
Form NI 43-101F1 Technical Report
CERTIFICATE OF QUALIFIED PERSON
Erin L. Patterson
I, Erin L. Patterson, P.E., do hereby certify that:
| 1. | I am currently employed as an Engineer by: |
M3 Engineering & Technology Corp.
2051 W Sunset Rd Suite 101
Tucson AZ 85704 USA
| 2. | I am a graduate of the University of Arizona and received a Bachelor of Science in Chemical Engineering in 2005. |
| 3. | I am a Registered Professional Engineer in the State of Arizona, License No. 54243. |
| 4. | I have worked as a process engineer and project manager for a total of 10 years. |
| 5. | I have read the definition of “qualified person” set out in National instrument 43-101 (“NI 43-101”) and certify that by reason of my education, affiliation with a professional association (as defined in NI 43-101) and past relevant work experience, I fulfill the requirements to be a “qualified person” for the purposes of NI 43-101. |
| 6. | I am responsible for the Sections 1.1, 1.2, 1.9, 1.10, 1.11, 2, 3, 4.1- 4.5, 4.7- 4.10, 5, 18.1-18.5, 18.8, 18.10, 24, 24.2, 25.1-25.2.1, 25.2.11, 25.3- 25.5, 26 and 27 of the technical report titled “NorthMet Project Form NI 43-101F1 Technical Report” (the “Technical Report”), dated March 26, 2018, prepared for Poly Met Mining, Inc. (PolyMet US). |
| 7. | I have not had prior involvement with the property that is the subject of the Technical Report. |
| 8. | I visited the NorthMet Project Site on October 11, 2017. |
| 9. | As of the date of this certificate, to the best of my knowledge, information and belief, the parts of the Technical Report for which I am responsible contain all scientific and technical information required to be disclosed to make the report not misleading. |
| 10. | I am independent of the issuer applying all of the tests in Section 1.5 of National Instrument 43-101. |
| 11. | I have read National Instrument 43-101 and Form 43-101F1, and the Technical Report has been prepared in compliance with that instrument and form. |
| 12. | I consent to the filing of the Technical Report with any stock exchange and other regulatory authority and any publication by them for regulatory purposes, including electronic publication in the public company files on their websites accessible by the public, of the Technical Report. |
Signed and dated this 26th day of March 2018.
(Signed) (Sealed) Erin L. Patterson
Signature of Qualified Person
Erin L. Patterson
Print name of Qualified Person
| M3-PN150164 26 March 2018 |
268
NorthMet Project
Form NI 43-101F1 Technical Report
CERTIFICATE OF QUALIFIED PERSON
Thomas J. Radue
I, Thomas J. Radue, do hereby certify that:
| 1. | I am currently employed as a Vice President and Senior Geotechnical Engineer with Barr Engineering Co. with an office at 4300 MarketPointe Drive, Suite 200, Minneapolis, Minnesota (USA) 55435. |
| 2. | I am a member of the Society of Mining Engineers and an associate member of the American Society of Civil Engineers. I graduated from: |
| · | the University of Wisconsin with a Bachelor of Science Degree in Civil Engineering in 1982, with study emphasis in Geotechnical and Structural engineering, |
| · | the University of Wisconsin with a Master of Science Degree in Civil and Environmental Engineering in 1985, with study emphasis in Geotechnical engineering, and |
| · | the University of Minnesota with a Master of Business Administration in 1999, with study emphasis in Strategy and Operations. |
| 3. | I am a duly Licensed Professional Engineer under the laws of the State of Minnesota, USA [License No. 20951. (Exp. Date 06/30/2018)]. |
| 4. | I have practiced my profession for 32 years. I have been directly involved in multiple projects, performing and managing conceptual, preliminary and detailed designs of industrial solid waste and mine tailings management facilities, and including construction specification, construction oversight, operations assistance and reclamation. |
| 5. | I have read the definition of “qualified person” set out in National instrument 43-101 (“NI 43-101”) and certify that by reason of my education, affiliation with a professional association (as defined in NI 43-101) and past relevant work experience, I fulfill the requirements to be a “qualified person” for the purposes of NI 43-101 as specifically related to industrial solid waste and mine tailings management and permitting in Minnesota. |
| 6. | I am responsible or co-responsible for the Sections 1.7, 1.8, 4.6, 16.3.3, 17.2.4, 17.5.2, 18.6, 20.1-20.6, 20.7 21, 21.1, 25.2.13 of the technical report titled, “NorthMet Project Form NI 43-101F1 Technical Report” (the “Technical Report”), dated March 26, 2018, prepared for Poly Met Mining, Inc. (PolyMet US). |
| 7. | Since 2005 I have acted as a consulting geotechnical engineer to PolyMet US in matters relating to the NorthMet Project. I have visited the NorthMet mine site and plant site on numerous occasions to participate in site walkovers for state and federal permitting agencies and their third-party contractors and/or representatives of environmental advocacy groups. I have visited the Study area on numerous occasions to conduct project meetings and tailings basin dam safety inspections. |
| 8. | My most recent visit to the Study area was on October 11, 2017. |
| 9. | As of the date of this certificate, to the best of my knowledge, information and belief, the parts of the Technical Report for which I am responsible contain all scientific and technical information required to be disclosed to make the report not misleading. |
| 10. | I am independent of PolyMet US as independence is described in Section 1.5 of National Instrument 43-101. |
| 11. | I have read National Instrument 43-101 and Form 43-101F1, and the sections of the Technical Report have been prepared in compliance with that instrument and form. |
| 12. | I consent to the filing of the Technical Report with any stock exchange and other regulatory authority and any publication by them for regulatory purposes, including electronic publication in the public company files on their websites accessible by the public, of the Technical Report. |
Signed and dated this 26th day of March 2018.
| M3-PN150164 26 March 2018 |
269
NorthMet Project
Form NI 43-101F1 Technical Report
(Signed) Thomas J. Radue
Signature of Qualified Person
Thomas J. Radue, P.E.
Print name of Qualified Person
| M3-PN150164 26 March 2018 |
270
NorthMet Project
Form NI 43-101F1 Technical Report
CERTIFICATE OF QUALIFIED PERSON
Jeff S. Ubl
I, Jeff S. Ubl, do hereby certify that:
| 1. | I am currently employed as a Senior Environmental Engineer with Barr Engineering Co. with an office at 4300 MarketPointe Drive, Suite 200, Minneapolis, Minnesota (USA) 55435. |
| 2. | I graduated from: |
| • | The University of Minnesota with a Bachelor of Science Degree in Civil Engineering in 1983. |
| 3. | I am a duly Licensed Professional Engineer under the laws of the State of Minnesota, USA [License No. 19646. (Exp. Date 06/30/2018)]. |
| 4. | I have practiced my profession for 32 years. I have been directly involved in multiple projects, performing and managing conceptual, preliminary and detailed designs of industrial solid waste and wastewater treatment facilities. These activities have included final design and construction specification, construction oversight, and operations assistance. |
| 5. | I have read the definition of “qualified person” set out in National instrument 43-101 (“NI 43-101”) and certify that by reason of my education (as defined in NI 43-101) and past relevant work experience, I fulfill the requirements to be a “qualified person” for the purposes of NI 43-101 as specifically related to wastewater treatment and permitting in Minnesota. |
| 6. | I am responsible or co-responsible for Section 18.7 of the technical report titled, “NorthMet Project Form NI 43-101F1 Technical Report Feasibility Study” (the “Technical Report”), dated March 26, 2018, prepared for Poly Met Mining, Inc. (PolyMet US). |
| 7. | Since 2007 I have acted as a consulting wastewater engineer to PolyMet Mining, Inc. (PolyMet) in matters relating to the NorthMet Project. |
| 8. | As of the date of this certificate, to the best of my knowledge, information and belief, the parts of the Technical Report for which I am responsible contain all scientific and technical information required to be disclosed to make the report not misleading. |
| 9. | I am independent of Poly Met Mining, Inc. (PolyMet) as independence is described in Section 1.5 of National Instrument 43-101. |
| 10. | I have read National Instrument 43-101 and Form 43-101F1, and the sections of the Technical Report have been prepared in compliance with that instrument and form. |
| 11. | I consent to the filing of the Technical Report with any stock exchange and other regulatory authority and any publication by them for regulatory purposes, including electronic publication in the public company files on their websites accessible by the public, of the Technical Report. |
Signed and dated this 26nd day of March 2018.
(Signed) Jeff S. Ubl
Signature of Qualified Person
Jeff S. Ubl, P.E.
Print name of Qualified Person
| M3-PN150164 26 March 2018 |
271
NorthMet Project
Form NI 43-101F1 Technical Report
CERTIFICATE OF QUALIFIED PERSON
Herbert E. Welhener
I, Herbert E. Welhener, do hereby certify that:
| 1. | I am currently employed a Vice President of Independent Mining Consultants, Inc. located at 3560 E. Gas Road, Tucson, Arizona, USA. |
| 2. | I am a graduate with a Bachelor of Science in Geology from the University of Arizona in 1973. |
| 3. | I am a registered member of the Society of Mining, Metallurgy and Exploration, Inc. (SME RM # 3434330). |
| 4. | I have practiced my profession continuously since 1973. Since graduating I have worked as a consultant on a wide range of mineral projects, specializing in precious, base and industrial metals. I have undertaken many mineral resource estimations, mine evaluation technical studies and due diligence reports in a variety of settings around the world. |
| 5. | I have read the definition of “qualified person” set out in National instrument 43-101 (“NI 43-101”) and certify that by reason of my education, affiliation with a professional association (as defined in NI 43-101) and past relevant work experience, I fulfill the requirements to be a “qualified person” for the purposes of NI 43-101. |
| 6. | I am co-author and reviewer of this report and have specific responsibility for the Mineral Reserve estimate and 1.5, 15, 16, and input for 21, 21.2.1, 24.2, 25.2.8 and 25.2.9 of the technical report titled “NorthMet Project Form NI 43-101F1 Technical Report” (the “Technical Report”), dated March 26, 2018. |
| 7. | I have had prior involvement with the property that is the subject of the Technical Report by working on the Pre-Feasibility Study dated April 2001 and providing mine engineering assistance during the period of July 2015 to present. |
| 8. | I last visited the NorthMet Property on December 12 and 13, 2000. |
| 9. | As of the date of this certificate, to the best of my knowledge, information and belief, the parts of the Technical Report for which I am responsible contain all scientific and technical information required to be disclosed to make the report not misleading. |
| 10. | I am independent of the issuer applying all of the tests in Section 1.5 of National Instrument 43-101. |
| 11. | I have read National Instrument 43-101 and Form 43-101F1, and the sections of the Technical Report I am responsible for have been prepared in compliance with that instrument and form. |
| 12. | I consent to the filing of the Technical Report with any stock exchange and other regulatory authority and any publication by them for regulatory purposes, including electronic publication in the public company files on their websites accessible by the public, of the Technical Report. |
Signed and dated this 26th day of March 2018.
(Signed) (Sealed) Herbert E. Welhener
Signature of Qualified Person
Herbert E. Welhener
Print name of Qualified Person
| M3-PN150164 26 March 2018 |
272