Table of Contents
UNITED STATES
SECURITIES AND EXCHANGE COMMISSION
Washington, D.C. 20549
FORMN-CSR
CERTIFIED SHAREHOLDER REPORT OF REGISTERED
MANAGEMENT INVESTMENT COMPANIES
Investment Company Act file number:811-06241
Loomis Sayles Funds II
(Exact name of Registrant as specified in charter)
888 Boylston Street, Suite 800 Boston, Massachusetts 02199-8197
(Address of principal executive offices) (Zip code)
Russell L. Kane, Esq.
Natixis Distribution, L.P.
888 Boylston Street, Suite 800
Boston, Massachusetts 02199-8197
(Name and address of agent for service)
Registrant’s telephone number, including area code: (617)449-2822
Date of fiscal year end: December 31
Date of reporting period: December 31, 2018
Table of Contents
Item 1. Reports to Stockholders.
The Registrant’s annual report transmitted to shareholders pursuant to Rule30e-1 under the Investment Company Act of 1940 is as follows:
Table of Contents


Annual Report
December 31, 2018
Loomis Sayles High Income Fund
Loomis Sayles Investment Grade Bond Fund
| Portfolio Review | 1 | |||
| Portfolio of Investments | 12 | |||
| Financial Statements | 39 | |||
| Notes to Financial Statements | 52 | |||
IMPORTANT NOTICE TO SHAREHOLDERS
Beginning on January 1, 2021, as permitted by regulations adopted by the Securities and Exchange Commission, paper copies of shareholder reports like this one will no longer be sent by mail, unless you specifically request paper copies of the reports from the Fund or from your financial intermediary, such as a broker-dealer or bank. Instead, the reports will be made available on the Funds’ website, and you will be notified by mail each time a report is posted and provided with a website link to access the report. If you wish to continue receiving paper copies of your shareholder reports after January 1, 2021, you can inform the Fund at any time by calling 1-800-225-5478. If you hold your account with a financial intermediary and you wish to continue receiving paper copies after January 1, 2021, you should call your financial intermediary directly. Paper copies are provided free of charge, and your election to receive reports in paper will apply to all funds held with the Natixis Funds complex. If you have already elected to receive shareholder reports electronically, you will not be affected by this change and you need not take any action. You currently may elect to receive shareholder reports and other communications from the Fund or your financial intermediary electronically at www.icsdelivery.com/natixisfunds.
Table of Contents
LOOMIS SAYLES HIGH INCOME FUND
| Managers | Symbols | |
| Matthew J. Eagan, CFA® | Class A NEFHX | |
| Elaine M. Stokes | Class C NEHCX | |
| Brian P. Kennedy | Class N LSHNX | |
| Todd P. Vandam, CFA® | Class Y NEHYX | |
| Loomis, Sayles & Company, L.P. | ||
Investment Goal
The Fund seeks high current income plus the opportunity for capital appreciation to produce a high total return.
Market Conditions
The broad market environment experienced a significant shift in the final three months of the year. While the markets had previously been riding a wave of optimism stemming from robust economic growth and rising corporate earnings, market sentiment turned sharply lower in the fourth quarter. Concerns about US trade policy and weaker economic conditions overseas sparked a downturn in global equities and other asset classes seen as having higher risk. US core personal consumption expenditures (PCE) inflation ticked below 2% in the fourth quarter, which marked a decrease from its mid-year high. While the US Federal Reserve (Fed) raised rates by a quarter point at its December meeting, slowing growth and commentary from Fed officials fueled expectations that the cycle of rate increases was nearing its conclusion.
US Treasuries performed well and finished as one of the few major asset categories to post a positive return. Government bonds were aided by weaker economic data and a “flight to quality” that benefited lower-risk investments. Long-term issues, which are less sensitive to Fed policy than shorter-term bonds, delivered the strongest returns.
Investment grade corporates underperformed Treasuries but strongly outpaced high yield issues. Although yield spreads over government bonds increased, higher-rated securities benefited from their above-average credit quality and greater sensitivity to the direction of Treasury yields.
High yield bonds performed poorly and lagged investment-grade issues by a sizable margin. A large portion of the selloff occurred in December amid the downturn in equities and the broader weakness in higher-risk assets. High yield was pressured by the combination of slower growth, falling oil prices and the evaporation of investors’ risk appetites.
Performance Results1
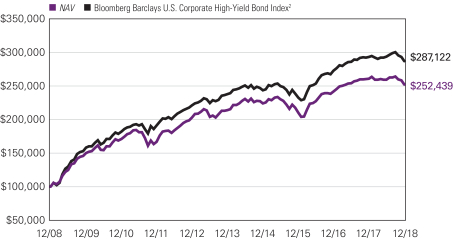
For the three months ended December 31, 2018, Class Y shares of the Loomis Sayles High Income Fund returned -4.49%. The Fund held up better than its benchmark, the Bloomberg Barclays U.S. Corporate High Yield Bond Index, which returned -4.53%.
| 1 | Effective November 1, 2018, the Board of Trustees approved a change in the fiscal year-end of the Fund from September 30 to December 31. The Fund performance provided in this section reflects the three-month fiscal period ended December 31, 2018. |
1 |
Table of Contents
Explanation of Fund Performance
An overweight allocation to emerging market credit added to relative performance. High yield corporate credit positively impacted relative return as well aided both by our longer duration positioning versus the benchmark and selected names within the energy space.Non-US-dollar securities, specifically those denominated in Argentine peso, helped performance during the period. Exposure to securitized assets including asset-backed securities andnon-agency commercial mortgage-backed securities also contributed positively to relative return.
Convertible securities acted as a constraint on relative performance largely due to holdings in selected energy, consumernon-cyclical and communications names. An allocation to equities reduced the fund’s overall performance, led by a position in Whiting Petroleum.
Outlook
Driven by market volatility, Fed policy and a fragile geopolitical environment, our outlook is evolving. While the US economy has experienced positive growth and strong employment, business uncertainty is rising and the pace of growth is slowing at the periphery. Recent growth and strong employment have generated some wage pressures, but inflation still appears contained and the dramatic move in oil should remove some inflationary pressures. Fed policy has been under pressure and the move lower in interest rates has been dramatic. Markets are appearing to price in no further rate hikes, but instead, the possibility of a rate cut. We believe market volatility and lower growth expectations may cause the Fed to pause; we expect one more rate hike (at most) in 2019.
Despite the volatility, we do believe the US economy is strong and we are not in “the cycle is turning” camp. We believe a fair amount of slowing growth is due to the inventory cycle and see the potential for some pickup in growth in the second half. Given the move down in US interest rates, we remain cautious about taking on more interest rate risk at present levels. However, our forward-looking view is that rates will be lower for this cycle. Geopolitical and political risks are rising, and outcomes from trade negotiations, actual Fed policy and developments abroad could have meaningful impacts on forward yield curve moves.
As we enter 2019, our strategy is to maintain a higher quality bias within credit markets as a whole, given the aging of the credit cycle.1 We continue to favor sectors that are exhibiting credit improvement, such as banking, and those with defensive characteristics, such as telecommunications and cable. We see more opportunity with the recent selloff in oil and have been selectively adding. We are limiting our exposure to industries with more challenging business trends, such as retail and home construction.
We believe opportunities in the US high yield market have increased and long-term value in certain areas is more attractive: Spreads have widened over 200 basis points in the past three months to more than 500 basis points, while market yield hovers at or above 8%. Historically, this is a material move. The fundamentals appear healthy and new issuance has declined dramatically, helping give support to the market. We still do not anticipate a large increase in defaults and the maturity wall remains pushed out until 2022. However, growth concerns warrant some increase in default risk.
| 2
Table of Contents
LOOMIS SAYLES HIGH INCOME FUND
In both investment grade and high yield markets, liquidity has been choppy. We remain very focused on liquidity conditions and have been actively buying into select opportunities.
A key risk to our outlook is the health of the global economy and markets outside of the United States, particularly Europe and parts of Asia, which have already experienced slowing growth. China is likely the most important economy to watch, given its large contribution to global growth. A negative outcome from trade policy discussions has the potential to significantly weaken risk appetite and accelerate an economic slowdown. Conversely, an agreement on trade could lead to a meaningful market recovery. As we enter the new year, we continue to favor an allocation to selected higher quality US investment grade and below investment grade bonds with an emphasis on solid fundamentals, attractive yield and liquidity.
| 1 | A credit cycle is a cyclical pattern that follows credit availability and corporate health. |
Hypothetical Growth of $100,000 Investment in Class Y Shares3
December 31, 2008 through December 31, 2018
3 |
Table of Contents
Average Annual Total Returns — December 31, 20183
3 Months
| 1 Year
| 5 Years
| 10 Years
| Life of
| Expense Ratios4 | |||||||||||||||||||||||
| Gross | Net | |||||||||||||||||||||||||||
| Class Y (Inception 2/29/08) | ||||||||||||||||||||||||||||
| NAV | -4.49 | % | -3.21 | % | 3.31 | % | 9.70 | % | — | % | 0.90 | % | 0.80 | % | ||||||||||||||
| Class A (Inception 2/22/84) | ||||||||||||||||||||||||||||
| NAV | -4.54 | -3.45 | 3.04 | 9.43 | — | 1.15 | 1.05 | |||||||||||||||||||||
| With 4.25% Maximum Sales Charge | -8.63 | -7.51 | 2.12 | 8.96 | — | |||||||||||||||||||||||
| Class C (Inception 3/2/98) | ||||||||||||||||||||||||||||
| NAV | -4.95 | -4.41 | 2.25 | 8.59 | — | 1.90 | 1.80 | |||||||||||||||||||||
| With CDSC1 | -5.89 | -5.33 | 2.25 | 8.59 | — | |||||||||||||||||||||||
| Class N (Inception 11/30/16) | ||||||||||||||||||||||||||||
| NAV | -4.47 | -3.15 | — | — | 2.91 | 31.73 | 0.75 | |||||||||||||||||||||
| Comparative Performance | ||||||||||||||||||||||||||||
| Bloomberg Barclays U.S. Corporate High-Yield Bond Index2 | -4.53 | -2.08 | 3.83 | 11.12 | 3.40 | |||||||||||||||||||||||
Performance data shown represents past performance and is no guarantee of, and not necessarily indicative of, future results. Total return and value will vary, and you may have a gain or loss when shares are sold. Current performance may be lower or higher than quoted. For most recent month-end performance, visit im.natixis.com. Performance for other share classes will be greater or less than shown based on differences in fees and sales charges. You may not invest directly in an index. Performance for periods less than one year is cumulative, not annualized. Returns reflect changes in share price and reinvestment of dividends and capital gains, if any. The table(s) do not reflect taxes shareholders might owe on any fund distributions or when they redeem their shares.
| 1 | Class C shares performance assumes a 1% CDSC applied when you sell shares within one year of purchase. |
| 2 | The Bloomberg Barclays U.S. Corporate High-Yield Bond Index measures the market of USD-denominated, non-investment grade, fixed-rate, taxable corporate bonds. Securities are classified as high yield if the middle rating of Moody’s, Fitch, and S&P is Ba1/BB /BB or below, excluding emerging market debt. The Bloomberg Barclays U.S. Corporate High-Yield Bond Index was created in 1986, with history backfilled to July 1, 1983, and rolls up into the Bloomberg Barclays U.S. Universal and Global High-Yield Indices. |
| 3 | Fund performance has been increased by fee waivers and/or expense reimbursements, if any, without which performance would have been lower. |
| 4 | Expense ratios are as shown in the Fund’s prospectus in effect as of the date of this report. The expense ratios for the current reporting period can be found in the Financial Highlights section of this report under Ratios to Average Net Assets. Net expenses reflect contractual expense caps set to expire on 1/31/19. When a Fund’s expenses are below the cap, gross and net expense ratios will be the same. See Note 6 of the Notes to Financial Statements for more information about the Fund’s expense caps. |
| 4
Table of Contents
LOOMIS SAYLES INVESTMENT GRADE BOND FUND
| Managers | Symbols | |||
| Matthew J. Eagan, CFA® | Class A | LIGRX | ||
| Brian P. Kennedy | Class C | LGBCX | ||
| Elaine M. Stokes | Class N | LGBNX | ||
| Loomis, Sayles & Company, L.P. | Class Y | LSIIX | ||
| Admin Class | LIGAX | |||
Investment Goal
The Fund seeks high total investment return through a combination of current income and capital appreciation.
Market Conditions
The broad market environment experienced a significant shift in the final three months of the year. While the markets had previously been riding a wave of optimism stemming from robust economic growth and rising corporate earnings, market sentiment turned sharply lower in the fourth quarter. Concerns about US trade policy and weaker economic conditions overseas sparked a downturn in global equities and other asset classes seen as having higher risk. US core personal consumption expenditures (PCE) inflation ticked below 2% in the fourth quarter, which marked a decrease from its mid-year high. While the US Federal Reserve (Fed) raised rates by a quarter point at its December meeting, slowing growth and commentary from Fed officials fueled expectations that the cycle of rate increases was nearing its conclusion.
US Treasuries performed well and finished as one of the few major asset categories to post a positive return. Government bonds were aided by weaker economic data and a “flight to quality” that benefited lower-risk investments. Long-term issues, which are less sensitive to Fed policy than shorter-term bonds, delivered the strongest returns.
Investment grade corporates underperformed Treasuries but strongly outpaced high yield issues. Although yield spreads over government bonds increased, higher-rated securities benefited from their above-average credit quality and greater sensitivity to the direction of Treasury yields.
High yield bonds performed poorly and lagged investment-grade issues by a sizable margin. A large portion of the selloff occurred in December amid the downturn in equities and the broader weakness in higher-risk assets. High yield was pressured by the combination of slower growth, falling oil prices and the evaporation of investors’ risk appetites.
Performance Results1 2
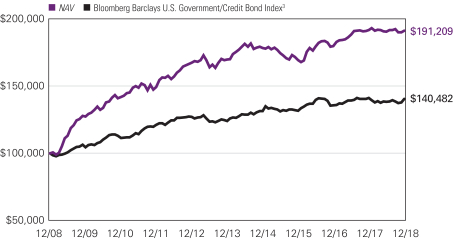
For the three months ended December 31, 2018, Class Y shares of the Loomis Sayles Investment Grade Bond Fund returned-0.59%. The Fund underperformed its benchmark, the Bloomberg Barclays U.S. Government/Credit Bond Index, which returned 1.46%.
| 1 | Effective November 1, 2018, the Board of Trustees approved a change in the fiscalyear-end of the Fund from September 30 to December 31. The Fund performance provided in this section reflects the three-month fiscal period ended December 31, 2018. |
5 |
Table of Contents
Explanation of Fund Performance
Exposure tonon-US-dollar-denominated issues had a negative impact on relative return, with Mexican peso holdings as the worst performers for the period. An allocation to high yield corporate credit also detracted from relative performance, largely due to selected finance companies, banking and energy names.
An underweight allocation versus the benchmark in US Treasuries was a laggard for relative return as well. Though security selection within investment grade corporate credit was modestly helpful, this was outweighed by our shorter-than-benchmark duration positioning in the space.
Outlook
Driven by market volatility, Fed policy and a fragile geopolitical environment, our outlook is evolving. While the US economy has experienced positive growth and strong employment, business uncertainty is rising and the pace of growth is slowing at the periphery. Recent growth and strong employment have generated some wage pressures, but inflation still appears contained and the dramatic move in oil should remove some inflationary pressures. Fed policy has been under pressure and the move lower in interest rates has been dramatic. Markets are appearing to price in no further rate hikes, but instead, the possibility of a rate cut. We believe market volatility and lower growth expectations may cause the Fed to pause; we expect one more rate hike (at most) in 2019.
Despite the volatility, we do believe the US economy is strong and we are not in “the cycle is turning” camp. We believe a fair amount of slowing growth is due to the inventory cycle and see the potential for some pickup in growth in the second half. Given the move down in US interest rates, we remain cautious about taking on more interest rate risk at present levels. However, our forward-looking view is that rates will be lower for this cycle. Geopolitical and political risks are rising, and outcomes from trade negotiations, actual Fed policy and developments abroad could have meaningful impacts on forward yield curve moves.
As we enter 2019, our strategy is to maintain a higher quality bias within credit markets as a whole, given the aging of the credit cycle.1 We continue to favor sectors that are exhibiting credit improvement, such as banking, and those with defensive characteristics, such as telecommunications and cable. We see more opportunity with the recent selloff in oil and have been selectively adding. We are limiting our exposure to industries with more challenging business trends, such as retail and home construction.
We believe opportunities in the US high yield market have increased and long-term value in certain areas is more attractive: Spreads have widened over 200 basis points in the past three months to more than 500 basis points, while market yield hovers at or above 8%. Historically, this is a material move. The fundamentals appear healthy and new issuance has declined dramatically, helping give support to the market. We still do not anticipate a large increase in defaults and the maturity wall remains pushed out until 2022. However, growth concerns warrant some increase in default risk.
In both investment grade and high yield markets, liquidity has been choppy. We remain very focused on liquidity conditions and have been actively buying into select opportunities.
| 6
Table of Contents
LOOMIS SAYLES INVESTMENT GRADE BOND FUND
A key risk to our outlook is the health of the global economy and markets outside of the United States, particularly Europe and parts of Asia, which have already experienced slowing growth. China is likely the most important economy to watch, given its large contribution to global growth. A negative outcome from trade policy discussions has the potential to significantly weaken risk appetite and accelerate an economic slowdown. Conversely, an agreement on trade could lead to a meaningful market recovery. As we enter the new year, we continue to favor an allocation to selected higher quality US investment grade and below investment grade bonds with an emphasis on solid fundamentals, attractive yield and liquidity.
| 1 | A credit cycle is a cyclical pattern that follows credit availability and corporate health. |
Hypothetical Growth of $100,000 Investment in Class Y Shares4
December 31, 2008 through December 31, 2018
7 |
Table of Contents
Average Annual Total Returns — December 31, 20184
3 Months
| 1 Year
| 5 Years
| 10 Years
| Life of
| Expense Ratios5 | |||||||||||||||||||||||
Gross | Net | |||||||||||||||||||||||||||
| Class Y (Inception 12/31/96) | ||||||||||||||||||||||||||||
| NAV | -0.59 | % | -0.32 | % | 2.41 | % | 6.69 | % | — | % | 0.57 | % | 0.53 | % | ||||||||||||||
| Class A (Inception 12/31/96) | ||||||||||||||||||||||||||||
| NAV | -0.66 | -0.64 | 2.15 | 6.42 | — | 0.82 | 0.78 | |||||||||||||||||||||
| With 4.25% Maximum Sales Charge | -4.90 | -4.86 | 1.27 | 5.96 | — | |||||||||||||||||||||||
| Class C (Inception 9/12/03) | ||||||||||||||||||||||||||||
| NAV | -0.86 | -1.37 | 1.39 | 5.63 | — | 1.57 | 1.53 | |||||||||||||||||||||
| With CDSC2 | -1.84 | -2.34 | 1.39 | 5.63 | — | |||||||||||||||||||||||
| Class N (Inception 2/1/13) | ||||||||||||||||||||||||||||
| NAV | -0.58 | -0.35 | 2.52 | — | 2.23 | 0.48 | 0.48 | |||||||||||||||||||||
| Admin Class (Inception 2/1/10)1 | ||||||||||||||||||||||||||||
| NAV | -0.63 | -0.72 | 1.94 | 6.15 | — | 1.03 | 1.03 | |||||||||||||||||||||
| Comparative Performance | ||||||||||||||||||||||||||||
| Bloomberg Barclays U.S. Government/Credit Bond Index3 | 1.46 | -0.42 | 2.53 | 3.46 | 1.89 | |||||||||||||||||||||||
Performance data shown represents past performance and is no guarantee of, and not necessarily indicative of, future results. Total return and value will vary, and you may have a gain or loss when shares are sold. Current performance may be lower or higher than quoted. For most recent month-end performance, visit im.natixis.com. Performance for other share classes will be greater or less than shown based on differences in fees and sales charges. You may not invest directly in an index. Performance for periods less than one year is cumulative, not annualized. Returns reflect changes in share price and reinvestment of dividends and capital gains, if any. The table(s) do not reflect taxes shareholders might owe on any fund distributions or when they redeem their shares.
| 1 | Prior to the inception of Admin Class shares (2/1/10), performance is that of Class A shares, restated to reflect the higher net expenses of Admin Class shares. |
| 2 | Performance for Class C shares assumes a 1% contingent deferred sales charge (“CDSC”) applied when you sell shares within one year of purchase. |
| 3 | The Bloomberg Barclays U.S. Government/Credit Bond Index is the non-securitized component of the U.S. Aggregate Index and was the first macro index launched by Barclays Capital. The U.S. Government/Credit Bond Index includes Treasuries (i.e., public obligations of the U.S. Treasury that have remaining maturities of more than one year), government-related issues (i.e., agency, sovereign, supranational, and local authority debt), and corporates. The U.S. Government/Credit Bond Index was launched on January 1, 1979, with index history backfilled to 1973, and is a subset of the U.S. Aggregate Index. |
| 4 | Fund performance has been increased by fee waivers and/or expense reimbursements, if any, without which performance would have been lower. |
| 5 | Expense ratios are as shown in the Fund’s prospectus in effect as of the date of this report. The expense ratios for the current reporting period can be found in the Financial Highlights section of this report under Ratios to Average Net Assets. Net expenses reflect contractual expense caps set to expire on 1/31/20. When a Fund’s expenses are below the cap, gross and net expense ratios will be the same. See Note 5 of the Notes to Financial Statements for more information about the Fund’s expense caps. |
| 8
Table of Contents
ADDITIONAL INFORMATION
The views expressed in this report reflect those of the portfolio managers as of the dates indicated. The managers’ views are subject to change at any time without notice based on changes in market or other conditions. References to specific securities or industries should not be regarded as investment advice. Because the Funds are actively managed, there is no assurance that they will continue to invest in the securities or industries mentioned.
All investing involves risk, including the risk of loss. There is no assurance that any investment will meet its performance objectives or that losses will be avoided.
ADDITIONAL INDEX INFORMATION
This document may contain references to third party copyrights, indexes, and trademarks, each of which is the property of its respective owner. Such owner is not affiliated with Natixis Investment Managers or any of its related or affiliated companies (collectively “Natixis Affiliates”) and does not sponsor, endorse or participate in the provision of any Natixis Affiliates services, funds or other financial products.
The index information contained herein is derived from third parties and is provided on an “as is” basis. The user of this information assumes the entire risk of use of this information. Each of the third party entities involved in compiling, computing or creating index information disclaims all warranties (including, without limitation, any warranties of originality, accuracy, completeness, timeliness, non-infringement, merchantability and fitness for a particular purpose) with respect to such information.
PROXY VOTING INFORMATION
A description of the Natixis Funds’ proxy voting policies and procedures is available without charge, upon request, by calling Natixis Funds at 800-225-5478; on the Natixis Funds’ website at im.natixis.com; and on the Securities and Exchange Commission’s (“SEC’s”) website at www.sec.gov. Information regarding how the funds voted proxies relating to portfolio securities the most recent 12-month period ended June 30 is available from the Natixis Funds’ website and the SEC’s website.
QUARTERLY PORTFOLIO SCHEDULES
The Natixis Funds file complete schedules of portfolio holdings with the SEC for the first and third quarters of each fiscal year on Form N-Q. The Funds’ Forms N-Q are available on the SEC’s website at www.sec.gov and may be reviewed and copied at the SEC’s Public Reference Room in Washington, DC. Information on the operation of the Public Reference Room may be obtained by calling 800-SEC-0330.
9 |
Table of Contents
UNDERSTANDING FUND EXPENSES
As a mutual fund shareholder, you incur different costs: transaction costs, including sales charges (loads) on purchases and contingent deferred sales charges on redemptions, and ongoing costs, including management fees, distribution and/or service fees (12b-1 fees), and other fund expenses. Certain exemptions may apply. These costs are described in more detail in the Funds’ prospectuses. The following examples are intended to help you understand the ongoing costs of investing in the Funds and help you compare these with the ongoing costs of investing in other mutual funds.
The first line in the table of each class of Fund shares shows the actual account values and actual Fund expenses you would have paid on a $1,000 investment in the Fund from July 1, 2018 through December 31, 2018. To estimate the expenses you paid over the period, simply divide your account value by $1,000 (for example $8,600 account value divided by $1,000 = 8.6) and multiply the result by the number in the Expenses Paid During Period column as shown below for your class.
The second line in the table of each class of Fund shares provides information about hypothetical account values and hypothetical expenses based on the Fund’s actual expense ratios and an assumed rate of return of 5% per year before expenses, which is not the Fund’s actual return. The hypothetical account values and expenses may not be used to estimate the actual ending account balance or expenses you paid on your investment for the period. You may use this information to compare the ongoing costs of investing in the Fund to other funds. To do so, compare this 5% hypothetical example with the 5% hypothetical examples that appear in the shareholder reports of the other funds.
Please note that the expenses shown reflect ongoing costs only, and do not include any transaction costs, such as sales charges. Therefore, the second line in the table of each fund is useful in comparing ongoing costs only, and will not help you determine the relative costs of owning different funds. If transaction costs were included, total costs would be higher.
| 10
Table of Contents
| LOOMIS SAYLES HIGH INCOME FUND | BEGINNING ACCOUNT VALUE 7/1/2018 | ENDING ACCOUNT VALUE 12/31/2018 | EXPENSES PAID DURING PERIOD* 7/1/2018 – 12/31/2018 | |||||||||
| Class A | ||||||||||||
| Actual | $1,000.00 | $970.70 | $5.22 | |||||||||
| Hypothetical (5% return before expenses) | $1,000.00 | $1,019.91 | $5.35 | |||||||||
| Class C | ||||||||||||
| Actual | $1,000.00 | $967.00 | $8.92 | |||||||||
| Hypothetical (5% return before expenses) | $1,000.00 | $1,016.13 | $9.15 | |||||||||
| Class N | ||||||||||||
| Actual | $1,000.00 | $974.50 | $3.73 | |||||||||
| Hypothetical (5% return before expenses) | $1,000.00 | $1,021.43 | $3.82 | |||||||||
| Class Y | ||||||||||||
| Actual | $1,000.00 | $971.90 | $3.98 | |||||||||
| Hypothetical (5% return before expenses) | $1,000.00 | $1,021.17 | $4.08 | |||||||||
| * | Expenses are equal to the Fund’s annualized expense ratio (after waiver/reimbursement): 1.05%, 1.80%, 0.75% and 0.80% for Class A, C, N and Y, respectively, multiplied by the average account value over the period, multiplied by the number of days in the most recent fiscal half-year (184), divided by 365 (to reflect the half-year period). |
| LOOMIS SAYLES INVESTMENT GRADE BOND FUND | BEGINNING ACCOUNT VALUE 7/1/2018 | ENDING ACCOUNT VALUE 12/31/2018 | EXPENSES PAID DURING PERIOD* 7/1/2018 – 12/31/2018 | |||||||||
| Class A | ||||||||||||
| Actual | $1,000.00 | $1,002.50 | $3.94 | |||||||||
| Hypothetical (5% return before expenses) | $1,000.00 | $1,021.27 | $3.97 | |||||||||
| Class C | ||||||||||||
| Actual | $1,000.00 | $998.00 | $7.71 | |||||||||
| Hypothetical (5% return before expenses) | $1,000.00 | $1,017.49 | $7.78 | |||||||||
| Class N | ||||||||||||
| Actual | $1,000.00 | $1,003.80 | $2.42 | |||||||||
| Hypothetical (5% return before expenses) | $1,000.00 | $1,022.79 | $2.45 | |||||||||
| Class Y | ||||||||||||
| Actual | $1,000.00 | $1,003.60 | $2.68 | |||||||||
| Hypothetical (5% return before expenses) | $1,000.00 | $1,022.53 | $2.70 | |||||||||
| Admin Class | ||||||||||||
| Actual | $1,000.00 | $1,001.10 | $5.20 | |||||||||
| Hypothetical (5% return before expenses) | $1,000.00 | $1,020.01 | $5.24 | |||||||||
| * | Expenses are equal to the Fund’s annualized expense ratio (after waiver/reimbursement): 0.78%, 1.53%, 0.48%, 0.53% and 1.03% for Class A, C, N, Y and Admin Class, respectively, multiplied by the average account value over the period, multiplied by the number of days in the most recent fiscal half-year (184), divided by 365 (to reflect the half-year period). |
11 |
Table of Contents
Portfolio of Investments – as of December 31, 2018
Loomis Sayles High Income Fund
| Principal Amount | Description | Value (†) | ||||||
| Bonds and Notes — 90.8% of Net Assets | ||||||||
| Non-Convertible Bonds — 80.9% | ||||||||
| ABS Home Equity — 1.2% |
| |||||||
| $ | 82,604 | Banc of America Alternative Loan Trust, Series2003-8, Class 1CB1, 5.500%, 10/25/2033 | $ | 84,287 | ||||
| 87,146 | Banc of America Funding Trust, Series2005-7, Class 3A1, 5.750%, 11/25/2035 | 91,858 | ||||||
| 61,178 | Banc of America Funding Trust, Series2007-4, Class 5A1, 5.500%, 11/25/2034 | 60,352 | ||||||
| 751 | Countrywide Home Loan Mortgage Pass Through Trust, Series 2005-HYB7, Class 2A, 4.383%, 11/20/2035(a)(b)(c) | 574 | ||||||
| 185,855 | DSLA Mortgage Loan Trust, Series2005-AR5, Class 2A1A,1-month LIBOR + 0.330%, 2.800%, 9/19/2045(d) | 151,084 | ||||||
| 305,000 | Freddie Mac Structured Agency Credit Risk Debt Notes, Series 2015-DNA1, Class M3,1-month LIBOR + 3.300%, 5.806%, 10/25/2027(d)(e) | 330,846 | ||||||
| 95,960 | �� | GMAC Mortgage Corp. Loan Trust, Series2005-AR4, Class 3A1, 4.268%, 7/19/2035(b) | 93,128 | |||||
| 150,000 | Home Partners of America Trust, Series2016-2, Class E, 1-month LIBOR + 3.780%, 6.235%, 10/17/2033, 144A(d) | 150,396 | ||||||
| 155,000 | Home Partners of America Trust, Series2016-2, Class F, 1-month LIBOR + 4.700%, 7.155%, 10/17/2033, 144A(d) | 155,000 | ||||||
| 214,901 | MASTR Adjustable Rate Mortgages Trust, Series2005-2, Class 3A1, 3.987%, 3/25/2035(b) | 209,792 | ||||||
| 223,825 | MASTR Adjustable Rate Mortgages Trust, Series2005-2, Class 4A1, 3.546%, 3/25/2035(b) | 202,249 | ||||||
| 100,000 | RCO Mortgage LLC, Series2017-1, Class A2, 5.125%, 8/25/2022, 144A(b) | 100,632 | ||||||
|
| |||||||
| 1,630,198 | ||||||||
|
| |||||||
| ABS Other — 0.3% |
| |||||||
| 186,325 | AIM Aviation Finance Ltd., Series2015-1A, Class B1, 5.072%, 2/15/2040, 144A(b) | 186,165 | ||||||
| 233,759 | Wave LLC, Series2017-1A, Class B, 5.682%, 11/15/2042, 144A | 242,651 | ||||||
|
| |||||||
| 428,816 | ||||||||
|
| |||||||
| Aerospace & Defense — 1.5% |
| |||||||
| 638,000 | Leonardo U.S. Holdings, Inc., 6.250%, 1/15/2040, 144A | 595,171 | ||||||
| 383,000 | Leonardo U.S. Holdings, Inc., 7.375%, 7/15/2039, 144A | 402,150 | ||||||
| 200,000 | TransDigm UK Holdings PLC, 6.875%, 5/15/2026, 144A | 190,500 | ||||||
| 845,000 | TransDigm, Inc., 6.500%, 7/15/2024 | 821,763 | ||||||
|
| |||||||
| 2,009,584 | ||||||||
|
| |||||||
| Airlines — 0.4% |
| |||||||
| 535,000 | Latam Finance Ltd., 6.875%, 4/11/2024, 144A | 526,846 | ||||||
| 23,236 | Virgin Australia Pass Through Certificates, Series2013-1B, 6.000%, 4/23/2022, 144A | 23,558 | ||||||
|
| |||||||
| 550,404 | ||||||||
|
| |||||||
See accompanying notes to financial statements.
| 12
Table of Contents
Portfolio of Investments – as of December 31, 2018
Loomis Sayles High Income Fund – (continued)
| Principal Amount | Description | Value (†) | ||||||
| Automotive — 1.6% |
| |||||||
| $ | 195,000 | Allison Transmission, Inc., 5.000%, 10/01/2024, 144A | $ | 187,200 | ||||
| 285,000 | Dana Financing Luxembourg S.a.r.l., 5.750%, 4/15/2025, 144A | 265,762 | ||||||
| 465,000 | Delphi Technologies PLC, 5.000%, 10/01/2025, 144A | 390,600 | ||||||
| 115,000 | Goodyear Tire & Rubber Co. (The), 5.000%, 5/31/2026 | 103,500 | ||||||
| 880,000 | IHO Verwaltungs GmbH, 5.250% PIK, 4.500% Cash, 9/15/2023, 144A(f) | 805,200 | ||||||
| 420,000 | Midas Intermediate Holdco II LLC/Midas Intermediate Holdco II Finance, Inc., 7.875%, 10/01/2022, 144A | 382,200 | ||||||
|
| |||||||
| 2,134,462 | ||||||||
|
| |||||||
| Banking — 3.1% |
| |||||||
| 1,730,000 | Ally Financial, Inc., 4.625%, 3/30/2025 | 1,675,937 | ||||||
| 485,000 | Ally Financial, Inc., 5.750%, 11/20/2025 | 482,575 | ||||||
| 850,000 | Barclays PLC, 5.200%, 5/12/2026(e) | 814,795 | ||||||
| 425,000 | Deutsche Bank AG, (fixed rate to 12/01/2027, variable rate thereafter), 4.875%, 12/01/2032 | 330,455 | ||||||
| 470,000 | Intesa Sanpaolo SpA, 5.017%, 6/26/2024, 144A | 426,235 | ||||||
| 495,000 | Intesa Sanpaolo SpA, 5.710%, 1/15/2026, 144A | 453,755 | ||||||
|
| |||||||
| 4,183,752 | ||||||||
|
| |||||||
| Brokerage — 0.4% |
| |||||||
| 535,000 | Jefferies Finance LLC/JFINCo-Issuer Corp., 6.875%, 4/15/2022, 144A | 520,288 | ||||||
|
| |||||||
| Building Materials — 2.8% |
| |||||||
| 610,000 | Beacon Roofing Supply, Inc., 4.875%, 11/01/2025, 144A | 536,037 | ||||||
| 230,000 | Cemex SAB de CV, 5.700%, 1/11/2025, 144A | 220,515 | ||||||
| 350,000 | Cemex SAB de CV, 7.750%, 4/16/2026, 144A | 367,938 | ||||||
| 420,000 | James Hardie International Finance Ltd., 4.750%, 1/15/2025, 144A | 382,200 | ||||||
| 445,000 | James Hardie International Finance Ltd., 5.000%, 1/15/2028, 144A | 380,475 | ||||||
| 360,000 | Jeld-Wen, Inc., 4.625%, 12/15/2025, 144A | 315,000 | ||||||
| 160,000 | Jeld-Wen, Inc., 4.875%, 12/15/2027, 144A | 135,200 | ||||||
| 420,000 | Summit Materials LLC / Summit Materials Finance Corp., 6.125%, 7/15/2023 | 415,800 | ||||||
| 1,120,000 | U.S. Concrete, Inc., 6.375%, 6/01/2024 | 1,030,400 | ||||||
|
| |||||||
| 3,783,565 | ||||||||
|
| |||||||
| Cable Satellite — 6.9% |
| |||||||
| 795,000 | Altice Financing S.A., 6.625%, 2/15/2023, 144A | 763,200 | ||||||
| 475,000 | CCO Holdings LLC/CCO Holdings Capital Corp., 5.125%, 2/15/2023 | 463,125 | ||||||
| 625,000 | CCO Holdings LLC/CCO Holdings Capital Corp., 5.125%, 5/01/2023, 144A | 607,813 | ||||||
| 865,000 | CCO Holdings LLC/CCO Holdings Capital Corp., 5.750%, 2/15/2026, 144A | 847,700 | ||||||
| 1,360,000 | CSC Holdings LLC, 5.500%, 4/15/2027, 144A | 1,264,800 | ||||||
| 355,000 | Sirius XM Radio, Inc., 5.000%, 8/01/2027, 144A | 324,381 | ||||||
| 800,000 | Telenet Finance Luxembourg Notes S.a.r.l., 5.500%, 3/01/2028, 144A | 725,208 | ||||||
| 1,485,000 | Unitymedia GmbH, 6.125%, 1/15/2025, 144A | 1,492,276 | ||||||
| 265,000 | Virgin Media Finance PLC, 6.000%, 10/15/2024, 144A | 254,533 | ||||||
| 375,000 | Virgin Media Secured Finance PLC, 5.500%, 1/15/2025, 144A | 369,614 | ||||||
| 2,570,000 | Ziggo BV, 5.500%, 1/15/2027, 144A | 2,300,150 | ||||||
|
| |||||||
| 9,412,800 | ||||||||
|
| |||||||
See accompanying notes to financial statements.
13 |
Table of Contents
Portfolio of Investments – as of December 31, 2018
Loomis Sayles High Income Fund – (continued)
| Principal Amount | Description | Value (†) | ||||||
| Chemicals — 1.6% |
| |||||||
| $ | 1,510,000 | Hercules LLC, 6.500%, 6/30/2029 | $ | 1,506,225 | ||||
| 420,000 | Hexion, Inc., 6.625%, 4/15/2020 | 334,950 | ||||||
| 70,000 | Hexion, Inc., 10.375%, 2/01/2022, 144A | 55,825 | ||||||
| 245,000 | SASOL Financing USA LLC, 5.875%, 3/27/2024 | 244,483 | ||||||
|
| |||||||
| 2,141,483 | ||||||||
|
| |||||||
| Construction Machinery — 1.0% |
| |||||||
| 615,000 | United Rentals North America, Inc., 4.625%, 10/15/2025 | 548,887 | ||||||
| 15,000 | United Rentals North America, Inc., 5.500%, 5/15/2027 | 13,913 | ||||||
| 800,000 | United Rentals North America, Inc., 5.750%, 11/15/2024 | 770,000 | ||||||
|
| |||||||
| 1,332,800 | ||||||||
|
| |||||||
| Consumer Cyclical Services — 0.2% |
| |||||||
| 350,000 | ServiceMaster Co. LLC (The), 7.450%, 8/15/2027 | 357,000 | ||||||
|
| |||||||
| Consumer Products — 0.5% |
| |||||||
| 790,000 | Coty, Inc., 6.500%, 4/15/2026, 144A | 679,400 | ||||||
|
| |||||||
| Electric — 1.7% |
| |||||||
| 125,000 | AES Corp. (The), 5.125%, 9/01/2027 | 120,000 | ||||||
| 479,000 | AES Corp. (The), 5.500%, 4/15/2025 | 476,533 | ||||||
| 150,000 | AES Corp. (The), 6.000%, 5/15/2026 | 152,250 | ||||||
| 1,502,000 | Enel SpA, (fixed rate to 9/24/2023, variable rate thereafter), 8.750%, 9/24/2073, 144A | 1,532,040 | ||||||
|
| |||||||
| 2,280,823 | ||||||||
|
| |||||||
| Environmental — 0.1% |
| |||||||
| 100,000 | GFL Environmental, Inc., 5.625%, 5/01/2022, 144A | 92,250 | ||||||
|
| |||||||
| Finance Companies — 4.6% |
| |||||||
| 120,000 | CIT Group, Inc., 4.125%, 3/09/2021 | 118,200 | ||||||
| 120,000 | iStar, Inc., 4.625%, 9/15/2020 | 117,000 | ||||||
| 395,000 | iStar, Inc., 5.250%, 9/15/2022 | 369,285 | ||||||
| 800,000 | iStar, Inc., 6.500%, 7/01/2021 | 792,000 | ||||||
| 720,000 | Ladder Capital Finance Holdings LLLP/Ladder Capital Finance Corp., 5.250%, 10/01/2025, 144A | 642,600 | ||||||
| 255,000 | Ladder Capital Finance Holdings LLLP/Ladder Capital Finance Corp., 5.875%, 8/01/2021, 144A | 254,363 | ||||||
| 820,000 | Navient Corp., 6.500%, 6/15/2022 | 764,650 | ||||||
| 315,000 | Provident Funding Associates LP/PFG Finance Corp., 6.375%, 6/15/2025, 144A | 283,500 | ||||||
| 1,305,000 | Quicken Loans, Inc., 5.250%, 1/15/2028, 144A | 1,154,925 | ||||||
| 710,000 | Quicken Loans, Inc., 5.750%, 5/01/2025, 144A | 663,850 | ||||||
| 185,000 | Springleaf Finance Corp., 6.875%, 3/15/2025 | 165,575 | ||||||
| 700,000 | Springleaf Finance Corp., 7.125%, 3/15/2026 | 624,750 | ||||||
| 405,000 | Unifin Financiera SAB de CV SOFOM ENR, 7.250%, 9/27/2023, 144A | 373,681 | ||||||
|
| |||||||
| 6,324,379 | ||||||||
|
| |||||||
| Financial Other — 0.8% |
| |||||||
| 180,000 | Icahn Enterprises LP/Icahn Enterprises Finance Corp., 5.875%, 2/01/2022 | 176,400 | ||||||
| 105,000 | Icahn Enterprises LP/Icahn Enterprises Finance Corp., 6.250%, 2/01/2022 | 103,688 | ||||||
See accompanying notes to financial statements.
| 14
Table of Contents
Portfolio of Investments – as of December 31, 2018
Loomis Sayles High Income Fund – (continued)
| Principal Amount | Description | Value (†) | ||||||
| Financial Other — continued |
| |||||||
| $ | 465,000 | Nationstar Mortgage Holdings, Inc., 8.125%, 7/15/2023, 144A | $ | 453,375 | ||||
| 330,000 | Nationstar Mortgage Holdings, Inc., 9.125%, 7/15/2026, 144A | 320,925 | ||||||
|
| |||||||
| 1,054,388 | ||||||||
|
| |||||||
| Food & Beverage — 2.4% |
| |||||||
| 405,000 | BRF GmbH, 4.350%, 9/29/2026, 144A | 349,495 | ||||||
| 210,000 | BRF S.A., 4.750%, 5/22/2024, 144A | 192,937 | ||||||
| 520,000 | Cosan Luxembourg S.A., 7.000%, 1/20/2027, 144A | 524,098 | ||||||
| 330,000 | JBS USA LUX S.A./JBS USA Finance, Inc., 5.750%, 6/15/2025, 144A | 315,150 | ||||||
| 385,000 | Marfrig Holdings Europe BV, Class B, 8.000%, 6/08/2023, 144A | 385,385 | ||||||
| 280,000 | Pilgrim’s Pride Corp., 5.750%, 3/15/2025, 144A | 262,500 | ||||||
| 540,000 | Pilgrim’s Pride Corp., 5.875%, 9/30/2027, 144A | 490,050 | ||||||
| 830,000 | Post Holdings, Inc., 5.750%, 3/01/2027, 144A | 778,125 | ||||||
|
| |||||||
| 3,297,740 | ||||||||
|
| |||||||
| Gaming — 0.5% |
| |||||||
| 175,000 | Boyd Gaming Corp., 6.375%, 4/01/2026 | 169,313 | ||||||
| 210,000 | MGM Growth Properties Operating Partnership LP / MGP FinanceCo-Issuer, Inc., 4.500%, 1/15/2028 | 183,750 | ||||||
| 380,000 | MGM Resorts International, 7.750%, 3/15/2022 | 404,225 | ||||||
|
| |||||||
| 757,288 | ||||||||
|
| |||||||
| Government Owned – No Guarantee — 1.0% |
| |||||||
| 400,000 | Petrobras Global Finance BV, 5.625%, 5/20/2043 | 335,204 | ||||||
| 515,000 | Petrobras Global Finance BV, 5.750%, 2/01/2029 | 476,375 | ||||||
| 710,000 | YPF S.A., 6.950%, 7/21/2027, 144A | 578,650 | ||||||
|
| |||||||
| 1,390,229 | ||||||||
|
| |||||||
| Healthcare — 4.6% |
| |||||||
| 170,000 | HCA, Inc., 7.050%, 12/01/2027 | 177,225 | ||||||
| 655,000 | HCA, Inc., 7.500%, 12/15/2023 | 700,850 | ||||||
| 145,000 | HCA, Inc., 7.500%, 11/06/2033 | 152,250 | ||||||
| 590,000 | HCA, Inc., 7.690%, 6/15/2025 | 628,350 | ||||||
| 480,000 | HCA, Inc., 8.360%, 4/15/2024 | 528,000 | ||||||
| 820,000 | HCA, Inc., MTN, 7.580%, 9/15/2025 | 869,200 | ||||||
| 515,000 | HCA, Inc., MTN, 7.750%, 7/15/2036 | 534,313 | ||||||
| 275,000 | Hologic, Inc., 4.375%, 10/15/2025, 144A | 255,750 | ||||||
| 315,000 | Hologic, Inc., 4.625%, 2/01/2028, 144A | 283,500 | ||||||
| 200,000 | IQVIA, Inc., 5.000%, 10/15/2026, 144A | 191,000 | ||||||
| 800,000 | Polaris Intermediate Corp., 8.500% PIK, 8.500% Cash, 12/01/2022, 144A(f) | 729,696 | ||||||
| 390,000 | Tenet Healthcare Corp., 5.125%, 5/01/2025 | 363,675 | ||||||
| 830,000 | Tenet Healthcare Corp., 7.500%, 1/01/2022, 144A | 842,450 | ||||||
|
| |||||||
| 6,256,259 | ||||||||
|
| |||||||
| Home Construction — 1.8% |
| |||||||
| 1,200,000 | Corporacion GEO SAB de CV, 8.875%, 3/27/2022(a)(c)(g)(h) | 12 | ||||||
| 750,000 | K. Hovnanian Enterprises, Inc., 5.000%, 11/01/2021 | 600,000 | ||||||
| 800,000 | Lennar Corp., 4.750%, 5/30/2025 | 750,000 | ||||||
| 1,130,000 | PulteGroup, Inc., 5.500%, 3/01/2026 | 1,087,625 | ||||||
|
| |||||||
| 2,437,637 | ||||||||
|
| |||||||
See accompanying notes to financial statements.
15 |
Table of Contents
Portfolio of Investments – as of December 31, 2018
Loomis Sayles High Income Fund – (continued)
| Principal Amount | Description | Value (†) | ||||||
| Independent Energy — 11.6% |
| |||||||
| $ | 460,000 | Aker BP ASA, 5.875%, 3/31/2025, 144A | $ | 458,850 | ||||
| 202,000 | Ascent Resources Utica Holdings LLC/ARU Finance Corp., 10.000%, 4/01/2022, 144A | 206,606 | ||||||
| 685,000 | Baytex Energy Corp., 5.625%, 6/01/2024, 144A | 592,525 | ||||||
| 570,000 | Bruin E&P Partners LLC, 8.875%, 8/01/2023, 144A | 507,300 | ||||||
| 90,000 | California Resources Corp., 5.500%, 9/15/2021 | 64,646 | ||||||
| 41,000 | California Resources Corp., 6.000%, 11/15/2024 | 25,010 | ||||||
| 2,530,000 | California Resources Corp., 8.000%, 12/15/2022, 144A | 1,714,075 | ||||||
| 140,000 | Callon Petroleum Co., 6.125%, 10/01/2024 | 130,200 | ||||||
| 795,000 | CNX Resources Corp., 5.875%, 4/15/2022 | 763,200 | ||||||
| 635,000 | Denbury Resources, Inc., 7.500%, 2/15/2024, 144A | 511,175 | ||||||
| 205,000 | Denbury Resources, Inc., 9.250%, 3/31/2022, 144A | 189,112 | ||||||
| 690,000 | Eclipse Resources Corp., 8.875%, 7/15/2023 | 591,675 | ||||||
| 375,000 | Gulfport Energy Corp., 6.000%, 10/15/2024 | 331,875 | ||||||
| 595,000 | Gulfport Energy Corp., 6.375%, 5/15/2025 | 526,575 | ||||||
| 365,000 | Gulfport Energy Corp., 6.375%, 1/15/2026 | 315,725 | ||||||
| 622,000 | Halcon Resources Corp., 6.750%, 2/15/2025 | 454,060 | ||||||
| 605,000 | Matador Resources Co., 5.875%, 9/15/2026 | 556,600 | ||||||
| 1,250,000 | MEG Energy Corp., 6.500%, 1/15/2025, 144A | 1,268,750 | ||||||
| 585,000 | MEG Energy Corp., 7.000%, 3/31/2024, 144A | 558,675 | ||||||
| 185,000 | Newfield Exploration Co., 5.625%, 7/01/2024 | 187,313 | ||||||
| 592,000 | Oasis Petroleum, Inc., 6.875%, 3/15/2022 | 557,960 | ||||||
| 210,000 | PDC Energy, Inc., 5.750%, 5/15/2026 | 186,900 | ||||||
| 205,000 | PDC Energy, Inc., 6.125%, 9/15/2024 | 189,625 | ||||||
| 870,000 | Range Resources Corp., 4.875%, 5/15/2025 | 713,400 | ||||||
| 330,000 | Sanchez Energy Corp., 6.125%, 1/15/2023 | 59,400 | ||||||
| 755,000 | Sanchez Energy Corp., 7.250%, 2/15/2023, 144A | 615,325 | ||||||
| 685,000 | Seven Generations Energy Ltd., 5.375%, 9/30/2025, 144A | 613,075 | ||||||
| 175,000 | Seven Generations Energy Ltd., 6.875%, 6/30/2023, 144A | 172,375 | ||||||
| 920,000 | SM Energy Co., 5.000%, 1/15/2024 | 800,400 | ||||||
| 27,000 | SM Energy Co., 6.125%, 11/15/2022 | 25,515 | ||||||
| 45,000 | SM Energy Co., 6.625%, 1/15/2027 | 39,825 | ||||||
| 190,000 | SM Energy Co., 6.750%, 9/15/2026 | 170,050 | ||||||
| 264,000 | Southwestern Energy Co., 6.200%, 1/23/2025 | 235,950 | ||||||
| 405,000 | Whiting Petroleum Corp., 5.750%, 3/15/2021 | 384,750 | ||||||
| 50,000 | Whiting Petroleum Corp., 6.250%, 4/01/2023 | 45,565 | ||||||
| 1,215,000 | Whiting Petroleum Corp., 6.625%, 1/15/2026 | 1,041,862 | ||||||
|
| |||||||
| 15,805,924 | ||||||||
|
| |||||||
| Integrated Energy — 0.1% |
| |||||||
| 200,000 | Geopark Ltd., 6.500%, 9/21/2024, 144A | 185,758 | ||||||
|
| |||||||
| Life Insurance — 0.2% |
| |||||||
| 340,000 | CNO Financial Group, Inc., 5.250%, 5/30/2025 | 323,850 | ||||||
|
| |||||||
| Local Authorities — 0.3% |
| |||||||
| 325,000 | Provincia de Buenos Aires, 6.500%, 2/15/2023, 144A | 261,427 | ||||||
| 270,000 | Provincia de Buenos Aires, 7.875%, 6/15/2027, 144A | 194,402 | ||||||
|
| |||||||
| 455,829 | ||||||||
|
| |||||||
See accompanying notes to financial statements.
| 16
Table of Contents
Portfolio of Investments – as of December 31, 2018
Loomis Sayles High Income Fund – (continued)
| Principal Amount | Description | Value (†) | ||||||
| Lodging — 0.9% |
| |||||||
| $ | 150,000 | Hilton Domestic Operating Co., Inc., 4.250%, 9/01/2024 | $ | 141,750 | ||||
| 755,000 | Hilton Worldwide Finance LLC/Hilton Worldwide Finance Corp., 4.625%, 4/01/2025 | 715,362 | ||||||
| 365,000 | Marriott Ownership Resorts, Inc., 6.500%, 9/15/2026, 144A | 352,225 | ||||||
|
| |||||||
| 1,209,337 | ||||||||
|
| |||||||
| Media Entertainment — 3.6% |
| |||||||
| 735,000 | AMC Networks, Inc., 4.750%, 8/01/2025 | 667,012 | ||||||
| 1,155,000 | Clear Channel Worldwide Holdings, Inc., Series B, 6.500%, 11/15/2022 | 1,155,000 | ||||||
| 1,305,000 | Clear Channel Worldwide Holdings, Inc., Series B, 7.625%, 3/15/2020 | 1,272,375 | ||||||
| 1,115,000 | iHeartCommunications, Inc., 9.000%, 12/15/2019(g) | 747,050 | ||||||
| 395,000 | Meredith Corp., 6.875%, 2/01/2026, 144A | 386,113 | ||||||
| 740,000 | Netflix, Inc., 4.875%, 4/15/2028 | 675,250 | ||||||
|
| |||||||
| 4,902,800 | ||||||||
|
| |||||||
| Metals & Mining — 2.1% |
| |||||||
| 190,000 | Commercial Metals Co., 4.875%, 5/15/2023 | 179,550 | ||||||
| 400,000 | First Quantum Minerals Ltd., 6.500%, 3/01/2024, 144A | 332,000 | ||||||
| 955,000 | First Quantum Minerals Ltd., 7.000%, 2/15/2021, 144A | 916,800 | ||||||
| 670,000 | First Quantum Minerals Ltd., 7.250%, 5/15/2022, 144A | 621,425 | ||||||
| 840,000 | FMG Resources (August 2006) Pty Ltd., 4.750%, 5/15/2022, 144A | 798,000 | ||||||
|
| |||||||
| 2,847,775 | ||||||||
|
| |||||||
| Midstream — 4.3% |
| |||||||
| 205,000 | EnLink Midstream Partners LP, 5.450%, 6/01/2047 | 165,789 | ||||||
| 360,000 | EnLink Midstream Partners LP, 5.600%, 4/01/2044 | 295,737 | ||||||
| 1,265,000 | Hess Infrastructure Partners LP/Hess Infrastructure Partners Finance Corp., 5.625%, 2/15/2026, 144A | 1,223,887 | ||||||
| 570,000 | NGL Energy Partners LP/NGL Energy Finance Corp., 5.125%, 7/15/2019 | 567,520 | ||||||
| 200,000 | NGL Energy Partners LP/NGL Energy Finance Corp., 6.125%, 3/01/2025 | 172,000 | ||||||
| 405,000 | NGL Energy Partners LP/NGL Energy Finance Corp., 7.500%, 11/01/2023 | 388,800 | ||||||
| 165,000 | NGPL PipeCo LLC, 4.375%, 8/15/2022, 144A | 160,463 | ||||||
| 700,000 | NGPL PipeCo LLC, 4.875%, 8/15/2027, 144A | 659,750 | ||||||
| 385,000 | SemGroup Corp./Rose Rock Finance Corp., 5.625%, 7/15/2022 | 362,863 | ||||||
| 935,000 | Summit Midstream Holdings LLC/Summit Midstream Finance Corp., 5.500%, 8/15/2022 | 888,250 | ||||||
| 95,000 | Targa Resources Partners LP/Targa Resources Partners Finance Corp., 4.250%, 11/15/2023 | 87,994 | ||||||
| 640,000 | Targa Resources Partners LP/Targa Resources Partners Finance Corp., 5.250%, 5/01/2023 | 627,200 | ||||||
| 305,000 | Transportadora de Gas del Sur S.A., 6.750%, 5/02/2025, 144A | 277,767 | ||||||
|
| |||||||
| 5,878,020 | ||||||||
|
| |||||||
| Non-Agency Commercial Mortgage-Backed Securities — 1.5% |
| |||||||
| 100,000 | CG-CCRE Commercial Mortgage Trust, Series2014-FL2, Class COL1, 1-month LIBOR + 3.500%, 5.955%, 11/15/2031, 144A(d)(h)(i) | 96,832 | ||||||
| 225,000 | CG-CCRE Commercial Mortgage Trust, Series2014-FL2, Class COL2, 1-month LIBOR + 4.500%, 6.955%, 11/15/2031, 144A(d)(h)(i) | 214,498 | ||||||
See accompanying notes to financial statements.
17 |
Table of Contents
Portfolio of Investments – as of December 31, 2018
Loomis Sayles High Income Fund – (continued)
| Principal Amount | Description | Value (†) | ||||||
| Non-Agency Commercial Mortgage-Backed Securities — continued |
| |||||||
| $ | 1,020,000 | Credit Suisse Mortgage Trust, Series2014-USA, Class E, 4.373%, 9/15/2037, 144A | $ | 912,767 | ||||
| 59,087 | GS Mortgage Securities Trust, Series 2007-GG10, Class AM, 5.780%, 8/10/2045(b) | 59,852 | ||||||
| 18,277 | JPMorgan Chase Commercial Mortgage Securities Trust, Series 2007-LDPX, Class AM, 5.464%, 1/15/2049(b) | 18,288 | ||||||
| 380,000 | Starwood Retail Property Trust, Series 2014-STAR, Class D, 1-month LIBOR + 3.250%, 5.705%, 11/15/2027, 144A(d)(h)(i) | 323,001 | ||||||
| 420,000 | Starwood Retail Property Trust, Series 2014-STAR, Class E, 1-month LIBOR + 4.150%, 6.605%, 11/15/2027, 144A(d) | 316,421 | ||||||
| 125,000 | WFRBS Commercial Mortgage Trust, Series2012-C7, Class E, 4.821%, 6/15/2045, 144A(b) | 104,073 | ||||||
|
| |||||||
| 2,045,732 | ||||||||
|
| |||||||
| Oil Field Services — 1.8% |
| |||||||
| 430,000 | Ensco PLC, 5.750%, 10/01/2044 | 240,318 | ||||||
| 490,000 | McDermott Technology Americas, Inc./McDermott Technology U.S., Inc., 10.625%, 5/01/2024, 144A | 413,437 | ||||||
| 160,000 | Noble Holding International Ltd., 5.250%, 3/15/2042 | 92,800 | ||||||
| 160,000 | Noble Holding International Ltd., 6.050%, 3/01/2041 | 98,400 | ||||||
| 420,000 | Noble Holding International Ltd., 7.750%, 1/15/2024 | 318,150 | ||||||
| 530,000 | Noble Holding International Ltd., 7.875%, 2/01/2026, 144A | 451,825 | ||||||
| 405,000 | Shelf Drilling Holdings Ltd., 8.250%, 2/15/2025, 144A | 346,275 | ||||||
| 175,000 | Transocean Guardian Ltd., 5.875%, 1/15/2024, 144A | 167,563 | ||||||
| 224,000 | Transocean Proteus Ltd., 6.250%, 12/01/2024, 144A | 214,480 | ||||||
| 175,000 | Transocean, Inc., 7.500%, 1/15/2026, 144A | 153,563 | ||||||
|
| |||||||
| 2,496,811 | ||||||||
|
| |||||||
| Packaging — 1.2% |
| |||||||
| 200,000 | ARD Finance S.A., 7.875% PIK, 7.125% Cash, 9/15/2023(f) | 179,500 | ||||||
| 395,000 | Ardagh Packaging Finance PLC/Ardagh MP Holdings USA, Inc., 4.625%, 5/15/2023, 144A | 377,225 | ||||||
| 1,165,000 | Ardagh Packaging Finance PLC/Ardagh MP Holdings USA, Inc., 7.250%, 5/15/2024, 144A | 1,162,087 | ||||||
|
| |||||||
| 1,718,812 | ||||||||
|
| |||||||
| Paper — 0.3% |
| |||||||
| 440,000 | Klabin Finance S.A., 4.875%, 9/19/2027, 144A | 399,300 | ||||||
|
| |||||||
| Pharmaceuticals — 2.0% |
| |||||||
| 265,000 | Bausch Health Cos., Inc., 5.500%, 3/01/2023, 144A | 242,475 | ||||||
| 66,000 | Bausch Health Cos., Inc., 5.625%, 12/01/2021, 144A | 65,010 | ||||||
| 1,350,000 | Bausch Health Cos., Inc., 5.875%, 5/15/2023, 144A | 1,248,750 | ||||||
| 280,000 | Catalent Pharma Solutions, Inc., 4.875%, 1/15/2026, 144A | 265,300 | ||||||
| 975,000 | Teva Pharmaceutical Finance Co. BV, 2.950%, 12/18/2022 | 862,251 | ||||||
|
| |||||||
| 2,683,786 | ||||||||
|
| |||||||
| Property & Casualty Insurance — 0.7% |
| |||||||
| 1,110,000 | Ardonagh Midco 3 PLC, 8.625%, 7/15/2023, 144A | 940,103 | ||||||
|
| |||||||
See accompanying notes to financial statements.
| 18
Table of Contents
Portfolio of Investments – as of December 31, 2018
Loomis Sayles High Income Fund – (continued)
| Principal Amount | Description | Value (†) | ||||||
| Refining — 0.4% |
| |||||||
| $ | 635,000 | Parkland Fuel Corp., 6.000%, 4/01/2026, 144A | $ | 595,313 | ||||
|
| |||||||
| Restaurants — 0.6% |
| |||||||
| 890,000 | 1011778 B.C. ULC/New Red Finance, Inc., 5.000%, 10/15/2025, 144A | 818,800 | ||||||
|
| |||||||
| Retailers — 2.3% |
| |||||||
| 830,000 | Asbury Automotive Group, Inc., 6.000%, 12/15/2024 | 794,725 | ||||||
| 820,000 | Group 1 Automotive, Inc., 5.000%, 6/01/2022 | 776,950 | ||||||
| 505,000 | JC Penney Corp., Inc., 5.875%, 7/01/2023, 144A | 406,525 | ||||||
| 475,000 | L Brands, Inc., 6.750%, 7/01/2036 | 387,125 | ||||||
| 180,000 | L Brands, Inc., 6.875%, 11/01/2035 | 150,336 | ||||||
| 665,000 | Party City Holdings, Inc., 6.625%, 8/01/2026, 144A | 605,150 | ||||||
|
| |||||||
| 3,120,811 | ||||||||
|
| |||||||
| Supermarkets — 0.7% |
| |||||||
| 335,000 | Albertson’s Cos. LLC/Safeway, Inc./New Albertson’s, Inc./Albertson’s LLC, 5.750%, 3/15/2025 | 293,125 | ||||||
| 935,000 | New Albertsons LP, Series C, MTN, 6.625%, 6/01/2028 | 691,900 | ||||||
|
| |||||||
| 985,025 | ||||||||
|
| |||||||
| Technology — 2.7% |
| |||||||
| 416,000 | Blackboard, Inc., 9.750%, 10/15/2021, 144A | 282,880 | ||||||
| 170,000 | Camelot Finance S.A., 7.875%, 10/15/2024, 144A | 164,050 | ||||||
| 60,000 | CommScope Technologies LLC, 6.000%, 6/15/2025, 144A | 54,600 | ||||||
| 1,205,000 | Dell International LLC/EMC Corp., 6.020%, 6/15/2026, 144A | 1,210,449 | ||||||
| 420,000 | First Data Corp., 5.375%, 8/15/2023, 144A | 412,650 | ||||||
| 190,000 | Open Text Corp., 5.875%, 6/01/2026, 144A | 186,200 | ||||||
| 275,000 | Sabre GLBL, Inc., 5.250%, 11/15/2023, 144A | 271,562 | ||||||
| 435,000 | Veritas U.S., Inc./Veritas Bermuda Ltd., 10.500%, 2/01/2024, 144A | 284,925 | ||||||
| 900,000 | Western Digital Corp., 4.750%, 2/15/2026 | 780,750 | ||||||
|
| |||||||
| 3,648,066 | ||||||||
|
| |||||||
| Transportation Services — 0.2% |
| |||||||
| 275,000 | APL Ltd., 8.000%, 1/15/2024(h)(i) | 244,626 | ||||||
|
| |||||||
| Wireless — 3.1% |
| |||||||
| 865,000 | Nokia Oyj, 4.375%, 6/12/2027 | 804,450 | ||||||
| 786,000 | Sprint Capital Corp., 6.875%, 11/15/2028 | 742,770 | ||||||
| 650,000 | Sprint Corp., 7.250%, 9/15/2021 | 665,275 | ||||||
| 920,000 | Sprint Corp., 7.875%, 9/15/2023 | 944,150 | ||||||
| 315,000 | T-Mobile USA, Inc., 4.500%, 2/01/2026 | 289,012 | ||||||
| 895,000 | T-Mobile USA, Inc., 4.750%, 2/01/2028 | 809,975 | ||||||
|
| |||||||
| 4,255,632 | ||||||||
|
| |||||||
| Wirelines — 1.3% |
| |||||||
| 130,000 | Cincinnati Bell Telephone Co. LLC, 6.300%, 12/01/2028 | 107,479 | ||||||
| 1,060,000 | Frontier Communications Corp., 8.500%, 4/01/2026, 144A | 927,500 | ||||||
| 405,000 | Frontier Communications Corp., 9.000%, 8/15/2031 | 216,675 | ||||||
| 120,000 | Telecom Italia Capital S.A., 7.200%, 7/18/2036 | 114,600 | ||||||
See accompanying notes to financial statements.
19 |
Table of Contents
Portfolio of Investments – as of December 31, 2018
Loomis Sayles High Income Fund – (continued)
| Principal Amount | Description | Value (†) | ||||||
| Wirelines — continued |
| |||||||
| $ | 505,000 | Windstream Services LLC/Windstream Finance Corp., 10.500%, 6/30/2024, 144A | $ | 383,800 | ||||
|
| |||||||
| 1,750,054 | ||||||||
|
| |||||||
| TotalNon-Convertible Bonds (Identified Cost $118,115,267) | 110,367,709 | |||||||
|
| |||||||
| Convertible Bonds — 9.9% | ||||||||
| Automotive — 0.3% |
| |||||||
| 390,000 | Meritor, Inc., 3.250%, 10/15/2037 | 340,517 | ||||||
|
| |||||||
| Cable Satellite — 1.2% |
| |||||||
| 1,515,000 | DISH Network Corp., 2.375%, 3/15/2024 | 1,206,192 | ||||||
| 580,000 | DISH Network Corp., 3.375%, 8/15/2026 | 468,359 | ||||||
|
| |||||||
| 1,674,551 | ||||||||
|
| |||||||
| Consumer Cyclical Services — 0.5% |
| |||||||
| 755,000 | Macquarie Infrastructure Corp., 2.000%, 10/01/2023 | 653,300 | ||||||
|
| |||||||
| Diversified Operations — 0.1% |
| |||||||
| 160,000 | RWT Holdings, Inc., 5.625%, 11/15/2019 | 160,701 | ||||||
|
| |||||||
| Healthcare — 0.5% |
| |||||||
| 190,000 | Evolent Health, Inc., 2.000%, 12/01/2021 | 210,686 | ||||||
| 125,000 | Insulet Corp., 1.375%, 11/15/2024, 144A | 132,752 | ||||||
| 275,000 | Wright Medical Group, Inc., 1.625%, 6/15/2023, 144A | 280,044 | ||||||
|
| |||||||
| 623,482 | ||||||||
|
| |||||||
| Independent Energy — 1.1% |
| |||||||
| 840,000 | Chesapeake Energy Corp., 5.500%, 9/15/2026 | 676,084 | ||||||
| 825,000 | PDC Energy, Inc., 1.125%, 9/15/2021 | 731,156 | ||||||
| 170,000 | Whiting Petroleum Corp., 1.250%, 4/01/2020 | 160,721 | ||||||
|
| |||||||
| 1,567,961 | ||||||||
|
| |||||||
| Industrial Other — 0.2% |
| |||||||
| 340,000 | Tutor Perini Corp., 2.875%, 6/15/2021 | 312,953 | ||||||
|
| |||||||
| Leisure — 0.1% |
| |||||||
| 185,000 | Rovi Corp., 0.500%, 3/01/2020 | 173,458 | ||||||
|
| |||||||
| Midstream — 0.0% |
| |||||||
| 60,000 | SM Energy Co., 1.500%, 7/01/2021 | 55,771 | ||||||
|
| |||||||
| Oil Field Services — 0.5% |
| |||||||
| 860,000 | Nabors Industries, Inc., 0.750%, 1/15/2024 | 531,248 | ||||||
| 225,000 | Oil States International, Inc., 1.500%, 2/15/2023, 144A | 184,414 | ||||||
|
| |||||||
| 715,662 | ||||||||
|
| |||||||
| Pharmaceuticals — 2.6% |
| |||||||
| 1,530,000 | BioMarin Pharmaceutical, Inc., 0.599%, 8/01/2024 | 1,521,430 | ||||||
| 265,000 | Dermira, Inc., 3.000%, 5/15/2022 | 204,426 | ||||||
| 475,000 | Flexion Therapeutics, Inc., 3.375%, 5/01/2024 | 390,583 | ||||||
| 745,000 | Intercept Pharmaceuticals, Inc., 3.250%, 7/01/2023 | 686,425 | ||||||
| 660,000 | Ionis Pharmaceuticals, Inc., 1.000%, 11/15/2021 | 706,268 | ||||||
|
| |||||||
| 3,509,132 | ||||||||
|
| |||||||
See accompanying notes to financial statements.
| 20
Table of Contents
Portfolio of Investments – as of December 31, 2018
Loomis Sayles High Income Fund – (continued)
| Principal Amount | Description | Value (†) | ||||||
| Railroads — 0.3% |
| |||||||
| $ | 385,000 | Greenbrier Cos., Inc. (The), 2.875%, 2/01/2024 | $ | 378,318 | ||||
|
| |||||||
| REITs – Diversified — 0.3% |
| |||||||
| 435,000 | iStar, Inc., 3.125%, 9/15/2022 | 391,952 | ||||||
|
| |||||||
| Technology — 2.0% |
| |||||||
| 570,000 | Avaya Holdings Corp., 2.250%, 6/15/2023, 144A | 486,295 | ||||||
| 865,000 | Finisar Corp., 0.500%, 12/15/2036 | 821,075 | ||||||
| 625,000 | Nuance Communications, Inc., 1.000%, 12/15/2035 | 537,406 | ||||||
| 315,000 | Nuance Communications, Inc., 1.250%, 4/01/2025 | 276,173 | ||||||
| 245,000 | Palo Alto Networks, Inc., 0.750%, 7/01/2023, 144A | 242,302 | ||||||
| 140,000 | Verint Systems, Inc., 1.500%, 6/01/2021 | 135,434 | ||||||
| 305,000 | Western Digital Corp., 1.500%, 2/01/2024, 144A | 247,173 | ||||||
|
| |||||||
| 2,745,858 | ||||||||
|
| |||||||
| Wirelines — 0.2% |
| |||||||
| 275,000 | GCI Liberty, Inc., 1.750%, 9/30/2046, 144A | 268,427 | ||||||
|
| |||||||
| Total Convertible Bonds (Identified Cost $14,909,751) | 13,572,043 | |||||||
|
| |||||||
| Total Bonds and Notes (Identified Cost $133,025,018) | 123,939,752 | |||||||
|
| |||||||
| Loan Participations — 0.3% | ||||||||
| ABS Other — 0.3% |
| |||||||
| 425,733 | Harbour Aircraft Investments Ltd., Series2017-1, Class C, 8.000%, 11/15/2037(a) (Identified Cost $424,760) | 425,679 | ||||||
|
| |||||||
| Senior Loans — 1.8% | ||||||||
| Retailers — 0.4% |
| |||||||
| 212,000 | J.C. Penney Corp., Inc., 2016 Term Loan B, 6/23/2023(j) | 180,200 | ||||||
| 461,941 | J.C. Penney Corp., Inc., 2016 Term Loan B,3-month LIBOR + 4.250%, 6.956%, 6/23/2023(d) | 392,650 | ||||||
|
| |||||||
| Total Retailers (Identified Cost $607,345) | 572,850 | |||||||
|
| |||||||
| Supermarkets — 0.6% |
| |||||||
| 422,927 | Albertsons LLC, USD 2017 Term Loan B5, 12/21/2022(j) | 405,244 | ||||||
| 429,000 | Albertsons LLC, Term Loan B7,1-month LIBOR + 3.000%, 5.522%, 11/17/2025(d) | 405,941 | ||||||
|
| |||||||
| 811,185 | ||||||||
|
| |||||||
| Transportation Services — 0.8% |
| |||||||
| 1,037,012 | Uber Technologies, 2018 Term Loan,1-month LIBOR + 4.000%, 6.387%, 4/04/2025(d) | 1,008,494 | ||||||
|
| |||||||
| Total Senior Loans (Identified Cost $2,479,828) | 2,392,529 | |||||||
|
| |||||||
See accompanying notes to financial statements.
21 |
Table of Contents
Portfolio of Investments – as of December 31, 2018
Loomis Sayles High Income Fund – (continued)
Shares | Description | Value (†) | ||||||
| Preferred Stocks — 1.5% | ||||||||
| Food & Beverage — 1.1% |
| |||||||
| 14,765 | Bunge Ltd., 4.875% | $ | 1,433,853 | |||||
|
| |||||||
| Midstream — 0.4% |
| |||||||
| 988 | Chesapeake Energy Corp., 5.750% | 509,662 | ||||||
| 20 | Chesapeake Energy Corp., 5.750%, 144A | 10,317 | ||||||
| 137 | Chesapeake Energy Corp., 5.750%(a) | 58,567 | ||||||
|
| |||||||
| 578,546 | ||||||||
|
| |||||||
| Total Preferred Stocks (Identified Cost $2,234,677) | 2,012,399 | |||||||
|
| |||||||
| Other Investments — 0.6% | ||||||||
| Aircraft ABS — 0.6% |
| |||||||
| 100 | ECAF I Blocker Ltd.(a)(c)(h)(k) (Identified Cost $1,000,000) | 865,625 | ||||||
|
| |||||||
| Principal Amount | ||||||||
| Short-Term Investments — 20.6% | ||||||||
| $ | 28,093,324 | Tri-Party Repurchase Agreement with Fixed Income Clearing Corporation, dated 12/31/2018 at 1.500% to be repurchased at $28,095,666 on 1/02/2019 collateralized by $23,255,000 U.S. Treasury Bond, 4.375% due 5/15/2041 valued at $28,661,206 including accrued interest (Note 2 of Notes to Financial Statements) (Identified Cost $28,093,324) | 28,093,324 | |||||
|
| |||||||
| Total Investments — 115.6% (Identified Cost $167,257,607) | 157,729,308 | |||||||
| Other assets less liabilities — (15.6)% | (21,251,074 | ) | ||||||
|
| |||||||
| Net Assets — 100.0% | $ | 136,478,234 | ||||||
|
| |||||||
| (†) | See Note 2 of Notes to Financial Statements. | |||||||
| (a) | Level 3 security. Value has been determined using significant unobservable inputs. See Note 3 of Notes to Financial Statements. |
| ||||||
| (b) | Variable rate security. The interest rate adjusts periodically based on; (i) changes in current interest rates and/or prepayments on underlying pools of assets, if applicable, (ii) reference to a base lending rate plus or minus a margin, and/or (iii) reference to a base lending rate adjusted by a multiplier and/or subject to certain floors or caps. Rate as of December 31, 2018 is disclosed. |
| ||||||
| (c) | Fair valued by the Fund’s adviser. At December 31, 2018, the value of these securities amounted to $866,211 or 0.6% of net assets. See Note 2 of Notes to Financial Statements. |
| ||||||
| (d) | Variable rate security. Rate as of December 31, 2018 is disclosed. |
| ||||||
| (e) | Security (or a portion thereof) has been designated to cover the Fund’s obligations under open derivative contracts. |
| ||||||
| (f) | Payment-in-kind security for which the issuer has the option at each interest payment date of making interest payments in cash or additional principal. For the period ended December 31, 2018, interest payments were made in cash. |
| ||||||
See accompanying notes to financial statements.
| 22
Table of Contents
Portfolio of Investments – as of December 31, 2018
Loomis Sayles High Income Fund – (continued)
| (g) | The issuer is in default with respect to interest and/or principal payments. Income is not being accrued. |
| ||||||
| (h) | Illiquid security. (Unaudited) |
| ||||||
| (i) | Securities classified as fair valued pursuant to the Fund’s pricing policies and procedures. At December 31, 2018, the value of these securities amounted to $878,957 or 0.6% of net assets. See Note 2 of Notes to Financial Statements. |
| ||||||
| (j) | Position is unsettled. Contract rate was not determined at December 31, 2018 and does not take effect until settlement date. Maturity date is not finalized until settlement date. |
| ||||||
| (k) | Securities subject to restriction on resale. At December 31, 2018, the restricted securities held by the Fund are as follows: |
| ||||||
| Acquisition Date | Acquisition Cost | Value | % of Net Assets | |||||||||||
| ECAF I Blocker Ltd. | December 20, 2016 | $ | 1,000,000 | $ | 865,625 | 0.6% | ||||||||
| 144A | All or a portion of these securities are exempt from registration under Rule 144A of the Securities Act of 1933. These securities may be resold in transactions exempt from registration, normally to qualified institutional buyers. At December 31, 2018, the value of Rule 144A holdings amounted to $60,625,842 or 44.4% of net assets. |
| ||||||
| ABS | Asset-Backed Securities | |||||||
| LIBOR | London Interbank Offered Rate | |||||||
| MTN | Medium Term Note | |||||||
| PIK | Payment-in-Kind | |||||||
| REITs | Real Estate Investment Trusts | |||||||
| GBP | British Pound | |||||||
| ZAR | South African Rand | |||||||
At December 31, 2018, the Fund had the following open forward foreign currency contracts:
| Counterparty | Delivery Date | Currency Bought/ Sold (B/S) | Units of Currency | In Exchange for | Notional Value | Unrealized Appreciation (Depreciation) | ||||||||||||||||||||||
HSBC Bank USA | 2/04/2019 | GBP | B | 340,000 | $ | 447,077 | $ | 434,051 | $ | (13,026 | ) | |||||||||||||||||
HSBC Bank USA | 2/04/2019 | GBP | S | 340,000 | 436,304 | 434,051 | 2,253 | |||||||||||||||||||||
Bank of America N.A | 2/04/2019 | ZAR | B | 25,220,000 | 1,719,116 | 1,746,214 | 27,098 | |||||||||||||||||||||
Bank of America N.A | 2/04/2019 | ZAR | S | 25,220,000 | 1,685,795 | 1,746,214 | (60,419 | ) | ||||||||||||||||||||
|
| |||||||||||||||||||||||||||
Total |
| $ | (44,094 | ) | ||||||||||||||||||||||||
|
| |||||||||||||||||||||||||||
See accompanying notes to financial statements.
23 |
Table of Contents
Portfolio of Investments – as of December 31, 2018
Loomis Sayles High Income Fund – (continued)
Industry Summary at December 31, 2018
Independent Energy | 12.7 | % | ||
Cable Satellite | 8.1 | |||
Healthcare | 5.1 | |||
Midstream | 4.7 | |||
Technology | 4.7 | |||
Finance Companies | 4.6 | |||
Pharmaceuticals | 4.6 | |||
Media Entertainment | 3.6 | |||
Food & Beverage | 3.5 | |||
Wireless | 3.1 | |||
Banking | 3.1 | |||
Building Materials | 2.8 | |||
Retailers | 2.7 | |||
Oil Field Services | 2.3 | |||
Metals & Mining | 2.1 | |||
Other Investments, less than 2% each | 27.3 | |||
Short-Term Investments | 20.6 | |||
|
| |||
Total Investments | 115.6 | |||
Other assets less liabilities (including forward foreign currency contracts) | (15.6 | ) | ||
|
| |||
Net Assets | 100.0 | % | ||
|
|
See accompanying notes to financial statements.
| 24
Table of Contents
Portfolio of Investments – as of December 31, 2018
Loomis Sayles Investment Grade Bond Fund
| Principal Amount (‡) | Description | Value (†) | ||||||
| Bonds and Notes — 83.3% of Net Assets | ||||||||
| Non-Convertible Bonds — 81.6% | ||||||||
| ABS Car Loan — 4.3% |
| |||||||
| $ | 20,902,000 | Ally Auto Receivables Trust, Series2017-3, Class A3, 1.740%, 9/15/2021 | $ | 20,706,221 | ||||
| 10,515,000 | AmeriCredit Automobile Receivables Trust, Series2018-3, Class D, 4.040%, 11/18/2024 | 10,645,240 | ||||||
| 6,317,885 | BMW Vehicle Owner Trust, Series2016-A, Class A3, 1.160%, 11/25/2020 | 6,276,831 | ||||||
| 3,650,000 | CarMax Auto Owner Trust, Series2018-3, Class D, 3.910%, 1/15/2025 | 3,660,478 | ||||||
| 22,010,000 | Credit Acceptance Auto Loan Trust, Series2018-2A, Class A, 3.470%, 5/17/2027, 144A | 21,968,885 | ||||||
| 6,555,000 | Drive Auto Receivables Trust, Series2018-5, Class D, 4.300%, 4/15/2026 | 6,639,626 | ||||||
| 3,122,000 | Ford Credit Auto Owner Trust, Series2017-B, Class A3, 1.690%, 11/15/2021 | 3,083,523 | ||||||
| 6,770,000 | Ford Credit Auto Owner Trust, Series2018-A, Class A3, 3.030%, 11/15/2022 | 6,773,149 | ||||||
| 6,697,430 | Honda Auto Receivables Owner Trust, Series2016-4, Class A3, 1.210%, 12/18/2020 | 6,637,116 | ||||||
| 2,103,000 | Honda Auto Receivables Owner Trust, Series2017-2, Class A3, 1.680%, 8/16/2021 | 2,081,255 | ||||||
| 28,000,000 | Honda Auto Receivables Owner Trust, Series2018-4, Class A3, 3.160%, 1/17/2023 | 28,133,025 | ||||||
| 25,503,002 | Nissan Auto Receivables Owner Trust, Series2016-C, Class A3, 1.180%, 1/15/2021 | 25,263,710 | ||||||
| 26,135,000 | Nissan Auto Receivables Owner Trust, Series2018-C, Class A3, 3.220%, 6/15/2023 | 26,323,091 | ||||||
| 12,632,000 | Toyota Auto Receivables Owner Trust, Series2017-B, Class A3, 1.760%, 7/15/2021 | 12,515,467 | ||||||
| 15,720,000 | Toyota Auto Receivables Owner Trust, Series2017-D, Class A3, 1.930%, 1/18/2022 | 15,500,980 | ||||||
| 27,000,000 | Toyota Auto Receivables Owner Trust, Series2018-A, Class A3, 2.350%, 5/16/2022(a) | 26,740,395 | ||||||
| 4,500,000 | Toyota Auto Receivables Owner Trust, Series2018-C, Class A2A, 2.770%, 8/16/2021 | 4,489,051 | ||||||
|
| |||||||
| 227,438,043 | ||||||||
|
| |||||||
| ABS Credit Card — 4.8% |
| |||||||
| 14,559,000 | American Express Credit Account Master Trust, Series2017-1, Class A, 1.930%, 9/15/2022 | 14,386,811 | ||||||
| 10,434,000 | American Express Credit Account Master Trust, Series2017-6, Class A, 2.040%, 5/15/2023 | 10,273,110 | ||||||
| 3,000,000 | American Express Credit Account Master Trust, Series2018-1, Class A, 2.670%, 10/17/2022 | 2,988,322 | ||||||
| 9,770,000 | BA Credit Card Trust, Series2017-A2, Class A2, 1.840%, 1/17/2023 | 9,595,101 | ||||||
| 28,630,000 | BA Credit Card Trust, Series2018-A2, Class A2, 3.000%, 9/15/2023(a) | 28,710,900 | ||||||
| 24,885,000 | Capital One Multi-Asset Execution Trust, Series2015-A2, Class A2, 2.080%, 3/15/2023 | 24,586,096 | ||||||
| 9,480,000 | Capital One Multi-Asset Execution Trust, Series2016-A3, Class A3, 1.340%, 4/15/2022 | 9,407,015 | ||||||
| 6,170,000 | Capital One Multi-Asset Execution Trust, Series2017-A4, Class A4, 1.990%, 7/17/2023 | 6,074,210 | ||||||
See accompanying notes to financial statements.
25 |
Table of Contents
Portfolio of Investments – as of December 31, 2018
Loomis Sayles Investment Grade Bond Fund – (continued)
| Principal Amount (‡) | Description | Value (†) | ||||||
| ABS Credit Card — continued |
| |||||||
| $ | 17,700,000 | Chase Issuance Trust, Series2012-A4, Class A4, 1.580%, 8/15/2021 | $ | 17,555,904 | ||||
| 7,915,000 | Chase Issuance Trust, Series2015-A4, Class A4, 1.840%, 4/15/2022 | 7,796,723 | ||||||
| 31,257,000 | Chase Issuance Trust, Sries2016-A5, Class A5, 1.270%, 7/15/2021 | 30,983,017 | ||||||
| 22,714,000 | Citibank Credit Card Issuance Trust, Series2014-A6, Class A6, 2.150%, 7/15/2021 | 22,620,471 | ||||||
| 13,575,000 | Citibank Credit Card Issuance Trust, Series2016-A1, Class A1, 1.750%, 11/19/2021 | 13,430,952 | ||||||
| 10,366,000 | Citibank Credit Card Issuance Trust, Series2017-A3, Class A3, 1.920%, 4/07/2022 | 10,233,786 | ||||||
| 13,235,000 | Citibank Credit Card Issuance Trust, Series2017-A8, Class A8, 1.860%, 8/08/2022 | 13,019,325 | ||||||
| 35,306,000 | Discover Card Execution Note Trust, Series2016-A4, Class A4, 1.390%, 3/15/2022 | 34,916,487 | ||||||
|
| |||||||
| 256,578,230 | ||||||||
|
| |||||||
| ABS Home Equity — 0.7% |
| |||||||
| 1,534,525 | Bayview Opportunity Master Fund Trust, Series2018-RN3, Class A1, 3.672%, 3/28/2033, 144A(b) | 1,533,133 | ||||||
| 3,147,076 | Bayview Opportunity Master Fund Trust, Series2018-RN8, Class A1, 4.066%, 9/28/2033, 144A(b) | 3,150,318 | ||||||
| 1,432,827 | CAM Mortgage Trust, Series2018-1, Class A1, 3.960%, 12/01/2065, 144A(b) | 1,442,430 | ||||||
| 1,394,900 | Gosforth Funding PLC, Series2018-1A, Class A1, 3-month LIBOR + 0.450%, 3.139%, 8/25/2060, 144A(c) | 1,389,078 | ||||||
| 2,481,000 | Holmes Master Issuer PLC, Series2018-1A, Class A2, 3-month LIBOR + 0.360%, 2.796%, 10/15/2054, 144A(c) | 2,473,413 | ||||||
| 9,990,147 | Progress Residential Trust, Series 2016-SFR2, Class A, 1-month LIBOR + 1.400%, 3.855%, 1/17/2034, 144A(c) | 10,001,739 | ||||||
| 3,620,982 | Sequoia Mortgage Trust, Series2017-CH2, Class A1, 4.000%, 12/25/2047, 144A(b) | 3,659,613 | ||||||
| 5,626,273 | Sequoia Mortgage Trust, Series2018-CH1, Class A1, 4.000%, 2/25/2048, 144A(b) | 5,679,462 | ||||||
| 2,099,979 | Towd Point Mortgage Trust, Series2016-1, Class A1B, 2.750%, 2/25/2055, 144A(b) | 2,071,048 | ||||||
| 1,944,991 | Vericrest Opportunity Loan Trust, Series 2018-NPL8, Class A1A, 4.213%, 10/26/2048, 144A(b) | 1,941,279 | ||||||
| 2,743,862 | Wells Fargo Mortgage Backed Securities Trust, Series2005-AR2, Class 3A1, 3.994%, 3/25/2035(b) | 2,790,072 | ||||||
|
| |||||||
| 36,131,585 | ||||||||
|
| |||||||
| ABS Other — 2.3% |
| |||||||
| 47,218,336 | FAN Engine Securitization Ltd., Series2013-1A, Class 1A, 4.625%, 10/15/2043, 144A(d)(e)(f) | 46,675,325 | ||||||
| 13,595,000 | Horizon Aircraft Finance I Ltd., Series2018-1, Class A, 4.458%, 12/15/2038, 144A | 13,857,744 | ||||||
| 8,720,000 | Kestrel Aircraft Funding Ltd., Series2018-1A, Class A, 4.250%, 12/15/2038, 144A(d) | 8,473,387 | ||||||
| 13,610,000 | Mariner Finance Issuance Trust, Series2018-AA, Class A, 4.200%, 11/20/2030, 144A | 13,759,916 | ||||||
See accompanying notes to financial statements.
| 26
Table of Contents
Portfolio of Investments – as of December 31, 2018
Loomis Sayles Investment Grade Bond Fund – (continued)
| Principal Amount (‡) | Description | Value (†) | ||||||
| ABS Other — continued |
| |||||||
| $ | 17,507,911 | S-Jets Ltd., Series2017-1, Class A, 3.967%, 8/15/2042, 144A | $ | 17,662,602 | ||||
| 1,190,000 | SLM Private Credit Student Loan Trust, Series2003-C, Class A3, 28-day ARS, 4.330%, 9/15/2032(c)(d) | 1,186,653 | ||||||
| 1,220,000 | SLM Private Credit Student Loan Trust, Series2003-C, Class A4, 28-day ARS, 4.870%, 9/15/2032(c)(d) | 1,216,569 | ||||||
| 6,720,000 | SoFi Consumer Loan Program Trust, Series2018-4, Class C, 4.170%, 11/26/2027, 144A | 6,821,144 | ||||||
| 10,403,392 | Trinity Rail Leasing LLC, Series2010-1A, Class A, 5.194%, 10/16/2040, 144A | 11,066,392 | ||||||
|
| |||||||
| 120,719,732 | ||||||||
|
| |||||||
| ABS Student Loan — 0.2% |
| |||||||
| 6,910,000 | Navient Student Loan Trust, Series2018-EA, Class A2, 4.000%, 12/15/2059, 144A | 7,061,395 | ||||||
| 1,033,000 | SLM Private Credit Student Loan Trust, Series2003-A, Class A3, 28-day ARS, 4.750%, 6/15/2032(c)(d) | 1,032,794 | ||||||
| 780,000 | SLM Private Credit Student Loan Trust, Series2003-A, Class A4, 28-day ARS, 4.770%, 6/15/2032(c)(d) | 777,806 | ||||||
| 1,454,000 | SLM Private Credit Student Loan Trust, Series2003-B, Class A3, 28-day ARS, 4.750%, 3/15/2033(c)(d) | 1,453,709 | ||||||
| 995,000 | SLM Private Credit Student Loan Trust, Series2003-B, Class A4, 28-day ARS, 4.810%, 3/15/2033(c)(d) | 994,801 | ||||||
|
| |||||||
| 11,320,505 | ||||||||
|
| |||||||
| ABS Whole Business — 1.2% |
| |||||||
| 7,156,452 | Adams Outdoor Advertising LP, Series2018-1, Class A, 4.810%, 11/15/2048, 144A | 7,360,188 | ||||||
| 3,595,000 | Adams Outdoor Advertising LP, Series2018-1, Class B, 5.653%, 11/15/2048, 144A | 3,702,129 | ||||||
| 27,481,500 | Coinstar Funding LLC, Series2017-1A, Class A2, 5.216%, 4/25/2047, 144A | 27,784,910 | ||||||
| 4,962,500 | Five Guys Funding LLC, Series2017-1A, Class A2, 4.600%, 7/25/2047, 144A | 5,060,840 | ||||||
| 13,595,000 | Taco Bell Funding LLC, Series2018-1A, Class A2I, 4.318%, 11/25/2048, 144A | 13,762,762 | ||||||
| 3,700,000 | Wingstop Funding LLC, Series2018-1, Class A2, 4.970%, 12/05/2048, 144A | 3,783,805 | ||||||
|
| |||||||
| 61,454,634 | ||||||||
|
| |||||||
| Aerospace & Defense — 1.7% |
| |||||||
| 6,195,000 | Embraer Netherlands Finance BV, 5.400%, 2/01/2027 | 6,396,399 | ||||||
| 550,000 | Leonardo U.S. Holdings, Inc., 6.250%, 1/15/2040, 144A | 513,079 | ||||||
| 650,000 | Leonardo U.S. Holdings, Inc., 7.375%, 7/15/2039 | 682,500 | ||||||
| 78,795,000 | Textron, Inc., 5.950%, 9/21/2021 | 83,124,733 | ||||||
|
| |||||||
| 90,716,711 | ||||||||
|
| |||||||
| Airlines — 0.8% |
| |||||||
| 3,211,778 | Air Canada Pass Through Trust, Series2013-1, Class B, 5.375%, 11/15/2022, 144A | 3,246,465 | ||||||
| 1,868,814 | American Airlines Pass Through Certificates, Series2016-3, Class B, 3.750%, 4/15/2027 | 1,793,846 | ||||||
| 697,843 | American Airlines Pass Through Certificates, Series2017-2, Class B, 3.700%, 4/15/2027 | 674,978 | ||||||
See accompanying notes to financial statements.
27 |
Table of Contents
Portfolio of Investments – as of December 31, 2018
Loomis Sayles Investment Grade Bond Fund – (continued)
| Principal Amount (‡) | Description | Value (†) | ||||||
| Airlines — continued |
| |||||||
| $ | 1,356,446 | Continental Airlines Pass Through Certificates, Series2012-1, Class B, 6.250%, 10/11/2021 | $ | 1,376,495 | ||||
| 213,322 | Continental Airlines Pass Through Trust, Series1999-1, Class A, 6.545%, 8/02/2020 | 213,863 | ||||||
| 324,173 | Continental Airlines Pass Through Trust, Series2001-1,Class A-1, 6.703%, 12/15/2022 | 338,174 | ||||||
| 1,119,507 | Delta Air Lines Pass Through Trust, Series2007-1, Class A, 6.821%, 2/10/2024(d) | 1,202,015 | ||||||
| 5,973,407 | Delta Air Lines Pass Through Trust, Series2007-1, Class B, 8.021%, 2/10/2024 | 6,499,665 | ||||||
| 9,346,973 | Delta Air Lines Pass Through Trust, Series2009-1, Class A, 7.750%, 6/17/2021 | 9,662,339 | ||||||
| 14,605,319 | UAL Pass Through Trust, Series2007-1, Class A, 6.636%, 1/02/2024 | 15,188,071 | ||||||
| 726,269 | Virgin Australia Pass Through Certificates, Series2013-1A, 5.000%, 4/23/2025, 144A | 736,139 | ||||||
|
| |||||||
| 40,932,050 | ||||||||
|
| |||||||
| Automotive — 1.5% |
| |||||||
| 23,581,000 | Cummins, Inc., 5.650%, 3/01/2098 | 25,022,978 | ||||||
| 5,274,000 | Cummins, Inc., 6.750%, 2/15/2027 | 6,154,116 | ||||||
| 255,000 | Ford Motor Co., 6.625%, 2/15/2028 | 254,100 | ||||||
| 240,000 | Ford Motor Co., 7.500%, 8/01/2026 | 259,673 | ||||||
| 14,000,000 | Toyota Motor Credit Corp., 1.950%, 4/17/2020 | 13,826,122 | ||||||
| 26,263,000 | Toyota Motor Credit Corp., GMTN, 1.900%, 4/08/2021 | 25,746,871 | ||||||
| 10,000,000 | Toyota Motor Credit Corp., MTN, 2.150%, 3/12/2020 | 9,884,183 | ||||||
|
| |||||||
| 81,148,043 | ||||||||
|
| |||||||
| Banking — 8.6% |
| |||||||
| 38,233,000 | Ally Financial, Inc., 4.625%, 3/30/2025 | 37,038,219 | ||||||
| 1,468,000 | Ally Financial, Inc., 8.000%, 11/01/2031 | 1,625,810 | ||||||
| 22,839,000 | Bank of America Corp., 6.110%, 1/29/2037 | 25,100,901 | ||||||
| 49,304,000 | Bank of America Corp., (fixed rate to 12/20/2027, variable rate thereafter), 3.419%, 12/20/2028 | 46,057,307 | ||||||
| 100,000 | Bank of America Corp., MTN, 4.250%, 10/22/2026 | 97,260 | ||||||
| 25,627,000 | Bank of America Corp., Series L, MTN, 4.183%, 11/25/2027 | 24,631,801 | ||||||
| 22,500,000 | BNP Paribas S.A., (fixed rate to 3/01/2028, variable rate thereafter), 4.375%, 3/01/2033, 144A | 21,062,319 | ||||||
| 460,000 | Capital One Financial Corp., 4.200%, 10/29/2025 | 442,577 | ||||||
| 17,000,000 | Citigroup, Inc., 3.500%, 5/15/2023 | 16,689,659 | ||||||
| 1,660,000 | Citigroup, Inc., 4.500%, 1/14/2022 | 1,696,079 | ||||||
| 7,155,000 | Credit Agricole S.A., (fixed rate to 1/10/2028, variable rate thereafter), 4.000%, 1/10/2033, 144A | 6,536,379 | ||||||
| 22,154,000 | Deutsche Bank AG, (fixed rate to 12/01/2027, variable rate thereafter), 4.875%, 12/01/2032 | 17,225,621 | ||||||
| 6,645,000 | Goldman Sachs Group, Inc. (The), GMTN, 5.375%, 3/15/2020 | 6,793,587 | ||||||
| 70,245,000 | JPMorgan Chase & Co., 4.125%, 12/15/2026 | 68,536,684 | ||||||
| 100,000 | Keybank NA, 6.950%, 2/01/2028 | 118,538 | ||||||
| 4,228,000 | Lloyds Banking Group PLC, 4.344%, 1/09/2048 | 3,336,366 | ||||||
| 5,973,000 | Lloyds Banking Group PLC, 4.582%, 12/10/2025 | 5,654,655 | ||||||
See accompanying notes to financial statements.
| 28
Table of Contents
Portfolio of Investments – as of December 31, 2018
Loomis Sayles Investment Grade Bond Fund – (continued)
| Principal Amount (‡) | Description | Value (†) | ||||||
| Banking — continued |
| |||||||
| $ | 872,000 | Lloyds Banking Group PLC, 5.300%, 12/01/2045 | $ | 793,732 | ||||
| 1,845,000 | Morgan Stanley, 4.350%, 9/08/2026 | 1,792,979 | ||||||
| 5,900,000 | Morgan Stanley, 5.750%, 1/25/2021 | 6,151,639 | ||||||
| 20,695,000 | Morgan Stanley, MTN, 4.100%, 5/22/2023 | 20,724,891 | ||||||
| 38,206,000 | Morgan Stanley, Series F, GMTN, 5.625%, 9/23/2019 | 38,771,405 | ||||||
| 8,638,000 | National City Corp., 6.875%, 5/15/2019 | 8,756,542 | ||||||
| 23,975,000 | Royal Bank of Scotland Group PLC, 6.000%, 12/19/2023 | 24,265,172 | ||||||
| 14,750,000 | Royal Bank of Scotland Group PLC, 6.100%, 6/10/2023 | 14,982,941 | ||||||
| 15,160,000 | Santander Holdings USA, Inc., 4.450%, 12/03/2021 | 15,422,657 | ||||||
| 20,295,000 | Societe Generale S.A., 4.250%, 4/14/2025, 144A | 19,459,861 | ||||||
| 21,340,000 | Standard Chartered PLC, 3-month LIBOR + 1.150%, 3.558%, 1/20/2023, 144A(c) | 21,056,818 | ||||||
| 5,900,000 | Standard Chartered PLC, (fixed rate to 1/20/2022, variable rate thereafter), 4.247%, 1/20/2023, 144A | 5,836,221 | ||||||
|
| |||||||
| 460,658,620 | ||||||||
|
| |||||||
| Brokerage — 1.5% |
| |||||||
| 50,270,000 | Jefferies Group LLC, 5.125%, 1/20/2023 | 51,399,523 | ||||||
| 19,498,000 | Jefferies Group LLC, 6.250%, 1/15/2036 | 19,550,565 | ||||||
| 8,760,000 | Jefferies Group LLC, 6.450%, 6/08/2027 | 9,159,715 | ||||||
|
| |||||||
| 80,109,803 | ||||||||
|
| |||||||
| Building Materials — 0.7% |
| |||||||
| 1,610,000 | Masco Corp., 6.500%, 8/15/2032 | 1,779,774 | ||||||
| 3,110,000 | Masco Corp., 7.125%, 3/15/2020 | 3,248,783 | ||||||
| 2,667,000 | Masco Corp., 7.750%, 8/01/2029 | 3,178,263 | ||||||
| 23,975,000 | Owens Corning, 7.000%, 12/01/2036 | 26,515,428 | ||||||
|
| |||||||
| 34,722,248 | ||||||||
|
| |||||||
| Cable Satellite — 0.8% |
| |||||||
| 10,320,000 | Cox Communications, Inc., 4.500%, 6/30/2043, 144A | 8,702,819 | ||||||
| 5,820,000 | Cox Communications, Inc., 4.700%, 12/15/2042, 144A | 5,124,323 | ||||||
| 13,630,000 | Time Warner Cable LLC, 4.125%, 2/15/2021 | 13,685,830 | ||||||
| 8,990,000 | Time Warner Cable LLC, 4.500%, 9/15/2042 | 7,227,091 | ||||||
| 8,975,000 | Time Warner Cable LLC, 5.500%, 9/01/2041 | 8,178,766 | ||||||
|
| |||||||
| 42,918,829 | ||||||||
|
| |||||||
| Chemicals — 1.7% |
| |||||||
| 27,205,000 | CF Industries, Inc., 4.500%, 12/01/2026, 144A | 26,587,865 | ||||||
| 15,145,000 | DowDuPont, Inc., 3.766%, 11/15/2020 | 15,290,198 | ||||||
| 50,500,000 | INVISTA Finance LLC, 4.250%, 10/15/2019, 144A | 50,125,988 | ||||||
|
| |||||||
| 92,004,051 | ||||||||
|
| �� | ||||||
| Construction Machinery — 1.2% |
| |||||||
| 17,058,000 | Caterpillar Financial Services Corp., 1.931%, 10/01/2021 | 16,517,412 | ||||||
| 12,000,000 | Caterpillar, Inc., 3.900%, 5/27/2021 | 12,217,188 | ||||||
| 10,400,000 | John Deere Capital Corp., 2.550%, 1/08/2021 | 10,306,027 | ||||||
| 11,005,000 | John Deere Capital Corp., MTN, 2.350%, 1/08/2021 | 10,854,135 | ||||||
See accompanying notes to financial statements.
29 |
Table of Contents
Portfolio of Investments – as of December 31, 2018
Loomis Sayles Investment Grade Bond Fund – (continued)
| Principal Amount (‡) | Description | Value (†) | ||||||
| Construction Machinery — continued |
| |||||||
| $ | 6,105,000 | John Deere Capital Corp., MTN, 3.900%, 7/12/2021 | $ | 6,221,134 | ||||
| 6,787,000 | Toro Co. (The), 6.625%, 5/01/2037(e)(f) | 7,899,018 | ||||||
|
| |||||||
| 64,014,914 | ||||||||
|
| |||||||
| Consumer Cyclical Services — 0.5% |
| |||||||
| 29,995,000 | Expedia Group, Inc., 3.800%, 2/15/2028 | 27,200,481 | ||||||
|
| |||||||
| Consumer Products — 0.7% |
| |||||||
| 7,458,000 | Hasbro, Inc., 6.600%, 7/15/2028 | 8,524,031 | ||||||
| 27,515,000 | Unilever Capital Corp., 3.000%, 3/07/2022 | 27,303,410 | ||||||
|
| |||||||
| 35,827,441 | ||||||||
|
| |||||||
| Diversified Manufacturing — 0.3% |
| |||||||
| 5,305,000 | General Electric Co., Series A, MTN,3-month LIBOR + 0.300%, 2.736%, 5/13/2024(c) | 4,350,100 | ||||||
| 13,160,000 | Votorantim Cimentos S.A., 7.250%, 4/05/2041, 144A | 13,456,100 | ||||||
|
| |||||||
| 17,806,200 | ||||||||
|
| |||||||
| Electric — 1.5% |
| |||||||
| 22,667,100 | Alta Wind Holdings LLC, 7.000%, 6/30/2035, 144A | 24,605,325 | ||||||
| 30,430,000 | EDP Finance BV, 4.125%, 1/15/2020, 144A | 30,461,647 | ||||||
| 13,025,000 | Enel Finance International NV, 6.000%, 10/07/2039, 144A | 12,912,086 | ||||||
| 9,007,000 | Enel Finance International NV, 6.800%, 9/15/2037, 144A | 9,667,152 | ||||||
|
| |||||||
| 77,646,210 | ||||||||
|
| |||||||
| Finance Companies — 2.0% |
| |||||||
| 12,430,000 | Aircastle Ltd., 4.125%, 5/01/2024 | 11,729,592 | ||||||
| 20,595,000 | Aircastle Ltd., 4.400%, 9/25/2023 | 20,255,650 | ||||||
| 8,160,000 | Aircastle Ltd., 5.000%, 4/01/2023 | 8,192,065 | ||||||
| 6,700,000 | Antares Holdings LP, 6.000%, 8/15/2023, 144A | 6,623,241 | ||||||
| 18,830,000 | International Lease Finance Corp., 4.625%, 4/15/2021 | 19,009,531 | ||||||
| 8,565,000 | Ladder Capital Finance Holdings LLLP/Ladder Capital Finance Corp., 5.250%, 3/15/2022, 144A | 8,329,462 | ||||||
| 18,000,000 | Navient LLC, 5.500%, 1/25/2023 | 15,750,000 | ||||||
| 15,116,000 | Navient LLC, Series A, MTN, 5.625%, 8/01/2033 | 9,976,560 | ||||||
| 7,805,000 | Quicken Loans, Inc., 5.250%, 1/15/2028, 144A | 6,907,425 | ||||||
|
| |||||||
| 106,773,526 | ||||||||
|
| |||||||
| Food & Beverage — 2.1% |
| |||||||
| 13,523,000 | Anheuser-Busch InBev Finance, Inc., 2.650%, 2/01/2021 | 13,298,465 | ||||||
| 13,750,000 | General Mills, Inc., 2.600%, 10/12/2022 | 13,246,384 | ||||||
| 26,965,000 | Grupo Bimbo SAB de CV, 4.700%, 11/10/2047, 144A | 24,256,635 | ||||||
| 8,595,000 | JBS USA LUX S.A./JBS USA Finance, Inc., 5.750%, 6/15/2025, 144A | 8,208,225 | ||||||
| 9,535,000 | PepsiCo, Inc., 1.700%, 10/06/2021 | 9,222,203 | ||||||
| 45,980,000 | PepsiCo, Inc., 2.000%, 4/15/2021 | 45,064,141 | ||||||
|
| |||||||
| 113,296,053 | ||||||||
|
| |||||||
| Government Guaranteed — 1.0% |
| |||||||
| 55,000,000 | Kreditanstalt fuer Wiederaufbau, 1.500%, 4/20/2020 | 54,215,640 | ||||||
|
| |||||||
See accompanying notes to financial statements.
| 30
Table of Contents
Portfolio of Investments – as of December 31, 2018
Loomis Sayles Investment Grade Bond Fund – (continued)
| Principal Amount (‡) | Description | Value (†) | ||||||
| Government Owned – No Guarantee — 0.5% |
| |||||||
| $ | 11,555,000 | Petrobras Global Finance BV, 5.625%, 5/20/2043 | $ | 9,683,206 | ||||
| 20,480,000 | Petrobras Global Finance BV, 5.750%, 2/01/2029 | 18,944,000 | ||||||
|
| |||||||
| 28,627,206 | ||||||||
|
| |||||||
| Government Sponsored — 1.7% |
| |||||||
| 50,000,000 | CPPIB Capital, Inc., 2.375%, 1/29/2021, 144A | 49,720,874 | ||||||
| 40,000,000 | Kommunalbanken, MTN, 1.625%, 2/10/2021 | 39,148,080 | ||||||
|
| |||||||
| 88,868,954 | ||||||||
|
| |||||||
| Health Insurance — 1.4% |
| |||||||
| 27,570,000 | Anthem, Inc., 2.500%, 11/21/2020 | 27,191,313 | ||||||
| 650,000 | Centene Corp., 6.125%, 2/15/2024 | 665,438 | ||||||
| 27,390,000 | Cigna Corp., 3.200%, 9/17/2020, 144A | 27,277,422 | ||||||
| 19,420,000 | Cigna Corp., 4.375%, 10/15/2028, 144A | 19,528,381 | ||||||
| 1,261,000 | Cigna Holding Co., 7.875%, 5/15/2027 | 1,553,690 | ||||||
|
| |||||||
| 76,216,244 | ||||||||
|
| |||||||
| Healthcare — 2.0% |
| |||||||
| 27,455,000 | Abbott Laboratories, 2.900%, 11/30/2021 | 27,216,486 | ||||||
| 7,692,000 | Boston Scientific Corp., 6.000%, 1/15/2020 | 7,886,333 | ||||||
| 13,765,000 | CVS Health Corp., 4.100%, 3/25/2025 | 13,627,657 | ||||||
| 16,985,000 | HCA, Inc., 4.500%, 2/15/2027 | 16,050,825 | ||||||
| 24,240,000 | HCA, Inc., 5.250%, 4/15/2025 | 24,118,800 | ||||||
| 6,175,000 | HCA, Inc., 5.375%, 9/01/2026 | 6,005,188 | ||||||
| 4,806,000 | HCA, Inc., 7.050%, 12/01/2027 | 5,010,255 | ||||||
| 1,592,000 | HCA, Inc., 7.500%, 11/06/2033 | 1,671,600 | ||||||
| 1,295,000 | HCA, Inc., 7.690%, 6/15/2025 | 1,379,175 | ||||||
| 2,480,000 | HCA, Inc., MTN, 7.580%, 9/15/2025 | 2,628,800 | ||||||
| 3,068,000 | HCA, Inc., MTN, 7.750%, 7/15/2036 | 3,183,050 | ||||||
|
| |||||||
| 108,778,169 | ||||||||
|
| |||||||
| Independent Energy — 2.3% |
| |||||||
| 12,417,000 | Anadarko Petroleum Corp., 5.550%, 3/15/2026 | 13,004,806 | ||||||
| 27,980,000 | Continental Resources, Inc., 3.800%, 6/01/2024 | 26,487,808 | ||||||
| 8,255,000 | Continental Resources, Inc., 4.375%, 1/15/2028 | 7,765,988 | ||||||
| 10,950,000 | Diamondback Energy, Inc., 4.750%, 11/01/2024, 144A | 10,566,750 | ||||||
| 9,787,000 | EQT Corp., 8.125%, 6/01/2019 | 9,953,069 | ||||||
| 9,695,000 | Hess Corp., 4.300%, 4/01/2027 | 8,883,855 | ||||||
| 21,000,000 | Newfield Exploration Co., 5.625%, 7/01/2024 | 21,262,500 | ||||||
| 26,185,000 | Seven Generations Energy Ltd., 5.375%, 9/30/2025, 144A | 23,435,575 | ||||||
| 60,000 | Whiting Petroleum Corp., 6.250%, 4/01/2023 | 54,678 | ||||||
|
| |||||||
| 121,415,029 | ||||||||
|
| |||||||
| Integrated Energy — 2.4% |
| |||||||
| 55,470,000 | Chevron Corp., 2.100%, 5/16/2021 | 54,399,210 | ||||||
| 20,430,000 | Exxon Mobil Corp., 2.222%, 3/01/2021 | 20,135,845 | ||||||
| 52,303,000 | Shell International Finance BV, 1.875%, 5/10/2021 | 50,942,449 | ||||||
|
| |||||||
| 125,477,504 | ||||||||
|
| |||||||
See accompanying notes to financial statements.
31 |
Table of Contents
Portfolio of Investments – as of December 31, 2018
Loomis Sayles Investment Grade Bond Fund – (continued)
| Principal Amount (‡) | Description | Value (†) | ||||||
| Life Insurance — 2.0% |
| |||||||
| $ | 1,475,000 | American International Group, Inc., 4.875%, 6/01/2022 | $ | 1,530,352 | ||||
| 15,000,000 | Global Atlantic Fin Co., 8.625%, 4/15/2021, 144A | 16,544,337 | ||||||
| 5,895,000 | Metropolitan Life Global Funding I,3-month LIBOR + 0.230%, 2.638%, 1/08/2021, 144A(c) | 5,823,451 | ||||||
| 9,063,000 | Mutual of Omaha Insurance Co., 6.800%, 6/15/2036, 144A | 11,281,899 | ||||||
| 26,914,000 | National Life Insurance Co., 10.500%, 9/15/2039, 144A(e)(f) | 42,742,667 | ||||||
| 6,440,000 | NLV Financial Corp., 7.500%, 8/15/2033, 144A(e)(f) | 8,040,938 | ||||||
| 2,872,000 | Penn Mutual Life Insurance Co. (The), 6.650%, 6/15/2034, 144A | 3,386,336 | ||||||
| 14,489,000 | Penn Mutual Life Insurance Co. (The), 7.625%, 6/15/2040, 144A | 19,054,255 | ||||||
|
| |||||||
| 108,404,235 | ||||||||
|
| |||||||
| Lodging — 0.5% |
| |||||||
| 26,131,000 | Choice Hotels International, Inc., 5.700%, 8/28/2020 | 26,588,292 | ||||||
|
| |||||||
| Media Entertainment — 0.1% |
| |||||||
| 4,482,000 | 21st Century Fox America, Inc., 8.150%, 10/17/2036 | 6,423,369 | ||||||
|
| |||||||
| Metals & Mining — 3.0% |
| |||||||
| 1,689,997 | 1839688 Alberta ULC, 14.000% PIK, 14.000% Cash, 2/13/2020(d)(e)(g)(h)(i) | 845 | ||||||
| 34,334,000 | Anglo American Capital PLC, 4.500%, 3/15/2028, 144A | 31,920,200 | ||||||
| 8,785,000 | Anglo American Capital PLC, 4.750%, 4/10/2027, 144A | 8,413,644 | ||||||
| 430,000 | ArcelorMittal, 5.500%, 3/01/2021 | 442,250 | ||||||
| 47,920,000 | ArcelorMittal, 6.750%, 3/01/2041 | 50,604,571 | ||||||
| 19,365,000 | ArcelorMittal, 7.000%, 10/15/2039 | 20,402,969 | ||||||
| 7,688,000 | Glencore Funding LLC, 3.875%, 10/27/2027, 144A | 6,927,964 | ||||||
| 37,257,000 | Glencore Funding LLC, 4.000%, 3/27/2027, 144A | 33,940,301 | ||||||
| 3,200,000 | United States Steel Corp., 6.650%, 6/01/2037 | 2,408,000 | ||||||
| 4,893,000 | Worthington Industries, Inc., 6.500%, 4/15/2020 | 5,056,661 | ||||||
|
| |||||||
| 160,117,405 | ||||||||
|
| |||||||
| Midstream — 3.0% |
| |||||||
| 14,040,000 | Andeavor Logistics LP/Tesoro Logistics Finance Corp., 4.250%, 12/01/2027 | 13,253,832 | ||||||
| 650,000 | DCP Midstream Operating LP, 6.450%, 11/03/2036, 144A | 630,500 | ||||||
| 7,000,000 | Energy Transfer Operating LP, 4.950%, 6/15/2028 | 6,848,893 | ||||||
| 340,000 | EnLink Midstream Partners LP, 5.050%, 4/01/2045 | 265,631 | ||||||
| 30,850,000 | EnLink Midstream Partners LP, 5.450%, 6/01/2047 | 24,949,189 | ||||||
| 1,845,000 | EnLink Midstream Partners LP, 5.600%, 4/01/2044 | 1,515,655 | ||||||
| 26,650,000 | EQM Midstream Partners LP, Series 10Y, 5.500%, 7/15/2028 | 26,100,997 | ||||||
| 3,328,000 | Florida Gas Transmission Co. LLC, 7.900%, 5/15/2019, 144A | 3,377,999 | ||||||
| 14,300,000 | IFM U.S. Colonial Pipeline 2 LLC, 6.450%, 5/01/2021, 144A | 14,932,372 | ||||||
| 14,660,000 | Kinder Morgan Energy Partners LP, 3.500%, 9/01/2023 | 14,240,304 | ||||||
| 3,105,000 | Kinder Morgan Energy Partners LP, 5.300%, 9/15/2020 | 3,188,949 | ||||||
| 7,461,000 | Kinder Morgan Energy Partners LP, 5.800%, 3/01/2021 | 7,787,316 | ||||||
| 85,000 | NGPL PipeCo LLC, 7.768%, 12/15/2037, 144A | 96,900 | ||||||
| 1,404,000 | Panhandle Eastern Pipe Line Co. LP, 8.125%, 6/01/2019 | 1,430,568 | ||||||
| 225,000 | Plains All American Pipeline LP / PAA Finance Corp., 2.850%, 1/31/2023 | 212,092 | ||||||
| 37,150,000 | Sunoco Logistics Partners Operations LP, 4.000%, 10/01/2027 | 34,027,324 | ||||||
| 8,405,000 | Williams Cos., Inc., 3.350%, 8/15/2022 | 8,225,329 | ||||||
|
| |||||||
| 161,083,850 | ||||||||
|
| |||||||
See accompanying notes to financial statements.
| 32
Table of Contents
Portfolio of Investments – as of December 31, 2018
Loomis Sayles Investment Grade Bond Fund – (continued)
| Principal Amount (‡) | Description | Value (†) | ||||||
| Mortgage Related — 0.0% |
| |||||||
| $ | 15,532 | FHLMC, 5.000%, 12/01/2031 | $ | 16,301 | ||||
| 1,952 | FNMA, 6.000%, 7/01/2029 | 2,127 | ||||||
|
| |||||||
| 18,428 | ||||||||
|
| |||||||
| Non-Agency Commercial Mortgage-Backed Securities — 0.5% |
| |||||||
| 10,402,518 | Commercial Mortgage Pass Through Certificates, Series 2014-LC15, Class A2, 2.840%, 4/10/2047 | 10,390,738 | ||||||
| 6,532,669 | Commercial Mortgage Pass Through Certificates, Series 2014-UBS4, Class A2, 2.963%, 8/10/2047 | 6,521,868 | ||||||
| 4,453,948 | JP Morgan Chase Commercial Mortgage Securities Trust, Series2014-C20, Class A2, 2.872%, 7/15/2047 | 4,441,348 | ||||||
| 760,407 | Morgan Stanley Bank of America Merrill Lynch Trust, Series2014-C14, Class A2, 2.916%, 2/15/2047 | 759,255 | ||||||
| 3,456,000 | Morgan Stanley Capital I Trust, Series2011-C2, Class E, 5.485%, 6/15/2044, 144A(b) | 3,315,007 | ||||||
| 2,125,000 | WFRBS Commercial Mortgage Trust, Series2011-C3, Class D, 5.683%, 3/15/2044, 144A(b) | 1,930,554 | ||||||
|
| |||||||
| 27,358,770 | ||||||||
|
| |||||||
| Paper — 1.4% |
| |||||||
| 6,400,000 | International Paper Co., 8.700%, 6/15/2038 | 8,514,103 | ||||||
| 4,600,000 | WestRock MWV LLC, 7.550%, 3/01/2047(e)(f) | 5,617,986 | ||||||
| 4,273,000 | WestRock MWV LLC, 8.200%, 1/15/2030 | 5,424,959 | ||||||
| 26,007,000 | Weyerhaeuser Co., 6.875%, 12/15/2033 | 30,970,713 | ||||||
| 7,374,000 | Weyerhaeuser Co., 7.375%, 10/01/2019 | 7,576,979 | ||||||
| 13,539,000 | Weyerhaeuser Co., 7.375%, 3/15/2032 | 16,555,984 | ||||||
|
| |||||||
| 74,660,724 | ||||||||
|
| |||||||
| Pharmaceuticals — 1.4% |
| |||||||
| 27,550,000 | Gilead Science, Inc., 2.550%, 9/01/2020 | 27,327,189 | ||||||
| 27,080,000 | GlaxoSmithKline Capital PLC, 3.125%, 5/14/2021 | 27,114,122 | ||||||
| 11,625,000 | Teva Pharmaceutical Finance Netherlands III BV, 2.800%, 7/21/2023 | 10,011,979 | ||||||
| 8,000,000 | Teva Pharmaceutical Finance Netherlands III BV, 3.150%, 10/01/2026 | 6,105,717 | ||||||
| 5,500,000 | Teva Pharmaceutical Finance Netherlands III BV, 6.000%, 4/15/2024 | 5,297,674 | ||||||
|
| |||||||
| 75,856,681 | ||||||||
|
| |||||||
| Property & Casualty Insurance — 0.1% |
| |||||||
| 2,740,000 | Fidelity National Financial, Inc., 5.500%, 9/01/2022 | 2,898,380 | ||||||
|
| |||||||
| Railroads — 0.2% |
| |||||||
| 9,787,000 | Canadian Pacific Railway Co., 7.250%, 5/15/2019 | 9,925,393 | ||||||
|
| |||||||
| REITs – Health Care — 0.1% |
| |||||||
| 5,972,000 | Welltower, Inc., 6.500%, 3/15/2041 | 6,974,392 | ||||||
|
| |||||||
| REITs – Single Tenant — 0.2% |
| |||||||
| 8,690,000 | Realty Income Corp., 5.750%, 1/15/2021 | 9,041,464 | ||||||
|
| |||||||
| Retailers — 1.3% |
| |||||||
| 1,255,000 | Group 1 Automotive, Inc., 5.000%, 6/01/2022 | 1,189,113 | ||||||
| 8,064,000 | Marks & Spencer PLC, 7.125%, 12/01/2037, 144A | 8,540,159 | ||||||
See accompanying notes to financial statements.
33 |
Table of Contents
Portfolio of Investments – as of December 31, 2018
Loomis Sayles Investment Grade Bond Fund – (continued)
| Principal Amount (‡) | Description | Value (†) | ||||||
| Retailers — continued |
| |||||||
| $ | 3,755,000 | PVH Corp., 7.750%, 11/15/2023 | $ | 4,149,275 | ||||
| 53,830,000 | Walmart, Inc., 3.125%, 6/23/2021 | 54,212,484 | ||||||
|
| |||||||
| 68,091,031 | ||||||||
|
| |||||||
| Supermarkets — 0.0% |
| |||||||
| 325,000 | Koninklijke Ahold Delhaize NV, 5.700%, 10/01/2040 | 351,645 | ||||||
|
| |||||||
| Supranational — 1.4% |
| |||||||
| 55,000,000 | European Investment Bank, 1.625%, 12/15/2020 | 53,966,217 | ||||||
| 20,000,000 | International Bank for Reconstruction & Development, Series GDIF, 2.750%, 7/23/2021 | 20,081,340 | ||||||
|
| |||||||
| 74,047,557 | ||||||||
|
| |||||||
| Technology — 7.0% |
| |||||||
| 54,860,000 | Apple, Inc., 2.850%, 5/06/2021 | 54,927,055 | ||||||
| 27,985,000 | Avnet, Inc., 4.625%, 4/15/2026 | 27,342,087 | ||||||
| 22,415,000 | Broadcom Corp. / Broadcom Cayman Finance Ltd., 3.000%, 1/15/2022 | 21,556,582 | ||||||
| 27,558,000 | Cisco Systems, Inc., 1.850%, 9/20/2021 | 26,796,254 | ||||||
| 22,066,000 | Cisco Systems, Inc., 2.200%, 2/28/2021 | 21,773,609 | ||||||
| 5,937,000 | Cisco Systems, Inc., 2.450%, 6/15/2020 | 5,905,493 | ||||||
| 25,760,000 | Dell International LLC/EMC Corp., 6.020%, 6/15/2026, 144A | 25,876,480 | ||||||
| 13,560,000 | Equifax, Inc., 3.600%, 8/15/2021 | 13,539,871 | ||||||
| 11,200,000 | Intel Corp., 3.300%, 10/01/2021 | 11,318,605 | ||||||
| 27,875,000 | International Business Machines Corp., 2.250%, 2/19/2021 | 27,313,370 | ||||||
| 7,440,000 | Jabil, Inc., 4.700%, 9/15/2022 | 7,365,600 | ||||||
| 16,735,000 | KLA-Tencor Corp., 5.650%, 11/01/2034 | 17,059,853 | ||||||
| 56,595,000 | Microsoft Corp., 1.550%, 8/08/2021(a) | 54,980,164 | ||||||
| 51,515,000 | Oracle Corp., 1.900%, 9/15/2021 | 49,980,238 | ||||||
| 5,000,000 | Oracle Corp., 2.800%, 7/08/2021 | 4,975,754 | ||||||
|
| |||||||
| 370,711,015 | ||||||||
|
| |||||||
| Treasuries — 7.0% |
| |||||||
| 391,985,000 | Iceland Government International Bond, 7.250%, 10/26/2022, (ISK) | 3,219,443 | ||||||
| 1,195,394,000 | Iceland Government International Bond, 8.750%, 2/26/2019, (ISK) | 9,315,733 | ||||||
| 210,910,000 | U.S. Treasury Bond, 3.000%, 8/15/2048 | 209,913,121 | ||||||
| 150,000,000 | U.S. Treasury Note, 1.250%, 6/30/2019 | 149,062,500 | ||||||
|
| |||||||
| 371,510,797 | ||||||||
|
| |||||||
| Wireless — 0.5% |
| |||||||
| 28,200,000 | America Movil SAB de CV, 8.460%, 12/18/2036, (MXN) | 1,140,814 | ||||||
| 22,660,000 | Crown Castle International Corp., 3.650%, 9/01/2027 | 21,006,740 | ||||||
| 6,615,000 | Crown Castle International Corp., 4.000%, 3/01/2027 | 6,442,780 | ||||||
|
| |||||||
| 28,590,334 | ||||||||
|
| |||||||
| Wirelines — 1.5% |
| |||||||
| 61,415,000 | AT&T, Inc., 4.300%, 2/15/2030 | 58,036,298 | ||||||
| 2,936,000 | BellSouth Telecommunications LLC, 5.850%, 11/15/2045 | 2,884,150 | ||||||
| 3,990,000 | CenturyLink, Inc., Series G, 6.875%, 1/15/2028 | 3,511,200 | ||||||
See accompanying notes to financial statements.
| 34
Table of Contents
Portfolio of Investments – as of December 31, 2018
Loomis Sayles Investment Grade Bond Fund – (continued)
| Principal Amount (‡) | Description | Value (†) | ||||||
| Wirelines — continued |
| |||||||
| $ | 11,700,000 | Qwest Corp., 6.875%, 9/15/2033 | $ | 10,452,113 | ||||
| 5,000,000 | Qwest Corp., 7.250%, 9/15/2025 | 5,147,912 | ||||||
|
| |||||||
| 80,031,673 | ||||||||
|
| |||||||
| TotalNon-Convertible Bonds (Identified Cost $4,237,296,553) | 4,345,702,090 | |||||||
|
| |||||||
| Convertible Bonds — 1.4% | ||||||||
| Cable Satellite — 0.2% |
| |||||||
| 9,050,000 | DISH Network Corp., 2.375%, 3/15/2024 | 7,205,303 | ||||||
| 6,190,000 | DISH Network Corp., 3.375%, 8/15/2026 | 4,998,524 | ||||||
|
| |||||||
| 12,203,827 | ||||||||
|
| |||||||
| Independent Energy — 0.1% |
| |||||||
| 8,905,000 | Chesapeake Energy Corp., 5.500%, 9/15/2026 | 7,167,296 | ||||||
|
| |||||||
| Industrial Other — 0.1% |
| |||||||
| 4,635,000 | Tutor Perini Corp., 2.875%, 6/15/2021 | 4,266,281 | ||||||
|
| |||||||
| Oil Field Services — 0.3% |
| |||||||
| 22,120,000 | Nabors Industries, Inc., 0.750%, 1/15/2024 | 13,664,188 | ||||||
|
| |||||||
| Pharmaceuticals — 0.1% |
| |||||||
| 7,895,000 | BioMarin Pharmaceutical, Inc., 0.599%, 8/01/2024 | 7,850,780 | ||||||
|
| |||||||
| Railroads — 0.1% |
| |||||||
| 5,165,000 | Greenbrier Cos., Inc. (The), 2.875%, 2/01/2024 | 5,075,356 | ||||||
|
| |||||||
| REITs – Diversified — 0.3% |
| |||||||
| 14,630,000 | iStar, Inc., 3.125%, 9/15/2022 | 13,182,215 | ||||||
|
| |||||||
| Technology — 0.2% |
| |||||||
| 11,409,000 | Finisar Corp., 0.500%, 12/15/2036 | 10,829,651 | ||||||
|
| |||||||
| Total Convertible Bonds (Identified Cost $81,913,052) | 74,239,594 | |||||||
|
| |||||||
| Municipals — 0.3% | ||||||||
| Illinois — 0.2% |
| |||||||
| 9,150,000 | State of Illinois, 5.100%, 6/01/2033 | 8,723,885 | ||||||
|
| |||||||
| Michigan — 0.0% |
| |||||||
| 1,660,000 | Michigan Tobacco Settlement Finance Authority Taxable Turbo, Series A, 7.309%, 6/01/2034 | 1,620,226 | ||||||
|
| |||||||
| Virginia — 0.1% |
| |||||||
| 7,705,000 | Virginia Tobacco Settlement Financing Corp., SeriesA-1, 6.706%, 6/01/2046 | 7,270,977 | ||||||
|
| |||||||
| Total Municipals (Identified Cost $16,431,045) | 17,615,088 | |||||||
|
| |||||||
| Total Bonds and Notes (Identified Cost $4,335,640,650) | 4,437,556,772 | |||||||
|
| |||||||
See accompanying notes to financial statements.
35 |
Table of Contents
Portfolio of Investments – as of December 31, 2018
Loomis Sayles Investment Grade Bond Fund – (continued)
| Shares | Description | Value (†) | ||||||
| Preferred Stocks — 0.3% | ||||||||
| Food & Beverage — 0.2% |
| |||||||
| 128,227 | Bunge Ltd., 4.875% | $ | 12,452,329 | |||||
|
| |||||||
| Independent Energy — 0.1% |
| |||||||
| 43,031 | Chesapeake Energy Corp., 5.000% | 2,232,448 | ||||||
|
| |||||||
| Total Preferred Stocks (Identified Cost $16,894,208) | 14,684,777 | |||||||
|
| |||||||
| Principal Amount (‡) | ||||||||
| Short-Term Investments — 15.3% | ||||||||
| $ | 164,580,277 | Tri-Party Repurchase Agreement with Fixed Income Clearing Corporation, dated 12/31/2018 at 1.500% to be repurchased at $164,593,992 on 1/02/2019 collateralized by $94,160,000 U.S. Treasury Bond, 2.750% due 11/15/2042 valued at $90,064,793; $75,675,000 U.S. Treasury Bond, 3.125% due 2/15/2043 valued at $77,810,776 including accrued interest (Note 2 of Notes to Financial Statements) | 164,580,277 | |||||
| 325,000,000 | U.S. Treasury Bills, 2.157% - 2.277%, 1/03/2019(j)(k) | 324,979,688 | ||||||
| 180,000,000 | U.S. Treasury Bills, 2.160% - 2.200%, 4/25/2019(j)(k) | 178,640,469 | ||||||
| 150,000,000 | U.S. Treasury Bills, 2.261%, 1/17/2019(j) | 149,857,188 | ||||||
|
| |||||||
| Total Short-Term Investments (Identified Cost $818,140,356) | 818,057,622 | |||||||
|
| |||||||
| Total Investments — 98.9% (Identified Cost $5,170,675,214) | 5,270,299,171 | |||||||
| Other assets less liabilities — 1.1% | 57,969,568 | |||||||
|
| |||||||
| Net Assets — 100.0% | $ | 5,328,268,739 | ||||||
|
| |||||||
| (‡) | Principal Amount stated in U.S. dollars unless otherwise noted. | |||||||
| (†) | See Note 2 of Notes to Financial Statements. | |||||||
| (a) | Security (or a portion thereof) has been designated to cover the Fund’s obligations under open derivative contracts. |
| ||||||
| (b) | Variable rate security. The interest rate adjusts periodically based on; (i) changes in current interest rates and/or prepayments on underlying pools of assets, if applicable, (ii) reference to a base lending rate plus or minus a margin, and/or (iii) reference to a base lending rate adjusted by a multiplier and/or subject to certain floors or caps. Rate as of December 31, 2018 is disclosed. |
| ||||||
| (c) | Variable rate security. Rate as of December 31, 2018 is disclosed. |
| ||||||
| (d) | Level 3 security. Value has been determined using significant unobservable inputs. See Note 3 of Notes to Financial Statements. |
| ||||||
| (e) | Illiquid security. (Unaudited) |
| ||||||
| (f) | Securities classified as fair valued pursuant to the Fund’s pricing policies and procedures. At December 31, 2018, the value of these securities amounted to $110,975,934 or 2.1% of net assets. See Note 2 of Notes to Financial Statements. |
| ||||||
| (g) | The issuer is in default with respect to interest and/or principal payments. Income is not being accrued. |
| ||||||
See accompanying notes to financial statements.
| 36
Table of Contents
Portfolio of Investments – as of December 31, 2018
Loomis Sayles Investment Grade Bond Fund – (continued)
| (h) | Payment-in-kind security for which the issuer has the option at each interest payment date of making interest payments in cash or additional principal. No payments were made during the period. |
| ||||||
| (i) | Fair valued by the Fund’s adviser. At December 31, 2018, the value of this security amounted to $845 or less than 0.1% of net assets. See Note 2 of Notes to Financial Statements. |
| ||||||
| (j) | Interest rate represents discount rate at time of purchase; not a coupon rate. |
| ||||||
| (k) | The Fund’s investment in U.S. Government/Agency securities is comprised of various lots with differing discount rates. These separate investments, which have the same maturity date, have been aggregated for the purpose of presentation in the Portfolio of Investments. |
| ||||||
| 144A | All or a portion of these securities are exempt from registration under Rule 144A of the Securities Act of 1933. These securities may be resold in transactions exempt from registration, normally to qualified institutional buyers. At December 31, 2018, the value of Rule 144A holdings amounted to $933,863,476 or 17.5% of net assets. |
| ||||||
| ABS | Asset-Backed Securities | |||||||
| ARS | Auction Rate Security | |||||||
| FHLMC | Federal Home Loan Mortgage Corp. | |||||||
| FNMA | Federal National Mortgage Association | |||||||
| GMTN | Global Medium Term Note | |||||||
| LIBOR | London Interbank Offered Rate | |||||||
| MTN | Medium Term Note | |||||||
| PIK | Payment-in-Kind | |||||||
| REITs | Real Estate Investment Trusts | �� | ||||||
| SLM | Sallie Mae | |||||||
| ISK | Icelandic Krona | |||||||
| MXN | Mexican Peso | |||||||
At December 31, 2018, the Fund had the following open forward foreign currency contracts:
| Counterparty | Delivery Date | Currency Bought/ Sold (B/S) | Units of Currency | In Exchange for | Notional Value | Unrealized Appreciation (Depreciation) | ||||||||||||||||||||||
BNP Paribas S.A. | 2/14/2019 | MXN | B | 563,000,000 | $ | 27,859,312 | $ | 28,464,557 | $ | 605,245 | ||||||||||||||||||
BNP Paribas S.A. | 2/14/2019 | MXN | S | 563,000,000 | 27,188,611 | 28,464,557 | (1,275,946 | ) | ||||||||||||||||||||
|
| |||||||||||||||||||||||||||
Total |
| $ | (670,701 | ) | ||||||||||||||||||||||||
|
| |||||||||||||||||||||||||||
See accompanying notes to financial statements.
37 |
Table of Contents
Portfolio of Investments – as of December 31, 2018
Loomis Sayles Investment Grade Bond Fund – (continued)
Industry Summary at December 31, 2018
Banking | 8.6 | % | ||
Technology | 7.2 | |||
Treasuries | 7.0 | |||
ABS Credit Card | 4.8 | |||
ABS Car Loan | 4.3 | |||
Midstream | 3.0 | |||
Metals & Mining | 3.0 | |||
Independent Energy | 2.5 | |||
Integrated Energy | 2.4 | |||
Food & Beverage | 2.3 | |||
ABS Other | 2.3 | |||
Healthcare | 2.0 | |||
Life Insurance | 2.0 | |||
Finance Companies | 2.0 | |||
Other Investments, less than 2% each | 30.2 | |||
Short-Term Investments | 15.3 | |||
|
| |||
Total Investments | 98.9 | |||
Other assets less liabilities (including forward foreign currency contracts) | 1.1 | |||
|
| |||
Net Assets | 100.0 | % | ||
|
|
See accompanying notes to financial statements.
| 38
Table of Contents
Statements of Assets and Liabilities
December 31, 2018
| High Income Fund | Investment Grade Bond Fund | |||||||
ASSETS |
| |||||||
Investments at cost | $ | 139,164,283 | $ | 5,006,094,937 | ||||
Repurchase agreement(s) at cost | 28,093,324 | 164,580,277 | ||||||
Net unrealized appreciation (depreciation) | (9,528,299 | ) | 99,623,957 | |||||
|
|
|
| |||||
Investments at value | 157,729,308 | 5,270,299,171 | ||||||
Cash | — | 8,042,993 | ||||||
Due from brokers (Note 2) | — | 650,000 | ||||||
Foreign currency at value (identified cost $0 and $392,424, respectively) | — | 390,690 | ||||||
Receivable for Fund shares sold | 1,804,078 | 26,936,605 | ||||||
Receivable for securities sold | 1,204,444 | 8,189,938 | ||||||
Interest receivable | 2,056,733 | 42,866,676 | ||||||
Unrealized appreciation on forward foreign currency contracts (Note 2) | 29,351 | 605,245 | ||||||
Tax reclaims receivable | 147 | — | ||||||
Receivable from distributor (Note 6d) | 3,486 | — | ||||||
Prepaid expenses (Note 8) | 92 | 3,272 | ||||||
|
|
|
| |||||
TOTAL ASSETS | 162,827,639 | 5,357,984,590 | ||||||
|
|
|
| |||||
LIABILITIES |
| |||||||
Payable for securities purchased | 669,943 | 3,065,646 | ||||||
Payable for Fund shares redeemed | 24,638,197 | 22,224,798 | ||||||
Unrealized depreciation on forward foreign currency contracts (Note 2) | 73,445 | 1,275,946 | ||||||
Payable to custodian bank (Note 9) | 574,563 | — | ||||||
Management fees payable (Note 6) | 89,292 | 1,638,811 | ||||||
Deferred Trustees’ fees (Note 6) | 165,660 | 810,708 | ||||||
Administrative fees payable (Note 6) | 5,564 | 190,246 | ||||||
Payable to distributor (Note 6d) | — | 43,332 | ||||||
Other accounts payable and accrued expenses | 132,741 | 466,364 | ||||||
|
|
|
| |||||
TOTAL LIABILITIES | 26,349,405 | 29,715,851 | ||||||
|
|
|
| |||||
NET ASSETS | $ | 136,478,234 | $ | 5,328,268,739 | ||||
|
|
|
| |||||
NET ASSETS CONSIST OF: |
| |||||||
Paid-in capital | $ | 151,345,089 | $ | 5,261,146,622 | ||||
Accumulated earnings (loss) | (14,866,855 | ) | 67,122,117 | |||||
|
|
|
| |||||
NET ASSETS | $ | 136,478,234 | $ | 5,328,268,739 | ||||
|
|
|
| |||||
See accompanying notes to financial statements.
39 |
Table of Contents
Statements of Assets and Liabilities (continued)
December 31, 2018
| High Income Fund | Investment Grade Bond Fund | |||||||
COMPUTATION OF NET ASSET VALUE AND OFFERING PRICE: |
| |||||||
Class A shares: |
| |||||||
Net assets | $ | 23,124,984 | $ | 721,110,403 | ||||
|
|
|
| |||||
Shares of beneficial interest | 5,793,694 | 66,927,244 | ||||||
|
|
|
| |||||
Net asset value and redemption price per share | $ | 3.99 | $ | 10.77 | ||||
|
|
|
| |||||
Offering price per share (100/95.75 of net asset value) (Note 1) | $ | 4.17 | $ | 11.25 | ||||
|
|
|
| |||||
Class C shares:(redemption price per share is equal to net asset value less any applicable contingent deferred sales charge) (Note 1) | ||||||||
Net assets | $ | 5,351,267 | $ | 366,067,920 | ||||
|
|
|
| |||||
Shares of beneficial interest | 1,336,216 | 34,361,115 | ||||||
|
|
|
| |||||
Net asset value and offering price per share | $ | 4.00 | $ | 10.65 | ||||
|
|
|
| |||||
Class N shares: |
| |||||||
Net assets | $ | 10,416,683 | $ | 1,216,689,786 | ||||
|
|
|
| |||||
Shares of beneficial interest | 2,613,650 | 112,915,763 | ||||||
|
|
|
| |||||
Net asset value, offering and redemption price per share | $ | 3.99 | $ | 10.78 | ||||
|
|
|
| |||||
Class Y shares: |
| |||||||
Net assets | $ | 97,585,300 | $ | 2,912,536,511 | ||||
|
|
|
| |||||
Shares of beneficial interest | 24,516,967 | 270,139,856 | ||||||
|
|
|
| |||||
Net asset value, offering and redemption price per share | $ | 3.98 | $ | 10.78 | ||||
|
|
|
| |||||
Admin Class shares: |
| |||||||
Net assets | $ | — | $ | 111,864,119 | ||||
|
|
|
| |||||
Shares of beneficial interest | — | 10,408,996 | ||||||
|
|
|
| |||||
Net asset value, offering and redemption price per share | $ | — | $ | 10.75 | ||||
|
|
|
| |||||
See accompanying notes to financial statements.
| 40
Table of Contents
Statements of Operations
| High Income Fund | Investment Grade Bond Fund | |||||||||||||||
| Period Ended December 31, 2018(a) | Year Ended September 30, 2018 | Period Ended December 31, 2018(a) | Year Ended September 30, 2018 | |||||||||||||
INVESTMENT INCOME |
| |||||||||||||||
Interest | $ | 2,504,410 | $ | 9,812,890 | $ | 52,387,566 | $ | 208,583,162 | ||||||||
Dividends | 71,928 | 215,042 | 769,241 | 3,275,378 | ||||||||||||
Less net foreign taxes withheld | — | (1,444 | ) | — | — | |||||||||||
|
|
|
|
|
|
|
| |||||||||
| 2,576,338 | 10,026,488 | 53,156,807 | 211,858,540 | |||||||||||||
|
|
|
|
|
|
|
| |||||||||
Expenses |
| |||||||||||||||
Management fees (Note 6) | 249,773 | 1,042,957 | 5,487,700 | 24,064,905 | ||||||||||||
Service and distribution fees (Note 6) | 30,233 | 163,550 | 1,591,374 | 7,990,970 | ||||||||||||
Administrative fees (Note 6) | 18,014 | 76,503 | 599,847 | 2,648,877 | ||||||||||||
Trustees’ fees and expenses | 3,364 | 33,532 | 24,555 | 233,306 | ||||||||||||
Transfer agent fees and expenses (Notes 6 and 7) | 51,169 | 205,041 | 930,158 | 4,648,637 | ||||||||||||
Audit and tax services fees | 44,550 | 52,781 | 51,181 | 63,525 | ||||||||||||
Custodian fees and expenses | 6,775 | 24,257 | 60,655 | 267,227 | ||||||||||||
Legal fees | 514 | 3,583 | 15,762 | 122,938 | ||||||||||||
Registration fees | 32,319 | 77,187 | 107,118 | 258,232 | ||||||||||||
Shareholder reporting expenses | 14,382 | 44,024 | 180,955 | 714,099 | ||||||||||||
Miscellaneous expenses (Notes 6 and 8) | 1,352 | 17,988 | 74,456 | 159,795 | ||||||||||||
|
|
|
|
|
|
|
| |||||||||
Total expenses | 452,445 | 1,741,403 | 9,123,761 | 41,172,511 | ||||||||||||
Less waiver and/or expense reimbursement (Note 6) | (90,480 | ) | (190,287 | ) | (417,839 | ) | (1,270,386 | ) | ||||||||
|
|
|
|
|
|
|
| |||||||||
Net expenses | 361,965 | 1,551,116 | 8,705,922 | 39,902,125 | ||||||||||||
|
|
|
|
|
|
|
| |||||||||
Net investment income | 2,214,373 | 8,475,372 | 44,450,885 | 171,956,415 | ||||||||||||
|
|
|
|
|
|
|
| |||||||||
NET REALIZED AND UNREALIZED GAIN (LOSS) ON INVESTMENTS, FORWARD FOREIGN CURRENCY CONTRACTS AND FOREIGN CURRENCY TRANSACTIONS | ||||||||||||||||
Net realized gain (loss) on: |
| |||||||||||||||
Investments | (6,566,560 | ) | 1,405,486 | (228,344,316 | ) | (64,668,766 | ) | |||||||||
Forward foreign currency contracts (Note 2d) | 219,012 | (165,859 | ) | — | — | |||||||||||
Foreign currency transactions (Note 2c) | (40,168 | ) | (34,283 | ) | (115,605 | ) | (4,121,375 | ) | ||||||||
Net change in unrealized appreciation (depreciation) on: | ||||||||||||||||
Investments | (3,397,911 | ) | (7,071,893 | ) | 151,497,842 | (88,563,612 | ) | |||||||||
Forward foreign currency contracts (Note 2d) | (128,778 | ) | 84,684 | (670,701 | ) | — | ||||||||||
Foreign currency translations (Note 2c) | 43,143 | (42,550 | ) | (154,049 | ) | 193,101 | ||||||||||
|
|
|
|
|
|
|
| |||||||||
Net realized and unrealized loss on investments, forward foreign currency contracts and foreign currency transactions | (9,871,262 | ) | (5,824,415 | ) | (77,786,829 | ) | (157,160,652 | ) | ||||||||
|
|
|
|
|
|
|
| |||||||||
NET INCREASE (DECREASE) IN NET ASSETS RESULTING FROM OPERATIONS | $ | (7,656,889 | ) | $ | 2,650,957 | $ | (33,335,944 | ) | $ | 14,795,763 | ||||||
|
|
|
|
|
|
|
| |||||||||
| (a) | For the three month period ended December 31, 2018. See Note 1 of Notes to Financial Statements. |
See accompanying notes to financial statements.
41 |
Table of Contents
Statements of Changes in Net Assets
| High Income Fund | Investment Grade Bond Fund | |||||||||||||||||||||||
| Period Ended December 31, 2018(a) | Year Ended September 30, 2018 | Year Ended September 30, 2017 | Period Ended December 31, 2018(a) | Year Ended September 30, 2018 | Year Ended September 30, 2017 | |||||||||||||||||||
FROM OPERATIONS: |
| |||||||||||||||||||||||
Net investment income | $ | 2,214,373 | $ | 8,475,372 | $ | 8,976,856 | $ | 44,450,885 | $ | 171,956,415 | $ | 205,406,044 | ||||||||||||
Net realized gain (loss) on investments, forward foreign currency contracts and foreign currency transactions | (6,387,716 | ) | 1,205,344 | 838,850 | (228,459,921 | ) | (68,790,141 | ) | 116,825,138 | |||||||||||||||
Net change in unrealized appreciation (depreciation) on investments, forward foreign currency contracts and foreign currency translations | (3,483,546 | ) | (7,029,759 | ) | 3,999,707 | 150,673,092 | (88,370,511 | ) | (91,129,640 | ) | ||||||||||||||
|
|
|
|
|
|
|
|
|
|
|
| |||||||||||||
Net increase (decrease) in net assets resulting from operations | (7,656,889 | ) | 2,650,957 | 13,815,413 | (33,335,944 | ) | 14,795,763 | 231,101,542 | ||||||||||||||||
|
|
|
|
|
|
|
|
|
|
|
| |||||||||||||
FROM DISTRIBUTIONS TO SHAREHOLDERS: | ||||||||||||||||||||||||
Class A | (410,882 | ) | (1,227,019 | ) | (1,577,362 | )(b) | (9,439,602 | ) | (26,935,957 | ) | (60,689,574 | )(b) | ||||||||||||
Class C | (81,814 | ) | (311,547 | ) | (453,429 | )(b) | (4,075,458 | ) | (15,654,049 | ) | (48,818,614 | )(b) | ||||||||||||
Class N | (178,711 | ) | (259,688 | ) | (41 | )(b) | (16,768,000 | ) | (41,987,053 | ) | (22,304,558 | )(b) | ||||||||||||
Class Y | (2,141,392 | ) | (5,752,686 | ) | (6,175,066 | )(b) | (39,150,105 | ) | (111,284,265 | ) | (262,616,392 | )(b) | ||||||||||||
Admin Class | — | — | — | (1,369,684 | ) | (778,851 | ) | (1,844,361 | )(b) | |||||||||||||||
|
|
|
|
|
|
|
|
|
|
|
| |||||||||||||
Total distributions | (2,812,799 | ) | (7,550,940 | ) | (8,205,898 | ) | (70,802,849 | ) | (196,640,175 | ) | (396,273,499 | ) | ||||||||||||
|
|
|
|
|
|
|
|
|
|
|
| |||||||||||||
NET DECREASE IN NET ASSETS FROM CAPITAL SHARE TRANSACTIONS (NOTE 12) | (23,511,576 | ) | (3,848,432 | ) | (2,678,063 | ) | (126,167,759 | ) | (534,159,760 | ) | (345,835,758 | ) | ||||||||||||
|
|
|
|
|
|
|
|
|
|
|
| |||||||||||||
Net increase (decrease) in net assets | (33,981,264 | ) | (8,748,415 | ) | 2,931,452 | (230,306,552 | ) | (716,004,172 | ) | (511,007,715 | ) | |||||||||||||
NET ASSETS |
| |||||||||||||||||||||||
Beginning of the year | 170,459,498 | 179,207,913 | 176,276,461 | 5,558,575,291 | 6,274,579,463 | 6,785,587,178 | ||||||||||||||||||
|
|
|
|
|
|
|
|
|
|
|
| |||||||||||||
End of the year | $ | 136,478,234 | $ | 170,459,498 | $ | 179,207,913 | $ | 5,328,268,739 | $ | 5,558,575,291 | $ | 6,274,579,463 | ||||||||||||
|
|
|
|
|
|
|
|
|
|
|
| |||||||||||||
| (a) | For the three month period ended December 31, 2018. See Note 1 of Notes to Financial Statements. |
| (b) | See Note 2g of Notes to Financial Statements. |
See accompanying notes to financial statements.
| 42
Table of Contents
Financial Highlights
For a share outstanding throughout each period.
| High Income Fund—Class A | ||||||||||||||||||||||||
| Period Ended December 31, 2018* | Year Ended September 30, 2018 | Year Ended September 30, 2017 | Year Ended September 30, 2016 | Year Ended September 30, 2015 | Year Ended September 30, 2014 | |||||||||||||||||||
Net asset value, beginning of the period | $ | 4.25 | $ | 4.37 | $ | 4.23 | $ | 3.99 | $ | 4.49 | $ | 4.59 | ||||||||||||
|
|
|
|
|
|
|
|
|
|
|
| |||||||||||||
INCOME (LOSS) FROM INVESTMENT OPERATIONS: | ||||||||||||||||||||||||
Net investment income(a) | 0.05 | 0.20 | 0.22 | 0.20 | 0.19 | 0.21 | ||||||||||||||||||
Net realized and unrealized gain (loss) | (0.24 | ) | (0.14 | ) | 0.12 | 0.21 | (0.39 | ) | 0.17 | |||||||||||||||
|
|
|
|
|
|
|
|
|
|
|
| |||||||||||||
Total from Investment Operations | (0.19 | ) | 0.06 | 0.34 | 0.41 | (0.20 | ) | 0.38 | ||||||||||||||||
|
|
|
|
|
|
|
|
|
|
|
| |||||||||||||
LESS DISTRIBUTIONS FROM: | ||||||||||||||||||||||||
Net investment income | (0.06 | ) | (0.18 | ) | (0.20 | ) | (0.16 | ) | (0.19 | ) | (0.22 | ) | ||||||||||||
Net realized capital gains | (0.01 | ) | — | — | (0.01 | ) | (0.11 | ) | (0.26 | ) | ||||||||||||||
|
|
|
|
|
|
|
|
|
|
|
| |||||||||||||
Total Distributions | (0.07 | ) | (0.18 | ) | (0.20 | ) | (0.17 | ) | (0.30 | ) | (0.48 | ) | ||||||||||||
|
|
|
|
|
|
|
|
|
|
|
| |||||||||||||
Net asset value, end of the period | $ | 3.99 | $ | 4.25 | $ | 4.37 | $ | 4.23 | $ | 3.99 | $ | 4.49 | ||||||||||||
|
|
|
|
|
|
|
|
|
|
|
| |||||||||||||
Total return(b) | (4.54 | )%(c)(d) | 1.41 | %(c) | 8.17 | %(c) | 10.66 | %(c) | (4.78 | )%(c) | 8.42 | % | ||||||||||||
RATIOS TO AVERAGE NET ASSETS: | ||||||||||||||||||||||||
Net assets, end of the period (000’s) | $ | 23,125 | $ | 26,175 | $ | 34,039 | $ | 34,820 | $ | 37,870 | $ | 42,630 | ||||||||||||
Net expenses | 1.05 | %(e)(f) | 1.05 | %(e) | 1.09 | %(e)(g) | 1.10 | %(e) | 1.11 | %(e)(h) | 1.14 | % | ||||||||||||
Gross expenses | 1.27 | %(f) | 1.16 | % | 1.15 | % | 1.14 | % | 1.13 | % | 1.14 | % | ||||||||||||
Net investment income | 5.13 | %(f) | 4.73 | % | 5.03 | % | 5.16 | % | 4.41 | % | 4.57 | % | ||||||||||||
Portfolio turnover rate | 17 | % | 55 | % | 46 | % | 38 | % | 69 | % | 59 | % | ||||||||||||
| * | For the three month period ended December 31, 2018. See Note 1 of Notes to Financial Statements. |
| (a) | Per share net investment income has been calculated using the average shares outstanding during the period. |
| (b) | A sales charge for Class A shares is not reflected in total return calculations. |
| (c) | Had certain expenses not been waived/reimbursed during the period, total returns would have been lower. |
| (d) | Periods less than one year are not annualized. |
| (e) | The investment adviser agreed to waive its fees and/or reimburse a portion of the Fund’s expenses during the period. Without this waiver/reimbursement, expenses would have been higher. |
| (f) | Computed on an annualized basis for periods less than one year. |
| (g) | Effective July 1, 2017, the expense limit decreased to 1.05%. |
| (h) | Effective July 1, 2015, the expense limit decreased to 1.10%. |
See accompanying notes to financial statements.
43 |
Table of Contents
Financial Highlights (continued)
For a share outstanding throughout each period.
| High Income Fund—Class C | ||||||||||||||||||||||||
| Period Ended December 31, 2018* | Year Ended September 30, 2018 | Year Ended September 30, 2017 | Year Ended September 30, 2016 | Year Ended September 30, 2015 | Year Ended September 30, 2014 | |||||||||||||||||||
Net asset value, beginning of the period | $ | 4.27 | $ | 4.38 | $ | 4.24 | $ | 4.00 | $ | 4.50 | $ | 4.61 | ||||||||||||
|
|
|
|
|
|
|
|
|
|
|
| |||||||||||||
INCOME (LOSS) FROM INVESTMENT OPERATIONS: | ||||||||||||||||||||||||
Net investment income(a) | 0.05 | 0.17 | 0.18 | 0.18 | 0.16 | 0.18 | ||||||||||||||||||
Net realized and unrealized gain (loss) | (0.26 | ) | (0.13 | ) | 0.12 | 0.20 | (0.39 | ) | 0.16 | |||||||||||||||
|
|
|
|
|
|
|
|
|
|
|
| |||||||||||||
Total from Investment Operations | (0.21 | ) | 0.04 | 0.30 | 0.38 | (0.23 | ) | 0.34 | ||||||||||||||||
|
|
|
|
|
|
|
|
|
|
|
| |||||||||||||
LESS DISTRIBUTIONS FROM: | ||||||||||||||||||||||||
Net investment income | (0.05 | ) | (0.15 | ) | (0.16 | ) | (0.13 | ) | (0.16 | ) | (0.19 | ) | ||||||||||||
Net realized capital gains | (0.01 | ) | — | — | (0.01 | ) | (0.11 | ) | (0.26 | ) | ||||||||||||||
|
|
|
|
|
|
|
|
|
|
|
| |||||||||||||
Total Distributions | (0.06 | ) | (0.15 | ) | (0.16 | ) | (0.14 | ) | (0.27 | ) | (0.45 | ) | ||||||||||||
|
|
|
|
|
|
|
|
|
|
|
| |||||||||||||
Net asset value, end of the period | $ | 4.00 | $ | 4.27 | $ | 4.38 | $ | 4.24 | $ | 4.00 | $ | 4.50 | ||||||||||||
|
|
|
|
|
|
|
|
|
|
|
| |||||||||||||
Total return(b) | (4.95 | )%(c)(d) | 0.86 | %(c) | 7.33 | %(c) | 9.81 | %(c) | (5.48 | )%(c) | 7.60 | % | ||||||||||||
RATIOS TO AVERAGE NET ASSETS: | ||||||||||||||||||||||||
Net assets, end of the period (000’s) | $ | 5,351 | $ | 6,248 | $ | 11,227 | $ | 12,288 | $ | 12,609 | $ | 14,555 | ||||||||||||
Net expenses | 1.80 | %(e)(f) | 1.80 | %(e) | 1.84 | %(e)(g) | 1.85 | %(e) | 1.86 | %(e)(h) | 1.89 | % | ||||||||||||
Gross expenses | 2.02 | %(f) | 1.91 | % | 1.90 | % | 1.89 | % | 1.88 | % | 1.89 | % | ||||||||||||
Net investment income | 4.38 | %(f) | 3.99 | % | 4.29 | % | 4.43 | % | 3.68 | % | 3.84 | % | ||||||||||||
Portfolio turnover rate | 17 | % | 55 | % | 46 | % | 38 | % | 69 | % | 59 | % | ||||||||||||
| * | For the three month period ended December 31, 2018. See Note 1 of Notes to Financial Statements. |
| (a) | Per share net investment income has been calculated using the average shares outstanding during the period. |
| (b) | A contingent deferred sales charge for Class C shares is not reflected in total return calculations. |
| (c) | Had certain expenses not been waived/reimbursed during the period, total returns would have been lower. |
| (d) | Periods less than one year are not annualized. |
| (e) | The investment adviser agreed to waive its fees and/or reimburse a portion of the Fund’s expenses during the period. Without this waiver/reimbursement, expenses would have been higher. |
| (f) | Computed on an annualized basis for periods less than one year. |
| (g) | Effective July 1, 2017, the expense limit decreased to 1.80%. |
| (h) | Effective July 1, 2015, the expense limit decreased to 1.85%. |
See accompanying notes to financial statements.
| 44
Table of Contents
Financial Highlights (continued)
For a share outstanding throughout each period.
| High Income Fund—Class N | ||||||||||||
| Period Ended December 31, 2018* | Year Ended September 30, 2018 | Period Ended September 30, 2017** | ||||||||||
Net asset value, beginning of the period | $ | 4.25 | $ | 4.36 | $ | 4.16 | ||||||
|
|
|
|
|
| |||||||
INCOME (LOSS) FROM INVESTMENT OPERATIONS: | ||||||||||||
Net investment income(a) | 0.06 | 0.20 | 0.19 | |||||||||
Net realized and unrealized gain (loss) | (0.25 | ) | (0.12 | ) | 0.18 | |||||||
|
|
|
|
|
| |||||||
Total from Investment Operations | (0.19 | ) | 0.08 | 0.37 | ||||||||
|
|
|
|
|
| |||||||
LESS DISTRIBUTIONS FROM: | ||||||||||||
Net investment income | (0.06 | ) | (0.19 | ) | (0.17 | ) | ||||||
Net realized capital gains | (0.01 | ) | — | — | ||||||||
|
|
|
|
|
| |||||||
Total Distributions | (0.07 | ) | (0.19 | ) | (0.17 | ) | ||||||
|
|
|
|
|
| |||||||
Net asset value, end of the period | $ | 3.99 | $ | 4.25 | $ | 4.36 | ||||||
|
|
|
|
|
| |||||||
Total return(b) | (4.47 | )%(c) | 1.96 | % | 8.99 | %(c) | ||||||
RATIOS TO AVERAGE NET ASSETS: | ||||||||||||
Net assets, end of the period (000’s) | $ | 10,417 | $ | 10,338 | $ | 1 | ||||||
Net expenses(d) | 0.75 | %(e) | 0.75 | % | 0.75 | %(e)(f) | ||||||
Gross expenses | 0.89 | %(e) | 0.79 | % | 31.73 | %(e) | ||||||
Net investment income | 5.45 | %(e) | 4.65 | % | 5.19 | %(e) | ||||||
Portfolio turnover rate | 17 | % | 55 | % | 46 | %(g) | ||||||
| * | For the three month period ended December 31, 2018. See Note 1 of Notes to Financial Statements. |
| ** | From commencement of Class operations on November 30, 2016 through September 30, 2017. |
| (a) | Per share net investment income has been calculated using the average shares outstanding during the period. |
| (b) | Had certain expenses not been waived/reimbursed during the period, total returns would have been lower. |
| (c) | Periods less than one year are not annualized. |
| (d) | The investment adviser agreed to waive its fees and/or reimburse a portion of the Fund’s expenses during the period. Without this waiver/reimbursement, expenses would have been higher. |
| (e) | Computed on an annualized basis for periods less than one year. |
| (f) | Effective July 1, 2017, the expense limit decreased to 0.75%. |
| (g) | Represents the Fund’s portfolio turnover rate for the year ended September 30, 2017. |
See accompanying notes to financial statements.
45 |
Table of Contents
Financial Highlights (continued)
For a share outstanding throughout each period.
| High Income Fund—Class Y | ||||||||||||||||||||||||
| Period Ended December 31, 2018* | Year Ended September 30, 2018 | Year Ended September 30, 2017 | Year Ended September 30, 2016 | Year Ended September 30, 2015 | Year Ended September 30, 2014 | |||||||||||||||||||
Net asset value, beginning of the period | $ | 4.24 | $ | 4.36 | $ | 4.22 | $ | 3.98 | $ | 4.48 | $ | 4.59 | ||||||||||||
|
|
|
|
|
|
|
|
|
|
|
| |||||||||||||
INCOME (LOSS) FROM INVESTMENT OPERATIONS: | ||||||||||||||||||||||||
Net investment income(a) | 0.06 | 0.21 | 0.23 | 0.21 | 0.20 | 0.22 | ||||||||||||||||||
Net realized and unrealized gain (loss) | (0.25 | ) | (0.14 | ) | 0.12 | 0.21 | (0.39 | ) | 0.16 | |||||||||||||||
|
|
|
|
|
|
|
|
|
|
|
| |||||||||||||
Total from Investment Operations | (0.19 | ) | 0.07 | 0.35 | 0.42 | (0.19 | ) | 0.38 | ||||||||||||||||
|
|
|
|
|
|
|
|
|
|
|
| |||||||||||||
LESS DISTRIBUTIONS FROM: | ||||||||||||||||||||||||
Net investment income | (0.06 | ) | (0.19 | ) | (0.21 | ) | (0.17 | ) | (0.20 | ) | (0.23 | ) | ||||||||||||
Net realized capital gains | (0.01 | ) | — | — | (0.01 | ) | (0.11 | ) | (0.26 | ) | ||||||||||||||
|
|
|
|
|
|
|
|
|
|
|
| |||||||||||||
Total Distributions | (0.07 | ) | (0.19 | ) | (0.21 | ) | (0.18 | ) | (0.31 | ) | (0.49 | ) | ||||||||||||
|
|
|
|
|
|
|
|
|
|
|
| |||||||||||||
Net asset value, end of the period | $ | 3.98 | $ | 4.24 | $ | 4.36 | $ | 4.22 | $ | 3.98 | $ | 4.48 | ||||||||||||
|
|
|
|
|
|
|
|
|
|
|
| |||||||||||||
Total return | (4.49 | )%(b)(c) | 1.68 | %(b) | 8.47 | %(b) | 10.98 | %(b) | (4.54 | )%(b) | 8.72 | % | ||||||||||||
RATIOS TO AVERAGE NET ASSETS: | ||||||||||||||||||||||||
Net assets, end of the period (000’s) | $ | 97,585 | $ | 127,699 | $ | 133,940 | $ | 129,169 | $ | 116,837 | $ | 125,185 | ||||||||||||
Net expenses | 0.80 | %(d)(e) | 0.80 | %(d) | 0.84 | %(d)(f) | 0.85 | %(d) | 0.86 | %(d)(g) | 0.89 | % | ||||||||||||
Gross expenses | 1.02 | %(e) | 0.91 | % | 0.90 | % | 0.89 | % | 0.88 | % | 0.89 | % | ||||||||||||
Net investment income | 5.39 | %(e) | 4.98 | % | 5.28 | % | 5.43 | % | 4.67 | % | 4.83 | % | ||||||||||||
Portfolio turnover rate | 17 | % | 55 | % | 46 | % | 38 | % | 69 | % | 59 | % | ||||||||||||
| * | For the three month period ended December 31, 2018. See Note 1 of Notes to Financial Statements. |
| (a) | Per share net investment income has been calculated using the average shares outstanding during the period. |
| (b) | Had certain expenses not been waived/reimbursed during the period, total returns would have been lower. |
| (c) | Periods less than one year are not annualized. |
| (d) | The investment adviser agreed to waive its fees and/or reimburse a portion of the Fund’s expenses during the period. Without this waiver/reimbursement, expenses would have been higher. |
| (e) | Computed on an annualized basis for periods less than one year. |
| (f) | Effective July 1, 2017, the expense limit decreased to 0.80%. |
| (g) | Effective July 1, 2015, the expense limit decreased to 0.85%. |
See accompanying notes to financial statements.
| 46
Table of Contents
Financial Highlights (continued)
For a share outstanding throughout each period.
| Investment Grade Bond Fund—Class A | ||||||||||||||||||||||||
| Period Ended December 31, 2018* | Year Ended September 30, 2018 | Year Ended September 30, 2017 | Year Ended September 30, 2016 | Year Ended September 30, 2015 | Year Ended September 30, 2014 | |||||||||||||||||||
Net asset value, beginning of the period | $ | 10.98 | $ | 11.30 | $ | 11.59 | $ | 11.10 | $ | 12.11 | $ | 12.22 | ||||||||||||
|
|
|
|
|
|
|
|
|
|
|
| |||||||||||||
INCOME (LOSS) FROM INVESTMENT OPERATIONS: | ||||||||||||||||||||||||
Net investment income(a) | 0.08 | 0.30 | 0.36 | 0.39 | 0.40 | 0.46 | ||||||||||||||||||
Net realized and unrealized gain (loss) | (0.16 | ) | (0.28 | ) | 0.05 | 0.48 | (0.95 | ) | 0.26 | |||||||||||||||
|
|
|
|
|
|
|
|
|
|
|
| |||||||||||||
Total from Investment Operations | (0.08 | ) | 0.02 | 0.41 | 0.87 | (0.55 | ) | 0.72 | ||||||||||||||||
|
|
|
|
|
|
|
|
|
|
|
| |||||||||||||
LESS DISTRIBUTIONS FROM: | ||||||||||||||||||||||||
Net investment income | (0.08 | ) | (0.21 | ) | (0.26 | ) | (0.23 | ) | (0.34 | ) | (0.51 | ) | ||||||||||||
Net realized capital gains | (0.05 | ) | (0.13 | ) | (0.44 | ) | (0.15 | ) | (0.12 | ) | (0.32 | ) | ||||||||||||
|
|
|
|
|
|
|
|
|
|
|
| |||||||||||||
Total Distributions | (0.13 | ) | (0.34 | ) | (0.70 | ) | (0.38 | ) | (0.46 | ) | (0.83 | ) | ||||||||||||
|
|
|
|
|
|
|
|
|
|
|
| |||||||||||||
Net asset value, end of the period | $ | 10.77 | $ | 10.98 | $ | 11.30 | $ | 11.59 | $ | 11.10 | $ | 12.11 | ||||||||||||
|
|
|
|
|
|
|
|
|
|
|
| |||||||||||||
Total return(b) | (0.66 | )%(c)(d) | 0.19 | %(c) | 3.88 | % | 8.06 | % | (4.72 | )% | 6.04 | % | ||||||||||||
RATIOS TO AVERAGE NET ASSETS: | ||||||||||||||||||||||||
Net assets, end of the period (000’s) | $ | 721,110 | $ | 777,391 | $ | 902,955 | $ | 1,130,260 | $ | 1,628,216 | $ | 1,932,847 | ||||||||||||
Net expenses | 0.78 | %(e)(f) | 0.80 | %(e)(g) | 0.82 | %(h) | 0.85 | % | 0.83 | % | 0.83 | % | ||||||||||||
Gross expenses | 0.82 | %(f) | 0.82 | % | 0.82 | % | 0.85 | % | 0.83 | % | 0.83 | % | ||||||||||||
Net investment income | 3.09 | %(f) | 2.73 | % | 3.23 | % | 3.49 | % | 3.38 | % | 3.75 | % | ||||||||||||
Portfolio turnover rate | 39 | %(i) | 3 | % | 10 | % | 11 | % | 23 | % | 19 | % | ||||||||||||
| * | For the three month period ended December 31, 2018. See Note 1 of Notes to Financial Statements. |
| (a) | Per share net investment income has been calculated using the average shares outstanding during the period. |
| (b) | A sales charge for Class A shares is not reflected in total return calculations. |
| (c) | Had certain expenses not been waived/reimbursed during the period, total returns would have been lower. |
| (d) | Periods less than one year are not annualized. |
| (e) | The investment adviser agreed to waive its fees and/or reimburse a portion of the Fund’s expenses during the period. Without this waiver/reimbursement, expenses would have been higher. |
| (f) | Computed on an annualized basis for periods less than one year. |
| (g) | Effective July 1, 2018, the expense limit decreased to 0.78%. |
| (h) | Effective July 1, 2017, the expense limit decreased to 0.80%. |
| (i) | The variation in the Fund’s turnover rate from the year ended September 30, 2018 to the period ended December 31, 2018 was primarily due to a change in the investment strategy and management structure of the Fund. |
See accompanying notes to financial statements.
47 |
Table of Contents
Financial Highlights (continued)
For a share outstanding throughout each period.
| Investment Grade Bond Fund—Class C | ||||||||||||||||||||||||
| Period Ended December 31, 2018* | Year Ended September 30, 2018 | Year Ended September 30, 2017 | Year Ended September 30, 2016 | Year Ended September 30, 2015 | Year Ended September 30, 2014 | |||||||||||||||||||
Net asset value, beginning of the period | $ | 10.86 | $ | 11.19 | $ | 11.48 | $ | 11.00 | $ | 12.00 | $ | 12.11 | ||||||||||||
|
|
|
|
|
|
|
|
|
|
|
| |||||||||||||
INCOME (LOSS) FROM INVESTMENT OPERATIONS: | ||||||||||||||||||||||||
Net investment income(a) | 0.06 | 0.22 | 0.27 | 0.30 | 0.31 | 0.36 | ||||||||||||||||||
Net realized and unrealized gain (loss) | (0.16 | ) | (0.28 | ) | 0.06 | 0.47 | (0.94 | ) | 0.27 | |||||||||||||||
|
|
|
|
|
|
|
|
|
|
|
| |||||||||||||
Total from Investment Operations | (0.10 | ) | (0.06 | ) | 0.33 | 0.77 | (0.63 | ) | 0.63 | |||||||||||||||
|
|
|
|
|
|
|
|
|
|
|
| |||||||||||||
LESS DISTRIBUTIONS FROM: | ||||||||||||||||||||||||
Net investment income | (0.06 | ) | (0.14 | ) | (0.18 | ) | (0.14 | ) | (0.25 | ) | (0.42 | ) | ||||||||||||
Net realized capital gains | (0.05 | ) | (0.13 | ) | (0.44 | ) | (0.15 | ) | (0.12 | ) | (0.32 | ) | ||||||||||||
|
|
|
|
|
|
|
|
|
|
|
| |||||||||||||
Total Distributions | (0.11 | ) | (0.27 | ) | (0.62 | ) | (0.29 | ) | (0.37 | ) | (0.74 | ) | ||||||||||||
|
|
|
|
|
|
|
|
|
|
|
| |||||||||||||
Net asset value, end of the period | $ | 10.65 | $ | 10.86 | $ | 11.19 | $ | 11.48 | $ | 11.00 | $ | 12.00 | ||||||||||||
|
|
|
|
|
|
|
|
|
|
|
| |||||||||||||
Total return(b) | (0.86 | )%(c)(d) | (0.53 | )%(d) | 3.12 | % | 7.18 | % | (5.40 | )% | 5.29 | % | ||||||||||||
RATIOS TO AVERAGE NET ASSETS: | ||||||||||||||||||||||||
Net assets, end of the period (000’s) | $ | 366,068 | $ | 412,788 | $ | 689,798 | $ | 1,001,522 | $ | 1,219,687 | $ | 1,524,806 | ||||||||||||
Net expenses | 1.53 | %(e)(f) | 1.55 | %(e)(g) | 1.57 | %(h) | 1.60 | % | 1.58 | % | 1.58 | % | ||||||||||||
Gross expenses | 1.57 | %(f) | 1.57 | % | 1.57 | % | 1.60 | % | 1.58 | % | 1.58 | % | ||||||||||||
Net investment income | 2.34 | %(f) | 1.96 | % | 2.49 | % | 2.74 | % | 2.63 | % | 3.00 | % | ||||||||||||
Portfolio turnover rate | 39 | %(i) | 3 | % | 10 | % | 11 | % | 23 | % | 19 | % | ||||||||||||
| * | For the three month period ended December 31, 2018. See Note 1 of Notes to Financial Statements. |
| (a) | Per share net investment income has been calculated using the average shares outstanding during the period. |
| (b) | A contingent deferred sales charge for Class C shares is not reflected in total return calculations. |
| (c) | Periods less than one year are not annualized. |
| (d) | Had certain expenses not been waived/reimbursed during the period, total returns would have been lower. |
| (e) | The investment adviser agreed to waive its fees and/or reimburse a portion of the Fund’s expenses during the period. Without this waiver/reimbursement, expenses would have been higher. |
| (f) | Computed on an annualized basis for periods less than one year. |
| (g) | Effective July 1, 2018, the expense limit decreased to 1.53%. |
| (h) | Effective July 1, 2017, the expense limit decreased to 1.55%. |
| (i) | The variation in the Fund’s turnover rate from the year ended September 30, 2018 to the period ended December 31, 2018 was primarily due to a change in the investment strategy and management structure of the Fund. |
See accompanying notes to financial statements.
| 48
Table of Contents
Financial Highlights (continued)
For a share outstanding throughout each period.
| Investment Grade Bond Fund—Class N | ||||||||||||||||||||||||
| Period Ended December 31, 2018* | Year Ended September 30, 2018 | Year Ended September 30, 2017 | Year Ended September 30, 2016 | Year Ended September 30, 2015 | Year Ended September 30, 2014 | |||||||||||||||||||
Net asset value, beginning of the period | $ | 10.98 | $ | 11.30 | $ | 11.58 | $ | 11.11 | $ | 12.11 | $ | 12.22 | ||||||||||||
|
|
|
|
|
|
|
|
|
|
|
| |||||||||||||
INCOME (LOSS) FROM INVESTMENT OPERATIONS: | ||||||||||||||||||||||||
Net investment income(a) | 0.09 | 0.34 | 0.39 | 0.43 | 0.44 | 0.50 | ||||||||||||||||||
Net realized and unrealized gain (loss) | (0.15 | ) | (0.28 | ) | 0.07 | 0.47 | (0.93 | ) | 0.26 | |||||||||||||||
|
|
|
|
|
|
|
|
|
|
|
| |||||||||||||
Total from Investment Operations | (0.06 | ) | 0.06 | 0.46 | 0.90 | (0.49 | ) | 0.76 | ||||||||||||||||
|
|
|
|
|
|
|
|
|
|
|
| |||||||||||||
LESS DISTRIBUTIONS FROM: | ||||||||||||||||||||||||
Net investment income | (0.09 | ) | (0.25 | ) | (0.30 | ) | (0.28 | ) | (0.39 | ) | (0.55 | ) | ||||||||||||
Net realized capital gains | (0.05 | ) | (0.13 | ) | (0.44 | ) | (0.15 | ) | (0.12 | ) | (0.32 | ) | ||||||||||||
|
|
|
|
|
|
|
|
|
|
|
| |||||||||||||
Total Distributions | (0.14 | ) | (0.38 | ) | (0.74 | ) | (0.43 | ) | (0.51 | ) | (0.87 | ) | ||||||||||||
|
|
|
|
|
|
|
|
|
|
|
| |||||||||||||
Net asset value, end of the period | $ | 10.78 | $ | 10.98 | $ | 11.30 | $ | 11.58 | $ | 11.11 | $ | 12.11 | ||||||||||||
|
|
|
|
|
|
|
|
|
|
|
| |||||||||||||
Total return | (0.58 | )%(b) | 0.50 | % | 4.34 | % | 8.31 | % | (4.28 | )% | 6.41 | % | ||||||||||||
RATIOS TO AVERAGE NET ASSETS: | ||||||||||||||||||||||||
Net assets, end of the period (000’s) | $ | 1,216,690 | $ | 1,251,189 | $ | 1,203,169 | $ | 47,343 | $ | 21,851 | $ | 6,101 | ||||||||||||
Net expenses | 0.48 | %(c) | 0.47 | %(d) | 0.48 | %(e) | 0.47 | % | 0.47 | % | 0.47 | %(f) | ||||||||||||
Gross expenses | 0.48 | %(c) | 0.47 | % | 0.48 | % | 0.47 | % | 0.47 | % | 0.47 | %(f) | ||||||||||||
Net investment income | 3.40 | %(c) | 3.05 | % | 3.51 | % | 3.88 | % | 3.78 | % | 4.07 | % | ||||||||||||
Portfolio turnover rate | 39 | %(g) | 3 | % | 10 | % | 11 | % | 23 | % | 19 | % | ||||||||||||
| * | For the three month period ended December 31, 2018. See Note 1 of Notes to Financial Statements. |
| (a) | Per share net investment income has been calculated using the average shares outstanding during the period. |
| (b) | Periods less than one year are not annualized. |
| (c) | Computed on an annualized basis for periods less than one year. |
| (d) | Effective July 1, 2018, the expense limit decreased to 0.48%. |
| (e) | Effective July 1, 2017, the expense limit increased to 0.50%. |
| (f) | Includes fee/expense recovery of less than 0.01%. |
| (g) | The variation in the Fund’s turnover rate from the year ended September 30, 2018 to the period ended December 31, 2018 was primarily due to a change in the investment strategy and management structure of the Fund. |
See accompanying notes to financial statements.
49 |
Table of Contents
Financial Highlights (continued)
For a share outstanding throughout each period.
| Investment Grade Bond Fund—Class Y | ||||||||||||||||||||||||
| Period Ended December 31, 2018* | Year Ended September 30, 2018 | Year Ended September 30, 2017 | Year Ended September 30, 2016 | Year Ended September 30, 2015 | Year Ended September 30, 2014 | |||||||||||||||||||
Net asset value, beginning of the period | $ | 10.99 | $ | 11.31 | $ | 11.59 | $ | 11.11 | $ | 12.12 | $ | 12.23 | ||||||||||||
|
|
|
|
|
|
|
|
|
|
|
| |||||||||||||
INCOME (LOSS) FROM INVESTMENT OPERATIONS: | ||||||||||||||||||||||||
Net investment income(a) | 0.09 | 0.33 | 0.39 | 0.42 | 0.43 | 0.49 | ||||||||||||||||||
Net realized and unrealized gain (loss) | (0.16 | ) | (0.28 | ) | 0.06 | 0.47 | (0.95 | ) | 0.26 | |||||||||||||||
|
|
|
|
|
|
|
|
|
|
|
| |||||||||||||
Total from Investment Operations | (0.07 | ) | 0.05 | 0.45 | 0.89 | (0.52 | ) | 0.75 | ||||||||||||||||
|
|
|
|
|
|
|
|
|
|
|
| |||||||||||||
LESS DISTRIBUTIONS FROM: | ||||||||||||||||||||||||
Net investment income | (0.09 | ) | (0.24 | ) | (0.29 | ) | (0.26 | ) | (0.37 | ) | (0.54 | ) | ||||||||||||
Net realized capital gains | (0.05 | ) | (0.13 | ) | (0.44 | ) | (0.15 | ) | (0.12 | ) | (0.32 | ) | ||||||||||||
|
|
|
|
|
|
|
|
|
|
|
| |||||||||||||
Total Distributions | (0.14 | ) | (0.37 | ) | (0.73 | ) | (0.41 | ) | (0.49 | ) | (0.86 | ) | ||||||||||||
|
|
|
|
|
|
|
|
|
|
|
| |||||||||||||
Net asset value, end of the period | $ | 10.78 | $ | 10.99 | $ | 11.31 | $ | 11.59 | $ | 11.11 | $ | 12.12 | ||||||||||||
|
|
|
|
|
|
|
|
|
|
|
| |||||||||||||
Total return | (0.59 | )%(b)(c) | 0.43 | %(c) | 4.24 | % | 8.25 | % | (4.47 | )% | 6.30 | % | ||||||||||||
RATIOS TO AVERAGE NET ASSETS: | ||||||||||||||||||||||||
Net assets, end of the period (000’s) | $ | 2,912,537 | $ | 3,001,906 | $ | 3,453,137 | $ | 4,571,167 | $ | 6,081,536 | $ | 6,911,938 | ||||||||||||
Net expenses | 0.53 | %(d)(e) | 0.55 | %(d)(f) | 0.57 | %(g) | 0.60 | % | 0.58 | % | 0.59 | % | ||||||||||||
Gross expenses | 0.57 | %(e) | 0.57 | % | 0.57 | % | 0.60 | % | 0.58 | % | 0.59 | % | ||||||||||||
Net investment income | 3.35 | %(e) | 2.98 | % | 3.48 | % | 3.74 | % | 3.63 | % | 3.99 | % | ||||||||||||
Portfolio turnover rate | 39 | %(h) | 3 | % | 10 | % | 11 | % | 23 | % | 19 | % | ||||||||||||
| * | For the three month period ended December 31, 2018. See Note 1 of Notes to Financial Statements. |
| (a) | Per share net investment income has been calculated using the average shares outstanding during the period. |
| (b) | Periods less than one year are not annualized. |
| (c) | Had certain expenses not been waived/reimbursed during the period, total returns would have been lower. |
| (d) | The investment adviser agreed to waive its fees and/or reimburse a portion of the Fund’s expenses during the period. Without this waiver/reimbursement, expenses would have been higher. |
| (e) | Computed on an annualized basis for periods less than one year. |
| (f) | Effective July 1, 2018, the expense limit decreased to 0.53%. |
| (g) | Effective July 1, 2017, the expense limit decreased to 0.55%. |
| (h) | The variation in the Fund’s turnover rate from the year ended September 30, 2018 to the period ended December 31, 2018 was primarily due to a change in the investment strategy and management structure of the Fund. |
See accompanying notes to financial statements.
| 50
Table of Contents
Financial Highlights (continued)
For a share outstanding throughout each period.
| Investment Grade Bond Fund—Admin Class | ||||||||||||||||||||||||
| Period Ended December 31, 2018* | Year Ended September 30, 2018 | Year Ended September 30, 2017 | Year Ended September 30, 2016 | Year Ended September 30, 2015 | Year Ended September 30, 2014 | |||||||||||||||||||
Net asset value, beginning of the period | $ | 10.95 | $ | 11.28 | $ | 11.56 | $ | 11.08 | $ | 12.09 | $ | 12.20 | ||||||||||||
|
|
|
|
|
|
|
|
|
|
|
| |||||||||||||
INCOME (LOSS) FROM INVESTMENT OPERATIONS: | ||||||||||||||||||||||||
Net investment income(a) | 0.08 | 0.28 | 0.34 | 0.37 | 0.37 | 0.43 | ||||||||||||||||||
Net realized and unrealized gain (loss) | (0.15 | ) | (0.28 | ) | 0.06 | 0.47 | (0.95 | ) | 0.26 | |||||||||||||||
|
|
|
|
|
|
|
|
|
|
|
| |||||||||||||
Total from Investment Operations | (0.07 | ) | 0.00 | (b) | 0.40 | 0.84 | (0.58 | ) | 0.69 | |||||||||||||||
|
|
|
|
|
|
|
|
|
|
|
| |||||||||||||
LESS DISTRIBUTIONS FROM: | ||||||||||||||||||||||||
Net investment income | (0.08 | ) | (0.20 | ) | (0.24 | ) | (0.21 | ) | (0.31 | ) | (0.48 | ) | ||||||||||||
Net realized capital gains | (0.05 | ) | (0.13 | ) | (0.44 | ) | (0.15 | ) | (0.12 | ) | (0.32 | ) | ||||||||||||
|
|
|
|
|
|
|
|
|
|
|
| |||||||||||||
Total Distributions | (0.13 | ) | (0.33 | ) | (0.68 | ) | (0.36 | ) | (0.43 | ) | (0.80 | ) | ||||||||||||
|
|
|
|
|
|
|
|
|
|
|
| |||||||||||||
Net asset value, end of the period | $ | 10.75 | $ | 10.95 | $ | 11.28 | $ | 11.56 | $ | 11.08 | $ | 12.09 | ||||||||||||
|
|
|
|
|
|
|
|
|
|
|
| |||||||||||||
Total return | (0.63 | )%(c)(d) | (0.07 | )%(d) | 3.76 | %(d) | 7.73 | % | (4.95 | )% | 5.79 | % | ||||||||||||
RATIOS TO AVERAGE NET ASSETS: | ||||||||||||||||||||||||
Net assets, end of the period (000’s) | $ | 111,864 | $ | 115,301 | $ | 25,521 | $ | 35,294 | $ | 37,355 | $ | 25,585 | ||||||||||||
Net expenses | 1.03 | %(e)(f) | 1.02 | %(e)(g)(h) | 1.02 | %(e)(i)(j) | 1.07 | %(k) | 1.08 | % | 1.09 | % | ||||||||||||
Gross expenses | 1.07 | %(f) | 1.05 | %(g) | 1.03 | %(i) | 1.07 | %(k) | 1.08 | % | 1.09 | % | ||||||||||||
Net investment income | 2.85 | %(f) | 2.56 | % | 3.03 | % | 3.27 | % | 3.14 | % | 3.49 | % | ||||||||||||
Portfolio turnover rate | 39 | %(l) | 3 | % | 10 | % | 11 | % | 23 | % | 19 | % | ||||||||||||
| * | For the three month period ended December 31, 2018. See Note 1 of Notes to Financial Statements. |
| (a) | Per share net investment income has been calculated using the average shares outstanding during the period. |
| (b) | Amount rounds to less than $0.01 per share. |
| (c) | Periods less than one year are not annualized. |
| (d) | Had certain expenses not been waived/reimbursed during the period, total returns would have been lower. |
| (e) | The investment adviser agreed to waive its fees and/or reimburse a portion of the Fund’s expenses during the period. Without this waiver/reimbursement, expenses would have been higher. |
| (f) | Computed on an annualized basis for periods less than one year. |
| (g) | Includes refund of prior year service fee of 0.02%. See Note 5b of Notes to Financial Statements. |
| (h) | Effective July 1, 2018, the expense limit decreased to 1.03%. |
| (i) | Includes refund of prior year service fee of 0.05%. |
| (j) | Effective July 1, 2017, the expense limit increased to 1.05%. |
| (k) | Includes refund of prior year service fee of 0.03%. |
| (l) | The variation in the Fund’s turnover rate from the year ended September 30, 2018 to the period ended December 31, 2018 was primarily due to a change in the investment strategy and management structure of the Fund. |
See accompanying notes to financial statements.
51 |
Table of Contents
December 31, 2018
1. Organization. Loomis Sayles Funds II (the “Trust”) is organized as a Massachusetts business trust. The Trust is registered under the Investment Company Act of 1940, as amended (the “1940 Act”), as anopen-end management investment company. The Declaration of Trust permits the Board of Trustees to authorize the issuance of an unlimited number of shares of the Trust in multiple series. The financial statements for certain funds of the Trust are presented in separate reports. The following funds (individually, a “Fund” and collectively, the “Funds”) are included in this report:
Loomis Sayles High Income Fund (the “High Income Fund”)
Loomis Sayles Investment Grade Bond Fund (the “Investment Grade Bond Fund”)
Each Fund is a diversified investment company.
On October 5, 2018, the Board of Trustees approved a change to the fiscal year end of the Funds from September 30 to December 31. Accordingly, the Funds’ financial statements and related notes include information as of and for the three month period ended December 31, 2018, and the years ended September 30, 2018, and September 30, 2017, where applicable.
Each Fund offers Class A, Class C, Class N and Class Y shares. In addition, Investment Grade Bond Fund also offers Admin Class shares. High Income Fund began offering Class N shares effective November 30, 2016.
Class A shares are sold with a maximumfront-end sales charge of 4.25%. Class C shares do not pay afront-end sales charge, pay higher Rule12b-1 fees than Class A shares for ten years (at which point they automatically convert to Class A shares) and may be subject to a contingent deferred sales charge (“CDSC”) of 1.00% if those shares are redeemed within one year of acquisition, except for reinvested distributions. Class N and Class Y shares do not pay afront-end sales charge, a CDSC or Rule12b-1 fees. Class N shares are offered with an initial minimum investment of $1,000,000. Class Y shares are offered with an initial minimum investment of $100,000. Certain categories of investors are exempted from the minimum investment amounts for Class N and Class Y as outlined in the relevant Funds’ prospectus. Admin Class shares do not pay afront-end sales charge or a CDSC, but do pay a Rule12b-1 fee. Admin Class shares are offered exclusively through intermediaries.
Most expenses can be directly attributed to a Fund. Expenses which cannot be directly attributed to a Fund are generally apportioned based on the relative net assets of each of the funds in Natixis Funds Trust I, Natixis Funds Trust II, Natixis Funds Trust IV and Gateway Trust (“Natixis Funds Trusts”), Loomis Sayles Funds I and Loomis Sayles Funds II (“Loomis Sayles Funds Trusts”), and Natixis ETF Trust. Expenses of a Fund are bornepro rata by the holders of each class of shares, except that each class bears expenses unique to that class (such as the Rule12b-1 fees applicable to Class A, Class C and Admin Class), and transfer agent fees are borne collectively for Class A,
| 52
Table of Contents
Notes to Financial Statements (continued)
December 31, 2018
Class C, Class Y, and Admin Class and individually for Class N. In addition, each class votes as a class only with respect to its own Rule12b-1 Plan. Shares of each class would receive theirpro rata share of the net assets of the Fund if the Fund were liquidated. The Trustees approve separate distributions from net investment income on each class of shares.
2. Significant Accounting Policies. The following is a summary of significant accounting policies consistently followed by each Fund in the preparation of its financial statements. The Funds’ financial statements follow the accounting and reporting guidelines provided for investment companies and are prepared in accordance with accounting principles generally accepted in the United States of America which require the use of management estimates that affect the reported amounts and disclosures in the financial statements. Actual results could differ from those estimates. Management has evaluated the events and transactions subsequent to year-end through the date the financial statements were issued and has determined that there were no material events that would require disclosure in the Funds’ financial statements.
a. Valuation. Fund securities and other investments are valued at market value based on market quotations obtained or determined by independent pricing services recommended by the adviser and approved by the Board of Trustees. Fund securities and other investments for which market quotations are not readily available are valued at fair value as determined in good faith by the adviser pursuant to procedures approved by the Board of Trustees, as described below. Market value is determined as follows:
Debt securities and unlisted preferred equity securities are valued based on evaluated bids furnished to the Fund by an independent pricing service or bid prices obtained from broker-dealers. Senior loans are valued at bid prices supplied by an independent pricing service, if available. Listed equity securities (including shares ofclosed-end investment companies and exchange-traded funds) are valued at the last sale price quoted on the exchange where they are traded most extensively or, if there is no reported sale during the day, the closing bid quotation as reported by an independent pricing service. Securities traded on the NASDAQ Global Select Market, NASDAQ Global Market and NASDAQ Capital Market are valued at the NASDAQ Official Closing Price (“NOCP”), or if lacking an NOCP, at the most recent bid quotations on the applicable NASDAQ Market. Unlisted equity securities (except unlisted preferred equity securities) are valued at the last sale price quoted in the market where they are traded most extensively or, if there is no reported sale during the day, the closing bid quotation as reported by an independent pricing service. If there is no last sale price or closing bid quotation available, unlisted equity securities will be valued using evaluated bids furnished by an independent pricing service, if available. In some foreign markets, an official close price and a last sale price may be available from the foreign exchange
53 |
Table of Contents
Notes to Financial Statements (continued)
December 31, 2018
or market. In those cases, the official close price is used. Broker-dealer bid prices may be used to value debt and unlisted equity securities and senior loans where an independent pricing service is unable to price a security or where an independent pricing service does not provide a reliable price for the security. Forward foreign currency contracts are valued utilizing interpolated rates determined based on information provided by an independent pricing service. Futures contracts are valued at the most recent settlement price on the exchange on which the adviser believes that, over time, they are traded most extensively.
Fund securities and other investments for which market quotations are not readily available are valued at fair value as determined in good faith by the adviser pursuant to procedures approved by the Board of Trustees. The Funds may also value securities and other investments at fair value in other circumstances such as when extraordinary events occur after the close of a foreign market but prior to the close of the New York Stock Exchange. This may include situations relating to a single issuer (such as a declaration of bankruptcy or a delisting of the issuer’s security from the primary market on which it has traded) as well as events affecting the securities markets in general (such as market disruptions or closings and significant fluctuations in U.S. and/or foreign markets). When fair valuing its securities or other investments, the Funds may, among other things, use modeling tools or other processes that may take into account factors such as securities or other market activity and/or significant events that occur after the close of the foreign market and before the time the Fund’s net asset value (“NAV”) is calculated. Fair value pricing may require subjective determinations about the value of a security, and fair values used to determine a Fund’s NAV may differ from quoted or published prices, or from prices that are used by others, for the same securities. In addition, the use of fair value pricing may not always result in adjustments to the prices of securities held by the Fund.
Illiquid securities for which market quotations are readily available and have been evaluated by the adviser are considered and classified as fair valued securities pursuant to the Funds’ pricing policies and procedures.
As of December 31, 2018, securities held by the Funds were fair valued as follows:
Fund | Securities fair valued | Percentage of | Securities fair | Percentage of Net Assets | ||||||||||||
High Income Fund | $ | 878,957 | 0.6 | % | $ | 866,211 | 0.6 | % | ||||||||
Investment Grade Bond Fund | 110,975,934 | 2.1 | % | 845 | less than 0.1 | % | ||||||||||
b. Investment Transactions and Related Investment Income. Investment transactions are accounted for on a trade date plus one day basis for daily NAV calculation. However, for financial reporting purposes, investment transactions are reported on
| 54
Table of Contents
Notes to Financial Statements (continued)
December 31, 2018
trade date. Dividend income (including income reinvested) and foreign withholding tax, if applicable, is recorded onex-dividend date, or in the case of certain foreign securities, as soon as a Fund is notified, and interest income is recorded on an accrual basis. Interest income is increased by the accretion of discount and decreased by the amortization of premium, if applicable. Distributions received from investments in securities that represent a return of capital or capital gain are recorded as a reduction of cost of investments or as a realized gain, respectively. In determining net gain or loss on securities sold, the cost of securities has been determined on an identified cost basis. Investment income,non-class specific expenses and realized and unrealized gains and losses are allocated on a pro rata basis to each class based on the relative net assets of each class to the total net assets of the Fund.
c. Foreign Currency Translation. The books and records of the Funds are maintained in U.S. dollars. The values of securities, currencies and other assets and liabilities denominated in currencies other than U.S. dollars are translated into U.S. dollars based upon foreign exchange rates prevailing at the end of the period. Purchases and sales of investment securities, income and expenses are translated into U.S. dollars on the respective dates of such transactions.
Net realized foreign exchange gains or losses arise from sales of foreign currency, changes in exchange rates between the trade and settlement dates on securities transactions and the difference between the amounts of dividends, interest and foreign withholding taxes recorded on the Fund’s books and the U.S. dollar equivalent of the amounts actually received or paid. Net unrealized foreign exchange gains or losses arise from changes in the value of assets and liabilities, other than investment securities, as of the end of the fiscal period, resulting from changes in exchange rates. Net realized foreign exchange gains or losses and the net change in unrealized foreign exchange gains or losses are disclosed in the Statements of Operations. For federal income tax purposes, net realized foreign exchange gains or losses are characterized as ordinary income and may, if the Funds have net losses, reduce the amount of income available to be distributed by the Funds.
The values of investment securities are presented at the foreign exchange rates prevailing at the end of the period for financial reporting purposes. Net realized and unrealized gains or losses on investments reported in the Statements of Operations reflect gains or losses resulting from changes in exchange rates and fluctuations which arise due to changes in market prices of investment securities. For federal income tax purposes, a portion of the net realized gain or loss on investments arising from changes in exchange rates, which is reflected in the Statements of Operations, may be characterized as ordinary income and may, if the Funds have net losses, reduce the amount of income available to be distributed by the Funds.
55 |
Table of Contents
Notes to Financial Statements (continued)
December 31, 2018
The Funds may use foreign currency exchange contracts to facilitate transactions in foreign-denominated investments. Losses may arise from changes in the value of the foreign currency or if the counterparties do not perform under the contracts’ terms.
d. Forward Foreign Currency Contracts. The Funds may enter into forward foreign currency contracts, including forward foreign cross currency contracts to acquire exposure to foreign currencies or to hedge the Funds’ investments against currency fluctuation. A contract can also be used to offset a previous contract. These contracts involve market risk in excess of the unrealized gain or loss reflected in the Funds’ Statements of Assets and Liabilities. The U.S. dollar value of the currencies a Fund has committed to buy or sell represents the aggregate exposure to each currency a Fund has acquired or hedged through currency contracts outstanding at period end. Gains or losses are recorded for financial statement purposes as unrealized until settlement date. Contracts are tradedover-the-counter directly with a counterparty. Risks may arise upon entering into these contracts from the potential inability of counterparties to meet the terms of their contracts and from unanticipated movements in the value of a foreign currency relative to the U.S. dollar. Certain contracts may require the movement of cash and/or securities as collateral for the Funds’ or counterparty’s net obligations under the contracts.
e. Futures Contracts. The Funds may enter into futures contracts. Futures contracts are agreements between two parties to buy and sell a particular instrument or index for a specified price on a specified future date.
When a Fund enters into a futures contract, it is required to deposit with (or for the benefit of) its broker an amount of cash or short-term high-quality securities as “initial margin.” As the value of the contract changes, the value of the futures contract position increases or declines. Subsequent payments, known as “variation margin,” are made or received by a Fund, depending on the price fluctuations in the fair value of the contract and the value of cash or securities on deposit with the broker. The aggregate principal amounts of the contracts are not recorded in the financial statements. Fluctuations in the value of the contracts are recorded in the Statements of Assets and Liabilities as an asset (liability) and in the Statements of Operations as unrealized appreciation (depreciation) until the contracts are closed, when they are recorded as realized gains (losses). Realized gain or loss on a futures position is equal to the difference between the value of the contract at the time it was opened and the value at the time it was closed, minus brokerage commissions. When a Fund enters into a futures contract certain risks may arise, such as illiquidity in the futures market, which may limit a Fund’s ability to close out a futures contract prior to settlement date, and unanticipated movements in the value of securities or interest rates.
Futures contracts are exchange-traded. Exchange-traded futures contracts are standardized and are settled through a clearing house with fulfillment supported by the credit of the exchange. Therefore, counterparty credit risks to the Funds are reduced;
| 56
Table of Contents
Notes to Financial Statements (continued)
December 31, 2018
however, in the event that a counterparty enters into bankruptcy, a Fund’s claim against initial/variation margin on deposit with the counterparty may be subject to terms of a final settlement in bankruptcy court.
No futures contracts were held by the Funds during the period ended December 31, 2018.
f. When-Issued and Delayed Delivery Transactions. The Funds may enter into when-issued or delayed delivery transactions. When-issued refers to transactions made conditionally because a security, although authorized, has not been issued. Delayed delivery refers to transactions for which delivery or payment will occur at a later date, beyond the normal settlement period. The price of when-issued and delayed delivery securities and the date when the securities will be delivered and paid for are fixed at the time the transaction is negotiated. The security and the obligation to pay for it are recorded by the Funds at the time the commitment is entered into. The value of the security may vary with market fluctuations during the time before the Funds take delivery of the security. No interest accrues to the Funds until the transaction settles.
Delayed delivery transactions include those designated as To Be Announced (“TBAs”) in the Portfolios of Investments. For TBAs, the actual security that will be delivered to fulfill the transaction is not designated at the time of the trade. The security is “to be announced” 48 hours prior to the established trade settlement date. Certain transactions require the Funds or counterparty to post cash and/or securities as collateral for the netmark-to-market exposure to the other party. The Funds cover their net obligations under outstanding delayed delivery commitments by segregating or earmarking cash or securities at the custodian.
Purchases of when-issued or delayed delivery securities may have a similar effect on the Funds’ NAV as if the Funds’ had created a degree of leverage in the portfolio. Risks may arise upon entering into such transactions from the potential inability of counterparties to meet their obligations under the transactions. Additionally, losses may arise due to changes in the value of the underlying securities.
There were no when-issued or delayed delivery securities held by the Funds as of December 31, 2018.
g. New Disclosure Requirements. In accordance with new reporting requirements pursuant to RegulationS-X of the Securities and Exchange Commission, presentation of certain amounts on the Statements of Changes in Net Assets for the year ended September 30, 2017 have been conformed to the new disclosure requirements. Where the prior disclosure of Distributions to Shareholders separately stated distributions from net investment income and from net realized capital gains for each share class of the Fund, they are now combined into a single line item for each respective share class. In addition, disclosure of Undistributed Net Investment Income and Distributions in Excess of Net Investment Income, where applicable, has been removed from the Statements of Changes in Net Assets.
57 |
Table of Contents
Notes to Financial Statements (continued)
December 31, 2018
The following is a summary of the previously disclosed amounts, as reported at September 30, 2017:
| High Income Fund | ||||
FROM DISTRIBUTIONS TO SHAREHOLDERS: | ||||
Net investment income | ||||
Class A | $ | (1,577,362 | ) | |
Class C | (453,429 | ) | ||
Class N | (41 | ) | ||
Class Y | (6,175,066 | ) | ||
|
| |||
Total distributions | $ | (8,205,898 | ) | |
|
| |||
DISTRIBUTIONS IN EXCESS OF NET INVESTMENT INCOME | $ | (357,359 | ) | |
|
| |||
| Investment Grade Bond Fund | ||||
FROM DISTRIBUTIONS TO SHAREHOLDERS: | ||||
Net investment income | ||||
Class A | $ | (22,698,039 | ) | |
Class C | (13,586,835 | ) | ||
Class N | (19,578,968 | ) | ||
Class Y | (95,925,578 | ) | ||
Admin Class | (642,265 | ) | ||
Net realized capital gains | ||||
Class A | (37,991,535 | ) | ||
Class C | (35,231,779 | ) | ||
Class N | (2,725,590 | ) | ||
Class Y | (166,690,814 | ) | ||
Admin Class | (1,202,096 | ) | ||
|
| |||
Total distributions | $ | (396,273,499 | ) | |
|
| |||
UNDISTRIBUTED NET INVESTMENT INCOME | $ | 60,682,395 | ||
|
| |||
h. Federal and Foreign Income Taxes. The Trust treats each Fund as a separate entity for federal income tax purposes. Each Fund intends to meet the requirements of the Internal Revenue Code of 1986, as amended, applicable to regulated investment companies, and to distribute to its shareholders substantially all of its net investment income and any net realized capital gains at least annually. Management has performed an analysis of each Fund’s tax positions for the open tax years as of December 31, 2018 and has concluded that no provisions for income tax are required. The Funds’ federal tax returns for the prior three fiscal years remain subject to examination by the Internal Revenue Service. Management is not aware of any events that are reasonably possible to occur in the next twelve months that would result in the amounts of any unrecognized tax benefits significantly increasing or decreasing for the Funds. However, management’s conclusions regarding tax positions taken may be subject to review and adjustment at a later date based on factors including, but not limited to, new tax laws and accounting regulations and interpretations thereof.
| 58
Table of Contents
Notes to Financial Statements (continued)
December 31, 2018
A Fund may be subject to foreign withholding taxes on investment income and taxes on capital gains on investments that are accrued and paid based upon the Fund’s understanding of the tax rules and regulations that exist in the countries in which the Fund invests. Foreign withholding taxes on dividend and interest income are reflected on the Statements of Operations as a reduction of investment income, net of amounts eligible to be reclaimed. Dividends and interest receivable on the Statements of Assets and Liabilities are net of foreign withholding taxes. Foreign withholding taxes where reclaims have been or will be filed are reflected on the Statements of Assets and Liabilities as tax reclaims receivable. Capital gains taxes paid are included in net realized gain (loss) on investments in the Statements of Operations. Accrued but unpaid capital gains taxes are reflected as foreign taxes payable on the Statements of Assets and Liabilities, if applicable, and reduce unrealized gains on investments. In the event that realized gains on investments are subsequently offset by realized losses, taxes paid on realized gains may be returned to a Fund. Such amounts, if applicable, are reflected as foreign tax rebates receivable on the Statements of Assets and Liabilities and are recorded as a realized gain when received.
i. Dividends and Distributions to Shareholders. Dividends and distributions are recorded onex-dividend date. The timing and characterization of certain income and capital gain distributions are determined in accordance with federal tax regulations, which may differ from accounting principles generally accepted in the United States of America. Permanent differences are primarily due to differing treatments for book and tax purposes of items such as contingent payment debt instruments, convertible bonds, defaulted and/ornon-income producing securities, deferred trustees’ fees, distributionre-designations, taxable over-distribution, foreign currency gains and losses, net operating losses, passive foreign investment company adjustments, paydown gains and losses and premium amortization. Permanent book and tax basis differences relating to shareholder distributions will result in reclassifications to capital accounts. Temporary differences between book and tax distributable earnings are primarily due to contingent payment debt instruments, convertible bonds, defaulted and/ ornon-income producing securities, deferred Trustees’ fees, forward foreign currency contractmark-to-market, passive foreign investment company adjustments, premium amortization and wash sales. Amounts of income and capital gain available to be distributed on a tax basis are determined annually, and at other times during the Funds’ fiscal year as may be necessary to avoid knowingly declaring and paying a return of capital distribution. Distributions from net investment income and net realized short-term capital gains are reported as distributed from ordinary income for tax purposes.
59 |
Table of Contents
Notes to Financial Statements (continued)
December 31, 2018
The tax characterization of distributions is determined on an annual basis. The tax character of distributions paid to shareholders during the period ended December 31, 2018 and years ended September 30, 2018 and September 30, 2017 were as follows:
| December 31, 2018 Distributions Paid From: | ||||||||||||
Fund | Ordinary | Long-Term | Total | |||||||||
High Income Fund | $ | 2,342,939 | $ | 469,860 | $ | 2,812,799 | ||||||
Investment Grade Bond Fund | 44,211,096 | 26,591,753 | 70,802,849 | |||||||||
| September 30, 2018 Distributions Paid From: | ||||||||||||
Fund | Ordinary | Long-Term | Total | |||||||||
High Income Fund | $ | 7,550,940 | $ | — | $ | 7,550,940 | ||||||
Investment Grade Bond Fund | 126,989,994 | 69,650,181 | 196,640,175 | |||||||||
| September 30, 2017 Distributions Paid From: | ||||||||||||
Fund | Ordinary | Long-Term | Total | |||||||||
High Income Fund | $ | 8,205,898 | $ | — | $ | 8,205,898 | ||||||
Investment Grade Bond Fund | 158,093,971 | 238,179,528 | 396,273,499 | |||||||||
For the year ended September 30, 2017, differences between these amounts and amounts disclosed in Note 2g of the Notes to Financial Statements are primarily attributable to different book and tax treatment for short-term capital gains.
Distributions paid to shareholders from net investment income and net realized capital gains, based on accounting principles generally accepted in the United States of America, are consolidated and reported on the Statements of Changes in Net Assets as Distributions to Shareholders. Distributions paid to shareholders from net investment income and net realized capital gains expressed inper-share amounts, based on accounting principles generally accepted in the United States of America, are separately stated and reported within the Financial Highlights.
| 60
Table of Contents
Notes to Financial Statements (continued)
December 31, 2018
As of December 31, 2018, the components of distributable earnings on a tax basis were as follows:
High Income | Investment | |||||||
Capital loss carryforward: | ||||||||
Short-term: | ||||||||
No expiration date | $ | (783,495 | ) | $ | — | |||
Long-term: | ||||||||
No expiration date | (3,978,362 | ) | — | |||||
|
|
|
| |||||
Total capital loss carryforward | (4,761,857 | ) | — | |||||
|
|
|
| |||||
Late-year ordinary and post-October capital loss deferrals* | — | (27,749,537 | ) | |||||
|
|
|
| |||||
Unrealized appreciation (depreciation) | (9,837,473 | ) | 96,481,542 | |||||
|
|
|
| |||||
Total accumulated earnings (losses) | $ | (14,599,330 | ) | $ | 68,732,005 | |||
|
|
|
| |||||
| * | Under current tax law, capital losses, foreign currency losses, and losses on passive foreign investment companies and contingent payment debt instruments after October 31 or December 31, as applicable, may be deferred and treated as occurring on the first day of the following taxable year. |
As of December 31, 2018, the cost of investments (including derivatives, if applicable) and unrealized appreciation (depreciation) on a federal tax basis were as follows:
High Income | Investment | |||||||
Federal tax cost | $ | 167,566,764 | $ | 5,176,047,253 | ||||
|
|
|
| |||||
Gross tax appreciation | $ | 1,668,098 | $ | 137,444,896 | ||||
Gross tax depreciation | (11,505,554 | ) | (43,192,978 | ) | ||||
|
|
|
| |||||
Net tax appreciation (depreciation) | $ | (9,837,456 | ) | $ | 94,251,918 | |||
|
|
|
| |||||
Differences between these amounts and those reported in the components of distributable earnings are primarily attributable to foreign currencymark-to-market.
j. Loan Participations. Each Fund may invest in loans to corporate, governmental or other borrowers. The Funds’ investments in loans may be in the form of participations in loans or assignments of all or a portion of loans. A loan is often administered by a bank or other financial institution that acts as agent for all holders. The agent administers the terms of the loan, as specified in the loan agreement. When investing in a loan participation, (i) a Fund has the right to receive payments of principal, interest and any fees to which it is entitled only from the party from whom the Fund has
61 |
Table of Contents
Notes to Financial Statements (continued)
December 31, 2018
purchased the participation and only upon receipt by that party of payments from the borrower and (ii) a Fund generally has no right to enforce compliance by the borrower with the terms of the loan agreement or to vote on matters arising under the loan agreement. Thus, a Fund may be subject to credit risk both of the party from whom it purchased the loan participation and the borrower and the Fund may have minimal control over the terms of any loan modification. When a Fund purchases assignments from lenders, it acquires direct rights against the borrower on the loan. Loan agreements and participations outstanding at the end of the period, if any, are listed in each applicable Fund’s Schedule of Investments.
k. Repurchase Agreements. Each Fund may enter into repurchase agreements, under the terms of a Master Repurchase Agreement, under which each Fund acquires securities as collateral and agrees to resell the securities at an agreed upon time and at an agreed upon price. It is each Fund’s policy that the market value of the collateral for repurchase agreements be at least equal to 102% of the repurchase price, including interest. Certain repurchase agreements aretri-party arrangements whereby the collateral is held in a segregated account for the benefit of the Fund and on behalf of the counterparty. Repurchase agreements could involve certain risks in the event of default or insolvency of the counterparty, including possible delays or restrictions upon a Fund’s ability to dispose of the underlying securities. As of December 31, 2018, each Fund had investments in repurchase agreements for which the value of the related collateral exceeded the value of the repurchase agreement. The gross value of repurchase agreements is included in the Statements of Assets and Liabilities for financial reporting purposes.
l. Due from Brokers. Transactions and positions in certain forward foreign currency contracts are maintained and cleared by registered U.S. broker/dealers pursuant to customer agreements between the Fund and the various broker/dealers. The due from broker balance in the Statements of Assets and Liabilities for Investment Grade Bond Fund represents cash pledged as collateral for forward foreign currency contracts. In certain circumstances the Fund’s use of cash held at brokers is restricted by regulation or broker mandated limits.
m. Securities Lending. The Funds have entered into an agreement with State Street Bank and Trust Company (“State Street Bank”), as agent of the Funds, to lend securities to certain designated borrowers. The loans are collateralized with cash or securities in an amount equal to at least 105% or 102% of the market value (including accrued interest) of the loaned international or domestic securities, respectively, when the loan is initiated. Thereafter, the value of the collateral must remain at least 102% of the market value (including accrued interest) of loaned securities for U.S. equities and U.S. corporate debt; at least 105% of the market value (including accrued interest) of loaned securities fornon-U.S. equities; and at least 100% of the market value (including accrued interest) of loaned securities for U.S. Government securities, sovereign debt issued bynon-U.S. Governments andnon-U.S. corporate debt. In the event that the
| 62
Table of Contents
Notes to Financial Statements (continued)
December 31, 2018
market value of the collateral falls below the required percentages described above, the borrower will deliver additional collateral on the next business day. As with other extensions of credit, the Funds may bear the risk of loss with respect to the investment of the collateral. The Funds invest cash collateral in short-term investments, a portion of the income from which is remitted to the borrowers and the remainder allocated between the Funds and State Street Bank as lending agent.
For the period ended December 31, 2018, neither Fund had loaned securities under this agreement.
n. Indemnifications. Under the Trust’s organizational documents, its officers and Trustees are indemnified against certain liabilities arising out of the performance of their duties to the Funds. Additionally, in the normal course of business, the Funds enter into contracts with service providers that contain general indemnification clauses. The Funds’ maximum exposure under these arrangements is unknown as this would involve future claims that may be made against the Funds that have not yet occurred. However, based on experience, the Funds expect the risk of loss to be remote.
o. New Accounting Pronouncement. In March 2017, the Financial Accounting Standards Board (FASB) issued Accounting Standards Update (ASU)No. 2017-08, Receivables — Nonrefundable Fees and Other Costs (Subtopic310-20): Premium Amortization on Purchased Callable Debt Securities. The amendments in the ASU shorten the amortization period for certain callable debt securities acquired at a premium, to be amortized to the earliest call date. The ASU does not require an accounting change for securities acquired at a discount, which continues to be amortized to maturity. The ASU is effective for fiscal years and interim periods within those fiscal years beginning after December 15, 2018. Management is currently evaluating the impact, if any, of applying this provision.
3. Fair Value Measurements. In accordance with accounting standards related to fair value measurements and disclosures, the Funds have categorized the inputs utilized in determining the value of each Fund’s assets or liabilities. These inputs are summarized in the three broad levels listed below:
| • | Level 1 – quoted prices in active markets for identical assets or liabilities; |
| • | Level 2 – prices determined using other significant inputs that are observable either directly, or indirectly through corroboration with observable market data (which could include quoted prices for similar assets or liabilities, interest rates, credit risk, etc.); and |
| • | Level 3 – prices determined using significant unobservable inputs when quoted prices or observable inputs are unavailable such as when there is little or no market activity for an asset or liability (unobservable inputs reflect each Fund’s own assumptions in determining the fair value of assets or liabilities and would be based on the best information available). |
63 |
Table of Contents
Notes to Financial Statements (continued)
December 31, 2018
The inputs or methodology used for valuing securities are not necessarily an indication of the risk associated with investing in those securities.
The Funds’ pricing policies and procedures are recommended by the adviser and approved by the Board of Trustees. Debt securities are valued based on evaluated bids furnished to the Funds by an independent pricing service. Broker-dealer bid prices may be used if an independent pricing service either is unable to price a security or does not provide a reliable price for a security. Broker-dealer bid prices for which the Funds do not have knowledge of the inputs used by the broker-dealer are categorized in Level 3. All security prices, including those obtained from an independent pricing service and broker-dealer bid prices, are reviewed on a daily basis by the adviser, subject to oversight by Fund management and the Board of Trustees. If the adviser, in good faith, believes that the price provided by an independent pricing service is unreliable, broker-dealer bid prices may be used until the price provided by the independent pricing service is considered to be reliable. Reliability of all security prices, including those obtained from an independent pricing service and broker-dealer bid prices, is tested in a variety of ways, including comparison to recent transaction prices and daily fluctuations, amongst other validation procedures in place. Securities for which market quotations are not readily available are valued at fair value as determined in good faith by the Funds’ adviser pursuant to procedures approved by the Board of Trustees. Fair valued securities may be categorized in Level 3.
The following is a summary of the inputs used to value the Funds’ investments as of December 31, 2018, at value:
High Income Fund
Asset Valuation Inputs
Description | Level 1 | Level 2 | Level 3 | Total | ||||||||||||
Bonds and Notes | ||||||||||||||||
Non-Convertible Bonds | ||||||||||||||||
ABS Home Equity | $ | — | $ | 1,629,624 | $ | 574 | (b) | $ | 1,630,198 | |||||||
Home Construction | — | 2,437,625 | 12 | (b) | 2,437,637 | |||||||||||
All OtherNon-Convertible Bonds(a) | — | 106,299,874 | — | 106,299,874 | ||||||||||||
|
|
|
|
|
|
|
| |||||||||
TotalNon-Convertible Bonds | — | 110,367,123 | 586 | 110,367,709 | ||||||||||||
|
|
|
|
|
|
|
| |||||||||
Convertible Bonds(a) | — | 13,572,043 | — | 13,572,043 | ||||||||||||
|
|
|
|
|
|
|
| |||||||||
Total Bonds and Notes | — | 123,939,166 | 586 | 123,939,752 | ||||||||||||
|
|
|
|
|
|
|
| |||||||||
| 64
Table of Contents
Notes to Financial Statements (continued)
December 31, 2018
High Income Fund (continued)
Asset Valuation Inputs (continued)
Description | Level 1 | Level 2 | Level 3 | Total | ||||||||||||
Loan Participations(a) | $ | — | $ | — | $ | 425,679 | (c) | $ | 425,679 | |||||||
Senior Loans(a) | — | 2,392,529 | — | 2,392,529 | ||||||||||||
Preferred Stocks | ||||||||||||||||
Food & Beverage | — | 1,433,853 | — | 1,433,853 | ||||||||||||
Midstream | — | 519,979 | 58,567 | (c) | 578,546 | |||||||||||
|
|
|
|
|
|
|
| |||||||||
Total Preferred Stocks | — | 1,953,832 | 58,567 | 2,012,399 | ||||||||||||
|
|
|
|
|
|
|
| |||||||||
Other Investments(a) | — | — | 865,625 | (d) | 865,625 | |||||||||||
Short-Term Investments | — | 28,093,324 | — | 28,093,324 | ||||||||||||
|
|
|
|
|
|
|
| |||||||||
Total Investments | — | 156,378,851 | 1,350,457 | 157,729,308 | ||||||||||||
|
|
|
|
|
|
|
| |||||||||
Forward Foreign Currency Contracts (unrealized appreciation) | — | 29,351 | — | 29,351 | ||||||||||||
|
|
|
|
|
|
|
| |||||||||
Total | $ | — | $ | 156,408,202 | $ | 1,350,457 | $ | 157,758,659 | ||||||||
|
|
|
|
|
|
|
| |||||||||
Liability Valuation Inputs
Description | Level 1 | Level 2 | Level 3 | Total | ||||||||||||
Forward Foreign Currency Contracts (unrealized depreciation) | $ | — | $ | (73,445 | ) | $ | — | $ | (73,445 | ) | ||||||
|
|
|
|
|
|
|
| |||||||||
| (a) | Details of the major categories of the Fund’s investments are reflected within the Portfolio of Investments. |
| (b) | Fair valued by the Fund’s adviser. |
| (c) | Valued using broker-dealer bid prices. |
| (d) | Fair valued by the Fund’s adviser using broker-dealer bid prices for which the inputs are unobservable to the Fund. |
65 |
Table of Contents
Notes to Financial Statements (continued)
December 31, 2018
Investment Grade Bond Fund
Asset Valuation Inputs
Description | Level 1 | Level 2 | Level 3 | Total | ||||||||||||
Bonds and Notes | ||||||||||||||||
Non-Convertible Bonds | ||||||||||||||||
ABS Other | $ | — | $ | 63,167,798 | $ | 57,551,934 | (b) | $ | 120,719,732 | |||||||
ABS Student Loan | — | 7,061,395 | 4,259,110 | (b) | 11,320,505 | |||||||||||
Airlines | — | 39,730,035 | 1,202,015 | (b) | 40,932,050 | |||||||||||
Metals & Mining | — | 160,116,560 | 845 | (c) | 160,117,405 | |||||||||||
All OtherNon-Convertible Bonds(a) | — | 4,012,612,398 | — | 4,012,612,398 | ||||||||||||
|
|
|
|
|
|
|
| |||||||||
TotalNon-Convertible Bonds | — | 4,282,688,186 | 63,013,904 | 4,345,702,090 | ||||||||||||
|
|
|
|
|
|
|
| |||||||||
Convertible Bonds(a) | — | 74,239,594 | — | 74,239,594 | ||||||||||||
Municipals(a) | — | 17,615,088 | — | 17,615,088 | ||||||||||||
|
|
|
|
|
|
|
| |||||||||
Total Bonds and Notes | — | 4,374,542,868 | 63,013,904 | 4,437,556,772 | ||||||||||||
|
|
|
|
|
|
|
| |||||||||
Preferred Stocks(a) | — | 14,684,777 | — | 14,684,777 | ||||||||||||
Short-Term Investments | — | 818,057,622 | — | 818,057,622 | ||||||||||||
|
|
|
|
|
|
|
| |||||||||
Total Investments | — | 5,207,285,267 | 63,013,904 | 5,270,299,171 | ||||||||||||
|
|
|
|
|
|
|
| |||||||||
Forward Foreign Currency Contracts (unrealized appreciation) | — | 605,245 | — | 605,245 | ||||||||||||
|
|
|
|
|
|
|
| |||||||||
Total | $ | — | $ | 5,207,890,512 | $ | 63,013,904 | $ | 5,270,904,416 | ||||||||
|
|
|
|
|
|
|
| |||||||||
Liability Valuation Inputs
Description | Level 1 | Level 2 | Level 3 | Total | ||||||||||||
Forward Foreign Currency Contracts (unrealized depreciation) | $ | — | $ | (1,275,946 | ) | $ | — | $ | (1,275,946 | ) | ||||||
|
|
|
|
|
|
|
| |||||||||
| (a) | Details of the major categories of the Fund’s investments are reflected within the Portfolio of Investments. |
| (b) | Valued using broker-dealer bid prices. |
| (c) | Fair valued by the Fund’s adviser. |
| 66
Table of Contents
Notes to Financial Statements (continued)
December 31, 2018
The following is a reconciliation of Level 3 investments for which significant unobservable inputs were used to determine fair value as of September 30, 2017 and/or December 31, 2018:
High Income Fund
Asset Valuation Inputs
Investments in Securities | Balance as of | Accrued | Realized | Change in | Purchases | |||||||||||||||
Bonds and Notes | ||||||||||||||||||||
Non-Convertible Bonds | ||||||||||||||||||||
ABS Home Equity | $ | 683 | $ | — | $ | 1 | $ | (102 | ) | $ | — | |||||||||
Home Construction | 12 | 7,509 | — | (7,509 | ) | — | ||||||||||||||
Loan Participations | ||||||||||||||||||||
ABS Other | 437,015 | 9 | 13 | (5,674 | ) | — | ||||||||||||||
Other Investments | ||||||||||||||||||||
Aircraft ABS | 896,883 | — | (8 | ) | (31,250 | ) | — | |||||||||||||
Preferred Stocks | ||||||||||||||||||||
Convertible Preferred Stocks | ||||||||||||||||||||
Midstream | — | — | — | (23,472 | ) | — | ||||||||||||||
|
|
|
|
|
|
|
|
|
| |||||||||||
Total | $ | 1,334,593 | $ | 7,518 | $ | 6 | $ | (68,007 | ) | $ | — | |||||||||
|
|
|
|
|
|
|
|
|
| |||||||||||
Investments in Securities | Sales | Transfers | Transfers | Balance as of | Change in | |||||||||||||||
Bonds and Notes | ||||||||||||||||||||
Non-Convertible Bonds | ||||||||||||||||||||
ABS Home Equity | $ | (8 | ) | $ | — | $ | — | $ | 574 | $ | (116 | ) | ||||||||
Home Construction | — | — | — | 12 | (7,509 | ) | ||||||||||||||
Loan Participations | ||||||||||||||||||||
ABS Other | (5,684 | ) | — | — | 425,679 | 871 | ||||||||||||||
Other Investments | ||||||||||||||||||||
Aircraft ABS | — | — | — | 865,625 | (31,250 | ) | ||||||||||||||
Preferred Stocks | ||||||||||||||||||||
Convertible Preferred Stocks | ||||||||||||||||||||
Midstream | — | 82,039 | — | 58,567 | (23,472 | ) | ||||||||||||||
|
|
|
|
|
|
|
|
|
| |||||||||||
Total | $ | (5,692 | ) | $ | 82,039 | $ | — | $ | 1,350,457 | $ | (61,476 | ) | ||||||||
|
|
|
|
|
|
|
|
|
| |||||||||||
67 |
Table of Contents
Notes to Financial Statements (continued)
December 31, 2018
A preferred stock valued at $82,039 was transferred from Level 2 to Level 3 during the period ended December 31, 2018. At September 30, 2018, this security was valued on the basis of evaluated bids furnished to the Fund by an independent pricing service in accordance with the Fund’s valuation policies. At December 31, 2018, this security was valued using broker-dealer bid prices based on inputs unobservable to the Fund as an independent pricing service did not provide a reliable price for the security.
All transfers are recognized as of the beginning of the reporting period.
Investment Grade Bond Fund
Asset Valuation Inputs
Investments in Securities | Balance as of | Accrued | Realized | Change in | Purchases | |||||||||||||||
Bonds and Notes | ||||||||||||||||||||
Non-Convertible Bonds | ||||||||||||||||||||
ABS Other | $ | 50,772,266 | $ | — | $ | 61,038 | $ | (13,558 | ) | $ | 11,026,794 | |||||||||
ABS Student Loan | — | — | 601 | 5,832 | 4,535,676 | |||||||||||||||
Airlines | 7,789,254 | 1,156 | — | (26,010 | ) | — | ||||||||||||||
Metals & Mining | 845 | 3,730 | — | (3,730 | ) | — | ||||||||||||||
|
|
|
|
|
|
|
|
|
| |||||||||||
Total | $ | 58,562,365 | $ | 4,886 | $ | 61,639 | $ | (37,466 | ) | $ | 15,562,470 | |||||||||
|
|
|
|
|
|
|
|
|
| |||||||||||
Investments in Securities | Sales | Transfers | Transfers | Balance as of | Change in | |||||||||||||||
Bonds and Notes | ||||||||||||||||||||
Non-Convertible Bonds | ||||||||||||||||||||
ABS Other | $ | (4,294,606 | ) | $ | — | $ | — | $ | 57,551,934 | $ | (606 | ) | ||||||||
ABS Student Loan | (282,999 | ) | — | — | 4,259,110 | 5,832 | ||||||||||||||
Airlines | — | — | (6,562,385 | ) | 1,202,015 | (26,010 | ) | |||||||||||||
Metals & Mining | — | — | — | 845 | (3,730 | ) | ||||||||||||||
|
|
|
|
|
|
|
|
|
| |||||||||||
Total | $ | (4,577,605 | ) | $ | — | $ | (6,562,385 | ) | $ | 63,013,904 | $ | (24,514 | ) | |||||||
|
|
|
|
|
|
|
|
|
| |||||||||||
A debt security valued at $6,562,385 was transferred from Level 3 to Level 2 during the period ended December 31, 2018. At September 30, 2018, this security was valued using
| 68
Table of Contents
Notes to Financial Statements (continued)
December 31, 2018
broker-dealer bid prices based on inputs unobservable to the Fund as an independent pricing service did not provide a reliable price for the security. At December 31, 2018, this security was valued on the basis of evaluated bids furnished to the Fund by an independent pricing service in accordance with the Fund’s valuation policies.
All transfers are recognized as of the beginning of the reporting period.
4. Derivatives. Derivative instruments are defined as financial instruments whose value and performance are based on the value and performance of an underlying asset, reference rate or index. Derivative instruments that the Funds used during the period include forward foreign currency contracts.
The Funds are subject to the risk that changes in foreign currency exchange rates will have an unfavorable effect on the value of Fund assets denominated in foreign currencies. The Funds may enter into forward foreign currency contracts for hedging purposes to protect the value of the Funds’ holdings of foreign securities. The Funds may also use forward foreign currency contracts to gain exposure to foreign currencies, regardless of whether securities denominated in such currencies are held in the Funds. During the period ended December 31, 2018, the Funds engaged in forward foreign currency transactions for hedging purposes.
The following is a summary of derivative instruments for High Income Fund as of December 31, 2018, as reflected within the Statements of Assets and Liabilities:
Assets | Unrealized | |||
Over-the-counter asset derivatives Foreign exchange contracts | $ | 29,351 | ||
Liabilities | Unrealized | |||
Over-the-counter liability derivatives Foreign exchange contracts | $ | (73,445 | ) | |
Transactions in derivative instruments for High Income Fund during the period ended December 31, 2018, as reflected within the Statements of Operations, were as follows:
Net Realized Gain (Loss) on: | Forward foreign | |||
Foreign exchange contracts | $ | 219,012 | ||
Net Change in Unrealized | Forward foreign | |||
Foreign exchange contracts | $ | (128,778 | ) | |
69 |
Table of Contents
Notes to Financial Statements (continued)
December 31, 2018
The following is a summary of derivative instruments for Investment Grade Bond Fund as of December 31, 2018, as reflected within the Statements of Assets and Liabilities:
Assets | Unrealized | |||
Over-the-counter asset derivatives | $ | 605,245 | ||
Liabilities | Unrealized | |||
Over-the-counter liability derivatives | $ | (1,275,946 | ) | |
Transactions in derivative instruments for Investment Grade Bond Fund during the period ended December 31, 2018, as reflected within the Statements of Operations, were as follows:
Net Change in Unrealized | Forward foreign | |||
Foreign exchange contracts | $ | (670,701 | ) | |
As the Funds value their derivatives at fair value and recognize changes in fair value through the Statements of Operations, they do not qualify for hedge accounting under authoritative guidance for derivative instruments. The Funds’ investments in derivatives may represent an economic hedge; however, they are considered to benon-hedge transactions for the purpose of these disclosures.
The volume of forward foreign currency contract activity, as a percentage of net assets, based on grossmonth-end notional amounts outstanding during the period, including long and short positions at absolute value, was as follows for the period ended December 31, 2018:
High Income Fund | Forwards | |||
Average Notional Amount Outstanding | 3.52 | % | ||
Highest Notional Amount Outstanding | 5.33 | % | ||
Lowest Notional Amount Outstanding | 2.72 | % | ||
Notional Amount Outstanding as of December 31, 2018 | 3.20 | % | ||
Investment Grade Bond Fund | Forwards | |||
Average Notional Amount Outstanding | 0.39 | % | ||
Highest Notional Amount Outstanding | 1.07 | % | ||
Lowest Notional Amount Outstanding | 0.00 | % | ||
Notional Amount Outstanding as of December 31, 2018 | 1.07 | % | ||
| 70
Table of Contents
Notes to Financial Statements (continued)
December 31, 2018
Notional amounts outstanding at the end of the prior period, if applicable, are included in the average notional amount outstanding.
Unrealized gain and/or loss on open forwards is recorded in the Statements of Assets and Liabilities. The aggregate notional values of forward contracts are not recorded in the Statements of Assets and Liabilities, and therefore are not included in the Funds’ net assets.
Over-the-counter derivatives, including forward foreign currency contracts, are entered into pursuant to International Swaps and Derivatives Association, Inc. (“ISDA”) agreements negotiated between the Funds and their counterparties. ISDA agreements typically contain, among other things, terms for the posting of collateral and master netting provisions in the event of a default or other termination event. Collateral is posted by a Fund or the counterparty to the extent of the netmark-to-market exposure to the other party of all open contracts under the agreement, subject to minimum transfer requirements. Master netting provisions allow the Funds and the counterparty, in the event of a default or other termination event, to offset amounts owed by each related to derivative contracts, including any posted collateral, to one net amount payable by either the Funds or the counterparty. The Funds’ ISDA agreements typically contain provisions that allow a counterparty to terminate open contracts early if the NAV of a Fund declines beyond a certain threshold. For financial reporting purposes, the Funds do not offset derivative assets and liabilities, and any related collateral received or pledged, on the Statements of Assets and Liabilities.
As of December 31, 2018, gross amounts ofover-the-counter derivative assets and liabilities not offset in the Statements of Assets and Liabilities and the related net amounts after taking into account master netting arrangements, by counterparty, are as follows:
High Income Fund
Counterparty | Gross Amounts | Offset | Net Asset | Collateral | Net | |||||||||||||||
Bank of America N.A | $ | 27,098 | $ | (27,098 | ) | $ | — | $ | — | $ | — | |||||||||
HSBC Bank USA | 2,253 | (2,253 | ) | — | — | — | ||||||||||||||
|
|
|
|
|
|
|
|
|
| |||||||||||
| $ | 29,351 | $ | (29,351 | ) | $ | — | $ | — | $ | — | ||||||||||
|
|
|
|
|
|
|
|
|
| |||||||||||
Counterparty | Gross Amounts | Offset | Net Liability | Collateral | Net | |||||||||||||||
Bank of America N.A | $ | (60,419 | ) | $ | 27,098 | $ | (33,321 | ) | $ | — | $ | (33,321 | ) | |||||||
HSBC Bank USA | (13,026 | ) | 2,253 | (10,773 | ) | — | (10,773 | ) | ||||||||||||
|
|
|
|
|
|
|
|
|
| |||||||||||
| $ | (73,445 | ) | $ | 29,351 | $ | (44,094 | ) | $ | — | $ | (44,094 | ) | ||||||||
|
|
|
|
|
|
|
|
|
| |||||||||||
71 |
Table of Contents
Notes to Financial Statements (continued)
December 31, 2018
Investment Grade Bond Fund
Counterparty | Gross Amounts | Offset | Net Asset | Collateral | Net | |||||||||||||||
BNP Paribas S.A. | $ | 605,245 | $ | (605,245 | ) | $ | — | $ | — | $ | — | |||||||||
|
|
|
|
|
|
|
|
|
| |||||||||||
Counterparty | Gross Amounts | Offset | Net Liability | Collateral | Net | |||||||||||||||
BNP Paribas S.A. | $ | (1,275,946 | ) | $ | 605,245 | $ | (670,701 | ) | $ | 650,000 | $ | (20,701 | ) | |||||||
|
|
|
|
|
|
|
|
|
| |||||||||||
The actual collateral received or pledged, if any, may exceed the amounts shown in the table due to overcollateralization. Timing differences may exist between when contracts under the ISDA agreements aremarked-to-market and when collateral moves. The ISDA agreements includetri-party control agreements under which collateral is held for the benefit of the secured party at a third party custodian, State Street Bank.
Counterparty risk is managed based on policies and procedures established by each Fund’s adviser. Such policies and procedures may include, but are not limited to, minimum counterparty credit rating requirements, monitoring of counterparty credit default swap spreads and posting of collateral. A Fund’s risk of loss from counterparty credit risk onover-the-counter derivatives is generally limited to the Fund’s aggregated unrealized gains and the amount of any collateral pledged to the counterparty, which may be offset by any collateral posted to the Fund by the counterparty. ISDA master agreements can help to manage counterparty risk by specifying collateral posting arrangements atpre-arranged exposure levels. Under these ISDA agreements, collateral is routinely transferred if the total net exposure in respect of certain transactions, net of existing collateral already in place, exceeds a specified amount (typically $250,000, depending on the counterparty). With exchange-traded derivatives, there is minimal counterparty credit risk to the Fund because the exchange’s clearing house, as counterparty to these instruments, stands between the buyer and the seller of the contract. Credit risk still exists in exchange-traded derivatives with respect to initial and variation margin that is held in a broker’s customer accounts. While brokers are required to segregate customer margin from their own assets, in the event that a broker becomes insolvent or goes into bankruptcy and at that time there is a shortfall in the aggregate amount of margin held by the broker for all its clients, U.S. bankruptcy laws will typically allocate that shortfall on a pro rata basis across all of the broker’s customers, potentially resulting in losses to the Fund. Based on balances reflected on each Fund’s Statement of Assets and Liabilities, the following table shows (i) the maximum amount of loss due to credit risk that, based on the gross fair value of the financial instrument, the Fund would incur if parties (including OTC derivative
| 72
Table of Contents
Notes to Financial Statements (continued)
December 31, 2018
counterparties and brokers holding margin for exchange-traded derivatives) to the relevant financial instruments failed completely to perform according to the terms of the contracts and the collateral or other security, if any, for the amount due proved to be of no value to the Fund, and (ii) the amount of loss that the Fund would incur after taking into account master netting provisions pursuant to ISDA agreements, as of December 31, 2018:
Fund | Maximum Amount | Maximum Amount | ||||||
High Income Fund | $ | 29,351 | $ | — | ||||
Investment Grade Bond Fund | 1,255,245 | — | ||||||
5. Purchases and Sales of Securities. For the period ended December 31, 2018, purchases and sales of securities (excluding short-term investments and including paydowns) were as follows:
| U.S. Government/ Agency Securities | Other Securities | |||||||||||||||
Fund | Purchases | Sales | Purchases | Sales | ||||||||||||
High Income Fund | $ | — | $ | 6,733,642 | $ | 26,199,855 | $ | 45,804,019 | ||||||||
Investment Grade Bond Fund | 194,863,447 | 401 | 2,649,875,425 | 1,462,052,369 | ||||||||||||
6. Management Fees and Other Transactions with Affiliates.
a. Management Fees. Loomis, Sayles & Company, L.P. (“Loomis Sayles”) serves as investment adviser to each Fund. Loomis Sayles is a limited partnership whose sole general partner, Loomis, Sayles & Company, Inc., is indirectly owned by Natixis Investment Managers, L.P. (“Natixis”), which is part of Natixis Investment Managers, an international asset management group based in Paris, France.
Under the terms of the management agreements, each Fund pays a management fee at the following annual rates, calculated daily and payable monthly, based on each Fund’s average daily net assets:
| Percentage of Average Daily Net Assets | ||||||||
Fund | First $15 billion | Over $15 billion | ||||||
High Income Fund | 0.60 | % | 0.60 | % | ||||
Investment Grade Bond Fund | 0.40 | % | 0.38 | % | ||||
Loomis Sayles has given binding undertakings to the Funds to waive management fees and/or reimburse certain expenses to limit the Funds’ operating expenses, exclusive of acquired fund fees and expenses, brokerage expenses, interest expense, taxes, organizational and extraordinary expenses such as litigation and indemnification
73 |
Table of Contents
Notes to Financial Statements (continued)
December 31, 2018
expenses. These undertakings are in effect until April 30, 2020, may be terminated before then only with the consent of the Funds’ Board of Trustees, and are reevaluated on an annual basis. Management fees payable, as reflected on the Statements of Assets and Liabilities, is net of waivers and/or expense reimbursements, if any, pursuant to these undertakings. Waivers/reimbursements that exceed management fees payable are reflected on the Statements of Assets and Liabilities as receivable from investment adviser.
For the period ended December 31, 2018 the expense limits as a percentage of average daily net assets under the expense limitation agreements were as follows:
| Expense Limit as a Percentage of Average Daily Net Assets | ||||||||||||||||||||
Fund | Class A | Class C | Class N | Class Y | Admin Class | |||||||||||||||
High Income Fund | 1.05 | % | 1.80 | % | 0.75 | % | 0.80 | % | — | |||||||||||
Investment Grade Bond Fund | 0.78 | % | 1.53 | % | 0.48 | % | 0.53 | % | 1.03 | % | ||||||||||
Loomis Sayles shall be permitted to recover expenses borne under the expense limitation agreements (whether through waiver of management fees or otherwise) on a class by class basis in later periods to the extent the annual operating expenses of a class fall below a class’ expense limits, provided, however, that a class is not obligated to pay such waived/reimbursed fees or expenses more than one year after the end of the fiscal year in which the fees or expenses were waived/reimbursed.
For the period ended December 31, 2018, the management fees and waivers of management fees for each Fund were as follows:
Fund | Gross | Contractual | Net | Percentage of Average Daily Net Assets | ||||||||||||||||
Gross | Net | |||||||||||||||||||
High Income Fund | $ | 249,773 | $ | 90,030 | $ | 159,743 | 0.60 | % | 0.38 | % | ||||||||||
Investment Grade Bond Fund | 5,487,700 | 404,301 | 5,083,399 | 0.40 | % | 0.37 | % | |||||||||||||
| 1 | Waiver/expense reimbursements are subject to possible recovery until December 31, 2019. |
No expenses were recovered for either Fund during the period ended December 31, 2018 under the terms of the expense limitation agreements.
b. Service and Distribution Fees. Natixis Distribution, L.P. (“Natixis Distribution), which is a wholly-owned subsidiary of Natixis, has entered into a distribution agreement with the Trust. Pursuant to this agreement, Natixis Distribution serves as principal underwriter of the Funds of the Trust.
| 74
Table of Contents
Notes to Financial Statements (continued)
December 31, 2018
Pursuant to Rule12b-1 under the 1940 Act, the Trust has adopted a Service Plan relating to each Fund’s Class A shares (the “Class A Plans”), a Distribution and Service Plan relating to each Fund’s Class C shares (the “Class C Plans”), and Investment Grade Bond Fund has adopted a Distribution Plan relating to its Admin Class shares (the “Admin Class Plan”).
Under the Class A Plans, each Fund pays Natixis Distribution a monthly service fee at an annual rate not to exceed 0.25% of the average daily net assets attributable to the Fund’s Class A shares, as reimbursement for expenses incurred by Natixis Distribution in providing personal services to investors in Class A shares and/or the maintenance of shareholder accounts.
Under the Class C Plans, each Fund pays Natixis Distribution a monthly service fee at an annual rate not to exceed 0.25% of the average daily net assets attributable to the Fund’s Class C shares, as compensation for services provided by Natixis Distribution in providing personal services to investors in Class C shares and/or the maintenance of shareholder accounts.
Also under the Class C Plans, each Fund pays Natixis Distribution a monthly distribution fee at an annual rate of 0.75% of the average daily net assets attributable to the Fund’s Class C shares, as compensation for services provided by Natixis Distribution in connection with the marketing or sale of Class C shares.
Under the Admin Class Plan, Investment Grade Bond Fund pays Natixis Distribution a monthly distribution fee at an annual rate not to exceed 0.25% of the average daily net assets attributable to the Fund’s Admin Class shares, as compensation for services provided by Natixis Distribution in connection with the marketing or sale of Admin Class shares or for payments made by Natixis Distribution to securities dealers or other financial intermediaries as commissions, asset-based sales charges or other compensation with respect to the sale of Admin Class shares, or for providing personal services to investors and/or the maintenance of shareholder accounts.
In addition, the Admin Class shares of Investment Grade Bond Fund may pay Natixis Distribution an administrative service fee, at an annual rate not to exceed 0.25% of the average daily net assets attributable to Admin Class shares. These fees are subsequently paid to securities dealers or financial intermediaries for providing personal services and/or account maintenance for their customers who hold such shares.
For the period ended December 31, 2018, the service and distribution fees for each Fund were as follows:
| Service Fees | Distribution Fees | |||||||||||||||||||
Fund | Class A | Class C | Admin Class | Class C | Admin Class | |||||||||||||||
High Income Fund | $ | 15,693 | $ | 3,635 | $ | — | $ | 10,905 | $ | — | ||||||||||
Investment Grade Bond Fund | 474,671 | 243,519 | 71,313 | 730,558 | 71,313 | |||||||||||||||
75 |
Table of Contents
Notes to Financial Statements (continued)
December 31, 2018
c. Administrative Fees. Natixis Advisors, L.P. (“Natixis Advisors”) provides certain administrative services for the Funds and contracts with State Street Bank to serve assub-administrator. Natixis Advisors is a wholly-owned subsidiary of Natixis. Pursuant to an agreement among Natixis Funds Trusts, Loomis Sayles Funds Trusts, Natixis ETF Trust and Natixis Advisors, each Fund pays Natixis Advisors monthly itspro rata portion of fees equal to an annual rate of 0.0575% of the first $15 billion of the average daily net assets of the Natixis Funds Trusts, Loomis Sayles Funds Trusts and Natixis ETF Trust, 0.0500% of the next $15 billion, 0.0400% of the next $30 billion, 0.0275% of the next $30 billion and 0.0225% of such assets in excess of $90 billion, subject to an annual aggregate minimum fee for the Natixis Funds Trusts, Loomis Sayles Funds Trusts and Natixis ETF Trust of $10 million, which is reevaluated on an annual basis.
Prior to July 1, 2018, each Fund paid Natixis Advisors monthly itspro rata portion of fees equal to an annual rate of 0.0575% of the first $15 billion of the average daily net assets of the Natixis Funds Trusts, Loomis Sayles Funds Trusts and Natixis ETF Trust, 0.0500% of the next $15 billion, 0.0400% of the next $30 billion, 0.0350% of the next $30 billion and 0.0325% of such assets in excess of $90 billion, subject to an annual aggregate minimum fee for the Natixis Funds Trusts, Loomis Sayles Funds Trusts and Natixis ETF Trust of $10 million, which was reevaluated on an annual basis.
Effective October 1, 2018, State Street Bank agreed to reduce the fees it receives from Natixis Advisors for serving assub-administrator to the Funds. Also, effective October 1, 2018, Natixis Advisors agreed to voluntarily waive fees paid by the Funds in an amount equal to the reduction insub-administrative fees discussed above. The waiver is in effect through June 30, 2019, at which time it will be reevaluated as part of the annual review of the administrative fee contract, as noted above.
For the period ended December 31, 2018, the administrative fees for each Fund were as follows:
Fund | Gross | Waiver of | Net | |||||||||
High Income Fund | $ | 18,014 | $ | 411 | $ | 17,603 | ||||||
Investment Grade Bond Fund | 599,847 | 13,538 | 586,309 | |||||||||
d. Sub-Transfer Agent Fees. Natixis Distribution has entered into agreements, which include servicing agreements, with financial intermediaries that provide recordkeeping, processing, shareholder communications and other services to customers of the intermediaries that hold positions in the Funds and has agreed to compensate the intermediaries for providing those services. Intermediaries transact with the Funds primarily through the use of omnibus accounts on behalf of their customers who hold positions in the Funds. These services would have been provided by the Funds’ transfer agent and other service providers if the shareholders’ accounts were maintained directly at the Funds’ transfer agent. Accordingly, the Funds have
| 76
Table of Contents
Notes to Financial Statements (continued)
December 31, 2018
agreed to reimburse Natixis Distribution for all or a portion of the servicing fees paid to these intermediaries. The reimbursement amounts(sub-transfer agent fees) paid to Natixis Distribution are subject to a currentper-account equivalent fee limit approved by the Funds’ Board of Trustees, which is based on fees for similar services paid to the Funds’ transfer agent and other service providers. Class N shares do not bear such expenses.
For the period ended December 31, 2018, thesub-transfer agent fees (which are reflected in transfer agent fees and expenses in the Statements of Operations) for each Fund were as follows:
Fund | Sub-Transfer | |||
High Income Fund | $ | 45,682 | ||
Investment Grade Bond Fund | 883,867 | |||
As of December 31, 2018, Natixis Distribution owes the High Income Fund $3,486 for overpayments ofsub-transfer agent fees (which are reflected in the Statement of Assets and Liabilities as receivable from distributor).
As of December 31, 2018, Investment Grade Bond Fund owes Natixis Distribution $43,332 forsub-transfer agent fees (which are reflected in the Statements of Assets and Liabilities as payable to distributor).
Sub-transfer agent fees attributable to Class A, Class C, Class Y and Admin Class are allocated on apro rata basis to each class based on the relative net assets of each class to the total net assets of those classes.
e. Commissions. Commissions (including CDSCs) on Fund shares retained by Natixis Distribution during the period ended December 31, 2018 were as follows:
Fund | Commissions | |||
Investment Grade Bond Fund | $ | 6,509 | ||
f. Trustees Fees and Expenses. The Trust does not pay any compensation directly to its officers or Trustees who are directors, officers or employees of Natixis Advisors, Natixis Distribution, Natixis or their affiliates. The Chairperson of the Board of Trustees receives a retainer fee at the annual rate of $340,000. The Chairperson does not receive any meeting attendance fees for Board of Trustees meetings or committee meetings that he attends. Each Independent Trustee (other than the Chairperson) receives, in the aggregate, a retainer fee at the annual rate of $170,000. Each Independent Trustee also receives a meeting attendance fee of $10,000 for each meeting of the Board of Trustees that he or she attends in person and $5,000 for each meeting of the Board of Trustees that he or she attends telephonically. In addition, the chairperson of the Contract Review Committee and the chairperson of the Audit Committee each receive an additional retainer fee at the annual rate of $20,000. The chairperson of the Governance
77 |
Table of Contents
Notes to Financial Statements (continued)
December 31, 2018
Committee receives an additional retainer fee at the annual rate of $12,000. Each Contract Review Committee member is compensated $6,000 for each Committee meeting that he or she attends in person and $3,000 for each meeting that he or she attends telephonically. Each Audit Committee member is compensated $6,000 for each Committee meeting that he or she attends in person and $3,000 for each meeting that he or she attends telephonically. These fees are allocated among the funds in the Natixis Funds Trusts, Loomis Sayles Funds Trusts and Natixis ETF Trust based on a formula that takes into account, among other factors, the relative net assets of each fund. Trustees are reimbursed for travel expenses in connection with attendance at meetings.
Effective January 1, 2019, the Chairperson of the Board will receive a retainer fee at the annual rate of $360,000, each Independent Trustee (other than the Chairperson) will receive, in the aggregate, a retainer fee at the annual rate of $190,000, and the chairperson of the Governance Committee will receive an additional retainer fee at the annual rate of $15,000. All other Trustee fees will remain unchanged.
A deferred compensation plan (the “Plan”) is available to the Trustees on a voluntary basis. Deferred amounts remain in the Funds until distributed in accordance with the provisions of the Plan. The value of a participating Trustee’s deferral account is based on theoretical investments of deferred amounts, on the normal payment dates, in certain funds of the Natixis Funds Trusts, Loomis Sayles Funds Trusts and Natixis ETF Trust as designated by the participating Trustees. Changes in the value of participants’ deferral accounts are allocatedpro rata among the funds in the Natixis Funds Trusts, Loomis Sayles Funds Trusts and Natixis ETF Trust, and are normally reflected as Trustees’ fees and expenses in the Statements of Operations. The portions of the accrued obligations allocated to the Funds under the Plan are reflected as Deferred Trustees’ fees in the Statements of Assets and Liabilities.
For the period ended December 31, 2018, net depreciation in the value of participants’ deferral accounts has been reclassified as Miscellaneous expenses on the Statements of Operations, as follows:
Fund | Amount | |||
High Income Fund | $ | 7,511 | ||
Investment Grade Bond Fund | 26,238 | |||
Certain officers and employees of Natixis Advisors and Loomis Sayles are also officers and/or Trustees of the Trust.
g. Affiliated Ownership. As of December 31, 2018, Loomis Sayles Employees’ Profit Sharing Retirement Plan held shares of the Investment Grade Bond Fund representing 0.11% of the Fund’s net assets.
Investment activities of affiliated shareholders could have material impacts on the Fund.
| 78
Table of Contents
Notes to Financial Statements (continued)
December 31, 2018
h. Reimbursement of Transfer Agent Fees and Expenses. Natixis Advisors has given a binding contractual undertaking to the High Income Fund to reimburse any and all transfer agency expenses for the Funds’ Class N shares. This undertaking is in effect through January 31, 2019 and is not subject to recovery under the expense limitation agreement described above.
For the period ended December 31, 2018, Natixis Advisors reimbursed the Fund for transfer agency expenses as follows:
| Reimbursement of Transfer Agency Expenses | ||||
Fund | Class N | |||
High Income Fund | $ | 39 | ||
7. Class-Specific Transfer Agent Fees and Expenses. Transfer agent fees and expenses attributable to Class A, Class C, Class Y and Admin Class are allocated on apro rata basis to each class based on the relative net assets of each class to the total net assets of those classes. Transfer agent fees and expenses attributable to Class N are allocated to Class N.
For the period ended December 31, 2018, the Funds incurred the following class-specific transfer agent fees and expenses (includingsub-transfer agent fees, where applicable):
| Transfer Agent Fees and Expenses | ||||||||||||||||||||
Fund | Class A | Class C | Class N | Class Y | Admin Class | |||||||||||||||
High Income Fund | $ | 8,220 | $ | 1,904 | $ | 39 | $ | 41,006 | $ | — | ||||||||||
Investment Grade Bond Fund | 166,648 | 85,491 | 822 | 652,152 | 25,045 | |||||||||||||||
8. Line of Credit. Effective April 12, 2018, each Fund, together with certain other funds of Natixis Funds Trusts, Loomis Sayles Funds Trusts and Natixis ETF Trust, entered into a $400,000,000 committed unsecured line of credit provided by State Street Bank. Any one Fund may borrow up to $350,000,000 under the line of credit agreement (as long as all borrowings by all Funds in the aggregate do not exceed the $400,000,000 limit at any time), subject to each Fund’s investment restrictions and its contractual obligations under the line of credit. Interest is charged to the Funds based upon the terms set forth in the agreement. In addition, a commitment fee of 0.15% per annum, payable at the end of each calendar quarter, is accrued and apportioned among the participating funds based on their average daily unused portion of the line of credit. The Funds paid an arrangement fee, an upfront fee, and other fees in connection with the new line of credit agreement, which are being amortized over a period of 364 days and are reflected as miscellaneous expenses on the Statements of Operations. The unamortized balance is reflected as prepaid expenses on the Statements of Assets and Liabilities.
79 |
Table of Contents
Notes to Financial Statements (continued)
December 31, 2018
Prior to April 12, 2018, each Fund, together with certain other funds of Natixis Funds Trusts and Loomis Sayles Funds Trusts, entered into a364-day, $400,000,000 syndicated, committed, unsecured line of credit with Citibank, N.A. to be used for temporary or emergency purposes only. Any one Fund was able borrow up to the full $400,000,000 under the line of credit (as long as all borrowings by all Funds in the aggregate did not exceed the $400,000,000 limit at any time), subject to each Fund’s investment restrictions and its contractual obligations under the line of credit. Interest was charged to the Funds at a rate equal to the greater of the eurodollar or the federal funds rate plus 1.00%. In addition, a commitment fee of 0.15% per annum, payable on the last business day of each month, was accrued and apportioned among the participating funds based on their average daily unused portion of the line of credit.
For the period ended December 31, 2018, neither Fund had borrowings under this agreement.
9. Payable to Custodian Bank. The Funds’ custodian bank, State Street Bank, provides overdraft protection to the Funds in the event of a cash shortfall. Cash overdrafts bear interest at a rate per annum equal to the Federal Funds rate plus 2.00%. At December 31, 2018, the High Income Fund had a payable of $574,563 to the custodian bank for an inadvertent overdraft due to a security sale transaction not settling as expected.
10. Concentration of Risk. Each Fund’s investments in foreign securities are subject to foreign currency fluctuations, higher volatility than U.S. securities, varying degrees of regulation and limited liquidity. Greater political, economic, credit and information risks are also associated with foreign securities.
11. Concentration of Ownership. From time to time, a Fund may have a concentration of one or more accounts constituting a significant percentage of shares outstanding. Investment activities by holders of such accounts could have material impacts on the Funds. As of December 31, 2018, based on management’s evaluation of the shareholder account base, the Funds had accounts representing controlling ownership of more than 5% of the Fund’s total outstanding shares. The number of such accounts, based on accounts that represent more than 5% of an individual class of shares, and the aggregate percentage of net assets represented by such holdings were as follows:
Fund | Number of 5% | Percentage of | ||||||
High Income Fund | 1 | 7.64 | % | |||||
Investment Grade Bond Fund | 1 | 19.53 | % | |||||
Omnibus shareholder accounts for which Natixis Advisors understands that the intermediary has discretion over the underlying shareholder accounts or investment models where a shareholder account may be invested for anon-discretionary
| 80
Table of Contents
Notes to Financial Statements (continued)
December 31, 2018
customer are included in the table above. For other omnibus accounts, the Fund does not have information on the individual shareholder accounts underlying the omnibus accounts; therefore, there could be other 5% shareholders in addition to those disclosed in the table above.
12. Capital Shares. Each Fund may issue an unlimited number of shares of beneficial interest, without par value. Transactions in capital shares were as follows:
| | Period Ended December 31, 2018(a) |
| | Year Ended September 30, 2018 |
| |||||||||||
High Income Fund | Shares | Amount | Shares | Amount | ||||||||||||
| Class A |
| |||||||||||||||
Issued from the sale of shares | 318,942 | $ | 1,321,333 | 1,898,245 | $ | 8,166,854 | ||||||||||
Issued in connection with the reinvestment of distributions | 84,926 | 349,137 | 243,140 | 1,040,786 | ||||||||||||
Redeemed | (764,361 | ) | (3,151,340 | ) | (3,771,177 | ) | (16,210,208 | ) | ||||||||
|
|
|
|
|
|
|
| |||||||||
Net change | (360,493 | ) | $ | (1,480,870 | ) | (1,629,792 | ) | $ | (7,002,568 | ) | ||||||
|
|
|
|
|
|
|
| |||||||||
| Class C |
| |||||||||||||||
Issued from the sale of shares | 42,068 | $ | 171,916 | 122,450 | $ | 527,966 | ||||||||||
Issued in connection with the reinvestment of distributions | 16,483 | 68,043 | 61,116 | 262,711 | ||||||||||||
Redeemed | (186,823 | ) | (777,538 | ) | (1,279,539 | ) | (5,486,771 | ) | ||||||||
|
|
|
|
|
|
|
| |||||||||
Net change | (128,272 | ) | $ | (537,579 | ) | (1,095,973 | ) | $ | (4,696,094 | ) | ||||||
|
|
|
|
|
|
|
| |||||||||
| Class N |
| |||||||||||||||
Issued from the sale of shares | 169,687 | $ | 691,887 | 2,698,050 | $ | 11,518,120 | ||||||||||
Issued in connection with the reinvestment of distributions | 43,495 | 178,710 | 61,394 | 259,688 | ||||||||||||
Redeemed | (33,788 | ) | (139,949 | ) | (325,438 | ) | (1,383,775 | ) | ||||||||
|
|
|
|
|
|
|
| |||||||||
Net change | 179,394 | $ | 730,648 | 2,434,006 | $ | 10,394,033 | ||||||||||
|
|
|
|
|
|
|
| |||||||||
| Class Y |
| |||||||||||||||
Issued from the sale of shares | 2,504,282 | $ | 10,312,064 | 9,865,696 | $ | 42,237,402 | ||||||||||
Issued in connection with the reinvestment of distributions | 433,237 | 1,776,880 | 1,120,509 | 4,782,844 | ||||||||||||
Redeemed | (8,528,009 | ) | (34,312,719 | ) | (11,587,593 | ) | (49,564,049 | ) | ||||||||
|
|
|
|
|
|
|
| |||||||||
Net change | (5,590,490 | ) | $ | (22,223,775 | ) | (601,388 | ) | $ | (2,543,803 | ) | ||||||
|
|
|
|
|
|
|
| |||||||||
Increase (decrease) from capital share transactions | (5,899,861 | ) | $ | (23,511,576 | ) | (893,147 | ) | $ | (3,848,432 | ) | ||||||
|
|
|
|
|
|
|
| |||||||||
| (a) | For the period October 1, 2018 through December 31, 2018. |
81 |
Table of Contents
Notes to Financial Statements (continued)
December 31, 2018
12. Capital Shares (continued).
| | Year Ended September 30, 2017(b) | |||||||
High Income Fund | Shares | Amount | ||||||
| Class A | ||||||||
Issued from the sale of shares | 2,869,491 | $ | 12,272,049 | |||||
Issued in connection with the reinvestment of distributions | 306,554 | 1,311,455 | ||||||
Redeemed | (3,623,241 | ) | (15,504,179 | ) | ||||
|
|
|
| |||||
Net change | (447,196 | ) | $ | (1,920,675 | ) | |||
|
|
|
| |||||
| Class C | ||||||||
Issued from the sale of shares | 471,847 | $ | 2,010,717 | |||||
Issued in connection with the reinvestment of distributions | 88,277 | 378,228 | ||||||
Redeemed | (897,288 | ) | (3,849,291 | ) | ||||
|
|
|
| |||||
Net change | (337,164 | ) | $ | (1,460,346 | ) | |||
|
|
|
| |||||
| Class N | ||||||||
Issued from the sale of shares | 240 | $ | 1,001 | |||||
Issued in connection with the reinvestment of distributions | 10 | 41 | ||||||
Redeemed | — | — | ||||||
|
|
|
| |||||
Net change | 250 | $ | 1,042 | |||||
|
|
|
| |||||
| Class Y | ||||||||
Issued from the sale of shares | 9,715,068 | $ | 41,499,158 | |||||
Issued in connection with the reinvestment of distributions | 1,184,729 | 5,054,088 | ||||||
Redeemed | (10,799,917 | ) | (45,851,330 | ) | ||||
|
|
|
| |||||
Net change | 99,880 | $ | 701,916 | |||||
|
|
|
| |||||
Increase (decrease) from capital share transactions | (684,230 | ) | $ | (2,678,063 | ) | |||
|
|
|
| |||||
| (b) | From commencement of operations on November 30, 2016 through September 30, 2017 for Class N shares. |
| 82
Table of Contents
Notes to Financial Statements (continued)
December 31, 2018
12. Capital Shares (continued).
| | Period Ended December 31, 2018(a) |
| | Year Ended September 30, 2018 |
| |||||||||||
Investment Grade Bond Fund | Shares | Amount | Shares | Amount | ||||||||||||
| Class A |
| |||||||||||||||
Issued from the sale of shares | 6,491,737 | $ | 70,239,572 | 26,350,729 | $ | 290,166,021 | ||||||||||
Issued in connection with the reinvestment of distributions | 692,485 | 7,466,489 | 1,939,385 | 21,405,938 | ||||||||||||
Redeemed | (11,048,598 | ) | (119,531,449 | ) | (37,379,900 | ) | (411,498,034 | ) | ||||||||
|
|
|
|
|
|
|
| |||||||||
Net change | (3,864,376 | ) | $ | (41,825,388 | ) | (9,089,786 | ) | $ | (99,926,075 | ) | ||||||
|
|
|
|
|
|
|
| |||||||||
| Class C |
| |||||||||||||||
Issued from the sale of shares | 945,273 | $ | 10,091,858 | 2,011,124 | $ | 22,000,351 | ||||||||||
Issued in connection with the reinvestment of distributions | 284,418 | 3,032,080 | 1,080,461 | 11,807,321 | ||||||||||||
Redeemed | (4,883,774 | ) | (52,357,128 | ) | (26,695,866 | ) | (290,792,159 | ) | ||||||||
|
|
|
|
|
|
|
| |||||||||
Net change | (3,654,083 | ) | $ | (39,233,190 | ) | (23,604,281 | ) | $ | (256,984,487 | ) | ||||||
|
|
|
|
|
|
|
| |||||||||
| Class N |
| |||||||||||||||
Issued from the sale of shares | 7,202,004 | $ | 78,146,326 | 47,337,549 | $ | 520,862,751 | ||||||||||
Issued in connection with the reinvestment of distributions | 1,542,978 | 16,637,378 | 3,799,061 | 41,897,623 | ||||||||||||
Redeemed | (9,753,310 | ) | (105,566,599 | ) | (43,651,422 | ) | (478,691,782 | ) | ||||||||
|
|
|
|
|
|
|
| |||||||||
Net change | (1,008,328 | ) | $ | (10,782,895 | ) | 7,485,188 | $ | 84,068,592 | ||||||||
|
|
|
|
|
|
|
| |||||||||
| Class Y |
| |||||||||||||||
Issued from the sale of shares | 26,286,587 | $ | 284,802,649 | 83,609,222 | $ | 923,226,055 | ||||||||||
Issued in connection with the reinvestment of distributions | 3,150,471 | 33,984,081 | 8,916,183 | 98,436,771 | ||||||||||||
Redeemed | (32,471,159 | ) | (351,840,854 | ) | (124,671,025 | ) | (1,373,103,002 | ) | ||||||||
|
|
|
|
|
|
|
| |||||||||
Net change | (3,034,101 | ) | $ | (33,054,124 | ) | (32,145,620 | ) | $ | (351,440,176 | ) | ||||||
|
|
|
|
|
|
|
| |||||||||
| Admin Class |
| |||||||||||||||
Issued from the sale of shares | 286,732 | $ | 3,102,815 | 9,244,822 | $ | 100,929,159 | ||||||||||
Issued in connection with the reinvestment of distributions | 117,845 | 1,266,981 | 37,178 | 408,621 | ||||||||||||
Redeemed | (521,944 | ) | (5,641,958 | ) | (1,018,175 | ) | (11,215,394 | ) | ||||||||
|
|
|
|
|
|
|
| |||||||||
Net change | (117,367 | ) | $ | (1,272,162 | ) | 8,263,825 | $ | 90,122,386 | ||||||||
|
|
|
|
|
|
|
| |||||||||
Increase (decrease) from capital share transactions | (11,678,255 | ) | $ | (126,167,759 | ) | (49,090,674 | ) | $ | (534,159,760 | ) | ||||||
|
|
|
|
|
|
|
| |||||||||
| (a) | For the period October 1, 2018 through December 31, 2018. |
83 |
Table of Contents
Notes to Financial Statements (continued)
December 31, 2018
12. Capital Shares (continued).
| | Year Ended September 30, 2017 |
| ||||||
Investment Grade Bond Fund | Shares | Amount | ||||||
| Class A | ||||||||
Issued from the sale of shares | 19,528,126 | $ | 217,152,190 | |||||
Issued in connection with the reinvestment of distributions | 4,610,265 | 50,116,925 | ||||||
Redeemed | (41,811,856 | ) | (466,635,041 | ) | ||||
|
|
|
| |||||
Net change | (17,673,465 | ) | $ | (199,365,926 | ) | |||
|
|
|
| |||||
| Class C | ||||||||
Issued from the sale of shares | 3,086,119 | $ | 33,663,672 | |||||
Issued in connection with the reinvestment of distributions | 3,067,848 | 32,931,990 | ||||||
Redeemed | (31,785,356 | ) | (350,114,834 | ) | ||||
|
|
|
| |||||
Net change | (25,631,389 | ) | $ | (283,519,172 | ) | |||
|
|
|
| |||||
| Class N | ||||||||
Issued from the sale of shares | 113,062,434 | $ | 1,236,685,568 | |||||
Issued in connection with the reinvestment of distributions | 2,009,435 | 22,234,080 | ||||||
Redeemed | (12,720,056 | ) | (141,192,418 | ) | ||||
|
|
|
| |||||
Net change | 102,351,813 | $ | 1,117,727,230 | |||||
|
|
|
| |||||
| Class Y | ||||||||
Issued from the sale of shares | 96,437,874 | $ | 1,075,867,439 | |||||
Issued in connection with the reinvestment of distributions | 21,650,224 | 235,495,402 | ||||||
Redeemed | (207,134,566 | ) | (2,283,144,056 | ) | ||||
|
|
|
| |||||
Net change | (89,046,468 | ) | $ | (971,781,215 | ) | |||
|
|
|
| |||||
| Admin Class | ||||||||
Issued from the sale of shares | 658,125 | $ | 7,267,683 | |||||
Issued in connection with the reinvestment of distributions | 74,152 | 803,727 | ||||||
Redeemed | (1,522,308 | ) | (16,968,085 | ) | ||||
|
|
|
| |||||
Net change | (790,031 | ) | $ | (8,896,675 | ) | |||
|
|
|
| |||||
Increase (decrease) from capital share transactions | (30,789,540 | ) | $ | (345,835,758 | ) | |||
|
|
|
| |||||
| 84
Table of Contents
Report of Independent Registered Public Accounting Firm
To the Board of Trustees of Loomis Sayles Funds II and Shareholders of Loomis Sayles High Income Fund and Loomis Sayles Investment Grade Bond Fund
Opinions on the Financial Statements
We have audited the accompanying statements of assets and liabilities, including the portfolios of investments, of Loomis Sayles High Income Fund and Loomis Sayles Investment Grade Bond Fund (two of the funds constituting Loomis Sayles Funds II, hereafter collectively referred to as the “Funds”) as of December 31, 2018, the related statements of operations for the period October 1, 2018 through December 31, 2018 and the year ended September 30, 2018, the statements of changes in net assets for the period October 1, 2018 through December 31, 2018 and each of the two years in the period ended September 30, 2018, including the related notes, and the financial highlights for each of the periods indicated therein (collectively referred to as the “financial statements”). In our opinion, the financial statements present fairly, in all material respects, the financial position of each of the Funds as of December 31, 2018, the results of each of their operations for the period October 1, 2018 through December 31, 2018 and the year ended September 30, 2018, the changes in each of their net assets for the period October 1, 2018 through December 31, 2018 and each of the two years in the period ended September 30, 2018 and each of the financial highlights for each of the periods indicated therein in conformity with accounting principles generally accepted in the United States of America.
Basis for Opinions
These financial statements are the responsibility of the Funds’ management. Our responsibility is to express an opinion on the Funds’ financial statements based on our audits. We are a public accounting firm registered with the Public Company Accounting Oversight Board (United States) (PCAOB) and are required to be independent with respect to the Funds in accordance with the U.S. federal securities laws and the applicable rules and regulations of the Securities and Exchange Commission and the PCAOB.
We conducted our audits of these financial statements in accordance with the standards of the PCAOB. Those standards require that we plan and perform the audit to obtain reasonable assurance about whether the financial statements are free of material misstatement, whether due to error or fraud.
Our audits included performing procedures to assess the risks of material misstatement of the financial statements, whether due to error or fraud, and performing procedures that respond to those risks. Such procedures included examining, on a test basis, evidence regarding the amounts and disclosures in the financial statements. Our audits also included evaluating the accounting principles used and significant estimates made by management, as well as evaluating the overall presentation of the
85 |
Table of Contents
Report of Independent Registered Public Accounting Firm
financial statements. Our procedures included confirmation of securities owned as of December 31, 2018 by correspondence with the custodian and brokers; when replies were not received from brokers, we performed other auditing procedures. We believe that our audits provide a reasonable basis for our opinions.
/s/ PricewaterhouseCoopers LLP
Boston, Massachusetts
February 21, 2019
We have served as the auditor of one or more of the investment companies in the Natixis Investment Company Complex since at least 1995. We have not been able to determine the specific year we began serving as auditor.
| 86
Table of Contents
2018 U.S. Tax Distribution Information to Shareholders (Unaudited)
Corporate Dividends Received Deduction. For the fiscal year ended December 31, 2018, a percentage of dividends distributed by the Funds listed below qualify for the dividends received deduction for corporate shareholders. This percentage is as follows:
Fund | Qualifying | |||
High Income Fund | 10.41 | % | ||
Investment Grade Bond Fund | 0.09 | % | ||
Capital Gains Distributions. Pursuant to Internal Revenue Section 852(b), the following Funds paid distributions, which have been designated as capital gains distributions for the fiscal year ended December 31, 2018.
Fund | Amount | |||
High Income Fund | $ | 469,860 | ||
Investment Grade Bond Fund | 26,591,753 | |||
Qualified Dividend Income. For the fiscal year ended December 31, 2018, a percentage of the ordinary income dividends paid by the Fund are considered qualified dividend income eligible for reduced tax rates. These lower rates range from 0% to 20% depending on an individual’s tax bracket. If the Fund paid a distribution during calendar year 2018, complete information will be reported in conjunction with Form1099-DIV. This percentage is noted below:
Fund | Qualifying | |||
High Income Fund | 2.41 | % | ||
Investment Grade Bond Fund | 3.87 | % | ||
87 |
Table of Contents
Trustee and Officer Information
The tables below provide certain information regarding the trustees and officers of Loomis Sayles Funds II (the “Trust”). Unless otherwise indicated, the address of all persons below is 888 Boylston Street, Suite 800, Boston, MA 02199-8197. The Funds’ Statement of Additional Information includes additional information about the trustees of the Trust and is available by calling Natixis Funds at 800-225-5478.
Name and Year of Birth | Position(s) Held with the Trust, Length of Time Served and Term of Office1 | Principal Occupation(s) During Past 5 Years | Number of Portfolios in Fund Complex and Other Directorships Held During Past 5 Years | Experience, Qualifications, Attributes, Skills for Board Membership | ||||
| INDEPENDENT TRUSTEES | ||||||||
Kenneth A. Drucker (1945) | Chairperson of the Board of Trustees since January 2017 Trustee since 2008 Ex Officio member of Audit Committee, Contract Review Committee and Governance Committee | Retired | 52 None | Significant experience on the Board and on the boards of other business organizations (including at investment companies); executive experience (including as treasurer of an aerospace, automotive, and metal manufacturing corporation) | ||||
Edmond J. English (1953) | Trustee since 2013 Audit Committee Member and Governance Committee Member | Executive Chairman; formerly, Chief Executive Officer of Bob’s Discount Furniture (retail) | 52 Director, Burlington Stores, Inc. (retail) | Significant experience on the Board and significant experience on the boards of other business organizations (including retail companies and a bank); executive experience (including at a retail company) | ||||
| 88
Table of Contents
Trustee and Officer Information
Name and Year of Birth | Position(s) Held with the Trust, Length of Time Served and Term of Office1 | Principal Occupation(s) During Past 5 Years | Number of Portfolios in Fund Complex and Other Directorships Held During Past 5 Years | Experience, Qualifications, Attributes, Skills for Board Membership | ||||
INDEPENDENT TRUSTEES continued | ||||||||
Richard A. Goglia (1951) | Trustee since 2015 Audit Committee Member | Retired; formerly Vice President and Treasurer of Raytheon Company (defense) | 52 None | Experience on the Board and executive experience (including his role as vice president and treasurer of a defense company and experience at a financial services company) | ||||
Wendell J. Knox (1948) | Trustee since 2009 Contract Review Committee Member and Governance Committee Member | Director of Abt Associates Inc. (research and consulting) | 52 Director, The Hanover Insurance Group (property and casualty insurance); formerly, Director, Eastern Bank (bank) | Significant experience on the Board and on the boards of other business organizations (including at a bank and at a property and casualty insurance firm); executive experience (including roles as president and chief executive officer of a research and consulting company) | ||||
89 |
Table of Contents
Trustee and Officer Information
Name and Year of Birth | Position(s) Held with the Trust, Length of Time Served and Term of Office1 | Principal Occupation(s) During Past 5 Years | Number of Portfolios in Fund Complex and Other Directorships Held During Past 5 Years | Experience, Qualifications, Attributes, Skills for Board Membership | ||||
INDEPENDENT TRUSTEES continued | ||||||||
Martin T. Meehan (1956) | Trustee since 2012 Audit Committee Member | President, University of Massachusetts; formerly, Chancellor and faculty member, University of Massachusetts Lowell | 52 None | Significant experience on the Board and on the boards of other business organizations; experience as President of the University of Massachusetts; government experience (including as a member of the U.S. House of Representatives); academic experience | ||||
Maureen B. Mitchell (1951) | Trustee since 2017 Contract Review Committee Member | Retired; formerly President, Global Sales and Marketing, GE Asset Management, Inc. (financial services) | 52 Director, Sterling Bancorp (Bank) | Experience on the Board and on the boards of other business organizations; financial services industry and executive experience (including role as president of global sales and marketing at a financial services company) | ||||
| 90
Table of Contents
Trustee and Officer Information
Name and Year of Birth | Position(s) Held with the Trust, Length of Time Served and Term of Office1 | Principal Occupation(s) During Past 5 Years | Number of Portfolios in Fund Complex and Other Directorships Held During Past 5 Years | Experience, Qualifications, Attributes, Skills for Board Membership | ||||
INDEPENDENT TRUSTEES continued | ||||||||
James P. Palermo (1955) | Trustee since 2016 Contract Review Committee Member | Founding Partner, Breton Capital Management, LLC (private equity); Partner, STEP Partners, LLC (private equity); formerly, Chief Executive Officer of Global Client Management of The Bank of New York Mellon Corporation | 52 Director, FutureFuel Corp. (Chemicals and Biofuels) | Experience on the Board and on the boards of other business organizations; financial services industry and executive experience (including roles as chief executive officer of client management and asset servicing for a banking and financial services company) | ||||
Erik R. Sirri (1958) | Trustee since 2009 Chairperson of the Audit Committee | Professor of Finance at Babson College | 52 None | Significant experience on the Board; experience as Director of the Division of Trading and Markets at the Securities and Exchange Commission; academic experience; training as an economist | ||||
91 |
Table of Contents
Trustee and Officer Information
Name and Year of Birth | Position(s) Held with the Trust, Length of Time Served and Term of Office1 | Principal Occupation(s) During Past 5 Years | Number of Portfolios in Fund Complex and Other Directorships Held During Past 5 Years | Experience, Qualifications, Attributes, Skills for Board Membership | ||||
INDEPENDENT TRUSTEES continued | ||||||||
Peter J. Smail (1952) | Trustee since 2009 Chairperson of the Contract Review Committee and Governance Committee Member | Retired | 52 None | Significant experience on the Board; mutual fund industry and executive experience (including roles as president and chief executive officer for an investment adviser) | ||||
Cynthia L. Walker (1956) | Trustee since 2005 Chairperson of the Governance Committee and Audit Committee Member | Deputy Dean for Finance and Administration, Yale University School of Medicine | 52 None | Significant experience on the Board; executive experience in a variety of academic organizations (including roles as dean for finance and administration) | ||||
| INTERESTED TRUSTEES | ||||||||
Kevin P. Charleston3 (1965) One FinancialCenter Boston, MA 02111 | Trustee since 2015 | President, Chief Executive Officer and Chairman of the Board of Directors of Loomis, Sayles & Company, L.P.; formerly, Chief Financial Officer, Loomis, Sayles & Company, L.P. | 52 None | Experience on the Board; continuing service as President, Chief Executive Officer and Chairman of the Board of Directors of Loomis, Sayles & Company, L.P. | ||||
| 92
Table of Contents
Trustee and Officer Information
Name and Year of Birth | Position(s) Held with the Trust, Length of Time Served and Term of Office1 | Principal Occupation(s) During Past 5 Years | Number of Portfolios in Fund Complex and Other Directorships Held During Past 5 Years | Experience, Qualifications, Attributes, Skills for Board Membership | ||||
INTERESTED TRUSTEES continued | ||||||||
| David L. Giunta4 (1965) | Trustee since 2011 President of Loomis Sayles Funds II since 2008; Chief Executive Officer of Loomis Sayles Funds II since 2015 | President and Chief Executive Officer, Natixis Advisors, L.P., Natixis Distribution, L.P., Natixis Distribution Corporation and Chairman of the Board of Natixis Distribution Corporation | 52 None | Significant experience on the Board; experience as President and Chief Executive Officer, Natixis Advisors, L.P., Natixis Distribution, L.P., Natixis Distribution Corporation and Chairman of the Board of Natixis Distribution Corporation | ||||
| 1 | Each trustee serves until retirement, resignation or removal from the Board. The current retirement age is 75. The position of Chairperson of the Board is appointed for a three-year term. |
| 2 | The trustees of the Trust serve as trustees of a fund complex that includes all series of the Natixis Funds Trust I, Natixis Funds Trust II, Natixis Funds Trust IV, Gateway Trust, Loomis Sayles Funds I, Loomis Sayles Funds II and Natixis ETF Trust (collectively, the “Fund Complex”). |
| 3 | Mr. Charleston is deemed an “interested person” of the Trust because he holds the following positions with an affiliated person of the Trust: President, Chief Executive Officer and Chairman of the Board of Directors of Loomis, Sayles & Company, L.P. |
| 4 | Mr. Giunta is deemed an “interested person” of the Trust because he holds the following positions with an affiliated person of the Trust: President and Chief Executive Officer, Natixis Advisors, L.P., Natixis Distribution, L.P., Natixis Distribution Corporation and Chairman of the Board of Natixis Distribution Corporation. |
93 |
Table of Contents
Trustee and Officer Information
Name and Year of Birth | Position(s) Held with the Trust | Term of Office1 and Length of Time Served | Principal Occupation(s) During Past 5 Years2 | |||
| OFFICERS OF THE TRUST | ||||||
Daniel J. Fuss (1933) One Financial Center Boston, MA 02111 | Executive Vice President of Loomis Sayles Funds I and Loomis Sayles Funds II | Since 2003 | Vice Chairman and Director, Loomis, Sayles & Company, L.P. | |||
Russell L. Kane (1969) | Secretary, Clerk and Chief Legal Officer | Since 2016 | Executive Vice President, General Counsel, Secretary and Clerk, Natixis Distribution Corporation, Natixis Advisors, L.P. and Natixis Distribution, L.P.; formerly, Chief Compliance Officer for Mutual Funds, Senior Vice President, Deputy General Counsel, Assistant Secretary and Assistant Clerk, Natixis Distribution Corporation, Natixis Advisors, L.P. and Natixis Distribution, L.P. | |||
Michael C. Kardok (1959) | Treasurer, Principal Financial and Accounting Officer | Since 2004 | Senior Vice President, Natixis Advisors, L.P. and Natixis Distribution, L.P. | |||
Kirk D. Johnson (1981) | Chief Compliance Officer, Assistant Secretary and Anti-Money Laundering Officer | Since 2018 | Senior Vice President, Deputy General Counsel, Assistant Secretary and Assistant Clerk, Natixis Distribution Corporation, Natixis Advisors, L.P. and Natixis Distribution, L.P.; formerly, Vice President and Counsel, Natixis Investment Managers, L.P. | |||
| 1 | Each officer of the Trust serves for an indefinite term in accordance with the Trust’s current by-laws until the date his or her successor is elected and qualified, or until he or she sooner dies, retires, is removed or becomes disqualified. |
| 2 | Each person listed above, except as noted, holds the same position(s) with the Fund Complex. Previous positions during the past five years with Natixis Distribution, L.P., Natixis Advisors, L.P. or Loomis, Sayles & Company, L.P. are omitted, if not materially different from an officer’s current position with such entity. |
| 94
Table of Contents
Item 2. Code of Ethics.
The Registrant has adopted a code of ethics that applies to the Registrant’s principal executive officer, principal financial officer and persons performing similar functions. There have been no amendments or waivers of the Registrant’s code of ethics during the period.
Item 3. Audit Committee Financial Expert.
The Board of Trustees of the Registrant has established an audit committee. Mr. Edmond J. English, Mr. Richard A. Goglia, Mr. Martin T. Meehan, Mr. Erik R. Sirri and Ms. Cynthia L. Walker are members of the audit committee and have been designated as “audit committee financial experts” by the Board of Trustees. Each of these individuals is also an Independent Trustee of the Registrant.
Item 4. Principal Accountant Fees and Services.
Fees billed by the Principal Accountant for services rendered to the Registrant.
The table below sets forth fees billed by the principal accountant, PricewaterhouseCoopers LLP, for the past two fiscal years for professional services rendered in connection with a) the audit of the Registrant’s annual financial statements and services provided in connection with regulatory filings; b) audit-related services (including services that are reasonably related to the performance of the audit of the Registrant’s financial statements and but not reported under “Audit Fees”); c) tax compliance, tax advice and tax planning and d) all other fees billed for professional services rendered by the principal accountant to the Registrant, other than the services reported as a part of (a) through (c) of this Item.
| Audit fees | Audit-related fees | Tax fees1 | All other fees | |||||||||||||
| 10/1/18-12/31/18 | 10/1/18- 12/31/18 | 10/1/18-12/31/18 | 10/1/18-12/31/18 | |||||||||||||
Loomis Sayles High Income Fund and Loomis Sayles Investment Grade Bond Fund | $ | 77,526 | $ | 0 | $ | 8,104 | $ | 0 | ||||||||
1.Tax fees consist of:
2018 – Review of Registrant’s tax returns and tax consulting services.
Aggregate fees billed to the Registrant fornon-audit services during 2018 were $8,104, respectively.
Fees billed by the Principal Accountant for services rendered to the Adviser and Control Affiliates.
The following table sets forth the fees billed by the Registrant’s principal accountant fornon-audit services rendered to Loomis, Sayles & Company, L.P. (“Loomis Sayles”) and entities controlling, controlled by or under common control with Loomis Sayles. Registrant (“Control Affiliates”) that provide ongoing services to the Registrant, for engagements that related directly to the operations and financial reporting of the Registrant for the last two fiscal years.
| Audit-related fees | Tax fees | All other fees | ||||||||||
| 10/1/18-12/31/18 | 10/1/18-12/31/18 | 10/1/18-12/31/18 | ||||||||||
Control Affiliates | $ | 0 | $ | 0 | $ | 0 | ||||||
The following table sets forth the aggregate fees billed by the Registrant’s principal accountant fornon-audit services rendered to Loomis Sayles. and Control Affiliates that provide ongoing services to the Registrant, for the last two fiscal years, including the fees disclosed in the table above.
| Aggregate Non-Audit Fees | ||||
| 10/1/18-12/31/18 | ||||
Control Affiliates | $ | 51,815 | ||
None of the services described above were approved pursuant to (c)(7)(i)(C) of RegulationS-X.
Table of Contents
Audit Committee Pre Approval Policies.
Annually, the Registrant’s Audit Committee reviews the audit, audit-related, tax and othernon-audit services together with the projected fees, for services proposed to be rendered to the Trust and/or other entities for whichpre-approval is required during the upcoming year. Any subsequent revisions to alreadypre-approved services or fees (including fee increases) and requests forpre-approval of new services would be presented for consideration quarterly as needed.
If, in the opinion of management, a proposed engagement by the Registrant’s independent accountants needs to commence before the next regularly scheduled Audit Committee meeting, any member of the Audit Committee who is an independent Board member is authorized topre-approve the engagement, but only for engagements to provide audit, audit related and tax services. This approval is subject to review of the full Audit Committee at its next quarterly meeting. All other engagements require the approval of all the members of the Audit Committee.
Item 5. Audit Committee of Listed Registrants.
Not applicable.
Item 6. Schedule of Investments.
Included as part of the Report to Shareholders filed as Item 1 herewith.
Item 7. Disclosure of Proxy Voting Policies and Procedures forClosed-End Management Investment Companies.
Not applicable.
Item 8. Portfolio Managers ofClosed-End Management Investment Companies
Not applicable.
Item 9. Purchases of Equity Securities byClosed-End Management Investment Companies and Affiliated Purchasers.
Not applicable.
Item 10. Submission of Matters to a Vote of Securities Holders.
There were no material changes to the procedures by which shareholders may recommend nominees to the Registrant’s Board of Trustees.
Item 11. Controls and Procedures.
The Registrant’s principal executive officer and principal financial officer have concluded that the Registrant’s disclosure controls and procedures are sufficient to ensure that information required to be disclosed by the Registrant in this FormN-CSR was recorded, processed, summarized and reported within the time periods specified in the Securities and Exchange Commission’s rules and forms, based upon such officers’ evaluation of these controls and procedures as of a date within 90 days of the filing date of the report.
There were no changes in the Registrant’s internal control over financial reporting that occurred during the Registrant’s last fiscal quarter of the period covered by the report that has materially affected, or is reasonably likely to materially affect, the Registrant’s internal control over financial reporting.
Table of Contents
Item 12. Disclosure of Securities Lending Activities forClosed-End Management Investment Companies.
Not applicable.
Item 13. Exhibits.
| (a) (1) | Code of Ethics required by Item 2 hereof, filed herewith as Exhibit (a)(1). | |
| (a) (2) | Certifications of Principal Executive Officer and Principal Financial Officer pursuant to Rule 30a-2(a) under the Investment Company Act of 1940 (17 CFR270.30a-2(a)), filed herewith as Exhibits (a)(2)(1) and (a)(2)(2), respectively. | |
| (a) (3) | Not applicable. | |
| (b) | Certification of Principal Executive Officer and Principal Financial Officer pursuant to Section 906 of Sarbanes-Oxley Act of 2002 are filed herewith as Exhibit (b). | |
Table of Contents
SIGNATURES
Pursuant to the requirements of the Securities Exchange Act of 1934 and the Investment Company Act of 1940, the Registrant has duly caused this report to be signed on its behalf by the undersigned, thereunto duly authorized.
| Loomis Sayles Funds II | ||
| By: | /s/ David L. Giunta | |
| Name: | David L. Giunta |
| Title: | President and Chief Executive Officer |
| Date: | February 21, 2019 |
Pursuant to the requirements of the Securities Exchange Act of 1934 and the Investment Company Act of 1940, this report has been signed by the following persons on behalf of the Registrant and in the capacities and on the dates indicated.
| By: | /s/ David L. Giunta |
| Name: | David L. Giunta |
| Title: | President and Chief Executive Officer |
| Date: | February 21, 2019 |
| By: | /s/ Michael C. Kardok |
| Name: | Michael C. Kardok |
| Title: | Treasurer |
| Date: | February 21, 2019 |