Table of Contents
UNITED STATES
SECURITIES AND EXCHANGE COMMISSION
Washington, D.C. 20549
FORMN-CSR
CERTIFIED SHAREHOLDER REPORT OF REGISTERED
MANAGEMENT INVESTMENT COMPANIES
Investment Company Act file number:811-06241
Loomis Sayles Funds II
(Exact name of Registrant as specified in charter)
| 888 Boylston Street, Suite 800 Boston, Massachusetts 02199-8197 |
| (Address of principal executive offices) (Zip code) |
Russell L. Kane, Esq.
Natixis Distribution, L.P.
888 Boylston Street, Suite 800
Boston, Massachusetts 02199-8197
(Name and address of agent for service)
Registrant’s telephone number, including area code: (617)449-2822
Date of fiscal year end: September 30
Date of reporting period: September 30, 2019
Table of Contents
Item 1. Reports to Stockholders.
The Registrant’s annual report transmitted to shareholders pursuant to Rule30e-1 under the Investment Company Act of 1940 is as follows:
Table of Contents

Loomis Sayles Small Cap Growth Fund
Loomis Sayles Small Cap Value Fund
Loomis Sayles Small/Mid Cap Growth Fund
Annual Report
September 30, 2019
| TABLE OF CONTENTS | ||||
| Portfolio Review | 1 | |||
| Portfolio of Investments | 22 | |||
| Financial Statements | 40 | |||
| Notes to Financial Statements | 52 | |||
IMPORTANT NOTICE TO SHAREHOLDERS
Beginning on January 1, 2021, as permitted by regulations adopted by the Securities and Exchange Commission, paper copies of shareholder reports like this one will no longer be sent by mail, unless you specifically request paper copies of the reports from the Fund or from your financial intermediary, such as a broker-dealer or bank. Instead, the reports will be made available on the Funds’ website, and you will be notified by mail each time a report is posted and provided with a website link to access the report. If you wish to continue receiving paper copies of your shareholder reports after January 1, 2021, you can inform the Fund at any time by calling1-800-633-3330. If you hold your account with a financial intermediary and you wish to continue receiving paper copies after January 1, 2021, you should call your financial intermediary directly. Paper copies are provided free of charge, and your election to receive reports in paper will apply to all funds held with the Natixis Funds complex. If you have already elected to receive shareholder reports electronically, you will not be affected by this change and you need not take any action. You currently may elect to receive shareholder reports and other communications from the Fund or your financial intermediary electronically atwww.icsdelivery.com/loomissayles.
Table of Contents
LOOMIS SAYLES SMALL CAP GROWTH FUND
| Managers | Symbols | |||
| Mark F. Burns, CFA® | Institutional Class | LSSIX | ||
| John J. Slavik, CFA® | Retail Class | LCGRX | ||
| Class N | LSSNX |
Investment Objective
The Fund’s investment objective is long-term capital growth from investments in common stocks or other equity securities.
Market Conditions
The12-month period ending September 30, 2019 was challenging for domestic small cap equities. The worst market conditions came in the fourth quarter of 2018, as stocks sold off dramatically. On a market cap basis, large cap stocks outperformed, as measured by the Russell indices.
Small cap value managers generally fared better than their growth peers, as the Russell 2000® Growth Index was down close to 10% during the12-month period, compared to the Russell 2000® Value Index’s 8.24% decline. Most sectors in the benchmark, the Russell 2000® Growth Index, posted negative returns, with energy being a particularly noteworthy underperformer. The utility sector, however, was an outlier to the upside, posting returns close to 27%.
Performance Results
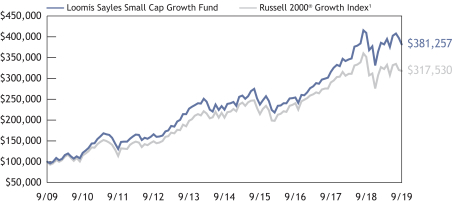
For the 12 months ended September 30, 2019, Institutional Class shares of the Loomis Sayles Small Cap Growth Fund returned-6.88% at net asset value. The Fund held up better than its benchmark, the Russell 2000® Growth Index, which returned-9.63%.
Explanation of Fund Performance
Among contributors to overall return, stock selection in the financials and communication services sectors, along with an overweight position in the information technology sector, drove the Fund’s outperformance. By contrast, underweight positioning in the real estate and utilities sectors, which outperformed the benchmark, and an overweight position to the energy sector, which underperformed the benchmark, hurt relative performance.
Among individual stocks, the Fund’s top contributors to performance were insurance company Kinsale Capital Group Inc., Goosehead Insurance Inc. and medical device producer Insulet Corp. Kinsale Capital was the Fund’s top performing stock. Kinsale is the only publicly traded property and casualty insurance company focused on the excess and surplus market, and results were strong during the year due to premium growth as the competitive environment became more favorable. Goosehead Insurance reported strong results driven by growth in its franchise and corporate business segments, while better than expected commissions helped to boost results. Insulet reported strong results during the
1 |
Table of Contents
year, with healthy international sales after working through inventory issues in the previous quarter. Margins were strong, and US new patient starts were at anall-time high. Insulet also began distributing into a new channel (pharmacy) which expanded its market reach and ease of access for patients.
Conversely, optical retailer National Vision Holdings Inc., cloud-based healthcare management platform provider HealthEquity Inc. and casino gaming products specialist PlayAGS Inc. were the largest detractors to the Fund’s performance. National Vision declined during the year amid concerns that comparable sales would fail to accelerate, attracting a short-seller research report that weighed on the stock. HealthEquity suffered from concerns around slowing growth and abating catalysts. Despite reporting solid results, expectations were high and investors were disappointed. Concern also grew about the impact of lower interest rates on HealthEquity’s custody business. Finally, PlayAGS reported results that fell short of expectations. The shortfall was due to a variety of issues, including regional product weakness, weather and higher than anticipated expenses.
Outlook
As we look forward, we continue to be focused on the underlying business trends of our existing holdings and potential new additions to ensure revenue and earnings growth trends can remain intact. This may prove challenging if earnings estimates continue to see downward pressure.
Markets may be volatile as investors search for clues about the health of the global economy. Central banks appear to be willing to support the global economy, which may reduce some near-term risks. US trade policy remains a source of uncertainty for corporate decision makers and investors. If theUS-China trade war is resolved, there could be a rebound in the broader global economy towards the end of the year. Business confidence indicators in the US have shown some signs of weakness, and the inversion of the yield curve further supports the market’s position at the later stages of the cycle. Volatility remains subdued, but macroeconomic and geopolitical events could cause it to return.
While the outlook remains uncertain, we will not attempt to alter our process. As always, we look to deliver to our clients a compelling level of positive risk-adjusted returns that compound over time.
| 2
Table of Contents
LOOMIS SAYLES SMALL CAP GROWTH FUND
Hypothetical Growth of $100,000 Investment in Institutional Class Shares
September 30, 2009 through September 30, 20192
Top Ten Holdings as of September 30, 2019
| Security name | % of assets | |||||
| 1 | Kinsale Capital Group, Inc. | 1.82 | % | |||
| 2 | POOL CORP. | 1.75 | ||||
| 3 | WNS Holdings Ltd., ADR | 1.74 | ||||
| 4 | Albany International Corp., Class A | 1.72 | ||||
| 5 | InterXion Holding NV | 1.68 | ||||
| 6 | Mercury Systems, Inc. | 1.64 | ||||
| 7 | Trex Co., Inc. | 1.63 | ||||
| 8 | Goosehead Insurance, Inc., Series A | 1.57 | ||||
| 9 | SiteOne Landscape Supply, Inc. | 1.55 | ||||
| 10 | RBC Bearings, Inc. | 1.53 | ||||
The portfolio is actively managed and holdings are subject to change. There is no guarantee the Fund continues to invest in the securities referenced. The holdings listed exclude any temporary cash investments.
3 |
Table of Contents
Average Annual Total Returns — September30, 20192
| Expense Ratios3 | ||||||||||||||||||||||||
| 1 year | 5 years | 10 years | Life of Class N | Gross | Net | |||||||||||||||||||
| Institutional Class (Inception12/31/96) | -6.88 | % | 11.17 | % | 14.32 | % | — | % | 0.94 | % | 0.94 | % | ||||||||||||
| Retail Class (Inception12/31/96) | -7.11 | 10.90 | 14.03 | — | 1.19 | 1.19 | ||||||||||||||||||
| Class N (Inception2/1/13) | -6.76 | 11.31 | — | 12.56 | 0.82 | 0.82 | ||||||||||||||||||
| Comparative Performance | ||||||||||||||||||||||||
| Russell2000® Growth Index1 | -9.63 | 9.08 | 12.25 | 10.75 | ||||||||||||||||||||
Performance data shown represents past performance and is no guarantee of, and not necessarily indicative of, future results. Total return and value will vary, and you may have a gain or loss when shares are sold. Current performance may be lower or higher than quoted. For most recent month-end performance, visit loomissayles.com. Performance for other share classes will be greater or less than shown based on differences in fees and sales charges. You may not invest directly in an index. Performance for periods less than one year is cumulative, not annualized. Returns reflect changes in share price and reinvestment of dividends and capital gains, if any. The table(s) do not reflect taxes shareholders might owe on any fund distributions or when they redeem their shares.
| 1 | Russell2000® Growth Index is an unmanaged index that measures the performance of the small-cap growth segment of the U.S. equity universe. It includes those Russell 2000® companies with higher price-to-book ratios and higher forecasted growth values. |
| 2 | Fund performance has been increased by fee waivers and/or expense reimbursements, if any, without which performance would have been lower. |
| 3 | Expense ratios are as shown in the Fund’s prospectus in effect as of the date of this report. The expense ratios for the current reporting period can be found in the Financial Highlights section of this report under Ratios to Average Net Assets. Net expenses reflect contractual expense limitations set to expire on 01/31/20. When a Fund’s expenses are below the limitation, gross and net expense ratios will be the same. See Note 5 of the Notes to Financial Statements for more information about the Fund’s expense limitations. |
| 4
Table of Contents
LOOMIS SAYLES SMALL CAP VALUE FUND
| Managers | Symbols | |||
| Joseph R. Gatz, CFA® | Institutional Class | LSSCX | ||
| Jeffrey Schwartz, CFA® | Retail Class | LSCRX | ||
| Admin Class | LSVAX | |||
| Class N | LSCNX |
Investment Objective
The Fund’s investment objective is long-term capital growth from investments in common stocks or other equity securities.
Market Conditions
Stocks tumbled during the fourth quarter of 2018 over concerns about US Federal Reserve (the Fed) policy tightening, trade wars, and weaker global growth which contributed to a negative turn in investor sentiment. The equity market then staged a remarkable rally during the first nine weeks of 2019 before settling into a trading range for the balance of the12-month period. Large cap stocks recorded a modest gain for the period, while small cap stocks finished modestly lower.
Lingering investor concerns over the Fed having “overtightened” in 2018, evidence of a softening global economy, and heightened activity related to international trade and tariffs led to increased market volatility throughout the year. Top performers included more defensive investments, including larger capitalization stocks, higher visibility business models, and companies with the healthiest balance sheets.
Interest rates fell fairly dramatically across the maturity spectrum as the result of softer economic data and the Fed moving to an accommodative stance, lowering interest rates twice during the third quarter of 2019.
Small cap growth stocks and value stocks swapped leadership throughout the period with small cap value returns ending just ahead of growth, helped by a stunning value rally in the month of September.
Performance Results
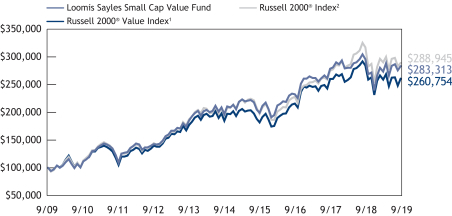
For the 12 months ended September 30, 2019, Institutional Class shares of the Loomis Sayles Small Cap Value Fund returned-4.11% at net asset value. The Fund held up better than its benchmark, the Russell 2000® Value Index, which returned-8.24%.
Explanation of Fund Performance
The Fund started the fiscal year period positioned fairly conservatively, favoring the upper portion of the market capitalization range and emphasizing companies with highly durable business models. The Fund maintained a fairly significant underweight to the energy sector, which was by far the worst performing area of the small cap market. An overweight to information technology also added to relative performance.
5 |
Table of Contents
Stock selection was favorable across most sectors of the Fund, but especially so in the consumer discretionary and health care sectors. Among individual stocks, Mellanox Technologies, Ltd., Aerojet Rocketdyne Holdings, Inc. and Euronet Worldwide, Inc. had the largest positive contributions to performance for the period.
Mellanox Technologies is a leading provider of networking technologies used for high performance and cloud computing. The company has benefited from the explosion of data and proliferation of data centers driving demand for faster networks and interconnects. During the first quarter of 2019, Mellanox agreed to be acquired, providing an additional boost to their share price.
Aerojet Rocketdyne is the leading independent provider of propulsion systems to space, missile defense, and tactical missile customers. It is benefiting from the overall growth of investments in space as well as an increasingly complex geopolitical environment. Profit margins have improved as the company has consolidated its manufacturing footprint.
Euronet facilitates electronic financial transactions on a global basis and manages ATM networks. The stock outperformed as prior regulatory concerns in its electronic funds transfer segment abated and high earnings visibility companies were in favor with investors.
On the negative side, the Fund’s underweight in the “bond proxy” sectors such as real estate and utilities detracted from relative performance, as interest rates declined fairly substantially during the period. Stock selection was also weak within the information technology and financials sectors. During the12-month period, Conduent, Inc., Avanos Medical, Inc. and Apergy Corporation detracted the most from performance.
Conduent is a leading service company specializing in transaction-intensive services including health savings account administration and toll processing. The company was spun off from Xerox Corporation in 2016 and has made progress reducing its cost structure. However, it has been burdened by legacy technology systems issues and has been unable to add new business as quickly as originally anticipated.
Avanos was spun off from Kimberly-Clark in 2015 and has now transformed itself into a pure-play medical device company. Industry-wide shortages of two pain medications manufactured by Pfizer that are used in the company’sOn-Q pain pumps have temporarily constrained top line growth, negatively affecting investor enthusiasm for the stock.
Apergy provides equipment and services in the drilling and production phases of oil and gas wells. Energy stocks were the worst performing sector over the trailing 12 months, and oil services stocks were the weakest segment within energy as rig counts have fallen and drilling companies have cut back on capital expenditures to maintain current wells.
| 6
Table of Contents
LOOMIS SAYLES SMALL CAP VALUE FUND
Outlook
We remain committed to identify inefficiencies in the small cap market that result in stock prices and valuations that do not accurately reflect our assessment of the underlying value of the corporate enterprise. We apply this approach consistently over time, regardless of the current market environment.
While many forms of inefficiency may exist in the market, we focus on companies that are misunderstood, underfollowed or in the midst of a “special situation” where we believe we can use our strengths and consistent process. We require fundamentally sound business models, capable management teams and financial stability. Key to our process are distinct, company-specific catalysts on the horizon to sustain, enhance, or highlight the fundamental outlook. These principles are applied consistently over time, regardless of the current market environment. With a margin of safety and a proper time horizon, our goal is to achieve an attractive return for our investors, while managing to an appropriate level of risk.
7 |
Table of Contents
Hypothetical Growth of $100,000 Investment in Institutional Class Shares
September 30, 2009 through September 30, 20193
Top Ten Holdings as of September 30, 2019
| Security name | % of assets | |||||
| 1 | ALLETE, Inc. | 1.54 | % | |||
| 2 | Viad Corp. | 1.42 | ||||
| 3 | Churchill Downs, Inc. | 1.31 | ||||
| 4 | NextEra Energy Partners LP | 1.23 | ||||
| 5 | Nomad Foods Ltd. | 1.22 | ||||
| 6 | Littelfuse, Inc. | 1.19 | ||||
| 7 | Vistra Energy Corp. | 1.17 | ||||
| 8 | Armstrong World Industries, Inc. | 1.15 | ||||
| 9 | GCI Liberty, Inc., Class A | 1.15 | ||||
| 10 | Reinsurance Group of America, Inc. | 1.14 | ||||
The portfolio is actively managed and holdings are subject to change. There is no guarantee the Fund continues to invest in the securities referenced. The holdings listed exclude any temporary cash investments.
See notes to chart on page 9.
| 8
Table of Contents
LOOMIS SAYLES SMALL CAP VALUE FUND
Average Annual Total Returns — September30, 20193
Expense Ratios4 | ||||||||||||||||||||||||
| 1 year | 5 years | 10 years | Life of Class N | Gross | Net | |||||||||||||||||||
| Institutional Class (Inception5/13/91) | -4.11 | % | 7.57 | % | 10.97 | % | — | % | 0.95 | % | 0.93 | % | ||||||||||||
| Retail Class (Inception12/31/96) | -4.33 | 7.30 | 10.70 | — | 1.20 | 1.18 | ||||||||||||||||||
| Admin Class (Inception1/2/98) | -4.60 | 7.04 | 10.43 | — | 1.45 | 1.43 | ||||||||||||||||||
| Class N (Inception2/1/13) | -4.07 | 7.64 | — | 9.15 | 0.86 | 0.86 | ||||||||||||||||||
| Comparative Performance | ||||||||||||||||||||||||
| Russell2000® Value Index1 | -8.24 | 7.17 | 10.06 | 8.23 | ||||||||||||||||||||
| Russell2000® Index2 | -8.89 | 8.19 | 11.19 | 9.53 | ||||||||||||||||||||
Performance data shown represents past performance and is no guarantee of, and not necessarily indicative of, future results. Total return and value will vary, and you may have a gain or loss when shares are sold. Current performance may be lower or higher than quoted. For most recent month-end performance, visit loomissayles.com. Performance for other share classes will be greater or less than shown based on differences in fees and sales charges. You may not invest directly in an index. Performance for periods less than one year is cumulative, not annualized. Returns reflect changes in share price and reinvestment of dividends and capital gains, if any. The table(s) do not reflect taxes shareholders might owe on any fund distributions or when they redeem their shares.
| 1 | Russell2000® Value Index is an unmanaged index that measures the performance of the small-cap value segment of the U.S. equity universe. It includes those Russell 2000® companies with lower price-to-book ratios and lower forecasted growth values. |
| 2 | Russell2000® Index is an unmanaged index that measures the performance of the small-cap segment of the U.S. equity universe. |
| 3 | Fund performance has been increased by fee waivers and/or expense reimbursements, if any, without which performance would have been lower. |
| 4 | Expense ratios are as shown in the Fund’s prospectus in effect as of the date of this report. The expense ratios for the current reporting period can be found in the Financial Highlights section of this report under Ratios to Average Net Assets. Net expenses reflect contractual expense limitations set to expire on 01/31/20. When a Fund’s expenses are below the limitation, gross and net expense ratios will be the same. See Note 5 of the Notes to Financial Statements for more information about the Fund’s expense limitations. |
9 |
Table of Contents
LOOMIS SAYLES SMALL/MID CAP GROWTH FUND
| Managers | Symbols | |||
| Mark F. Burns, CFA® | Institutional Class | LSMIX | ||
| John J. Slavik, CFA® |
Investment Objective
The Fund’s investment objective is long-term capital growth from investments in common stocks or other equity securities.
Market Conditions
The12-month period ending September 30, 2019 was challenging for domestic small cap equities. Mid-cap and large cap equities posted positive returns over the year. After a dramatic selloff in the fourth quarter of 2018, most domestic equity indices bounced back, but the Russell 2500TM Growth Index (the Index) still finished lower for the period. On a market cap basis, large cap stocks outperformed, as measured by the Russell indices.
The Russell benchmarks showed minimal performance differential between growth and value managers in the small/mid-cap market. Most sectors in the growth benchmark posted negative returns, with energy being a particularly noteworthy underperformer within the Index, losing approximately 48%. The utility sector, however, was an outlier to the upside, posting returns close to 27%.
Performance Results
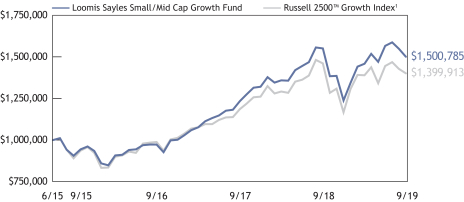
For the 12 months ended September 30, 2019, Institutional Class shares of the Loomis Sayles Small/Mid Cap Growth Fund returned-3.27% at net asset value. The Fund held up better than its benchmark, the Russell 2500TM Growth Index, which returned-4.11%.
Explanation of Fund Performance
The Fund’s relative performance was driven by stock selection, with particularly strong contributions from the health care, industrials and financials sectors. Stock selection in the information technology sector detracted from relative performance.
Among individual stocks, the Fund’s top contributors to performance were medical device producer Insulet Corp., electronic fixed income trading platform provider MarketAxess Holdings Inc. and aftermarket aircraft parts supplier Heico Corp. Insulet reported strong results during the year, with healthy international sales after working through inventory issues in the previous quarter. Margins were also strong, and US new patient starts were at anall-time high. The company began distributing into a new channel (pharmacy) which expanded its market reach and ease of access for patients. MarketAxess reported solid results throughout the year, citing improving market conditions for credit trading, and volume trended ahead of prior time periods. Heico benefited from robust demand and a strong pipeline of M&A targets. The market has been favorable for its flight support business, givenair-traffic increases and fleet expansion. Rising US defense spending has also benefited its electronic technologies business.
| 10
Table of Contents
LOOMIS SAYLES SMALL/MID CAP GROWTH FUND
Conversely, transportation and logistics services company XPO Logistics, cloud-based healthcare management platform provider HealthEquity Inc. and modular space rental solutions specialist WillScot Corp. were the largest detractors to performance for the12-month time period. The bulk of the impact from these holdings was concentrated in the market selloff of the fourth quarter of 2018. XPO Logistics declined in response to a report from a short-selling investment firm. The logistics company disputed the report’s merit, but given heavy selling pressure across all equities, the stock declined significantly. HealthEquity suffered from concerns around slowing growth and abating catalysts. Despite reporting solid results, expectations were high and investors were disappointed. Concern also grew about the impact of lower interest rates on HealthEquity’s custody business. Finally, WillScot issued stock to warrant holders during poor market conditions, which likely created selling pressure on the stock.
Outlook
As we look forward, we continue to be focused on the underlying business trends of our existing holdings and potential new additions to ensure revenue and earnings growth trends can remain intact. This may prove challenging if earnings estimates continue to see downward pressure.
Markets may be volatile as investors search for clues about the health of the global economy. Central banks appear to be willing to support the global economy, which may reduce some near-term risks. US trade policy remains a source of uncertainty for corporate decision makers and investors. If theUS-China trade war is resolved, there could be a rebound in the broader global economy towards the end of the year. Business confidence indicators in the US have shown some signs of weakness, and the inversion of the yield curve further supports the market’s position at the later stages of the cycle. Volatility remains subdued, but macroeconomic and geopolitical events could cause it to return.
While the outlook remains uncertain, we will not attempt to alter our process. As always, we look to deliver to our clients a compelling level of positive risk-adjusted returns that compound over time.
11 |
Table of Contents
Hypothetical Growth of $1,000,000 Investment in Institutional Class Shares
June 30, 2015 (inception) through September 30, 20192
Top Ten Holdings as of September 30, 2019
| Security name | % of assets | |||||
| 1 | Insulet Corp. | 2.04 | % | |||
| 2 | Live Nation Entertainment, Inc. | 1.75 | ||||
| 3 | EPAM Systems, Inc. | 1.75 | ||||
| 4 | Bright Horizons Family Solutions, Inc. | 1.64 | ||||
| 5 | Guidewire Software, Inc. | 1.63 | ||||
| 6 | Generac Holdings, Inc. | 1.59 | ||||
| 7 | Hexcel Corp. | 1.51 | ||||
| 8 | HEICO Corp. | 1.49 | ||||
| 9 | Booz Allen Hamilton Holding Corp. | 1.47 | ||||
| 10 | ICON PLC | 1.46 | ||||
The portfolio is actively managed and holdings are subject to change. There is no guarantee the Fund continues to invest in the securities referenced. The holdings listed exclude any temporary cash investments.
See notes to chart on page 13.
| 12
Table of Contents
LOOMIS SAYLES SMALL/MID CAP GROWTH FUND
Average Annual Total Returns — September30, 20192
| Expense Ratios3 | ||||||||||||||||
| 1 year | Life of Fund | Gross | Net | |||||||||||||
| Institutional Class (Inception6/30/15) | -3.27 | % | 10.02 | % | 1.42 | % | 0.85 | % | ||||||||
| Comparative Performance | ||||||||||||||||
| Russell2500TM Growth Index1 | -4.11 | 8.23 | ||||||||||||||
Performance data shown represents past performance and is no guarantee of, and not necessarily indicative of, future results. Total return and value will vary, and you may have a gain or loss when shares are sold. Current performance may be lower or higher than quoted. For most recent month-end performance, visit loomissayles.com.Performance for other share classes will be greater or less than shown based on differences in fees and sales charges. You may not invest directly in an index. Performance for periods less than one year is cumulative, not annualized. Returns reflect changes in share price and reinvestment of dividends and capital gains, if any. The table(s) do not reflect taxes shareholders might owe on any fund distributions or when they redeem their shares.
| 1 | TheRussell2500TM Growth Index measures the performance of the small-to-mid-cap growth segment of the US equity universe. It includes those Russell 2500TM Index companies with higher price-to-book ratios and higher forecasted growth values. The Russell 2500TM Growth Index is constructed to provide a comprehensive and unbiased barometer of the small-to-mid-cap growth market. The Index is completely reconstituted annually to ensure larger stocks do not distort the performance and characteristics of the true small-to-mid-cap opportunity set and that the represented companies continue to reflect growth characteristics. Indices are unmanaged. |
| 2 | Fund performance has been increased by fee waivers and/or expense reimbursements, if any, without which performance would have been lower. |
| 3 | Expense ratios are as shown in the Fund’s prospectus in effect as of the date of this report. The expense ratios for the current reporting period can be found in the Financial Highlights section of this report under Ratios to Average Net Assets. Net expenses reflect contractual expense limitations set to expire on 01/31/20. When a Fund’s expenses are below the limitation, gross and net expense ratios will be the same. See Note 5 of the Notes to Financial Statements for more information about the Fund’s expense limitations. |
13 |
Table of Contents
ADDITIONAL INFORMATION
The views expressed in this report reflect those of the portfolio managers as of the dates indicated. The managers’ views are subject to change at any time without notice based on changes in market or other conditions. References to specific securities or industries should not be regarded as investment advice. Because the Funds are actively managed, there is no assurance that they will continue to invest in the securities or industries mentioned.
All investing involves risk, including the risk of loss. There is no assurance that any investment will meet its performance objectives or that losses will be avoided.
Additional Index Information
This document may contain references to third party copyrights, indexes, and trademarks, each of which is the property of its respective owner. Such owner is not affiliated with Natixis Investment Managers or any of its related or affiliated companies (collectively “Natixis Affiliates”) and does not sponsor, endorse or participate in the provision of any Natixis Affiliates services, funds or other financial products.
The index information contained herein is derived from third parties and is provided on an “as is” basis. The user of this information assumes the entire risk of use of this information. Each of the third party entities involved in compiling, computing or creating index information disclaims all warranties (including, without limitation, any warranties of originality, accuracy, completeness, timeliness, non-infringement, merchantability and fitness for a particular purpose) with respect to such information.
Proxy Voting Information
A description of the Funds’ proxy voting policies and procedures is available without charge upon request, by calling Loomis Sayles at 800-633-3330; on the Funds’ website, at www.loomissayles.com, and on the Securities and Exchange Commission’s (“SEC”) website at www.sec.gov. Information about how the Funds voted proxies relating to portfolio securities during the most recent 12-month period ended June 30 is available on the Funds’ website and the SEC’s website.
Quarterly Portfolio Schedules
The Funds file a complete schedule of portfolio holdings with the SEC for the first and third quarters of each fiscal year on Form N-PORT. The Funds’ Forms N-PORT are available on the SEC’s website at www.sec.gov.
CFA® and Chartered Financial Analyst® are registered trademarks owned by the CFA Institute.
UNDERSTANDING YOUR FUND’S EXPENSES
As a mutual fund shareholder you incur two types of costs: (1)transaction costs and (2) ongoing costs, including management fees, distribution and/or service fees (12b-1 fees), and other fund expenses. Certain exemptions may apply. These costs are described in more detail in the Funds’ prospectus. The following examples are intended to help you
| 14
Table of Contents
understand the ongoing costs of investing in the Funds and help you compare these with the ongoing costs of investing in other mutual funds.
The first line in the table of each Fund shows theactual amount of Fund expenses you would have paid on a $1,000 investment in the Fund from April 1, 2019 through September 30, 2019. To estimate the expenses you paid over the period, simply divide your account value by $1,000 (for example $8,600 account value divided by $1,000 = 8.6) and multiply the result by the number in the Expenses Paid During Period column as shown below for your class.
The second line in the table of each Fund provides information about hypothetical account values and hypothetical expenses based on the Fund’s actual expense ratios and an assumed rate of return of 5% per year before expenses, which is not the Fund’s actual return. The hypothetical account values and expenses may not be used to estimate the actual ending account balance or expenses you paid on your investment for the period. You may use this information to compare the ongoing costs of investing in the Funds to other funds. To do so, compare this 5% hypothetical example with the 5% hypothetical examples that appear in the shareholder reports of other funds.
Please note that the expenses shown reflect ongoing costs only, and do not include any transaction costs. Therefore, the second line in the table is useful in comparing ongoing costs only, and will not help you determine the relative costs of owning different funds. If transaction costs were included, total costs would be higher.
Loomis Sayles Small Cap Growth Fund
Institutional Class | Beginning Account Value 4/1/2019 | Ending Account Value 9/30/2019 | Expenses Paid During Period* 4/1/2019 – 9/30/2019 | |||||||||
Actual | $1,000.00 | $1,000.00 | $4.76 | |||||||||
Hypothetical (5% return before expenses) | $1,000.00 | $1,020.31 | $4.81 | |||||||||
Retail Class | ||||||||||||
Actual | $1,000.00 | $998.70 | $6.01 | |||||||||
Hypothetical (5% return before expenses) | $1,000.00 | $1,019.05 | $6.07 | |||||||||
Class N | ||||||||||||
Actual | $1,000.00 | $1,000.80 | $4.16 | |||||||||
Hypothetical (5% return before expenses) | $1,000.00 | $1,020.91 | $4.20 | |||||||||
* Expenses are equal to the Fund’s annualized expense ratio (after waiver/reimbursement): 0.95%, 1.20% and 0.83% for Institutional Class, Retail Class and Class N, respectively, multiplied by the average account value over the period, multiplied by the number of days in the most recent fiscal half-year (183), divided by 365 (to reflect the half-year period). |
| |||||||||||
15 |
Table of Contents
Loomis Sayles Small Cap Value Fund
Institutional Class | Beginning Account Value 4/1/2019 | Ending Account Value 9/30/2019 | Expenses Paid During Period* 4/1/2019 – 9/30/2019 | |||||||||
Actual | $1,000.00 | $1,035.80 | $4.59 | |||||||||
Hypothetical (5% return before expenses) | $1,000.00 | $1,020.56 | $4.56 | |||||||||
Retail Class | ||||||||||||
Actual | $1,000.00 | $1,035.00 | $5.87 | |||||||||
Hypothetical (5% return before expenses) | $1,000.00 | $1,019.30 | $5.82 | |||||||||
Admin Class | ||||||||||||
Actual | $1,000.00 | $1,033.30 | $7.14 | |||||||||
Hypothetical (5% return before expenses) | $1,000.00 | $1,018.05 | $7.08 | |||||||||
Class N | ||||||||||||
Actual | $1,000.00 | $1,036.10 | $4.24 | |||||||||
Hypothetical (5% return before expenses) | $1,000.00 | $1,020.91 | $4.20 | |||||||||
* Expenses are equal to the Fund’s annualized expense ratio (after waiver/reimbursement): 0.90%, 1.15%, 1.40% and 0.83% for Institutional Class, Retail Class, Admin Class and Class N, respectively, multiplied by the average account value over the period, multiplied by the number of days in the most recent fiscal half-year (183), divided by 365 (to reflect the half-year period). |
| |||||||||||
Loomis Sayles Small/Mid Cap Growth Fund
Institutional Class | Beginning Account Value 4/1/2019 | Ending Account Value 9/30/2019 | Expenses Paid During Period* 4/1/2019 – 9/30/2019 | |||||||||
Actual | $1,000.00 | $1,028.70 | $4.32 | |||||||||
Hypothetical (5% return before expenses) | $1,000.00 | $1,020.81 | $4.31 | |||||||||
* Expenses are equal to the Fund’s annualized expense ratio (after waiver/reimbursement) of 0.85%, multiplied by the average account value over the period, multiplied by the number of days in the most recent fiscal half-year (183), divided by 365 (to reflect the half-year period). |
| |||||||||||
| 16
Table of Contents
BOARD APPROVAL OF THE EXISTING ADVISORY AGREEMENTS
The Board of Trustees of the Trusts (the “Board”), including the Independent Trustees, considers matters bearing on each Fund’s advisory agreement (collectively, the “Agreements”) at most of its meetings throughout the year. Each year, usually in the spring, the Contract Review Committee of the Board meets to review the Agreements to determine whether to recommend that the full Board approve the continuation of the Agreements, typically for an additionalone-year period. After the Contract Review Committee has made its recommendation, the full Board, including the Independent Trustees, determines whether to approve the continuation of the Agreements.
In connection with these meetings, the Trustees receive materials that the Funds’ investment adviser (the “Adviser”) believes to be reasonably necessary for the Trustees to evaluate the Agreements. These materials generally include, among other items, (i) information on the investment performance of the Funds and the performance of peer groups of funds and the Funds’ performance benchmarks, (ii) information on the Funds’ advisory fees and other expenses, including information comparing the Funds’ advisory fees to the fees charged to institutional accounts with similar strategies managed by the Adviser, if any, and to those of peer groups of funds and information about any applicable expense caps and/or fee “breakpoints,” (iii) sales and redemption data in respect of the Funds, (iv) information about the profitability of the Agreements to the Adviser and (v) information obtained through the completion by the Adviser of a questionnaire distributed on behalf of the Trustees. The Board, including the Independent Trustees, also considers other matters such as (i) each Fund’s investment objective and strategies and the size, education and experience of the Adviser’s investment staff and its use of technology, external research and trading cost measurement tools, (ii) arrangements in respect of the distribution of the Funds’ shares and the related costs, (iii) the allocation of the Funds’ brokerage, if any, including, to the extent applicable, the use of “soft” commission dollars to pay for research and other similar services, (iv) each Adviser’s policies and procedures relating to, among other things, compliance, trading and best execution, proxy voting and valuation, (v) information about amounts invested by the Funds’ portfolio managers in the Funds or in similar accounts that they manage and (vi) the general economic outlook with particular emphasis on the mutual fund industry. Throughout the process, the Trustees are afforded the opportunity to ask questions of and request additional materials from the Adviser.
In addition to the materials requested by the Trustees in connection with their annual consideration of the continuation of the Agreements, the Trustees receive materials in advance of each regular quarterly meeting of the Board that provide detailed information about the Funds’ investment performance and the fees charged to the Funds for advisory and other services. This information generally includes, among other things, an internal performance rating for each Fund based on agreed-upon criteria, graphs showing each Fund’s performance and expense differentials against each Fund’s peer group/category, performance ratings provided by a third-party, total return information for various periods, and third-party performance rankings for various periods comparing a Fund against similarly categorized funds. The portfolio management team for each Fund or
17 |
Table of Contents
other representatives of the Adviser make periodic presentations to the Contract Review Committee and/or the full Board, and Funds identified as presenting possible performance concerns may be subject to more frequent Board or Committee presentations and reviews. In addition, each quarter the Trustees are provided with detailed statistical information about each Fund’s portfolio. The Trustees also receive periodic updates between meetings.
The Board most recently approved the continuation of the Agreements for aone-year period at its meeting held in June 2019. In considering whether to approve the continuation of the Agreements, the Board, including the Independent Trustees, did not identify any single factor as determinative. Individual Trustees may have evaluated the information presented differently from one another, giving different weights to various factors. Matters considered by the Trustees, including the Independent Trustees, in connection with their approval of the Agreements included, but were not limited to, the factors listed below.
The nature, extent and quality of the services provided to the Funds under the Agreements. The Trustees considered the nature, extent and quality of the services provided by the Adviser and its affiliates to the Funds and the resources dedicated to the Funds by the Adviser and its affiliates.
The Trustees considered not only the advisory services provided by the Adviser to the Funds, but also the monitoring and oversight services provided by Natixis Advisors, L.P. (“Natixis Advisors”). They also considered the administrative and shareholder services provided by Natixis Advisors and its affiliates to the Funds.
For each Fund, the Trustees also considered the benefits to shareholders of investing in a mutual fund that is part of a family of funds that offers shareholders the right to exchange shares of one type of fund for shares of another type of fund, and provides a variety of fund and shareholder services.
After reviewing these and related factors, the Trustees concluded, within the context of their overall conclusions regarding each of the Agreements, that the nature, extent and quality of services provided supported the renewal of the Agreements.
Investment performance of the Funds and the Adviser. As noted above, the Trustees received information about the performance of the Funds over various time periods, including information that compared the performance of the Funds to the performance of peer groups and categories of funds and the Funds’ respective performance benchmarks. In addition, the Trustees reviewed data prepared by an independent third party that analyzed the performance of the Funds using a variety of performance metrics, including metrics that measured the performance of the Funds on a risk adjusted basis.
| 18
Table of Contents
The Board noted that, through December 31, 2018, each Fund’sone-, three- and five-year performance, as applicable, stated as percentile rankings within categories selected by the independent third-party data provider was as follows (where the best performance would be in the first percentile of its category):
| One-Year | Three-Year | Five-Year | ||||||||||
Loomis Sayles Small Cap Growth Fund | 20% | 32% | 29% | |||||||||
Loomis Sayles Small Cap Value Fund | 80% | 62% | 48% | |||||||||
Loomis Sayles Small/Mid Cap Growth Fund | 63% | 27% | N/A | |||||||||
In the case of each Fund that had performance that lagged that of a relevant category median as determined by the independent third party for certain (although not necessarily all) periods the Board concluded that other factors relevant to performance supported renewal of the Agreements. These factors included one or more of the following: (1) that the underperformance was attributable, to a significant extent, to investment decisions (such as security selection or sector allocation) by the Adviser that were reasonable and consistent with the Fund’s investment objective and policies; (2) that the Fund’s performance, although lagging in certain periods, was competitive over the long term relative to its category and (3) that the Fund’s performance has been competitive when compared to its benchmark.
The Trustees also considered the Adviser’s performance and reputation generally, the performance of the fund family generally, and the historical responsiveness of the Adviser to Trustee concerns about performance and the willingness of the Adviser to take steps intended to improve performance.
After reviewing these and related factors, the Trustees concluded, within the context of their overall conclusions regarding each of the Agreements, that the performance of the Funds and the Adviser and/or other relevant factors supported the renewal of the Agreements.
The costs of the services to be provided and profits to be realized by the Adviser and its affiliates from their respective relationships with the Funds. The Trustees considered the fees charged to the Funds for advisory and administrative services as well as the total expense levels of the Funds. This information included comparisons (provided both by management and by an independent third party) of the Funds’ advisory fees and total expense levels to those of their peer groups and information about the advisory fees charged by the Adviser to comparable accounts (such as institutional separate accounts), as well as information about differences in such fees and the reasons for any such differences. In considering the fees charged to comparable accounts, the Trustees considered, among other things, management’s representations about the differences between managing mutual funds as compared to other types of accounts, including the additional resources required to effectively manage mutual fund assets and the greater regulatory costs associated with the management of such assets. In evaluating each Fund’s advisory fee, the Trustees also took into account the demands, complexity and quality of the investment management of such Fund and the need for the Adviser to offer competitive compensation and the potential need to expend additional resources to the extent the Fund grows in size. The Trustees considered that over the past several years, management had made recommendations
19 |
Table of Contents
regarding reductions in advisory fee rates, implementation of advisory fee breakpoints and the institution of advisory fee waivers and expense caps for various funds in the fund family. They noted that all of the Funds have expense caps in place, and they considered the amounts waived or reimbursed by the Adviser for certain Funds under their caps. The Trustees also considered that Loomis Sayles Small Cap Growth Fund’s current expenses are below its cap. The Trustees noted that the Funds had total advisory fee rates that were below the medians of their respective peer groups of funds.
The Trustees also considered the compensation directly or indirectly received by the Adviser and its affiliates from their relationships with the Funds. The Trustees reviewed information provided by management as to the profitability of the Adviser’s and its affiliates’ relationships with the Funds, and information about the allocation of expenses used to calculate profitability. They also reviewed information provided by management about the effect of distribution costs and changes in asset levels on Adviser profitability, including information regarding resources spent on distribution activities. When reviewing profitability, the Trustees also considered information about court cases in which adviser compensation or profitability were issues, the performance of the Funds, the expense levels of the Funds, whether the Adviser had implemented breakpoints and/or expense caps with respect to such Funds and the overall profit margin of Natixis Investment Managers compared to that of certain other investment managers for which such data was available.
After reviewing these and related factors, the Trustees concluded, within the context of their overall conclusions regarding each of the Agreements, that the advisory fee charged to each of the Funds was fair and reasonable, and that the costs of these services generally and the related profitability of the Adviser and its affiliates in respect of their relationships with the Funds supported the renewal of the Agreements.
Economies of Scale. The Trustees considered the existence of any economies of scale in the provision of services by the Adviser and whether those economies are shared with the Funds through breakpoints in their investment advisory fees or other means, such as expense caps. The Trustees also considered management’s explanation of the factors that are taken into account with respect to the implementation of breakpoints in investment advisory fees or expense caps. With respect to economies of scale, the Trustees noted that although none of the Funds’ management fees were subject to breakpoints, each of the Funds was subject to an expense cap. In considering these issues, the Trustees also took note of the costs of the services provided (both on an absolute and on a relative basis) and the profitability to the Adviser and its affiliates of their relationships with the Funds, as discussed above. The Trustees also considered that the Funds have benefitted from the substantial reinvestment the Adviser has made into its business.
After reviewing these and related factors, the Trustees concluded, within the context of their overall conclusions regarding each of the Agreements, that the extent to which economies of scale were shared with the Funds supported the renewal of the Agreements.
| 20
Table of Contents
The Trustees also considered other factors, which included but were not limited to the following:
| • | The effect of recent market and economic events on the performance, asset levels and expense ratios of each Fund. |
| • | Whether each Fund has operated in accordance with its investment objective and the Fund’s record of compliance with its investment restrictions, and the compliance programs of the Funds and the Adviser. They also considered the compliance-related resources the Adviser and its affiliates were providing to the Funds. |
| • | So-called “fallout benefits” to the Adviser, such as the engagement of affiliates of the Adviser to provide distribution and administrative services to the Funds, and the benefits of research made available to the Adviser by reason of brokerage commissions (if any) generated by the Funds’ securities transactions. The Trustees also considered the benefits to the parent company of Natixis Advisors from the retention of the Adviser. The Trustees considered the possible conflicts of interest associated with these fallout and other benefits, and the reporting, disclosure and other processes in place to disclose and monitor such possible conflicts of interest. |
| • | The Trustees’ review and discussion of the Funds’ advisory arrangements in prior years, and management’s record of responding to Trustee concerns raised during the year and in prior years. |
Based on their evaluation of all factors that they deemed to be material, including those factors described above, and assisted by the advice of independent counsel, the Trustees, including the Independent Trustees, concluded that each of the existing Agreements should be continued through June 30, 2020.
21 |
Table of Contents
Portfolio of Investments – as of September 30, 2019
Loomis Sayles Small Cap Growth Fund
| Shares | Description | Value (†) | ||||||
| Common Stocks –97.0% of Net Assets | ||||||||
| Aerospace & Defense –4.9% |
| |||||||
| 396,117 | AAR Corp. | $ | 16,323,982 | |||||
| 299,980 | Hexcel Corp. | 24,637,357 | ||||||
| 627,968 | Kratos Defense & Security Solutions, Inc.(a) | 11,677,065 | ||||||
| 331,133 | Mercury Systems, Inc.(a) | 26,878,066 | ||||||
|
| |||||||
| 79,516,470 | ||||||||
|
| |||||||
| Air Freight & Logistics –0.6% |
| |||||||
| 468,325 | Air Transport Services Group, Inc.(a) | 9,844,192 | ||||||
|
| |||||||
| Auto Components –1.8% |
| |||||||
| 211,674 | Fox Factory Holding Corp.(a) | 13,174,590 | ||||||
| 533,557 | Stoneridge, Inc.(a) | 16,524,260 | ||||||
|
| |||||||
| 29,698,850 | ||||||||
|
| |||||||
| Banks –0.8% |
| |||||||
| 324,015 | TCF Financial Corp. | 12,335,251 | ||||||
|
| |||||||
| Biotechnology –6.8% |
| |||||||
| 542,550 | Aimmune Therapeutics, Inc.(a) | 11,360,997 | ||||||
| 130,269 | Argenx SE, ADR(a) | 14,845,455 | ||||||
| 155,230 | Blueprint Medicines Corp.(a) | 11,404,748 | ||||||
| 891,462 | Epizyme, Inc.(a) | 9,195,431 | ||||||
| 191,893 | Genomic Health, Inc.(a) | 13,014,183 | ||||||
| 717,044 | Halozyme Therapeutics, Inc.(a) | 11,121,353 | ||||||
| 214,459 | PTC Therapeutics, Inc.(a) | 7,253,003 | ||||||
| 211,167 | Repligen Corp.(a) | 16,194,397 | ||||||
| 132,173 | Ultragenyx Pharmaceutical, Inc.(a) | 5,654,361 | ||||||
| 324,210 | Xencor, Inc.(a) | 10,935,603 | ||||||
|
| |||||||
| 110,979,531 | ||||||||
|
| |||||||
| Building Products –3.3% |
| |||||||
| 381,251 | AAON, Inc. | 17,514,671 | ||||||
| 280,254 | Advanced Drainage Systems, Inc. | 9,043,796 | ||||||
| 292,715 | Trex Co., Inc.(a) | 26,616,575 | ||||||
|
| |||||||
| 53,175,042 | ||||||||
|
| |||||||
| Capital Markets –1.5% |
| |||||||
| 473,303 | AssetMark Financial Holdings, Inc.(a) | 12,329,543 | ||||||
| 210,143 | Hamilton Lane, Inc., Class A | 11,969,745 | ||||||
|
| |||||||
| 24,299,288 | ||||||||
|
| |||||||
| Commercial Services & Supplies –1.4% |
| |||||||
| 407,711 | Casella Waste Systems, Inc., Class A(a) | 17,507,110 | ||||||
| 82,854 | McGrath RentCorp | 5,765,810 | ||||||
|
| |||||||
| 23,272,920 | ||||||||
|
| |||||||
See accompanying notes to financial statements.
| 22
Table of Contents
Portfolio of Investments – as of September 30, 2019
Loomis Sayles Small Cap Growth Fund – continued
| Shares | Description | Value (†) | ||||||
| Common Stocks – continued | ||||||||
| Construction & Engineering –0.7% |
| |||||||
| 586,308 | Primoris Services Corp. | $ | 11,497,500 | |||||
|
| |||||||
| Distributors –1.7% |
| |||||||
| 142,067 | POOL CORP. | 28,654,914 | ||||||
|
| |||||||
| Diversified Consumer Services –2.7% |
| |||||||
| 65,770 | Chegg, Inc.(a) | 1,969,811 | ||||||
| 221,828 | Grand Canyon Education, Inc.(a) | 21,783,510 | ||||||
| 1,213,083 | Laureate Education, Inc., Class A(a) | 20,106,851 | ||||||
|
| |||||||
| 43,860,172 | ||||||||
|
| |||||||
| Diversified Telecommunication Services –1.8% |
| |||||||
| 175,533 | Bandwidth, Inc., Class A(a) | 11,428,954 | ||||||
| 313,582 | Cogent Communications Holdings, Inc. | 17,278,368 | ||||||
|
| |||||||
| 28,707,322 | ||||||||
|
| |||||||
| Electrical Equipment –1.5% |
| |||||||
| 306,443 | Generac Holdings, Inc.(a) | 24,006,745 | ||||||
|
| |||||||
| Electronic Equipment, Instruments & Components –1.8% |
| |||||||
| 224,265 | Novanta, Inc.(a) | 18,326,936 | ||||||
| 79,955 | Rogers Corp.(a) | 10,930,648 | ||||||
|
| |||||||
| 29,257,584 | ||||||||
|
| |||||||
| Energy Equipment & Services –1.5% |
| |||||||
| 361,165 | Apergy Corp.(a) | 9,769,513 | ||||||
| 486,364 | Cactus, Inc., Class A(a) | 14,075,374 | ||||||
|
| |||||||
| 23,844,887 | ||||||||
|
| |||||||
| Entertainment –1.0% |
| |||||||
| 772,351 | IMAX Corp.(a) | 16,953,104 | ||||||
|
| |||||||
| Food & Staples Retailing –1.2% |
| |||||||
| 490,272 | Chefs’ Warehouse, Inc. (The)(a) | 19,767,767 | ||||||
|
| |||||||
| Food Products –2.5% |
| |||||||
| 486,364 | Freshpet, Inc.(a) | 24,206,336 | ||||||
| 592,544 | Simply Good Foods Co. (The)(a) | 17,177,851 | ||||||
|
| |||||||
| 41,384,187 | ||||||||
|
| |||||||
| Health Care Equipment & Supplies –4.3% |
| |||||||
| 539,957 | AtriCure, Inc.(a) | 13,466,527 | ||||||
| 232,358 | CONMED Corp. | 22,341,222 | ||||||
| 403,478 | CryoLife, Inc.(a) | 10,954,428 | ||||||
| 86,196 | Penumbra, Inc.(a) | 11,592,500 | ||||||
| 191,307 | Quidel Corp.(a) | 11,736,684 | ||||||
|
| |||||||
| 70,091,361 | ||||||||
|
| |||||||
See accompanying notes to financial statements.
23 |
Table of Contents
Portfolio of Investments – as of September 30, 2019
Loomis Sayles Small Cap Growth Fund – continued
| Shares | Description | Value (†) | ||||||
| Common Stocks – continued | ||||||||
| Health Care Providers & Services –3.1% |
| |||||||
| 143,042 | Amedisys, Inc.(a) | $ | 18,739,933 | |||||
| 292,130 | BioTelemetry, Inc.(a) | 11,898,455 | ||||||
| 172,197 | LHC Group, Inc.(a) | 19,554,691 | ||||||
|
| |||||||
| 50,193,079 | ||||||||
|
| |||||||
| Health Care Technology –2.0% |
| |||||||
| 480,653 | HMS Holdings Corp.(a) | 16,565,706 | ||||||
| 317,354 | Inovalon Holdings, Inc., Class A(a) | 5,201,432 | ||||||
| 123,736 | Medidata Solutions, Inc.(a) | 11,321,844 | ||||||
|
| |||||||
| 33,088,982 | ||||||||
|
| |||||||
| Hotels, Restaurants & Leisure –1.9% |
| |||||||
| 227,202 | Planet Fitness, Inc., Class A(a) | 13,148,180 | ||||||
| 200,181 | Wingstop, Inc. | 17,471,797 | ||||||
|
| |||||||
| 30,619,977 | ||||||||
|
| |||||||
| Insurance –5.4% |
| |||||||
| 521,174 | Goosehead Insurance, Inc., Series A | 25,719,937 | ||||||
| 298,454 | James River Group Holdings Ltd. | 15,292,783 | ||||||
| 288,327 | Kinsale Capital Group, Inc. | 29,787,062 | ||||||
| 227,700 | Palomar Holdings, Inc.(a) | 8,975,934 | ||||||
| 312,539 | Trupanion, Inc.(a) | 7,944,742 | ||||||
|
| |||||||
| 87,720,458 | ||||||||
|
| |||||||
| IT Services –6.0% |
| |||||||
| 419,962 | EVERTEC, Inc. | 13,111,213 | ||||||
| 694,439 | Evo Payments, Inc., Class A(a) | 19,527,625 | ||||||
| 336,496 | InterXion Holding NV(a) | 27,410,964 | ||||||
| 489,661 | NIC, Inc. | 10,111,500 | ||||||
| 485,096 | WNS Holdings Ltd., ADR(a) | 28,499,390 | ||||||
|
| |||||||
| 98,660,692 | ||||||||
|
| |||||||
| Leisure Products –1.0% |
| |||||||
| 807,526 | Callaway Golf Co. | 15,674,080 | ||||||
|
| |||||||
| Life Sciences Tools & Services –2.6% |
| |||||||
| 248,963 | Adaptive Biotechnologies Corp.(a) | 7,692,957 | ||||||
| 556,959 | NeoGenomics, Inc.(a) | 10,649,056 | ||||||
| 248,935 | PRA Health Sciences, Inc.(a) | 24,701,820 | ||||||
|
| |||||||
| 43,043,833 | ||||||||
|
| |||||||
| Machinery –7.1% |
| |||||||
| 312,022 | Albany International Corp., Class A | 28,131,904 | ||||||
| 259,953 | Chart Industries, Inc.(a) | 16,210,669 | ||||||
| 757,470 | Harsco Corp.(a) | 14,361,631 | ||||||
| 558,616 | Kornit Digital Ltd.(a) | 17,194,200 | ||||||
See accompanying notes to financial statements.
| 24
Table of Contents
Portfolio of Investments – as of September 30, 2019
Loomis Sayles Small Cap Growth Fund – continued
| Shares | Description | Value (†) | ||||||
| Common Stocks – continued | ||||||||
| Machinery – continued |
| |||||||
| 154,255 | Proto Labs, Inc.(a) | $ | 15,749,436 | |||||
| 150,266 | RBC Bearings, Inc.(a) | 24,930,632 | ||||||
|
| |||||||
| 116,578,472 | ||||||||
|
| |||||||
| Pharmaceuticals –3.7% |
| |||||||
| 526,049 | Horizon Therapeutics PLC(a) | 14,324,314 | ||||||
| 169,856 | MyoKardia, Inc.(a) | 8,857,991 | ||||||
| 292,093 | Pacira BioSciences, Inc.(a) | 11,119,981 | ||||||
| 123,053 | Reata Pharmaceuticals, Inc., Class A(a) | 9,879,925 | ||||||
| 279,844 | Supernus Pharmaceuticals, Inc.(a) | 7,690,113 | ||||||
| 211,004 | Zogenix, Inc.(a) | 8,448,600 | ||||||
|
| |||||||
| 60,320,924 | ||||||||
|
| |||||||
| Professional Services –2.5% |
| |||||||
| 329,963 | Huron Consulting Group, Inc.(a) | 20,239,931 | ||||||
| 241,771 | ICF International, Inc. | 20,422,396 | ||||||
|
| |||||||
| 40,662,327 | ||||||||
|
| |||||||
| Semiconductors & Semiconductor Equipment –2.6% |
| |||||||
| 145,285 | Monolithic Power Systems, Inc. | 22,610,705 | ||||||
| 184,287 | Silicon Laboratories, Inc.(a) | 20,520,357 | ||||||
|
| |||||||
| 43,131,062 | ||||||||
|
| |||||||
| Software –10.4% |
| |||||||
| 219,097 | Cornerstone OnDemand, Inc.(a) | 12,010,898 | ||||||
| 311,826 | Envestnet, Inc.(a) | 17,680,534 | ||||||
| 422,789 | Five9, Inc.(a) | 22,720,681 | ||||||
| 155,913 | Globant S.A.(a) | 14,278,512 | ||||||
| 108,071 | HubSpot, Inc.(a) | 16,384,644 | ||||||
| 396,852 | Mimecast Ltd.(a) | 14,155,711 | ||||||
| 167,402 | PROS Holdings, Inc.(a) | 9,977,159 | ||||||
| 299,638 | Q2 Holdings, Inc.(a) | 23,632,449 | ||||||
| 397,340 | Rapid7, Inc.(a) | 18,035,263 | ||||||
| 342,834 | RealPage, Inc.(a) | 21,550,545 | ||||||
|
| |||||||
| 170,426,396 | ||||||||
|
| |||||||
| Specialty Retail –1.4% |
| |||||||
| 618,740 | National Vision Holdings, Inc.(a) | 14,893,072 | ||||||
| 265,304 | Sonic Automotive, Inc., Class A | 8,333,198 | ||||||
|
| |||||||
| 23,226,270 | ||||||||
|
| |||||||
| Textiles, Apparel & Luxury Goods –2.1% |
| |||||||
| 218,610 | Columbia Sportswear Co. | 21,181,123 | ||||||
| 368,575 | Steven Madden Ltd. | 13,191,299 | ||||||
|
| |||||||
| 34,372,422 | ||||||||
|
| |||||||
See accompanying notes to financial statements.
25 |
Table of Contents
Portfolio of Investments – as of September 30, 2019
Loomis Sayles Small Cap Growth Fund – continued
| Shares | Description | Value (†) | ||||||
| Common Stocks – continued | ||||||||
| Thrifts & Mortgage Finance –1.9% |
| |||||||
| 342,306 | Essent Group Ltd. | $ | 16,317,727 | |||||
| 563,784 | NMI Holdings, Inc., Class A(a) | 14,804,968 | ||||||
|
| |||||||
| 31,122,695 | ||||||||
|
| |||||||
| Trading Companies & Distributors –1.5% |
| |||||||
| 342,054 | SiteOne Landscape Supply, Inc.(a) | 25,318,837 | ||||||
|
| |||||||
| Total Common Stocks (Identified Cost $1,312,164,600) | 1,585,307,593 | |||||||
|
| |||||||
| | Principal Amount | |||||||
| Short-Term Investments –3.4% | ||||||||
| $ | 55,500,624 | Tri-Party Repurchase Agreement with Fixed Income Clearing Corporation, dated 9/30/2019 at 1.100% to be repurchased at $55,502,319 on 10/01/2019 collateralized by $54,620,000 U.S. Treasury Note, 2.125% due 5/15/2025 valued at $56,612,374 including accrued interest (Note 2 of Notes to Financial Statements) (Identified Cost $55,500,624) | 55,500,624 | |||||
|
| |||||||
| Total Investments –100.4% (Identified Cost $1,367,665,224) | 1,640,808,217 | |||||||
Other assets less liabilities—(0.4)% | (6,644,063 | ) | ||||||
|
| |||||||
| Net Assets –100.0% | $ | 1,634,164,154 | ||||||
|
| |||||||
| (†) | See Note 2 of Notes to Financial Statements. |
| ||||||
| (a) | Non-income producing security. |
| ||||||
| ADR | An American Depositary Receipt is a certificate issued by a custodian bank representing the right to receive securities of the foreign issuer described. The values of ADRs may be significantly influenced by trading on exchanges not located in the United States. |
| ||||||
See accompanying notes to financial statements.
| 26
Table of Contents
Portfolio of Investments – as of September 30, 2019
Loomis Sayles Small Cap Growth Fund – continued
Industry Summary at September 30, 2019
Software | 10.4 | % | ||
Machinery | 7.1 | |||
Biotechnology | 6.8 | |||
IT Services | 6.0 | |||
Insurance | 5.4 | |||
Aerospace & Defense | 4.9 | |||
Health Care Equipment & Supplies | 4.3 | |||
Pharmaceuticals | 3.7 | |||
Building Products | 3.3 | |||
Health Care Providers & Services | 3.1 | |||
Diversified Consumer Services | 2.7 | |||
Semiconductors & Semiconductor Equipment | 2.6 | |||
Life Sciences Tools & Services | 2.6 | |||
Food Products | 2.5 | |||
Professional Services | 2.5 | |||
Textiles, Apparel & Luxury Goods | 2.1 | |||
Health Care Technology | 2.0 | |||
Other Investments, less than 2% each | 25.0 | |||
Short-Term Investments | 3.4 | |||
|
| |||
Total Investments | 100.4 | |||
Other assets less liabilities | (0.4 | ) | ||
|
| |||
Net Assets | 100.0 | % | ||
|
|
See accompanying notes to financial statements.
27 |
Table of Contents
Portfolio of Investments – as of September 30, 2019
Loomis Sayles Small Cap Value Fund
| Shares | Description | Value (†) | ||||||
| Common Stocks – 99.0% of Net Assets | ||||||||
| Aerospace & Defense –1.7% |
| |||||||
| 156,282 | Aerojet Rocketdyne Holdings, Inc.(a) | $ | 7,893,804 | |||||
| 74,984 | BWX Technologies, Inc. | 4,289,834 | ||||||
|
| |||||||
| 12,183,638 | ||||||||
|
| |||||||
| Auto Components –1.5% |
| |||||||
| 152,445 | Cooper Tire & Rubber Co. | 3,981,863 | ||||||
| 48,454 | Fox Factory Holding Corp.(a) | 3,015,777 | ||||||
| 39,753 | LCI Industries | 3,651,313 | ||||||
|
| |||||||
| 10,648,953 | ||||||||
|
| |||||||
| Banks –15.0% |
| |||||||
| 154,250 | Ameris Bancorp | 6,207,020 | ||||||
| 166,240 | BancorpSouth Bank | 4,922,366 | ||||||
| 107,053 | Bank OZK | 2,919,335 | ||||||
| 160,522 | Bryn Mawr Bank Corp. | 5,860,658 | ||||||
| 93,549 | Carolina Financial Corp. | 3,324,732 | ||||||
| 138,995 | Cathay General Bancorp | 4,827,991 | ||||||
| 227,100 | CenterState Bank Corp. | 5,446,994 | ||||||
| 256,269 | CVB Financial Corp. | 5,348,334 | ||||||
| 220,906 | First Financial Bancorp | 5,406,674 | ||||||
| 346,655 | Home BancShares, Inc. | 6,515,381 | ||||||
| 89,891 | IBERIABANK Corp. | 6,790,366 | ||||||
| 139,260 | PacWest Bancorp | 5,060,709 | ||||||
| 95,744 | Pinnacle Financial Partners, Inc. | 5,433,472 | ||||||
| 151,044 | Popular, Inc. | 8,168,460 | ||||||
| 108,832 | Prosperity Bancshares, Inc. | 7,686,804 | ||||||
| 40,560 | Signature Bank | 4,835,563 | ||||||
| 160,207 | TCF Financial Corp. | 6,099,081 | ||||||
| 197,480 | Triumph Bancorp, Inc.(a) | 6,297,637 | ||||||
| 113,943 | Wintrust Financial Corp. | 7,364,136 | ||||||
|
| |||||||
| 108,515,713 | ||||||||
|
| |||||||
| Beverages –0.7% |
| |||||||
| 416,350 | Cott Corp. | 5,191,884 | ||||||
|
| |||||||
| Biotechnology –0.5% |
| |||||||
| 44,384 | United Therapeutics Corp.(a) | 3,539,624 | ||||||
|
| |||||||
| Building Products –1.7% |
| |||||||
| 46,323 | American Woodmark Corp.(a) | 4,118,578 | ||||||
| 85,931 | Armstrong World Industries, Inc. | 8,309,528 | ||||||
|
| |||||||
| 12,428,106 | ||||||||
|
| |||||||
| Capital Markets –1.5% |
| |||||||
| 325,208 | Donnelley Financial Solutions, Inc.(a) | 4,006,563 | ||||||
| 116,480 | Stifel Financial Corp. | 6,683,622 | ||||||
|
| |||||||
| 10,690,185 | ||||||||
|
| |||||||
See accompanying notes to financial statements.
| 28
Table of Contents
Portfolio of Investments – as of September 30, 2019
Loomis Sayles Small Cap Value Fund – continued
| Shares | Description | Value (†) | ||||||
| Common Stocks – continued | ||||||||
| Chemicals –3.1% |
| |||||||
| 186,220 | AdvanSix, Inc.(a) | $ | 4,789,578 | |||||
| 53,359 | Ashland Global Holdings, Inc. | 4,111,311 | ||||||
| 122,555 | Cabot Corp. | 5,554,193 | ||||||
| 40,317 | Ingevity Corp.(a) | 3,420,494 | ||||||
| 69,697 | WR Grace & Co. | 4,652,972 | ||||||
|
| |||||||
| 22,528,548 | ||||||||
|
| |||||||
| Commercial Services & Supplies –4.4% |
| |||||||
| 89,279 | Clean Harbors, Inc.(a) | 6,892,339 | ||||||
| 172,650 | IAA, Inc.(a) | 7,204,684 | ||||||
| 172,650 | KAR Auction Services, Inc. | 4,238,557 | ||||||
| 175,199 | Kimball International, Inc., Class B | 3,381,341 | ||||||
| 152,591 | Viad Corp. | 10,246,486 | ||||||
|
| |||||||
| 31,963,407 | ||||||||
|
| |||||||
| Communications Equipment –1.2% |
| |||||||
| 272,103 | Digi International, Inc.(a) | 3,706,043 | ||||||
| 360,583 | Viavi Solutions, Inc.(a) | 5,049,965 | ||||||
|
| |||||||
| 8,756,008 | ||||||||
|
| |||||||
| Construction & Engineering –0.9% |
| |||||||
| 186,609 | Arcosa, Inc. | 6,383,894 | ||||||
|
| |||||||
| Distributors –0.6% |
| |||||||
| 127,834 | Core-Mark Holding Co., Inc. | 4,105,389 | ||||||
|
| |||||||
| Diversified Consumer Services –1.6% |
| |||||||
| 112,585 | frontdoor, Inc.(a) | 5,468,253 | ||||||
| 149,813 | OneSpaWorld Holdings Ltd.(a) | 2,326,596 | ||||||
| 66,542 | ServiceMaster Global Holdings, Inc.(a) | 3,719,698 | ||||||
|
| |||||||
| 11,514,547 | ||||||||
|
| |||||||
| Diversified Financial Services –0.8% |
| |||||||
| 226,416 | Cannae Holdings, Inc.(a) | 6,219,648 | ||||||
|
| |||||||
| Diversified Telecommunication Services –1.1% |
| |||||||
| 133,581 | GCI Liberty, Inc., Class A(a) | 8,291,373 | ||||||
|
| |||||||
| Electric Utilities –1.5% |
| |||||||
| 127,026 | ALLETE, Inc. | 11,103,343 | ||||||
|
| |||||||
| Electrical Equipment –0.6% |
| |||||||
| 227,061 | TPI Composites, Inc.(a) | 4,257,394 | ||||||
|
| |||||||
| Electronic Equipment, Instruments & Components –2.8% |
| |||||||
| 108,422 | Kimball Electronics, Inc.(a) | 1,573,203 | ||||||
| 48,470 | Littelfuse, Inc. | 8,594,216 | ||||||
| 157,993 | Methode Electronics, Inc. | 5,314,884 | ||||||
See accompanying notes to financial statements.
29 |
Table of Contents
Portfolio of Investments – as of September 30, 2019
Loomis Sayles Small Cap Value Fund – continued
| Shares | Description | Value (†) | ||||||
| Common Stocks – continued | ||||||||
| Electronic Equipment, Instruments & Components – continued |
| |||||||
| 15,858 | Rogers Corp.(a) | $ | 2,167,947 | |||||
| 201,758 | TTM Technologies, Inc.(a) | 2,460,439 | ||||||
|
| |||||||
| 20,110,689 | ||||||||
|
| |||||||
| Energy Equipment & Services –1.1% |
| |||||||
| 223,506 | Apergy Corp.(a) | 6,045,837 | ||||||
| 41,390 | DMC Global, Inc. | 1,820,332 | ||||||
|
| |||||||
| 7,866,169 | ||||||||
|
| |||||||
| Entertainment –0.5% |
| |||||||
| 128,200 | Liberty Media Corp.-Liberty Braves, Class C(a) | 3,557,550 | ||||||
|
| |||||||
| Food Products –3.6% |
| |||||||
| 224,605 | Darling Ingredients, Inc.(a) | 4,296,693 | ||||||
| 35,446 | J&J Snack Foods Corp. | 6,805,632 | ||||||
| 431,084 | Nomad Foods Ltd.(a) | 8,837,222 | ||||||
| 56,983 | Post Holdings, Inc.(a) | 6,031,081 | ||||||
|
| |||||||
| 25,970,628 | ||||||||
|
| |||||||
| Health Care Equipment & Supplies –2.0% |
| |||||||
| 112,321 | Avanos Medical, Inc.(a) | 4,207,545 | ||||||
| 77,360 | Quidel Corp.(a) | 4,746,036 | ||||||
| 187,113 | Varex Imaging Corp.(a) | 5,340,205 | ||||||
|
| |||||||
| 14,293,786 | ||||||||
|
| |||||||
| Health Care Providers & Services –0.8% |
| |||||||
| 100,333 | AMN Healthcare Services, Inc.(a) | 5,775,167 | ||||||
|
| |||||||
| Hotels, Restaurants & Leisure –2.8% |
| |||||||
| 76,463 | Churchill Downs, Inc. | 9,439,740 | ||||||
| 22,981 | Cracker Barrel Old Country Store, Inc. | 3,737,860 | ||||||
| 70,132 | Marriott Vacations Worldwide Corp. | 7,266,376 | ||||||
|
| |||||||
| 20,443,976 | ||||||||
|
| |||||||
| Household Durables –0.8% |
| |||||||
| 35,486 | Helen of Troy Ltd.(a) | 5,594,723 | ||||||
|
| |||||||
| Independent Power & Renewable Electricity Producers –3.2% |
| |||||||
| 168,813 | NextEra Energy Partners LP | 8,920,079 | ||||||
| 140,035 | NRG Energy, Inc. | 5,545,386 | ||||||
| 317,351 | Vistra Energy Corp. | 8,482,792 | ||||||
|
| |||||||
| 22,948,257 | ||||||||
|
| |||||||
| Industrial Conglomerates –0.7% |
| |||||||
| 162,759 | Raven Industries, Inc. | 5,445,916 | ||||||
|
| |||||||
| Insurance –3.9% |
| |||||||
| 178,589 | Employers Holdings, Inc. | 7,782,908 | ||||||
See accompanying notes to financial statements.
| 30
Table of Contents
Portfolio of Investments – as of September 30, 2019
Loomis Sayles Small Cap Value Fund – continued
| Shares | Description | Value (†) | ||||||
| Common Stocks – continued | ||||||||
| Insurance – continued |
| |||||||
| 122,468 | First American Financial Corp. | $ | 7,226,837 | |||||
| 133,106 | ProAssurance Corp. | 5,360,179 | ||||||
| 51,406 | Reinsurance Group of America, Inc. | 8,218,791 | ||||||
|
| |||||||
| 28,588,715 | ||||||||
|
| |||||||
| Internet & Direct Marketing Retail –0.4% |
| |||||||
| 287,102 | Qurate Retail, Inc., Class A(a) | 2,961,457 | ||||||
|
| |||||||
| IT Services –5.1% |
| |||||||
| 376,418 | Conduent, Inc.(a) | 2,341,320 | ||||||
| 115,704 | CSG Systems International, Inc. | 5,979,583 | ||||||
| 49,840 | Euronet Worldwide, Inc.(a) | 7,291,592 | ||||||
| 204,987 | Genpact Ltd. | 7,943,246 | ||||||
| 224,297 | Perspecta, Inc. | 5,858,638 | ||||||
| 37,706 | WEX, Inc.(a) | 7,619,251 | ||||||
|
| |||||||
| 37,033,630 | ||||||||
|
| |||||||
| Leisure Products –0.6% |
| |||||||
| 77,944 | Brunswick Corp. | 4,062,441 | ||||||
|
| |||||||
| Machinery –4.2% |
| |||||||
| 55,864 | Alamo Group, Inc. | 6,576,310 | ||||||
| 67,500 | Altra Industrial Motion Corp. | 1,869,413 | ||||||
| 157,864 | Columbus McKinnon Corp. | 5,750,986 | ||||||
| 357,465 | Harsco Corp.(a) | 6,777,536 | ||||||
| 34,564 | John Bean Technologies Corp. | 3,436,699 | ||||||
| 69,131 | Kadant, Inc. | 6,069,010 | ||||||
|
| |||||||
| 30,479,954 | ||||||||
|
| |||||||
| Marine –0.4% |
| |||||||
| 35,137 | Kirby Corp.(a) | 2,886,856 | ||||||
|
| |||||||
| Media –1.3% |
| |||||||
| 374,795 | Gray Television, Inc.(a) | 6,116,654 | ||||||
| 78,466 | John Wiley & Sons, Inc., Class A | 3,447,796 | ||||||
|
| |||||||
| 9,564,450 | ||||||||
|
| |||||||
| Metals & Mining –0.4% |
| |||||||
| 507,316 | Ferroglobe R&W Trust(a)(b)(c)(d) | — | ||||||
| 81,689 | Haynes International, Inc. | 2,927,734 | ||||||
|
| |||||||
| 2,927,734 | ||||||||
|
| |||||||
| Multi-Utilities –2.1% |
| |||||||
| 245,544 | MDU Resources Group, Inc. | 6,921,885 | ||||||
| 108,521 | NorthWestern Corp. | 8,144,501 | ||||||
|
| |||||||
| 15,066,386 | ||||||||
|
| |||||||
See accompanying notes to financial statements.
31 |
Table of Contents
Portfolio of Investments – as of September 30, 2019
Loomis Sayles Small Cap Value Fund – continued
| Shares | Description | Value (†) | ||||||
| Common Stocks – continued | ||||||||
| Oil, Gas & Consumable Fuels –1.5% |
| |||||||
| 35,050 | Arch Coal, Inc., Class A | $ | 2,600,710 | |||||
| 565,046 | SRC Energy, Inc.(a) | 2,633,114 | ||||||
| 192,547 | Viper Energy Partners LP | 5,327,776 | ||||||
|
| |||||||
| 10,561,600 | ||||||||
|
| |||||||
| Personal Products –0.5% |
| |||||||
| 35,613 | Medifast, Inc. | 3,690,575 | ||||||
|
| |||||||
| Pharmaceuticals –1.4% |
| |||||||
| 124,259 | Catalent, Inc.(a) | 5,922,184 | ||||||
| 143,865 | Supernus Pharmaceuticals, Inc.(a) | 3,953,410 | ||||||
|
| |||||||
| 9,875,594 | ||||||||
|
| |||||||
| Professional Services –2.8% |
| |||||||
| 92,412 | ASGN, Inc.(a) | 5,809,018 | ||||||
| 241,312 | Clarivate Analytics PLC(a) | 4,070,933 | ||||||
| 61,988 | Insperity, Inc. | 6,113,257 | ||||||
| 111,257 | Korn Ferry | 4,298,971 | ||||||
|
| |||||||
| 20,292,179 | ||||||||
|
| |||||||
| REITs – Apartments –0.8% |
| |||||||
| 119,160 | American Campus Communities, Inc. | 5,729,213 | ||||||
|
| |||||||
| REITs – Diversified –0.6% |
| |||||||
| 160,546 | Outfront Media, Inc. | 4,459,968 | ||||||
|
| |||||||
| REITs – Hotels –0.8% |
| |||||||
| 71,375 | Ryman Hospitality Properties, Inc. | 5,839,189 | ||||||
|
| |||||||
| REITs – Office Property –0.9% |
| |||||||
| 160,908 | JBG SMITH Properties | 6,309,203 | ||||||
|
| |||||||
| REITs – Shopping Centers –0.8% |
| |||||||
| 314,399 | Retail Opportunity Investments Corp. | 5,731,494 | ||||||
|
| |||||||
| REITs – Single Tenant –1.5% |
| |||||||
| 274,618 | Essential Properties Realty Trust, Inc. | 6,291,498 | ||||||
| 85,107 | National Retail Properties, Inc. | 4,800,035 | ||||||
|
| |||||||
| 11,091,533 | ||||||||
|
| |||||||
| REITs – Storage –0.9% |
| |||||||
| 182,971 | CubeSmart | 6,385,688 | ||||||
|
| |||||||
| REITs – Warehouse/Industrials –2.9% |
| |||||||
| 184,388 | Americold Realty Trust | 6,835,263 | ||||||
| 87,780 | CyrusOne, Inc. | 6,943,398 | ||||||
| 173,265 | Rexford Industrial Realty, Inc. | 7,627,125 | ||||||
|
| |||||||
| 21,405,786 | ||||||||
|
| |||||||
See accompanying notes to financial statements.
| 32
Table of Contents
Portfolio of Investments – as of September 30, 2019
Loomis Sayles Small Cap Value Fund – continued
| Shares | Description | Value (†) | ||||||
| Common Stocks – continued | ||||||||
| Road & Rail –1.2% |
| |||||||
| 39,114 | Genesee & Wyoming, Inc., Class A(a) | $ | 4,322,488 | |||||
| 24,283 | Old Dominion Freight Line, Inc. | 4,127,382 | ||||||
|
| |||||||
| 8,449,870 | ||||||||
|
| |||||||
| Semiconductors & Semiconductor Equipment –2.1% |
| |||||||
| 97,629 | Advanced Energy Industries, Inc.(a) | 5,604,881 | ||||||
| 39,706 | Mellanox Technologies Ltd.(a) | 4,351,381 | ||||||
| 167,797 | Tower Semiconductor Ltd.(a) | 3,228,414 | ||||||
| 35,140 | Versum Materials, Inc. | 1,859,960 | ||||||
|
| |||||||
| 15,044,636 | ||||||||
|
| |||||||
| Software –1.5% |
| |||||||
| 123,311 | ACI Worldwide, Inc.(a) | 3,862,717 | ||||||
| 42,553 | LogMeIn, Inc. | 3,019,561 | ||||||
| 95,772 | Verint Systems, Inc.(a) | 4,097,126 | ||||||
|
| |||||||
| 10,979,404 | ||||||||
|
| |||||||
| Specialty Retail –1.7% |
| |||||||
| 106,551 | Aaron’s, Inc. | 6,846,967 | ||||||
| 189,878 | Urban Outfitters, Inc.(a) | 5,333,673 | ||||||
|
| |||||||
| 12,180,640 | ||||||||
|
| |||||||
| Thrifts & Mortgage Finance –2.0% |
| |||||||
| 51,558 | Federal Agricultural Mortgage Corp., Class C | 4,210,226 | ||||||
| 152,408 | Meta Financial Group, Inc. | 4,970,025 | ||||||
| 214,056 | OceanFirst Financial Corp. | 5,051,722 | ||||||
|
| |||||||
| 14,231,973 | ||||||||
|
| |||||||
| Total Common Stocks (Identified Cost $511,675,605) | 716,158,683 | |||||||
|
| |||||||
| | Principal Amount | |||||||
| Short-Term Investments –1.0% | ||||||||
| $ | 7,065,933 | Tri-Party Repurchase Agreement with Fixed Income Clearing Corporation, dated 9/30/2019 at 1.100% to be repurchased at $7,066,149 on 10/01/2019 collateralized by $6,755,000 U.S. Treasury Note, 2.625% due 12/31/2025 valued at $7,207,524 including accrued interest (Note 2 of Notes to Financial Statements) (Identified Cost $7,065,933) | 7,065,933 | |||||
|
| |||||||
| Total Investments –100.0% (Identified Cost $518,741,538) | 723,224,616 | |||||||
Other assets less liabilities—(0.0)% | (252,118 | ) | ||||||
|
| |||||||
| Net Assets –100.0% | $ | 722,972,498 | ||||||
|
| |||||||
See accompanying notes to financial statements.
33 |
Table of Contents
Portfolio of Investments – as of September 30, 2019
Loomis Sayles Small Cap Value Fund – continued
| (†) | See Note 2 of Notes to Financial Statements. | |||||
| (a) | Non-income producing security. | |||||
| (b) | Security subject to restrictions on resale. This security was acquired on November 29, 2016 at a cost of $0. At September 30, 2019, the value of this security amounted to $0. | |||||
| (c) | Illiquid security. (Unaudited) | |||||
| (d) | Security classified as fair valued pursuant to the Fund’s pricing policies and procedures. At September 30, 2019, the value of this security amounted to $0. See Note 2 of Notes to Financial Statements. | |||||
| REITs | Real Estate Investment Trusts | |||||
Industry Summary at September30, 2019
Banks | 15.0 | % | ||
IT Services | 5.1 | |||
Commercial Services & Supplies | 4.4 | |||
Machinery | 4.2 | |||
Insurance | 3.9 | |||
Food Products | 3.6 | |||
Independent Power & Renewable Electricity Producers | 3.2 | |||
Chemicals | 3.1 | |||
REITs – Warehouse/Industrials | 2.9 | |||
Hotels, Restaurants & Leisure | 2.8 | |||
Professional Services | 2.8 | |||
Electronic Equipment, Instruments & Components | 2.8 | |||
Multi-Utilities | 2.1 | |||
Semiconductors & Semiconductor Equipment | 2.1 | |||
Health Care Equipment & Supplies | 2.0 | |||
Thrifts & Mortgage Finance | 2.0 | |||
Other Investments, less than 2% each | 37.0 | |||
Short-Term Investments | 1.0 | |||
|
| |||
Total Investments | 100.0 | |||
Other assets less liabilities | (0.0 | ) | ||
|
| |||
Net Assets | 100.0 | % | ||
|
|
See accompanying notes to financial statements.
| 34
Table of Contents
Portfolio of Investments – as of September 30, 2019
Loomis Sayles Small/Mid Cap Growth Fund
| Shares | Description | Value (†) | ||||||
| Common Stocks –89.1% of Net Assets | ||||||||
| Aerospace & Defense –3.0% |
| |||||||
| 4,107 | HEICO Corp. | $ | 512,882 | |||||
| 6,313 | Hexcel Corp. | 518,487 | ||||||
|
| |||||||
| 1,031,369 | ||||||||
|
| |||||||
| Banks –1.1% |
| |||||||
| 8,551 | Western Alliance Bancorp | 394,030 | ||||||
|
| |||||||
| Biotechnology –3.3% |
| |||||||
| 1,938 | Argenx SE, ADR(a) | 220,855 | ||||||
| 2,826 | Ascendis Pharma AS, ADR(a) | 272,200 | ||||||
| 3,554 | Blueprint Medicines Corp.(a) | 261,112 | ||||||
| 4,152 | Neurocrine Biosciences, Inc.(a) | 374,137 | ||||||
|
| |||||||
| 1,128,304 | ||||||||
|
| |||||||
| Capital Markets –3.6% |
| |||||||
| 15,962 | Ares Management Corp., Class A | 427,941 | ||||||
| 1,237 | MarketAxess Holdings, Inc. | 405,118 | ||||||
| 2,695 | Morningstar, Inc. | 393,847 | ||||||
|
| |||||||
| 1,226,906 | ||||||||
|
| |||||||
| Commercial Services & Supplies –1.4% |
| |||||||
| 11,984 | Ritchie Bros. Auctioneers, Inc. | 478,162 | ||||||
|
| |||||||
| Communications Equipment –1.3% |
| |||||||
| 11,391 | Ciena Corp.(a) | 446,869 | ||||||
|
| |||||||
| Distributors –1.4% |
| |||||||
| 2,308 | POOL CORP. | 465,524 | ||||||
|
| |||||||
| Diversified Consumer Services –4.2% |
| |||||||
| 3,685 | Bright Horizons Family Solutions, Inc.(a) | 561,962 | ||||||
| 4,925 | Grand Canyon Education, Inc.(a) | 483,635 | ||||||
| 24,873 | Laureate Education, Inc., Class A(a) | 412,270 | ||||||
|
| |||||||
| 1,457,867 | ||||||||
|
| |||||||
| Diversified Telecommunication Services –1.1% |
| |||||||
| 7,051 | Cogent Communications Holdings, Inc. | 388,510 | ||||||
|
| |||||||
| Electrical Equipment –2.6% |
| |||||||
| 2,479 | Acuity Brands, Inc. | 334,144 | ||||||
| 6,961 | Generac Holdings, Inc.(a) | 545,325 | ||||||
|
| |||||||
| 879,469 | ||||||||
|
| |||||||
| Electronic Equipment, Instruments & Components –2.5% |
| |||||||
| 8,104 | FLIR Systems, Inc. | 426,189 | ||||||
| 10,712 | Trimble, Inc.(a) | 415,733 | ||||||
|
| |||||||
| 841,922 | ||||||||
|
| |||||||
See accompanying notes to financial statements.
35 |
Table of Contents
Portfolio of Investments – as of September30, 2019
Loomis Sayles Small/Mid Cap Growth Fund – continued
| Shares | Description | Value (†) | ||||||
| Common Stocks – continued | ||||||||
| Energy Equipment & Services –0.8% |
| |||||||
| 9,363 | Cactus, Inc., Class A(a) | $ | 270,965 | |||||
|
| |||||||
| Entertainment –1.7% |
| |||||||
| 9,036 | Live Nation Entertainment, Inc.(a) | 599,448 | ||||||
|
| |||||||
| Food & Staples Retailing –2.0% |
| |||||||
| 2,641 | Casey’s General Stores, Inc. | 425,624 | ||||||
| 13,951 | Sprouts Farmers Market, Inc.(a) | 269,812 | ||||||
|
| |||||||
| 695,436 | ||||||||
|
| |||||||
| Food Products –2.4% |
| |||||||
| 8,733 | Freshpet, Inc.(a) | 434,641 | ||||||
| 19,623 | Nomad Foods Ltd.(a) | 402,272 | ||||||
|
| |||||||
| 836,913 | ||||||||
|
| |||||||
| Health Care Equipment & Supplies –4.9% |
| |||||||
| 6,340 | Globus Medical, Inc., Class A(a) | 324,101 | ||||||
| 4,236 | Insulet Corp.(a) | 698,643 | ||||||
| 1,616 | Penumbra, Inc.(a) | 217,336 | ||||||
| 3,129 | West Pharmaceutical Services, Inc. | 443,755 | ||||||
|
| |||||||
| 1,683,835 | ||||||||
|
| |||||||
| Health Care Providers & Services –2.0% |
| |||||||
| 3,988 | LHC Group, Inc.(a) | 452,877 | ||||||
| 918 | WellCare Health Plans, Inc.(a) | 237,918 | ||||||
|
| |||||||
| 690,795 | ||||||||
|
| |||||||
| Health Care Technology –1.4% |
| |||||||
| 6,578 | HMS Holdings Corp.(a) | 226,711 | ||||||
| 2,960 | Medidata Solutions, Inc.(a) | 270,840 | ||||||
|
| |||||||
| 497,551 | ||||||||
|
| |||||||
| Hotels, Restaurants & Leisure –3.2% |
| |||||||
| 6,168 | Planet Fitness, Inc., Class A(a) | 356,942 | ||||||
| 6,444 | Texas Roadhouse, Inc. | 338,439 | ||||||
| 1,717 | Vail Resorts, Inc. | 390,721 | ||||||
|
| |||||||
| 1,086,102 | ||||||||
|
| |||||||
| Insurance –2.1% |
| |||||||
| 5,023 | Kemper Corp. | 391,543 | ||||||
| 3,159 | Kinsale Capital Group, Inc. | 326,356 | ||||||
|
| |||||||
| 717,899 | ||||||||
|
| |||||||
| IT Services –8.6% |
| |||||||
| 8,011 | Black Knight, Inc.(a) | 489,152 | ||||||
| 7,122 | Booz Allen Hamilton Holding Corp. | 505,804 | ||||||
| 3,789 | Broadridge Financial Solutions, Inc. | 471,465 | ||||||
See accompanying notes to financial statements.
| 36
Table of Contents
Portfolio of Investments – as of September30, 2019
Loomis Sayles Small/Mid Cap Growth Fund – continued
| Shares | Description | Value (†) | ||||||
| Common Stocks – continued | ||||||||
| IT Services – continued |
| |||||||
| 3,284 | EPAM Systems, Inc.(a) | $ | 598,739 | |||||
| 13,730 | Evo Payments, Inc., Class A(a) | 386,088 | ||||||
| 2,453 | WEX, Inc.(a) | 495,678 | ||||||
|
| |||||||
| 2,946,926 | ||||||||
|
| |||||||
| Life Sciences Tools & Services –3.4% |
| |||||||
| 1,824 | Charles River Laboratories International, Inc.(a) | 241,443 | ||||||
| 3,399 | ICON PLC(a) | 500,809 | ||||||
| 4,131 | PRA Health Sciences, Inc.(a) | 409,919 | ||||||
|
| |||||||
| 1,152,171 | ||||||||
|
| |||||||
| Machinery –4.8% |
| |||||||
| 5,190 | Albany International Corp., Class A | 467,930 | ||||||
| 14,330 | Gardner Denver Holdings, Inc.(a) | 405,396 | ||||||
| 6,983 | Helios Technologies, Inc. | 283,300 | ||||||
| 1,730 | WABCO Holdings, Inc.(a) | 231,388 | ||||||
| 2,258 | Woodward, Inc. | 243,480 | ||||||
|
| |||||||
| 1,631,494 | ||||||||
|
| |||||||
| Oil, Gas & Consumable Fuels –0.7% |
| |||||||
| 2,605 | Diamondback Energy, Inc. | 234,215 | ||||||
|
| |||||||
| Pharmaceuticals –1.8% |
| |||||||
| 6,406 | Catalent, Inc.(a) | 305,310 | ||||||
| 10,986 | Horizon Therapeutics PLC(a) | 299,149 | ||||||
|
| |||||||
| 604,459 | ||||||||
|
| |||||||
| Professional Services –2.5% |
| |||||||
| 5,991 | TransUnion | 485,930 | ||||||
| 6,195 | TriNet Group, Inc.(a) | 385,267 | ||||||
|
| |||||||
| 871,197 | ||||||||
|
| |||||||
| Semiconductors & Semiconductor Equipment –5.4% |
| |||||||
| 5,954 | Advanced Energy Industries, Inc.(a) | 341,819 | ||||||
| 3,415 | MKS Instruments, Inc. | 315,136 | ||||||
| 2,300 | Monolithic Power Systems, Inc. | 357,949 | ||||||
| 7,036 | Semtech Corp.(a) | 342,020 | ||||||
| 4,312 | Silicon Laboratories, Inc.(a) | 480,141 | ||||||
|
| |||||||
| 1,837,065 | ||||||||
|
| |||||||
| Software –9.3% |
| |||||||
| 4,167 | Everbridge, Inc.(a) | 257,146 | ||||||
| 5,318 | Guidewire Software, Inc.(a) | 560,411 | ||||||
| 3,107 | HubSpot, Inc.(a) | 471,052 | ||||||
| 5,360 | j2 Global, Inc. | 486,795 | ||||||
| 5,121 | Paylocity Holding Corp.(a) | 499,707 | ||||||
| 3,868 | Pegasystems, Inc. | 263,217 | ||||||
See accompanying notes to financial statements.
37 |
Table of Contents
Portfolio of Investments – as of September30, 2019
Loomis Sayles Small/Mid Cap Growth Fund – continued
| Shares | Description | Value (†) | ||||||
| Common Stocks – continued | ||||||||
| Software – continued |
| |||||||
| 1,068 | Tyler Technologies, Inc.(a) | $ | 280,350 | |||||
| 4,993 | Zendesk, Inc.(a) | 363,890 | ||||||
|
| |||||||
| 3,182,568 | ||||||||
|
| |||||||
| Specialty Retail –2.3% |
| |||||||
| 6,547 | Aaron’s, Inc. | 420,710 | ||||||
| 2,968 | Five Below, Inc.(a) | 374,265 | ||||||
|
| |||||||
| 794,975 | ||||||||
|
| |||||||
| Textiles, Apparel & Luxury Goods –2.1% |
| |||||||
| 2,764 | Carter’s, Inc. | 252,104 | ||||||
| 4,296 | Columbia Sportswear Co. | 416,240 | ||||||
| 2,710 | Under Armour, Inc., Class A(a) | 54,037 | ||||||
|
| |||||||
| 722,381 | ||||||||
|
| |||||||
| Thrifts & Mortgage Finance –1.0% |
| |||||||
| 7,247 | Essent Group Ltd. | 345,464 | ||||||
|
| |||||||
| Trading Companies & Distributors –1.2% |
| |||||||
| 5,778 | SiteOne Landscape Supply, Inc.(a) | 427,688 | ||||||
|
| |||||||
| Total Common Stocks (Identified Cost $28,230,728) | 30,568,479 | |||||||
|
| |||||||
| | Principal Amount | |||||||
| Short-Term Investments –3.6% | ||||||||
| $ | 1,255,709 | Tri-Party Repurchase Agreement with Fixed Income Clearing Corporation, dated 9/30/2019 at 1.100% to be repurchased at $1,255,747 on 10/01/2019 collateralized by $1,205,000 U.S. Treasury Note, 2.625% due 1/31/2026 valued at $1,283,779 including accrued interest (Note 2 of Notes to Financial Statements) (Identified Cost $1,255,709) | 1,255,709 | |||||
|
| |||||||
| Total Investments –92.7% (Identified Cost $29,486,437) | 31,824,188 | |||||||
Other assets less liabilities—7.3% | 2,487,780 | |||||||
|
| |||||||
| Net Assets –100.0% | $ | 34,311,968 | ||||||
|
| |||||||
| (†) | See Note 2 of Notes to Financial Statements. |
| ||||||
| (a) | Non-income producing security. |
| ||||||
| ADR | An American Depositary Receipt is a certificate issued by a custodian bank representing the right to receive securities of the foreign issuer described. The values of ADRs may be significantly influenced by trading on exchanges not located in the United States. |
| ||||||
See accompanying notes to financial statements.
| 38
Table of Contents
Portfolio of Investments – as of September30, 2019
Loomis Sayles Small/Mid Cap Growth Fund – continued
Industry Summary at September 30, 2019
Software | 9.3 | % | ||
IT Services | 8.6 | |||
Semiconductors & Semiconductor Equipment | 5.4 | |||
Health Care Equipment & Supplies | 4.9 | |||
Machinery | 4.8 | |||
Diversified Consumer Services | 4.2 | |||
Capital Markets | 3.6 | |||
Life Sciences Tools & Services | 3.4 | |||
Biotechnology | 3.3 | |||
Hotels, Restaurants & Leisure | 3.2 | |||
Aerospace & Defense | 3.0 | |||
Electrical Equipment | 2.6 | |||
Professional Services | 2.5 | |||
Electronic Equipment, Instruments & Components | 2.5 | |||
Food Products | 2.4 | |||
Specialty Retail | 2.3 | |||
Textiles, Apparel & Luxury Goods | 2.1 | |||
Insurance | 2.1 | |||
Food & Staples Retailing | 2.0 | |||
Health Care Providers & Services | 2.0 | |||
Other Investments, less than 2% each | 14.9 | |||
Short-Term Investments | 3.6 | |||
|
| |||
Total Investments | 92.7 | |||
Other assets less liabilities | 7.3 | |||
|
| |||
Net Assets | 100.0 | % | ||
|
|
See accompanying notes to financial statements.
39 |
Table of Contents
Statements of Assets and Liabilities
September 30, 2019
| Small Cap Growth Fund | Small Cap Value Fund | Small/Mid Cap Growth Fund | ||||||||||
ASSETS |
| |||||||||||
Investments at cost | $ | 1,367,665,224 | $ | 518,741,538 | $ | 29,486,437 | ||||||
Net unrealized appreciation | 273,142,993 | 204,483,078 | 2,337,751 | |||||||||
|
|
|
|
|
| |||||||
Investments at value | 1,640,808,217 | 723,224,616 | 31,824,188 | |||||||||
Cash | — | 21 | — | |||||||||
Receivable for Fund shares sold | 3,854,047 | 733,146 | 2,650,150 | |||||||||
Receivable for securities sold | 16,226,878 | 1,184,781 | 499,418 | |||||||||
Dividends and interest receivable | 280,448 | 771,685 | 3,543 | |||||||||
Prepaid expenses (Note 7) | 117 | 64 | 2 | |||||||||
|
|
|
|
|
| |||||||
TOTAL ASSETS | 1,661,169,707 | 725,914,313 | 34,977,301 | |||||||||
|
|
|
|
|
| |||||||
LIABILITIES |
| |||||||||||
Payable for securities purchased | 24,440,223 | 1,135,768 | 547,215 | |||||||||
Payable for Fund shares redeemed | 1,139,557 | 1,001,424 | 22,414 | |||||||||
Management fees payable (Note 5) | 1,033,060 | 440,042 | 15,288 | |||||||||
Deferred Trustees’ fees (Note 5) | 197,406 | 236,970 | 25,174 | |||||||||
Administrative fees payable (Note 5) | 60,030 | 26,246 | 1,161 | |||||||||
Payable to distributor (Note 5d) | 15,155 | 6,383 | 9 | |||||||||
Other accounts payable and accrued expenses | 120,122 | 94,982 | 54,072 | |||||||||
|
|
|
|
|
| |||||||
TOTAL LIABILITIES | 27,005,553 | 2,941,815 | 665,333 | |||||||||
|
|
|
|
|
| |||||||
NET ASSETS | $ | 1,634,164,154 | $ | 722,972,498 | $ | 34,311,968 | ||||||
|
|
|
|
|
| |||||||
NET ASSETS CONSIST OF: |
| |||||||||||
Paid-in capital | $ | 1,222,672,893 | $ | 466,918,155 | $ | 31,416,440 | ||||||
Accumulated earnings | 411,491,261 | 256,054,343 | 2,895,528 | |||||||||
|
|
|
|
|
| |||||||
NET ASSETS | $ | 1,634,164,154 | $ | 722,972,498 | $ | 34,311,968 | ||||||
|
|
|
|
|
| |||||||
COMPUTATION OF NET ASSET VALUE AND OFFERING PRICE: | ||||||||||||
Institutional Class: |
| |||||||||||
Net assets | $ | 908,615,572 | $ | 433,360,358 | $ | 34,311,968 | ||||||
|
|
|
|
|
| |||||||
Shares of beneficial interest | 34,548,404 | 15,119,422 | 3,422,035 | |||||||||
|
|
|
|
|
| |||||||
Net asset value, offering and redemption price per share | $ | 26.30 | $ | 28.66 | $ | 10.03 | ||||||
|
|
|
|
|
| |||||||
Retail Class: |
| |||||||||||
Net assets | $ | 95,634,525 | $ | 134,434,310 | $ | — | ||||||
|
|
|
|
|
| |||||||
Shares of beneficial interest | 3,993,192 | 4,783,042 | — | |||||||||
|
|
|
|
|
| |||||||
Net asset value, offering and redemption price per share | $ | 23.95 | $ | 28.11 | $ | — | ||||||
|
|
|
|
|
| |||||||
Admin Class shares: |
| |||||||||||
Net assets | $ | — | $ | 13,356,614 | $ | — | ||||||
|
|
|
|
|
| |||||||
Shares of beneficial interest | — | 500,586 | — | |||||||||
|
|
|
|
|
| |||||||
Net asset value, offering and redemption price per share | $ | — | $ | 26.68 | $ | — | ||||||
|
|
|
|
|
| |||||||
Class N shares: |
| |||||||||||
Net assets | $ | 629,914,057 | $ | 141,821,216 | $ | — | ||||||
|
|
|
|
|
| |||||||
Shares of beneficial interest | 23,745,799 | 4,944,207 | — | |||||||||
|
|
|
|
|
| |||||||
Net asset value, offering and redemption price per share | $ | 26.53 | $ | 28.68 | $ | — | ||||||
|
|
|
|
|
| |||||||
See accompanying notes to financial statements.
| 40
Table of Contents
Statements of Operations
For the Year Ended September 30, 2019
| Small Cap Growth Fund | Small Cap Value Fund | Small/Mid Cap Growth Fund | ||||||||||
INVESTMENT INCOME |
| |||||||||||
Dividends | $ | 4,070,821 | $ | 9,917,219 | $ | 104,043 | ||||||
Interest | 922,045 | 163,867 | 12,865 | |||||||||
Less net foreign taxes withheld | — | (35,326 | ) | (998 | ) | |||||||
|
|
|
|
|
| |||||||
| 4,992,866 | 10,045,760 | 115,910 | ||||||||||
|
|
|
|
|
| |||||||
Expenses |
| |||||||||||
Management fees (Note 5) | 11,217,209 | 5,996,267 | 175,353 | |||||||||
Service and distribution fees (Note 5) | 269,104 | 475,016 | — | |||||||||
Administrative fees (Note 5) | 658,351 | 351,874 | 10,310 | |||||||||
Trustees’ fees and expenses (Note 5) | 63,099 | 42,520 | 16,461 | |||||||||
Transfer agent fees and expenses (Notes 5 and 6) | 1,209,125 | 655,051 | 2,908 | |||||||||
Audit and tax services fees | 39,427 | 40,130 | 39,697 | |||||||||
Custodian fees and expenses | 48,492 | 25,667 | 6,563 | |||||||||
Legal fees (Note 7) | 44,056 | 24,161 | 637 | |||||||||
Registration fees | 111,127 | 77,888 | 26,339 | |||||||||
Shareholder reporting expenses | 63,833 | 56,174 | 1,497 | |||||||||
Miscellaneous expenses (Note 7) | 70,796 | 45,910 | 23,580 | |||||||||
|
|
|
|
|
| |||||||
Total expenses | 13,794,619 | 7,790,658 | 303,345 | |||||||||
Less waiver and/or expense reimbursement (Note 5) | (11,103 | ) | (216,358 | ) | (104,533 | ) | ||||||
|
|
|
|
|
| |||||||
Net expenses | 13,783,516 | 7,574,300 | 198,812 | |||||||||
|
|
|
|
|
| |||||||
Net investment income (loss) | (8,790,650 | ) | 2,471,460 | (82,902 | ) | |||||||
|
|
|
|
|
| |||||||
NET REALIZED AND UNREALIZED GAIN (LOSS) ON INVESTMENTS | ||||||||||||
Net realized gain on: |
| |||||||||||
Investments | 155,991,266 | 55,538,968 | 707,633 | |||||||||
Net change in unrealized appreciation (depreciation) on: | ||||||||||||
Investments | (268,064,056 | ) | (109,251,529 | ) | (112,924 | ) | ||||||
|
|
|
|
|
| |||||||
Net realized and unrealized gain (loss) on investments | (112,072,790 | ) | (53,712,561 | ) | 594,709 | |||||||
|
|
|
|
|
| |||||||
NET INCREASE (DECREASE) IN NET ASSETS RESULTING FROM OPERATIONS | $ | (120,863,440 | ) | $ | (51,241,101 | ) | $ | 511,807 | ||||
|
|
|
|
|
| |||||||
See accompanying notes to financial statements.
41 |
Table of Contents
Statements of Changes in Net Assets
| Small Cap Growth Fund | Small Cap Value Fund | |||||||||||||||
| Year Ended September 30, 2019 | Year Ended September 30, 2018 | Year Ended September 30, 2019 | Year Ended September 30, 2018 | |||||||||||||
FROM OPERATIONS: | ||||||||||||||||
Net investment income (loss) | $ | (8,790,650 | ) | $ | (7,529,984 | ) | $ | 2,471,460 | $ | 2,080,621 | ||||||
Net realized gain on investments | 155,991,266 | 143,506,294 | 55,538,968 | 118,702,551 | ||||||||||||
Net change in unrealized appreciation (depreciation) on investments | (268,064,056 | ) | 216,618,091 | (109,251,529 | ) | (58,719,669 | ) | |||||||||
|
|
|
|
|
|
|
| |||||||||
Net increase (decrease) in net assets resulting from operations | (120,863,440 | ) | 352,594,401 | (51,241,101 | ) | 62,063,503 | ||||||||||
|
|
|
|
|
|
|
| |||||||||
FROM DISTRIBUTIONS TO SHAREHOLDERS: | ||||||||||||||||
Institutional Class | (74,228,048 | ) | (93,157,470 | ) | (67,841,584 | ) | (73,726,264 | ) | ||||||||
Retail Class | (11,691,827 | ) | (13,096,336 | ) | (23,416,722 | ) | (27,201,028 | ) | ||||||||
Admin Class | — | — | (3,000,140 | ) | (3,453,473 | ) | ||||||||||
Class N | (45,465,070 | ) | (35,428,773 | ) | (18,276,952 | ) | (16,470,360 | ) | ||||||||
|
|
|
|
|
|
|
| |||||||||
Total distributions | (131,384,945 | ) | (141,682,579 | ) | (112,535,398 | ) | (120,851,125 | ) | ||||||||
|
|
|
|
|
|
|
| |||||||||
NET INCREASE (DECREASE) IN NET ASSETS FROM CAPITAL SHARE TRANSACTIONS (NOTE 9) | 305,348,898 | 159,153,016 | (86,935,502 | ) | (50,857,393 | ) | ||||||||||
|
|
|
|
|
|
|
| |||||||||
Net increase (decrease) in net assets | 53,100,513 | 370,064,838 | (250,712,001 | ) | (109,645,015 | ) | ||||||||||
NET ASSETS |
| |||||||||||||||
Beginning of the year | 1,581,063,641 | 1,210,998,803 | 973,684,499 | 1,083,329,514 | ||||||||||||
|
|
|
|
|
|
|
| |||||||||
End of the year | $ | 1,634,164,154 | $ | 1,581,063,641 | $ | 722,972,498 | $ | 973,684,499 | ||||||||
|
|
|
|
|
|
|
| |||||||||
See accompanying notes to financial statements.
| 42
Table of Contents
Statements of Changes in Net Assets – continued
| Small/Mid Cap Growth Fund | ||||||||
| Year Ended September 30, 2019 | Year Ended September 30, 2018 | |||||||
FROM OPERATIONS: |
| |||||||
Net investment loss | $ | (82,902 | ) | $ | (61,563 | ) | ||
Net realized gain on investments | 707,633 | 5,067,741 | ||||||
Net change in unrealized appreciation (depreciation) on investments | (112,924 | ) | (965,346 | ) | ||||
|
|
|
| |||||
Net increase in net assets resulting from operations | 511,807 | 4,040,832 | ||||||
|
|
|
| |||||
FROM DISTRIBUTIONS TO SHAREHOLDERS: |
| |||||||
Institutional Class | (4,717,064 | ) | — | |||||
|
|
|
| |||||
NET INCREASE (DECREASE) IN NET ASSETS FROM CAPITAL SHARE TRANSACTIONS (NOTE 9) | 21,017,023 | (1,132,819 | ) | |||||
|
|
|
| |||||
Net increase in net assets | 16,811,766 | 2,908,013 | ||||||
NET ASSETS |
| |||||||
Beginning of the year | 17,500,202 | 14,592,189 | ||||||
|
|
|
| |||||
End of the year | $ | 34,311,968 | $ | 17,500,202 | ||||
|
|
|
| |||||
See accompanying notes to financial statements.
43 |
Table of Contents
Financial Highlights
For a share outstanding throughout each period.
| Small Cap Growth Fund—Institutional Class | ||||||||||||||||||||||||
| Year Ended September 30, 2019 | Year Ended September 30, 2018 | Year Ended September 30, 2017 | Year Ended September 30, 2016 | Year Ended September 30, 2015 | ||||||||||||||||||||
Net asset value, beginning of the period | $ | 31.55 | $ | 27.37 | $ | 22.03 | $ | 22.22 | $ | 24.27 | ||||||||||||||
|
| |||||||||||||||||||||||
INCOME (LOSS) FROM INVESTMENT OPERATIONS: | ||||||||||||||||||||||||
Net investment loss(a) | (0.16 | ) | (0.16 | ) | (0.12 | ) | (0.09 | ) | (0.14 | ) | ||||||||||||||
Net realized and unrealized gain (loss) | (2.51 | ) | 7.54 | 5.46 | 1.59 | 1.63 | ||||||||||||||||||
|
| |||||||||||||||||||||||
Total from Investment Operations | (2.67 | ) | 7.38 | 5.34 | 1.50 | 1.49 | ||||||||||||||||||
|
| |||||||||||||||||||||||
LESS DISTRIBUTIONS FROM: | ||||||||||||||||||||||||
Net realized capital gains | (2.58 | ) | (3.20 | ) | — | (1.69 | ) | (3.54 | ) | |||||||||||||||
|
| |||||||||||||||||||||||
Net asset value, end of the period | $ | 26.30 | $ | 31.55 | $ | 27.37 | $ | 22.03 | $ | 22.22 | ||||||||||||||
|
| |||||||||||||||||||||||
Total return | (6.88 | )% | 29.77 | % | 24.24 | % | 6.92 | % | 5.78 | % | ||||||||||||||
RATIOS TO AVERAGE NET ASSETS: | ||||||||||||||||||||||||
Net assets, end of the period (000’s) | $ | 908,616 | $ | 926,914 | $ | 824,103 | $ | 812,383 | $ | 800,883 | ||||||||||||||
Net expenses | 0.95 | % | 0.94 | % | 0.95 | % | 0.95 | % | 0.94 | % | ||||||||||||||
Gross expenses | 0.95 | % | 0.94 | % | 0.95 | % | 0.95 | % | 0.94 | % | ||||||||||||||
Net investment loss | (0.62 | )% | (0.58 | )% | (0.49 | )% | (0.41 | )% | (0.57 | )% | ||||||||||||||
Portfolio turnover rate | 67 | % | 41 | % | 45 | % | 56 | % | 78 | % | ||||||||||||||
| (a) | Per share net investment loss has been calculated using the average shares outstanding during the period. |
See accompanying notes to financial statements.
| 44
Table of Contents
Financial Highlights – continued
For a share outstanding throughout each period.
| Small Cap Growth Fund—Retail Class | ||||||||||||||||||||||||
| Year Ended September 30, 2019 | Year Ended September 30, 2018 | Year Ended September 30, 2017 | Year Ended September 30, 2016 | Year Ended September 30, 2015 | ||||||||||||||||||||
Net asset value, beginning of the period | $ | 29.09 | $ | 25.53 | $ | 20.61 | $ | 20.93 | $ | 23.10 | ||||||||||||||
|
| |||||||||||||||||||||||
INCOME (LOSS) FROM INVESTMENT OPERATIONS: | ||||||||||||||||||||||||
Net investment loss(a) | (0.21 | ) | (0.22 | ) | (0.16 | ) | (0.13 | ) | (0.19 | ) | ||||||||||||||
Net realized and unrealized gain (loss) | (2.35 | ) | 6.98 | 5.08 | 1.50 | 1.56 | ||||||||||||||||||
|
| |||||||||||||||||||||||
Total from Investment Operations | (2.56 | ) | 6.76 | 4.92 | 1.37 | 1.37 | ||||||||||||||||||
|
| |||||||||||||||||||||||
LESS DISTRIBUTIONS FROM: | ||||||||||||||||||||||||
Net realized capital gains | (2.58 | ) | (3.20 | ) | — | (1.69 | ) | (3.54 | ) | |||||||||||||||
|
| |||||||||||||||||||||||
Net asset value, end of the period | $ | 23.95 | $ | 29.09 | $ | 25.53 | $ | 20.61 | $ | 20.93 | ||||||||||||||
|
| |||||||||||||||||||||||
Total return | (7.11 | )%(b) | 29.45 | % | 23.93 | % | 6.61 | % | 5.58 | % | ||||||||||||||
RATIOS TO AVERAGE NET ASSETS: | ||||||||||||||||||||||||
Net assets, end of the period (000’s) | $ | 95,635 | $ | 136,415 | $ | 107,387 | $ | 118,670 | $ | 162,906 | ||||||||||||||
Net expenses | 1.19 | %(c) | 1.19 | % | 1.20 | % | 1.20 | % | 1.19 | % | ||||||||||||||
Gross expenses | 1.20 | % | 1.19 | % | 1.20 | % | 1.20 | % | 1.19 | % | ||||||||||||||
Net investment loss | (0.86 | )% | (0.82 | )% | (0.73 | )% | (0.66 | )% | (0.82 | )% | ||||||||||||||
Portfolio turnover rate | 67 | % | 41 | % | 45 | % | 56 | % | 78 | % | ||||||||||||||
| (a) | Per share net investment loss has been calculated using the average shares outstanding during the period. |
| (b) | Had certain expenses not been waived/reimbursed during the period, total returns would have been lower. |
| (c) | The administrator agreed to waive its fees and/or reimburse a portion of the Fund’s expenses during the period. Without this waiver/reimbursement, expenses would have been higher. |
See accompanying notes to financial statements.
45 |
Table of Contents
Financial Highlights – continued
For a share outstanding throughout each period.
| Small Cap Growth Fund—Class N | ||||||||||||||||||||||||
| Year Ended September 30, 2019 | Year Ended September 30, 2018 | Year Ended September 30, 2017 | Year Ended September 30, 2016 | Year Ended September 30, 2015 | ||||||||||||||||||||
Net asset value, beginning of the period | $ | 31.76 | $ | 27.50 | $ | 22.11 | $ | 22.27 | $ | 24.29 | ||||||||||||||
|
| |||||||||||||||||||||||
INCOME (LOSS) FROM INVESTMENT OPERATIONS: | ||||||||||||||||||||||||
Net investment loss(a) | (0.13 | ) | (0.12 | ) | (0.09 | ) | (0.06 | ) | (0.12 | ) | ||||||||||||||
Net realized and unrealized gain (loss) | (2.52 | ) | 7.58 | 5.48 | 1.59 | 1.64 | ||||||||||||||||||
|
| |||||||||||||||||||||||
Total from Investment Operations | (2.65 | ) | 7.46 | 5.39 | 1.53 | 1.52 | ||||||||||||||||||
|
| |||||||||||||||||||||||
LESS DISTRIBUTIONS FROM: | ||||||||||||||||||||||||
Net realized capital gains | (2.58 | ) | (3.20 | ) | — | (1.69 | ) | (3.54 | ) | |||||||||||||||
|
| |||||||||||||||||||||||
Net asset value, end of the period | $ | 26.53 | $ | 31.76 | $ | 27.50 | $ | 22.11 | $ | 22.27 | ||||||||||||||
|
| |||||||||||||||||||||||
Total return | (6.76 | )% | 29.93 | % | 24.38 | % | 7.05 | % | 5.92 | % | ||||||||||||||
RATIOS TO AVERAGE NET ASSETS: | ||||||||||||||||||||||||
Net assets, end of the period (000’s) | $ | 629,914 | $ | 517,734 | $ | 279,508 | $ | 196,733 | $ | 162,591 | ||||||||||||||
Net expenses | 0.82 | % | 0.82 | % | 0.82 | % | 0.83 | % | 0.83 | % | ||||||||||||||
Gross expenses | 0.82 | % | 0.82 | % | 0.82 | % | 0.83 | % | 0.83 | % | ||||||||||||||
Net investment loss | (0.49 | )% | (0.43 | )% | (0.39 | )% | (0.29 | )% | (0.51 | )% | ||||||||||||||
Portfolio turnover rate | 67 | % | 41 | % | 45 | % | 56 | % | 78 | % | ||||||||||||||
| (a) | Per share net investment loss has been calculated using the average shares outstanding during the period. |
See accompanying notes to financial statements.
| 46
Table of Contents
Financial Highlights – continued
For a share outstanding throughout each period.
| Small Cap Value Fund—Institutional Class | ||||||||||||||||||||||||
| Year Ended September 30, 2019 | Year Ended September 30, 2018 | Year Ended September 30, 2017 | Year Ended September 30, 2016 | Year Ended September 30, 2015 | ||||||||||||||||||||
Net asset value, beginning of the period | $ | 35.27 | $ | 37.37 | $ | 33.78 | $ | 32.19 | $ | 36.40 | ||||||||||||||
|
| |||||||||||||||||||||||
INCOME (LOSS) FROM INVESTMENT OPERATIONS: | ||||||||||||||||||||||||
Net investment income(a) | 0.10 | 0.09 | 0.13 | 0.17 | 0.27 | |||||||||||||||||||
Net realized and unrealized gain (loss) | (2.49 | ) | 2.11 | 6.36 | 4.82 | 0.49 | ||||||||||||||||||
|
| |||||||||||||||||||||||
Total from Investment Operations | (2.39 | ) | 2.20 | 6.49 | 4.99 | 0.76 | ||||||||||||||||||
|
| |||||||||||||||||||||||
LESS DISTRIBUTIONS FROM: | ||||||||||||||||||||||||
Net investment income | (0.08 | ) | (0.05 | ) | (0.14 | ) | (0.22 | ) | (0.22 | ) | ||||||||||||||
Net realized capital gains | (4.14 | ) | (4.25 | ) | (2.76 | ) | (3.18 | ) | (4.75 | ) | ||||||||||||||
|
| |||||||||||||||||||||||
Total Distributions | (4.22 | ) | (4.30 | ) | (2.90 | ) | (3.40 | ) | (4.97 | ) | ||||||||||||||
|
| |||||||||||||||||||||||
Net asset value, end of the period | $ | 28.66 | $ | 35.27 | $ | 37.37 | $ | 33.78 | $ | 32.19 | ||||||||||||||
|
| |||||||||||||||||||||||
Total return(b) | (4.11 | )% | 6.21 | % | 19.68 | % | 16.75 | % | 1.20 | % | ||||||||||||||
RATIOS TO AVERAGE NET ASSETS: | ||||||||||||||||||||||||
Net assets, end of the period (000’s) | $ | 433,360 | $ | 587,198 | $ | 665,229 | $ | 654,501 | $ | 666,107 | ||||||||||||||
Net expenses(c) | 0.90 | % | 0.90 | % | 0.90 | % | 0.90 | % | 0.90 | % | ||||||||||||||
Gross expenses | 0.93 | % | 0.92 | % | 0.93 | % | 0.93 | % | 0.92 | % | ||||||||||||||
Net investment income | 0.36 | % | 0.26 | % | 0.37 | % | 0.52 | % | 0.75 | % | ||||||||||||||
Portfolio turnover rate | 24 | % | 19 | % | 25 | % | 22 | % | 22 | % | ||||||||||||||
| (a) | Per share net investment income has been calculated using the average shares outstanding during the period. |
| (b) | Had certain expenses not been waived/reimbursed during the period, total returns would have been lower. |
| (c) | The investment adviser agreed to waive its fees and/or reimburse a portion of the Fund’s expenses during the period. Without this waiver/reimbursement, expenses would have been higher. |
See accompanying notes to financial statements.
47 |
Table of Contents
Financial Highlights – continued
For a share outstanding throughout each period.
| Small Cap Value Fund—Retail Class | ||||||||||||||||||||||||
| Year Ended September 30, 2019 | Year Ended September 30, 2018 | Year Ended September 30, 2017 | Year Ended September 30, 2016 | Year Ended September 30, 2015 | ||||||||||||||||||||
Net asset value, beginning of the period | $ | 34.66 | $ | 36.83 | $ | 33.33 | $ | 31.78 | $ | 35.98 | ||||||||||||||
|
| |||||||||||||||||||||||
INCOME (LOSS) FROM INVESTMENT OPERATIONS: | ||||||||||||||||||||||||
Net investment income(a) | 0.03 | 0.00 | (b) | 0.04 | 0.08 | 0.18 | ||||||||||||||||||
Net realized and unrealized gain (loss) | (2.44 | ) | 2.08 | 6.27 | 4.77 | 0.48 | ||||||||||||||||||
|
| |||||||||||||||||||||||
Total from Investment Operations | (2.41 | ) | 2.08 | 6.31 | 4.85 | 0.66 | ||||||||||||||||||
|
| |||||||||||||||||||||||
LESS DISTRIBUTIONS FROM: | ||||||||||||||||||||||||
Net investment income | — | — | (0.05 | ) | (0.12 | ) | (0.11 | ) | ||||||||||||||||
Net realized capital gains | (4.14 | ) | (4.25 | ) | (2.76 | ) | (3.18 | ) | (4.75 | ) | ||||||||||||||
|
| |||||||||||||||||||||||
Total Distributions | (4.14 | ) | (4.25 | ) | (2.81 | ) | (3.30 | ) | (4.86 | ) | ||||||||||||||
|
| |||||||||||||||||||||||
Net asset value, end of the period | $ | 28.11 | $ | 34.66 | $ | 36.83 | $ | 33.33 | $ | 31.78 | ||||||||||||||
|
| |||||||||||||||||||||||
Total return(c) | (4.33 | )% | 5.95 | % | 19.38 | % | 16.47 | % | 0.94 | % | ||||||||||||||
RATIOS TO AVERAGE NET ASSETS: | ||||||||||||||||||||||||
Net assets, end of the period (000’s) | $ | 134,434 | $ | 208,310 | $ | 251,405 | $ | 267,936 | $ | 306,360 | ||||||||||||||
Net expenses(d) | 1.15 | % | 1.15 | % | 1.15 | % | 1.15 | % | 1.15 | % | ||||||||||||||
Gross expenses | 1.18 | % | 1.17 | % | 1.18 | % | 1.18 | % | 1.17 | % | ||||||||||||||
Net investment income | 0.10 | % | 0.01 | % | 0.12 | % | 0.27 | % | 0.50 | % | ||||||||||||||
Portfolio turnover rate | 24 | % | 19 | % | 25 | % | 22 | % | 22 | % | ||||||||||||||
| (a) | Per share net investment income has been calculated using the average shares outstanding during the period. |
| (b) | Amount rounds to less than $0.01 per share. |
| (c) | Had certain expenses not been waived/reimbursed during the period, total returns would have been lower. |
| (d) | The investment adviser agreed to waive its fees and/or reimburse a portion of the Fund’s expenses during the period. Without this waiver/reimbursement, expenses would have been higher. |
See accompanying notes to financial statements.
| 48
Table of Contents
Financial Highlights – continued
For a share outstanding throughout each period.
| Small Cap Value Fund—Admin Class | ||||||||||||||||||||||||
| Year Ended September 30, 2019 | Year Ended September 30, 2018 | Year Ended September 30, 2017 | Year Ended September 30, 2016 | Year Ended September 30, 2015 | ||||||||||||||||||||
Net asset value, beginning of the period | $ | 33.25 | $ | 35.58 | $ | 32.31 | $ | 30.88 | $ | 35.06 | ||||||||||||||
|
| |||||||||||||||||||||||
INCOME (LOSS) FROM INVESTMENT OPERATIONS: | ||||||||||||||||||||||||
Net investment income (loss)(a) | (0.04 | ) | (0.08 | ) | (0.04 | ) | 0.01 | 0.09 | ||||||||||||||||
Net realized and unrealized gain (loss) | (2.39 | ) | 2.00 | 6.07 | 4.62 | 0.48 | ||||||||||||||||||
|
| |||||||||||||||||||||||
Total from Investment Operations | (2.43 | ) | 1.92 | 6.03 | 4.63 | 0.57 | ||||||||||||||||||
|
| |||||||||||||||||||||||
LESS DISTRIBUTIONS FROM: | ||||||||||||||||||||||||
Net investment income | — | — | — | (0.02 | ) | (0.00 | )(b) | |||||||||||||||||
Net realized capital gains | (4.14 | ) | (4.25 | ) | (2.76 | ) | (3.18 | ) | (4.75 | ) | ||||||||||||||
|
| |||||||||||||||||||||||
Total Distributions | (4.14 | ) | (4.25 | ) | (2.76 | ) | (3.20 | ) | (4.75 | ) | ||||||||||||||
|
| |||||||||||||||||||||||
Net asset value, end of the period | $ | 26.68 | $ | 33.25 | $ | 35.58 | $ | 32.31 | $ | 30.88 | ||||||||||||||
|
| |||||||||||||||||||||||
Total return(c) | (4.60 | )% | 5.68 | % | 19.10 | % | 16.19 | % | 0.71 | % | ||||||||||||||
RATIOS TO AVERAGE NET ASSETS: | ||||||||||||||||||||||||
Net assets, end of the period (000’s) | $ | 13,357 | $ | 24,530 | $ | 30,533 | $ | 43,973 | $ | 45,762 | ||||||||||||||
Net expenses(d) | 1.40 | % | 1.40 | % | 1.40 | % | 1.39 | %(e) | 1.38 | %(f) | ||||||||||||||
Gross expenses | 1.43 | % | 1.42 | % | 1.43 | % | 1.42 | %(e) | 1.40 | %(f) | ||||||||||||||
Net investment income (loss) | (0.15 | )% | (0.24 | )% | (0.11 | )% | 0.03 | % | 0.28 | % | ||||||||||||||
Portfolio turnover rate | 24 | % | 19 | % | 25 | % | 22 | % | 22 | % | ||||||||||||||
| (a) | Per share net investment income (loss) has been calculated using the average shares outstanding during the period. |
| (b) | Amount rounds to less than $0.01 per share. |
| (c) | Had certain expenses not been waived/reimbursed during the period, total returns would have been lower. |
| (d) | The investment adviser agreed to waive its fees and/or reimburse a portion of the Fund’s expenses during the period. Without this waiver/reimbursement, expenses would have been higher. |
| (e) | Includes refund of prior year service fee of 0.01%. |
| (f) | Includes refund of prior year service fee of 0.02%. |
See accompanying notes to financial statements.
49 |
Table of Contents
Financial Highlights – continued
For a share outstanding throughout each period.
| Small Cap Value Fund—Class N | ||||||||||||||||||||||||
| Year Ended September 30, 2019 | Year Ended September 30, 2018 | Year Ended September 30, 2017 | Year Ended September 30, 2016 | Year Ended September 30, 2015 | ||||||||||||||||||||
Net asset value, beginning of the period | $ | 35.31 | $ | 37.41 | $ | 33.81 | $ | 32.22 | $ | 36.44 | ||||||||||||||
|
| |||||||||||||||||||||||
INCOME (LOSS) FROM INVESTMENT OPERATIONS: | ||||||||||||||||||||||||
Net investment income(a) | 0.12 | 0.12 | 0.15 | 0.19 | 0.27 | |||||||||||||||||||
Net realized and unrealized gain (loss) | (2.50 | ) | 2.11 | 6.37 | 4.83 | 0.50 | ||||||||||||||||||
|
| |||||||||||||||||||||||
Total from Investment Operations | (2.38 | ) | 2.23 | 6.52 | 5.02 | 0.77 | ||||||||||||||||||
|
| |||||||||||||||||||||||
LESS DISTRIBUTIONS FROM: | ||||||||||||||||||||||||
Net investment income | (0.11 | ) | (0.08 | ) | (0.16 | ) | (0.25 | ) | (0.24 | ) | ||||||||||||||
Net realized capital gains | (4.14 | ) | (4.25 | ) | (2.76 | ) | (3.18 | ) | (4.75 | ) | ||||||||||||||
|
| |||||||||||||||||||||||
Total Distributions | (4.25 | ) | (4.33 | ) | (2.92 | ) | (3.43 | ) | (4.99 | ) | ||||||||||||||
|
| |||||||||||||||||||||||
Net asset value, end of the period | $ | 28.68 | $ | 35.31 | $ | 37.41 | $ | 33.81 | $ | 32.22 | ||||||||||||||
|
| |||||||||||||||||||||||
Total return | (4.07 | )% | 6.28 | % | 19.78 | % | 16.84 | % | 1.25 | % | ||||||||||||||
RATIOS TO AVERAGE NET ASSETS: | ||||||||||||||||||||||||
Net assets, end of the period (000’s) | $ | 141,821 | $ | 153,646 | $ | 136,162 | $ | 68,332 | $ | 38,555 | ||||||||||||||
Net expenses | 0.83 | % | 0.83 | % | 0.83 | % | 0.83 | % | 0.83 | %(b) | ||||||||||||||
Gross expenses | 0.83 | % | 0.83 | % | 0.83 | % | 0.83 | % | 0.83 | %(b) | ||||||||||||||
Net investment income | 0.43 | % | 0.33 | % | 0.44 | % | 0.61 | % | 0.76 | % | ||||||||||||||
Portfolio turnover rate | 24 | % | 19 | % | 25 | % | 22 | % | 22 | % | ||||||||||||||
| (a) | Per share net investment income has been calculated using the average shares outstanding during the period. |
| (b) | Includes fee/expense recovery of less than 0.01%. |
See accompanying notes to financial statements.
| 50
Table of Contents
Financial Highlights – continued
For a share outstanding throughout each period.
| Small/Mid Cap Growth Fund—Institutional Class | ||||||||||||||||||||||||
| Year Ended September 30, 2019 | Year Ended September 30, 2018 | Year Ended September 30, 2017 | Year Ended September 30, 2016 | Period Ended September 30, 2015* | ||||||||||||||||||||
Net asset value, beginning of the period | $ | 15.49 | $ | 12.31 | $ | 9.73 | $ | 9.05 | $ | 10.00 | ||||||||||||||
|
| |||||||||||||||||||||||
INCOME (LOSS) FROM INVESTMENT OPERATIONS: | ||||||||||||||||||||||||
Net investment income (loss)(a) | (0.04 | ) | (0.05 | ) | 0.00 | (b) | (0.02 | ) | (0.01 | ) | ||||||||||||||
Net realized and unrealized gain (loss) | (1.55 | )(c) | 3.23 | 2.60 | 0.70 | (0.94 | ) | |||||||||||||||||
|
| |||||||||||||||||||||||
Total from Investment Operations | (1.59 | ) | 3.18 | 2.60 | 0.68 | (0.95 | ) | |||||||||||||||||
|
| |||||||||||||||||||||||
LESS DISTRIBUTIONS FROM: | ||||||||||||||||||||||||
Net investment income | — | — | (0.02 | ) | — | — | ||||||||||||||||||
Net realized capital gains | (3.87 | ) | — | — | — | — | ||||||||||||||||||
|
| |||||||||||||||||||||||
Total Distributions | (3.87 | ) | — | (0.02 | ) | — | — | |||||||||||||||||
|
| |||||||||||||||||||||||
Net asset value, end of the period | $ | 10.03 | $ | 15.49 | $ | 12.31 | $ | 9.73 | $ | 9.05 | ||||||||||||||
|
| |||||||||||||||||||||||
Total return(d) | (3.27 | )% | 25.83 | % | 26.74 | % | 7.51 | % | (9.50 | )%(e) | ||||||||||||||
RATIOS TO AVERAGE NET ASSETS: | ||||||||||||||||||||||||
Net assets, end of the period (000’s) | $ | 34,312 | $ | 17,500 | $ | 14,592 | $ | 11,974 | $ | 9,242 | ||||||||||||||
Net expenses(f) | 0.85 | % | 0.85 | % | 0.85 | % | 0.85 | % | 0.85 | %(g) | ||||||||||||||
Gross expenses | 1.30 | % | 1.43 | % | 1.57 | % | 1.75 | % | 2.65 | %(g) | ||||||||||||||
Net investment income (loss) | (0.35 | )% | (0.35 | )% | 0.01 | % | (0.22 | )% | (0.53 | )%(g) | ||||||||||||||
Portfolio turnover rate | 67 | % | 102 | %(h) | 49 | % | 53 | % | 14 | % | ||||||||||||||
| * | From commencement of operations on June 30, 2015 through September 30, 2015. |
| (a) | Per share net investment income (loss) has been calculated using the average shares outstanding during the period. |
| (b) | Amount rounds to less than $0.01. |
| (c) | The amount shown for a share outstanding does not correspond with the aggregate realized and unrealized gain (loss) on investments for the period due to the timing of sales and redemptions of fund shares in relation to fluctuating market values of investments of the Fund. |
| (d) | Had certain expenses not been waived/reimbursed during the period, total returns would have been lower. |
| (e) | Periods less than one year are not annualized. |
| (f) | The investment adviser agreed to waive its fees and/or reimburse a portion of the Fund’s expenses during the period. Without this waiver/reimbursement, expenses would have been higher. |
| (g) | Computed on an annualized basis for periods less than one year. |
| (h) | The variation in the Fund’s turnover rate from 2017 to 2018 was primarily due to significant shareholder flows. |
See accompanying notes to financial statements.
51 |
Table of Contents
September 30, 2019
1. Organization. Loomis Sayles Funds I and Loomis Sayles Funds II (the “Trusts” and each a “Trust”) are each organized as a Massachusetts business trust. Each Trust is registered under the Investment Company Act of 1940, as amended (the “1940 Act”), as anopen-end management investment company. Each Declaration of Trust permits the Board of Trustees to authorize the issuance of an unlimited number of shares of the Trust in multiple series. The financial statements for certain funds of the Trusts are presented in separate reports. The following funds (individually, a “Fund” and collectively, the “Funds”) are included in this report:
Loomis Sayles Funds I:
Loomis Sayles Small Cap Value Fund (the “Small Cap Value Fund”)
Loomis Sayles Funds II:
Loomis Sayles Small Cap Growth Fund (the “Small Cap Growth Fund”)
Loomis Sayles Small/Mid Cap Growth Fund (the “Small/Mid Cap Growth Fund”)
Each Fund is a diversified investment company.
Small Cap Growth Fund and Small Cap Value Fund were closed to new investors effective September 14, 2012 and September 15, 2008, respectively. Small Cap Growth Fundre-opened to new investors effective October 1, 2018. Small Cap Value Fundre-opened to new investors effective November 27, 2017. Small Cap Growth Fund offers Institutional Class, Retail Class and Class N shares. Small Cap Value Fund offers Institutional Class, Retail Class, Admin Class and Class N shares. Small/Mid Cap Growth Fund offers Institutional Class shares.
Each share class is sold without a sales charge. Retail Class and Admin Class shares pay a Rule12b-1 fee. Class N shares are offered with an initial minimum investment of $1,000,000. Institutional Class shares are intended for institutional investors with a minimum initial investment of $100,000 for Small Cap Growth Fund and Small Cap Value Fund and $1,000,000 for Small/Mid Cap Growth Fund. Certain categories of investors are exempted from the minimum investment amount for Class N and Institutional Class as outlined in the relevant Fund’s prospectus. Admin Class shares are offered exclusively through intermediaries.
Most expenses can be directly attributed to a Fund. Expenses which cannot be directly attributed to a Fund are generally apportioned based on the relative net assets of each of the funds in Natixis Funds Trust I, Natixis Funds Trust II, Natixis Funds Trust IV and Gateway Trust (“Natixis Funds Trusts”), Loomis Sayles Funds I and Loomis Sayles Funds II (“Loomis Sayles Funds Trusts”), and Natixis ETF Trust. Expenses of a Fund are bornepro rata by the holders of each class of shares, except that each class bears expenses unique to that class (such as the Rule12b-1 fees applicable to Retail Class and Admin Class), and transfer agent fees are borne collectively for Institutional Class, Retail Class and Admin Class, and individually for Class N. In addition, each class votes as a class only with respect to its own Rule12b-1 Plan. Shares of each class would receive theirpro rata share
| 52
Table of Contents
Notes to Financial Statements – continued
September 30, 2019
of the net assets of a Fund if the Fund were liquidated. The Trustees approve separate distributions from net investment income on each class of shares.
2. Significant Accounting Policies. The following is a summary of significant accounting policies consistently followed by each Fund in the preparation of its financial statements. The Funds’ financial statements follow the accounting and reporting guidelines provided for investment companies and are prepared in accordance with accounting principles generally accepted in the United States of America which require the use of management estimates that affect the reported amounts and disclosures in the financial statements. Actual results could differ from those estimates. Management has evaluated the events and transactions subsequent to year-end through the date the financial statements were issued and has determined that there were no material events that would require disclosure in the Funds’ financial statements.
a. Valuation. Fund securities and other investments are valued at market value based on market quotations obtained or determined by independent pricing services recommended by the adviser and approved by the Board of Trustees. Fund securities and other investments for which market quotations are not readily available are valued at fair value as determined in good faith by the adviser pursuant to procedures approved by the Board of Trustees, as described below. Market value is determined as follows:
Listed equity securities (including shares ofclosed-end investment companies and exchange-traded funds) are valued at the last sale price quoted on the exchange where they are traded most extensively or, if there is no reported sale during the day, the closing bid quotation as reported by an independent pricing service. Securities traded on the NASDAQ Global Select Market, NASDAQ Global Market and NASDAQ Capital Market are valued at the NASDAQ Official Closing Price (“NOCP”), or if lacking an NOCP, at the most recent bid quotations on the applicable NASDAQ Market. Unlisted equity securities (except unlisted preferred equity securities) are valued at the last sale price quoted in the market where they are traded most extensively or, if there is no reported sale during the day, the closing bid quotation as reported by an independent pricing service. If there is no last sale price or closing bid quotation available, unlisted equity securities will be valued using evaluated bids furnished by an independent pricing service, if available. In some foreign markets, an official close price and a last sale price may be available from the foreign exchange or market. In those cases, the official close price is used. Debt securities and unlisted preferred equity securities are valued based on evaluated bids furnished to the Funds by an independent pricing service or bid prices obtained from broker-dealers. Broker-dealer bid prices may be used to value debt and unlisted equity securities where an independent pricing service is unable to price a security or where an independent pricing service does not provide a reliable price for the security.
Fund securities and other investments for which market quotations are not readily available are valued at fair value as determined in good faith by the adviser pursuant to procedures approved by the Board of Trustees. The Funds may also value securities and
53 |
Table of Contents
Notes to Financial Statements – continued
September 30, 2019
other investments at fair value in other circumstances such as when extraordinary events occur after the close of a foreign market but prior to the close of the New York Stock Exchange. This may include situations relating to a single issuer (such as a declaration of bankruptcy or a delisting of the issuer’s security from the primary market on which it has traded) as well as events affecting the securities markets in general (such as market disruptions or closings and significant fluctuations in U.S. and/or foreign markets). When fair valuing its securities or other investments, the Funds may, among other things, use modeling tools or other processes that may take into account factors such as securities or other market activity and/or significant events that occur after the close of the foreign market and before the time the Fund’s net asset value (“NAV”) is calculated. Fair value pricing may require subjective determinations about the value of a security, and fair values used to determine a Fund’s NAV may differ from quoted or published prices, or from prices that are used by others, for the same securities. In addition, the use of fair value pricing may not always result in adjustments to the prices of securities held by a Fund.
Illiquid securities for which market quotations are readily available and have been evaluated by the adviser are considered and classified as fair valued securities pursuant to the Funds’ pricing policies and procedures.
b. Investment Transactions and Related Investment Income. Investment transactions are accounted for on a trade date plus one day basis for daily NAV calculation. However, for financial reporting purposes, investment transactions are reported on trade date. Dividend income (including income reinvested) and foreign withholding tax, if applicable, is recorded on theex-dividend date, or in the case of certain foreign securities, as soon as a Fund is notified, and interest income is recorded on an accrual basis. Interest income is increased by the accretion of discount and decreased by the amortization of premium, if applicable. Distributions received from investments in securities that represent a return of capital or capital gain are recorded as a reduction of cost of investments or as a realized gain, respectively. The calendaryear-end amounts of ordinary income, capital gains and return of capital included in distributions received from the Funds’ investments in real estate investment trusts (“REITs”) are reported to the Funds after the end of the fiscal year; accordingly, the Funds estimate these amounts for accounting purposes until the characterization of REIT distributions is reported to the Funds after the end of the fiscal year. Estimates are based on the most recent REIT distribution information available. In determining net gain or loss on securities sold, the cost of securities has been determined on an identified cost basis. Investment income,non-class specific expenses and realized and unrealized gains and losses are allocated on apro rata basis to each class based on the relative net assets of each class to the total net assets of the Fund.
c. Foreign Currency Translation. The books and records of the Funds are maintained in U.S. dollars. The values of securities, currencies and other assets and liabilities denominated in currencies other than U.S. dollars, if any, are translated into U.S. dollars
| 54
Table of Contents
Notes to Financial Statements – continued
September 30, 2019
based upon foreign exchange rates prevailing at the end of the period. Purchases and sales of investment securities, income and expenses are translated into U.S. dollars on the respective dates of such transactions.
Net realized foreign exchange gains or losses arise from sales of foreign currency, changes in exchange rates between the trade and settlement dates on securities transactions and the difference between the amounts of dividends, interest and foreign withholding taxes recorded on the Funds’ books and the U.S. dollar equivalent of the amounts actually received or paid. Net unrealized foreign exchange gains or losses arise from changes in the value of assets and liabilities, other than investment securities, as of the end of the fiscal period, resulting from changes in exchange rates.
The values of investment securities are presented at the foreign exchange rates prevailing at the end of the period for financial reporting purposes. Net realized and unrealized gains or losses on investments reported in the Statements of Operations reflect gains or losses resulting from changes in exchange rates and fluctuations which arise due to changes in market prices of investment securities.
The Funds may use foreign currency exchange contracts to facilitate transactions in foreign-denominated investments. Losses may arise from changes in the value of the foreign currency or if the counterparties do not perform under the contracts’ terms.
d. Federal and Foreign Income Taxes. The Trusts treat each Fund as a separate entity for federal income tax purposes. Each Fund intends to meet the requirements of the Internal Revenue Code of 1986, as amended, applicable to regulated investment companies, and to distribute to its shareholders substantially all of its net investment income and any net realized capital gains at least annually. Management has performed an analysis of each Fund’s tax positions for the open tax years as of September 30, 2019 and has concluded that no provisions for income tax are required. The Funds’ federal tax returns for the prior three fiscal years remain subject to examination by the Internal Revenue Service. Management is not aware of any events that are reasonably possible to occur in the next twelve months that would result in the amounts of any unrecognized tax benefits significantly increasing or decreasing for the Funds. However, management’s conclusions regarding tax positions taken may be subject to review and adjustment at a later date based on factors including, but not limited to, new tax laws and accounting regulations and interpretations thereof.
A Fund may be subject to foreign withholding taxes on investment income and taxes on capital gains on investments that are accrued and paid based upon the Fund’s understanding of the tax rules and regulations that exist in the countries in which the Fund invests. Foreign withholding taxes on dividend and interest income are reflected on the Statements of Operations as a reduction of investment income, net of amounts eligible to be reclaimed. Dividends and interest receivable on the Statements of Assets and Liabilities are net of foreign withholding taxes. Foreign withholding taxes where reclaims
55 |
Table of Contents
Notes to Financial Statements – continued
September 30, 2019
have been or will be filed are reflected on the Statements of Assets and Liabilities as tax reclaims receivable. Capital gains taxes paid are included in net realized gain (loss) on investments in the Statements of Operations. Accrued but unpaid capital gains taxes are reflected as foreign taxes payable on the Statements of Assets and Liabilities, if applicable, and reduce unrealized gains on investments. In the event that realized gains on investments are subsequently offset by realized losses, taxes paid on realized gains may be returned to a Fund. Such amounts, if applicable, are reflected as foreign tax rebates receivable on the Statements of Assets and Liabilities and are recorded as a realized gain when received.
e. Dividends and Distributions to Shareholders. Dividends and distributions are recorded on theex-dividend date. The timing and characterization of certain income and capital gain distributions are determined in accordance with federal tax regulations, which may differ from accounting principles generally accepted in the United States of America. Permanent differences are primarily due to differing treatments for book and tax purposes of items such as return of capital distributions received, deferred Trustees’ fees, and net operating losses. Permanent book and tax basis differences relating to shareholder distributions will result in reclassifications to capital accounts reported on the Statements of Assets and Liabilities. Temporary differences between book and tax distributable earnings are primarily due to return of capital distributions received, deferred Trustees’ fees and wash sales. Amounts of income and capital gain available to be distributed on a tax basis are determined annually, and at other times during the Funds’ fiscal year as may be necessary to avoid knowingly declaring and paying a return of capital distribution. Distributions from net investment income and net realized short-term capital gains are reported as distributed from ordinary income for tax purposes.
The tax characterization of distributions is determined on an annual basis. The tax character of distributions paid to shareholders during the years ended September 30, 2019 and 2018 were as follows:
| 2019 Distributions Paid From: | 2018 Distributions Paid From: | |||||||||||||||||||||||
Fund | Ordinary Income | Long-Term Capital Gains | Total | Ordinary Income | Long-Term Capital Gains | Total | ||||||||||||||||||
Small Cap Growth Fund | $ | — | $ | 131,384,945 | $ | 131,384,945 | $ | — | $ | 141,682,579 | $ | 141,682,579 | ||||||||||||
Small Cap Value Fund | 1,761,169 | 110,774,229 | 112,535,398 | 1,359,796 | 119,491,329 | 120,851,125 | ||||||||||||||||||
Small/Mid Cap Growth Fund | — | 4,717,064 | 4,717,064 | — | — | — | ||||||||||||||||||
Distributions paid to shareholders from net investment income and net realized capital gains, based on accounting principles generally accepted in the United States of America, are consolidated and reported on the Statements of Changes in Net Assets as Distributions to Shareholders. Distributions paid to shareholders from net investment income and net realized capital gains expressed inper-share amounts, based on accounting principles generally accepted in the United States of America, are separately stated and reported within the Financial Highlights.
| 56
Table of Contents
Notes to Financial Statements – continued
September 30, 2019
As of September 30, 2019, the components of distributable earnings on a tax basis were as follows:
| Small Cap Growth Fund | Small Cap Value Fund | Small/Mid Cap Growth Fund | ||||||||||
Undistributed ordinary income | $ | — | $ | 1,766,135 | $ | — | ||||||
Undistributed long-term capital gains | 145,569,989 | 50,009,384 | 721,955 | |||||||||
|
|
|
|
|
| |||||||
Total undistributed earnings | 145,569,989 | 51,775,519 | 721,955 | |||||||||
|
|
|
|
|
| |||||||
Late-year ordinary and post-October capital loss deferrals* | (6,292,971 | ) | — | (67,038 | ) | |||||||
|
|
|
|
|
| |||||||
Unrealized appreciation | 272,411,649 | 204,515,794 | 2,265,785 | |||||||||
|
|
|
|
|
| |||||||
Total accumulated earnings | $ | 411,688,667 | $ | 256,291,313 | $ | 2,920,702 | ||||||
|
|
|
|
|
| |||||||
* Under current tax law, net operating losses, capital losses, foreign currency losses, and losses on passive foreign investment companies and contingent payment debt instruments after October 31 or December 31, as applicable, may be deferred and treated as occurring on the first day of the following taxable year. Small Cap Growth Fund and Small/Mid Cap Growth Fund are deferring net operating losses.
As of September 30, 2019, the tax cost of investments and unrealized appreciation (depreciation) on a federal tax basis were as follows:
| Small Cap Growth Fund | Small Cap Value Fund | Small/Mid Cap Growth Fund | ||||||||||
Federal tax cost | $ | 1,368,396,568 | $ | 518,708,822 | $ | 29,558,403 | ||||||
|
|
|
|
|
| |||||||
Gross tax appreciation | $ | 323,020,604 | $ | 227,812,904 | $ | 2,768,670 | ||||||
Gross tax depreciation | (50,608,955 | ) | (23,297,110 | ) | (502,885 | ) | ||||||
|
|
|
|
|
| |||||||
Net tax appreciation | $ | 272,411,649 | $ | 204,515,794 | $ | 2,265,785 | ||||||
|
|
|
|
|
| |||||||
f. Repurchase Agreements. Each Fund may enter into repurchase agreements, under the terms of a Master Repurchase Agreement, under which each Fund acquires securities as collateral and agrees to resell the securities at an agreed upon time and at an agreed upon price. It is each Fund’s policy that the market value of the collateral for repurchase agreements be at least equal to 102% of the repurchase price, including interest. Certain repurchase agreements aretri-party arrangements whereby the collateral is held in a segregated account for the benefit of the Fund and on behalf of the counterparty. Repurchase agreements could involve certain risks in the event of default or insolvency of the counterparty, including possible delays or restrictions upon a Fund’s ability to dispose of the underlying securities. As of September 30, 2019, each Fund, as applicable, had investments in repurchase agreements for which the value of the related collateral exceeded the value of the repurchase agreement. The gross value of repurchase agreements is included in the Statements of Assets and Liabilities for financial reporting purposes.
g. Securities Lending. The Funds have entered into an agreement with State Street Bank and Trust Company (“State Street Bank”), as agent of the Funds, to lend securities to
57 |
Table of Contents
Notes to Financial Statements – continued
September 30, 2019
certain designated borrowers. The loans are collateralized with cash or securities in an amount equal to at least 105% or 102% of the market value (including accrued interest) of the loaned international or domestic securities, respectively, when the loan is initiated. Thereafter, the value of the collateral must remain at least 102% of the market value (including accrued interest) of loaned securities for U.S. equities and U.S. corporate debt; at least 105% of the market value (including accrued interest) of loaned securities fornon-U.S. equities; and at least 100% of the market value (including accrued interest) of loaned securities for U.S. Government securities, sovereign debt issued bynon-U.S. Governments andnon-U.S. corporate debt. In the event that the market value of the collateral falls below the required percentages described above, the borrower will deliver additional collateral on the next business day. As with other extensions of credit, the Funds may bear the risk of loss with respect to the investment of the collateral. The Funds invest cash collateral in short-term investments, a portion of the income from which is remitted to the borrowers and the remainder allocated between the Funds and State Street Bank as lending agent.
For the year ended September 30, 2019, none of the Funds had loaned securities under this agreement.
h. Indemnifications. Under the Trusts’ organizational documents, their officers and Trustees are indemnified against certain liabilities arising out of the performance of their duties to the Funds. Additionally, in the normal course of business, the Funds enter into contracts with service providers that contain general indemnification clauses. The Funds’ maximum exposure under these arrangements is unknown as this would involve future claims that may be made against the Funds that have not yet occurred. However, based on experience, the Funds expect the risk of loss to be remote.
3. Fair Value Measurements. In accordance with accounting standards related to fair value measurements and disclosures, the Funds have categorized the inputs utilized in determining the value of each Fund’s assets or liabilities. These inputs are summarized in the three broad levels listed below:
| • | Level 1—quoted prices in active markets for identical assets or liabilities; |
| • | Level 2—prices determined using other significant inputs that are observable either directly, or indirectly through corroboration with observable market data (which could include quoted prices for similar assets or liabilities, interest rates, credit risk, etc.); and |
| • | Level 3—prices determined using significant unobservable inputs when quoted prices or observable inputs are unavailable such as when there is little or no market activity for an asset or liability (unobservable inputs reflect each Fund’s own assumptions in determining the fair value of assets or liabilities and would be based on the best information available). |
| 58
Table of Contents
Notes to Financial Statements – continued
September 30, 2019
The inputs or methodology used for valuing securities are not necessarily an indication of the risk associated with investing in those securities.
The following is a summary of the inputs used to value the Funds’ investments as of September 30, 2019, at value:
Small Cap Growth Fund
Asset Valuation Inputs
Description | Level 1 | Level 2 | Level 3 | Total | ||||||||||||
Common Stocks(a) | $ | 1,585,307,593 | $ | — | $ | — | $ | 1,585,307,593 | ||||||||
Short-Term Investments | — | 55,500,624 | — | 55,500,624 | ||||||||||||
|
|
|
|
|
|
|
| |||||||||
Total | $ | 1,585,307,593 | $ | 55,500,624 | $ | — | $ | 1,640,808,217 | ||||||||
|
|
|
|
|
|
|
| |||||||||
(a) Details of the major categories of the Fund’s investments are reflected within the Portfolio of Investments.
For the year ended September 30, 2019, there were no transfers among Levels 1, 2 and 3.
Small Cap Value Fund
Asset Valuation Inputs
Description | Level 1 | Level 2 | Level 3 | Total | ||||||||||||
Common Stocks(a) | $ | 716,158,683 | $ | — | $ | — | $ | 716,158,683 | ||||||||
Short-Term Investments | — | 7,065,933 | — | 7,065,933 | ||||||||||||
|
|
|
|
|
|
|
| |||||||||
Total | $ | 716,158,683 | $ | 7,065,933 | $ | — | $ | 723,224,616 | ||||||||
|
|
|
|
|
|
|
| |||||||||
(a) Details of the major categories of the Fund’s investments are reflected within the Portfolio of Investments.
For the year ended September 30, 2019, there were no transfers among Levels 1, 2 and 3.
Small/Mid Cap Growth Fund
Asset Valuation Inputs
Description | Level 1 | Level 2 | Level 3 | Total | ||||||||||||
Common Stocks(a) | $ | 30,568,479 | $ | — | $ | — | $ | 30,568,479 | ||||||||
Short-Term Investments | — | 1,255,709 | — | 1,255,709 | ||||||||||||
|
|
|
|
|
|
|
| |||||||||
Total | $ | 30,568,479 | $ | 1,255,709 | $ | — | $ | 31,824,188 | ||||||||
|
|
|
|
|
|
|
| |||||||||
(a) Details of the major categories of the Fund’s investments are reflected within the Portfolio of Investments.
For the year ended September 30, 2019, there were no transfers among Levels 1, 2 and 3.
59 |
Table of Contents
Notes to Financial Statements – continued
September 30, 2019
4. Purchases and Sales of Securities. For the year ended September 30, 2019, purchases and sales of securities (excluding short-term investments) were as follows:
Fund | Purchases | Sales | ||||||
Small Cap Growth Fund | $ | 1,147,534,384 | $ | 966,340,282 | ||||
Small Cap Value Fund | 189,739,344 | 386,389,761 | ||||||
Small/Mid Cap Growth Fund | 28,246,006 | 15,323,220 | ||||||
5. Management Fees and Other Transactions with Affiliates.
a. Management Fees. Loomis, Sayles & Company, L.P. (“Loomis Sayles”) serves as investment adviser to each Fund. Loomis Sayles is a limited partnership whose sole general partner, Loomis, Sayles & Company, Inc., is indirectly owned by Natixis Investment Managers, L.P. (“Natixis”), which is part of Natixis Investment Managers, an international asset management group based in Paris, France.
Under the terms of the management agreements, each Fund pays a management fee at the following annual rates, calculated daily and payable monthly, based on each Fund’s average daily net assets:
Fund | Percentage of Average Daily Net Assets | |||||||
Small Cap Growth Fund | 0.75% | |||||||
Small Cap Value Fund | 0.75% | |||||||
Small/Mid Cap Growth Fund | 0.75% | |||||||
Loomis Sayles has given binding undertakings to the Funds to waive management fees and/or reimburse certain expenses to limit the Funds’ operating expenses, exclusive of acquired fund fees and expenses, brokerage expenses, interest expense, taxes, organizational and extraordinary expenses such as litigation and indemnification expenses. These undertakings are in effect until January 31, 2020, may be terminated before then only with the consent of the Funds’ Board of Trustees and are reevaluated on an annual basis. Management fees payable, as reflected on the Statements of Assets and Liabilities, is net of waivers and/or expense reimbursements, if any, pursuant to these undertakings. Waivers/ reimbursements that exceed management fees payable are reflected on the Statements of Assets and Liabilities as receivable from investment adviser.
For the year ended September 30, 2019, the expense limits as a percentage of average daily net assets under the expense limitation agreements were as follows:
| Expense Limit as a Percentage of Average Daily Net Assets | ||||||||||||||||
Fund | Institutional Class | Retail Class | Admin Class | Class N | ||||||||||||
Small Cap Growth Fund | 1.00% | 1.25% | — | 0.95% | ||||||||||||
Small Cap Value Fund | 0.90% | 1.15% | 1.40% | 0.85% | ||||||||||||
Small/Mid Cap Growth Fund | 0.85% | — | — | — | ||||||||||||
| 60
Table of Contents
Notes to Financial Statements – continued
September 30, 2019
Loomis Sayles shall be permitted to recover expenses borne under the expense limitation agreements (whether through waiver of management fees or otherwise) on a class by class basis in later periods to the extent the annual operating expenses of a class fall below a class’ expense limits, provided, however, that a class is not obligated to pay such waived/reimbursed fees or expenses more than one year after the end of the fiscal year in which the fees or expenses were waived/reimbursed.
For the year ended September 30, 2019, the management fees for each Fund were as follows:
| Gross Management Fees | Contractual Waivers of Management Fees1 | Net Management Fees | Percentage of | |||||||||||||||||
Fund | Gross | Net | ||||||||||||||||||
Small Cap Growth Fund | $ | 11,217,209 | $ | — | $ | 11,217,209 | 0.75% | 0.75% | ||||||||||||
Small Cap Value Fund | 5,996,267 | — | 5,996,267 | 0.75% | 0.75% | |||||||||||||||
Small/Mid Cap Growth Fund | 175,353 | 104,365 | 70,988 | 0.75% | 0.30% | |||||||||||||||
For the year ended September 30, 2019, class-specific expenses have been reimbursed as follows:
| Reimbursement1 | ||||||||||||||||||||
Fund | Institutional Class | Retail Class | Admin Class | Class N | Total | |||||||||||||||
Small Cap Value Fund | $ | 155,034 | $ | 49,387 | $ | 5,632 | $ | — | $ | 210,053 | ||||||||||
1Waiver/expense reimbursements are subject to possible recovery until September 30, 2020.
b. Service and Distribution Fees. Natixis Distribution, L.P. (“Natixis Distribution”), which is a wholly-owned subsidiary of Natixis, has entered into a distribution agreement with the Trusts. Pursuant to this agreement, Natixis Distribution serves as principal underwriter of the Funds of the Trusts.
Pursuant to Rule12b-1 under the 1940 Act, Small Cap Growth Fund and Small Cap Value Fund have adopted a Distribution Plan relating to each Fund’s Retail Class shares (the “Retail Class Plans”) and Small Cap Value Fund has adopted a Distribution Plan relating to its Admin Class shares (the “Admin Class Plan”).
Under the Retail Class Plans, each Fund pays Natixis Distribution a monthly distribution fee at an annual rate not to exceed 0.25% of the average daily net assets attributable to the Fund’s Retail Class shares, as compensation for services provided by Natixis Distribution in connection with the marketing or sale of Retail Class shares or for payments made by Natixis Distribution to securities dealers or other financial intermediaries as commissions, asset-based sales charges or other compensation with respect to the sale of Retail Class shares, or for providing personal services to investors and/or the maintenance of shareholder accounts.
61 |
Table of Contents
Notes to Financial Statements – continued
September 30, 2019
Under the Admin Class Plan, Small Cap Value Fund pays Natixis Distribution a monthly distribution fee at an annual rate not to exceed 0.25% of the average daily net assets attributable to the Fund’s Admin Class shares, as compensation for services provided by Natixis Distribution in connection with the marketing or sale of Admin Class shares or for payments made by Natixis Distribution to securities dealers or other financial intermediaries as commissions, asset-based sales charges or other compensation with respect to the sale of Admin Class shares, or for providing personal services to investors and/or the maintenance of shareholder accounts.
In addition, the Admin Class shares of Small Cap Value Fund may pay Natixis Distribution an administrative service fee, at an annual rate not to exceed 0.25% of the average daily net assets attributable to Admin Class shares. These fees are subsequently paid to securities dealers or financial intermediaries for providing personal services and/or account maintenance for their customers who hold such shares.
For the year ended September 30, 2019, the service and distribution fees for each Fund were as follows:
| Service Fees | Distribution Fees | |||||||||||
Fund | Admin Class | Retail Class | Admin Class | |||||||||
Small Cap Growth Fund | $ | — | $ | 269,104 | $ | — | ||||||
Small Cap Value Fund | 44,171 | 386,674 | 44,171 | |||||||||
c. Administrative Fees. Natixis Advisors, L.P. (“Natixis Advisors”) provides certain administrative services for the Funds and contracts with State Street Bank to serve assub-administrator. Natixis Advisors is a wholly-owned subsidiary of Natixis. Pursuant to an agreement among Natixis Funds Trusts, Loomis Sayles Funds Trusts, Natixis ETF Trust and Natixis Advisors, effective July 1, 2019, each Fund pays Natixis Advisors monthly itspro rata portion of fees equal to an annual rate of 0.0540% of the first $15 billion of the average daily net assets of the Natixis Funds Trusts, Loomis Sayles Funds Trusts and Natixis ETF Trust, 0.0500% of the next $15 billion, 0.0400% of the next $30 billion, 0.0275% of the next $30 billion and 0.0225% of such assets in excess of $90 billion, subject to an annual aggregate minimum fee for the Natixis Funds Trusts, Loomis Sayles Funds Trusts and Natixis ETF Trust of $10 million, which is reevaluated on an annual basis.
Prior to July 1, 2019, each Fund paid Natixis Advisors monthly itspro rata portion of fees equal to an annual rate of 0.0575% of the first $15 billion of the average daily net assets of the Natixis Funds Trusts, Loomis Sayles Funds Trusts and Natixis ETF Trust, 0.0500% of the next $15 billion, 0.0400% of the next $30 billion, 0.0275% of the next $30 billion and 0.0225% of such assets in excess of $90 billion, subject to an annual aggregate minimum fee for the Natixis Funds Trusts, Loomis Sayles Funds Trusts and Natixis ETF Trust of $10 million.
| 62
Table of Contents
Notes to Financial Statements – continued
September 30, 2019
Effective October 1, 2018, State Street Bank agreed to reduce the fees it receives from Natixis Advisors for serving assub-administrator to the Funds. Also, effective October 1, 2018, Natixis Advisors agreed to voluntarily waive fees paid by the Funds in an amount equal to the reduction insub-administrative fees discussed above. The waiver was in effect through June 30, 2019.
For the year ended September 30, 2019, the administrative fees for each Fund were as follows:
Fund | Gross Administrative Fees | Waiver of Administrative Fees | Net Administrative Fees | |||||||||
Small Cap Growth Fund | $ | 658,351 | $ | 11,103 | $ | 647,248 | ||||||
Small Cap Value Fund | 351,874 | 6,305 | 345,569 | |||||||||
Small/Mid Cap Growth Fund | 10,310 | 168 | 10,142 | |||||||||
d. Sub-Transfer Agent Fees. Natixis Distribution has entered into agreements, which include servicing agreements, with financial intermediaries that provide recordkeeping, processing, shareholder communications and other services to customers of the intermediaries that hold positions in the Funds and has agreed to compensate the intermediaries for providing those services. Intermediaries transact with the Funds primarily through the use of omnibus accounts on behalf of their customers who hold positions in the Funds. These services would have been provided by the Funds’ transfer agent and other service providers if the shareholders’ accounts were maintained directly at the Funds’ transfer agent. Accordingly, the Funds have agreed to reimburse Natixis Distribution for all or a portion of the servicing fees paid to these intermediaries. The reimbursement amounts(sub-transfer agent fees) paid to Natixis Distribution are subject to a currentper-account equivalent fee limit approved by the Funds’ Board of Trustees, which is based on fees for similar services paid to the Funds’ transfer agent and other service providers. Class N shares do not bear such expenses.
For the year ended September 30, 2019, thesub-transfer agent fees (which are reflected in transfer agent fees and expenses in the Statements of Operations) for each Fund were as follows:
Fund | Sub-Transfer Agent Fees | |||
Small Cap Growth Fund | $ | 1,187,960 | ||
Small Cap Value Fund | 623,706 | |||
Small/Mid Cap Growth Fund | 561 | |||
63 |
Table of Contents
Notes to Financial Statements – continued
September 30, 2019
As of September 30, 2019, the Funds owe Natixis Distribution the following reimbursements forsub-transfer agent fees (which are reflected in the Statements of Assets and Liabilities as payable to distributor):
Fund | Reimbursements of Sub-Transfer Agent Fees | |||
Small Cap Growth Fund | $ | 15,155 | ||
Small Cap Value Fund | 6,383 | |||
Small/Mid Cap Growth Fund | 9 | |||
Sub-transfer agent fees attributable to Institutional Class, Retail Class and Admin Class are allocated on apro rata basis to each class based on the relative net assets of each class to the total net assets of those classes.
e. Trustees Fees and Expenses. The Trusts do not pay any compensation directly to their officers or Trustees who are directors, officers or employees of Natixis Advisors, Natixis Distribution, Natixis or their affiliates. The Chairperson of the Board of Trustees receives a retainer fee at the annual rate of $360,000. The Chairperson does not receive any meeting attendance fees for Board of Trustees meetings or committee meetings that he attends. Each Independent Trustee (other than the Chairperson) receives, in the aggregate, a retainer fee at the annual rate of $190,000. Each Independent Trustee also receives a meeting attendance fee of $10,000 for each meeting of the Board of Trustees that he or she attends in person and $5,000 for each meeting of the Board of Trustees that he or she attends telephonically. In addition, the chairperson of the Contract Review Committee and the chairperson of the Audit Committee each receive an additional retainer fee at the annual rate of $20,000. The chairperson of the Governance Committee receives an additional retainer fee at the annual rate of $15,000. Each Contract Review Committee member is compensated $6,000 for each Committee meeting that he or she attends in person and $3,000 for each meeting that he or she attends telephonically. Each Audit Committee member is compensated $6,000 for each Committee meeting that he or she attends in person and $3,000 for each meeting that he or she attends telephonically. These fees are allocated among the funds in the Natixis Funds Trusts, Loomis Sayles Funds Trusts and Natixis ETF Trust based on a formula that takes into account, among other factors, the relative net assets of each fund. Trustees are reimbursed for travel expenses in connection with attendance at meetings.
Prior to January 1, 2019, the Chairperson of the Board received a retainer fee at the annual rate of $340,000 and each Independent Trustee (other than the Chairperson) received, in the aggregate, a retainer fee at the annual rate of $170,000, and the chairperson of the Governance Committee received an additional retainer fee at the annual rate of $12,000. All other Trustee fees remained unchanged.
A deferred compensation plan (the “Plan”) is available to the Trustees on a voluntary basis. Deferred amounts remain in the Funds until distributed in accordance with the provisions
| 64
Table of Contents
Notes to Financial Statements – continued
September 30, 2019
of the Plan. The value of a participating Trustee’s deferral account is based on theoretical investments of deferred amounts, on the normal payment dates, in certain funds of the Natixis Funds Trusts, Loomis Sayles Funds Trusts and Natixis ETF Trust as designated by the participating Trustees. Changes in the value of participants’ deferral accounts are allocatedpro rata among the funds in the Natixis Funds Trusts, Loomis Sayles Funds Trusts and Natixis ETF Trust, and are normally reflected as Trustees’ fees and expenses in the Statements of Operations. The portions of the accrued obligations allocated to the Funds under the Plan are reflected as Deferred Trustees’ fees in the Statements of Assets and Liabilities.
Certain officers and employees of Natixis Advisors and Loomis Sayles are also officers and/or Trustees of the Trusts.
f. Affiliated Ownership. As of September 30, 2019, Loomis Sayles Funded Pension Plan and Trust (“Pension Plan”) and Loomis Sayles Employees’ Profit Sharing Retirement Plan (“Retirement Plan”) held shares of the Funds representing the following percentages of the Funds’ net assets:
Fund | Pension Plan | Retirement Plan | Total Affiliated Ownership | |||||||||
Small Cap Growth Fund | 0.18% | 1.38% | 1.56% | |||||||||
Small Cap Value Fund | 0.35% | 3.91% | 4.26% | |||||||||
Small/Mid Cap Growth Fund | — | 14.46% | 14.46% | |||||||||
Investment activities of affiliated shareholders could have material impacts on the Funds.
6. Class-Specific Transfer Agent Fees and Expenses. Transfer agent fees and expenses attributable to Institutional Class, Retail Class and Admin Class are allocated on apro rata basis to each class based on the relative net assets of each class to the total net assets of those classes. Transfer agent fees and expenses attributable to Class N are allocated to Class N.
For the year ended September 30, 2019, the Funds incurred the following class-specific transfer agent fees and expenses (includingsub-transfer agent fees, where applicable):
| Transfer Agent Fees and Expenses | ||||||||||||||||
Fund | Institutional Class | Retail Class | Admin Class | Class N | ||||||||||||
Small Cap Growth Fund | $ | 1,073,889 | $ | 133,017 | $ | — | $ | 2,219 | ||||||||
Small Cap Value Fund | 481,548 | 155,099 | 17,723 | 681 | ||||||||||||
Small/Mid Cap Growth Fund | 2,908 | — | — | — | ||||||||||||
7. Line of Credit. Each Fund, together with certain other funds of Natixis Funds Trusts, Loomis Sayles Funds Trusts and Natixis ETF Trust, entered into a $400,000,000 committed unsecured line of credit provided by State Street Bank. Any one Fund may borrow up to $350,000,000 under the line of credit agreement (as long as all borrowings by all Funds in the aggregate do not exceed the $400,000,000 limit at any time), subject to
65 |
Table of Contents
Notes to Financial Statements – continued
September 30, 2019
each Fund’s investment restrictions and its contractual obligations under the line of credit. Interest is charged to the Funds based upon the terms set forth in the agreement. In addition, a commitment fee of 0.15% per annum, payable at the end of each calendar quarter, is accrued and apportioned among the participating funds based on their average daily unused portion of the line of credit. The Funds paid an arrangement fee, an upfront fee, and certain other legal fees in connection with the line of credit agreement, which are being amortized over a period of 364 days and are reflected in legal fees and/or miscellaneous expenses on the Statements of Operations. The unamortized balance is reflected as prepaid expenses on the Statements of Assets and Liabilities.
For the year ended September 30, 2019, Small Cap Growth Fund had an average daily balance on the line of credit (for those days on which there were borrowings) of $111,196,100 at a weighted average interest rate of 3.49%. Interest expense incurred was $10,790.
8. Concentration of Ownership. From time to time, a Fund may have a concentration of one or more accounts constituting a significant percentage of shares outstanding. Investment activities by holders of such accounts could have material impacts on the Funds. As of September 30, 2019, based on management’s evaluation of the shareholder account base, the Funds had accounts representing controlling ownership of more than 5% of the Fund’s total outstanding shares. The number of such accounts, based on accounts that represent more than 5% of an individual class of shares, and the aggregate percentage of net assets represented by such holdings were as follows:
Fund | Number of 5% Non-Affiliated Account Holders | Percentage of Non-Affiliated Ownership | Percentage of Affiliated Ownership (Note 5f) | Total Percentage of Ownership | ||||||||
Small Cap Value Fund | 1 | 6.32% | — | 6.32% | ||||||||
Small/Mid Cap Growth Fund | 4 | 52.63% | 14.46% | 67.09% | ||||||||
Omnibus shareholder accounts for which Natixis Advisors understands that the intermediary has discretion over the underlying shareholder accounts or investment models where a shareholder account may be invested for anon-discretionary customer are included in the table above. For other omnibus accounts, the Funds do not have information on the individual shareholder accounts underlying the omnibus accounts; therefore, there could be other 5% shareholders in addition to those disclosed in the table above.
| 66
Table of Contents
Notes to Financial Statements – continued
September 30, 2019
9. Capital Shares. Each Fund may issue an unlimited number of shares of beneficial interest, without par value. Transactions in capital shares were as follows:
| Small Cap Growth Fund | ||||||||||||||||
| Year Ended September 30, 2019 | Year Ended September 30, 2018 | |||||||||||||||
| Institutional Class | Shares | Amount | Shares | Amount | ||||||||||||
Issued from the sale of shares | 11,579,961 | $ | 308,840,843 | 5,754,255 | $ | 164,470,396 | ||||||||||
Issued in connection with the reinvestment of distributions | 3,229,384 | 71,175,640 | 3,526,960 | 89,866,953 | ||||||||||||
Redeemed | (9,640,609 | ) | (255,383,227 | ) | (10,014,456 | ) | (275,865,186 | ) | ||||||||
|
|
|
|
|
|
|
| |||||||||
Net change | 5,168,736 | $ | 124,633,256 | (733,241 | ) | $ | (21,527,837 | ) | ||||||||
|
|
|
|
|
|
|
| |||||||||
| Retail Class | ||||||||||||||||
Issued from the sale of shares | 1,457,788 | $ | 35,354,241 | 1,440,364 | $ | 38,533,569 | ||||||||||
Issued in connection with the reinvestment of distributions | 580,575 | 11,675,362 | 555,428 | 13,074,766 | ||||||||||||
Redeemed | (2,734,300 | ) | (66,088,287 | ) | (1,512,825 | ) | (39,740,093 | ) | ||||||||
|
|
|
|
|
|
|
| |||||||||
Net change | (695,937 | ) | $ | (19,058,684 | ) | 482,967 | $ | 11,868,242 | ||||||||
|
|
|
|
|
|
|
| |||||||||
| Class N | ||||||||||||||||
Issued from the sale of shares | 14,891,081 | $ | 407,213,957 | 6,071,292 | $ | 171,038,280 | ||||||||||
Issued in connection with the reinvestment of distributions | 2,040,644 | 45,322,697 | 1,378,059 | 35,305,861 | ||||||||||||
Redeemed | (9,488,573 | ) | (252,762,328 | ) | (1,311,117 | ) | (37,531,530 | ) | ||||||||
|
|
|
|
|
|
|
| |||||||||
Net change | 7,443,152 | $ | 199,774,326 | 6,138,234 | $ | 168,812,611 | ||||||||||
|
|
|
|
|
|
|
| |||||||||
Increase from capital share transactions | 11,915,951 | $ | 305,348,898 | 5,887,960 | $ | 159,153,016 | ||||||||||
|
|
|
|
|
|
|
| |||||||||
| Small Cap Value Fund | ||||||||||||||||
| Year Ended September 30, 2019 | Year Ended September 30, 2018 | |||||||||||||||
| Institutional Class | Shares | Amount | Shares | Amount | ||||||||||||
Issued from the sale of shares | 1,885,997 | $ | 52,720,402 | 2,693,880 | $ | 94,890,273 | ||||||||||
Issued in connection with the reinvestment of distributions | 2,757,754 | 64,641,757 | 2,049,039 | 70,363,994 | ||||||||||||
Redeemed | (6,172,550 | ) | (172,631,075 | ) | (5,895,445 | ) | (207,624,212 | ) | ||||||||
|
|
|
|
|
|
|
| |||||||||
Net change | (1,528,799 | ) | $ | (55,268,916 | ) | (1,152,526 | ) | $ | (42,369,945 | ) | ||||||
|
|
|
|
|
|
|
| |||||||||
67 |
Table of Contents
Notes to Financial Statements – continued
September 30, 2019
9. Capital Shares – continued
| Small Cap Value Fund – continued | ||||||||||||||||
| Year Ended September 30, 2019 | Year Ended September 30, 2018 | |||||||||||||||
| Retail Class | Shares | Amount | Shares | Amount | ||||||||||||
Issued from the sale of shares | 248,433 | $ | 6,930,683 | 283,804 | $ | 9,876,474 | ||||||||||
Issued in connection with the reinvestment of distributions | 1,013,991 | 23,352,213 | 802,859 | 27,144,677 | ||||||||||||
Redeemed | (2,489,201 | ) | (67,155,838 | ) | (1,902,508 | ) | (66,646,118 | ) | ||||||||
|
|
|
|
|
|
|
| |||||||||
Net change | (1,226,777 | ) | $ | (36,872,942 | ) | (815,845 | ) | $ | (29,624,967 | ) | ||||||
|
|
|
|
|
|
|
| |||||||||
| Admin Class | ||||||||||||||||
Issued from the sale of shares | 164,641 | $ | 4,244,622 | 189,958 | $ | 6,328,263 | ||||||||||
Issued in connection with the reinvestment of distributions | 103,280 | 2,261,822 | 78,301 | 2,544,008 | ||||||||||||
Redeemed | (505,156 | ) | (12,991,234 | ) | (388,643 | ) | (12,936,046 | ) | ||||||||
|
|
|
|
|
|
|
| |||||||||
Net change | (237,235 | ) | $ | (6,484,790 | ) | (120,384 | ) | $ | (4,063,775 | ) | ||||||
|
|
|
|
|
|
|
| |||||||||
| Class N | ||||||||||||||||
Issued from the sale of shares | 1,949,203 | $ | 53,692,224 | 829,306 | $ | 29,863,505 | ||||||||||
Issued in connection with the reinvestment of distributions | 779,733 | 18,276,952 | 479,347 | 16,470,360 | ||||||||||||
Redeemed | (2,136,634 | ) | (60,278,030 | ) | (596,844 | ) | (21,132,571 | ) | ||||||||
|
|
|
|
|
|
|
| |||||||||
Net change | 592,302 | $ | 11,691,146 | 711,809 | $ | 25,201,294 | ||||||||||
|
|
|
|
|
|
|
| |||||||||
Decrease from capital share transactions | (2,400,509 | ) | $ | (86,935,502 | ) | (1,376,946 | ) | $ | (50,857,393 | ) | ||||||
|
|
|
|
|
|
|
| |||||||||
| Small/Mid Cap Growth Fund | ||||||||||||||||
| Year Ended September 30, 2019 | Year Ended September 30, 2018 | |||||||||||||||
| Institutional Class | Shares | Amount | Shares | Amount | ||||||||||||
Issued from the sale of shares | 2,433,625 | $ | 23,898,389 | 925,420 | $ | 12,965,329 | ||||||||||
Issued in connection with the reinvestment of distributions | 540,127 | 4,234,598 | — | — | ||||||||||||
Redeemed | (681,600 | ) | (7,115,964 | ) | (981,019 | ) | (14,098,148 | ) | ||||||||
|
|
|
|
|
|
|
| |||||||||
Increase (decrease) from capital share transactions | 2,292,152 | $ | 21,017,023 | (55,599 | ) | $ | (1,132,819 | ) | ||||||||
|
|
|
|
|
|
|
| |||||||||
| 68
Table of Contents
Notes to Financial Statements – continued
September 30, 2019
10. Subsequent Event. Effective October 1, 2019, Small/Mid Cap Growth Fund will begin offering Class N shares to investors. Class N shares will be offered with an initial minimum investment of $1,000,000. There will be no initial minimum investment for certain retirement plans and funds of funds that are distributed by Natixis Distribution. Also effective October 1, 2019, Institutional Class shares of Small/Mid Cap Growth Fund will be subject to a minimum initial investment of $100,000.
69 |
Table of Contents
Report of Independent Registered Public Accounting Firm
To the Board of Trustees of Loomis Sayles Funds I and Loomis Sayles Funds II and Shareholders of Loomis Sayles Small Cap Value Fund, Loomis Sayles Small Cap Growth Fund and Loomis Sayles Small/Mid Cap Growth Fund:
Opinions on the Financial Statements
We have audited the accompanying statements of assets and liabilities, including the portfolios of investments, of Loomis Sayles Small Cap Value Fund (one of the funds constituting Loomis Sayles Funds I), and Loomis Sayles Small Cap Growth Fund and Loomis Sayles Small/Mid Cap Growth Fund (two of the funds constituting Loomis Sayles Funds II) (hereafter collectively referred to as the “Funds”) as of September 30, 2019, the related statements of operations for the year ended September 30, 2019, the statements of changes in net assets for each of the two years in the period ended September 30, 2019, including the related notes, and the financial highlights for each of the periods indicated therein (collectively referred to as the “financial statements”). In our opinion, the financial statements present fairly, in all material respects, the financial position of each of the Funds as of September 30, 2019, the results of each of their operations for the year then ended, the changes in each of their net assets for each of the two years in the period ended September 30, 2019 and each of the financial highlights for each of the periods indicated therein in conformity with accounting principles generally accepted in the United States of America.
Basis for Opinions
These financial statements are the responsibility of the Funds’ management. Our responsibility is to express an opinion on the Funds’ financial statements based on our audits. We are a public accounting firm registered with the Public Company Accounting Oversight Board (United States) (PCAOB) and are required to be independent with respect to the Funds in accordance with the U.S. federal securities laws and the applicable rules and regulations of the Securities and Exchange Commission and the PCAOB.
We conducted our audits of these financial statements in accordance with the standards of the PCAOB. Those standards require that we plan and perform the audit to obtain reasonable assurance about whether the financial statements are free of material misstatement, whether due to error or fraud.
Our audits included performing procedures to assess the risks of material misstatement of the financial statements, whether due to error or fraud, and performing procedures that respond to those risks. Such procedures included examining, on a test basis, evidence regarding the amounts and disclosures in the financial statements. Our audits also included evaluating the accounting principles used and significant estimates made by management, as well as evaluating the overall presentation of the financial statements. Our procedures included confirmation of securities owned as of September 30, 2019 by
| 70
Table of Contents
Report of Independent Registered Public Accounting Firm
correspondence with the custodian, and brokers; when replies were not received from brokers, we performed other auditing procedures. We believe that our audits provide a reasonable basis for our opinions.
PricewaterhouseCoopers LLP
Boston, Massachusetts
November 21, 2019
We have served as the auditor of one or more investment companies in the Natixis Investment Company Complex since at least 1995. We have not determined the specific year we began serving as auditor.
71 |
Table of Contents
2019 U.S. Tax Distribution Information to Shareholders (Unaudited)
Corporate Dividends Received Deduction. For the fiscal year ended September 30, 2019, a percentage of dividends distributed by the Fund listed below qualifies for the dividends received deduction for corporate shareholders. This percentage is as follows:
Fund | Qualifying Percentage | |||
Small Cap Value | 100.00% | |||
Capital Gains Distributions. Pursuant to Internal Revenue Section 852(b), the following Funds paid distributions, which have been designated as capital gains distributions for the fiscal year ended September 30, 2019, unless subsequently determined to be different.
Fund | Amount | |||
Small Cap Growth | $ | 131,384,945 | ||
Small Cap Value | 110,962,781 | |||
Small/Mid Cap Growth | 4,717,064 | |||
Qualified Dividend Income. For the fiscal year ended September 30, 2019, the Fund below will designate up to the maximum amount allowable pursuant to the Internal Revenue Code as qualified dividend income eligible for reduced tax rates. These lower rates range from 0% to 20% depending on an individual’s tax bracket. If the Fund pays a distribution during calendar year 2019, complete information will be reported in conjunction with Form1099-DIV.
Fund |
Small Cap Value |
| 72
Table of Contents
Trustee and Officer Information
The tables below provide certain information regarding the trustees and officers of Loomis Sayles Funds I and Loomis Sayles Funds II (the “Trusts”). Unless otherwise indicated, the address of all persons below is 888 Boylston Street, Suite 800, Boston, MA 02199-8197. The Funds’ Statement of Additional Information includes additional information about the trustees of the Trusts and is available by calling Loomis Sayles Funds at800-633-3330.
| Name and Year of Birth | Position(s) Held Term of Office1 | Principal Occupation(s) During Past 5 Years | Number of Portfolios in Fund Complex Overseen2 and Other Directorships Held During Past 5 Years | Experience, Qualifications, Attributes, Skills for Board Membership | ||||
| INDEPENDENT TRUSTEES | ||||||||
Kenneth A. Drucker (1945) | Chairperson of the Board of Trustees since January 2017 Trustee since 2008 Ex Officio member of Audit Committee, Contract Review Committee and Governance Committee | Retired | 52 None | Significant experience on the Board and on the boards of other business organizations (including at investment companies); executive experience (including as treasurer of an aerospace, automotive, and metal manufacturing corporation) | ||||
| Edmond J. English (1953) | Trustee since 2013 Audit Committee Member and Governance Committee Member | Executive Chairman of Bob’s Discount Furniture (retail) | 52 Director, Burlington Stores, Inc. (retail) | Significant experience on the Board and on the boards of other business organizations (including retail companies and a bank); executive experience (including at a retail company) | ||||
Richard A. Goglia (1951) | Trustee since 2015 Contract Review Committee Member and Governance Committee Member | Retired; formerly Vice President and Treasurer of Raytheon Company (defense) | 52 None | Experience on the Board and executive experience (including his role as vice president and treasurer of a defense company and experience at a financial services company) | ||||
73 |
Table of Contents
Trustee and Officer Information – continued
| Name and Year of Birth | Position(s) Held Term of Office1 | Principal Occupation(s) During Past 5 Years | Number of Portfolios in Fund Complex Overseen2 and Other Directorships Held During Past 5 Years | Experience, Qualifications, Attributes, Skills for Board Membership | ||||
| INDEPENDENT TRUSTEES– continued | ||||||||
Wendell J. Knox (1948) | Trustee since 2009 Chairperson of Contract Review Committee | Director of Abt Associates Inc. (research and consulting) | 52 Director, The Hanover Insurance Group (property and casualty insurance); formerly, Director, Eastern Bank (bank) | Significant experience on the Board and on the boards of other business organizations (including at a bank and at a property and casualty insurance firm); executive experience (including roles as president and chief executive officer of a research and consulting company) | ||||
| Martin T. Meehan(1956) | Trustee since 2012 Audit Committee Member | President, University of Massachusetts; formerly, Chancellor and faculty member, University of Massachusetts Lowell | 52 None | Significant experience on the Board and on the boards of other business organizations; experience as President of the University of Massachusetts; government experience (including as a member of the U.S. House of Representatives); academic experience | ||||
Maureen B. Mitchell (1951) | Trustee since 2017 Contract Review Committee Member and Governance Committee Member | Retired; formerly President, Global Sales and Marketing, GE Asset Management, Inc. (financial services) | 52 Director, Sterling Bancorp (Bank) | Experience on the Board; financial services industry and executive experience (including role as president of global sales and marketing at a financial services company) | ||||
| 74
Table of Contents
Trustee and Officer Information – continued
| Name and Year of Birth | Position(s) Held Term of Office1 | Principal Occupation(s) During Past 5 Years | Number of Portfolios in Fund Complex Overseen2 and Other Directorships Held During Past 5 Years | Experience, Qualifications, Attributes, Skills for Board Membership | ||||
| INDEPENDENT TRUSTEES– continued | ||||||||
James P. Palermo (1955) | Trustee since 2016 Contract Review Committee Member | Founding Partner, Breton Capital Management, LLC (private equity); Partner, STEP Partners, LLC (private equity) | 52 Director, FutureFuel.io (Chemicals and Biofuels) | Experience on the Board; financial services industry and executive experience (including roles as chief executive officer of client management and asset servicing for a banking and financial services company) | ||||
Erik R. Sirri (1958) | Trustee since 2009 Chairperson of the Audit Committee | Professor of Finance at Babson College | 52 None | Significant experience on the Board; experience as Director of the Division of Trading and Markets at the Securities and Exchange Commission; academic experience; training as an economist | ||||
Peter J. Smail (1952) | Trustee since 2009 Audit Committee Member and Governance Committee Member | Retired | 52 None | Significant experience on the Board; mutual fund industry and executive experience (including roles as president and chief executive officer for an investment adviser) | ||||
75 |
Table of Contents
Trustee and Officer Information – continued
| Name and Year of Birth | Position(s) Held Term of Office1 | Principal Occupation(s) During Past 5 Years | Number of Portfolios in Fund Complex Overseen2 and Other Directorships Held During Past 5 Years | Experience, Qualifications, Attributes, Skills for Board Membership | ||||
| INDEPENDENT TRUSTEES– continued | ||||||||
Kirk A. Sykes (1958) | Trustee since 2019 Contract Review Committee Member | Managing Director of Accordia Partners, LLC (real estate development); President of Primary Corporation (real estate development); Managing Principal of Merrick Capital Partners (infrastructure finance); formerly, President of Urban Strategy America Fund (real estate fund manager) | 52 Trustee, Eastern Bank (bank); formerly Director, Ares Commercial Real Estate Corporation (real estate investment trust) | Experience on the Board and significant experience on the boards of other business organizations (including real estate companies and banks) | ||||
Cynthia L. Walker (1956) | Trustee since 2005 Chairperson of the Governance Committee and Audit Committee Member | Deputy Dean for Finance and Administration, Yale University School of Medicine | 52 None | Significant experience on the Board; executive experience in a variety of academic organizations (including roles as dean for finance and administration) | ||||
| INTERESTED TRUSTEES | ||||||||
Kevin P. Charleston3 (1965) One Financial Center Boston, MA 02111 | Trustee since 2015 President and Chief Executive Officer of Loomis Sayles Funds I since 2015 | President, Chief Executive Officer and Chairman of the Board of Directors; formerly, Chief Financial Officer, Loomis, Sayles & Company, L.P. | 52 None | Experience on the Board; continuing service as President, Chief Executive Officer and Chairman of the Board of Directors of Loomis, Sayles & Company, L.P. | ||||
| 76
Table of Contents
Trustee and Officer Information – continued
| Name and Year of Birth | Position(s) Held Term of Office1 | Principal Occupation(s) During Past 5 Years | Number of Portfolios in Fund Complex Overseen2 and Other Directorships Held During Past 5 Years | Experience, Qualifications, Attributes, Skills for Board Membership | ||||
| INTERESTED TRUSTEES– continued | ||||||||
David L. Giunta4 (1965) | Trustee since 2011 President of Loomis Sayles Funds II and Executive Vice President of Loomis Sayles Funds I since 2008; Chief Executive Officer of Loomis Sayles Funds II since 2015 | President and Chief Executive Officer, Natixis Advisors, L.P., Natixis Distribution, L.P., Natixis Distribution Corporation and Chairman of the Board of Natixis Distribution Corporation | 52 None | Significant experience on the Board; experience as President and Chief Executive Officer, Natixis Advisors, L.P., Natixis Distribution, L.P., Natixis Distribution Corporation and Chairman of the Board of Natixis Distribution Corporation | ||||
| 1 | Each trustee serves until retirement, resignation or removal from the Board. The current retirement age is 75. The position of Chairperson of the Board is appointed for a three-year term. Mr. Drucker was appointed to serve an additional one year term as the Chairperson of the Board on June 12, 2019. |
| 2 | The trustees of the Trusts serve as trustees of a fund complex that includes all series of the Trusts, Natixis Funds Trust I, Natixis Funds Trust II, Natixis Funds Trust IV, Gateway Trust and Natixis ETF Trust (collectively, the “Fund Complex”). |
| 3 | Mr. Charleston is deemed an “interested person” of the Trusts because he holds the following positions with an affiliated person of the Trusts: President, Chief Executive Officer and Chairman of the Board of Directors of Loomis, Sayles & Company, L.P. |
| 4 | Mr. Giunta is deemed an “interested person” of the Trusts because he holds the following positions with an affiliated person of the Trusts: President and Chief Executive Officer, Natixis Advisors, L.P., Natixis Distribution, L.P., Natixis Distribution Corporation and Chairman of the Board of Natixis Distribution Corporation. |
77 |
Table of Contents
Trustee and Officer Information – continued
| Name and Year of Birth | Position(s) Held with the Trusts | Term of Office1 and Length of Time Served | Principal Occupation(s) During Past 5 Years2 | |||
| OFFICERS OF THE TRUSTS | ||||||
Daniel J. Fuss (1933) One Financial Center Boston, MA 02111 | Executive Vice President | Since 2003 | Vice Chairman and Director, Loomis, Sayles & Company, L.P. | |||
Russell L. Kane (1969) | Secretary, Clerk and Chief Legal Officer | Since 2016 | Executive Vice President, General Counsel, Secretary and Clerk, Natixis Distribution Corporation, Natixis Advisors, L.P. and Natixis Distribution, L.P.; formerly, Chief Compliance Officer for Mutual Funds, Senior Vice President, Deputy General Counsel, Assistant Secretary and Assistant Clerk, Natixis Distribution Corporation, Natixis Advisors, L.P. and Natixis Distribution, L.P. | |||
Michael C. Kardok (1959) | Treasurer, Principal Financial and Accounting Officer | Since 2004 | Senior Vice President, Natixis Advisors, L.P. and Natixis Distribution, L.P. | |||
Kirk D. Johnson (1981) | Chief Compliance Officer, Assistant Secretary and Anti-Money Laundering Officer | Since 2018 | Senior Vice President, Deputy General Counsel, Assistant Secretary and Assistant Clerk, Natixis Distribution Corporation, Natixis Advisors, L.P. and Natixis Distribution, L.P.; formerly, Associate General Counsel, Natixis Distribution, L.P.; Vice President and Counsel, Natixis Investment Managers, L.P. | |||
| 1 | Each officer of the Trusts serves for an indefinite term in accordance with the Trusts’ currentby-laws until the date his or her successor is elected and qualified, or until he or she sooner dies, retires, is removed or becomes disqualified. |
| 2 | Each person listed above, except as noted, holds the same position(s) with the Fund Complex. Previous positions during the past five years with Natixis Distribution, L.P., Natixis Advisors, L.P. or Loomis, Sayles & Company, L.P. are omitted, if not materially different from an officer’s current position with such entity. |
| 78
Table of Contents


Annual Report
September 30, 2019
Loomis Sayles Intermediate Duration Bond Fund
Loomis Sayles Limited Term Government and Agency Fund
| Portfolio Review | 1 | |||
| Portfolio of Investments | 17 | |||
| Financial Statements | 43 | |||
| Notes to Financial Statements | 55 | |||
IMPORTANT NOTICE TO SHAREHOLDERS
Beginning on January 1, 2021, as permitted by regulations adopted by the Securities and Exchange Commission, paper copies of shareholder reports like this one will no longer be sent by mail, unless you specifically request paper copies of the reports from the Fund or from your financial intermediary, such as a broker-dealer or bank. Instead, the reports will be made available on the Funds’ website, and you will be notified by mail each time a report is posted and provided with a website link to access the report. If you wish to continue receiving paper copies of your shareholder reports after January 1, 2021, you can inform the Fund at any time by calling 1-800-225-5478. If you hold your account with a financial intermediary and you wish to continue receiving paper copies after January 1, 2021, you should call your financial intermediary directly. Paper copies are provided free of charge, and your election to receive reports in paper will apply to all funds held with the Natixis Funds complex. If you have already elected to receive shareholder reports electronically, you will not be affected by this change and you need not take any action. You currently may elect to receive shareholder reports and other communications from the Fund or your financial intermediary electronically atwww.icsdelivery.com/natixisfunds.
Table of Contents
LOOMIS SAYLES INTERMEDIATE DURATION BOND FUND
| Managers | Symbols | |
| Daniel Conklin, CFA®* | Class A LSDRX | |
| Christopher T. Harms | Class C LSCDX | |
| Clifton V. Rowe, CFA® | Class N LSDNX | |
| Kurt L. Wagner, CFA®, CIC | Class Y LSDIX | |
| Loomis Sayles & Company, L.P. | ||
| * | Daniel Conklin was named Associate Portfolio Manager effective October 1, 2019. |
Investment Goal
The Fund’s investment objective is above-average total return through a combination of current income and capital appreciation.
Market Conditions
Global fixed income markets delivered healthy gains over the12-month period, reflecting the combination of slowing economic growth, persistently low inflation and the US Federal Reserve’s (Fed’s) shift toward an increasingly accommodative monetary policy. As recently as the fourth quarter of 2018, the markets generally anticipated that the Fed would continue to raise interest rates for at least another 12 months. As growth slowed in late 2018, however, the Fed indicated that its next move would likely be to reduce interest rates. The Fed indeed cut rates by a quarter point on both August 1 and September 19, 2019, bringing its benchmark federal funds target rate to a range of 1.75% to 2.00%. In addition, the markets appeared to be pricing in the likelihood of further reductions bymid-2020. The dramatic change in the outlook for Fed policy was the leading factor in the strong, broad-based rally in bonds.
These circumstances helped fuel gains for US Treasuries, with longer-term issues registering the largest advance. The yield on the benchmark10-year Treasury note, after reaching a peak of 3.23% in October 2018, fell to 1.47% in early September — near its lowest level of the past decade. (Prices and yields move in opposite directions.)
Investment grade corporates generated robust returns and finished the period as the top performing major fixed income category. In addition to benefiting from the rally in rate-sensitive assets, investment grade corporates were boosted by both positive earnings trends and healthy investor risk appetites.
Securitized assets generated strong absolute returns, but their lower interest rate sensitivity caused them to lag Treasuries and investment grade corporates. Commercial mortgage backed securities (CMBS) delivered the largest gains, followed by mortgage-backed-securities (MBS) and asset-backed securities (ABS), respectively.
Performance Results
For the 12 months ended September 30, 2019, Class Y shares of the Loomis Sayles Intermediate Duration Bond Fund returned 8.38% at net asset value. The Fund
1 |
Table of Contents
outperformed its benchmark, the Bloomberg Barclays U.S. Intermediate Government/Credit Bond Index, which returned 8.17%.
Explanation of Fund Performance
A meaningful underweight to US Treasuries proved beneficial as the sector underperformed risk assets during the period. Corporate bond exposure was a strong source of positive performance over the period as corporates outperformed US Treasuries of comparable duration (and corresponding interest rate sensitivity). Positive contributions within the Fund’s allocation to corporates were driven by an overweight to financial issuers, most notably within banking and insurance. Additionally, security selection within industrial-related segments such as communications, basic industry and consumer cyclical also contributed to performance. Finally,out-of-benchmark positioning in securitized credit was advantageous over the 12 months, most notably issuer choices withinnon-agency CMBS and car loan receivables within ABS.
On the downside, exposure to agency-backed securitized assets marginally detracted from performance. Security selection within student loan names was also a slight constraint on relative performance during the period. Finally, the Fund’s allocation to government- related sectors weighed modestly on return.
Outlook
We believe that the Fed will cut rates at least one more time in 2019 depending on the progress of trade talks and economic indicators. In our opinion, the cuts should help ameliorate yield curve inversion, stimulate activity and ease concerns about the end of the credit cycle.1 We believe these cuts represent a“mid-cycle adjustment” and we do not expect a US recession to take hold over the next twelve months.
Corporate fundamentals remain consistent with a credit cycle in late expansion mode. Top line revenues have plateaued, margins have started to deteriorate, leverage is elevated, and businesses are concerned with the economic environment, particularly given the ongoing discussions around trade. Primary cycle risks continue to include the pace of global growth, US trade policy, strong dollar, global central bank policy accommodation and the potential for further escalation of Middle East tensions.
We continue to favor sectors offering higher yield potential than Treasuries and therefore remain underweight government bonds given low yields.
Additionally, we continue to be overweight credit. We are focused on security selection opportunities, buying new issues with favorable concessions and secondary market bonds that offer potentially favorable risk/return profiles. We remain overweight both agency andnon-agency CMBS, particularly senior parts of the capital stack.
Within MBS, we are focused on securities with limited prepayment risk. The high-quality ABS sector remains attractive relative to government bonds. Consumer fundamentals continue to be healthy and we still favor auto loans and credit card receivables within ABS.
| 2
Table of Contents
LOOMIS SAYLES INTERMEDIATE DURATION BOND FUND
We have been maintaining a higher yield and exposure to more credit-sensitive sectors relative to the benchmark. We continue to monitor the portfolio and diversify our holdings with an eye toward minimizing undue exposure to macroeconomic risk and/or issuer-specific events.
| 1 | A credit cycle is a cyclical pattern that follows credit availability and corporate health. |
Hypothetical Growth of $100,000 Investment in Class Y Shares
September 30, 2009 through September 30, 20191,4,5
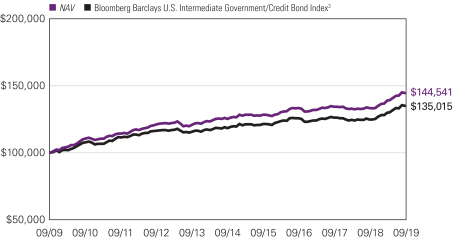
3 |
Table of Contents
Average Annual Total Returns — September 30, 20194,5
| Life of | Expense Ratios6 | |||||||||||||||||||||||
| 1 Year | 5 Years | 10 Years | Class N | Gross | Net | |||||||||||||||||||
| Class Y (Inception 1/28/98)1 | ||||||||||||||||||||||||
| NAV | 8.38 | % | 2.91 | % | 3.75 | % | — | % | 0.45 | % | 0.40 | % | ||||||||||||
| Class A (Inception 5/28/10)1 | ||||||||||||||||||||||||
| NAV | 8.11 | 2.65 | 3.50 | — | 0.70 | 0.65 | ||||||||||||||||||
| With 4.25% Maximum Sales Charge | 3.54 | 1.77 | 3.05 | — | ||||||||||||||||||||
| Class C (Inception 8/31/16)1 | ||||||||||||||||||||||||
| NAV | 7.28 | 1.86 | 2.64 | — | 1.45 | 1.40 | ||||||||||||||||||
| With CDSC2 | 6.28 | 1.86 | 2.64 | — | ||||||||||||||||||||
| Class N (Inception 2/01/19) | ||||||||||||||||||||||||
NAV | — | — | — | 6.19 | 0.40 | 0.35 | ||||||||||||||||||
| Comparative Performance | ||||||||||||||||||||||||
Bloomberg Barclays U.S. Intermediate Government/Credit Bond Index3 | 8.17 | 2.68 | 3.05 | 5.70 | ||||||||||||||||||||
Performance data shown represents past performance and is no guarantee of, and not necessarily indicative of, future results. Total return and value will vary, and you may have a gain or loss when shares are sold. Current performance may be lower or higher than quoted. For most recent month-end performance, visit im.natixis.com. Performance for other share classes will be greater or less than shown based on differences in fees and sales charges. You may not invest directly in an index. Performance for periods less than one year is cumulative, not annualized. Returns reflect changes in share price and reinvestment of dividends and capital gains, if any. The table(s) do not reflect taxes shareholders might owe on any fund distributions or when they redeem their shares.
| 1 | As of August 31, 2016, the Fund’s Retail Class shares and Institutional Class shares were redesignated as Class A shares and Class Y shares, respectively. Accordingly, the returns shown in the table for Class A shares prior to August 31, 2016 are those of Retail Class shares, restated to reflect the sales loads of Class A shares, and the returns in the table for Class Y shares prior to August 31, 2016 are those of Institutional Class shares. Prior to the inception of Retail Class shares (May 28, 2010), performance is that of Institutional Class shares, restated to reflect the higher net expenses and sales loads of Class A shares. Prior to the inception of Class C shares (August 31, 2016), performance is that of Retail Class shares, restated to reflect the higher net expenses and sales loads of Class C shares. |
| 2 | Class C shares performance assumes a 1% CDSC applied when you sell shares within one year of purchase. |
| 3 | The Bloomberg Barclays U.S. Intermediate Government/Credit Bond Index includes securities in the intermediate maturity range within the Government and Credit Indices. The Government Index includes treasuries (i.e., public obligations of the U.S. Treasury that have remaining maturities of more than one year) and agencies (i.e., publicly issued debt of U.S. Government agencies, quasi-federal corporations, and corporate or foreign debt guaranteed by the U.S. Government). The Credit Index includes publicly issued U.S. corporate and foreign debentures and secured notes that meet specified maturity, liquidity, and quality requirements. |
| 4 | The Fund revised its investment strategy on May 28, 2010; performance may have been different had the current investment strategy been in place for all periods shown. |
| 5 | Fund performance has been increased by fee waivers and/or expense reimbursements, if any, without which performance would have been lower. |
| 6 | Expense ratios are as shown in the Fund’s prospectus in effect as of the date of this report. The expense ratios for the current reporting period can be found in the Financial Highlights section of this report under Ratios to Average Net Assets. Net expenses reflect contractual expense limitations set to expire on 1/31/20. When a Fund’s expenses are below the limitation, gross and net expense ratios will be the same. See Note 6 of the Notes to Financial Statements for more information about the Fund’s expense limitations. |
| 4
Table of Contents
LOOMIS SAYLES LIMITED TERM GOVERNMENT AND AGENCY FUND
| Managers | Symbols | |
| Daniel Conklin, CFA®* | Class A NEFLX | |
| Christopher T. Harms | Class C NECLX | |
| Clifton V. Rowe, CFA® | Class N LGANX | |
| Kurt L. Wagner, CFA®, CIC | Class Y NELYX | |
| Loomis, Sayles & Company, L.P. | ||
| * | Daniel Conklin was named Associate Portfolio Manager effective October 1, 2019. |
Investment Goal
The Fund seeks high current return consistent with preservation of capital.
Market Conditions
Global fixed income markets delivered healthy gains over the12-month period, reflecting the combination of slowing economic growth, persistently low inflation and the US Federal Reserve’s (Fed’s) shift toward an increasingly accommodative monetary policy. As recently as the fourth quarter of 2018, the markets generally anticipated that the Fed would continue to raise interest rates for at least another 12 months. As growth slowed in late 2018, however, the Fed indicated that its next move would likely be to reduce interest rates.
The Fed indeed cut rates by a quarter point on both August 1 and September 19, 2019, bringing its benchmark federal funds target rate to a range of 1.75% to 2.00%. In addition, the markets appeared to be pricing in the likelihood of further reductions bymid-2020. The dramatic change in the outlook for Fed policy was the leading factor in the strong, broad-based rally in bonds.
These circumstances helped fuel gains for US Treasuries, with longer-term issues registering the largest advance. The yield on the benchmark10-year Treasury note, after reaching a peak of 3.23% in October 2018, fell to 1.47% in early September — near its lowest level of the past decade. (Prices and yields move in opposite directions.)
Securitized assets generated strong absolute returns, but their lower interest rate sensitivity caused them to lag Treasuries and investment grade corporates. Commercial mortgage-backed securities (CMBS) delivered the largest gains, followed by mortgage-backed securities (MBS) and asset-backed securities (ABS), respectively.
Performance Results
For the 12 months ended September 30, 2019, Class Y shares of the Loomis Sayles Limited Term Government and Agency Fund returned 4.67% at net asset value. The Fund underperformed its benchmark, the Bloomberg Barclays U.S.1-5 Year Government Bond Index, which returned 5.69%.
5 |
Table of Contents
Explanation of Fund Performance
The Fund’s positioning along the yield curve (which depicts the relationship among bond yields across the maturity spectrum) was the main detractor from relative return. The portfolio’s slightly shorter-than-benchmark stance with respect to duration (and corresponding sensitivity to changes in interest rates) weighed on results as yields fell. An underweight allocation to US Agency bonds acted as a constraint on performance as the sector outperformed comparable-duration Treasuries over the period. Finally, the Fund’s cash position detracted from relative return.
The Fund’s selection within securitized assets aided performance relative to the benchmark for the12-month period. On the agency-backed side of securitized assets, holdings of CMBS led positive contributions, while auto receivables within ABS contributed positively on thenon-agency side.
Outlook
Agency MBS spreads (the difference in yield between agency MBS and Treasuries of similar maturity) are more attractive with valuations near longer-term averages. Mortgages issued in recent years are relatively high quality compared with those issued in prior years. Therefore, we favor an underweight to recently issued30-year MBS and prefer MBS sectors less likely to face refinancing and extension risk, such as low loan balance mortgages and home equity conversion mortgages.
Within the commercial real estate sector,top-tier assets and markets have generally recovered and are at or above prior peak levels. We believe investment grade CMBS remain attractive.
We believe ABS currently offer an attractive combination of strong credit quality and enhanced yield. Within the sector we favor higher-yielding securities and bonds of less frequent issuers within ABS. Our analysis indicates the credit risk of these securities is inefficiently priced and they offer potentially attractive opportunities for additional yield.
| 6
Table of Contents
LOOMIS SAYLES LIMITED TERM GOVERNMENT AND AGENCY FUND
Hypothetical Growth of $100,000 Investment in Class Y Shares
September 30, 2009 through September 30, 20193
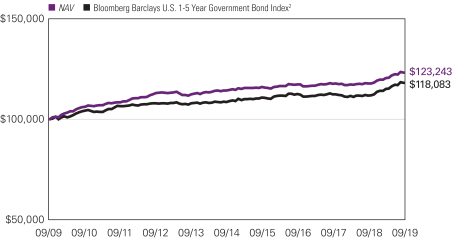
7 |
Table of Contents
Average Annual Total Returns — September 30, 20193
| Life of | Expense Ratios4 | |||||||||||||||||||||||
| 1 Year | 5 Years | 10 Years | Class N | Gross | Net | |||||||||||||||||||
| Class Y (Inception 3/31/94) | ||||||||||||||||||||||||
| NAV | 4.67 | % | 1.52 | % | 2.11 | % | — | % | 0.55 | % | 0.55 | % | ||||||||||||
| Class A (Inception 1/3/89) | ||||||||||||||||||||||||
| NAV | 4.42 | 1.27 | 1.85 | — | 0.80 | 0.80 | ||||||||||||||||||
| With 2.25% Maximum Sales Charge | 2.03 | 0.80 | 1.62 | — | ||||||||||||||||||||
| Class C (Inception 12/30/94) | ||||||||||||||||||||||||
| NAV | 3.64 | 0.51 | 1.09 | — | 1.55 | 1.55 | ||||||||||||||||||
| With CDSC1 | 2.64 | 0.51 | 1.09 | — | ||||||||||||||||||||
| Class N (Inception 2/1/17) | ||||||||||||||||||||||||
| NAV | 4.77 | — | — | 2.23 | 0.48 | 0.46 | ||||||||||||||||||
| Comparative Performance | ||||||||||||||||||||||||
Bloomberg Barclays U.S.1-5 Year Government Bond Index2 | 5.69 | 1.69 | 1.68 | 2.23 | ||||||||||||||||||||
Performance data shown represents past performance and is no guarantee of, and not necessarily indicative of, future results. Total return and value will vary, and you may have a gain or loss when shares are sold. Current performance may be lower or higher than quoted. For most recent month-end performance, visit im.natixis.com.Performance for other share classes will be greater or less than shown based on differences in fees and sales charges. You may not invest directly in an index. Performance for periods less than one year is cumulative, not annualized. Returns reflect changes in share price and reinvestment of dividends and capital gains, if any. The table(s) do not reflect taxes shareholders might owe on any fund distributions or when they redeem their shares.
| 1 | Class C shares performance assumes a 1% CDSC applied when you sell shares within one year of purchase. |
| 2 | The Bloomberg Barclays U.S. 1-5 Year Government Bond Index is a subindex of the Bloomberg Barclays U.S. Government Index, which is composed of the Bloomberg Barclays U.S. Treasury and U.S. Agency Indices. The Bloomberg Barclays U.S. Government Index includes Treasuries (public obligations of the U.S. Treasury that have remaining maturities of more than one year) and U.S. agency debentures (publicly issued debt of U.S. government agencies, quasi-federal corporations, and corporate or foreign debt guaranteed by the U.S. government). The Bloomberg Barclays U.S. Government Index is a component of the Bloomberg Barclays U.S. Government/Credit Index and the Bloomberg Barclays U.S. Aggregate Bond Index. |
| 3 | Fund performance has been increased by fee waivers and/or expense reimbursements, if any, without which performance would have been lower. |
| 4 | Expense ratios are as shown in the Fund’s prospectus in effect as of the date of this report. The expense ratios for the current reporting period can be found in the Financial Highlights section of this report under Ratios to Average Net Assets. Net expenses reflect contractual expense limitations set to expire on 1/31/20. When a Fund’s expenses are below the limitation, gross and net expense ratios will be the same. See Note 6 of the Notes to Financial Statements for more information about the Fund’s expense limitations. |
| 8
Table of Contents
ADDITIONAL INFORMATION
The views expressed in this report reflect those of the portfolio managers as of the dates indicated. The managers’ views are subject to change at any time without notice based on changes in market or other conditions. References to specific securities or industries should not be regarded as investment advice. Because the Fund is actively managed, there is no assurance that they will continue to invest in the securities or industries mentioned.
All investing involves risk, including the risk of loss. There is no assurance that any investment will meet its performance objectives or that losses will be avoided.
ADDITIONAL INDEX INFORMATION
This document may contain references to third party copyrights, indexes, and trademarks, each of which is the property of its respective owner. Such owner is not affiliated with Natixis Investment Managers or any of its related or affiliated companies (collectively “Natixis Affiliates”) and does not sponsor, endorse or participate in the provision of any Natixis Affiliates services, funds or other financial products.
The index information contained herein is derived from third parties and is provided on an “as is” basis. The user of this information assumes the entire risk of use of this information. Each of the third party entities involved in compiling, computing or creating index information disclaims all warranties (including, without limitation, any warranties of originality, accuracy, completeness, timeliness, non-infringement, merchantability and fitness for a particular purpose) with respect to such information.
PROXY VOTING INFORMATION
A description of the Natixis Funds’ proxy voting policies and procedures is available without charge, upon request, by calling Natixis Funds at 800-225-5478; on the Natixis Funds’ website at im.natixis.com; and on the Securities and Exchange Commission’s (“SEC”) website at www.sec.gov. Information regarding how the funds voted proxies relating to portfolio securities the most recent 12-month period ended June 30 is available from the Natixis Funds’ website and the SEC’s website.
QUARTERLY PORTFOLIO SCHEDULES
The Natixis Funds file complete schedules of portfolio holdings with the SEC for the first and third quarters of each fiscal year as an exhibit on Form N-PORT. The Funds’ Form N-PORT reports are available on the SEC’s website at www.sec.gov.
CFA® and Chartered Financial Analyst® are registered trademarks owned by the CFA Institute.
9 |
Table of Contents
UNDERSTANDING FUND EXPENSES
As a mutual fund shareholder, you incur different costs: transaction costs, including sales charges (loads) on purchases and contingent deferred sales charges on redemptions, and ongoing costs, including management fees, distribution and/or service fees (12b-1 fees), and other fund expenses. Certain exemptions may apply. These costs are described in more detail in the Funds’ prospectus. The following examples are intended to help you understand the ongoing costs of investing in the Funds and help you compare these with the ongoing costs of investing in other mutual funds.
The first line in the table of each class of Fund shares shows the actual account values and actual Fund expenses you would have paid on a $1,000 investment in the Fund from April 1, 2019 through September 30, 2019. To estimate the expenses you paid over the period, simply divide your account value by $1,000 (for example $8,600 account value divided by $1,000 = 8.6) and multiply the result by the number in the Expenses Paid During Period column as shown below for your class.
The second line in the table of each class of Fund shares provides information about hypothetical account values and hypothetical expenses based on the Fund’s actual expense ratios and an assumed rate of return of 5% per year before expenses, which is not the Fund’s actual return. The hypothetical account values and expenses may not be used to estimate the actual ending account balance or expenses you paid on your investment for the period. You may use this information to compare the ongoing costs of investing in the Fund to other funds. To do so, compare this 5% hypothetical example with the 5% hypothetical examples that appear in the shareholder reports of the other funds.
Please note that the expenses shown reflect ongoing costs only, and do not include any transaction costs, such as sales charges. Therefore, the second line in the table of each fund is useful in comparing ongoing costs only, and will not help you determine the relative costs of owning different funds. If transaction costs were included, total costs would be higher.
| 10
Table of Contents
| LOOMIS SAYLES INTERMEDIATE DURATION BOND FUND | BEGINNING ACCOUNT VALUE 4/1/2019 | ENDING ACCOUNT VALUE 9/30/2019 | EXPENSES PAID DURING PERIOD* 4/1/2019 – 9/30/2019 | |||||||||
| Class A | ||||||||||||
| Actual | $1,000.00 | $1,039.80 | $3.32 | |||||||||
| Hypothetical (5% return before expenses) | $1,000.00 | $1,021.81 | $3.29 | |||||||||
| Class C | ||||||||||||
| Actual | $1,000.00 | $1,037.00 | $7.15 | |||||||||
| Hypothetical (5% return before expenses) | $1,000.00 | $1,018.05 | $7.08 | |||||||||
| Class N | ||||||||||||
| Actual | $1,000.00 | $1,041.40 | $1.79 | |||||||||
| Hypothetical (5% return before expenses) | $1,000.00 | $1,023.31 | $1.78 | |||||||||
| Class Y | ||||||||||||
| Actual | $1,000.00 | $1,042.10 | $2.05 | |||||||||
| Hypothetical (5% return before expenses) | $1,000.00 | $1,023.06 | $2.03 | |||||||||
| * | Expenses are equal to the Fund’s annualized expense ratio (after waiver/reimbursement): 0.65%, 1.40%, 0.35% and 0.40% for Class A, C, N and Y, respectively, multiplied by the average account value over the period, multiplied by the number of days in the most recent fiscal half-year (183), divided by 365 (to reflect the half-year period). |
| LOOMIS SAYLES LIMITED TERM GOVERNMENT AND AGENCY FUND | BEGINNING ACCOUNT VALUE 4/1/2019 | ENDING ACCOUNT VALUE 9/30/2019 | EXPENSES PAID DURING PERIOD* 4/1/2019 – 9/30/2019 | |||||||||
| Class A | ||||||||||||
| Actual | $1,000.00 | $1,020.90 | $4.05 | |||||||||
| Hypothetical (5% return before expenses) | $1,000.00 | $1,021.06 | $4.05 | |||||||||
| Class C | ||||||||||||
| Actual | $1,000.00 | $1,017.10 | $7.84 | |||||||||
| Hypothetical (5% return before expenses) | $1,000.00 | $1,017.30 | $7.84 | |||||||||
| Class N | ||||||||||||
| Actual | $1,000.00 | $1,022.70 | $2.33 | |||||||||
| Hypothetical (5% return before expenses) | $1,000.00 | $1,022.76 | $2.33 | |||||||||
| Class Y | ||||||||||||
| Actual | $1,000.00 | $1,023.10 | $2.79 | |||||||||
| Hypothetical (5% return before expenses) | $1,000.00 | $1,022.31 | $2.79 | |||||||||
| * | Expenses are equal to the Fund’s annualized expense ratio (after waiver/reimbursement): 0.80%, 1.55%, 0.46% and 0.55% for Class A, C, N and Y, respectively, multiplied by the average account value over the period, multiplied by the number of days in the most recent fiscal half-year (183), divided by 365 (to reflect the half-year period). |
11 |
Table of Contents
BOARD APPROVAL OF THE EXISTING ADVISORY AGREEMENTS
The Board of Trustees of the Trusts (the “Board”), including the Independent Trustees, considers matters bearing on each Fund’s advisory agreement (collectively, the “Agreements”) at most of its meetings throughout the year. Each year, usually in the spring, the Contract Review Committee of the Board meets to review the Agreements to determine whether to recommend that the full Board approve the continuation of the Agreements, typically for an additionalone-year period. After the Contract Review Committee has made its recommendation, the full Board, including the Independent Trustees, determines whether to approve the continuation of the Agreements.
In connection with these meetings, the Trustees receive materials that the Funds’ investment adviser (the “Adviser”) believes to be reasonably necessary for the Trustees to evaluate the Agreements. These materials generally include, among other items, (i) information on the investment performance of the Funds and the performance of peer groups of funds and the Funds’ performance benchmarks, (ii) information on the Funds’ advisory fees and other expenses, including information comparing the Funds’ advisory fees to the fees charged to institutional accounts with similar strategies managed by the Adviser, if any, and to those of peer groups of funds and information about any applicable expense caps and/or fee “breakpoints,” (iii) sales and redemption data in respect of the Funds, (iv) information about the profitability of the Agreements to the Adviser and (v) information obtained through the completion by the Adviser of a questionnaire distributed on behalf of the Trustees. The Board, including the Independent Trustees, also considers other matters such as (i) each Fund’s investment objective and strategies and the size, education and experience of the Adviser’s investment staff and its use of technology, external research and trading cost measurement tools, (ii) arrangements in respect of the distribution of the Funds’ shares and the related costs, (iii) the allocation of the Funds’ brokerage, if any, including, to the extent applicable, the use of “soft” commission dollars to pay for research and other similar services, (iv) each Adviser’s policies and procedures relating to, among other things, compliance, trading and best execution, proxy voting and valuation, (v) information about amounts invested by the Funds’ portfolio managers in the Funds or in similar accounts that they manage and (vi) the general economic outlook with particular emphasis on the mutual fund industry. Throughout the process, the Trustees are afforded the opportunity to ask questions of and request additional materials from the Adviser.
In addition to the materials requested by the Trustees in connection with their annual consideration of the continuation of the Agreements, the Trustees receive materials in advance of each regular quarterly meeting of the Board that provide detailed information about the Funds’ investment performance and the fees charged to the Funds for advisory and other services. This information generally includes, among other things, an internal performance rating for each Fund based on agreed-upon criteria, graphs showing each Fund’s performance and expense differentials against each Fund’s peer group/category of funds, performance ratings provided by a third-party, total return information for various periods, and third-party performance rankings for various periods comparing a Fund against similarly categorized funds. The portfolio management team for each Fund or other representatives of the Adviser make periodic presentations to the Contract Review
| 12
Table of Contents
Committee and/or the full Board, and Funds identified as presenting possible performance concerns may be subject to more frequent Board or Committee presentations and reviews. In addition, each quarter the Trustees are provided with detailed statistical information about each Fund’s portfolio. The Trustees also receive periodic updates between meetings.
The Board most recently approved the continuation of the Agreements for aone-year period at its meeting held in June 2019. In considering whether to approve the continuation of the Agreements, the Board, including the Independent Trustees, did not identify any single factor as determinative. Individual Trustees may have evaluated the information presented differently from one another, giving different weights to various factors. Matters considered by the Trustees, including the Independent Trustees, in connection with their approval of the Agreements included, but were not limited to, the factors listed below.
The nature, extent and quality of the services provided to the Funds under the Agreements. The Trustees considered the nature, extent and quality of the services provided by the Adviser and its affiliates to the Funds and the resources dedicated to the Funds by the Adviser and its affiliates.
The Trustees considered not only the advisory services provided by the Adviser to the Funds, but also the monitoring and oversight services provided by Natixis Advisors, L.P. (“Natixis Advisors”). They also considered the administrative and shareholder services provided by Natixis Advisors and its affiliates to the Funds.
For each Fund, the Trustees also considered the benefits to shareholders of investing in a mutual fund that is part of a family of funds that offers shareholders the right to exchange shares of one type of fund for shares of another type of fund, and provides a variety of fund and shareholder services.
After reviewing these and related factors, the Trustees concluded, within the context of their overall conclusions regarding each of the Agreements, that the nature, extent and quality of services provided supported the renewal of the Agreements.
Investment performance of the Funds and the Adviser. As noted above, the Trustees received information about the performance of the Funds over various time periods, including information that compared the performance of the Funds to the performance of peer groups and categories of funds and the Funds’ respective performance benchmarks. In addition, the Trustees reviewed data prepared by an independent third party that analyzed the performance of the Funds using a variety of performance metrics, including metrics that measured the performance of the Funds on a risk adjusted basis.
The Board noted that through December 31, 2018, each Fund’sone-, three- and five-year performance, stated as percentile rankings within categories selected by the independent third-party data provider was as follows (where the best performance would be in the first percentile of its category):
One-Year | Three-Year | Five-Year | ||||||||||
Loomis Sayles Intermediate Duration Bond Fund | 17 | % | 76 | % | 83 | % | ||||||
Loomis Sayles Limited Term Government and Agency Fund | 29 | % | 15 | % | 22 | % | ||||||
13 |
Table of Contents
In the case of a Fund that had performance that lagged that of a relevant category group median as determined by the independent third-party for certain (although not necessarily all) periods, the Board concluded that other factors relevant to performance supported renewal of the Agreement, including: (1) that the underperformance was attributable, to a significant extent, to investment decisions (such as security selection or sector allocation) by the Adviser that were reasonable and consistent with the Fund’s investment objective and policies; (2) that the Fund’s more recent performance had shown improvement relative to its category;(3) the Fund had outperformed its relevant performance benchmark; and (4) that the Fund had recently been assigned to a different category by the independent third-party data provider, which is expected to result in more relevant performance comparisons.
The Trustees also considered the Adviser’s performance and reputation generally, the performance of the fund family generally, and the historical responsiveness of the Adviser to Trustee concerns about performance and the willingness of the Adviser to take steps intended to improve performance.
After reviewing these and related factors, the Trustees concluded, within the context of their overall conclusions regarding each of the Agreements, that the performance of the Funds and the Adviser and/or other relevant factors supported the renewal of the Agreements.
The costs of the services to be provided and profits to be realized by the Adviser and its affiliates from their respective relationships with the Funds. The Trustees considered the fees charged to the Funds for advisory and administrative services as well as the total expense levels of the Funds. This information included comparisons (provided both by management and by an independent third party) of the Funds’ advisory fees and total expense levels to those of their peer groups and information about the advisory fees charged by the Adviser to comparable accounts (such as institutional separate accounts), as well as information about differences in such fees and the reasons for any such differences. In considering the fees charged to comparable accounts, the Trustees considered, among other things, management’s representations about the differences between managing mutual funds as compared to other types of accounts, including the additional resources required to effectively manage mutual fund assets and the greater regulatory costs associated with the management of such assets. In evaluating each Fund’s advisory fee, the Trustees also took into account the demands, complexity and quality of the investment management of such Fund, as well as the need for the Adviser to offer competitive compensation and the potential need to expend additional resources to the extent the Fund grows in size. The Trustees considered that over the past several years, management had made recommendations regarding reductions in advisory fee rates, implementation of advisory fee breakpoints and the institution of advisory fee waivers and expense caps for various funds in the fund family. They noted that both of the Funds have expense caps in place, and they considered the amounts waived or reimbursed by the Adviser for the Funds under their caps. The Trustees noted that the total advisory fee rates for the Funds were below the medians of their respective peer group of funds.
The Trustees also considered the compensation directly or indirectly received by the Adviser and its affiliates from their relationships with the Funds. The Trustees reviewed information provided by management as to the profitability of the Adviser’s and its
| 14
Table of Contents
affiliates’ relationships with the Funds, and information about the allocation of expenses used to calculate profitability. They also reviewed information provided by management about the effect of distribution costs and changes in asset levels on Adviser profitability, including information regarding resources spent on distribution activities. When reviewing profitability, the Trustees also considered information about court cases in which adviser compensation or profitability were issues, the performance of the Funds, the expense levels of the Funds, whether the Adviser had implemented breakpoints and/or expense caps with respect to such Funds and the overall profit margin of Natixis Investment Managers compared to that of certain other investment managers for which such data was available.
After reviewing these and related factors, the Trustees concluded, within the context of their overall conclusions regarding each of the Agreements, that the advisory fee charged to each of the Funds was fair and reasonable, and that the costs of these services generally and the related profitability of the Adviser and its affiliates in respect of their relationships with the Funds supported the renewal of the Agreements.
Economies of Scale. The Trustees considered the existence of any economies of scale in the provision of services by the Adviser and whether those economies are shared with the Funds through breakpoints in their investment advisory fees or other means, such as expense caps. The Trustees also considered management’s explanation of the factors that are taken into account with respect to the implementation of breakpoints in investment advisory fees or expense caps. With respect to economies of scale, the Trustees noted that the Loomis Sayles Limited Term Government and Agency Fund had breakpoints in its advisory fee and that all of the Funds were subject to an expense cap. In considering these issues, the Trustees also took note of the costs of the services provided (both on an absolute and on a relative basis) and the profitability to the Adviser and its affiliates of their relationships with the Funds, as discussed above. The Trustees also considered that the Funds have benefitted from the substantial reinvestment the Adviser has made into its business.
After reviewing these and related factors, the Trustees concluded, within the context of their overall conclusions regarding each of the Agreements, that the extent to which economies of scale were shared with the Funds supported the renewal of the Agreements.
The Trustees also considered other factors, which included but were not limited to the following:
| · | The effect of recent market and economic events on the performance, asset levels and expense ratios of each Fund. |
| · | Whether each Fund has operated in accordance with its investment objective and the Fund’s record of compliance with its investment restrictions, and the compliance programs of the Funds and the Adviser. They also considered the compliance-related resources the Adviser and its affiliates were providing to the Funds. |
| · | So-called “fallout benefits” to the Adviser, such as the engagement of affiliates of the Adviser to provide distribution and administrative services to the Funds, and the benefits of research made available to the Adviser by reason of brokerage commissions (if any) generated by the Funds’ securities transactions. The Trustees also considered the benefits to the parent company of Natixis Advisors from the retention of the |
15 |
Table of Contents
Adviser. The Trustees considered the possible conflicts of interest associated with these fallout and other benefits, and the reporting, disclosure and other processes in place to disclose and monitor such possible conflicts of interest. |
| · | The Trustees’ review and discussion of the Funds’ advisory arrangements in prior years, and management’s record of responding to Trustee concerns raised during the year and in prior years. |
Based on their evaluation of all factors that they deemed to be material, including those factors described above, and assisted by the advice of independent counsel, the Trustees, including the Independent Trustees, concluded that each of the existing Agreements, should be continued through June 30, 2020.
| 16
Table of Contents
Portfolio of Investments – as of September 30, 2019
Loomis Sayles Intermediate Duration Bond Fund
| Principal Amount | Description | Value (†) | ||||||
| Bonds and Notes — 97.5% of Net Assets | ||||||||
| ABS Car Loan — 9.0% | ||||||||
| $ | 22,037 | ACC Trust,Series 2018-1, Class A, 3.700%, 12/21/2020, 144A | $ | 22,064 | ||||
| 70,164 | AmeriCredit Automobile Receivables Trust,Series 2016-2, Class C, 2.870%, 11/08/2021 | 70,323 | ||||||
| 160,000 | AmeriCredit Automobile Receivables Trust,Series 2016-3, Class C, 2.240%, 4/08/2022 | 159,940 | ||||||
| 555,000 | AmeriCredit Automobile Receivables Trust,Series 2016-4, Class B, 1.830%, 12/08/2021(a) | 554,335 | ||||||
| 110,000 | AmeriCredit Automobile Receivables Trust,Series 2017-1, Class B, 2.300%, 2/18/2022 | 109,990 | ||||||
| 510,000 | AmeriCredit Automobile Receivables Trust,Series 2018-3, Class B, 3.580%, 10/18/2024 | 526,963 | ||||||
| 480,000 | AmeriCredit Automobile Receivables Trust,Series 2019-2, Class B, 2.540%, 7/18/2024 | 483,707 | ||||||
| 695,000 | AmeriCredit Automobile Receivables Trust,Series 2019-3, Class A3, 2.060%, 4/18/2024 | 695,536 | ||||||
| 360,000 | Avis Budget Rental Car Funding AESOP LLC,Series 2016-1A, Class A, 2.990%, 6/20/2022, 144A(a) | 363,898 | ||||||
| 100,000 | Avis Budget Rental Car Funding AESOP LLC,Series 2019-1, Class A, 3.450%, 3/20/2023, 144A | 102,714 | ||||||
| 640,000 | Avis Budget Rental Car Funding AESOP LLC,Series 2019-2A, Class A, 3.350%, 9/22/2025, 144A | 665,998 | ||||||
| 261,072 | Bank of the West Auto Trust,Series 2017-1, Class A3, 2.110%, 1/15/2023, 144A | 260,875 | ||||||
| 450,000 | Bank of the West Auto Trust,Series 2019-1, Class A3, 2.430%, 4/15/2024, 144A | 453,441 | ||||||
| 461,067 | California Republic Auto Receivables Trust,Series 2017-1, Class A4, 2.280%, 6/15/2022(a) | 461,121 | ||||||
| 87,552 | Capital Auto Receivables Asset Trust,Series 2017-1, Class A3, 2.020%, 8/20/2021, 144A | 87,500 | ||||||
| 565,000 | Capital One Prime Auto Receivables Trust,Series 2019-2, Class A3, 1.920%, 5/15/2024 | 565,352 | ||||||
| 624,827 | CarMax Auto Owner Trust,Series 2017-2, Class A3, 1.930%, 3/15/2022(a) | 624,158 | ||||||
| 660,000 | Carvana Auto Receivables Trust,Series 2019-3A, Class A3, 2.340%, 6/15/2023, 144A(b)(c) | 660,000 | ||||||
| 10,742 | Chrysler Capital Auto Receivables Trust,Series 2016-BA, Class A3, 1.640%, 7/15/2021, 144A | 10,740 | ||||||
| 25,558 | CIG Auto Receivables Trust,Series 2017-1A, Class A, 2.710%, 5/15/2023, 144A | 25,584 | ||||||
| 27,454 | CPS Auto Receivables Trust,Series 2017-C, Class B, 2.300%, 7/15/2021, 144A | 27,453 | ||||||
| 775,000 | CPS Auto Receivables Trust,Series 2018-D, Class B, 3.610%, 11/15/2022, 144A | 784,893 | ||||||
| 1,005,000 | Drive Auto Receivables Trust,Series 2018-5, Class B, 3.680%, 7/15/2023 | 1,019,949 | ||||||
| 215,000 | Drive Auto Receivables Trust,Series 2019-3, Class B, 2.650%, 2/15/2024 | 217,034 | ||||||
| 153,564 | DT Auto Owner Trust,Series 2015-3A, Class D, 4.530%, 10/17/2022, 144A | 153,711 | ||||||
| 170,881 | DT Auto Owner Trust,Series 2016-2A, Class D, 5.430%, 11/15/2022, 144A | 172,767 | ||||||
| 3,715 | DT Auto Owner Trust,Series 2017-1A, Class C, 2.700%, 11/15/2022, 144A | 3,716 | ||||||
| 60,000 | DT Auto Owner Trust,Series 2018-2A, Class C, 3.670%, 3/15/2024, 144A | 60,777 | ||||||
| 285,000 | DT Auto Owner Trust,Series 2019-1A, Class C, 3.610%, 11/15/2024, 144A | 290,586 | ||||||
| 270,000 | DT Auto Owner Trust,Series 2019-2A, Class C, 3.180%, 2/18/2025, 144A | 274,000 | ||||||
See accompanying notes to financial statements.
17 |
Table of Contents
Portfolio of Investments – as of September 30, 2019
Loomis Sayles Intermediate Duration Bond Fund – (continued)
| Principal Amount | Description | Value (†) | ||||||
| ABS Car Loan — continued | ||||||||
| $ | 184,397 | Exeter Automobile Receivables Trust,Series 2017-2A, Class B, 2.820%, 5/16/2022, 144A | $ | 184,701 | ||||
| 111,732 | Exeter Automobile Receivables Trust,Series 2018-1A, Class B, 2.750%, 4/15/2022, 144A | 111,809 | ||||||
| 368,667 | Exeter Automobile Receivables Trust,Series 2018-2A, Class B, 3.270%, 5/16/2022, 144A | 369,620 | ||||||
| 150,000 | Exeter Automobile Receivables Trust,Series 2019-2A, Class B, 3.060%, 5/15/2023, 144A | 151,561 | ||||||
| 123,173 | First Investors Auto Owner Trust,Series 2017-1A, Class A2, 2.200%, 3/15/2022, 144A | 123,147 | ||||||
| 269,841 | First Investors Auto Owner Trust,Series 2017-2A, Class A2, 2.270%, 7/15/2022, 144A | 269,732 | ||||||
| 270,465 | First Investors Auto Owner Trust,Series 2018-2A, Class A1, 3.230%, 12/15/2022, 144A | 271,724 | ||||||
| 183,065 | Flagship Credit Auto Trust,Series 2016-2, Class B, 3.840%, 9/15/2022, 144A | 183,877 | ||||||
| 4,893 | Flagship Credit Auto Trust,Series 2016-3, Class B, 2.430%, 6/15/2021, 144A | 4,893 | ||||||
| 64,560 | Flagship Credit Auto Trust,Series 2016-4, Class B, 2.410%, 10/15/2021, 144A | 64,547 | ||||||
| 800,000 | Flagship Credit Auto Trust,Series 2018-4, Class B, 3.880%, 10/16/2023, 144A | 824,530 | ||||||
| 230,000 | Ford Credit Auto Owner Trust,Series 2014-2, Class A, 2.310%, 4/15/2026, 144A | 230,002 | ||||||
| 705,000 | Ford Credit Auto Owner Trust,Series 2016-2, Class A, 2.030%, 12/15/2027, 144A(a) | 704,581 | ||||||
| 595,000 | Ford Credit Auto Owner Trust,Series 2018-1, Class A, 3.190%, 7/15/2031, 144A(a) | 619,703 | ||||||
| 635,000 | Ford Credit Floorplan Master Owner Trust,Series 2019-1, Class A, 2.840%, 3/15/2024 | 646,926 | ||||||
| 265,000 | GLS Auto Receivables Trust,Series 2018-3A, Class B, 3.780%, 8/15/2023, 144A | 269,622 | ||||||
| 631,525 | GLS Auto Receivables Trust,Series 2019-2A, Class A, 3.060%, 4/17/2023, 144A | 635,377 | ||||||
| 133,460 | GM Financial Consumer Automobile Receivables Trust,Series 2017-1A, Class A3, 1.780%, 10/18/2021, 144A | 133,235 | ||||||
| 416,056 | GM Financial Consumer Automobile Receivables Trust,Series 2017-3A, Class A3, 1.970%, 5/16/2022, 144A(a) | 416,009 | ||||||
| 450,000 | GM Financial Consumer Automobile Receivables Trust,Series 2019-3, Class A3, 2.180%, 4/16/2024 | 452,683 | ||||||
| 510,000 | NextGear Floorplan Master Owner Trust,Series 2017-1A, Class A2, 2.540%, 4/18/2022, 144A(a) | 510,451 | ||||||
| 150,000 | NextGear Floorplan Master Owner Trust,Series 2017-2A, Class A2, 2.560%, 10/17/2022, 144A | 150,601 | ||||||
| 125,000 | NextGear Floorplan Master Owner Trust,Series 2018-1A, Class A2, 3.220%, 2/15/2023, 144A | 126,656 | ||||||
| 310,000 | NextGear Floorplan Master Owner Trust,Series 2018-2A, Class A2, 3.690%, 10/15/2023, 144A | 319,164 | ||||||
| 1,045,000 | Prestige Auto Receivables Trust,Series 2019-1A, Class A3, 2.450%, 5/15/2023, 144A | 1,048,406 | ||||||
| 370,000 | Santander Drive Auto Receivables Trust,Series 2019-2, Class C, 2.900%, 10/15/2024 | 375,959 | ||||||
| 460,000 | Santander Drive Auto Receivables Trust,Series 2018-5, Class C, 3.810%, 12/16/2024 | 468,424 | ||||||
See accompanying notes to financial statements.
| 18
Table of Contents
Portfolio of Investments – as of September 30, 2019
Loomis Sayles Intermediate Duration Bond Fund – (continued)
| Principal Amount | Description | Value (†) | ||||||
| ABS Car Loan — continued | ||||||||
| $ | 655,000 | Santander Drive Auto Receivables Trust,Series 2019-3, Class A3, 2.160%, 11/15/2022 | $ | 655,112 | ||||
| 129,353 | Westlake Automobile Receivables Trust,Series 2018-1A, Class B, 2.670%, 5/17/2021, 144A | 129,418 | ||||||
| 515,000 | Westlake Automobile Receivables Trust,Series 2019-1A, Class B, 3.260%, 10/17/2022, 144A | 520,073 | ||||||
| 830,000 | Westlake Automobile Receivables Trust,Series 2019-2A, Class B, 2.620%, 7/15/2024, 144A | 834,281 | ||||||
| 105,227 | World Omni Auto Receivables Trust,Series 2017-B, Class A3, 1.950%, 2/15/2023 | 105,187 | ||||||
|
| |||||||
| 21,821,136 | ||||||||
|
| |||||||
| ABS Credit Card — 1.9% | ||||||||
| 620,000 | American Express Credit Account Master Trust,Series 2019-1, Class A, 2.870%, 10/15/2024 | 635,223 | ||||||
| 925,000 | Barclays Dryrock Issuance Trust,Series 2019-1, Class A, 1.960%, 5/15/2025 | 926,745 | ||||||
| 805,000 | Capital One Multi-Asset Execution Trust,Series 2017-A4, Class A4, 1.990%, 7/17/2023(a) | 805,186 | ||||||
| 260,000 | Citibank Credit Card Issuance Trust,Series 2014-A1, Class A1, 2.880%, 1/23/2023 | 263,155 | ||||||
| 555,000 | World Financial Network Credit Card Master Trust,Series 2016-C, Class A, 1.720%, 8/15/2023(a) | 554,888 | ||||||
| 730,000 | World Financial Network Credit Card Master Trust,Series 2017-A, Class A, 2.120%, 3/15/2024(a) | 729,410 | ||||||
| 585,000 | World Financial Network Credit Card Master Trust,Series 2019-C, Class A, 2.210%, 7/15/2026 | 584,609 | ||||||
|
| |||||||
| 4,499,216 | ||||||||
|
| |||||||
| ABS Home Equity — 0.4% | ||||||||
| 244,830 | Bayview Opportunity Master Fund IVa Trust, Series 2016-SPL1, Class A, 4.000%, 4/28/2055, 144A | 250,106 | ||||||
| 55,315 | Colony American Finance Ltd.,Series 2015-1, Class A, 2.896%, 10/15/2047, 144A | 55,233 | ||||||
| 139,800 | CoreVest American Finance Trust,Series 2017-1, Class A, 2.968%, 10/15/2049, 144A | 140,484 | ||||||
| 11,866 | Countrywide Alternative Loan Trust,Series 2006-J5, Class 4A1, 4.924%, 7/25/2021(b)(c)(d) | 11,336 | ||||||
| 5,332 | Countrywide Asset-Backed Certificates,Series 2004-S1, Class A3, 5.115%, 2/25/2035(b)(c)(d) | 5,273 | ||||||
| 279,300 | Freddie Mac Structured Agency Credit Risk Debt Notes, Series 2015-DNA1, Class M2,1-month LIBOR + 1.850%, 3.868%, 10/25/2027(a)(e) | 281,117 | ||||||
| 92,911 | Mill City Mortgage Loan Trust,Series 2016-1, Class A1, 2.500%, 4/25/2057, 144A(d) | 93,053 | ||||||
| 79,350 | Towd Point Mortgage Trust,Series 2015-2, Class 1A12, 2.750%, 11/25/2060, 144A(d) | 79,441 | ||||||
| 35,025 | Wells Fargo Mortgage Backed Securities Trust, Series 2005-AR10, Class 2A4, 4.968%, 5/01/2035(d) | 36,463 | ||||||
|
| |||||||
| 952,506 | ||||||||
|
| |||||||
See accompanying notes to financial statements.
19 |
Table of Contents
Portfolio of Investments – as of September 30, 2019
Loomis Sayles Intermediate Duration Bond Fund – (continued)
| Principal Amount | Description | Value (†) | ||||||
| ABS Other — 2.8% | ||||||||
| $ | 195,765 | Diamond Resorts Owner Trust,Series 2018-1, Class A, 3.700%, 1/21/2031, 144A | $ | 199,656 | ||||
| 176,558 | John Deere Owner Trust,Series 2017-B, Class A3, 1.820%, 10/15/2021 | 176,284 | ||||||
| 520,000 | Mariner Finance Issuance Trust,Series 2017-BA, Class A, 2.920%, 12/20/2029, 144A | 521,249 | ||||||
| 194,829 | Merlin Aviation Holdings DAC,Series 2016-1, Class A, 4.500%, 12/15/2032, 144A(d) | 198,638 | ||||||
| 113,635 | OneMain Financial Issuance Trust,Series 2016-1A, Class A, 3.660%, 2/20/2029, 144A | 114,028 | ||||||
| 555,000 | OneMain Financial Issuance Trust,Series 2018-1A, Class A, 3.300%, 3/14/2029, 144A(a) | 564,780 | ||||||
| 285,618 | S-Jets Ltd.,Series 2017-1, Class A, 3.967%, 8/15/2042, 144A | 294,198 | ||||||
| 338,894 | SCF Equipment Leasing LLC,Series 2018-1A, Class A2, 3.630%, 10/20/2024, 144A(a) | 341,636 | ||||||
| 64,021 | Sierra Timeshare Conduit Receivables Funding LLC,Series 2017-1A, Class A, 2.910%, 3/20/2034, 144A | 64,599 | ||||||
| 730,000 | SoFi Consumer Loan Program Trust,Series 2018-2, Class A2, 3.350%, 4/26/2027, 144A | 736,198 | ||||||
| 789,382 | SoFi Consumer Loan Program Trust,Series 2018-4, Class A, 3.540%, 11/26/2027, 144A | 797,440 | ||||||
| 121,458 | TAL Advantage V LLC,Series 2014-1A, Class A, 3.510%, 2/22/2039, 144A | 121,312 | ||||||
| 48,889 | TAL Advantage V LLC,Series 2014-2A, Class A2, 3.330%, 5/20/2039, 144A | 48,873 | ||||||
| 129,167 | TAL Advantage V LLC,Series 2014-3A, Class A, 3.270%, 11/21/2039, 144A | 129,476 | ||||||
| 2,180,000 | Verizon Owner Trust,Series 2019-B, Class A1A, 2.330%, 12/20/2023 | 2,197,250 | ||||||
| 345,000 | Wheels SPV 2 LLC,Series 2019-1A, Class A2, 2.300%, 5/22/2028, 144A | 345,700 | ||||||
|
| |||||||
| 6,851,317 | ||||||||
|
| |||||||
| ABS Student Loan — 0.4% | ||||||||
| 89,546 | Earnest Student Loan Program LLC,Series 2017-A, Class A2, 2.650%, 1/25/2041, 144A | 89,819 | ||||||
| 318,534 | Massachusetts Educational Financing Authority,Series 2018-A, Class A, 3.850%, 5/25/2033 | 326,367 | ||||||
| 123,988 | North Carolina State Education Assistance Authority,Series 2011-2, Class A2,3-month LIBOR + 0.800%, 3.076%, 7/25/2025(e) | 124,020 | ||||||
| 34,516 | SoFi Professional Loan Program LLC,Series 2015-A, Class A2, 2.420%, 3/25/2030, 144A | 34,517 | ||||||
| 174,816 | SoFi Professional Loan Program LLC,Series 2016-B, Class A2B, 2.740%, 10/25/2032, 144A | 176,262 | ||||||
| 180,000 | SoFi Professional Loan Program LLC,Series 2017-E, Class A2B, 2.720%, 11/26/2040, 144A | 183,352 | ||||||
| 77,479 | South Carolina Student Loan Corp.,Series 2010-1, Class A2,3-month LIBOR + 1.000%, 3.276%, 7/25/2025(e) | 77,540 | ||||||
|
| |||||||
| 1,011,877 | ||||||||
|
| |||||||
| ABS Whole Business — 0.2% | ||||||||
| 529,650 | Planet Fitness Master Issuer LLC,Series 2018-1A, Class A2II, 4.666%, 9/05/2048, 144A | 554,983 | ||||||
|
| |||||||
| Aerospace & Defense — 0.2% | ||||||||
| 450,000 | Rolls-Royce PLC, 2.375%, 10/14/2020, 144A | 450,414 | ||||||
|
| |||||||
See accompanying notes to financial statements.
| 20
Table of Contents
Portfolio of Investments – as of September 30, 2019
Loomis Sayles Intermediate Duration Bond Fund – (continued)
| Principal Amount | Description | Value (†) | ||||||
| Agency Commercial Mortgage-Backed Securities — 0.8% | ||||||||
| $ | 648,018 | FHLMC Multifamily Structured Pass Through Certificates, Series K013, Class A2, 3.974%, 1/25/2021(a)(d) | $ | 661,141 | ||||
| 509,476 | FHLMC Multifamily Structured Pass Through Certificates, Series K029, Class A2, 3.320%, 2/25/2023(a) | 530,657 | ||||||
| 701,647 | FHLMC Multifamily Structured Pass Through Certificates, Series K042, Class A2, 2.670%, 12/25/2024(a) | 723,635 | ||||||
|
| |||||||
| 1,915,433 | ||||||||
|
| |||||||
| Airlines — 0.0% | ||||||||
| 34,207 | Delta Air Lines Pass Through Trust,Series 2009-1, Class A, 7.750%, 6/17/2021 | 34,548 | ||||||
|
| |||||||
| Automotive — 5.0% | ||||||||
| 425,000 | American Honda Finance Corp., MTN, 2.000%, 2/14/2020 | 424,958 | ||||||
| 925,000 | American Honda Finance Corp., MTN, 2.150%, 9/10/2024 | 921,052 | ||||||
| 1,095,000 | American Honda Finance Corp., MTN, 2.200%, 6/27/2022 | 1,099,041 | ||||||
| 245,000 | American Honda Finance Corp., MTN, 3.625%, 10/10/2023 | 259,450 | ||||||
| 290,000 | BMW U.S. Capital LLC, 1.850%, 9/15/2021, 144A | 288,680 | ||||||
| 1,100,000 | Daimler Finance North America LLC, 3.350%, 2/22/2023, 144A | 1,129,528 | ||||||
| 670,000 | Ford Motor Credit Co. LLC, 2.979%, 8/03/2022 | 664,488 | ||||||
| 200,000 | Ford Motor Credit Co. LLC, 3.810%, 1/09/2024 | 199,286 | ||||||
| 535,000 | Ford Motor Credit Co. LLC, 4.542%, 8/01/2026 | 534,504 | ||||||
| 360,000 | General Motors Financial Co., Inc., 4.150%, 6/19/2023 | 374,155 | ||||||
| 315,000 | Harley-Davidson Financial Services, Inc., 3.350%, 2/15/2023, 144A | 321,177 | ||||||
| 220,000 | Harley-Davidson Financial Services, Inc., 4.050%, 2/04/2022, 144A | 226,904 | ||||||
| 585,000 | Hyundai Capital America, 2.750%, 9/18/2020, 144A | 586,142 | ||||||
| 1,175,000 | Hyundai Capital America, 3.000%, 6/20/2022, 144A | 1,183,904 | ||||||
| 175,000 | Hyundai Capital America, 3.450%, 3/12/2021, 144A | 177,200 | ||||||
| 1,065,000 | Nissan Motor Acceptance Corp., 2.150%, 7/13/2020, 144A | 1,063,841 | ||||||
| 730,000 | Nissan Motor Acceptance Corp., 3.450%, 3/15/2023, 144A | 749,472 | ||||||
| 870,000 | Toyota Motor Credit Corp., MTN, 2.150%, 9/08/2022 | 875,233 | ||||||
| 255,000 | Volkswagen Group of America Finance LLC, 3.200%, 9/26/2026, 144A | 256,986 | ||||||
| 615,000 | Volkswagen Group of America Finance LLC, 4.250%, 11/13/2023, 144A | 655,224 | ||||||
|
| |||||||
| 11,991,225 | ||||||||
|
| |||||||
| Banking — 17.3% | ||||||||
| 315,000 | American Express Co., 2.200%, 10/30/2020 | 315,470 | ||||||
| 495,000 | American Express Co., 3.700%, 8/03/2023 | 521,514 | ||||||
| 915,000 | ANZ New Zealand International Ltd., 2.200%, 7/17/2020, 144A | 916,469 | ||||||
| 395,000 | Bank of Ireland Group PLC, 4.500%, 11/25/2023, 144A | 413,587 | ||||||
| 545,000 | Bank of Montreal, MTN, 2.500%, 6/28/2024 | 550,784 | ||||||
| 950,000 | Bank of Nova Scotia (The), 2.150%, 7/14/2020 | 951,239 | ||||||
| 450,000 | Banque Federative du Credit Mutuel S.A., 2.200%, 7/20/2020, 144A | 450,551 | ||||||
| 460,000 | Banque Federative du Credit Mutuel S.A., 2.700%, 7/20/2022, 144A | 466,048 | ||||||
| 485,000 | Banque Federative du Credit Mutuel S.A., 3.750%, 7/20/2023, 144A | 510,389 | ||||||
| 1,110,000 | Barclays PLC, (fixed rate to 5/16/2023, variable rate thereafter), 4.338%, 5/16/2024 | 1,160,136 | ||||||
| 770,000 | Barclays PLC, (fixed rate to 6/20/2029, variable rate thereafter), 5.088%, 6/20/2030 | 802,874 | ||||||
| 720,000 | BB&T Corp., MTN, 2.500%, 8/01/2024 | 725,777 | ||||||
See accompanying notes to financial statements.
21 |
Table of Contents
Portfolio of Investments – as of September 30, 2019
Loomis Sayles Intermediate Duration Bond Fund – (continued)
| Principal Amount | Description | Value (†) | ||||||
| Banking — continued | ||||||||
| $ | 1,015,000 | BB&T Corp., MTN, 3.050%, 6/20/2022 | $ | 1,039,842 | ||||
| 490,000 | BNZ International Funding Ltd., 2.400%, 2/21/2020, 144A | 490,558 | ||||||
| 160,000 | Capital One Financial Corp., 3.750%, 3/09/2027 | 167,951 | ||||||
| 545,000 | Capital One NA, 2.150%, 9/06/2022 | 544,466 | ||||||
| 215,000 | Citigroup, Inc., 2.900%, 12/08/2021 | 218,172 | ||||||
| 1,000,000 | Citigroup, Inc., (fixed rate to 1/24/2022, variable rate thereafter), 3.142%, 1/24/2023 | 1,018,220 | ||||||
| 310,000 | Citizens Bank NA, 2.250%, 3/02/2020 | 310,097 | ||||||
| 250,000 | Comerica Bank, 2.500%, 6/02/2020 | 250,659 | ||||||
| 225,000 | Comerica, Inc., 3.700%, 7/31/2023 | 236,239 | ||||||
| 660,000 | Cooperatieve Rabobank U.A. (NY), 2.750%, 1/10/2023 | 671,687 | ||||||
| 925,000 | Credit Agricole S.A., 3.750%, 4/24/2023, 144A | 966,749 | ||||||
| 940,000 | Danske Bank A/S, 3.875%, 9/12/2023, 144A | 974,541 | ||||||
| 215,000 | Deutsche Bank AG, 3.150%, 1/22/2021 | 214,851 | ||||||
| 795,000 | Discover Bank, 2.450%, 9/12/2024 | 793,132 | ||||||
| 240,000 | Discover Financial Services, 4.500%, 1/30/2026 | 260,764 | ||||||
| 520,000 | Goldman Sachs Group, Inc. (The), (fixed rate to 10/31/2021, variable rate thereafter), 2.876%, 10/31/2022 | 525,934 | ||||||
| 520,000 | HSBC Holdings PLC, (fixed rate to 9/12/2025, variable rate thereafter), 4.292%, 9/12/2026 | 557,603 | ||||||
| 185,000 | HSBC USA, Inc., 2.375%, 11/13/2019 | 185,041 | ||||||
| 350,000 | ING Groep NV, 4.625%, 1/06/2026, 144A | 387,534 | ||||||
| 695,000 | JPMorgan Chase & Co., (fixed rate to 10/15/2029, variable rate thereafter), 2.739%, 10/15/2030 | 690,118 | ||||||
| 535,000 | JPMorgan Chase & Co., (fixed rate to 4/1/2022, variable rate thereafter), 3.207%, 4/01/2023 | 548,037 | ||||||
| 790,000 | KeyCorp, MTN, 2.550%, 10/01/2029 | 772,737 | ||||||
| 665,000 | Lloyds Bank PLC, 2.250%, 8/14/2022 | 663,357 | ||||||
| 495,000 | Lloyds Banking Group PLC, 4.050%, 8/16/2023 | 519,027 | ||||||
| 560,000 | Mitsubishi UFJ Financial Group, Inc., 3.195%, 7/18/2029 | 578,645 | ||||||
| 790,000 | Mizuho Financial Group, Inc., (fixed rate to 9/13/2029, variable rate thereafter), 2.869%, 9/13/2030 | 786,689 | ||||||
| 930,000 | National Australia Bank Ltd., 3.700%, 11/04/2021 | 960,230 | ||||||
| 1,135,000 | National Bank of Canada, 2.200%, 11/02/2020 | 1,137,497 | ||||||
| 620,000 | Nationwide Building Society, (fixed rate to 3/08/2023, variable rate thereafter), 3.766%, 3/08/2024, 144A | 636,653 | ||||||
| 1,020,000 | NatWest Markets PLC, 3.625%, 9/29/2022, 144A | 1,047,147 | ||||||
| 1,055,000 | Nordea Bank Abp, 2.125%, 5/29/2020, 144A | 1,054,895 | ||||||
| 315,000 | Northern Trust Corp., (fixed rate to 5/08/2027, variable rate thereafter), 3.375%, 5/08/2032 | 323,275 | ||||||
| 820,000 | PNC Financial Services Group, Inc. (The), 2.600%, 7/23/2026 | 830,252 | ||||||
| 1,125,000 | Royal Bank of Canada, GMTN, 2.550%, 7/16/2024 | 1,140,237 | ||||||
| 690,000 | Santander Holdings USA, Inc., 3.500%, 6/07/2024 | 707,877 | ||||||
| 635,000 | Santander Holdings USA, Inc., 3.700%, 3/28/2022 | 652,831 | ||||||
| 235,000 | Santander Holdings USA, Inc., 4.450%, 12/03/2021 | 245,450 | ||||||
| 350,000 | Santander UK PLC, 2.125%, 11/03/2020 | 349,659 | ||||||
| 715,000 | Santander UK PLC, 2.500%, 1/05/2021 | 715,903 | ||||||
See accompanying notes to financial statements.
| 22
Table of Contents
Portfolio of Investments – as of September 30, 2019
Loomis Sayles Intermediate Duration Bond Fund – (continued)
| Principal Amount | Description | Value (†) | ||||||
| Banking — continued | ||||||||
| $ | 580,000 | Santander UK PLC, 2.875%, 6/18/2024 | $ | 588,648 | ||||
| 530,000 | Standard Chartered PLC, (fixed rate to 5/21/2024, variable rate thereafter), 3.785%, 5/21/2025, 144A | 547,117 | ||||||
| 305,000 | State Street Corp., (fixed rate to 5/15/2022, variable rate thereafter), 2.653%, 5/15/2023 | 309,961 | ||||||
| 545,000 | Sumitomo Mitsui Financial Group, Inc., 2.696%, 7/16/2024 | 551,081 | ||||||
| 235,000 | Sumitomo Mitsui Financial Group, Inc., 2.784%, 7/12/2022 | 238,401 | ||||||
| 440,000 | Sumitomo Mitsui Financial Group, Inc., 3.040%, 7/16/2029 | 450,067 | ||||||
| 515,000 | Svenska Handelsbanken AB, 3.900%, 11/20/2023 | 550,324 | ||||||
| 1,140,000 | Synchrony Bank, 3.650%, 5/24/2021 | 1,161,902 | ||||||
| 150,000 | Synchrony Financial, 3.700%, 8/04/2026 | 153,095 | ||||||
| 75,000 | Synchrony Financial, 4.250%, 8/15/2024 | 79,056 | ||||||
| 1,065,000 | Toronto Dominion Bank (The), MTN, 3.250%, 6/11/2021 | 1,087,382 | ||||||
| 840,000 | U.S. Bank NA, 2.000%, 1/24/2020 | 840,062 | ||||||
| 1,150,000 | UBS AG, 2.200%, 6/08/2020, 144A | 1,151,081 | ||||||
| 665,000 | UniCredit SpA, 3.750%, 4/12/2022, 144A | 680,007 | ||||||
| 1,030,000 | Wells Fargo Bank NA, 3.625%, 10/22/2021 | 1,059,831 | ||||||
| 195,000 | Westpac Banking Corp., 2.800%, 1/11/2022 | 198,361 | ||||||
|
| |||||||
| 41,605,770 | ||||||||
|
| |||||||
| Brokerage — 0.2% | ||||||||
| 415,000 | Ameriprise Financial, Inc., 3.000%, 3/22/2022 | 422,695 | ||||||
|
| |||||||
| Building Materials — 0.3% | ||||||||
| 107,000 | Fortune Brands Home & Security, Inc., 3.000%, 6/15/2020 | 107,385 | ||||||
| 600,000 | Martin Marietta Materials, Inc.,3-month LIBOR + 0.650%, 2.800%, 5/22/2020(e) | 600,824 | ||||||
| 40,000 | Masco Corp., 3.500%, 4/01/2021 | 40,549 | ||||||
| 4,000 | Masco Corp., 7.125%, 3/15/2020 | 4,079 | ||||||
|
| |||||||
| 752,837 | ||||||||
|
| |||||||
| Cable Satellite — 0.1% | ||||||||
| 320,000 | Cox Communications, Inc., 3.150%, 8/15/2024, 144A | 327,713 | ||||||
|
| |||||||
| Chemicals — 0.7% | ||||||||
| 205,000 | Alpek SAB de CV, 4.250%, 9/18/2029, 144A | 206,743 | ||||||
| 480,000 | Cabot Corp., 4.000%, 7/01/2029 | 502,768 | ||||||
| 255,000 | DuPont de Nemours, Inc., 3.766%, 11/15/2020 | 259,694 | ||||||
| 9,000 | Eastman Chemical Co., 4.500%, 1/15/2021 | 9,185 | ||||||
| 45,000 | Methanex Corp., 3.250%, 12/15/2019 | 45,089 | ||||||
| 740,000 | Methanex Corp., 5.250%, 12/15/2029 | 742,989 | ||||||
|
| |||||||
| 1,766,468 | ||||||||
|
| |||||||
| Collateralized Mortgage Obligations — 3.5% | ||||||||
| 672,484 | Government National Mortgage Association,Series 2010-H02, Class FA,1-month LIBOR + 0.680%, 2.820%, 2/20/2060(e) | 675,080 | ||||||
| 328,151 | Government National Mortgage Association,Series 2010-H03, Class FA,1-month LIBOR + 0.550%, 2.690%, 3/20/2060(e) | 328,645 | ||||||
| 173,905 | Government National Mortgage Association,Series 2014-H14, Class FA,1-month LIBOR + 0.500%, 2.880%, 7/20/2064(e) | 173,990 | ||||||
See accompanying notes to financial statements.
23 |
Table of Contents
Portfolio of Investments – as of September 30, 2019
Loomis Sayles Intermediate Duration Bond Fund – (continued)
| Principal Amount | Description | Value (†) | ||||||
| Collateralized Mortgage Obligations — continued | ||||||||
| $ | 123,467 | Government National Mortgage Association,Series 2014-H15, Class FA,1-month LIBOR + 0.500%, 2.729%, 7/20/2064(e) | $ | 123,529 | ||||
| 23,619 | Government National Mortgage Association,Series 2015-H09, Class HA, 1.750%, 3/20/2065 | 23,495 | ||||||
| 315,609 | Government National Mortgage Association,Series 2015-H10, Class JA, 2.250%, 4/20/2065(a) | 311,593 | ||||||
| 511,053 | Government National Mortgage Association,Series 2016-H06, Class FC,1-month LIBOR + 0.920%, 3.149%, 2/20/2066(a)(e) | 516,423 | ||||||
| 571,230 | Government National Mortgage Association,Series 2016-H10, Class FJ,1-month LIBOR + 0.600%, 2.829%, 4/20/2066(a)(e) | 571,946 | ||||||
| 2,193,853 | Government National Mortgage Association,Series 2018-H17, Class JA, 3.750%, 9/20/2068(a)(d) | 2,372,724 | ||||||
| 429,135 | Government National Mortgage Association,Series 2019-H01, Class FL,1-month LIBOR + 0.450%, 2.679%, 12/20/2068(e) | 428,704 | ||||||
| 1,497,078 | Government National Mortgage Association,Series 2019-H01, Class FT,1-month LIBOR + 0.400%, 2.629%, 10/20/2068(a)(e) | 1,494,981 | ||||||
| 1,304,620 | Government National Mortgage Association,Series 2019-H10, Class FM,1-month LIBOR + 0.400%, 2.629%, 5/20/2069(e) | 1,303,830 | ||||||
|
| |||||||
| 8,324,940 | ||||||||
|
| |||||||
| Construction Machinery — 0.6% | ||||||||
| 265,000 | Caterpillar Financial Services Corp., 2.650%, 5/17/2021 | 267,880 | ||||||
| 300,000 | Caterpillar Financial Services Corp., MTN, 3.150%, 9/07/2021 | 306,206 | ||||||
| 500,000 | Caterpillar Financial Services Corp., MTN, 3.650%, 12/07/2023 | 530,837 | ||||||
| 110,000 | John Deere Capital Corp., MTN, 2.600%, 3/07/2024 | 112,242 | ||||||
| 174,000 | John Deere Capital Corp., Series 0014, MTN, 2.450%, 9/11/2020 | 174,761 | ||||||
|
| |||||||
| 1,391,926 | ||||||||
|
| |||||||
| Consumer Cyclical Services — 0.7% | ||||||||
| 790,000 | Expedia Group, Inc., 3.250%, 2/15/2030, 144A | 787,747 | ||||||
| 285,000 | Experian Finance PLC, 4.250%, 2/01/2029, 144A | 320,116 | ||||||
| 495,000 | Western Union Co. (The), 4.250%, 6/09/2023 | 520,323 | ||||||
|
| |||||||
| 1,628,186 | ||||||||
|
| |||||||
| Diversified Manufacturing — 0.8% | ||||||||
| 455,000 | Kennametal, Inc., 4.625%, 6/15/2028 | 483,965 | ||||||
| 265,000 | Timken Co. (The), 4.500%, 12/15/2028 | 284,250 | ||||||
| 860,000 | United Technologies Corp., 3.650%, 8/16/2023 | 910,079 | ||||||
| 175,000 | Wabtec Corp.,3-month LIBOR + 1.300%, 3.419%, 9/15/2021(e) | 175,005 | ||||||
| 155,000 | Wabtec Corp., 4.950%, 9/15/2028 | 170,916 | ||||||
|
| |||||||
| 2,024,215 | ||||||||
|
| |||||||
| Electric — 5.2% | ||||||||
| 720,000 | Alliant Energy Finance LLC, 4.250%, 6/15/2028, 144A | 772,882 | ||||||
| 225,000 | Ameren Corp., 2.500%, 9/15/2024 | 226,117 | ||||||
| 120,000 | Consolidated Edison Co. of New York, Inc., Series B, 2.900%, 12/01/2026 | 123,009 | ||||||
| 1,035,000 | Consolidated Edison, Inc., Series A, 2.000%, 3/15/2020 | 1,034,434 | ||||||
| 225,000 | Dominion Energy, Inc., 3.071%, 8/15/2024 | 230,480 | ||||||
| 590,000 | DTE Energy Co., Series C, 2.529%, 10/01/2024 | 591,757 | ||||||
See accompanying notes to financial statements.
| 24
Table of Contents
Portfolio of Investments – as of September 30, 2019
Loomis Sayles Intermediate Duration Bond Fund – (continued)
| Principal Amount | Description | Value (†) | ||||||
| Electric — continued | ||||||||
| $ | 1,135,000 | Duke Energy Carolinas LLC, 3.050%, 3/15/2023 | $ | 1,174,325 | ||||
| 575,000 | Evergy, Inc., 2.900%, 9/15/2029 | 572,092 | ||||||
| 451,000 | Exelon Corp., 2.450%, 4/15/2021 | 452,010 | ||||||
| 179,000 | Exelon Generation Co. LLC, 2.950%, 1/15/2020 | 179,244 | ||||||
| 116,000 | Exelon Generation Co. LLC, 4.250%, 6/15/2022 | 121,464 | ||||||
| 605,000 | Fortis, Inc., 2.100%, 10/04/2021 | 603,007 | ||||||
| 188,000 | National Rural Utilities Cooperative Finance Corp., (fixed rate to 4/30/2023, variable rate thereafter), 4.750%, 4/30/2043 | 191,491 | ||||||
| 690,000 | National Rural Utilities Cooperative Finance Corp., MTN, 1.500%, 11/01/2019 | 688,129 | ||||||
| 830,000 | Nextera Energy Capital Holding, Inc., 2.403%, 9/01/2021 | 835,121 | ||||||
| 1,115,000 | PNM Resources, Inc., 3.250%, 3/09/2021 | 1,125,529 | ||||||
| 370,000 | PSEG Power LLC, 3.850%, 6/01/2023 | 390,836 | ||||||
| 235,000 | Public Service Enterprise Group, Inc., 2.875%, 6/15/2024 | 241,112 | ||||||
| 273,000 | Southern Co. (The), 2.750%, 6/15/2020 | 273,997 | ||||||
| 720,000 | Southern Power Co., Series E, 2.500%, 12/15/2021 | 721,234 | ||||||
| 815,000 | Vistra Operations Co. LLC, 3.550%, 7/15/2024, 144A | 820,409 | ||||||
| 1,030,000 | Wisconsin Public Service Corp., 3.350%, 11/21/2021 | 1,058,795 | ||||||
|
| |||||||
| 12,427,474 | ||||||||
|
| |||||||
| Finance Companies — 1.3% | ||||||||
| 790,000 | Air Lease Corp., 3.250%, 10/01/2029 | 778,882 | ||||||
| 275,000 | Air Lease Corp., 3.875%, 7/03/2023 | 286,975 | ||||||
| 210,000 | Aircastle Ltd., 4.125%, 5/01/2024 | 218,785 | ||||||
| 1,005,000 | Ares Capital Corp., 4.200%, 6/10/2024 | 1,030,130 | ||||||
| 305,000 | Aviation Capital Group LLC, 3.875%, 5/01/2023, 144A | 315,403 | ||||||
| 225,000 | Aviation Capital Group LLC, 4.375%, 1/30/2024, 144A | 236,935 | ||||||
| 375,000 | Avolon Holdings Funding Ltd., 3.625%, 5/01/2022, 144A | 380,063 | ||||||
|
| |||||||
| 3,247,173 | ||||||||
|
| |||||||
| Financial Other — 0.2% | ||||||||
| 410,000 | Mitsubishi UFJ Lease & Finance Co. Ltd., 2.652%, 9/19/2022, 144A | 411,275 | ||||||
| 185,000 | ORIX Corp., 3.250%, 12/04/2024 | 191,764 | ||||||
|
| |||||||
| 603,039 | ||||||||
|
| |||||||
| Food & Beverage — 2.8% | ||||||||
| 835,000 | Bacardi Ltd., 4.700%, 5/15/2028, 144A | 911,961 | ||||||
| 120,000 | Brown-Forman Corp., 3.500%, 4/15/2025 | 127,695 | ||||||
| 525,000 | Bunge Ltd. Finance Corp., 4.350%, 3/15/2024 | 552,998 | ||||||
| 565,000 | Coca-Cola Co. (The), 1.750%, 9/06/2024 | 559,702 | ||||||
| 785,000 | Diageo Capital PLC, 2.375%, 10/24/2029 | 777,904 | ||||||
| 1,095,000 | General Mills, Inc., 2.600%, 10/12/2022 | 1,107,033 | ||||||
| 90,000 | Kraft Heinz Foods Co., 3.000%, 6/01/2026 | 89,045 | ||||||
| 555,000 | Kraft Heinz Foods Co., 3.750%, 4/01/2030, 144A | 560,182 | ||||||
| 845,000 | Molson Coors Brewing Co., 2.250%, 3/15/2020 | 844,484 | ||||||
| 795,000 | Mondelez International Holdings Netherlands BV, 2.250%, 9/19/2024, 144A | 791,163 | ||||||
| 140,000 | Smithfield Foods, Inc., 3.350%, 2/01/2022, 144A | 140,417 | ||||||
| 320,000 | Sysco Corp., 3.550%, 3/15/2025 | 339,023 | ||||||
|
| |||||||
| 6,801,607 | ||||||||
|
| |||||||
See accompanying notes to financial statements.
25 |
Table of Contents
Portfolio of Investments – as of September 30, 2019
Loomis Sayles Intermediate Duration Bond Fund – (continued)
| Principal Amount | Description | Value (†) | ||||||
| Government Owned – No Guarantee — 0.1% | ||||||||
| $ | 155,000 | Petroleos Mexicanos, 6.875%, 8/04/2026 | $ | 166,644 | ||||
|
| |||||||
| Health Insurance — 0.1% | ||||||||
| 310,000 | Humana, Inc., 2.500%, 12/15/2020 | 310,707 | ||||||
|
| |||||||
| Healthcare — 0.8% | ||||||||
| 630,000 | Cigna Corp., 3.750%, 7/15/2023 | 659,721 | ||||||
| 95,000 | Express Scripts Holding Co., 4.500%, 2/25/2026 | 103,750 | ||||||
| 65,000 | Express Scripts Holding Co., 4.750%, 11/15/2021 | 68,311 | ||||||
| 190,000 | Fresenius Med Care III Co., 3.750%, 6/15/2029, 144A | 191,116 | ||||||
| 195,000 | HCA, Inc., 4.125%, 6/15/2029 | 204,494 | ||||||
| 183,000 | Life Technologies Corp., 6.000%, 3/01/2020 | 185,802 | ||||||
| 310,000 | MEDNAX, Inc., 6.250%, 1/15/2027, 144A | 307,653 | ||||||
| 94,000 | Quest Diagnostics, Inc., 4.750%, 1/30/2020 | 94,712 | ||||||
|
| |||||||
| 1,815,559 | ||||||||
|
| |||||||
| Hybrid ARMs — 0.1% | ||||||||
| 40,677 | FHLMC,1-year CMT + 2.255%, 4.586%, 1/01/2035(e) | 42,965 | ||||||
| 90,563 | FHLMC,1-year CMT + 2.500%, 4.992%, 5/01/2036(e) | 96,063 | ||||||
|
| |||||||
| 139,028 | ||||||||
|
| |||||||
| Life Insurance — 2.3% | ||||||||
| 85,000 | AIG Global Funding, 2.150%, 7/02/2020, 144A | 85,059 | ||||||
| 380,000 | Athene Global Funding, 2.750%, 4/20/2020, 144A | 381,323 | ||||||
| 330,000 | Brighthouse Financial, Inc., Series WI, 3.700%, 6/22/2027 | 325,879 | ||||||
| 405,000 | Global Atlantic Finance Co., 4.400%, 10/15/2029, 144A | 404,312 | ||||||
| 155,000 | Jackson National Life Global Funding, 3.875%, 6/11/2025, 144A | 166,711 | ||||||
| 505,000 | Metropolitan Life Global Funding I, 2.400%, 6/17/2022, 144A | 509,248 | ||||||
| 1,070,000 | New York Life Global Funding, 2.875%, 4/10/2024, 144A | 1,103,395 | ||||||
| 915,000 | New York Life Global Funding, 2.950%, 1/28/2021, 144A | 926,612 | ||||||
| 615,000 | Protective Life Corp., 3.400%, 1/15/2030, 144A | 625,236 | ||||||
| 720,000 | Reliance Standard Life Global Funding, 3.850%, 9/19/2023, 144A | 756,564 | ||||||
| 170,000 | Unum Group, 4.000%, 6/15/2029 | 176,706 | ||||||
| 63,000 | Unum Group, 5.625%, 9/15/2020 | 65,005 | ||||||
|
| |||||||
| 5,526,050 | ||||||||
|
| |||||||
| Lodging — 0.2% | ||||||||
| 350,000 | Marriott International, Inc., Series Z, 4.150%, 12/01/2023 | 372,518 | ||||||
|
| |||||||
| Media Entertainment — 0.3% | ||||||||
| 95,000 | Activision Blizzard, Inc., 2.300%, 9/15/2021 | 95,244 | ||||||
| 425,000 | CBS Corp., 2.900%, 6/01/2023 | 430,875 | ||||||
| 130,000 | Interpublic Group of Cos., Inc. (The), 3.500%, 10/01/2020 | 131,527 | ||||||
| 112,000 | S&P Global, Inc., 3.300%, 8/14/2020 | 113,072 | ||||||
|
| |||||||
| 770,718 | ||||||||
|
| |||||||
| Metals & Mining — 0.3% | ||||||||
| 585,000 | ArcelorMittal, 3.600%, 7/16/2024 | 590,957 | ||||||
| 155,000 | Glencore Funding LLC, 4.125%, 3/12/2024, 144A | 162,588 | ||||||
|
| |||||||
| 753,545 | ||||||||
|
| |||||||
See accompanying notes to financial statements.
| 26
Table of Contents
Portfolio of Investments – as of September 30, 2019
Loomis Sayles Intermediate Duration Bond Fund – (continued)
| Principal Amount | Description | Value (†) | ||||||
| Midstream — 0.7% | ||||||||
| $ | 25,000 | Energy Transfer Operating LP, 4.250%, 3/15/2023 | $ | 26,119 | ||||
| 440,000 | Midwest Connector Capital Co. LLC, 3.625%, 4/01/2022, 144A | 451,357 | ||||||
| 1,130,000 | MPLX LP,3-month LIBOR + 0.900%, 3.002%, 9/09/2021(e) | 1,133,751 | ||||||
| 195,000 | ONEOK, Inc., 3.400%, 9/01/2029 | 193,715 | ||||||
|
| |||||||
| 1,804,942 | ||||||||
|
| |||||||
| Mortgage Related — 2.2% | ||||||||
| 2,672 | FHLMC, 3.000%, 10/01/2026 | 2,746 | ||||||
| 237 | FHLMC, 6.500%, 1/01/2024 | 264 | ||||||
| 54 | FHLMC, 8.000%, 7/01/2025 | 58 | ||||||
| 54 | FNMA, 6.000%, 9/01/2021 | 54 | ||||||
| 176,347 | GNMA, 4.200%, 2/20/2063(a)(d) | 177,907 | ||||||
| 164,811 | GNMA, 4.217%, 2/20/2063(d) | 166,772 | ||||||
| 44,154 | GNMA, 4.224%, 5/20/2062(d) | 44,482 | ||||||
| 38,217 | GNMA, 4.307%, 5/20/2062(d) | 38,811 | ||||||
| 73,356 | GNMA, 4.360%, 10/20/2062(d) | 74,299 | ||||||
| 106,192 | GNMA, 4.395%, 4/20/2063(d) | 107,635 | ||||||
| 60,484 | GNMA, 4.404%, 6/20/2066(d) | 65,708 | ||||||
| 222,178 | GNMA, 4.431%, 10/20/2066(d) | 244,143 | ||||||
| 104,102 | GNMA, 4.436%, 9/20/2066(d) | 113,815 | ||||||
| 99,405 | GNMA, 4.442%, 11/20/2064(d) | 100,815 | ||||||
| 59,657 | GNMA, 4.443%, 11/20/2066(d) | 64,952 | ||||||
| 68,599 | GNMA, 4.465%, 8/20/2066(d) | 74,706 | ||||||
| 110,346 | GNMA, 4.499%, 11/20/2066(d) | 120,920 | ||||||
| 215,877 | GNMA, 4.504%, 4/20/2063(a)(d) | 218,963 | ||||||
| 123,511 | GNMA, 4.524%, 10/20/2066(d) | 135,341 | ||||||
| 192,292 | GNMA, 4.529%, 9/20/2066(d) | 212,262 | ||||||
| 1,037,337 | GNMA, 4.530%, 4/20/2067(a)(d) | 1,148,890 | ||||||
| 89,322 | GNMA, 4.532%, 10/20/2066(d) | 98,678 | ||||||
| 92,821 | GNMA, 4.545%, 3/20/2063(d) | 93,872 | ||||||
| 458,596 | GNMA, 4.549%, 7/20/2067(a)(d) | 511,488 | ||||||
| 89,240 | GNMA, 4.551%, 2/20/2063(d) | 90,143 | ||||||
| 874,764 | GNMA, 4.590%, 1/20/2067(a)(d) | 973,267 | ||||||
| 12,291 | GNMA, 4.622%, 7/20/2062(d) | 12,493 | ||||||
| 415,378 | GNMA, 4.686%, 5/20/2064(a)(d) | 447,618 | ||||||
| 674 | GNMA, 4.700%, 8/20/2061(d) | 732 | ||||||
| 793 | GNMA, 6.500%, 12/15/2023 | 878 | ||||||
|
| |||||||
| 5,342,712 | ||||||||
|
| |||||||
| Natural Gas — 0.5% | ||||||||
| 250,000 | Atmos Energy Corp., 2.625%, 9/15/2029 | 252,826 | ||||||
| 965,000 | Sempra Energy, 1.625%, 10/07/2019 | 964,909 | ||||||
|
| |||||||
| 1,217,735 | ||||||||
|
| |||||||
| Non-Agency Commercial Mortgage-Backed Securities — 5.4% | ||||||||
| 565,000 | Barclays Commercial Mortgage Securities Trust,Series 2017-C1, Class A2, 3.189%, 2/15/2050(a) | 577,387 | ||||||
| 491,600 | CFCRE Commercial Mortgage Trust,Series 2016-C3, Class A3, 3.865%, 1/10/2048(a) | 532,613 | ||||||
See accompanying notes to financial statements.
27 |
Table of Contents
Portfolio of Investments – as of September 30, 2019
Loomis Sayles Intermediate Duration Bond Fund – (continued)
| Principal Amount | Description | Value (†) | ||||||
| Non-Agency Commercial Mortgage-Backed Securities — continued | ||||||||
| $ | 361,996 | CFCRE Commercial Mortgage Trust,Series 2016-C4, Class A4, 3.283%, 5/10/2058 | $ | 381,352 | ||||
| 992,138 | Citigroup Commercial Mortgage Trust, Series 2016-GC37, Class A4, 3.314%, 4/10/2049(a) | 1,049,631 | ||||||
| 263,676 | Commercial Mortgage Pass Through Certificates,Series 2013-CR8, Class A5, 3.612%, 6/10/2046(d) | �� | 276,015 | |||||
| 535,000 | Commercial Mortgage Pass Through Certificates, Series 2012-LTRT, Class A2, 3.400%, 10/05/2030, 144A(a) | 543,528 | ||||||
| 28,635 | Commercial Mortgage Pass Through Certificates, Series 2014-CR14, Class A2, 3.147%, 2/10/2047 | 28,627 | ||||||
| 68,558 | Commercial Mortgage Pass Through Certificates, Series 2014-CR15, Class A2, 2.928%, 2/10/2047 | 68,545 | ||||||
| 189,792 | Commercial Mortgage Pass Through Certificates, Series 2014-CR16, Class ASB, 3.653%, 4/10/2047 | 195,515 | ||||||
| 478,193 | Commercial Mortgage Pass Through Certificates, Series 2014-LC17, Class A3, 3.723%, 10/10/2047(a) | 493,071 | ||||||
| 280,000 | Commercial Mortgage Pass Through Certificates, Series 2014-UBS3, Class A4, 3.819%, 6/10/2047 | 297,521 | ||||||
| 280,000 | Commercial Mortgage Pass Through Certificates,Series 2015-DC1, Class A5, 3.350%, 2/10/2048 | 293,931 | ||||||
| 520,299 | Commercial Mortgage Pass Through Certificates,Series 2016-DC2, Class A5, 3.765%, 2/10/2049(a) | 561,830 | ||||||
| 640,000 | Credit Suisse Mortgage Capital Certificates,Series 2014-USA, Class A2, 3.953%, 9/15/2037, 144A(a) | 685,232 | ||||||
| 84,913 | CSAIL Commercial Mortgage Trust,Series 2015-C4, Class ASB, 3.617%, 11/15/2048 | 89,026 | ||||||
| 340,000 | GS Mortgage Securities Corp. Trust, Series 2013-PEMB, Class A, 3.550%, 3/05/2033, 144A(d) | 354,634 | ||||||
| 330,000 | GS Mortgage Securities Trust, Series 2014-GC18, Class A4, 4.074%, 1/10/2047 | 354,437 | ||||||
| 180,000 | Hudsons Bay Simon JV Trust, Series 2015-HB10, Class A10, 4.155%, 8/05/2034, 144A | 188,534 | ||||||
| 355,000 | Hudsons Bay Simon JV Trust,Series 2015-HB7, Class A7, 3.914%, 8/05/2034, 144A | 362,582 | ||||||
| 102,657 | JPMorgan Chase Commercial Mortgage Securities Trust,Series 2014-C19, Class ASB, 3.584%, 4/15/2047 | 105,556 | ||||||
| 166,200 | JPMorgan Chase Commercial Mortgage Securities Trust,Series 2017-JP5, Class A1, 2.086%, 3/15/2050 | 165,854 | ||||||
| 1,100,000 | JPMorgan Chase Commercial Mortgage Securities Trust, Series 2019-COR5, Class A4, 3.386%, 6/13/2052 | 1,182,152 | ||||||
| 240,000 | Morgan Stanley Bank of America Merrill Lynch Trust,Series 2013-C10, Class A4, 4.218%, 7/15/2046(d) | 255,948 | ||||||
| 181,889 | Morgan Stanley Bank of America Merrill Lynch Trust,Series 2014-C14, Class A3, 3.669%, 2/15/2047 | 184,768 | ||||||
| 129,604 | Morgan Stanley Bank of America Merrill Lynch Trust,Series 2015-C22, Class A4, 3.306%, 4/15/2048 | 136,292 | ||||||
| 195,456 | Starwood Retail Property Trust, Inc., Series 2014-STAR, Class A,1-month LIBOR + 1.220%, 3.248%, 11/15/2027, 144A(e) | 195,200 | ||||||
See accompanying notes to financial statements.
| 28
Table of Contents
Portfolio of Investments – as of September 30, 2019
Loomis Sayles Intermediate Duration Bond Fund – (continued)
| Principal Amount | Description | Value (†) | ||||||
| Non-Agency Commercial Mortgage-Backed Securities — continued | ||||||||
| $ | 505,000 | UBS-Barclays Commercial Mortgage Trust,Series 2012-TFT, Class A, 2.892%, 6/05/2030, 144A(a) | $ | 504,682 | ||||
| 565,000 | UBS-Barclays Commercial Mortgage Trust,Series 2013-C6, Class A4, 3.244%, 4/10/2046(a) | 582,733 | ||||||
| 201,109 | Wells Fargo Commercial Mortgage Trust,Series 2016-C33, Class A4, 3.426%, 3/15/2059 | 213,652 | ||||||
| 1,295,000 | Wells Fargo Commercial Mortgage Trust,Series 2017-RC1, Class A2, 3.118%, 1/15/2060(a) | 1,319,365 | ||||||
| 152,101 | WFRBS Commercial Mortgage Trust,Series 2014-C19, Class A3, 3.660%, 3/15/2047 | 154,462 | ||||||
| 325,000 | WFRBS Commercial Mortgage Trust,Series 2014-C19, Class A5, 4.101%, 3/15/2047 | 349,872 | ||||||
| 325,752 | WFRBS Commercial Mortgage Trust,Series 2014-C20, Class ASB, 3.638%, 5/15/2047(a) | 336,026 | ||||||
|
| |||||||
| 13,020,573 | ||||||||
|
| |||||||
| Oil Field Services — 0.4% | ||||||||
| 980,000 | Baker Hughes a GE Co. LLC/Baker HughesCo-Obligor, Inc., 2.773%, 12/15/2022 | 996,313 | ||||||
|
| |||||||
| Pharmaceuticals — 0.5% | ||||||||
| 305,000 | AbbVie, Inc., 3.600%, 5/14/2025 | 317,226 | ||||||
| 235,000 | Bayer U.S. Finance II LLC, 3.375%, 7/15/2024, 144A | 240,365 | ||||||
| 525,000 | Pfizer, Inc., 3.200%, 9/15/2023 | 549,833 | ||||||
|
| |||||||
| 1,107,424 | ||||||||
|
| |||||||
| Property & Casualty Insurance — 0.9% | ||||||||
| 645,000 | American Financial Group, Inc., 3.500%, 8/15/2026 | 662,474 | ||||||
| 180,000 | Assurant, Inc., 4.200%, 9/27/2023 | 188,274 | ||||||
| 145,000 | AXIS Specialty Finance LLC, 3.900%, 7/15/2029 | 151,656 | �� | |||||
| 275,000 | Enstar Group Ltd., 4.950%, 6/01/2029 | 290,333 | ||||||
| 690,000 | PartnerRe Finance B LLC, 3.700%, 7/02/2029 | 718,978 | ||||||
| 270,000 | Willis North America, Inc., 2.950%, 9/15/2029 | 265,744 | ||||||
|
| |||||||
| 2,277,459 | ||||||||
|
| |||||||
| Railroads — 0.2% | ||||||||
| 206,000 | CSX Corp., 3.700%, 10/30/2020 | 208,522 | ||||||
| 215,000 | Union Pacific Corp., 3.646%, 2/15/2024 | 227,472 | ||||||
|
| |||||||
| 435,994 | ||||||||
|
| |||||||
| REITs – Apartments — 0.1% | ||||||||
| 270,000 | UDR, Inc., 3.000%, 8/15/2031 | 270,275 | ||||||
|
| |||||||
| REITs – Diversified — 0.2% | ||||||||
| 565,000 | EPR Properties, 3.750%, 8/15/2029 | 564,811 | ||||||
|
| |||||||
| REITs – Health Care — 0.4% | ||||||||
| 615,000 | Omega Healthcare Investors, Inc., 4.500%, 1/15/2025 | 648,251 | ||||||
| 190,000 | Sabra Health Care LP/Sabra Capital Corp., 4.800%, 6/01/2024 | 200,490 | ||||||
|
| |||||||
| 848,741 | ||||||||
|
| |||||||
See accompanying notes to financial statements.
29 |
Table of Contents
Portfolio of Investments – as of September 30, 2019
Loomis Sayles Intermediate Duration Bond Fund – (continued)
| Principal Amount | Description | Value (†) | ||||||
| REITs – Hotels — 0.6% | ||||||||
| $ | 695,000 | Host Hotels & Resorts LP, Series H, 3.375%, 12/15/2029 | $ | 693,960 | ||||
| 785,000 | Service Properties Trust, 4.950%, 10/01/2029 | 778,239 | ||||||
|
| |||||||
| 1,472,199 | ||||||||
|
| |||||||
| REITs – Office Property — 0.3% | ||||||||
| 140,000 | Alexandria Real Estate Equities, Inc., 2.750%, 12/15/2029 | 137,973 | ||||||
| 185,000 | Kilroy Realty LP, 3.050%, 2/15/2030 | 181,219 | ||||||
| 290,000 | Office Properties Income Trust, 4.250%, 5/15/2024 | 296,441 | ||||||
|
| |||||||
| 615,633 | ||||||||
|
| |||||||
| REITs – Regional Malls — 0.3% | ||||||||
| 735,000 | Simon Property Group LP, 2.000%, 9/13/2024 | 727,850 | ||||||
|
| |||||||
| REITs – Shopping Centers — 0.3% | ||||||||
| 565,000 | Brixmor Operating Partnership LP, 3.650%, 6/15/2024 | 587,646 | ||||||
| 120,000 | Regency Centers LP, 2.950%, 9/15/2029 | 119,678 | ||||||
|
| |||||||
| 707,324 | ||||||||
|
| |||||||
| REITs – Single Tenant — 0.2% | ||||||||
| 525,000 | Spirit Realty LP, 3.400%, 1/15/2030 | 521,140 | ||||||
|
| |||||||
| Restaurants — 0.7% | ||||||||
| 1,280,000 | McDonald’s Corp., MTN, 2.625%, 1/15/2022 | 1,299,475 | ||||||
| 420,000 | McDonald’s Corp., MTN, 3.350%, 4/01/2023 | 438,337 | ||||||
|
| |||||||
| 1,737,812 | ||||||||
|
| |||||||
| Retailers — 0.8% | ||||||||
| 345,000 | AutoNation, Inc., 3.500%, 11/15/2024 | 351,580 | ||||||
| 290,000 | AutoNation, Inc., 4.500%, 10/01/2025 | 308,169 | ||||||
| 415,000 | Best Buy Co., Inc., 4.450%, 10/01/2028 | 450,759 | ||||||
| 55,000 | Ralph Lauren Corp., 3.750%, 9/15/2025 | 59,023 | ||||||
| 850,000 | Seven & i Holdings Co. Ltd., 3.350%, 9/17/2021, 144A | 867,609 | ||||||
|
| |||||||
| 2,037,140 | ||||||||
|
| |||||||
| Sovereigns — 0.4% | ||||||||
| 930,000 | Abu Dhabi Government International Bond, 2.500%, 9/30/2029, 144A | 923,471 | ||||||
|
| |||||||
| Technology — 2.6% | ||||||||
| 560,000 | Amphenol Corp., 2.800%, 2/15/2030 | 544,485 | ||||||
| 915,000 | Flex Ltd., 4.875%, 6/15/2029 | 960,508 | ||||||
| 450,000 | Genpact Luxembourg S.a.r.l., 3.700%, 4/01/2022 | 456,819 | ||||||
| 565,000 | Global Payments, Inc., 2.650%, 2/15/2025 | 567,616 | ||||||
| 610,000 | Hewlett Packard Enterprise Co., 2.100%, 10/04/2019, 144A | 609,992 | ||||||
| 1,145,000 | Hewlett Packard Enterprise Co.,3-month LIBOR + 0.680%, 2.807%, 3/12/2021(e) | 1,147,246 | ||||||
| 530,000 | International Business Machines Corp., 2.850%, 5/13/2022 | 541,143 | ||||||
| 89,000 | Jabil, Inc., 5.625%, 12/15/2020 | 92,175 | ||||||
| 175,000 | Marvell Technology Group Ltd., 4.200%, 6/22/2023 | 183,423 | ||||||
| 140,000 | Microchip Technologies, Inc., 3.922%, 6/01/2021 | 142,993 | ||||||
| 565,000 | Panasonic Corp., 2.536%, 7/19/2022, 144A | 568,422 | ||||||
| 205,000 | Seagate HDD Cayman, 4.875%, 3/01/2024 | 215,331 | ||||||
| 130,000 | Texas Instruments, Inc., 2.250%, 9/04/2029 | 127,983 | ||||||
|
| |||||||
| 6,158,136 | ||||||||
|
| |||||||
See accompanying notes to financial statements.
| 30
Table of Contents
Portfolio of Investments – as of September 30, 2019
Loomis Sayles Intermediate Duration Bond Fund – (continued)
| Principal Amount | Description | Value (†) | ||||||
| Tobacco — 0.3% | ||||||||
| $ | 565,000 | BAT Capital Corp., 3.215%, 9/06/2026 | $ | 557,879 | ||||
| 215,000 | Imperial Brands Finance PLC, 3.500%, 7/26/2026, 144A | 214,994 | ||||||
|
| |||||||
| 772,873 | ||||||||
|
| |||||||
| Transportation Services — 1.0% | ||||||||
| 410,000 | FedEx Corp., 3.100%, 8/05/2029 | 406,392 | ||||||
| 695,000 | Penske Truck Leasing Co. LP/PTL Finance Corp., 4.125%, 8/01/2023, 144A | 735,478 | ||||||
| 135,000 | Penske Truck Leasing Co. LP/PTL Finance Corp., 4.450%, 1/29/2026, 144A | 145,783 | ||||||
| 320,000 | Ryder System, Inc., MTN, 3.750%, 6/09/2023 | 335,722 | ||||||
| 275,000 | Ryder System, Inc., MTN, 3.875%, 12/01/2023 | 291,675 | ||||||
| 430,000 | TTX Co., 2.600%, 6/15/2020, 144A | 430,994 | ||||||
|
| |||||||
| 2,346,044 | ||||||||
|
| |||||||
| Treasuries — 19.6% | ||||||||
| 6,585,000 | U.S. Treasury Note, 1.125%, 2/28/2021 | 6,527,124 | ||||||
| 21,825,000 | U.S. Treasury Note, 1.250%, 8/31/2024 | 21,518,939 | ||||||
| 2,395,000 | U.S. Treasury Note, 1.500%, 9/15/2022 | 2,390,509 | ||||||
| 9,330,000 | U.S. Treasury Note, 1.750%, 6/30/2024 | 9,409,086 | ||||||
| 7,015,000 | U.S. Treasury Note, 2.375%, 5/15/2029 | 7,449,601 | ||||||
|
| |||||||
| 47,295,259 | ||||||||
|
| |||||||
| Wireless — 0.1% | ||||||||
| 200,000 | SK Telecom Co. Ltd., 3.750%, 4/16/2023, 144A | 208,655 | ||||||
|
| |||||||
| Wirelines — 0.2% | ||||||||
| 205,000 | British Telecommunications PLC, 4.500%, 12/04/2023 | 220,471 | ||||||
| 144,000 | Verizon Communications, Inc., 3.376%, 2/15/2025 | 151,901 | ||||||
|
| |||||||
| 372,372 | ||||||||
|
| |||||||
| Total Bonds and Notes (Identified Cost $231,408,623) | 235,044,354 | |||||||
|
| |||||||
| Short-Term Investments — 3.6% | ||||||||
| 8,791,292 | Tri-Party Repurchase Agreement with Fixed Income Clearing Corporation, dated 9/30/2019 at 1.100% to be repurchased at $8,791,560 on 10/01/2019 collateralized by $8,420,000 U.S. Treasury Note, 2.625% due 1/31/2026 valued at $8,970,474 including accrued interest (Note 2 of Notes to Financial Statements) (Identified Cost $8,791,292) | 8,791,292 | ||||||
|
| |||||||
| Total Investments — 101.1% (Identified Cost $240,199,915) | 243,835,646 | |||||||
| Other assets less liabilities — (1.1)% | (2,655,425 | ) | ||||||
|
| |||||||
| Net Assets — 100.0% | $ | 241,180,221 | ||||||
|
| |||||||
| (†) | See Note 2 of Notes to Financial Statements. | |||||||
| (a) | Security (or a portion thereof) has been designated to cover the Fund’s obligations under open derivative contracts. |
| ||||||
| (b) | Level 3 security. Value has been determined using significant unobservable inputs. See Note 3 of Notes to Financial Statements. |
| ||||||
See accompanying notes to financial statements.
31 |
Table of Contents
Portfolio of Investments – as of September 30, 2019
Loomis Sayles Intermediate Duration Bond Fund – (continued)
| (c) | Fair valued by the Fund’s adviser. At September 30, 2019, the value of these securities amounted to $676,609 or 0.3% of net assets. See Note 2 of Notes to Financial Statements. |
| ||||||
| (d) | Variable rate security. The interest rate adjusts periodically based on; (i) changes in current interest rates and/or prepayments on underlying pools of assets, if applicable, (ii) reference to a base lending rate plus or minus a margin, and/or (iii) reference to a base lending rate adjusted by a multiplier and/or subject to certain floors or caps. Rate as of September 30, 2019 is disclosed. |
| ||||||
| (e) | Variable rate security. Rate as of September 30, 2019 is disclosed. | |||||||
| 144A | All or a portion of these securities are exempt from registration under Rule 144A of the Securities Act of 1933. These securities may be resold in transactions exempt from registration, normally to qualified institutional buyers. At September 30, 2019, the value of Rule 144A holdings amounted to $58,380,606 or 24.2% of net assets. |
| ||||||
| ABS | Asset-Backed Securities | |||||||
| ARMs | Adjustable Rate Mortgages | |||||||
| CMT | Constant Maturity Treasury | |||||||
| FHLMC | Federal Home Loan Mortgage Corp. | |||||||
| FNMA | Federal National Mortgage Association | |||||||
| GMTN | Global Medium Term Note | |||||||
| GNMA | Government National Mortgage Association | |||||||
| LIBOR | London Interbank Offered Rate | |||||||
| MTN | Medium Term Note | |||||||
| REITs | Real Estate Investment Trusts | |||||||
At September 30, 2019, open long futures contracts were as follows:
| Financial Futures | Expiration Date | Contracts | Notional Amount | Value | Unrealized Appreciation (Depreciation) | |||||||||||||||
5 Year U.S. Treasury Note | 12/31/2019 | 174 | $ | 20,846,172 | $ | 20,731,828 | $ | (114,344 | ) | |||||||||||
|
| |||||||||||||||||||
Industry Summary at September 30, 2019
Treasuries | 19.6 | % | ||
Banking | 17.3 | |||
ABS Car Loan | 9.0 | |||
Non-Agency Commercial Mortgage-Backed Securities | 5.4 | |||
Electric | 5.2 | |||
Automotive | 5.0 | |||
Collateralized Mortgage Obligations | 3.5 | |||
ABS Other | 2.8 | |||
Food & Beverage | 2.8 | |||
Technology | 2.6 | |||
Life Insurance | 2.3 | |||
Mortgage Related | 2.2 | |||
Other Investments, less than 2% each | 19.8 | |||
Short-Term Investments | 3.6 | |||
|
| |||
Total Investments | 101.1 | |||
Other assets less liabilities (including futures contracts) | (1.1 | ) | ||
|
| |||
Net Assets | 100.0 | % | ||
|
|
See accompanying notes to financial statements.
| 32
Table of Contents
Portfolio of Investments – as of September 30, 2019
Loomis Sayles Limited Term Government and Agency Fund
| Principal Amount | Description | Value (†) | ||||||
| Bonds and Notes — 82.4% of Net Assets | ||||||||
| ABS Car Loan — 1.4% | ||||||||
| $ | 1,550,000 | Avis Budget Rental Car Funding AESOP LLC,Series 2016-1A, Class A, 2.990%, 6/20/2022, 144A | $ | 1,566,782 | ||||
| 840,000 | Avis Budget Rental Car Funding AESOP LLC,Series 2019-1, Class A, 3.450%, 3/20/2023, 144A | 862,799 | ||||||
| 1,824,950 | CPS Auto Receivables Trust,Series 2019-C, Class A, 2.550%, 9/15/2022, 144A | 1,826,898 | ||||||
| 1,516,646 | Exeter Automobile Receivables Trust,Series 2019-3A, Class A, 2.590%, 9/15/2022, 144A | 1,519,529 | ||||||
| 936,969 | First Investors Auto Owner Trust,Series 2018-2A, Class A1, 3.230%, 12/15/2022, 144A | 941,329 | ||||||
| 2,090,000 | Foursight Capital Automobile Receivables Trust,Series 2018-2, Class A3, 3.640%, 5/15/2023, 144A | 2,124,200 | ||||||
| 1,495,000 | NextGear Floorplan Master Owner Trust,Series 2017-1A, Class A2, 2.540%, 4/18/2022, 144A | 1,496,323 | ||||||
| 685,000 | NextGear Floorplan Master Owner Trust,Series 2017-2A, Class A2, 2.560%, 10/17/2022, 144A | 687,743 | ||||||
|
| |||||||
| 11,025,603 | ||||||||
|
| |||||||
| ABS Home Equity — 0.2% | ||||||||
| 810,839 | CoreVest American Finance Trust,Series 2017-1, Class A, 2.968%, 10/15/2049, 144A | 814,808 | ||||||
| 725,259 | Towd Point Mortgage Trust,Series 2015-2, Class 1A12, 2.750%, 11/25/2060, 144A(a) | 726,096 | ||||||
|
| |||||||
| 1,540,904 | ||||||||
|
| |||||||
| ABS Other — 0.8% | ||||||||
| 736,996 | Diamond Resorts Owner Trust,Series 2018-1, Class A, 3.700%, 1/21/2031, 144A | 751,646 | ||||||
| 825,000 | Navistar Financial Dealer Note Master Owner Trust II,Series 2018-1, Class A,1-month LIBOR + 0.630%, 2.648%, 9/25/2023, 144A(b) | 826,016 | ||||||
| 2,740,122 | SoFi Consumer Loan Program Trust,Series 2018-4, Class A, 3.540%, 11/26/2027, 144A | 2,768,093 | ||||||
| 2,214,829 | Welk Resorts LLC,Series 2019-AA, Class A, 2.800%, 6/15/2038, 144A | 2,236,563 | ||||||
|
| |||||||
| 6,582,318 | ||||||||
|
| |||||||
| ABS Student Loan — 0.0% | ||||||||
| 85,950 | SoFi Professional Loan Program LLC,Series 2016-D, Class A1,1-month LIBOR + 0.950%, 2.968%, 1/25/2039, 144A(b) | 86,387 | ||||||
|
| |||||||
| Agency Commercial Mortgage-Backed Securities — 9.2% | ||||||||
| 1,303,608 | Federal National Mortgage Association,Series 2015-M17, Class FA,1-month LIBOR + 0.930%, 3.228%, 11/25/2022(b) | 1,304,998 | ||||||
| 614,913 | Federal National Mortgage Association,Series 2016-M3, Class ASQ2, 2.263%, 2/25/2023 | 615,614 | ||||||
| 13,445,000 | FHLMC Multifamily Structured Pass Through Certificates, Series KJ20, Class A2, 3.799%, 12/25/2025 | 14,621,628 | ||||||
| 4,393,698 | FHLMC Multifamily Structured Pass Through Certificates, Series K006, Class A2, 4.251%, 1/25/2020 | 4,400,849 | ||||||
| 4,185,657 | FHLMC Multifamily Structured Pass Through Certificates, Series K014, Class A2, 3.871%, 4/25/2021 | 4,261,753 | ||||||
See accompanying notes to financial statements.
33 |
Table of Contents
Portfolio of Investments – as of September 30, 2019
Loomis Sayles Limited Term Government and Agency Fund – (continued)
| Principal Amount | Description | Value (†) | ||||||
| Agency Commercial Mortgage-Backed Securities — continued | ||||||||
| $ | 3,859,195 | FHLMC Multifamily Structured Pass Through Certificates, Series K015, Class A2, 3.230%, 7/25/2021 | $ | 3,913,210 | ||||
| 6,377,810 | FHLMC Multifamily Structured Pass Through Certificates, Series K017, Class A2, 2.873%, 12/25/2021 | 6,472,989 | ||||||
| 2,580,000 | FHLMC Multifamily Structured Pass Through Certificates, Series K064, Class A2, 3.224%, 3/25/2027 | 2,772,844 | ||||||
| 2,358,609 | FHLMC Multifamily Structured Pass Through Certificates, Series K725, Class A1, 2.666%, 5/25/2023 | 2,387,363 | ||||||
| 248,895 | FHLMC Multifamily Structured Pass Through Certificates, Series KF06, Class A,1-month LIBOR + 0.330%, 2.419%, 11/25/2021(b) | 248,431 | ||||||
| 1,730,160 | FHLMC Multifamily Structured Pass Through Certificates, Series KF14, Class A,1-month LIBOR + 0.650%, 2.739%, 1/25/2023(b) | 1,730,695 | ||||||
| 4,664,742 | FHLMC Multifamily Structured Pass Through Certificates, Series KF53, Class A,1-month LIBOR + 0.390%, 2.479%, 10/25/2025(b) | 4,644,389 | ||||||
| 429,355 | FHLMC Multifamily Structured Pass Through Certificates, Series KI01, Class A,1-month LIBOR + 0.160%, 2.249%, 9/25/2022(b) | 428,534 | ||||||
| 2,087,765 | FHLMC Multifamily Structured Pass Through Certificates, Series KI02, Class A,1-month LIBOR + 0.200%, 2.289%, 2/25/2023(b) | 2,087,332 | ||||||
| 10,261,000 | FHLMC Multifamily Structured Pass Through Certificates, Series KJ21, Class A2, 3.700%, 9/25/2026 | 11,183,132 | ||||||
| 5,979,543 | FHLMC Multifamily Structured Pass Through Certificates, Series Q008, Class A,1-month LIBOR + 0.390%, 2.479%, 10/25/2045(b) | 5,982,608 | ||||||
| 5,200,000 | FNMA, 3.580%, 1/01/2026 | 5,643,286 | ||||||
| 130,409 | Government National Mortgage Association,Series 2003-72, Class Z, 5.288%, 11/16/2045(a) | 139,828 | ||||||
| 103,464 | Government National Mortgage Association,Series 2003-88, Class Z, 4.498%, 3/16/2046(a) | 108,703 | ||||||
|
| |||||||
| 72,948,186 | ||||||||
|
| |||||||
| Collateralized Mortgage Obligations — 12.3% | ||||||||
| 34,256 | Federal Home Loan Mortgage Corp., REMIC, Series 1500, Class FD,7-year Treasury – 0.200%, 1.740%, 5/15/2023(b)(c)(d) | 33,380 | ||||||
| 25,744 | Federal Home Loan Mortgage Corp., REMIC, Series 1552, Class I,10-year Treasury – 0.650%, 0.930%, 8/15/2023(b)(c)(d) | 25,144 | ||||||
| 116,683 | Federal Home Loan Mortgage Corp., REMIC, Series 2131, Class ZB, 6.000%, 3/15/2029(c)(d) | 125,097 | ||||||
| 29,332 | Federal Home Loan Mortgage Corp., REMIC, Series 2931, Class DE, 4.000%, 2/15/2020(c)(d) | 29,078 | ||||||
| 992,266 | Federal Home Loan Mortgage Corp., REMIC, Series 2978, Class JG, 5.500%, 5/15/2035 | 1,078,487 | ||||||
| 1,499,194 | Federal Home Loan Mortgage Corp., REMIC, Series 3036, Class NE, 5.000%, 9/15/2035 | 1,671,139 | ||||||
| 754,076 | Federal Home Loan Mortgage Corp., REMIC, Series 3412, Class AY, 5.500%, 2/15/2038 | 826,482 | ||||||
| 1,120,447 | Federal Home Loan Mortgage Corp., REMIC, Series 3561, Class W, 2.827%, 6/15/2048(a)(e) | 1,118,069 | ||||||
| 1,285,005 | Federal Home Loan Mortgage Corp., REMIC, Series 3620, Class AT, 3.991%, 12/15/2036(a)(e) | 1,353,122 | ||||||
See accompanying notes to financial statements.
| 34
Table of Contents
Portfolio of Investments – as of September 30, 2019
Loomis Sayles Limited Term Government and Agency Fund – (continued)
| Principal Amount | Description | Value (†) | ||||||
| Collateralized Mortgage Obligations — continued | ||||||||
| $ | 721,452 | Federal Home Loan Mortgage Corp., REMIC, Series 4212, Class FW,1-month LIBOR + 2.100%, 4.128%, 6/15/2043(b) | $ | 739,143 | ||||
| 1,122,802 | Federal National Mortgage Association, REMIC,Series 2003-48, Class GH, 5.500%, 6/25/2033 | 1,269,397 | ||||||
| 18,277 | Federal National Mortgage Association, REMIC,Series 1992-162, Class FB,7-year Treasury – 0.050%, 1.690%, 9/25/2022(b)(c)(d) | 18,046 | ||||||
| 26,094 | Federal National Mortgage Association, REMIC,Series 1994-42, Class FD,10-year Treasury – 0.500%, 1.080%, 4/25/2024(b)(c)(d) | 25,437 | ||||||
| 8,169 | Federal National Mortgage Association, REMIC,Series 2002-W10, Class A7, 4.693%, 8/25/2042(a)(c)(d) | 8,391 | ||||||
| 403,933 | Federal National Mortgage Association, REMIC,Series 2005-100, Class BQ, 5.500%, 11/25/2025(c)(d) | 418,175 | ||||||
| 495,726 | Federal National Mortgage Association, REMIC,Series 2007-73, Class A1,1-month LIBOR + 0.060%, 2.279%, 7/25/2037(b) | 487,249 | ||||||
| 1,151,255 | Federal National Mortgage Association, REMIC,Series 2008-86, Class LA, 3.453%, 8/25/2038(a) | 1,190,059 | ||||||
| 5,412,360 | Federal National Mortgage Association, REMIC,Series 2013-67, Class NF,1-month LIBOR + 1.000%, 3.018%, 7/25/2043(b) | 5,255,850 | ||||||
| 5,479 | Federal National Mortgage Association, REMIC,Series G93-19, Class FD,10-year Treasury – 0.650%, 1.150%, 4/25/2023(b)(c)(d) | 5,424 | ||||||
| 8,016 | FHLMC Structured Pass Through Securities,Series T-60, Class 2A1, 4.294%, 3/25/2044(a)(c)(d) | 8,635 | ||||||
| 519,719 | FHLMC Structured Pass Through Securities,Series T-62, Class 1A1,12-month MTA + 1.200%, 3.646%, 10/25/2044(b) | 525,332 | ||||||
| 1,038,021 | Government National Mortgage Association,Series 2010-H20, Class AF,1-month LIBOR + 0.330%, 2.559%, 10/20/2060(b) | 1,034,057 | ||||||
| 994,919 | Government National Mortgage Association,Series 2010-H24, Class FA,1-month LIBOR + 0.350%, 2.579%, 10/20/2060(b) | 991,359 | ||||||
| 785,374 | Government National Mortgage Association,Series 2011-H06, Class FA,1-month LIBOR + 0.450%, 2.679%, 2/20/2061(b) | 784,751 | ||||||
| 311,961 | Government National Mortgage Association,Series 2011-H23, Class HA, 3.000%, 12/20/2061 | 313,346 | ||||||
| 919,799 | Government National Mortgage Association,Series 2012-124, Class HT, 7.290%, 7/20/2032(a) | 917,547 | ||||||
| 46,140 | Government National Mortgage Association,Series 2012-H15, Class FA,1-month LIBOR + 0.450%, 2.679%, 5/20/2062(b)(c)(d) | 45,678 | ||||||
| 849,603 | Government National Mortgage Association,Series 2012-H18, Class NA,1-month LIBOR + 0.520%, 2.749%, 8/20/2062(b) | 849,957 | ||||||
| 509,257 | Government National Mortgage Association,Series 2012-H29, Class HF,1-month LIBOR + 0.500%, 2.729%, 10/20/2062(b)(c)(d) | 506,118 | ||||||
| 204,772 | Government National Mortgage Association,Series 2013-H02, Class GF,1-month LIBOR + 0.500%, 2.729%, 12/20/2062(b)(c)(d) | 203,793 | ||||||
| 3,426,027 | Government National Mortgage Association,Series 2013-H08, Class FA,1-month LIBOR + 0.350%, 2.579%, 3/20/2063(b) | 3,417,187 | ||||||
| 2,286,031 | Government National Mortgage Association,Series 2013-H10, Class FA,1-month LIBOR + 0.400%, 2.629%, 3/20/2063(b) | 2,282,066 | ||||||
| 8,513,294 | Government National Mortgage Association,Series 2013-H22, Class FT,1-year CMT + 0.650%, 2.590%, 4/20/2063(b) | 8,536,004 | ||||||
See accompanying notes to financial statements.
35 |
Table of Contents
Portfolio of Investments – as of September 30, 2019
Loomis Sayles Limited Term Government and Agency Fund – (continued)
| Principal Amount | Description | Value (†) | ||||||
| Collateralized Mortgage Obligations — continued | ||||||||
| $ | 5,235,262 | Government National Mortgage Association,Series 2014-H14, Class FA,1-month LIBOR + 0.500%, 2.880%, 7/20/2064(b) | $ | 5,237,810 | ||||
| 3,669,200 | Government National Mortgage Association,Series 2014-H15, Class FA,1-month LIBOR + 0.500%, 2.729%, 7/20/2064(b) | 3,671,036 | ||||||
| 3,121,125 | Government National Mortgage Association,Series 2015-H04, Class FL,1-month LIBOR + 0.470%, 2.699%, 2/20/2065(b) | 3,119,609 | ||||||
| 50,759 | Government National Mortgage Association,Series 2015-H05, Class FA,1-month LIBOR + 0.300%, 2.529%, 4/20/2061(b)(c)(d) | 50,373 | ||||||
| 630,987 | Government National Mortgage Association,Series 2015-H09, Class HA, 1.750%, 3/20/2065 | 627,686 | ||||||
| 5,334,199 | Government National Mortgage Association,Series 2015-H10, Class JA, 2.250%, 4/20/2065 | 5,266,320 | ||||||
| 108,690 | Government National Mortgage Association,Series 2015-H11, Class FA,1-month LIBOR + 0.250%, 2.479%, 4/20/2065(b)(c)(d) | 108,049 | ||||||
| 4,445,103 | Government National Mortgage Association,Series 2015-H12, Class FL,1-month LIBOR + 0.230%, 2.459%, 5/20/2065(b) | 4,419,905 | ||||||
| 1,009,607 | Government National Mortgage Association,Series 2015-H19, Class FH,1-month LIBOR + 0.300%, 2.529%, 7/20/2065(b) | 1,008,358 | ||||||
| 97,663 | Government National Mortgage Association,Series 2015-H29, Class FA,1-month LIBOR + 0.700%, 2.929%, 10/20/2065(b)(c)(d) | 97,352 | ||||||
| 36,234 | Government National Mortgage Association,Series 2015-H30, Class FA,1-month LIBOR + 0.680%, 2.909%, 8/20/2061(b)(c)(d) | 36,123 | ||||||
| 5,599,036 | Government National Mortgage Association,Series 2016-H06, Class FC,1-month LIBOR + 0.920%, 3.149%, 2/20/2066(b) | 5,657,871 | ||||||
| 2,129,864 | Government National Mortgage Association,Series 2016-H10, Class FJ,1-month LIBOR + 0.600%, 2.829%, 4/20/2066(b) | 2,132,534 | ||||||
| 2,808,531 | Government National Mortgage Association,Series 2016-H19, Class FJ,1-month LIBOR + 0.400%, 2.629%, 9/20/2063(b) | 2,807,881 | ||||||
| 2,807,113 | Government National Mortgage Association,Series 2017-H24, Class FJ,1-month LIBOR + 0.250%, 2.479%, 10/20/2067(b) | 2,804,409 | ||||||
| 8,027,184 | Government National Mortgage Association,Series 2018-H11, Class FJ,12-month LIBOR + 0.080%, 2.590%, 6/20/2068(b) | 7,914,329 | ||||||
| 14,158,998 | Government National Mortgage Association,Series 2019-H04, Class NA, 3.500%, 9/20/2068 | 15,070,958 | ||||||
| 216,191 | NCUA Guaranteed Notes,Series 2010-A1, Class A,1-month LIBOR + 0.350%, 2.399%, 12/07/2020(b) | 216,071 | ||||||
| 311,918 | NCUA Guaranteed Notes,Series 2010-R1, Class 1A,1-month LIBOR + 0.450%, 2.507%, 10/07/2020(b) | 312,053 | ||||||
| 855,328 | NCUA Guaranteed Notes,Series 2010-R3, Class 1A,1-month LIBOR + 0.560%, 2.617%, 12/08/2020(b) | 855,832 | ||||||
| 56,002 | NCUA Guaranteed Notes,Series 2010-R3, Class 2A,1-month LIBOR + 0.560%, 2.617%, 12/08/2020(b) | 56,085 | ||||||
|
| |||||||
| 97,563,643 | ||||||||
|
| |||||||
| Hybrid ARMs — 6.0% | ||||||||
| 1,232,834 | FHLMC,12-month LIBOR + 1.771%, 4.113%, 9/01/2035(b) | 1,294,263 | ||||||
| 348,556 | FHLMC,1-year CMT + 1.870%, 4.397%, 9/01/2038(b) | 363,125 | ||||||
| 403,297 | FHLMC,6-month LIBOR + 1.704%, 4.398%, 6/01/2037(b) | 408,700 | ||||||
See accompanying notes to financial statements.
| 36
Table of Contents
Portfolio of Investments – as of September 30, 2019
Loomis Sayles Limited Term Government and Agency Fund – (continued)
| Principal Amount | Description | Value (†) | ||||||
| Hybrid ARMs — continued | ||||||||
| $ | 202,019 | FHLMC,12-month LIBOR + 1.625%, 4.403%, 11/01/2038(b) | $ | 210,514 | ||||
| 68,839 | FHLMC,12-month LIBOR + 1.729%, 4.426%, 12/01/2037(b) | 69,693 | ||||||
| 595,771 | FHLMC,1-year CMT + 2.248%, 4.478%, 9/01/2038(b) | 627,876 | ||||||
| 850,147 | FHLMC,1-year CMT + 2.220%, 4.595%, 7/01/2033(b) | 892,641 | ||||||
| 235,856 | FHLMC,12-month LIBOR + 1.718%, 4.636%, 4/01/2037(b) | 247,766 | ||||||
| 489,962 | FHLMC,1-year CMT + 2.165%, 4.672%, 4/01/2036(b) | 506,337 | ||||||
| 150,456 | FHLMC,1-year CMT + 2.209%, 4.677%, 9/01/2038(b) | 158,970 | ||||||
| 280,577 | FHLMC,12-month LIBOR + 1.798%, 4.684%, 11/01/2038(b) | 296,056 | ||||||
| 2,476,457 | FHLMC,1-year CMT + 2.251%, 4.695%, 3/01/2037(b) | 2,614,440 | ||||||
| 280,238 | FHLMC,12-month LIBOR + 1.795%, 4.750%, 3/01/2038(b) | 298,739 | ||||||
| 1,810,855 | FHLMC,12-month LIBOR + 1.896%, 4.771%, 9/01/2041(b) | 1,899,558 | ||||||
| 249,823 | FHLMC,12-month LIBOR + 1.934%, 4.780%, 12/01/2034(b) | 263,798 | ||||||
| 887,079 | FHLMC,1-year CMT + 2.286%, 4.790%, 2/01/2036(b) | 935,889 | ||||||
| 1,542,124 | FHLMC,1-year CMT + 2.277%, 4.854%, 2/01/2036(b) | 1,627,165 | ||||||
| 850,548 | FHLMC,12-month LIBOR + 1.741%, 4.856%, 4/01/2037(b) | 898,207 | ||||||
| 558,373 | FHLMC,1-year CMT + 2.245%, 4.940%, 3/01/2036(b) | 589,407 | ||||||
| 241,365 | FHLMC,1-year CMT + 2.250%, 5.000%, 2/01/2035(b) | 254,426 | ||||||
| 210,389 | FHLMC,12-month LIBOR + 2.180%, 5.305%, 3/01/2037(b) | 222,225 | ||||||
| 75,288 | FNMA,6-month LIBOR + 1.544%, 3.881%, 2/01/2037(b) | 78,093 | ||||||
| 1,363,032 | FNMA,12-month LIBOR + 1.595%, 3.952%, 9/01/2037(b) | 1,427,321 | ||||||
| 734,519 | FNMA,6-month LIBOR + 1.542%, 4.107%, 7/01/2035(b) | 759,270 | ||||||
| 183,213 | FNMA,12-month LIBOR + 1.564%, 4.204%, 8/01/2035(b) | 192,128 | ||||||
| 379,746 | FNMA,1-year CMT + 2.223%, 4.309%, 8/01/2035(b) | 402,706 | ||||||
| 671,068 | FNMA,12-month LIBOR + 1.712%, 4.337%, 8/01/2034(b) | 703,137 | ||||||
| 368,879 | FNMA,12-month LIBOR + 1.657%, 4.347%, 8/01/2038(b) | 382,800 | ||||||
| 292,850 | FNMA,1-year CMT + 2.145%, 4.352%, 9/01/2036(b) | 308,188 | ||||||
| 486,795 | FNMA,12-month LIBOR + 1.619%, 4.382%, 7/01/2038(b) | 509,947 | ||||||
| 1,183,445 | FNMA,12-month LIBOR + 1.601%, 4.401%, 7/01/2035(b) | 1,235,132 | ||||||
| 320,567 | FNMA,12-month LIBOR + 1.656%, 4.422%, 10/01/2033(b) | 334,758 | ||||||
| 1,549,303 | FNMA,12-month LIBOR + 1.562%, 4.424%, 4/01/2037(b) | 1,619,711 | ||||||
| 1,465,479 | FNMA,1-year CMT + 2.177%, 4.458%, 11/01/2033(b) | 1,543,655 | ||||||
| 317,095 | FNMA,12-month LIBOR + 1.690%, 4.501%, 11/01/2036(b) | 332,932 | ||||||
| 198,072 | FNMA,12-month LIBOR + 1.802%, 4.529%, 7/01/2041(b) | 207,260 | ||||||
| 187,943 | FNMA,12-month LIBOR + 1.732%, 4.536%, 11/01/2035(b) | 196,738 | ||||||
| 323,753 | FNMA,1-year CMT + 2.185%, 4.549%, 12/01/2034(b) | 335,841 | ||||||
| 339,336 | FNMA,1-year CMT + 2.287%, 4.556%, 10/01/2033(b) | 355,238 | ||||||
| 3,286,112 | FNMA,1-year CMT + 2.185%, 4.562%, 10/01/2034(b) | 3,466,875 | ||||||
| 572,195 | FNMA,12-month LIBOR + 1.605%, 4.607%, 4/01/2037(b) | 600,424 | ||||||
| 1,683,684 | FNMA,1-year CMT + 2.177%, 4.634%, 12/01/2040(b) | 1,771,986 | ||||||
| 1,136,557 | FNMA,1-year CMT + 2.273%, 4.648%, 6/01/2037(b) | 1,205,926 | ||||||
| 1,682,184 | FNMA,12-month LIBOR + 1.800%, 4.661%, 10/01/2041(b) | 1,749,800 | ||||||
| 622,470 | FNMA,1-year CMT + 2.162%, 4.674%, 6/01/2036(b) | 656,169 | ||||||
| 567,411 | FNMA,1-year CMT +2.287%, 4.681%, 6/01/2033(b) | 596,746 | ||||||
| 1,216,903 | FNMA,12-month LIBOR + 1.722%, 4.690%, 9/01/2037(b) | 1,283,560 | ||||||
| 204,766 | FNMA,1-year CMT + 2.192%, 4.725%, 4/01/2033(b) | 212,340 | ||||||
| 396,870 | FNMA,1-year CMT + 2.138%, 4.730%, 9/01/2034(b) | 417,885 | ||||||
| 2,342,387 | FNMA,1-year CMT + 2.218%, 4.746%, 4/01/2034(b) | 2,470,118 | ||||||
See accompanying notes to financial statements.
37 |
Table of Contents
Portfolio of Investments – as of September 30, 2019
Loomis Sayles Limited Term Government and Agency Fund – (continued)
| Principal Amount | Description | Value (†) | ||||||
| Hybrid ARMs — continued | ||||||||
| $ | 365,603 | FNMA,12-month LIBOR + 1.800%, 4.800%, 12/01/2041(b) | $ | 383,798 | ||||
| 65,902 | FNMA,1-year CMT + 2.440%, 4.815%, 8/01/2033(b) | 69,158 | ||||||
| 65,669 | FNMA,12-month LIBOR + 1.811%, 4.821%, 1/01/2037(b) | 69,243 | ||||||
| 1,615,278 | FNMA,12-month LIBOR + 1.796%, 4.823%, 3/01/2037(b) | 1,707,116 | ||||||
| 528,786 | FNMA,1-year CMT + 2.245%, 4.833%, 4/01/2034(b) | 555,799 | ||||||
| 612,164 | FNMA,1-year CMT + 2.185%, 4.848%, 1/01/2036(b) | 644,400 | ||||||
| 483,502 | FNMA,12-month LIBOR + 1.765%, 4.890%, 2/01/2037(b) | 505,118 | ||||||
| 981,675 | FNMA,6-month LIBOR + 2.280%, 4.910%, 7/01/2037(b) | 1,042,535 | ||||||
| 198,735 | FNMA,12-month LIBOR + 1.800%, 4.925%, 3/01/2034(b) | 209,048 | ||||||
| 1,024,873 | FNMA,12-month LIBOR + 1.820%, 4.945%, 2/01/2047(b) | 1,090,616 | ||||||
| 209,418 | FNMA,1-year CMT + 2.500%, 5.031%, 8/01/2036(b) | 222,964 | ||||||
| 428,399 | FNMA,1-year CMT + 2.482%, 5.066%, 5/01/2035(b) | 455,480 | ||||||
| 507,938 | FNMA,12-month LIBOR + 2.473%, 5.348%, 6/01/2035(b) | 544,551 | ||||||
|
| |||||||
| 47,536,305 | ||||||||
|
| |||||||
| Mortgage Related — 5.2% | ||||||||
| 54,567 | FHLMC, 3.000%, 10/01/2026 | 56,066 | ||||||
| 422,875 | FHLMC, 4.000%, with various maturities from 2024 to 2042(f) | 448,805 | ||||||
| 199,146 | FHLMC, 4.500%, with various maturities from 2025 to 2034(f) | 207,704 | ||||||
| 73,602 | FHLMC, 5.500%, 10/01/2023 | 76,165 | ||||||
| 31,182 | FHLMC, COFI + 1.250%, 5.773%, 6/01/2020(b) | 31,247 | ||||||
| 59,604 | FHLMC, COFI + 1.250%, 5.889%, 8/01/2020(b) | 59,913 | ||||||
| 56,181 | FHLMC, COFI + 1.250%, 5.921%, 10/01/2020(b) | 56,545 | ||||||
| 75,420 | FHLMC, COFI + 1.250%, 5.954%, 11/01/2020(b) | 75,946 | ||||||
| 173 | FHLMC, 6.000%, 11/01/2019 | 173 | ||||||
| 222,860 | FHLMC, 6.500%, 12/01/2034 | 255,662 | ||||||
| 155 | FHLMC, 7.500%, 6/01/2026 | 168 | ||||||
| 131,032 | FNMA, 3.000%, 3/01/2042 | 135,107 | ||||||
| 1,244,613 | FNMA, 5.000%, with various maturities from 2037 to 2038(f) | 1,373,866 | ||||||
| 554,021 | FNMA, 5.500%, with various maturities from 2023 to 2033(f) | 591,866 | ||||||
| 483,899 | FNMA, 6.000%, with various maturities from 2021 to 2022(f) | 500,092 | ||||||
| 175,584 | FNMA, 6.500%, with various maturities from 2032 to 2037(f) | 196,768 | ||||||
| 67,127 | FNMA, 7.500%, with various maturities from 2030 to 2032(f) | 73,449 | ||||||
| 3,074,061 | GNMA,1-month LIBOR + 1.718%, 4.093%, 2/20/2061(b) | 3,197,117 | ||||||
| 427,558 | GNMA, 4.129%, 6/20/2062(a) | 429,720 | ||||||
| 227,629 | GNMA, 4.180%, 3/20/2062(a) | 228,443 | ||||||
| 258,919 | GNMA, 4.187%, 2/20/2062(a) | 259,769 | ||||||
| 45,791 | GNMA, 4.205%, 8/20/2061(a) | 47,008 | ||||||
| 162,287 | GNMA, 4.233%, 12/20/2061(a) | 164,696 | ||||||
| 405,166 | GNMA, 4.248%, 12/20/2061(a) | 407,648 | ||||||
| 2,293,929 | GNMA,1-month LIBOR + 1.890%, 4.287%, 2/20/2063(b) | 2,387,833 | ||||||
| 1,059,942 | GNMA, 4.309%, 3/20/2063(a) | 1,072,441 | ||||||
| 800,993 | GNMA, 4.371%, 2/20/2063(a) | 810,372 | ||||||
| 76,553 | GNMA, 4.401%, 2/20/2062(a) | 77,905 | ||||||
| 2,323,376 | GNMA, 4.409%, 6/20/2063(a) | 2,365,697 | ||||||
| 2,351,742 | GNMA, 4.469%, 12/20/2062(a) | 2,373,185 | ||||||
| 3,386,514 | GNMA, 4.486%, 10/20/2065(a) | 3,691,274 | ||||||
| 55,263 | GNMA, 4.537%, 3/20/2062(a) | 55,353 | ||||||
See accompanying notes to financial statements.
| 38
Table of Contents
Portfolio of Investments – as of September 30, 2019
Loomis Sayles Limited Term Government and Agency Fund – (continued)
| Principal Amount | Description | Value (†) | ||||||
| Mortgage Related — continued | ||||||||
| $ | 3,608,956 | GNMA, 4.540%, 11/20/2062(a) | $ | 3,634,019 | ||||
| 2,840,319 | GNMA,1-month LIBOR + 2.159%, 4.556%, 3/20/2063(b) | 2,956,925 | ||||||
| 526,862 | GNMA, 4.566%, 4/20/2063(a) | 535,104 | ||||||
| 475,256 | GNMA, 4.600%, 7/20/2063(a) | 507,430 | ||||||
| 1,853,894 | GNMA, 4.601%, 2/20/2066(a) | 1,999,109 | ||||||
| 1,938,575 | GNMA, 4.624%, 3/20/2064(a) | 2,080,663 | ||||||
| 87,775 | GNMA, 4.638%, 8/20/2062(a) | 88,675 | ||||||
| 373,542 | GNMA, 4.650%, 1/20/2064(a) | 402,758 | ||||||
| 838,499 | GNMA,1-month LIBOR + 2.266%, 4.663%, 5/20/2065(b) | 888,060 | ||||||
| 1,863,070 | GNMA, 4.674%, 11/20/2063(a) | 2,008,392 | ||||||
| 837,751 | GNMA,1-month LIBOR + 2.276%, 4.674%, 6/20/2065(b) | 891,196 | ||||||
| 1,367,612 | GNMA, 4.686%, 5/20/2064(a) | 1,473,762 | ||||||
| 24,112 | GNMA, 4.697%, 3/20/2061(a) | 24,499 | ||||||
| 49,383 | GNMA, 4.700%, with various maturities in 2061(a)(f) | 51,731 | ||||||
| 32,646 | GNMA, 4.710%, 8/20/2061(a) | 33,542 | ||||||
| 1,534,981 | GNMA,1-month LIBOR + 2.364%, 4.760%, 2/20/2063(b) | 1,601,583 | ||||||
| 62,659 | GNMA, 4.826%, 4/20/2061(a) | 63,526 | ||||||
| 80,579 | GNMA, 4.940%, 2/20/2062(a) | 80,853 | ||||||
| 11,056 | GNMA, 6.000%, 12/15/2031 | 12,683 | ||||||
| 45,996 | GNMA, 6.500%, 5/15/2031 | 52,975 | ||||||
| 55,348 | GNMA, 7.000%, 10/15/2028 | 61,203 | ||||||
|
| |||||||
| 41,156,691 | ||||||||
|
| |||||||
| Non-Agency Commercial Mortgage-Backed Securities — 2.0% | ||||||||
| 1,310,000 | Commercial Mortgage Pass Through Certificates, Series 2012-LTRT, Class A2, 3.400%, 10/05/2030, 144A | 1,330,883 | ||||||
| 1,488,000 | Commercial Mortgage Pass Through Certificates, Series 2014-UBS2, Class A5, 3.961%, 3/10/2047 | 1,587,575 | ||||||
| 4,282,000 | Commercial Mortgage Pass Through Certificates,Series 2016-DC2, Class ASB, 3.550%, 2/10/2049 | 4,479,670 | ||||||
| 1,397,747 | DBUBS Mortgage Trust, Series 2011-LC2A, Class A4, 4.537%, 7/10/2044, 144A | 1,435,638 | ||||||
| 2,600,000 | Hudsons Bay Simon JV Trust,Series 2015-HB7, Class A7, 3.914%, 8/05/2034, 144A | 2,655,529 | ||||||
| 1,040,000 | Morgan Stanley Bank of America Merrill Lynch Trust,Series 2013-C8, Class A4, 3.134%, 12/15/2048 | 1,069,045 | ||||||
| 3,287,216 | Starwood Retail Property Trust, Inc., Series 2014-STAR, Class A,1-month LIBOR + 1.220%, 3.248%, 11/15/2027, 144A(b) | 3,282,907 | ||||||
|
| |||||||
| 15,841,247 | ||||||||
|
| |||||||
| Treasuries — 45.3% | ||||||||
| 8,395,000 | U.S. Treasury Note, 1.125%, 6/30/2021 | 8,311,706 | ||||||
| 24,445,000 | U.S. Treasury Note, 1.125%, 7/31/2021 | 24,201,505 | ||||||
| 21,405,000 | U.S. Treasury Note, 1.125%, 8/31/2021 | 21,188,442 | ||||||
| 20,945,000 | U.S. Treasury Note, 1.250%, 7/31/2023 | 20,692,187 | ||||||
| 9,635,000 | U.S. Treasury Note, 1.375%, 1/31/2021 | 9,584,567 | ||||||
| 5,000,000 | U.S. Treasury Note, 1.375%, 9/30/2023 | 4,963,281 | ||||||
| 13,605,000 | U.S. Treasury Note, 1.625%, 8/31/2022 | 13,616,692 | ||||||
| 26,050,000 | U.S. Treasury Note, 1.750%, 11/30/2021 | 26,108,002 | ||||||
See accompanying notes to financial statements.
39 |
Table of Contents
Portfolio of Investments – as of September 30, 2019
Loomis Sayles Limited Term Government and Agency Fund – (continued)
| Principal Amount | Description | Value (†) | ||||||
| Treasuries — continued | ||||||||
| $ | 8,460,000 | U.S. Treasury Note, 1.750%, 6/30/2022 | $ | 8,497,012 | ||||
| 12,480,000 | U.S. Treasury Note, 1.750%, 7/15/2022 | 12,529,237 | ||||||
| 12,605,000 | U.S. Treasury Note, 1.750%, 9/30/2022 | 12,667,533 | ||||||
| 16,165,000 | U.S. Treasury Note, 1.875%, 4/30/2022 | 16,274,240 | ||||||
| 9,900,000 | U.S. Treasury Note, 2.000%, 2/28/2021 | 9,934,805 | ||||||
| 17,015,000 | U.S. Treasury Note, 2.000%, 12/31/2021 | 17,153,247 | ||||||
| 13,945,000 | U.S. Treasury Note, 2.125%, 9/30/2021 | 14,073,011 | ||||||
| 6,000,000 | U.S. Treasury Note, 2.125%, 5/15/2022 | 6,078,516 | ||||||
| 8,305,000 | U.S. Treasury Note, 2.125%, 11/30/2023 | 8,487,970 | ||||||
| 6,550,000 | U.S. Treasury Note, 2.250%, 2/15/2021 | 6,592,729 | ||||||
| 11,915,000 | U.S. Treasury Note, 2.250%, 1/31/2024 | 12,252,902 | ||||||
| 5,290,000 | U.S. Treasury Note, 2.250%, 11/15/2027 | 5,533,629 | ||||||
| 8,000,000 | U.S. Treasury Note, 2.375%, 12/31/2020 | 8,056,562 | ||||||
| 3,865,000 | U.S. Treasury Note, 2.500%, 12/31/2020 | 3,898,215 | ||||||
| 3,130,000 | U.S. Treasury Note, 2.500%, 1/31/2024 | 3,251,165 | ||||||
| 7,835,000 | U.S. Treasury Note, 2.875%, 11/15/2021 | 8,033,935 | ||||||
| 67,520,000 | U.S. Treasury Note, 2.875%, 10/31/2023 | 70,983,037 | ||||||
| 6,030,000 | U.S. Treasury Note, 2.875%, 11/30/2023 | 6,345,868 | ||||||
|
| |||||||
| 359,309,995 | ||||||||
|
| |||||||
| Total Bonds and Notes (Identified Cost $645,691,022) | 653,591,279 | |||||||
|
| |||||||
| Short-Term Investments — 18.5% | ||||||||
| 32,100,000 | Federal Home Loan Bank Discount Notes, 1.600%, 10/04/2019(g) | 32,094,971 | ||||||
| 40,200,000 | Federal Home Loan Bank Discount Notes, 1.600%, 10/07/2019(g) | 40,187,404 | ||||||
| 11,815,923 | Tri-Party Repurchase Agreement with Fixed Income Clearing Corporation, dated 9/30/2019 at 1.100% to be repurchased at $11,816,284 on 10/01/2019 collateralized by $11,630,000 U.S. Treasury Note, 2.125% due 5/15/2025 valued at $12,054,228 including accrued interest (Note 2 of Notes to Financial Statements) | 11,815,923 | ||||||
| 3,530,000 | U.S. Treasury Bills, 1.764%, 1/23/2020(g) | 3,509,952 | ||||||
| 10,090,000 | U.S. Treasury Bills,1.815%-2.380%, 10/03/2019(g)(h) | 10,089,082 | ||||||
| 12,565,000 | U.S. Treasury Bills,1.823%-2.468%, 2/27/2020(g)(h) | 12,472,041 | ||||||
| 11,510,000 | U.S. Treasury Bills,1.843%-2.301%, 11/21/2019(g)(h) | 11,480,747 | ||||||
| 11,625,000 | U.S. Treasury Bills, 2.377%, 10/24/2019(g) | 11,611,687 | ||||||
| 13,145,000 | U.S. Treasury Bills, 2.396%, 10/17/2019(g) | 13,134,645 | ||||||
|
| |||||||
| Total Short-Term Investments (Identified Cost $146,371,099) | 146,396,452 | |||||||
|
| |||||||
| Total Investments — 100.9% (Identified Cost $792,062,121) | 799,987,731 | |||||||
| Other assets less liabilities — (0.9)% | (7,139,770 | ) | ||||||
|
| |||||||
| Net Assets — 100.0% | $ | 792,847,961 | ||||||
|
| |||||||
See accompanying notes to financial statements.
| 40
Table of Contents
Portfolio of Investments – as of September 30, 2019
Loomis Sayles Limited Term Government and Agency Fund – (continued)
| (†) | See Note 2 of Notes to Financial Statements. |
| ||||||
| (a) | Variable rate security. The interest rate adjusts periodically based on; (i) changes in current interest rates and/or prepayments on underlying pools of assets, if applicable, (ii) reference to a base lending rate plus or minus a margin, and/or (iii) reference to a base lending rate adjusted by a multiplier and/or subject to certain floors or caps. Rate as of September 30, 2019 is disclosed. |
| ||||||
| (b) | Variable rate security. Rate as of September 30, 2019 is disclosed. |
| ||||||
| (c) | Level 3 security. Value has been determined using significant unobservable inputs. See Note 3 of Notes to Financial Statements. |
| ||||||
| (d) | Fair valued by the Fund’s adviser. At September 30, 2019, the value of these securities amounted to $1,744,293 or 0.2% of net assets. See Note 2 of Notes to Financial Statements. |
| ||||||
| (e) | Security represents right to receive monthly interest payments on an underlying pool of mortgages. Principal shown is the outstanding par amount of the pool held as of the end of the period. |
| ||||||
| (f) | The Fund’s investment in mortgage related securities of Federal Home Loan Mortgage Corporation, Federal National Mortgage Association and Government National Mortgage Association are interests in separate pools of mortgages. All separate investments in securities of each issuer which have the same coupon rate have been aggregated for the purpose of presentation in the Portfolio of Investments. |
| ||||||
| (g) | Interest rate represents discount rate at time of purchase; not a coupon rate. |
| ||||||
| (h) | The Fund’s investment in U.S. Government/Agency securities is comprised of various lots with differing discount rates. These separate investments, which have the same maturity date, have been aggregated for the purpose of presentation in the Portfolio of Investments. |
| ||||||
| 144A | All or a portion of these securities are exempt from registration under Rule 144A of the Securities Act of 1933. These securities may be resold in transactions exempt from registration, normally to qualified institutional buyers. At September 30, 2019, the value of Rule 144A holdings amounted to $27,940,169 or 3.5% of net assets. |
| ||||||
| ABS | Asset-Backed Securities |
| ||||||
| ARMs | Adjustable Rate Mortgages |
| ||||||
| CMT | Constant Maturity Treasury |
| ||||||
| COFI | Cost Of Funds Index |
| ||||||
| FHLMC | Federal Home Loan Mortgage Corp. |
| ||||||
| FNMA | Federal National Mortgage Association |
| ||||||
| GNMA | Government National Mortgage Association |
| ||||||
| LIBOR | London Interbank Offered Rate |
| ||||||
| MTA | Monthly Treasury Average Interest |
| ||||||
| REMIC | Real Estate Mortgage Investment Conduit |
| ||||||
See accompanying notes to financial statements.
41 |
Table of Contents
Portfolio of Investments – as of September 30, 2019
Loomis Sayles Limited Term Government and Agency Fund – (continued)
Industry Summary at September 30, 2019
Treasuries | 45.3 | % | ||
Collateralized Mortgage Obligations | 12.3 | |||
Agency Commercial Mortgage-Backed Securities | 9.2 | |||
Hybrid ARMs | 6.0 | |||
Mortgage Related | 5.2 | |||
Non-Agency Commercial Mortgage-Backed Securities | 2.0 | |||
Other Investments, less than 2% each | 2.4 | |||
Short-Term Investments | 18.5 | |||
|
| |||
Total Investments | 100.9 | |||
Other assets less liabilities | (0.9 | ) | ||
|
| |||
Net Assets | 100.0 | % | ||
|
|
See accompanying notes to financial statements.
| 42
Table of Contents
Statements of Assets and Liabilities
September 30, 2019
| Intermediate Duration Bond Fund | Limited Term Government and Agency Fund | |||||||
ASSETS |
| |||||||
Investments at cost | $ | 240,199,915 | $ | 792,062,121 | ||||
Net unrealized appreciation | 3,635,731 | 7,925,610 | ||||||
|
|
|
| |||||
Investments at value | 243,835,646 | 799,987,731 | ||||||
Cash | 4,398 | — | ||||||
Due from brokers (Note 2) | 145,000 | — | ||||||
Receivable for Fund shares sold | 2,101,370 | 862,409 | ||||||
Receivable for securities sold | 487,003 | 71,894,421 | ||||||
Interest receivable | 1,096,453 | 3,233,165 | ||||||
Tax reclaims receivable | 4,467 | — | ||||||
Prepaid expenses (Note 8) | 17 | 60 | ||||||
|
|
|
| |||||
TOTAL ASSETS | 247,674,354 | 875,977,786 | ||||||
|
|
|
| |||||
LIABILITIES |
| |||||||
Payable for securities purchased | 6,163,703 | 80,181,824 | ||||||
Payable for Fund shares redeemed | 74,556 | 1,833,089 | ||||||
Payable for variation margin on futures contracts (Note 2) | 8,201 | — | ||||||
Distributions payable | — | 307,984 | ||||||
Management fees payable (Note 6) | 38,574 | 253,981 | ||||||
Deferred Trustees’ fees (Note 6) | 114,317 | 342,370 | ||||||
Administrative fees payable (Note 6) | 8,549 | 27,632 | ||||||
Payable to distributor (Note 6d) | 2,185 | 11,549 | ||||||
Other accounts payable and accrued expenses | 84,048 | 171,396 | ||||||
|
|
|
| |||||
TOTAL LIABILITIES | 6,494,133 | 83,129,825 | ||||||
|
|
|
| |||||
NET ASSETS | $ | 241,180,221 | $ | 792,847,961 | ||||
|
|
|
| |||||
NET ASSETS CONSIST OF: |
| |||||||
Paid-in capital | $ | 236,774,714 | $ | 821,425,470 | ||||
Accumulated earnings (loss) | 4,405,507 | (28,577,509 | ) | |||||
|
|
|
| |||||
NET ASSETS | $ | 241,180,221 | $ | 792,847,961 | ||||
|
|
|
| |||||
See accompanying notes to financial statements.
43 |
Table of Contents
Statements of Assets and Liabilities (continued)
September 30, 2019
| Intermediate Duration Bond Fund | Limited Term Government and Agency Fund | |||||||
COMPUTATION OF NET ASSET VALUE AND OFFERING PRICE: | ||||||||
Class A shares: | ||||||||
Net assets | $ | 21,415,384 | $ | 308,185,863 | ||||
|
|
|
| |||||
Shares of beneficial interest | 2,037,282 | 27,174,545 | ||||||
|
|
|
| |||||
Net asset value and redemption price per share | $ | 10.51 | $ | 11.34 | ||||
|
|
|
| |||||
Offering price per share(100/[100-maximum sales charge] of net asset value) (Note 1) | $ | 10.98 | $ | 11.60 | ||||
|
|
|
| |||||
Class C shares:(redemption price per share is equal to net asset value less any applicable contingent deferred sales charge) (Note 1) | ||||||||
Net assets | $ | 466,898 | $ | 22,141,954 | ||||
|
|
|
| |||||
Shares of beneficial interest | 44,304 | 1,950,835 | ||||||
|
|
|
| |||||
Net asset value and offering price per share | $ | 10.54 | $ | 11.35 | ||||
|
|
|
| |||||
Class N shares: |
| |||||||
Net assets | $ | 3,545,687 | $ | 5,272,101 | ||||
|
|
|
| |||||
Shares of beneficial interest | 337,687 | 463,536 | ||||||
|
|
|
| |||||
Net asset value, offering and redemption price per share | $ | 10.50 | $ | 11.37 | ||||
|
|
|
| |||||
Class Y shares: |
| |||||||
Net assets | $ | 215,752,252 | $ | 457,248,043 | ||||
|
|
|
| |||||
Shares of beneficial interest | 20,531,567 | 40,185,434 | ||||||
|
|
|
| |||||
Net asset value, offering and redemption price per share | $ | 10.51 | $ | 11.38 | ||||
|
|
|
| |||||
See accompanying notes to financial statements.
| 44
Table of Contents
Statements of Operations
For the Year Ended September 30, 2019
| Intermediate Duration Bond Fund | Limited Term Government and Agency Fund | |||||||
INVESTMENT INCOME |
| |||||||
Interest | $ | 6,658,845 | $ | 15,862,051 | ||||
Less net foreign taxes withheld | (3,931 | ) | — | |||||
|
|
|
| |||||
| 6,654,914 | 15,862,051 | |||||||
|
|
|
| |||||
Expenses |
| |||||||
Management fees (Note 6) | 541,556 | 2,760,971 | ||||||
Service and distribution fees (Note 6) | 51,316 | 1,066,425 | ||||||
Administrative fees (Note 6) | 95,382 | 330,827 | ||||||
Trustees’ fees and expenses (Note 6) | 23,355 | 41,373 | ||||||
Transfer agent fees and expenses (Notes 6 and 7) | 169,403 | 695,642 | ||||||
Audit and tax services fees | 51,108 | 55,151 | ||||||
Custodian fees and expenses | 20,121 | 36,442 | ||||||
Legal fees (Note 8) | 6,114 | 21,958 | ||||||
Registration fees | 77,918 | 97,177 | ||||||
Shareholder reporting expenses | 15,455 | 75,873 | ||||||
Miscellaneous expenses (Note 8) | 30,054 | 42,468 | ||||||
|
|
|
| |||||
Total expenses | 1,081,782 | 5,224,307 | ||||||
Less waiver and/or expense reimbursement (Note 6) | (164,234 | ) | (20,017 | ) | ||||
|
|
|
| |||||
Net expenses | 917,548 | 5,204,290 | ||||||
|
|
|
| |||||
Net investment income | 5,737,366 | 10,657,761 | ||||||
|
|
|
| |||||
NET REALIZED AND UNREALIZED GAIN (LOSS) ON INVESTMENTS AND FUTURES CONTRACTS | ||||||||
Net realized gain (loss) on: |
| |||||||
Investments | 4,214,915 | (805,903 | ) | |||||
Futures contracts | 1,026,542 | — | ||||||
Net change in unrealized appreciation (depreciation) on: |
| |||||||
Investments | 6,536,114 | 23,250,762 | ||||||
Futures contracts | 10,368 | — | ||||||
|
|
|
| |||||
Net realized and unrealized gain on investments and futures contracts | 11,787,939 | 22,444,859 | ||||||
|
|
|
| |||||
NET INCREASE IN NET ASSETS RESULTING FROM OPERATIONS | $ | 17,525,305 | $ | 33,102,620 | ||||
|
|
|
| |||||
See accompanying notes to financial statements.
45 |
Table of Contents
Statements of Changes in Net Assets
| Intermediate Duration Bond Fund | Limited Term Government and Agency Fund | |||||||||||||||
| Year Ended September 30, 2019 | Year Ended September 30, 2018 | Year Ended September 30, 2019 | Year Ended September 30, 2018 | |||||||||||||
FROM OPERATIONS: | ||||||||||||||||
Net investment income | $ | 5,737,366 | $ | 4,230,759 | $ | 10,657,761 | $ | 7,851,107 | ||||||||
Net realized gain (loss) on investments and futures contracts | 5,241,457 | (2,736,102 | ) | (805,903 | ) | (1,854,197 | ) | |||||||||
Net change in unrealized appreciation (depreciation) on investments and futures contracts | 6,546,482 | (2,837,300 | ) | 23,250,762 | (6,897,838 | ) | ||||||||||
|
|
|
|
|
|
|
| |||||||||
Net increase (decrease) in net assets resulting from operations | 17,525,305 | (1,342,643 | ) | 33,102,620 | (900,928 | ) | ||||||||||
|
|
|
|
|
|
|
| |||||||||
FROM DISTRIBUTIONS TO SHAREHOLDERS: | ||||||||||||||||
Class A | (489,457 | ) | (457,955 | ) | (6,888,790 | ) | (6,062,622 | ) | ||||||||
Class C | (4,669 | ) | (30,450 | ) | (335,648 | ) | (373,941 | ) | ||||||||
Class N | (14,658 | ) | — | (117,078 | ) | (53,072 | ) | |||||||||
Class Y | (5,477,745 | ) | (3,945,026 | ) | (9,249,815 | ) | (7,556,453 | ) | ||||||||
|
|
|
|
|
|
|
| |||||||||
Total distributions | (5,986,529 | ) | (4,433,431 | ) | (16,591,331 | ) | (14,046,088 | ) | ||||||||
|
|
|
|
|
|
|
| |||||||||
NET INCREASE (DECREASE) IN NET ASSETS FROM CAPITAL SHARE TRANSACTIONS (NOTE 11) | 62,370,471 | (6,673,219 | ) | 54,497,302 | (4,981,212 | ) | ||||||||||
|
|
|
|
|
|
|
| |||||||||
Net increase (decrease) in net assets | 73,909,247 | (12,449,293 | ) | 71,008,591 | (19,928,228 | ) | ||||||||||
NET ASSETS |
| |||||||||||||||
Beginning of the year | 167,270,974 | 179,720,267 | 721,839,370 | 741,767,598 | ||||||||||||
|
|
|
|
|
|
|
| |||||||||
End of the year | $ | 241,180,221 | $ | 167,270,974 | $ | 792,847,961 | $ | 721,839,370 | ||||||||
|
|
|
|
|
|
|
| |||||||||
See accompanying notes to financial statements.
| 46
Table of Contents
Financial Highlights
For a share outstanding throughout each period.
| Intermediate Duration Bond Fund—Class A* | ||||||||||||||||||||
| Year Ended September 30, 2019 | Year Ended September 30, 2018 | Year Ended September 30, 2017 | Year Ended September 30, 2016 | Year Ended September 30, 2015 | ||||||||||||||||
Net asset value, beginning of the period | $ | 9.97 | $ | 10.29 | $ | 10.52 | $ | 10.39 | $ | 10.39 | ||||||||||
|
|
|
|
|
|
|
|
|
| |||||||||||
INCOME (LOSS) FROM INVESTMENT OPERATIONS: | ||||||||||||||||||||
Net investment income(a) | 0.25 | 0.22 | 0.17 | 0.20 | 0.20 | |||||||||||||||
Net realized and unrealized gain (loss) | 0.55 | (0.31 | ) | (0.12 | ) | 0.17 | 0.03 | |||||||||||||
|
|
|
|
|
|
|
|
|
| |||||||||||
Total from Investment Operations | 0.80 | (0.09 | ) | 0.05 | 0.37 | 0.23 | ||||||||||||||
|
|
|
|
|
|
|
|
|
| |||||||||||
LESS DISTRIBUTIONS FROM: | ||||||||||||||||||||
Net investment income | (0.26 | ) | (0.23 | ) | (0.20 | ) | (0.21 | ) | (0.22 | ) | ||||||||||
Net realized capital gains | — | — | (0.08 | ) | (0.03 | ) | (0.01 | ) | ||||||||||||
|
|
|
|
|
|
|
|
|
| |||||||||||
Total Distributions | (0.26 | ) | (0.23 | ) | (0.28 | ) | (0.24 | ) | (0.23 | ) | ||||||||||
|
|
|
|
|
|
|
|
|
| |||||||||||
Net asset value, end of the period | $ | 10.51 | $ | 9.97 | $ | 10.29 | $ | 10.52 | $ | 10.39 | ||||||||||
|
|
|
|
|
|
|
|
|
| |||||||||||
Total return(b)(c) | 8.11 | % | (0.85 | )% | 0.44 | % | 3.64 | % | 2.17 | % | ||||||||||
RATIOS TO AVERAGE NET ASSETS: | ||||||||||||||||||||
Net assets, end of the period (000’s) | $ | 21,415 | $ | 19,149 | $ | 21,828 | $ | 19,327 | $ | 18,425 | ||||||||||
Net expenses(d) | 0.65 | % | 0.65 | % | 0.65 | % | 0.65 | % | 0.65 | % | ||||||||||
Gross expenses | �� | 0.72 | % | 0.70 | % | 0.72 | % | 0.72 | % | 0.71 | % | |||||||||
Net investment income | 2.42 | % | 2.17 | % | 1.69 | % | 1.89 | % | 1.93 | % | ||||||||||
Portfolio turnover rate | 135 | % | 152 | % | 216 | % | 151 | % | 151 | % | ||||||||||
| * | Effective August 31, 2016, Retail Class shares were redesignated as Class A shares. |
| (a) | Per share net investment income has been calculated using the average shares outstanding during the period. |
| (b) | A sales charge for Class A shares is not reflected in total return calculations. |
| (c) | Had certain expenses not been waived/reimbursed during the period, total returns would have been lower. |
| (d) | The investment adviser agreed to waive its fees and/or reimburse a portion of the Fund’s expenses during the period. Without this waiver/reimbursement, expenses would have been higher. |
See accompanying notes to financial statements.
47 |
Table of Contents
Financial Highlights (continued)
For a share outstanding throughout each period.
| Intermediate Duration Bond Fund—Class C | ||||||||||||||||
| Year Ended September 30, 2019 | Year Ended September 30, 2018 | Year Ended September 30, 2017 | Period Ended September 30, 2016* | |||||||||||||
Net asset value, beginning of the period | $ | 10.00 | $ | 10.30 | $ | 10.53 | $ | 10.53 | ||||||||
|
|
|
|
|
|
|
| |||||||||
INCOME (LOSS) FROM INVESTMENT OPERATIONS: | ||||||||||||||||
Net investment income(a) | 0.17 | 0.13 | 0.10 | 0.01 | ||||||||||||
Net realized and unrealized gain (loss) | 0.55 | (0.31 | ) | (0.13 | ) | 0.00 | (b) | |||||||||
|
|
|
|
|
|
|
| |||||||||
Total from Investment Operations | 0.72 | (0.18 | ) | (0.03 | ) | 0.01 | ||||||||||
|
|
|
|
|
|
|
| |||||||||
LESS DISTRIBUTIONS FROM: | ||||||||||||||||
Net investment income | (0.18 | ) | (0.12 | ) | (0.12 | ) | (0.01 | ) | ||||||||
Net realized capital gains | — | — | (0.08 | ) | — | |||||||||||
|
|
|
|
|
|
|
| |||||||||
Total Distributions | (0.18 | ) | (0.12 | ) | (0.20 | ) | (0.01 | ) | ||||||||
|
|
|
|
|
|
|
| |||||||||
Net asset value, end of the period | $ | 10.54 | $ | 10.00 | $ | 10.30 | $ | 10.53 | ||||||||
|
|
|
|
|
|
|
| |||||||||
Total return(c)(d) | 7.28 | % | (1.71 | )% | (0.29 | )% | 0.08 | %(e) | ||||||||
RATIOS TO AVERAGE NET ASSETS: | ||||||||||||||||
Net assets, end of the period (000’s) | $ | 467 | $ | 2 | $ | 3,225 | $ | 3,088 | ||||||||
Net expenses(f) | 1.40 | % | 1.40 | % | 1.40 | % | 1.40 | %(g) | ||||||||
Gross expenses | 1.48 | % | 1.45 | % | 1.48 | % | 1.56 | %(g) | ||||||||
Net investment income | 1.64 | % | 1.31 | % | 0.95 | % | 0.86 | %(g) | ||||||||
Portfolio turnover rate | 135 | % | 152 | % | 216 | % | 151 | % | ||||||||
| * | From commencement of Class operations on August 31, 2016 through September 30, 2016. |
| (a) | Per share net investment income has been calculated using the average shares outstanding during the period. |
| (b) | Amount rounds to less than $0.01 per share. |
| (c) | A contingent deferred sales charge for Class C shares is not reflected in total return calculations. |
| (d) | Had certain expenses not been waived/reimbursed during the period, total returns would have been lower. |
| (e) | Periods less than one year are not annualized. |
| (f) | The investment adviser agreed to waive its fees and/or reimburse a portion of the Fund’s expenses during the period. Without this waiver/reimbursement, expenses would have been higher. |
| (g) | Computed on an annualized basis for periods less than one year. |
See accompanying notes to financial statements.
| 48
Table of Contents
Financial Highlights (continued)
For a share outstanding throughout each period.
| Intermediate Duration Bond Fund—Class N | ||||
| Period Ended September 30, 2019* | ||||
Net asset value, beginning of the period | $ | 10.07 | ||
|
| |||
INCOME (LOSS) FROM INVESTMENT OPERATIONS: | ||||
Net investment income(a) | 0.17 | |||
Net realized and unrealized gain (loss) | 0.45 | |||
|
| |||
Total from Investment Operations | 0.62 | |||
|
| |||
LESS DISTRIBUTIONS FROM: | ||||
Net investment income | (0.19 | ) | ||
|
| |||
Net asset value, end of the period | $ | 10.50 | ||
|
| |||
Total return(b)(c) | 6.19 | % | ||
RATIOS TO AVERAGE NET ASSETS: | ||||
Net assets, end of the period (000’s) | $ | 3,546 | ||
Net expenses(d)(e) | 0.35 | % | ||
Gross expenses(e) | 0.42 | % | ||
Net investment income(e) | 2.54 | % | ||
Portfolio turnover rate | 135 | %(f) | ||
| * | From commencement of Class operations on February 1, 2019 through September 30, 2019. |
| (a) | Per share net investment income has been calculated using the average shares outstanding during the period. |
| (b) | Had certain expenses not been waived/reimbursed during the period, total returns would have been lower. |
| (c) | Periods less than one year are not annualized. |
| (d) | The investment adviser agreed to waive its fees and/or reimburse a portion of the Fund’s expenses during the period. Without this waiver/reimbursement, expenses would have been higher. |
| (e) | Computed on an annualized basis for periods less than one year. |
| (f) | Represents the Fund’s portfolio turnover rate for year ended September 30, 2019. |
See accompanying notes to financial statements.
49 |
Table of Contents
Financial Highlights (continued)
For a share outstanding throughout each period.
| Intermediate Duration Bond Fund—Class Y* | ||||||||||||||||||||
| Year Ended September 30, 2019 | Year Ended September 30, 2018 | Year Ended September 30, 2017 | Year Ended September 30, 2016 | Year Ended September 30, 2015 | ||||||||||||||||
Net asset value, beginning of the period | $ | 9.97 | $ | 10.29 | $ | 10.52 | $ | 10.39 | $ | 10.39 | ||||||||||
|
|
|
|
|
|
|
|
|
| |||||||||||
INCOME (LOSS) FROM INVESTMENT OPERATIONS: | ||||||||||||||||||||
Net investment income(a) | 0.27 | 0.25 | 0.20 | 0.22 | 0.22 | |||||||||||||||
Net realized and unrealized gain (loss) | 0.55 | (0.31 | ) | (0.13 | ) | 0.18 | 0.04 | |||||||||||||
|
|
|
|
|
|
|
|
|
| |||||||||||
Total from Investment Operations | 0.82 | (0.06 | ) | 0.07 | 0.40 | 0.26 | ||||||||||||||
|
|
|
|
|
|
|
|
|
| |||||||||||
LESS DISTRIBUTIONS FROM: | ||||||||||||||||||||
Net investment income | (0.28 | ) | (0.26 | ) | (0.22 | ) | (0.24 | ) | (0.25 | ) | ||||||||||
Net realized capital gains | — | — | (0.08 | ) | (0.03 | ) | (0.01 | ) | ||||||||||||
|
|
|
|
|
|
|
|
|
| |||||||||||
Total Distributions | (0.28 | ) | (0.26 | ) | (0.30 | ) | (0.27 | ) | (0.26 | ) | ||||||||||
|
|
|
|
|
|
|
|
|
| |||||||||||
Net asset value, end of the period | $ | 10.51 | $ | 9.97 | $ | 10.29 | $ | 10.52 | $ | 10.39 | ||||||||||
|
|
|
|
|
|
|
|
|
| |||||||||||
Total return(b) | 8.38 | % | (0.60 | )% | 0.69 | % | 3.90 | % | 2.42 | % | ||||||||||
RATIOS TO AVERAGE NET ASSETS: | ||||||||||||||||||||
Net assets, end of the period (000’s) | $ | 215,752 | $ | 148,119 | $ | 154,668 | $ | 139,398 | $ | 88,592 | ||||||||||
Net expenses(c) | 0.40 | % | 0.40 | % | 0.40 | % | 0.40 | % | 0.40 | % | ||||||||||
Gross expenses | 0.48 | % | 0.45 | % | 0.47 | % | 0.47 | % | 0.47 | % | ||||||||||
Net investment income | 2.67 | % | 2.43 | % | 1.93 | % | 2.11 | % | 2.15 | % | ||||||||||
Portfolio turnover rate | 135 | % | 152 | % | 216 | % | 151 | % | 151 | % | ||||||||||
| * | Effective August 31, 2016, Institutional Class shares were redesignated as Class Y shares. |
| (a) | Per share net investment income has been calculated using the average shares outstanding during the period. |
| (b) | Had certain expenses not been waived/reimbursed during the period, total returns would have been lower. |
| (c) | The investment adviser agreed to waive its fees and/or reimburse a portion of the Fund’s expenses during the period. Without this waiver/reimbursement, expenses would have been higher. |
See accompanying notes to financial statements.
| 50
Table of Contents
Financial Highlights (continued)
For a share outstanding throughout each period.
| Limited Term Government and Agency Fund—Class A | ||||||||||||||||||||
| Year Ended September 30, 2019 | Year Ended September 30, 2018 | Year Ended September 30, 2017 | Year Ended September 30, 2016 | Year Ended September 30, 2015 | ||||||||||||||||
Net asset value, beginning of the period | $ | 11.09 | $ | 11.32 | $ | 11.51 | $ | 11.57 | $ | 11.61 | ||||||||||
|
|
|
|
|
|
|
|
|
| |||||||||||
INCOME (LOSS) FROM INVESTMENT OPERATIONS: | ||||||||||||||||||||
Net investment income(a) | 0.15 | 0.11 | 0.08 | 0.11 | 0.14 | |||||||||||||||
Net realized and unrealized gain (loss) | 0.34 | (0.13 | ) | (0.09 | ) | 0.00 | (b) | 0.01 | (c) | |||||||||||
|
|
|
|
|
|
|
|
|
| |||||||||||
Total from Investment Operations | 0.49 | (0.02 | ) | (0.01 | ) | 0.11 | 0.15 | |||||||||||||
|
|
|
|
|
|
|
|
|
| |||||||||||
LESS DISTRIBUTIONS FROM: | ||||||||||||||||||||
Net investment income | (0.24 | ) | (0.21 | ) | (0.18 | ) | (0.17 | ) | (0.19 | ) | ||||||||||
|
|
|
|
|
|
|
|
|
| |||||||||||
Net asset value, end of the period | $ | 11.34 | $ | 11.09 | $ | 11.32 | $ | 11.51 | $ | 11.57 | ||||||||||
|
|
|
|
|
|
|
|
|
| |||||||||||
Total return(d) | 4.42 | % | (0.17 | )% | (0.04 | )% | 0.93 | % | 1.26 | % | ||||||||||
RATIOS TO AVERAGE NET ASSETS: | ||||||||||||||||||||
Net assets, end of the period (000’s) | $ | 308,186 | $ | 328,475 | $ | 336,227 | $ | 442,671 | $ | 346,317 | ||||||||||
Net expenses | 0.80 | % | 0.80 | % | 0.80 | % | 0.77 | % | 0.77 | % | ||||||||||
Gross expenses | 0.80 | % | 0.80 | % | 0.80 | % | 0.77 | % | 0.77 | % | ||||||||||
Net investment income | 1.31 | % | 1.02 | % | 0.67 | % | 0.96 | % | 1.21 | % | ||||||||||
Portfolio turnover rate | 527 | %(e) | 157 | % | 126 | % | 109 | %(f) | 48 | % | ||||||||||
| (a) | Per share net investment income has been calculated using the average shares outstanding during the period. |
| (b) | Amount rounds to less than $0.01 per share. |
| (c) | The amount shown for a share outstanding does not correspond with the aggregate realized and unrealized gain (loss) on investments for the period due to the timing of sales and redemptions of fund shares in relation to fluctuating market values of investments of the Fund. |
| (d) | A sales charge for Class A shares is not reflected in total return calculations. |
| (e) | The variation in the Fund’s turnover rate from 2018 to 2019 is due to an increase in the volume of U.S. Treasury securities related to certain trading strategies. |
| (f) | The variation in the Fund’s turnover rate from 2015 to 2016 was primarily due to fluctuation in the level of fund assets due to shareholder flows. |
See accompanying notes to financial statements.
51 |
Table of Contents
Financial Highlights (continued)
For a share outstanding throughout each period.
| Limited Term Government and Agency Fund—Class C | ||||||||||||||||||||
| Year Ended September 30, 2019 | Year Ended September 30, 2018 | Year Ended September 30, 2017 | Year Ended September 30, 2016 | Year Ended September 30, 2015 | ||||||||||||||||
Net asset value, beginning of the period | $ | 11.10 | $ | 11.33 | $ | 11.52 | $ | 11.58 | $ | 11.62 | ||||||||||
|
|
|
|
|
|
|
|
|
| |||||||||||
INCOME (LOSS) FROM INVESTMENT OPERATIONS: | ||||||||||||||||||||
Net investment income (loss)(a) | 0.06 | 0.03 | (0.01 | ) | 0.02 | 0.05 | ||||||||||||||
Net realized and unrealized gain (loss) | 0.34 | (0.13 | ) | (0.08 | ) | 0.00 | (b) | 0.01 | (c) | |||||||||||
|
|
|
|
|
|
|
|
|
| |||||||||||
Total from Investment Operations | 0.40 | (0.10 | ) | (0.09 | ) | 0.02 | 0.06 | |||||||||||||
|
|
|
|
|
|
|
|
|
| |||||||||||
LESS DISTRIBUTIONS FROM: | ||||||||||||||||||||
Net investment income | (0.15 | ) | (0.13 | ) | (0.10 | ) | (0.08 | ) | (0.10 | ) | ||||||||||
|
|
|
|
|
|
|
|
|
| |||||||||||
Net asset value, end of the period | $ | 11.35 | $ | 11.10 | $ | 11.33 | $ | 11.52 | $ | 11.58 | ||||||||||
|
|
|
|
|
|
|
|
|
| |||||||||||
Total return(d) | 3.64 | % | (0.91 | )% | (0.79 | )% | 0.18 | % | 0.51 | % | ||||||||||
RATIOS TO AVERAGE NET ASSETS: | ||||||||||||||||||||
Net assets, end of the period (000’s) | $ | 22,142 | $ | 23,341 | $ | 43,319 | $ | 73,027 | $ | 63,167 | ||||||||||
Net expenses | 1.55 | % | 1.55 | % | 1.55 | % | 1.52 | % | 1.53 | % | ||||||||||
Gross expenses | 1.55 | % | 1.55 | % | 1.55 | % | 1.52 | % | 1.53 | % | ||||||||||
Net investment income (loss) | 0.57 | % | 0.24 | % | (0.09 | )% | 0.21 | % | 0.47 | % | ||||||||||
Portfolio turnover rate | 527 | %(e) | 157 | % | 126 | % | 109 | %(f) | 48 | % | ||||||||||
| (a) | Per share net investment income (loss) has been calculated using the average shares outstanding during the period. |
| (b) | Amount rounds to less than $0.01 per share. |
| (c) | The amount shown for a share outstanding does not correspond with the aggregate realized and unrealized gain (loss) on investments for the period due to the timing of sales and redemptions of fund shares in relation to fluctuating market values of investments of the Fund. |
| (d) | A contingent deferred sales charge for Class C shares is not reflected in total return calculations. |
| (e) | The variation in the Fund’s turnover rate from 2018 to 2019 is due to an increase in the volume of U.S. Treasury securities related to certain trading strategies. |
| (f) | The variation in the Fund’s turnover rate from 2015 to 2016 was primarily due to fluctuation in the level of fund assets due to shareholder flows. |
See accompanying notes to financial statements.
| 52
Table of Contents
Financial Highlights (continued)
For a share outstanding throughout each period.
| Limited Term Government and Agency Fund—Class N | ||||||||||||
| Year Ended September 30, 2019 | Year Ended September 30, 2018 | Period Ended September 30, 2017* | ||||||||||
Net asset value, beginning of the period | $ | 11.12 | $ | 11.36 | $ | 11.39 | ||||||
|
|
|
|
|
| |||||||
INCOME (LOSS) FROM INVESTMENT OPERATIONS: | ||||||||||||
Net investment income(a) | 0.19 | 0.15 | 0.05 | |||||||||
Net realized and unrealized gain (loss) | 0.33 | (0.14 | ) | 0.08 | (b) | |||||||
|
|
|
|
|
| |||||||
Total from Investment Operations | 0.52 | 0.01 | 0.13 | |||||||||
|
|
|
|
|
| |||||||
LESS DISTRIBUTIONS FROM: | ||||||||||||
Net investment income | (0.27 | ) | (0.25 | ) | (0.16 | ) | ||||||
|
|
|
|
|
| |||||||
Net asset value, end of the period | $ | 11.37 | $ | 11.12 | $ | 11.36 | ||||||
|
|
|
|
|
| |||||||
Total return(c) | 4.77 | % | 0.09 | % | 1.12 | %(d) | ||||||
RATIOS TO AVERAGE NET ASSETS: | ||||||||||||
Net assets, end of the period (000’s) | $ | 5,272 | $ | 3,176 | $ | 1,900 | ||||||
Net expenses(e) | 0.46 | % | 0.46 | % | 0.47 | %(f) | ||||||
Gross expenses | 0.48 | % | 0.48 | % | 0.50 | %(f) | ||||||
Net investment income | 1.65 | % | 1.37 | % | 0.64 | %(f) | ||||||
Portfolio turnover rate | 527 | %(g) | 157 | % | 126 | %(h) | ||||||
| * | From commencement of Class operations on February 1, 2017 through September 30, 2017. |
| (a) | Per share net investment income has been calculated using the average shares outstanding during the period. |
| (b) | The amount shown for a share outstanding does not correspond with the aggregate realized and unrealized gain (loss) on investments for the period due to the timing of sales and redemptions of fund shares in relation to fluctuating market values of investments of the Fund. |
| (c) | Had certain expenses not been waived/reimbursed during the period, total returns would have been lower. |
| (d) | Periods less than one year are not annualized. |
| (e) | The investment adviser agreed to waive its fees and/or reimburse a portion of the Fund’s expenses during the period. Without this waiver/reimbursement, expenses would have been higher. |
| (f) | Computed on an annualized basis for periods less than one year. |
| (g) | The variation in the Fund’s turnover rate from 2018 to 2019 is due to an increase in the volume of U.S. Treasury securities related to certain trading strategies. |
| (h) | Represents the Fund’s portfolio turnover rate for the year ended September 30, 2017. |
See accompanying notes to financial statements.
53 |
Table of Contents
Financial Highlights (continued)
For a share outstanding throughout each period.
| Limited Term Government and Agency Fund—Class Y | ||||||||||||||||||||
| Year Ended September 30, 2019 | Year Ended September 30, 2018 | Year Ended September 30, 2017 | Year Ended September 30, 2016 | Year Ended September 30, 2015 | ||||||||||||||||
Net asset value, beginning of the period | $ | 11.13 | $ | 11.36 | $ | 11.55 | $ | 11.61 | $ | 11.65 | ||||||||||
|
|
|
|
|
|
|
|
|
| |||||||||||
INCOME (LOSS) FROM INVESTMENT OPERATIONS: | ||||||||||||||||||||
Net investment income(a) | 0.17 | 0.14 | 0.11 | 0.14 | 0.17 | |||||||||||||||
Net realized and unrealized gain (loss) | 0.34 | (0.13 | ) | (0.09 | ) | 0.00 | (b) | 0.01 | (c) | |||||||||||
|
|
|
|
|
|
|
|
|
| |||||||||||
Total from Investment Operations | 0.51 | 0.01 | 0.02 | 0.14 | 0.18 | |||||||||||||||
|
|
|
|
|
|
|
|
|
| |||||||||||
LESS DISTRIBUTIONS FROM: | ||||||||||||||||||||
Net investment income | (0.26 | ) | (0.24 | ) | (0.21 | ) | (0.20 | ) | (0.22 | ) | ||||||||||
|
|
|
|
|
|
|
|
|
| |||||||||||
Net asset value, end of the period | $ | 11.38 | $ | 11.13 | $ | 11.36 | $ | 11.55 | $ | 11.61 | ||||||||||
|
|
|
|
|
|
|
|
|
| |||||||||||
Total return | 4.67 | % | 0.09 | % | 0.22 | % | 1.19 | % | 1.51 | % | ||||||||||
RATIOS TO AVERAGE NET ASSETS: | ||||||||||||||||||||
Net assets, end of the period (000’s) | $ | 457,248 | $ | 366,847 | $ | 360,322 | $ | 411,898 | $ | 431,727 | ||||||||||
Net expenses | 0.55 | % | 0.55 | % | 0.55 | % | 0.52 | % | 0.52 | % | ||||||||||
Gross expenses | 0.55 | % | 0.55 | % | 0.55 | % | 0.52 | % | 0.52 | % | ||||||||||
Net investment income | 1.55 | % | 1.26 | % | 0.92 | % | 1.20 | % | 1.45 | % | ||||||||||
Portfolio turnover rate | 527 | %(d) | 157 | % | 126 | % | 109 | %(e) | 48 | % | ||||||||||
| (a) | Per share net investment income has been calculated using the average shares outstanding during the period. |
| (b) | Amount rounds to less than $0.01 per share. |
| (c) | The amount shown for a share outstanding does not correspond with the aggregate realized and unrealized gain (loss) on investments for the period due to the timing of sales and redemptions of fund shares in relation to fluctuating market values of investments of the Fund. |
| (d) | The variation in the Fund’s turnover rate from 2018 to 2019 is due to an increase in the volume of U.S. Treasury securities related to certain trading strategies. |
| (e) | The variation in the Fund’s turnover rate from 2015 to 2016 was primarily due to fluctuation in the level of fund assets due to shareholder flows. |
See accompanying notes to financial statements.
| 54
Table of Contents
September 30, 2019
1. Organization. Loomis Sayles Funds I and Loomis Sayles Funds II (the “Trusts” and each a “Trust”) are each organized as a Massachusetts business trust. Each Trust is registered under the Investment Company Act of 1940, as amended (the “1940 Act”), as anopen-end management investment company. Each Declaration of Trust permits the Board of Trustees to authorize the issuance of an unlimited number of shares of the Trust in multiple series. The financial statements for certain funds of the Trusts are presented in separate reports. The following funds (individually, a “Fund” and collectively, the “Funds”) are included in this report:
Loomis Sayles Funds I:
Loomis Sayles Intermediate Duration Bond Fund (the “Intermediate Duration Bond Fund”)
Loomis Sayles Funds II:
Loomis Sayles Limited Term Government and Agency Fund (the “Limited Term Government and Agency Fund”)
Each Fund is a diversified investment company.
Each Fund offers Class A, Class C, Class N (effective February 1, 2019 for Intermediate Duration Bond Fund) and Class Y shares.
Class A shares of Intermediate Duration Bond Fund are sold with a maximumfront-end sales charge of 4.25%. Class A shares of Limited Term Government and Agency Fund are sold with a maximumfront-end sales charge of 2.25%. Class C shares do not pay afront-end sales charge, pay higher Rule12b-1 fees than Class A shares for 10 years (at which point they automatically convert to Class A shares) and may be subject to a contingent deferred sales charge (“CDSC”) of 1.00% if those shares are redeemed within one year of acquisition, except for reinvested distributions. Class N and Class Y shares do not pay afront-end sales charge, a CDSC or Rule12b-1 fees. Class N shares are offered with an initial minimum investment of $1,000,000. Class Y shares are offered with an initial minimum investment of $100,000. Certain categories of investors are exempted from the minimum investment amounts for Class N and Class Y as outlined in the relevant Funds’ prospectus.
Most expenses can be directly attributed to a Fund. Expenses which cannot be directly attributed to a Fund are generally apportioned based on the relative net assets of each of the funds in Natixis Funds Trust I, Natixis Funds Trust II, Natixis Funds Trust IV and Gateway Trust (“Natixis Funds Trusts”), Loomis Sayles Funds I and Loomis Sayles Funds II (“Loomis Sayles Funds Trusts”), and Natixis ETF Trust. Expenses of a Fund are bornepro rata by the holders of each class of shares, except that each class bears expenses unique to that class (such as the Rule12b-1 fees applicable to Class A and Class C) and transfer agent fees are borne collectively for Class A, Class C and Class Y, and individually for Class N. In addition, each class votes as a class only with respect to its own Rule12b-1 Plan. Shares of each class would receive theirpro rata share of
55 |
Table of Contents
Notes to Financial Statements (continued)
September 30, 2019
the net assets of a Fund if the Fund were liquidated. The Trustees approve separate distributions from net investment income on each class of shares.
2. Significant Accounting Policies. The following is a summary of significant accounting policies consistently followed by each Fund in the preparation of its financial statements. The Funds’ financial statements follow the accounting and reporting guidelines provided for investment companies and are prepared in accordance with accounting principles generally accepted in the United States of America which require the use of management estimates that affect the reported amounts and disclosures in the financial statements. Actual results could differ from those estimates. Management has evaluated the events and transactions subsequent to year-end through the date the financial statements were issued and has determined that there were no material events that would require disclosure in the Funds’ financial statements.
a. Valuation. Fund securities and other investments are valued at market value based on market quotations obtained or determined by independent pricing services recommended by the adviser and approved by the Board of Trustees. Fund securities and other investments for which market quotations are not readily available are valued at fair value as determined in good faith by the adviser pursuant to procedures approved by the Board of Trustees, as described below. Market value is determined as follows:
Debt securities and unlisted preferred equity securities are valued based on evaluated bids furnished to the Funds by an independent pricing service or bid prices obtained from broker-dealers. Listed equity securities (including shares ofclosed-end investment companies and exchange-traded funds) are valued at the last sale price quoted on the exchange where they are traded most extensively or, if there is no reported sale during the day, the closing bid quotation as reported by an independent pricing service. Securities traded on the NASDAQ Global Select Market, NASDAQ Global Market and NASDAQ Capital Market are valued at the NASDAQ Official Closing Price (“NOCP”), or if lacking an NOCP, at the most recent bid quotations on the applicable NASDAQ Market. Unlisted equity securities (except unlisted preferred equity securities) are valued at the last sale price quoted in the market where they are traded most extensively or, if there is no reported sale during the day, the closing bid quotation as reported by an independent pricing service. If there is no last sale price or closing bid quotation available, unlisted equity securities will be valued using evaluated bids furnished by an independent pricing service, if available. In some foreign markets, an official close price and a last sale price may be available from the foreign exchange or market. In those cases, the official close price is used. Broker-dealer bid prices may be used to value debt and unlisted equity securities where an independent pricing service is unable to price a security or where an independent pricing service does not provide a reliable price for the security. Futures contracts are valued at the most recent settlement price on the exchange on which the adviser believes that, over time, they are traded most extensively.
| 56
Table of Contents
Notes to Financial Statements (continued)
September 30, 2019
Fund securities and other investments for which market quotations are not readily available are valued at fair value as determined in good faith by the adviser pursuant to procedures approved by the Board of Trustees. The Funds may also value securities and other investments at fair value in other circumstances such as when extraordinary events occur after the close of a foreign market but prior to the close of the New York Stock Exchange. This may include situations relating to a single issuer (such as a declaration of bankruptcy or a delisting of the issuer’s security from the primary market on which it has traded) as well as events affecting the securities markets in general (such as market disruptions or closings and significant fluctuations in U.S. and/or foreign markets). When fair valuing its securities or other investments, the Funds may, among other things, use modeling tools or other processes that may take into account factors such as securities or other market activity and/or significant events that occur after the close of the foreign market and before the time the Fund’s net asset value (“NAV”) is calculated. Fair value pricing may require subjective determinations about the value of a security, and fair values used to determine a Fund’s NAV may differ from quoted or published prices, or from prices that are used by others, for the same securities. In addition, the use of fair value pricing may not always result in adjustments to the prices of securities held by a Fund.
Illiquid securities for which market quotations are readily available and have been evaluated by the adviser are considered and classified as fair valued securities pursuant to the Funds’ pricing policies and procedures.
As of September 30, 2019, securities held by the Funds were fair valued as follows:
Fund | Securities fair | Percentage of | ||||||
Intermediate Duration Bond Fund | $ | 676,609 | 0.3 | % | ||||
Limited Term Government and Agency Fund | 1,744,293 | 0.2 | % | |||||
b. Investment Transactions and Related Investment Income. Investment transactions are accounted for on a trade date plus one day basis for daily NAV calculation. However, for financial reporting purposes, investment transactions are reported on trade date. Dividend income (including income reinvested) and foreign withholding tax, if applicable, is recorded on theex-dividend date, or in the case of certain foreign securities, as soon as a Fund is notified, and interest income is recorded on an accrual basis. Interest income is increased by the accretion of discount and decreased by the amortization of premium, if applicable. Periodic principal adjustments for inflation-protected securities are recorded to interest income. Negative principal adjustments (in the event of deflation) are recorded as reductions of interest income to the extent of interest income earned, not to exceed the amount of positive principal adjustments on a cumulative basis. In determining net gain or loss on securities sold, the cost of securities has been determined on an identified cost basis. Investment income,
57 |
Table of Contents
Notes to Financial Statements (continued)
September 30, 2019
non-class specific expenses and realized and unrealized gains and losses are allocated on apro rata basis to each class based on the relative net assets of each class to the total net assets of the Fund.
c. Foreign Currency Translation. The books and records of the Funds are maintained in U.S. dollars. The values of securities, currencies and other assets and liabilities denominated in currencies other than U.S. dollars, if any, are translated into U.S. dollars based upon foreign exchange rates prevailing at the end of the period. Purchases and sales of investment securities, income and expenses are translated into U.S. dollars on the respective dates of such transactions.
Net realized foreign exchange gains or losses arise from sales of foreign currency, changes in exchange rates between the trade and settlement dates on securities transactions and the difference between the amounts of dividends, interest and foreign withholding taxes recorded on the Funds’ books and the U.S. dollar equivalent of the amounts actually received or paid. Net unrealized foreign exchange gains or losses arise from changes in the value of assets and liabilities, other than investment securities, as of the end of the fiscal period, resulting from changes in exchange rates.
The values of investment securities are presented at the foreign exchange rates prevailing at the end of the period for financial reporting purposes. Net realized and unrealized gains or losses on investments reported in the Statements of Operations reflect gains or losses resulting from changes in exchange rates and fluctuations which arise due to changes in market prices of investment securities.
The Funds may use foreign currency exchange contracts to facilitate transactions in foreign-denominated investments. Losses may arise from changes in the value of the foreign currency or if the counterparties do not perform under the contracts’ terms.
d. Futures Contracts. The Funds may enter into futures contracts. Futures contracts are agreements between two parties to buy and sell a particular instrument or index for a specified price on a specified future date.
When a Fund enters into a futures contract, it is required to deposit with (or for the benefit of) its broker an amount of cash or short-term high-quality securities as “initial margin.” As the value of the contract changes, the value of the futures contract position increases or declines. Subsequent payments, known as “variation margin,” are made or received by a Fund, depending on the price fluctuations in the fair value of the contract and the value of cash or securities on deposit with the broker. The aggregate principal amounts of the contracts are not recorded in the financial statements. Daily fluctuations in the value of the contracts are recorded in the Statements of Assets and Liabilities as a receivable (payable) and in the Statements of Operations as unrealized appreciation (depreciation) until the contracts are closed, when they are recorded as realized gains (losses). Realized gain or loss on a futures position is equal to the difference between the value of the contract at the time it was
| 58
Table of Contents
Notes to Financial Statements (continued)
September 30, 2019
opened and the value at the time it was closed, minus brokerage commissions. When a Fund enters into a futures contract certain risks may arise, such as illiquidity in the futures market, which may limit a Fund’s ability to close out a futures contract prior to settlement date, and unanticipated movements in the value of securities or interest rates.
Futures contracts are exchange-traded. Exchange-traded futures contracts are standardized and are settled through a clearing house with fulfillment supported by the credit of the exchange. Therefore, counterparty credit risks to the Funds are reduced; however, in the event that a counterparty enters into bankruptcy, a Fund’s claim against initial/variation margin on deposit with the counterparty may be subject to terms of a final settlement in bankruptcy court.
e. When-Issued and Delayed Delivery Transactions. The Funds may enter into when-issued or delayed delivery transactions. When-issued refers to transactions made conditionally because a security, although authorized, has not been issued. Delayed delivery refers to transactions for which delivery or payment will occur at a later date, beyond the normal settlement period. The price of when-issued and delayed delivery securities and the date when the securities will be delivered and paid for are fixed at the time the transaction is negotiated. The security and the obligation to pay for it are recorded by the Funds at the time the commitment is entered into. The value of the security may vary with market fluctuations during the time before the Funds take delivery of the security. No interest accrues to the Funds until the transaction settles.
Delayed delivery transactions include those designated as To Be Announced (“TBAs”) in the Portfolios of Investments. For TBAs, the actual security that will be delivered to fulfill the transaction is not designated at the time of the trade. The security is “to be announced” 48 hours prior to the established trade settlement date. Certain transactions require the Funds or counterparty to post cash and/or securities as collateral for the netmark-to-market exposure to the other party. The Funds cover their net obligations under outstanding delayed delivery commitments by segregating or earmarking cash or securities at the custodian.
Purchases of when-issued or delayed delivery securities may have a similar effect on the Funds’ NAV as if the Funds’ had created a degree of leverage in the portfolio. Risks may arise upon entering into such transactions from the potential inability of counterparties to meet their obligations under the transactions. Additionally, losses may arise due to changes in the value of the underlying securities.
There were no when-issued or delayed delivery securities held by the Funds as of September 30, 2019.
f. Federal and Foreign Income Taxes. The Trusts treat each Fund as a separate entity for federal income tax purposes. Each Fund intends to meet the requirements of the Internal Revenue Code of 1986, as amended, applicable to regulated investment companies, and to distribute to its shareholders substantially all of its net investment
59 |
Table of Contents
Notes to Financial Statements (continued)
September 30, 2019
income and any net realized capital gains at least annually. Management has performed an analysis of each Fund’s tax positions for the open tax years as of September 30, 2019 and has concluded that no provisions for income tax are required. The Funds’ federal tax returns for the prior three fiscal years remain subject to examination by the Internal Revenue Service. Management is not aware of any events that are reasonably possible to occur in the next twelve months that would result in the amounts of any unrecognized tax benefits significantly increasing or decreasing for the Funds. However, management’s conclusions regarding tax positions taken may be subject to review and adjustment at a later date based on factors including, but not limited to, new tax laws and accounting regulations and interpretations thereof.
A Fund may be subject to foreign withholding taxes on investment income and taxes on capital gains on investments that are accrued and paid based upon the Fund’s understanding of the tax rules and regulations that exist in the countries in which the Fund invests. Foreign withholding taxes on dividend and interest income are reflected on the Statements of Operations as a reduction of investment income, net of amounts eligible to be reclaimed. Dividends and interest receivable on the Statements of Assets and Liabilities are net of foreign withholding taxes. Foreign withholding taxes where reclaims have been or will be filed are reflected on the Statements of Assets and Liabilities as tax reclaims receivable. Capital gains taxes paid are included in net realized gain (loss) on investments in the Statements of Operations. Accrued but unpaid capital gains taxes are reflected as foreign taxes payable on the Statements of Assets and Liabilities, if applicable, and reduce unrealized gains on investments. In the event that realized gains on investments are subsequently offset by realized losses, taxes paid on realized gains may be returned to a Fund. Such amounts, if applicable, are reflected as foreign tax rebates receivable on the Statements of Assets and Liabilities and are recorded as a realized gain when received.
g. Dividends and Distributions to Shareholders. Dividends and distributions are recorded on theex-dividend date. The timing and characterization of certain income and capital gain distributions are determined in accordance with federal tax regulations, which may differ from accounting principles generally accepted in the United States of America. Permanent differences are primarily due to differing treatments for book and tax purposes of items such as deferred Trustees’ fees, premium amortization and paydown gains and losses. Permanent book and tax basis differences relating to shareholder distributions will result in reclassifications to capital accounts. Temporary differences between book and tax distributable earnings are primarily due to deferred Trustees’ fees, wash sales, premium amortization and futures contractmark-to-market. Amounts of income and capital gain available to be distributed on a tax basis are determined annually, and at other times during the Funds’ fiscal year as may be necessary to avoid knowingly declaring and paying a return of capital distribution. Distributions from net investment income and net realized short-term capital gains are reported as distributed from ordinary income for tax purposes.
| 60
Table of Contents
Notes to Financial Statements (continued)
September 30, 2019
The tax characterization of distributions is determined on an annual basis. The tax character of distributions paid to shareholders during the years ended September 30, 2019 and 2018 were as follows:
| 2019 Distributions Paid From: | 2018 Distributions Paid From: | |||||||||||||||||||||||
Fund | Ordinary | Long-Term | Total | Ordinary | Long-Term | Total | ||||||||||||||||||
Intermediate Duration Bond Fund | $ | 5,986,529 | $ | — | $ | 5,986,529 | $ | 4,433,431 | $ | — | $ | 4,433,431 | ||||||||||||
Limited Term Government and Agency Fund | 16,591,331 | — | 16,591,331 | 14,046,088 | — | 14,046,088 | ||||||||||||||||||
Distributions paid to shareholders from net investment income and net realized capital gains, based on accounting principles generally accepted in the United States of America, are consolidated and reported on the Statements of Changes in Net Assets as Distributions to Shareholders. Distributions paid to shareholders from net investment income and net realized capital gains expressed inper-share amounts, based on accounting principles generally accepted in the United States of America, are separately stated and reported within the Financial Highlights.
As of September 30, 2019, the components of distributable earnings on a tax basis were as follows:
Intermediate | Limited Term | |||||||
Undistributed ordinary income | $ | 964,707 | $ | 482,967 | ||||
Capital loss carryforward: |
| |||||||
Short-term: |
| |||||||
No expiration date | — | (1,558,729 | ) | |||||
Long-term: |
| |||||||
No expiration date | — | (34,283,605 | ) | |||||
|
|
|
| |||||
Total capital loss carryforward | — | (35,842,334 | ) | |||||
|
|
|
| |||||
Unrealized appreciation | 3,555,117 | 7,432,213 | ||||||
|
|
|
| |||||
Total accumulated earnings (losses) | $ | 4,519,824 | $ | (27,927,154 | ) | |||
|
|
|
| |||||
Capital loss carryforward utilized in the current year | $ | 4,072,102 | $ | — | ||||
|
|
|
| |||||
61 |
Table of Contents
Notes to Financial Statements (continued)
September 30, 2019
As of September 30, 2019, the tax cost of investments (including derivatives, if applicable) and unrealized appreciation (depreciation) on a federal tax basis were as follows:
Intermediate | Limited Term | |||||||
Federal tax cost | $ | 240,280,529 | $ | 792,555,518 | ||||
|
|
|
| |||||
Gross tax appreciation | $ | 3,911,890 | $ | 11,750,318 | ||||
Gross tax depreciation | (356,773 | ) | (4,318,105 | ) | ||||
|
|
|
| |||||
Net tax appreciation | $ | 3,555,117 | $ | 7,432,213 | ||||
|
|
|
| |||||
h. Repurchase Agreements. Each Fund may enter into repurchase agreements, under the terms of a Master Repurchase Agreement, under which each Fund acquires securities as collateral and agrees to resell the securities at an agreed upon time and at an agreed upon price. It is each Fund’s policy that the market value of the collateral for repurchase agreements be at least equal to 102% of the repurchase price, including interest. Certain repurchase agreements aretri-party arrangements whereby the collateral is held in a segregated account for the benefit of the Fund and on behalf of the counterparty. Repurchase agreements could involve certain risks in the event of default or insolvency of the counterparty, including possible delays or restrictions upon a Fund’s ability to dispose of the underlying securities. As of September 30, 2019, each Fund, as applicable, had investments in repurchase agreements for which the value of the related collateral exceeded the value of the repurchase agreement. The gross value of repurchase agreements is included in the Statements of Assets and Liabilities for financial reporting purposes.
i. Due from Brokers. Transactions and positions in certain futures contracts are maintained and cleared by registered U.S. broker/dealers pursuant to customer agreements between the Funds and the various broker/dealers. The due from broker balance in the Statements of Assets and Liabilities for Intermediate Duration Bond Fund represents cash pledged as initial margin for futures contracts. In certain circumstances the Fund’s use of cash held at brokers is restricted by regulation or broker mandated limits.
j. Securities Lending. The Funds have entered into an agreement with State Street Bank and Trust Company (“State Street Bank”), as agent of the Funds, to lend securities to certain designated borrowers. The loans are collateralized with cash or securities in an amount equal to at least 105% or 102% of the market value (including accrued interest) of the loaned international or domestic securities, respectively, when the loan is initiated. Thereafter, the value of the collateral must remain at least 102% of the market value (including accrued interest) of loaned securities for U.S. equities and
| 62
Table of Contents
Notes to Financial Statements (continued)
September 30, 2019
U.S. corporate debt; at least 105% of the market value (including accrued interest) of loaned securities fornon-U.S. equities; and at least 100% of the market value (including accrued interest) of loaned securities for U.S. Government securities, sovereign debt issued bynon-U.S. Governments andnon-U.S. corporate debt. In the event that the market value of the collateral falls below the required percentages described above, the borrower will deliver additional collateral on the next business day. As with other extensions of credit, the Funds may bear the risk of loss with respect to the investment of the collateral. The Funds invest cash collateral in short-term investments, a portion of the income from which is remitted to the borrowers and the remainder allocated between the Funds and State Street Bank as lending agent.
For the year ended September 30, 2019, neither Fund had loaned securities under this agreement.
k. Indemnifications. Under the Trusts’ organizational documents, their officers and Trustees are indemnified against certain liabilities arising out of the performance of their duties to the Funds. Additionally, in the normal course of business, the Funds enter into contracts with service providers that contain general indemnification clauses. The Funds’ maximum exposure under these arrangements is unknown as this would involve future claims that may be made against the Funds that have not yet occurred. However, based on experience, the Funds expect the risk of loss to be remote.
l. New Accounting Pronouncement. In March 2017, the Financial Accounting Standards Board (FASB) issued Accounting Standards Update (ASU)No. 2017-08, Receivables—Nonrefundable Fees and Other Costs (Subtopic310-20): Premium Amortization on Purchased Callable Debt Securities. The amendments in the ASU shorten the amortization period for certain callable debt securities acquired at a premium, to be amortized to the earliest call date. The ASU is effective for fiscal years and interim periods within those fiscal years beginning after December 15, 2018. Management has evaluated the application of this provision and has determined there will be no impact on the net asset value of the Funds.
3. Fair Value Measurements. In accordance with accounting standards related to fair value measurements and disclosures, the Funds have categorized the inputs utilized in determining the value of each Fund’s assets or liabilities. These inputs are summarized in the three broad levels listed below:
| • | Level 1 – quoted prices in active markets for identical assets or liabilities; |
| • | Level 2 – prices determined using other significant inputs that are observable either directly, or indirectly through corroboration with observable market data (which could include quoted prices for similar assets or liabilities, interest rates, credit risk, etc.); and |
63 |
Table of Contents
Notes to Financial Statements (continued)
September 30, 2019
| • | Level 3 – prices determined using significant unobservable inputs when quoted prices or observable inputs are unavailable such as when there is little or no market activity for an asset or liability (unobservable inputs reflect each Fund’s own assumptions in determining the fair value of assets or liabilities and would be based on the best information available). |
The inputs or methodology used for valuing securities are not necessarily an indication of the risk associated with investing in those securities.
The Funds’ pricing policies and procedures are recommended by the adviser and approved by the Board of Trustees. Debt securities are valued based on evaluated bids furnished to the Funds by an independent pricing service. Broker-dealer bid prices may be used if an independent pricing service either is unable to price a security or does not provide a reliable price for a security. Broker-dealer bid prices for which the Funds do not have knowledge of the inputs used by the broker-dealer are categorized in Level 3. All security prices, including those obtained from an independent pricing service and broker-dealer bid prices, are reviewed on a daily basis by the adviser, subject to oversight by Fund management and the Board of Trustees. If the adviser, in good faith, believes that the price provided by an independent pricing service is unreliable, broker-dealer bid prices may be used until the price provided by the independent pricing service is considered to be reliable. Reliability of all security prices, including those obtained from an independent pricing service and broker-dealer bid prices, is tested in a variety of ways, including comparison to recent transaction prices and daily fluctuations, amongst other validation procedures in place. Securities for which market quotations are not readily available are valued at fair value as determined in good faith by the Funds’ adviser pursuant to procedures approved by the Board of Trustees. Fair valued securities may be categorized in Level 3.
The following is a summary of the inputs used to value the Funds’ investments as of September 30, 2019, at value:
Intermediate Duration Bond Fund
Asset Valuation Inputs
Description | Level 1 | Level 2 | Level 3 | Total | ||||||||||||
Bonds and Notes | ||||||||||||||||
ABS Car Loan | $ | — | $ | 21,161,136 | $ | 660,000 | (b) | $ | 21,821,136 | |||||||
ABS Home Equity | — | 935,897 | 16,609 | (b) | 952,506 | |||||||||||
All Other Bonds and Notes(a) | — | 212,270,712 | — | 212,270,712 | ||||||||||||
|
|
|
|
|
|
|
| |||||||||
Total Bonds and Notes | — | 234,367,745 | 676,609 | 235,044,354 | ||||||||||||
|
|
|
|
|
|
|
| |||||||||
Short-Term Investments | — | 8,791,292 | — | 8,791,292 | ||||||||||||
|
|
|
|
|
|
|
| |||||||||
Total | $ | — | $ | 243,159,037 | $ | 676,609 | $ | 243,835,646 | ||||||||
|
|
|
|
|
|
|
| |||||||||
| 64
Table of Contents
Notes to Financial Statements (continued)
September 30, 2019
Intermediate Duration Bond Fund (continued)
Liability Valuation Inputs
Description | Level 1 | Level 2 | Level 3 | Total | ||||||||||||
Futures Contracts (unrealized depreciation) | $ | (114,344 | ) | $ | — | $ | — | $ | (114,344) | |||||||
|
|
|
|
|
|
|
| |||||||||
| (a) | Details of the major categories of the Fund’s investments are reflected within the Portfolio of Investments. |
| (b) | Fair valued by the Fund’s adviser. |
Limited Term Government and Agency Fund
Asset Valuation Inputs
Description | Level 1 | Level 2 | Level 3 | Total | ||||||||||||
Bonds and Notes | ||||||||||||||||
Collateralized Mortgage Obligations | $ | — | $ | 95,819,350 | $ | 1,744,293 | (b) | $ | 97,563,643 | |||||||
All Other Bonds and Notes(a) | — | 556,027,636 | — | 556,027,636 | ||||||||||||
|
|
|
|
|
|
|
| |||||||||
Total Bonds and Notes | — | 651,846,986 | 1,744,293 | 653,591,279 | ||||||||||||
|
|
|
|
|
|
|
| |||||||||
Short-Term Investments | — | 146,396,452 | — | 146,396,452 | ||||||||||||
|
|
|
|
|
|
|
| |||||||||
Total | $ | — | $ | 798,243,438 | $ | 1,744,293 | $ | 799,987,731 | ||||||||
|
|
|
|
|
|
|
| |||||||||
| (a) | Details of the major categories of the Fund’s investments are reflected within the Portfolio of Investments. |
| (b) | Fair valued by the Fund’s adviser. |
The following is a reconciliation of Level 3 investments for which significant unobservable inputs were used to determine fair value as of September 30, 2018 and/or September 30, 2019:
Intermediate Duration Bond Fund
Asset Valuation Inputs
Investments in Securities | Balance as of | Accrued | Realized | Change in | Purchases | |||||||||||||||
Bonds and Notes | ||||||||||||||||||||
ABS Car Loan | $ | — | $ | — | $ | — | $ | 93 | $ | 659,907 | ||||||||||
ABS Home Equity | 14,830 | — | (14 | ) | 158 | — | ||||||||||||||
|
|
|
|
|
|
|
|
|
| |||||||||||
| $ | 14,830 | $ | — | $ | (14 | ) | $ | 251 | $ | 659,907 | ||||||||||
|
|
|
|
|
|
|
|
|
| |||||||||||
65 |
Table of Contents
Notes to Financial Statements (continued)
September 30, 2019
Intermediate Duration Bond Fund (continued)
Asset Valuation Inputs (continued)
Investments in Securities | Sales | Transfers | Transfers | Balance as of | Change in | |||||||||||||||
Bonds and Notes | ||||||||||||||||||||
ABS Car Loan | $ | — | $ | — | $ | — | $ | 660,000 | $ | 93 | ||||||||||
ABS Home Equity | (7,420 | ) | 9,055 | — | 16,609 | (42 | ) | |||||||||||||
|
|
|
|
|
|
|
|
|
| |||||||||||
| $ | (7,420 | ) | $ | 9,055 | $ | — | $ | 676,609 | $ | 51 | ||||||||||
|
|
|
|
|
|
|
|
|
| |||||||||||
A debt security valued at $9,055 was transferred from Level 2 to Level 3 during the period ended September 30, 2019. At September 30, 2018, this security was valued on the basis of evaluated bids furnished to the Fund by an independent pricing service in accordance with the Fund’s valuation policies. At September 30, 2019 this security was valued at fair value as determined in good faith by the Fund’s adviser as an independent pricing service did not provide a reliable price for the security.
All transfers are recognized as of the beginning of the reporting period.
Limited Term Government and Agency Fund
Asset Valuation Inputs
Investments in Securities | Balance as of | Accrued | Realized | Change in | Purchases | |||||||||||||||
Bonds and Notes | ||||||||||||||||||||
Collateralized Mortgage Obligations | $ | 191,318 | $ | — | $ | (45,762 | ) | $ | 31,407 | $ | 412 | |||||||||
|
|
|
|
|
|
|
|
|
| |||||||||||
| 66
Table of Contents
Notes to Financial Statements (continued)
September 30, 2019
Limited Term Government and Agency Fund (continued)
Asset Valuation Inputs (continued)
Investments in Securities | Sales | Transfers | Transfers | Balance as of | Change in | |||||||||||||||
Bonds and Notes | ||||||||||||||||||||
Collateralized Mortgage Obligations | $ | (4,978,779 | ) | $ | 6,545,697 | $ | — | $ | 1,744,293 | $ | 30,265 | |||||||||
|
|
|
|
|
|
|
|
|
| |||||||||||
Debt securities valued at $6,545,697 were transferred from Level 2 to Level 3 during the period ended September 30, 2019. At September 30, 2018, these securities were valued on the basis of evaluated bids furnished to the Fund by an independent pricing service in accordance with the Fund’s valuation policies. At September 30, 2019 these securities were valued at fair value as determined in good faith by the Fund’s adviser as an independent pricing service did not provide a reliable price for the securities.
All transfers are recognized as of the beginning of the reporting period.
4. Derivatives. Derivative instruments are defined as financial instruments whose value and performance are based on the value and performance of an underlying asset, reference rate or index. Derivative instruments that Intermediate Duration Bond Fund used during the period include futures contracts.
Intermediate Duration Bond Fund is subject to the risk that changes in interest rates will affect the value of the Fund’s investments in fixed-income securities. A Fund will be subject to increased interest rate risk to the extent that it invests in fixed-income securities with longer maturities or durations, as compared to investing in fixed-income securities with shorter maturities or durations. The Fund may use futures contracts to hedge against changes in interest rates and to manage its duration in order to control interest rate risk without having to buy or sell portfolio securities. During the year ended September 30, 2019, Intermediate Duration Bond Fund used futures contracts for hedging purposes and to manage duration.
67 |
Table of Contents
Notes to Financial Statements (continued)
September 30, 2019
The following is a summary of derivative instruments for Intermediate Duration Bond Fund as of September 30, 2019, as reflected within the Statements of Assets and Liabilities:
Liabilities | Unrealized | |||
Exchange-traded liability derivatives | $ | (114,344 | ) | |
Transactions in derivative instruments for Intermediate Duration Bond Fund during the year ended September 30, 2019, as reflected within the Statements of Operations, were as follows:
Net Realized Gain (Loss) on: | Futures | |||
Interest rate contracts | $ | 1,026,542 | ||
Net Change in Unrealized | Futures | |||
Interest rate contracts | $ | 10,368 | ||
As the Fund values its derivatives at fair value and recognizes changes in fair value through the Statement of Operations, it does not qualify for hedge accounting under authoritative guidance for derivative instruments. The Fund’s investments in derivatives may represent an economic hedge; however, they are considered to benon-hedge transactions for the purpose of these disclosures.
The volume of futures contract activity, as a percentage of net assets, based on grossmonth-end notional amounts outstanding during the period, including long and short positions at absolute value, was as follows for the year ended September 30, 2019:
Intermediate Duration Bond Fund | Futures | |||
Average Notional Amount Outstanding | 9.44 | % | ||
Highest Notional Amount Outstanding | 9.98 | % | ||
Lowest Notional Amount Outstanding | 8.60 | % | ||
Notional Amount Outstanding as of September 30, 2019 | 8.60 | % | ||
Notional amounts outstanding at the end of the prior period are included in the average notional amount outstanding.
Unrealized gain and/or loss on open futures is recorded in the Statements of Assets and Liabilities. The aggregate notional values of futures contracts are not recorded in the Statements of Assets and Liabilities, and therefore are not included in the Funds’ net assets.
| 68
Table of Contents
Notes to Financial Statements (continued)
September 30, 2019
Counterparty risk is managed based on policies and procedures established by each Fund’s adviser. Such policies and procedures may include, but are not limited to, minimum counterparty credit rating requirements, monitoring of counterparty credit default swap spreads and posting of collateral. With exchange-traded derivatives, there is minimal counterparty credit risk to the Fund because the exchange’s clearing house, as counterparty to these instruments, stands between the buyer and the seller of the contract. Credit risk still exists in exchange-traded derivatives with respect to initial and variation margin that is held in a broker’s customer accounts. While brokers are required to segregate customer margin from their own assets, in the event that a broker becomes insolvent or goes into bankruptcy and at that time there is a shortfall in the aggregate amount of margin held by the broker for all its clients, U.S. bankruptcy laws will typically allocate that shortfall on a pro rata basis across all of the broker’s customers, potentially resulting in losses to the Fund. Based on balances reflected on each Fund’s Statement of Assets and Liabilities, the following table shows the maximum amount of loss due to credit risk that, based on the gross fair value of the financial instrument, the Fund would incur if parties (including brokers holding margin for exchange-traded derivatives) to the relevant financial instruments failed completely to perform according to the terms of the contracts and the collateral or other security, if any, for the amount due proved to be of no value to the Fund:
Fund | Maximum Amount | Maximum Amount | ||||||
Intermediate Duration Bond Fund | $ | 145,000 | $ | 145,000 | ||||
5. Purchases and Sales of Securities. For the year ended September 30, 2019, purchases and sales of securities (excluding short-term investments and including paydowns) were as follows:
| U.S. Government/ Agency Securities | Other Securities | |||||||||||||||
Fund | Purchases | Sales | Purchases | Sales | ||||||||||||
Intermediate Duration Bond Fund | $ | 138,728,969 | $ | 96,952,028 | $ | 208,219,179 | $ | 188,147,571 | ||||||||
Limited Term Government and Agency Fund | 3,258,496,912 | 3,232,110,895 | 51,087,446 | 107,389,062 | ||||||||||||
6. Management Fees and Other Transactions with Affiliates.
a. Management Fees. Loomis, Sayles & Company, L.P. (“Loomis Sayles”) serves as investment adviser to each Fund. Loomis Sayles is a limited partnership whose sole general partner, Loomis, Sayles & Company, Inc., is indirectly owned by Natixis Investment Managers, L.P. (“Natixis”), which is part of Natixis Investment Managers, an international asset management group based in Paris, France.
69 |
Table of Contents
Notes to Financial Statements (continued)
September 30, 2019
Under the terms of the management agreements, each Fund pays a management fee at the following annual rates, calculated daily and payable monthly, based on each Fund’s average daily net assets:
| Percentage of Average Daily Net Assets | ||||||||||||
Fund | First $500 million | Next $1.5 billion | Over $2 billion | |||||||||
Intermediate Duration Bond Fund | 0.2500 | % | 0.2500 | % | 0.2500 | % | ||||||
Limited Term Government and Agency Fund | 0.3750 | % | 0.3500 | % | 0.3000 | % | ||||||
Loomis Sayles has given binding undertakings to the Funds to waive management fees and/or reimburse certain expenses to limit the Funds’ operating expenses, exclusive of acquired fund fees and expenses, brokerage expenses, interest expense, taxes, organizational and extraordinary expenses such as litigation and indemnification expenses. These undertakings are in effect until January 31, 2020, may be terminated before then only with the consent of the Funds’ Board of Trustees, and are reevaluated on an annual basis. Management fees payable, as reflected on the Statements of Assets and Liabilities, is net of waivers and/or expense reimbursements, if any, pursuant to these undertakings. Waivers/reimbursements that exceed management fees payable are reflected on the Statements of Assets and Liabilities as receivable from investment adviser.
For the year ended September 30, 2019 the expense limits as a percentage of average daily net assets under the expense limitation agreements were as follows:
| Expense Limit as a Percentage of Average Daily Net Assets | ||||||||||||||||
Fund | Class A | Class C | Class N | Class Y | ||||||||||||
Intermediate Duration Bond Fund | 0.65 | % | 1.40 | % | 0.35 | % | 0.40 | % | ||||||||
Limited Term Government and Agency Fund | 0.80 | % | 1.55 | % | 0.50 | % | 0.55 | % | ||||||||
Loomis Sayles shall be permitted to recover expenses borne under the expense limitation agreements (whether through waiver of management fees or otherwise) on a class by class basis in later periods to the extent the annual operating expenses of a class fall below a class’ expense limits, provided, however, that a class is not obligated to pay such waived/reimbursed fees or expenses more than one year after the end of the fiscal year in which the fees or expenses were waived/reimbursed.
| 70
Table of Contents
Notes to Financial Statements (continued)
September 30, 2019
For the year ended September 30, 2019, the management fees and waivers of management fees for each Fund were as follows:
Fund | Gross | Contractual | Net | Percentage of | ||||||||||||||||
Gross | Net | |||||||||||||||||||
Intermediate Duration Bond Fund | $ | 541,556 | $ | 162,505 | $ | 379,051 | 0.25 | % | 0.17 | % | ||||||||||
Limited Term Government and Agency Fund | 2,760,971 | — | 2,760,971 | 0.37 | % | 0.37 | % | |||||||||||||
For the year ended September 30, 2019, class-specific expenses have been reimbursed as follows:
| Reimbursement1 | ||||||||||||||||||||
Fund | Class A | Class C | Class N | Class Y | Total | |||||||||||||||
Limited Term Government and Agency Fund | $ | 7,977 | $ | 703 | $ | — | $ | 4,646 | $ | 13,326 | ||||||||||
| 1 | Waiver/expense reimbursements are subject to possible recovery until September 30, 2020. |
No expenses were recovered for either Fund during the year ended September 30, 2019 under the terms of the expense limitation agreements.
b. Service and Distribution Fees. Natixis Distribution, L.P. (“Natixis Distribution), which is a wholly-owned subsidiary of Natixis, has entered into a distribution agreement with the Trusts. Pursuant to this agreement, Natixis Distribution serves as principal underwriter of the Funds of the Trusts.
Pursuant to Rule12b-1 under the 1940 Act, the Trusts have adopted a Service Plan relating to each Fund’s Class A shares (the “Class A Plans”) and a Distribution and Service Plan relating to each Fund’s Class C shares (the “Class C Plans”).
Under the Class A Plans, each Fund pays Natixis Distribution a monthly service fee at an annual rate not to exceed 0.25% of the average daily net assets attributable to the Fund’s Class A shares, as reimbursement for expenses incurred by Natixis Distribution in providing personal services to investors in Class A shares and/or the maintenance of shareholder accounts.
Under the Class C Plans, each Fund pays Natixis Distribution a monthly service fee at an annual rate not to exceed 0.25% of the average daily net assets attributable to the Fund’s Class C shares, as compensation for services provided by Natixis Distribution in providing personal services to investors in Class C shares and/or the maintenance of shareholder accounts.
71 |
Table of Contents
Notes to Financial Statements (continued)
September 30, 2019
Also under the Class C Plans, each Fund pays Natixis Distribution a monthly distribution fee at the annual rate of 0.75% of the average daily net assets attributable to the Fund’s Class C shares, as compensation for services provided by Natixis Distribution in connection with the marketing or sale of Class C shares.
For the year ended September 30, 2019, the service and distribution fees for each Fund were as follows:
| Service Fees | Distribution Fees | |||||||||||
Fund | Class A | Class C | Class C | |||||||||
Intermediate Duration Bond Fund | $ | 48,636 | $ | 670 | $ | 2,010 | ||||||
Limited Term Government and Agency Fund | 819,219 | 61,802 | 185,404 | |||||||||
c. Administrative Fees. Natixis Advisors, L.P. (“Natixis Advisors”) provides certain administrative services for the Funds and contracts with State Street Bank to serve as sub-administrator. Natixis Advisors is a wholly-owned subsidiary of Natixis. Pursuant to an agreement among Natixis Funds Trusts, Loomis Sayles Funds Trusts, Natixis ETF Trust and Natixis Advisors, effective July 1, 2019, each Fund pays Natixis Advisors monthly itspro rata portion of fees equal to an annual rate of 0.0540% of the first $15 billion of the average daily net assets of the Natixis Funds Trusts, Loomis Sayles Funds Trusts and Natixis ETF Trust, 0.0500% of the next $15 billion, 0.0400% of the next $30 billion, 0.0275% of the next $30 billion and 0.0225% of such assets in excess of $90 billion, subject to an annual aggregate minimum fee for the Natixis Funds Trusts, Loomis Sayles Funds Trusts and Natixis ETF Trust of $10 million, which is reevaluated on an annual basis.
Prior to July 1, 2019, each Fund paid Natixis Advisors monthly itspro rataportion of fees equal to an annual rate of 0.0575% of the first $15 billion of the average daily net assets of the Natixis Funds Trusts, Loomis Sayles Funds Trusts and Natixis ETF Trust, 0.0500% of the next $15 billion, 0.0400% of the next $30 billion, 0.0275% of the next $30 billion and 0.0225% of such assets in excess of $90 billion, subject to an annual aggregate minimum fee for the Natixis Funds Trusts, Loomis Sayles Funds Trusts and Natixis ETF Trust of $10 million.
Effective October 1, 2018, State Street Bank agreed to reduce the fees it receives from Natixis Advisors for serving assub-administrator to the Funds. Also, effective October 1, 2018, Natixis Advisors agreed to voluntarily waive fees paid by the Funds in an amount equal to the reduction insub-administrative fees discussed above. The waiver was in effect through June 30, 2019.
| 72
Table of Contents
Notes to Financial Statements (continued)
September 30, 2019
For the year ended September 30, 2019, the administrative fees for each Fund were as follows:
Fund | Gross | Waiver of | Net | |||||||||
Intermediate Duration Bond Fund | $ | 95,382 | $ | 1,628 | $ | 93,754 | ||||||
Limited Term Government and Agency Fund | 330,827 | 5,765 | 325,062 | |||||||||
d. Sub-Transfer Agent Fees. Natixis Distribution has entered into agreements, which include servicing agreements, with financial intermediaries that provide recordkeeping, processing, shareholder communications and other services to customers of the intermediaries that hold positions in the Funds and has agreed to compensate the intermediaries for providing those services. Intermediaries transact with the Funds primarily through the use of omnibus accounts on behalf of their customers who hold positions in the Funds. These services would have been provided by the Funds’ transfer agent and other service providers if the shareholders’ accounts were maintained directly at the Funds’ transfer agent. Accordingly, the Funds have agreed to reimburse Natixis Distribution for all or a portion of the servicing fees paid to these intermediaries. The reimbursement amounts(sub-transfer agent fees) paid to Natixis Distribution are subject to a currentper-account equivalent fee limit approved by the Funds’ Board of Trustees, which is based on fees for similar services paid to the Funds’ transfer agent and other service providers. Class N shares do not bear such expenses.
For the year ended September 30, 2019, thesub-transfer agent fees (which are reflected in transfer agent fees and expenses in the Statements of Operations) for each Fund were as follows:
Fund | Sub-Transfer | |||
Intermediate Duration Bond Fund | $ | 162,463 | ||
Limited Term Government and Agency Fund | 381,461 | |||
As of September 30, 2019, the Funds owe Natixis Distribution the following reimbursements forsub-transfer agent fees (which are reflected in the Statements of Assets and Liabilities as payable to distributor):
Fund | Reimbursements | |||
Intermediate Duration Bond Fund | $ | 2,185 | ||
Limited Term Government and Agency Fund | 11,549 | |||
73 |
Table of Contents
Notes to Financial Statements (continued)
September 30, 2019
Sub-transfer agent fees attributable to Class A, Class C and Class Y are allocated on apro rata basis to each class based on the relative net assets of each class to the total net assets of those classes.
e. Commissions. Commissions (including CDSCs) on Fund shares retained by Natixis Distribution during the year ended September 30, 2019 were as follows:
Fund | Commissions | |||
Intermediate Duration Bond Fund | $ | 608 | ||
Limited Term Government and Agency Fund | 10,887 | |||
f. Trustees Fees and Expenses. The Trusts do not pay any compensation directly to their officers or Trustees who are directors, officers or employees of Natixis Advisors, Natixis Distribution, Natixis or their affiliates. The Chairperson of the Board of Trustees receives a retainer fee at the annual rate of $360,000. The Chairperson does not receive any meeting attendance fees for Board of Trustees meetings or committee meetings that he attends. Each Independent Trustee (other than the Chairperson) receives, in the aggregate, a retainer fee at the annual rate of $190,000. Each Independent Trustee also receives a meeting attendance fee of $10,000 for each meeting of the Board of Trustees that he or she attends in person and $5,000 for each meeting of the Board of Trustees that he or she attends telephonically. In addition, the chairperson of the Contract Review Committee and the chairperson of the Audit Committee each receive an additional retainer fee at the annual rate of $20,000. The chairperson of the Governance Committee receives an additional retainer fee at the annual rate of $15,000. Each Contract Review Committee member is compensated $6,000 for each Committee meeting that he or she attends in person and $3,000 for each meeting that he or she attends telephonically. Each Audit Committee member is compensated $6,000 for each Committee meeting that he or she attends in person and $3,000 for each meeting that he or she attends telephonically. These fees are allocated among the funds in the Natixis Funds Trusts, Loomis Sayles Funds Trusts and Natixis ETF Trust based on a formula that takes into account, among other factors, the relative net assets of each fund. Trustees are reimbursed for travel expenses in connection with attendance at meetings.
Prior to January 1, 2019, the Chairperson of the Board received a retainer fee at the annual rate of $340,000 and each Independent Trustee (other than the Chairperson) received, in the aggregate, a retainer fee at the annual rate of $170,000, and the chairperson of the Governance Committee received an additional retainer fee at the annual rate of $12,000. All other Trustee fees remained unchanged.
A deferred compensation plan (the “Plan”) is available to the Trustees on a voluntary basis. Deferred amounts remain in the Funds until distributed in accordance with the provisions of the Plan. The value of a participating Trustee’s deferral account is based on theoretical investments of deferred amounts, on the normal payment dates, in certain funds of the Natixis Funds Trusts, Loomis Sayles Funds Trusts and Natixis ETF Trust as designated by the participating Trustees. Changes in the value of participants’
| 74
Table of Contents
Notes to Financial Statements (continued)
September 30, 2019
deferral accounts are allocatedpro rata among the funds in the Natixis Funds Trusts, Loomis Sayles Funds Trusts and Natixis ETF Trust, and are normally reflected as Trustees’ fees and expenses in the Statements of Operations. The portions of the accrued obligations allocated to the Funds under the Plan are reflected as Deferred Trustees’ fees in the Statements of Assets and Liabilities.
Certain officers and employees of Natixis Advisors and Loomis Sayles are also officers and/or Trustees of the Trusts.
g. Affiliated Ownership. As of September 30, 2019, the percentage of each Fund’s net assets owned by affiliates is as follows:
Intermediate Duration Bond Fund | Percentage of | |||
Loomis Sayles Employees’ Profit Sharing Retirement Plan | 0.96 | % | ||
Limited Term Government and Agency Fund | Percentage of | |||
Loomis Sayles Employees’ Profit Sharing Retirement Plan | 0.19 | % | ||
Loomis Sayles Distribution | 0.19 | % | ||
Natixis Sustainable Future 2015 Fund | 0.07 | % | ||
Natixis Sustainable Future 2020 Fund | 0.06 | % | ||
Natixis Sustainable Future 2025 Fund | 0.04 | % | ||
Natixis Sustainable Future 2030 Fund | 0.03 | % | ||
Natixis Sustainable Future 2035 Fund | 0.02 | % | ||
Natixis Sustainable Future 2040 Fund | 0.01 | % | ||
Natixis Sustainable Future 2045 Fund | 0.01 | % | ||
Investment activities of affiliated shareholders could have material impacts on the Funds.
h. Reimbursement of Transfer Agent Fees and Expenses. Natixis Advisors has given a binding contractual undertaking to the Funds to reimburse any and all transfer agency expenses for the Funds’ Class N shares. This undertaking is in effect through January 31, 2020 and is not subject to recovery under the expense limitation agreement described above.
For the year ended September 30, 2019 (for the period from February 1, 2019, commencement of Class N operations, through September 30, 2019 for Intermediate Duration Bond Fund), Natixis Advisors reimbursed the Funds for transfer agency expenses as follows:
| Reimbursement of Transfer Agency Expenses | ||||
Fund | Class N | |||
Intermediate Duration Bond Fund | $ | 101 | ||
Limited Term Government and Agency Fund | 926 | |||
75 |
Table of Contents
Notes to Financial Statements (continued)
September 30, 2019
7. Class-Specific Transfer Agent Fees and Expenses. Transfer agent fees and expenses attributable to Class A, Class C, and Class Y are allocated on apro rata basis to each class based on the relative net assets of each class to the total net assets of those classes. Transfer agent fees and expenses attributable to Class N are allocated to Class N.
For the year ended September 30, 2019 (for the period from February 1, 2019, commencement of operations, through September 30, 2019 for Intermediate Duration Bond Fund Class N), the Funds incurred the following class-specific transfer agent fees and expenses (includingsub-transfer agent fees, where applicable):
| Transfer Agent Fees and Expenses | ||||||||||||||||
Fund | Class A | Class C | Class N | Class Y | ||||||||||||
Intermediate Duration Bond Fund | $ | 14,998 | $ | 231 | $ | 101 | $ | 154,073 | ||||||||
Limited Term Government and Agency Fund | 304,712 | 22,989 | 926 | 367,015 | ||||||||||||
8. Line of Credit. Each Fund, together with certain other funds of Natixis Funds Trusts, Loomis Sayles Funds Trusts and Natixis ETF Trust, entered into a $400,000,000 committed unsecured line of credit provided by State Street Bank. Any one Fund may borrow up to $350,000,000 under the line of credit agreement (as long as all borrowings by all Funds in the aggregate do not exceed the $400,000,000 limit at any time), subject to each Fund’s investment restrictions and its contractual obligations under the line of credit. Interest is charged to the Funds based upon the terms set forth in the agreement. In addition, a commitment fee of 0.15% per annum, payable at the end of each calendar quarter, is accrued and apportioned among the participating funds based on their average daily unused portion of the line of credit. The Funds paid an arrangement fee, an upfront fee, and certain other legal fees in connection with the line of credit agreement, which are being amortized over a period of 364 days and are reflected in legal fees and/or miscellaneous expenses on the Statements of Operations. The unamortized balance is reflected as prepaid expenses on the Statements of Assets and Liabilities.
For the year ended September 30, 2019, neither Fund had borrowings under this agreement.
9. Concentration of Risk. Limited Term Government and Agency Fund’s investments in mortgage-related and asset-backed securities are subject to certain risks not associated with investments in other securities. Mortgage-related and asset-backed securities are subject to the risk that unexpected changes in interest rates will have a direct effect on expected maturity. A shortened maturity may result in the reinvestment of prepaid amounts in securities with lower yields than the original obligations. An extended maturity may result in a reduction of a security’s value.
10. Concentration of Ownership. From time to time, a Fund may have a concentration of one or more accounts constituting a significant percentage of shares outstanding. Investment activities by holders of such accounts could have material impacts on the Funds. As of September 30, 2019, based on management’s evaluation of the shareholder account base, the Funds had accounts representing controlling ownership
| 76
Table of Contents
Notes to Financial Statements (continued)
September 30, 2019
of more than 5% of the Fund’s total outstanding shares. The number of such accounts, based on accounts that represent more than 5% of an individual class of shares, and the aggregate percentage of net assets represented by such holdings were as follows:
Number of 5% | Percentage of | |||||||
Intermediate Duration Bond Fund | 1 | 18.51 | % | |||||
Omnibus shareholder accounts for which Natixis Advisors understands that the intermediary has discretion over the underlying shareholder accounts or investment models where a shareholder account may be invested for anon-discretionary customer are included in the table above. For other omnibus accounts, the Funds do not have information on the individual shareholder accounts underlying the omnibus accounts; therefore, there could be other 5% shareholders in addition to those disclosed in the table above.
11. Capital Shares. Each Fund may issue an unlimited number of shares of beneficial interest, without par value. Transactions in capital shares were as follows:
| | Year Ended September 30, 2019 | | Year Ended September 30, 2018 | |||||||||||||
Intermediate Duration Bond Fund | Shares | Amount | Shares | Amount | ||||||||||||
| Class A |
| |||||||||||||||
Issued from the sale of shares | 398,531 | $ | 4,099,679 | 419,513 | $ | 4,226,997 | ||||||||||
Issued in connection with the reinvestment of distributions | 47,051 | 480,510 | 44,777 | 451,282 | ||||||||||||
Redeemed | (328,671 | ) | (3,334,024 | ) | (664,405 | ) | (6,691,192 | ) | ||||||||
|
|
|
|
|
|
|
| |||||||||
Net change | 116,911 | $ | 1,246,165 | (200,115 | ) | $ | (2,012,913 | ) | ||||||||
|
|
|
|
|
|
|
| |||||||||
| Class C |
| |||||||||||||||
Issued from the sale of shares | 43,629 | $ | 442,533 | 244 | $ | 3,933 | ||||||||||
Issued in connection with the reinvestment of distributions | 435 | 4,496 | 3,007 | 30,450 | ||||||||||||
Redeemed | (3 | ) | (26 | ) | (316,184 | ) | (3,174,018 | ) | ||||||||
|
|
|
|
|
|
|
| |||||||||
Net change | 44,061 | $ | 447,003 | (312,933 | ) | $ | (3,139,635 | ) | ||||||||
|
|
|
|
|
|
|
| |||||||||
| Class N(a) |
| |||||||||||||||
Issued from the sale of shares | 336,294 | $ | 3,517,593 | — | $ | — | ||||||||||
Issued in connection with the reinvestment of distributions | 1,393 | 14,658 | — | — | ||||||||||||
|
|
|
|
|
|
|
| |||||||||
Net change | 337,687 | $ | 3,532,251 | — | $ | — | ||||||||||
|
|
|
|
|
|
|
| |||||||||
| Class Y |
| |||||||||||||||
Issued from the sale of shares | 10,382,829 | $ | 104,956,223 | 3,847,881 | $ | 38,930,563 | ||||||||||
Issued in connection with the reinvestment of distributions | 500,421 | 5,110,711 | 331,230 | 3,335,145 | ||||||||||||
Redeemed | (5,211,508 | ) | (52,921,882 | ) | (4,349,784 | ) | (43,786,379 | ) | ||||||||
|
|
|
|
|
|
|
| |||||||||
Net change | 5,671,742 | $ | 57,145,052 | (170,673 | ) | $ | (1,520,671 | ) | ||||||||
|
|
|
|
|
|
|
| |||||||||
Increase (decrease) from capital share transactions | 6,170,401 | $ | 62,370,471 | (683,721 | ) | $ | (6,673,219 | ) | ||||||||
|
|
|
|
|
|
|
| |||||||||
| (a) | From commencement of Class operations on February 1, 2019 through September 30, 2019. |
77 |
Table of Contents
Notes to Financial Statements (continued)
September 30, 2019
11. Capital Shares (continued).
| | Year Ended September 30, 2019 | | Year Ended September 30, 2018 | |||||||||||||
Limited Term Government and Agency Fund | Shares | Amount | Shares | Amount | ||||||||||||
| Class A |
| |||||||||||||||
Issued from the sale of shares | 6,604,468 | $ | 73,758,793 | 8,514,333 | $ | 95,199,331 | ||||||||||
Issued in connection with the reinvestment of distributions | 468,020 | 5,253,188 | 415,392 | 4,644,926 | ||||||||||||
Redeemed | (9,509,963 | ) | (106,560,526 | ) | (9,012,064 | ) | (100,870,225 | ) | ||||||||
|
|
|
|
|
|
|
| |||||||||
Net change | (2,437,475 | ) | $ | (27,548,545 | ) | (82,339 | ) | $ | (1,025,968 | ) | ||||||
|
|
|
|
|
|
|
| |||||||||
| Class C |
| |||||||||||||||
Issued from the sale of shares | 1,272,362 | $ | 14,195,722 | 404,620 | $ | 4,537,413 | ||||||||||
Issued in connection with the reinvestment of distributions | 21,420 | 240,567 | 25,353 | 283,986 | ||||||||||||
Redeemed | (1,445,466 | ) | (16,189,983 | ) | (2,149,966 | ) | (24,060,145 | ) | ||||||||
|
|
|
|
|
|
|
| |||||||||
Net change | (151,684 | ) | $ | (1,753,694 | ) | (1,719,993 | ) | $ | (19,238,746 | ) | ||||||
|
|
|
|
|
|
|
| |||||||||
| Class N |
| |||||||||||||||
Issued from the sale of shares | 351,754 | $ | 3,935,676 | 707,393 | $ | 7,898,516 | ||||||||||
Issued in connection with the reinvestment of distributions | 10,232 | 115,280 | 4,698 | 52,619 | ||||||||||||
Redeemed | (183,979 | ) | (2,066,729 | ) | (593,846 | ) | (6,627,527 | ) | ||||||||
|
|
|
|
|
|
|
| |||||||||
Net change | 178,007 | $ | 1,984,227 | 118,245 | $ | 1,323,608 | ||||||||||
|
|
|
|
|
|
|
| |||||||||
| Class Y |
| |||||||||||||||
Issued from the sale of shares | 26,296,159 | $ | 295,778,178 | 15,567,203 | $ | 174,641,549 | ||||||||||
Issued in connection with the reinvestment of distributions | 623,009 | 7,019,684 | 509,058 | 5,709,282 | ||||||||||||
Redeemed | (19,697,925 | ) | (220,982,548 | ) | (14,832,325 | ) | (166,390,937 | ) | ||||||||
|
|
|
|
|
|
|
| |||||||||
Net change | 7,221,243 | $ | 81,815,314 | 1,243,936 | $ | 13,959,894 | ||||||||||
|
|
|
|
|
|
|
| |||||||||
Increase (decrease) from capital share transactions | 4,810,091 | $ | 54,497,302 | (440,151 | ) | $ | (4,981,212 | ) | ||||||||
|
|
|
|
|
|
|
| |||||||||
| 78
Table of Contents
Report of Independent Registered Public Accounting Firm
To the Board of Trustees of Loomis Sayles Funds I and Loomis Sayles Funds II and Shareholders of Loomis Sayles Intermediate Duration Bond Fund and Loomis Sayles Limited Term Government and Agency Fund:
Opinions on the Financial Statements
We have audited the accompanying statements of assets and liabilities, including the portfolios of investments, of Loomis Sayles Intermediate Duration Bond Fund (one of the funds constituting Loomis Sayles Funds I), and Loomis Sayles Limited Term Government and Agency Fund (one of the funds constituting Loomis Sayles Funds II) (hereafter collectively referred to as the “Funds”) as of September 30, 2019, the related statements of operations for the year ended September 30, 2019, the statements of changes in net assets for each of the two years in the period ended September 30, 2019, including the related notes, and the financial highlights for each of the periods indicated therein (collectively referred to as the “financial statements”). In our opinion, the financial statements present fairly, in all material respects, the financial position of each of the Funds as of September 30, 2019, the results of each of their operations for the year then ended, the changes in each of their net assets for each of the two years in the period ended September 30, 2019 and each of the financial highlights for each of the periods indicated therein in conformity with accounting principles generally accepted in the United States of America.
Basis for Opinions
These financial statements are the responsibility of the Funds’ management. Our responsibility is to express an opinion on the Funds’ financial statements based on our audits. We are a public accounting firm registered with the Public Company Accounting Oversight Board (United States) (PCAOB) and are required to be independent with respect to the Funds in accordance with the U.S. federal securities laws and the applicable rules and regulations of the Securities and Exchange Commission and the PCAOB.
We conducted our audits of these financial statements in accordance with the standards of the PCAOB. Those standards require that we plan and perform the audit to obtain reasonable assurance about whether the financial statements are free of material misstatement, whether due to error or fraud.
Our audits included performing procedures to assess the risks of material misstatement of the financial statements, whether due to error or fraud, and performing procedures that respond to those risks. Such procedures included examining, on a test basis, evidence regarding the amounts and disclosures in the financial statements. Our audits also included evaluating the accounting principles used and significant estimates made by management, as well as evaluating the overall presentation of the financial statements. Our procedures included confirmation of securities owned as of
79 |
Table of Contents
Report of Independent Registered Public Accounting Firm
September 30, 2019 by correspondence with the custodian, and brokers; when replies were not received from brokers, we performed other auditing procedures. We believe that our audits provide a reasonable basis for our opinions.
PricewaterhouseCoopers LLP
Boston, Massachusetts
November 21, 2019
We have served as the auditor of one or more investment companies in the Natixis Investment Company Complex since at least 1995. We have not determined the specific year we began serving as auditor.
| 80
Table of Contents
Trustee and Officer Information
The tables below provide certain information regarding the trustees and officers of Loomis Sayles Funds I and Loomis Sayles Funds II (the “Trusts”). Unless otherwise indicated, the address of all persons below is 888 Boylston Street, Suite 800, Boston, MA 02199-8197. The Funds’ Statement of Additional Information includes additional information about the trustees of the Trusts and is available by calling Natixis Funds at 800-225-5478.
Name and Year of Birth | Position(s) Held of Office1 | Principal 5 Years | Number of and Other 5 Years | Experience, Membership | ||||
| INDEPENDENT TRUSTEES | ||||||||
Kenneth A. Drucker (1945) | Chairperson of the Board of Trustees since January 2017 Trustee since 2008 Ex Officio member of Audit Committee, Contract Review Committee and Governance Committee | Retired | 52 None | Significant experience on the Board and on the boards of other business organizations (including at investment companies); executive experience (including as treasurer of an aerospace, automotive, and metal manufacturing corporation) | ||||
| Edmond J. English (1953) | Trustee since 2013 Audit Committee Member and Governance Committee Member | Executive Chairman of Bob’s Discount Furniture (retail) | 52 Director, Burlington Stores, Inc. (retail) | Significant experience on the Board and on the boards of other business organizations (including retail companies and a bank); executive experience (including at a retail company) | ||||
81 |
Table of Contents
Trustee and Officer Information
Name and Year of Birth | Position(s) Held of Office1 | Principal 5 Years | Number of and Other 5 Years | Experience, Membership | ||||
| INDEPENDENT TRUSTEES continued | ||||||||
Richard A. Goglia (1951) | Trustee since 2015 Contract Review Committee Member and Governance Committee Member | Retired; formerly Vice President and Treasurer of Raytheon Company (defense) | 52 None | Experience on the Board and executive experience (including his role as vice president and treasurer of a defense company and experience at a financial services company) | ||||
Wendell J. Knox (1948) | Trustee since 2009 Chairperson of Contract Review Committee | Director of Abt Associates Inc. (research and consulting) | 52 Director, The Hanover Insurance Group (property and casualty insurance); formerly, Director, Eastern Bank (bank) | Significant experience on the Board and on the boards of other business organizations (including at a bank and at a property and casualty insurance firm); executive experience (including roles as president and chief executive officer of a research and consulting company) | ||||
| 82
Table of Contents
Trustee and Officer Information
Name and Year of Birth | Position(s) Held of Office1 | Principal 5 Years | Number of and Other 5 Years | Experience, Membership | ||||
| INDEPENDENT TRUSTEES continued | ||||||||
| Martin T. Meehan(1956) | Trustee since 2012 Audit Committee Member | President, University of Massachusetts; formerly, Chancellor and faculty member, University of Massachusetts Lowell | 52 None | Significant experience on the Board and on the boards of other business organizations; experience as President of the University of Massachusetts; government experience (including as a member of the U.S. House of Representatives); academic experience | ||||
Maureen B. Mitchell (1951) | Trustee since 2017 Contract Review Committee Member and Governance Committee Member | Retired; formerly President, Global Sales and Marketing, GE Asset Management, Inc. (financial services) | 52 Director, Sterling Bancorp (Bank) | Experience on the Board ; financial services industry and executive experience (including role as president of global sales and marketing at a financial services company) | ||||
83 |
Table of Contents
Trustee and Officer Information
Name and Year of Birth | Position(s) Held of Office1 | Principal 5 Years | Number of and Other 5 Years | Experience, Membership | ||||
| INDEPENDENT TRUSTEES continued | ||||||||
James P. Palermo (1955) | Trustee since 2016 Contract Review Committee Member | Founding Partner, Breton Capital Management, LLC (private equity); Partner, STEP Partners, LLC (private equity) | 52 Director, FutureFuel.io (Chemicals and Biofuels) | Experience on the Board ; financial services industry and executive experience (including roles as chief executive officer of client management and asset servicing for a banking and financial services company) | ||||
Erik R. Sirri (1958) | Trustee since 2009 Chairperson of the Audit Committee | Professor of Finance at Babson College | 52 None | Significant experience on the Board; experience as Director of the Division of Trading and Markets at the Securities and Exchange Commission; academic experience; training as an economist | ||||
Peter J. Smail (1952) | Trustee since 2009 Audit Committee Member and Governance Committee Member | Retired | 52 None | Significant experience on the Board; mutual fund industry and executive experience (including roles as president and chief executive officer for an investment adviser) | ||||
| 84
Table of Contents
Trustee and Officer Information
Name and Year of Birth | Position(s) Held of Office1 | Principal 5 Years | Number of and Other 5 Years | Experience, Membership | ||||
| INDEPENDENT TRUSTEES continued | ||||||||
Kirk A. Sykes (1958) | Trustee since 2019 Contract Review Committee Member | Managing Director of Accordia Partners, LLC (real estate development); President of Primary Corporation (real estate development); Managing Principal of Merrick Capital Partners (infrastructure finance); formerly, President of Urban Strategy America Fund (real estate fund manager) | 52 Trustee, Eastern Bank (bank); formerly Director, Ares Commercial Real Estate Corporation (real estate investment trust) | Experience on the Board and significant experience on the boards of other business organizations (including real estate companies and banks) | ||||
Cynthia L. Walker (1956) | Trustee since 2005 Chairperson of the Governance Committee and Audit Committee Member | Deputy Dean for Finance and Administration, Yale University School of Medicine | 52 None | Significant experience on the Board; executive experience in a variety of academic organizations (including roles as dean for finance and administration) | ||||
85 |
Table of Contents
Trustee and Officer Information
Name and Year of Birth | Position(s) Held of Office1 | Principal 5 Years | Number of and Other 5 Years | Experience, Membership | ||||
| INTERESTED TRUSTEES | ||||||||
Kevin P. Charleston3 (1965) One Financial Center Boston, MA 02111 | Trustee since 2015 President and Chief Executive Officer of Loomis Sayles Funds I since 2015 | President, Chief Executive Officer and Chairman of the Board of Directors; formerly, Chief Financial Officer, Loomis, Sayles & Company, L.P. | 52 None | Experience on the Board; continuing service as President, Chief Executive Officer and Chairman of the Board of Directors of Loomis, Sayles & Company, L.P. | ||||
| David L. Giunta4(1965) | Trustee since 2011 President of Loomis Sayles Funds II and Executive Vice President of Loomis Sayles Funds I since 2008; Chief Executive Officer of Loomis Sayles Funds II since 2015 | President and Chief Executive Officer, Natixis Advisors, L.P., Natixis Distribution, L.P., Natixis Distribution Corporation and Chairman of the Board of Natixis Distribution Corporation | 52 None | Significant experience on the Board; experience as President and Chief Executive Officer, Natixis Advisors, L.P., Natixis Distribution, L.P., Natixis Distribution Corporation and Chairman of the Board of Natixis Distribution Corporation | ||||
| 1 | Each trustee serves until retirement, resignation or removal from the Board. The current retirement age is 75. The position of Chairperson of the Board is appointed for a three-year term. Mr. Drucker was appointed to serve an additional one year term as the Chairperson of the Board on June 12, 2019. |
| 2 | The trustees of the Trusts serve as trustees of a fund complex that includes all series of the Natixis Funds Trust I, Natixis Funds Trust II, Natixis Funds Trust IV, Gateway Trust, Loomis Sayles Funds I, Loomis Sayles Funds II and Natixis ETF Trust (collectively, the “Fund Complex”). |
| 3 | Mr. Charleston is deemed an “interested person” of the Trusts because he holds the following positions with an affiliated person of the Trusts: President, Chief Executive Officer and Chairman of the Board of Directors of Loomis, Sayles & Company, L.P. |
| 4 | Mr. Giunta is deemed an “interested person” of the Trusts because he holds the following positions with an affiliated person of the Trusts: President and Chief Executive Officer, Natixis Advisors, L.P., Natixis Distribution, L.P., Natixis Distribution Corporation and Chairman of the Board of Natixis Distribution Corporation. |
| 86
Table of Contents
Trustee and Officer Information
Name and Year of Birth | Position(s) Held with the Trusts | Term of Office1 and Length of Time Served | Principal Occupation(s) During Past 5 Years2 | |||
| OFFICERS OF THE TRUSTS | ||||||
Daniel J. Fuss (1933) One Financial Center Boston, MA 02111 | Executive Vice President of Loomis Sayles Funds I and Loomis Sayles Funds II | Since 2003 | Vice Chairman and Director, Loomis, Sayles & Company, L.P. | |||
Russell L. Kane (1969) | Secretary, Clerk and Chief Legal Officer | Since 2016 | Executive Vice President, General Counsel, Secretary and Clerk, Natixis Distribution Corporation, Natixis Advisors, L.P. and Natixis Distribution, L.P.; formerly, Chief Compliance Officer for Mutual Funds, Senior Vice President, Deputy General Counsel, Assistant Secretary and Assistant Clerk, Natixis Distribution Corporation, Natixis Advisors, L.P. and Natixis Distribution, L.P. | |||
Michael C. Kardok (1959) | Treasurer, Principal Financial and Accounting Officer | Since 2004 | Senior Vice President, Natixis Advisors, L.P. and Natixis Distribution, L.P. | |||
Kirk D. Johnson (1981) | Chief Compliance Officer, Assistant Secretary and Anti-Money Laundering Officer | Since 2018 | Senior Vice President, Deputy General Counsel, Assistant Secretary and Assistant Clerk, Natixis Distribution Corporation, Natixis Advisors, L.P. and Natixis Distribution, L.P.; formerly, Associate General Counsel, Natixis Distribution, L.P.; Vice President and Counsel, Natixis Investment Managers, L.P. | |||
87 |
Table of Contents
Trustee and Officer Information
| 1 | Each officer of the Trusts serves for an indefinite term in accordance with the Trusts’ currentby-laws until the date his or her successor is elected and qualified, or until he or she sooner dies, retires, is removed or becomes disqualified. |
| 2 | Each person listed above, except as noted, holds the same position(s) with the Fund Complex. Previous positions during the past five years with Natixis Distribution, L.P., Natixis Advisors, L.P. or Loomis, Sayles & Company, L.P. are omitted, if not materially different from an officer’s current position with such entity. |
| 88
Table of Contents


Annual Report
September 30, 2019
Loomis Sayles Growth Fund
Loomis Sayles Strategic Income Fund
| Portfolio Review | 1 | |||
| Portfolio of Investments | 23 | |||
| Financial Statements | 41 | |||
| Notes to Financial Statements | 54 | |||
IMPORTANT NOTICE TO SHAREHOLDERS
Beginning on January 1, 2021, as permitted by regulations adopted by the Securities and Exchange Commission, paper copies of shareholder reports like this one will no longer be sent by mail, unless you specifically request paper copies of the reports from the Fund or from your financial intermediary, such as a broker-dealer or bank. Instead, the reports will be made available on the Funds’ website, and you will be notified by mail each time a report is posted and provided with a website link to access the report. If you wish to continue receiving paper copies of your shareholder reports after January 1, 2021, you can inform the Fund at any time by calling 1-800-225-5478. If you hold your account with a financial intermediary and you wish to continue receiving paper copies after January 1, 2021, you should call your financial intermediary directly. Paper copies are provided free of charge, and your election to receive reports in paper will apply to all funds held with the Natixis Funds complex. If you have already elected to receive shareholder reports electronically, you will not be affected by this change and you need not take any action. You currently may elect to receive shareholder reports and other communications from the Fund or your financial intermediary electronically atwww.icsdelivery.com/natixisfunds.
Table of Contents
| Manager | Symbols | |
| Aziz V. Hamzaogullari, CFA® | Class A LGRRX | |
| Loomis, Sayles & Company, L.P. | Class C LGRCX | |
| Class N LGRNX | ||
| Class Y LSGRX | ||
Investment Goal
The Fund seeks long-term growth of capital.
Market Conditions
US equity markets finished modestly higher for the12-month period ending September 30, 2019 as gauged by the large-capitalization S&P 500® Index. The fourth quarter of 2018 saw a sharp decline in risk-based assets including equities on concerns around theUS-China trade war, slowing overseas growth, and monetary policy. Entering 2019, the US Federal Reserve (Fed) announced an early end to its balance sheet reduction program and signaled a pause in short-term rate hikes. Combined with data suggesting that domestic growth was likely to remain in positive territory, the central bank’s pivot to a more accommodative stance supported a recovery in US equities. In May, President Trump announced plans to raise tariffs to 25% on some $200 billion in imports from China, sending markets lower. However, sentiment rebounded as the Fed signaled a willingness to cut rates as needed to offset any drag on growth from higher tariffs. The S&P 500® eventually surpassed its previous high before settling into a trading range over the last few weeks of the period. While performance for growth and value stocks did not vary all that widely for the 12 months, the same was not true with respect to market capitalization.Small-cap stocks badly lagged theirlarge-cap counterparts for the period, finishing well into negative territory as the segment failed to fully recover the lost ground incurred during late 2018’s flight to safety on the part of investors.
Performance Results
For the 12 months ended September 30, 2019, Class Y shares of Loomis Sayles Growth Fund returned 6.09% at net asset value. The Fund outperformed its benchmark, the Russell 1000® Growth Index, which returned 3.71%.
Explanation of Fund Performance
We are an active manager with a long-term, private equity approach to investing. Through our proprietarybottom-up research framework, we look to invest in those few high-quality businesses with sustainable competitive advantages and profitable growth when they trade at a significant discount to intrinsic value. Given the rare confluence of quality, growth, and valuation, we may study dozens of companies but may only invest in a select few businesses each year. We believe identifying those few businesses with these characteristics is an art, not a science. As a result of this rigorous approach, ours is a selective, high-conviction portfolio of typically30-40 names.
1 |
Table of Contents
The Fund’s positions in Starbucks, Procter & Gamble, and Visa contributed the most to performance. Stock selection in the consumer discretionary, healthcare, consumer staples, communication services, industrials and information technology sectors, along with our allocations in the consumer staples, industrials and financials sectors, contributed positively to relative performance.
Starbucks is the world’s leading retailer and roaster of specialty coffee, with more than 30,000 coffee shops in over 40 countries. The Starbucks brand is among the most iconic in the quick-service restaurant category, and ranks among the world’s most powerful brands. By far the largest specialty-coffee provider, Starbucks’ scale provides it with advantages in procurement and advertising that lead to higher profitability than competitors, while also enabling it to spend far more on advertising and marketing. A unique culture of employee development has contributed to lower employee turnover and better customer experience than many restaurant competitors, and the company has been a pioneer in customer engagement through its loyalty program. A holding since March 2018, Starbucks was the largest contributor to performance for the period. The company reported revenue and operating profits that were generally ahead of expectations, driven by improving same-store sales growth in the US and China, its two largest markets. In the US the company is benefiting from beverage innovation, improvingin-store execution, and digital engagement with consumers, while in China the company is benefiting from innovation, improved digital engagement, and the success of its new delivery partnership with Alibaba. We believe that Starbucks is one of the best-positioned companies in the specialty-coffee industry and one of the highest quality consumer brands in food and beverage. We believe that over the long run, its global sales growth will be supported by a long tail of away-from-home coffee consumption, pricing power, ongoing premiumization, and improved loyalty and targeted marketing. In addition, we believe that the China opportunity is not fully appreciated by short-term investors. As a result, we believe Starbucks is trading at a discount to our estimate of intrinsic value and offers an attractivereward-to-risk opportunity.
Procter & Gamble (P&G) is the world’s largest consumer products manufacturer. The company’s portfolio of leading brands, global distribution reach, shelf space with retailers, and scale constitute strong and sustainable competitive advantages that would take decades for a competitor to replicate. In many of its categories P&G is the global market share leader, often capturing a multiple of the next largest competitor’s share. During the period, P&G reported its strongest year of organic sales growth in the past decade and exceeded its full-year guidance after raising it multiple times throughout the year. The main driver for improved performance was the growing benefit of the company’s increased focus on a smaller number of product categories in which the company’s competitive advantages enable it to deliver clearly differentiated products, in particular on the basis of their superior efficacy, packaging, and brands. While we believe the company should routinely succeed on this basis, years of expansion by category and geography had resulted in insufficient attention to the company’s core businesses. Under CEO David Taylor, the company implemented an improved strategy by refocusing on 65 brands in 10 core categories, and has disposed of over 100non-core brands since late 2015. Correcting its missteps has taken time and required investment in the company’s US supply chain and global manufacturing
| 2
Table of Contents
LOOMIS SAYLES GROWTH FUND
capabilities to enable the company to deliver superiority on all measures. We believe recent results have begun to reflect P&G’s improved focus and execution and should enable the company to sustainably return to above-market growth over our long-term investment horizon. We believe the current market expectations underestimate the long-term structural growth drivers and the company’s superior positioning. With its share price at a significant discount to our estimate of intrinsic value, we believe the company offers a compellingreward-to-risk opportunity.
Visa is the largest payments technology company in the world, with a comprehensive offering of digital payment products including credit cards, debit cards — which Visa invented — and transaction security services known as tokenization. Visa has one of the world’s most recognized brands, which took decades and significant investment to build. Through its open-loop, multi-party system, Visa has built a massive global network, orchestrating transaction settlements between merchants, merchants’ banks, card-issuer banks and cardholders in more than 200 countries. A growing global network with over 3.3 billion Visa-branded cards outstanding that are accepted by 54 million merchants worldwide creates a powerful virtuous cycle, reinforcing Visa’sdifficult-to-replicate competitive advantages. During the period Visa reported revenue and earnings that were strong and generally better than market expectations. Payment volume growth of approximately 10% in constant currency was well above the rate of growth in the approximately $47 trillion of global personal consumer expenditures, reflecting the ongoing, long-term secular shift from cash to electronic payments. Other areas of growth for Visa include expansion of its network capabilities into new segments such asperson-to-person payments,business-to-business payments, and government and corporate disbursements to consumers. In aggregate, these new segments represent an estimated $30 trillion of addressable spending. We estimate Visa can generate double-digit revenue growth over our forecast period. As the company continues to scale its businesses in regions around the world, we expect it will be able to increase cash flow growth, expand margins, and improve its return on invested capital. We believe the assumptions embedded in Visa’s share price underestimate the company’s significant long-term growth opportunities and the sustainability of its business model. We believe the company’s shares currently sell at a significant discount to our estimate of intrinsic value and thereby offer a compellingreward-to-risk opportunity.
The Fund’s positions in Amazon, Schlumberger, and Regeneron Pharmaceuticals detracted the most from performance. Stock selection in the energy and financials sectors, along with our allocations in the energy, healthcare, information technology (IT) and consumer discretionary sectors, detracted from relative performance.
Online retailer Amazon offers millions of products — sold by Amazon or by third parties — with the value proposition to consumers of selection, price, and convenience. Amazon’s enterprise IT business, Amazon Web Services (AWS), offers a suite of secure,on-demand cloud-computing services, with a value proposition to clients of speed, agility, and savings. In both of its core markets, we believe Amazon possesses strong and sustainable competitive advantages that would be difficult for competitors to replicate. Amazon reported healthy fundamentals and revenue growth that remains strong despite some
3 |
Table of Contents
deceleration during the period. With gross merchandise volume (GMV) growing, by our estimates, above growth in the teens for USe-commerce and low single-digit growth in global retail sales, the company continued to take market share. AWS also posted strong revenue growth that was many multiples higher than our estimate of single-digit growth in overall enterprise IT spending. However, the company incurred higher-than-expected expenses to support the recent rollout ofone-day Prime shipping, and provided guidance that reflected higher ongoing investments. Amazon has experienced a number of transitions over the past 25 years where changes to its service model, such as the initial launch of Primetwo-day delivery or offering fulfillment by Amazon, have temporarily impacted the cost or efficiency of its logistics system. We expect the company’s newest initiative will benefit from scale and efficiency over time, and that increasing convenience to consumers once again by expanding the selection of products available for faster delivery will contribute to future share gains. With an increasing shift to higher-margin product categories such as third-party sales, AWS, and advertising, gross margins expanded during the period. Amazon is one of the best-positioned companies ine-commerce and enterprise IT — each addressing large, underpenetrated markets. The secular shift in consumer preference from traditionalbrick-and-mortar retail to online retail ande-commerce spending is the primary growth driver for Amazon, but both markets benefit from secular growth that is still in its early stages. We believe the current share price shows a lack of appreciation for Amazon’s significant long-term growth opportunities and the sustainability of its business model. As a result, we believe the company is selling at a significant discount to our estimate of intrinsic value and offers a compellingreward-to-risk opportunity.
Schlumberger is the world’s leading supplier of technology, equipment, integrated project management, and information solutions to the international oil and gas exploration and production industry. Over its90-year history, Schlumberger has built a brand and reputation for delivering consistent service and product excellence across the spectrum of exploration, drilling, and production. Only a few companies can compete with the scope of Schlumberger’s integrated suite of products and services, and even fewer can compete with the scale and depth of its technology and service execution. A portfolio holding since 2008, global sales for the trailing 12 months of $33 billion rose 2% compared with the prior-year period, while free cash flow increased 54% to $2.5 billion. However, stocks in the oil services sector came under pressure on concerns around slowing activity in North America, where record-setting production, coupled with insufficient takeaway capacity in the Permian basin, has led operators to delay well completions and downwardly revise their 2019 spending outlook. Further, trade war rhetoric and concerns over global demand growth have contributed to falling oil prices, impacting expectations for global service activity. Markets outside of North America, which have historically accounted for approximately 75% of Schlumberger’s revenue and a greater share of profitability, have substantially lagged the rebound in North America over the past two years. However, international revenues inflected up in the second half of 2018 and have continued to improve. While management has been prematurely optimistic about a recovery outside of the US and has revised previous estimates, management expects international growth in 2019 will be in the high single digits and positive for the first time since 2014. The need to
| 4
Table of Contents
LOOMIS SAYLES GROWTH FUND
replace naturally depleting reservoirs creates long-term secular growth in the demand for oil and the need to extract hydrocarbons from harsher environments. Oilfield services like those Schlumberger provides are key to accessingdifficult-to-reach resources. Thanks to its superior products and services and its competitive advantages, we believe Schlumberger is well positioned to weather the current environment and capitalize on the growth in oilfield services as market supply and demand normalizes. We believe the shares of Schlumberger are selling at a significant discount to our estimate of intrinsic value and offer a compellingreward-to-risk opportunity.
Regeneron Pharmaceuticals, Inc. is a fully integrated biopharmaceutical company created with the vision to empower scientists to shape the path of the business. Regeneron has created enabling technologies, platforms, and methods that materially speed target discovery and development timelines, allowing the company to develop viable candidates for clinical trial faster than its competitors. As a result of these technologies, Regeneron was able to negotiate risk-mitigating collaborations with larger biopharmaceutical company partners that fund early-stage research and development in exchange for a share of potential profits, enabling the company to access scale and distribution strength. During the period, Regeneron reported operating results that reflected share gains for Eylea, a treatment for eye diseases and the company’s largest revenue generator, along with continued traction for Dupixent, the company’s innovative treatment for atopic dermatitis and allergic asthma, and meaningful progress in its pipeline. However, heightened investments to support its pipeline and growth products, as well as continued investment in Eylea, contributed to lower-than-expected operating profits. We believe the increase in investments is reflective of its ongoing innovation and should lay the groundwork for long-term revenue growth. In the interim, Regeneron’s share price continues to be volatile in response to market expectations regarding potential competition for Eylea. While we expect Eylea to face heightened competition in the near future, we believe its competitive advantages remain intact. The treatment’s leading efficacy, long-term durability of results, and attractive safety profile, have made it the market leader and choice of physicians across multiple indications — a position that will be difficult for new competitors to replicate. We believe Regeneron is among the highest quality businesses in healthcare, with both broad-based established therapies and meaningful pipeline assets, which include 21 product candidates in clinical development that were generated using the company’s proprietary technology. We believe Regeneron’s market price embeds a lack of appreciation for the company’s multiple short-term and longer-term growth opportunities and the uniqueness of its financial model. We believe the shares trade at a significant discount to our estimate of intrinsic value and offer a compellingreward-to-risk opportunity.
All aspects of our quality-growth-valuation investment thesis must be present simultaneously for us to make an investment. Often our research is completed well in advance of the opportunity to invest. We are patient investors and maintain coverage of high-quality businesses in order to take advantage of meaningful price dislocations if and when they occur. During the period we initiated new positions in Nvidia and Roche Holding, and received an approximately 22 basis point allocation in Alcon, Inc., which was a spinoff from existing portfolio holding Novartis. We added to our existing holdings in
5 |
Table of Contents
Cerner, Regeneron Pharmaceuticals, and Monster Beverage. We trimmed our existing positions in FactSet Research Systems, Varian Medical Systems, Starbucks, and American Express. We sold our position in United Parcel Service as it approached our estimate of intrinsic value.
Outlook
Our investment process is characterized bybottom-up, fundamental research and a long-term investment time horizon. The nature of the process leads to a lower-turnover portfolio in which sector positioning is the result of stock selection. The Fund ended the year with overweight positions in the consumer staples, consumer discretionary, financials, energy, and healthcare sectors and underweight positions in the information technology, industrials, and communication services sectors. We did not own positions in the real estate or materials sectors.
Hypothetical Growth of $100,000 Investment in Class Y Shares3
September 30, 2009 through September 30, 2019
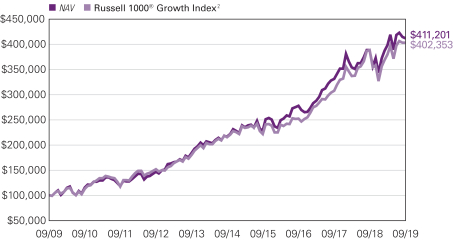
See notes to chart on page 8.
| 6
Table of Contents
LOOMIS SAYLES GROWTH FUND
Top Ten Holdings as of September 30, 2019
| Security Name | % of Assets | |||||
| 1 | Visa, Inc., Class A | 6.75 | % | |||
| 2 | Amazon.com, Inc. | 6.14 | ||||
| 3 | Facebook, Inc., Class A | 5.42 | ||||
| 4 | Oracle Corp. | 4.97 | ||||
| 5 | Alibaba Group Holding Ltd., Sponsored ADR | 4.89 | ||||
| 6 | Microsoft Corp. | 3.99 | ||||
| 7 | Autodesk, Inc. | 3.92 | ||||
| 8 | Procter & Gamble Co. (The) | 3.53 | ||||
| 9 | Monster Beverage Corp. | 3.44 | ||||
| 10 | QUALCOMM, Inc. | 3.25 | ||||
The portfolio is actively managed and holdings are subject to change. There is no guarantee the Fund continues to invest in the securities referenced. The holdings listed exclude any temporary cash investments.
7 |
Table of Contents
Average Annual Total Returns — September 30, 20193
| Expense Ratios4 | ||||||||||||||||||||||||
| 1 Year | 5 Years | 10 Years | Life of Class N | Gross | Net | |||||||||||||||||||
| Class Y (Inception 5/16/91) | ||||||||||||||||||||||||
| NAV | 6.09 | % | 13.75 | % | 15.19 | % | — | % | 0.65 | % | 0.65 | % | ||||||||||||
| Class A (Inception 12/31/96) | ||||||||||||||||||||||||
| NAV | 5.81 | 13.48 | 14.91 | — | 0.90 | 0.90 | ||||||||||||||||||
| With 5.75% Maximum Sales Charge | -0.28 | 12.13 | 14.24 | — | ||||||||||||||||||||
| Class C (Inception 9/12/03) | ||||||||||||||||||||||||
| NAV | 5.05 | 12.61 | 14.06 | — | 1.65 | 1.65 | ||||||||||||||||||
| With CDSC1 | 4.06 | 12.61 | 14.06 | — | ||||||||||||||||||||
| Class N (Inception 2/1/13) | ||||||||||||||||||||||||
| NAV | 6.14 | 13.86 | — | 14.97 | 0.58 | 0.58 | ||||||||||||||||||
| Comparative Performance | ||||||||||||||||||||||||
| Russell 1000® Growth Index2 | 3.71 | 13.39 | 14.94 | 15.19 | ||||||||||||||||||||
Performance data shown represents past performance and is no guarantee of, and not necessarily indicative of, future results. Total return and value will vary, and you may have a gain or loss when shares are sold. Current performance may be lower or higher than quoted. For most recent month-end performance, visit im.natixis.com. Performance for other share classes will be greater or less than shown based on differences in fees and sales charges. You may not invest directly in an index. Performance for periods less than one year is cumulative, not annualized. Returns reflect changes in share price and reinvestment of dividends and capital gains, if any. The table(s) do not reflect taxes shareholders might owe on any fund distributions or when they redeem their shares.
| 1 | Performance for Class C shares assumes a 1% contingent deferred sales charge (“CDSC”) applied when you sell shares within one year of purchase. |
| 2 | Russell 1000® Growth Index is an unmanaged index that measures the performance of the large-cap growth segment of the U.S. equity universe. It includes those Russell 1000® companies with higher price-to-book ratios and higher forecasted growth values. |
| 3 | Fund performance has been increased by fee waivers and/or expense reimbursements, if any, without which performance would have been lower. |
| 4 | Expense ratios are as shown in the Fund’s prospectus in effect as of the date of this report. The expense ratios for the current reporting period can be found in the Financial Highlights section of this report under Ratios to Average Net Assets. Net expenses reflect contractual expense limitations set to expire on 1/31/20. When a Fund’s expenses are below the limitation, gross and net expense ratios will be the same. See Note 5 of the Notes to Financial Statements for more information about the Fund’s expense limitations. |
| 8
Table of Contents
LOOMIS SAYLES STRATEGIC INCOME FUND
| Managers | Symbols | |||
| Matthew J. Eagan, CFA® | Class A | NEFZX | ||
| Daniel J. Fuss, CFA®, CIC | Class C | NECZX | ||
| Brian P. Kennedy | Class N | NEZNX | ||
| Elaine M. Stokes | Class Y | NEZYX | ||
| Loomis, Sayles & Company, L.P. | Admin Class | NEZAX | ||
Investment Goal
The Fund seeks high current income with a secondary objective of capital growth.
Market Conditions
Global fixed income markets delivered healthy gains over the12-month period, reflecting the combination of slowing economic growth, persistently low inflation and the US Federal Reserve’s (Fed’s) shift toward an increasingly accommodative monetary policy. As recently as the fourth quarter of 2018, the markets generally anticipated that the Fed would continue to raise interest rates for at least another 12 months. As growth slowed in late 2018, however, the Fed indicated that its next move would likely be to reduce interest rates. The Fed indeed cut rates by a quarter point on both August 1 and September 19, 2019, bringing its benchmark federal funds target rate to a range of 1.75% to 2.00%. In addition, the markets appeared to be pricing in the likelihood of further reductions bymid-2020. The dramatic change in the outlook for Fed policy was the leading factor in the strong, broad-based rally in bonds.
Investment grade corporates generated robust returns and finished the period as the top performing major fixed income category. In addition to benefiting from the rally in rate-sensitive assets, investment grade corporates were boosted by both positive earnings trends and healthy investor risk appetites.
High yield bonds posted a gain but lagged most other fixed income categories. The bulk of the shortfall occurred in December, when stocks and other higher-risk assets sold off sharply. While high yield issues rebounded over the following nine months as investor sentiment improved, the category could not recover from its earlier underperformance.
Securitized assets generated strong absolute returns, but their lower interest rate sensitivity caused them to lag Treasuries and investment grade corporates. Commercial mortgage-backed securities delivered the largest gains, followed by mortgage-backed securities and asset-backed securities, respectively.
Despite persistent uncertainty surrounding the world economy and theUS-China trade dispute, emerging market bonds delivered a strong absolute return and narrowly outpaced the headline domestic indexes. Latin America was the top performer at the regional level, led by Brazil.
9 |
Table of Contents
Performance Results
For the 12 months ended September 30, 2019, Class Y shares of the Loomis Sayles Strategic Income Fund returned 3.22% at net asset value. The Fund underperformed its primary benchmark, the Bloomberg Barclays U.S. Aggregate Bond Index, which returned 10.30%.
Explanation of Fund Performance
Exposure to high yield corporate credit limited performance for the 12 months, primarily due to holdings of energy names which were negatively impacted by softening demand and increasing supply. Holdings of liquid investments also weighed on relative performance as higher-yielding securities outperformed. Security selection innon-US-dollar-denominated issues, primarily in Norwegian names, weighed on performance as well.
The Fund’s allocation to securitized assets generated positive results during the period, led by security selection in asset-backed securities (ABS). Longer-than-benchmark positioning with respect to duration (and corresponding interest rate sensitivity) in US Treasuries aided relative performance as yields declined over the 12 months, but overall, shorter than benchmark duration had a negative impact on performance for the period. The allocation to emerging market credit, most notably communications and energy names, added modestly to relative performance.
Outlook
Recent market volatility and macro developments have confirmed our view that we are in a late cycle environment. We have become more cautious based on the high degree of uncertainty associated with the outlook for trade; we believe there is still potential for a deal but with reduced conviction. Weak global manufacturing demand has persisted longer than expected, and this has the potential to further weaken business and consumer sentiment. We expect the US economy to weather this manufacturing slowdown without recession. However, it is likely that more policy easing will be needed to avoid a near-term downturn with the trade dispute showing the potential for rapid escalation. The Fund’s portfolio reflects a cautious view, and we expect the above factors will be the primary issues driving risk profiles in the financial markets. As we gain clarity on the macro risk factors, we will seek to invest opportunistically where we feel the market may be mispricing risk in credit, currency or rates.
In our view, it is possible the Fed overtightened in 2018 while fiscal stimulus and corporate tax cuts were temporarily boosting economic activity. We don’t believe that yield curve inversion is entirely indicative of an imminent recession, and there can be significant lag time between inversion and the start of a recession. Risk assets can still perform well while yield curves are inverted, which supports continued investment in credit. However, security selection is critical. With the recent policy pivot and acknowledgment of a global slowdown by the Fed and other global central banks, the direction of rates in the near term appears to be more neutral. Additionally, further central bank cuts should support extension of the credit cycle.1
| 1 | A credit cycle is a cyclical pattern that follows credit availability and corporate health. |
| 10
Table of Contents
LOOMIS SAYLES STRATEGIC INCOME FUND
The current shift in US monetary policy has not translated to a materially weaker US dollar. This, combined with slower global growth and trade conflict, leaves us with a cautious view on markets outside of the US. We are being patient and highly selective within our allocation to emerging market debt.
We believe there are still opportunities in the credit markets, given the positive technical backdrop including flat to negative net issuance and solid retail inflows driven by negative global yields, along with expectations for slower butnon-recessionary US economic growth. We are finding value in select areas of the market, while maintaining a higher credit quality bias and increased emphasis on sectors with more defensive characteristics and positive secular trends including healthcare, communications, technology and media. These are industries that should hold up well even in a downturn. The upside potential for the credit markets, given current valuations, is largely dependent on global profit growth and capital expenditures helping to extend this stage of the cycle. The key risk to markets, in our view, centers on the overhang from macro uncertainty with potential for contagion across sectors.
Consistent with our process, we use periods of market volatility to invest where there has been significant dislocation at the sector or security level and valuations show a disconnect from the underlying fundamentals. We have maintained sufficient liquidity in our portfolios to be positioned to invest opportunistically as these situations arise.
During periods in which the US dollar appreciates relative to foreign currencies, funds that holdnon-US-dollar-denominated bonds may realize currency losses in connection with the maturity or sale of certain bonds. These losses impact a fund’s ordinary income distributions (to the extent that losses are not offset by realized currency gains within the fund’s fiscal year). A recognized currency loss, in accordance with federal tax rules, decreases the amount of ordinary income a fund has available to distribute, even though these bonds continue to generate coupon income.
Fund officers have analyzed the fund’s current portfolio of investments, realized currency gains and losses, schedule of maturities, and the corresponding amounts of unrealized currency losses that may become realized during the current fiscal year. This analysis is performed regularly to determine how realized currency losses will impact periodic ordinary income distributions for the fund. Based on the most recent quarterly analysis (as of September 30, 2019), fund officers believe that realized currency losses will have an impact on the distributions in the 2020 fiscal year. This analysis is based on certain assumptions including, but not limited to, the level of foreign currency exchange rates, security prices, interest rates, the fund advisers’ ability to manage realized currency losses, and the net asset level of the fund. Changes to these assumptions could materially impact the analysis and the amounts of future fund distributions. Fund officers will continue to monitor these amounts on a regular basis and take the necessary actions required to manage the fund’s distributions to address realized currency losses while seeking to avoid a return of capital distribution.
11 |
Table of Contents
Hypothetical Growth of $100,000 Investment in Class Y Shares5
September 30, 2009 through September 30, 2019
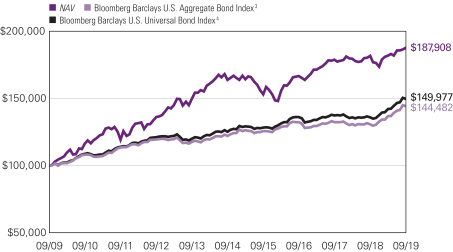
See notes to chart on page 13.
| 12
Table of Contents
LOOMIS SAYLES STRATEGIC INCOME FUND
Average Annual Total Returns — September 30, 20195
| Expense Ratios6 | ||||||||||||||||||||||||
| 1 Year | 5 Years | 10 Years | Life of Class N | Gross | Net | |||||||||||||||||||
| Class Y (Inception 12/1/99) | ||||||||||||||||||||||||
| NAV | 3.22 | % | 2.74 | % | 6.51 | % | — | % | 0.71 | % | 0.71 | % | ||||||||||||
| Class A (Inception 5/1/95) | ||||||||||||||||||||||||
| NAV | 3.02 | 2.49 | 6.24 | — | 0.96 | 0.96 | ||||||||||||||||||
| With 4.25% Maximum Sales Charge | -1.36 | 1.61 | 5.79 | — | ||||||||||||||||||||
| Class C (Inception 5/1/95) | ||||||||||||||||||||||||
| NAV | 2.27 | 1.73 | 5.46 | — | 1.71 | 1.71 | ||||||||||||||||||
| With CDSC2 | 1.28 | 1.73 | 5.46 | — | ||||||||||||||||||||
| Class N (Inception 2/1/13) | ||||||||||||||||||||||||
| NAV | 3.37 | 2.84 | — | 4.17 | 0.63 | 0.63 | ||||||||||||||||||
| Admin Class (Inception 2/1/10)1 | ||||||||||||||||||||||||
| NAV | 2.78 | 2.24 | 5.97 | — | 1.20 | 1.20 | ||||||||||||||||||
| Comparative Performance | ||||||||||||||||||||||||
| Bloomberg Barclays U.S. Aggregate Bond Index3 | 10.30 | 3.38 | 3.75 | 2.95 | ||||||||||||||||||||
| Bloomberg Barclays U.S. Universal Bond Index4 | 10.07 | 3.62 | 4.14 | 3.22 | ||||||||||||||||||||
Performance data shown represents past performance and is no guarantee of, and not necessarily indicative of, future results. Total return and value will vary, and you may have a gain or loss when shares are sold. Current performance may be lower or higher than quoted. Formost recent month-end performance, visit im.natixis.com. Performance for other share classes will be greater or less than shown based on differences in fees and sales charges. You may not invest directly in an index. Performance for periods less than one year is cumulative, not annualized. Returns reflect changes in share price and reinvestment of dividends and capital gains, if any. The table(s) do not reflect taxes shareholders might owe on any fund distributions or when they redeem their shares.
| 1 | Prior to the inception of Admin Class shares (2/1/10), performance is that of Class A shares, restated to reflect the higher net expenses of Admin Class shares. |
| 2 | Class C share performance assumes a 1% CDSC applied when you sell shares within one year of purchase. |
| 3 | The Bloomberg Barclays U.S. Aggregate Bond Index is an unmanaged index that covers the U.S.-dollar-denominated, investment-grade, fixed-rate, taxable bond market of SEC-registered securities. The index includes bonds from the Treasury, government-related, corporate, mortgage-backed securities, asset-backed securities, and collateralized mortgage-backed securities sectors. |
| 4 | The Bloomberg Barclays U.S. Universal Bond Index represents the union of the U.S. Aggregate Index, the U.S. High-Yield Corporate Index, the 144A Index, the Eurodollar Index, the Emerging Markets Index, and the non-ERISA portion of the CMBS Index. Municipal debt, private placements, and non-dollar-denominated issues are excluded from the Universal Bond Index. The only constituent of the index that includes floating-rate debt is the Emerging Markets Index. |
| 5 | Fund performance has been increased by fee waivers and/or expense reimbursements, if any, without which performance would have been lower. |
| 6 | Expense ratios are as shown in the Fund’s prospectus in effect as of the date of this report. The expense ratios for the current reporting period can be found in the Financial Highlights section of this report under Ratios to Average Net Assets. Net expenses reflect contractual expense limitations set to expire on 1/31/20. When a Fund’s expenses are below the limitation, gross and net expense ratios will be the same. See Note 5 of the Notes to Financial Statements for more information about the Fund’s expense limitations. |
13 |
Table of Contents
ADDITIONAL INFORMATION
The views expressed in this report reflect those of the portfolio managers as of the dates indicated. The managers’ views are subject to change at any time without notice based on changes in market or other conditions. References to specific securities or industries should not be regarded as investment advice. Because the Fund is actively managed, there is no assurance that they will continue to invest in the securities or industries mentioned.
All investing involves risk, including the risk of loss. There is no assurance that any investment will meet its performance objectives or that losses will be avoided.
ADDITIONAL INDEX INFORMATION
This document may contain references to third party copyrights, indexes, and trademarks, each of which is the property of its respective owner. Such owner is not affiliated with Natixis Investment Managers or any of its related or affiliated companies (collectively “Natixis Affiliates”) and does not sponsor, endorse or participate in the provision of any Natixis Affiliates services, funds or other financial products.
The index information contained herein is derived from third parties and is provided on an “as is” basis. The user of this information assumes the entire risk of use of this information. Each of the third party entities involved in compiling, computing or creating index information disclaims all warranties (including, without limitation, any warranties of originality, accuracy, completeness, timeliness, non-infringement, merchantability and fitness for a particular purpose) with respect to such information.
PROXY VOTING INFORMATION
A description of the Natixis Funds’ proxy voting policies and procedures is available without charge, upon request, by calling Natixis Funds at 800-225-5478; on the Natixis Funds’ website at im.natixis.com; and on the Securities and Exchange Commission’s (“SEC’s”) website at www.sec.gov. Information regarding how the Natixis Funds voted proxies relating to portfolio securities during the most recent 12-month period ended June 30 is available from the Natixis Funds’ website and the SEC’s website.
QUARTERLY PORTFOLIO SCHEDULES
The Natixis Funds file complete schedules of portfolio holdings with the SEC for the first and third quarters of each fiscal year as an exhibit on Form N-PORT. The Funds’ Forms N-PORT are available on the SEC’s website at www.sec.gov.
CFA® and Chartered Financial Analyst® are registered trademarks owned by the CFA
Institute.
| 14
Table of Contents
UNDERSTANDING YOUR FUND’S EXPENSES
As a mutual fund shareholder, you incur different types of costs: transaction costs, including sales charges (loads) on purchases and contingent deferred sales charges on redemptions; and ongoing costs, including management fees, distribution fees (12b-1 fees) and/or service fees, and other fund expenses. Certain exemptions may apply. These costs are described in more detail in the Funds’ prospectuses. The following examples are intended to help you understand the ongoing costs of investing in the Funds and help you compare these with the ongoing costs of investing in other mutual funds.
The first line in the table for each class of Fund shares shows the actual account values and actual Fund expenses you would have paid on a $1,000 investment in the Fund from April 1, 2019 through September 30, 2019. To estimate the expenses you paid over the period, simply divide your account value by $1,000 (for example $8,600 account value divided by $1,000 = 8.6) and multiply the result by the number in the Expenses Paid During Period column as shown below for your class.
The second line in the table for each class of Fund shares provides information about hypothetical account values and hypothetical expenses based on the Fund’s actual expense ratios and an assumed rate of return of 5% per year before expenses, which is not the Fund’s actual return. The hypothetical account values and expenses may not be used to estimate the actual ending account balance or expenses you paid on your investment for the period. You may use this information to compare the ongoing costs of investing in the Fund to other funds. To do so, compare this 5% hypothetical example with the 5% hypothetical examples that appear in the shareholder reports of the other funds.
Please note that the expenses shown reflect ongoing costs only, and do not include any transaction costs, such as sales charges. Therefore, the second line in the table of each fund is useful in comparing ongoing costs only, and will not help you determine the relative costs of owning different funds. If transaction costs were included, total costs would be higher.
15 |
Table of Contents
| LOOMIS SAYLES GROWTH FUND | BEGINNING ACCOUNT VALUE 4/1/2019 | ENDING ACCOUNT VALUE 9/30/2019 | EXPENSES PAID DURING PERIOD* 4/1/2019 – 9/30/2019 | |||||||||
| Class A | ||||||||||||
| Actual | $1,000.00 | $1,034.20 | $4.59 | |||||||||
| Hypothetical (5% return before expenses) | $1,000.00 | $1,020.56 | $4.56 | |||||||||
| Class C | ||||||||||||
| Actual | $1,000.00 | $1,030.50 | $8.40 | |||||||||
| Hypothetical (5% return before expenses) | $1,000.00 | $1,016.80 | $8.34 | |||||||||
| Class N | ||||||||||||
| Actual | $1,000.00 | $1,036.20 | $2.86 | |||||||||
| Hypothetical (5% return before expenses) | $1,000.00 | $1,022.26 | $2.84 | |||||||||
| Class Y | ||||||||||||
| Actual | $1,000.00 | $1,035.60 | $3.32 | |||||||||
| Hypothetical (5% return before expenses) | $1,000.00 | $1,021.81 | $3.29 | |||||||||
| * | Expenses are equal to the Fund’s annualized expense ratio: 0.90%, 1.65%, 0.56% and 0.65% for Class A, C, N and Y, respectively, multiplied by the average account value over the period, multiplied by the number of days in the most recent fiscal half-year (183), divided by 365 (to reflect the half-year period). |
| 16
Table of Contents
| LOOMIS SAYLES STRATEGIC INCOME FUND | BEGINNING ACCOUNT VALUE 4/1/2019 | ENDING ACCOUNT VALUE 9/30/2019 | EXPENSES PAID DURING PERIOD* 4/1/2019 – 9/30/2019 | |||||||||
| Class A | ||||||||||||
| Actual | $1,000.00 | $1,030.10 | $4.89 | |||||||||
| Hypothetical (5% return before expenses) | $1,000.00 | $1,020.26 | $4.86 | |||||||||
| Class C | ||||||||||||
| Actual | $1,000.00 | $1,026.50 | $8.69 | |||||||||
| Hypothetical (5% return before expenses) | $1,000.00 | $1,016.50 | $8.64 | |||||||||
| Class N | ||||||||||||
| Actual | $1,000.00 | $1,032.60 | $3.21 | |||||||||
| Hypothetical (5% return before expenses) | $1,000.00 | $1,021.91 | $3.19 | |||||||||
| Class Y | ||||||||||||
| Actual | $1,000.00 | $1,031.40 | $3.62 | |||||||||
| Hypothetical (5% return before expenses) | $1,000.00 | $1,021.51 | $3.60 | |||||||||
| Admin Class | ||||||||||||
| Actual | $1,000.00 | $1,028.90 | $6.15 | |||||||||
| Hypothetical (5% return before expenses) | $1,000.00 | $1,019.00 | $6.12 | |||||||||
| * | Expenses are equal to the Fund’s annualized expense ratio: 0.96%, 1.71%, 0.63%, 0.71% and 1.21% for Class A, C, N, Y and Admin Class, respectively, multiplied by the average account value over the period, multiplied by the number of days in the most recent fiscal half-year (183), divided by 365 (to reflect the half-year period). |
17 |
Table of Contents
BOARD APPROVAL OF THE EXISTING ADVISORY AGREEMENTS
The Board of Trustees of the Trust (the “Board”), including the Independent Trustees, considers matters bearing on each Fund’s advisory agreement (collectively, the “Agreements”) at most of its meetings throughout the year. Each year, usually in the spring, the Contract Review Committee of the Board meets to review the Agreements to determine whether to recommend that the full Board approve the continuation of the Agreements, typically for an additionalone-year period. After the Contract Review Committee has made its recommendation, the full Board, including the Independent Trustees, determines whether to approve the continuation of the Agreements.
In connection with these meetings, the Trustees receive materials that the Funds’ investment adviser (the “Adviser”) believes to be reasonably necessary for the Trustees to evaluate the Agreements. These materials generally include, among other items, (i) information on the investment performance of the Funds and the performance of peer groups of funds and the Funds’ performance benchmarks, (ii) information on the Funds’ advisory fees and other expenses, including information comparing the Funds’ advisory fees to the fees charged to institutional accounts with similar strategies managed by the Adviser, if any, and to those of peer groups of funds and information about any applicable expense caps and/or fee “breakpoints,” (iii) sales and redemption data in respect of the Funds, (iv) information about the profitability of the Agreements to the Adviser and (v) information obtained through the completion by the Adviser of a questionnaire distributed on behalf of the Trustees. The Board, including the Independent Trustees, also considers other matters such as (i) each Fund’s investment objective and strategies and the size, education and experience of the Adviser’s investment staff and its use of technology, external research and trading cost measurement tools, (ii) arrangements in respect of the distribution of the Funds’ shares and the related costs, (iii) the allocation of the Funds’ brokerage, if any, including, to the extent applicable, the use of “soft” commission dollars to pay for research and other similar services, (iv) the Adviser’s policies and procedures relating to, among other things, compliance, trading and best execution, proxy voting and valuation, (v) information about amounts invested by the Funds’ portfolio managers in the Funds or in similar accounts that they manage and (vi) the general economic outlook with particular emphasis on the mutual fund industry. Throughout the process, the Trustees are afforded the opportunity to ask questions of and request additional materials from the Adviser.
In addition to the materials requested by the Trustees in connection with their annual consideration of the continuation of the Agreements, the Trustees receive materials in advance of each regular quarterly meeting of the Board that provide detailed information about the Funds’ investment performance and the fees charged to the Funds for advisory and other services. This information generally includes, among other things, an internal performance rating for each Fund based on agreed-upon criteria, graphs showing each Fund’s performance and expense differentials against each Fund’s peer group/category of funds, performance ratings provided by a third-party, total return information for various periods, and third-party performance rankings for various periods comparing a Fund against similarly categorized funds. The portfolio management team for each Fund or other
| 18
Table of Contents
representatives of the Adviser make periodic presentations to the Contract Review Committee and/or the full Board, and Funds identified as presenting possible performance concerns may be subject to more frequent Board or Committee presentations and reviews. In addition, each quarter the Trustees are provided with detailed statistical information about each Fund’s portfolio. The Trustees also receive periodic updates between meetings.
The Board most recently approved the continuation of the Agreements for a one year period at its meeting held in June 2019. In considering whether to approve the continuation of the Agreements, the Board, including the Independent Trustees, did not identify any single factor as determinative. Individual Trustees may have evaluated the information presented differently from one another, giving different weights to various factors. Matters considered by the Trustees, including the Independent Trustees, in connection with their approval of the Agreements included, but were not limited to, the factors listed below.
The nature, extent and quality of the services provided to the Funds under the Agreements. The Trustees considered the nature, extent and quality of the services provided by the Adviser and its affiliates to the Funds and the resources dedicated to the Funds by the Adviser and its affiliates.
The Trustees considered not only the advisory services provided by the Adviser to the Funds, but also the monitoring and oversight services provided by Natixis Advisors, L.P. (“Natixis Advisors”). They also considered the administrative and shareholder services provided by Natixis Advisors and its affiliates to the Funds.
For each Fund, the Trustees also considered the benefits to shareholders of investing in a mutual fund that is part of a family of funds that offers shareholders the right to exchange shares of one type of fund for shares of another type of fund, and provides a variety of fund and shareholder services.
After reviewing these and related factors, the Trustees concluded, within the context of their overall conclusions regarding each of the Agreements, that the nature, extent and quality of services provided supported the renewal of the Agreements.
Investment performance of the Funds and the Adviser. As noted above, the Trustees received information about the performance of the Funds over various time periods, including information that compared the performance of the Funds to the performance of peer groups and categories of funds and the Funds’ respective performance benchmarks. In addition, the Trustees reviewed data prepared by an independent third party that analyzed the performance of the Funds using a variety of performance metrics, including metrics that measured the performance of the Funds on a risk adjusted basis.
The Board noted that, through December 31, 2018, each Fund’sone-, three- and five-year performance stated as percentile rankings within categories selected by the independent third-party data provider was as follows (where the best performance would be in the first percentile of its category):
One-Year | Three-Year | Five-Year | ||||||||||
Loomis Sayles Growth Fund | 62 | % | 19 | % | 9 | % | ||||||
Loomis Sayles Strategic Income Fund | 75 | % | 53 | % | 74 | % | ||||||
19 |
Table of Contents
In the case of each Fund that had performance that lagged that of a relevant category median as determined by the independent third party for certain (although not necessarily all) periods, the Board concluded that other factors relevant to performance supported renewal of the Agreements. These factors included one or more of the following: (1) that the underperformance was attributable, to a significant extent, to investment decisions (such as security selection or sector allocation) by the Adviser that were reasonable and consistent with the Fund’s investment objective and policies; (2) that the Fund’s more recent performance had shown improvement relative to its category; and (3) that the Fund’s long-term performance was strong.
The Trustees also considered the Adviser’s performance and reputation generally, the performance of the fund family generally, and the historical responsiveness of the Adviser to Trustee concerns about performance and the willingness of the Adviser to take steps intended to improve performance.
After reviewing these and related factors, the Trustees concluded, within the context of their overall conclusions regarding each of the Agreements, that the performance of the Funds and the Adviser and/or other relevant factors supported the renewal of the Agreements.
The costs of the services to be provided and profits to be realized by the Adviser and its affiliates from their respective relationships with the Funds. The Trustees considered the fees charged to the Funds for advisory and administrative services as well as the total expense levels of the Funds. This information included comparisons (provided both by management and by an independent third party) of the Funds’ advisory fees and total expense levels to those of their peer groups and information about the advisory fees charged by the Adviser to comparable accounts (such as institutional separate accounts), as well as information about differences in such fees and the reasons for any such differences. In considering the fees charged to comparable accounts, the Trustees considered, among other things, management’s representations about the differences between managing mutual funds as compared to other types of accounts, including the additional resources required to effectively manage mutual fund assets and the greater regulatory costs associated with the management of such assets. In evaluating each Fund’s advisory fee, the Trustees also took into account the demands, complexity and quality of the investment management of such Fund, as well as the need for the Adviser to offer competitive compensation and the potential need to expend additional resources to the extent the Fund grows in size. The Trustees considered that over the past several years, management had made recommendations regarding reductions in advisory fee rates, implementation of advisory fee breakpoints and the institution of advisory fee waivers and expense caps for various funds in the fund family. They noted that both of the Funds have expense caps in place. The Trustees also considered that the current expenses for each Fund were below their caps. The Trustees further noted that Loomis Sayles Growth Fund’s total advisory fee rate was below the median of a peer group of funds.
The Trustees noted that Loomis Sayles Strategic Income Fund had an advisory fee rate that was above the median of a peer group of funds. In this regard, the Trustees considered the factors that management believed justified such relatively higher advisory fee rate, including that the advisory fee rate was only one basis point above the peer group median.
| 20
Table of Contents
The Trustees also considered the compensation directly or indirectly received by the Adviser and its affiliates from their relationships with the Funds. The Trustees reviewed information provided by management as to the profitability of the Adviser’s and its affiliates’ relationships with the Funds, and information about the allocation of expenses used to calculate profitability. They also reviewed information provided by management about the effect of distribution costs and changes in asset levels on Adviser profitability, including information regarding resources spent on distribution activities. When reviewing profitability, the Trustees also considered information about court cases in which adviser compensation or profitability were issues, the performance of the Funds, the expense levels of the Funds, whether the Adviser had implemented breakpoints and/or expense caps with respect to such Funds and the overall profit margin of Natixis Investment Managers compared to that of certain other investment managers for which such data was available.
After reviewing these and related factors, the Trustees concluded, within the context of their overall conclusions regarding each of the Agreements, that the advisory fee charged to each of the Funds was fair and reasonable, and that the costs of these services generally and the related profitability of the Adviser and its affiliates in respect of their relationships with the Funds supported the renewal of the Agreements.
Economies of Scale. The Trustees considered the existence of any economies of scale in the provision of services by the Adviser and whether those economies are shared with the Funds through breakpoints in their investment advisory fees or other means, such as expense caps. The Trustees also considered management’s explanation of the factors that are taken into account with respect to the implementation of breakpoints in investment advisory fees or expense caps. With respect to economies of scale, the Trustees noted that Loomis Sayles Strategic Income Fund had breakpoints in its advisory fee and that each of the Funds was subject to an expense cap. In considering these issues, the Trustees also took note of the costs of the services provided (both on an absolute and on a relative basis) and the profitability to the Adviser and its affiliates of their relationships with the Funds, as discussed above. The Trustees also considered that the Funds have benefitted from the substantial reinvestment the Adviser has made into its business.
After reviewing these and related factors, the Trustees concluded, within the context of their overall conclusions regarding each of the Agreements, that the extent to which economies of scale were shared with the Funds supported the renewal of the Agreements.
The Trustees also considered other factors, which included but were not limited to the following:
| · | The effect of recent market and economic events on the performance, asset levels and expense ratios of each Fund. |
| · | Whether each Fund has operated in accordance with its investment objective and the Fund’s record of compliance with its investment restrictions, and the compliance programs of the Funds and the Adviser. They also considered the compliance-related resources the Adviser and its affiliates were providing to the Funds. |
| · | So-called “fallout benefits” to the Adviser, such as the engagement of affiliates of the Adviser to provide distribution and administrative services to the Funds, and the benefits of research made available to the Adviser by reason of brokerage commissions |
21 |
Table of Contents
(if any) generated by the Funds’ securities transactions. The Trustees also considered the benefits to the parent company of Natixis Advisors from the retention of the Adviser. The Trustees considered the possible conflicts of interest associated with these fallout and other benefits, and the reporting, disclosure and other processes in place to disclose and monitor such possible conflicts of interest. |
| · | The Trustees’ review and discussion of the Funds’ advisory arrangements in prior years, and management’s record of responding to Trustee concerns raised during the year and in prior years. |
Based on their evaluation of all factors that they deemed to be material, including those factors described above, and assisted by the advice of independent counsel, the Trustees, including the Independent Trustees, concluded that each of the existing Agreements should be continued through June 30, 2020.
| 22
Table of Contents
Portfolio of Investments – as of September 30, 2019
Loomis Sayles Growth Fund
| Shares | Description | Value (†) | ||||||
| Common Stocks — 98.6% of Net Assets | ||||||||
| Air Freight & Logistics — 2.8% | ||||||||
| 3,309,475 | Expeditors International of Washington, Inc. | $ | 245,860,898 | |||||
|
| |||||||
| Beverages — 6.2% | ||||||||
| 4,407,982 | Coca-Cola Co. (The) | 239,970,540 | ||||||
| 5,229,306 | Monster Beverage Corp.(a) | 303,613,506 | ||||||
|
| |||||||
| 543,584,046 | ||||||||
|
| |||||||
| Biotechnology — 4.1% | ||||||||
| 763,471 | Amgen, Inc. | 147,739,273 | ||||||
| 781,642 | Regeneron Pharmaceuticals, Inc.(a) | 216,827,491 | ||||||
|
| |||||||
| 364,566,764 | ||||||||
|
| |||||||
| Capital Markets — 4.0% | ||||||||
| 607,414 | FactSet Research Systems, Inc. | 147,583,380 | ||||||
| 3,424,982 | SEI Investments Co. | 202,947,308 | ||||||
|
| |||||||
| 350,530,688 | ||||||||
|
| |||||||
| Communications Equipment — 2.8% | ||||||||
| 5,041,224 | Cisco Systems, Inc. | 249,086,878 | ||||||
|
| |||||||
| Consumer Finance — 1.0% | ||||||||
| 715,026 | American Express Co. | 84,573,275 | ||||||
|
| |||||||
| Energy Equipment & Services — 1.3% | ||||||||
| 3,359,778 | Schlumberger Ltd. | 114,803,614 | ||||||
|
| |||||||
| Food Products — 3.0% | ||||||||
| 15,072,505 | Danone S.A., Sponsored ADR | 264,222,520 | ||||||
|
| |||||||
| Health Care Equipment & Supplies — 1.5% | ||||||||
| 322,719 | Alcon, Inc.(a) | 18,811,291 | ||||||
| 979,144 | Varian Medical Systems, Inc.(a) | 116,606,259 | ||||||
|
| |||||||
| 135,417,550 | ||||||||
|
| |||||||
| Health Care Technology — 2.3% | ||||||||
| 2,980,951 | Cerner Corp. | 203,211,430 | ||||||
|
| |||||||
| Hotels, Restaurants & Leisure — 6.8% | ||||||||
| 3,232,576 | Starbucks Corp. | 285,824,370 | ||||||
| 2,906,055 | Yum China Holdings, Inc. | 132,022,079 | ||||||
| 1,615,086 | Yum! Brands, Inc. | 183,199,205 | ||||||
|
| |||||||
| 601,045,654 | ||||||||
|
| |||||||
| Household Products — 5.5% | ||||||||
| 2,389,416 | Colgate-Palmolive Co. | 175,645,970 | ||||||
| 2,506,223 | Procter & Gamble Co. (The) | 311,724,017 | ||||||
|
| |||||||
| 487,369,987 | ||||||||
|
| |||||||
| Interactive Media & Services — 10.8% | ||||||||
| 196,777 | Alphabet, Inc., Class A(a) | 240,292,266 | ||||||
| 196,505 | Alphabet, Inc., Class C(a) | 239,539,595 | ||||||
| 2,688,707 | Facebook, Inc., Class A(a) | 478,804,942 | ||||||
|
| |||||||
| 958,636,803 | ||||||||
|
| |||||||
See accompanying notes to financial statements.
23 |
Table of Contents
Portfolio of Investments – as of September 30, 2019
Loomis Sayles Growth Fund – (continued)
| Shares | Description | Value (†) | ||||||
| Internet & Direct Marketing Retail — 11.0% | ||||||||
| 2,581,862 | Alibaba Group Holding Ltd., Sponsored ADR(a) | $ | 431,764,782 | |||||
| 312,369 | Amazon.com, Inc.(a) | 542,244,471 | ||||||
|
| |||||||
| 974,009,253 | ||||||||
|
| |||||||
| IT Services — 7.8% | ||||||||
| 567,713 | Automatic Data Processing, Inc. | 91,640,232 | ||||||
| 3,463,460 | Visa, Inc., Class A | 595,749,755 | ||||||
|
| |||||||
| 687,389,987 | ||||||||
|
| |||||||
| Machinery — 2.7% | ||||||||
| 1,426,215 | Deere & Co. | 240,573,946 | ||||||
|
| |||||||
| Pharmaceuticals — 6.4% | ||||||||
| 1,329,887 | Merck & Co., Inc. | 111,949,887 | ||||||
| 1,613,583 | Novartis AG, Sponsored ADR | 140,220,363 | ||||||
| 4,752,501 | Novo Nordisk AS, Sponsored ADR | 245,704,302 | ||||||
| 1,883,834 | Roche Holding AG, Sponsored ADR | 68,665,749 | ||||||
|
| |||||||
| 566,540,301 | ||||||||
|
| |||||||
| Semiconductors & Semiconductor Equipment — 5.7% | ||||||||
| 1,239,392 | NVIDIA Corp. | 215,740,966 | ||||||
| 3,761,219 | QUALCOMM, Inc. | 286,905,785 | ||||||
|
| |||||||
| 502,646,751 | ||||||||
|
| |||||||
| Software — 12.9% | ||||||||
| 2,341,117 | Autodesk, Inc.(a) | 345,782,981 | ||||||
| 2,535,183 | Microsoft Corp. | 352,466,492 | ||||||
| 7,970,169 | Oracle Corp. | 438,598,400 | ||||||
|
| |||||||
| 1,136,847,873 | ||||||||
|
| |||||||
| Total Common Stocks (Identified Cost $6,145,603,822) | 8,710,918,218 | |||||||
|
| |||||||
| Principal Amount | ||||||||
| Short-Term Investments — 1.8% | ||||||||
| $ | 155,199,792 | Tri-Party Repurchase Agreement with Fixed Income Clearing Corporation, dated 9/30/2019 at 1.100% to be repurchased at $155,204,534 on 10/01/2019 collateralized by $147,170,000 U.S. Treasury Note, 2.875% due 7/31/2025 valued at $158,304,735 including accrued interest (Note 2 of Notes to Financial Statements) (Identified Cost $155,199,792) | 155,199,792 | |||||
|
| |||||||
| Total Investments — 100.4% (Identified Cost $6,300,803,614) | 8,866,118,010 | |||||||
| Other assets less liabilities — (0.4)% | (35,101,262 | ) | ||||||
|
| |||||||
| Net Assets — 100.0% | $ | 8,831,016,748 | ||||||
|
| |||||||
| (†) | See Note 2 of Notes to Financial Statements. |
| ||||||
| (a) | Non-income producing security. |
| ||||||
See accompanying notes to financial statements.
| 24
Table of Contents
Portfolio of Investments – as of September 30, 2019
Loomis Sayles Growth Fund – (continued)
| ADR | An American Depositary Receipt is a certificate issued by a custodian bank representing the right to receive securities of the foreign issuer described. The values of ADRs may be significantly influenced by trading on exchanges not located in the United States. |
| ||||||
Industry Summary at September 30, 2019
Software | 12.9 | % | ||
Internet & Direct Marketing Retail | 11.0 | |||
Interactive Media & Services | 10.8 | |||
IT Services | 7.8 | |||
Hotels, Restaurants & Leisure | 6.8 | |||
Pharmaceuticals | 6.4 | |||
Beverages | 6.2 | |||
Semiconductors & Semiconductor Equipment | 5.7 | |||
Household Products | 5.5 | |||
Biotechnology | 4.1 | |||
Capital Markets | 4.0 | |||
Food Products | 3.0 | |||
Communications Equipment | 2.8 | |||
Air Freight & Logistics | 2.8 | |||
Machinery | 2.7 | |||
Health Care Technology | 2.3 | |||
Other Investments, less than 2% each | 3.8 | |||
Short-Term Investments | 1.8 | |||
|
| |||
Total Investments | 100.4 | |||
Other assets less liabilities | (0.4 | ) | ||
|
| |||
Net Assets | 100.0 | % | ||
|
|
See accompanying notes to financial statements.
25 |
Table of Contents
Portfolio of Investments – as of September 30, 2019
Loomis Sayles Strategic Income Fund
| Principal Amount (‡) | Description | Value (†) | ||||||
| Bonds and Notes — 66.3% of Net Assets | ||||||||
| Non-Convertible Bonds — 59.9% | ||||||||
| ABS Other — 0.4% | ||||||||
| $ | 22,212,163 | GCA2014 Holdings Ltd., Series2014-1, Class C, 6.000%, 1/05/2030, 144A(a)(b)(c)(d) | $ | 18,036,277 | ||||
| 9,682,403 | GCA2014 Holdings Ltd., Series2014-1, Class D, 7.500%, 1/05/2030, 144A(a)(b)(c)(d) | 5,315,639 | ||||||
| 42,000,000 | GCA2014 Holdings Ltd., Series2014-1, Class E, Zero Coupon, 1/05/2030, 144A(a)(b)(c)(d)(e) | — | ||||||
| 7,934,488 | Global Container Assets Ltd., Series2015-1A, Class B, 4.500%, 2/05/2030, 144A(c)(f) | 7,833,190 | ||||||
|
| |||||||
| 31,185,106 | ||||||||
|
| |||||||
| Aerospace & Defense — 1.2% | ||||||||
| 620,000 | Bombardier, Inc., 7.350%, 12/22/2026, 144A, (CAD) | 461,215 | ||||||
| 10,225,000 | Bombardier, Inc., 7.450%, 5/01/2034, 144A | 9,892,688 | ||||||
| 3,700,000 | Bombardier, Inc., 7.875%, 4/15/2027, 144A | 3,684,645 | ||||||
| 3,145,000 | Embraer Netherlands Finance BV, 5.400%, 2/01/2027 | 3,557,813 | ||||||
| 9,576,000 | Leonardo U.S. Holdings, Inc., 6.250%, 1/15/2040, 144A | 10,559,455 | ||||||
| 8,815,000 | Leonardo U.S. Holdings, Inc., 7.375%, 7/15/2039, 144A | 10,401,700 | ||||||
| 5,310,000 | Textron Financial Corp.,3-month LIBOR + 1.735%, 3.893%, 2/15/2067, 144A(g) | 4,015,794 | ||||||
| 24,513,000 | TransDigm, Inc., 6.500%, 7/15/2024 | 25,279,031 | ||||||
| 17,765,000 | TransDigm, Inc., 6.500%, 5/15/2025 | 18,431,187 | ||||||
|
| |||||||
| 86,283,528 | ||||||||
|
| |||||||
| Airlines — 3.0% | ||||||||
| 20,000,000 | American Airlines Group, Inc., 5.000%, 6/01/2022, 144A | 20,767,000 | ||||||
| 130,040,000 | American Airlines Group, Inc., 5.500%, 10/01/2019, 144A | 130,040,000 | ||||||
| 1,778,221 | American Airlines Pass Through Certificates, Series2016-3, Class B, 3.750%, 4/15/2027 | 1,806,104 | ||||||
| 1,049,908 | American Airlines Pass Through Certificates, Series2017-2, Class B, 3.700%, 4/15/2027 | 1,055,709 | ||||||
| 8,502,577 | American Airlines Pass Through Certificates, Series2013-1, Class A, 4.000%, 1/15/2027 | 8,969,454 | ||||||
| 1,559,697 | Continental Airlines Pass Through Certificates, Series2012-1, Class B, 6.250%, 10/11/2021 | 1,578,507 | ||||||
| 1,640,326 | Continental Airlines Pass Through Certificates, Series2012-2, Class B, 5.500%, 4/29/2022 | 1,671,558 | ||||||
| 930 | Continental Airlines Pass Through Trust, Series1999-2, Class B, 7.566%, 9/15/2021 | 940 | ||||||
| 193,163 | Continental Airlines Pass Through Trust, Series2001-1,Class A-1, 6.703%, 12/15/2022 | 205,115 | ||||||
| 301,407 | Northwest Airlines Pass Through Trust, Series2002-1, Class G2, (MBIA Insured), 6.264%, 5/20/2023 | 309,906 | ||||||
| 48,950,000 | Virgin Australia Holdings Ltd., 8.500%, 11/15/2019, 144A | 49,023,425 | ||||||
|
| |||||||
| 215,427,718 | ||||||||
|
| |||||||
See accompanying notes to financial statements.
| 26
Table of Contents
Portfolio of Investments – as of September 30, 2019
Loomis Sayles Strategic Income Fund – (continued)
| Principal Amount (‡) | Description | Value (†) | ||||||
| Automotive — 1.0% | ||||||||
| $ | 1,210,000 | Allison Transmission, Inc., 4.750%, 10/01/2027, 144A | $ | 1,241,763 | ||||
| 12,740,000 | Delphi Technologies PLC, 5.000%, 10/01/2025, 144A | 11,274,900 | ||||||
| 1,220,000 | Ford Motor Co., 6.625%, 2/15/2028 | 1,318,796 | ||||||
| 1,345,000 | Ford Motor Co., 7.500%, 8/01/2026 | 1,539,172 | ||||||
| 18,565,000 | Ford Motor Credit Co. LLC, 5.596%, 1/07/2022 | 19,504,844 | ||||||
| 9,545,000 | Goodyear Tire & Rubber Co. (The), 4.875%, 3/15/2027 | 9,412,324 | ||||||
| 4,977,000 | Goodyear Tire & Rubber Co. (The), 7.000%, 3/15/2028 | 5,350,275 | ||||||
| 26,055,000 | Midas Intermediate Holdco II LLC/Midas Intermediate Holdco II Finance, Inc., 7.875%, 10/01/2022, 144A | 24,166,012 | ||||||
|
| |||||||
| 73,808,086 | ||||||||
|
| |||||||
| Banking — 5.0% | ||||||||
| 6,000,000 | Ally Financial, Inc., 8.000%, 11/01/2031 | 8,295,000 | ||||||
| 983,000 | Bank of America Corp., (fixed rate to 12/20/2027, variable rate thereafter), 3.419%, 12/20/2028 | 1,026,646 | ||||||
| 265,000 | Bank of America Corp., MTN, 4.250%, 10/22/2026 | 286,122 | ||||||
| 7,045,000 | Bank of America Corp., Series L, MTN, 4.183%, 11/25/2027 | 7,605,191 | ||||||
| 36,445,000 | Citigroup, Inc., 5.130%, 11/12/2019, (NZD) | 22,910,592 | ||||||
| 3,450,000 | Cooperatieve Rabobank UA, 3.950%, 11/09/2022 | 3,593,242 | ||||||
| 1,709,000 | Deutsche Bank AG, (fixed rate to 12/01/2027, variable rate thereafter), 4.875%, 12/01/2032 | 1,547,294 | ||||||
| 25,000,000 | Goldman Sachs Group, Inc. (The), 3.550%, 2/12/2021, (CAD) | 19,180,096 | ||||||
| 19,245,000 | Intesa Sanpaolo SpA, 5.017%, 6/26/2024, 144A | 19,803,883 | ||||||
| 36,195,000 | Morgan Stanley, GMTN, 4.350%, 9/08/2026 | 39,196,485 | ||||||
| 185,000,000 | Morgan Stanley, GMTN, 5.000%, 9/30/2021, (AUD) | 133,060,073 | ||||||
| 46,735,000 | Morgan Stanley, MTN, 4.100%, 5/22/2023 | 49,215,227 | ||||||
| 10,000,000 | Morgan Stanley, MTN, 6.250%, 8/09/2026 | 12,124,614 | ||||||
| 53,095,000 | Morgan Stanley, Series MPLE, 3.125%, 8/05/2021, (CAD) | 40,719,058 | ||||||
|
| |||||||
| 358,563,523 | ||||||||
|
| |||||||
| Brokerage — 1.2% | ||||||||
| 1,675,000 | Jefferies Finance LLC/JFINCo-Issuer Corp., 7.250%, 8/15/2024, 144A | 1,668,719 | ||||||
| 43,025,000 | Jefferies Group LLC, 5.125%, 1/20/2023 | 46,300,575 | ||||||
| 14,755,000 | Jefferies Group LLC, 6.250%, 1/15/2036 | 17,003,294 | ||||||
| 15,215,000 | Jefferies Group LLC, 6.450%, 6/08/2027 | 17,630,741 | ||||||
|
| |||||||
| 82,603,329 | ||||||||
|
| |||||||
| Building Materials — 0.4% | ||||||||
| 5,565,000 | American Woodmark Corp., 4.875%, 3/15/2026, 144A | 5,606,737 | ||||||
| 3,255,000 | JELD-WEN, Inc., 4.875%, 12/15/2027, 144A | 3,222,450 | ||||||
| 1,859,000 | Masco Corp., 6.500%, 8/15/2032 | 2,279,251 | ||||||
| 195,000 | Masco Corp., 7.125%, 3/15/2020 | 198,862 | ||||||
| 1,226,000 | Masco Corp., 7.750%, 8/01/2029 | 1,570,532 | ||||||
| 10,800,000 | Owens Corning, 7.000%, 12/01/2036 | 13,244,854 | ||||||
|
| |||||||
| 26,122,686 | ||||||||
|
| |||||||
| Cable Satellite — 1.5% | ||||||||
| 850,000 | CCO Holdings LLC/CCO Holdings Capital Corp., 5.125%, 5/01/2023, 144A | 871,029 | ||||||
| 975,000 | CCO Holdings LLC/CCO Holdings Capital Corp., 5.375%, 5/01/2025, 144A | 1,011,562 | ||||||
See accompanying notes to financial statements.
27 |
Table of Contents
Portfolio of Investments – as of September 30, 2019
Loomis Sayles Strategic Income Fund – (continued)
| Principal Amount (‡) | Description | Value (†) | ||||||
| Cable Satellite — continued | ||||||||
| $ | 497,000 | CCO Holdings LLC/CCO Holdings Capital Corp., 5.750%, 1/15/2024 | $ | 508,183 | ||||
| 4,360,000 | CCO Holdings LLC/CCO Holdings Capital Corp., 5.875%, 5/01/2027, 144A | 4,610,700 | ||||||
| 17,880,000 | CSC Holdings LLC, 5.375%, 2/01/2028, 144A | 18,841,050 | ||||||
| 17,679,000 | DISH DBS Corp., 5.875%, 11/15/2024 | 17,524,309 | ||||||
| 4,865,000 | DISH DBS Corp., 7.750%, 7/01/2026 | 4,950,137 | ||||||
| 25,270,000 | Shaw Communications, Inc., 5.650%, 10/01/2019, (CAD) | 19,073,857 | ||||||
| 4,835,000 | Time Warner Cable LLC, 4.500%, 9/15/2042 | 4,757,871 | ||||||
| 135,000 | Time Warner Cable LLC, 5.875%, 11/15/2040 | 150,982 | ||||||
| 11,275,000 | Videotron Ltd., 5.625%, 6/15/2025, 144A, (CAD) | 9,140,592 | ||||||
| 18,245,000 | VTR Finance BV, 6.875%, 1/15/2024, 144A | 18,769,544 | ||||||
| 6,150,000 | Ziggo BV, 5.500%, 1/15/2027, 144A | 6,409,530 | ||||||
|
| |||||||
| 106,619,346 | ||||||||
|
| |||||||
| Chemicals — 1.8% | ||||||||
| 19,810,000 | Aruba Investments, Inc., 8.750%, 2/15/2023, 144A | 19,611,900 | ||||||
| 18,254,000 | Consolidated Energy Finance S.A., 6.500%, 5/15/2026, 144A | 17,706,380 | ||||||
| 90,205,000 | INVISTA Finance LLC, 4.250%, 10/15/2019, 144A | 90,249,651 | ||||||
|
| |||||||
| 127,567,931 | ||||||||
|
| |||||||
| Construction Machinery — 0.1% | ||||||||
| 1,310,000 | United Rentals North America, Inc., 4.875%, 1/15/2028 | 1,362,400 | ||||||
| 3,850,000 | United Rentals North America, Inc., 6.500%, 12/15/2026 | 4,194,575 | ||||||
|
| |||||||
| 5,556,975 | ||||||||
|
| |||||||
| Consumer Cyclical Services — 0.1% | ||||||||
| 5,500,000 | ServiceMaster Co. LLC (The), 7.450%, 8/15/2027 | 6,160,000 | ||||||
|
| |||||||
| Consumer Products — 0.2% | ||||||||
| 11,880,000 | Avon Products, Inc., 8.950%, 3/15/2043 | 13,305,600 | ||||||
|
| |||||||
| Electric — 1.2% | ||||||||
| 4,379,000 | AES Corp. (The), 4.875%, 5/15/2023 | 4,455,633 | ||||||
| 9,371,000 | AES Corp. (The), 5.500%, 4/15/2025 | 9,732,627 | ||||||
| 28,759,664 | Alta Wind Holdings LLC, 7.000%, 6/30/2035, 144A | 33,483,076 | ||||||
| 29,959,000 | EDP Finance BV, 4.125%, 1/15/2020, 144A | 30,033,897 | ||||||
| 3,570,000 | Empresa Nacional de Electricidad S.A., 7.875%, 2/01/2027 | 4,594,293 | ||||||
|
| |||||||
| 82,299,526 | ||||||||
|
| |||||||
| Finance Companies — 3.6% | ||||||||
| 1,020,000 | Antares Holdings LP, 6.000%, 8/15/2023, 144A | 1,056,716 | ||||||
| 22,945,000 | Navient Corp., 5.500%, 1/25/2023 | 23,690,712 | ||||||
| 2,260,000 | Navient Corp., 5.875%, 10/25/2024 | 2,276,950 | ||||||
| 109,950(††) | Navient Corp., 6.000%, 12/15/2043 | 2,553,864 | ||||||
| 47,944,000 | Navient Corp., MTN, 6.125%, 3/25/2024 | 49,727,037 | ||||||
| 6,490,000 | Navient Corp., MTN, 7.250%, 1/25/2022 | 6,992,975 | ||||||
| 53,465,000 | Navient Corp., Series A, MTN, 5.625%, 8/01/2033 | 45,144,777 | ||||||
| 4,360,000 | Quicken Loans, Inc., 5.250%, 1/15/2028, 144A | 4,499,520 | ||||||
| 23,115,000 | Springleaf Finance Corp., 6.875%, 3/15/2025 | 25,469,841 | ||||||
| 4,075,000 | Springleaf Finance Corp., 7.125%, 3/15/2026 | 4,520,499 | ||||||
| 26,970,000 | Springleaf Finance Corp., 7.750%, 10/01/2021 | 29,329,875 | ||||||
See accompanying notes to financial statements.
| 28
Table of Contents
Portfolio of Investments – as of September 30, 2019
Loomis Sayles Strategic Income Fund – (continued)
| Principal Amount (‡) | Description | Value (†) | ||||||
| Finance Companies — continued | ||||||||
| $ | 55,015,000 | Springleaf Finance Corp., 8.250%, 10/01/2023 | $ | 64,092,475 | ||||
|
| |||||||
| 259,355,241 | ||||||||
|
| |||||||
| Financial Other — 0.4% | ||||||||
| 25,465,000 | Nationstar Mortgage Holdings, Inc., 9.125%, 7/15/2026, 144A | 27,120,225 | ||||||
|
| |||||||
| Gaming — 0.1% | ||||||||
| 5,475,000 | International Game Technology PLC, 6.250%, 1/15/2027, 144A | 6,063,563 | ||||||
|
| |||||||
| Government Owned – No Guarantee — 0.1% | ||||||||
| 6,535,000 | Pertamina Persero PT, 6.450%, 5/30/2044, 144A | 8,404,529 | ||||||
|
| |||||||
| Healthcare — 4.1% | ||||||||
| 40,686,000 | HCA, Inc., 5.875%, 5/01/2023 | 44,754,600 | ||||||
| 14,620,000 | HCA, Inc., 7.050%, 12/01/2027 | 17,105,400 | ||||||
| 20,447,000 | HCA, Inc., 7.500%, 12/15/2023 | 23,156,227 | ||||||
| 24,215,000 | HCA, Inc., 7.500%, 11/06/2033 | 29,058,000 | ||||||
| 14,056,000 | HCA, Inc., 7.690%, 6/15/2025 | 16,902,340 | ||||||
| 32,745,000 | HCA, Inc., 8.360%, 4/15/2024 | 38,974,081 | ||||||
| 10,815,000 | HCA, Inc., MTN, 7.580%, 9/15/2025 | 12,761,700 | ||||||
| 9,492,000 | HCA, Inc., MTN, 7.750%, 7/15/2036 | 11,105,640 | ||||||
| 18,365,000 | Tenet Healthcare Corp., 5.125%, 5/01/2025 | 18,618,437 | ||||||
| 40,800,000 | Tenet Healthcare Corp., 6.750%, 6/15/2023 | 42,847,344 | ||||||
| 43,749,000 | Tenet Healthcare Corp., 6.875%, 11/15/2031 | 39,811,590 | ||||||
| 990,000 | Tenet Healthcare Corp., 8.125%, 4/01/2022 | 1,070,735 | ||||||
|
| |||||||
| 296,166,094 | ||||||||
|
| |||||||
| Home Construction — 0.9% | ||||||||
| 47,260,000 | PulteGroup, Inc., 6.000%, 2/15/2035 | 50,331,900 | ||||||
| 13,190,000 | PulteGroup, Inc., 6.375%, 5/15/2033 | 14,596,054 | ||||||
| 195,000 | TRI Pointe Group, Inc./TRI Pointe Homes, Inc., 5.875%, 6/15/2024 | 207,675 | ||||||
|
| |||||||
| 65,135,629 | ||||||||
|
| |||||||
| Independent Energy — 3.9% | ||||||||
| 4,810,000 | Antero Resources Corp., 5.625%, 6/01/2023 | 4,160,650 | ||||||
| 18,736,000 | Ascent Resources Utica Holdings LLC/ARU Finance Corp., 10.000%, 4/01/2022, 144A | 18,730,379 | ||||||
| 8,145,000 | Baytex Energy Corp., 5.125%, 6/01/2021, 144A | 7,961,737 | ||||||
| 8,225,000 | Baytex Energy Corp., 5.625%, 6/01/2024, 144A | 7,567,000 | ||||||
| 5,989,000 | Bellatrix Exploration Ltd., 8.500%, 9/11/2023(a)(b)(c)(d)(h) | 3,593,400 | ||||||
| 6,526,000 | Bellatrix Exploration Ltd., 9.500% PIK or 3.000% Cash, 12/15/2023(a)(b)(c)(d)(h)(i)(j) | — | ||||||
| 8,645,000 | California Resources Corp., 5.500%, 9/15/2021 | 4,257,663 | ||||||
| 1,188,000 | California Resources Corp., 6.000%, 11/15/2024(c)(f) | 450,858 | ||||||
| 67,805,000 | California Resources Corp., 8.000%, 12/15/2022, 144A | 33,563,475 | ||||||
| 1,310,000 | Chesapeake Energy Corp., 4.875%, 4/15/2022 | 1,057,825 | ||||||
| 21,335,000 | Chesapeake Energy Corp., 8.000%, 1/15/2025 | 15,414,537 | ||||||
| 50,375,000 | Chesapeake Energy Corp., 8.000%, 6/15/2027 | 34,265,075 | ||||||
| 15,215,000 | Continental Resources, Inc., 3.800%, 6/01/2024 | 15,504,915 | ||||||
| 5,450,000 | Continental Resources, Inc., 4.500%, 4/15/2023 | 5,657,960 | ||||||
| 302,000 | Continental Resources, Inc., 5.000%, 9/15/2022 | 304,649 | ||||||
See accompanying notes to financial statements.
29 |
Table of Contents
Portfolio of Investments – as of September 30, 2019
Loomis Sayles Strategic Income Fund – (continued)
| Principal Amount (‡) | Description | Value (†) | ||||||
| Independent Energy — continued | ||||||||
| $ | 1,522,000 | Halcon Resources Corp., 6.750%, 2/15/2025(c)(f)(j) | $ | 147,847 | ||||
| 15,580,000 | Lonestar Resources America, Inc., 11.250%, 1/01/2023, 144A | 13,314,668 | ||||||
| 180,000 | MEG Energy Corp., 6.375%, 1/30/2023, 144A | 173,700 | ||||||
| 12,740,000 | MEG Energy Corp., 7.000%, 3/31/2024, 144A | 12,294,100 | ||||||
| 19,290,000 | Montage Resources Corp., 8.875%, 7/15/2023 | 14,756,850 | ||||||
| 1,065,000 | Oasis Petroleum, Inc., 6.875%, 1/15/2023 | 974,475 | ||||||
| 540,000 | Occidental Petroleum Corp., 4.500%, 7/15/2044 | 550,740 | ||||||
| 4,780,000 | Pan American Energy LLC, 7.875%, 5/07/2021, 144A | 4,756,100 | ||||||
| 2,055,000 | QEP Resources, Inc., 5.250%, 5/01/2023 | 1,906,054 | ||||||
| 17,908,000 | Sanchez Energy Corp., 6.125%, 1/15/2023(c)(f)(j) | 1,127,130 | ||||||
| 9,520,000 | Sanchez Energy Corp., 7.750%, 6/15/2021(c)(f)(j) | 571,200 | ||||||
| 8,241,000 | SM Energy Co., 5.000%, 1/15/2024 | 7,396,297 | ||||||
| 15,904,000 | SM Energy Co., 6.125%, 11/15/2022 | 15,241,598 | ||||||
| 5,710,000 | SM Energy Co., 6.625%, 1/15/2027 | 4,924,875 | ||||||
| 95,000 | SM Energy Co., 6.750%, 9/15/2026 | 83,125 | ||||||
| 1,110,000 | Southwestern Energy Co., 6.200%, 1/23/2025 | 976,778 | ||||||
| 14,955,000 | Vine Oil & Gas LP/Vine Oil & Gas Finance Corp., 8.750%, 4/15/2023, 144A | 6,804,525 | ||||||
| 2,530,000 | Vine Oil & Gas LP/Vine Oil & Gas Finance Corp., 9.750%, 4/15/2023, 144A | 1,182,775 | ||||||
| 19,960,000 | Whiting Petroleum Corp., 5.750%, 3/15/2021 | 19,062,399 | ||||||
| 3,550,000 | Whiting Petroleum Corp., 6.250%, 4/01/2023 | 2,743,405 | ||||||
| 21,785,000 | Whiting Petroleum Corp., 6.625%, 1/15/2026 | 14,704,875 | ||||||
|
| |||||||
| 276,183,639 | ||||||||
|
| |||||||
| Life Insurance — 0.9% | ||||||||
| 3,575,000 | Brighthouse Financial, Inc., 4.700%, 6/22/2047 | 3,189,298 | ||||||
| 15,000,000 | Global Atlantic Fin Co., 8.625%, 4/15/2021, 144A | 16,207,984 | ||||||
| 20,000,000 | National Life Insurance Co., 10.500%, 9/15/2039, 144A(c)(f) | 33,909,559 | ||||||
| 8,920,000 | NLV Financial Corp., 7.500%, 8/15/2033, 144A(c)(f) | 12,131,031 | ||||||
|
| |||||||
| 65,437,872 | ||||||||
|
| |||||||
| Local Authorities — 0.9% | ||||||||
| 95,480,000 | New South Wales Treasury Corp., 4.000%, 4/08/2021, (AUD) | 67,475,877 | ||||||
|
| |||||||
| Media Entertainment — 0.3% | ||||||||
| 111,590,000 | Grupo Televisa SAB, EMTN, 7.250%, 5/14/2043, (MXN) | 4,215,698 | ||||||
| 17,950,000 | Outfront Media Capital LLC/Outfront Media Capital Corp., 5.875%, 3/15/2025 | 18,510,937 | ||||||
|
| |||||||
| 22,726,635 | ||||||||
|
| |||||||
| Metals & Mining — 1.0% | ||||||||
| 2,000,000 | AK Steel Corp., 7.625%, 10/01/2021 | 1,970,000 | ||||||
| 25,271,000 | ArcelorMittal, 6.750%, 3/01/2041 | 29,825,182 | ||||||
| 1,970,000 | Barrick North America Finance LLC, 5.750%, 5/01/2043 | 2,579,390 | ||||||
| 12,315,000 | First Quantum Minerals Ltd., 7.250%, 5/15/2022, 144A | 12,197,145 | ||||||
| 1,810,000 | First Quantum Minerals Ltd., 7.500%, 4/01/2025, 144A | 1,778,325 | ||||||
| 16,135,000 | Russel Metals, Inc., 6.000%, 4/19/2022, 144A, (CAD) | 12,285,301 | ||||||
| 10,158,000 | United States Steel Corp., 6.650%, 6/01/2037 | 7,796,265 | ||||||
|
| |||||||
| 68,431,608 | ||||||||
|
| |||||||
See accompanying notes to financial statements.
| 30
Table of Contents
Portfolio of Investments – as of September 30, 2019
Loomis Sayles Strategic Income Fund – (continued)
| Principal Amount (‡) | Description | Value (†) | ||||||
| Midstream — 0.6% | ||||||||
| $ | 8,935,000 | IFM U.S. Colonial Pipeline 2 LLC, 6.450%, 5/01/2021, 144A | $ | 9,294,707 | ||||
| 13,667,000 | NGL Energy Partners LP/NGL Energy Finance Corp., 6.125%, 3/01/2025 | 13,017,817 | ||||||
| 8,125,000 | NGL Energy Partners LP/NGL Energy Finance Corp., 7.500%, 11/01/2023 | 8,267,188 | ||||||
| 505,000 | NGPL PipeCo LLC, 7.768%, 12/15/2037, 144A | 654,125 | ||||||
| 11,980,000 | Summit Midstream Partners LP, Series A, (fixed rate to 12/15/2022, variable rate thereafter), 9.500%(c)(f)(k) | 8,610,266 | ||||||
|
| |||||||
| 39,844,103 | ||||||||
|
| |||||||
| Oil Field Services — 2.6% | ||||||||
| 7,120,000 | Global Marine, Inc., 7.000%, 6/01/2028 | 6,458,054 | ||||||
| 1,765,000 | Noble Holding International Ltd., 7.750%, 1/15/2024 | 1,147,250 | ||||||
| 19,385,000 | Noble Holding International Ltd., 7.875%, 2/01/2026, 144A | 13,957,200 | ||||||
| 18,385,000 | Pioneer Energy Services Corp., 6.125%, 3/15/2022(c)(f) | 6,434,750 | ||||||
| 12,020,000 | Precision Drilling Corp., 5.250%, 11/15/2024 | 10,547,550 | ||||||
| 280,481 | Precision Drilling Corp., 6.500%, 12/15/2021 | 274,871 | ||||||
| 2,080,000 | Shelf Drilling Holdings Ltd., 8.250%, 2/15/2025, 144A | 1,768,000 | ||||||
| 66,903,750 | Transocean Proteus Ltd., 6.250%, 12/01/2024, 144A | 67,907,306 | ||||||
| 39,300,000 | Transocean, Inc., 5.800%, 10/15/2022 | 38,219,250 | ||||||
| 46,390,000 | Transocean, Inc., 6.800%, 3/15/2038 | 28,529,850 | ||||||
| 2,770,000 | Transocean, Inc., 7.500%, 4/15/2031 | 1,952,850 | ||||||
| 11,165,000 | Valaris PLC, 7.750%, 2/01/2026 | 6,294,157 | ||||||
|
| |||||||
| 183,491,088 | ||||||||
|
| |||||||
| Paper — 0.6% | ||||||||
| 15,225,000 | Georgia-Pacific LLC, 7.750%, 11/15/2029 | 21,732,941 | ||||||
| 4,865,000 | WestRock MWV LLC, 7.950%, 2/15/2031 | 6,729,819 | ||||||
| 8,750,000 | WestRock MWV LLC, 8.200%, 1/15/2030 | 11,978,696 | ||||||
| 2,840,000 | Weyerhaeuser Co., 6.950%, 10/01/2027 | 3,629,858 | ||||||
|
| |||||||
| 44,071,314 | ||||||||
|
| |||||||
| Property & Casualty Insurance — 0.1% | ||||||||
| 12,510,000 | MBIA Insurance Corp.,3-month LIBOR + 11.260%, 13.563%, 1/15/2033, 144A(e)(g) | 8,835,188 | ||||||
|
| |||||||
| Retailers — 0.7% | ||||||||
| 3,325,000 | Dillard’s, Inc., 7.000%, 12/01/2028 | 3,656,403 | ||||||
| 1,500,000 | Dillard’s, Inc., 7.750%, 7/15/2026 | 1,680,615 | ||||||
| 27,224,000 | J.C. Penney Corp., Inc., 6.375%, 10/15/2036(c)(f) | 8,834,732 | ||||||
| 2,510,000 | J.C. Penney Corp., Inc., 7.625%, 3/01/2097(c)(f) | 715,350 | ||||||
| 6,365,000 | Marks & Spencer PLC, 7.125%, 12/01/2037, 144A | 7,247,471 | ||||||
| 28,455,000 | Michaels Stores, Inc., 8.000%, 7/15/2027, 144A | 28,490,569 | ||||||
|
| |||||||
| 50,625,140 | ||||||||
|
| |||||||
| Supermarkets — 0.3% | ||||||||
| 11,495,000 | Albertson’s Cos. LLC/Safeway, Inc./New Albertson’s, Inc./Albertson’s LLC, 5.750%, 3/15/2025 | 11,820,883 | ||||||
| 9,465,000 | Albertson’s Cos. LLC/Safeway, Inc./New Albertson’s, Inc./Albertson’s LLC, 6.625%, 6/15/2024 | 9,914,588 | ||||||
| 2,290,000 | Safeway, Inc., 7.250%, 2/01/2031 | 2,335,800 | ||||||
|
| |||||||
| 24,071,271 | ||||||||
|
| |||||||
See accompanying notes to financial statements.
31 |
Table of Contents
Portfolio of Investments – as of September 30, 2019
Loomis Sayles Strategic Income Fund – (continued)
| Principal Amount (‡) | Description | Value (†) | ||||||
| Technology — 1.5% | ||||||||
| $ | 23,345,000 | Iron Mountain, Inc., 4.875%, 9/15/2029, 144A | $ | 23,702,178 | ||||
| 56,340,000 | KLA Corp., 4.650%, 11/01/2024 | 62,032,869 | ||||||
| 15,170,000 | KLA Corp., 5.650%, 11/01/2034 | 18,037,483 | ||||||
| 135,000 | Samsung Electronics Co. Ltd., 7.700%, 10/01/2027, 144A | 162,965 | ||||||
| 3,355,000 | Seagate HDD Cayman, 4.875%, 6/01/2027 | 3,463,751 | ||||||
|
| |||||||
| 107,399,246 | ||||||||
|
| |||||||
| Transportation Services — 0.1% | ||||||||
| 10,503,000 | APL Ltd., 8.000%, 1/15/2024(c)(f) | 9,033,630 | ||||||
|
| |||||||
| Treasuries — 16.1% | ||||||||
| 312,000,000 | Canadian Government Bond, 0.750%, 9/01/2020, (CAD) | 233,402,423 | ||||||
| 1,605,660,000 | Central Bank of Iceland, 7.250%, 10/26/2022, (ISK) | 14,397,895 | ||||||
| 10,000,000(†††) | Mexican Fixed Rate Bonds, Series M, 5.750%, 3/05/2026, (MXN) | 47,961,386 | ||||||
| 9,930,439(†††) | Mexican Fixed Rate Bonds, Series M, 6.500%, 6/10/2021, (MXN) | 50,147,862 | ||||||
| 4,250,000(†††) | Mexican Fixed Rate Bonds, Series M, 7.750%, 5/29/2031, (MXN) | 22,818,283 | ||||||
| 27,224,481(†††) | Mexican Fixed Rate Bonds, Series M, 8.000%, 12/07/2023, (MXN) | 144,435,708 | ||||||
| 7,740,000(†††) | Mexican Fixed Rate Bonds, SeriesM-20, 7.500%, 6/03/2027, (MXN) | 40,719,915 | ||||||
| 3,035,000(†††) | Mexican Fixed Rate Bonds, SeriesM-20, 8.500%, 5/31/2029, (MXN) | 17,120,667 | ||||||
| 21,700,000(†††) | Mexican Fixed Rate Bonds, SeriesM-20, 10.000%, 12/05/2024, (MXN) | 125,746,519 | ||||||
| 175,365,000 | New Zealand Government Bond, 6.000%, 5/15/2021, (NZD) | 118,975,300 | ||||||
| 458,725,000 | Norway Government Bond, 3.750%, 5/25/2021, 144A, (NOK) | 52,506,157 | ||||||
| 162,850,000 | Republic of Brazil, 8.500%, 1/05/2024, (BRL) | 43,290,793 | ||||||
| 55,925,000 | Republic of Brazil, 10.250%, 1/10/2028, (BRL) | 16,828,176 | ||||||
| 144,325,000 | U.S. Treasury Bond, 3.000%, 8/15/2048 | 171,633,996 | ||||||
| 50,000,000 | U.S. Treasury Note, 1.500%, 8/31/2021 | 49,853,516 | ||||||
|
| |||||||
| 1,149,838,596 | ||||||||
|
| |||||||
| Wireless — 1.3% | ||||||||
| 293,000,000 | America Movil SAB de CV, 6.450%, 12/05/2022, (MXN) | 14,290,691 | ||||||
| 134,600,000 | America Movil SAB de CV, 8.460%, 12/18/2036, (MXN) | 6,616,094 | ||||||
| 49,955,000 | Sprint Capital Corp., 6.875%, 11/15/2028 | 54,460,941 | ||||||
| 6,260,000 | Sprint Capital Corp., 8.750%, 3/15/2032 | 7,721,397 | ||||||
| 8,200,000 | Sprint Corp., 7.125%, 6/15/2024 | 8,837,960 | ||||||
|
| |||||||
| 91,927,083 | ||||||||
|
| |||||||
| Wirelines — 2.7% | ||||||||
| 11,140,000 | AT&T, Inc., 4.500%,��3/09/2048 | 11,982,532 | ||||||
| 14,095,000 | AT&T, Inc., 4.550%, 3/09/2049 | 15,236,558 | ||||||
| 4,370,000 | Bell Canada, Inc., MTN, 6.550%, 5/01/2029, 144A, (CAD) | 4,228,528 | ||||||
| 7,545,000 | Bell Canada, Inc., SeriesM-17, MTN, 6.100%, 3/16/2035, 144A, (CAD) | 7,377,909 | ||||||
| 1,240,000 | CenturyLink, Inc., 5.625%, 4/01/2025 | 1,286,500 | ||||||
| 28,385,000 | CenturyLink, Inc., Series S, 6.450%, 6/15/2021 | 29,804,250 | ||||||
| 7,940,000 | CenturyLink, Inc., Series W, 6.750%, 12/01/2023 | 8,694,300 | ||||||
| 350,000 | Cincinnati Bell Telephone Co. LLC, 6.300%, 12/01/2028 | 330,946 | ||||||
| 1,140,000 | Cincinnati Bell, Inc., 7.000%, 7/15/2024, 144A | 1,054,500 | ||||||
| 16,600,000 | Cincinnati Bell, Inc., 8.000%, 10/15/2025, 144A | 14,525,000 | ||||||
| 25,745,000 | Level 3 Parent LLC, 5.750%, 12/01/2022 | 25,847,980 | ||||||
| 30,646,000 | Telecom Italia Capital S.A., 6.000%, 9/30/2034 | 32,637,990 | ||||||
See accompanying notes to financial statements.
| 32
Table of Contents
Portfolio of Investments – as of September 30, 2019
Loomis Sayles Strategic Income Fund – (continued)
| Principal Amount (‡) | Description | Value (†) | ||||||
| Wirelines — continued | ||||||||
| $ | 16,440,000 | Telecom Italia Capital S.A., 6.375%, 11/15/2033 | $ | 18,084,000 | ||||
| 14,223,000 | Verizon Communications, Inc., 4.329%, 9/21/2028 | 16,116,366 | ||||||
| 6,309,000 | Windstream Services LLC/Windstream Finance Corp., 9.000%, 6/30/2025, 144A(j) | 3,406,860 | ||||||
| 8,865,000 | Windstream Services LLC/Windstream Finance Corp., 10.500%, 6/30/2024, 144A(j) | 4,897,912 | ||||||
|
| |||||||
| 195,512,131 | ||||||||
|
| |||||||
| TotalNon-Convertible Bonds (Identified Cost $4,672,768,942) | 4,282,653,056 | |||||||
|
| |||||||
| Convertible Bonds — 4.6% | ||||||||
| Cable Satellite — 2.0% | ||||||||
| 14,660,000 | DISH Network Corp., 2.375%, 3/15/2024 | 12,882,104 | ||||||
| 139,495,000 | DISH Network Corp., 3.375%, 8/15/2026 | 127,806,114 | ||||||
|
| |||||||
| 140,688,218 | ||||||||
|
| |||||||
| Independent Energy — 0.5% | ||||||||
| 39,012,000 | Chesapeake Energy Corp., 5.500%, 9/15/2026 | 23,309,670 | ||||||
| 10,955,000 | SM Energy Co., 1.500%, 7/01/2021 | 9,880,551 | ||||||
| 2,827,000 | Whiting Petroleum Corp., 1.250%, 4/01/2020 | 2,757,060 | ||||||
|
| |||||||
| 35,947,281 | ||||||||
|
| |||||||
| Leisure — 0.4% | ||||||||
| 27,795,000 | Rovi Corp., 0.500%, 3/01/2020 | 27,348,612 | ||||||
|
| |||||||
| Pharmaceuticals — 0.0% | ||||||||
| 870,000 | BioMarin Pharmaceutical, Inc., 0.599%, 8/01/2024 | 855,207 | ||||||
| 715,000 | BioMarin Pharmaceutical, Inc., 1.500%, 10/15/2020 | 736,333 | ||||||
|
| |||||||
| 1,591,540 | ||||||||
|
| |||||||
| REITs – Diversified — 0.2% | ||||||||
| 14,245,000 | iStar, Inc., 3.125%, 9/15/2022 | 15,085,032 | ||||||
|
| |||||||
| Technology — 1.5% | ||||||||
| 10,415,000 | Booking Holdings, Inc., 0.900%, 9/15/2021 | 12,076,364 | ||||||
| 8,835,000 | Evolent Health, Inc., 2.000%, 12/01/2021 | 7,736,147 | ||||||
| 23,990,000 | Nuance Communications, Inc., 1.000%, 12/15/2035 | 22,716,850 | ||||||
| 11,265,000 | Nuance Communications, Inc., 1.250%, 4/01/2025 | 11,154,941 | ||||||
| 39,710,000 | Nuance Communications, Inc., 1.500%, 11/01/2035 | 39,686,174 | ||||||
| 17,000,000 | Western Digital Corp., 1.500%, 2/01/2024 | 16,277,500 | ||||||
|
| |||||||
| 109,647,976 | ||||||||
|
| |||||||
| Total Convertible Bonds (Identified Cost $354,092,034) | 330,308,659 | |||||||
|
| |||||||
| Municipals — 1.8% | ||||||||
| Illinois — 0.3% | ||||||||
| 17,570,000 | State of Illinois, 5.100%, 6/01/2033 | 19,030,770 | ||||||
|
| |||||||
See accompanying notes to financial statements.
33 |
Table of Contents
Portfolio of Investments – as of September 30, 2019
Loomis Sayles Strategic Income Fund – (continued)
| Principal Amount (‡) | Description | Value (†) | ||||||
| Michigan — 0.1% | ||||||||
| $ | 8,470,000 | Michigan Tobacco Settlement Finance Authority Taxable Turbo, Series A, 7.309%, 6/01/2034 | $ | 8,579,263 | ||||
|
| |||||||
| Puerto Rico — 0.5% | ||||||||
| 63,900,000 | Commonwealth of Puerto Rico, GO, Refunding, Series A, 8.000%, 7/01/2035(j) | 38,419,875 | ||||||
|
| |||||||
| Virginia — 0.9% | ||||||||
| 68,715,000 | Tobacco Settlement Financing Corp., SeriesA-1, 6.706%, 6/01/2046 | 66,057,104 | ||||||
|
| |||||||
| Total Municipals (Identified Cost $145,621,443) | 132,087,012 | |||||||
|
| |||||||
| Total Bonds and Notes (Identified Cost $5,172,482,419) | 4,745,048,727 | |||||||
|
| |||||||
| Senior Loans — 0.9% | ||||||||
| Construction Machinery — 0.5% | ||||||||
| 15,562,263 | Onsite Rental Group Pty Ltd., Term Loan B,1-month LIBOR + 4.500%, 6.518%, 10/26/2022(c)(f)(g) | 15,212,112 | ||||||
| 21,276,992 | Onsite Rental Group Pty Ltd., Note, 6.100%, 10/26/2023(b)(c)(f) | 17,979,058 | ||||||
|
| |||||||
| 33,191,170 | ||||||||
|
| |||||||
| Media Entertainment — 0.3% | ||||||||
| 20,112,042 | iHeartCommunications, Inc., Exit Term Loan,1-month LIBOR + 4.000%, 6.100%, 5/01/2026(g) | 20,230,904 | ||||||
|
| |||||||
| Oil Field Services — 0.0% | ||||||||
| 2,828,139 | PetroleumGeo-Services ASA, New Term Loan B,3-month LIBOR + 2.500%, 4.604%, 3/19/2021(g) | 2,605,423 | ||||||
|
| |||||||
| Technology — 0.1% | ||||||||
| 9,507,380 | IQOR U.S., Inc., 2nd Lien Term Loan,3-month LIBOR + 8.750%, 11.069%, 4/01/2022(g) | 7,061,892 | ||||||
|
| |||||||
| Total Senior Loans (Identified Cost $70,993,038) | 63,089,389 | |||||||
|
| |||||||
| Shares | ||||||||
| Common Stocks — 9.5% | ||||||||
| Chemicals — 0.1% | ||||||||
| 664,252 | Hexion Holdings Corp., Class B(e) | 8,157,015 | ||||||
|
| |||||||
| Diversified Telecommunication Services — 4.2% | ||||||||
| 7,868,481 | AT&T, Inc. | 297,743,321 | ||||||
|
| |||||||
| Electronic Equipment, Instruments & Components — 1.0% | ||||||||
| 2,511,351 | Corning, Inc. | 71,623,730 | ||||||
|
| |||||||
| Media — 0.1% | ||||||||
| 2,500,188 | Clear Channel Outdoor Holdings, Inc.(e) | 6,300,474 | ||||||
| 279,162 | iHeartMedia, Inc., Class A(e) | 4,187,430 | ||||||
See accompanying notes to financial statements.
| 34
Table of Contents
Portfolio of Investments – as of September 30, 2019
Loomis Sayles Strategic Income Fund – (continued)
| Shares | Description | Value (†) | ||||||
| Media — continued | ||||||||
| 110,654 | Thryv Holdings, Inc.(b)(c)(e)(f) | $ | 866,753 | |||||
|
| |||||||
| 11,354,657 | ||||||||
|
| |||||||
| Oil, Gas & Consumable Fuels — 0.1% | ||||||||
| 2,400,565 | Bellatrix Exploration Ltd.(a)(b)(d)(e)(h) | — | ||||||
| 846,398 | Chesapeake Energy Corp.(e) | 1,193,421 | ||||||
| 5,886 | Frontera Energy Corp. | 56,956 | ||||||
| 156,902 | Paragon Offshore Ltd., Litigation Units, Class A(a)(b)(c)(d)(e) | 1,569 | ||||||
| 225,503 | Paragon Offshore Ltd., Litigation Units, Class B(b)(e) | 3,382,545 | ||||||
| 1,514 | Southcross Holdings Group LLC(b)(e) | — | ||||||
| 1,514 | Southcross Holdings LP, Class A(b) | 681,300 | ||||||
|
| |||||||
| 5,315,791 | ||||||||
|
| |||||||
| Pharmaceuticals — 4.0% | ||||||||
| 5,651,190 | Bristol-Myers Squibb Co. | 286,571,845 | ||||||
|
| |||||||
| Specialty Retail — 0.0% | ||||||||
| 11,662,687 | Onsite Rental Group Pty Ltd.(a)(b)(c)(d)(e) | — | ||||||
|
| |||||||
| Total Common Stocks (Identified Cost $567,737,300) | 680,766,359 | |||||||
|
| |||||||
| Preferred Stocks — 1.5% | ||||||||
| Convertible Preferred Stocks — 1.3% | ||||||||
| Banking — 0.2% | ||||||||
| 8,447 | Bank of America Corp., Series L, 7.250% | 12,663,827 | ||||||
|
| |||||||
| Communications — 0.0% | ||||||||
| 3,704 | Cincinnati Bell, Inc., Series B, 6.750% | 120,380 | ||||||
|
| |||||||
| Independent Energy — 0.4% | ||||||||
| 172,972 | Chesapeake Energy Corp., 4.500% | 7,427,417 | ||||||
| 240,916 | Chesapeake Energy Corp., 5.000%(c)(f) | 9,154,808 | ||||||
| 32,522 | Chesapeake Energy Corp., Series A, 5.750%, 144A(a)(c)(f) | 11,391,481 | ||||||
|
| |||||||
| 27,973,706 | ||||||||
|
| |||||||
| Midstream — 0.5% | ||||||||
| 43,178 | Chesapeake Energy Corp., 5.750%, 144A(a)(c)(f) | 15,124,390 | ||||||
| 6,017 | Chesapeake Energy Corp., 5.750%(a)(c)(f) | 2,107,635 | ||||||
| 23,928 | Chesapeake Energy Corp., 5.750%(a)(c)(f) | 8,381,260 | ||||||
| 242,297 | El Paso Energy Capital Trust I, 4.750%(c)(f) | 12,713,324 | ||||||
|
| |||||||
| 38,326,609 | ||||||||
|
| |||||||
| REITs – Diversified — 0.2% | ||||||||
| 325,207 | iStar, Inc., Series J, 4.500%(c)(f) | 17,404,000 | ||||||
|
| |||||||
| Total Convertible Preferred Stocks (Identified Cost $155,141,807) | 96,488,522 | |||||||
|
| |||||||
| Non-Convertible Preferred Stocks — 0.2% | ||||||||
| Finance Companies — 0.0% | ||||||||
| 10,425 | iStar, Inc., Series G, 7.650% | 265,824 | ||||||
|
| |||||||
See accompanying notes to financial statements.
35 |
Table of Contents
Portfolio of Investments – as of September 30, 2019
Loomis Sayles Strategic Income Fund – (continued)
| Shares | Description | Value (†) | ||||||
| Home Construction — 0.0% | ||||||||
| 208,246 | Hovnanian Enterprises, Inc., 7.625%(e) | $ | 697,624 | |||||
|
| |||||||
| REITs – Office Property — 0.0% | ||||||||
| 1,596 | Highwoods Properties, Inc., Series A, 8.625% | 1,899,240 | ||||||
|
| |||||||
| REITs – Warehouse/Industrials — 0.2% | ||||||||
| 116,192 | Prologis, Inc., Series Q, 8.540% | 8,394,872 | ||||||
|
| |||||||
| TotalNon-Convertible Preferred Stocks (Identified Cost $8,540,568) | 11,257,560 | |||||||
|
| |||||||
| Total Preferred Stocks (Identified Cost $163,682,375) | 107,746,082 | |||||||
|
| |||||||
| Closed-End Investment Companies — 0.0% | ||||||||
| 170,282 | NexPoint Strategic Opportunities Fund (Identified Cost $10,230,310) | 3,053,156 | ||||||
|
| |||||||
| Warrants — 0.2% | ||||||||
| 751,946 | iHeartMedia, Inc., Expiration on 5/1/2039(e) (Identified Cost $18,045,316) | 10,715,230 | ||||||
|
| |||||||
| Principal Amount (‡) | ||||||||
| Short-Term Investments — 20.5% | ||||||||
| $ | 10,070,157,559 | Central Bank of Iceland, 0.000%, (ISK)(c)(f)(g)(l) | 81,240,430 | |||||
| 45,895,000 | Federal Home Loan Bank Discount Notes, 1.950%, 11/15/2019(m) | 45,787,147 | ||||||
| 83,800,000 | Ford Motor Credit Co. LLC, 4.331%, 12/02/2019(m) | 83,404,631 | ||||||
| 157,488,902 | Tri-Party Repurchase Agreement with Fixed Income Clearing Corporation, dated 9/30/2019 at 1.100% to be repurchased at $157,493,714 on 10/01/2019 collateralized by $124,715,000 U.S. Treasury Note, 2.125% due 5/15/2025 valued at $129,264,229; $29,325,000 U.S. Treasury Note, 2.750% due 6/30/2025 valued at $31,377,339 including accrued interest (Note 2 of Notes to Financial Statements) | 157,488,902 | ||||||
| 215,435,000 | U.S. Treasury Bills, 1.815%, 3/26/2020(m) | 213,552,232 | ||||||
| 300,000,000 | U.S. Treasury Bills,1.830%-1.837%, 2/27/2020(m)(n) | 297,780,522 | ||||||
| 416,810,000 | U.S. Treasury Bills,1.840%-2.350%, 11/14/2019(m)(n) | 415,903,080 | ||||||
| 170,000,000 | U.S. Treasury Bills, 2.318%, 11/29/2019(m) | 169,495,017 | ||||||
|
| |||||||
| Total Short-Term Investments (Identified Cost $1,462,474,088) | 1,464,651,961 | |||||||
|
| |||||||
| Total Investments — 98.9% (Identified Cost $7,465,644,846) | 7,075,070,904 | |||||||
| Other assets less liabilities — 1.1% | 78,246,684 | |||||||
|
| |||||||
| Net Assets — 100.0% | $ | 7,153,317,588 | ||||||
|
| |||||||
| (‡) | Principal Amount stated in U.S. dollars unless otherwise noted. |
| ||||||
See accompanying notes to financial statements.
| 36
Table of Contents
Portfolio of Investments – as of September 30, 2019
Loomis Sayles Strategic Income Fund – (continued)
| (†) | See Note 2 of Notes to Financial Statements. |
| ||||||
| (††) | Amount shown represents units. One unit represents a principal amount of 25. |
| ||||||
| (†††) | Amount shown represents units. One unit represents a principal amount of 100. |
| ||||||
| (a) | Level 3 security. Value has been determined using significant unobservable inputs. See Note 3 of Notes to Financial Statements. |
| ||||||
| (b) | Securities subject to restriction on resale. At September 30, 2019, the restricted securities held by the Fund are as follows: |
| ||||||
| Acquisition Date | Acquisition Cost | Value | % of Net Assets | |||||||||||||
| Bellatrix Exploration Ltd., 8.500% | 6/04/2019 | $ | 5,869,220 | $ | 3,593,400 | 0.1% | ||||||||||
| Bellatrix Exploration Ltd., 9.500% PIK or 3.000% Cash | 6/04/2019 | 4,307,160 | — | — | ||||||||||||
| Bellatrix Exploration Ltd. | 6/04/2019 | 3,016,862 | — | — | ||||||||||||
| GCA2014 Holdings Ltd., Series2014-1, Class C | 12/18/2014 | 22,212,163 | 18,036,277 | 0.3% | ||||||||||||
| GCA2014 Holdings Ltd., Series2014-1, Class D | 12/18/2014 | 9,682,403 | 5,315,639 | 0.1% | ||||||||||||
| GCA2014 Holdings Ltd., Series2014-1, Class E | 12/18/2014 | 32,732,982 | — | — | ||||||||||||
| Onsite Rental Group Pty Ltd. | 10/26/2017 | — | — | — | ||||||||||||
| Onsite Rental Group Pty Ltd., Note | 10/26/2017 | 15,532,204 | 17,979,058 | 0.3% | ||||||||||||
| Paragon Offshore Ltd., Litigation Units, Class A | 7/18/2017 | 1,167,146 | 1,569 | Less than 0.1% | ||||||||||||
| Paragon Offshore Ltd., Litigation Units, Class B | 7/18/2017 | 22,768,653 | 3,382,545 | Less than 0.1% | ||||||||||||
| Southcross Holdings Group LLC | 4/29/2016 | — | — | — | ||||||||||||
| Southcross Holdings LP, Class A | 4/29/2016 | 2,215,133 | 681,300 | Less than 0.1% | ||||||||||||
| Thryv Holdings, Inc. | 8/12/2016 | 539,031 | 866,753 | Less than 0.1% | ||||||||||||
| (c) | Illiquid security. (Unaudited) |
| ||||||
| (d) | Fair valued by the Fund’s adviser. At September 30, 2019, the value of these securities amounted to $26,946,885 or 0.4% of net assets. See Note 2 of Notes to Financial Statements. |
| ||||||
| (e) | Non-income producing security. |
| ||||||
| (f) | Securities classified as fair valued pursuant to the Fund’s pricing policies and procedures. At September 30, 2019, the value of these securities amounted to $281,374,794 or 3.9% of net assets. See Note 2 of Notes to Financial Statements. |
| ||||||
| (g) | Variable rate security. Rate as of September 30, 2019 is disclosed. |
| ||||||
| (h) | Affiliated issuer. See Note 5h for a summary of transactions in securities of affiliated issuers. |
| ||||||
| (i) | Payment-in-kind security for which the issuer has the option at each interest payment date of making interest payments in cash or additional principal. No payments were made during the period. |
| ||||||
| (j) | The issuer is in default with respect to interest and/or principal payments. Income is not being accrued. |
| ||||||
| (k) | Perpetual bond with no specified maturity date. |
| ||||||
| (l) | Security callable by issuer at any time. No specified maturity date. |
| ||||||
| (m) | Interest rate represents discount rate at time of purchase; not a coupon rate. |
| ||||||
| (n) | The Fund’s investment in U.S. Government/Agency securities is comprised of various lots with differing discount rates. These separate investments, which have the same maturity date, have been aggregated for the purpose of presentation in the Portfolio of Investments. |
| ||||||
| 144A | All or a portion of these securities are exempt from registration under Rule 144A of the Securities Act of 1933. These securities may be resold in transactions exempt from registration, normally to qualified institutional buyers. At September 30, 2019, the value of Rule 144A holdings amounted to $1,106,289,206 or 15.5% of net assets. |
| ||||||
See accompanying notes to financial statements.
37 |
Table of Contents
Portfolio of Investments – as of September 30, 2019
Loomis Sayles Strategic Income Fund – (continued)
| ABS | Asset-Backed Securities |
| ||||||
| EMTN | Euro Medium Term Note |
| ||||||
| GMTN | Global Medium Term Note |
| ||||||
| GO | General Obligation |
| ||||||
| LIBOR | London Interbank Offered Rate |
| ||||||
| MBIA | Municipal Bond Investors Assurance Corp. |
| ||||||
| MTN | Medium Term Note |
| ||||||
| PIK | Payment-in-Kind |
| ||||||
| REITs | Real Estate Investment Trusts |
| ||||||
| AUD | Australian Dollar |
| ||||||
| BRL | Brazilian Real |
| ||||||
| CAD | Canadian Dollar |
| ||||||
| ISK | Icelandic Krona |
| ||||||
| MXN | Mexican Peso |
| ||||||
| NOK | Norwegian Krone |
| ||||||
| NZD | New Zealand Dollar |
| ||||||
Industry Summary at September 30, 2019
Treasuries | 16.1 | % | ||
Banking | 5.2 | |||
Independent Energy | 4.8 | |||
Diversified Telecommunication Services | 4.2 | |||
Healthcare | 4.1 | |||
Pharmaceuticals | 4.0 | |||
Finance Companies | 3.6 | |||
Cable Satellite | 3.5 | |||
Technology | 3.1 | |||
Airlines | 3.0 | |||
Wirelines | 2.7 | |||
Oil Field Services | 2.6 | |||
Other Investments, less than 2% each | 21.5 | |||
Short-Term Investments | 20.5 | |||
Closed-End Investment Companies | 0.0 | * | ||
|
| |||
Total Investments | 98.9 | |||
Other assets less liabilities | 1.1 | |||
|
| |||
Net Assets | 100.0 | % | ||
|
|
| * | Less than 0.1% |
See accompanying notes to financial statements.
| 38
Table of Contents
Portfolio of Investments – as of September 30, 2019
Loomis Sayles Strategic Income Fund – (continued)
Currency Exposure Summary at September 30, 2019
United States Dollar | 79.7 | % | ||
Mexican Peso | 6.7 | |||
Canadian Dollar | 5.0 | |||
Australian Dollar | 2.7 | |||
New Zealand Dollar | 2.0 | |||
Other, less than 2% each | 2.8 | |||
|
| |||
Total Investments | 98.9 | |||
Other assets less liabilities | 1.1 | |||
|
| |||
Net Assets | 100.0 | % | ||
|
|
See accompanying notes to financial statements.
39 |
Table of Contents
This Page Intentionally Left Blank
| 40
Table of Contents
Statements of Assets and Liabilities
September 30, 2019
| Growth Fund | Strategic Income Fund | |||||||
ASSETS | ||||||||
Unaffiliated investments at cost | $ | 6,300,803,614 | $ | 7,452,349,931 | ||||
Affiliated investments at cost | — | 13,294,915 | ||||||
Net unrealized appreciation (depreciation) on unaffiliated investments | 2,565,314,396 | (380,872,427 | ) | |||||
Net unrealized appreciation (depreciation) on affiliated investments | — | (9,701,515 | ) | |||||
|
|
|
| |||||
Investments at value | 8,866,118,010 | 7,075,070,904 | ||||||
Cash | 26,668,399 | 4,274,496 | ||||||
Foreign currency at value (identified cost $0 and $3,128,351, respectively) | — | 3,121,644 | ||||||
Receivable for Fund shares sold | 14,735,660 | 7,087,173 | ||||||
Receivable for securities sold | 35,465,654 | 3,802,290 | ||||||
Dividends and interest receivable | 6,185,851 | 77,077,641 | ||||||
Tax reclaims receivable | 4,551,359 | 438,399 | ||||||
Prepaid expenses (Note 7) | 638 | 590 | ||||||
|
|
|
| |||||
TOTAL ASSETS | 8,953,725,571 | 7,170,873,137 | ||||||
|
|
|
| |||||
LIABILITIES | ||||||||
Payable for securities purchased | 112,117,255 | 3,231,217 | ||||||
Payable for Fund shares redeemed | 5,671,129 | 8,697,054 | ||||||
Management fees payable (Note 5) | 3,659,008 | 3,352,609 | ||||||
Deferred Trustees’ fees (Note 5) | 429,242 | 1,526,620 | ||||||
Administrative fees payable (Note 5) | 318,951 | 260,050 | ||||||
Payable to distributor (Note 5d) | 81,341 | 69,188 | ||||||
Other accounts payable and accrued expenses | 431,897 | 418,811 | ||||||
|
|
|
| |||||
TOTAL LIABILITIES | 122,708,823 | 17,555,549 | ||||||
|
|
|
| |||||
NET ASSETS | $ | 8,831,016,748 | $ | 7,153,317,588 | ||||
|
|
|
| |||||
NET ASSETS CONSIST OF: | ||||||||
Paid-in capital | $ | 6,077,892,903 | $ | 7,610,189,722 | ||||
Accumulated earnings (loss) | 2,753,123,845 | (456,872,134 | ) | |||||
|
|
|
| |||||
NET ASSETS | $ | 8,831,016,748 | $ | 7,153,317,588 | ||||
|
|
|
| |||||
See accompanying notes to financial statements.
41 |
Table of Contents
Statements of Assets and Liabilities (continued)
September 30, 2019
| Growth Fund | Strategic Income Fund | |||||||
COMPUTATION OF NET ASSET VALUE AND OFFERING PRICE: | ||||||||
Class A shares: | ||||||||
Net assets | $ | 1,250,029,957 | $ | 1,835,813,069 | ||||
|
|
|
| |||||
Shares of beneficial interest | 78,023,345 | 128,821,175 | ||||||
|
|
|
| |||||
Net asset value and redemption price per share | $ | 16.02 | $ | 14.25 | ||||
|
|
|
| |||||
Offering price per share(100/[100-maximum sales charge] of net asset value) (Note 1) | $ | 17.00 | $ | 14.88 | ||||
|
|
|
| |||||
Class C shares:(redemption price per share is equal to net asset value less any applicable contingent deferred sales charge) (Note 1) | ||||||||
Net assets | $ | 120,492,992 | $ | 676,601,820 | ||||
|
|
|
| |||||
Shares of beneficial interest | 8,294,023 | 47,026,319 | ||||||
|
|
|
| |||||
Net asset value and offering price per share | $ | 14.53 | $ | 14.39 | ||||
|
|
|
| |||||
Class N shares: | ||||||||
Net assets | $ | 442,786,595 | $ | 202,989,477 | ||||
|
|
|
| |||||
Shares of beneficial interest | 25,788,041 | 14,259,258 | ||||||
|
|
|
| |||||
Net asset value, offering and redemption price per share | $ | 17.17 | $ | 14.24 | ||||
|
|
|
| |||||
Class Y shares: | ||||||||
Net assets | $ | 7,017,707,204 | $ | 4,316,009,910 | ||||
|
|
|
| |||||
Shares of beneficial interest | 408,727,851 | 303,211,347 | ||||||
|
|
|
| |||||
Net asset value, offering and redemption price per share | $ | 17.17 | $ | 14.23 | ||||
|
|
|
| |||||
Admin Class shares: | ||||||||
Net assets | $ | — | $ | 121,903,312 | ||||
|
|
|
| |||||
Shares of beneficial interest | — | 8,584,232 | ||||||
|
|
|
| |||||
Net asset value, offering and redemption price per share | $ | — | $ | 14.20 | ||||
|
|
|
| |||||
See accompanying notes to financial statements.
| 42
Table of Contents
Statements of Operations
For the Year Ended September 30, 2019
| Growth Fund | Strategic Income Fund | |||||||
INVESTMENT INCOME | ||||||||
Dividends | $ | 105,551,410 | $ | 35,318,760 | ||||
Interest from unaffiliated investments | 1,526,044 | 345,472,499 | ||||||
Interest from affiliated investments | — | 266,596 | ||||||
Less net foreign taxes withheld | (2,402,568 | ) | (489,072 | ) | ||||
|
|
|
| |||||
| 104,674,886 | 380,568,783 | |||||||
|
|
|
| |||||
Expenses | ||||||||
Management fees (Note 5) | 41,575,620 | 42,993,058 | ||||||
Service and distribution fees (Note 5) | 4,012,689 | 14,006,862 | ||||||
Administrative fees (Note 5) | 3,660,618 | 3,353,455 | ||||||
Trustees’ fees and expenses (Note 5) | 272,865 | 259,934 | ||||||
Transfer agent fees and expenses (Notes 5 and 6) | 7,229,878 | 6,245,387 | ||||||
Audit and tax services fees | 39,942 | 60,621 | ||||||
Custodian fees and expenses | 254,782 | 309,894 | ||||||
Legal fees (Note 7) | 245,991 | 223,404 | ||||||
Registration fees | 177,488 | 155,276 | ||||||
Shareholder reporting expenses | 386,193 | 344,030 | ||||||
Miscellaneous expenses (Note 7) | 249,270 | 214,887 | ||||||
|
|
|
| |||||
Total expenses | 58,105,336 | 68,166,808 | ||||||
Less waiver and/or expense reimbursement (Note 5) | (62,678 | ) | (59,623 | ) | ||||
|
|
|
| |||||
Net expenses | 58,042,658 | 68,107,185 | ||||||
|
|
|
| |||||
Net investment income | 46,632,228 | 312,461,598 | ||||||
|
|
|
| |||||
NET REALIZED AND UNREALIZED GAIN (LOSS) ON INVESTMENTS AND FOREIGN CURRENCY TRANSACTIONS | ||||||||
Net realized gain (loss) on: | ||||||||
Unaffiliated investments | 210,199,000 | (31,243,600 | ) | |||||
Foreign currency transactions (Note 2c) | — | 5,738,112 | ||||||
Net change in unrealized appreciation (depreciation) on: | ||||||||
Unaffiliated investments | 177,218,567 | (77,967,852 | ) | |||||
Affiliated investments | — | (9,701,515 | ) | |||||
Foreign currency translations (Note 2c) | — | (8,754,894 | ) | |||||
|
|
|
| |||||
Net realized and unrealized gain (loss) on investments and foreign currency transactions | 387,417,567 | (121,929,749 | ) | |||||
|
|
|
| |||||
NET INCREASE IN NET ASSETS RESULTING FROM OPERATIONS | $ | 434,049,795 | $ | 190,531,849 | ||||
|
|
|
| |||||
See accompanying notes to financial statements.
43 |
Table of Contents
Statements of Changes in Net Assets
| Growth Fund | Strategic Income Fund | |||||||||||||||
| Year Ended September 30, 2019 | Year Ended September 30, 2018 | Year Ended September 30, 2019 | Year Ended September 30, 2018 | |||||||||||||
FROM OPERATIONS: | ||||||||||||||||
Net investment income | $ | 46,632,228 | $ | 48,813,777 | $ | 312,461,598 | $ | 331,027,757 | ||||||||
Net realized gain (loss) on investments and foreign currency transactions | 210,199,000 | 330,004,291 | (25,505,488 | ) | 2,141,142 | |||||||||||
Net change in unrealized appreciation (depreciation) on investments and foreign currency translations | 177,218,567 | 902,573,085 | (96,424,261 | ) | (220,599,041 | ) | ||||||||||
|
|
|
|
|
|
|
| |||||||||
Net increase in net assets resulting from operations | 434,049,795 | 1,281,391,153 | 190,531,849 | 112,569,858 | ||||||||||||
|
|
|
|
|
|
|
| |||||||||
FROM DISTRIBUTIONS TO SHAREHOLDERS: | ||||||||||||||||
Class A | (51,082,626 | ) | (23,626,171 | ) | (71,533,316 | ) | (83,233,392 | ) | ||||||||
Class C | (6,370,291 | ) | (2,938,721 | ) | (27,624,605 | ) | (65,182,313 | ) | ||||||||
Class N | (29,366,126 | ) | (9,153,975 | ) | (8,091,999 | ) | (7,465,601 | ) | ||||||||
Class Y | (317,599,223 | ) | (147,324,401 | ) | (189,621,495 | ) | (249,028,627 | ) | ||||||||
Admin Class | — | — | (4,619,879 | ) | (5,735,653 | ) | ||||||||||
|
|
|
|
|
|
|
| |||||||||
Total distributions | (404,418,266 | ) | (183,043,268 | ) | (301,491,294 | ) | (410,645,586 | ) | ||||||||
|
|
|
|
|
|
|
| |||||||||
NET INCREASE (DECREASE) IN NET ASSETS FROM CAPITAL SHARE TRANSACTIONS (NOTE 10) | (34,793,401 | ) | 530,718,841 | (1,303,567,589 | ) | (1,369,576,617 | ) | |||||||||
|
|
|
|
|
|
|
| |||||||||
Net increase (decrease) in net assets | (5,161,872 | ) | 1,629,066,726 | (1,414,527,034 | ) | (1,667,652,345 | ) | |||||||||
NET ASSETS | ||||||||||||||||
Beginning of the year | 8,836,178,620 | 7,207,111,894 | 8,567,844,622 | 10,235,496,967 | ||||||||||||
|
|
|
|
|
|
|
| |||||||||
End of the year | $ | 8,831,016,748 | $ | 8,836,178,620 | $ | 7,153,317,588 | $ | 8,567,844,622 | ||||||||
|
|
|
|
|
|
|
| |||||||||
See accompanying notes to financial statements.
| 44
Table of Contents
Financial Highlights
For a share outstanding throughout each period.
| Growth Fund—Class A | ||||||||||||||||||||
| Year Ended September 30, 2019 | Year Ended September 30, 2018 | Year Ended September 30, 2017 | Year Ended September 30, 2016 | Year Ended September 30, 2015 | ||||||||||||||||
Net asset value, beginning of the period | $ | 16.05 | $ | 14.04 | $ | 11.96 | $ | 9.90 | $ | 9.45 | ||||||||||
|
|
|
|
|
|
|
|
|
| |||||||||||
INCOME (LOSS) FROM INVESTMENT OPERATIONS: | ||||||||||||||||||||
Net investment income(a) | 0.05 | 0.06 | 0.06 | 0.06 | 0.05 | |||||||||||||||
Net realized and unrealized gain (loss) | 0.71 | 2.29 | 2.18 | 2.05 | 0.45 | |||||||||||||||
|
|
|
|
|
|
|
|
|
| |||||||||||
Total from Investment Operations | 0.76 | 2.35 | 2.24 | 2.11 | 0.50 | |||||||||||||||
|
|
|
|
|
|
|
|
|
| |||||||||||
LESS DISTRIBUTIONS FROM: | ||||||||||||||||||||
Net investment income | (0.05 | ) | (0.05 | ) | (0.05 | ) | (0.05 | ) | (0.05 | ) | ||||||||||
Net realized capital gains | (0.74 | ) | (0.29 | ) | (0.11 | ) | — | — | ||||||||||||
|
|
|
|
|
|
|
|
|
| |||||||||||
Total Distributions | (0.79 | ) | (0.34 | ) | (0.16 | ) | (0.05 | ) | (0.05 | ) | ||||||||||
|
|
|
|
|
|
|
|
|
| |||||||||||
Net asset value, end of the period | $ | 16.02 | $ | 16.05 | $ | 14.04 | $ | 11.96 | $ | 9.90 | ||||||||||
|
|
|
|
|
|
|
|
|
| |||||||||||
Total return(b) | 5.81 | % | 16.98 | % | 18.99 | % | 21.32 | % | 5.30 | % | ||||||||||
RATIOS TO AVERAGE NET ASSETS: | ||||||||||||||||||||
Net assets, end of the period (000’s) | $ | 1,250,030 | $ | 1,083,362 | $ | 983,047 | $ | 729,989 | $ | 122,203 | ||||||||||
Net expenses | 0.91 | % | 0.90 | % | 0.91 | % | 0.92 | % | 0.92 | % | ||||||||||
Gross expenses | 0.91 | % | 0.90 | % | 0.91 | % | 0.92 | % | 0.92 | % | ||||||||||
Net investment income | 0.35 | % | 0.39 | % | 0.45 | % | 0.58 | % | 0.45 | % | ||||||||||
Portfolio turnover rate | 7 | % | 11 | % | 8 | % | 11 | % | 27 | %(c) | ||||||||||
| (a) | Per share net investment income has been calculated using the average shares outstanding during the period. |
| (b) | A sales charge for Class A shares is not reflected in total return calculations. |
| (c) | Portfolio turnover would have been 6% if excluding the transferin-kind amounts that occurred during the period. |
See accompanying notes to financial statements.
45 |
Table of Contents
Financial Highlights (continued)
For a share outstanding throughout each period.
| Growth Fund—Class C | ||||||||||||||||||||
| Year Ended September 30, 2019 | Year Ended September 30, 2018 | Year Ended September 30, 2017 | Year Ended September 30, 2016 | Year Ended September 30, 2015 | ||||||||||||||||
Net asset value, beginning of the period | $ | 14.68 | $ | 12.92 | $ | 11.06 | $ | 9.18 | $ | 8.79 | ||||||||||
|
|
|
|
|
|
|
|
|
| |||||||||||
INCOME (LOSS) FROM INVESTMENT OPERATIONS: | ||||||||||||||||||||
Net investment loss(a) | (0.06 | ) | (0.05 | ) | (0.03 | ) | (0.02 | ) | (0.03 | ) | ||||||||||
Net realized and unrealized gain (loss) | 0.65 | 2.10 | 2.00 | 1.90 | 0.42 | |||||||||||||||
|
|
|
|
|
|
|
|
|
| |||||||||||
Total from Investment Operations | 0.59 | 2.05 | 1.97 | 1.88 | 0.39 | |||||||||||||||
|
|
|
|
|
|
|
|
|
| |||||||||||
LESS DISTRIBUTIONS FROM: | ||||||||||||||||||||
Net realized capital gains | (0.74 | ) | (0.29 | ) | (0.11 | ) | — | — | ||||||||||||
|
|
|
|
|
|
|
|
|
| |||||||||||
Net asset value, end of the period | $ | 14.53 | $ | 14.68 | $ | 12.92 | $ | 11.06 | $ | 9.18 | ||||||||||
|
|
|
|
|
|
|
|
|
| |||||||||||
Total return(b) | 5.05 | % | 16.09 | % | 18.03 | % | 20.48 | % | 4.44 | % | ||||||||||
RATIOS TO AVERAGE NET ASSETS: | ||||||||||||||||||||
Net assets, end of the period (000’s) | $ | 120,493 | $ | 130,133 | $ | 133,329 | $ | 109,798 | $ | 41,421 | ||||||||||
Net expenses | 1.66 | % | 1.65 | % | 1.66 | % | 1.66 | % | 1.67 | % | ||||||||||
Gross expenses | 1.66 | % | 1.65 | % | 1.66 | % | 1.66 | % | 1.67 | % | ||||||||||
Net investment loss | (0.39 | )% | (0.36 | )% | (0.29 | )% | (0.16 | )% | (0.29 | )% | ||||||||||
Portfolio turnover rate | 7 | % | 11 | % | 8 | % | 11 | % | 27 | %(c) | ||||||||||
| (a) | Per share net investment loss has been calculated using the average shares outstanding during the period. |
| (b) | A contingent deferred sales charge for Class C shares is not reflected in total return calculations. |
| (c) | Portfolio turnover would have been 6% if excluding the transferin-kind amounts that occurred during the period. |
See accompanying notes to financial statements.
| 46
Table of Contents
Financial Highlights (continued)
For a share outstanding throughout each period.
| Growth Fund—Class N | ||||||||||||||||||||
| Year Ended September 30, 2019 | Year Ended September 30, 2018 | Year Ended September 30, 2017 | Year Ended September 30, 2016 | Year Ended September 30, 2015 | ||||||||||||||||
Net asset value, beginning of the period | $ | 17.15 | $ | 14.97 | $ | 12.73 | $ | 10.52 | $ | 10.01 | ||||||||||
|
|
|
|
|
|
|
|
|
| |||||||||||
INCOME (LOSS) FROM INVESTMENT OPERATIONS: | ||||||||||||||||||||
Net investment income(a) | 0.11 | 0.12 | 0.11 | 0.10 | 0.08 | |||||||||||||||
Net realized and unrealized gain (loss) | 0.76 | 2.44 | 2.32 | 2.18 | 0.49 | |||||||||||||||
|
|
|
|
|
|
|
|
|
| |||||||||||
Total from Investment Operations | 0.87 | 2.56 | 2.43 | 2.28 | 0.57 | |||||||||||||||
|
|
|
|
|
|
|
|
|
| |||||||||||
LESS DISTRIBUTIONS FROM: | ||||||||||||||||||||
Net investment income | (0.11 | ) | (0.09 | ) | (0.08 | ) | (0.07 | ) | (0.06 | ) | ||||||||||
Net realized capital gains | (0.74 | ) | (0.29 | ) | (0.11 | ) | — | — | ||||||||||||
|
|
|
|
|
|
|
|
|
| |||||||||||
Total Distributions | (0.85 | ) | (0.38 | ) | (0.19 | ) | (0.07 | ) | (0.06 | ) | ||||||||||
|
|
|
|
|
|
|
|
|
| |||||||||||
Net asset value, end of the period | $ | 17.17 | $ | 17.15 | $ | 14.97 | $ | 12.73 | $ | 10.52 | ||||||||||
|
|
|
|
|
|
|
|
|
| |||||||||||
Total return | 6.14 | % | 17.40 | %(b) | 19.39 | %(b) | 21.75 | % | 5.65 | %(b) | ||||||||||
RATIOS TO AVERAGE NET ASSETS: | ||||||||||||||||||||
Net assets, end of the period (000’s) | $ | 442,787 | $ | 1,001,688 | $ | 341,160 | $ | 60,765 | $ | 1 | ||||||||||
Net expenses | 0.56 | % | 0.57 | %(c) | 0.57 | %(c) | 0.58 | % | 0.55 | %(c) | ||||||||||
Gross expenses | 0.56 | % | 0.58 | % | 0.58 | % | 0.58 | % | 9.82 | % | ||||||||||
Net investment income | 0.69 | % | 0.73 | % | 0.80 | % | 0.82 | % | 0.71 | % | ||||||||||
Portfolio turnover rate | 7 | % | 11 | % | 8 | % | 11 | % | 27 | %(d) | ||||||||||
| (a) | Per share net investment income has been calculated using the average shares outstanding during the period. |
| (b) | Had certain expenses not been waived/reimbursed during the period, total returns would have been lower. |
| (c) | The investment adviser agreed to waive its fees and/or reimburse a portion of the Fund’s expenses during the period. Without this waiver/reimbursement, expenses would have been higher. |
| (d) | Portfolio turnover would have been 6% if excluding the transferin-kind amounts that occurred during the period. |
See accompanying notes to financial statements.
47 |
Table of Contents
Financial Highlights (continued)
For a share outstanding throughout each period.
| Growth Fund—Class Y | ||||||||||||||||||||
| Year Ended September 30, 2019 | Year Ended September 30, 2018 | Year Ended September 30, 2017 | Year Ended September 30, 2016 | Year Ended September 30, 2015 | ||||||||||||||||
Net asset value, beginning of the period | $ | 17.14 | $ | 14.97 | $ | 12.73 | $ | 10.53 | $ | 10.04 | ||||||||||
|
|
|
|
|
|
|
|
|
| |||||||||||
INCOME (LOSS) FROM INVESTMENT OPERATIONS: | ||||||||||||||||||||
Net investment income(a) | 0.10 | 0.10 | 0.09 | 0.10 | 0.07 | |||||||||||||||
Net realized and unrealized gain (loss) | 0.77 | 2.44 | 2.33 | 2.16 | 0.49 | |||||||||||||||
|
|
|
|
|
|
|
|
|
| |||||||||||
Total from Investment Operations | 0.87 | 2.54 | 2.42 | 2.26 | 0.56 | |||||||||||||||
|
|
|
|
|
|
|
|
|
| |||||||||||
LESS DISTRIBUTIONS FROM: | ||||||||||||||||||||
Net investment income | (0.10 | ) | (0.08 | ) | (0.07 | ) | (0.06 | ) | (0.07 | ) | ||||||||||
Net realized capital gains | (0.74 | ) | (0.29 | ) | (0.11 | ) | — | — | ||||||||||||
|
|
|
|
|
|
|
|
|
| |||||||||||
Total Distributions | (0.84 | ) | (0.37 | ) | (0.18 | ) | (0.06 | ) | (0.07 | ) | ||||||||||
|
|
|
|
|
|
|
|
|
| |||||||||||
Net asset value, end of the period | $ | 17.17 | $ | 17.14 | $ | 14.97 | $ | 12.73 | $ | 10.53 | ||||||||||
|
|
|
|
|
|
|
|
|
| |||||||||||
Total return | 6.09 | % | 17.25 | % | 19.31 | % | 21.55 | % | 5.59 | % | ||||||||||
RATIOS TO AVERAGE NET ASSETS: | ||||||||||||||||||||
Net assets, end of the period (000’s) | $ | 7,017,707 | $ | 6,620,996 | $ | 5,749,576 | $ | 3,493,961 | $ | 1,174,150 | ||||||||||
Net expenses | 0.66 | % | 0.65 | % | 0.66 | % | 0.66 | % | 0.67 | % | ||||||||||
Gross expenses | 0.66 | % | 0.65 | % | 0.66 | % | 0.66 | % | 0.67 | % | ||||||||||
Net investment income | 0.60 | % | 0.64 | % | 0.69 | % | 0.82 | % | 0.69 | % | ||||||||||
Portfolio turnover rate | 7 | % | 11 | % | 8 | % | 11 | % | 27 | %(b) | ||||||||||
| (a) | Per share net investment income has been calculated using the average shares outstanding during the period. |
| (b) | Portfolio turnover would have been 6% if excluding the transferin-kind amounts that occurred during the period. |
See accompanying notes to financial statements.
| 48
Table of Contents
Financial Highlights (continued)
For a share outstanding throughout each period.
| Strategic Income Fund—Class A | ||||||||||||||||||||
| Year Ended September 30, 2019 | Year Ended September 30, 2018 | Year Ended September 30, 2017 | Year Ended September 30, 2016 | Year Ended September 30, 2015 | ||||||||||||||||
Net asset value, beginning of the period | $ | 14.39 | $ | 14.84 | $ | 14.70 | $ | 14.70 | $ | 16.75 | ||||||||||
|
|
|
|
|
|
|
|
|
| |||||||||||
INCOME (LOSS) FROM INVESTMENT OPERATIONS: | ||||||||||||||||||||
Net investment income(a) | 0.57 | 0.52 | 0.56 | 0.57 | 0.64 | |||||||||||||||
Net realized and unrealized gain (loss) | (0.16 | ) | (0.33 | ) | 0.42 | 0.61 | (1.74 | ) | ||||||||||||
|
|
|
|
|
|
|
|
|
| |||||||||||
Total from Investment Operations | 0.41 | 0.19 | 0.98 | 1.18 | (1.10 | ) | ||||||||||||||
|
|
|
|
|
|
|
|
|
| |||||||||||
LESS DISTRIBUTIONS FROM: | �� | |||||||||||||||||||
Net investment income | (0.48 | ) | (0.57 | ) | (0.52 | ) | (0.36 | ) | (0.57 | ) | ||||||||||
Net realized capital gains | (0.07 | ) | (0.07 | ) | (0.32 | ) | (0.82 | ) | (0.38 | ) | ||||||||||
|
|
|
|
|
|
|
|
|
| |||||||||||
Total Distributions | (0.55 | ) | (0.64 | ) | (0.84 | ) | (1.18 | ) | (0.95 | ) | ||||||||||
|
|
|
|
|
|
|
|
|
| |||||||||||
Net asset value, end of the period | $ | 14.25 | $ | 14.39 | $ | 14.84 | $ | 14.70 | $ | 14.70 | ||||||||||
|
|
|
|
|
|
|
|
|
| |||||||||||
Total return(b) | 3.02 | % | 1.34 | % | 7.01 | % | 8.72 | % | (6.88 | )% | ||||||||||
RATIOS TO AVERAGE NET ASSETS: | ||||||||||||||||||||
Net assets, end of the period (000’s) | $ | 1,835,813 | $ | 1,986,300 | $ | 1,999,385 | $ | 2,514,770 | $ | 3,318,262 | ||||||||||
Net expenses | 0.96 | % | 0.96 | % | 0.96 | % | 0.96 | % | 0.94 | % | ||||||||||
Gross expenses | 0.96 | % | 0.96 | % | 0.96 | % | 0.96 | % | 0.94 | % | ||||||||||
Net investment income | 4.03 | % | 3.57 | % | 3.82 | % | 4.01 | % | 3.95 | % | ||||||||||
Portfolio turnover rate | 13 | % | 6 | % | 11 | % | 17 | % | 23 | % | ||||||||||
| (a) | Per share net investment income has been calculated using the average shares outstanding during the period. |
| (b) | A sales charge for Class A shares is not reflected in total return calculations. |
See accompanying notes to financial statements.
49 |
Table of Contents
Financial Highlights (continued)
For a share outstanding throughout each period.
| Strategic Income Fund—Class C | ||||||||||||||||||||
| Year Ended September 30, 2019 | Year Ended September 30, 2018 | Year Ended September 30, 2017 | Year Ended September 30, 2016 | Year Ended September 30, 2015 | ||||||||||||||||
Net asset value, beginning of the period | $ | 14.52 | $ | 14.97 | $ | 14.81 | $ | 14.80 | $ | 16.85 | ||||||||||
|
|
|
|
|
|
|
|
|
| |||||||||||
INCOME (LOSS) FROM INVESTMENT OPERATIONS: | ||||||||||||||||||||
Net investment income(a) | 0.47 | 0.41 | 0.45 | 0.47 | 0.52 | |||||||||||||||
Net realized and unrealized gain (loss) | (0.16 | ) | (0.33 | ) | 0.44 | 0.61 | (1.74 | ) | ||||||||||||
|
|
|
|
|
|
|
|
|
| |||||||||||
Total from Investment Operations | 0.31 | 0.08 | 0.89 | 1.08 | (1.22 | ) | ||||||||||||||
|
|
|
|
|
|
|
|
|
| |||||||||||
LESS DISTRIBUTIONS FROM: | ||||||||||||||||||||
Net investment income | (0.37 | ) | (0.46 | ) | (0.41 | ) | (0.25 | ) | (0.45 | ) | ||||||||||
Net realized capital gains | (0.07 | ) | (0.07 | ) | (0.32 | ) | (0.82 | ) | (0.38 | ) | ||||||||||
|
|
|
|
|
|
|
|
|
| |||||||||||
Total Distributions | (0.44 | ) | (0.53 | ) | (0.73 | ) | (1.07 | ) | (0.83 | ) | ||||||||||
|
|
|
|
|
|
|
|
|
| |||||||||||
Net asset value, end of the period | $ | 14.39 | $ | 14.52 | $ | 14.97 | $ | 14.81 | $ | 14.80 | ||||||||||
|
|
|
|
|
|
|
|
|
| |||||||||||
Total return(b) | 2.27 | % | 0.60 | % | 6.20 | % | 7.91 | % | (7.60 | )% | ||||||||||
RATIOS TO AVERAGE NET ASSETS: | ||||||||||||||||||||
Net assets, end of the period (000’s) | $ | 676,602 | $ | 1,153,853 | $ | 2,248,939 | $ | 3,433,204 | $ | 4,295,139 | ||||||||||
Net expenses | 1.71 | % | 1.71 | % | 1.71 | % | 1.71 | % | 1.69 | % | ||||||||||
Gross expenses | 1.71 | % | 1.71 | % | 1.71 | % | 1.71 | % | 1.69 | % | ||||||||||
Net investment income | 3.30 | % | 2.79 | % | 3.08 | % | 3.26 | % | 3.20 | % | ||||||||||
Portfolio turnover rate | 13 | % | 6 | % | 11 | % | 17 | % | 23 | % | ||||||||||
| (a) | Per share net investment income has been calculated using the average shares outstanding during the period. |
| (b) | A contingent deferred sales charge for Class C shares is not reflected in total return calculations. |
See accompanying notes to financial statements.
| 50
Table of Contents
Financial Highlights (continued)
For a share outstanding throughout each period.
| Strategic Income Fund—Class N | ||||||||||||||||||||
| Year Ended September 30, 2019 | Year Ended September 30, 2018 | Year Ended September 30, 2017 | Year Ended September 30, 2016 | Year Ended September 30, 2015 | ||||||||||||||||
Net asset value, beginning of the period | $ | 14.38 | $ | 14.83 | $ | 14.69 | $ | 14.69 | $ | 16.73 | ||||||||||
|
|
|
|
|
|
|
|
|
| |||||||||||
INCOME (LOSS) FROM INVESTMENT OPERATIONS: | ||||||||||||||||||||
Net investment income(a) | 0.61 | 0.56 | 0.60 | 0.61 | 0.69 | |||||||||||||||
Net realized and unrealized gain (loss) | (0.16 | ) | (0.32 | ) | 0.43 | 0.62 | (1.73 | ) | ||||||||||||
|
|
|
|
|
|
|
|
|
| |||||||||||
Total from Investment Operations | 0.45 | 0.24 | 1.03 | 1.23 | (1.04 | ) | ||||||||||||||
|
|
|
|
|
|
|
|
|
| |||||||||||
LESS DISTRIBUTIONS FROM: | ||||||||||||||||||||
Net investment income | (0.52 | ) | (0.62 | ) | (0.57 | ) | (0.41 | ) | (0.62 | ) | ||||||||||
Net realized capital gains | (0.07 | ) | (0.07 | ) | (0.32 | ) | (0.82 | ) | (0.38 | ) | ||||||||||
|
|
|
|
|
|
|
|
|
| |||||||||||
Total Distributions | (0.59 | ) | (0.69 | ) | (0.89 | ) | (1.23 | ) | (1.00 | ) | ||||||||||
|
|
|
|
|
|
|
|
|
| |||||||||||
Net asset value, end of the period | $ | 14.24 | $ | 14.38 | $ | 14.83 | $ | 14.69 | $ | 14.69 | ||||||||||
|
|
|
|
|
|
|
|
|
| |||||||||||
Total return | 3.37 | % | 1.67 | % | 7.38 | % | 9.09 | % | (6.58 | )% | ||||||||||
RATIOS TO AVERAGE NET ASSETS: | ||||||||||||||||||||
Net assets, end of the period (000’s) | $ | 202,989 | $ | 176,456 | $ | 141,695 | $ | 130,637 | $ | 83,405 | ||||||||||
Net expenses | 0.63 | % | 0.63 | % | 0.63 | % | 0.63 | % | 0.62 | % | ||||||||||
Gross expenses | 0.63 | % | 0.63 | % | 0.63 | % | 0.63 | % | 0.62 | % | ||||||||||
Net investment income | 4.36 | % | 3.91 | % | 4.13 | % | 4.34 | % | 4.33 | % | ||||||||||
Portfolio turnover rate | 13 | % | 6 | % | 11 | % | 17 | % | 23 | % | ||||||||||
| (a) | Per share net investment income has been calculated using the average shares outstanding during the period. |
See accompanying notes to financial statements.
51 |
Table of Contents
Financial Highlights (continued)
For a share outstanding throughout each period.
| Strategic Income Fund—Class Y | ||||||||||||||||||||
| Year Ended September 30, 2019 | Year Ended September 30, 2018 | Year Ended September 30, 2017 | Year Ended September 30, 2016 | Year Ended September 30, 2015 | ||||||||||||||||
Net asset value, beginning of the period | $ | 14.38 | $ | 14.83 | $ | 14.69 | $ | 14.69 | $ | 16.73 | ||||||||||
|
|
|
|
|
|
|
|
|
| |||||||||||
INCOME (LOSS) FROM INVESTMENT OPERATIONS: | ||||||||||||||||||||
Net investment income(a) | 0.60 | 0.55 | 0.59 | 0.61 | 0.68 | |||||||||||||||
Net realized and unrealized gain (loss) | (0.17 | ) | (0.32 | ) | 0.43 | 0.61 | (1.73 | ) | ||||||||||||
|
|
|
|
|
|
|
|
|
| |||||||||||
Total from Investment Operations | 0.43 | 0.23 | 1.02 | 1.22 | (1.05 | ) | ||||||||||||||
|
|
|
|
|
|
|
|
|
| |||||||||||
LESS DISTRIBUTIONS FROM: | ||||||||||||||||||||
Net investment income | (0.51 | ) | (0.61 | ) | (0.56 | ) | (0.40 | ) | (0.61 | ) | ||||||||||
Net realized capital gains | (0.07 | ) | (0.07 | ) | (0.32 | ) | (0.82 | ) | (0.38 | ) | ||||||||||
|
|
|
|
|
|
|
|
|
| |||||||||||
Total Distributions | (0.58 | ) | (0.68 | ) | (0.88 | ) | (1.22 | ) | (0.99 | ) | ||||||||||
|
|
|
|
|
|
|
|
|
| |||||||||||
Net asset value, end of the period | $ | 14.23 | $ | 14.38 | $ | 14.83 | $ | 14.69 | $ | 14.69 | ||||||||||
|
|
|
|
|
|
|
|
|
| |||||||||||
Total return | 3.22 | % | 1.66 | % | 7.22 | % | 9.00 | % | (6.65 | )% | ||||||||||
RATIOS TO AVERAGE NET ASSETS: | ||||||||||||||||||||
Net assets, end of the period (000’s) | $ | 4,316,010 | $ | 5,118,016 | $ | 5,702,607 | $ | 5,350,759 | $ | 7,018,369 | ||||||||||
Net expenses | 0.71 | % | 0.71 | % | 0.71 | % | 0.71 | % | 0.69 | % | ||||||||||
Gross expenses | 0.71 | % | 0.71 | % | 0.71 | % | 0.71 | % | 0.69 | % | ||||||||||
Net investment income | 4.28 | % | 3.82 | % | 4.04 | % | 4.26 | % | 4.21 | % | ||||||||||
Portfolio turnover rate | 13 | % | 6 | % | 11 | % | 17 | % | 23 | % | ||||||||||
| (a) | Per share net investment income has been calculated using the average shares outstanding during the period. |
See accompanying notes to financial statements.
| 52
Table of Contents
Financial Highlights (continued)
For a share outstanding throughout each period.
| Strategic Income Fund—Admin Class | ||||||||||||||||||||
| Year Ended September 30, 2019 | Year Ended September 30, 2018 | Year Ended September 30, 2017 | Year Ended September 30, 2016 | Year Ended September 30, 2015 | ||||||||||||||||
Net asset value, beginning of the period | $ | 14.34 | $ | 14.79 | $ | 14.65 | $ | 14.66 | $ | 16.70 | ||||||||||
|
|
|
|
|
|
|
|
|
| |||||||||||
INCOME (LOSS) FROM INVESTMENT OPERATIONS: | ||||||||||||||||||||
Net investment income(a) | 0.53 | 0.48 | 0.52 | 0.53 | 0.60 | |||||||||||||||
Net realized and unrealized gain (loss) | (0.16 | ) | (0.33 | ) | 0.43 | 0.61 | (1.73 | ) | ||||||||||||
|
|
|
|
|
|
|
|
|
| |||||||||||
Total from Investment Operations | 0.37 | 0.15 | 0.95 | 1.14 | (1.13 | ) | ||||||||||||||
|
|
|
|
|
|
|
|
|
| |||||||||||
LESS DISTRIBUTIONS FROM: | ||||||||||||||||||||
Net investment income | (0.44 | ) | (0.53 | ) | (0.49 | ) | (0.33 | ) | (0.53 | ) | ||||||||||
Net realized capital gains | (0.07 | ) | (0.07 | ) | (0.32 | ) | (0.82 | ) | (0.38 | ) | ||||||||||
|
|
|
|
|
|
|
|
|
| |||||||||||
Total Distributions | (0.51 | ) | (0.60 | ) | (0.81 | ) | (1.15 | ) | (0.91 | ) | ||||||||||
|
|
|
|
|
|
|
|
|
| |||||||||||
Net asset value, end of the period | $ | 14.20 | $ | 14.34 | $ | 14.79 | $ | 14.65 | $ | 14.66 | ||||||||||
|
|
|
|
|
|
|
|
|
| |||||||||||
Total return | 2.78 | % | 1.09 | % | 6.79 | % | 8.42 | % | (7.13 | )% | ||||||||||
RATIOS TO AVERAGE NET ASSETS: | ||||||||||||||||||||
Net assets, end of the period (000’s) | $ | 121,903 | $ | 133,220 | $ | 142,871 | $ | 143,275 | $ | 141,844 | ||||||||||
Net expenses | 1.20 | %(b) | 1.20 | %(c) | 1.19 | %(d) | 1.20 | %(c) | 1.19 | % | ||||||||||
Gross expenses | 1.20 | %(b) | 1.20 | %(c) | 1.19 | %(d) | 1.20 | %(c) | 1.19 | % | ||||||||||
Net investment income | 3.80 | % | 3.33 | % | 3.57 | % | 3.76 | % | 3.73 | % | ||||||||||
Portfolio turnover rate | 13 | % | 6 | % | 11 | % | 17 | % | 23 | % | ||||||||||
| (a) | Per share net investment income has been calculated using the average shares outstanding during the period. |
| (b) | Includes refund of prior year service fee of 0.01%. See Note 5b of Notes to Financial Statements. |
| (c) | Includes refund of prior year service fee of 0.01%. |
| (d) | Includes refund of prior year service fee of 0.02%. |
See accompanying notes to financial statements.
53 |
Table of Contents
September 30, 2019
1. Organization. Loomis Sayles Funds II (the “Trust”) is organized as a Massachusetts business trust. The Trust is registered under the Investment Company Act of 1940, as amended (the “1940 Act”), as anopen-end management investment company. The Declaration of Trust permits the Board of Trustees to authorize the issuance of an unlimited number of shares of the Trust in multiple series. The financial statements for certain funds of the Trust are presented in separate reports. The following funds (individually, a “Fund” and collectively, the “Funds”) are included in this report:
Loomis Sayles Growth Fund (the “Growth Fund”)
Loomis Sayles Strategic Income Fund (the “Strategic Income Fund”)
Each Fund is a diversified investment company.
Growth Fund was closed to new investors effective April 28, 2017. Growth Fund offers Class A, Class C, Class N, and Class Y shares to defined contribution and defined benefit plans, clients of registered investment advisers and registered representatives trading through intermediary programs/platforms on which the Fund is already available and existing shareholders. Strategic Income Fund offers Class A, Class C, Class N, Class Y and Admin Class shares.
Class A shares are sold with a maximumfront-end sales charge of 5.75% for Growth Fund and 4.25% for Strategic Income Fund. Class C shares do not pay afront-end sales charge, pay higher Rule12b-1 fees than Class A shares for ten years (at which point they automatically convert to Class A shares) and may be subject to a contingent deferred sales charge (“CDSC”) of 1.00% if those shares are redeemed within one year of acquisition, except for reinvested distributions. Class N and Class Y shares do not pay afront-end sales charge, a CDSC or Rule12b-1 fees. Class N shares are offered with an initial minimum investment of $1,000,000. Class Y shares are offered with an initial minimum investment of $100,000. Certain categories of investors are exempted from the minimum investment amounts as outlined in the relevant Funds’ prospectus. Admin Class shares do not pay afront-end sales charge or a CDSC, but do pay aRule 12b-1 fee. Admin Class shares are offered exclusively through intermediaries.
Most expenses can be directly attributed to a Fund. Expenses which cannot be directly attributed to a Fund are generally apportioned based on the relative net assets of each of the funds in Natixis Funds Trust I, Natixis Funds Trust II, Natixis Funds Trust IV, and Gateway Trust (“Natixis Funds Trusts”), Loomis Sayles Funds I and Loomis Sayles Funds II (“Loomis Sayles Funds Trusts”) and Natixis ETF Trust. Expenses of a Fund are bornepro rataby the holders of each class of shares, except that each class bears expenses unique to that class (such as the Rule12b-1 fees applicable to Class A, Class C and Admin Class), and transfer agent fees are borne collectively for Class A, Class C, Class Y, and Admin Class and individually for Class N. In addition, each class votes as a class only with respect to its own Rule12b-1 Plan. Shares of each class would receive theirpro rata share of the net assets of the Fund if the Fund were liquidated. The Trustees approve separate distributions from net investment income on each class of shares.
| 54
Table of Contents
Notes to Financial Statements (continued)
September 30, 2019
2. Significant Accounting Policies. The following is a summary of significant accounting policies consistently followed by each Fund in the preparation of its financial statements. The Funds’ financial statements follow the accounting and reporting guidelines provided for investment companies and are prepared in accordance with accounting principles generally accepted in the United States of America which require the use of management estimates that affect the reported amounts and disclosures in the financial statements. Actual results could differ from those estimates. Management has evaluated the events and transactions subsequent to year-end through the date the financial statements were issued and has determined that there were no material events that would require disclosure in the Funds’ financial statements.
a. Valuation. Fund securities and other investments are valued at market value based on market quotations obtained or determined by independent pricing services recommended by the adviser and approved by the Board of Trustees. Fund securities and other investments for which market quotations are not readily available are valued at fair value as determined in good faith by the adviser pursuant to procedures approved by the Board of Trustees, as described below. Market value is determined as follows:
Listed equity securities (including shares ofclosed-end investment companies and exchange-traded funds) are valued at the last sale price quoted on the exchange where they are traded most extensively or, if there is no reported sale during the day, the closing bid quotation as reported by an independent pricing service. Securities traded on the NASDAQ Global Select Market, NASDAQ Global Market and NASDAQ Capital Market are valued at the NASDAQ Official Closing Price (“NOCP”), or if lacking an NOCP, at the most recent bid quotations on the applicable NASDAQ Market. Unlisted equity securities (except unlisted preferred equity securities) are valued at the last sale price quoted in the market where they are traded most extensively or, if there is no reported sale during the day, the closing bid quotation as reported by an independent pricing service. If there is no last sale price or closing bid quotation available, unlisted equity securities will be valued using evaluated bids furnished by an independent pricing service, if available. In some foreign markets, an official close price and a last sale price may be available from the foreign exchange or market. In those cases, the official close price is used. Debt securities and unlisted preferred equity securities are valued based on evaluated bids furnished to the Funds by an independent pricing service or bid prices obtained from broker-dealers. Senior loans are valued at bid prices supplied by an independent pricing service, if available. Broker-dealer bid prices may be used to value debt and unlisted equity securities and senior loans where an independent pricing service is unable to price a security or where an independent pricing service does not provide a reliable price for the security.
55 |
Table of Contents
Notes to Financial Statements (continued)
September 30, 2019
Fund securities and other investments for which market quotations are not readily available are valued at fair value as determined in good faith by the adviser pursuant to procedures approved by the Board of Trustees. The Funds may also value securities and other investments at fair value in other circumstances such as when extraordinary events occur after the close of a foreign market but prior to the close of the New York Stock Exchange. This may include situations relating to a single issuer (such as a declaration of bankruptcy or a delisting of the issuer’s security from the primary market on which it has traded) as well as events affecting the securities markets in general (such as market disruptions or closings and significant fluctuations in U.S. and/or foreign markets). When fair valuing its securities or other investments, the Funds may, among other things, use modeling tools or other processes that may take into account factors such as securities or other market activity and/or significant events that occur after the close of the foreign market and before the time the Fund’s net asset value (“NAV”) is calculated. Fair value pricing may require subjective determinations about the value of a security, and fair values used to determine a Fund’s NAV may differ from quoted or published prices, or from prices that are used by others, for the same securities. In addition, the use of fair value pricing may not always result in adjustments to the prices of securities held by a Fund.
Illiquid securities for which market quotations are readily available and have been evaluated by the adviser are considered and classified as fair valued securities pursuant to the Funds’ pricing policies and procedures.
As of September 30, 2019, securities held by Strategic Income Fund were fair valued as follows:
Securities | Percentage of | Securities fair | Percentage of | |||||||||
$281,374,794 | 3.9 | % | $ | 26,946,885 | 0.4 | % | ||||||
b. Investment Transactions and Related Investment Income. Investment transactions are accounted for on a trade date plus one day basis for daily NAV calculation. However, for financial reporting purposes, investment transactions are reported on trade date. Dividend income (including income reinvested) and foreign withholding tax, if applicable, is recorded on theex-dividend date, or in the case of certain foreign securities, as soon as a Fund is notified, and interest income is recorded on an accrual basis. Interest income is increased by the accretion of discount and decreased by the amortization of premium, if applicable. Distributions received from investments in securities that represent a return of capital or capital gain are recorded as a reduction of cost of investments or as a realized gain, respectively. In determining net gain or loss on securities sold, the cost of securities has been determined on an identified cost basis. Investment income,non-class specific expenses and realized and unrealized gains and losses are allocated on apro rata basis to each class based on the relative net assets of each class to the total net assets of the Fund.
| 56
Table of Contents
Notes to Financial Statements (continued)
September 30, 2019
c. Foreign Currency Translation. The books and records of the Funds are maintained in U.S. dollars. The values of securities, currencies and other assets and liabilities denominated in currencies other than U.S. dollars, if any, are translated into U.S. dollars based upon foreign exchange rates prevailing at the end of the period. Purchases and sales of investment securities, income and expenses are translated into U.S. dollars on the respective dates of such transactions.
Net realized foreign exchange gains or losses arise from sales of foreign currency, changes in exchange rates between the trade and settlement dates on securities transactions and the difference between the amounts of dividends, interest and foreign withholding taxes recorded on the Funds’ books and the U.S. dollar equivalent of the amounts actually received or paid. Net unrealized foreign exchange gains or losses arise from changes in the value of assets and liabilities, other than investment securities, as of the end of the fiscal period, resulting from changes in exchange rates. Net realized foreign exchange gains or losses and the net change in unrealized foreign exchange gains or losses are disclosed in the Statements of Operations. For federal income tax purposes, net realized foreign exchange gains or losses are characterized as ordinary income and may, if the Funds have net losses, reduce the amount of income available to be distributed by the Funds.
The values of investment securities are presented at the foreign exchange rates prevailing at the end of the period for financial reporting purposes. Net realized and unrealized gains or losses on investments reported in the Statements of Operations reflect gains or losses resulting from changes in exchange rates and fluctuations which arise due to changes in market prices of investment securities. For federal income tax purposes, a portion of the net realized gain or loss on investments arising from changes in exchange rates, which is reflected in the Statements of Operations, may be characterized as ordinary income and may, if the Funds have net losses, reduce the amount of income available to be distributed by the Funds.
For the year ended September 30, 2019, the amount of income available to be distributed by the Strategic Income Fund has been reduced by $74,670,553 as a result of losses arising from changes in exchange rates.
The Funds may use foreign currency exchange contracts to facilitate transactions in foreign-denominated investments. Losses may arise from changes in the value of the foreign currency or if the counterparties do not perform under the contracts’ terms.
d. Federal and Foreign Income Taxes. The Trust treats each Fund as a separate entity for federal income tax purposes. Each Fund intends to meet the requirements of the Internal Revenue Code of 1986, as amended, applicable to regulated investment companies, and to distribute to its shareholders substantially all of its net investment income and any net realized capital gains at least annually. Management has performed an analysis of each Fund’s tax positions for the open tax years as of
57 |
Table of Contents
Notes to Financial Statements (continued)
September 30, 2019
September 30, 2019 and has concluded that no provisions for income tax are required. The Funds’ federal tax returns for the prior three fiscal years remain subject to examination by the Internal Revenue Service. Management is not aware of any events that are reasonably possible to occur in the next twelve months that would result in the amounts of any unrecognized tax benefits significantly increasing or decreasing for the Funds. However, management’s conclusions regarding tax positions taken may be subject to review and adjustment at a later date based on factors including, but not limited to, new tax laws and accounting regulations and interpretations thereof.
A Fund may be subject to foreign withholding taxes on investment income and taxes on capital gains on investments that are accrued and paid based upon the Fund’s understanding of the tax rules and regulations that exist in the countries in which the Fund invests. Foreign withholding taxes on dividend and interest income are reflected on the Statements of Operations as a reduction of investment income, net of amounts eligible to be reclaimed. Dividends and interest receivable on the Statements of Assets and Liabilities are net of foreign withholding taxes. Foreign withholding taxes where reclaims have been or will be filed are reflected on the Statements of Assets and Liabilities as tax reclaims receivable. Capital gains taxes paid are included in net realized gain (loss) on investments in the Statements of Operations. Accrued but unpaid capital gains taxes are reflected as foreign taxes payable on the Statements of Assets and Liabilities, if applicable, and reduce unrealized gains on investments. In the event that realized gains on investments are subsequently offset by realized losses, taxes paid on realized gains may be returned to a Fund. Such amounts, if applicable, are reflected as foreign tax rebates receivable on the Statements of Assets and Liabilities and are recorded as a realized gain when received.
e. Dividends and Distributions to Shareholders. Dividends and distributions are recorded on theex-dividend date. The timing and characterization of certain income and capital gain distributions are determined in accordance with federal tax regulations, which may differ from accounting principles generally accepted in the United States of America. Permanent differences are primarily due to differing treatments for book and tax purposes of items such as distributionre-designations, defaulted and/ornon-income producing securities, foreign currency gains and losses, premium amortization, convertible bonds, paydown gains and losses, partnership basis adjustments and deferred Trustees’ fees. Permanent book and tax basis differences relating to shareholder distributions will result in reclassifications to capital accounts reported on the Statements of Assets and Liabilities. Temporary differences between book and tax distributable earnings are primarily due to corporate actions, deferred Trustees’ fees, wash sales, premium amortization, return of capital distributions received, trust preferred securities, defaulted and/ornon-income producing securities, contingent payment debt instruments, partnership basis adjustments and convertible bonds. Amounts of income and capital gain available to be distributed on a tax basis are determined annually, and at other times during the Funds’ fiscal year as may be
| 58
Table of Contents
Notes to Financial Statements (continued)
September 30, 2019
necessary to avoid knowingly declaring and paying a return of capital distribution. Distributions from net investment income and net realized short-term capital gains are reported as distributed from ordinary income for tax purposes.
The tax characterization of distributions is determined on an annual basis. The tax character of distributions paid to shareholders during the years ended September 30, 2019 and 2018 were as follows:
| 2019 Distributions Paid From: | 2018 Distributions Paid From: | |||||||||||||||||||||||
Fund | Ordinary | Long-Term | Total | Ordinary | Long-Term | Total | ||||||||||||||||||
Growth Fund | $ | 44,783,074 | $ | 359,635,192 | $ | 404,418,266 | $ | 38,048,905 | $ | 144,994,363 | $ | 183,043,268 | ||||||||||||
Strategic Income Fund | 263,812,130 | 37,679,164 | 301,491,294 | 365,189,758 | 45,455,828 | 410,645,586 | ||||||||||||||||||
Distributions paid to shareholders from net investment income and net realized capital gains, based on accounting principles generally accepted in the United States of America, are consolidated and reported on the Statements of Changes in Net Assets as Distributions to Shareholders. Distributions paid to shareholders from net investment income and net realized capital gains expressed inper-share amounts, based on accounting principles generally accepted in the United States of America, are separately stated and reported within the Financial Highlights.
As of September 30, 2019, the components of distributable earnings on a tax basis were as follows:
Growth Fund | Strategic | |||||||
Undistributed ordinary income | $ | 35,874,698 | $ | 15,925,222 | ||||
Undistributed long-term capital gains | 165,721,571 | 9,981,228 | ||||||
|
|
|
| |||||
Total undistributed earnings | 201,596,269 | 25,906,450 | ||||||
|
|
|
| |||||
Unrealized appreciation (depreciation) | 2,551,956,818 | (450,174,382 | ) | |||||
|
|
|
| |||||
Total accumulated earnings (losses) | $ | 2,753,553,087 | $ | (424,267,932 | ) | |||
|
|
|
| |||||
As of September 30, 2019, unrealized appreciation (depreciation) as a component of distributable earnings were as follows:
Growth Fund | Strategic | |||||||
Unrealized appreciation (depreciation) | ||||||||
Investments | $ | 2,551,956,818 | $ | (9,191,273 | ) | |||
Foreign currency translations | — | (440,983,109 | ) | |||||
|
|
|
| |||||
Total unrealized appreciation (depreciation) | $ | 2,551,956,818 | $ | (450,174,382 | ) | |||
|
|
|
| |||||
59 |
Table of Contents
Notes to Financial Statements (continued)
September 30, 2019
As of September 30, 2019, the tax cost of investments and unrealized appreciation (depreciation) on a federal tax basis were as follows:
Growth Fund | Strategic | |||||||
Federal tax cost | $ | 6,314,161,192 | $ | 7,524,833,787 | ||||
|
|
|
| |||||
Gross tax appreciation | $ | 2,737,655,193 | $ | 561,473,745 | ||||
Gross tax depreciation | (185,698,375 | ) | (1,011,240,282 | ) | ||||
|
|
|
| |||||
Net tax appreciation (depreciation) | $ | 2,551,956,818 | $ | (449,766,537 | ) | |||
|
|
|
| |||||
The difference between these amounts and those reported in the components of distributable earnings are primarily attributable to foreign currencymark-to-market.
f. Senior Loans. Strategic Income Fund may invest in senior loans to corporate, governmental or other borrowers. Senior loans, which include both secured and unsecured loans made by banks and other financial institutions to corporate customers, typically hold the most senior position in a borrower’s capital structure, may be secured by the borrower’s assets and have interest rates that reset frequently. Senior Loans can include term loans, revolving credit facility loans and second lien loans. A senior loan is often administered by a bank or other financial institution that acts as agent for all holders. The agent administers the terms of the senior loan, as specified in the loan agreement. Large loans may be shared or syndicated among several lenders. The Fund may enter into the primary syndicate for a loan or it may also purchase all or a portion of loans from other lenders (sometimes referred to as loan assignments), in either case becoming a direct lender. Senior loans outstanding at the end of the period are listed in the Fund’s Portfolio of Investments.
g. Loan Participations. A Fund’s investments in senior loans may be in the form of participations in loans. When investing in a loan participation, a Fund has the right to receive payments of principal, interest and any fees to which it is entitled only from the party from whom the Fund has purchased the participation and only upon receipt by that party of payments from the borrower. A Fund generally has no right to enforce compliance by the borrower with the terms of the loan agreement or to vote on matters arising under the loan agreement. Thus, a Fund may be subject to credit risk from both the party from whom it purchased the loan participation and the borrower. Additionally, a Fund may have minimal control over the terms of any loan modification. Loan participations outstanding at the end of the period, if any, are listed in each applicable Fund’s Portfolio of Investments.
There were no loan participations held by the Funds as of September 30, 2019.
h. Repurchase Agreements. Each Fund may enter into repurchase agreements, under the terms of a Master Repurchase Agreement, under which each Fund acquires securities as collateral and agrees to resell the securities at an agreed upon time and
| 60
Table of Contents
Notes to Financial Statements (continued)
September 30, 2019
at an agreed upon price. It is each Fund’s policy that the market value of the collateral for repurchase agreements be at least equal to 102% of the repurchase price, including interest. Certain repurchase agreements aretri-party arrangements whereby the collateral is held in a segregated account for the benefit of the Fund and on behalf of the counterparty. Repurchase agreements could involve certain risks in the event of default or insolvency of the counterparty, including possible delays or restrictions upon a Fund’s ability to dispose of the underlying securities. As of September 30, 2019, each Fund, as applicable, had investments in repurchase agreements for which the value of the related collateral exceeded the value of the repurchase agreement. The gross value of repurchase agreements is included in the Statements of Assets and Liabilities for financial reporting purposes.
i. Securities Lending. The Funds have entered into an agreement with State Street Bank and Trust Company (“State Street Bank”), as agent of the Funds, to lend securities to certain designated borrowers. The loans are collateralized with cash or securities in an amount equal to at least 105% or 102% of the market value (including accrued interest) of the loaned international or domestic securities, respectively, when the loan is initiated. Thereafter, the value of the collateral must remain at least 102% of the market value (including accrued interest) of loaned securities for U.S. equities and U.S. corporate debt; at least 105% of the market value (including accrued interest) of loaned securities fornon-U.S. equities; and at least 100% of the market value (including accrued interest) of loaned securities for U.S. Government securities, sovereign debt issued bynon-U.S. Governments andnon-U.S. corporate debt. In the event that the market value of the collateral falls below the required percentages described above, the borrower will deliver additional collateral on the next business day. As with other extensions of credit, the Funds may bear the risk of loss with respect to the investment of the collateral. The Funds invest cash collateral in short-term investments, a portion of the income from which is remitted to the borrowers and the remainder allocated between the Funds and State Street Bank as lending agent.
For the year ended September 30, 2019, neither Fund had loaned securities under this agreement.
j. Indemnifications. Under the Trust’s organizational documents, its officers and Trustees are indemnified against certain liabilities arising out of the performance of their duties to the Funds. Additionally, in the normal course of business, the Funds enter into contracts with service providers that contain general indemnification clauses. The Funds’ maximum exposure under these arrangements is unknown as this would involve future claims that may be made against the Funds that have not yet occurred. However, based on experience, the Funds expect the risk of loss to be remote.
k. New Accounting Pronouncement. In March 2017, the Financial Accounting Standards Board (FASB) issued Accounting Standards Update (ASU)No. 2017-08, Receivables — Nonrefundable Fees and Other Costs (Subtopic310-20): Premium
61 |
Table of Contents
Notes to Financial Statements (continued)
September 30, 2019
Amortization on Purchased Callable Debt Securities. The amendments in the ASU shorten the amortization period for certain callable debt securities acquired at a premium, to be amortized to the earliest call date. The ASU is effective for fiscal years and interim periods within those fiscal years beginning after December 15, 2018. Management has evaluated the application of this provision for Strategic Income Fund and has determined there will be no impact on the net asset value of the Fund.
3. Fair Value Measurements. In accordance with accounting standards related to fair value measurements and disclosures, the Funds have categorized the inputs utilized in determining the value of each Fund’s assets or liabilities. These inputs are summarized in the three broad levels listed below:
| �� | Level 1 – quoted prices in active markets for identical assets or liabilities; |
| • | Level 2 – prices determined using other significant inputs that are observable either directly, or indirectly through corroboration with observable market data (which could include quoted prices for similar assets or liabilities, interest rates, credit risk, etc.); and |
| • | Level 3 – prices determined using significant unobservable inputs when quoted prices or observable inputs are unavailable such as when there is little or no market activity for an asset or liability (unobservable inputs reflect each Fund’s own assumptions in determining the fair value of assets or liabilities and would be based on the best information available). |
The inputs or methodology used for valuing securities are not necessarily an indication of the risk associated with investing in those securities.
The Funds’ pricing policies and procedures are recommended by the adviser and approved by the Board of Trustees. Debt securities are valued based on evaluated bids furnished to the Funds by an independent pricing service. Broker-dealer bid prices may be used if an independent pricing service either is unable to price a security or does not provide a reliable price for a security. Broker-dealer bid prices for which the Funds do not have knowledge of the inputs used by the broker-dealer are categorized in Level 3. All security prices, including those obtained from an independent pricing service and broker-dealer bid prices, are reviewed on a daily basis by the adviser, subject to oversight by Fund management and the Board of Trustees. If the adviser, in good faith, believes that the price provided by an independent pricing service is unreliable, broker-dealer bid prices may be used until the price provided by the independent pricing service is considered to be reliable. Reliability of all security prices, including those obtained from an independent pricing service and broker-dealer bid prices, is tested in a variety of ways, including comparison to recent transaction prices and daily fluctuations, amongst other validation procedures in place. Securities for which market quotations are not readily available are valued at fair value as
| 62
Table of Contents
Notes to Financial Statements (continued)
September 30, 2019
determined in good faith by the Funds’ adviser pursuant to procedures approved by the Board of Trustees. Fair valued securities may be categorized in Level 3.
The following is a summary of the inputs used to value the Funds’ investments as of September 30, 2019, at value:
Growth Fund
Asset Valuation Inputs
Description | Level 1 | Level 2 | Level 3 | Total | ||||||||||||
Common Stocks(a) | $ | 8,710,918,218 | $ | — | $ | — | $ | 8,710,918,218 | ||||||||
Short-Term Investments | — | 155,199,792 | — | 155,199,792 | ||||||||||||
|
|
|
|
|
|
|
| |||||||||
Total | $ | 8,710,918,218 | $ | 155,199,792 | $ | — | $ | 8,866,118,010 | ||||||||
|
|
|
|
|
|
|
| |||||||||
| (a) | Details of the major categories of the Fund’s investments are reflected within the Portfolio of Investments. |
For the year ended September 30, 2019, there were no transfers among Levels 1, 2 and 3.
Strategic Income Fund
Asset Valuation Inputs
Description | Level 1 | Level 2 | Level 3 | Total | ||||||||||||
Bonds and Notes | ||||||||||||||||
Non-Convertible Bonds | ||||||||||||||||
ABS Other | $ | — | $ | 7,833,190 | $ | 23,351,916 | (b)(c) | $ | 31,185,106 | |||||||
Finance Companies | 2,553,864 | 256,801,377 | — | 259,355,241 | ||||||||||||
Independent Energy | — | 272,590,239 | 3,593,400 | (c)(d) | 276,183,639 | |||||||||||
All OtherNon-Convertible Bonds(a) | — | 3,715,929,070 | — | 3,715,929,070 | ||||||||||||
|
|
|
|
|
|
|
| |||||||||
TotalNon-Convertible Bonds | 2,553,864 | 4,253,153,876 | 26,945,316 | 4,282,653,056 | ||||||||||||
|
|
|
|
|
|
|
| |||||||||
Convertible Bonds(a) | — | 330,308,659 | — | 330,308,659 | ||||||||||||
Municipals(a) | — | 132,087,012 | — | 132,087,012 | ||||||||||||
|
|
|
|
|
|
|
| |||||||||
Total Bonds and Notes | 2,553,864 | 4,715,549,547 | 26,945,316 | 4,745,048,727 | ||||||||||||
|
|
|
|
|
|
|
| |||||||||
63 |
Table of Contents
Notes to Financial Statements (continued)
September 30, 2019
Strategic Income Fund (continued)
Asset Valuation Inputs (continued)
Description | Level 1 | Level 2 | Level 3 | Total | ||||||||||||
Senior Loans(a) | $ | — | $ | 63,089,389 | $ | — | $ | 63,089,389 | ||||||||
Common Stocks | ||||||||||||||||
Chemicals | — | 8,157,015 | — | 8,157,015 | ||||||||||||
Media | 10,487,904 | 866,753 | — | 11,354,657 | ||||||||||||
Oil, Gas & Consumable Fuels | 1,250,377 | 4,063,845 | 1,569 | (c)(d) | 5,315,791 | |||||||||||
Specialty Retail | — | — | — | (c) | — | |||||||||||
All Other Common Stocks(a) | 655,938,896 | — | — | 655,938,896 | ||||||||||||
|
|
|
|
|
|
|
| |||||||||
Total Common Stocks | 667,677,177 | 13,087,613 | 1,569 | 680,766,359 | ||||||||||||
|
|
|
|
|
|
|
| |||||||||
Preferred Stocks | ||||||||||||||||
Convertible Preferred Stocks | ||||||||||||||||
Independent Energy | 7,427,417 | 9,154,808 | 11,391,481 | (e) | 27,973,706 | |||||||||||
Midstream | 12,713,324 | — | 25,613,285 | (e) | 38,326,609 | |||||||||||
REITs - Diversified | — | 17,404,000 | — | 17,404,000 | ||||||||||||
All Other Convertible Preferred Stocks(a) | 12,784,207 | — | — | 12,784,207 | ||||||||||||
|
|
|
|
|
|
|
| |||||||||
Total Convertible Preferred Stocks | 32,924,948 | 26,558,808 | 37,004,766 | 96,488,522 | ||||||||||||
|
|
|
|
|
|
|
| |||||||||
Non-Convertible Preferred Stocks | ||||||||||||||||
REITs - Office Property | — | 1,899,240 | — | 1,899,240 | ||||||||||||
REITs - Warehouse/Industrials | — | 8,394,872 | — | 8,394,872 | ||||||||||||
All OtherNon-Convertible Preferred Stocks(a) | 963,448 | — | — | 963,448 | ||||||||||||
|
|
|
|
|
|
|
| |||||||||
TotalNon-Convertible Preferred Stocks | 963,448 | 10,294,112 | — | 11,257,560 | ||||||||||||
|
|
|
|
|
|
|
| |||||||||
Total Preferred Stocks | 33,888,396 | 36,852,920 | 37,004,766 | 107,746,082 | ||||||||||||
|
|
|
|
|
|
|
| |||||||||
Closed-End Investment Companies | 3,053,156 | — | — | 3,053,156 | ||||||||||||
Warrants | — | 10,715,230 | — | 10,715,230 | ||||||||||||
Short-Term Investments | — | 1,464,651,961 | — | 1,464,651,961 | ||||||||||||
|
|
|
|
|
|
|
| |||||||||
Total | $ | 707,172,593 | $ | 6,303,946,660 | $ | 63,951,651 | $ | 7,075,070,904 | ||||||||
|
|
|
|
|
|
|
| |||||||||
| (a) | Details of the major categories of the Fund’s investments are reflected within the Portfolio of Investments. |
| 64
Table of Contents
Notes to Financial Statements (continued)
September 30, 2019
| (b) | Fair valued by the Fund’s adviser ($5,315,639) or fair valued by the Fund’s adviser using broker-dealer bid prices for which the inputs are unobservable to the Fund ($18,036,277). |
| (c) | Includes a security fair valued at zero using Level 3 inputs. |
| (d) | Fair valued by the Fund’s adviser. |
| (e) | Valued using broker-dealer bid prices. |
The following is a reconciliation of Level 3 investments for which significant unobservable inputs were used to determine fair value as of September 30, 2018 and/or September 30, 2019:
Strategic Income Fund
Asset Valuation Inputs
Investments in Securities | Balance as of | Accrued | Realized | Change in | Purchases | |||||||||||||||
Bonds and Notes | ||||||||||||||||||||
Non-Convertible Bonds | ||||||||||||||||||||
ABS Other | $ | 20,680,219 | (a) | $ | — | $ | — | $ | 2,140,991 | $ | 1,293,691 | |||||||||
Airlines | 455,986 | — | — | — | — | |||||||||||||||
Independent Energy | — | 101,673 | — | (6,684,653 | ) | 10,176,380 | ||||||||||||||
Metals & Mining | 4,101 | (23,510 | ) | (8,068,536 | ) | 8,087,945 | — | |||||||||||||
Loan Participations | ||||||||||||||||||||
ABS Other | 8,343,807 | — | (65,527 | ) | 458,691 | — | ||||||||||||||
Common Stocks | ||||||||||||||||||||
Oil, Gas & Consumable Fuels | — | — | — | (3,142,069 | ) | 3,016,862 | ||||||||||||||
Specialty Retail | — | (a) | — | — | — | — | ||||||||||||||
Preferred Stocks | ||||||||||||||||||||
Convertible Preferred Stocks | ||||||||||||||||||||
Independent Energy | — | — | — | (8,083,554 | ) | — | ||||||||||||||
Midstream | — | — | — | (19,374,997 | ) | 2,688,242 | ||||||||||||||
|
|
|
|
|
|
|
|
|
| |||||||||||
Total | $ | 29,484,113 | $ | 78,163 | $ | (8,134,063 | ) | $ | (26,597,646 | ) | $ | 17,175,175 | ||||||||
|
|
|
|
|
|
|
|
|
| |||||||||||
65 |
Table of Contents
Notes to Financial Statements (continued)
September 30, 2019
Strategic Income Fund (continued)
Asset Valuation Inputs (continued)
Investments in Securities | Sales | Transfers | Transfers | Balance as of | Change in | |||||||||||||||
Bonds and Notes | ||||||||||||||||||||
Non-Convertible Bonds | ||||||||||||||||||||
ABS Other | $ | (762,985 | ) | $ | — | $ | — | $ | 23,351,916 | (a) | $ | 2,101,709 | ||||||||
Airlines | — | — | (455,986 | ) | — | — | ||||||||||||||
Independent Energy | — | — | — | 3,593,400 | (a) | (6,684,653 | ) | |||||||||||||
Metals & Mining | — | — | — | — | — | |||||||||||||||
Loan Participations | ||||||||||||||||||||
ABS Other | (8,736,971 | ) | — | — | — | — | ||||||||||||||
Common Stocks | ||||||||||||||||||||
Oil, Gas & Consumable Fuels | — | 126,776 | — | 1,569 | (a) | (3,142,069 | ) | |||||||||||||
Specialty Retail | — | — | — | — | (a) | — | ||||||||||||||
Preferred Stocks | ||||||||||||||||||||
Convertible Preferred Stocks | ||||||||||||||||||||
Independent Energy | — | 19,475,035 | — | 11,391,481 | (8,083,554 | ) | ||||||||||||||
Midstream | — | 42,300,040 | — | 25,613,285 | (19,374,997 | ) | ||||||||||||||
|
|
|
|
|
|
|
|
|
| |||||||||||
Total | $ | (9,499,956 | ) | $ | 61,901,851 | $ | (455,986 | ) | $ | 63,951,651 | $ | (35,183,564 | ) | |||||||
|
|
|
|
|
|
|
|
|
| |||||||||||
| (a) | Includes a security fair valued at zero using Level 3 inputs. |
A debt security valued at $455,986 was transferred from Level 3 to Level 2 during the period ended September 30, 2019. At September 30, 2018, this security was valued using broker-dealer bid prices based on inputs unobservable to the Fund as an independent pricing service was unable to price the security. At September 30, 2019, this security was valued on the basis of evaluated bids furnished to the Fund by an independent pricing service in accordance with the Fund’s valuation policies.
| 66
Table of Contents
Notes to Financial Statements (continued)
September 30, 2019
A common stock valued at $126,776 was transferred from Level 2 to Level 3 during the period ended September 30, 2019. At September 30, 2018, this security was valued on the basis of closing bid quotations furnished to the Fund by an independent pricing service in accordance with the Fund’s valuation policies. At September 30, 2019, this security was valued at fair value as determined in good faith by the Fund’s adviser as an independent pricing service did not provide a reliable price for the security.
Preferred stocks valued at $61,775,075 were transferred from Level 2 to Level 3 during the period ended September 30, 2019. At September 30, 2018, these securities were valued on the basis of evaluated bids furnished to the Fund by an independent pricing service in accordance with the Fund’s valuation policies. At September 30, 2019, these securities were valued using broker-dealer bid prices based on inputs unobservable to the Fund as an independent pricing service did not provide a reliable price for the securities.
All transfers are recognized as of the beginning of the reporting period.
4. Purchases and Sales of Securities. For the year ended September 30, 2019, purchases and sales of securities (excluding short-term investments and including paydowns) were as follows:
| U.S. Government/ Agency Securities | Other Securities | |||||||||||||||
Fund | Purchases | Sales | Purchases | Sales | ||||||||||||
Growth Fund | $ | — | $ | — | $ | 615,164,763 | $ | 983,868,927 | ||||||||
Strategic Income Fund | 183,616,703 | 250,000,000 | 600,525,833 | 1,454,891,882 | ||||||||||||
5. Management Fees and Other Transactions with Affiliates.
a. Management Fees. Loomis, Sayles & Company, L.P. (“Loomis Sayles”) serves as investment adviser to each Fund. Loomis Sayles is a limited partnership whose sole general partner, Loomis, Sayles & Company, Inc., is indirectly owned by Natixis Investment Managers, L.P. (“Natixis”), which is part of Natixis Investment Managers, an international asset management group based in Paris, France.
Under the terms of the management agreements, each Fund pays a management fee at the following annual rates, calculated daily and payable monthly, based on each Fund’s average daily net assets:
| Percentage of Average Daily Net Assets | ||||||||||||||||||||
Fund | First $200 million | Next $1.8 billion | Next | Next | Over | |||||||||||||||
Growth Fund | 0.50 | % | 0.50 | % | 0.50 | % | 0.50 | % | 0.50 | % | ||||||||||
Strategic Income Fund | 0.65 | % | 0.60 | % | 0.55 | % | 0.54 | % | 0.53 | % | ||||||||||
Loomis Sayles has given binding undertakings to the Funds to waive management fees and/or reimburse certain expenses to limit the Funds’ operating expenses, exclusive of acquired fund fees and expenses, brokerage expenses, interest expense, taxes,
67 |
Table of Contents
Notes to Financial Statements (continued)
September 30, 2019
organizational and extraordinary expenses such as litigation and indemnification expenses. These undertakings are in effect until January 31, 2020, may be terminated before then only with the consent of the Funds’ Board of Trustees and are reevaluated on an annual basis. Management fees payable, as reflected on the Statements of Assets and Liabilities, is net of waivers and/or expense reimbursements, if any, pursuant to these undertakings. Waivers/reimbursements that exceed management fees payable are reflected on the Statements of Assets and Liabilities as receivable from investment adviser.
For the year ended September 30, 2019 the expense limits as a percentage of average daily net assets under the expense limitation agreements were as follows:
| Expense Limit as a Percentage of Average Daily Net Assets | ||||||||||||||||||||
Fund | Class A | Class C | Class N | Class Y | Admin Class | |||||||||||||||
Growth Fund | 1.25 | % | 2.00 | % | 0.95 | % | 1.00 | % | — | |||||||||||
Strategic Income Fund | 1.25 | % | 2.00 | % | 0.95 | % | 1.00 | % | 1.50 | % | ||||||||||
Loomis Sayles shall be permitted to recover expenses borne under the expense limitation agreements (whether through waiver of management fees or otherwise) on a class by class basis in later periods to the extent the annual operating expenses of a class fall below a class’ expense limits, provided, however, that a class is not obligated to pay such waived/reimbursed fees or expenses more than one year after the end of the fiscal year in which the fees or expenses were waived/reimbursed.
For the year ended September 30, 2019, the management fees for each Fund were as follows:
Fund | Gross | Percentage of | ||||||
Growth Fund | $ | 41,575,620 | 0.50 | % | ||||
Strategic Income Fund | 42,993,058 | 0.56 | % | |||||
No expenses were recovered for either Fund during the year ended September 30, 2019 under the terms of the expense limitation agreements.
b. Service and Distribution Fees. Natixis Distribution, L.P. (“Natixis Distribution”), which is a wholly-owned subsidiary of Natixis, has entered into a distribution agreement with the Trust. Pursuant to this agreement, Natixis Distribution serves as principal underwriter of the Funds of the Trust.
Pursuant to Rule12b-1 under the 1940 Act, the Trust has adopted a Service Plan relating to each Fund’s Class A shares (the “Class A Plans”), a Distribution and Service Plan relating to each Fund’s Class C shares (the “Class C Plans”), and Strategic Income Fund has adopted a Distribution Plan relating to its Admin Class shares (the “Admin Class Plan”).
| 68
Table of Contents
Notes to Financial Statements (continued)
September 30, 2019
Under the Class A Plans, each Fund pays Natixis Distribution a monthly service fee at an annual rate not to exceed 0.25% of the average daily net assets attributable to the Fund’s Class A shares, as reimbursement for expenses incurred by Natixis Distribution in providing personal services to investors in Class A shares and/or the maintenance of shareholder accounts.
Under the Class C Plans, each Fund pays Natixis Distribution a monthly service fee at an annual rate not to exceed 0.25% of the average daily net assets attributable to the Fund’s Class C shares, as compensation for services provided by Natixis Distribution in providing personal services to investors in Class C shares and/or the maintenance of shareholder accounts.
Also under the Class C Plans, each Fund pays Natixis Distribution a monthly distribution fee at an annual rate of 0.75% of the average daily net assets attributable to the Funds’ Class C shares, as compensation for services provided by Natixis Distribution in connection with the marketing or sale of Class C shares.
Under the Admin Class Plan, Strategic Income Fund pays Natixis Distribution a monthly distribution fee at an annual rate not to exceed 0.25% of the average daily net assets attributable to the Fund’s Admin Class shares, as compensation for services provided by Natixis Distribution in connection with the marketing or sale of Admin Class shares or for payments made by Natixis Distribution to securities dealers or other financial intermediaries as commissions, asset-based sales charges or other compensation with respect to the sale of Admin Class shares, or for providing personal services to investors and/or the maintenance of shareholder accounts.
In addition, the Admin Class shares of Strategic Income Fund may pay Natixis Distribution an administrative service fee, at an annual rate not to exceed 0.25% of the average daily net assets attributable to Admin Class shares. These fees are subsequently paid to securities dealers or financial intermediaries for providing personal services and/or account maintenance for their customers who hold such shares.
For the year ended September 30, 2019, the service and distribution fees for each Fund were as follows:
| Service Fees | Distribution Fees | |||||||||||||||||||
Fund | Class A | Class C | Admin Class | Class C | Admin Class | |||||||||||||||
Growth Fund | $ | 2,793,134 | $ | 304,889 | $ | — | $ | 914,666 | $ | — | ||||||||||
Strategic Income Fund | 4,620,096 | 2,192,546 | 299,124 | 6,577,637 | 317,459 | |||||||||||||||
For the year ended September 30, 2019, Natixis Distribution refunded Strategic Income Fund $18,335 of prior year Admin Class service fees paid to Natixis Distribution in excess of amounts subsequently paid to securities dealers or financial intermediaries. Service and distribution fees on the Statements of Operations have been reduced by these amounts.
69 |
Table of Contents
Notes to Financial Statements (continued)
September 30, 2019
c. Administrative Fees. Natixis Advisors, L.P. (“Natixis Advisors”) provides certain administrative services for the Funds and contracts with State Street Bank to serve assub-administrator. Natixis Advisors is a wholly-owned subsidiary of Natixis. Pursuant to an agreement among Natixis Funds Trusts, Loomis Sayles Funds Trusts, Natixis ETF Trust and Natixis Advisors, effective July 1, 2019 each Fund pays Natixis Advisors monthly itspro rataportion of fees equal to an annual rate of 0.0540% of the first $15 billion of the average daily net assets of the Natixis Funds Trusts, Loomis Sayles Funds Trusts and Natixis ETF Trust, 0.0500% of the next $15 billion, 0.0400% of the next $30 billion, 0.0275% of the next $30 billion and 0.0225% of such assets in excess of $90 billion, subject to an annual aggregate minimum fee for the Natixis Funds Trusts, Loomis Sayles Funds Trusts and Natixis ETF Trust of $10 million, which is reevaluated on an annual basis.
Prior to July 1, 2019, each Fund paid Natixis Advisors monthly itspro rataportion of fees equal to an annual rate of 0.0575% of the first $15 billion of the average daily net assets of the Natixis Funds Trusts, Loomis Sayles Funds Trusts and Natixis ETF Trust, 0.0500% of the next $15 billion, 0.0400% of the next $30 billion, 0.0275% of the next $30 billion and 0.0225% of such assets in excess of $90 billion, subject to an annual aggregate minimum fee for the Natixis Funds Trusts, Loomis Sayles Funds Trusts and Natixis ETF Trust of $10 million.
Effective October 1, 2018, State Street Bank agreed to reduce the fees it receives from Natixis Advisors for serving assub-administrator to the Funds. Also, effective October 1, 2018, Natixis Advisors agreed to voluntarily waive fees paid by the Funds in an amount equal to the reduction insub-administrative fees discussed above. The waiver was in effect through June 30, 2019.
For the year ended September 30, 2019, the administrative fees for each Fund were as follows:
Fund | Gross | Waiver of | Net | |||||||||
Growth Fund | $ | 3,660,618 | $ | 62,678 | $ | 3,597,940 | ||||||
Strategic Income Fund | 3,353,455 | 59,623 | 3,293,832 | |||||||||
d. Sub-Transfer Agent Fees. Natixis Distribution has entered into agreements, which include servicing agreements, with financial intermediaries that provide recordkeeping, processing, shareholder communications and other services to customers of the intermediaries that hold positions in the Funds and has agreed to compensate the intermediaries for providing those services. Intermediaries transact with the Funds primarily through the use of omnibus accounts on behalf of their customers who hold positions in the Funds. These services would have been provided by the Funds’ transfer agent and other service providers if the shareholders’ accounts were maintained directly at the Funds’ transfer agent. Accordingly, the Funds have
| 70
Table of Contents
Notes to Financial Statements (continued)
September 30, 2019
agreed to reimburse Natixis Distribution for all or a portion of the servicing fees paid to these intermediaries. The reimbursement amounts(sub-transfer agent fees) paid to Natixis Distribution are subject to a currentper-account equivalent fee limit approved by the Funds’ Board of Trustees, which is based on fees for similar services paid to the Funds’ transfer agent and other service providers. Class N shares do not bear such expenses.
For the year ended September 30, 2019, thesub-transfer agent fees (which are reflected in transfer agent fees and expenses in the Statements of Operations) for each Fund were as follows:
Fund | Sub-Transfer | |||
Growth Fund | $ | 6,581,543 | ||
Strategic Income Fund | 5,859,255 | |||
As of September 30, 2019, the Funds owe Natixis Distribution the following reimbursements forsub-transfer agent fees (which are reflected in the Statements of Assets and Liabilities as payable to distributor):
Fund | Reimbursements | |||
Growth Fund | $ | 81,341 | ||
Strategic Income Fund | 69,188 | |||
Sub-transfer agent fees attributable to Class A, Class C, Class Y, and Admin Class are allocated on apro ratabasis to each class based on the relative net assets of each class to the total net assets of those classes.
e. Commissions. Commissions (including CDSCs) on Fund shares retained by Natixis Distribution during the year ended September 30, 2019, were as follows:
Fund | Commissions | |||
Growth Fund | $ | 36,465 | ||
Strategic Income Fund | 72,228 | |||
f. Trustees Fees and Expenses. The Trust does not pay any compensation directly to its officers or Trustees who are directors, officers or employees of Natixis Advisors, Natixis Distribution, Natixis or their affiliates. The Chairperson of the Board of Trustees receives a retainer fee at the annual rate of $360,000. The Chairperson does not receive any meeting attendance fees for Board of Trustees meetings or committee meetings that he attends. Each Independent Trustee (other than the Chairperson) receives, in the aggregate, a retainer fee at the annual rate of $190,000. Each Independent Trustee also receives a meeting attendance fee of $10,000 for each meeting of the Board of Trustees that he or she attends in person and $5,000 for each meeting of the Board of Trustees
71 |
Table of Contents
Notes to Financial Statements (continued)
September 30, 2019
that he or she attends telephonically. In addition, the chairperson of the Contract Review Committee and the chairperson of the Audit Committee each receive an additional retainer fee at the annual rate of $20,000. The chairperson of the Governance Committee receives an additional retainer fee at the annual rate of $15,000. Each Contract Review Committee member is compensated $6,000 for each Committee meeting that he or she attends in person and $3,000 for each meeting that he or she attends telephonically. Each Audit Committee member is compensated $6,000 for each Committee meeting that he or she attends in person and $3,000 for each meeting that he or she attends telephonically. These fees are allocated among the funds in the Natixis Funds Trusts, Loomis Sayles Funds Trusts and Natixis ETF Trust based on a formula that takes into account, among other factors, the relative net assets of each fund. Trustees are reimbursed for travel expenses in connection with attendance at meetings.
Prior to January 1, 2019, the Chairperson of the Board received a retainer fee at the annual rate of $340,000 and each Independent Trustee (other than the Chairperson) received, in the aggregate, a retainer fee at the annual rate of $170,000, and the chairperson of the Governance Committee received an additional retainer fee at the annual rate of $12,000. All other Trustee fees remained unchanged.
A deferred compensation plan (the “Plan”) is available to the Trustees on a voluntary basis. Deferred amounts remain in the Funds until distributed in accordance with the provisions of the Plan. The value of a participating Trustee’s deferral account is based on theoretical investments of deferred amounts, on the normal payment dates, in certain funds of the Natixis Funds Trusts, Loomis Sayles Funds Trusts and Natixis ETF Trust as designated by the participating Trustees. Changes in the value of participants’ deferral accounts are allocatedpro rata among the funds in the Natixis Funds Trusts, Loomis Sayles Funds Trusts and Natixis ETF Trust, and are normally reflected as Trustees’ fees and expenses in the Statements of Operations. The portions of the accrued obligations allocated to the Funds under the Plan are reflected as Deferred Trustees’ fees in the Statements of Assets and Liabilities.
Certain officers and employees of Natixis Advisors and Loomis Sayles are also officers and/or Trustees of the Trust.
g. Affiliated Ownership. As of September 30, 2019, Loomis Sayles Funded Pension Plan and Trust and Loomis Sayles Employees’ Profit Sharing Retirement Plan held shares of the Growth Fund representing 0.19% and 0.67%, respectively, of the Fund’s net assets.
Investment activities of affiliated shareholders could have material impacts on the Fund.
| 72
Table of Contents
Notes to Financial Statements (continued)
September 30, 2019
h. Affiliated Transactions. As a result of a business restructuring, Strategic Income Fund received common stock shares of Bellatrix Exploration Ltd. (the “Company”) which constitutes more than 5% of the voting securities of the Company. As such, the Company is considered to be an affiliate. A summary of affiliated transactions for the year ended September 30, 2019, is as follows:
Strategic Income Fund | Beginning | Purchase | Sales | Accrued | ||||||||||||
Bellatrix Exploration Ltd., 8.500% | $ | — | $ | 5,869,220 | $ | — | $ | 7,670 | ||||||||
Bellatrix Exploration Ltd., 9.500% PIK or 3.000% Cash | — | 4,307,160 | — | 94,003 | ||||||||||||
Bellatrix Exploration Ltd. | — | 3,016,862 | — | — | ||||||||||||
|
|
|
|
|
|
|
| |||||||||
| $ | — | $ | 13,193,242 | $ | — | $ | 101,673 | |||||||||
|
|
|
|
|
|
|
| |||||||||
Strategic Income Fund | Realized Gain (Loss) | Change in | Ending Value | Investment | ||||||||||||
Bellatrix Exploration Ltd., 8.500% | $ | — | $ | (2,283,490 | ) | $ | 3,593,400 | $ | 164,923 | |||||||
Bellatrix Exploration Ltd., 9.500% PIK or 3.000% Cash | — | (4,401,163 | ) | — | — | |||||||||||
Bellatrix Exploration Ltd. | — | (3,016,862 | ) | — | — | |||||||||||
|
|
|
|
|
|
|
| |||||||||
| $ | — | $ | (9,701,515 | ) | $ | 3,593,400 | $ | 164,923 | ||||||||
|
|
|
|
|
|
|
| |||||||||
6. Class-Specific Transfer Agent Fees and Expenses. Transfer agent fees and expenses attributable to Class A, Class C, Class Y and Admin Class are allocated on apro ratabasis to each class based on the relative net assets of each class to the total net assets of those classes. Transfer agent fees and expenses attributable to Class N are allocated to Class N.
For the year ended September 30, 2019, the Funds incurred the following class-specific transfer agent fees and expenses (includingsub-transfer agent fees, where applicable):
| Transfer Agent Fees and Expenses | ||||||||||||||||||||
Fund | Class A | Class C | Class N | Class Y | Admin Class | |||||||||||||||
Growth Fund | $ | 1,037,070 | $ | 113,554 | $ | 3,198 | $ | 6,076,056 | $ | — | ||||||||||
Strategic Income Fund | 1,553,703 | 738,499 | 2,026 | 3,844,377 | 106,782 | |||||||||||||||
7. Line of Credit. Each Fund, together with certain other funds of Natixis Funds Trusts, Loomis Sayles Funds Trusts and Natixis ETF Trust, entered into a $400,000,000
73 |
Table of Contents
Notes to Financial Statements (continued)
September 30, 2019
committed unsecured line of credit provided by State Street Bank. Any one Fund may borrow up to $350,000,000 under the line of credit agreement (as long as all borrowings by all Funds in the aggregate do not exceed the $400,000,000 limit at any time), subject to each Fund’s investment restrictions and its contractual obligations under the line of credit. Interest is charged to the Funds based upon the terms set forth in the agreement. In addition, a commitment fee of 0.15% per annum, payable at the end of each calendar quarter, is accrued and apportioned among the participating funds based on their average daily unused portion of the line of credit. The Funds paid an arrangement fee, an upfront fee, and certain other legal fees in connection with the line of credit agreement, which are being amortized over a period of 364 days and are reflected in legal fees and/or miscellaneous expenses on the Statements of Operations. The unamortized balance is reflected as prepaid expenses on the Statements of Assets and Liabilities.
For the year ended September 30, 2019, Growth Fund had an average daily balance on the line of credit (for those days on which there were borrowings) of $20,531,390 at a weighted average interest rate of 3.43%. Interest expense incurred was $7,822.
8. Concentration of Risk. Strategic Income Fund’s investments in foreign securities may be subject to greater political, economic, environmental, credit/counterparty and information risks. The Fund’s investments in foreign securities also are subject to foreign currency fluctuations and other foreign currency-related risks. Foreign securities may be subject to higher volatility than U.S. securities, varying degrees of regulation and limited liquidity.
9. Concentration of Ownership. From time to time, a Fund may have a concentration of one or more accounts constituting a significant percentage of shares outstanding. Investment activities by holders of such accounts could have material impacts on the Funds. As of September 30, 2019, based on management’s evaluation of the shareholder account base, the Growth Fund had accounts representing controlling ownership of more than 5% of the Fund’s total outstanding shares. The number of such accounts, based on accounts that represent more than 5% of an individual class of shares, and the aggregate percentage of net assets represented by such holdings were as follows:
Number of 5% | Percentage of | |||||||
Growth Fund | 5 | 54.16 | % | |||||
Omnibus shareholder accounts for which Natixis Advisors understands that the intermediary has discretion over the underlying shareholder accounts or investment models where a shareholder account may be invested for anon-discretionary customer are included in the table above. For other omnibus accounts, the Fund does not have information on the individual shareholder accounts underlying the omnibus accounts; therefore, there could be other 5% shareholders in addition to those disclosed in the table above.
| 74
Table of Contents
Notes to Financial Statements (continued)
September 30, 2019
10. Capital Shares. Each Fund may issue an unlimited number of shares of beneficial interest, without par value. Transactions in capital shares were as follows:
| | Year Ended September 30, 2019 | | Year Ended September 30, 2018 | |||||||||||||
Growth Fund | Shares | Amount | Shares | Amount | ||||||||||||
| Class A |
| |||||||||||||||
Issued from the sale of shares | 19,091,773 | $ | 297,048,970 | 9,892,333 | $ | 148,235,534 | ||||||||||
Issued in connection with the reinvestment of distributions | 3,582,164 | 47,177,097 | 1,464,494 | 21,381,619 | ||||||||||||
Redeemed | (12,138,033 | ) | (185,450,226 | ) | (13,865,728 | ) | (209,484,702 | ) | ||||||||
|
|
|
|
|
|
|
| |||||||||
Net change | 10,535,904 | $ | 158,775,841 | (2,508,901 | ) | $ | (39,867,549 | ) | ||||||||
|
|
|
|
|
|
|
| |||||||||
| Class C |
| |||||||||||||||
Issued from the sale of shares | 1,154,714 | $ | 15,338,399 | 1,122,136 | $ | 15,439,085 | ||||||||||
Issued in connection with the reinvestment of distributions | 332,911 | 3,998,270 | 148,410 | 1,993,145 | ||||||||||||
Redeemed | (2,056,040 | ) | (28,433,099 | ) | (2,724,624 | ) | (37,772,137 | ) | ||||||||
|
|
|
|
|
|
|
| |||||||||
Net change | (568,415 | ) | $ | (9,096,430 | ) | (1,454,078 | ) | $ | (20,339,907 | ) | ||||||
|
|
|
|
|
|
|
| |||||||||
| Class N |
| |||||||||||||||
Issued from the sale of shares | 8,887,567 | $ | 147,132,489 | 43,285,115 | $ | 684,373,304 | ||||||||||
Issued in connection with the reinvestment of distributions | 2,024,898 | 28,510,563 | 380,354 | 5,914,498 | ||||||||||||
Redeemed | (43,548,774 | ) | (706,227,218 | ) | (8,026,613 | ) | (130,323,337 | ) | ||||||||
|
|
|
|
|
|
|
| |||||||||
Net change | (32,636,309 | ) | $ | (530,584,166 | ) | 35,638,856 | $ | 559,964,465 | ||||||||
|
|
|
|
|
|
|
| |||||||||
| Class Y |
| |||||||||||||||
Issued from the sale of shares | 117,111,537 | $ | 1,914,578,957 | 134,173,905 | $ | 2,158,881,553 | ||||||||||
Issued in connection with the reinvestment of distributions | 16,819,594 | 236,988,075 | 7,592,419 | 118,138,051 | ||||||||||||
Redeemed | (111,406,135 | ) | (1,805,455,678 | ) | (139,565,871 | ) | (2,246,057,772 | ) | ||||||||
|
|
|
|
|
|
|
| |||||||||
Net change | 22,524,996 | $ | 346,111,354 | 2,200,453 | $ | 30,961,832 | ||||||||||
|
|
|
|
|
|
|
| |||||||||
Increase (decrease) from capital share transactions | (143,824 | ) | $ | (34,793,401 | ) | 33,876,330 | $ | 530,718,841 | ||||||||
|
|
|
|
|
|
|
| |||||||||
75 |
Table of Contents
Notes to Financial Statements (continued)
September 30, 2019
10. Capital Shares (continued).
| | Year Ended September 30, 2019 | | Year Ended September 30, 2018 | |||||||||||||
Strategic Income Fund | Shares | Amount | Shares | Amount | ||||||||||||
| Class A |
| |||||||||||||||
Issued from the sale of shares | 27,644,005 | $ | 388,066,928 | 51,625,278 | $ | 738,924,261 | ||||||||||
Issued in connection with the reinvestment of distributions | 3,733,655 | 52,153,952 | 4,060,455 | 58,682,435 | ||||||||||||
Redeemed | (40,562,001 | ) | (568,498,683 | ) | (52,391,158 | ) | (758,110,873 | ) | ||||||||
|
|
|
|
|
|
|
| |||||||||
Net change | (9,184,341 | ) | $ | (128,277,803 | ) | 3,294,575 | $ | 39,495,823 | ||||||||
|
|
|
|
|
|
|
| |||||||||
| Class C |
| |||||||||||||||
Issued from the sale of shares | 2,930,132 | $ | 41,347,083 | 2,803,621 | $ | 41,029,278 | ||||||||||
Issued in connection with the reinvestment of distributions | 1,354,833 | 19,052,625 | 3,309,104 | 48,333,624 | ||||||||||||
Redeemed | (36,710,107 | ) | (519,364,178 | ) | (76,940,917 | ) | (1,116,045,348 | ) | ||||||||
|
|
|
|
|
|
|
| |||||||||
Net change | (32,425,142 | ) | $ | (458,964,470 | ) | (70,828,192 | ) | $ | (1,026,682,446 | ) | ||||||
|
|
|
|
|
|
|
| |||||||||
| Class N |
| |||||||||||||||
Issued from the sale of shares | 5,710,006 | $ | 80,153,591 | 4,812,920 | $ | 69,711,732 | ||||||||||
Issued in connection with the reinvestment of distributions | 502,914 | 7,022,689 | 485,081 | 6,999,401 | ||||||||||||
Redeemed | (4,226,437 | ) | (59,477,704 | ) | (2,582,475 | ) | (37,282,778 | ) | ||||||||
|
|
|
|
|
|
|
| |||||||||
Net change | 1,986,483 | $ | 27,698,576 | 2,715,526 | $ | 39,428,355 | ||||||||||
|
|
|
|
|
|
|
| |||||||||
| Class Y |
| |||||||||||||||
Issued from the sale of shares | 60,558,641 | $ | 847,970,819 | 77,541,895 | $ | 1,122,643,031 | ||||||||||
Issued in connection with the reinvestment of distributions | 10,011,095 | 139,677,190 | 12,318,919 | 177,879,588 | ||||||||||||
Redeemed | (123,342,737 | ) | (1,721,792,645 | ) | (118,518,308 | ) | (1,716,975,666 | ) | ||||||||
|
|
|
|
|
|
|
| |||||||||
Net change | (52,773,001 | ) | $ | (734,144,636 | ) | (28,657,494 | ) | $ | (416,453,047 | ) | ||||||
|
|
|
|
|
|
|
| |||||||||
| Admin Class |
| |||||||||||||||
Issued from the sale of shares | 1,029,988 | $ | 14,399,151 | 1,110,070 | $ | 16,029,203 | ||||||||||
Issued in connection with the reinvestment of distributions | 293,184 | 4,080,471 | 336,388 | 4,845,855 | ||||||||||||
Redeemed | (2,027,234 | ) | (28,358,878 | ) | (1,818,549 | ) | (26,240,360 | ) | ||||||||
Net change | (704,062 | ) | $ | (9,879,256 | ) | (372,091 | ) | $ | (5,365,302 | ) | ||||||
|
|
|
|
|
|
|
| |||||||||
Decrease from capital share transactions | (93,100,063 | ) | $ | (1,303,567,589 | ) | (93,847,676 | ) | $ | (1,369,576,617 | ) | ||||||
|
|
|
|
|
|
|
| |||||||||
| 76
Table of Contents
Report of Independent Registered Public Accounting Firm
To the Board of Trustees of Loomis Sayles Funds II and Shareholders of Loomis Sayles Strategic Income Fund and Loomis Sayles Growth Fund:
Opinions on the Financial Statements
We have audited the accompanying statements of assets and liabilities, including the portfolios of investments, of Loomis Sayles Strategic Income Fund and Loomis Sayles Growth Fund (two of the funds constituting Loomis Sayles Funds II, hereafter collectively referred to as the “Funds”) as of September 30, 2019, the related statements of operations for the year ended September 30, 2019, the statements of changes in net assets for each of the two years in the period ended September 30, 2019, including the related notes, and the financial highlights for each of the five years in the period ended September 30, 2019 (collectively referred to as the “financial statements”). In our opinion, the financial statements present fairly, in all material respects, the financial position of each of the Funds as of September 30, 2019, the results of each of their operations for the year then ended, the changes in each of their net assets for each of the two years in the period ended September 30, 2019 and each of the financial highlights for each of the five years in the period ended September 30, 2019 in conformity with accounting principles generally accepted in the United States of America.
Basis for Opinions
These financial statements are the responsibility of the Funds’ management. Our responsibility is to express an opinion on the Funds’ financial statements based on our audits. We are a public accounting firm registered with the Public Company Accounting Oversight Board (United States) (PCAOB) and are required to be independent with respect to the Funds in accordance with the U.S. federal securities laws and the applicable rules and regulations of the Securities and Exchange Commission and the PCAOB.
We conducted our audits of these financial statements in accordance with the standards of the PCAOB. Those standards require that we plan and perform the audit to obtain reasonable assurance about whether the financial statements are free of material misstatement, whether due to error or fraud.
Our audits included performing procedures to assess the risks of material misstatement of the financial statements, whether due to error or fraud, and performing procedures that respond to those risks. Such procedures included examining, on a test basis, evidence regarding the amounts and disclosures in the financial statements. Our audits also included evaluating the accounting principles used and significant estimates made by management, as well as evaluating the overall presentation of the financial statements. Our procedures included confirmation of securities owned as of
77 |
Table of Contents
Report of Independent Registered Public Accounting Firm
September 30, 2019 by correspondence with the custodian and brokers; when replies were not received from brokers, we performed other auditing procedures. We believe that our audits provide a reasonable basis for our opinions.
PricewaterhouseCoopers LLP
Boston, Massachusetts
November 21, 2019
We have served as the auditor of one or more investment companies in the Natixis Investment Company Complex since at least 1995. We have not determined the specific year we began serving as auditor.
| 78
Table of Contents
2019 U.S. Tax Distribution Information to Shareholders (Unaudited)
Corporate Dividends Received Deduction. For the fiscal year ended September 30, 2019, a percentage of dividends distributed by the Funds listed below qualifies for the dividends received deduction for corporate shareholders. These percentages are as follows:
Fund | Qualifying | |||
Growth | 100.00 | % | ||
Strategic Income | 12.18 | % | ||
Capital Gains Distributions. Pursuant to Internal Revenue Section 852(b), the following Funds paid distributions, which have been designated as capital gains distributions for the fiscal year ended September 30, 2019, unless subsequently determined to be different.
Fund | Amount | |||
Growth | $ | 359,635,192 | ||
Strategic Income | 37,679,164 | |||
Qualified Dividend Income. For the fiscal year ended September 30, 2019, the Funds below will designate up to the maximum amount allowable pursuant to the Internal Revenue Code as qualified dividend income eligible for reduced tax rates. These lower rates range from 0% to 20% depending on an individual’s tax bracket. If the Funds pay a distribution during calendar year 2019, complete information will be reported in conjunction with Form1099-DIV.
Fund |
| |||
Growth | ||||
Strategic Income | ||||
79 |
Table of Contents
Trustee and Officer Information
The tables below provide certain information regarding the trustees and officers of Loomis Sayles Funds II (the “Trust”). Unless otherwise indicated, the address of all persons below is 888 Boylston Street, Suite 800, Boston, MA 02199-8197. The Funds’ Statement of Additional Information includes additional information about the trustees of the Trust and is available by calling Natixis Funds at800-225-5478.
Name and Year of Birth | Position(s) Held with the Trust, Length of Time Served and Term of Office1 | Principal Occupation(s) During Past 5 Years | Number of Portfolios in Fund Complex Overseen2 and Other Directorships Held During Past 5 Years | Experience, Qualifications, Attributes, Skills for Board Membership | ||||
| INDEPENDENT TRUSTEES | ||||||||
Kenneth A. Drucker (1945) | Chairperson of the Board of Trustees since January 2017 Trustee since 2008 Ex Officio member of Audit Committee, Contract Review Committee and Governance Committee | Retired | 52 None | Significant experience on the Board and on the boards of other business organizations (including at investment companies); executive experience (including as treasurer of an aerospace, automotive, and metal manufacturing corporation) | ||||
Edmond J. English (1953) | Trustee since 2013 Audit Committee Member and Governance Committee Member | Executive Chairman of Bob’s Discount Furniture (retail) | 52 Director, Burlington Stores, Inc. (retail) | Significant experience on the Board and on the boards of other business organizations (including retail companies and a bank); executive experience (including at a retail company) | ||||
| 80
Table of Contents
Trustee and Officer Information
Name and Year of Birth | Position(s) Held with the Trust, Length of Time Served and Term of Office1 | Principal Occupation(s) During Past 5 Years | Number of Portfolios in Fund Complex Overseen2 and Other Directorships Held During Past 5 Years | Experience, Qualifications, Attributes, Skills for Board Membership | ||||
INDEPENDENT TRUSTEES continued | ||||||||
Richard A. Goglia (1951) | Trustee since 2015 Contract Review Committee Member and Governance Committee Member | Retired; formerly Vice President and Treasurer of Raytheon Company (defense) | 52 None | Experience on the Board and executive experience (including his role as vice president and treasurer of a defense company and experience at a financial services company) | ||||
Wendell J. Knox (1948) | Trustee since 2009 Chairperson of Contract Review Committee | Director of Abt Associates Inc. (research and consulting) | 52 Director, The Hanover Insurance Group (property and casualty insurance); formerly, Director, Eastern Bank (bank) | Significant experience on the Board and on the boards of other business organizations (including at a bank and at a property and casualty insurance firm); executive experience (including roles as president and chief executive officer of a research and consulting company) | ||||
81 |
Table of Contents
Trustee and Officer Information
Name and Year of Birth | Position(s) Held with the Trust, Length of Time Served and Term of Office1 | Principal Occupation(s) During Past 5 Years | Number of Portfolios in Fund Complex Overseen2 and Other Directorships Held During Past 5 Years | Experience, Qualifications, Attributes, Skills for Board Membership | ||||
INDEPENDENT TRUSTEES continued | ||||||||
Martin T. Meehan (1956) | Trustee since 2012 Audit Committee Member | President, University of Massachusetts; formerly, Chancellor and faculty member, University of Massachusetts Lowell | 52 None | Significant experience on the Board and on the boards of other business organizations; experience as President of the University of Massachusetts; government experience (including as a member of the U.S. House of Representatives); academic experience | ||||
Maureen B. Mitchell (1951) | Trustee since 2017 Contract Review Committee Member and Governance Committee Member | Retired; formerly President, Global Sales and Marketing, GE Asset Management, Inc. (financial services) | 52 Director, Sterling Bancorp (Bank) | Experience on the Board ; financial services industry and executive experience (including role as president of global sales and marketing at a financial services company) | ||||
| 82
Table of Contents
Trustee and Officer Information
Name and Year of Birth | Position(s) Held with the Trust, Length of Time Served and Term of Office1 | Principal Occupation(s) During Past 5 Years | Number of Portfolios in Fund Complex Overseen2 and Other Directorships Held During Past 5 Years | Experience, Qualifications, Attributes, Skills for Board Membership | ||||
INDEPENDENT TRUSTEES continued | ||||||||
James P. Palermo (1955) | Trustee since 2016 Contract Review Committee Member | Founding Partner, Breton Capital Management, LLC (private equity); Partner, STEP Partners, LLC (private equity) | 52 Director, FutureFuel.io (Chemicals and Biofuels) | Experience on the Board ; financial services industry and executive experience (including roles as chief executive officer of client management and asset servicing for a banking and financial services company) | ||||
Erik R. Sirri (1958) | Trustee since 2009 Chairperson of the Audit Committee | Professor of Finance at Babson College | 52 None | Significant experience on the Board; experience as Director of the Division of Trading and Markets at the Securities and Exchange Commission; academic experience; training as an economist | ||||
Peter J. Smail (1952) | Trustee since 2009 Audit Committee Member and Governance Committee Member | Retired | 52 None | Significant experience on the Board; mutual fund industry and executive experience (including roles as president and chief executive officer for an investment adviser) | ||||
83 |
Table of Contents
Trustee and Officer Information
Name and Year of Birth | Position(s) Held with the Trust, Length of Time Served and Term of Office1 | Principal Occupation(s) During Past 5 Years | Number of Portfolios in Fund Complex Overseen2 and Other Directorships Held During Past 5 Years | Experience, Qualifications, Attributes, Skills for Board Membership | ||||
INDEPENDENT TRUSTEES continued | ||||||||
Kirk A. Sykes (1958) | Trustee since 2019 Contract Review Committee Member | Managing Director of Accordia Partners, LLC (real estate development); President of Primary Corporation (real estate development); Managing Principal of Merrick Capital Partners (infrastructure finance); formerly, President of Urban Strategy America Fund (real estate fund manager) | 52 Trustee, Eastern Bank (bank); formerly Director, Ares Commercial Real Estate Corporation (real estate investment trust) | Experience on the Board and significant experience on the boards of other business organizations (including real estate companies and banks) | ||||
Cynthia L. Walker (1956) | Trustee since 2005 Chairperson of the Governance Committee and Audit Committee Member | Deputy Dean for Finance and Administration, Yale University School of Medicine | 52 None | Significant experience on the Board; executive experience in a variety of academic organizations (including roles as dean for finance and administration) | ||||
| 84
Table of Contents
Trustee and Officer Information
Name and Year of Birth | Position(s) Held with the Trust, Length of Time Served and Term of Office1 | Principal Occupation(s) During Past 5 Years | Number of Portfolios in Fund Complex Overseen2 and Other Directorships Held During Past 5 Years | Experience, Qualifications, Attributes, Skills for Board Membership | ||||
| INTERESTED TRUSTEES | ||||||||
Kevin P. Charleston3 (1965) One Financial Center Boston, MA 02111 | Trustee since 2015 | President, Chief Executive Officer and Chairman of the Board of Directors; formerly, Chief Financial Officer, Loomis, Sayles & Company, L.P. | 52 None | Experience on the Board; continuing service as President, Chief Executive Officer and Chairman of the Board of Directors of Loomis, Sayles & Company, L.P. | ||||
David L. Giunta4 (1965) | Trustee since 2011 President of Loomis Sayles Funds II since 2008; Chief Executive Officer of Loomis Sayles Funds II since 2015 | President and Chief Executive Officer, Natixis Advisors, L.P., Natixis Distribution, L.P., Natixis Distribution Corporation and Chairman of the Board of Natixis Distribution Corporation | 52 None | Significant experience on the Board; experience as President and Chief Executive Officer, Natixis Advisors, L.P., Natixis Distribution, L.P., Natixis Distribution Corporation and Chairman of the Board of Natixis Distribution Corporation | ||||
| 1 | Each trustee serves until retirement, resignation or removal from the Board. The current retirement age is 75. The position of Chairperson of the Board is appointed for a three-year term. Mr. Drucker was appointed to serve an additional one year term as the Chairperson of the Board on June 12, 2019. |
| 2 | The trustees of the Trust serve as trustees of a fund complex that includes all series of the Natixis Funds Trust I, Natixis Funds Trust II, Natixis Funds Trust IV, Gateway Trust, Loomis Sayles Funds I, Loomis Sayles Funds II and Natixis ETF Trust (collectively, the “Fund Complex”). |
| 3 | Mr. Charleston is deemed an “interested person” of the Trust because he holds the following positions with an affiliated person of the Trust: President, Chief Executive Officer and Chairman of the Board of Directors of Loomis, Sayles & Company, L.P. |
| 4 | Mr. Giunta is deemed an “interested person” of the Trust because he holds the following positions with an affiliated person of the Trust: President and Chief Executive Officer, Natixis Advisors, L.P., Natixis Distribution, L.P., Natixis Distribution Corporation and Chairman of the Board of Natixis Distribution Corporation. |
85 |
Table of Contents
Trustee and Officer Information
Name and Year of Birth | Position(s) Held with the Trust | Term of Office1 and Length of Time Served | Principal Occupation(s) During Past 5 Years2 | |||
| OFFICERS OF THE TRUST | ||||||
Daniel J. Fuss (1933) One Financial Center Boston, MA 02111 | Executive Vice President of Loomis Sayles Funds I and Loomis Sayles Funds II | Since 2003 | Vice Chairman and Director, Loomis, Sayles & Company, L.P. | |||
Russell L. Kane (1969) | Secretary, Clerk and Chief Legal Officer | Since 2016 | Executive Vice President, General Counsel, Secretary and Clerk, Natixis Distribution Corporation, Natixis Advisors, L.P. and Natixis Distribution, L.P.; formerly, Chief Compliance Officer for Mutual Funds, Senior Vice President, Deputy General Counsel, Assistant Secretary and Assistant Clerk, Natixis Distribution Corporation, Natixis Advisors, L.P. and Natixis Distribution, L.P. | |||
Michael C. Kardok (1959) | Treasurer, Principal Financial and Accounting Officer | Since 2004 | Senior Vice President, Natixis Advisors, L.P. and Natixis Distribution, L.P. | |||
Kirk D. Johnson (1981) | Chief Compliance Officer, Assistant Secretary and Anti-Money Laundering Officer | Since 2018 | Senior Vice President, Deputy General Counsel, Assistant Secretary and Assistant Clerk, Natixis Distribution Corporation, Natixis Advisors, L.P. and Natixis Distribution, L.P.; formerly, Associate General Counsel, Natixis Distribution, L.P.; Vice President and Counsel, Natixis Investment Managers, L.P. | |||
| 86
Table of Contents
Trustee and Officer Information
| 1 | Each officer of the Trust serves for an indefinite term in accordance with the Trust’s currentby-laws until the date his or her successor is elected and qualified, or until he or she sooner dies, retires, is removed or becomes disqualified. |
| 2 | Each person listed above, except as noted, holds the same position(s) with the Fund Complex. Previous positions during the past five years with Natixis Distribution, L.P., Natixis Advisors, L.P. or Loomis, Sayles & Company, L.P. are omitted, if not materially different from an officer’s current position with such entity. |
87 |
Table of Contents


Annual Report
September 30, 2019
Loomis Sayles Core Plus Bond Fund
Loomis Sayles Global Allocation Fund
| Portfolio Review | 1 | |||
| Portfolio of Investments | 19 | |||
| Financial Statements | 55 | |||
| Notes to Financial Statements | 67 | |||
IMPORTANT NOTICE TO SHAREHOLDERS
Beginning on January 1, 2021, as permitted by regulations adopted by the Securities and Exchange Commission, paper copies of shareholder reports like this one will no longer be sent by mail, unless you specifically request paper copies of the reports from the Fund or from your financial intermediary, such as a broker-dealer or bank. Instead, the reports will be made available on the Funds’ website, and you will be notified by mail each time a report is posted and provided with a website link to access the report. If you wish to continue receiving paper copies of your shareholder reports after January 1, 2021, you can inform the Fund at any time by calling 1-800-225-5478. If you hold your account with a financial intermediary and you wish to continue receiving paper copies after January 1, 2021, you should call your financial intermediary directly. Paper copies are provided free of charge, and your election to receive reports in paper will apply to all funds held with the Natixis Funds complex. If you have already elected to receive shareholder reports electronically, you will not be affected by this change and you need not take any action. You currently may elect to receive shareholder reports and other communications from the Fund or your financial intermediary electronically atwww.icsdelivery.com/natixisfunds.
Table of Contents
LOOMIS SAYLES CORE PLUS BOND FUND
| Managers | Symbols | |
| Peter W. Palfrey, CFA® | Class A NEFRX | |
| Richard G. Raczkowski | Class C NECRX | |
| Loomis, Sayles & Company, L.P. | Class N NERNX | |
| Class Y NERYX | ||
Investment Goal
The Fund seeks high total investment return through a combination of current income and capital appreciation.
Market Conditions
Global fixed income markets delivered healthy gains over the12-month period, reflecting the combination of slowing economic growth, persistently low inflation and the US Federal Reserve’s (Fed’s) shift toward an increasingly accommodative monetary policy. As recently as the fourth quarter of 2018, the markets generally anticipated that the Fed would continue to raise interest rates for at least another 12 months. As growth slowed in late 2018 and risk sentiment faltered, credit spread widened, equities fell, and rates plunged. By early 2019, the Fed was forced to reverse forward guidance towards an easing bias.
The Fed subsequently cut rates by a quarter point on August 1, September 19, and again early in the fourth quarter of 2019, bringing its benchmark federal funds target rate to a range of 1.50% to 1.75%. The dramatic change in the outlook for Fed policy was the leading factor in the strong, broad-based rally in bonds. These circumstances helped fuel gains for US Treasuries, with longer-term issues registering the largest advance. The yield on the benchmark10-year Treasury note, after reaching a peak of 3.23% in October 2018, fell to 1.47% in early September — near its lowest level of the past decade. (Prices and yields move in opposite directions.)
Domestic inflation remained below target, mirroring a trend that was in place across the globe. US core personal consumption expenditure inflation (which excludes food and energy) moved toward the 2% level in late 2018 before settling into a range between 1.5% and 1.7% from March onward. Low inflation was one of the key factors providing the Fed and foreign central banks with the ability to loosen policy in order to address slowing growth.
Investment grade corporates generated robust returns and finished the period as the top performing major fixed income category. In addition to benefiting from the rally in rate-sensitive assets, corporates were boosted by both positive earnings trends and healthy investor risk appetites.
Performance Results
For the 12 months ended September 30, 2019, Class Y shares of the Loomis Sayles Core Plus Bond Fund returned 8.67% at net asset value. The Fund underperformed its benchmark, the Bloomberg Barclays U.S. Aggregate Bond Index, which returned 10.30%.
1 |
Table of Contents
Explanation of Fund Performance
While on a year-to-date basis, the Fund has outperformed its benchmark, the weaker 12 month relative return reflects the Fund’s underperformance during the “risk-off” period in the fourth quarter of 2018. The Fund’s allocation to Treasury inflation-protected securities (TIPS) was the primary detractor from relative performance as inflation expectations softened over the year. Exposure to emerging markets, specifically an allocation to US dollar-denominated Argentina bonds, also weighed on performance. Non-dollar exposure, specifically Mexican peso, detracted from relative returns as the peso depreciated versus the US dollar over the twelve month period. Additionally, the Fund’s holdings within Securitized Agency also constrained performance relative to the benchmark.
The Fund’s slightly above-benchmark stance with respect to duration (and corresponding sensitivity to changes in interest rates) added to relative performance. An underweight to nominal US Treasuries also added to relative return as riskier assets outperformed. Security selection within US investment grade corporates also boosted performance, led by positions within industrials and utilities.
Outlook
We believe that the Fed will likely remain on hold for the remainder of 2019 and into 2020, depending on substantive progress of trade talks and economic indicators. The three rate cuts have already helped to ameliorate yield curve inversion, stimulate activity and ease concerns about the impending end of the credit cycle.1 We believe these cuts represent a“mid-cycle adjustment” and we do not expect a US recession to take hold over the next twelve months.
Corporate fundamentals remain consistent with a credit cycle in late expansion. Top line revenues have plateaued, margins have started to deteriorate, leverage is elevated and businesses are concerned with the economic environment, particularly given the ongoing discussions around trade. Primary cycle risks continue to include the pace of global growth, US trade policy, strong dollar, global central bank policy accommodation and the potential for further escalation of Middle East tensions.
We currently have a 7.7% market value allocation to TIPS which accounts for approximately 22% of total portfolio duration. We continue to find breakeven inflation levels (the difference between yields on nominal Treasuries and TIPS of the same maturity) on10- and30-year TIPS attractive relative to historical levels and versus our inflation and interest rate expectations. In light of what we consider an overbought nominal Treasury market, we expect TIPS to provide an attractive alternative to longer-dated US Treasuries going forward, especially as the Fed refocuses on generating and sustaining a more robust inflation outlook for the US economy.
Our portfolio duration (which reflects price sensitivity to interest rate expectations) is approximately 0.45 years longer than the benchmark on a nominal basis, but we expect the portfolio to behave about 0.45 years shorter, largely due to our TIPS and high yield exposure.
We believe our higher-than-benchmark yield, in combination with our meaningful underweight to nominal Treasuries (with TIPS as a substitute), should help reduce interest rate risk should economic fundamentals start to stabilize and then improve late this year and next in response to the Fed’s decision to further ease monetary policy.
We may opportunistically add exposure back to investment grade credit, high yield credit and emerging market debt and currencies in the coming months, as valuations permit.
| 2
Table of Contents
LOOMIS SAYLES CORE PLUS BOND FUND
Given the late stage in the credit cycle, we are unlikely to return to the levels of overall credit exposure that we carried in recent years without a significant repricing of credit markets or a more lasting improvement in the US and global economic outlook.
During periods in which the US dollar appreciates relative to foreign currencies, funds that holdnon-US-dollar-denominated bonds may realize currency losses in connection with the maturity or sale of certain bonds. These losses impact a fund’s ordinary income distributions (to the extent that losses are not offset by realized currency gains within the fund’s fiscal year). A recognized currency loss, in accordance with federal tax rules, decreases the amount of ordinary income a fund has available to distribute, even though these bonds continue to generate coupon income.
Fund officers have analyzed the Fund’s current portfolio of investments, realized currency gains and losses, schedule of maturities, and the corresponding amounts of unrealized currency losses that may become realized during the current fiscal year. This analysis is performed regularly to determine how realized currency losses will affect periodic ordinary income distributions for the Fund. Based on the most recent quarterly analysis (as of September 30, 2019), Fund officers believe that realized currency losses will have an impact on the distributions in the 2020 fiscal year. This analysis is based on certain assumptions including, but not limited to, the level of foreign currency exchange rates, security prices, interest rates, the Fund advisers’ ability to manage realized currency losses, and the net asset level of the Fund. Changes to these assumptions could materially impact the analysis and the amounts of future Fund distributions. Fund officers will continue to monitor these amounts on a regular basis and take the necessary actions required to manage the Fund’s distributions to address realized currency losses while seeking to avoid a return of capital distribution.
| 1 | A credit cycle is a cyclical pattern that follows credit availability and corporate health. |
Hypothetical Growth of $100,000 Investment in Class Y Shares3
September 30, 2009 to September 30, 2019
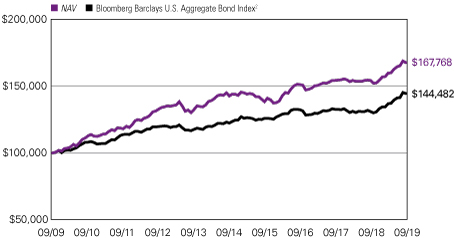
3 |
Table of Contents
Average Annual Total Returns — September 30, 20193
| Life of | Expense Ratios4 | |||||||||||||||||||||||
| 1 Year | 5 Years | 10 Years | Class N | Gross | Net | |||||||||||||||||||
| Class Y (Inception 12/30/94) |
| |||||||||||||||||||||||
| NAV | 8.67 | % | 3.31 | % | 5.31 | % | — | % | 0.48 | % | 0.48 | % | ||||||||||||
| Class A (Inception 11/7/73) | ||||||||||||||||||||||||
| NAV | 8.39 | 3.04 | 5.04 | — | 0.73 | 0.73 | ||||||||||||||||||
| With 4.25% Maximum Sales Charge | 3.75 | 2.14 | 4.58 | — | ||||||||||||||||||||
| Class C (Inception 12/30/94) |
| |||||||||||||||||||||||
| NAV | 7.57 | 2.28 | 4.25 | — | 1.48 | 1.48 | ||||||||||||||||||
| With CDSC1 | 6.57 | 2.28 | 4.25 | |||||||||||||||||||||
| Class N (Inception 2/1/13) | ||||||||||||||||||||||||
| NAV | 8.85 | 3.40 | — | 3.39 | 0.39 | 0.39 | ||||||||||||||||||
| Comparative Performance | ||||||||||||||||||||||||
| Bloomberg Barclays U.S. Aggregate Bond Index2 | 10.30 | 3.38 | 3.75 | 2.95 | ||||||||||||||||||||
Performance data shown represents past performance and is no guarantee of, and not necessarily indicative of, future results. Total return and value will vary, and you may have a gain or loss when shares are sold. Current performance may be lower or higher than quoted. For most recent month-end performance, visit im.natixis.com.Performance for other share classes will be greater or less than shown based on differences and sales charges. You may not invest directly in an index. Performance for periods less than one year is cumulative, not annualized. Returns reflect changes in share price and reinvestment of dividends and capital gains, if any. The table(s) do not reflect taxes shareholders might owe on any fund distributions or when they redeem their shares.
| 1 | Class C shares performance assumes a 1% CDSC applied when you sell shares within one year of purchase. |
| 2 | The Bloomberg Barclays U.S. Aggregate Bond Index is an unmanaged index that covers the U.S.-dollar-denominated, investment-grade, fixed-rate, taxable bond market of SEC-registered securities. The index includes bonds from the Treasury, government-related, corporate, mortgage-backed securities, asset-backed securities, and collateralized mortgage-backed securities sectors. |
| 3 | Fund performance has been increased by fee waivers and/or expense reimbursements, if any, without which performance would have been lower. |
| 4 | Expense ratios are as shown in the Fund’s prospectus in effect as of the date of this report. The expense ratios for the current reporting period can be found in the Financial Highlights section of this report under Ratios to Average Net Assets. Net expenses reflect contractual expense limitations set to expire on 1/31/20. When a Fund’s expenses are below the limitation, gross and net expense ratios will be the same. See Note 6 of the Notes to Financial Statements for more information about the Fund’s expense limitations. |
| 4
Table of Contents
LOOMIS SAYLES GLOBAL ALLOCATION FUND
| Managers | Symbols | |
| Daniel J. Fuss, CFA®, CIC | Class A LGMAX | |
| Eileen N. Riley, CFA® | Class C LGMCX | |
| David W. Rolley, CFA® | Class N LGMNX | |
| Lee M. Rosenbaum | Class Y LSWWX | |
| Loomis, Sayles & Company, L.P. | ||
Investment Goal
The Fund seeks high total investment return through a combination of capital appreciation and current income.
Market Conditions
The first half of the period saw initial signs of decelerating global growth. The slowdown in majornon-US economies proved more persistent due to political uncertainty and weak manufacturing data. However, employment statistics continued to indicate labor market strength and rising wages, which kept consumer confidence healthy. In the second half of the period global economic data and inflation expectations weakened, particularly in major export-driven economies like Germany and South Korea. Declining business investment and slowing trade flows are signals that theUS-China trade conflict is hindering global growth.
Global equity markets started the period with double-digit declines. Markets moved sharply upward in the first quarter of 2019 then leveled off over the second and third quarters. Overall global equity market returns were muted for the12-month period. The utilities, real estate, and consumer staples sectors posted the highest returns, as investors moved into perceived less risky areas of the market. The energy, materials, health care, and industrials sectors posted declines.
The US Federal Reserve (Fed) Open Market Committee raised its target rate in December by 25 basis points; market pricing reflected an expectation that the Fed may have tightened policy rates enough for the foreseeable future. In January, a more dovish tone from the Fed coupled with strong US jobs numbers sparked a relief rally and reduced fears of a global recession. Central bank easing has been a global theme in 2019 and some, such as the European Central Bank (ECB) and Bank of Japan (BOJ), are pressing further into negative territory. The ECB has also indicated that it will restart quantitative easing in November 2019.
The US dollar, despite the Fed cutting the policy rate by 50 basis points in fiscal year 2019, has strengthened against most currency peers during the period. Investors remain uneasy about prospects in Europe given the uncertain Brexit situation, political instability in Italy and rising fears of a recession in Germany. The low prospective returns on government bonds in Europe and Japan have pushed investors to seek the higher available yields in the US.
5 |
Table of Contents
Performance Results
For the 12 months ended September 30, 2019, Class Y shares of the Loomis Sayles Global Allocation Fund returned 7.95% at net asset value. The Fund outperformed its primary benchmark, the MSCI All Country World Index (Net), which returned 1.38%. The Fund outperformed its secondary blended benchmark, 60% MSCI All Country World Index (Net)/40% Bloomberg Barclays Global Aggregate Index, which returned 4.19%.
Explanation of Performance
The global equity, US fixed income, and non-US fixed income components of the Fund posted returns higher than the all equity primary benchmark. Performance against the secondary blended index was due to the Fund’s equity component. The US and non-US fixed income components of the Fund detracted marginally from relative return.
In equities, the largest three contributors were Danaher, Nestle, and Roper Technologies. Shares of Danaher, a technology-focused health care company, outperformed as the company announced its plan to acquire the Biopharma business of General Electric (GE) for $21 billion. Danaher’s three-decade-long track record of acquiring growth companies and improving operations via the application of its Danaher Business Systems provides investors with a clear path towards realizing value. In the case of GE Biopharma, Danaher was able to acquire a market leader in attractive end markets — bioprocessing and biopharma production — that Danaher already understood from its acquisition of Pall in 2015. We believe the Biopharma acquisition will enhance Danaher’s intrinsic value growth. We continue to view Danaher as one of the more attractive values within our scenario-based framework.
Shares of Nestle, the world’s largest food and beverage company, outperformed over the12-month period, as the stock was supported by strong organic growth, successful restructuring, and returning capital to shareholders. We continue to view Nestle as a high-quality company with multiple levers for intrinsic value growth; shares remain attractive based on our discounted cash flow methodology.
Shares of Roper Technologies, a manufacturer and distributor of industrial equipment and software, rose steadily over the period as the company continues to execute on its business strategy. The company rates highly across our quality criteria; its management team successfully executes an acquisitive business model, focused on purchasing cash-generative, asset-light companies in niche industries. By specifically focusing on consumables, replacement, and subscription-based products, the company generates an attractive recurring revenue stream (currently greater than 50% of total revenue) which we forecast to grow over time. We expect intrinsic value growth to be driven by top line growth, margin expansion, and capital allocation as management continues to redeploy organic free cash flow into acquisitions and return cash to shareholders.
In fixed income, the corporate credit allocation was a positive source of returns during the period. Particularly helpful to performance were overweight allocations to the consumer cyclical, communications, banking, and finance company sectors. The likelihood of further global central bank easing and the attractiveness of corporate yields versus a plethora of negative and low yielding government bonds benefited the asset class. Allocations to high
| 6
Table of Contents
LOOMIS SAYLES GLOBAL ALLOCATION FUND
yield corporate credit also contributed to positive performance. US high yield holdings contributed to results as they generally outpaced higher grade names. The expectation of further Fed rate cuts, a relatively strong consumer, and still-positive corporate earnings growth benefited the high yield market.
In equities, the largest three detractors were UnitedHealth Group, Amazon, and EOG Resources.
UnitedHealth Group, the largest managed care operator in the US, was the largest individual detractor for the period. Uncertainty around the Democratic Party’s potential health care platform as we approach the 2020 presidential election has weighed on shares, along with the broader managed care sector. We continue to view UnitedHealth Group shares favorably as it evolves from a health insurance pure play into an integrated service provider.
Shares of Amazon lagged over the period as the company absorbed the cost of offering one day shipping to customers. We believe this offering will enhance Amazon’s long-term competitive advantage versus other retailers. News flow around anti-trust investigations also weighed on Amazon shares; however, we think it’s unlikely that Amazon will be subject to anti-trust regulation at this juncture given its market share, which is currently in themid-single digits. We continue to view Amazon as a high-quality company and shares remain attractive based on our discounted cash flow methodology.
EOG Resources, an upstream oil and gas company, detracted from performance as shares declined in sympathy with the overall energy sector. We sold out of our position in EOG in August as intensive production challenged our investment thesis. We viewed the risk/reward opportunities in other holdings and in new ideas as more favorable.
In fixed income, allocations to select positions in the supermarket category did not keep pace with other corporate sectors. Supermarkets underperformed the broader corporate market. In addition, individual bond choices in the energy sector, in particular among select US independent and oil field services companies, failed to keep pace. Global oil demand has been very weak given slowing demand growth in major growth regions such as India and China as well as stagnant demand in the US. The Fund’s stance with respect to duration (and corresponding sensitivity to interest rates) and yield curve positioning along the US dollar-pay yield curve detracted from relative performance. Our underweight to the euro-pay markets also impeded performance as yields moved deeper into negative territory throughout the period. We were underweight the negative yielding Euro and JPY bond markets, as the Fund invested in higher yielding markets in the US. We utilized currency forwards in both currencies to maintain a more representative currency allocation in the account, which resulted in losses due to the FX hedging costs of selling USDs and mainly driven by the purchase of JPY. Exposure to the Colombian peso, Chilean peso, and Brazilian real also detracted as these currencies depreciated over the period.
Outlook
Global economic data may continue to indicate weakness near term. However, we expect the manufacturing-driven slowdown to reverse course later in the fourth quarter without a recession. Elsewhere, the ECB and BOJ have indicated signs of continued easing until
7 |
Table of Contents
growth and inflation approach mandated targets. Global growth consensus forecasts have stabilized across developed and emerging market economies. Absolute levels of real GDP still look decent for this year and next.
The outlook for corporate earnings and global growth remain critical factors helping to drive equity market performance. Downside risks include any uncontrolled trade escalation between the US and China and a slower-than-anticipated uptick in economic activity. Both could have a negative impact on earnings and equity markets. US trade policy remains a source of uncertainty for corporate decision-makers and investors. Clarity on trade negotiations with China and some sort of deal, even if small, would introduce potential upside for global equity markets.
Short-term volatility often provides us with entry points to build long-term positions in high-quality companies and opportunities to trim or sell positions at what we consider attractive levels. Rather than try to predict macro events, we focus on companies with sustainable business models and attractive valuations. The Fund continues to be positioned with a majority equity allocation and a tilt towardnon-US within fixed income as we are finding opportunities within these asset classes.
Hypothetical Growth of $100,000 Investment in Class Y Shares4
September 30, 2009 through September 30, 2019
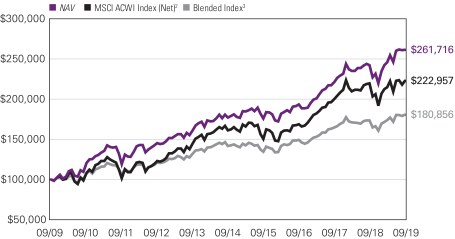
See notes to chart on page 10.
| 8
Table of Contents
LOOMIS SAYLES GLOBAL ALLOCATION FUND
Top Ten Holdings as of September 30, 2019
| Security Name | % of Assets | |||||
| 1 | Danaher Corp. | 3.35 | % | |||
| 2 | Roper Technologies, Inc. | 3.20 | ||||
| 3 | Northrop Grumman Corp. | 3.12 | ||||
| 4 | Sherwin-Williams Co. (The) | 2.67 | ||||
| 5 | Nestle S.A., (Registered) | 2.50 | ||||
| 6 | Alibaba Group Holding Ltd., Sponsored ADR | 2.43 | ||||
| 7 | Marriott International, Inc., Class A | 2.41 | ||||
| 8 | Amazon.com, Inc. | 2.38 | ||||
| 9 | UnitedHealth Group, Inc. | 2.32 | ||||
| 10 | AIA Group Ltd. | 2.11 | ||||
The portfolio is actively managed and holdings are subject to change. There is no guarantee the Fund continues to invest in the securities referenced. The holdings listed exclude any temporary cash investments.
9 |
Table of Contents
Average Annual Total Returns — September 30, 20194
| Life of | Expense Ratios5 | |||||||||||||||||||||||
| 1 Year | 5 Years | 10 Years | Class N | Gross | Net | |||||||||||||||||||
| Class Y (Inception 5/1/96) |
| |||||||||||||||||||||||
| NAV | 7.95 | % | 8.10 | % | 10.10 | % | — | % | 0.91 | % | 0.91 | % | ||||||||||||
| Class A (Inception 2/1/06) | ||||||||||||||||||||||||
| NAV | 7.66 | 7.84 | 9.82 | — | 1.16 | 1.16 | ||||||||||||||||||
| With 5.75% Maximum Sales Charge | 1.46 | 6.56 | 9.17 | — | ||||||||||||||||||||
| Class C (Inception 2/1/06) |
| |||||||||||||||||||||||
| NAV | 6.85 | 7.04 | 9.00 | — | 1.91 | 1.91 | ||||||||||||||||||
| With CDSC1 | 5.85 | 7.04 | 9.00 | — | ||||||||||||||||||||
| Class N (Inception 2/1/17) | ||||||||||||||||||||||||
| NAV | 8.04 | — | — | 11.63 | 0.83 | 0.83 | ||||||||||||||||||
| Comparative Performance | ||||||||||||||||||||||||
| MSCI All Country World Index (Net)2 | 1.38 | 6.65 | 8.35 | 9.37 | ||||||||||||||||||||
| Blended Index3 | 4.19 | 4.94 | 6.10 | 7.52 | ||||||||||||||||||||
Performance data shown represents past performance and is no guarantee of, and not necessarily indicative of, future results. Total return and value will vary, and you may have a gain or loss when shares are sold. Current performance may be lower or higher than quoted. For most recent month-end performance, visit im.natixis.com. Performance for other share classes will be greater or less than shown based on differences in fees and sales charges. You may not invest directly in an index. Performance for periods less than one year is cumulative, not annualized. Returns reflect changes in share price and reinvestment of dividends and capital gains, if any. The table(s) do not reflect taxes shareholders might owe on any fund distributions or when they redeem their shares.
| 1 | Performance for Class C shares assumes a 1% contingent deferred sales charge (“CDSC”) applied when you sell shares within one year of purchase. |
| 2 | The MSCI All Country World Index (Net) is a free float-adjusted market capitalization weighted index that is designed to measure the equity market performance of developed and emerging markets. |
| 3 | The Blended Index is an unmanaged, blended index composed of the following weights: 60% MSCI All Country World Index (Net) and 40% Bloomberg Barclays Global Aggregate Bond Index. The Bloomberg Barclays Global Aggregate Bond Index provides a broad-based measure of the global investment-grade fixed income markets. The three major components of this index are the U.S. Aggregate, the Pan-European Aggregate, and the Asian-Pacific Aggregate Indices. The index also includes Eurodollar and Euro-Yen corporate bonds, Canadian government, agency and corporate securities, and USD investment grade 144A securities. |
| 4 | Fund performance has been increased by fee waivers and/or expense reimbursements, if any, without which performance would have been lower. |
| 5 | Expense ratios are as shown in the Fund’s prospectus in effect as of the date of this report. The expense ratios for the current reporting period can be found in the Financial Highlights section of this report under Ratios to Average Net Assets. Net expenses reflect contractual expense limitations set to expire on 1/31/20. When a Fund’s expenses are below the limitation, gross and net expense ratios will be the same. See Note 6 of the Notes to Financial Statements for more information about the Fund’s expense limitations. |
| 10
Table of Contents
ADDITIONAL INFORMATION
The views expressed in this report reflect those of the portfolio managers as of the dates indicated. The managers’ views are subject to change at any time without notice based on changes in market or other conditions. References to specific securities or industries should not be regarded as investment advice. Because the Funds are actively managed, there is no assurance that they will continue to invest in the securities or industries mentioned.
All investing involves risk, including the risk of loss. There is no assurance that any investment will meet its performance objectives or that losses will be avoided.
ADDITIONAL INDEX INFORMATION
This document may contain references to third party copyrights, indexes, and trademarks, each of which is the property of its respective owner. Such owner is not affiliated with Natixis Investment Managers or any of its related or affiliated companies (collectively “Natixis Affiliates”) and does not sponsor, endorse or participate in the provision of any Natixis Affiliates services, funds or other financial products.
The index information contained herein is derived from third parties and is provided on an “as is” basis. The user of this information assumes the entire risk of use of this information. Each of the third party entities involved in compiling, computing or creating index information disclaims all warranties (including, without limitation, any warranties of originality, accuracy, completeness, timeliness, non-infringement, merchantability and fitness for a particular purpose) with respect to such information.
PROXY VOTING INFORMATION
A description of the Natixis Funds’ proxy voting policies and procedures is available without charge, upon request, by calling Natixis Funds at 800-225-5478; on the Fund’s website at im.natixis.com; and on the Securities and Exchange Commission’s (“SEC’s”) website at www.sec.gov. Information regarding how the Fund voted proxies relating to portfolio securities the most recent 12-month period ended June 30 is available from the Fund’s website and the SEC’s website.
QUARTERLY PORTFOLIO SCHEDULES
The Natixis Funds file complete schedules of portfolio holdings with the SEC for the first and third quarters of each fiscal year on Form N-PORT. The Funds’ Form N-PORT reports are available on the SEC’s website at www.sec.gov.
CFA® and Chartered Financial Analyst® are registered trademarks owned by the CFA Institute.
11 |
Table of Contents
UNDERSTANDING FUND EXPENSES
As a mutual fund shareholder, you incur different costs: transaction costs, including sales charges (loads) on purchases and contingent deferred sales charges on redemptions; and ongoing costs, including management fees, distribution and/or service fees (12b-1 fees), and other fund expenses. Certain exemptions may apply. These costs are described in more detail in the Fund’s prospectuses. The following examples are intended to help you understand the ongoing costs of investing in the Fund and help you compare these with the ongoing costs of investing in other mutual funds.
The first line in the table of each class of Fund shares shows the actual account values and actual fund expenses you would have paid on a $1,000 investment in the Fund from April 1, 2019 through September 30, 2019. To estimate the expenses you paid over the period, simply divide your account value by $1,000 (for example $8,600 account value divided by $1,000 = 8.6) and multiply the result by the number in the Expenses Paid During Period column as shown below for your class.
The second line in the table of each class of Fund shares provides information about hypothetical account values and hypothetical expenses based on the Fund’s actual expense ratios and an assumed rate of return of 5% per year before expenses, which is not the Fund’s actual return. The hypothetical account values and expenses may not be used to estimate the actual ending account balance or expenses you paid on your investment for the period. You may use this information to compare the ongoing costs of investing in the Fund to other funds. To do so, compare this 5% hypothetical example with the 5% hypothetical examples that appear in the shareholder reports of the other funds.
Please note that the expenses shown reflect ongoing costs only, and do not include any transaction costs, such as sales charges. Therefore, the second line in the table of the fund is useful in comparing ongoing costs only, and will not help you determine the relative costs of owning different funds. If transaction costs were included, total costs would be higher.
| LOOMIS SAYLES CORE PLUS BOND FUND | BEGINNING ACCOUNT VALUE 4/1/2019 | ENDING ACCOUNT VALUE 9/30/2019 | EXPENSES PAID DURING PERIOD* 4/1/2019 – 9/30/2019 | |||||||||
| Class A | ||||||||||||
| Actual | $1,000.00 | $1,048.00 | $3.70 | |||||||||
| Hypothetical (5% return before expenses) | $1,000.00 | $1,021.46 | $3.65 | |||||||||
| Class C | ||||||||||||
| Actual | $1,000.00 | $1,044.10 | $7.53 | |||||||||
| Hypothetical (5% return before expenses) | $1,000.00 | $1,017.70 | $7.44 | |||||||||
| Class N | ||||||||||||
| Actual | $1,000.00 | $1,050.20 | $2.00 | |||||||||
| Hypothetical (5% return before expenses) | $1,000.00 | $1,023.11 | $1.98 | |||||||||
| Class Y | ||||||||||||
| Actual | $1,000.00 | $1,049.70 | $2.41 | |||||||||
| Hypothetical (5% return before expenses) | $1,000.00 | $1,022.71 | $2.38 | |||||||||
| * | Expenses are equal to the Fund’s annualized expense ratio: 0.72%, 1.47%, 0.39% and 0.47% for Class A, C, N and Y, respectively, multiplied by the average account value over the period, multiplied by the number of days in the most recent fiscal half-year (183), divided by 365 (to reflect the half-year period). |
| 12
Table of Contents
| LOOMIS SAYLES GLOBAL ALLOCATION FUND | BEGINNING ACCOUNT VALUE 4/1/2019 | ENDING ACCOUNT VALUE 9/30/2019 | EXPENSES PAID DURING PERIOD* 4/1/2019 – 9/30/2019 | |||||||||
| Class A | ||||||||||||
| Actual | $1,000.00 | $1,063.10 | $5.95 | |||||||||
| Hypothetical (5% return before expenses) | $1,000.00 | $1,019.30 | $5.82 | |||||||||
| Class C | ||||||||||||
| Actual | $1,000.00 | $1,059.20 | $9.81 | |||||||||
| Hypothetical (5% return before expenses) | $1,000.00 | $1,015.54 | $9.60 | |||||||||
| Class N | ||||||||||||
| Actual | $1,000.00 | $1,065.00 | $4.24 | |||||||||
| Hypothetical (5% return before expenses) | $1,000.00 | $1,020.96 | $4.15 | |||||||||
| Class Y | ||||||||||||
| Actual | $1,000.00 | $1,064.10 | $4.66 | |||||||||
| Hypothetical (5% return before expenses) | $1,000.00 | $1,020.56 | $4.56 | |||||||||
| * | Expenses are equal to the Fund’s annualized expense ratio (after waiver/reimbursement): 1.15%, 1.90%, 0.82% and 0.90% for Class A, C, N and Y, respectively, multiplied by the average account value over the period, multiplied by the number of days in the most recent fiscal half-year (183), divided by 365 (to reflect the half-year period). |
13 |
Table of Contents
BOARD APPROVAL OF THE EXISTING ADVISORY AGREEMENTS
The Board of Trustees of the Trusts (the “Board”), including the Independent Trustees, considers matters bearing on each Fund’s advisory agreement (collectively, the “Agreements”) at most of its meetings throughout the year. Each year, usually in the spring, the Contract Review Committee of the Board meets to review the Agreements to determine whether to recommend that the full Board approve the continuation of the Agreements, typically for an additionalone-year period. After the Contract Review Committee has made its recommendation, the full Board, including the Independent Trustees, determines whether to approve the continuation of the Agreements.
In connection with these meetings, the Trustees receive materials that the Funds’ investment adviser and Loomis Sayles Core Plus Bond Fund’s advisory administrator (the “Advisers”) believes to be reasonably necessary for the Trustees to evaluate the Agreements. These materials generally include, among other items, (i) information on the investment performance of the Funds and the performance of peer groups of funds and the Funds’ performance benchmarks, (ii) information on the Funds’ advisory fees and other expenses, including information comparing the Funds’ advisory fees to the fees charged to institutional accounts with similar strategies managed by the Advisers, if any, and to those of peer groups of funds and information about any applicable expense caps and/or fee “breakpoints,” (iii) sales and redemption data in respect of the Funds, (iv) information about the profitability of the Agreements to the Advisers and (v) information obtained through the completion by the Advisers of a questionnaire distributed on behalf of the Trustees. The Board, including the Independent Trustees, also considers other matters such as (i) each Fund’s investment objective and strategies and the size, education and experience of the Advisers’ investment staffs and their use of technology, external research and trading cost measurement tools, (ii) arrangements in respect of the distribution of the Funds’ shares and the related costs, (iii) the allocation of the Funds’ brokerage, if any, including, to the extent applicable, the use of “soft” commission dollars to pay for research and other similar services, (iv) the Advisers’ policies and procedures relating to, among other things, compliance, trading and best execution, proxy voting and valuation, (v) information about amounts invested by the Funds’ portfolio managers in the Funds or in similar accounts that they manage and (vi) the general economic outlook with particular emphasis on the mutual fund industry. Throughout the process, the Trustees are afforded the opportunity to ask questions of and request additional materials from the Advisers.
In addition to the materials requested by the Trustees in connection with their annual consideration of the continuation of the Agreements, the Trustees receive materials in advance of each regular quarterly meeting of the Board that provide detailed information about the Funds’ investment performance and the fees charged to the Funds for advisory and other services. This information generally includes, among other things, an internal performance rating for each Fund based on agreed-upon criteria, graphs showing each Fund’s performance and expense differentials against each Fund’s peer group/category, performance ratings provided by a third-party, total return information for various periods, and third-party performance rankings for various periods comparing a Fund against similarly categorized funds. The portfolio management team for each Fund or other
| 14
Table of Contents
representatives of the Advisers make periodic presentations to the Contract Review Committee and/or the full Board, and Funds identified as presenting possible performance concerns may be subject to more frequent Board or Committee presentations and reviews. In addition, each quarter the Trustees are provided with detailed statistical information about each Fund’s portfolio. The Trustees also receive periodic updates between meetings.
The Board most recently approved the continuation of the Agreements for aone-year period at its meeting held in June 2019. In considering whether to approve the continuation of the Agreements, the Board, including the Independent Trustees, did not identify any single factor as determinative. Individual Trustees may have evaluated the information presented differently from one another, giving different weights to various factors. Matters considered by the Trustees, including the Independent Trustees, in connection with their approval of the Agreements included, but were not limited to, the factors listed below.
The nature, extent and quality of the services provided to the Funds under the Agreements. The Trustees considered the nature, extent and quality of the services provided by the Advisers and their affiliates to the Funds and the resources dedicated to the Funds by the Advisers and their affiliates.
The Trustees considered not only the advisory services provided by the Advisers to the Funds, but also the monitoring and oversight services provided by Natixis Advisors, L.P. (“Natixis Advisors”). They also considered the administrative and shareholder services provided by Natixis Advisors and its affiliates to the Funds.
For each Fund, the Trustees also considered the benefits to shareholders of investing in a mutual fund that is part of a family of funds that offers shareholders the right to exchange shares of one type of fund for shares of another type of fund, and provides a variety of fund and shareholder services.
After reviewing these and related factors, the Trustees concluded, within the context of their overall conclusions regarding each of the Agreements, that the nature, extent and quality of services provided supported the renewal of the Agreements.
Investment performance of the Funds and the Advisers. As noted above, the Trustees received information about the performance of the Funds over various time periods, including information that compared the performance of the Funds to the performance of peer groups and categories of funds and the Funds’ respective performance benchmarks. In addition, the Trustees reviewed data prepared by an independent third party that analyzed the performance of the Funds using a variety of performance metrics, including metrics that measured the performance of the Funds on a risk adjusted basis.
The Board noted that, through December 31, 2018, each Fund’sone-, three- and five-year performance stated as percentile rankings within categories selected by the independent third-party data provider was as follows (where the best performance would be in the first percentile of its category):
One-Year | Three-Year | Five-Year | ||||||||||
Loomis Sayles Core Plus Bond Fund | 68 | % | 3 | % | 27 | % | ||||||
Loomis Sayles Global Allocation Fund | 8 | % | 4 | % | 3 | % | ||||||
15 |
Table of Contents
In the case of a Fund that had performance that lagged that of a relevant category median as determined by the independent third party for certain (although not necessarily all) periods, the Board concluded that other factors relevant to performance supported renewal of the Agreements. These factors included: (1) that the underperformance was attributable, to a significant extent, to investment decisions (such as security selection or sector allocation) by the Advisers that were reasonable and consistent with the Fund’s investment objective and policies; (2) that the Fund’s long-term performance was strong; and (3) that the Fund had recently been assigned to a different category by the independent third-party data provider, which is expected to result in more relevant performance comparisons.
The Trustees also considered the Advisers’ performance and reputation generally, the performance of the fund family generally, and the historical responsiveness of the Advisers to Trustee concerns about performance and the willingness of the Advisers to take steps intended to improve performance.
After reviewing these and related factors, the Trustees concluded, within the context of their overall conclusions regarding each of the Agreements, that the performance of the Funds and the Advisers and/or other relevant factors supported the renewal of the Agreements.
The costs of the services to be provided and profits to be realized by the Advisers and their affiliates from their respective relationships with the Funds. The Trustees considered the fees charged to the Funds for advisory and administrative services as well as the total expense levels of the Funds. This information included comparisons (provided both by management and by an independent third party) of the Funds’ advisory fees and total expense levels to those of their peer groups and information about the advisory fees charged by the Advisers to comparable accounts (such as institutional separate accounts), as well as information about differences in such fees and the reasons for any such differences. In considering the fees charged to comparable accounts, the Trustees considered, among other things, management’s representations about the differences between managing mutual funds as compared to other types of accounts, including the additional resources required to effectively manage mutual fund assets and the greater regulatory costs associated with the management of such assets. In evaluating each Fund’s advisory fee, the Trustees also took into account the demands, complexity and quality of the investment management of such Fund, as well as the need for the Advisers to offer competitive compensation and the potential need to expend additional resources to the extent the Fund grows in size. The Trustees considered that over the past several years, management had made recommendations regarding reductions in advisory fee rates, implementation of advisory fee breakpoints and the institution of advisory fee waivers and expense caps for various funds in the fund family. They noted that the Funds have expense caps in place, and that the current expenses were below their caps. The Trustees also noted that the total advisory fee rate for each Fund was at or below the median of its peer group of funds.
The Trustees also considered the compensation directly or indirectly received by the Advisers and their affiliates from their relationships with the Funds. The Trustees reviewed information provided by management as to the profitability of the Advisers’ and their affiliates’ relationships with the Funds, and information about the allocation of expenses used to calculate profitability. They also reviewed information provided by management about the effect of distribution costs and changes in asset levels on Adviser profitability,
| 16
Table of Contents
including information regarding resources spent on distribution activities. When reviewing profitability, the Trustees also considered information about court cases in which adviser compensation or profitability were issues, the performance of the Funds, the expense levels of the Funds, whether the Advisers had implemented breakpoints and/or expense caps with respect to such Funds and the overall profit margin of Natixis Investment Managers compared to that of certain other investment managers for which such data was available.
After reviewing these and related factors, the Trustees concluded, within the context of their overall conclusions regarding the Agreements, that the advisory fee charged to each of the Funds was fair and reasonable, and that the costs of these services generally and the related profitability of the Advisers and their affiliates in respect of their relationships with the Funds supported the renewal of the Agreements.
Economies of Scale. The Trustees considered the existence of any economies of scale in the provision of services by the Advisers and whether those economies are shared with the Funds through breakpoints in their investment advisory fees or other means, such as expense caps. The Trustees also considered management’s explanation of the factors that are taken into account with respect to the implementation of breakpoints in investment advisory fees or expense caps. With respect to economies of scale, the Trustees noted that each of the Funds had breakpoints in its advisory fee and that each of the Funds was subject to an expense cap. In considering these issues, the Trustees also took note of the costs of the services provided (both on an absolute and on a relative basis) and the profitability to the Advisers and their affiliates of their relationships with the Funds, as discussed above. The Trustees also considered that the Funds have benefitted from the substantial reinvestment each Adviser has made into its business.
After reviewing these and related factors, the Trustees concluded, within the context of their overall conclusions regarding the Agreements, that the extent to which economies of scale were shared with the Funds supported the renewal of the Agreements.
The Trustees also considered other factors, which included but were not limited to the following:
| · | The effect of recent market and economic events on the performance, asset levels and expense ratios of each Fund. |
| · | Whether each Fund has operated in accordance with its investment objective and the Fund’s record of compliance with its investment restrictions, and the compliance programs of the Funds and the Advisers. They also considered the compliance-related resources the Advisers and their affiliates were providing to the Funds. |
| · | So-called “fallout benefits” to the Advisers, such as the engagement of affiliates of the Advisers to provide distribution and administrative services to the Funds, and the benefits of research made available to the Advisers by reason of brokerage commissions (if any) generated by the Funds’ securities transactions. The Trustees also considered the benefits to the parent company of Natixis Advisors from the retention of the Advisers. The Trustees considered the possible conflicts of interest associated with these fallout and other benefits, and the reporting, disclosure and other processes in place to disclose and monitor such possible conflicts of interest. |
17 |
Table of Contents
| · | The Trustees’ review and discussion of the Funds’ advisory arrangements in prior years, and management’s record of responding to Trustee concerns raised during the year and in prior years. |
Based on their evaluation of all factors that they deemed to be material, including those factors described above, and assisted by the advice of independent counsel, the Trustees, including the Independent Trustees, concluded that the existing Agreements should be continued through June 30, 2020.
| 18
Table of Contents
Portfolio of Investments – as of September 30, 2019
Loomis Sayles Core Plus Bond Fund
| Principal Amount (‡) | Description | Value (†) | ||||||
| Bonds and Notes — 93.2% of Net Assets | ||||||||
| Non-Convertible Bonds — 93.0% | ||||||||
| ABS Car Loan — 0.9% | ||||||||
| $ | 2,654,201 | AmeriCredit Automobile Receivables Trust, Series2015-4, Class C, 2.880%, 7/08/2021 | $ | 2,656,991 | ||||
| 109,099 | AmeriCredit Automobile Receivables Trust, Series2017-1, Class A3, 1.870%, 8/18/2021 | 109,047 | ||||||
| 2,000,000 | Avis Budget Rental Car Funding AESOP LLC, Series2015-1A, Class A, 2.500%, 7/20/2021, 144A | 2,001,520 | ||||||
| 11,955,000 | Avis Budget Rental Car Funding AESOP LLC, Series2016-1A, Class A, 2.990%, 6/20/2022, 144A | 12,084,438 | ||||||
| 15,005,000 | Avis Budget Rental Car Funding AESOP LLC, Series2016-2A, Class A, 2.720%, 11/20/2022, 144A | 15,128,860 | ||||||
| 10,350,000 | Avis Budget Rental Car Funding AESOP LLC, Series2017-1A, Class A, 3.070%, 9/20/2023, 144A | 10,566,336 | ||||||
| 4,985,000 | Avis Budget Rental Car Funding AESOP LLC, Series2019-1, Class A, 3.450%, 3/20/2023, 144A | 5,120,301 | ||||||
| 515,075 | CPS Auto Receivables Trust, Series2015-C, Class C, 3.420%, 8/16/2021, 144A | 515,286 | ||||||
| 1,026,408 | Credit Acceptance Auto Loan Trust, Series2017-1A, Class A, 2.560%, 10/15/2025, 144A | 1,026,814 | ||||||
| 7,435,000 | Credit Acceptance Auto Loan Trust, Series2017-3A, Class B, 3.210%, 8/17/2026, 144A | 7,522,871 | ||||||
| 880,537 | Drive Auto Receivables Trust, Series2017-AA, Class C, 2.980%, 1/18/2022, 144A | 881,421 | ||||||
| 5,755,000 | Santander Drive Auto Receivables Trust, Series2018-2, Class B, 3.030%, 9/15/2022 | 5,767,776 | ||||||
| 4,140,000 | Santander Drive Auto Receivables Trust, Series2018-2, Class C, 3.350%, 7/17/2023 | 4,183,022 | ||||||
| 2,475,000 | Santander Drive Auto Receivables Trust, Series2019-3, Class A3, 2.160%, 11/15/2022 | 2,475,423 | ||||||
|
| |||||||
| 70,040,106 | ||||||||
|
| |||||||
| ABS Credit Card — 0.3% | ||||||||
| 11,115,000 | World Financial Network Credit Card Master Trust, Series2016-A, Class A, 2.030%, 4/15/2025 | 11,097,318 | ||||||
| 12,265,000 | World Financial Network Credit Card Master Trust, Series2016-C, Class A, 1.720%, 8/15/2023 | 12,262,531 | ||||||
|
| |||||||
| 23,359,849 | ||||||||
|
| |||||||
| ABS Home Equity — 1.8% | ||||||||
| 3,122,786 | Bayview Opportunity Master Fund IVa Trust, Series 2016-SPL1, Class A, 4.000%, 4/28/2055, 144A | 3,190,072 | ||||||
| 1,749,461 | Bayview Opportunity Master Fund IVa Trust, Series2017-RT1, Class A1, 3.000%, 3/28/2057, 144A(a) | 1,766,775 | ||||||
| 9,261,109 | Bayview Opportunity Master Fund IVa Trust, Series2017-RT5, Class A, 3.500%, 5/28/2069, 144A(a) | 9,425,778 | ||||||
| 5,043,583 | Bayview Opportunity Master Fund IVa Trust, Series 2017-SPL1, Class A, 4.000%, 10/28/2064, 144A(a) | 5,189,709 | ||||||
See accompanying notes to financial statements.
19 |
Table of Contents
Portfolio of Investments – as of September 30, 2019
Loomis Sayles Core Plus Bond Fund – (continued)
| Principal Amount (‡) | Description | Value (†) | ||||||
| ABS Home Equity — continued | ||||||||
| $ | 2,078,072 | Bayview Opportunity Master Fund IVb Trust, Series 2017-SPL2, Class A, 4.000%, 6/28/2054, 144A(a) | $ | 2,136,223 | ||||
| 2,313,465 | Bayview Opportunity Master Fund IVb Trust, Series 2017-SPL3, Class A, 4.000%, 11/28/2053, 144A(a) | 2,378,511 | ||||||
| 3,215,092 | Colony American Finance Ltd., Series2015-1, Class A, 2.896%, 10/15/2047, 144A | 3,210,314 | ||||||
| 41,750 | Countrywide Asset-Backed Certificates, Series2004-S1, Class A3, 5.115%, 2/25/2035(a)(b)(c) | 41,289 | ||||||
| 25,419,601 | Invitation Homes Trust, Series 2018-SFR2, Class A,1-month LIBOR + 0.900%, 2.928%, 6/17/2037, 144A(d) | 25,419,563 | ||||||
| 8,960,000 | Lanark Master Issuer PLC, Series2019-1A, Class 1A1,3-month LIBOR + 0.770%, 2.902%, 12/22/2069, 144A(d) | 8,979,730 | ||||||
| 2,476,283 | Mill City Mortgage Loan Trust, Series2016-1, Class A1, 2.500%, 4/25/2057, 144A(a) | 2,480,073 | ||||||
| 9,434,291 | Onslow Bay Financial LLC, Series 2018-EXP1, Class 1A3, 4.000%, 4/25/2048, 144A(a) | 9,587,348 | ||||||
| 2,684,063 | Sequoia Mortgage Trust, Series2017-CH1, Class A1, 4.000%, 8/25/2047, 144A(a) | 2,751,408 | ||||||
| 2,654,845 | Sequoia Mortgage Trust, Series2017-CH2, Class A10, 4.000%, 12/25/2047, 144A(a) | 2,682,869 | ||||||
| 5,867,629 | Sequoia Mortgage Trust, Series2018-CH1, Class A1, 4.000%, 2/25/2048, 144A(a) | 6,004,124 | ||||||
| 13,065,857 | Sequoia Mortgage Trust, Series2018-CH3, Class A2, 4.000%, 8/25/2048, 144A(a) | 13,281,946 | ||||||
| 1,454,000 | Towd Point Mortgage Trust, Series2015-1, Class A5, 3.997%, 10/25/2053, 144A(a) | 1,511,605 | ||||||
| 6,771,874 | Towd Point Mortgage Trust, Series2015-2, Class 1A12, 2.750%, 11/25/2060, 144A(a) | 6,779,684 | ||||||
| 5,018,000 | Towd Point Mortgage Trust, Series2015-4, Class M2, 3.750%, 4/25/2055, 144A(a) | 5,184,413 | ||||||
| 5,858,195 | Towd Point Mortgage Trust, Series2016-2, Class A1A, 2.750%, 8/25/2055, 144A(a) | 5,881,331 | ||||||
| 6,017,000 | Towd Point Mortgage Trust, Series2016-2, Class M2, 3.000%, 8/25/2055, 144A(a) | 6,025,167 | ||||||
| 12,758,018 | Towd Point Mortgage Trust, Series2018-3, Class A1, 3.750%, 5/25/2058, 144A(a) | 13,228,193 | ||||||
|
| |||||||
| 137,136,125 | ||||||||
|
| |||||||
| ABS Other — 0.1% | ||||||||
| 4,538,904 | OneMain Financial Issuance Trust, Series2016-1A, Class A, 3.660%, 2/20/2029, 144A | 4,554,604 | ||||||
| 4,476,400 | TAL Advantage V LLC, Series2014-3A, Class A, 3.270%, 11/21/2039, 144A | 4,487,120 | ||||||
|
| |||||||
| 9,041,724 | ||||||||
|
| |||||||
| ABS Student Loan — 0.0% | ||||||||
| 620,918 | SoFi Professional Loan Program LLC, Series2014-B, Class A2, 2.550%, 8/27/2029, 144A | 621,041 | ||||||
|
| |||||||
See accompanying notes to financial statements.
| 20
Table of Contents
Portfolio of Investments – as of September 30, 2019
Loomis Sayles Core Plus Bond Fund – (continued)
| Principal Amount (‡) | Description | Value (†) | ||||||
| ABS Whole Business — 0.5% | ||||||||
| $ | 19,149,225 | Coinstar Funding LLC, Series2017-1A, Class A2, 5.216%, 4/25/2047, 144A | $ | 19,721,674 | ||||
| 14,335,200 | Planet Fitness Master Issuer LLC, Series2018-1A, Class A2I, 4.262%, 9/05/2048, 144A | 14,655,878 | ||||||
|
| |||||||
| 34,377,552 | ||||||||
|
| |||||||
| Aerospace & Defense — 0.2% | ||||||||
| 921,000 | Bombardier, Inc., 5.750%, 3/15/2022, 144A | 935,966 | ||||||
| 14,932,000 | Embraer Netherlands Finance BV, 5.050%, 6/15/2025 | 16,332,025 | ||||||
|
| |||||||
| 17,267,991 | ||||||||
|
| |||||||
| Agency Commercial Mortgage-Backed Securities — 2.9% | ||||||||
| 15,165,000 | Federal National Mortgage Association, Series2015-M15, Class A2, 2.923%, 10/25/2025(a) | 15,802,998 | ||||||
| 6,750,000 | Federal National Mortgage Association, Series2015-M17, Class A2, 3.035%, 11/25/2025(a) | 7,049,736 | ||||||
| 10,975,000 | Federal National Mortgage Association, Series2016-M4, Class A2, 2.576%, 3/25/2026 | 11,235,243 | ||||||
| 20,355,000 | Federal National Mortgage Association, Series2017-M14, Class A2, 2.972%, 11/25/2027(a) | 21,324,932 | ||||||
| 1,660,000 | Federal National Mortgage Association, Series2017-M15, Class A2, 3.058%, 9/25/2027(a) | 1,757,458 | ||||||
| 7,591,000 | Federal National Mortgage Association, Series2017-M3, Class A2, 2.566%, 12/25/2026(a) | 7,740,459 | ||||||
| 6,538,096 | Federal National Mortgage Association, Series2017-M7, Class A2, 2.961%, 2/25/2027(a) | 6,861,898 | ||||||
| 11,860,279 | Federal National Mortgage Association, Series2018-M1, Class A2, 3.085%, 12/25/2027(a) | 12,587,491 | ||||||
| 2,460,000 | Federal National Mortgage Association, Series2018-M10, Class A2, 3.497%, 7/25/2028(a) | 2,674,254 | ||||||
| 6,965,000 | Federal National Mortgage Association, Series2018-M7, Class A2, 3.150%, 3/25/2028(a) | 7,388,937 | ||||||
| 4,665,000 | Federal National Mortgage Association, Series2018-M8, Class A2, 3.436%, 6/25/2028(a) | 5,052,325 | ||||||
| 7,350,000 | FHLMC Multifamily Structured Pass Through Certificates, Series K725, Class A2, 3.002%, 1/25/2024 | 7,626,356 | ||||||
| 2,770,000 | FHLMC Multifamily Structured Pass Through Certificates, Series K058, Class A2, 2.653%, 8/25/2026 | 2,876,576 | ||||||
| 6,195,000 | FHLMC Multifamily Structured Pass Through Certificates, Series K061, Class A2, 3.347%, 11/25/2026(a) | 6,707,706 | ||||||
| 6,995,000 | FHLMC Multifamily Structured Pass Through Certificates, Series K062, Class A2, 3.413%, 12/25/2026 | 7,607,237 | ||||||
| 5,105,490 | FHLMC Multifamily Structured Pass Through Certificates, Series K063, Class A2, 3.430%, 1/25/2027(a) | 5,553,636 | ||||||
| 915,000 | FHLMC Multifamily Structured Pass Through Certificates, Series K069, Class A2, 3.187%, 9/25/2027(a) | 983,729 | ||||||
| 1,310,000 | FHLMC Multifamily Structured Pass Through Certificates, Series K071, Class A2, 3.286%, 11/25/2027 | 1,417,447 | ||||||
| 8,045,000 | FHLMC Multifamily Structured Pass Through Certificates, Series K072, Class A2, 3.444%, 12/25/2027 | 8,802,413 | ||||||
See accompanying notes to financial statements.
21 |
Table of Contents
Portfolio of Investments – as of September 30, 2019
Loomis Sayles Core Plus Bond Fund – (continued)
| Principal Amount (‡) | Description | Value (†) | ||||||
| Agency Commercial Mortgage-Backed Securities — continued | ||||||||
| $ | 2,550,000 | FHLMC Multifamily Structured Pass Through Certificates, Series K073, Class A2, 3.350%, 1/25/2028 | $ | 2,775,702 | ||||
| 21,680,000 | FHLMC Multifamily Structured Pass Through Certificates, Series K081, Class A2, 3.900%, 8/25/2028(a) | 24,540,097 | ||||||
| 7,205,000 | FHLMC Multifamily Structured Pass Through Certificates, Series K082, Class A2, 3.920%, 9/25/2028(a) | 8,176,853 | ||||||
| 10,465,000 | FHLMC Multifamily Structured Pass Through Certificates, Series K084, Class A2, 3.780%, 10/25/2028(a) | 11,752,675 | ||||||
| 11,410,000 | FHLMC Multifamily Structured Pass Through Certificates, Series K727, Class A2, 2.946%, 7/25/2024 | 11,815,449 | ||||||
| 2,151,433 | FNMA, 2.880%, 12/01/2027 | 2,263,970 | ||||||
| 6,485,000 | FNMA, 2.900%, 12/01/2027 | 6,824,238 | ||||||
| 5,035,000 | FNMA, 2.950%, 11/01/2027 | 5,337,997 | ||||||
| 1,826,000 | FNMA, 3.015%, 7/01/2028 | 1,941,284 | ||||||
|
| |||||||
| 216,479,096 | ||||||||
|
| |||||||
| Airlines — 0.0% | ||||||||
| 2,294,395 | Continental Airlines Pass Through Certificates, Series2012-2, Class A, 4.000%, 4/29/2026 | 2,418,338 | ||||||
| 505,079 | Continental Airlines Pass Through Trust, Series2010-1, Class A, 4.750%, 7/12/2022 | 518,611 | ||||||
|
| |||||||
| 2,936,949 | ||||||||
|
| |||||||
| Automotive — 1.6% | ||||||||
| 12,010,000 | Ford Motor Credit Co. LLC, 3.336%, 3/18/2021 | 12,066,096 | ||||||
| 27,688,000 | Ford Motor Credit Co. LLC, 5.750%, 2/01/2021 | 28,624,266 | ||||||
| 16,412,000 | Ford Motor Credit Co. LLC, 5.875%, 8/02/2021 | 17,190,749 | ||||||
| 18,701,000 | General Motors Co., 5.000%, 4/01/2035 | 18,770,984 | ||||||
| 22,752,000 | Hyundai Capital America, 3.000%, 10/30/2020, 144A | 22,859,972 | ||||||
| 10,350,000 | Toyota Motor Corp., 2.358%, 7/02/2024 | 10,457,727 | ||||||
| 8,370,000 | Volkswagen Group of America Finance LLC, 3.200%, 9/26/2026, 144A | 8,435,187 | ||||||
|
| |||||||
| 118,404,981 | ||||||||
|
| |||||||
| Banking — 8.4% | ||||||||
| 17,853,000 | Ally Financial, Inc., 3.750%, 11/18/2019 | 17,869,068 | ||||||
| 21,085,000 | American Express Co., 2.500%, 7/30/2024 | 21,248,033 | ||||||
| 16,016,000 | Banco Santander Chile, 3.875%, 9/20/2022, 144A | 16,633,082 | ||||||
| 31,480,000 | Bangkok Bank PCL, 4.050%, 3/19/2024, 144A | 33,537,263 | ||||||
| 10,172,000 | Bank of America Corp., (fixed rate to 12/20/2022, variable rate thereafter), 3.004%, 12/20/2023 | 10,388,334 | ||||||
| 45,265,000 | Bank of America Corp., (fixed rate to 4/23/2026, variable rate thereafter), MTN, 3.559%, 4/23/2027 | 47,745,499 | ||||||
| 5,715,000 | Bank of America Corp., GMTN, 2.625%, 4/19/2021 | 5,766,043 | ||||||
| 10,850,000 | Bank of Montreal, Series D, 3.100%, 4/13/2021 | 11,036,081 | ||||||
| 45,518,000 | Barclays PLC, 2.875%, 6/08/2020 | 45,688,237 | ||||||
| 7,058,000 | Barclays PLC, 3.200%, 8/10/2021 | 7,120,110 | ||||||
| 14,545,000 | Capital One NA, 2.150%, 9/06/2022 | 14,530,753 | ||||||
| 5,780,000 | Citigroup, Inc., 2.650%, 10/26/2020 | 5,815,391 | ||||||
See accompanying notes to financial statements.
| 22
Table of Contents
Portfolio of Investments – as of September 30, 2019
Loomis Sayles Core Plus Bond Fund – (continued)
| Principal Amount (‡) | Description | Value (†) | ||||||
| Banking — continued | ||||||||
| $ | 30,055,000 | Citigroup, Inc., 4.050%, 7/30/2022 | $ | 31,476,021 | ||||
| 11,955,000 | Goldman Sachs Bank USA, SOFR + 0.600%, 2.575%, 5/24/2021(d) | 11,974,556 | ||||||
| 5,780,000 | Goldman Sachs Group, Inc. (The), 2.600%, 4/23/2020 | 5,790,734 | ||||||
| 12,701,000 | Goldman Sachs Group, Inc. (The), 3.625%, 1/22/2023 | 13,208,738 | ||||||
| 14,867,000 | Goldman Sachs Group, Inc. (The), 5.750%, 1/24/2022 | 16,017,577 | ||||||
| 13,448,000 | Goldman Sachs Group, Inc. (The), 6.750%, 10/01/2037 | 18,153,241 | ||||||
| 19,915,000 | Huntington Bancshares, Inc., 2.625%, 8/06/2024 | 20,108,120 | ||||||
| 3,205,000 | JPMorgan Chase & Co., 2.550%, 3/01/2021 | 3,222,990 | ||||||
| 10,919,000 | JPMorgan Chase & Co., 3.200%, 1/25/2023 | 11,276,472 | ||||||
| 1,785,000 | JPMorgan Chase & Co., 4.250%, 10/15/2020 | 1,826,488 | ||||||
| 10,223,000 | JPMorgan Chase & Co., 4.350%, 8/15/2021 | 10,634,563 | ||||||
| 23,597,000 | JPMorgan Chase & Co., 4.500%, 1/24/2022 | 24,893,311 | ||||||
| 33,445,000 | JPMorgan Chase & Co., (fixed rate to 10/15/2029, variable rate thereafter), 2.739%, 10/15/2030 | 33,210,078 | ||||||
| 3,235,000 | Lloyds Banking Group PLC, 3.000%, 1/11/2022 | 3,268,164 | ||||||
| 3,955,000 | Lloyds Banking Group PLC, 3.100%, 7/06/2021 | 4,008,210 | ||||||
| 23,780,000 | Lloyds Banking Group PLC, 4.344%, 1/09/2048 | 24,366,052 | ||||||
| 7,690,000 | Morgan Stanley, 2.800%, 6/16/2020 | 7,728,849 | ||||||
| 19,598,000 | Morgan Stanley, 5.750%, 1/25/2021 | 20,506,859 | ||||||
| 3,381,000 | Morgan Stanley, GMTN, 3.700%, 10/23/2024 | 3,580,042 | ||||||
| 12,550,000 | Morgan Stanley, GMTN, 5.500%, 7/28/2021 | 13,317,096 | ||||||
| 21,770,000 | Morgan Stanley, Series F, 3.875%, 4/29/2024 | 23,159,573 | ||||||
| 16,700,000 | Nationwide Building Society, (fixed rate to 4/26/2022, variable rate thereafter), 3.622%, 4/26/2023, 144A | 17,024,717 | ||||||
| 9,123,000 | Santander UK Group Holdings PLC, 5.625%, 9/15/2045, 144A | 10,505,781 | ||||||
| 18,300,000 | Sumitomo Mitsui Financial Group, Inc., 2.696%, 7/16/2024 | 18,504,172 | ||||||
| 14,405,000 | Sumitomo Mitsui Financial Group, Inc., 3.040%, 7/16/2029 | 14,734,591 | ||||||
| 25,285,000 | Toronto Dominion Bank (The), 2.650%, 6/12/2024 | 25,761,640 | ||||||
|
| |||||||
| 625,636,529 | ||||||||
|
| |||||||
| Building Materials — 0.1% | ||||||||
| 8,563,000 | Owens Corning, 4.200%, 12/01/2024 | 9,013,883 | ||||||
|
| |||||||
| Cable Satellite — 0.2% | ||||||||
| 924,000 | Time Warner Cable LLC, 5.500%, 9/01/2041 | 994,965 | ||||||
| 2,648,000 | Time Warner Cable LLC, 5.875%, 11/15/2040 | 2,961,480 | ||||||
| 8,447,000 | Time Warner Cable LLC, 6.550%, 5/01/2037 | 10,140,711 | ||||||
| 2,013,000 | Time Warner Cable LLC, 6.750%, 6/15/2039 | 2,460,760 | ||||||
|
| |||||||
| 16,557,916 | ||||||||
|
| |||||||
| Chemicals — 1.4% | ||||||||
| 26,749,000 | Braskem America Finance Co., 7.125%, 7/22/2041, 144A | 31,764,438 | ||||||
| 3,680,000 | Koppers, Inc., 6.000%, 2/15/2025, 144A | 3,682,318 | ||||||
| 3,566,000 | Methanex Corp., 3.250%, 12/15/2019 | 3,573,018 | ||||||
| 14,107,000 | Methanex Corp., 5.250%, 3/01/2022 | 14,660,254 | ||||||
| 17,715,000 | Methanex Corp., 5.250%, 12/15/2029 | 17,786,565 | ||||||
| 10,242,000 | Orbia Advance Corp. SAB de CV, 5.875%, 9/17/2044, 144A | 10,843,718 | ||||||
| 11,165,000 | Orbia Advance Corp. SAB de CV, 6.750%, 9/19/2042, 144A | 13,063,162 | ||||||
| 4,402,000 | RPM International, Inc., 3.450%, 11/15/2022 | 4,518,814 | ||||||
See accompanying notes to financial statements.
23 |
Table of Contents
Portfolio of Investments – as of September 30, 2019
Loomis Sayles Core Plus Bond Fund – (continued)
| Principal Amount (‡) | Description | Value (†) | ||||||
| Chemicals — continued | ||||||||
| $ | 3,558,000 | RPM International, Inc., 6.125%, 10/15/2019 | $ | 3,562,566 | ||||
|
| |||||||
| 103,454,853 | ||||||||
|
| |||||||
| Collateralized Mortgage Obligations — 1.1% | ||||||||
| 22,649,444 | Federal Home Loan Mortgage Corp., Series 277, Class 30, 3.000%, 9/15/2042 | 23,163,620 | ||||||
| 2,672,415 | Federal Home Loan Mortgage Corp., Series 353, Class 300, 3.000%, 12/15/2046 | 2,754,050 | ||||||
| 5,000,000 | Federal Home Loan Mortgage Corp., Series 3654, Class DC, 5.000%, 4/15/2030 | 5,636,088 | ||||||
| 508,419 | Government National Mortgage Association, Series2010-H20, Class AF,1-month LIBOR + 0.330%, 2.559%, 10/20/2060(d) | 506,477 | ||||||
| 416,946 | Government National Mortgage Association, Series2010-H24, Class FA,1-month LIBOR + 0.350%, 2.579%, 10/20/2060(d) | 415,454 | ||||||
| 340,084 | Government National Mortgage Association, Series2011-H06, Class FA,1-month LIBOR + 0.450%, 2.679%, 2/20/2061(d) | 339,814 | ||||||
| 3,712,414 | Government National Mortgage Association, Series2012-H12, Class FA,1-month LIBOR + 0.550%, 2.779%, 4/20/2062(d) | 3,717,707 | ||||||
| 473,450 | Government National Mortgage Association, Series2012-H18, Class NA,1-month LIBOR + 0.520%, 2.749%, 8/20/2062(d) | 473,647 | ||||||
| 3,858,337 | Government National Mortgage Association, Series2012-H27, Class FA,1-month LIBOR + 0.400%, 2.629%, 10/20/2062(d) | 3,851,047 | ||||||
| 1,231,485 | Government National Mortgage Association, Series2013-H01, Class FA, 1.650%, 1/20/2063 | 1,225,422 | ||||||
| 2,014,006 | Government National Mortgage Association, Series2013-H03, Class HA, 1.750%, 12/20/2062 | 2,004,984 | ||||||
| 2,922,468 | Government National Mortgage Association, Series2013-H04, Class BA, 1.650%, 2/20/2063 | 2,908,107 | ||||||
| 7,682,448 | Government National Mortgage Association, Series2013-H07, Class DA, 2.500%, 3/20/2063 | 7,680,171 | ||||||
| 11,798,963 | Government National Mortgage Association, Series2013-H10, Class PA, 2.500%, 4/20/2063 | 11,780,263 | ||||||
| 12,590,023 | Government National Mortgage Association, Series2015-H10, Class JA, 2.250%, 4/20/2065 | 12,429,811 | ||||||
| 6,351,944 | Government National Mortgage Association, Series2015-H13, Class FG,1-month LIBOR + 0.400%, 2.629%, 4/20/2065(d) | 6,340,238 | ||||||
| 237,504 | Government National Mortgage Association, Series2015-H13, Class FL,1-month LIBOR + 0.280%, 2.509%, 5/20/2063(d) | 237,228 | ||||||
|
| |||||||
| 85,464,128 | ||||||||
|
| |||||||
| Construction Machinery — 0.2% | ||||||||
| 8,705,000 | CNH Industrial Capital LLC, 4.375%, 4/05/2022 | 9,039,446 | ||||||
| 4,790,000 | John Deere Capital Corp., MTN, 2.600%, 3/07/2024 | 4,887,647 | ||||||
|
| |||||||
| 13,927,093 | ||||||||
|
| |||||||
| Consumer Cyclical Services — 0.4% | ||||||||
| 25,600,000 | Amazon.com, Inc., 4.250%, 8/22/2057 | 31,822,977 | ||||||
|
| |||||||
See accompanying notes to financial statements.
| 24
Table of Contents
Portfolio of Investments – as of September 30, 2019
Loomis Sayles Core Plus Bond Fund – (continued)
| Principal Amount (‡) | Description | Value (†) | ||||||
| Consumer Products — 0.2% | ||||||||
| $ | 11,675,000 | Whirlpool Corp., 4.750%, 2/26/2029 | $ | 13,013,105 | ||||
| 3,495,000 | Whirlpool Corp., MTN, 4.850%, 6/15/2021 | 3,627,693 | ||||||
|
| |||||||
| 16,640,798 | ||||||||
|
| |||||||
| Diversified Manufacturing — 0.1% | ||||||||
| 1,158,000 | Crane Co., 6.550%, 11/15/2036 | 1,457,345 | ||||||
| 2,770,000 | General Electric Co., 5.300%, 2/11/2021 | 2,861,982 | ||||||
|
| |||||||
| 4,319,327 | ||||||||
|
| |||||||
| Electric — 1.3% | ||||||||
| 26,437,125 | Cometa Energia S.A. de CV, 6.375%, 4/24/2035, 144A | 28,122,492 | ||||||
| 3,315,000 | Enel Americas S.A., 4.000%, 10/25/2026 | 3,462,517 | ||||||
| 3,364,000 | Enel Generacion Chile S.A., 4.250%, 4/15/2024 | 3,557,544 | ||||||
| 17,805,000 | Florida Power & Light Co., 3.150%, 10/01/2049 | 18,117,095 | ||||||
| 17,247,000 | National Rural Utilities Cooperative Finance Corp., (fixed rate to 4/30/2023, variable rate thereafter), 4.750%, 4/30/2043 | 17,567,277 | ||||||
| 5,930,000 | PPL Electric Utilities Corp., 3.000%, 10/01/2049 | 5,737,611 | ||||||
| 8,413,000 | Transelec S.A., 4.250%, 1/14/2025, 144A | 8,917,864 | ||||||
| 4,380,000 | Transelec S.A., 4.625%, 7/26/2023, 144A | 4,653,794 | ||||||
| 3,050,000 | Virginia Electric & Power Co., 2.875%, 7/15/2029 | 3,123,867 | ||||||
|
| |||||||
| 93,260,061 | ||||||||
|
| |||||||
| Finance Companies — 0.5% | ||||||||
| 1,534,000 | AerCap Ireland Capital DAC/AerCap Global Aviation Trust, 3.300%, 1/23/2023 | 1,564,331 | ||||||
| 18,035,000 | Air Lease Corp., GMTN, 3.750%, 6/01/2026 | 18,735,250 | ||||||
| 3,910,000 | International Lease Finance Corp., 5.875%, 8/15/2022 | 4,283,838 | ||||||
| 14,547,000 | Navient LLC, MTN, 8.000%, 3/25/2020 | 14,819,756 | ||||||
|
| |||||||
| 39,403,175 | ||||||||
|
| |||||||
| Financial Other — 0.1% | ||||||||
| 7,243,251 | Cielo USA, Inc., 3.750%, 11/16/2022, 144A | 7,246,148 | ||||||
|
| |||||||
| Food & Beverage — 0.4% | ||||||||
| 7,380,000 | Bacardi Ltd., 5.150%, 5/15/2038, 144A | 8,099,097 | ||||||
| 16,885,000 | Bacardi Ltd., 5.300%, 5/15/2048, 144A | 19,344,095 | ||||||
| 3,490,000 | Gruma SAB de CV, 4.875%, 12/01/2024, 144A | 3,777,960 | ||||||
| 1,230,000 | Sigma Alimentos S.A. de CV, 6.875%, 12/16/2019, 144A | 1,239,803 | ||||||
|
| |||||||
| 32,460,955 | ||||||||
|
| |||||||
| Government Owned – No Guarantee — 2.6% | ||||||||
| 7,757,000 | CNPC General Capital Ltd., 3.950%, 4/19/2022, 144A | 8,029,038 | ||||||
| 17,981,000 | Dolphin Energy Ltd. LLC, 5.500%, 12/15/2021, 144A | 19,081,977 | ||||||
| 11,005,000 | Mexico City Airport Trust, 5.500%, 7/31/2047, 144A | 10,915,859 | ||||||
| 18,213,000 | OCP S.A., 5.625%, 4/25/2024, 144A | 19,858,617 | ||||||
| 7,355,000 | Ooredoo International Finance Ltd., 3.250%, 2/21/2023, 144A | 7,490,664 | ||||||
| 10,955,000 | Ooredoo International Finance Ltd., 3.875%, 1/31/2028, 144A | 11,749,237 | ||||||
| 11,250,000 | Saudi Arabian Oil Co., 4.375%, 4/16/2049, 144A | 12,288,832 | ||||||
| 18,945,000 | Syngenta Finance NV, 3.698%, 4/24/2020, 144A | 19,007,952 | ||||||
| 24,223,000 | Tennessee Valley Authority, 4.250%, 9/15/2065 | 33,472,745 | ||||||
See accompanying notes to financial statements.
25 |
Table of Contents
Portfolio of Investments – as of September 30, 2019
Loomis Sayles Core Plus Bond Fund – (continued)
| Principal Amount (‡) | Description | Value (†) | ||||||
| Government Owned – No Guarantee — continued | ||||||||
| $ | 6,160,000 | Tennessee Valley Authority, 4.625%, 9/15/2060 | $ | 8,956,090 | ||||
| 6,401,000 | Tennessee Valley Authority, 4.875%, 1/15/2048 | 9,117,270 | ||||||
| 10,957,000 | Tennessee Valley Authority, 5.250%, 9/15/2039 | 15,509,272 | ||||||
| 5,215,000 | Tennessee Valley Authority, 5.880%, 4/01/2036 | 7,564,405 | ||||||
| 10,930,000 | Transportadora de Gas Internacional S.A. E.S.P., 5.550%, 11/01/2028, 144A | 12,596,934 | ||||||
|
| |||||||
| 195,638,892 | ||||||||
|
| |||||||
| Healthcare — 0.6% | ||||||||
| 3,805,000 | CVS Health Corp., 2.625%, 8/15/2024 | 3,821,918 | ||||||
| 18,025,000 | CVS Health Corp., 5.050%, 3/25/2048 | 20,457,091 | ||||||
| 3,089,000 | PerkinElmer, Inc., 5.000%, 11/15/2021 | 3,244,132 | ||||||
| 13,364,000 | Universal Health Services, Inc., 4.750%, 8/01/2022, 144A | 13,464,230 | ||||||
|
| |||||||
| 40,987,371 | ||||||||
|
| |||||||
| Hybrid ARMs — 0.0% | ||||||||
| 31,862 | FNMA,6-month LIBOR + 1.544%, 3.881%, 2/01/2037(d) | 33,049 | ||||||
|
| |||||||
| Independent Energy — 0.6% | ||||||||
| 14,785,000 | Occidental Petroleum Corp., 2.600%, 8/13/2021 | 14,881,303 | ||||||
| 9,258,667 | Pan American Energy LLC, 7.875%, 5/07/2021, 144A | 9,212,373 | ||||||
| 985,000 | QEP Resources, Inc., 5.250%, 5/01/2023 | 913,607 | ||||||
| 10,701,000 | Range Resources Corp., 5.000%, 8/15/2022 | 10,032,187 | ||||||
| 12,316,000 | SM Energy Co., 6.125%, 11/15/2022 | 11,803,039 | ||||||
|
| |||||||
| 46,842,509 | ||||||||
|
| |||||||
| Industrial Other — 0.4% | ||||||||
| 11,005,000 | CK Hutchison International 16 Ltd., 2.750%, 10/03/2026, 144A | 11,008,632 | ||||||
| 4,020,000 | Georgetown University (The), Class A, 5.215%, 10/01/2118 | 5,625,106 | ||||||
| 3,750,000 | Georgetown University (The), Class B, 4.315%, 4/01/2049 | 4,667,737 | ||||||
| 5,920,000 | University of Pennsylvania, 3.610%, 2/15/2119 | 6,498,059 | ||||||
|
| |||||||
| 27,799,534 | ||||||||
|
| |||||||
| Life Insurance — 0.1% | ||||||||
| 9,158,000 | Northwestern Mutual Life Insurance Co. (The), 3.625%, 9/30/2059, 144A | 9,365,146 | ||||||
|
| |||||||
| Media Entertainment — 0.7% | ||||||||
| 63,720,000 | Grupo Televisa SAB, EMTN, 7.250%, 5/14/2043, (MXN) | 2,407,243 | ||||||
| 15,635,000 | Myriad International Holdings BV, 4.850%, 7/06/2027, 144A | 17,306,069 | ||||||
| 32,599,000 | Myriad International Holdings BV, 6.000%, 7/18/2020, 144A | 33,386,918 | ||||||
|
| |||||||
| 53,100,230 | ||||||||
|
| |||||||
| Metals & Mining — 0.2% | ||||||||
| 17,135,000 | Freeport-McMoRan, Inc., 3.550%, 3/01/2022 | 17,177,838 | ||||||
|
| |||||||
| Midstream — 1.1% | ||||||||
| 670,000 | Energy Transfer Operating LP, 5.150%, 2/01/2043 | 696,682 | ||||||
| 6,959,000 | Energy Transfer Operating LP, 5.950%, 10/01/2043 | 7,875,996 | ||||||
| 10,082,000 | Energy Transfer Operating LP, 6.500%, 2/01/2042 | 12,093,170 | ||||||
| 1,578,000 | Energy Transfer Operating LP, 6.625%, 10/15/2036 | 1,910,785 | ||||||
| 13,236,000 | Energy Transfer Partners LP/Regency Energy Finance Corp., 5.000%, 10/01/2022 | 14,043,285 | ||||||
See accompanying notes to financial statements.
| 26
Table of Contents
Portfolio of Investments – as of September 30, 2019
Loomis Sayles Core Plus Bond Fund – (continued)
| Principal Amount (‡) | Description | Value (†) | ||||||
| Midstream — continued | ||||||||
| $ | 2,745,000 | Energy Transfer Partners LP/Regency Energy Finance Corp., 5.875%, 3/01/2022 | $ | 2,935,817 | ||||
| 2,555,000 | Kinder Morgan Energy Partners LP, 4.150%, 2/01/2024 | 2,716,331 | ||||||
| 10,668,000 | Kinder Morgan Energy Partners LP, 4.300%, 5/01/2024 | 11,402,336 | ||||||
| 4,861,000 | Kinder Morgan, Inc., 5.000%, 2/15/2021, 144A | 5,020,964 | ||||||
| 17,979,000 | Kinder Morgan, Inc., 5.625%, 11/15/2023, 144A | 19,952,156 | ||||||
| 2,080,000 | Sunoco Logistics Partners Operations LP, 5.400%, 10/01/2047 | 2,269,503 | ||||||
|
| |||||||
| 80,917,025 | ||||||||
|
| |||||||
| Mortgage Related — 29.1% | ||||||||
| 15,410,657 | FHLMC, 3.000%, with various maturities from 2042 to 2049(e) | 15,732,842 | ||||||
| 99,477,738 | FHLMC, 3.500%, with various maturities from 2043 to 2049(e)(f) | 102,811,652 | ||||||
| 33,708,682 | FHLMC, 4.000%, with various maturities from 2044 to 2048(e) | 35,859,577 | ||||||
| 136,243,592 | FHLMC, 4.500%, with various maturities from 2041 to 2049(e) | 144,513,570 | ||||||
| 10,610 | FHLMC, 6.000%, 6/01/2035 | 12,216 | ||||||
| 139,839,490 | FNMA, 2.500%, with various maturities from 2045 to 2058(e)(f) | 139,082,560 | ||||||
| 214,385,006 | FNMA, 3.000%, with various maturities from 2045 to 2049(e) | 218,284,350 | ||||||
| 106,616,310 | FNMA, 3.500%, with various maturities from 2043 to 2049(e) | 111,028,240 | ||||||
| 216,594,678 | FNMA, 4.000%, with various maturities from 2041 to 2049(e)(f) | 226,953,448 | ||||||
| 115,163,163 | FNMA, 4.500%, with various maturities from 2043 to 2049(e)(f) | 121,920,566 | ||||||
| 155,644 | FNMA, 6.000%, with various maturities from 2034 to 2037(e) | 178,936 | ||||||
| 13,613 | FNMA, 6.500%, with various maturities from 2029 to 2031(e) | 15,166 | ||||||
| 40,463 | FNMA, 7.000%, with various maturities in 2030(e) | 44,698 | ||||||
| 21,039 | FNMA, 7.500%, with various maturities from 2024 to 2032(e) | 23,762 | ||||||
| 92,912 | GNMA, 4.042%, 1/20/2063(a) | 93,936 | ||||||
| 260,729 | GNMA, 4.129%, 6/20/2062(a) | 262,047 | ||||||
| 19,690 | GNMA, 4.205%, 8/20/2061(a) | 20,213 | ||||||
| 434,608 | GNMA, 4.248%, 12/20/2061(a) | 437,270 | ||||||
| 93,873 | GNMA, 4.257%, 5/20/2063(a) | 95,241 | ||||||
| 165,483 | GNMA, 4.324%, 8/20/2062(a) | 166,222 | ||||||
| 17,333 | GNMA, 4.331%, 5/20/2062(a) | 17,572 | ||||||
| 128,449 | GNMA, 4.334%, 7/20/2063(a) | 130,949 | ||||||
| 589,787 | GNMA,1-month LIBOR + 1.938%, 4.336%, 9/20/2063(d) | 614,283 | ||||||
| 1,081,129 | GNMA, 4.356%, 10/20/2062(a) | 1,085,494 | ||||||
| 10,317,421 | GNMA, 4.371%, 12/20/2066(a) | 11,369,774 | ||||||
| 352,157 | GNMA, 4.393%, 6/20/2062(a) | 353,773 | ||||||
| 294,140 | GNMA, 4.395%, 12/20/2062(a) | 296,476 | ||||||
| 202,323 | GNMA, 4.414%, 4/20/2062(a) | 209,961 | ||||||
| 309,207 | GNMA, 4.418%, 11/20/2062(a) | 311,409 | ||||||
| 5,744,950 | GNMA, 4.427%, 11/20/2066(a) | 6,271,633 | ||||||
| 2,836,320 | GNMA, 4.431%, 10/20/2066(a) | 3,116,717 | ||||||
| 408,677 | GNMA, 4.436%, 7/20/2063(a) | 416,163 | ||||||
| 3,910,212 | GNMA, 4.442%, 2/20/2066(a) | 4,269,651 | ||||||
| 4,327,116 | GNMA, 4.489%, 11/20/2062(a) | 4,356,744 | ||||||
| 4,685,877 | GNMA, 4.498%, 6/20/2066(a) | 5,148,548 | ||||||
| 2,407,161 | GNMA, 4.519%, 2/20/2066(a) | 2,632,133 | ||||||
| 336,820 | GNMA, 4.520%, 5/20/2063(a) | 342,444 | ||||||
See accompanying notes to financial statements.
27 |
Table of Contents
Portfolio of Investments – as of September 30, 2019
Loomis Sayles Core Plus Bond Fund – (continued)
| Principal Amount (‡) | Description | Value (†) | ||||||
| Mortgage Related — continued | ||||||||
| $ | 8,306,578 | GNMA, 4.526%, with various maturities from 2064 to 2066(a)(e) | $ | 9,017,667 | ||||
| 3,204,873 | GNMA, 4.529%, 9/20/2066(a) | 3,537,691 | ||||||
| 3,976,286 | GNMA, 4.532%, 12/20/2063(a) | 4,246,519 | ||||||
| 11,053,493 | GNMA, 4.541%, 12/20/2066(a) | 12,240,501 | ||||||
| 3,753,616 | GNMA, 4.545%, 6/20/2066(a) | 4,137,181 | ||||||
| 4,635,131 | GNMA, 4.547%, 2/20/2065(a) | 4,982,101 | ||||||
| 3,920,402 | GNMA, 4.556%, 6/20/2064(a) | 4,230,093 | ||||||
| 2,804,222 | GNMA, 4.565%, with various maturities from 2062 to 2066(a)(e) | 3,037,445 | ||||||
| 584,889 | GNMA, 4.570%, 10/20/2062(a) | 588,667 | ||||||
| 6,282,371 | GNMA, 4.577%, 10/20/2064(a) | 6,749,353 | ||||||
| 6,556,525 | GNMA, 4.596%, 2/20/2065(a) | 7,099,038 | ||||||
| 2,409,452 | GNMA, 4.600%, 1/20/2065(a) | 2,600,248 | ||||||
| 7,057,401 | GNMA, 4.604%, 12/20/2064(a) | 7,603,663 | ||||||
| 4,252,345 | GNMA, 4.611%, 1/20/2065(a) | 4,631,128 | ||||||
| 763,357 | GNMA, 4.637%, 1/20/2064(a) | 814,141 | ||||||
| 2,807,609 | GNMA, 4.638%, 3/20/2065(a) | 3,009,637 | ||||||
| 4,834,790 | GNMA, 4.640%, 3/20/2066(a) | 5,329,930 | ||||||
| 318,989 | GNMA, 4.650%, 1/20/2061(a) | 323,568 | ||||||
| 3,084,445 | GNMA, 4.669%, 1/20/2064(a) | 3,273,555 | ||||||
| 5,514,047 | GNMA, 4.674%, 6/20/2064(a) | 5,959,896 | ||||||
| 470 | GNMA, 4.700%, with various maturities in 2061(a)(e) | 470 | ||||||
| 3,788,356 | GNMA, 4.710%, 1/20/2064(a) | 4,078,241 | ||||||
| 2,270 | GNMA, 5.074%, 3/20/2062(a) | 2,328 | ||||||
| 242,936 | GNMA, 5.500%, 4/15/2038 | 271,962 | ||||||
| 43,958 | GNMA, 6.000%, with various maturities from 2029 to 2038(e) | 49,959 | ||||||
| 39,207 | GNMA, 6.500%, with various maturities from 2029 to 2032(e) | 43,390 | ||||||
| 58,841 | GNMA, 7.000%, with various maturities from 2025 to 2029(e) | 60,560 | ||||||
| 7,346 | GNMA, 7.500%, with various maturities from 2025 to 2030(e) | 8,016 | ||||||
| 319 | GNMA, 8.500%, 10/15/2022 | 320 | ||||||
| 352,631,000 | GNMA (TBA), 3.500%, 10/01/2049(g) | 365,310,563 | ||||||
| 112,415,000 | GNMA (TBA), 4.000%, 10/01/2049(g) | 116,905,014 | ||||||
| 34,097,000 | UMBS® (TBA), 2.500%, 11/01/2049(g) | 33,906,856 | ||||||
| 225,990,000 | UMBS® (TBA), 3.000%, 11/01/2049(g) | 229,238,606 | ||||||
| 168,861,000 | UMBS® (TBA), 4.500%, with various maturities in 2049(e)(g) | 177,828,671 | ||||||
|
| |||||||
| 2,179,597,214 | ||||||||
|
| |||||||
| Natural Gas — 0.0% | ||||||||
| 3,185,000 | Boston Gas Co., 3.001%, 8/01/2029, 144A | 3,280,579 | ||||||
|
| |||||||
| Non-Agency Commercial Mortgage-Backed Securities — 0.5% | ||||||||
| 1,025,000 | Commercial Mortgage Trust, Series2010-C1, Class D, 6.304%, 7/10/2046, 144A(a) | 1,046,580 | ||||||
| 3,052,113 | DBUBS Mortgage Trust, Series 2011-LC1A, Class E, 5.885%, 11/10/2046, 144A(a) | 3,162,003 | ||||||
| 6,637,000 | GS Mortgage Securities Trust, Series2011-GC5, Class C, 5.556%, 8/10/2044, 144A(a) | 6,881,410 | ||||||
| 8,150,000 | UBS-Barclays Commercial Mortgage Trust, Series2013-C5, Class A4, 3.185%, 3/10/2046 | 8,378,511 | ||||||
See accompanying notes to financial statements.
| 28
Table of Contents
Portfolio of Investments – as of September 30, 2019
Loomis Sayles Core Plus Bond Fund – (continued)
| Principal Amount (‡) | Description | Value (†) | ||||||
| Non-Agency Commercial Mortgage-Backed Securities — continued | ||||||||
| $ | 9,412,653 | Wells Fargo Commercial Mortgage Trust, Series2010-C1, Class D, 5.783%, 11/15/2043, 144A(a) | $ | 9,586,865 | ||||
| 5,876,392 | WFRBS Commercial Mortgage Trust, Series2011-C4, Class D, 5.397%, 6/15/2044, 144A(a) | 6,003,058 | ||||||
|
| |||||||
| 35,058,427 | ||||||||
|
| |||||||
| Oil Field Services — 0.9% | ||||||||
| 2,447,000 | Nabors Industries, Inc., 4.625%, 9/15/2021 | 2,312,415 | ||||||
| 796,000 | Nabors Industries, Inc., 5.000%, 9/15/2020 | 778,998 | ||||||
| 23,633,000 | Nabors Industries, Inc., 5.100%, 9/15/2023 | 18,360,005 | ||||||
| 29,916,000 | Thaioil Treasury Center Co. Ltd., 4.875%, 1/23/2043, 144A | 36,224,088 | ||||||
| 8,770,950 | Transocean Guardian Ltd., 5.875%, 1/15/2024, 144A | 8,792,877 | ||||||
| 7,342,000 | Valaris PLC, 5.750%, 10/01/2044 | 3,120,350 | ||||||
|
| |||||||
| 69,588,733 | ||||||||
|
| |||||||
| Paper — 0.3% | ||||||||
| 5,797,000 | Celulosa Arauco y Constitucion S.A., 4.500%, 8/01/2024 | 6,108,647 | ||||||
| 10,350,000 | Klabin Austria GmbH, 7.000%, 4/03/2049, 144A | 11,020,680 | ||||||
| 1,989,000 | WestRock RKT LLC, 4.900%, 3/01/2022 | 2,104,235 | ||||||
|
| |||||||
| 19,233,562 | ||||||||
|
| |||||||
| Pharmaceuticals — 0.1% | ||||||||
| 6,293,000 | Biogen, Inc., 2.900%, 9/15/2020 | 6,338,383 | ||||||
|
| |||||||
| Property & Casualty Insurance — 0.2% | ||||||||
| 13,365,000 | Ardonagh Midco 3 PLC, 8.625%, 7/15/2023, 144A | 12,897,225 | ||||||
| 3,171,000 | Willis Towers Watson PLC, 5.750%, 3/15/2021 | 3,324,110 | ||||||
|
| |||||||
| 16,221,335 | ||||||||
|
| |||||||
| Railroads — 0.3% | ||||||||
| 22,355,000 | Burlington Northern Santa Fe LLC, 3.550%, 2/15/2050 | 23,682,112 | ||||||
|
| |||||||
| Refining — 0.1% | ||||||||
| 8,665,000 | Ultrapar International S.A., 5.250%, 10/06/2026, 144A | 9,152,493 | ||||||
|
| |||||||
| REITs – Diversified — 0.2% | ||||||||
| 15,445,000 | iStar, Inc., 6.500%, 7/01/2021 | 15,707,565 | ||||||
|
| |||||||
| Retailers — 0.6% | ||||||||
| 27,630,000 | El Puerto de Liverpool SAB de CV, 3.875%, 10/06/2026, 144A | 27,975,651 | ||||||
| 9,929,000 | SACI Falabella, 3.750%, 4/30/2023, 144A | 10,201,591 | ||||||
| 7,559,000 | SACI Falabella, 4.375%, 1/27/2025, 144A | 8,002,573 | ||||||
|
| |||||||
| 46,179,815 | ||||||||
|
| |||||||
| Sovereigns — 1.1% | ||||||||
| 32,145,000 | Kingdom of Saudi Arabia, 3.250%, 10/26/2026, 144A | 33,187,912 | ||||||
| 20,805,000 | Republic of Argentina, 7.500%, 4/22/2026 | 9,050,383 | ||||||
| 19,040,000 | Republic of Argentina, 7.625%, 4/22/2046(h)(i) | 8,254,031 | ||||||
| 8,015,000 | Republic of Indonesia, 3.700%, 1/08/2022, 144A | 8,236,455 | ||||||
| 11,125,000 | Republic of Oman, 3.875%, 3/08/2022, 144A | 11,076,161 | ||||||
| 11,830,000 | State of Qatar, 3.875%, 4/23/2023, 144A | 12,510,225 | ||||||
|
| |||||||
| 82,315,167 | ||||||||
|
| |||||||
See accompanying notes to financial statements.
29 |
Table of Contents
Portfolio of Investments – as of September 30, 2019
Loomis Sayles Core Plus Bond Fund – (continued)
| Principal Amount (‡) | Description | Value (†) | ||||||
| Technology — 1.6% | ||||||||
| $ | 18,770,000 | Apple, Inc., 2.050%, 9/11/2026 | $ | 18,555,285 | ||||
| 18,765,000 | Apple, Inc., 2.200%, 9/11/2029 | 18,437,561 | ||||||
| 3,000,000 | Equifax, Inc., 3.300%, 12/15/2022 | 3,079,702 | ||||||
| 5,101,000 | Equifax, Inc., 7.000%, 7/01/2037 | 6,586,206 | ||||||
| 15,427,000 | Hewlett Packard Enterprise Co., 3.600%, 10/15/2020 | 15,625,662 | ||||||
| 17,176,000 | Hewlett Packard Enterprise Co., 6.200%, 10/15/2035 | 20,378,001 | ||||||
| 3,601,000 | KLA Corp., 3.375%, 11/01/2019 | 3,602,236 | ||||||
| 7,515,000 | Microchip Technologies, Inc., 4.333%, 6/01/2023 | 7,892,077 | ||||||
| 10,996,000 | Molex Electronic Technologies LLC, 2.878%, 4/15/2020, 144A | 11,013,745 | ||||||
| 7,255,000 | Molex Electronic Technologies LLC, 3.900%, 4/15/2025, 144A | 7,572,500 | ||||||
| 6,140,000 | Texas Instruments, Inc., 2.250%, 9/04/2029 | 6,044,729 | ||||||
|
| |||||||
| 118,787,704 | ||||||||
|
| |||||||
| Tobacco — 0.6% | ||||||||
| 8,705,000 | Altria Group, Inc., 4.400%, 2/14/2026 | 9,308,680 | ||||||
| 37,450,000 | BAT Capital Corp., 2.789%, 9/06/2024 | 37,125,981 | ||||||
|
| |||||||
| 46,434,661 | ||||||||
|
| |||||||
| Transportation Services — 0.2% | ||||||||
| 10,960,000 | Ryder System, Inc., MTN, 2.500%, 9/01/2024 | 10,999,463 | ||||||
|
| |||||||
| Treasuries — 26.4% | ||||||||
| 10,976,000(††) | Mexican Fixed Rate Bonds, Series M, 5.750%, 3/05/2026, (MXN) | 52,642,418 | ||||||
| 9,241,400(††) | Mexican Fixed Rate Bonds, Series M, 6.500%, 6/10/2021, (MXN) | 46,668,274 | ||||||
| 496,730,000 | Republic of Uruguay, 8.500%, 3/15/2028, 144A, (UYU) | 11,581,765 | ||||||
| 294,989,000 | Republic of Uruguay, 9.875%, 6/20/2022, 144A, (UYU) | 7,881,538 | ||||||
| 25,220,000 | U.S. Treasury Bond, 2.250%, 8/15/2049 | 25,938,179 | ||||||
| 35,510,000 | U.S. Treasury Bond, 3.000%, 2/15/2049(f) | 42,338,740 | ||||||
| 48,350,000 | U.S. Treasury Bond, 3.125%, 5/15/2048(f) | 58,767,914 | ||||||
| 63,015,000 | U.S. Treasury Bond, 3.375%, 11/15/2048(f) | 80,292,433 | ||||||
| 62,807,169 | U.S. Treasury Inflation Indexed Bond, 0.750%, 2/15/2045(f)(j) | 65,557,543 | ||||||
| 122,505,947 | U.S. Treasury Inflation Indexed Bond, 0.875%, 2/15/2047(f)(j) | 132,124,427 | ||||||
| 142,828,191 | U.S. Treasury Inflation Indexed Bond, 1.000%, 2/15/2046(f)(j) | 158,073,773 | ||||||
| 34,104,282 | U.S. Treasury Inflation Indexed Bond, 1.000%, 2/15/2049(f)(j) | 38,271,542 | ||||||
| 61,656,727 | U.S. Treasury Inflation Indexed Note, 0.125%, 7/15/2024(f)(j) | 61,579,403 | ||||||
| 55,161,266 | U.S. Treasury Inflation Indexed Note, 0.250%, 1/15/2025(f)(j) | 55,271,997 | ||||||
| 68,884,422 | U.S. Treasury Inflation Indexed Note, 0.625%, 1/15/2024(f)(j) | 69,923,889 | ||||||
| 100,805,000 | U.S. Treasury Note, 1.500%, 9/30/2024 | 100,552,987 | ||||||
| 59,270,000 | U.S. Treasury Note, 1.625%, 9/30/2026 | 59,283,892 | ||||||
| 2,255,000 | U.S. Treasury Note, 1.625%, 8/15/2029 | 2,244,606 | ||||||
| 23,395,000 | U.S. Treasury Note, 1.750%, 6/30/2024 | 23,593,309 | ||||||
| 29,230,000 | U.S. Treasury Note, 2.375%, 5/15/2029 | 31,040,890 | ||||||
| 37,405,000 | U.S. Treasury Note, 2.625%, 2/15/2029(f) | 40,483,607 | ||||||
| 53,565,000 | U.S. Treasury Note, 2.875%, 8/15/2028(f) | 58,896,391 | ||||||
| 669,637,000 | U.S. Treasury Note, 3.125%, 11/15/2028 | 751,772,163 | ||||||
|
| |||||||
| 1,974,781,680 | ||||||||
|
| |||||||
See accompanying notes to financial statements.
| 30
Table of Contents
Portfolio of Investments – as of September 30, 2019
Loomis Sayles Core Plus Bond Fund – (continued)
| Principal Amount (‡) | Description | Value (†) | ||||||
| Utility Other — 0.4% | ||||||||
| $ | 25,420,000 | Acwa Power Management And Investments One Ltd., 5.950%, 12/15/2039, 144A | $ | 27,568,498 | ||||
|
| |||||||
| Wireless — 0.4% | ||||||||
| 1,424,000 | American Tower Corp., 4.700%, 3/15/2022 | 1,508,580 | ||||||
| 20,973,000 | Bharti Airtel Ltd., 4.375%, 6/10/2025, 144A | 21,668,367 | ||||||
| 3,960,000 | Millicom International Cellular S.A., 6.625%, 10/15/2026, 144A | 4,306,500 | ||||||
|
| |||||||
| 27,483,447 | ||||||||
|
| |||||||
| Wirelines — 1.0% | ||||||||
| 720,000 | AT&T, Inc., 4.350%, 6/15/2045 | 756,616 | ||||||
| 6,549,000 | AT&T, Inc., 4.500%, 3/09/2048 | 7,044,309 | ||||||
| 1,615,000 | AT&T, Inc., 4.750%, 5/15/2046 | 1,790,981 | ||||||
| 7,715,000 | AT&T, Inc., 5.250%, 3/01/2037 | 9,079,895 | ||||||
| 10,790,000 | AT&T, Inc., 5.450%, 3/01/2047 | 13,053,124 | ||||||
| 11,187,000 | Colombia Telecomunicaciones S.A. E.S.P., 5.375%, 9/27/2022, 144A | 11,298,870 | ||||||
| 3,890,000 | Telefonica Emisiones S.A., 5.134%, 4/27/2020 | 3,952,235 | ||||||
| 23,277,000 | Telefonica Emisiones S.A., 5.462%, 2/16/2021 | 24,298,478 | ||||||
|
| |||||||
| 71,274,508 | ||||||||
|
| |||||||
| TotalNon-Convertible Bonds (Identified Cost $6,791,901,443) | 6,964,420,197 | |||||||
|
| |||||||
| Municipals — 0.2% | ||||||||
| Local Authorities — 0.2% | ||||||||
| 17,415,000 | University of Virginia, Revenue Bond, Series A, 3.227%, 9/01/2119 | 17,132,006 | ||||||
|
| |||||||
| Total Municipals (Identified Cost $17,415,000) | 17,132,006 | |||||||
|
| |||||||
| Total Bonds and Notes (Identified Cost $6,809,316,443) | 6,981,552,203 | |||||||
|
| |||||||
| Senior Loans — 2.9% | ||||||||
| Automotive — 0.2% | ||||||||
| 8,897,359 | Dayco Products LLC, 2017 Term Loan B,3-month LIBOR + 4.250%, 6.374%, 5/19/2023(d) | 7,963,137 | ||||||
| 2,780,000 | KAR Auction Services, Inc., 2019 Term Loan B6,1-month LIBOR + 2.250%, 4.313%, 9/19/2026(d) | 2,790,425 | ||||||
| 1,487,781 | Visteon Corp., 2018 Term Loan B, LIBOR + 1.750%, 3.805%, 3/25/2024(k) | 1,458,025 | ||||||
|
| |||||||
| 12,211,587 | ||||||||
|
| |||||||
| Chemicals — 0.1% | ||||||||
| 4,155,200 | Venator Materials Corp., Term Loan B,1-month LIBOR + 3.000%, 5.044%, 8/08/2024(d) | 4,061,708 | ||||||
|
| |||||||
| Consumer Cyclical Services — 0.0% | ||||||||
| 1,376,493 | FrontDoor, Inc., 2018 Term Loan B,1-month LIBOR + 2.500%, 4.563%, 8/16/2025(d) | 1,382,522 | ||||||
|
| |||||||
See accompanying notes to financial statements.
31 |
Table of Contents
Portfolio of Investments – as of September 30, 2019
Loomis Sayles Core Plus Bond Fund – (continued)
| Principal Amount (‡) | Description | Value (†) | ||||||
| Consumer Products — 0.3% | ||||||||
| $ | 11,276,222 | Coty, Inc., 2018 USD Term Loan B,1-month LIBOR + 2.250%, 4.292%, 4/07/2025(d) | $ | 10,904,106 | ||||
| 2,073,075 | Energizer Holdings, Inc., 2018 Term Loan B,1-month LIBOR + 2.250%, 4.375%, 12/17/2025(d) | 2,071,790 | ||||||
| 1,235,234 | Resideo Funding, Inc., Term Loan B,3-month LIBOR + 2.000%, 4.110%, 10/24/2025(d) | 1,233,690 | ||||||
| 11,532,324 | Serta Simmons Bedding LLC, 1st Lien Term Loan,1-month LIBOR + 3.500%, 5.543%, 11/08/2023(l) | 7,054,899 | ||||||
|
| |||||||
| 21,264,485 | ||||||||
|
| |||||||
| Electric — 0.0% | ||||||||
| 585,459 | AES Corp., 2018 Term Loan B,3-month LIBOR + 1.750%, 3.874%, 5/31/2022(d) | 585,336 | ||||||
|
| |||||||
| Food & Beverage — 0.1% | ||||||||
| 9,006,117 | Post Holdings, Inc., 2017 Series A Incremental Term Loan,1-month LIBOR + 2.000%, 4.040%, 5/24/2024(d) | 9,026,381 | ||||||
|
| |||||||
| Gaming — 0.1% | ||||||||
| 4,453,673 | Churchill Downs, Inc., 2017 Term Loan B,1-month LIBOR + 2.000%, 4.050%, 12/27/2024(d) | 4,464,807 | ||||||
|
| |||||||
| Industrial Other — 0.0% | ||||||||
| 3,130,075 | Altra Industrial Motion Corp., 2018 Term Loan B,1-month LIBOR + 2.000%, 4.044%, 10/01/2025(d) | 3,122,249 | ||||||
|
| |||||||
| Leisure — 0.1% | ||||||||
| 9,830,600 | AMC Entertainment Holdings, Inc., 2019 Term Loan B,6-month LIBOR + 3.000%, 5.230%, 4/22/2026(d) | 9,863,336 | ||||||
|
| |||||||
| Media Entertainment — 0.5% | ||||||||
| 4,994,929 | Entercom Media Corp., 2017 Term Loan B,1-month LIBOR + 2.750%, 4.804%, 11/18/2024(d) | 4,996,177 | ||||||
| 3,477,208 | Lamar Media Corp., 2018 Term Loan B,1-month LIBOR + 1.750%, 3.813%, 3/14/2025(d) | 3,488,092 | ||||||
| 3,287,231 | Meredith Corp., 2018 Term Loan B,1-month LIBOR + 2.750%, 4.794%, 1/31/2025(d) | 3,289,696 | ||||||
| 18,300,000 | Nielsen Finance LLC, USD Term Loan B4,1-month LIBOR + 2.000%, 4.042%, 10/04/2023(d) | 18,286,275 | ||||||
| 6,050,000 | Sinclair Television Group, Inc., Term Loan B2B,1-month LIBOR + 2.500%, 4.540%, 9/30/2026(d) | 6,067,666 | ||||||
|
| |||||||
| 36,127,906 | ||||||||
|
| |||||||
| Packaging — 0.1% | ||||||||
| 574,195 | Crown Americas LLC, 2018 Term Loan B,1-month LIBOR + 2.000%, 4.057%, 4/03/2025(d) | 575,940 | ||||||
| 2,709,700 | Plastipak Packaging, Inc., 2018 Term Loan B,1-month LIBOR + 2.500%, 4.550%, 10/14/2024(d) | 2,671,087 | ||||||
|
| |||||||
| 3,247,027 | ||||||||
|
| |||||||
See accompanying notes to financial statements.
| 32
Table of Contents
Portfolio of Investments – as of September 30, 2019
Loomis Sayles Core Plus Bond Fund – (continued)
| Principal Amount (‡) | Description | Value (†) | ||||||
| Pharmaceuticals — 0.3% | ||||||||
| $ | 5,656,485 | Bausch Health Cos., Inc., Term Loan B,1-month LIBOR + 2.750%, 4.789%, 11/27/2025(d) | $ | 5,664,970 | ||||
| 7,512,791 | Change Healthcare Holdings LLC, 2017 Term Loan B,1-month LIBOR + 2.500%, 4.544%, 3/01/2024(d) | 7,473,349 | ||||||
| 9,750,000 | Grifols Worldwide Operations USA, Inc., 2017 Acquisition Term Loan,1-week LIBOR + 2.250%, 4.197%, 1/31/2025(d) | 9,796,897 | ||||||
|
| |||||||
| 22,935,216 | ||||||||
|
| |||||||
| Property & Casualty Insurance — 0.0% | ||||||||
| 2,714,600 | USI, Inc., 2017 Repriced Term Loan,3-month LIBOR + 3.000%, 5.104%, 5/16/2024(d) | 2,667,665 | ||||||
|
| |||||||
| Restaurants — 0.2% | ||||||||
| 17,522,733 | 1011778 B.C. Unlimited Liability Co., Term Loan B3,1-month LIBOR + 2.250%, 4.294%, 2/16/2024(d) | 17,575,301 | ||||||
|
| |||||||
| Retailers — 0.2% | ||||||||
| 2,972,063 | Hanesbrands, Inc., 2017 Term Loan B,1-month LIBOR + 1.750%, 3.794%, 12/13/2024(d) | 2,990,638 | ||||||
| 14,309,595 | Michaels Stores, Inc., 2018 Term Loan B,1-month LIBOR + 2.500%, 4.544%, 1/30/2023(l) | 13,959,010 | ||||||
|
| |||||||
| 16,949,648 | ||||||||
|
| |||||||
| Technology — 0.3% | ||||||||
| 9,980,385 | Iron Mountain, Inc., 2018 Term Loan B,1-month LIBOR + 1.750%, 3.794%, 1/02/2026(d) | 9,880,582 | ||||||
| 1,964,853 | Sabre GLBL, Inc., 2018 Term Loan B,1-month LIBOR + 2.000%, 4.044%, 2/22/2024(d) | 1,971,769 | ||||||
| 9,740,202 | SS&C Technologies Inc., 2018 Term Loan B5,1-month LIBOR + 2.250%, 4.294%, 4/16/2025(d) | 9,774,682 | ||||||
|
| |||||||
| 21,627,033 | ||||||||
|
| |||||||
| Transportation Services — 0.1% | ||||||||
| 9,764,501 | Uber Technologies, Inc., 2018 Incremental Term Loan,1-month LIBOR + 3.500%, 5.554%, 7/13/2023(d) | 9,681,112 | ||||||
|
| |||||||
| Wirelines — 0.3% | ||||||||
| 18,214,063 | Level 3 Financing, Inc., 2017 Term Loan B,1-month LIBOR + 2.250%, 4.294%, 2/22/2024(d) | 18,240,655 | ||||||
|
| |||||||
| Total Senior Loans (Identified Cost $220,703,669) | 215,033,974 | |||||||
|
| |||||||
| Shares | ||||||||
| Preferred Stocks — 0.2% | ||||||||
| Cable Satellite — 0.2% | ||||||||
| 17,563,000 | NBCUniversal Enterprise, Inc., 5.250%, 144A (Identified Cost $18,210,290) | 18,089,890 | ||||||
|
| |||||||
See accompanying notes to financial statements.
33 |
Table of Contents
Portfolio of Investments – as of September 30, 2019
Loomis Sayles Core Plus Bond Fund – (continued)
| Shares | Description | Value (†) | ||||||
| Common Stocks — 0.0% | ||||||||
| Oil, Gas & Consumable Fuels — 0.0% | ||||||||
| 77,870 | Paragon Offshore Ltd., Litigation Units, Class A(b)(c)(h)(m)(n) | $ | 779 | |||||
| 116,806 | Paragon Offshore Ltd., Litigation Units, Class B(m)(n) | 1,752,090 | ||||||
|
| |||||||
| Total Common Stocks (Identified Cost $9,028,818) | 1,752,869 | |||||||
|
| |||||||
| Principal Amount (‡) | ||||||||
| Short-Term Investments — 15.9% | ||||||||
| $ | 67,510,000 | Federal Home Loan Bank Discount Notes, 1.600%, 10/04/2019(o) | 67,499,423 | |||||
| 149,892,261 | Tri-Party Repurchase Agreement with Fixed Income Clearing Corporation, dated 9/30/2019 at 1.100% to be repurchased at $149,896,841 on 10/01/2019 collateralized by $136,155,000 U.S. Treasury Note, 2.125% due 5/15/2025 valued at $141,121,526; $11,575,000 U.S. Treasury Note, 2.250% due 4/30/2021 valued at $11,777,400 including accrued interest (Note 2 of Notes to Financial Statements) | 149,892,261 | ||||||
| 120,025,000 | U.S. Treasury Bills,1.580%-1.772%, 10/03/2019(o)(p) | 120,014,081 | ||||||
| 20,975,000 | U.S. Treasury Bills, 1.888%, 11/29/2019(o) | 20,912,694 | ||||||
| 263,675,000 | U.S. Treasury Bills,1.905%-2.030%, 10/01/2019(o)(p) | 263,675,000 | ||||||
| 134,630,000 | U.S. Treasury Bills,1.922%-1.936%, 11/21/2019(o)(p) | 134,287,838 | ||||||
| 183,985,000 | U.S. Treasury Bills,1.970%-2.048%, 10/24/2019(o)(p) | 183,774,299 | ||||||
| 250,000,000 | U.S. Treasury Bills,1.972%-1.980%, 10/31/2019(o)(p) | 249,632,813 | ||||||
|
| |||||||
| Total Short-Term Investments (Identified Cost $1,189,588,857) | 1,189,688,409 | |||||||
|
| |||||||
| Total Investments — 112.2% (Identified Cost $8,246,848,077) | 8,406,117,345 | |||||||
| Other assets less liabilities — (12.2)% | (913,141,411 | ) | ||||||
|
| |||||||
| Net Assets — 100.0% | $ | 7,492,975,934 | ||||||
|
| |||||||
| (‡) | Principal Amount stated in U.S. dollars unless otherwise noted. |
| ||||||
| (†) | See Note 2 of Notes to Financial Statements. |
| ||||||
| (††) | Amount shown represents units. One unit represents a principal amount of 100. |
| ||||||
| (a) | Variable rate security. The interest rate adjusts periodically based on; (i) changes in current interest rates and/or prepayments on underlying pools of assets, if applicable, (ii) reference to a base lending rate plus or minus a margin, and/or (iii) reference to a base lending rate adjusted by a multiplier and/or subject to certain floors or caps. Rate as of September 30, 2019 is disclosed. |
| ||||||
| (b) | Fair valued by the Fund’s adviser. At September 30, 2019, the value of these securities amounted to $42,068 or less than 0.1% of net assets. See Note 2 of Notes to Financial Statements. |
| ||||||
| (c) | Level 3 security. Value has been determined using significant unobservable inputs. See Note 3 of Notes to Financial Statements. |
| ||||||
| (d) | Variable rate security. Rate as of September 30, 2019 is disclosed. |
| ||||||
See accompanying notes to financial statements.
| 34
Table of Contents
Portfolio of Investments – as of September 30, 2019
Loomis Sayles Core Plus Bond Fund – (continued)
| (e) | The Fund’s investment in mortgage related securities of Federal Home Loan Mortgage Corporation, Federal National Mortgage Association and Government National Mortgage Association are interests in separate pools of mortgages. All separate investments in securities of each issuer which have the same coupon rate have been aggregated for the purpose of presentation in the Portfolio of Investments. |
| ||||||
| (f) | Security (or a portion thereof) has been designated to cover the Fund’s obligations under open TBA transactions. |
| ||||||
| (g) | When-issued/delayed delivery. See Note 2 of Notes to Financial Statements. |
| ||||||
| (h) | Illiquid security. (Unaudited) |
| ||||||
| (i) | Security classified as fair valued pursuant to the Fund’s pricing policies and procedures. At September 30, 2019, the value of this security amounted to $8,254,031 or 0.1% of net assets. See Note 2 of Notes to Financial Statements. |
| ||||||
| (j) | Treasury Inflation Protected Security (TIPS). |
| ||||||
| (k) | Variable rate security. Rate shown represents the weighted average rate of underlying contracts at September 30, 2019. Interest rates on contracts are primarily redetermined either weekly, monthly or quarterly by reference to the indicated base lending rate and spread and the reset period. |
| ||||||
| (l) | Variable rate security. Rate shown represents the weighted average rate of underlying contracts at September 30, 2019. |
| ||||||
| (m) | Securities subject to restriction on resale. At September 30, 2019, the restricted securities held by the Fund are as follows: |
| ||||||
| Acquisition Date | Acquisition Cost | Value | % of Net Assets | |||||||||||||
| Paragon Offshore Ltd., Litigation Units, Class A | 7/18/2017 | $ | 429,948 | $ | 779 | Less than 0.1% | ||||||||||
| Paragon Offshore Ltd., Litigation Units, Class B | 7/18/2017 | 8,598,870 | 1,752,090 | Less than 0.1% | ||||||||||||
| (n) | Non-income producing security. |
| ||||||
| (o) | Interest rate represents discount rate at time of purchase; not a coupon rate. |
| ||||||
| (p) | The Fund’s investment in U.S. Government/Agency securities is comprised of various lots with differing discount rates. These separate investments, which have the same maturity date, have been aggregated for the purpose of presentation in the Portfolio of Investments. |
| ||||||
| 144A | All or a portion of these securities are exempt from registration under Rule 144A of the Securities Act of 1933. These securities may be resold in transactions exempt from registration, normally to qualified institutional buyers. At September 30, 2019, the value of Rule 144A holdings amounted to $1,066,625,554 or 14.2% of net assets. |
| ||||||
| ABS | Asset-Backed Securities |
| ||||||
| ARMs | Adjustable Rate Mortgages |
| ||||||
| EMTN | Euro Medium Term Note |
| ||||||
| FHLMC | Federal Home Loan Mortgage Corp. |
| ||||||
| FNMA | Federal National Mortgage Association |
| ||||||
| GMTN | Global Medium Term Note |
| ||||||
| GNMA | Government National Mortgage Association |
| ||||||
| LIBOR | London Interbank Offered Rate |
| ||||||
| MTN | Medium Term Note |
| ||||||
| REITs | Real Estate Investment Trusts |
| ||||||
| SOFR | Secured Overnight Financing Rate |
| ||||||
| TBA | To Be Announced |
| ||||||
| UMBS® | Uniform Mortgage-Backed Securities |
| ||||||
| MXN | Mexican Peso |
| ||||||
| UYU | Uruguayan Peso |
| ||||||
See accompanying notes to financial statements.
35 |
Table of Contents
Portfolio of Investments – as of September 30, 2019
Loomis Sayles Core Plus Bond Fund – (continued)
Industry Summary at September 30, 2019
Mortgage Related | 29.1 | % | ||
Treasuries | 26.4 | |||
Banking | 8.4 | |||
Agency Commercial Mortgage-Backed Securities | 2.9 | |||
Government Owned - No Guarantee | 2.6 | |||
Other Investments, less than 2% each | 26.9 | |||
Short-Term Investments | 15.9 | |||
|
| |||
Total Investments | 112.2 | |||
Other assets less liabilities | (12.2 | ) | ||
|
| |||
Net Assets | 100.0 | % | ||
|
|
See accompanying notes to financial statements.
| 36
Table of Contents
Portfolio of Investments – as of September 30, 2019
Loomis Sayles Global Allocation Fund
| Shares | Description | Value (†) | ||||||
| Common Stocks — 67.5% of Net Assets | ||||||||
| Canada — 1.9% | ||||||||
| 734,800 | CGI, Inc.(a) | $ | 58,102,916 | |||||
|
| |||||||
| China — 2.4% | ||||||||
| 447,299 | Alibaba Group Holding Ltd., Sponsored ADR(a) | 74,801,812 | ||||||
�� |
| |||||||
| France — 2.5% | ||||||||
| 239,796 | Dassault Systemes SE | 34,160,446 | ||||||
| 385,855 | Thales S.A. | 44,354,377 | ||||||
|
| |||||||
| 78,514,823 | ||||||||
|
| |||||||
| Hong Kong — 2.1% | ||||||||
| 6,881,800 | AIA Group Ltd. | 64,902,539 | ||||||
|
| |||||||
| India — 1.2% | ||||||||
| 2,092,142 | HDFC Bank Ltd. | 36,255,791 | ||||||
|
| |||||||
| Japan — 1.7% | ||||||||
| 2,596,061 | Nomura Research Institute Ltd. | 51,874,360 | ||||||
|
| |||||||
| Sweden — 1.4% | ||||||||
| 1,375,103 | Atlas Copco AB, Class A | 42,343,717 | ||||||
|
| |||||||
| Switzerland — 4.1% | ||||||||
| 709,287 | Nestle S.A., (Registered) | 76,925,334 | ||||||
| 289,213 | Temenos AG, (Registered) | 48,428,700 | ||||||
|
| |||||||
| 125,354,034 | ||||||||
|
| |||||||
| United Kingdom — 5.6% | ||||||||
| 1,726,688 | Halma PLC | 41,795,195 | ||||||
| 7,594,810 | Legal & General Group PLC | 23,181,780 | ||||||
| 259,960 | Linde PLC | 50,359,451 | ||||||
| 649,054 | London Stock Exchange Group PLC | 58,284,840 | ||||||
|
| |||||||
| 173,621,266 | ||||||||
|
| |||||||
| United States — 44.6% | ||||||||
| 315,477 | Accenture PLC, Class A | 60,682,001 | ||||||
| 6,478 | Alphabet, Inc., Class C(a) | 7,896,682 | ||||||
| 51,316 | Alphabet, Inc., Class A(a) | 62,664,020 | ||||||
| 42,149 | Amazon.com, Inc.(a) | 73,166,871 | ||||||
| 10,456 | Booking Holdings, Inc.(a) | 20,521,050 | ||||||
| 1,155,972 | CBRE Group, Inc., Class A(a) | 61,278,076 | ||||||
| 712,851 | Danaher Corp. | 102,957,070 | ||||||
| 294,551 | Facebook, Inc., Class A(a) | 52,453,642 | ||||||
| 162,654 | Goldman Sachs Group, Inc. (The) | 33,706,788 | ||||||
| 542,099 | Intercontinental Exchange, Inc. | 50,019,475 | ||||||
| 226,930 | IQVIA Holdings, Inc.(a) | 33,898,803 | ||||||
| 278,885 | LyondellBasell Industries NV, Class A | 24,951,841 | ||||||
| 336,014 | M&T Bank Corp. | 53,080,131 | ||||||
| 594,507 | Marriott International, Inc., Class A | 73,938,836 | ||||||
| 156,522 | McCormick & Co., Inc. | 24,464,389 | ||||||
| 62,299 | Mettler-Toledo International, Inc.(a) | 43,883,416 | ||||||
| 256,055 | Northrop Grumman Corp. | 95,966,853 | ||||||
See accompanying notes to financial statements.
37 |
Table of Contents
Portfolio of Investments – as of September 30, 2019
Loomis Sayles Global Allocation Fund – (continued)
| Shares | Description | Value (†) | ||||||
| United States — continued | ||||||||
| 8,829 | NVR, Inc.(a) | $ | 32,820,483 | |||||
| 328,238 | Parker-Hannifin Corp. | 59,283,065 | ||||||
| 276,012 | Roper Technologies, Inc. | 98,425,879 | ||||||
| 209,820 | S&P Global, Inc. | 51,401,704 | ||||||
| 149,048 | Sherwin-Williams Co. (The) | 81,957,024 | ||||||
| 473,052 | Texas Instruments, Inc. | 61,137,240 | ||||||
| 245 | Thryv Holdings, Inc.(a)(b)(c)(d) | 1,919 | ||||||
| 148,484 | Tyler Technologies, Inc.(a) | 38,977,050 | ||||||
| 327,599 | UnitedHealth Group, Inc. | 71,193,815 | ||||||
|
| |||||||
| 1,370,728,123 | ||||||||
|
| |||||||
| Total Common Stocks (Identified Cost $1,539,240,813) | 2,076,499,381 | |||||||
|
| |||||||
| Principal Amount (‡) | ||||||||
| Bonds and Notes — 25.3% | ||||||||
| Non-Convertible Bonds — 24.9% | ||||||||
| Argentina — 0.1% | ||||||||
| $ | 775,000 | Provincia de Buenos Aires, 9.125%, 3/16/2024, 144A(c)(d) | 282,488 | |||||
| 535,000 | Republic of Argentina, 6.875%, 4/22/2021 | 262,155 | ||||||
| 2,460,000 | Republic of Argentina, 7.125%, 6/28/2117 | 1,067,665 | ||||||
| 1,390,000 | Republic of Argentina, 7.625%, 4/22/2046 | 602,579 | ||||||
| 17,745,000 | YPF S.A., 16.500%, 5/09/2022, 144A, (ARS)(c)(d) | 92,426 | ||||||
|
| |||||||
| 2,307,313 | ||||||||
|
| |||||||
| Australia — 0.1% | ||||||||
| 1,675,000 | Australia Government Bond, Series 133, 5.500%, 4/21/2023, (AUD)(e) | 1,319,022 | ||||||
| 1,150,000 | Commonwealth Bank of Australia, 2.250%, 3/10/2020, 144A(e) | 1,151,044 | ||||||
| 670,000 | GAIF Bond Issuer Pty Ltd., 3.400%, 9/30/2026, 144A(e) | 682,216 | ||||||
| 110,000 | Incitec Pivot Finance LLC, 6.000%, 12/10/2019, 144A | 110,697 | ||||||
| 935,000 | National Australia Bank, 2.500%, 1/12/2021(e) | 940,292 | ||||||
| 95,000 | Sydney Airport Finance Co. Pty Ltd., 3.375%, 4/30/2025, 144A | 97,797 | ||||||
|
| |||||||
| 4,301,068 | ||||||||
|
| |||||||
| Belgium — 0.1% | ||||||||
| 1,765,000 | Anheuser-Busch InBev Finance, Inc., 2.650%, 2/01/2021 | 1,781,729 | ||||||
| 1,690,000 | Anheuser-Busch InBev Worldwide, Inc., 4.750%, 1/23/2029 | 1,964,221 | ||||||
|
| |||||||
| 3,745,950 | ||||||||
|
| |||||||
| Brazil — 0.5% | ||||||||
| 800,000 | Braskem Finance Ltd., 5.750%, 4/15/2021, 144A | 828,008 | ||||||
| 8,500(††) | Brazil Notas do Tesouro Nacional, Series F, 10.000%, 1/01/2025, (BRL) | 2,347,769 | ||||||
| 10,980(††) | Brazil Notas do Tesouro Nacional, Series F, 10.000%, 1/01/2021, (BRL) | 2,796,257 | ||||||
| 11,634(††) | Brazil Notas do Tesouro Nacional, Series F, 10.000%, 1/01/2027, (BRL) | 3,289,484 | ||||||
| 1,085,000 | Brazilian Government International Bond, 4.625%, 1/13/2028 | 1,152,823 | ||||||
| 400,000 | Cosan Luxembourg S.A., 5.000%, 3/14/2023, 144A | 404,000 | ||||||
| 1,100,000 | Embraer Netherlands Finance BV, 5.050%, 6/15/2025(e) | 1,203,136 | ||||||
| 1,350,000 | Petrobras Global Finance BV, 5.999%, 1/27/2028 | 1,503,225 | ||||||
See accompanying notes to financial statements.
| 38
Table of Contents
Portfolio of Investments – as of September 30, 2019
Loomis Sayles Global Allocation Fund – (continued)
| Principal Amount (‡) | Description | Value (†) | ||||||
| Brazil — continued | ||||||||
| $ | 150,000 | Petrobras Global Finance BV, 6.875%, 1/20/2040 | $ | 173,033 | ||||
| 575,000 | Raizen Fuels Finance S.A., 5.300%, 1/20/2027, 144A | 623,012 | ||||||
| 500,000 | Tupy Overseas S.A., 6.625%, 7/17/2024, 144A | 515,630 | ||||||
|
| |||||||
| 14,836,377 | ||||||||
|
| |||||||
| Canada — 3.8% | ||||||||
| 423,390 | Air Canada Pass Through Trust, Series2015-2, Class A, 4.125%, 6/15/2029, 144A(e) | 449,674 | ||||||
| 849,176 | Air Canada Pass Through Trust, Series2017-1, Class AA, 3.300%, 7/15/2031, 144A(e) | 874,235 | ||||||
| 1,010,000 | Antares Holdings LP, 6.000%, 8/15/2023, 144A | 1,046,356 | ||||||
| 815,000 | Bank of Montreal, 1.750%, 6/15/2021, 144A(e) | 812,873 | ||||||
| 6,384 | BMW Canada Auto Trust, Series2017-1A, Class A2, 1.677%, 5/20/2020, 144A, (CAD)(e)(f) | 4,819 | ||||||
| 1,015,000 | Brookfield Finance, Inc., 4.850%, 3/29/2029 | 1,148,722 | ||||||
| 11,680,000 | Canadian Government Bond, 0.500%, 3/01/2022, (CAD)(e) | 8,599,040 | ||||||
| 13,815,000 | Canadian Government Bond, 0.750%, 9/01/2020, (CAD) | 10,334,790 | ||||||
| 65,740,000 | Canadian Government Bond, 0.750%, 3/01/2021, (CAD)(e) | 48,994,002 | ||||||
| 35,230,000 | Canadian Government Bond, 1.750%, 5/01/2021, (CAD)(e) | 26,648,596 | ||||||
| 970,000 | Canadian Imperial Bank of Commerce, 3.500%, 9/13/2023 | 1,020,567 | ||||||
| 1,800,000 | Canadian Imperial Bank of Commerce, (fixed rate to 7/22/2022, variable rate thereafter), 2.606%, 7/22/2023(e) | 1,811,051 | ||||||
| 800,000 | CPPIB Capital, Inc., 0.375%, 6/20/2024, 144A, (EUR)(e) | 903,098 | ||||||
| 430,000 | Enbridge, Inc., 2.900%, 7/15/2022 | 438,120 | ||||||
| 905,000 | Export Development Canada, 1.800%, 9/01/2022, (CAD)(e) | 685,152 | ||||||
| 391,828 | GMF Canada Leasing Trust, Series2018-1A, Class A2, 3.030%, 6/21/2021, 144A, (CAD) | 296,770 | ||||||
| 831,317 | Institutional Mortgage Securities Canada, Inc., Series2014-5A, Class A2, 2.616%, 7/12/2047, 144A, (CAD)(e) | 625,893 | ||||||
| 7,200,000 | Province of Ontario Canada, 1.875%, 5/21/2020(e) | 7,190,856 | ||||||
| 2,500,000 | Toronto-Dominion Bank (The), 2.100%, 7/15/2022, 144A(e) | 2,516,880 | ||||||
| 1,690,000 | Toronto-Dominion Bank (The), GMTN, 3.500%, 7/19/2023(e) | 1,782,144 | ||||||
| 1,580,000 | Videotron Ltd., 5.125%, 4/15/2027, 144A | 1,670,850 | ||||||
|
| |||||||
| 117,854,488 | ||||||||
|
| |||||||
| Chile — 0.5% | ||||||||
| 1,590,000,000 | Bonos de la Tesoreria de la Republica de Chile, 4.000%, 3/01/2023, 144A, (CLP)(e) | 2,317,958 | ||||||
| 815,000,000 | Bonos de la Tesoreria de la Republica de Chile, 4.500%, 3/01/2026, (CLP)(e) | 1,251,783 | ||||||
| 1,960,000 | Corp. Nacional del Cobre de Chile, 3.000%, 9/30/2029, 144A | 1,952,611 | ||||||
| 1,700,000 | Corp. Nacional del Cobre de Chile, 4.500%, 9/16/2025(e) | 1,859,318 | ||||||
| 1,160,000 | Corp. Nacional del Cobre de Chile, 4.500%, 9/16/2025, 144A(e) | 1,268,711 | ||||||
| 525,000 | Enel Chile S.A., 4.875%, 6/12/2028 | 583,406 | ||||||
| 250,000 | Engie Energia Chile S.A., 5.625%, 1/15/2021, 144A | 259,194 | ||||||
| 800,000 | Inversiones CMPC S.A., 4.375%, 5/15/2023, 144A(e) | 833,965 | ||||||
| 696,673 | Latam Airlines Pass Through Trust, Series2015-1, Class A, 4.200%, 8/15/2029 | 712,557 | ||||||
See accompanying notes to financial statements.
39 |
Table of Contents
Portfolio of Investments – as of September 30, 2019
Loomis Sayles Global Allocation Fund – (continued)
| Principal Amount (‡) | Description | Value (†) | ||||||
| Chile — continued | ||||||||
| $ | 407,967 | Latam Airlines Pass Through Trust, Series2015-1, Class B, 4.500%, 8/15/2025 | $ | 407,600 | ||||
| 950,000 | Latam Finance Ltd., 6.875%, 4/11/2024, 144A | 997,025 | ||||||
| 935,000 | Republic of Chile, 3.240%, 2/06/2028(e) | 993,447 | ||||||
| 1,120,000 | Transelec S.A., 4.250%, 1/14/2025, 144A(e) | 1,187,211 | ||||||
|
| |||||||
| 14,624,786 | ||||||||
|
| |||||||
| China — 0.3% | ||||||||
| 920,000 | Alibaba Group Holding Ltd., 3.400%, 12/06/2027(e) | 957,542 | ||||||
| 795,000 | Baidu, Inc., 3.875%, 9/29/2023 | 828,636 | ||||||
| 400,000 | China Resources Gas Group Ltd., 4.500%, 4/05/2022, 144A(e) | 416,920 | ||||||
| 905,000 | Industrial & Commercial Bank of China Ltd., 2.957%, 11/08/2022(e) | 916,629 | ||||||
| 985,000 | Sinopec Group Overseas Development 2017 Ltd., 2.375%, 4/12/2020, 144A(e) | 984,921 | ||||||
| 500,000 | Tencent Holdings Ltd., 2.985%, 1/19/2023, 144A(e) | 507,800 | ||||||
| 1,175,000 | Tencent Holdings Ltd., 3.280%, 4/11/2024, 144A | 1,206,753 | ||||||
| 1,820,000 | Three Gorges Finance I Cayman Islands Ltd., 3.150%, 6/02/2026(e) | 1,878,058 | ||||||
| 1,270,000 | Weibo Corp., 3.500%, 7/05/2024 | 1,290,128 | ||||||
|
| |||||||
| 8,987,387 | ||||||||
|
| |||||||
| Colombia — 0.3% | ||||||||
| 1,265,000,000 | Emgesa S.A. E.S.P., 8.750%, 1/25/2021, 144A, (COP) | 377,137 | ||||||
| 1,300,000 | Empresas Publicas de Medellin ESP, 4.250%, 7/18/2029, 144A | 1,366,820 | ||||||
| 1,140,000 | Millicom International Cellular S.A., 6.250%, 3/25/2029, 144A | 1,245,006 | ||||||
| 575,000 | Republic of Colombia, 3.875%, 4/25/2027 | 609,793 | ||||||
| 200,000,000 | Republic of Colombia, 7.750%, 4/14/2021, (COP) | 59,845 | ||||||
| 7,073,300,000 | Republic of Colombia, Series B, 6.250%, 11/26/2025, (COP) | 2,121,665 | ||||||
| 6,150,000,000 | Titulos De Tesoreria, Series B, 7.500%, 8/26/2026, (COP)(e) | 1,964,064 | ||||||
| 870,000 | Transportadora de Gas Internacional S.A. E.S.P., 5.550%, 11/01/2028, 144A | 1,002,684 | ||||||
|
| |||||||
| 8,747,014 | ||||||||
|
| |||||||
| Denmark — 0.0% | ||||||||
| 670,000 | Danske Bank A/S, 3.875%, 9/12/2023, 144A | 694,620 | ||||||
|
| |||||||
| Dominican Republic — 0.1% | ||||||||
| 1,410,000 | Dominican Republic, 5.500%, 1/27/2025, 144A | 1,485,802 | ||||||
| 590,000 | Dominican Republic, 5.950%, 1/25/2027, 144A | 638,911 | ||||||
| 995,000 | Dominican Republic, 6.000%, 7/19/2028, 144A | 1,086,789 | ||||||
| 425,000 | Dominican Republic, 8.625%, 4/20/2027, 144A | 508,410 | ||||||
|
| |||||||
| 3,719,912 | ||||||||
|
| |||||||
| France — 0.8% | ||||||||
| 200,000 | AXA S.A., 7.125%, 12/15/2020, (GBP) | 262,718 | ||||||
| 205,000 | BNP Paribas S.A., 4.375%, 5/12/2026, 144A | 218,545 | ||||||
| 1,415,000 | Caisse d’Amortissement de la Dette Sociale, 1.875%, 2/12/2022(e) | 1,419,471 | ||||||
| 250,000 | Credit Agricole S.A., 3.250%, 10/04/2024, 144A | 257,341 | ||||||
| 735,000 | Danone S.A., 1.691%, 10/30/2019, 144A(e) | 734,654 | ||||||
| 500,000 | Dexia Credit Local S.A., 2.250%, 2/18/2020, 144A(e) | 500,194 | ||||||
| 1,300,000 | Edenred, 1.875%, 3/06/2026, (EUR) | 1,550,768 | ||||||
| 465,000 | French Republic Government Bond OAT, 4.250%, 10/25/2023, (EUR) | 610,440 | ||||||
See accompanying notes to financial statements.
| 40
Table of Contents
Portfolio of Investments – as of September 30, 2019
Loomis Sayles Global Allocation Fund – (continued)
| Principal Amount (‡) | Description | Value (†) | ||||||
| France — continued | ||||||||
| 12,590,000 | French Republic Government Bond OAT, 4.250%, 10/25/2023, (EUR)(e) | $ | 16,527,815 | |||||
| 500,000 | Holding d’Infrastructures de Transport SASU, EMTN, 1.625%, 11/27/2027, (EUR) | 577,794 | ||||||
| 500,000 | Holding d’Infrastructures de Transport SASU, EMTN, 0.625%, 3/27/2023, (EUR) | 552,034 | ||||||
| 1,015,000 | Societe Generale S.A., 4.750%, 11/24/2025, 144A(e) | 1,090,214 | ||||||
|
| |||||||
| 24,301,988 | ||||||||
|
| |||||||
| Germany — 0.3% | ||||||||
| 1,165,000 | BMW U.S. Capital LLC, 3.150%, 4/18/2024, 144A | 1,206,836 | ||||||
| 675,000 | Daimler Finance North America LLC, 1.750%, 10/30/2019, 144A(e) | 674,780 | ||||||
| 380,000 | Deutsche Telekom International Finance BV, 2.820%, 1/19/2022, 144A | 384,496 | ||||||
| 1,825,000 | Deutsche Telekom International Finance BV, 4.375%, 6/21/2028, 144A | 2,041,027 | ||||||
| 1,850,000 | RWE AG, (fixed rate to 10/21/2020, variable rate thereafter), 2.750%, 4/21/2075, (EUR) | 2,057,535 | ||||||
| 1,450,000 | Siemens Financieringsmaatschappij NV, 2.350%, 10/15/2026, 144A | 1,444,879 | ||||||
|
| |||||||
| 7,809,553 | ||||||||
|
| |||||||
| Greece — 0.1% | ||||||||
| 430,000 | Hellenic Republic Government Bond, 3.450%, 4/02/2024, 144A, (EUR) | 525,210 | ||||||
| 1,855,000 | Hellenic Republic Government Bond, 3.750%, 1/30/2028, (EUR) | 2,412,380 | ||||||
|
| |||||||
| 2,937,590 | ||||||||
|
| |||||||
| Hong Kong — 0.1% | ||||||||
| 355,000 | AIA Group Ltd., 3.200%, 3/11/2025, 144A(e) | 366,122 | ||||||
| 1,135,000 | AIA Group Ltd., 3.900%, 4/06/2028, 144A | 1,233,098 | ||||||
| 1,350,000 | CK Hutchison International 19 Ltd., 3.625%, 4/11/2029, 144A | 1,433,368 | ||||||
|
| |||||||
| 3,032,588 | ||||||||
|
| |||||||
| India — 0.0% | ||||||||
| 650,000 | Greenko Dutch BV, 5.250%, 7/24/2024, 144A | 651,631 | ||||||
|
| |||||||
| Indonesia — 0.1% | ||||||||
| 300,000 | Indonesia Government International Bond, 4.125%, 1/15/2025, 144A | 319,228 | ||||||
| 735,000 | Indonesia Government International Bond, 4.750%, 1/08/2026 | 810,401 | ||||||
| 1,475,000 | Perusahaan Listrik Negara PT, MTN, 4.125%, 5/15/2027 | 1,556,657 | ||||||
| 545,000 | Republic of Indonesia, 2.875%, 7/08/2021, 144A, (EUR) | 623,171 | ||||||
| 525,000 | Republic of Indonesia, 4.750%, 1/08/2026, 144A | 579,369 | ||||||
|
| |||||||
| 3,888,826 | ||||||||
|
| |||||||
| Ireland — 0.1% | ||||||||
| 475,000 | AerCap Ireland Capital DAC/AerCap Global Aviation Trust, 4.500%, 5/15/2021 | 490,379 | ||||||
| 1,250,000 | Bank of Ireland Group PLC, 4.500%, 11/25/2023, 144A | 1,308,820 | ||||||
| 375,000 | Ireland Government Bond, 3.400%, 3/18/2024, (EUR) | 480,116 | ||||||
|
| |||||||
| 2,279,315 | ||||||||
|
| |||||||
| Italy — 0.6% | ||||||||
| 2,180,000 | Enel Finance International NV, 4.625%, 9/14/2025, 144A | 2,381,051 | ||||||
| 1,075,000 | Intesa Sanpaolo SpA, 5.710%, 1/15/2026, 144A | 1,142,103 | ||||||
See accompanying notes to financial statements.
41 |
Table of Contents
Portfolio of Investments – as of September 30, 2019
Loomis Sayles Global Allocation Fund – (continued)
| Principal Amount (‡) | Description | Value (†) | ||||||
| Italy — continued | ||||||||
| 530,000 | Intesa Sanpaolo SpA, EMTN, 3.928%, 9/15/2026, (EUR) | $ | 646,890 | |||||
| 3,305,000 | Italy Buoni Poliennali Del Tesoro, 2.000%, 2/01/2028, (EUR) | 4,001,297 | ||||||
| 4,255,000 | Italy Buoni Poliennali Del Tesoro, 5.000%, 3/01/2022, (EUR) | 5,218,847 | ||||||
| 3,335,000 | Republic of Italy, 2.500%, 11/15/2025, (EUR) | 4,092,731 | ||||||
| 430,000 | UniCredit SpA, (fixed rate to 6/19/2027, variable rate thereafter), 5.861%, 6/19/2032, 144A | 442,186 | ||||||
|
| |||||||
| 17,925,105 | ||||||||
|
| |||||||
| Japan — 0.7% | ||||||||
| 988,104,600(†††) | Japan Government CPI Linked Bond, Series 23, 0.100%, 3/10/2028, (JPY)(e) | 9,532,168 | ||||||
| 1,155,150,000 | Japan Government Thirty Year Bond, Series 62, 0.500%, 3/20/2049, (JPY)(e) | 11,124,268 | ||||||
| 1,445,000 | Sumitomo Mitsui Financial Group, Inc., 3.040%, 7/16/2029 | 1,478,062 | ||||||
|
| |||||||
| 22,134,498 | ||||||||
|
| |||||||
| Korea — 0.3% | ||||||||
| 765,000 | Export-Import Bank of Korea, 3.000%, 11/01/2022(e) | 784,193 | ||||||
| 1,100,000 | Hyundai Capital Services, Inc., 3.750%, 3/05/2023, 144A | 1,136,179 | ||||||
| 1,575,000 | Kia Motors Corp., 3.000%, 4/25/2023, 144A | 1,591,561 | ||||||
| 630,000 | Korea Development Bank (The), MTN, 4.500%, 11/22/2019, (AUD)(e) | 426,959 | ||||||
| 910,000 | Korea Gas Corp., 2.750%, 7/20/2022, 144A(e) | 922,058 | ||||||
| 670,000 | KT Corp., 2.500%, 7/18/2026, 144A(e) | 660,807 | ||||||
| 1,180,000 | LG Chem Ltd., 3.250%, 10/15/2024, 144A | 1,217,083 | ||||||
| 1,440,000,000 | Republic of Korea, Series 2209, 2.000%, 9/10/2022, (KRW)(e) | 1,226,099 | ||||||
| 770,000 | Shinhan Bank Co. Ltd., 3.875%, 3/24/2026, 144A(e) | 808,704 | ||||||
| 140,000 | SK Telecom Co. Ltd., 6.625%, 7/20/2027, 144A(e) | 177,834 | ||||||
| 200,000 | Woori Bank, 5.875%, 4/13/2021, 144A(e) | 208,816 | ||||||
|
| |||||||
| 9,160,293 | ||||||||
|
| |||||||
| Mexico — 0.5% | ||||||||
| 620,000 | Alfa SAB de CV, 6.875%, 3/25/2044 | 725,406 | ||||||
| 770,000 | America Movil SAB de CV, 2.125%, 3/10/2028, (EUR)(e) | 947,328 | ||||||
| 10,000,000 | America Movil SAB de CV, 6.450%, 12/05/2022, (MXN)(e) | 487,737 | ||||||
| 675,000 | Banco Nacional de Comercio Exterior SNC, (fixed rate to 8/11/2021, variable rate thereafter), 3.800%, 8/11/2026, 144A | 682,601 | ||||||
| 1,150,000 | CEMEX Finance LLC, 6.000%, 4/01/2024, 144A | 1,180,475 | ||||||
| 555,000 | Cemex SAB de CV, 2.750%, 12/05/2024, 144A, (EUR) | 621,969 | ||||||
| 1,010,000 | Cemex SAB de CV, 5.700%, 1/11/2025 | 1,038,997 | ||||||
| 800,000 | Gruma SAB de CV, 4.875%, 12/01/2024(e) | 866,008 | ||||||
| 10,000,000 | Grupo Televisa SAB, EMTN, 7.250%, 5/14/2043, (MXN)(e) | 377,785 | ||||||
| 142,000(††††) | Mexican Fixed Rate Bonds, Series M, 5.750%, 3/05/2026, (MXN) | 681,052 | ||||||
| 190,229(††††) | Mexican Fixed Rate Bonds, Series M, 6.500%, 6/10/2021, (MXN)(e) | 960,640 | ||||||
| 3,600,000 | Mexico Government International Bond, 4.000%, 10/02/2023 | 3,790,800 | ||||||
| 196,000 | Mexico Government International Bond, 4.000%, 3/15/2115, (EUR)(e) | 244,008 | ||||||
| 100,000 | Sigma Alimentos S.A. de CV, 2.625%, 2/07/2024, 144A, (EUR) | 117,335 | ||||||
| 835,000 | Sigma Alimentos S.A. de CV, 4.125%, 5/02/2026 | 863,190 | ||||||
| 1,010,000 | Unifin Financiera SAB de CV SOFOM ENR, 7.250%, 9/27/2023 | 1,043,350 | ||||||
|
| |||||||
| 14,628,681 | ||||||||
|
| |||||||
See accompanying notes to financial statements.
| 42
Table of Contents
Portfolio of Investments – as of September 30, 2019
Loomis Sayles Global Allocation Fund – (continued)
| Principal Amount (‡) | Description | Value (†) | ||||||
| Netherlands — 0.0% | ||||||||
| $ | 870,000 | Cooperatieve Rabobank UA, 4.375%, 8/04/2025(e) | $ | 938,147 | ||||
|
| |||||||
| Norway — 0.2% | ||||||||
| 17,000,000 | City of Oslo, Norway, 3.550%, 2/12/2021, (NOK)(e) | 1,911,225 | ||||||
| 550,000 | Kommunalbanken AS, 1.750%, 9/15/2020, 144A(e) | 549,098 | ||||||
| 3,815,000 | Norway Government Bond, Series 475, 2.000%, 5/24/2023, 144A, (NOK)(e) | 429,741 | ||||||
| 16,500,000 | Norway Government Bond, Series 478, 1.500%, 2/19/2026, 144A, (NOK)(e) | 1,843,991 | ||||||
|
| |||||||
| 4,734,055 | ||||||||
|
| |||||||
| Panama — 0.1% | ||||||||
| 680,000 | Banco Latinoamericano de Comercio Exterior S.A., 3.250%, 5/07/2020, 144A(e) | 681,952 | ||||||
| 1,045,000 | Panama Government International Bond, 3.160%, 1/23/2030 | 1,077,917 | ||||||
|
| |||||||
| 1,759,869 | ||||||||
|
| |||||||
| Paraguay — 0.0% | ||||||||
| 800,000 | Republic of Paraguay, 5.000%, 4/15/2026, 144A | 872,008 | ||||||
|
| |||||||
| Peru — 0.1% | ||||||||
| 580,000 | Southern Copper Corp., 3.875%, 4/23/2025(e) | 603,544 | ||||||
| 1,050,000 | Transportadora de Gas del Peru S.A., 4.250%, 4/30/2028, 144A(e) | 1,114,323 | ||||||
| 350,000 | Union Andina de Cementos SAA, 5.875%, 10/30/2021, 144A | 354,379 | ||||||
|
| |||||||
| 2,072,246 | ||||||||
|
| |||||||
| Singapore — 0.2% | ||||||||
| 785,000 | BOC Aviation Ltd., 2.750%, 9/18/2022, 144A | 784,839 | ||||||
| 495,000 | BOC Aviation Ltd., 3.000%, 3/30/2020(e) | 495,786 | ||||||
| 345,000 | DBS Group Holdings Ltd., (fixed rate to 12/11/2023, variable rate thereafter), 4.520%, 12/11/2028, 144A | 367,149 | ||||||
| 3,215,000 | United Overseas Bank Ltd., 3.200%, 4/23/2021, 144A(e) | 3,267,147 | ||||||
|
| |||||||
| 4,914,921 | ||||||||
|
| |||||||
| South Africa — 0.1% | ||||||||
| 930,000 | MTN (Mauritius) Investments Ltd., 4.755%, 11/11/2024, 144A | 941,346 | ||||||
| 500,000 | Myriad International Holdings BV, 6.000%, 7/18/2020, 144A | 512,085 | ||||||
| 39,185,000 | South Africa Government International Bond, Series R213, 7.000%, 2/28/2031, (ZAR)(e) | 2,189,134 | ||||||
|
| |||||||
| 3,642,565 | ||||||||
|
| |||||||
| Spain — 0.5% | ||||||||
| 2,300,000 | Banco Bilbao Vizcaya Argentaria S.A., GMTN, 0.750%, 9/11/2022, (EUR) | 2,557,069 | ||||||
| 400,000 | Banco Santander S.A., 3.125%, 2/23/2023 | 407,466 | ||||||
| 100,000 | Iberdrola International BV, EMTN, 0.375%, 9/15/2025, (EUR) | 111,004 | ||||||
| 700,000 | Naturgy Finance BV, EMTN, 1.500%, 1/29/2028, (EUR) | 831,670 | ||||||
| 725,000 | Spain Government International Bond, 0.750%, 7/30/2021, (EUR)(e) | 808,389 | ||||||
| 430,000 | Spain Government International Bond, 1.600%, 4/30/2025, 144A, (EUR)(e) | 516,744 | ||||||
| 3,590,000 | Spain Government International Bond, 2.700%, 10/31/2048, 144A, (EUR) | 5,525,515 | ||||||
| 760,000 | Spain Government International Bond, 4.300%, 10/31/2019, 144A, (EUR)(e) | 831,338 | ||||||
| 2,565,000 | Spain Government International Bond, 4.400%, 10/31/2023, 144A, (EUR)(e) | 3,340,251 | ||||||
| 1,300,000 | Telefonica Emisiones SAU Co., EMTN, 1.495%, 9/11/2025, (EUR) | 1,513,967 | ||||||
|
| |||||||
| 16,443,413 | ||||||||
|
| |||||||
See accompanying notes to financial statements.
43 |
Table of Contents
Portfolio of Investments – as of September 30, 2019
Loomis Sayles Global Allocation Fund – (continued)
| Principal Amount (‡) | Description | Value (†) | ||||||
| Supranationals — 0.2% | ||||||||
| $ | 1,115,000 | Corporacion Andina de Fomento, 4.375%, 6/15/2022(e) | $ | 1,173,326 | ||||
| 3,360,000 | European Investment Bank, 1.750%, 7/30/2024, 144A, (CAD)(e) | 2,535,578 | ||||||
| 3,515,000 | International Bank for Reconstruction & Development, 2.200%, 1/18/2022, (CAD)(e) | 2,679,741 | ||||||
| 1,140,000 | International Bank for Reconstruction & Development, MTN, 2.500%, 3/12/2020, (AUD)(e) | 774,183 | ||||||
|
| |||||||
| 7,162,828 | ||||||||
|
| |||||||
| Sweden — 0.0% | ||||||||
| 2,450,000 | Sweden Government Bond, Series 1047, 5.000%, 12/01/2020, (SEK)(e) | 265,185 | ||||||
|
| |||||||
| Switzerland — 0.1% | ||||||||
| 1,075,000 | Glencore Finance Canada Ltd., 5.550%, 10/25/2042, 144A(e) | 1,165,622 | ||||||
| 900,000 | Syngenta Finance NV, EMTN, 1.250%, 9/10/2027, (EUR) | 959,951 | ||||||
| 340,000 | Willow No. 2 (Ireland) PLC for Zurich Insurance Co. Ltd., EMTN, (fixed rate to 10/1/2025, variable rate thereafter), 4.250%, 10/01/2045 | 354,110 | ||||||
|
| |||||||
| 2,479,683 | ||||||||
|
| |||||||
| Thailand — 0.2% | ||||||||
| 1,570,000 | Kasikornbank PCL, EMTN, 3.256%, 7/12/2023 | 1,607,477 | ||||||
| 85,000,000 | Thailand Government Bond, 2.125%, 12/17/2026, (THB) | 2,905,339 | ||||||
| 950,000 | Thaioil Treasury Center Co. Ltd., 3.625%, 1/23/2023, 144A | 980,799 | ||||||
|
| |||||||
| 5,493,615 | ||||||||
|
| |||||||
| Trinidad — 0.0% | ||||||||
| 415,000 | Trinidad Generation UnLtd., 5.250%, 11/04/2027, 144A | 424,342 | ||||||
|
| |||||||
| Turkey — 0.3% | ||||||||
| 525,000 | Turk Telekomunikasyon AS, 6.875%, 2/28/2025, 144A | 551,544 | ||||||
| 2,875,000 | Turkcell Iletisim Hizmetleri AS, 5.800%, 4/11/2028 | 2,767,417 | ||||||
| 16,960,000 | Turkey Government Bond, 12.400%, 3/08/2028, (TRY) | 2,889,237 | ||||||
| 1,345,000 | Turkey Government International Bond, 7.625%, 4/26/2029 | 1,429,192 | ||||||
|
| |||||||
| 7,637,390 | ||||||||
|
| |||||||
| United Arab Emirates — 0.1% | ||||||||
| 1,610,000 | Abu Dhabi Crude Oil Pipeline LLC, 3.650%, 11/02/2029(e) | 1,745,562 | ||||||
| 1,275,000 | DP World Crescent Ltd., 4.848%, 9/26/2028, 144A | 1,400,702 | ||||||
| 850,000 | DP World PLC, 3.250%, 5/18/2020, 144A(e) | 850,309 | ||||||
| 200,000 | DP World PLC, MTN, 3.250%, 5/18/2020 | 200,073 | ||||||
|
| |||||||
| 4,196,646 | ||||||||
|
| |||||||
| United Kingdom — 0.3% | ||||||||
| 95,000 | Avon Products, Inc., 8.950%, 3/15/2043 | 106,400 | ||||||
| 300,000 | HSBC Holdings PLC, 4.375%, 11/23/2026(e) | 320,941 | ||||||
| 565,000 | HSBC Holdings PLC, (fixed rate to 6/01/2021, variable rate thereafter), 6.875%(g) | 592,685 | ||||||
| 295,000 | HSBC Holdings PLC, EMTN, 5.750%, 12/20/2027, (GBP)(e) | 449,287 | ||||||
| 635,000 | Lloyds Banking Group PLC, 4.050%, 8/16/2023 | 665,823 | ||||||
| 400,000 | Lloyds Banking Group PLC, 4.500%, 11/04/2024(e) | 417,586 | ||||||
| 1,395,000 | Nationwide Building Society, (fixed rate to 7/18/2029, variable rate thereafter), 3.960%, 7/18/2030, 144A | 1,456,860 | ||||||
See accompanying notes to financial statements.
| 44
Table of Contents
Portfolio of Investments – as of September 30, 2019
Loomis Sayles Global Allocation Fund – (continued)
| Principal Amount (‡) | Description | Value (†) | ||||||
| United Kingdom — continued | ||||||||
| 235,000 | Network Rail Infrastructure Finance PLC, EMTN, 4.750%, 1/22/2024, (GBP) | $ | 340,018 | |||||
| 1,130,000 | Royal Bank of Scotland Group PLC, 6.000%, 12/19/2023(e) | 1,240,646 | ||||||
| 350,000 | Santander UK Group Holdings PLC, 4.750%, 9/15/2025, 144A(e) | 364,815 | ||||||
| 250,000 | Standard Chartered PLC, EMTN, 3.125%, 11/19/2024, (EUR) | 304,314 | ||||||
| 1,035,000 | United Kingdom Gilt, 2.750%, 9/07/2024, (GBP)(e) | 1,426,622 | ||||||
| 530,000 | United Kingdom Gilt, 4.000%, 3/07/2022, (GBP) | 710,304 | ||||||
| 130,000 | Virgin Media Finance PLC, 4.500%, 1/15/2025, 144A, (EUR) | 145,944 | ||||||
| 115,000 | Virgin Media Secured Finance PLC, 4.875%, 1/15/2027, (GBP) | 147,043 | ||||||
| 1,660,000 | Vodafone Group PLC, 4.375%, 5/30/2028 | 1,833,476 | ||||||
|
| |||||||
| 10,522,764 | ||||||||
|
| |||||||
| United States — 13.1% | ||||||||
| 9,890,000 | AbbVie, Inc., 2.500%, 5/14/2020 | 9,912,471 | ||||||
| 1,500,000 | AES Corp. (The), 4.875%, 5/15/2023 | 1,526,250 | ||||||
| 480,000 | Allison Transmission, Inc., 4.750%, 10/01/2027, 144A | 492,600 | ||||||
| 8,000,000 | Ally Financial, Inc., 4.125%, 2/13/2022 | 8,180,000 | ||||||
| 745,000 | Ally Financial, Inc., 5.125%, 9/30/2024 | 813,912 | ||||||
| 1,728,000 | Ally Financial, Inc., 8.000%, 11/01/2031 | 2,388,960 | ||||||
| 1,965,000 | American Airlines Group, Inc., 5.000%, 6/01/2022, 144A | 2,040,358 | ||||||
| 1,517,993 | American Airlines Pass Through Certificates, Series2016-3, Class B, 3.750%, 4/15/2027 | 1,541,796 | ||||||
| 566,303 | American Airlines Pass Through Certificates, Series2017-2, Class B, 3.700%, 4/15/2027 | 569,432 | ||||||
| 116,474 | American Airlines Pass Through Certificates, Series2013-1, Class A, 4.000%, 1/15/2027 | 122,869 | ||||||
| 1,906,962 | American Airlines Pass Through Certificates, Series2016-1, Class B, 5.250%, 7/15/2025 | 2,026,759 | ||||||
| 436,785 | American Airlines Pass Through Certificates, Series2017-1B, Class B, 4.950%, 8/15/2026 | 460,738 | ||||||
| 400,000 | Antero Resources Corp., 5.125%, 12/01/2022 | 351,500 | ||||||
| 175,000 | Antero Resources Corp., 5.375%, 11/01/2021 | 168,875 | ||||||
| 3,060,000 | Antero Resources Corp., 5.625%, 6/01/2023 | 2,646,900 | ||||||
| 260,000 | Aptiv PLC, 1.600%, 9/15/2028, (EUR) | 300,507 | ||||||
| 1,510,000 | AT&T, Inc., 3.400%, 5/15/2025 | 1,575,451 | ||||||
| 3,960,000 | AT&T, Inc., 4.300%, 2/15/2030 | 4,357,100 | ||||||
| 495,000 | AT&T, Inc., 4.500%, 3/09/2048 | 532,437 | ||||||
| 625,000 | AT&T, Inc., 4.550%, 3/09/2049 | 675,619 | ||||||
| 925,000 | Aviation Capital Group LLC, 6.750%, 4/06/2021, 144A | 980,226 | ||||||
| 2,700,000 | Bank of America Corp., 6.110%, 1/29/2037 | 3,536,318 | ||||||
| 115,000 | Bank of America Corp., MTN, 4.250%, 10/22/2026 | 124,166 | ||||||
| 3,180,000 | Beazer Homes USA, Inc., 7.250%, 10/15/2029, 144A | 3,231,675 | ||||||
| 585,000 | BP Capital Markets America, Inc., 3.216%, 11/28/2023 | 607,618 | ||||||
| 270,000 | Brighthouse Financial, Inc., 4.700%, 6/22/2047 | 240,870 | ||||||
| 1,170,000 | Broadcom, Inc., 4.250%, 4/15/2026, 144A | 1,208,501 | ||||||
| 71,000 | California Resources Corp., 5.500%, 9/15/2021 | 34,968 | ||||||
| 10,000 | California Resources Corp., 6.000%, 11/15/2024 | 3,795 | ||||||
| 9,300,000 | California Resources Corp., 8.000%, 12/15/2022, 144A | 4,603,500 | ||||||
| 60,000 | CenturyLink, Inc., 5.625%, 4/01/2025 | 62,250 | ||||||
See accompanying notes to financial statements.
45 |
Table of Contents
Portfolio of Investments – as of September 30, 2019
Loomis Sayles Global Allocation Fund – (continued)
| Principal Amount (‡) | Description | Value (†) | ||||||
| United States — continued | ||||||||
| $ | 880,000 | CenturyLink, Inc., Series S, 6.450%, 6/15/2021 | $ | 924,000 | ||||
| 3,210,000 | Chesapeake Energy Corp., 4.875%, 4/15/2022 | 2,592,075 | ||||||
| 315,000 | Chesapeake Energy Corp., 5.750%, 3/15/2023 | 240,975 | ||||||
| 7,000,000 | Chesapeake Energy Corp., 8.000%, 6/15/2027 | 4,761,400 | ||||||
| 780,000 | Chevron Corp., 2.419%, 11/17/2020(e) | 784,195 | ||||||
| 1,635,000 | Cimarex Energy Co., 4.375%, 6/01/2024 | 1,718,004 | ||||||
| 165,000 | Cincinnati Bell, Inc., 7.000%, 7/15/2024, 144A | 152,625 | ||||||
| 325,000 | Cincinnati Bell, Inc., 8.000%, 10/15/2025, 144A | 284,375 | ||||||
| 500,000 | Citizens Financial Group, Inc., 4.300%, 12/03/2025 | 534,626 | ||||||
| 265,000 | Constellation Brands, Inc., 4.750%, 11/15/2024 | 292,689 | ||||||
| 485,000 | Continental Resources, Inc., 3.800%, 6/01/2024 | 494,241 | ||||||
| 640,000 | Continental Resources, Inc., 4.500%, 4/15/2023 | 664,421 | ||||||
| 63,000 | Continental Resources, Inc., 5.000%, 9/15/2022 | 63,553 | ||||||
| 375,000 | Cox Communications, Inc., 4.800%, 2/01/2035, 144A | 407,707 | ||||||
| 595,000 | CSC Holdings LLC, 5.375%, 2/01/2028, 144A | 626,981 | ||||||
| 155,000 | Cummins, Inc., 5.650%, 3/01/2098 | 201,348 | ||||||
| 475,000 | Dell International LLC/EMC Corp., 6.020%, 6/15/2026, 144A | 534,175 | ||||||
| 93,641 | Delta Air Lines Pass Through Trust, Series2007-1, Class B, 8.021%, 2/10/2024 | 103,764 | ||||||
| 940,000 | DH Europe Finance II S.a.r.l, 0.750%, 9/18/2031, (EUR) | 1,027,701 | ||||||
| 50,000 | Dillard’s, Inc., 7.000%, 12/01/2028 | 54,984 | ||||||
| 8,000 | Dillard’s, Inc., 7.750%, 7/15/2026 | 8,963 | ||||||
| 1,680,000 | DISH DBS Corp., 5.000%, 3/15/2023 | 1,697,304 | ||||||
| 1,495,000 | DISH DBS Corp., 5.875%, 11/15/2024 | 1,481,919 | ||||||
| 1,385,000 | DISH DBS Corp., 7.750%, 7/01/2026 | 1,409,237 | ||||||
| 310,000 | DR Horton, Inc., 4.375%, 9/15/2022 | 324,981 | ||||||
| 340,000 | Enable Midstream Partners LP, 5.000%, 5/15/2044 | 312,017 | ||||||
| 235,000 | Enbridge Energy Partners LP, 7.375%, 10/15/2045 | 347,954 | ||||||
| 1,075,000 | Energy Transfer Partners LP/Regency Energy Finance Corp., 5.000%, 10/01/2022 | 1,140,566 | ||||||
| 600,000 | EnLink Midstream Partners LP, 4.150%, 6/01/2025 | 556,500 | ||||||
| 1,310,000 | Federal National Mortgage Association, Series2017-M14, Class A2, 2.972%, 11/25/2027(e)(h) | 1,372,423 | ||||||
| 410,000 | FedEx Corp., 1.000%, 1/11/2023, (EUR) | 457,363 | ||||||
| 650,000 | FedEx Corp., 3.400%, 1/14/2022 | 666,458 | ||||||
| 21,480,003 | FNMA, 3.500%, 7/01/2049 | 22,096,246 | ||||||
| 40,000 | Ford Motor Co., 4.346%, 12/08/2026 | 40,106 | ||||||
| 685,000 | Ford Motor Co., 5.291%, 12/08/2046 | 632,862 | ||||||
| 25,000 | Ford Motor Co., 6.375%, 2/01/2029 | 26,586 | ||||||
| 50,000 | Ford Motor Co., 6.625%, 2/15/2028 | 54,049 | ||||||
| 2,105,000 | Ford Motor Co., 6.625%, 10/01/2028 | 2,314,127 | ||||||
| 5,000 | Ford Motor Co., 7.500%, 8/01/2026 | 5,722 | ||||||
| 5,000,000 | Ford Motor Credit Co. LLC, 2.459%, 3/27/2020 | 4,994,092 | ||||||
| 131,000 | Gates Global LLC/Gates Global Co., 6.000%, 7/15/2022, 144A | 130,509 | ||||||
| 295,000 | General Electric Co., 4.500%, 3/11/2044 | 315,988 | ||||||
| 50,000 | General Electric Co., GMTN, 3.100%, 1/09/2023 | 50,661 | ||||||
| 310,000 | General Motors Co., 5.200%, 4/01/2045 | 306,139 | ||||||
See accompanying notes to financial statements.
| 46
Table of Contents
Portfolio of Investments – as of September 30, 2019
Loomis Sayles Global Allocation Fund – (continued)
| Principal Amount (‡) | Description | Value (†) | ||||||
| United States — continued | ||||||||
| $ | 240,000 | General Motors Financial Co., Inc., 3.450%, 4/10/2022 | $ | 244,149 | ||||
| 925,000 | General Motors Financial Co., Inc., 5.250%, 3/01/2026 | 1,003,377 | ||||||
| 100,000 | General Motors Financial Co., Inc., EMTN, 0.955%, 9/07/2023, (EUR) | 110,138 | ||||||
| 3,435,000 | Georgia-Pacific LLC, 7.250%, 6/01/2028 | 4,574,424 | ||||||
| 105,000 | Georgia-Pacific LLC, 7.375%, 12/01/2025 | 133,052 | ||||||
| 180,000 | Georgia-Pacific LLC, 7.750%, 11/15/2029 | 256,941 | ||||||
| 315,000 | Georgia-Pacific LLC, 8.875%, 5/15/2031 | 499,051 | ||||||
| 905,000 | Global Atlantic Fin Co., 8.625%, 4/15/2021, 144A | 977,882 | ||||||
| 2,295,000 | Goldman Sachs Group, Inc. (The), 6.750%, 10/01/2037 | 3,097,984 | ||||||
| 2,745,000 | Goodyear Tire & Rubber Co. (The), 4.875%, 3/15/2027 | 2,706,844 | ||||||
| 165,000 | Goodyear Tire & Rubber Co. (The), 7.000%, 3/15/2028 | 177,375 | ||||||
| 1,000,000 | HCA Healthcare, Inc., 6.250%, 2/15/2021 | 1,047,100 | ||||||
| 20,000 | HCA, Inc., 4.750%, 5/01/2023 | 21,423 | ||||||
| 6,670,000 | HCA, Inc., 5.375%, 9/01/2026 | 7,328,329 | ||||||
| 225,000 | HCA, Inc., 7.050%, 12/01/2027 | 263,250 | ||||||
| 820,000 | HCA, Inc., 7.500%, 11/06/2033 | 984,000 | ||||||
| 395,000 | HCA, Inc., 8.360%, 4/15/2024 | 470,141 | ||||||
| 195,000 | HCA, Inc., MTN, 7.580%, 9/15/2025 | 230,100 | ||||||
| 75,000 | HCA, Inc., MTN, 7.750%, 7/15/2036 | 87,750 | ||||||
| 855,000 | Hecla Mining Co., 6.875%, 5/01/2021 | 846,450 | ||||||
| 490,000 | Hewlett Packard Enterprise Co., 6.350%, 10/15/2045 | 571,534 | ||||||
| 485,000 | Huntington Ingalls Industries, Inc., 5.000%, 11/15/2025, 144A | 508,037 | ||||||
| 1,585,000 | Hyundai Capital America, 2.750%, 9/27/2026, 144A(e) | 1,547,610 | ||||||
| 450,000 | International Lease Finance Corp., 4.625%, 4/15/2021 | 463,402 | ||||||
| 745,000 | INVISTA Finance LLC, 4.250%, 10/15/2019, 144A | 745,369 | ||||||
| 5,760,000 | Iron Mountain, Inc., 4.875%, 9/15/2029, 144A | 5,848,128 | ||||||
| 48,000 | J.C. Penney Corp., Inc., 6.375%, 10/15/2036 | 15,577 | ||||||
| 5,000 | J.C. Penney Corp., Inc., 7.625%, 3/01/2097 | 1,425 | ||||||
| 1,070,000 | Jefferies Group LLC, 6.250%, 1/15/2036 | 1,233,041 | ||||||
| 7,760,000 | JELD-WEN, Inc., 4.625%, 12/15/2025, 144A | 7,789,333 | ||||||
| 1,875,000 | JELD-WEN, Inc., 4.875%, 12/15/2027, 144A | 1,856,250 | ||||||
| 15,000 | K. Hovnanian Enterprises, Inc., 5.000%, 11/01/2021 | 13,703 | ||||||
| 1,665,000 | KB Home, 8.000%, 3/15/2020 | 1,705,293 | ||||||
| 330,000 | Level 3 Financing, Inc., 5.125%, 5/01/2023 | 333,416 | ||||||
| 760,000 | Level 3 Financing, Inc., 5.375%, 5/01/2025 | 787,200 | ||||||
| 140,000 | Level 3 Parent LLC, 5.750%, 12/01/2022 | 140,560 | ||||||
| 44,000 | Masco Corp., 6.500%, 8/15/2032 | 53,947 | ||||||
| 403,000 | Masco Corp., 7.750%, 8/01/2029 | 516,252 | ||||||
| 615,000 | Medtronic Global Holdings SCA, 1.125%, 3/07/2027, (EUR) | 712,684 | ||||||
| 4,315,000 | Michaels Stores, Inc., 8.000%, 7/15/2027, 144A | 4,320,394 | ||||||
| 254,000 | Micron Technology, Inc., 5.500%, 2/01/2025 | 261,025 | ||||||
| 1,430,000 | Midas Intermediate Holdco II LLC/Midas Intermediate Holdco II Finance, Inc., 7.875%, 10/01/2022, 144A | 1,326,325 | ||||||
| 450,000 | Morgan Stanley, 3.950%, 4/23/2027 | 475,983 | ||||||
| 725,000 | Morgan Stanley, 5.750%, 1/25/2021 | 758,622 | ||||||
| 3,150,000 | Morgan Stanley, MTN, 4.100%, 5/22/2023 | 3,317,171 | ||||||
| 600,000 | Morgan Stanley, MTN, 6.250%, 8/09/2026 | 727,477 | ||||||
See accompanying notes to financial statements.
47 |
Table of Contents
Portfolio of Investments – as of September 30, 2019
Loomis Sayles Global Allocation Fund – (continued)
| Principal Amount (‡) | Description | Value (†) | ||||||
| United States — continued | ||||||||
| $ | 25,000 | MPLX LP, 4.500%, 7/15/2023 | $ | 26,632 | ||||
| 95,000 | MPLX LP, 4.875%, 6/01/2025 | 104,510 | ||||||
| 3,890,000 | Nationstar Mortgage Holdings, Inc., 9.125%, 7/15/2026, 144A | 4,142,850 | ||||||
| 3,000,000 | Navient Corp., 5.000%, 10/26/2020 | 3,037,500 | ||||||
| 915,000 | Navient Corp., 5.500%, 1/25/2023 | 944,737 | ||||||
| 95,000 | Navient Corp., 5.875%, 10/25/2024 | 95,713 | ||||||
| 1,600(†††††) | Navient Corp., 6.000%, 12/15/2043 | 37,164 | ||||||
| 935,000 | Navient Corp., 6.750%, 6/15/2026 | 958,375 | ||||||
| 750,000 | Navient Corp., MTN, 6.125%, 3/25/2024 | 777,892 | ||||||
| 415,000 | Navient Corp., MTN, 7.250%, 1/25/2022 | 447,163 | ||||||
| 4,113,000 | Navient Corp., Series A, MTN, 5.625%, 8/01/2033 | 3,472,935 | ||||||
| 65,000 | Newfield Exploration Co., 5.625%, 7/01/2024 | 71,704 | ||||||
| 900,000 | NGL Energy Partners LP/NGL Energy Finance Corp., 6.125%, 3/01/2025 | 857,250 | ||||||
| 405,000 | NGL Energy Partners LP/NGL Energy Finance Corp., 7.500%, 11/01/2023 | 412,088 | ||||||
| 20,000 | NGPL PipeCo LLC, 7.768%, 12/15/2037, 144A | 25,906 | ||||||
| 1,765,000 | Nissan Motor Acceptance Corp., 3.650%, 9/21/2021, 144A | 1,805,562 | ||||||
| 120,000 | Oasis Petroleum, Inc., 6.875%, 1/15/2023 | 109,800 | ||||||
| 300,000 | Occidental Petroleum Corp., 4.500%, 7/15/2044 | 305,967 | ||||||
| 2,275,000 | Oceaneering International, Inc., 4.650%, 11/15/2024 | 2,145,507 | ||||||
| 420,000 | Old Republic International Corp., 4.875%, 10/01/2024 | 459,954 | ||||||
| 3,693,000 | ONEOK Partners LP, 4.900%, 3/15/2025 | 4,061,012 | ||||||
| 25,000 | ONEOK Partners LP, 6.200%, 9/15/2043 | 30,923 | ||||||
| 140,000 | Outfront Media Capital LLC/Outfront Media Capital Corp., 5.875%, 3/15/2025 | 144,375 | ||||||
| 1,200,000 | Owens Corning, 4.400%, 1/30/2048 | 1,104,586 | ||||||
| 310,000 | Owens Corning, 7.000%, 12/01/2036 | 380,176 | ||||||
| 2,965,000 | Owens-Brockway Glass Container, Inc., 5.375%, 1/15/2025, 144A | 3,039,125 | ||||||
| 585,000 | Prologis LP, 2.250%, 6/30/2029, (GBP) | 757,301 | ||||||
| 540,000 | PulteGroup, Inc., 6.000%, 2/15/2035 | 575,100 | ||||||
| 785,000 | PulteGroup, Inc., 6.375%, 5/15/2033 | 868,681 | ||||||
| 220,000 | PulteGroup, Inc., 7.875%, 6/15/2032 | 268,400 | ||||||
| 285,000 | QEP Resources, Inc., 5.250%, 5/01/2023 | 264,343 | ||||||
| 210,000 | QEP Resources, Inc., 5.375%, 10/01/2022 | 200,876 | ||||||
| 295,000 | Quicken Loans, Inc., 5.250%, 1/15/2028, 144A | 304,440 | ||||||
| 120,000 | Quicken Loans, Inc., 5.750%, 5/01/2025, 144A | 123,750 | ||||||
| 95,000 | Qwest Corp., 7.250%, 9/15/2025 | 107,378 | ||||||
| 345,000 | Radian Group, Inc., 4.500%, 10/01/2024 | 355,350 | ||||||
| 195,000 | Radian Group, Inc., 4.875%, 3/15/2027 | 197,438 | ||||||
| 230,000 | Range Resources Corp., 4.875%, 5/15/2025 | 189,750 | ||||||
| 850,000 | Range Resources Corp., 5.000%, 8/15/2022 | 796,875 | ||||||
| 220,000 | Range Resources Corp., 5.000%, 3/15/2023 | 192,500 | ||||||
| 970,000 | Santander Holdings USA, Inc., 2.650%, 4/17/2020(e) | 971,839 | ||||||
| 25,000 | Sealed Air Corp., 4.875%, 12/01/2022, 144A | 26,250 | ||||||
| 640,000 | Sealed Air Corp., 5.500%, 9/15/2025, 144A | 689,600 | ||||||
| 420,000 | ServiceMaster Co. LLC (The), 7.450%, 8/15/2027 | 470,400 | ||||||
| 140,000 | Silgan Holdings, Inc., 3.250%, 3/15/2025, (EUR) | 156,217 | ||||||
| 7,560,000 | SM Energy Co., 6.625%, 1/15/2027 | 6,520,500 | ||||||
See accompanying notes to financial statements.
| 48
Table of Contents
Portfolio of Investments – as of September 30, 2019
Loomis Sayles Global Allocation Fund – (continued)
| Principal Amount (‡) | Description | Value (†) | ||||||
| United States — continued | ||||||||
| $ | 155,000 | SM Energy Co., 6.750%, 9/15/2026 | $ | 135,625 | ||||
| 1,170,000 | Springleaf Finance Corp., 5.625%, 3/15/2023 | 1,246,050 | ||||||
| 860,000 | Springleaf Finance Corp., 6.875%, 3/15/2025 | 947,612 | ||||||
| 2,310,000 | Springleaf Finance Corp., 7.125%, 3/15/2026 | 2,562,541 | ||||||
| 330,000 | Springleaf Finance Corp., 7.750%, 10/01/2021 | 358,875 | ||||||
| 130,000 | Springleaf Finance Corp., 8.250%, 10/01/2023 | 151,450 | ||||||
| 2,349,000 | Sprint Capital Corp., 6.875%, 11/15/2028 | 2,560,880 | ||||||
| 2,240,000 | Sprint Capital Corp., 8.750%, 3/15/2032 | 2,762,928 | ||||||
| 120,000 | Sprint Corp., 7.125%, 6/15/2024 | 129,336 | ||||||
| 2,840,000 | Sprint Corp., 7.875%, 9/15/2023 | 3,119,626 | ||||||
| 1,365,000 | Targa Resources Partners LP/Targa Resources Partners Finance Corp., 6.750%, 3/15/2024 | 1,414,481 | ||||||
| 950,000 | Tenet Healthcare Corp., 5.125%, 5/01/2025 | 963,110 | ||||||
| 100,000 | Tenet Healthcare Corp., 6.750%, 6/15/2023 | 105,018 | ||||||
| 1,695,000 | Tenet Healthcare Corp., 6.875%, 11/15/2031 | 1,542,450 | ||||||
| 820,000 | Textron, Inc., 5.950%, 9/21/2021 | 869,300 | ||||||
| 90,000 | Time Warner Cable LLC, 4.500%, 9/15/2042 | 88,564 | ||||||
| 85,000 | Time Warner Cable LLC, 5.500%, 9/01/2041 | 91,528 | ||||||
| 1,635,000 | Toyota Motor Credit Corp., MTN, 2.650%, 4/12/2022 | 1,663,495 | ||||||
| 1,680,000 | Transcontinental Gas Pipe Line Co. LLC, 7.850%, 2/01/2026 | 2,130,909 | ||||||
| 171,000 | TransDigm, Inc., 6.500%, 7/15/2024 | 176,344 | ||||||
| 185,000 | TransDigm, Inc., 6.500%, 5/15/2025 | 191,938 | ||||||
| 6,665,000 | TRI Pointe Group, Inc., 4.875%, 7/01/2021 | 6,864,950 | ||||||
| 5,000 | TRI Pointe Group, Inc./TRI Pointe Homes, Inc., 5.875%, 6/15/2024 | 5,325 | ||||||
| 4,960,000 | U.S. Treasury Bond, 2.875%, 5/15/2049 | 5,784,794 | ||||||
| 4,380,000 | U.S. Treasury Bond, 3.000%, 8/15/2048 | 5,208,778 | ||||||
| 4,103,717 | U.S. Treasury Inflation Indexed Note, 0.125%, 4/15/2022(e)(i) | 4,060,586 | ||||||
| 4,142,760 | U.S. Treasury Inflation Indexed Note, 0.375%, 7/15/2027(e)(i) | 4,204,862 | ||||||
| 13,065,806 | U.S. Treasury Inflation Indexed Note, 0.625%, 4/15/2023(e)(i) | 13,168,701 | ||||||
| 25,430,000 | U.S. Treasury Note, 1.375%, 5/31/2020 | 25,343,578 | ||||||
| 16,645,000 | U.S. Treasury Note, 1.625%, 8/15/2029 | 16,568,277 | ||||||
| 21,715,000 | U.S. Treasury Note, 1.750%, 11/30/2021(e) | 21,763,350 | ||||||
| 12,245,000 | U.S. Treasury Note, 1.875%, 3/31/2022(e) | 12,328,228 | ||||||
| 15,000,000 | U.S. Treasury Note, 2.500%, 6/30/2020(e) | 15,069,727 | ||||||
| 13,505,000 | U.S. Treasury Note, 2.750%, 2/28/2025(e) | 14,316,355 | ||||||
| 7,360,000 | U.S. Treasury Note, 2.875%, 5/15/2028(e) | 8,078,175 | ||||||
| 444,479 | United Airlines Pass Through Trust, Series2016-2, Class B, 3.650%, 4/07/2027 | 448,888 | ||||||
| 2,940,000 | United Rentals North America, Inc., 5.500%, 7/15/2025 | 3,059,070 | ||||||
| 460,000 | United Rentals North America, Inc., 6.500%, 12/15/2026 | 501,170 | ||||||
| 1,690,000 | United States Steel Corp., 6.650%, 6/01/2037 | 1,297,075 | ||||||
| 86,742 | US Airways Pass Through Trust, Series2012-1A, Class A, 5.900%, 4/01/2026 | 96,561 | ||||||
| 329,675 | US Airways Pass Through Trust, Series2012-2A, Class A, 4.625%, 12/03/2026 | 356,223 | ||||||
| 25,000 | Viacom, Inc., 4.375%, 3/15/2043 | 25,784 | ||||||
| 395,000 | Viacom, Inc., 5.250%, 4/01/2044 | 444,804 | ||||||
See accompanying notes to financial statements.
49 |
Table of Contents
Portfolio of Investments – as of September 30, 2019
Loomis Sayles Global Allocation Fund – (continued)
| Principal Amount (‡) | Description | Value (†) | ||||||
| United States — continued | ||||||||
| $ | 145,000 | Viacom, Inc., 5.850%, 9/01/2043 | $ | 177,848 | ||||
| 145,000 | Vine Oil & Gas LP/Vine Oil & Gas Finance Corp., 9.750%, 4/15/2023, 144A | 67,788 | ||||||
| 1,150,000 | Walmart, Inc., 3.700%, 6/26/2028(e) | 1,274,543 | ||||||
| 60,000 | Weyerhaeuser Co., 6.950%, 10/01/2027 | 76,687 | ||||||
| 315,000 | Weyerhaeuser Co., 7.375%, 3/15/2032 | 441,355 | ||||||
| 525,000 | Whiting Petroleum Corp., 5.750%, 3/15/2021 | 501,391 | ||||||
| 195,000 | Whiting Petroleum Corp., 6.250%, 4/01/2023 | 150,694 | ||||||
| 3,052,000 | Windstream Services LLC/Windstream Finance Corp., 9.000%, 6/30/2025, 144A(j) | 1,648,080 | ||||||
| 65,000 | Windstream Services LLC/Windstream Finance Corp., 10.500%, 6/30/2024, 144A(j) | 35,913 | ||||||
|
| |||||||
| 403,232,564 | ||||||||
|
| |||||||
| TotalNon-Convertible Bonds (Identified Cost $750,181,717) | 765,361,224 | |||||||
|
| |||||||
| Convertible Bonds — 0.4% | ||||||||
| United States — 0.4% | ||||||||
| 1,450,000 | Booking Holdings, Inc., 0.900%, 9/15/2021 | 1,681,299 | ||||||
| 105,000 | CalAmp Corp., 1.625%, 5/15/2020 | 103,471 | ||||||
| 95,000 | Chesapeake Energy Corp., 5.500%, 9/15/2026 | 56,763 | ||||||
| 545,000 | DISH Network Corp., 2.375%, 3/15/2024 | 478,905 | ||||||
| 2,860,000 | DISH Network Corp., 3.375%, 8/15/2026 | 2,620,348 | ||||||
| 290,000 | Evolent Health, Inc., 2.000%, 12/01/2021 | 253,931 | ||||||
| 1,855,000 | iStar, Inc., 3.125%, 9/15/2022 | 1,964,390 | ||||||
| 2,020,000 | Nuance Communications, Inc., 1.000%, 12/15/2035 | 1,912,799 | ||||||
| 240,000 | Nuance Communications, Inc., 1.250%, 4/01/2025 | 237,655 | ||||||
| 10,000 | Nuance Communications, Inc., 1.500%, 11/01/2035 | 9,994 | ||||||
| 1,660,000 | Rovi Corp., 0.500%, 3/01/2020 | 1,633,340 | ||||||
| 380,000 | SM Energy Co., 1.500%, 7/01/2021 | 342,730 | ||||||
| 825,000 | Western Digital Corp., 1.500%, 2/01/2024 | 789,938 | ||||||
|
| |||||||
| Total Convertible Bonds (Identified Cost $11,924,032) | 12,085,563 | |||||||
|
| |||||||
| Municipals — 0.0% | ||||||||
| United States — 0.0% | ||||||||
| 155,000 | State of Illinois, 5.100%, 6/01/2033 | 167,887 | ||||||
| 130,000 | Tobacco Settlement Financing Corp., SeriesA-1, 6.706%, 6/01/2046 | 124,971 | ||||||
|
| |||||||
| Total Municipals (Identified Cost $255,136) | 292,858 | |||||||
|
| |||||||
| Total Bonds and Notes (Identified Cost $762,360,885) | 777,739,645 | |||||||
|
| |||||||
See accompanying notes to financial statements.
| 50
Table of Contents
Portfolio of Investments – as of September 30, 2019
Loomis Sayles Global Allocation Fund – (continued)
| Shares | Description | Value (†) | ||||||
| Preferred Stocks — 0.1% | ||||||||
| United States — 0.1% | ||||||||
| 460 | Chesapeake Energy Corp., 5.000%(c)(d) | $ | 17,480 | |||||
| 40 | Chesapeake Energy Corp., 5.750%(c)(d)(f) | 14,011 | ||||||
| 736 | Chesapeake Energy Corp., 5.750%(c)(d)(f) | 257,806 | ||||||
| 84 | Chesapeake Energy Corp., Series A, 5.750%, 144A(c)(d)(f) | 29,423 | ||||||
| 38,952 | El Paso Energy Capital Trust I, 4.750% | 2,043,811 | ||||||
|
| |||||||
| 2,362,531 | ||||||||
|
| |||||||
| Total Preferred Stocks (Identified Cost $2,285,617) | 2,362,531 | |||||||
|
| |||||||
| Principal Amount (‡) | ||||||||
| Short-Term Investments — 7.3% | ||||||||
| $ | 12,315,000 | Federal Home Loan Bank Discount Notes, 1.950%, 11/15/2019(k) | 12,286,060 | |||||
| 3,707,000 | Ford Motor Credit Co. LLC, 4.331%, 12/02/2019(k) | 3,689,510 | ||||||
| 58,998,220 | Tri-Party Repurchase Agreement with Fixed Income Clearing Corporation, dated 9/30/2019 at 1.100% to be repurchased at $59,000,023 on 10/01/2019 collateralized by $56,470,000 U.S. Treasury Note, 2.625% due 1/31/2026 valued at $60,161,839; $20,000 U.S. Treasury Note, 2.375% due 5/15/2027 valued at $21,261 including accrued interest (Note 2 of Notes to Financial Statements) | 58,998,220 | ||||||
| 29,625,000 | U.S. Treasury Bills, 1.815%, 3/26/2020(k) | 29,366,096 | ||||||
| 12,555,000 | U.S. Treasury Bills, 1.825%, 3/05/2020(k) | 12,458,023 | ||||||
| 10,000,000 | U.S. Treasury Bills,1.830%-1.837%, 2/27/2020(k)(l) | 9,926,018 | ||||||
| 4,205,000 | U.S. Treasury Bills, 1.888%, 12/19/2019(k) | 4,189,080 | ||||||
| 18,530,000 | U.S. Treasury Bills,2.023%-2.385%, 10/24/2019(k)(l) | 18,508,779 | ||||||
| 13,810,000 | U.S. Treasury Bills,2.035%-2.350%, 11/14/2019(k)(l) | 13,779,951 | ||||||
| 26,785,000 | U.S. Treasury Bills, 2.042%, 1/23/2020(k) | 26,632,877 | ||||||
| 35,000,000 | U.S. Treasury Bills, 2.318%, 11/29/2019(k) | 34,896,033 | ||||||
|
| |||||||
| Total Short-Term Investments (Identified Cost $224,645,958) | 224,730,647 | |||||||
|
| |||||||
| Total Investments — 100.2% (Identified Cost $2,528,533,273) | 3,081,332,204 | |||||||
| Other assets less liabilities — (0.2)% | (7,029,011 | ) | ||||||
|
| |||||||
| Net Assets — 100.0% | $ | 3,074,303,193 | ||||||
|
| |||||||
| (‡) | Principal Amount stated in U.S. dollars unless otherwise noted. |
| ||||||
| (†) | See Note 2 of Notes to Financial Statements. |
| ||||||
| (††) | Amount shown represents units. One unit represents a principal amount of 1,000. |
| ||||||
| (†††) | Amount shown represents principal amount including inflation adjustments. |
| ||||||
| (††††) | Amount shown represents units. One unit represents a principal amount of 100. |
| ||||||
| (†††††) | Amount shown represents units. One unit represents a principal amount of 25. |
| ||||||
| (a) | Non-income producing security. |
| ||||||
See accompanying notes to financial statements.
51 |
Table of Contents
Portfolio of Investments – as of September 30, 2019
Loomis Sayles Global Allocation Fund – (continued)
| (b) | Securities subject to restriction on resale. At September 30, 2019, the restricted securities held by the Fund are as follows: |
| ||||||
| Acquisition Date | Acquisition Cost | Value | % of Net Assets | |||||||||||||
| Thryv Holdings, Inc. | 8/12/2016 | $1,194 | $ | 1,919 | Less than 0.1% | |||||||||||
| (c) | Illiquid security. (Unaudited) |
| ||||||
| (d) | Securities classified as fair valued pursuant to the Fund’s pricing policies and procedures. At September 30, 2019, the value of these securities amounted to $695,553 or less than 0.1% of net assets. See Note 2 of Notes to Financial Statements. |
| ||||||
| (e) | Security (or a portion thereof) has been designated to cover the Fund’s obligations under open derivative contracts. |
| ||||||
| (f) | Level 3 security. Value has been determined using significant unobservable inputs. See Note 3 of Notes to Financial Statements. |
| ||||||
| (g) | Perpetual bond with no specified maturity date. |
| ||||||
| (h) | Variable rate security. The interest rate adjusts periodically based on; (i) changes in current interest rates and/or prepayments on underlying pools of assets, if applicable, (ii) reference to a base lending rate plus or minus a margin, and/or (iii) reference to a base lending rate adjusted by a multiplier and/or subject to certain floors or caps. Rate as of September 30, 2019 is disclosed. |
| ||||||
| (i) | Treasury Inflation Protected Security (TIPS). |
| ||||||
| (j) | The issuer is in default with respect to interest and/or principal payments. Income is not being accrued. |
| ||||||
| (k) | Interest rate represents discount rate at time of purchase; not a coupon rate. |
| ||||||
| (l) | The Fund’s investment in U.S. Government/Agency securities is comprised of various lots with differing discount rates. These separate investments, which have the same maturity date, have been aggregated for the purpose of presentation in the Portfolio of Investments. |
| ||||||
| 144A | All or a portion of these securities are exempt from registration under Rule 144A of the Securities Act of 1933. These securities may be resold in transactions exempt from registration, normally to qualified institutional buyers. At September 30, 2019, the value of Rule 144A holdings amounted to $146,571,427 or 4.8% of net assets. |
| ||||||
| ADR | An American Depositary Receipt is a certificate issued by a custodian bank representing the right to receive securities of the foreign issuer described. The values of ADRs may be significantly influenced by trading on exchanges not located in the United States. |
| ||||||
| CPI | Consumer Price Index |
| ||||||
| EMTN | Euro Medium Term Note |
| ||||||
| FNMA | Federal National Mortgage Association |
| ||||||
| GMTN | Global Medium Term Note |
| ||||||
| MTN | Medium Term Note |
| ||||||
| ARS | Argentine Peso |
| ||||||
| AUD | Australian Dollar |
| ||||||
| BRL | Brazilian Real |
| ||||||
| CAD | Canadian Dollar |
| ||||||
| CLP | Chilean Peso |
| ||||||
| COP | Colombian Peso |
| ||||||
| EUR | Euro |
| ||||||
| GBP | British Pound |
| ||||||
See accompanying notes to financial statements.
| 52
Table of Contents
Portfolio of Investments – as of September 30, 2019
Loomis Sayles Global Allocation Fund – (continued)
| JPY | Japanese Yen |
| ||||||
| KRW | South Korean Won |
| ||||||
| MXN | Mexican Peso |
| ||||||
| NOK | Norwegian Krone |
| ||||||
| SEK | Swedish Krona |
| ||||||
| THB | Thai Baht |
| ||||||
| TRY | Turkish Lira |
| ||||||
| ZAR | South African Rand |
| ||||||
At September 30, 2019, the Fund had the following open forward foreign currency contracts:
| Counterparty | Delivery Date | Currency Bought/ Sold (B/S) | Units of Currency | In Exchange for | Notional Value | Unrealized Appreciation (Depreciation) | ||||||||||||||||||||
| Bank of America, N.A. | 12/03/2019 | BRL | S | 18,445,000 | $ | 4,431,764 | $ | 4,422,025 | $ | 9,739 | ||||||||||||||||
| Citibank N.A. | 12/18/2019 | ZAR | S | 33,700,000 | 2,257,094 | 2,203,115 | 53,979 | |||||||||||||||||||
| Credit Suisse International | 12/18/2019 | CAD | S | 123,005,000 | 93,470,621 | 92,963,761 | 506,860 | |||||||||||||||||||
| Credit Suisse International | 12/18/2019 | COP | S | 10,293,255,000 | 3,037,389 | 2,947,174 | 90,215 | |||||||||||||||||||
| Credit Suisse International | 12/18/2019 | GBP | B | 12,290,000 | 15,261,980 | 15,159,161 | (102,819 | ) | ||||||||||||||||||
| Credit Suisse International | 12/18/2019 | JPY | B | 7,830,000,000 | 73,452,020 | 72,811,170 | (640,850 | ) | ||||||||||||||||||
| Goldman Sachs & Co. | 12/18/2019 | MXN | S | 19,000,000 | 954,500 | 951,073 | 3,427 | |||||||||||||||||||
| HSBC Bank USA | 12/18/2019 | AUD | B | 905,000 | 621,102 | 612,323 | (8,779 | ) | ||||||||||||||||||
| Morgan Stanley Capital Services, Inc. | 12/18/2019 | EUR | B | 58,260,000 | 64,668,192 | 63,878,537 | (789,655 | ) | ||||||||||||||||||
| UBS AG | 12/18/2019 | SEK | B | 7,350,000 | 751,034 | 750,588 | (446 | ) | ||||||||||||||||||
| UBS AG | 12/18/2019 | THB | S | 83,000,000 | 2,710,779 | 2,717,801 | (7,022 | ) | ||||||||||||||||||
|
| |||||||||||||||||||||||||
| Total |
| $ | (885,351 | ) | ||||||||||||||||||||||
|
| |||||||||||||||||||||||||
At September 30, 2019, the Fund had the following open forward cross currency contracts:
| Counterparty | Settlement Date | Deliver/Units of Currency | Receive/Units of Currency | Notional Value | Unrealized Appreciation (Depreciation) | |||||||||||||||||||||
| UBS AG | 12/18/2019 | NOK | 14,180,000 | EUR | 1,426,228 | $ | 1,563,772 | $ | 3,218 | |||||||||||||||||
| UBS AG | 12/18/2019 | NOK | 4,200,000 | EUR | 422,437 | 463,176 | 953 | |||||||||||||||||||
|
| |||||||||||||||||||||||||
| Total |
| $ | 4,171 | |||||||||||||||||||||||
|
| |||||||||||||||||||||||||
See accompanying notes to financial statements.
53 |
Table of Contents
Portfolio of Investments – as of September 30, 2019
Loomis Sayles Global Allocation Fund – (continued)
Industry Summary at September 30, 2019
Treasuries | 11.5 | % | ||
Capital Markets | 6.3 | |||
IT Services | 5.6 | |||
Internet & Direct Marketing Retail | 5.5 | |||
Chemicals | 5.2 | |||
Aerospace & Defense | 4.6 | |||
Interactive Media & Services | 4.0 | |||
Software | 4.0 | |||
Health Care Equipment & Supplies | 3.3 | |||
Machinery | 3.3 | |||
Food Products | 3.3 | |||
Industrial Conglomerates | 3.2 | |||
Banks | 2.9 | |||
Insurance | 2.8 | |||
Life Sciences Tools & Services | 2.5 | |||
Hotels, Restaurants & Leisure | 2.4 | |||
Health Care Providers & Services | 2.3 | |||
Real Estate Management & Development | 2.0 | |||
Semiconductors & Semiconductor Equipment | 2.0 | |||
Other Investments, less than 2% each | 16.2 | |||
Short-Term Investments | 7.3 | |||
|
| |||
Total Investments | 100.2 | |||
Other assets less liabilities (including forward foreign currency contracts) | (0.2 | ) | ||
|
| |||
Net Assets | 100.0 | % | ||
|
|
Currency Exposure Summary at September 30, 2019
United States Dollar | 73.9 | % | ||
Canadian Dollar | 5.2 | |||
Euro | 4.3 | |||
British Pound | 4.1 | |||
Swiss Franc | 4.1 | |||
Japanese Yen | 2.4 | |||
Hong Kong Dollar | 2.1 | |||
Other, less than 2% each | 4.1 | |||
|
| |||
Total Investments | 100.2 | |||
Other assets less liabilities (including forward foreign currency contracts) | (0.2 | ) | ||
|
| |||
Net Assets | 100.0 | % | ||
|
|
See accompanying notes to financial statements.
| 54
Table of Contents
Statements of Assets and Liabilities
September 30, 2019
| Core Plus Bond Fund | Global Allocation Fund | |||||||
ASSETS |
| |||||||
Investments at cost | $ | 8,246,848,077 | $ | 2,528,533,273 | ||||
Net unrealized appreciation | 159,269,268 | 552,798,931 | ||||||
|
|
|
| |||||
Investments at value | 8,406,117,345 | 3,081,332,204 | ||||||
Cash | 337,334 | 2,858,416 | ||||||
Due from brokers (Note 2) | 1,656,990 | 580,000 | ||||||
Foreign currency at value (identified cost $0 and $7,087,524, respectively) | — | 6,962,275 | ||||||
Receivable for Fund shares sold | 14,550,102 | 10,352,256 | ||||||
Receivable for securities sold | 171,334,110 | 1,708,729 | ||||||
Receivable for when-issued/delayed delivery securities sold (Note 2) | 552,809,377 | — | ||||||
Collateral received for delayed delivery securities (Note 2) | 1,579,000 | — | ||||||
Dividends and interest receivable | 42,921,274 | 7,758,220 | ||||||
Unrealized appreciation on forward foreign currency contracts (Note 2) | — | 668,391 | ||||||
Tax reclaims receivable | 25,342 | 1,000,497 | ||||||
Prepaid expenses (Note 8) | 507 | 198 | ||||||
|
|
|
| |||||
TOTAL ASSETS | 9,191,331,381 | 3,113,221,186 | ||||||
|
|
|
| |||||
LIABILITIES |
| |||||||
Payable for securities purchased | 196,316,963 | 26,526,282 | ||||||
Payable for when-issued/delayed delivery securities purchased (Note 2) | 1,476,539,134 | — | ||||||
Payable for Fund shares redeemed | 20,758,394 | 7,388,310 | ||||||
Unrealized depreciation on forward foreign currency contracts (Note 2) | — | 1,549,571 | ||||||
Foreign taxes payable (Note 2) | — | 975,496 | ||||||
Due to brokers (Note 2) | 1,579,000 | — | ||||||
Management fees payable (Note 6) | 1,969,669 | 1,873,688 | ||||||
Deferred Trustees’ fees (Note 6) | 501,887 | 235,473 | ||||||
Administrative fees payable (Note 6) | 261,840 | 109,948 | ||||||
Payable to distributor (Note 6d) | 50,450 | 47,578 | ||||||
Other accounts payable and accrued expenses | 378,110 | 211,647 | ||||||
|
|
|
| |||||
TOTAL LIABILITIES | 1,698,355,447 | 38,917,993 | ||||||
|
|
|
| |||||
NET ASSETS | $ | 7,492,975,934 | $ | 3,074,303,193 | ||||
|
|
|
| |||||
NET ASSETS CONSIST OF: |
| |||||||
Paid-in capital | $ | 7,446,768,183 | $ | 2,451,180,913 | ||||
Accumulated earnings | 46,207,751 | 623,122,280 | ||||||
|
|
|
| |||||
NET ASSETS | $ | 7,492,975,934 | $ | 3,074,303,193 | ||||
|
|
|
| |||||
See accompanying notes to financial statements.
55 |
Table of Contents
Statements of Assets and Liabilities (continued)
September 30, 2019
| Core Plus Bond Fund | Global Allocation Fund | |||||||
COMPUTATION OF NET ASSET VALUE AND OFFERING PRICE: |
| |||||||
Class A shares: |
| |||||||
Net assets | $ | 558,291,222 | $ | 453,008,666 | ||||
|
|
|
| |||||
Shares of beneficial interest | 42,128,357 | 19,063,216 | ||||||
|
|
|
| |||||
Net asset value and redemption price per share | $ | 13.25 | $ | 23.76 | ||||
|
|
|
| |||||
Offering price per share(100/[100-maximum sales charge] of net asset value) (Note 1) | $ | 13.84 | $ | 25.21 | ||||
|
|
|
| |||||
Class C shares:(redemption price per share is equal to net asset value less any applicable contingent deferred sales charge) (Note 1) | ||||||||
Net assets | $ | 160,200,697 | $ | 480,478,947 | ||||
|
|
|
| |||||
Shares of beneficial interest | 12,087,026 | 20,505,571 | ||||||
|
|
|
| |||||
Net asset value and offering price per share | $ | 13.25 | $ | 23.43 | ||||
|
|
|
| |||||
Class N shares: |
| |||||||
Net assets | $ | 2,610,698,938 | $ | 202,691,896 | ||||
|
|
|
| |||||
Shares of beneficial interest | 195,292,682 | 8,473,120 | ||||||
|
|
|
| |||||
Net asset value, offering and redemption price per share | $ | 13.37 | $ | 23.92 | ||||
|
|
|
| |||||
Class Y shares: |
| |||||||
Net assets | $ | 4,163,785,077 | $ | 1,938,123,684 | ||||
|
|
|
| |||||
Shares of beneficial interest | 311,647,886 | 81,012,871 | ||||||
|
|
|
| |||||
Net asset value, offering and redemption price per share | $ | 13.36 | $ | 23.92 | ||||
|
|
|
| |||||
See accompanying notes to financial statements.
| 56
Table of Contents
Statements of Operations
For the Year Ended September 30, 2019
| Core Plus Bond Fund | Global Allocation Fund | |||||||
INVESTMENT INCOME |
| |||||||
Interest | $ | 227,424,151 | $ | 31,017,014 | ||||
Dividends | — | 21,858,732 | ||||||
Less net foreign taxes withheld | (35,921 | ) | (587,927 | ) | ||||
|
|
|
| |||||
| 227,388,230 | 52,287,819 | |||||||
|
|
|
| |||||
Expenses |
| |||||||
Management fees (Note 6) | 21,875,964 | 19,622,561 | ||||||
Service and distribution fees (Note 6) | 3,160,713 | 5,334,445 | ||||||
Administrative fees (Note 6) | 2,979,797 | 1,159,251 | ||||||
Trustees’ fees and expenses (Note 6) | 220,619 | 98,802 | ||||||
Transfer agent fees and expenses (Notes 6 and 7) | 4,217,135 | 2,140,452 | ||||||
Audit and tax services fees | 51,243 | 54,686 | ||||||
Custodian fees and expenses | 225,919 | 220,157 | ||||||
Legal fees (Note 8) | 195,183 | 76,706 | ||||||
Registration fees | 307,427 | 151,593 | ||||||
Shareholder reporting expenses | 209,300 | 138,190 | ||||||
Miscellaneous expenses (Note 8) | 179,410 | 116,429 | ||||||
|
|
|
| |||||
Total expenses | 33,622,710 | 29,113,272 | ||||||
Less waiver and/or expense reimbursement (Note 6) | (50,789 | ) | (20,599 | ) | ||||
|
|
|
| |||||
Net expenses | 33,571,921 | 29,092,673 | ||||||
|
|
|
| |||||
Net investment income | 193,816,309 | 23,195,146 | ||||||
|
|
|
| |||||
NET REALIZED AND UNREALIZED GAIN (LOSS) ON INVESTMENTS, FORWARD FOREIGN CURRENCY CONTRACTS AND FOREIGN CURRENCY TRANSACTIONS | ||||||||
Net realized gain (loss) on: |
| |||||||
Investments | 42,326,233 | 65,065,425 | ||||||
Forward foreign currency contracts (Note 2d) | (5,254,691 | ) | (4,522,875 | ) | ||||
Foreign currency transactions (Note 2c) | 31,998 | (383,894 | ) | |||||
Net change in unrealized appreciation (depreciation) on: |
| |||||||
Investments | 342,118,524 | 124,266,321 | ||||||
Forward foreign currency contracts (Note 2d) | — | 773,497 | ||||||
Foreign currency translations (Note 2c) | (74,782 | ) | (82,562 | ) | ||||
|
|
|
| |||||
Net realized and unrealized gain on investments, forward foreign currency contracts and foreign currency transactions | 379,147,282 | 185,115,912 | ||||||
|
|
|
| |||||
NET INCREASE IN NET ASSETS RESULTING FROM OPERATIONS | $ | 572,963,591 | $ | 208,311,058 | ||||
|
|
|
| |||||
See accompanying notes to financial statements.
57 |
Table of Contents
Statements of Changes in Net Assets
| Core Plus Bond Fund | Global Allocation Fund | |||||||||||||||
| Year Ended September 30, 2019 | Year Ended September 30, 2018 | Year Ended September 30, 2019 | Year Ended September 30, 2018 | |||||||||||||
FROM OPERATIONS: |
| |||||||||||||||
Net investment income | $ | 193,816,309 | $ | 190,164,910 | $ | 23,195,146 | $ | 22,346,439 | ||||||||
Net realized gain (loss) on investments, forward foreign currency contracts and foreign currency transactions | 37,103,540 | (23,807,624 | ) | 60,158,656 | 77,022,216 | |||||||||||
Net change in unrealized appreciation (depreciation) on investments, forward foreign currency contracts and foreign currency translations | 342,043,742 | (169,788,966 | ) | 124,957,256 | 73,033,930 | |||||||||||
|
|
|
|
|
|
|
| |||||||||
Net increase (decrease) in net assets resulting from operations | 572,963,591 | (3,431,680 | ) | 208,311,058 | 172,402,585 | |||||||||||
|
|
|
|
|
|
|
| |||||||||
FROM DISTRIBUTIONS TO SHAREHOLDERS: | ||||||||||||||||
Class A | (14,225,845 | ) | (19,704,399 | ) | (15,303,424 | ) | (7,114,532 | ) | ||||||||
Class C | (2,905,066 | ) | (5,062,623 | ) | (13,674,405 | ) | (4,826,992 | ) | ||||||||
Class N | (62,882,079 | ) | (61,623,432 | ) | (3,466,169 | ) | (1,642,868 | ) | ||||||||
Class Y | (103,228,686 | ) | (127,335,569 | ) | (64,089,255 | ) | (26,544,930 | ) | ||||||||
|
|
|
|
|
|
|
| |||||||||
Total distributions | (183,241,676 | ) | (213,726,023 | ) | (96,533,253 | ) | (40,129,322 | ) | ||||||||
|
|
|
|
|
|
|
| |||||||||
NET INCREASE IN NET ASSETS FROM CAPITAL SHARE TRANSACTIONS (NOTE 11) | 683,792,596 | 80,681,752 | 518,843,716 | 525,543,091 | ||||||||||||
|
|
|
|
|
|
|
| |||||||||
Net increase (decrease) in net assets | 1,073,514,511 | (136,475,951 | ) | 630,621,521 | 657,816,354 | |||||||||||
NET ASSETS |
| |||||||||||||||
Beginning of the year | 6,419,461,423 | 6,555,937,374 | 2,443,681,672 | 1,785,865,318 | ||||||||||||
|
|
|
|
|
|
|
| |||||||||
End of the year | $ | 7,492,975,934 | $ | 6,419,461,423 | $ | 3,074,303,193 | $ | 2,443,681,672 | ||||||||
|
|
|
|
|
|
|
| |||||||||
See accompanying notes to financial statements.
| 58
Table of Contents
Financial Highlights
For a share outstanding throughout each period.
| Core Plus Bond Fund—Class A | ||||||||||||||||||||
| Year Ended September 30, 2019 | Year Ended September 30, 2018 | Year Ended September 30, 2017 | Year Ended September 30, 2016 | Year Ended September 30, 2015 | ||||||||||||||||
Net asset value, beginning of the period | $ | 12.53 | $ | 12.96 | $ | 13.06 | $ | 12.34 | $ | 13.18 | ||||||||||
|
|
|
|
|
|
|
|
|
| |||||||||||
INCOME (LOSS) FROM INVESTMENT OPERATIONS: | ||||||||||||||||||||
Net investment income(a) | 0.34 | 0.35 | 0.28 | 0.37 | 0.37 | |||||||||||||||
Net realized and unrealized gain (loss) | 0.70 | (0.38 | ) | (0.04 | ) | 0.71 | (0.77 | ) | ||||||||||||
|
|
|
|
|
|
|
|
|
| |||||||||||
Total from Investment Operations | 1.04 | (0.03 | ) | 0.24 | 1.08 | (0.40 | ) | |||||||||||||
|
|
|
|
|
|
|
|
|
| |||||||||||
LESS DISTRIBUTIONS FROM: | ||||||||||||||||||||
Net investment income | (0.32 | ) | (0.40 | ) | (0.34 | ) | (0.36 | ) | (0.36 | ) | ||||||||||
Net realized capital gains | — | — | — | — | (0.08 | ) | ||||||||||||||
|
|
|
|
|
|
|
|
|
| |||||||||||
Total Distributions | (0.32 | ) | (0.40 | ) | (0.34 | ) | (0.36 | ) | (0.44 | ) | ||||||||||
|
|
|
|
|
|
|
|
|
| |||||||||||
Net asset value, end of the period | $ | 13.25 | $ | 12.53 | $ | 12.96 | $ | 13.06 | $ | 12.34 | ||||||||||
|
|
|
|
|
|
|
|
|
| |||||||||||
Total return(b) | 8.39 | % | (0.27 | )% | 1.86 | % | 8.90 | % | (3.13 | )% | ||||||||||
RATIOS TO AVERAGE NET ASSETS: | ||||||||||||||||||||
Net assets, end of the period (000’s) | $ | 558,291 | $ | 600,762 | $ | 676,892 | $ | 776,566 | $ | 912,662 | ||||||||||
Net expenses | 0.73 | % | 0.73 | % | 0.73 | % | 0.73 | % | 0.74 | % | ||||||||||
Gross expenses | 0.73 | % | 0.73 | % | 0.73 | % | 0.73 | % | 0.74 | % | ||||||||||
Net investment income | 2.63 | % | 2.71 | % | 2.19 | % | 2.91 | % | 2.87 | % | ||||||||||
Portfolio turnover rate | 297 | %(c) | 181 | % | 195 | % | 143 | % | 175 | % | ||||||||||
| (a) | Per share net investment income has been calculated using the average shares outstanding during the period. |
| (b) | A sales charge for Class A shares is not reflected in total return calculations. |
| (c) | The variation in the Fund’s turnover rate from 2018 to 2019 is due to an increase in the volume of U.S. Treasury securities related to certain trading strategies. |
See accompanying notes to financial statements.
59 |
Table of Contents
Financial Highlights (continued)
For a share outstanding throughout each period.
| Core Plus Bond Fund—Class C | ||||||||||||||||||||
| Year Ended September 30, 2019 | Year Ended September 30, 2018 | Year Ended September 30, 2017 | Year Ended September 30, 2016 | Year Ended September 30, 2015 | ||||||||||||||||
Net asset value, beginning of the period | $ | 12.53 | $ | 12.96 | $ | 13.06 | $ | 12.33 | $ | 13.18 | ||||||||||
|
|
|
|
|
|
|
|
|
| |||||||||||
INCOME (LOSS) FROM INVESTMENT OPERATIONS: | ||||||||||||||||||||
Net investment income(a) | 0.24 | 0.25 | 0.19 | 0.27 | 0.27 | |||||||||||||||
Net realized and unrealized gain (loss) | 0.70 | (0.38 | ) | (0.05 | ) | 0.73 | (0.77 | ) | ||||||||||||
|
|
|
|
|
|
|
|
|
| |||||||||||
Total from Investment Operations | 0.94 | (0.13 | ) | 0.14 | 1.00 | (0.50 | ) | |||||||||||||
|
|
|
|
|
|
|
|
|
| |||||||||||
LESS DISTRIBUTIONS FROM: | ||||||||||||||||||||
Net investment income | (0.22 | ) | (0.30 | ) | (0.24 | ) | (0.27 | ) | (0.27 | ) | ||||||||||
Net realized capital gains | — | — | — | — | (0.08 | ) | ||||||||||||||
|
|
|
|
|
|
|
|
|
| |||||||||||
Total Distributions | (0.22 | ) | (0.30 | ) | (0.24 | ) | (0.27 | ) | (0.35 | ) | ||||||||||
|
|
|
|
|
|
|
|
|
| |||||||||||
Net asset value, end of the period | $ | 13.25 | $ | 12.53 | $ | 12.96 | $ | 13.06 | $ | 12.33 | ||||||||||
|
|
|
|
|
|
|
|
|
| |||||||||||
Total return(b) | 7.57 | % | (1.03 | )% | 1.08 | % | 8.17 | % | (3.86 | )% | ||||||||||
RATIOS TO AVERAGE NET ASSETS: | ||||||||||||||||||||
Net assets, end of the period (000’s) | $ | 160,201 | $ | 185,758 | $ | 248,687 | $ | 321,626 | $ | 354,285 | ||||||||||
Net expenses | 1.48 | % | 1.48 | % | 1.48 | % | 1.48 | % | 1.49 | % | ||||||||||
Gross expenses | 1.48 | % | 1.48 | % | 1.48 | % | 1.48 | % | 1.49 | % | ||||||||||
Net investment income | 1.88 | % | 1.96 | % | 1.44 | % | 2.16 | % | 2.11 | % | ||||||||||
Portfolio turnover rate | 297 | %(c) | 181 | % | 195 | % | 143 | % | 175 | % | ||||||||||
| (a) | Per share net investment income has been calculated using the average shares outstanding during the period. |
| (b) | A contingent deferred sales charge for Class C shares is not reflected in total return calculations. |
| (c) | The variation in the Fund’s turnover rate from 2018 to 2019 is due to an increase in the volume of U.S. Treasury securities related to certain trading strategies. |
See accompanying notes to financial statements.
| 60
Table of Contents
Financial Highlights (continued)
For a share outstanding throughout each period.
| Core Plus Bond Fund—Class N | ||||||||||||||||||||
| Year Ended September 30, 2019 | Year Ended September 30, 2018 | Year Ended September 30, 2017 | Year Ended September 30, 2016 | Year Ended September 30, 2015 | ||||||||||||||||
Net asset value, beginning of the period | $ | 12.63 | $ | 13.06 | $ | 13.17 | $ | 12.44 | $ | 13.28 | ||||||||||
|
|
|
|
|
|
|
|
|
| |||||||||||
INCOME (LOSS) FROM INVESTMENT OPERATIONS: | ||||||||||||||||||||
Net investment income(a) | 0.38 | 0.39 | 0.33 | 0.41 | 0.42 | |||||||||||||||
Net realized and unrealized gain (loss) | 0.72 | (0.38 | ) | (0.06 | ) | 0.73 | (0.78 | ) | ||||||||||||
|
|
|
|
|
|
|
|
|
| |||||||||||
Total from Investment Operations | 1.10 | 0.01 | 0.27 | 1.14 | (0.36 | ) | ||||||||||||||
|
|
|
|
|
|
|
|
|
| |||||||||||
LESS DISTRIBUTIONS FROM: | ||||||||||||||||||||
Net investment income | (0.36 | ) | (0.44 | ) | (0.38 | ) | (0.41 | ) | (0.40 | ) | ||||||||||
Net realized capital gains | — | — | — | — | (0.08 | ) | ||||||||||||||
|
|
|
|
|
|
|
|
|
| |||||||||||
Total Distributions | (0.36 | ) | (0.44 | ) | (0.38 | ) | (0.41 | ) | (0.48 | ) | ||||||||||
|
|
|
|
|
|
|
|
|
| |||||||||||
Net asset value, end of the period | $ | 13.37 | $ | 12.63 | $ | 13.06 | $ | 13.17 | $ | 12.44 | ||||||||||
|
|
|
|
|
|
|
|
|
| |||||||||||
Total return | 8.85 | % | 0.07 | % | 2.12 | % | 9.33 | % | (2.82 | )% | ||||||||||
RATIOS TO AVERAGE NET ASSETS: | ||||||||||||||||||||
Net assets, end of the period (000’s) | $ | 2,610,699 | $ | 1,899,190 | $ | 1,784,150 | $ | 2,134,113 | $ | 2,209,110 | ||||||||||
Net expenses | 0.39 | % | 0.39 | % | 0.39 | % | 0.39 | % | 0.40 | % | ||||||||||
Gross expenses | 0.39 | % | 0.39 | % | 0.39 | % | 0.39 | % | 0.40 | % | ||||||||||
Net investment income | 2.96 | % | 3.06 | % | 2.53 | % | 3.25 | % | 3.27 | % | ||||||||||
Portfolio turnover rate | 297 | %(b) | 181 | % | 195 | % | 143 | % | 175 | % | ||||||||||
| (a) | Per share net investment income has been calculated using the average shares outstanding during the period. |
| (b) | The variation in the Fund’s turnover rate from 2018 to 2019 is due to an increase in the volume of U.S. Treasury securities related to certain trading strategies. |
See accompanying notes to financial statements.
61 |
Table of Contents
Financial Highlights (continued)
For a share outstanding throughout each period.
| Core Plus Bond Fund—Class Y | ||||||||||||||||||||
| Year Ended September 30, 2019 | Year Ended September 30, 2018 | Year Ended September 30, 2017 | Year Ended September 30, 2016 | Year Ended September 30, 2015 | ||||||||||||||||
Net asset value, beginning of the period | $ | 12.63 | $ | 13.06 | $ | 13.16 | $ | 12.43 | $ | 13.27 | ||||||||||
|
|
|
|
|
|
|
|
|
| |||||||||||
INCOME (LOSS) FROM INVESTMENT OPERATIONS: | ||||||||||||||||||||
Net investment income(a) | 0.37 | 0.38 | 0.31 | 0.40 | 0.41 | |||||||||||||||
Net realized and unrealized gain (loss) | 0.71 | (0.38 | ) | (0.04 | ) | 0.73 | (0.78 | ) | ||||||||||||
|
|
|
|
|
|
|
|
|
| |||||||||||
Total from Investment Operations | 1.08 | 0.00 | (b) | 0.27 | 1.13 | (0.37 | ) | |||||||||||||
|
|
|
|
|
|
|
|
|
| |||||||||||
LESS DISTRIBUTIONS FROM: | ||||||||||||||||||||
Net investment income | (0.35 | ) | (0.43 | ) | (0.37 | ) | (0.40 | ) | (0.39 | ) | ||||||||||
Net realized capital gains | — | — | — | — | (0.08 | ) | ||||||||||||||
|
|
|
|
|
|
|
|
|
| |||||||||||
Total Distributions | (0.35 | ) | (0.43 | ) | (0.37 | ) | (0.40 | ) | (0.47 | ) | ||||||||||
|
|
|
|
|
|
|
|
|
| |||||||||||
Net asset value, end of the period | $ | 13.36 | $ | 12.63 | $ | 13.06 | $ | 13.16 | $ | 12.43 | ||||||||||
|
|
|
|
|
|
|
|
|
| |||||||||||
Total return | 8.67 | % | (0.02 | )% | 2.10 | % | 9.22 | % | (2.89 | )% | ||||||||||
RATIOS TO AVERAGE NET ASSETS: | ||||||||||||||||||||
Net assets, end of the period (000’s) | $ | 4,163,785 | $ | 3,733,751 | $ | 3,846,208 | $ | 2,953,919 | $ | 3,137,371 | ||||||||||
Net expenses | 0.48 | % | 0.48 | % | 0.48 | % | 0.48 | % | 0.49 | % | ||||||||||
Gross expenses | 0.48 | % | 0.48 | % | 0.48 | % | 0.48 | % | 0.49 | % | ||||||||||
Net investment income | 2.87 | % | 2.97 | % | 2.43 | % | 3.15 | % | 3.14 | % | ||||||||||
Portfolio turnover rate | 297 | %(c) | 181 | % | 195 | % | 143 | % | 175 | % | ||||||||||
| (a) | Per share net investment income has been calculated using the average shares outstanding during the period. |
| (b) | Amount rounds to less than $0.01 per share. |
| (c) | The variation in the Fund’s turnover rate from 2018 to 2019 is due to an increase in the volume of U.S. Treasury securities related to certain trading strategies. |
See accompanying notes to financial statements.
| 62
Table of Contents
Financial Highlights (continued)
For a share outstanding throughout each period.
| Global Allocation Fund—Class A | ||||||||||||||||||||
| Year Ended September 30, 2019 | Year Ended September 30, 2018 | Year Ended September 30, 2017 | Year Ended September 30, 2016 | Year Ended September 30, 2015 | ||||||||||||||||
Net asset value, beginning of the period | $ | 23.10 | $ | 21.60 | $ | 19.17 | $ | 18.45 | $ | 19.77 | ||||||||||
|
|
|
|
|
|
|
|
|
| |||||||||||
INCOME (LOSS) FROM INVESTMENT OPERATIONS: | ||||||||||||||||||||
Net investment income(a) | 0.19 | 0.23 | 0.31 | 0.24 | 0.21 | |||||||||||||||
Net realized and unrealized gain (loss) | 1.38 | 1.75 | 2.36 | 1.47 | (0.37 | ) | ||||||||||||||
|
|
|
|
|
|
|
|
|
| |||||||||||
Total from Investment Operations | 1.57 | 1.98 | 2.67 | 1.71 | (0.16 | ) | ||||||||||||||
|
|
|
|
|
|
|
|
|
| |||||||||||
LESS DISTRIBUTIONS FROM: | ||||||||||||||||||||
Net investment income | (0.16 | ) | (0.19 | ) | (0.24 | ) | (0.15 | ) | (0.20 | ) | ||||||||||
Net realized capital gains | (0.75 | ) | (0.29 | ) | — | (0.84 | ) | (0.96 | ) | |||||||||||
|
|
|
|
|
|
|
|
|
| |||||||||||
Total Distributions | (0.91 | ) | (0.48 | ) | (0.24 | ) | (0.99 | ) | (1.16 | ) | ||||||||||
|
|
|
|
|
|
|
|
|
| |||||||||||
Net asset value, end of the period | $ | 23.76 | $ | 23.10 | $ | 21.60 | $ | 19.17 | $ | 18.45 | ||||||||||
|
|
|
|
|
|
|
|
|
| |||||||||||
Total return(b) | 7.66 | % | 9.26 | % | 14.10 | % | 9.64 | % | (0.91 | )% | ||||||||||
RATIOS TO AVERAGE NET ASSETS: | ||||||||||||||||||||
Net assets, end of the period (000’s) | $ | 453,009 | $ | 401,036 | $ | 305,275 | $ | 280,263 | $ | 246,371 | ||||||||||
Net expenses | 1.16 | % | 1.16 | % | 1.18 | % | 1.17 | % | 1.18 | % | ||||||||||
Gross expenses | 1.16 | % | 1.16 | % | 1.18 | % | 1.17 | % | 1.18 | % | ||||||||||
Net investment income | 0.83 | % | 1.03 | % | 1.57 | % | 1.32 | % | 1.06 | % | ||||||||||
Portfolio turnover rate | 27 | % | 22 | % | 35 | % | 43 | % | 48 | % | ||||||||||
| (a) | Per share net investment income has been calculated using the average shares outstanding during the period. |
| (b) | A sales charge for Class A shares is not reflected in total return calculations. |
See accompanying notes to financial statements.
63 |
Table of Contents
Financial Highlights (continued)
For a share outstanding throughout each period.
| Global Allocation Fund—Class C | ||||||||||||||||||||
| Year Ended September 30, 2019 | Year Ended September 30, 2018 | Year Ended September 30, 2017 | Year Ended September 30, 2016 | Year Ended September 30, 2015 | ||||||||||||||||
Net asset value, beginning of the period | $ | 22.78 | $ | 21.29 | $ | 18.89 | $ | 18.19 | $ | 19.51 | ||||||||||
|
|
|
|
|
|
|
|
|
| |||||||||||
INCOME (LOSS) FROM INVESTMENT OPERATIONS: | ||||||||||||||||||||
Net investment income(a) | 0.02 | 0.06 | 0.16 | 0.10 | 0.06 | |||||||||||||||
Net realized and unrealized gain (loss) | 1.38 | 1.73 | 2.33 | 1.46 | (0.36 | ) | ||||||||||||||
|
|
|
|
|
|
|
|
|
| |||||||||||
Total from Investment Operations | 1.40 | 1.79 | 2.49 | 1.56 | (0.30 | ) | ||||||||||||||
|
|
|
|
|
|
|
|
|
| |||||||||||
LESS DISTRIBUTIONS FROM: | ||||||||||||||||||||
Net investment income | (0.00 | )(b) | (0.01 | ) | (0.09 | ) | (0.02 | ) | (0.06 | ) | ||||||||||
Net realized capital gains | (0.75 | ) | (0.29 | ) | — | (0.84 | ) | (0.96 | ) | |||||||||||
|
|
|
|
|
|
|
|
|
| |||||||||||
Total Distributions | (0.75 | ) | (0.30 | ) | (0.09 | ) | (0.86 | ) | (1.02 | ) | ||||||||||
|
|
|
|
|
|
|
|
|
| |||||||||||
Net asset value, end of the period | $ | 23.43 | $ | 22.78 | $ | 21.29 | $ | 18.89 | $ | 18.19 | ||||||||||
|
|
|
|
|
|
|
|
|
| |||||||||||
Total return(c) | 6.85 | % | 8.46 | % | 13.22 | % | 8.88 | % | (1.66 | )% | ||||||||||
RATIOS TO AVERAGE NET ASSETS: | ||||||||||||||||||||
Net assets, end of the period (000’s) | $ | 480,479 | $ | 412,610 | $ | 354,017 | $ | 423,350 | $ | 393,416 | ||||||||||
Net expenses | 1.91 | % | 1.91 | % | 1.93 | % | 1.92 | % | 1.93 | % | ||||||||||
Gross expenses | 1.91 | % | 1.91 | % | 1.93 | % | 1.92 | % | 1.93 | % | ||||||||||
Net investment income | 0.08 | % | 0.29 | % | 0.84 | % | 0.57 | % | 0.31 | % | ||||||||||
Portfolio turnover rate | 27 | % | 22 | % | 35 | % | 43 | % | 48 | % | ||||||||||
| (a) | Per share net investment income has been calculated using the average shares outstanding during the period. |
| (b) | Amount rounds to less than $0.01 per share. |
| (c) | A contingent deferred sales charge for Class C shares is not reflected in total return calculations. |
See accompanying notes to financial statements.
| 64
Table of Contents
Financial Highlights (continued)
For a share outstanding throughout each period.
| Global Allocation Fund—Class N | ||||||||||||
| Year Ended September 30, 2019 | Year Ended September 30, 2018 | Period Ended September 30, 2017* | ||||||||||
Net asset value, beginning of the period | $ | 23.25 | $ | 21.73 | $ | 19.20 | ||||||
|
|
|
|
|
| |||||||
INCOME (LOSS) FROM INVESTMENT OPERATIONS: | ||||||||||||
Net investment income(a) | 0.27 | 0.31 | 0.20 | |||||||||
Net realized and unrealized gain (loss) | 1.38 | 1.75 | 2.33 | |||||||||
|
|
|
|
|
| |||||||
Total from Investment Operations | 1.65 | 2.06 | 2.53 | |||||||||
|
|
|
|
|
| |||||||
LESS DISTRIBUTIONS FROM: | ||||||||||||
Net investment income | (0.23 | ) | (0.25 | ) | — | |||||||
Net realized capital gains | (0.75 | ) | (0.29 | ) | — | |||||||
|
|
|
|
|
| |||||||
Total Distributions | (0.98 | ) | (0.54 | ) | — | |||||||
|
|
|
|
|
| |||||||
Net asset value, end of the period | $ | 23.92 | $ | 23.25 | $ | 21.73 | ||||||
|
|
|
|
|
| |||||||
Total return | 8.04 | % | 9.60 | % | 13.18 | %(b) | ||||||
RATIOS TO AVERAGE NET ASSETS: | ||||||||||||
Net assets, end of the period (000’s) | $ | 202,692 | $ | 80,346 | $ | 59,512 | ||||||
Net expenses | 0.82 | % | 0.83 | % | 0.87 | %(c) | ||||||
Gross expenses | 0.82 | % | 0.83 | % | 0.87 | %(c) | ||||||
Net investment income | 1.20 | % | 1.36 | % | 1.48 | %(c) | ||||||
Portfolio turnover rate | 27 | % | 22 | % | 35 | %(d) | ||||||
| * | From commencement of Class operations on February 1, 2017 through September 30, 2017. |
| (a) | Per share net investment income has been calculated using the average shares outstanding during the period. |
| (b) | Periods less than one year are not annualized. |
| (c) | Computed on an annualized basis for periods less than one year. |
| (d) | Represents the Fund’s portfolio turnover rate for the year ended September 30, 2017. |
See accompanying notes to financial statements.
65 |
Table of Contents
Financial Highlights (continued)
For a share outstanding throughout each period.
| Global Allocation Fund—Class Y | ||||||||||||||||||||
| Year Ended September 30, 2019 | Year Ended September 30, 2018 | Year Ended September 30, 2017 | Year Ended September 30, 2016 | Year Ended September 30, 2015 | ||||||||||||||||
Net asset value, beginning of the period | $ | 23.25 | $ | 21.74 | $ | 19.29 | $ | 18.55 | $ | 19.89 | ||||||||||
|
|
|
|
|
|
|
|
|
| |||||||||||
INCOME (LOSS) FROM INVESTMENT OPERATIONS: | ||||||||||||||||||||
Net investment income(a) | 0.24 | 0.29 | 0.36 | 0.29 | 0.25 | |||||||||||||||
Net realized and unrealized gain (loss) | 1.40 | 1.75 | 2.37 | 1.49 | (0.37 | ) | ||||||||||||||
|
|
|
|
|
|
|
|
|
| |||||||||||
Total from Investment Operations | 1.64 | 2.04 | 2.73 | 1.78 | (0.12 | ) | ||||||||||||||
|
|
|
|
|
|
|
|
|
| |||||||||||
LESS DISTRIBUTIONS FROM: | ||||||||||||||||||||
Net investment income | (0.22 | ) | (0.24 | ) | (0.28 | ) | (0.20 | ) | (0.26 | ) | ||||||||||
Net realized capital gains | (0.75 | ) | (0.29 | ) | — | (0.84 | ) | (0.96 | ) | |||||||||||
|
|
|
|
|
|
|
|
|
| |||||||||||
Total Distributions | (0.97 | ) | (0.53 | ) | (0.28 | ) | (1.04 | ) | (1.22 | ) | ||||||||||
|
|
|
|
|
|
|
|
|
| |||||||||||
Net asset value, end of the period | $ | 23.92 | $ | 23.25 | $ | 21.74 | $ | 19.29 | $ | 18.55 | ||||||||||
|
|
|
|
|
|
|
|
|
| |||||||||||
Total return | 7.95 | % | 9.49 | % | 14.42 | % | 9.97 | % | (0.72 | )% | ||||||||||
RATIOS TO AVERAGE NET ASSETS: | ||||||||||||||||||||
Net assets, end of the period (000’s) | $ | 1,938,124 | $ | 1,549,689 | $ | 1,067,062 | $ | 835,391 | $ | 604,609 | ||||||||||
Net expenses | 0.91 | % | 0.91 | % | 0.93 | % | 0.92 | % | 0.93 | % | ||||||||||
Gross expenses | 0.91 | % | 0.91 | % | 0.93 | % | 0.92 | % | 0.93 | % | ||||||||||
Net investment income | 1.08 | % | 1.29 | % | 1.79 | % | 1.58 | % | 1.30 | % | ||||||||||
Portfolio turnover rate | 27 | % | 22 | % | 35 | % | 43 | % | 48 | % | ||||||||||
| (a) | Per share net investment income has been calculated using the average shares outstanding during the period. |
See accompanying notes to financial statements.
| 66
Table of Contents
September 30, 2019
1. Organization. Natixis Funds Trust I and Loomis Sayles Funds II (the “Trusts” and each a “Trust”) are each organized as a Massachusetts business trust. Each Trust is registered under the Investment Company Act of 1940, as amended (the “1940 Act”) as anopen-end management investment company. Each Declaration of Trust permits the Board of Trustees to authorize the issuance of an unlimited number of shares of the Trust in multiple series. The financial statements for certain funds of the Trusts are presented in separate reports. The following funds (individually, a “Fund” and collectively, the “Funds”) are included in this report:
Natixis Funds Trust I:
Loomis Sayles Core Plus Bond Fund (the “Core Plus Bond Fund”)
Loomis Sayles Funds II:
Loomis Sayles Global Allocation Fund (the “Global Allocation Fund”)
Each Fund is a diversified investment company.
Each Fund offers Class A, Class C, Class N and Class Y shares.
Class A shares are sold with a maximumfront-end sales charge of 4.25% for Core Plus Bond Fund and 5.75% for Global Allocation Fund. Class C shares do not pay afront-end sales charge, pay higher Rule12b-1 fees than Class A shares for ten years (at which point they automatically convert to Class A shares) and may be subject to a contingent deferred sales charge (“CDSC”) of 1.00% if those shares are redeemed within one year of acquisition, except for reinvested distributions. Class N and Class Y shares do not pay afront-end sales charge, a CDSC or Rule12b-1 fees. Class N shares are offered with an initial minimum investment of $1,000,000. Class Y shares are offered with an initial minimum investment of $100,000. Certain categories of investors are exempted from the minimum investment amounts for Class N and Class Y as outlined in the relevant Funds’ prospectus.
Most expenses can be directly attributed to a Fund. Expenses which cannot be directly attributed to a Fund are generally apportioned based on the relative net assets of each of the funds in Natixis Funds Trust I, Natixis Funds Trust II, Natixis Funds Trust IV and Gateway Trust (“Natixis Funds Trusts”), Loomis Sayles Funds I and Loomis Sayles Funds II (“Loomis Sayles Funds Trusts”), and Natixis ETF Trust. Expenses of a Fund are bornepro rata by the holders of each class of shares, except that each class bears expenses unique to that class (such as the Rule12b-1 fees applicable to Class A and Class C), and transfer agent fees are borne collectively for Class A, Class C and Class Y, and individually for Class N. In addition, each class votes as a class only with respect to its own Rule12b-1 Plan. Shares of each class would receive theirpro rata share of the net assets of the Fund if the Fund were liquidated. The Trustees approve separate distributions from net investment income on each class of shares.
67 |
Table of Contents
Notes to Financial Statements (continued)
September 30, 2019
2. Significant Accounting Policies. The following is a summary of significant accounting policies consistently followed by each Fund in the preparation of its financial statements. The Funds’ financial statements follow the accounting and reporting guidelines provided for investment companies and are prepared in accordance with accounting principles generally accepted in the United States of America which require the use of management estimates that affect the reported amounts and disclosures in the financial statements. Actual results could differ from those estimates. Management has evaluated the events and transactions subsequent to year-end through the date the financial statements were issued and has determined that there were no material events that would require disclosure in the Funds’ financial statements.
a. Valuation. Fund securities and other investments are valued at market value based on market quotations obtained or determined by independent pricing services recommended by the adviser and approved by the Board of Trustees. Fund securities and other investments for which market quotations are not readily available are valued at fair value as determined in good faith by the adviser pursuant to procedures approved by the Board of Trustees, as described below. Market value is determined as follows:
Debt securities and unlisted preferred equity securities are valued based on evaluated bids furnished to the Funds by an independent pricing service or bid prices obtained from broker-dealers. Senior loans are valued at bid prices supplied by an independent pricing service, if available. Listed equity securities (including shares ofclosed-end investment companies and exchange-traded funds) are valued at the last sale price quoted on the exchange where they are traded most extensively or, if there is no reported sale during the day, the closing bid quotation as reported by an independent pricing service. Securities traded on the NASDAQ Global Select Market, NASDAQ Global Market and NASDAQ Capital Market are valued at the NASDAQ Official Closing Price (“NOCP”), or if lacking an NOCP, at the most recent bid quotations on the applicable NASDAQ Market. Unlisted equity securities (except unlisted preferred equity securities) are valued at the last sale price quoted in the market where they are traded most extensively or, if there is no reported sale during the day, the closing bid quotation as reported by an independent pricing service. If there is no last sale price or closing bid quotation available, unlisted equity securities will be valued using evaluated bids furnished by an independent pricing service, if available. In some foreign markets, an official close price and a last sale price may be available from the foreign exchange or market. In those cases, the official close price is used. Broker-dealer bid prices may be used to value debt and unlisted equity securities and senior loans where an independent pricing service is unable to price a security or where an independent pricing service does not provide a reliable price for the security. Forward foreign currency contracts are valued utilizing interpolated rates determined based on information provided by an independent pricing service.
| 68
Table of Contents
Notes to Financial Statements (continued)
September 30, 2019
Fund securities and other investments for which market quotations are not readily available are valued at fair value as determined in good faith by the adviser pursuant to procedures approved by the Board of Trustees. The Funds may also value securities and other investments at fair value in other circumstances such as when extraordinary events occur after the close of a foreign market but prior to the close of the New York Stock Exchange. This may include situations relating to a single issuer (such as a declaration of bankruptcy or a delisting of the issuer’s security from the primary market on which it has traded) as well as events affecting the securities markets in general (such as market disruptions or closings and significant fluctuations in U.S. and/or foreign markets). When fair valuing its securities or other investments, the Funds may, among other things, use modeling tools or other processes that may take into account factors such as securities or other market activity and/or significant events that occur after the close of the foreign market and before the time the Fund’s net asset value (“NAV”) is calculated. Fair value pricing may require subjective determinations about the value of a security, and fair values used to determine a Fund’s NAV may differ from quoted or published prices, or from prices that are used by others, for the same securities. In addition, the use of fair value pricing may not always result in adjustments to the prices of securities held by a Fund.
Illiquid securities for which market quotations are readily available and have been evaluated by the adviser are considered and classified as fair valued securities pursuant to the Funds’ pricing policies and procedures.
As of September 30, 2019, securities held by the Funds were fair valued as follows:
Fund | Equity | Percentage | Securities | Percentage | Securities | Percentage | ||||||||||||||||||
Core Plus Bond Fund | $ | — | — | $ | 8,254,031 | 0.1% | $ | 42,068 | Less than 0.1% | |||||||||||||||
Global Allocation Fund | 522,507,079 | 17.0 | % | 695,553 | Less than 0.1% | — | — | |||||||||||||||||
| 1 | Certain foreign equity securities were fair valued pursuant to procedures approved by the Board of Trustees as events occurring after the close of the foreign market were believed to materially affect the value of those securities. |
b. Investment Transactions and Related Investment Income. Investment transactions are accounted for on a trade date plus one day basis for daily NAV calculation. However, for financial reporting purposes, investment transactions are reported on trade date. Dividend income (including income reinvested) and foreign withholding tax, if applicable, is recorded on theex-dividend date, or in the case of certain foreign securities, as soon as a Fund is notified, and interest income is recorded on an accrual
69 |
Table of Contents
Notes to Financial Statements (continued)
September 30, 2019
basis. Interest income is increased by the accretion of discount and decreased by the amortization of premium, if applicable. Periodic principal adjustments for inflation-protected securities are recorded to interest income. Negative principal adjustments (in the event of deflation) are recorded as reductions of interest income to the extent of interest income earned, not to exceed the amount of positive principal adjustments on a cumulative basis. In determining net gain or loss on securities sold, the cost of securities has been determined on an identified cost basis. Investment income,non-class specific expenses and realized and unrealized gains and losses are allocated on apro rata basis to each class based on the relative net assets of each class to the total net assets of the Fund.
c. Foreign Currency Translation. The books and records of the Funds are maintained in U.S. dollars. The values of securities, currencies and other assets and liabilities denominated in currencies other than U.S. dollars, if any, are translated into U.S. dollars based upon foreign exchange rates prevailing at the end of the period. Purchases and sales of investment securities, income and expenses are translated into U.S. dollars on the respective dates of such transactions.
Net realized foreign exchange gains or losses arise from sales of foreign currency, changes in exchange rates between the trade and settlement dates on securities transactions and the difference between the amounts of dividends, interest and foreign withholding taxes recorded on the Funds’ books and the U.S. dollar equivalent of the amounts actually received or paid. Net unrealized foreign exchange gains or losses arise from changes in the value of assets and liabilities, other than investment securities, as of the end of the fiscal period, resulting from changes in exchange rates. Net realized foreign exchange gains or losses and the net change in unrealized foreign exchange gains or losses are disclosed in the Statements of Operations. For federal income tax purposes, net realized foreign exchange gains or losses are characterized as ordinary income and may, if the Funds have net losses, reduce the amount of income available to be distributed by the Funds.
The values of investment securities are presented at the foreign exchange rates prevailing at the end of the period for financial reporting purposes. Net realized and unrealized gains or losses on investments reported in the Statements of Operations reflect gains or losses resulting from changes in exchange rates and fluctuations which arise due to changes in market prices of investment securities. For federal income tax purposes, a portion of the net realized gain or loss on investments arising from changes in exchange rates, which is reflected in the Statements of Operations, may be characterized as ordinary income and may, if the Funds have net losses, reduce the amount of income available to be distributed by the Funds.
| 70
Table of Contents
Notes to Financial Statements (continued)
September 30, 2019
For the year ended September 30, 2019, the amount of income available to be distributed has been reduced by the following amounts as a result of losses arising from changes in exchange rates:
Core Plus Bond Fund | $ | 27,950,351 | ||
Global Allocation Fund | 8,144,545 |
The Funds may use foreign currency exchange contracts to facilitate transactions in foreign-denominated investments. Losses may arise from changes in the value of the foreign currency or if the counterparties do not perform under the contracts’ terms.
d. Forward Foreign Currency Contracts. The Funds may enter into forward foreign currency contracts, including forward foreign cross currency contracts to acquire exposure to foreign currencies or to hedge the Funds’ investments against currency fluctuation. A contract can also be used to offset a previous contract. These contracts involve market risk in excess of the unrealized appreciation (depreciation) reflected in the Funds’ Statements of Assets and Liabilities. The U.S. dollar value of the currencies a Fund has committed to buy or sell represents the aggregate exposure to each currency the Fund has acquired or hedged through currency contracts outstanding at period end. Gains or losses are recorded for financial statement purposes as unrealized until settlement date. Contracts are tradedover-the-counter directly with a counterparty. Risks may arise upon entering into these contracts from the potential inability of counterparties to meet the terms of their contracts and from unanticipated movements in the value of a foreign currency relative to the U.S. dollar. Certain contracts may require the movement of cash and/or securities as collateral for the Funds’ or counterparty’s net obligations under the contracts.
e. When-Issued and Delayed Delivery Transactions. The Funds may enter into when-issued or delayed delivery transactions. When-issued refers to transactions made conditionally because a security, although authorized, has not been issued. Delayed delivery refers to transactions for which delivery or payment will occur at a later date, beyond the normal settlement period. The price of when-issued and delayed delivery securities and the date when the securities will be delivered and paid for are fixed at the time the transaction is negotiated. The security and the obligation to pay for it are recorded by the Funds at the time the commitment is entered into. The value of the security may vary with market fluctuations during the time before the Funds take delivery of the security. No interest accrues to the Funds until the transaction settles.
Delayed delivery transactions include those designated as To Be Announced (“TBAs”) in the Portfolios of Investments. For TBAs, the actual security that will be delivered to fulfill the transaction is not designated at the time of the trade. The security is “to be announced” 48 hours prior to the established trade settlement date. Certain transactions require the Funds or counterparty to post cash and/or securities as collateral for the netmark-to-market exposure to the other party. The Funds cover their
71 |
Table of Contents
Notes to Financial Statements (continued)
September 30, 2019
net obligations under outstanding delayed delivery commitments by segregating or earmarking cash or securities at the custodian.
Purchases of when-issued or delayed delivery securities may have a similar effect on the Funds’ NAV as if the Funds’ had created a degree of leverage in the portfolio. Risks may arise upon entering into such transactions from the potential inability of counterparties to meet their obligations under the transactions. Additionally, losses may arise due to changes in the value of the underlying securities.
f. Federal and Foreign Income Taxes. The Trusts treat each Fund as a separate entity for federal income tax purposes. Each Fund intends to meet the requirements of the Internal Revenue Code of 1986, as amended, applicable to regulated investment companies, and to distribute to its shareholders substantially all of its net investment income and any net realized capital gains at least annually. Management has performed an analysis of each Fund’s tax positions for the open tax years as of September 30, 2019 and has concluded that no provisions for income tax are required. The Funds’ federal tax returns for the prior three fiscal years remain subject to examination by the Internal Revenue Service. Management is not aware of any events that are reasonably possible to occur in the next twelve months that would result in the amounts of any unrecognized tax benefits significantly increasing or decreasing for the Funds. However, management’s conclusions regarding tax positions taken may be subject to review and adjustment at a later date based on factors including, but not limited to, new tax laws and accounting regulations and interpretations thereof.
A Fund may be subject to foreign withholding taxes on investment income and taxes on capital gains on investments that are accrued and paid based upon the Fund’s understanding of the tax rules and regulations that exist in the countries in which the Fund invests. Foreign withholding taxes on dividend and interest income are reflected on the Statements of Operations as a reduction of investment income, net of amounts eligible to be reclaimed. Dividends and interest receivable on the Statements of Assets and Liabilities are net of foreign withholding taxes. Foreign withholding taxes where reclaims have been or will be filed are reflected on the Statements of Assets and Liabilities as tax reclaims receivable. Capital gains taxes paid are included in net realized gain (loss) on investments in the Statements of Operations. Accrued but unpaid capital gains taxes are reflected as foreign taxes payable on the Statements of Assets and Liabilities, if applicable, and reduce unrealized gains on investments. In the event that realized gains on investments are subsequently offset by realized losses, taxes paid on realized gains may be returned to a Fund. Such amounts, if applicable, are reflected as foreign tax rebates receivable on the Statements of Assets and Liabilities and are recorded as a realized gain when received.
g. Dividends and Distributions to Shareholders. Dividends and distributions are recorded on theex-dividend date. The timing and characterization of certain income and capital gain distributions are determined in accordance with federal tax
| 72
Table of Contents
Notes to Financial Statements (continued)
September 30, 2019
regulations, which may differ from accounting principles generally accepted in the United States of America. Permanent differences are primarily due to differing treatments for book and tax purposes of items such as foreign currency gains and losses, paydown gains and losses, convertible bonds, treasury inflation protected bonds, defaulted and/ornon-income producing securities, capital gains taxes, deferred Trustees’ fees, distributionre-designations and premium amortization. Permanent book and tax basis differences relating to shareholder distributions will result in reclassifications to capital accounts reported on the Statements of Assets and Liabilities. Temporary differences between book and tax distributable earnings are primarily due to deferred Trustees’ fees, defaulted and/ornon-income producing securities, forward foreign currency contractmark-to-market, wash sales, premium amortization, corporate actions, treasury inflation protected bonds, contingent payment debt instruments, trust preferred securities and convertible bonds. Amounts of income and capital gain available to be distributed on a tax basis are determined annually, and at other times during the Funds’ fiscal year as may be necessary to avoid knowingly declaring and paying a return of capital distribution. Distributions from net investment income and net realized short-term capital gains are considered to be distributed from ordinary income for tax purposes.
The tax characterization of distributions is determined on an annual basis. The tax character of distributions paid to shareholders during the years ended September 30, 2019 and 2018 were as follows:
2019 Distributions Paid From: | 2018 Distributions Paid From: | |||||||||||||||||||||||
Fund | Ordinary | Long-Term | Total | Ordinary | Long-Term | Total | ||||||||||||||||||
Core Plus Bond Fund | $ | 183,241,676 | $ | — | $ | 183,241,676 | $ | 213,726,023 | $ | — | $ | 213,726,023 | ||||||||||||
Global Allocation Fund | 18,627,380 | 77,905,873 | 96,533,253 | 15,533,777 | 24,595,545 | 40,129,322 | ||||||||||||||||||
Distributions paid to shareholders from net investment income and net realized capital gains, based on accounting principles generally accepted in the United States of America, are consolidated and reported on the Statements of Changes in Net Assets as Distributions to Shareholders. Distributions paid to shareholders from net investment income and net realized capital gains expressed inper-share amounts, based on accounting principles generally accepted in the United States of America, are separately stated and reported within the Financial Highlights.
73 |
Table of Contents
Notes to Financial Statements (continued)
September 30, 2019
As of September 30, 2019, the components of distributable earnings on a tax basis were as follows:
Core Plus | Global | |||||||
Undistributed ordinary income | $ | 2,315,215 | $ | 12,969,159 | ||||
Undistributed long-term capital gains | — | 62,638,200 | ||||||
|
|
|
| |||||
Total undistributed earnings | 2,315,215 | 75,607,359 | ||||||
|
|
|
| |||||
Capital loss carryforward: |
| |||||||
Long-term: |
| |||||||
No expiration date | (74,174,601 | ) | — | |||||
|
|
|
| |||||
Unrealized appreciation | 118,569,024 | 547,793,405 | ||||||
|
|
|
| |||||
Total accumulated earnings | $ | 46,709,638 | $ | 623,400,764 | ||||
|
|
|
| |||||
Capital loss carryforward utilized in the current year | $ | 45,035,017 | $ | — | ||||
|
|
|
| |||||
|
|
|
| |||||
As of September 30, 2019, unrealized appreciation (depreciation) as a component of distributable earnings were as follows:
Core Plus | Global | |||||||
Unrealized appreciation (depreciation) | ||||||||
Investments | $ | 149,617,761 | $ | 554,877,433 | ||||
Foreign currency translations | (31,048,737 | ) | (7,084,028 | ) | ||||
|
|
|
| |||||
Total unrealized appreciation | $ | 118,569,024 | $ | 547,793,405 | ||||
|
|
|
| |||||
As of September 30, 2019, the tax cost of investments (including derivatives, if applicable) and unrealized appreciation (depreciation) on a federal tax basis were as follows:
Core Plus | Global | |||||||
Federal tax cost | $ | 8,287,525,201 | $ | 2,532,365,351 | ||||
|
|
|
| |||||
Gross tax appreciation | $ | 239,373,779 | $ | 570,888,277 | ||||
Gross tax depreciation | (120,781,635 | ) | (21,932,297 | ) | ||||
|
|
|
| |||||
Net tax appreciation | $ | 118,592,144 | $ | 548,955,980 | ||||
|
|
|
| |||||
The difference between these amounts and those reported in the components of distributable earnings are primarily attributable to capital gains taxes and foreign exchange gains or losses.
| 74
Table of Contents
Notes to Financial Statements (continued)
September 30, 2019
h. Senior Loans. Each Fund may invest in senior loans to corporate, governmental or other borrowers. Senior loans, which include both secured and unsecured loans made by banks and other financial institutions to corporate customers, typically hold the most senior position in a borrower’s capital structure, may be secured by the borrower’s assets and have interest rates that reset frequently. Senior Loans can include term loans, revolving credit facility loans and second lien loans. A senior loan is often administered by a bank or other financial institution that acts as agent for all holders. The agent administers the terms of the senior loan, as specified in the loan agreement. Large loans may be shared or syndicated among several lenders. A Fund may enter into the primary syndicate for a loan or it may also purchase all or a portion of loans from other lenders (sometimes referred to as loan assignments), in either case becoming a direct lender. Senior loans outstanding at the end of the period, if any, are listed in each applicable Fund’s Portfolio of Investments.
i. Repurchase Agreements. Each Fund may enter into repurchase agreements, under the terms of a Master Repurchase Agreement, under which each Fund acquires securities as collateral and agrees to resell the securities at an agreed upon time and at an agreed upon price. It is each Fund’s policy that the market value of the collateral for repurchase agreements be at least equal to 102% of the repurchase price, including interest. Certain repurchase agreements aretri-party arrangements whereby the collateral is held in a segregated account for the benefit of the Fund and on behalf of the counterparty. Repurchase agreements could involve certain risks in the event of default or insolvency of the counterparty, including possible delays or restrictions upon a Fund’s ability to dispose of the underlying securities. As of September 30, 2019, each Fund, as applicable, had investments in repurchase agreements for which the value of the related collateral exceeded the value of the repurchase agreement. The gross value of repurchase agreements is included in the Statements of Assets and Liabilities for financial reporting purposes.
j. Due to/from Brokers. Transactions and positions in certain forward foreign currency contracts and delayed delivery commitments are maintained and cleared by registered U.S. broker/dealers pursuant to customer agreements between a Fund and the various broker/dealers. The due from brokers balance in the Statements of Assets and Liabilities for Core Plus Bond Fund represents cash pledged as collateral for delayed delivery securities. The due from brokers balance in the Statements of Assets and Liabilities for Global Allocation Fund represents cash pledged as collateral for forward foreign currency contracts. The due to brokers balance in the Statements of Assets and Liabilities for Core Plus Bond Fund represents cash received for delayed delivery securities. In certain circumstances a Fund’s use of cash held at brokers is restricted by regulation or broker mandated limits.
k. Securities Lending. The Funds have entered into an agreement with State Street Bank and Trust Company (“State Street Bank”), as agent of the Funds, to lend securities to certain designated borrowers. The loans are collateralized with cash or
75 |
Table of Contents
Notes to Financial Statements (continued)
September 30, 2019
securities in an amount equal to at least 105% or 102% of the market value (including accrued interest) of the loaned international or domestic securities, respectively, when the loan is initiated. Thereafter, the value of the collateral must remain at least 102% of the market value (including accrued interest) of loaned securities for U.S. equities and U.S. corporate debt; at least 105% of the market value (including accrued interest) of loaned securities fornon-U.S. equities; and at least 100% of the market value (including accrued interest) of loaned securities for U.S. Government securities, sovereign debt issued bynon-U.S. Governments andnon-U.S. corporate debt. In the event that the market value of the collateral falls below the required percentages described above, the borrower will deliver additional collateral on the next business day. As with other extensions of credit, the Funds may bear the risk of loss with respect to the investment of the collateral. The Funds invest cash collateral in short-term investments, a portion of the income from which is remitted to the borrowers and the remainder allocated between the Funds and State Street Bank as lending agent.
For the year ended September 30, 2019, neither Fund had loaned securities under this agreement.
l. Indemnifications. Under the Trusts’ organizational documents, their officers and Trustees are indemnified against certain liabilities arising out of the performance of their duties to the Funds. Additionally, in the normal course of business, the Funds enter into contracts with service providers that contain general indemnification clauses. The Funds’ maximum exposure under these arrangements is unknown as this would involve future claims that may be made against the Funds that have not yet occurred. However, based on experience, the Funds expect the risk of loss to be remote.
m. New Accounting Pronouncement. In March 2017, the Financial Accounting Standards Board (FASB) issued Accounting Standards Update (ASU) No.2017-08, Receivables — Nonrefundable Fees and Other Costs (Subtopic310-20): Premium Amortization on Purchased Callable Debt Securities. The amendments in the ASU shorten the amortization period for certain callable debt securities acquired at a premium, to be amortized to the earliest call date. The ASU is effective for fiscal years and interim periods within those fiscal years beginning after December 15, 2018. Management has evaluated the application of this provision and has determined there will be no impact on the net asset value of the Funds.
3. Fair Value Measurements. In accordance with accounting standards related to fair value measurements and disclosures, the Funds have categorized the inputs utilized in determining the value of each Fund’s assets or liabilities. These inputs are summarized in the three broad levels listed below:
| • | Level 1 – quoted prices in active markets for identical assets or liabilities; |
| • | Level 2 – prices determined using other significant inputs that are observable either directly, or indirectly through corroboration with observable market data |
| 76
Table of Contents
Notes to Financial Statements (continued)
September 30, 2019
| (which could include quoted prices for similar assets or liabilities, interest rates, credit risk, etc.); and |
| • | Level 3 – prices determined using significant unobservable inputs when quoted prices or observable inputs are unavailable such as when there is little or no market activity for an asset or liability (unobservable inputs reflect each Fund’s own assumptions in determining the fair value of assets or liabilities and would be based on the best information available). |
The inputs or methodology used for valuing securities are not necessarily an indication of the risk associated with investing in those securities.
The Funds’ pricing policies and procedures are recommended by the adviser and approved by the Board of Trustees. Debt securities are valued based on evaluated bids furnished to the Funds by an independent pricing service. Broker-dealer bid prices may be used if an independent pricing service either is unable to price a security or does not provide a reliable price for a security. Broker-dealer bid prices for which the Funds do not have knowledge of the inputs used by the broker-dealer are categorized in Level 3. All security prices, including those obtained from an independent pricing service and broker-dealer bid prices, are reviewed on a daily basis by the adviser, subject to oversight by Fund management and the Board of Trustees. If the adviser, in good faith, believes that the price provided by an independent pricing service is unreliable, broker-dealer bid prices may be used until the price provided by the independent pricing service is considered to be reliable. Reliability of all security prices, including those obtained from an independent pricing service and broker-dealer bid prices, is tested in a variety of ways, including comparison to recent transaction prices and daily fluctuations, amongst other validation procedures in place. Securities for which market quotations are not readily available are valued at fair value as determined in good faith by the Funds’ adviser pursuant to procedures approved by the Board of Trustees. Fair valued securities may be categorized in Level 3.
77 |
Table of Contents
Notes to Financial Statements (continued)
September 30, 2019
The following is a summary of the inputs used to value the Funds’ investments as of September 30, 2019, at value:
Core Plus Bond Fund
Asset Valuation Inputs
Description | Level 1 | Level 2 | Level 3 | Total | ||||||||||||
Bonds and Notes | ||||||||||||||||
Non-Convertible Bonds | ||||||||||||||||
ABS Home Equity | $ | — | $ | 137,094,836 | $ | 41,289 | (b) | $ | 137,136,125 | |||||||
All OtherNon-Convertible Bonds(a) | — | 6,827,284,072 | — | 6,827,284,072 | ||||||||||||
|
|
|
|
|
|
|
| |||||||||
TotalNon-Convertible Bonds | — | 6,964,378,908 | 41,289 | 6,964,420,197 | ||||||||||||
|
|
|
|
|
|
|
| |||||||||
Municipals(a) | — | 17,132,006 | — | 17,132,006 | ||||||||||||
|
|
|
|
|
|
|
| |||||||||
Total Bonds and Notes | — | 6,981,510,914 | 41,289 | 6,981,552,203 | ||||||||||||
|
|
|
|
|
|
|
| |||||||||
Senior Loans(a) | — | 215,033,974 | — | 215,033,974 | ||||||||||||
Preferred Stocks(a) | — | 18,089,890 | — | 18,089,890 | ||||||||||||
Common Stocks(a) | — | 1,752,090 | 779 | (b) | 1,752,869 | |||||||||||
Short-Term Investments | — | 1,189,688,409 | — | 1,189,688,409 | ||||||||||||
|
|
|
|
|
|
|
| |||||||||
Total | $ | — | $ | 8,406,075,277 | $ | 42,068 | $ | 8,406,117,345 | ||||||||
|
|
|
|
|
|
|
| |||||||||
| (a) | Details of the major categories of the Fund’s investments are reflected within the Portfolio of Investments. |
| (b) | Fair valued by the Fund’s adviser. |
Global Allocation Fund
Asset Valuation Inputs
Description | Level 1 | Level 2 | Level 3 | Total | ||||||||||||
Common Stocks | ||||||||||||||||
France | $ | — | $ | 78,514,823 | $ | — | $ | 78,514,823 | ||||||||
Hong Kong | — | 64,902,539 | — | 64,902,539 | ||||||||||||
India | — | 36,255,791 | — | 36,255,791 | ||||||||||||
Japan | — | 51,874,360 | — | 51,874,360 | ||||||||||||
Sweden | — | 42,343,717 | — | 42,343,717 | ||||||||||||
Switzerland | — | 125,354,034 | — | 125,354,034 | ||||||||||||
United Kingdom | 50,359,451 | 123,261,815 | — | 173,621,266 | ||||||||||||
United States | 1,370,726,204 | 1,919 | — | 1,370,728,123 | ||||||||||||
All Other Common Stocks(a) | 132,904,728 | — | — | 132,904,728 | ||||||||||||
|
|
|
|
|
|
|
| |||||||||
Total Common Stocks | 1,553,990,383 | 522,508,998 | — | 2,076,499,381 | ||||||||||||
|
|
|
|
|
|
|
| |||||||||
| 78
Table of Contents
Notes to Financial Statements (continued)
September 30, 2019
Global Allocation Fund (continued)
Asset Valuation Inputs (continued)
Description | Level 1 | Level 2 | Level 3 | Total | ||||||||||||
Bonds and Notes | ||||||||||||||||
Non-Convertible Bonds | ||||||||||||||||
Canada | $ | — | $ | 117,849,669 | $ | 4,819 | (b) | $ | 117,854,488 | |||||||
United States | 37,164 | 403,195,400 | — | 403,232,564 | ||||||||||||
All OtherNon-Convertible Bonds(a) | — | 244,274,172 | — | 244,274,172 | ||||||||||||
|
|
|
|
|
|
|
| |||||||||
TotalNon-Convertible Bonds | 37,164 | 765,319,241 | 4,819 | 765,361,224 | ||||||||||||
|
|
|
|
|
|
|
| |||||||||
Convertible Bonds(a) | — | 12,085,563 | — | 12,085,563 | ||||||||||||
Municipals(a) | — | 292,858 | — | 292,858 | ||||||||||||
|
|
|
|
|
|
|
| |||||||||
Total Bonds and Notes | 37,164 | 777,697,662 | 4,819 | 777,739,645 | ||||||||||||
|
|
|
|
|
|
|
| |||||||||
Preferred Stocks(a) | 2,043,811 | 17,480 | 301,240 | (b) | 2,362,531 | |||||||||||
Short-Term Investments | — | 224,730,647 | — | 224,730,647 | ||||||||||||
|
|
|
|
|
|
|
| |||||||||
Total Investments | 1,556,071,358 | 1,524,954,787 | 306,059 | 3,081,332,204 | ||||||||||||
|
|
|
|
|
|
|
| |||||||||
Forward Foreign Currency Contracts (unrealized appreciation) | — | 668,391 | — | 668,391 | ||||||||||||
|
|
|
|
|
|
|
| |||||||||
Total | $ | 1,556,071,358 | $ | 1,525,623,178 | $ | 306,059 | $ | 3,082,000,595 | ||||||||
|
|
|
|
|
|
|
| |||||||||
Liability Valuation Inputs
Description | Level 1 | Level 2 | Level 3 | Total | ||||||||||||
Forward Foreign Currency Contracts (unrealized depreciation) | $ | — | $ | (1,549,571) | $ | — | $ | (1,549,571) | ||||||||
|
|
|
|
|
|
|
| |||||||||
| (a) | Details of the major categories of the Fund’s investments are reflected within the Portfolio of Investments. |
| (b) | Valued using broker-dealer bid prices. |
79 |
Table of Contents
Notes to Financial Statements (continued)
September 30, 2019
The following is a reconciliation of Level 3 investments for which significant unobservable inputs were used to determine fair value as of September 30, 2018 and/or September 30, 2019:
Core Plus Bond Fund
Asset Valuation Inputs
Investments in Securities | Balance as of | Accrued | Realized | Change in | Purchases | |||||||||||||||
Bonds and Notes | ||||||||||||||||||||
ABS Home Equity | $ | — | $ | — | $ | 2 | $ | (802) | $ | — | ||||||||||
Common Stocks | ||||||||||||||||||||
Oil, Gas & Consumable Fuels | — | — | — | (62,140 | ) | — | ||||||||||||||
|
|
|
|
|
|
|
|
|
| |||||||||||
Total | $ | — | $ | — | $ | 2 | $ | (62,942 | ) | $ | — | |||||||||
|
|
|
|
|
|
|
|
|
| |||||||||||
Investments in Securities | Sales | Transfers | Transfers | Balance as of | Change in | |||||||||||||||
Bonds and Notes | ||||||||||||||||||||
ABS Home Equity | $ | (28,812 | ) | $ | 70,901 | $ | — | $ | 41,289 | $ | (802 | ) | ||||||||
Common Stocks | ||||||||||||||||||||
Oil, Gas & Consumable Fuels | — | 62,919 | — | 779 | (62,140 | ) | ||||||||||||||
|
|
|
|
|
|
|
|
|
| |||||||||||
Total | $ | (28,812 | ) | $ | 133,820 | $ | — | $ | 42,068 | $ | (62,942 | ) | ||||||||
|
|
|
|
|
|
|
|
|
| |||||||||||
A debt security valued at $70,901 was transferred from Level 2 to Level 3 during the period ended September 30, 2019. At September 30, 2018, this security was valued on the basis of evaluated bids furnished to the Fund by an independent pricing service in accordance with the Fund’s valuation policies. At September 30, 2019 this security was valued at fair value as determined in good faith by the Fund’s adviser as an independent pricing service did not provide a reliable price for the security.
A common stock valued at $62,919 was transferred from Level 2 to Level 3 during the period ended September 30, 2019. At September 30, 2018, this security was valued on the basis of closing bid quotations furnished to the Fund by an independent pricing
| 80
Table of Contents
Notes to Financial Statements (continued)
September 30, 2019
service in accordance with the Fund’s valuation policies. At September 30, 2019, this security was valued at fair value as determined in good faith by the Fund’s adviser as an independent pricing service did not provide a reliable price for the security.
All transfers are recognized as of the beginning of the reporting period.
Global Allocation Fund
Asset Valuation Inputs
Investments in Securities | Balance as of | Accrued | Realized | Change in | Purchases | |||||||||||||||
Bonds and Notes | ||||||||||||||||||||
Non-Convertible Bonds | ||||||||||||||||||||
Canada | $ | — | $ | — | $ | (22,588 | ) | $ | (35,836 | ) | $ | — | ||||||||
United States | 124,748 | — | — | — | — | |||||||||||||||
Prefered Stocks | ||||||||||||||||||||
United States | — | — | — | (236,024 | ) | — | ||||||||||||||
|
|
|
|
|
|
|
|
|
| |||||||||||
Total | $ | 124,748 | $ | — | $ | (22,588 | ) | $ | (271,860 | ) | $ | — | ||||||||
|
|
|
|
|
|
|
|
|
| |||||||||||
Investments in Securities | Sales | Transfers | Transfers | Balance as of | Change in | |||||||||||||||
Bonds and Notes | ||||||||||||||||||||
Non-Convertible Bonds | ||||||||||||||||||||
Canada | $ | (2,250,728 | ) | $ | 2,313,971 | $ | — | $ | 4,819 | $ | (35,836 | ) | ||||||||
United States | — | — | (124,748 | ) | — | — | ||||||||||||||
Prefered Stocks | ||||||||||||||||||||
United States | — | 537,264 | — | 301,240 | (236,024 | ) | ||||||||||||||
|
|
|
|
|
|
|
|
|
| |||||||||||
Total | $ | (2,250,728 | ) | $ | 2,851,235 | $ | (124,748 | ) | $ | 306,059 | $ | (271,860 | ) | |||||||
|
|
|
|
|
|
|
|
|
| |||||||||||
A debt security valued at $2,313,971 was transferred from Level 2 to Level 3 during the period ended September 30, 2019. At September 30, 2018, this security was valued on the basis of evaluated bids furnished to the Fund by an independent pricing service in accordance with the Fund’s valuation policies. At September 30, 2019, this security was
81 |
Table of Contents
Notes to Financial Statements (continued)
September 30, 2019
valued using broker-dealer bid prices based on inputs unobservable to the Fund as an independent pricing service was unable to price the security.
A debt security valued at $124,748 was transferred from Level 3 to Level 2 during the period ended September 30, 2019. At September 30, 2018, this security was valued using broker-dealer bid prices based on inputs unobservable to the Fund as an independent pricing service did not provide a reliable price for the security. At September 30, 2019 this security was valued on the basis of evaluated bids furnished to the Fund by an independent pricing service in accordance with the Fund’s valuation policies.
Preferred stocks valued at $537,264 were transferred from Level 2 to Level 3 during the period ended September 30, 2019. At September 30, 2018, these securities were valued on the basis of evaluated bids furnished to the Fund by an independent pricing service in accordance with the Fund’s valuation policies. At September 30, 2019, these securities were valued using broker-dealer bid prices based on inputs unobservable to the Fund as an independent pricing service did not provide a reliable price for the securities.
All transfers are recognized as of the beginning of the reporting period.
4. Derivatives. Derivative instruments are defined as financial instruments whose value and performance are based on the value and performance of an underlying asset, reference rate or index. Derivative instruments that the Funds used during the period include forward foreign currency contracts.
The Funds are subject to the risk that changes in foreign currency exchange rates will have an unfavorable effect on the value of Fund assets denominated in foreign currencies. The Funds may enter into forward foreign currency contracts for hedging purposes to protect the value of the Funds’ holdings of foreign securities. During the year ended September 30, 2019, the Funds engaged in forward foreign currency transactions for hedging purposes. The Funds may also use forward foreign currency contracts to gain exposure to foreign currencies, regardless of whether securities denominated in such currencies are held in the Funds. During the year ended September 30, 2019, Global Allocation Fund engaged in forward foreign currency transactions to gain exposure to foreign currencies.
Transactions in derivative instruments for Core Plus Bond Fund during the year ended September 30, 2019, as reflected within the Statements of Operations, were as follows:
Net Realized Gain (Loss) on: | Forward | |||
Foreign exchange contracts | $ | (5,254,691 | ) | |
| 82
Table of Contents
Notes to Financial Statements (continued)
September 30, 2019
The following is a summary of derivative instruments for Global Allocation Fund as of September 30, 2019, as reflected within the Statements of Assets and Liabilities:
Assets | Unrealized | |||
Over-the-counter asset derivatives | ||||
Foreign exchange contracts | $ | 668,391 | ||
Liabilities | Unrealized | |||
Over-the-counter liability derivatives | ||||
Foreign exchange contracts | $ | (1,549,571 | ) | |
Transactions in derivative instruments for Global Allocation Fund during the year ended September 30, 2019, as reflected within the Statements of Operations, were as follows:
Net Realized Gain (Loss) on: | Forward | |||
Foreign exchange contracts | $ | (4,522,875 | ) | |
Net Change in Unrealized | Forward | |||
Foreign exchange contracts | $ | 773,497 | ||
As the Funds value their derivatives at fair value and recognize changes in fair value through the Statements of Operations, they do not qualify for hedge accounting under authoritative guidance for derivative instruments. The Funds’ investments in derivatives may represent an economic hedge; however, they are considered to benon-hedge transactions for the purpose of these disclosures.
83 |
Table of Contents
Notes to Financial Statements (continued)
September 30, 2019
The volume of forward foreign currency contract activity, as a percentage of net assets, based on grossmonth-end notional amounts outstanding during the period, including long and short positions at absolute value, was as follows for the year ended September 30, 2019:
Core Plus Bond Fund | Forwards | |||
Average Notional Amount Outstanding | 0.30 | % | ||
Highest Notional Amount Outstanding | 2.16 | % | ||
Lowest Notional Amount Outstanding | 0.00 | % | ||
Notional Amount Outstanding as of September 30, 2019 | 0.00 | % | ||
Global Allocation Fund | Forwards | |||
Average Notional Amount Outstanding | 8.54 | % | ||
Highest Notional Amount Outstanding | 10.64 | % | ||
Lowest Notional Amount Outstanding | 7.37 | % | ||
Notional Amount Outstanding as of September 30, 2019 | 8.57 | % | ||
Notional amounts outstanding at the end of the prior period are included in the average notional amount outstanding.
Unrealized gain and/or loss on open forwards is recorded in the Statements of Assets and Liabilities. The aggregate notional values of forward contracts are not recorded in the Statements of Assets and Liabilities, and therefore are not included in the Funds’ net assets.
Over-the-counter derivatives, including forward foreign currency contracts, are entered into pursuant to International Swaps and Derivatives Association, Inc. (“ISDA”) agreements negotiated between the Funds and their counterparties. ISDA agreements typically contain, among other things, terms for the posting of collateral and master netting provisions in the event of a default or other termination event. Collateral is posted by a Fund or the counterparty to the extent of the netmark-to-market exposure to the other party of all open contracts under the agreement, subject to minimum transfer requirements. Master netting provisions allow the Funds and the counterparty, in the event of a default or other termination event, to offset amounts owed by each related to derivative contracts, including any posted collateral, to one net amount payable by either the Funds or the counterparty. The Funds’ ISDA agreements typically contain provisions that allow a counterparty to terminate open contracts early if the NAV of a Fund declines beyond a certain threshold. For financial reporting purposes, the Funds do not offset derivative assets and liabilities, and any related collateral received or pledged, on the Statements of Assets and Liabilities.
| 84
Table of Contents
Notes to Financial Statements (continued)
September 30, 2019
As of September 30, 2019, gross amounts ofover-the-counter derivative assets and liabilities not offset in the Statements of Assets and Liabilities and the related net amounts after taking into account master netting arrangements, by counterparty, are as follows:
Global Allocation Fund
Counterparty | Gross Amounts of | Offset | Net Asset | Collateral | Net | |||||||||||||||
Bank of America, N.A. | $ | 9,739 | $ | — | $ | 9,739 | $ | — | $ | 9,739 | ||||||||||
Citibank N.A. | 53,979 | — | 53,979 | — | 53,979 | |||||||||||||||
Credit Suisse International | 597,075 | (597,075 | ) | — | — | — | ||||||||||||||
Goldman Sachs & Co. | 3,427 | — | 3,427 | — | 3,427 | |||||||||||||||
UBS AG | 4,171 | (4,171 | ) | — | — | — | ||||||||||||||
|
|
|
|
|
|
|
|
|
| |||||||||||
| $ | 668,391 | $ | (601,246 | ) | $ | 67,145 | $ | — | $ | 67,145 | ||||||||||
|
|
|
|
|
|
|
|
|
| |||||||||||
Counterparty | Gross Amounts of | Offset | Net Liability | Collateral | Net | |||||||||||||||
Credit Suisse International | $ | (743,669 | ) | $ | 597,075 | $ | (146,594 | ) | $ | 146,594 | $ | — | ||||||||
HSBC Bank USA | (8,779 | ) | — | (8,779 | ) | — | (8,779 | ) | ||||||||||||
Morgan Stanley Capital Services, Inc. | (789,655 | ) | — | (789,655 | ) | 430,000 | (359,655 | ) | ||||||||||||
UBS AG | (7,468 | ) | 4,171 | (3,297 | ) | — | (3,297 | ) | ||||||||||||
|
|
|
|
|
|
|
|
|
| |||||||||||
| $ | (1,549,571 | ) | $ | 601,246 | $ | (948,325 | ) | $ | 576,594 | $ | (371,731 | ) | ||||||||
|
|
|
|
|
|
|
|
|
| |||||||||||
The actual collateral received or pledged, if any, may exceed the amounts shown in the table due to overcollateralization. Timing differences may exist between when contracts under the ISDA agreements aremarked-to-market and when collateral moves. The ISDA agreements includetri-party control agreements under which collateral is held for the benefit of the secured party at a third party custodian, State Street Bank.
Counterparty risk is managed based on policies and procedures established by each Fund’s adviser. Such policies and procedures may include, but are not limited to, minimum counterparty credit rating requirements, monitoring of counterparty credit default swap spreads and posting of collateral. A Fund’s risk of loss from counterparty credit risk onover-the-counter derivatives is generally limited to the Fund’s aggregated unrealized gains and the amount of any collateral pledged to the counterparty, which
85 |
Table of Contents
Notes to Financial Statements (continued)
September 30, 2019
may be offset by any collateral posted to the Fund by the counterparty. ISDA master agreements can help to manage counterparty risk by specifying collateral posting arrangements atpre-arranged exposure levels. Under these ISDA agreements, collateral is routinely transferred if the total net exposure in respect of certain transactions, net of existing collateral already in place, exceeds a specified amount (typically $250,000, depending on the counterparty). With exchange-traded derivatives, there is minimal counterparty credit risk to the Fund because the exchange’s clearing house, as counterparty to these instruments, stands between the buyer and the seller of the contract. Credit risk still exists in exchange-traded derivatives with respect to initial and variation margin that is held in a broker’s customer accounts. While brokers are required to segregate customer margin from their own assets, in the event that a broker becomes insolvent or goes into bankruptcy and at that time there is a shortfall in the aggregate amount of margin held by the broker for all its clients, U.S. bankruptcy laws will typically allocate that shortfall on a pro rata basis across all of the broker’s customers, potentially resulting in losses to the Fund. Based on balances reflected on each Fund’s Statement of Assets and Liabilities, the following table shows (i) the maximum amount of loss due to credit risk that, based on the gross fair value of the financial instrument, the Fund would incur if parties (including OTC derivative counterparties and brokers holding margin for exchange-traded derivatives) to the relevant financial instruments failed completely to perform according to the terms of the contracts and the collateral or other security, if any, for the amount due proved to be of no value to the Fund, and (ii) the amount of loss that the Fund would incur after taking into account master netting provisions pursuant to ISDA agreements, as of September 30, 2019:
Fund | Maximum Amount of Loss - Gross | Maximum Amount of Loss - Net | ||||||
Global Allocation Fund | $ | 1,248,391 | $ | 70,551 | ||||
5. Purchases and Sales of Securities. For the year ended September 30, 2019, purchases and sales of securities (excluding short-term investments and including paydowns) were as follows:
| U.S. Government/ Agency Securities | Other Securities | |||||||||||||||
Fund | Purchases | Sales | Purchases | Sales | ||||||||||||
Core Plus Bond Fund | $ | 18,838,676,346 | $ | 17,284,422,096 | $ | 920,223,556 | $ | 1,252,836,635 | ||||||||
Global Allocation Fund | 183,957,972 | 100,973,884 | 946,433,658 | 564,607,854 | ||||||||||||
6. Management Fees and Other Transactions with Affiliates.
a. Management Fees. Loomis, Sayles & Company, L.P. (“Loomis Sayles”) serves as investment adviser to each Fund. Loomis Sayles is a limited partnership whose sole
| 86
Table of Contents
Notes to Financial Statements (continued)
September 30, 2019
general partner, Loomis, Sayles & Company, Inc., is indirectly owned by Natixis Investment Managers, L.P. (“Natixis”), which is part of Natixis Investment Managers, an international asset management group based in Paris, France.
Under the terms of the management agreements, each Fund pays a management fee at the following annual rates, calculated daily and payable monthly, based on the Fund’s average daily net assets:
| Percentage of Average Daily Net Assets | ||||||||||||
Fund | First $100 million | Next | Over | |||||||||
Core Plus Bond Fund | 0.2000 | % | 0.1875 | % | 0.1500 | % | ||||||
Global Allocation Fund | 0.7500 | % | 0.7500 | % | 0.7300 | % | ||||||
Natixis Advisors, L.P. (“Natixis Advisors”) serves as the advisory administrator to Core Plus Bond Fund. Natixis Advisors is a wholly-owned subsidiary of Natixis. Under the terms of the advisory administration agreement, the Fund pays an advisory administration fee at the following annual rates, calculated daily and payable monthly, based on its average daily net assets:
| Percentage of Average Daily Net Assets | ||||||||||||
Fund | First $100 million | Next | Over | |||||||||
Core Plus Bond Fund | 0.2000 | % | 0.1875 | % | 0.1500 | % | ||||||
Management and advisory administration fees are presented in the Statements of Operations as management fees.
Loomis Sayles has given binding undertakings to the Funds to waive management fees and/or reimburse certain expenses to limit the Funds’ operating expenses, exclusive of acquired fund fees and expenses, brokerage expenses, interest expense, taxes, organizational and extraordinary expenses such as litigation and indemnification expenses. These undertakings are in effect until January 31, 2020, may be terminated before then only with the consent of the Funds’ Board of Trustees and are reevaluated on an annual basis. Management fees payable, as reflected on the Statements of Assets and Liabilities, is net of waivers and/or expense reimbursements, if any, pursuant to these undertakings. Waivers/reimbursements that exceed management fees payable are reflected on the Statements of Assets and Liabilities as receivable from investment adviser.
87 |
Table of Contents
Notes to Financial Statements (continued)
September 30, 2019
For the year ended September 30, 2019 the expense limits as a percentage of average daily net assets under the expense limitation agreements were as follows:
Fund | Expense Limit as a Percentage of Average Daily Net Assets | |||||||||||||||
Class A | Class C | Class N | Class Y | |||||||||||||
Core Plus Bond Fund | 0.80 | % | 1.55 | % | 0.50 | % | 0.55 | % | ||||||||
Global Allocation Fund | 1.25 | % | 2.00 | % | 0.95 | % | 1.00 | % | ||||||||
Loomis Sayles and Natixis Advisors have agreed to equally bear the waivers and/or expense reimbursements for Core Plus Bond Fund.
Loomis Sayles (and Natixis Advisors for Core Plus Bond Fund) shall be permitted to recover expenses borne under the expense limitation agreements (whether through waiver of management fees or otherwise) on a class by class basis in later periods to the extent the annual operating expenses of a class fall below a class’ expense limits, provided, however, that a class is not obligated to pay such waived/reimbursed fees or expenses more than one year after the end of the fiscal year in which the fees or expenses were waived/reimbursed.
For the year ended September 30, 2019, the management fees for each Fund were as follows:
Fund | Gross | Percentage of | ||||||
Core Plus Bond Fund | $ | 10,937,982 | 0.16 | % | ||||
Global Allocation Fund | 19,622,561 | 0.75 | % | |||||
For the year ended September 30, 2019, the advisory administration fees for Core Plus Bond Fund were $10,937,982 (effective rate of 0.16% of average daily net assets).
No expenses were recovered for either Fund during the year ended September 30, 2019 under the terms of the expense limitation agreements.
b. Service and Distribution Fees. Natixis Distribution, L.P. (“Natixis Distribution”), which is a wholly-owned subsidiary of Natixis, has entered into a distribution agreement with the Trusts. Pursuant to this agreement, Natixis Distribution serves as principal underwriter of the Funds of the Trusts.
Pursuant to Rule12b-1 under the 1940 Act, the Trusts have adopted a Service Plan relating to each Fund’s Class A shares (the “Class A Plans”), and a Distribution and Service Plan relating to each Fund’s Class C shares (the “Class C Plans”).
Under the Class A Plans, each Fund pays Natixis Distribution a monthly service fee at an annual rate not to exceed 0.25% of the average daily net assets attributable to the
| 88
Table of Contents
Notes to Financial Statements (continued)
September 30, 2019
Fund’s Class A shares, as reimbursement for expenses incurred by Natixis Distribution in providing personal services to investors in Class A shares and/or the maintenance of shareholder accounts.
Under the Class C Plans, each Fund pays Natixis Distribution a monthly service fee at an annual rate not to exceed 0.25% of the average daily net assets attributable to the Fund’s Class C shares, as compensation for services provided by Natixis Distribution in providing personal services to investors in Class C shares and/or the maintenance of shareholder accounts.
Also under the Class C Plans, each Fund pays Natixis Distribution a monthly distribution fee at an annual rate of 0.75% of the average daily net assets attributable to the Fund’s Class C shares, as compensation for services provided by Natixis Distribution in connection with the marketing or sale of Class C shares.
For the year ended September 30, 2019, the service and distribution fees for each Fund were as follows:
| Service Fees | Distribution Fees | |||||||||||
Fund | Class A | Class C | Class C | |||||||||
Core Plus Bond Fund | $ | 1,448,947 | $ | 427,942 | $ | 1,283,824 | ||||||
Global Allocation Fund | 1,014,734 | 1,079,928 | 3,239,783 | |||||||||
c. Administrative Fees. Natixis Advisors provides certain administrative services for the Funds and contracts with State Street Bank to serve assub-administrator. Pursuant to an agreement among Natixis Funds Trusts, Loomis Sayles Funds Trusts, Natixis ETF Trust and Natixis Advisors, effective July 1, 2019, each Fund pays Natixis Advisors monthly itspro rata portion of fees equal to an annual rate of 0.0540% of the first $15 billion of the average daily net assets of the Natixis Funds Trusts, Loomis Sayles Funds Trusts and Natixis ETF Trust, 0.0500% of the next $15 billion, 0.0400% of the next $30 billion, 0.0275% of the next $30 billion and 0.0225% of such assets in excess of $90 billion, subject to an annual aggregate minimum fee for the Natixis Funds Trusts, Loomis Sayles Funds Trusts and Natixis ETF Trust of $10 million, which is reevaluated on an annual basis.
Prior to July 1, 2019, each Fund paid Natixis Advisors monthly itspro rata portion of fees equal to an annual rate of 0.0575% of the first $15 billion of the average daily net assets of the Natixis Funds Trusts, Loomis Sayles Funds Trusts and Natixis ETF Trust, 0.0500% of the next $15 billion, 0.0400% of the next $30 billion, 0.0275% of the next $30 billion and 0.0225% of such assets in excess of $90 billion, subject to an annual aggregate minimum fee for the Natixis Funds Trusts, Loomis Sayles Funds Trusts and Natixis ETF Trust of $10 million.
Effective October 1, 2018, State Street Bank agreed to reduce the fees it receives from Natixis Advisors for serving assub-administrator to the Funds. Also, effective October 1,
89 |
Table of Contents
Notes to Financial Statements (continued)
September 30, 2019
2018, Natixis Advisors agreed to voluntarily waive fees paid by the Funds in an amount equal to the reduction insub-administrative fees discussed above. The waiver was in effect through June 30, 2019.
For the year ended September 30, 2019, the administrative fees for each Fund were as follows:
Fund | Gross | Waiver of | Net | |||||||||
Core Plus Bond Fund | $ | 2,979,797 | $ | 50,789 | $ | 2,929,008 | ||||||
Global Allocation Fund | 1,159,251 | 19,350 | 1,139,901 | |||||||||
d. Sub-Transfer Agent Fees. Natixis Distribution has entered into agreements, which include servicing agreements, with financial intermediaries that provide recordkeeping, processing, shareholder communications and other services to customers of the intermediaries that hold positions in the Funds and has agreed to compensate the intermediaries for providing those services. Intermediaries transact with the Funds primarily through the use of omnibus accounts on behalf of their customers who hold positions in the Funds. These services would have been provided by the Funds’ transfer agent and other service providers if the shareholders’ accounts were maintained directly at the Funds’ transfer agent. Accordingly, the Funds have agreed to reimburse Natixis Distribution for all or a portion of the servicing fees paid to these intermediaries. The reimbursement amounts(sub-transfer agent fees) paid to Natixis Distribution are subject to a currentper-account equivalent fee limit approved by the Funds’ Board of Trustees, which is based on fees for similar services paid to the Funds’ transfer agent and other service providers. Class N shares do not bear such expenses.
For the year ended September 30, 2019, thesub-transfer agent fees (which are reflected in transfer agent fees and expenses in the Statements of Operations) for each Fund were as follows:
Fund | Sub-Transfer | |||
Core Plus Bond Fund | $ | 4,005,391 | ||
Global Allocation Fund | 2,050,127 | |||
As of September 30, 2019, the Funds owe Natixis Distribution the following reimbursements forsub-transfer agent fees (which are reflected in the Statements of Assets and Liabilities as payable to distributor):
Fund | Reimbursements | |||
Core Plus Bond Fund | $ | 50,450 | ||
Global Allocation Fund | 47,578 | |||
| 90
Table of Contents
Notes to Financial Statements (continued)
September 30, 2019
Sub-transfer agent fees attributable to Class A, Class C and Class Y are allocated on apro ratabasis to each class based on the relative net assets of each class to the total net assets of those classes.
e. Commissions. Commissions (including CDSCs) on Fund shares retained by Natixis Distribution during the year ended September 30, 2019, were as follows:
Fund | Commissions | |||
Core Plus Bond Fund | $ | 41,087 | ||
Global Allocation Fund | 184,743 | |||
f. Trustees Fees and Expenses. The Trusts do not pay any compensation directly to their officers or Trustees who are directors, officers or employees of Natixis Advisors, Natixis Distribution, Natixis or their affiliates. The Chairperson of the Board of Trustees receives a retainer fee at the annual rate of $360,000. The Chairperson does not receive any meeting attendance fees for Board of Trustees meetings or committee meetings that he attends. Each Independent Trustee (other than the Chairperson) receives, in the aggregate, a retainer fee at the annual rate of $190,000. Each Independent Trustee also receives a meeting attendance fee of $10,000 for each meeting of the Board of Trustees that he or she attends in person and $5,000 for each meeting of the Board of Trustees that he or she attends telephonically. In addition, the chairperson of the Contract Review Committee and the chairperson of the Audit Committee each receive an additional retainer fee at the annual rate of $20,000. The chairperson of the Governance Committee receives an additional retainer fee at the annual rate of $15,000. Each Contract Review Committee member is compensated $6,000 for each Committee meeting that he or she attends in person and $3,000 for each meeting that he or she attends telephonically. Each Audit Committee member is compensated $6,000 for each Committee meeting that he or she attends in person and $3,000 for each meeting that he or she attends telephonically. These fees are allocated among the funds in the Natixis Funds Trusts, Loomis Sayles Funds Trusts and Natixis ETF Trust based on a formula that takes into account, among other factors, the relative net assets of each fund. Trustees are reimbursed for travel expenses in connection with attendance at meetings.
Prior to January 1, 2019, the Chairperson of the Board received a retainer fee at the annual rate of $340,000 and each Independent Trustee (other than the Chairperson) received, in the aggregate, a retainer fee at the annual rate of $170,000, and the chairperson of the Governance Committee received an additional retainer fee at the annual rate of $12,000. All other Trustee fees remained unchanged.
A deferred compensation plan (the “Plan”) is available to the Trustees on a voluntary basis. Deferred amounts remain in the Funds until distributed in accordance with the provisions of the Plan. The value of a participating Trustee’s deferral account is based on theoretical investments of deferred amounts, on the normal payment dates, in
91 |
Table of Contents
Notes to Financial Statements (continued)
September 30, 2019
certain funds of the Natixis Funds Trusts, Loomis Sayles Funds Trusts and Natixis ETF Trust as designated by the participating Trustees. Changes in the value of participants’ deferral accounts are allocatedpro rata among the funds in the Natixis Funds Trusts, Loomis Sayles Funds Trusts and Natixis ETF Trust, and are normally reflected as Trustees’ fees and expenses in the Statements of Operations. The portions of the accrued obligations allocated to the Funds under the Plan are reflected as Deferred Trustees’ fees in the Statements of Assets and Liabilities.
Certain officers and employees of Natixis Advisors and Loomis Sayles are also officers and/or Trustees of the Trusts.
g. Affiliated Ownership. As of September 30, 2019, Loomis Sayles Employees’ Profit Sharing Retirement Plan held shares of the Core Plus Bond Fund and Global Allocation Fund representing 0.12% and 0.66%, respectively, of the Funds’ net assets.
Investment activities of affiliated shareholders could have material impacts on the Fund.
h. Reimbursement of Transfer Agent Fees and Expenses. Natixis Advisors has given a binding contractual undertaking to the Global Allocation Fund to reimburse any and all transfer agency expenses for the Fund’s Class N shares. This undertaking is in effect through January 31, 2020.
Expenses reimbursed pursuant to this undertaking is not subject to recovery under the expense limitation agreement described above.
For the year ended September 30, 2019, Natixis Advisors reimbursed Global Allocation Fund $1,249 for transfer agency expenses related to Class N shares.
i. Payment by Affiliates. For the year ended September 30, 2019, Loomis Sayles reimbursed Global Allocation Fund $4,199 in connection with a trading error.
7. Class-Specific Transfer Agent Fees and Expenses. Transfer agent fees and expenses attributable to Class A, Class C and Class Y are allocated on apro ratabasis to each class based on the relative net assets of each class to the total net assets of those classes. Transfer agent fees and expenses attributable to Class N are allocated to Class N.
For the year ended September 30, 2019, the Funds incurred the following class-specific transfer agent fees and expenses (includingsub-transfer agent fees, where applicable):
| Transfer Agent Fees and Expenses | ||||||||||||||||
Fund | Class A | Class C | Class N | Class Y | ||||||||||||
Core Plus Bond Fund | $ | 535,767 | $ | 158,337 | $ | 6,151 | $ | 3,516,880 | ||||||||
Global Allocation Fund | 348,101 | 370,445 | 1,249 | 1,420,657 | ||||||||||||
| 92
Table of Contents
Notes to Financial Statements (continued)
September 30, 2019
8. Line of Credit. Each Fund, together with certain other funds of Natixis Funds Trusts, Loomis Sayles Funds Trusts and Natixis ETF Trust, entered into a $400,000,000 committed unsecured line of credit provided by State Street Bank. Any one Fund may borrow up to $350,000,000 under the line of credit agreement (as long as all borrowings by all Funds in the aggregate do not exceed the $400,000,000 limit at any time), subject to each Fund’s investment restrictions and its contractual obligations under the line of credit. Interest is charged to the Funds based upon the terms set forth in the agreement. In addition, a commitment fee of 0.15% per annum, payable at the end of each calendar quarter, is accrued and apportioned among the participating funds based on their average daily unused portion of the line of credit. The Funds paid an arrangement fee, an upfront fee, and certain other legal fees in connection with the line of credit agreement, which are being amortized over a period of 364 days and are reflected in legal fees and/or miscellaneous expenses on the Statements of Operations. The unamortized balance is reflected as prepaid expenses on the Statements of Assets and Liabilities.
For the year ended September 30, 2019, neither Fund had borrowings under this agreement.
9. Concentration of Risk. Global Allocation Fund’s investments in foreign securities may be subject to greater political, economic, environmental, credit/counterparty and information risks. The Fund’s investments in foreign securities also are subject to foreign currency fluctuations and other foreign currency-related risks. Foreign securities may be subject to higher volatility than U.S. securities, varying degrees of regulation and limited liquidity.
Core Plus Bond Fund’s investments in mortgage-related and asset-backed securities are subject to certain risks not associated with investments in other securities. Mortgage-related and asset-backed securities are subject to the risk that unexpected changes in interest rates will have a direct effect on expected maturity. A shortened maturity may result in the reinvestment of prepaid amounts in securities with lower yields than the original obligations. An extended maturity may result in a reduction of a security’s value.
10. Concentration of Ownership. From time to time, a Fund may have a concentration of one or more accounts constituting a significant percentage of shares outstanding. Investment activities by holders of such accounts could have material impacts on the Fund. As of September 30, 2019, based on management’s evaluation of the shareholder account base, the Fund had accounts representing controlling ownership of more than 5% of the Fund’s total outstanding shares. The number of such accounts, based on accounts that represent more than 5% of an individual class of shares, and the aggregate percentage of net assets represented by such holdings were as follows:
Number of 5% | Percentage of | |||||||
Core Plus Bond Fund | 2 | 13.13 | % | |||||
93 |
Table of Contents
Notes to Financial Statements (continued)
September 30, 2019
Omnibus shareholder accounts for which Natixis Advisors understands that the intermediary has discretion over the underlying shareholder accounts or investment models where a shareholder account may be invested for anon-discretionary customer are included in the table above. For other omnibus accounts, the Funds do not have information on the individual shareholder accounts underlying the omnibus accounts; therefore, there could be other 5% shareholders in addition to those disclosed in the table above.
11. Capital Shares. Each Fund may issue an unlimited number of shares of beneficial interest, without par value. Transactions in capital shares were as follows:
| | Year Ended September 30, 2019 | | Year Ended September 30, 2018 | |||||||||||||
Core Plus Bond Fund | Shares | Amount | Shares | Amount | ||||||||||||
| Class A |
| |||||||||||||||
Issued from the sale of shares | 12,426,857 | $ | 158,345,750 | 14,040,643 | $ | 178,690,699 | ||||||||||
Issued in connection with the reinvestment of distributions | 837,896 | 10,721,395 | 1,154,778 | 14,686,836 | ||||||||||||
Redeemed | (19,090,450 | ) | (243,916,582 | ) | (19,481,082 | ) | (248,180,226 | ) | ||||||||
|
|
|
|
|
|
|
| |||||||||
Net change | (5,825,697 | ) | $ | (74,849,437 | ) | (4,285,661 | ) | $ | (54,802,691 | ) | ||||||
|
|
|
|
|
|
|
| |||||||||
| Class C |
| |||||||||||||||
Issued from the sale of shares | 1,660,719 | $ | 21,057,183 | 1,254,087 | $ | 16,021,820 | ||||||||||
Issued in connection with the reinvestment of distributions | 172,807 | 2,212,246 | 296,095 | 3,768,661 | ||||||||||||
Redeemed | (4,572,623 | ) | (58,229,725 | ) | (5,917,216 | ) | (75,210,340 | ) | ||||||||
|
|
|
|
|
|
|
| |||||||||
Net change | (2,739,097 | ) | $ | (34,960,296 | ) | (4,367,034 | ) | $ | (55,419,859 | ) | ||||||
|
|
|
|
|
|
|
| |||||||||
| Class N |
| |||||||||||||||
Issued from the sale of shares | 74,861,614 | $ | 965,170,758 | 38,117,548 | $ | 488,137,584 | ||||||||||
Issued in connection with the reinvestment of distributions | 4,521,156 | 58,566,539 | 4,499,650 | 57,668,654 | ||||||||||||
Redeemed | (34,409,887 | ) | (444,651,546 | ) | (28,866,367 | ) | (370,892,754 | ) | ||||||||
|
|
|
|
|
|
|
| |||||||||
Net change | 44,972,883 | $ | 579,085,751 | 13,750,831 | $ | 174,913,484 | ||||||||||
|
|
|
|
|
|
|
| |||||||||
| Class Y |
| |||||||||||||||
Issued from the sale of shares | 85,377,215 | $ | 1,102,722,145 | 75,086,998 | $ | 964,464,952 | ||||||||||
Issued in connection with the reinvestment of distributions | 6,833,439 | 88,271,244 | 8,393,721 | 107,561,723 | ||||||||||||
Redeemed | (76,245,974 | ) | (976,476,811 | ) | (82,352,831 | ) | (1,056,035,857 | ) | ||||||||
|
|
|
|
|
|
|
| |||||||||
Net change | 15,964,680 | $ | 214,516,578 | 1,127,888 | $ | 15,990,818 | ||||||||||
|
|
|
|
|
|
|
| |||||||||
Increase from capital share transactions | 52,372,769 | $ | 683,792,596 | 6,226,024 | $ | 80,681,752 | ||||||||||
|
|
|
|
|
|
|
| |||||||||
| 94
Table of Contents
Notes to Financial Statements (continued)
September 30, 2019
11. Capital Shares (continued).
| | Year Ended September 30, 2019 | | Year Ended September 30, 2018 | |||||||||||||
Global Allocation Fund | Shares | Amount | Shares | Amount | ||||||||||||
| Class A |
| |||||||||||||||
Issued from the sale of shares | 7,286,270 | $ | 162,617,493 | 8,103,965 | $ | 184,844,305 | ||||||||||
Issued in connection with the reinvestment of distributions | 622,284 | 12,134,537 | 259,737 | 5,734,993 | ||||||||||||
Redeemed | (6,207,958 | ) | (137,784,719 | ) | (5,133,874 | ) | (116,824,548 | ) | ||||||||
|
|
|
|
|
|
|
| |||||||||
Net change | 1,700,596 | $ | 36,967,311 | 3,229,828 | $ | 73,754,750 | ||||||||||
|
|
|
|
|
|
|
| |||||||||
| Class C |
| |||||||||||||||
Issued from the sale of shares | 5,953,693 | $ | 130,846,979 | 6,101,385 | $ | 137,296,960 | ||||||||||
Issued in connection with the reinvestment of distributions | 519,881 | 10,054,504 | 149,300 | 3,268,181 | ||||||||||||
Redeemed | (4,084,514 | ) | (89,798,271 | ) | (4,761,750 | ) | (107,144,492 | ) | ||||||||
|
|
|
|
|
|
|
| |||||||||
Net change | 2,389,060 | $ | 51,103,212 | 1,488,935 | $ | 33,420,649 | ||||||||||
|
|
|
|
|
|
|
| |||||||||
| Class N |
| |||||||||||||||
Issued from the sale of shares | 5,515,442 | $ | 122,986,662 | 880,524 | $ | 20,044,847 | ||||||||||
Issued in connection with the reinvestment of distributions | 168,053 | 3,290,482 | 70,593 | 1,565,047 | ||||||||||||
Redeemed | (665,833 | ) | (15,132,556 | ) | (234,590 | ) | (5,402,022 | ) | ||||||||
|
|
|
|
|
|
|
| |||||||||
Net change | 5,017,662 | $ | 111,144,588 | 716,527 | $ | 16,207,872 | ||||||||||
|
|
|
|
|
|
|
| |||||||||
| Class Y |
| |||||||||||||||
Issued from the sale of shares | 31,758,778 | $ | 709,981,758 | 26,704,228 | $ | 611,912,156 | ||||||||||
Issued in connection with the reinvestment of distributions | 2,439,526 | 47,790,318 | 905,490 | 20,083,757 | ||||||||||||
Redeemed | (19,828,297 | ) | (438,143,471 | ) | (10,059,816 | ) | (229,836,093 | ) | ||||||||
|
|
|
|
|
|
|
| |||||||||
Net change | 14,370,007 | $ | 319,628,605 | 17,549,902 | $ | 402,159,820 | ||||||||||
|
|
|
|
|
|
|
| |||||||||
Increase from capital share transactions | 23,477,325 | $ | 518,843,716 | 22,985,192 | $ | 525,543,091 | ||||||||||
|
|
|
|
|
|
|
| |||||||||
95 |
Table of Contents
Report of Independent Registered Public Accounting Firm
To the Board of Trustees of Loomis Sayles Funds II and Natixis Funds Trust I and Shareholders of Loomis Sayles Global Allocation Fund and Loomis Sayles Core Plus Bond Fund:
Opinions on the Financial Statements
We have audited the accompanying statements of assets and liabilities, including the portfolios of investments, of Loomis Sayles Global Allocation Fund (one of the funds constituting Loomis Sayles Funds II) and Loomis Sayles Core Plus Bond Fund (one of the funds constituting Natixis Funds Trust I) (hereafter collectively referred to as the “Funds”) as of September 30, 2019, the related statements of operations for the year ended September 30, 2019, the statements of changes in net assets for each of the two years in the period ended September 30, 2019, including the related notes, and the financial highlights for each of the periods indicated therein (collectively referred to as the “financial statements”). In our opinion, the financial statements present fairly, in all material respects, the financial position of each of the Funds as of September 30, 2019, the results of each of their operations for the year then ended, the changes in each of their net assets for each of the two years in the period ended September 30, 2019 and each of the financial highlights for each of the periods indicated therein in conformity with accounting principles generally accepted in the United States of America.
Basis for Opinions
These financial statements are the responsibility of the Funds’ management. Our responsibility is to express an opinion on the Funds’ financial statements based on our audits. We are a public accounting firm registered with the Public Company Accounting Oversight Board (United States) (PCAOB) and are required to be independent with respect to the Funds in accordance with the U.S. federal securities laws and the applicable rules and regulations of the Securities and Exchange Commission and the PCAOB.
We conducted our audits of these financial statements in accordance with the standards of the PCAOB. Those standards require that we plan and perform the audit to obtain reasonable assurance about whether the financial statements are free of material misstatement, whether due to error or fraud.
Our audits included performing procedures to assess the risks of material misstatement of the financial statements, whether due to error or fraud, and performing procedures that respond to those risks. Such procedures included examining, on a test basis, evidence regarding the amounts and disclosures in the financial statements. Our audits also included evaluating the accounting principles used and significant estimates made by management, as well as evaluating the overall presentation of the financial statements. Our procedures included confirmation of securities owned as of September 30, 2019 by correspondence with the custodian, and brokers; when replies
| 96
Table of Contents
Report of Independent Registered Public Accounting Firm
were not received from brokers, we performed other auditing procedures. We believe that our audits provide a reasonable basis for our opinions.
PricewaterhouseCoopers LLP
Boston, Massachusetts
November 21, 2019
We have served as the auditor of one or more investment companies in the Natixis Investment Company Complex since at least 1995. We have not determined the specific year we began serving as auditor.
97 |
Table of Contents
2019 U.S. Tax Distribution Information to Shareholders (Unaudited)
Corporate Dividends Received Deduction. For the fiscal year ended September 30, 2019, a percentage of dividends distributed by the Fund listed below qualify for the dividends received deduction for corporate shareholders. These percentages are as follows:
Fund | Qualifying | |||
Global Allocation | 45.45 | % | ||
Capital Gains Distributions. Pursuant to Internal Revenue Section 852(b), the following Fund paid distributions, which have been designated as capital gains distributions for the fiscal year ended September 30, 2019, unless subsequently determined to be different.
Fund | Amount | |||
Global Allocation | $ | 77,905,873 | ||
Qualified Dividend Income. For the fiscal year ended September 30, 2019, the Fund below will designate up to the maximum amount allowable pursuant to the Internal Revenue Code as qualified dividend income eligible for reduced tax rates. These lower rates range from 0% to 20% depending on an individual’s tax bracket. If the Fund pays a distribution during calendar year 2019, complete information will be reported in conjunction with Form1099-DIV.
Fund | ||
Global Allocation | ||
| 98
Table of Contents
Trustee and Officer Information
The tables below provide certain information regarding the trustees and officers of Natixis Funds Trust I and Loomis Sayles Funds II (the “Trusts”). Unless otherwise indicated, the address of all persons below is 888 Boylston Street, Suite 800, Boston, MA 02199-8197. The Funds’ Statements of Additional Information include additional information about the trustees of the Trusts and are available by calling Natixis Funds at800-225-5478.
Name and Year of Birth | Position(s) Held of Office1 | Principal 5 Years | Number of 5 Years | Experience, | ||||
| INDEPENDENT TRUSTEES | ||||||||
| Kenneth A. Drucker (1945) | Chairperson of the Board of Trustees since January 2017 Trustee since 2008Ex Officio member of Audit Committee, Contract Review Committee and Governance Committee | Retired | 52 None | Significant experience on the Board and on the boards of other business organizations (including at investment companies); executive experience (including as treasurer of an aerospace, automotive, and metal manufacturing corporation) | ||||
| Edmond J. English (1953) | Trustee since 2013 Chairperson of Governance Committee and Audit Committee Member | Executive Chairman of Bob’s Discount Furniture (retail) | 52 Director, Burlington Stores, Inc. (retail) | Significant experience on the Board and on the boards of other business organizations (including retail companies and a bank); executive experience (including at a retail company) | ||||
99 |
Table of Contents
Trustee and Officer Information
Name and Year of Birth | Position(s) Held of Office1 | Principal 5 Years | Number of 5 Years | Experience, | ||||
INDEPENDENT TRUSTEES continued | ||||||||
| Richard A. Goglia (1951) | Trustee since 2015 Contract Review Committee Member and Governance Committee Member | Retired; formerly Vice President and Treasurer of Raytheon Company (defense) | 52 None | Experience on the Board and executive experience (including his role as vice president and treasurer of a defense company and experience at a financial services company) | ||||
| Wendell J. Knox (1948) | Trustee since 2009 Chairperson of Contract Review Committee | Director of Abt Associates Inc. (research and consulting) | 52 Director, The Hanover Insurance Group (property and casualty insurance); formerly, Director, Eastern Bank (bank) | Significant experience on the Board and on the boards of other business organizations (including at a bank and at a property and casualty insurance firm); executive experience (including roles as president and chief executive officer of a research and consulting company) | ||||
| 100
Table of Contents
Trustee and Officer Information
Name and Year of Birth | Position(s) Held of Office1 | Principal 5 Years | Number of 5 Years | Experience, | ||||
INDEPENDENT TRUSTEES continued | ||||||||
| Martin T. Meehan (1956) | Trustee since 2012 Audit Committee Member | President, University of Massachusetts; formerly, Chancellor and faculty member, University of Massachusetts Lowell | 52 None | Significant experience on the Board and on the boards of other business organizations; experience as President of the University of Massachusetts; government experience (including as a member of the U.S. House of Representatives); academic experience | ||||
| Maureen B. Mitchell (1951) | Trustee since 2017 Contract Review Committee Member and Governance Committee Member | Retired; formerly President, Global Sales and Marketing, GE Asset Management, Inc. (financial services) | 52 Director, Sterling Bancorp (Bank) | Experience on the Board; financial services industry and executive experience (including role as president of global sales and marketing at a financial services company) | ||||
101 |
Table of Contents
Trustee and Officer Information
Name and Year of Birth | Position(s) Held of Office1 | Principal 5 Years | Number of 5 Years | Experience, | ||||
INDEPENDENT TRUSTEES continued | ||||||||
| James P. Palermo (1955) | Trustee since 2016 Contract Review Committee Member | Founding Partner, Breton Capital Management, LLC (private equity); Partner, STEP Partners, LLC (private equity) | 52 Director, FutureFuel.io (Chemicals and Biofuels) | Experience on the Board; financial services industry and executive experience (including roles as chief executive officer of client management and asset servicing for a banking and financial services company) | ||||
| Erik R. Sirri (1958) | Trustee since 2009 Chairperson of the Audit Committee | Professor of Finance at Babson College | 52 None | Significant experience on the Board; experience as Director of the Division of Trading and Markets at the Securities and Exchange Commission; academic experience; training as an economist | ||||
| Peter J. Smail (1952) | Trustee since 2009 Audit Committee Member and Governance Committee Member | Retired | 52 None | Significant experience on the Board; mutual fund industry and executive experience (including roles as president and chief executive officer for an investment adviser) | ||||
| 102
Table of Contents
Trustee and Officer Information
Name and Year of Birth | Position(s) Held of Office1 | Principal 5 Years | Number of 5 Years | Experience, | ||||
INDEPENDENT TRUSTEES continued | ||||||||
| Kirk A. Sykes (1958) | Trustee since 2019 Contract Review Committee Member | Managing Director of Accordia Partners, LLC (real estate development); President of Primary Corporation (real estate development); Managing Principal of Merrick Capital Partners (infrastructure finance); formerly, President of Urban Strategy America Fund (real estate fund manager) | 52 Trustee, Eastern Bank (bank); formerly Director, Ares Commercial Real Estate Corporation (real estate investment trust) | Experience on the Board and significant experience on the boards of other business organizations (including real estate companies and banks) | ||||
| Cynthia L. Walker (1956) | Trustee since 2005 Chairperson of the Governance Committee and Audit Committee Member | Deputy Dean for Finance and Administration, Yale University School of Medicine | 52 None | Significant experience on the Board; executive experience in a variety of academic organizations (including roles as dean for finance and administration) | ||||
103 |
Table of Contents
Trustee and Officer Information
Name and Year of Birth | Position(s) Held of Office1 | Principal 5 Years | Number of 5 Years | Experience, | ||||
| INTERESTED TRUSTEES | ||||||||
| Kevin P. Charleston3 (1965) One Financial Center Boston, MA 02111 | Trustee since 2015 | President, Chief Executive Officer and Chairman of the Board of Directors; formerly, Chief Financial Officer, Loomis, Sayles & Company, L.P. | 52 None | Experience on the Board; continuing service as President, Chief Executive Officer and Chairman of the Board of Directors of Loomis, Sayles & Company, L.P. | ||||
| David L. Giunta4 (1965) | Trustee since 2011 President and Chief Executive Officer of Natixis Funds Trust I; President of Loomis Sayles Funds II since 2008; Chief Executive Officer of Loomis Sayles Funds II since 2015 | President and Chief Executive Officer, Natixis Advisors, L.P., Natixis Distribution, L.P., Natixis Distribution Corporation and Chairman of the Board of Natixis Distribution Corporation | 52 None | Significant experience on the Board; experience as President and Chief Executive Officer, Natixis Advisors, L.P., Natixis Distribution, L.P., Natixis Distribution Corporation and Chairman of the Board of Natixis Distribution Corporation | ||||
| 1 | Each trustee serves until retirement, resignation or removal from the Board. The current retirement age is 75. The position of Chairperson of the Board is appointed for a three-year term. Mr. Drucker was appointed to serve an additional one year term as the Chairperson of the Board on June 12, 2019. |
| 2 | The trustees of the Trusts serve as trustees of a fund complex that includes all series of the Natixis Funds Trust I, Natixis Funds Trust II, Natixis Funds Trust IV, Gateway Trust, Loomis Sayles Funds I, Loomis Sayles Funds II and Natixis ETF Trust (collectively, the “Fund Complex”). |
| 3 | Mr. Charleston is deemed an “interested person” of the Trusts because he holds the following positions with an affiliated person of the Trusts: President, Chief Executive Officer and Chairman of the Board of Directors of Loomis, Sayles & Company, L.P. |
| 4 | Mr. Giunta is deemed an “interested person” of the Trusts because he holds the following positions with an affiliated person of the Trusts: President and Chief Executive Officer, Natixis Advisors, L.P., Natixis Distribution, L.P., Natixis Distribution Corporation and Chairman of the Board of Natixis Distribution Corporation. |
| 104
Table of Contents
Trustee and Officer Information
Name and Year of Birth | Position(s) Held with the Trusts | Term of Office1 and Length of Time Served | Principal Occupation(s) During Past 5 Years2 | |||
| OFFICERS OF THE TRUSTS | ||||||
| Daniel J. Fuss (1933) One Financial Center Boston, MA 02111 | Executive Vice President of Loomis Sayles Funds II | Since 2003 | Vice Chairman and Director, Loomis, Sayles & Company, L.P. | |||
| Russell L. Kane (1969) | Secretary, Clerk and Chief Legal Officer | Since 2016 | Executive Vice President, General Counsel, Secretary and Clerk, Natixis Distribution Corporation, Natixis Advisors, L.P. and Natixis Distribution, L.P.; formerly, Chief Compliance Officer for Mutual Funds, Senior Vice President, Deputy General Counsel, Assistant Secretary and Assistant Clerk, Natixis Distribution Corporation, Natixis Advisors, L.P. and Natixis Distribution, L.P. | |||
| Michael C. Kardok (1959) | Treasurer, Principal Financial and Accounting Officer | Since 2004 (since 2007 for Gateway Trust and 2011 for Natixis ETF Trust) | Senior Vice President, Natixis Advisors, L.P. and Natixis Distribution, L.P. | |||
| Kirk D. Johnson (1981) | Chief Compliance Officer, Assistant Secretary and Anti-Money Laundering Officer | Since 2018 | Senior Vice President, Deputy General Counsel, Assistant Secretary and Assistant Clerk, Natixis Distribution Corporation, Natixis Advisors, L.P. and Natixis Distribution, L.P.; formerly, Associate General Counsel, Natixis Distribution, L.P.; Vice President and Counsel, Natixis Investment Managers, L.P. | |||
| 1 | Each officer of the Trusts serves for an indefinite term in accordance with the Trusts’ currentby-laws until the date his or her successor is elected and qualified, or until he or she sooner dies, retires, is removed or becomes disqualified. |
| 2 | Each person listed above, except as noted, holds the same position(s) with the Fund Complex. Previous positions during the past five years with Natixis Distribution, L.P., Natixis Advisors, L.P. or Loomis, Sayles & Company, L.P. are omitted, if not materially different from an officer’s current position with such entity. |
105 |
Table of Contents
Item 2. Code of Ethics.
The Registrant has adopted a code of ethics that applies to the Registrant’s principal executive officer, principal financial officer and persons performing similar functions. There have been no amendments or waivers of the Registrant’s code of ethics during the period.
Item 3. Audit Committee Financial Expert.
The Board of Trustees of the Registrant has established an audit committee. Mr. Edmond J. English, Mr. Martin T. Meehan, Mr. Peter Smail, Mr. Erik R. Sirri and Ms. Cynthia L. Walker are members of the audit committee and have been designated as “audit committee financial experts” by the Board of Trustees. Each of these individuals is also an Independent Trustee of the Registrant.
Item 4. Principal Accountant Fees and Services.
Fees billed by the Principal Accountant for services rendered to the Registrant.
The table below sets forth fees billed by the principal accountant, PricewaterhouseCoopers LLP, for the past two fiscal years for professional services rendered in connection with a) the audit of the Registrant’s annual financial statements and services provided in connection with regulatory filings; b) audit-related services (including services that are reasonably related to the performance of the audit of the Registrant’s financial statements but not reported under “Audit Fees”); c) tax compliance, tax advice and tax planning and d) all other fees billed for professional services rendered by the principal accountant to the Registrant, other than the services reported as a part of (a) through (c) of this Item.
| Audit fees | Audit-related fees1 | Tax fees2 | All other fees | |||||||||||||||||||||||||||||
| 10/1/17- 9/30/18 | 10/1/18- 9/30/19 | 10/1/17- 9/30/18 | 10/1/18- 9/30/19 | 10/1/17- 9/30/18 | 10/1/18- 9/30/19 | 10/1/17- 9/30/18 | 10/1/18- 9/30/19 | |||||||||||||||||||||||||
Loomis Sayles Funds II | $ | 345,589 | $ | 251,137 | $ | 4,749 | $ | 3,667 | $ | 65,572 | $ | 43,725 | $ | — | $ | — | ||||||||||||||||
| 1. | Audit-related fees consist of: |
2018 & 2019– performance of agreed-upon procedures related to the Registrant’s deferred compensation plan.
| 2. | Tax fees consist of: |
2018 & 2019– review of Registrant’s tax returns.
Aggregate fees billed to the Registrant fornon-audit services during 2018 and 2019 were $70,321 and $47,392, respectively.
Fees billed by the Principal Accountant for services rendered to the Adviser and Control Affiliates.
The following table sets forth the fees billed by the Registrant’s principal accountant fornon-audit services rendered to Loomis, Sayles & Company, L.P. and entities controlling, controlled by or under common control with Loomis, Sayles & Company, L.P. Registrant (“Control Affiliates”) that provide ongoing services to the Registrant, for engagements that related directly to the operations and financial reporting of the Registrant for the last two fiscal years.
| Audit-related fees | Tax fees | All other fees | ||||||||||||||||||||||
| 10/1/17- 9/30/18 | 10/1/18- 9/30/19 | 10/1/17- 9/30/18 | 10/1/18- 9/30/19 | 10/1/17- 9/30/18 | 10/1/18- 9/30/19 | |||||||||||||||||||
Control Affiliates | $ | — | $ | — | $ | — | $ | — | $ | — | $ | — | ||||||||||||
Table of Contents
The following table sets forth the aggregate fees billed by the Registrant’s principal accountant fornon-audit services rendered to Loomis, Sayles & Company, L.P. and Control Affiliates that provide ongoing services to the Registrant, for the last two fiscal years, including the fees disclosed in the table above.
| AggregateNon-Audit Fees | ||||||||
| 10/1/17-9/30/18 | 10/1/18-9/30/19 | |||||||
Control Affiliates | $ | 62,411 | $ | 32,252 | ||||
None of the services described above were approved pursuant to (c)(7)(i)(C) of RegulationS-X.
Audit Committee Pre Approval Policies.
Annually, the Registrant’s Audit Committee reviews the audit, audit-related, tax and othernon-audit services together with the projected fees, for services proposed to be rendered to the Trust and/or other entities for whichpre-approval is required during the upcoming year. Any subsequent revisions to alreadypre-approved services or fees (including fee increases) and requests forpre-approval of new services would be presented for consideration quarterly as needed.
If, in the opinion of management, a proposed engagement by the Registrant’s independent accountants needs to commence before the next regularly scheduled Audit Committee meeting, any member of the Audit Committee who is an independent Board member is authorized topre-approve the engagement, but only for engagements to provide audit, audit related and tax services. This approval is subject to review of the full Audit Committee at its next quarterly meeting. All other engagements require the approval of all the members of the Audit Committee.
Item 5. Audit Committee of Listed Registrants.
Not applicable.
Item 6. Schedule of Investments.
Included as part of the Report to Shareholders filed as Item 1 herewith.
Item 7. Disclosure of Proxy Voting Policies and Procedures forClosed-End Management Investment Companies.
Not applicable.
Item 8. Portfolio Managers ofClosed-End Management Investment Companies
Not applicable.
Item 9. Purchases of Equity Securities byClosed-End Management Investment Companies and Affiliated Purchasers.
Not applicable.
Item 10. Submission of Matters to a Vote of Securities Holders.
There were no material changes to the procedures by which shareholders may recommend nominees to the Registrant’s Board of Trustees.
Item 11. Controls and Procedures.
The Registrant’s principal executive officer and principal financial officer have concluded that the Registrant’s disclosure controls and procedures are sufficient to ensure that information required to be disclosed by the Registrant in this FormN-CSR was recorded, processed, summarized and reported within the time periods specified in the Securities and Exchange Commission’s rules and forms, based upon such officers’ evaluation of these controls and procedures as of a date within 90 days of the filing date of the report.
Table of Contents
There were no changes in the Registrant’s internal control over financial reporting that occurred during the period covered by the report that have materially affected, or is reasonably likely to materially affect, the Registrant’s internal control over financial reporting.
Item 12. Disclosure of Securities Lending Activities forClosed-End Management Investment Companies.
Not applicable.
Item 13. Exhibits.
| (a) (1) | Code of Ethics required by Item 2 hereof, filed herewith as Exhibit (a)(1). | |
| (a) (2) | Certifications of Principal Executive Officer and Principal Financial Officer pursuant to Rule30a-2(a) under the Investment Company Act of 1940 (17 CFR270.30a-2(a)), filed herewith as Exhibits (a)(2)(1) and (a)(2)(2), respectively. | |
| (a) (3) | Not applicable. | |
| (b) | Certification of Principal Executive Officer and Principal Financial Officer pursuant to Section 906 of Sarbanes-Oxley Act of 2002 are filed herewith as Exhibit (b). | |
Table of Contents
SIGNATURES
Pursuant to the requirements of the Securities Exchange Act of 1934 and the Investment Company Act of 1940, the Registrant has duly caused this report to be signed on its behalf by the undersigned, thereunto duly authorized.
| Loomis Sayles Funds II | ||
| By: | /s/ David L. Giunta | |
| Name: | David L. Giunta | |
| Title: | President and Chief Executive Officer | |
| Date: | November 21, 2019 | |
Pursuant to the requirements of the Securities Exchange Act of 1934 and the Investment Company Act of 1940, this report has been signed by the following persons on behalf of the Registrant and in the capacities and on the dates indicated.
| By: | /s/ David L. Giunta | |
| Name: | David L. Giunta | |
| Title: | President and Chief Executive Officer | |
| Date: | November 21, 2019 | |
| By: | /s/ Michael C. Kardok | |
| Name: | Michael C. Kardok | |
| Title: | Treasurer | |
| Date: | November 21, 2019 | |