Table of Contents
UNITED STATES
SECURITIES AND EXCHANGE COMMISSION
Washington, D.C. 20549
FORMN-CSR
CERTIFIED SHAREHOLDER REPORT OF REGISTERED
MANAGEMENT INVESTMENT COMPANIES
Investment Company Act file number:811-06241
Loomis Sayles Funds II
(Exact name of Registrant as specified in charter)
888 Boylston Street, Suite 800 Boston, Massachusetts 02199-8197
(Address of principal executive offices) (Zip code)
Russell L. Kane, Esq.
Natixis Distribution, L.P.
888 Boylston Street, Suite 800 Boston, Massachusetts 02199-8197
(Name and address of agent for service)
Registrant’s telephone number, including area code: (617)449-2822
Date of fiscal year end: December 31
Date of reporting period: December 31, 2019
Table of Contents
Item 1. Reports to Stockholders.
The Registrant’s annual report transmitted to shareholders pursuant to Rule30e-1 under the Investment Company Act of 1940 is as follows:
Table of Contents


Annual Report
December 31, 2019
Loomis Sayles High Income Fund
Loomis Sayles Investment Grade Bond Fund
Loomis Sayles Multi-Asset Income Fund
| Portfolio Review | 1 | |||
| Portfolio of Investments | 17 | |||
| Financial Statements | 57 | |||
| Notes to Financial Statements | 76 | |||
IMPORTANT NOTICE TO SHAREHOLDERS
Beginning on January 1, 2021, as permitted by regulations adopted by the Securities and Exchange Commission, paper copies of shareholder reports like this one will no longer be sent by mail, unless you specifically request paper copies of the reports from the Fund or from your financial intermediary, such as a broker-dealer or bank. Instead, the reports will be made available on the Funds’ website, and you will be notified by mail each time a report is posted and provided with a website link to access the report. If you wish to continue receiving paper copies of your shareholder reports after January 1, 2021, you can inform the Fund at any time by calling 1-800-225-5478. If you hold your account with a financial intermediary and you wish to continue receiving paper copies after January 1, 2021, you should call your financial intermediary directly. Paper copies are provided free of charge, and your election to receive reports in paper will apply to all funds held with the Natixis Funds complex. If you have already elected to receive shareholder reports electronically, you will not be affected by this change and you need not take any action. You currently may elect to receive shareholder reports and other communications from the Fund or your financial intermediary electronically at www.icsdelivery.com/natixisfunds.
Table of Contents
LOOMIS SAYLES HIGH INCOME FUND
| Managers | Symbols | |
| Matthew J. Eagan, CFA® | Class A NEFHX | |
| Brian P. Kennedy | Class C NEHCX | |
| Elaine M. Stokes | Class N LSHNX | |
| Todd P. Vandam, CFA® | Class Y NEHYX | |
| Loomis, Sayles & Company, L.P. | ||
Investment Goal
The Fund seeks high current income plus the opportunity for capital appreciation to produce a high total return.
Market Conditions
The fixed income markets produced robust returns in 2019, reflecting global central banks’ shift to more accommodative policies. A backdrop of moderate economic growth and low inflation provided the US Federal Reserve (the “Fed”) with the latitude to lower interest rates by a quarter point on three occasions in the span from July to October. While the Fed subsequently made it clear that it was unlikely to enact any further cuts in the near future barring a meaningful slowdown in growth, investors remained confident that it would keep rates steady throughout 2020. A number of other world central banks followed the Fed’s move toward easier policy, highlighted by the European Central Bank’s pledge to restart its stimulative quantitative easing program.
US Treasuries performed well in this environment, with falling yields (and rising prices) for bonds of all maturities. The yield on the bellwether 10-year note fell from 2.69% to 1.92% in 2019, while the two-year issue moved from 2.48% to 1.58%. As a result, the yield curve steepened compared to its level of December 31, 2018. The Treasury market reached its peak in late August, at which point yields began to tick higher as investors factored in improving economic data and the apparently low likelihood of further cuts in the coming year.
High-grade corporate bonds performed very well and finished the year as one of the best performing areas of the bond market. In addition to benefiting from the decline in Treasury yields, the asset class was helped by continued spread compression and elevated demand for high quality investments.
Lower-quality corporate debt also rallied in 2019 as the search for yield continued. The category was boosted by broad strength across higher-risk assets, an accommodative Fed and a benign economic outlook for 2020.
Domestic inflation remained tame, mirroring a trend that was in place across the globe. After flirting with the 2% level in late 2018, US core personal consumption expenditure inflation (which excludes food and energy) settled into a range between 1.5% and 1.7% from February onward. Low inflation was one of the key factors providing the Fed and foreign central banks with the ability to loosen policy in order to address slowing growth.
1 |
Table of Contents
Performance Results
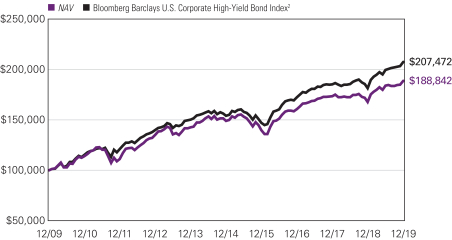
For the 12 months ended December 31, 2019, Class Y shares of the Loomis Sayles High Income Fund returned 12.52% at net asset value. The Fund underperformed its benchmark, the Bloomberg Barclays U.S. Corporate High-Yield Bond Index, which returned 14.32%.
Explanation of Fund Performance
Security selection was the primary source of underperformance for the year. Within convertibles, selected energy holdings weighed on returns. Allocations to securitized issues and defensive reserve-like positions were also detractors as they underperformed higher-yielding securities during the period.
The Fund’s longer-than-benchmark positioning with respect to duration (and corresponding interest rate sensitivity) aided relative performance as yields declined over the period. Emerging market credit exposure positively contributed to performance as well, led by basic industry, consumer non-cyclical and government-related names. Finally, security selection within investment grade credit positively impacted performance during the year, most notably holdings of electric, banking and technology issues.
Outlook
We continue to believe we are late in the credit cycle1 rather than at the end of it. Probabilities of a shift to a downturn in the cycle declined over the fourth quarter as the Fed provided additional rate cuts, a phase one deal with China became increasingly likely and odds of a no-deal Brexit declined. We do not see the US economy sliding into recession in 2020. These developments fueled further support for corporate bonds and risk assets, driving valuations up and delivering a strong year for fixed income assets in 2019.
Our macro outlook remains benign and the market backdrop has largely remained supportive. We believe that Fed rate cuts and relatively good news on trade and Brexit will allow the United States to emerge from a third “mini cycle” slow down within this long running late cycle phase without a recession. We expect global manufacturing to continue to improve into 2020 as uncertainty regarding global trade declines. We anticipate that slow, but positive, global growth will continue and that this will help support mid-single digit corporate profit growth and allow for reasonably strong corporate credit metrics in 2020.
We expect the US Fed to remain on hold for most, if not all, of 2020. Inflation remains well contained. Overall yield levels in the United States should remain within current established ranges, although there could be some modest upward pressure on yields should the global macro environment firm more quickly on better-than-expected news on the trade front. From a duration perspective, we remain modestly short relative to the broad market. Nonetheless, global developed market yields will likely remain low and relatively high US yields should be a supportive technical factor for US bonds.
The double-barreled market rally of lower yields and tighter spreads has pushed valuations on corporate bonds higher. High yield and investment grade corporate bond risk premiums declined over the course of 2019. While we believe that the global demand for yield and a continued late cycle environment can support spreads at current levels, we expect returns to be
| 2
Table of Contents
LOOMIS SAYLES HIGH INCOME FUND
based more on carry in 2020. We believe corporate credit quality will continue to marginally decline but not enough to cause a dramatic move wider in spreads or a large uptick in corporate defaults. That said, we retain a cautious and “up in quality” bias. By historic standards we have less exposure to high yield bonds than usual, while retaining relatively high liquidity which can be deployed should opportunities develop within the sector.
We continue to strive for positive issue selection through our credit research efforts. Our portfolios are dominated by credits we believe are attractively priced relative to the credit quality we assign them. Communications and cable and media issues account for the bulk of this exposure, along with select areas within consumer cyclical. We believe that opportunities for positive carry in emerging market corporate bonds could expand should global growth strengthen. While we have pulled back some of our energy exposure, we believe sentiment regarding the sector has become too negative relative to the actual fundamentals. Accordingly, we believe there is upside potential for some of our best picks in this sector.
We also remain comfortable with the securitized sector, which largely lagged the bigger moves in other fixed income sectors in 2019. We still like the defensive nature of the sector based on good carry for higher quality.
Overall, we believe that the large rally seen in 2019 presents a challenge to fixed income return potential in 2020. However, some of those same market drivers could provide support as we enter a new year. These include global demand for yield, reduced uncertainty on global trade and Brexit, and positive global growth. The late cycle environment is likely to continue. We remain focused on maintaining favorable carry/yield, seeking to identify attractively priced bonds and retaining the liquidity and flexibility to adapt should the benign market conditions deteriorate.
| 1 | A credit cycle is a cyclical pattern that follows credit availability and corporate health. |
Hypothetical Growth of $100,000 Investment in Class Y Shares3
December 31, 2009 through December 31, 2019
3 |
Table of Contents
Average Annual Total Returns — December 31, 20193
| Expense Ratios4 | ||||||||||||||||||||||||
| 1 Year | 5 Years | 10 Years | Life of Class N | Gross | Net | |||||||||||||||||||
| Class Y (Inception 2/29/08) | ||||||||||||||||||||||||
| NAV | 12.52 | % | 4.84 | % | 6.56 | % | — | % | 1.02 | % | 0.75 | % | ||||||||||||
| Class A (Inception 2/22/84) | ||||||||||||||||||||||||
| NAV | 11.94 | 4.51 | 6.25 | — | 1.27 | 1.00 | ||||||||||||||||||
| With 4.25% Maximum Sales Charge | 7.11 | 3.61 | 5.79 | — | ||||||||||||||||||||
| Class C (Inception 3/2/98) | ||||||||||||||||||||||||
| NAV | 11.32 | 3.76 | 5.46 | — | 2.02 | 1.75 | ||||||||||||||||||
| With CDSC1 | 10.32 | 3.76 | 5.46 | — | ||||||||||||||||||||
| Class N (Inception 11/30/16) | ||||||||||||||||||||||||
| NAV | 12.28 | — | — | 5.86 | 0.89 | 0.70 | ||||||||||||||||||
| Comparative Performance | ||||||||||||||||||||||||
| Bloomberg Barclays U.S.Corporate High-Yield Bond Index2 | 14.32 | 6.13 | 7.57 | 6.80 | ||||||||||||||||||||
Performance data shown represents past performance and is no guarantee of, and not necessarily indicative of, future results. Total return and value will vary, and you may have a gain or loss when shares are sold. Current performance may be lower or higher than quoted. For most recent month-end performance, visit im.natixis.com. Performance for other share classes will be greater or less than shown based on differences in fees and sales charges. You may not invest directly in an index. Performance for periods less than one year is cumulative, not annualized. Returns reflect changes in share price and reinvestment of dividends and capital gains, if any. The table(s) do not reflect taxes shareholders might owe on any fund distributions or when they redeem their shares.
| 1 | Class C shares performance assumes a 1% CDSC applied when you sell shares within one year of purchase. |
| 2 | The Bloomberg Barclays U.S. Corporate High-Yield Bond Index measures the market of USD-denominated, non-investment grade, fixed-rate, taxable corporate bonds. Securities are classified as high yield if the middle rating of Moody’s, Fitch, and S&P is Ba1/BB+/BB+ or below, excluding emerging market debt. The Bloomberg Barclays U.S. Corporate High-Yield Bond Index was created in 1986, with history backfilled to July 1, 1983, and rolls up into the Bloomberg Barclays U.S. Universal and Global High-Yield Indices. |
| 3 | Fund performance has been increased by fee waivers and/or expense reimbursements, if any, without which performance would have been lower. |
| 4 | Expense ratios are as shown in the Fund’s prospectus in effect as of the date of this report. The expense ratios for the current reporting period can be found in the Financial Highlights section of this report under Ratios to Average Net Assets. Net expenses reflect contractual expense limitations set to expire on 4/30/21. When a Fund’s expenses are below the limitation, gross and net expense ratios will be the same. See Note 6 of the Notes to Financial Statements for more information about the Fund’s expense limitations. |
| 4
Table of Contents
LOOMIS SAYLES INVESTMENT GRADE BOND FUND
| Managers | Symbols | |||
| Matthew J. Eagan, CFA® | Class A | LIGRX | ||
| Brian P. Kennedy | Class C | LGBCX | ||
| Elaine M. Stokes | Class N | LGBNX | ||
| Loomis, Sayles & Company, L.P. | Class Y | LSIIX | ||
| Admin Class | LIGAX | |||
Investment Goal
The Fund seeks high total investment return through a combination of current income and capital appreciation.
Market Conditions
The fixed income markets produced robust returns in 2019, reflecting global central banks’ shift to more accommodative policies. A backdrop of moderate economic growth and low inflation provided the US Federal Reserve (the “Fed”) with the latitude to lower interest rates by a quarter point on three occasions in the span from July to October. While the Fed subsequently made it clear that it was unlikely to enact any further cuts in the near future barring a meaningful slowdown in growth, investors remained confident that it would keep rates steady throughout 2020. A number of other world central banks followed the Fed’s move toward easier policy, highlighted by the European Central Bank’s pledge to restart its stimulative quantitative easing program.
US Treasuries performed well in this environment, with falling yields (and rising prices) for bonds of all maturities. The yield on the bellwether 10-year note fell from 2.69% to 1.92% in 2019, while the two-year issue moved from 2.48% to 1.58%. As a result, the yield curve steepened compared to its level of December 31, 2018. The Treasury market reached its peak in late August, at which point yields began to tick higher as investors factored in improving economic data and the apparently low likelihood of further cuts in the coming year.
High-grade corporate bonds performed very well and finished the year as one of the best performing areas of the bond market. In addition to benefiting from the decline in Treasury yields, the asset class was helped by continued spread compression and elevated demand for high quality investments.
Lower-quality corporate debt also rallied in 2019 as the search for yield continued. The category was boosted by broad strength across higher-risk assets, an accommodative Fed and a benign economic outlook for 2020.
Domestic inflation remained tame, mirroring a trend that was in place across the globe. After flirting with the 2% level in late 2018, US core personal consumption expenditure inflation (which excludes food and energy) settled into a range between 1.5% and 1.7% from February onward. Low inflation was one of the key factors providing the Fed and foreign central banks with the ability to loosen policy in order to address slowing growth.
5 |
Table of Contents
Performance Results
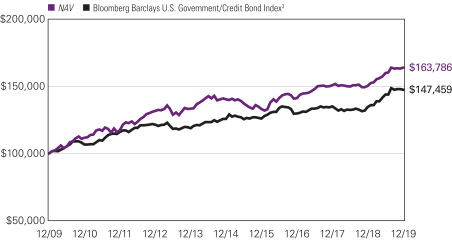
For the 12 months ended December 31, 2019, Class Y shares of the Loomis Sayles Investment Grade Bond Fund returned 9.04% at net asset value. The Fund underperformed its benchmark, the Bloomberg Barclays U.S. Government/Credit Bond Index, which returned 9.71%.
Explanation of Fund Performance
The Fund’s overall shorter-than-benchmark positioning with respect to duration weighed on return as interest rates declined over the period. Exposure to securitized issues had the largest negative impact on relative performance as the sector lagged both corporate credit and Treasuries. Additionally, holdings of defensive reserve-like positions detracted as these underperformed higher-yielding issues during the period.
A significant underweight to US Treasuries bolstered relative performance. An allocation to high yield corporate credit positively impacted performance during the year, aided by consumer non-cyclical, energy and banking names. Emerging market credit exposure also generated positive relative return, with metals & mining and government-related issues as top performers.
Outlook
We continue to believe we are late in the credit cycle1 rather than at the end of it. Probabilities of a shift to a downturn in the cycle declined over the fourth quarter as the Fed provided additional rate cuts, a phase one deal with China became increasingly likely and odds of a no-deal Brexit declined. We do not see the US economy sliding into recession in 2020. These developments fueled further support for corporate bonds and risk assets, driving valuations up and delivering a strong year for fixed income assets in 2019.
Our macro outlook remains benign and the market backdrop has largely remained supportive. We believe that Fed rate cuts and relatively good news on trade and Brexit will allow the US to emerge from a third “mini cycle” slow down within this long running late cycle phase without a recession. We expect global manufacturing to continue to improve into 2020 as uncertainty regarding global trade declines. We anticipate that slow, but positive, global growth will continue and that this will help support mid-single digit corporate profit growth and allow for reasonably strong corporate credit metrics in 2020.
We expect the Fed to remain on hold for most, if not all, of 2020. Inflation remains well contained. Overall yield levels in the United States should remain within current established ranges, although there could be some modest upward pressure on yields should the global macro environment firm more quickly on better-than-expected news on the trade front. From a duration perspective, we remain modestly short relative to the broad market. Nonetheless, global developed market yields will likely remain low and relatively high US yields should be a supportive technical factor for US bonds.
The double-barreled market rally of lower yields and tighter spreads has pushed valuations on corporate bonds higher. High yield and investment grade corporate bond risk premiums declined over the course of 2019. While we believe that the global demand for yield and a continued late cycle environment can support spreads at current levels, we expect returns to be
| 6
Table of Contents
LOOMIS SAYLES INVESTMENT GRADE BOND FUND
based more on carry in 2020. We believe corporate credit quality will continue to marginally decline but not enough to cause a dramatic move wider in spreads or a large uptick in corporate defaults. That said, we retain a cautious and “up in quality” bias. By historic standards we have less exposure to high yield bonds than usual, while retaining relatively high liquidity which can be deployed should opportunities develop within the sector.
We continue to strive for positive issue selection through our credit research efforts. Our portfolios are dominated by credits we believe are attractively priced relative to the credit quality we assign them. Communications and cable and media issues account for the bulk of this exposure, along with select areas within consumer cyclical. We believe that opportunities for positive carry in emerging market corporate bonds could expand should global growth strengthen. While we have pulled back some of our energy exposure, we believe sentiment regarding the sector has become too negative relative to the actual fundamentals. Accordingly, we believe there is upside potential for some of our best picks in this sector.
We also remain comfortable with the securitized sector, which largely lagged the bigger moves in other fixed income sectors in 2019. We still like the defensive nature of the sector based on good carry for higher quality.
Overall, we believe that the large rally seen in 2019 presents a challenge to fixed income return potential in 2020. However, some of those same market drivers could provide support as we enter a new year. These include global demand for yield, reduced uncertainty on global trade and Brexit, and positive global growth. The late cycle environment is likely to continue. We remain focused on maintaining favorable carry/yield, seeking to identify attractively priced bonds and retaining the liquidity and flexibility to adapt should the benign market conditions deteriorate.
| 1 | A credit cycle is a cyclical pattern that follows credit availability and corporate health. |
Hypothetical Growth of $100,000 Investment in Class Y Shares4
December 31, 2009 through December 31, 2019
7 |
Table of Contents
Average Annual Total Returns — December 31, 20194
| Expense Ratios5 | ||||||||||||||||||||||||
| 1 Year | 5 Years | 10 Years | Life of Class N | Gross | Net | |||||||||||||||||||
| Class Y (Inception 12/31/96) | ||||||||||||||||||||||||
| NAV | 9.04 | % | 3.16 | % | 5.06 | % | — | % | 0.57 | % | 0.51 | % | ||||||||||||
| Class A (Inception 12/31/96) | ||||||||||||||||||||||||
| NAV | 8.78 | 2.90 | 4.79 | — | 0.82 | 0.76 | ||||||||||||||||||
| With 4.25% Maximum Sales Charge | 4.14 | 2.01 | 4.33 | — | ||||||||||||||||||||
| Class C (Inception 9/12/03) | ||||||||||||||||||||||||
| NAV | 7.94 | 2.12 | 4.01 | — | 1.57 | 1.51 | ||||||||||||||||||
| With CDSC2 | 6.94 | 2.12 | 4.01 | — | ||||||||||||||||||||
| Class N (Inception 2/1/13) | ||||||||||||||||||||||||
| NAV | 9.11 | 3.25 | — | 3.20 | 0.48 | 0.46 | ||||||||||||||||||
| Admin Class (Inception 2/1/10)1 | ||||||||||||||||||||||||
| NAV | 8.43 | 2.67 | 4.54 | — | 1.07 | 1.01 | ||||||||||||||||||
| Comparative Performance | ||||||||||||||||||||||||
| Bloomberg Barclays U.S. Government/Credit Bond Index3 | 9.71 | 3.23 | 3.96 | 2.97 | ||||||||||||||||||||
Performance data shown represents past performance and is no guarantee of, and not necessarily indicative of, future results. Total return and value will vary, and you may have a gain or loss when shares are sold. Current performance may be lower or higher than quoted. For most recent month-end performance, visit im.natixis.com. Performance for other share classes will be greater or less than shown based on differences in fees and sales charges. You may not invest directly in an index. Performance for periods less than one year is cumulative, not annualized. Returns reflect changes in share price and reinvestment of dividends and capital gains, if any. The table(s) do not reflect taxes shareholders might owe on any fund distributions or when they redeem their shares.
| 1 | Prior to the inception of Admin Class shares (2/1/10), performance is that of Class A shares, restated to reflect the higher net expenses of Admin Class shares. |
| 2 | Performance for Class C shares assumes a 1% contingent deferred sales charge (“CDSC”) applied when you sell shares within one year of purchase. |
| 3 | The Bloomberg Barclays U.S. Government/Credit Bond Index is the non-securitized component of the U.S. Aggregate Index and was the first macro index launched by Barclays Capital. The U.S. Government/Credit Bond Index includes investment grade, US dollar denominated, fixed rate Treasuries (i.e., public obligations of the U.S. Treasury that have remaining maturities of more than one year), government-related issues (i.e., agency, sovereign, supranational, and local authority debt), and corporate securities. The U.S. Government/Credit Index was launched on January 1, 1979, with index history backfilled to 1973, and is a subset of the Bloomberg Barclays U.S. Aggregate Index. |
| 4 | Fund performance has been increased by fee waivers and/or expense reimbursements, if any, without which performance would have been lower. |
| 5 | Expense ratios are as shown in the Fund’s prospectus in effect as of the date of this report. The expense ratios for the current reporting period can be found in the Financial Highlights section of this report under Ratios to Average Net Assets. Net expenses reflect contractual expense limitations set to expire on 4/30/21. When a Fund’s expenses are below the limitation, gross and net expense ratios will be the same. See Note 6 of the Notes to Financial Statements for more information about the Fund’s expense limitations. |
| 8
Table of Contents
LOOMIS SAYLES MULTI-ASSET INCOME FUND
| Managers | Symbols | |||
| Thomas Fahey | Class A | IIDPX | ||
| Kevin Kearns | Class C | CIDPX | ||
| Maura Murphy, CFA® | Class N | LMINX | ||
| Loomis, Sayles & Company, L.P. | Class Y | YIDPX | ||
Investment Goal
The Fund seeks current income with a secondary objective of capital appreciation.
Market Conditions
Subdued inflation has allowed central banks to maintain largely accommodative policies, which have supported risk assets. The US Federal Reserve’s (the “Fed”) indication that it will pause has given way to the expectation of yields to be tightly range bound.
Despite persistently soft data, some signs have been seen to indicate that the manufacturing slowdown may be bottoming out. Easy monetary policy has largely been used to counteract anemic global growth encumbered by the manufacturing slowdown.
Risk assets have been supported by the macro risk landscape softening in several regards since the end of the previous year. Central banks have shown a willingness to continue economic stimulus through monetary policy. The likelihood of a no deal Brexit appears to have diminished with negotiations spanning multiple Brexit deadlines. Trade negotiations between China and the US seem to have taken on a less tenuous tone; suggesting a lower probability of escalation and higher probability of a “phase one” agreement being reached.
Performance Results
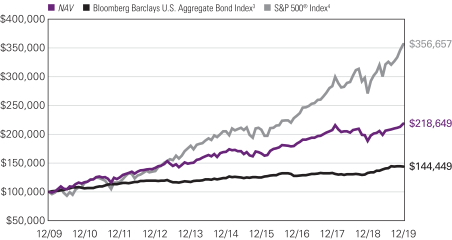
For the 12 months ended December 31, 2019, Class Y shares of the Loomis Sayles Multi-Asset Income Fund returned 15.80% at net asset value. The Fund outperformed its primary benchmark, the Bloomberg Barclays U.S. Aggregate Bond Index, which returned 8.72%.
Explanation of Fund Performance
Our allocation to US dividend-paying equities provided the largest positive contribution to performance for the year. During the period, markets remained focused on the direction of the US/China trade negotiations, the state of the Chinese economy and central bank policy in response to anemic growth and soft manufacturing data. Equity markets were assisted by a Fed that remained largely supportive throughout the year.
Our allocation to preferred stock benefited from a strong equity market and accommodative central bank policy throughout the period. In addition, the Fund’s focus on financial issues within preferreds added to the performance.
Exposure to emerging market fixed income assets aided performance despite a strong dollar. The perceived softening of Chinese trade-related macro risks buoyed the asset class. There remains a concern that a protracted trade conflict between the United States and
9 |
Table of Contents
China could exacerbate the global growth slowdown and increase pressure on export-driven economies. The focus within emerging markets remains on China regarding both its trade relations with the US and its pace of growth. Within the portfolio, the most significant contributions came from our Brazilian, Qatari and South African exposures.
An allocation to bank loan assets was the largest detractor during the year. The accommodative tack taken by the Fed throughout the year created headwinds for floating rate instruments. Within the portfolio, energy issues had the largest negative impact on performance.
Outlook
While near-term downside risks remain present, we expect to exit the manufacturing slowdown without an economy-wide recession. This view hinges on the idea that the Fed will remain supportive and continue accommodative monetary policy. We project the Fed to remain on hold for the next twelve months. Chair Powell has indicated that a rate cut is unlikely in the near term, barring any significant, unexpected increase in inflation acceleration.
We maintain our cautious outlook on risk sentiment. While the Fed appears likely to continue to maintain an accommodative monetary policy, China’s economic recovery is faltering and risk related to the United States/China trade war remains despite an increased likelihood of a phase one agreement. Markets will remain focused on Chinese stimulus as a potential catalyst for global growth. So far, however, Chinese policy makers have been reluctant to utilize all options available, instead favoring an incremental approach that emphasizes leverage stabilization.
Despite some volatility, the US dollar has essentially traded within a range. We expect a continuation of this theme, which should be supportive for risk assets in general. While there was some dollar weakening during October, we haven’t seen much of a breakout in either direction since. The perception of softening risks related to United States/China trade has caused the dollar’s recent bid as a safe-haven to largely evaporate. Volatility shocks and weakening risk appetite are factors that could prove constructive for the dollar.
The fund closed as of February 3, 2020, and as it closed, primary consideration was given to clients and their interests. There was no unusual market action that affected our trading of the portfolio during liquidation. All fund assets were subsequently redeemed or distributed to fund shareholders.
| 10
Table of Contents
LOOMIS SAYLES MULTI-ASSET INCOME FUND
Hypothetical Growth of $100,000 Investment in Class Y Shares1,5,6
December 31, 2009 through December 31, 2019
Top Ten Holdings as of December 31, 2019
| Security Name | % of Assets | |||||
| 1 | Alerian MLP ETF | 5.06 | % | |||
| 2 | Gol LuxCo S.A., 1st Lien Term Loan, 6.500%, 8/31/2020 | 2.41 | ||||
| 3 | Standard Chartered PLC, (fixed rate to 4/02/2023, variable rate thereafter), 7.750% | 2.30 | ||||
| 4 | Apple, Inc. | 1.98 | ||||
| 5 | HSBC Holdings PLC, (fixed rate to 3/23/2023, variable rate thereafter), 6.250% | 1.92 | ||||
| 6 | Royal Bank of Scotland Group PLC, (fixed rate to 8/10/2025, variable rate thereafter), 8.000% | 1.87 | ||||
| 7 | Banco BTG Pactual SA, (fixed rate to 2/15/2024, variable rate thereafter), 7.750%, 2/15/2029 | 1.86 | ||||
| 8 | Credit Agricole S.A., (fixed rate to 1/23/2024, variable rate thereafter), 7.875% | 1.85 | ||||
| 9 | Microsoft Corp. | 1.76 | ||||
| 10 | Banco Bilbao Vizcaya Argentaria S.A., (fixed rate to 11/16/2027, variable rate thereafter), 6.125% | 1.43 | ||||
The portfolio is actively managed and holdings are subject to change. There is no guarantee the Fund continues to invest in the securities referenced. The holdings listed exclude any temporary cash investments.
11 |
Table of Contents
Average Annual Total Returns — December 31, 20195,6
Life of | Expense Ratios7 | |||||||||||||||||||||||
| 1 Year | 5 Years | 10 Years | Class N | Gross | Net | |||||||||||||||||||
| Class Y (Inception 12/3/12)1 | ||||||||||||||||||||||||
| NAV | 15.80 | % | 5.18 | % | 8.13 | % | — | % | 0.89 | % | 0.75 | % | ||||||||||||
| Class A (Inception 11/17/05) | ||||||||||||||||||||||||
| NAV | 15.39 | 4.92 | 7.98 | — | 1.14 | 1.00 | ||||||||||||||||||
| With 4.25% Maximum Sales Charge | 10.51 | 4.00 | 7.52 | — | ||||||||||||||||||||
| Class C (Inception 11/17/05) | ||||||||||||||||||||||||
| NAV | 14.59 | 4.14 | 7.18 | — | 1.89 | 1.75 | ||||||||||||||||||
| With CDSC2 | 13.59 | 4.14 | 7.18 | — | ||||||||||||||||||||
| Class N (Inception 8/31/15) | ||||||||||||||||||||||||
| NAV | 15.86 | — | — | 6.98 | 1.38 | 0.70 | ||||||||||||||||||
| Comparative Performance | ||||||||||||||||||||||||
| Bloomberg Barclays U.S. Aggregate Bond Index3 | 8.72 | 3.05 | 3.75 | 3.40 | ||||||||||||||||||||
| S&P 500® Index4 | 31.49 | 11.70 | 13.56 | 14.32 | ||||||||||||||||||||
Performance data shown represents past performance and is no guarantee of, and not necessarily indicative of, future results. Total return and value will vary, and you may have a gain or loss when shares are sold. Current performance may be lower or higher than quoted. For most recent month-end performance, visit im.natixis.com. Performance for other share classes will be greater or less than shown based on differences in fees and sales charges. You may not invest directly in an index. Performance for periods less than one year is cumulative, not annualized. Returns reflect changes in share price and reinvestment of dividends and capital gains, if any. The table(s) do not reflect taxes shareholders might owe on any fund distributions or when they redeem their shares.
| 1 | Prior to the inception of Class Y shares (12/3/2012), performance is that of Class A shares and reflects the higher net expenses of that share class. |
| 2 | Class C share performance assumes a 1.00% contingent deferred sales charge (“CDSC”) applied when you sell shares within one year of purchase. |
| 3 | The Bloomberg Barclays U.S. Aggregate Bond Index is an unmanaged index that covers the U.S.-dollar denominated, investment grade, fixed-rate, taxable bond market of SEC-registered securities. The index includes bonds from the Treasury, government-related, corporate, mortgage-backed securities, asset-backed securities, and collateralized mortgage-backed securities sectors. |
| 4 | S&P 500® Index is a widely recognized measure of U.S. stock market performance. It is an unmanaged index of 500 common stocks chosen for market size, liquidity, and industry group representation, among other factors. |
| 5 | Fund performance has been increased by fee waivers and/or expense reimbursements, if any, without which performance would have been lower. |
| 6 | Prior to the stock market close August 31, 2015, the Fund had multiple subadvisers. The performance results shown above for the periods prior to the stock market close August 31, 2015 reflect results achieved by those subadvisers using different investment strategies. |
| 7 | Expense ratios are as shown in the Fund’s prospectus in effect as of the date of this report. The expense ratios for the current reporting period can be found in the Financial Highlights section of this report under Ratios to Average Net Assets. Net expenses reflect contractual expense limitations set to expire on 4/30/20. When a Fund’s expenses are below the limitation, gross and net expense ratios will be the same. See Note 6 of the Notes to Financial Statements for more information about the Fund’s expense limitations. |
| 12
Table of Contents
ADDITIONAL INFORMATION
The views expressed in this report reflect those of the portfolio managers as of the dates indicated. The managers’ views are subject to change at any time without notice based on changes in market or other conditions. References to specific securities or industries should not be regarded as investment advice. Because the Fund is actively managed, there is no assurance that they will continue to invest in the securities or industries mentioned.
All investing involves risk, including the risk of loss. There is no assurance that any investment will meet its performance objectives or that losses will be avoided.
ADDITIONAL INDEX INFORMATION
This document may contain references to third party copyrights, indexes, and trademarks, each of which is the property of its respective owner. Such owner is not affiliated with Natixis Investment Managers or any of its related or affiliated companies (collectively “Natixis Affiliates”) and does not sponsor, endorse or participate in the provision of any Natixis Affiliates services, funds or other financial products.
The index information contained herein is derived from third parties and is provided on an “as is” basis. The user of this information assumes the entire risk of use of this information. Each of the third party entities involved in compiling, computing or creating index information disclaims all warranties (including, without limitation, any warranties of originality, accuracy, completeness, timeliness, non-infringement, merchantability and fitness for a particular purpose) with respect to such information.
PROXY VOTING INFORMATION
A description of the Natixis Funds’ proxy voting policies and procedures is available without charge, upon request, by calling Natixis Funds at 800-225-5478; on the Natixis Funds’ website at im.natixis.com; and on the Securities and Exchange Commission’s (“SEC’s”) website at www.sec.gov. Information regarding how the funds voted proxies relating to portfolio securities during the most recent 12-month period ended June 30 is available from the Natixis Funds’ website and the SEC’s website.
QUARTERLY PORTFOLIO SCHEDULES
Natixis Funds file complete schedules of portfolio holdings with the SEC for the first and third quarters of each fiscal year on Form N-PORT. The Funds’ Forms N-PORT reports are available on the SEC’s website at www.sec.gov.
CFA® and Chartered Financial Analyst® are registered trademarks owned by the CFA Institute.
13 |
Table of Contents
UNDERSTANDING FUND EXPENSES
As a mutual fund shareholder, you incur different costs: transaction costs, including sales charges (loads) on purchases and contingent deferred sales charges on redemptions, and ongoing costs, including management fees, distribution and/or service fees (12b-1 fees), and other fund expenses. Certain exemptions may apply. These costs are described in more detail in the Funds’ prospectuses. The following examples are intended to help you understand the ongoing costs of investing in the Funds and help you compare these with the ongoing costs of investing in other mutual funds.
The first line in the table of each class of Fund shares shows the actual account values and actual Fund expenses you would have paid on a $1,000 investment in the Fund from July 1, 2019 through December 31, 2019. To estimate the expenses you paid over the period, simply divide your account value by $1,000 (for example $8,600 account value divided by $1,000 = 8.6) and multiply the result by the number in the Expenses Paid During Period column as shown below for your class.
The second line in the table of each class of Fund shares provides information about hypothetical account values and hypothetical expenses based on the Fund’s actual expense ratios and an assumed rate of return of 5% per year before expenses, which is not the Fund’s actual return. The hypothetical account values and expenses may not be used to estimate the actual ending account balance or expenses you paid on your investment for the period. You may use this information to compare the ongoing costs of investing in the Fund to other funds. To do so, compare this 5% hypothetical example with the 5% hypothetical examples that appear in the shareholder reports of the other funds.
Please note that the expenses shown reflect ongoing costs only, and do not include any transaction costs, such as sales charges. Therefore, the second line in the table of each fund is useful in comparing ongoing costs only, and will not help you determine the relative costs of owning different funds. If transaction costs were included, total costs would be higher.
| 14
Table of Contents
| LOOMIS SAYLES HIGH INCOME FUND | BEGINNING ACCOUNT VALUE 7/1/2019 | ENDING ACCOUNT VALUE 12/31/2019 | EXPENSES PAID DURING PERIOD* 7/1/2019 – 12/31/2019 | |||||||||
| Class A | ||||||||||||
| Actual | $1,000.00 | $1,022.20 | $5.10 | |||||||||
| Hypothetical (5% return before expenses) | $1,000.00 | $1,020.16 | $5.09 | |||||||||
| Class C | ||||||||||||
| Actual | $1,000.00 | $1,020.50 | $8.91 | |||||||||
| Hypothetical (5% return before expenses) | $1,000.00 | $1,016.38 | $8.89 | |||||||||
| Class N | ||||||||||||
| Actual | $1,000.00 | $1,023.80 | $3.57 | |||||||||
| Hypothetical (5% return before expenses) | $1,000.00 | $1,021.68 | $3.57 | |||||||||
| Class Y | ||||||||||||
| Actual | $1,000.00 | $1,026.00 | $3.83 | |||||||||
| Hypothetical (5% return before expenses) | $1,000.00 | $1,021.43 | $3.82 | |||||||||
| * | Expenses are equal to the Fund’s annualized expense ratio (after waiver/reimbursement): 1.00%, 1.75%, 0.70% and 0.75% for Class A, C, N and Y, respectively, multiplied by the average account value over the period, multiplied by the number of days in the most recent fiscal half-year (184), divided by 365 (to reflect the half-year period). |
| LOOMIS SAYLES INVESTMENT GRADE BOND FUND | BEGINNING ACCOUNT VALUE 7/1/2019 | ENDING ACCOUNT VALUE 12/31/2019 | EXPENSES PAID DURING PERIOD* 7/1/2019 – 12/31/2019 | |||||||||
| Class A | ||||||||||||
| Actual | $1,000.00 | $1,024.40 | $3.88 | |||||||||
| Hypothetical (5% return before expenses) | $1,000.00 | $1,021.37 | $3.87 | |||||||||
| Class C | ||||||||||||
| Actual | $1,000.00 | $1,020.60 | $7.69 | |||||||||
| Hypothetical (5% return before expenses) | $1,000.00 | $1,017.59 | $7.68 | |||||||||
| Class N | ||||||||||||
| Actual | $1,000.00 | $1,026.00 | $2.35 | |||||||||
| Hypothetical (5% return before expenses) | $1,000.00 | $1,022.89 | $2.35 | |||||||||
| Class Y | ||||||||||||
| Actual | $1,000.00 | $1,025.70 | $2.60 | |||||||||
| Hypothetical (5% return before expenses) | $1,000.00 | $1,022.64 | $2.60 | |||||||||
| Admin Class | ||||||||||||
| Actual | $1,000.00 | $1,023.20 | $5.15 | |||||||||
| Hypothetical (5% return before expenses) | $1,000.00 | $1,020.11 | $5.14 | |||||||||
| * | Expenses are equal to the Fund’s annualized expense ratio (after waiver/reimbursement): 0.76%, 1.51%, 0.46%, 0.51% and 1.01% for Class A, C, N, Y and Admin Class, respectively, multiplied by the average account value over the period, multiplied by the number of days in the most recent fiscal half-year (184), divided by 365 (to reflect the half-year period). |
15 |
Table of Contents
| LOOMIS SAYLES MULTI-ASSET INCOME FUND | BEGINNING ACCOUNT VALUE 7/1/2019 | ENDING ACCOUNT VALUE 12/31/2019 | EXPENSES PAID DURING PERIOD* 7/1/2019 – 12/31/2019 | |||||||||
| Class A | ||||||||||||
| Actual | $1,000.00 | $1,055.70 | $4.92 | |||||||||
| Hypothetical (5% return before expenses) | $1,000.00 | $1,020.42 | $4.84 | |||||||||
| Class C | ||||||||||||
| Actual | $1,000.00 | $1,052.60 | $8.80 | |||||||||
| Hypothetical (5% return before expenses) | $1,000.00 | $1,016.64 | $8.64 | |||||||||
| Class N | ||||||||||||
| Actual | $1,000.00 | $1,057.70 | $3.37 | |||||||||
| Hypothetical (5% return before expenses) | $1,000.00 | $1,021.93 | $3.31 | |||||||||
| Class Y | ||||||||||||
| Actual | $1,000.00 | $1,057.50 | $3.63 | |||||||||
| Hypothetical (5% return before expenses) | $1,000.00 | $1,021.68 | $3.57 | |||||||||
| * | Expenses are equal to the Fund’s annualized expense ratio (after waiver/reimbursement): 0.95%, 1.70%, 0.65% and 0.70% for Class A, C, N and Y, respectively, multiplied by the average account value over the period, multiplied by the number of days in the most recent fiscal half-year (184), divided by 365 (to reflect the half-year period). |
| 16
Table of Contents
Portfolio of Investments – as of December 31, 2019
Loomis Sayles High Income Fund
| Principal Amount | Description | Value (†) | ||||||
| Bonds and Notes — 93.6% of Net Assets | ||||||||
| Non-Convertible Bonds — 87.8% | ||||||||
| ABS Home Equity — 0.2% | ||||||||
| $ | 70,254 | Banc of America Alternative Loan Trust, Series2003-8, Class 1CB1, 5.500%, 10/25/2033 | $ | 73,692 | ||||
| 53,688 | Banc of America Funding Trust, Series2007-4, Class 5A1, 5.500%, 11/25/2034 | 53,667 | ||||||
| 159,769 | DSLA Mortgage Loan Trust, Series2005-AR5, Class 2A1A,1-month LIBOR + 0.330%, 2.094%, 9/19/2045(a) | 130,510 | ||||||
|
| |||||||
| 257,869 | ||||||||
|
| |||||||
| Aerospace & Defense — 2.4% | ||||||||
| 740,000 | Bombardier, Inc., 6.000%, 10/15/2022, 144A | 739,778 | ||||||
| 638,000 | Leonardo U.S. Holdings, Inc., 6.250%, 1/15/2040, 144A | 700,218 | ||||||
| 383,000 | Leonardo U.S. Holdings, Inc., 7.375%, 7/15/2039, 144A | 475,839 | ||||||
| 60,000 | Moog, Inc., 4.250%, 12/15/2027, 144A | 61,056 | ||||||
| 365,000 | Signature Aviation U.S. Holdings, Inc., 4.000%, 3/01/2028, 144A | 359,999 | ||||||
| 1,155,000 | TransDigm, Inc., 6.250%, 3/15/2026, 144A | 1,250,415 | ||||||
|
| |||||||
| 3,587,305 | ||||||||
|
| |||||||
| Airlines — 0.5% | ||||||||
| 535,000 | Latam Finance Ltd., 6.875%, 4/11/2024, 144A | 565,233 | ||||||
| 200,000 | Latam Finance Ltd., 7.000%, 3/01/2026, 144A | 216,502 | ||||||
|
| |||||||
| 781,735 | ||||||||
|
| |||||||
| Automotive — 1.2% | ||||||||
| 195,000 | Allison Transmission, Inc., 5.000%, 10/01/2024, 144A | 199,631 | ||||||
| 510,000 | Allison Transmission, Inc., 5.875%, 6/01/2029, 144A | 558,450 | ||||||
| 285,000 | Dana Financing Luxembourg S.a.r.l., 5.750%, 4/15/2025, 144A | 297,825 | ||||||
| 255,000 | Delphi Technologies PLC, 5.000%, 10/01/2025, 144A | 235,875 | ||||||
| 115,000 | Goodyear Tire & Rubber Co. (The), 5.000%, 5/31/2026 | 119,600 | ||||||
| 420,000 | Midas Intermediate Holdco II LLC/Midas Intermediate Holdco II Finance, Inc., 7.875%, 10/01/2022, 144A | 383,250 | ||||||
|
| |||||||
| 1,794,631 | ||||||||
|
| |||||||
| Banking — 3.0% | ||||||||
| 700,000 | Ally Financial, Inc., 3.875%, 5/21/2024 | 733,250 | ||||||
| 1,730,000 | Ally Financial, Inc., 4.625%, 3/30/2025 | 1,872,725 | ||||||
| 485,000 | Ally Financial, Inc., 5.750%, 11/20/2025 | 542,594 | ||||||
| 120,000 | CIT Group, Inc., 4.125%, 3/09/2021 | 122,263 | ||||||
| 425,000 | Deutsche Bank AG, (fixed rate to 12/01/2027, variable rate thereafter), 4.875%, 12/01/2032 | 400,563 | ||||||
| 470,000 | Intesa Sanpaolo SpA, 5.017%, 6/26/2024, 144A | 493,864 | ||||||
| 265,000 | Intesa Sanpaolo SpA, 5.710%, 1/15/2026, 144A | 286,848 | ||||||
|
| |||||||
| 4,452,107 | ||||||||
|
| |||||||
| Building Materials — 2.2% | ||||||||
| 280,000 | American Builders & Contractors Supply Co., Inc., 4.000%, 1/15/2028, 144A | 284,200 | ||||||
| 230,000 | Cemex SAB de CV, 5.700%, 1/11/2025, 144A | 236,327 | ||||||
| 350,000 | Cemex SAB de CV, 7.750%, 4/16/2026, 144A | 380,625 | ||||||
| 420,000 | James Hardie International Finance Ltd., 4.750%, 1/15/2025, 144A | 435,750 | ||||||
See accompanying notes to financial statements.
17 |
Table of Contents
Portfolio of Investments – as of December 31, 2019
Loomis Sayles High Income Fund – (continued)
| Principal Amount | Description | Value (†) | ||||||
| Building Materials — continued | ||||||||
| $ | 445,000 | James Hardie International Finance Ltd., 5.000%, 1/15/2028, 144A | $ | 467,250 | ||||
| 360,000 | JELD-WEN, Inc., 4.625%, 12/15/2025, 144A | 370,620 | ||||||
| 160,000 | JELD-WEN, Inc., 4.875%, 12/15/2027, 144A | 163,600 | ||||||
| 110,000 | Summit Materials LLC/Summit Materials Finance Corp., 6.125%, 7/15/2023 | 111,788 | ||||||
| 685,000 | U.S. Concrete, Inc., 6.375%, 6/01/2024 | 714,969 | ||||||
|
| |||||||
| 3,165,129 | ||||||||
|
| |||||||
| Cable Satellite — 9.2% | ||||||||
| 2,700,000 | CCO Holdings LLC/CCO Holdings Capital Corp., 4.750%, 3/01/2030, 144A | 2,748,681 | ||||||
| 450,000 | CCO Holdings LLC/CCO Holdings Capital Corp., 5.375%, 5/01/2025, 144A | 464,625 | ||||||
| 405,000 | CCO Holdings LLC/CCO Holdings Capital Corp., 5.375%, 6/01/2029, 144A | 433,350 | ||||||
| 865,000 | CCO Holdings LLC/CCO Holdings Capital Corp., 5.750%, 2/15/2026, 144A | 912,592 | ||||||
| 1,360,000 | CSC Holdings LLC, 5.500%, 4/15/2027, 144A | 1,460,436 | ||||||
| 390,000 | CSC Holdings LLC, 6.500%, 2/01/2029, 144A | 434,850 | ||||||
| 415,000 | DISH DBS Corp., 7.750%, 7/01/2026 | 439,647 | ||||||
| 70,000 | Intelsat Jackson Holdings S.A., 5.500%, 8/01/2023 | 60,133 | ||||||
| 195,000 | Intelsat Jackson Holdings S.A., 8.500%, 10/15/2024, 144A | 177,612 | ||||||
| 430,000 | Intelsat Jackson Holdings S.A., 9.750%, 7/15/2025, 144A | 397,750 | ||||||
| 355,000 | Sirius XM Radio, Inc., 5.000%, 8/01/2027, 144A | 374,525 | ||||||
| 1,400,000 | Telenet Finance Luxembourg Notes S.a.r.l., 5.500%, 3/01/2028, 144A | 1,498,518 | ||||||
| 265,000 | Virgin Media Finance PLC, 6.000%, 10/15/2024, 144A | 272,950 | ||||||
| 1,070,000 | Virgin Media Secured Finance PLC, 5.500%, 5/15/2029, 144A | 1,132,862 | ||||||
| 2,570,000 | Ziggo BV, 5.500%, 1/15/2027, 144A | 2,730,625 | ||||||
|
| |||||||
| 13,539,156 | ||||||||
|
| |||||||
| Chemicals — 1.3% | ||||||||
| 1,510,000 | Hercules LLC, 6.500%, 6/30/2029 | 1,593,050 | ||||||
| 245,000 | SASOL Financing USA LLC, 5.875%, 3/27/2024 | 265,301 | ||||||
|
| |||||||
| 1,858,351 | ||||||||
|
| |||||||
| Construction Machinery — 0.8% | ||||||||
| 615,000 | United Rentals North America, Inc., 4.625%, 10/15/2025 | 632,282 | ||||||
| 15,000 | United Rentals North America, Inc., 5.500%, 5/15/2027 | 16,069 | ||||||
| 235,000 | United Rentals North America, Inc., 5.875%, 9/15/2026 | 252,096 | ||||||
| 195,000 | United Rentals North America, Inc., 6.500%, 12/15/2026 | 214,317 | ||||||
|
| |||||||
| 1,114,764 | ||||||||
|
| |||||||
| Consumer Cyclical Services — 1.2% | ||||||||
| 350,000 | ServiceMaster Co. LLC (The), 7.450%, 8/15/2027 | 395,500 | ||||||
| 180,000 | Staples, Inc., 7.500%, 4/15/2026, 144A | 186,750 | ||||||
| 680,000 | Uber Technologies, Inc., 7.500%, 11/01/2023, 144A | 710,600 | ||||||
| 345,000 | Uber Technologies, Inc., 7.500%, 9/15/2027, 144A | 353,949 | ||||||
| 150,000 | Uber Technologies, Inc., 8.000%, 11/01/2026, 144A | 156,375 | ||||||
|
| |||||||
| 1,803,174 | ||||||||
|
| |||||||
| Consumer Products — 0.2% | ||||||||
| 115,000 | Mattel, Inc., 5.875%, 12/15/2027, 144A | 121,181 | ||||||
| 175,000 | Prestige Brands, Inc., 5.125%, 1/15/2028, 144A | 183,313 | ||||||
|
| |||||||
| 304,494 | ||||||||
|
| |||||||
See accompanying notes to financial statements.
| 18
Table of Contents
Portfolio of Investments – as of December 31, 2019
Loomis Sayles High Income Fund – (continued)
| Principal Amount | Description | Value (†) | ||||||
| Electric — 3.2% | ||||||||
| $ | 125,000 | AES Corp. (The), 5.125%, 9/01/2027 | $ | 133,438 | ||||
| 479,000 | AES Corp. (The), 5.500%, 4/15/2025 | 495,262 | ||||||
| 150,000 | AES Corp. (The), 6.000%, 5/15/2026 | 159,750 | ||||||
| 1,105,000 | Calpine Corp., 5.125%, 3/15/2028, 144A | 1,127,874 | ||||||
| 1,502,000 | Enel SpA, (fixed rate to 9/24/2023, variable rate thereafter), 8.750%, 9/24/2073, 144A | 1,762,972 | ||||||
| 1,055,000 | Vistra Operations Co. LLC, 3.700%, 1/30/2027, 144A | 1,048,319 | ||||||
|
| |||||||
| 4,727,615 | ||||||||
|
| |||||||
| Finance Companies — 3.2% | ||||||||
| 820,000 | Navient Corp., 6.500%, 6/15/2022 | 888,675 | ||||||
| 315,000 | Provident Funding Associates LP/PFG Finance Corp., 6.375%, 6/15/2025, 144A | 308,700 | ||||||
| 1,305,000 | Quicken Loans, Inc., 5.250%, 1/15/2028, 144A | 1,350,675 | ||||||
| 710,000 | Quicken Loans, Inc., 5.750%, 5/01/2025, 144A | 733,962 | ||||||
| 185,000 | Springleaf Finance Corp., 6.875%, 3/15/2025 | 210,438 | ||||||
| 700,000 | Springleaf Finance Corp., 7.125%, 3/15/2026 | 809,340 | ||||||
| 405,000 | Unifin Financiera SAB de CV, 7.250%, 9/27/2023, 144A | 421,795 | ||||||
|
| |||||||
| 4,723,585 | ||||||||
|
| |||||||
| Financial Other — 1.5% | ||||||||
| 745,000 | Icahn Enterprises LP/Icahn Enterprises Finance Corp., 4.750%, 9/15/2024, 144A | 765,487 | ||||||
| 635,000 | Icahn Enterprises LP/Icahn Enterprises Finance Corp., 5.250%, 5/15/2027, 144A | 649,370 | ||||||
| 465,000 | Nationstar Mortgage Holdings, Inc., 8.125%, 7/15/2023, 144A | 492,212 | ||||||
| 330,000 | Nationstar Mortgage Holdings, Inc., 9.125%, 7/15/2026, 144A | 365,475 | ||||||
|
| |||||||
| 2,272,544 | ||||||||
|
| |||||||
| Food & Beverage — 2.2% | ||||||||
| 245,000 | BRF S.A., 4.875%, 1/24/2030, 144A | 252,659 | ||||||
| 330,000 | JBS USA LUX S.A./JBS USA Finance, Inc., 5.750%, 6/15/2025, 144A | 341,550 | ||||||
| 285,000 | JBS USA LUX S.A./JBS USA Food Co./JBS USA Finance, Inc., 5.500%, 1/15/2030, 144A | 306,118 | ||||||
| 385,000 | Marfrig Holdings Europe BV, Class B, 8.000%, 6/08/2023, 144A | 401,081 | ||||||
| 250,000 | NBM U.S Holdings, Inc., 7.000%, 5/14/2026, 144A | 270,753 | ||||||
| 225,000 | Performance Food Group, Inc., 5.500%, 10/15/2027, 144A | 240,469 | ||||||
| 280,000 | Pilgrim’s Pride Corp., 5.750%, 3/15/2025, 144A | 289,416 | ||||||
| 540,000 | Pilgrim’s Pride Corp., 5.875%, 9/30/2027, 144A | 583,875 | ||||||
| 550,000 | Post Holdings, Inc., 5.750%, 3/01/2027, 144A | 589,875 | ||||||
|
| |||||||
| 3,275,796 | ||||||||
|
| |||||||
| Gaming — 1.8% | ||||||||
| 375,000 | Boyd Gaming Corp., 4.750%, 12/01/2027, 144A | 389,531 | ||||||
| 175,000 | Boyd Gaming Corp., 6.375%, 4/01/2026 | 188,289 | ||||||
| 200,000 | Melco Resorts Finance Ltd., 5.375%, 12/04/2029, 144A | 205,187 | ||||||
| 210,000 | MGM Growth Properties Operating Partnership LP/MGP FinanceCo-Issuer, Inc., 4.500%, 1/15/2028 | 218,925 | ||||||
| 345,000 | MGM Growth Properties Operating Partnership LP/MGP FinanceCo-Issuer, Inc., 5.750%, 2/01/2027, 144A | 384,675 | ||||||
| 380,000 | MGM Resorts International, 7.750%, 3/15/2022 | 425,125 | ||||||
| 155,000 | Scientific Games International, Inc., 7.000%, 5/15/2028, 144A | 166,238 | ||||||
See accompanying notes to financial statements.
19 |
Table of Contents
Portfolio of Investments – as of December 31, 2019
Loomis Sayles High Income Fund – (continued)
| Principal Amount | Description | Value (†) | ||||||
| Gaming — continued | ||||||||
| $ | 160,000 | Scientific Games International, Inc., 7.250%, 11/15/2029, 144A | $ | 173,600 | ||||
| 250,000 | Wynn Macau Ltd., 5.125%, 12/15/2029, 144A | 255,127 | ||||||
| 215,000 | Wynn Resorts Finance LLC/Wynn Resorts Capital Corp., 5.125%, 10/01/2029, 144A | 230,588 | ||||||
|
| |||||||
| 2,637,285 | ||||||||
|
| |||||||
| Government Owned – No Guarantee — 1.0% | ||||||||
| 550,000 | Petrobras Global Finance BV, 5.750%, 2/01/2029 | 620,400 | ||||||
| 225,000 | Petrobras Global Finance BV, 6.900%, 3/19/2049 | 263,925 | ||||||
| 710,000 | YPF S.A., 6.950%, 7/21/2027, 144A | 631,900 | ||||||
|
| |||||||
| 1,516,225 | ||||||||
|
| |||||||
| Health Insurance — 0.8% | ||||||||
| 630,000 | Centene Corp., 4.250%, 12/15/2027, 144A | 648,112 | ||||||
| 290,000 | Centene Corp., 4.625%, 12/15/2029, 144A | 304,892 | ||||||
| 210,000 | Centene Corp., 4.750%, 1/15/2025, 144A | 218,133 | ||||||
|
| |||||||
| 1,171,137 | ||||||||
|
| |||||||
| Healthcare — 6.0% | ||||||||
| 590,000 | CHS/Community Health Systems, Inc., 6.250%, 3/31/2023 | 598,850 | ||||||
| 160,000 | CHS/Community Health Systems, Inc., 8.000%, 3/15/2026, 144A | 164,800 | ||||||
| 350,000 | Encompass Health Corp., 4.500%, 2/01/2028 | 362,688 | ||||||
| 365,000 | Encompass Health Corp., 4.750%, 2/01/2030 | 378,688 | ||||||
| 170,000 | HCA, Inc., 7.050%, 12/01/2027 | 201,450 | ||||||
| 655,000 | HCA, Inc., 7.500%, 12/15/2023 | 741,787 | ||||||
| 145,000 | HCA, Inc., 7.500%, 11/06/2033 | 182,700 | ||||||
| 590,000 | HCA, Inc., 7.690%, 6/15/2025 | 710,950 | ||||||
| 480,000 | HCA, Inc., 8.360%, 4/15/2024 | 583,200 | ||||||
| 820,000 | HCA, Inc., MTN, 7.580%, 9/15/2025 | 979,900 | ||||||
| 515,000 | HCA, Inc., MTN, 7.750%, 7/15/2036 | 612,850 | ||||||
| 95,000 | Hill Rom Holdings, Inc., 4.375%, 9/15/2027, 144A | 97,731 | ||||||
| 275,000 | Hologic, Inc., 4.375%, 10/15/2025, 144A | 283,938 | ||||||
| 140,000 | Hologic, Inc., 4.625%, 2/01/2028, 144A | 148,400 | ||||||
| 200,000 | IQVIA, Inc., 5.000%, 10/15/2026, 144A | 211,000 | ||||||
| 715,000 | MPH Acquisition Holdings LLC, 7.125%, 6/01/2024, 144A | 691,762 | ||||||
| 850,000 | Polaris Intermediate Corp., 9.250% PIK or 8.500% Cash, 12/01/2022, 144A(b) | 791,562 | ||||||
| 725,000 | Tenet Healthcare Corp., 4.625%, 7/15/2024 | 742,219 | ||||||
| 390,000 | Tenet Healthcare Corp., 5.125%, 5/01/2025 | 401,700 | ||||||
|
| |||||||
| 8,886,175 | ||||||||
|
| |||||||
| Home Construction — 1.7% | ||||||||
| 1,200,000 | Corporacion GEO SAB de CV, 8.875%, 2/27/2022, 144A(e)(f)(h) | — | ||||||
| 230,000 | KB Home, 4.800%, 11/15/2029 | 235,175 | ||||||
| 800,000 | Lennar Corp., 4.750%, 5/30/2025 | 860,000 | ||||||
| 1,130,000 | PulteGroup, Inc., 5.500%, 3/01/2026 | 1,262,775 | ||||||
| 185,000 | Taylor Morrison Communities, Inc., 5.750%, 1/15/2028, 144A | 201,650 | ||||||
|
| |||||||
| 2,559,600 | ||||||||
|
| |||||||
| Independent Energy — 4.8% | ||||||||
| 460,000 | Aker BP ASA, 5.875%, 3/31/2025, 144A | 488,750 | ||||||
| 685,000 | Baytex Energy Corp., 5.625%, 6/01/2024, 144A | 623,350 | ||||||
See accompanying notes to financial statements.
| 20
Table of Contents
Portfolio of Investments – as of December 31, 2019
Loomis Sayles High Income Fund – (continued)
| Principal Amount | Description | Value (†) | ||||||
| Independent Energy — continued | ||||||||
| $ | 1,025,000 | Bruin E&P Partners LLC, 8.875%, 8/01/2023, 144A | $ | 667,336 | ||||
| 90,000 | California Resources Corp., 5.500%, 9/15/2021(c)(d) | 42,300 | ||||||
| 41,000 | California Resources Corp., 6.000%, 11/15/2024(c)(d) | 12,300 | ||||||
| 950,000 | California Resources Corp., 8.000%, 12/15/2022, 144A(c)(d) | 424,717 | ||||||
| 425,000 | Centennial Resource Production LLC, 6.875%, 4/01/2027, 144A | 442,000 | ||||||
| 195,000 | Denbury Resources, Inc., 7.750%, 2/15/2024, 144A | 172,575 | ||||||
| 375,000 | Gulfport Energy Corp., 6.000%, 10/15/2024 | 266,250 | ||||||
| 595,000 | Gulfport Energy Corp., 6.375%, 5/15/2025 | 377,825 | ||||||
| 365,000 | Gulfport Energy Corp., 6.375%, 1/15/2026 | 226,300 | ||||||
| 690,000 | Montage Resources Corp., 8.875%, 7/15/2023 | 636,525 | ||||||
| 302,000 | Oasis Petroleum, Inc., 6.875%, 3/15/2022 | 290,675 | ||||||
| 685,000 | Seven Generations Energy Ltd., 5.375%, 9/30/2025, 144A | 688,425 | ||||||
| 175,000 | Seven Generations Energy Ltd., 6.875%, 6/30/2023, 144A | 180,031 | ||||||
| 320,000 | SM Energy Co., 5.000%, 1/15/2024 | 304,800 | ||||||
| 425,000 | Vine Oil & Gas LP/Vine Oil & Gas Finance Corp., 9.750%, 4/15/2023, 144A | 212,500 | ||||||
| 50,000 | Viper Energy Partners LP, 5.375%, 11/01/2027, 144A | 52,000 | ||||||
| 405,000 | Whiting Petroleum Corp., 5.750%, 3/15/2021 | 383,130 | ||||||
| 50,000 | Whiting Petroleum Corp., 6.250%, 4/01/2023 | 42,085 | ||||||
| 805,000 | Whiting Petroleum Corp., 6.625%, 1/15/2026 | 548,591 | ||||||
|
| |||||||
| 7,082,465 | ||||||||
|
| |||||||
| Industrial Other — 0.1% | ||||||||
| 130,000 | Installed Building Products, Inc., 5.750%, 2/01/2028, 144A | 138,938 | ||||||
|
| |||||||
| Integrated Energy — 0.1% | ||||||||
| 200,000 | Geopark Ltd., 6.500%, 9/21/2024, 144A | 208,404 | ||||||
|
| |||||||
| Leisure — 0.4% | ||||||||
| 330,000 | Live Nation Entertainment, Inc., 4.750%, 10/15/2027, 144A | 341,550 | ||||||
| 300,000 | Speedway Motorsports LLC/Speedway Funding II, Inc., 4.875%, 11/01/2027, 144A | 304,125 | ||||||
|
| |||||||
| 645,675 | ||||||||
|
| |||||||
| Life Insurance — 0.3% | ||||||||
| 340,000 | CNO Financial Group, Inc., 5.250%, 5/30/2025 | 376,550 | ||||||
|
| |||||||
| Local Authorities — 0.2% | ||||||||
| 325,000 | Provincia de Buenos Aires, 6.500%, 2/15/2023, 144A | 134,875 | ||||||
| 270,000 | Provincia de Buenos Aires, 7.875%, 6/15/2027, 144A | 114,750 | ||||||
|
| |||||||
| 249,625 | ||||||||
|
| |||||||
| Lodging — 1.2% | ||||||||
| 150,000 | Hilton Domestic Operating Co., Inc., 4.250%, 9/01/2024 | 152,813 | ||||||
| 755,000 | Hilton Worldwide Finance LLC/Hilton Worldwide Finance Corp., 4.625%, 4/01/2025 | 775,762 | ||||||
| 565,000 | Marriott Ownership Resorts, Inc., 4.750%, 1/15/2028, 144A | 578,419 | ||||||
| 60,000 | Marriott Ownership Resorts, Inc./ILG LLC, 6.500%, 9/15/2026 | 65,325 | ||||||
| 255,000 | Wyndham Destinations, Inc., 4.625%, 3/01/2030, 144A | 255,637 | ||||||
|
| |||||||
| 1,827,956 | ||||||||
|
| |||||||
See accompanying notes to financial statements.
21 |
Table of Contents
Portfolio of Investments – as of December 31, 2019
Loomis Sayles High Income Fund – (continued)
| Principal Amount | Description | Value (†) | ||||||
| Media Entertainment — 3.5% | ||||||||
| $ | 735,000 | AMC Networks, Inc., 4.750%, 8/01/2025 | $ | 737,756 | ||||
| 720,000 | Diamond Sports Group LLC/Diamond Sports Finance Co., 5.375%, 8/15/2026, 144A | 728,317 | ||||||
| 120,000 | Gray Television, Inc., 5.125%, 10/15/2024, 144A | 124,500 | ||||||
| 275,000 | iHeartCommunications, Inc., 4.750%, 1/15/2028, 144A | 281,875 | ||||||
| 99,931 | iHeartCommunications, Inc., 6.375%, 5/01/2026 | 108,425 | ||||||
| 346,125 | iHeartCommunications, Inc., 8.375%, 5/01/2027 | 382,468 | ||||||
| 395,000 | Meredith Corp., 6.875%, 2/01/2026 | 410,682 | ||||||
| 740,000 | Netflix, Inc., 4.875%, 4/15/2028 | 768,638 | ||||||
| 390,000 | Netflix, Inc., 5.375%, 11/15/2029, 144A | 415,342 | ||||||
| 105,000 | Nexstar Broadcasting, Inc., 5.625%, 7/15/2027, 144A | 110,649 | ||||||
| 805,000 | Nielsen Finance LLC/Nielsen Finance Co., 5.000%, 4/15/2022, 144A | 808,019 | ||||||
| 120,000 | Outfront Media Capital LLC/Outfront Media Capital Corp., 4.625%, 3/15/2030, 144A | 122,100 | ||||||
| 170,000 | Terrier Media Buyer, Inc., 8.875%, 12/15/2027, 144A | 179,775 | ||||||
|
| |||||||
| 5,178,546 | ||||||||
|
| |||||||
| Metals & Mining — 2.7% | ||||||||
| 60,000 | Allegheny Technologies, Inc., 5.875%, 12/01/2027 | 63,000 | ||||||
| 190,000 | Commercial Metals Co., 4.875%, 5/15/2023 | 197,600 | ||||||
| 665,000 | First Quantum Minerals Ltd., 6.500%, 3/01/2024, 144A | 666,663 | ||||||
| 835,000 | First Quantum Minerals Ltd., 6.875%, 3/01/2026, 144A | 845,437 | ||||||
| 200,000 | First Quantum Minerals Ltd., 7.250%, 4/01/2023, 144A | 207,056 | ||||||
| 210,000 | First Quantum Minerals Ltd., 7.500%, 4/01/2025, 144A | 214,725 | ||||||
| 840,000 | FMG Resources (August 2006) Pty Ltd., 4.750%, 5/15/2022, 144A | 867,300 | ||||||
| 370,000 | FMG Resources (August 2006) Pty Ltd., 5.125%, 5/15/2024, 144A | 393,125 | ||||||
| 435,000 | Mineral Resources Ltd., 8.125%, 5/01/2027, 144A | 477,413 | ||||||
|
| |||||||
| 3,932,319 | ||||||||
|
| |||||||
| Midstream — 3.7% | ||||||||
| 385,000 | EnLink Midstream Partners LP, 5.050%, 4/01/2045 | 304,150 | ||||||
| 205,000 | EnLink Midstream Partners LP, 5.450%, 6/01/2047 | 165,537 | ||||||
| 435,000 | EnLink Midstream Partners LP, 5.600%, 4/01/2044 | 352,350 | ||||||
| 1,265,000 | Hess Midstream Operations LP, 5.625%, 2/15/2026, 144A | 1,321,723 | ||||||
| 145,000 | NGL Energy Partners LP/NGL Energy Finance Corp., 6.125%, 3/01/2025 | 136,663 | ||||||
| 350,000 | NGL Energy Partners LP/NGL Energy Finance Corp., 7.500%, 11/01/2023 | 350,000 | ||||||
| 165,000 | NGPL PipeCo LLC, 4.375%, 8/15/2022, 144A | 171,391 | ||||||
| 700,000 | NGPL PipeCo LLC, 4.875%, 8/15/2027, 144A | 744,056 | ||||||
| 935,000 | Summit Midstream Holdings LLC/Summit Midstream Finance Corp., 5.500%, 8/15/2022 | 832,150 | ||||||
| 95,000 | Targa Resources Partners LP/Targa Resources Partners Finance Corp., 4.250%, 11/15/2023 | 95,950 | ||||||
| 640,000 | Targa Resources Partners LP/Targa Resources Partners Finance Corp., 5.250%, 5/01/2023 | 646,400 | ||||||
| 255,000 | Targa Resources Partners LP/Targa Resources Partners Finance Corp., 5.500%, 3/01/2030, 144A | 262,012 | ||||||
|
| |||||||
| 5,382,382 | ||||||||
|
| |||||||
See accompanying notes to financial statements.
| 22
Table of Contents
Portfolio of Investments – as of December 31, 2019
Loomis Sayles High Income Fund – (continued)
| Principal Amount | Description | Value (†) | ||||||
| Non-Agency Commercial Mortgage-Backed Securities — 1.4% | ||||||||
| $ | 100,000 | CG-CCRE Commercial Mortgage Trust, Series2014-FL2, Class COL1,1-month LIBOR + 3.500%, 5.240%, 11/15/2031, 144A(a)(c)(d) | $ | 99,782 | ||||
| 225,000 | CG-CCRE Commercial Mortgage Trust, Series2014-FL2, Class COL2,1-month LIBOR + 4.500%, 6.240%, 11/15/2031, 144A(a)(c)(d) | 224,270 | ||||||
| 1,020,000 | Credit Suisse Mortgage Trust, Series2014-USA, Class E, 4.373%, 9/15/2037, 144A | 959,114 | ||||||
| 380,000 | Starwood Retail Property Trust, Series 2014-STAR, Class D,1-month LIBOR + 3.500%, 5.240%, 11/15/2027, 144A(a)(c)(d) | 322,911 | ||||||
| 420,000 | Starwood Retail Property Trust, Series 2014-STAR, Class E,1-month LIBOR + 4.400%, 6.140%, 11/15/2027, 144A(a)(c)(e)(f) | 325,435 | ||||||
| 125,000 | WFRBS Commercial Mortgage Trust, Series2012-C7, Class E, 4.813%, 6/15/2045, 144A(g) | 107,207 | ||||||
|
| |||||||
| 2,038,719 | ||||||||
|
| |||||||
| Oil Field Services — 1.8% | ||||||||
| 935,000 | McDermott Technology Americas, Inc./McDermott Technology U.S., Inc., 10.625%, 5/01/2024, 144A(c)(d)(h) | 79,475 | ||||||
| 160,000 | Noble Holding International Ltd., 5.250%, 3/15/2042 | 57,970 | ||||||
| 1,145,000 | Shelf Drilling Holdings Ltd., 8.250%, 2/15/2025, 144A | 1,090,612 | ||||||
| 360,450 | Transocean Guardian Ltd., 5.875%, 1/15/2024, 144A | 368,560 | ||||||
| 22,250 | Transocean Pontus Ltd., 6.125%, 8/01/2025, 144A | 22,806 | ||||||
| 196,000 | Transocean Proteus Ltd., 6.250%, 12/01/2024, 144A | 201,880 | ||||||
| 695,000 | Transocean Sentry Ltd., 5.375%, 5/15/2023, 144A | 707,162 | ||||||
| 175,000 | Transocean, Inc., 7.500%, 1/15/2026, 144A | 172,813 | ||||||
|
| |||||||
| 2,701,278 | ||||||||
|
| |||||||
| Packaging — 0.3% | ||||||||
| 370,000 | ARD Finance S.A., 7.250% PIK or 6.500% Cash, 6/30/2027, 144A(b) | 382,562 | ||||||
|
| |||||||
| Pharmaceuticals — 3.9% | ||||||||
| 400,000 | Bausch Health Cos., Inc., 5.000%, 1/30/2028, 144A | 410,556 | ||||||
| 395,000 | Bausch Health Cos., Inc., 5.250%, 1/30/2030, 144A | 409,615 | ||||||
| 53,000 | Bausch Health Cos., Inc., 5.500%, 3/01/2023, 144A | 53,265 | ||||||
| 36,000 | Bausch Health Cos., Inc., 5.875%, 5/15/2023, 144A | 36,315 | ||||||
| 220,000 | Bausch Health Cos., Inc., 6.125%, 4/15/2025, 144A | 227,311 | ||||||
| 170,000 | Bausch Health Cos., Inc., 9.000%, 12/15/2025, 144A | 193,324 | ||||||
| 280,000 | Catalent Pharma Solutions, Inc., 4.875%, 1/15/2026, 144A | 289,800 | ||||||
| 600,000 | Endo Dac/Endo Finance LLC/Endo Finco, Inc., 6.000%, 2/01/2025, 144A | 404,628 | ||||||
| 445,000 | Mylan NV, 5.250%, 6/15/2046 | 500,519 | ||||||
| 75,000 | Mylan, Inc., 5.200%, 4/15/2048 | 83,973 | ||||||
| 150,000 | Mylan, Inc., 5.400%, 11/29/2043 | 166,238 | ||||||
| 1,065,000 | Teva Pharmaceutical Finance Netherlands III BV, 2.800%, 7/21/2023 | 986,020 | ||||||
| 65,000 | Teva Pharmaceutical Finance Netherlands III BV, 3.150%, 10/01/2026 | 54,112 | ||||||
| 2,155,000 | Teva Pharmaceutical Finance Netherlands III BV, 4.100%, 10/01/2046 | 1,551,600 | ||||||
| 405,000 | Teva Pharmaceutical Finance Netherlands III BV, 7.125%, 1/31/2025, 144A | 416,016 | ||||||
|
| |||||||
| 5,783,292 | ||||||||
|
| |||||||
| Property & Casualty Insurance — 0.6% | ||||||||
| 45,000 | AmWINS Group, Inc., 7.750%, 7/01/2026, 144A | 49,731 | ||||||
| 780,000 | Ardonagh Midco 3 PLC, 8.625%, 7/15/2023, 144A | 774,150 | ||||||
|
| |||||||
| 823,881 | ||||||||
|
| |||||||
See accompanying notes to financial statements.
23 |
Table of Contents
Portfolio of Investments – as of December 31, 2019
Loomis Sayles High Income Fund – (continued)
| Principal Amount | Description | Value (†) | ||||||
| Refining — 0.8% | ||||||||
| $ | 405,000 | Parkland Fuel Corp., 5.875%, 7/15/2027, 144A | $ | 435,521 | ||||
| 635,000 | Parkland Fuel Corp., 6.000%, 4/01/2026, 144A | 670,750 | ||||||
|
| |||||||
| 1,106,271 | ||||||||
|
| |||||||
| REITs – Diversified — 0.3% | ||||||||
| 395,000 | iStar, Inc., 5.250%, 9/15/2022 | 405,369 | ||||||
|
| |||||||
| REITs – Hotels — 0.7% | ||||||||
| 350,000 | Service Properties Trust, 4.750%, 10/01/2026 | 359,056 | ||||||
| 715,000 | Service Properties Trust, 4.350%, 10/01/2024 | 734,794 | ||||||
|
| |||||||
| 1,093,850 | ||||||||
|
| |||||||
| REITs – Mortgage — 0.7% | ||||||||
| 720,000 | Ladder Capital Finance Holdings LLLP/Ladder Capital Finance Corp., 5.250%, 10/01/2025, 144A | 747,000 | ||||||
| 255,000 | Ladder Capital Finance Holdings LLLP/Ladder Capital Finance Corp., 5.875%, 8/01/2021, 144A | 258,506 | ||||||
|
| |||||||
| 1,005,506 | ||||||||
|
| |||||||
| REITs – Regional Malls — 0.5% | ||||||||
| 695,000 | Brookfield Property REIT, Inc./BPR Cumulus LLC/BPR Nimbus LLC/GGSI Sellco LL, 5.750%, 5/15/2026, 144A | 733,225 | ||||||
|
| |||||||
| Restaurants — 1.0% | ||||||||
| 400,000 | 1011778 B.C. ULC/New Red Finance, Inc., 4.375%, 1/15/2028, 144A | 401,000 | ||||||
| 890,000 | 1011778 B.C. ULC/New Red Finance, Inc., 5.000%, 10/15/2025, 144A | 918,925 | ||||||
| 110,000 | Yum Brands, Inc., 4.750%, 1/15/2030, 144A | 115,225 | ||||||
|
| |||||||
| 1,435,150 | ||||||||
|
| |||||||
| Retailers — 2.2% | ||||||||
| 830,000 | Asbury Automotive Group, Inc., 6.000%, 12/15/2024 | 856,975 | ||||||
| 820,000 | Group 1 Automotive, Inc., 5.000%, 6/01/2022 | 831,275 | ||||||
| 480,000 | Hanesbrands, Inc., 4.875%, 5/15/2026, 144A | 508,200 | ||||||
| 505,000 | J.C. Penney Corp., Inc., 5.875%, 7/01/2023, 144A | 433,038 | ||||||
| 105,000 | Murphy Oil USA, Inc., 4.750%, 9/15/2029 | 110,887 | ||||||
| 385,000 | PetSmart, Inc., 7.125%, 3/15/2023, 144A | 377,300 | ||||||
| 125,000 | William Carter Co. (The), 5.625%, 3/15/2027, 144A | 134,375 | ||||||
|
| |||||||
| 3,252,050 | ||||||||
|
| |||||||
| Technology — 5.4% | ||||||||
| 335,000 | Camelot Finance S.A., 4.500%, 11/01/2026, 144A | 344,213 | ||||||
| 120,000 | CDK Global, Inc., 5.250%, 5/15/2029, 144A | 128,700 | ||||||
| 595,000 | CDW LLC/CDM Finance Corp., 4.250%, 4/01/2028 | 624,006 | ||||||
| 825,000 | CommScope Technologies LLC, 5.000%, 3/15/2027, 144A | 775,500 | ||||||
| 100,000 | CommScope Technologies LLC, 6.000%, 6/15/2025, 144A | 100,113 | ||||||
| 1,455,000 | CommScope, Inc., 5.500%, 3/01/2024, 144A | 1,516,837 | ||||||
| 620,000 | Dun & Bradstreet Corp. (The), 6.875%, 8/15/2026, 144A | 684,325 | ||||||
| 690,000 | Iron Mountain, Inc., 4.875%, 9/15/2029, 144A | 700,902 | ||||||
| 140,000 | MSCI, Inc., 4.000%, 11/15/2029, 144A | 141,925 | ||||||
| 865,000 | Nokia Oyj, 4.375%, 6/12/2027 | 901,762 | ||||||
| 190,000 | Open Text Corp., 5.875%, 6/01/2026, 144A | 203,300 | ||||||
See accompanying notes to financial statements.
| 24
Table of Contents
Portfolio of Investments – as of December 31, 2019
Loomis Sayles High Income Fund – (continued)
| Principal Amount | Description | Value (†) | ||||||
| Technology — continued | ||||||||
| $ | 275,000 | Sabre GLBL, Inc., 5.250%, 11/15/2023, 144A | $ | 282,219 | ||||
| 590,000 | SS&C Technologies, Inc., 5.500%, 9/30/2027, 144A | 629,825 | ||||||
| 900,000 | Western Digital Corp., 4.750%, 2/15/2026 | 938,250 | ||||||
|
| |||||||
| 7,971,877 | ||||||||
|
| |||||||
| Transportation Services — 0.2% | ||||||||
| 275,000 | APL Ltd., 8.000%, 1/15/2024(c)(d) | 244,778 | ||||||
|
| |||||||
| Treasuries — 0.5% | ||||||||
| 715,000 | U.S. Treasury Note, 2.125%, 5/31/2021 | 720,167 | ||||||
|
| |||||||
| Wireless — 4.2% | ||||||||
| 1,000,000 | Altice Luxembourg S.A., 10.500%, 5/15/2027, 144A | 1,140,050 | ||||||
| 200,000 | Bharti Airtel Ltd., 4.375%, 6/10/2025 | 203,682 | ||||||
| 345,000 | Kenbourne Invest S.A., 6.875%, 11/26/2024, 144A | 358,862 | ||||||
| 200,000 | Millicom International Cellular S.A., 5.125%, 1/15/2028, 144A | 209,702 | ||||||
| 200,000 | Millicom International Cellular S.A., 6.250%, 3/25/2029, 144A | 220,658 | ||||||
| 810,000 | Sprint Capital Corp., 6.875%, 11/15/2028 | 872,775 | ||||||
| 20,000 | Sprint Capital Corp., 8.750%, 3/15/2032 | 24,275 | ||||||
| 890,000 | Sprint Corp., 7.125%, 6/15/2024 | 960,087 | ||||||
| 650,000 | Sprint Corp., 7.250%, 9/15/2021 | 687,375 | ||||||
| 1,085,000 | Sprint Corp., 7.875%, 9/15/2023 | 1,197,113 | ||||||
| 315,000 | T-Mobile USA, Inc., 4.500%, 2/01/2026 | 322,875 | ||||||
|
| |||||||
| 6,197,454 | ||||||||
|
| |||||||
| Wirelines — 2.7% | ||||||||
| 130,000 | Cincinnati Bell Telephone Co. LLC, 6.300%, 12/01/2028 | 133,457 | ||||||
| 555,000 | Frontier Communications Corp., 8.000%, 4/01/2027, 144A | 579,975 | ||||||
| 725,000 | Frontier Communications Corp., 8.500%, 4/01/2026, 144A | 734,062 | ||||||
| 755,000 | Level 3 Financing, Inc., 4.625%, 9/15/2027, 144A | 772,969 | ||||||
| 120,000 | Telecom Italia Capital S.A., 7.200%, 7/18/2036 | 142,176 | ||||||
| 1,485,000 | Windstream Services LLC/Windstream Finance Corp., 8.625%, 10/31/2025, 144A | 1,425,600 | ||||||
| 505,000 | Windstream Services LLC/Windstream Finance Corp., 10.500%, 6/30/2024, 144A(h) | 196,950 | ||||||
|
| |||||||
| 3,985,189 | ||||||||
|
| |||||||
| TotalNon-Convertible Bonds (Identified Cost $127,159,786) | 129,332,155 | |||||||
|
| |||||||
| Convertible Bonds — 5.8% | ||||||||
| Cable Satellite — 1.3% | ||||||||
| 1,515,000 | DISH Network Corp., 2.375%, 3/15/2024 | 1,383,346 | ||||||
| 580,000 | DISH Network Corp., 3.375%, 8/15/2026 | 557,902 | ||||||
|
| |||||||
| 1,941,248 | ||||||||
|
| |||||||
| Diversified Manufacturing — 0.5% | ||||||||
| 755,000 | Greenbrier Cos., Inc. (The), 2.875%, 2/01/2024 | 728,818 | ||||||
|
| |||||||
| Independent Energy — 0.4% | ||||||||
| 645,000 | Chesapeake Energy Corp., 5.500%, 9/15/2026 | 307,267 | ||||||
| 325,000 | PDC Energy, Inc., 1.125%, 9/15/2021 | 305,156 | ||||||
| 31,000 | Whiting Petroleum Corp., 1.250%, 4/01/2020 | 30,259 | ||||||
|
| |||||||
| 642,682 | ||||||||
|
| |||||||
See accompanying notes to financial statements.
25 |
Table of Contents
Portfolio of Investments – as of December 31, 2019
Loomis Sayles High Income Fund – (continued)
| Principal Amount | Description | Value (†) | ||||||
| Oil Field Services — 0.5% | ||||||||
| $ | 510,000 | Nabors Industries, Inc., 0.750%, 1/15/2024 | $ | 382,184 | ||||
| 395,000 | Oil States International, Inc., 1.500%, 2/15/2023 | 354,552 | ||||||
|
| |||||||
| 736,736 | ||||||||
|
| |||||||
| Pharmaceuticals — 1.9% | ||||||||
| 1,530,000 | BioMarin Pharmaceutical, Inc., 0.599%, 8/01/2024 | 1,616,443 | ||||||
| 220,000 | Dermira, Inc., 3.000%, 5/15/2022 | 202,586 | ||||||
| 230,000 | Flexion Therapeutics, Inc., 3.375%, 5/01/2024 | 245,390 | ||||||
| 275,000 | Intercept Pharmaceuticals, Inc., 3.250%, 7/01/2023 | 277,292 | ||||||
| 330,000 | PTC Therapeutics, Inc., 3.000%, 8/15/2022 | 380,682 | ||||||
|
| |||||||
| 2,722,393 | ||||||||
|
| |||||||
| Technology — 1.2% | ||||||||
| 625,000 | Avaya Holdings Corp., 2.250%, 6/15/2023 | 550,856 | ||||||
| 655,000 | CalAmp Corp., 2.000%, 8/01/2025 | 544,403 | ||||||
| 245,000 | Palo Alto Networks, Inc., 0.750%, 7/01/2023 | 270,233 | ||||||
| 340,000 | Pure Storage, Inc., 0.125%, 4/15/2023 | 337,162 | ||||||
|
| |||||||
| 1,702,654 | ||||||||
|
| |||||||
| Total Convertible Bonds (Identified Cost $8,963,204) | 8,474,531 | |||||||
|
| |||||||
| Total Bonds and Notes (Identified Cost $136,122,990) | 137,806,686 | |||||||
|
| |||||||
| Senior Loans — 1.4% | ||||||||
| Media Entertainment — 0.1% | ||||||||
| 215,643 | iHeartCommunications, Inc., Exit Term Loan,1-month LIBOR + 4.000%, 5.691%, 5/01/2026(a) | 217,170 | ||||||
|
| |||||||
| Retailers — 0.6% | ||||||||
| 921,922 | J.C. Penney Corp., Inc., 2016 Term Loan B,3-month LIBOR + 4.250%, 6.159%, 6/23/2023(a) | 810,425 | ||||||
|
| |||||||
| Transportation Services — 0.7% | ||||||||
| 1,026,589 | Uber Technologies, Inc., 2018 Term Loan,1-month LIBOR + 4.000%, 5.745%, 4/04/2025(a) | 1,023,653 | ||||||
|
| |||||||
| Total Senior Loans (Identified Cost $2,127,859) | 2,051,248 | |||||||
|
| |||||||
| Loan Participations — 0.3% | ||||||||
| ABS Other — 0.3% | ||||||||
| 397,714 | Harbour Aircraft Investments Ltd., Series2017-1, Class C, 8.000%, 11/15/2037 (Identified Cost $396,837) | 398,373 | ||||||
|
| |||||||
| Shares | ||||||||
| Preferred Stocks — 1.6% | ||||||||
| Food & Beverage — 1.5% | ||||||||
| 21,381 | Bunge Ltd., 4.875% | 2,201,691 | ||||||
|
| |||||||
See accompanying notes to financial statements.
| 26
Table of Contents
Portfolio of Investments – as of December 31, 2019
Loomis Sayles High Income Fund – (continued)
| Shares | Description | Value (†) | ||||||
| Midstream — 0.1% | ||||||||
| 988 | Chesapeake Energy Corp., 5.750%(c)(d)(f) | $ | 169,412 | |||||
| 20 | Chesapeake Energy Corp., 5.750%, 144A(c)(d)(f) | 3,430 | ||||||
| 137 | Chesapeake Energy Corp., 5.750%(c)(d)(f) | 23,508 | ||||||
|
| |||||||
| 196,350 | ||||||||
|
| |||||||
| Total Preferred Stocks (Identified Cost $2,900,221) | 2,398,041 | |||||||
|
| |||||||
| Other Investments — 0.6% | ||||||||
| Aircraft ABS — 0.6% | ||||||||
| 100 | ECAF I Blocker Ltd.(c)(e)(f)(i) (Identified Cost $1,000,000) | 864,000 | ||||||
|
| |||||||
| Common Stocks — 0.4% | ||||||||
| Chemicals — 0.1% | ||||||||
| 12,177 | Hexion Holdings Corp., Class B(j) | 155,257 | ||||||
|
| |||||||
| Media — 0.3% | ||||||||
| 41,970 | Clear Channel Outdoor Holdings, Inc.(j) | 120,034 | ||||||
| 17,670 | iHeartMedia, Inc., Class A(j) | 298,623 | ||||||
|
| |||||||
| 418,657 | ||||||||
|
| |||||||
| Oil, Gas & Consumable Fuels — 0.0% | ||||||||
| 3,650 | Halcon Resources Corp.(c)(e)(f)(j) | 52,304 | ||||||
|
| |||||||
| Total Common Stocks (Identified Cost $1,412,096) | 626,218 | |||||||
|
| |||||||
| Principal Amount | ||||||||
| Short-Term Investments — 0.6% | ||||||||
| $ | 924,835 | Tri-Party Repurchase Agreement with Fixed Income Clearing Corporation, dated 12/31/2019 at 0.900% to be repurchased at $924,882 on 1/02/2020 collateralized by $900,000 U.S. Treasury Note, 2.875% due 10/31/2023 valued at $945,191 including accrued interest (Note 2 of Notes to Financial Statements) (Identified Cost $924,835) | 924,835 | |||||
|
| |||||||
| Total Investments — 98.5% (Identified Cost $144,884,838) | 145,069,401 | |||||||
| Other assets less liabilities — 1.5% | 2,257,583 | |||||||
|
| |||||||
| Net Assets — 100.0% | $ | 147,326,984 | ||||||
|
| |||||||
| (†) | See Note 2 of Notes to Financial Statements. |
| ||||||
| (a) | Variable rate security. Rate as of December 31, 2019 is disclosed. |
| ||||||
| (b) | Payment-in-kind security for which the issuer, at each interest payment date, may make interest payments in cash and/or additional principal. For the period ended December 31, 2019, interest payments were made in cash. |
| ||||||
| (c) | Illiquid security. (Unaudited) |
| ||||||
| (d) | Securities classified as fair valued pursuant to the Fund’s pricing policies and procedures. At December 31, 2019, the value of these securities amounted to $1,646,883 or 1.1% of net assets. See Note 2 of Notes to Financial Statements. |
| ||||||
See accompanying notes to financial statements.
27 |
Table of Contents
Portfolio of Investments – as of December 31, 2019
Loomis Sayles High Income Fund – (continued)
| (e) | Fair valued by the Fund’s adviser. At December 31, 2019, the value of these securities amounted to $1,241,739 or 0.8% of net assets. See Note 2 of Notes to Financial Statements. |
| ||||||
| (f) | Level 3 security. Value has been determined using significant unobservable inputs. See Note 3 of Notes to Financial Statements. |
| ||||||
| (g) | Variable rate security. The interest rate adjusts periodically based on; (i) changes in current interest rates and/or prepayments on underlying pools of assets, if applicable, (ii) reference to a base lending rate plus or minus a margin, and/or (iii) reference to a base lending rate adjusted by a multiplier and/or subject to certain floors or caps. Rate as of December 31, 2019 is disclosed. |
| ||||||
| (h) | The issuer is in default with respect to interest and/or principal payments. Income is not being accrued. |
| ||||||
| (i) | Securities subject to restriction on resale. At December 31, 2019, the restricted securities held by the Fund are as follows: |
| ||||||
| Acquisition Date | Acquisition Cost | Value | % of Net Assets | |||||||||||||
| ECAF I Blocker Ltd. | 12/20/2016 | $ | 1,000,000 | $ | 864,000 | 0.6% | ||||||||||
| (j) | Non-income producing security. |
| ||||||
| 144A | All or a portion of these securities are exempt from registration under Rule 144A of the Securities Act of 1933. These securities may be resold in transactions exempt from registration, normally to qualified institutional buyers. At December 31, 2019, the value of Rule 144A holdings amounted to $82,598,504 or 56.1% of net assets. |
| ||||||
| ABS | Asset-Backed Securities |
| ||||||
| LIBOR | London Interbank Offered Rate |
| ||||||
| MTN | Medium Term Note |
| ||||||
| PIK | Payment-in-Kind |
| ||||||
| REITs | Real Estate Investment Trusts |
| ||||||
Industry Summary at December 31, 2019
Cable Satellite | 10.5 | % | ||
Technology | 6.6 | |||
Healthcare | 6.0 | |||
Pharmaceuticals | 5.8 | |||
Independent Energy | 5.2 | |||
Wireless | 4.2 | |||
Midstream | 3.8 | |||
Food & Beverage | 3.7 | |||
Media Entertainment | 3.6 | |||
Electric | 3.2 | |||
Finance Companies | 3.2 | |||
Banking | 3.0 | |||
Retailers | 2.8 | |||
Wirelines | 2.7 | |||
Metals & Mining | 2.7 | |||
Aerospace & Defense | 2.4 | |||
Oil Field Services | 2.3 | |||
Building Materials | 2.2 | |||
Other Investments, less than 2% each | 24.0 | |||
Short-Term Investments | 0.6 | |||
|
| |||
Total Investments | 98.5 | |||
Other assets less liabilities | 1.5 | |||
|
| |||
Net Assets | 100.0 | % | ||
|
|
See accompanying notes to financial statements.
| 28
Table of Contents
Portfolio of Investments – as of December 31, 2019
Loomis Sayles Investment Grade Bond Fund
| Principal Amount (‡) | Description | Value (†) | ||||||
| Bonds and Notes — 94.7% of Net Assets | ||||||||
| Non-Convertible Bonds — 93.9% | ||||||||
| ABS Car Loan — 7.6% | ||||||||
| $ | 6,688,850 | Ally Auto Receivables Trust, Series2017-3, Class A3, 1.740%, 9/15/2021 | $ | 6,684,620 | ||||
| 16,590,000 | Ally Auto Receivables Trust, Series2019-1, Class A3, 2.910%, 9/15/2023 | 16,794,882 | ||||||
| 13,085,000 | Ally Auto Receivables Trust, Series2019-4, Class A3, 1.840%, 6/17/2024 | 13,060,610 | ||||||
| 7,865,000 | American Credit Acceptance Receivables Trust, Series2019-3, Class D, 2.890%, 9/12/2025, 144A | 7,850,543 | ||||||
| 1,965,000 | AmeriCredit Automobile Receivables Trust, Series2018-2, Class D, 4.010%, 7/18/2024 | 2,046,347 | ||||||
| 10,515,000 | AmeriCredit Automobile Receivables Trust, Series2018-3, Class D, 4.040%, 11/18/2024 | 10,981,783 | ||||||
| 25,880,000 | AmeriCredit Automobile Receivables Trust, Series2019-1, Class D, 3.620%, 3/18/2025 | 26,584,971 | ||||||
| 12,340,000 | AmeriCredit Automobile Receivables Trust, Series2019-2, Class D, 2.990%, 6/18/2025 | 12,475,541 | ||||||
| 3,650,000 | CarMax Auto Owner Trust, Series2018-3, Class D, 3.910%, 1/15/2025 | 3,757,921 | ||||||
| 13,585,000 | CarMax Auto Owner Trust, Series2019-1, Class D, 4.040%, 8/15/2025(a)(b) | 14,117,199 | ||||||
| 5,811,000 | CarMax Auto Owner Trust, Series2019-2, Class D, 3.410%, 10/15/2025 | 5,915,195 | ||||||
| 2,315,000 | CarMax Auto Owner Trust, Series2019-3, Class D, 2.850%, 1/15/2026 | 2,318,994 | ||||||
| 5,122,000 | CPS Auto Receivables Trust , Series2019-D, Class D, 2.720%, 9/15/2025, 144A | 5,100,904 | ||||||
| 13,965,000 | CPS Auto Receivables Trust, Series2019-A, Class D, 4.350%, 12/16/2024, 144A | 14,424,842 | ||||||
| 1,800,000 | Credit Acceptance Auto Loan Trust, Series2017-3A, Class C, 3.480%, 10/15/2026, 144A | 1,825,684 | ||||||
| 23,320,000 | Credit Acceptance Auto Loan Trust, Series2019-1A, Class C, 3.940%, 6/15/2028, 144A(a)(b) | 24,091,624 | ||||||
| 6,555,000 | Drive Auto Receivables Trust, Series2018-5, Class D, 4.300%, 4/15/2026 | 6,769,307 | ||||||
| 16,395,000 | Drive Auto Receivables Trust, Series2019-1, Class D, 4.090%, 6/15/2026 | 16,880,684 | ||||||
| 3,700,000 | Drive Auto Receivables Trust, Series2019-2, Class D, 3.690%, 8/17/2026 | 3,787,872 | ||||||
| 10,760,000 | DT Auto Owner Trust, Series2019-1A, Class D, 3.870%, 11/15/2024, 144A | 10,990,159 | ||||||
| 3,950,000 | DT Auto Owner Trust, Series2019-2A, Class D, 3.480%, 2/18/2025, 144A | 4,005,320 | ||||||
| 3,400,000 | DT Auto Owner Trust, Series2019-3A, Class D, 2.960%, 4/15/2025, 144A | 3,401,958 | ||||||
| 3,790,000 | First Investors Auto Owner Trust, Series2019-1A, Class D, 3.550%, 4/15/2025, 144A | 3,860,700 | ||||||
| 4,610,000 | Flagship Credit Auto Trust, Series2019-3, Class D, 2.860%, 12/15/2025, 144A | 4,576,674 | ||||||
| 1,549,198 | Ford Credit Auto Owner Trust, Series2017-B, Class A3, 1.690%, 11/15/2021 | 1,547,673 | ||||||
| 15,246,806 | Ford Credit Auto Owner Trust, Series2018-A, Class A3, 3.030%, 11/15/2022 | 15,372,022 | ||||||
| 8,555,000 | GLS Auto Receivables Trust, Series2019-A, Class C, 3.540%, 2/18/2025, 144A | 8,697,608 | ||||||
| 3,218,000 | GM Financial Consumer Automobile Receivables Trust, Series2018-2, Class A3, 2.810%, 12/16/2022 | 3,244,805 | ||||||
| 2,000,000 | GM Financial Consumer Automobile Receivables Trust, Series2018-3, Class A3, 3.020%, 5/16/2023 | 2,024,540 | ||||||
| 15,645,000 | GM Financial Consumer Automobile Receivables Trust, Series2019-1, Class A3, 2.970%, 11/16/2023 | 15,859,937 | ||||||
See accompanying notes to financial statements.
29 |
Table of Contents
Portfolio of Investments – as of December 31, 2019
Loomis Sayles Investment Grade Bond Fund – (continued)
| Principal Amount (‡) | Description | Value (†) | ||||||
| ABS Car Loan — continued | ||||||||
| $ | 810,236 | Honda Auto Receivables Owner Trust, Series2016-4, Class A3, 1.210%, 12/18/2020 | $ | 809,602 | ||||
| 857,354 | Honda Auto Receivables Owner Trust, Series2017-2, Class A3, 1.680%, 8/16/2021 | 856,558 | ||||||
| 3,925,000 | Honda Auto Receivables Owner Trust, Series2017-2, Class A4, 1.870%, 9/15/2023 | 3,919,858 | ||||||
| 28,000,000 | Honda Auto Receivables Owner Trust, Series2018-4, Class A3, 3.160%, 1/17/2023 | 28,459,970 | ||||||
| 5,925,000 | Honda Auto Receivables Owner Trust, Series2019-1, Class A3, 2.830%, 3/20/2023 | 6,015,848 | ||||||
| 6,655,000 | Nissan Auto Receivables Owner Trust, Series2019-C, Class A3, 1.930%, 7/15/2024 | 6,657,644 | ||||||
| 2,685,000 | Nissan Auto Receivables Owner Trust, Series2016-C, Class A3, 1.180%, 1/15/2021 | 2,683,427 | ||||||
| 27,665,000 | Santander Drive Auto Receivables Trust, Series2019-1, Class D, 3.650%, 4/15/2025 | 28,338,048 | ||||||
| 6,995,000 | Santander Drive Auto Receivables Trust, Series2019-2, Class D, 3.220%, 7/15/2025 | 7,130,455 | ||||||
| 8,455,000 | Santander Drive Auto Receivables Trust, Series2019-H13, Class D, 2.680%, 10/15/2025 | 8,423,722 | ||||||
| 4,936,517 | Toyota Auto Receivables Owner Trust, Series2017-B, Class A3, 1.760%, 7/15/2021 | 4,933,575 | ||||||
| 12,473,250 | Toyota Auto Receivables Owner Trust, Series2017-D, Class A3, 1.930%, 1/18/2022 | 12,471,431 | ||||||
| 25,405,559 | Toyota Auto Receivables Owner Trust, Series2018-A, Class A3, 2.350%, 5/16/2022 | 25,471,977 | ||||||
| 1,981,871 | Toyota Auto Receivables Owner Trust, Series2018-C, Class A2A, 2.770%, 8/16/2021 | 1,986,058 | ||||||
| 15,495,000 | Westlake Automobile Receivables Trust, Series2019-1A, Class D, 3.670%, 3/15/2024, 144A | 15,792,079 | ||||||
|
| |||||||
| 423,001,171 | ||||||||
|
| |||||||
| ABS Credit Card — 1.7% | ||||||||
| 14,559,000 | American Express Credit Account Master Trust, Series2017-1, Class A, 1.930%, 9/15/2022 | 14,558,339 | ||||||
| 10,434,000 | American Express Credit Account Master Trust, Series2017-6, Class A, 2.040%, 5/15/2023 | 10,449,952 | ||||||
| 3,000,000 | American Express Credit Account Master Trust, Series2018-1, Class A, 2.670%, 10/17/2022 | 3,004,616 | ||||||
| 8,000,000 | American Express Credit Account Master Trust, Series2019-1, Class A, 2.870%, 10/15/2024 | 8,173,779 | ||||||
| 25,135,000 | Capital One Multi-Asset Execution Trust, Series2015-A2, Class A2, 2.080%, 3/15/2023 | 25,152,127 | ||||||
| 6,170,000 | Capital One Multi-Asset Execution Trust, Series2017-A4, Class A4, 1.990%, 7/17/2023 | 6,176,529 | ||||||
| 11,730,000 | Capital One Multi-Asset Execution Trust, Series2019-A1, Class A1, 2.840%, 12/15/2024 | 11,967,846 | ||||||
| 7,915,000 | Chase Issuance Trust, Series2015-A4, Class A4, 1.840%, 4/15/2022 | 7,913,172 | ||||||
See accompanying notes to financial statements.
| 30
Table of Contents
Portfolio of Investments – as of December 31, 2019
Loomis Sayles Investment Grade Bond Fund – (continued)
| Principal Amount (‡) | Description | Value (†) | ||||||
| ABS Credit Card — continued | ||||||||
| $ | 10,366,000 | Citibank Credit Card Issuance Trust, Series2017-A3, Class A3, 1.920%, 4/07/2022 | $ | 10,365,443 | ||||
|
| |||||||
| 97,761,803 | ||||||||
|
| |||||||
| ABS Home Equity — 4.7% | ||||||||
| 15,451,000 | American Homes 4 Rent, Series 2015-SFR1, Class E, 5.639%, 4/17/2052, 144A | 16,634,191 | ||||||
| 12,875,000 | AMSR Trust, Series 2019-SFR1, Class A, 2.774%, 1/19/2039, 144A | 12,869,361 | ||||||
| 6,077,236 | Bayview Opportunity Master Fund IVb Trust, Series2019-RN4, Class A1, 3.278%, 10/28/2034, 144A(c) | 6,063,651 | ||||||
| 1,579,142 | Bayview Opportunity Master Fund Trust, Series2019-RN1, Class A1, 4.090%, 2/28/2034, 144A(c) | 1,576,799 | ||||||
| 1,401,782 | Bayview Opportunity Master Fund Trust, Series2019-RN2, Class A1, 3.967%, 3/28/2034, 144A(c) | 1,403,222 | ||||||
| 6,075,000 | Brass PLC, Series 8A,Class A1, 3-month LIBOR + 0.700%, 2.806%, 11/16/2066, 144A(d) | 6,076,567 | ||||||
| 5,466,450 | Citigroup Mortgage Loan Trust, Series2019-B, Class A1, 3.258%, 4/25/2066, 144A(c) | 5,472,867 | ||||||
| 7,838,772 | Citigroup Mortgage Loan Trust, Series2019-RP1, Class A1, 3.500%, 1/25/2066, 144A(c) | 8,003,802 | ||||||
| 5,513,144 | Colony American Finance Ltd., Series2019-3, Class A, 2.705%, 10/15/2052, 144A | 5,510,491 | ||||||
| 2,929,000 | Colony American Finance Ltd., Series2019-3, Class B, 3.163%, 10/15/2052, 144A | 2,911,078 | ||||||
| 2,434,000 | CoreVest American Finance Trust, Series2019-1, Class D, 4.818%, 3/15/2052, 144A | 2,612,904 | ||||||
| 7,702,256 | GCAT Trust, Series2019-3, Class A1, 3.352%, 10/25/2049, 144A(c) | 7,693,564 | ||||||
| 9,039,363 | GCAT Trust, Series 2019-RPL1, Class A1, 2.650%, 10/25/2068, 144A(c) | 9,028,412 | ||||||
| 948,753 | Gosforth Funding PLC, Series2018-1A,Class A1, 3-month LIBOR + 0.450%, 2.360%, 8/25/2060, 144A(d) | 947,210 | ||||||
| 1,835,670 | Grand Avenue Mortgage Loan Trust, Series 2017-RPL1, Class A1, 3.250%, 8/25/2064, 144A | 1,812,163 | ||||||
| 1,630,371 | Holmes Master Issuer PLC, Series2018-1A,Class A2, 3-month LIBOR + 0.360%, 2.361%, 10/15/2054, 144A(d) | 1,629,309 | ||||||
| 2,902,375 | Home Partners of America Trust, Series2019-1, Class D, 3.406%, 9/17/2039, 144A | 2,865,615 | ||||||
| 2,628,289 | Home Partners of America Trust, Series2019-2, Class D, 3.121%, 10/19/2039, 144A | 2,575,723 | ||||||
| 3,050,000 | Invitation Homes Trust, Series 2018-SFR4,Class D, 1-month LIBOR + 1.650%, 3.387%, 1/17/2038, 144A(d) | 3,061,402 | ||||||
| 4,008,333 | Lanark Master Issuer PLC, Series2019-1A,Class 1A1, 3-month LIBOR + 0.770%, 2.669%, 12/22/2069, 144A(d) | 4,019,208 | ||||||
| 7,020,000 | Lanark Master Issuer PLC, Series2019-2A, Class 1A, 2.710%, 12/22/2069, 144A(c) | 7,047,961 | ||||||
| 9,486,722 | Legacy Mortgage Asset Trust, Series2019-GS7, Class A1, 3.250%, 11/25/2059, 144A(c) | 9,493,732 | ||||||
| 4,116,300 | Legacy Mortgage Asset Trust, Series2019-GS3, Class A1, 3.750%, 4/25/2059, 144A(c) | 4,149,776 | ||||||
See accompanying notes to financial statements.
31 |
Table of Contents
Portfolio of Investments – as of December 31, 2019
Loomis Sayles Investment Grade Bond Fund – (continued)
| Principal Amount (‡) | Description | Value (†) | ||||||
| ABS Home Equity — continued | ||||||||
| $ | 12,061,613 | Mill City Mortgage Loan Trust, Series2019-GS1, Class A1, 2.750%, 7/25/2059, 144A(c) | $ | 12,122,192 | ||||
| 5,005,300 | Mill City Mortgage Trust, Series2019-1, Class A1, 3.250%, 10/25/2069, 144A(c) | 5,097,741 | ||||||
| 6,695,495 | Onslow Bay Financial LLC , Series 2019-EXP3, Class 1A8, 3.500%, 10/25/2059, 144A(c) | 6,742,656 | ||||||
| 3,327,372 | Preston Ridge Partners Mortgage LLC, Series2019-3A, Class A1, 3.351%, 7/25/2024, 144A(c) | 3,332,005 | ||||||
| 3,708,000 | Progress Residential Trust, Series 2017-SFR2, Class E, 4.142%, 12/17/2034, 144A | 3,728,872 | ||||||
| 1,332,000 | Progress Residential Trust, Series 2018-SFR2, Class E, 4.656%, 8/17/2035, 144A | 1,361,294 | ||||||
| 2,830,000 | Progress Residential Trust, Series 2019-SFR1, Class D, 4.168%, 8/17/2035, 144A | 2,890,678 | ||||||
| 4,732,000 | Progress Residential Trust, Series 2019-SFR2, Class D, 3.794%, 5/17/2036, 144A | 4,803,748 | ||||||
| 3,860,000 | Progress Residential Trust, Series 2019-SFR4, Class D, 3.136%, 10/17/2036, 144A | 3,836,015 | ||||||
| 5,506,820 | PRPM LLC, Series2019-4A, Class A1, 3.351%, 11/25/2024, 144A(c) | 5,506,759 | ||||||
| 5,709,291 | RCO V Mortgage LLC, Series2019-1, Class A1, 3.721%, 5/24/2024, 144A(c) | 5,715,345 | ||||||
| 3,143,539 | Sequoia Mortgage Trust, Series2017-CH2, Class A1, 4.000%, 12/25/2047, 144A(c) | 3,248,122 | ||||||
| 6,864,056 | Sequoia Mortgage Trust, Series2019-CH2, Class A1, 4.500%, 8/25/2049, 144A(c) | 6,963,957 | ||||||
| 5,000,475 | Silverstone Master Issuer PLC, Series2019-1A,Class 1A, 3-month LIBOR + 0.570%, 2.536%, 1/21/2070, 144A(d) | 5,002,275 | ||||||
| 4,930,000 | Towd Point Mortgage Trust, Series2017-4, Class M2, 3.250%, 6/25/2057, 144A(c) | 4,925,840 | ||||||
| 4,207,213 | Towd Point Mortgage Trust, Series2015-2, Class 1A13, 2.500%, 11/25/2060, 144A(c) | 4,196,295 | ||||||
| 1,443,284 | Towd Point Mortgage Trust, Series2016-1, Class A1B, 2.750%, 2/25/2055, 144A(c) | 1,443,959 | ||||||
| 10,959,121 | Towd Point Mortgage Trust, Series2019-4, Class A1, 2.900%, 10/25/2059, 144A(c) | 11,022,139 | ||||||
| 2,575,000 | Tricon American Homes Trust, Series 2019-SFR1, Class D, 3.198%, 3/17/2038, 144A | 2,559,706 | ||||||
| 13,259,594 | Vericrest Opportunity Loan Trust, Series 2019-NPL8, Class A1A, 3.278%, 11/25/2049, 144A(c) | 13,227,526 | ||||||
| 8,358,268 | Vericrest Opportunity Loan Trust, Series 2019-NPL3, Class A1, 3.967%, 3/25/2049, 144A(c) | 8,401,162 | ||||||
| 12,652,190 | Vericrest Opportunity Loan Trust, Series 2019-NPL5, Class A1A, 3.352%, 9/25/2049, 144A(c) | 12,646,578 | ||||||
| 1,407,847 | VOLT LXXII LLC, Series 2018-NPL8, Class A1A, 4.213%, 10/26/2048, 144A(c) | 1,406,428 | ||||||
| 5,318,288 | VOLT LXXV LLC, Series 2019-NPL1, Class A1A, 4.336%, 1/25/2049, 144A(c) | 5,349,987 | ||||||
| 4,934,679 | VOLT LXXXIII LLC, Series 2019-NPL9, Class A1A, 3.327%, 11/26/2049, 144A(c) | 4,932,247 | ||||||
|
| |||||||
| 263,922,534 | ||||||||
|
| |||||||
See accompanying notes to financial statements.
| 32
Table of Contents
Portfolio of Investments – as of December 31, 2019
Loomis Sayles Investment Grade Bond Fund – (continued)
| Principal Amount (‡) | Description | Value (†) | ||||||
| ABS Other — 3.5% | ||||||||
| $ | 39,262,848 | FAN Engine Securitization Ltd., Series2013-1A, Class 1A, 4.625%, 10/15/2043, 144A(a)(b) | $ | 39,261,741 | ||||
| 12,372,896 | Horizon Aircraft Finance I Ltd., Series2018-1, Class A, 4.458%, 12/15/2038, 144A | 12,702,154 | ||||||
| 2,923,205 | Horizon Aircraft Finance II Ltd., Series2019-1, Class A, 3.721%, 7/15/2039, 144A | 2,919,606 | ||||||
| 1,975,000 | HPEFS Equipment Trust, Series2019-1A, Class C, 2.490%, 9/20/2029, 144A | 1,974,637 | ||||||
| 8,041,680 | Kestrel Aircraft Funding Ltd., Series2018-1A, Class A, 4.250%, 12/15/2038, 144A | 8,172,861 | ||||||
| 14,088,288 | MAPS Ltd., Series2018-1A, Class A, 4.212%, 5/15/2043, 144A | 14,340,492 | ||||||
| 4,096,091 | MAPS Ltd., Series2019-1A, Class A, 4.458%, 3/15/2044, 144A | 4,216,395 | ||||||
| 13,610,000 | Mariner Finance Issuance Trust, Series2018-AA, Class A, 4.200%, 11/20/2030, 144A | 13,882,847 | ||||||
| 5,222,850 | Marlette Funding Trust, Series2019-4A, Class A, 2.390%, 12/17/2029, 144A | 5,226,606 | ||||||
| 2,406,243 | Marlette Funding Trust, Series2019-1A, Class A, 3.440%, 4/16/2029, 144A | 2,423,702 | ||||||
| 8,040,000 | OneMain Financial Issuance Trust, Series2019-1A, Class D, 4.220%, 2/14/2031, 144A | 8,322,842 | ||||||
| 15,600,403 | S-Jets Ltd., Series2017-1, Class A, 3.967%, 8/15/2042, 144A | 15,612,523 | ||||||
| 940,000 | SLM Private Credit Student Loan Trust, Series2003-C,Class A3, 28-day ARS, 5.080%, 9/15/2032(d) | 938,892 | ||||||
| 1,495,000 | SLM Private Credit Student Loan Trust, Series2003-C,Class A4, 28-day ARS, 5.080%, 9/15/2032(d) | 1,492,476 | ||||||
| 13,765,000 | SoFi Consumer Loan Program Trust, Series2019-1, Class C, 3.730%, 2/25/2028, 144A | 14,077,175 | ||||||
| 3,459,000 | SoFi Consumer Loan Program Trust, Series2018-1, Class B, 3.650%, 2/25/2027, 144A | 3,525,296 | ||||||
| 6,720,000 | SoFi Consumer Loan Program Trust, Series2018-4, Class C, 4.170%, 11/26/2027, 144A | 6,943,605 | ||||||
| 6,805,000 | SoFi Consumer Loan Program Trust, Series2019-2, Class C, 3.460%, 4/25/2028, 144A | 6,921,100 | ||||||
| 12,755,000 | SoFi Consumer Loan Program Trust, Series2019-3, Class C, 3.350%, 5/25/2028, 144A | 12,956,024 | ||||||
| 7,370,000 | SoFi Consumer Loan Program Trust, Series2019-4, Class C, 2.840%, 8/25/2028, 144A | 7,350,316 | ||||||
| 13,234,382 | SpringCastle Funding Asset-Backed Notes, Series2019-AA, Class A, 3.200%, 5/27/2036, 144A | 13,283,534 | ||||||
|
| |||||||
| 196,544,824 | ||||||||
|
| |||||||
| ABS Student Loan — 1.6% | ||||||||
| 11,813,199 | ELFI Graduate Loan Program LLC, Series2019-A, Class A, 2.540%, 3/25/2044, 144A | 11,662,331 | ||||||
| 14,080,000 | Navient Private Education Refi Loan Trust, Series2019-FA, Class A2, 2.600%, 8/15/2068, 144A | 14,054,456 | ||||||
| 4,020,000 | Navient Private Education Refi Loan Trust, Series2019-CA, Class A2, 3.130%, 2/15/2068, 144A | 4,040,302 | ||||||
| 6,910,000 | Navient Student Loan Trust, Series2018-EA, Class A2, 4.000%, 12/15/2059, 144A | 7,155,941 | ||||||
See accompanying notes to financial statements.
33 |
Table of Contents
Portfolio of Investments – as of December 31, 2019
Loomis Sayles Investment Grade Bond Fund – (continued)
| Principal Amount (‡) | Description | Value (†) | ||||||
| ABS Student Loan — continued | ||||||||
| $ | 796,000 | SLM Private Credit Student Loan Trust, Series2003-A,Class A3, 28-day ARS, 5.040%, 6/15/2032(d) | $ | 794,917 | ||||
| 575,000 | SLM Private Credit Student Loan Trust, Series2003-A,Class A4, 28-day ARS, 4.440%, 6/15/2032(d) | 575,081 | ||||||
| 1,150,000 | SLM Private Credit Student Loan Trust, Series2003-B,Class A3, 28-day ARS, 5.040%, 3/15/2033(d) | 1,147,862 | ||||||
| 786,000 | SLM Private Credit Student Loan Trust, Series2003-B,Class A4, 28-day ARS, 4.590%, 3/15/2033(d) | 785,546 | ||||||
| 2,500,000 | SMB Private Education Loan Trust, Series2015-C, Class B, 3.500%, 9/15/2043, 144A | 2,538,399 | ||||||
| 565,000 | SMB Private Education Loan Trust, Series2018-B, Class B, 4.000%, 7/15/2042, 144A | 584,884 | ||||||
| 1,525,000 | SMB Private Education Loan Trust, Series2018-C, Class B, 4.000%, 11/17/2042, 144A | 1,568,676 | ||||||
| 10,385,000 | SMB Private Education Loan Trust, Series2019-A, Class A2A, 3.440%, 7/15/2036, 144A | 10,546,403 | ||||||
| 16,265,000 | SMB Private Education Loan Trust, Series2019-B, Class A2A, 2.840%, 6/15/2037, 144A | 16,328,643 | ||||||
| 9,075,000 | SoFi Professional Loan Program LLC, Series2019-A, Class A2FX, 3.690%, 6/15/2048, 144A | 9,376,797 | ||||||
| 8,217,000 | SoFi Professional Loan Program LLC, Series2019-C, Class A2FX, 2.370%, 11/16/2048, 144A | 8,061,895 | ||||||
|
| |||||||
| 89,222,133 | ||||||||
|
| |||||||
| ABS Whole Business — 2.0% | ||||||||
| 10,278,610 | Adams Outdoor Advertising LP, Series2018-1, Class A, 4.810%, 11/15/2048, 144A | 10,665,474 | ||||||
| 3,595,000 | Adams Outdoor Advertising LP, Series2018-1, Class B, 5.653%, 11/15/2048, 144A | 3,714,392 | ||||||
| 27,202,500 | Coinstar Funding LLC, Series2017-1A, Class A2, 5.216%, 4/25/2047, 144A | 27,908,233 | ||||||
| 7,260,515 | DB Master Finance LLC, Series2019-1A, Class A23, 4.352%, 5/20/2049, 144A | 7,522,111 | ||||||
| 2,383,360 | Domino’s Pizza Master Issuer LLC, Series2017-1A, Class A23, 4.118%, 7/25/2047, 144A | 2,468,780 | ||||||
| 133,313 | Domino’s Pizza Master Issuer LLC, Series2018-1A, Class A2I, 4.116%, 7/25/2048, 144A | 137,101 | ||||||
| 5,244,613 | Domino’s Pizza Master Issuer LLC, Series2018-1A, Class A2II, 4.328%, 7/25/2048, 144A | 5,462,002 | ||||||
| 4,035,000 | Domino’s Pizza Master Issuer LLC, Series2019-1A, Class A2, 3.668%, 10/25/2049, 144A | 4,035,686 | ||||||
| 2,285,200 | Driven Brands Funding LLC, Series2018-1A, Class A2, 4.739%, 4/20/2048, 144A | 2,369,204 | ||||||
| 5,046,863 | Driven Brands Funding LLC, Series2019-1A, Class A2, 4.641%, 4/20/2049, 144A | 5,218,002 | ||||||
| 4,962,500 | Five Guys Funding LLC, Series2017-1A, Class A2, 4.600%, 7/25/2047, 144A | 5,148,779 | ||||||
| 17,582,250 | Stack Infrastructure Issuer LLC, Series2019-1A, Class A2, 4.540%, 2/25/2044, 144A | 18,408,863 | ||||||
See accompanying notes to financial statements.
| 34
Table of Contents
Portfolio of Investments – as of December 31, 2019
Loomis Sayles Investment Grade Bond Fund – (continued)
| Principal Amount (‡) | Description | Value (†) | ||||||
| ABS Whole Business — continued | ||||||||
| $ | 13,459,050 | Taco Bell Funding LLC, Series2018-1A, Class A2I, 4.318%, 11/25/2048, 144A | $ | 13,771,031 | ||||
| 3,672,250 | Wingstop Funding LLC, Series2018-1, Class A2, 4.970%, 12/05/2048, 144A | 3,779,994 | ||||||
|
| |||||||
| 110,609,652 | ||||||||
|
| |||||||
| Aerospace & Defense — 1.5% | ||||||||
| 650,000 | Leonardo U.S. Holdings, Inc., 7.375%, 7/15/2039 | 807,560 | ||||||
| 78,795,000 | Textron, Inc., 5.950%, 9/21/2021 | 83,206,395 | ||||||
|
| |||||||
| 84,013,955 | ||||||||
|
| |||||||
| Airlines — 1.8% | ||||||||
| 2,811,133 | Air Canada Pass Through Trust, Series2013-1, Class B, 5.375%, 11/15/2022, 144A | 2,890,127 | ||||||
| 1,687,628 | American Airlines Pass Through Certificates, Series2016-3, Class B, 3.750%, 4/15/2027 | 1,706,646 | ||||||
| 3,782,751 | American Airlines Pass Through Certificates, Series 2017-2, Class B, 3.700%, 4/15/2027 | 3,823,925 | ||||||
| 8,007,826 | American Airlines Pass Through Trust, Series2016-1, Class B, 5.250%, 7/15/2025 | 8,470,516 | ||||||
| 2,014,937 | American Airlines Pass Through Trust, Series2015-2, Class B, 4.400%, 3/22/2025 | 2,087,379 | ||||||
| 23,269,000 | American Airlines Pass Through Trust, Series2019-1, Class B, 3.850%, 8/15/2029 | 23,634,789 | ||||||
| 6,855,000 | British Airways Pass Through Trust, Series2019-1, Class A, 3.350%, 12/15/2030, 144A | 6,970,781 | ||||||
| 1,045,800 | Continental Airlines Pass Through Certificates, Series2012-1, Class B, 6.250%, 10/11/2021 | 1,055,275 | ||||||
| 324,173 | Continental Airlines Pass Through Trust, Series2001-1,Class A-1, 6.703%, 12/15/2022 | 341,549 | ||||||
| 1,039,170 | Delta Air Lines Pass Through Trust, Series2007-1, Class A, 6.821%, 2/10/2024 | 1,128,160 | ||||||
| 4,926,025 | Delta Air Lines Pass Through Trust, Series2007-1, Class B, 8.021%, 2/10/2024 | 5,388,385 | ||||||
| 835,182 | Latam Airlines Pass Through Trust, Series2015-1, Class B, 4.500%, 8/15/2025 | 836,218 | ||||||
| 13,000,876 | UAL Pass Through Trust, Series2007-1, Class A, 6.636%, 1/02/2024 | 13,733,865 | ||||||
| 24,981,273 | United Airlines Pass Through Trust, Series2016-2, Class B, 3.650%, 4/07/2027 | 25,127,913 | ||||||
| 2,724,967 | United Airlines Pass Through Trust, Series2018-1, Class A, 3.700%, 9/01/2031 | 2,796,037 | ||||||
|
| |||||||
| 99,991,565 | ||||||||
|
| |||||||
| Automotive — 2.1% | ||||||||
| 18,836,000 | Cummins, Inc., 5.650%, 3/01/2098 | 23,942,816 | ||||||
| 5,274,000 | Cummins, Inc., 6.750%, 2/15/2027 | 6,509,068 | ||||||
| 14,000,000 | Toyota Motor Credit Corp., 1.950%, 4/17/2020 | 13,999,712 | ||||||
| 10,000,000 | Toyota Motor Credit Corp., MTN, 2.150%, 3/12/2020 | 10,002,611 | ||||||
| 38,060,000 | Toyota Motor Credit Corp., MTN, 2.650%, 4/12/2022 | 38,739,333 | ||||||
| 4,750,000 | Volkswagen Group of America Finance LLC, 2.500%, 9/24/2021, 144A | 4,791,431 | ||||||
See accompanying notes to financial statements.
35 |
Table of Contents
Portfolio of Investments – as of December 31, 2019
Loomis Sayles Investment Grade Bond Fund – (continued)
| Principal Amount (‡) | Description | Value (†) | ||||||
| Automotive — continued | ||||||||
| $ | 12,005,000 | Volkswagen Group of America Finance LLC, 2.700%, 9/26/2022, 144A | $ | 12,142,182 | ||||
| 7,565,000 | ZF North America Capital, Inc., 4.750%, 4/29/2025, 144A | 7,959,864 | ||||||
|
| |||||||
| 118,087,017 | ||||||||
|
| |||||||
| Banking — 7.9% | ||||||||
| 39,613,000 | Ally Financial, Inc., 4.625%, 3/30/2025 | 42,881,072 | ||||||
| 1,468,000 | Ally Financial, Inc., 8.000%, 11/01/2031 | 2,011,681 | ||||||
| 49,304,000 | Bank of America Corp., (fixed rate to 12/20/2027, variable rate thereafter), 3.419%, 12/20/2028 | 51,776,288 | ||||||
| 100,000 | Bank of America Corp., MTN, 4.250%, 10/22/2026 | 109,081 | ||||||
| 25,627,000 | Bank of America Corp., Series L, MTN, 4.183%, 11/25/2027 | 27,791,119 | ||||||
| 22,500,000 | BNP Paribas S.A., (fixed rate to 3/01/2028, variable rate thereafter), 4.375%, 3/01/2033, 144A | 24,303,449 | ||||||
| 460,000 | Capital One Financial Corp., 4.200%, 10/29/2025 | 496,563 | ||||||
| 17,000,000 | Citigroup, Inc., 3.500%, 5/15/2023 | 17,694,194 | ||||||
| 1,230,000 | Citigroup, Inc., 4.125%, 7/25/2028 | 1,342,261 | ||||||
| 1,660,000 | Citigroup, Inc., 4.500%, 1/14/2022 | 1,740,490 | ||||||
| 7,155,000 | Credit Agricole S.A., (fixed rate to 1/10/2028, variable rate thereafter), 4.000%, 1/10/2033, 144A | 7,549,455 | ||||||
| 17,940,000 | Danske Bank A/S, 5.000%, 1/12/2022, 144A | 18,844,044 | ||||||
| 14,200,000 | Danske Bank A/S, 5.375%, 1/12/2024, 144A | 15,543,803 | ||||||
| 3,390,000 | Danske Bank A/S, (fixed rate to 12/20/2024, variable rate thereafter), 3.244%, 12/20/2025, 144A | 3,431,010 | ||||||
| 13,075,000 | Danske Bank A/S, (fixed rate to 9/20/2021, variable rate thereafter), 3.001%, 9/20/2022, 144A | 13,190,898 | ||||||
| 20,999,000 | Deutsche Bank AG, (fixed rate to 12/01/2027, variable rate thereafter), 4.875%, 12/01/2032 | 19,791,558 | ||||||
| 6,645,000 | Goldman Sachs Group, Inc. (The), GMTN, 5.375%, 3/15/2020 | 6,690,024 | ||||||
| 70,245,000 | JPMorgan Chase & Co., 4.125%, 12/15/2026 | 76,956,398 | ||||||
| 100,000 | KeyBank NA, 6.950%, 2/01/2028 | 126,434 | ||||||
| 5,900,000 | Morgan Stanley, 5.750%, 1/25/2021 | 6,127,564 | ||||||
| 1,845,000 | Morgan Stanley, GMTN, 4.350%, 9/08/2026 | 2,018,216 | ||||||
| 20,695,000 | Morgan Stanley, MTN, 4.100%, 5/22/2023 | 21,853,083 | ||||||
| 15,160,000 | Santander Holdings USA, Inc., 3.244%, 10/05/2026, 144A | 15,327,930 | ||||||
| 20,295,000 | Societe Generale S.A., 4.250%, 4/14/2025, 144A | 21,208,275 | ||||||
| 21,340,000 | Standard Chartered PLC,3-month LIBOR + 1.150%, 3.116%, 1/20/2023, 144A(d) | 21,478,497 | ||||||
| 5,900,000 | Standard Chartered PLC, (fixed rate to 1/20/2022, variable rate thereafter), 4.247%, 1/20/2023, 144A | 6,110,984 | ||||||
| 7,580,000 | Synchrony Financial, 2.850%, 7/25/2022 | 7,673,669 | ||||||
| 3,865,000 | Synchrony Financial, 4.375%, 3/19/2024 | 4,123,986 | ||||||
|
| |||||||
| 438,192,026 | ||||||||
|
| |||||||
| Brokerage — 1.6% | ||||||||
| 50,270,000 | Jefferies Group LLC, 5.125%, 1/20/2023 | 54,290,526 | ||||||
| 19,498,000 | Jefferies Group LLC, 6.250%, 1/15/2036 | 23,294,876 | ||||||
| 8,760,000 | Jefferies Group LLC, 6.450%, 6/08/2027 | 10,276,571 | ||||||
|
| |||||||
| 87,861,973 | ||||||||
|
| |||||||
See accompanying notes to financial statements.
| 36
Table of Contents
Portfolio of Investments – as of December 31, 2019
Loomis Sayles Investment Grade Bond Fund – (continued)
| Principal Amount (‡) | Description | Value (†) | ||||||
| Building Materials — 0.5% | ||||||||
| $ | 925,000 | Masco Corp., 6.500%, 8/15/2032 | $ | 1,135,631 | ||||
| 23,975,000 | Owens Corning, 7.000%, 12/01/2036 | 29,869,531 | ||||||
|
| |||||||
| 31,005,162 | ||||||||
|
| |||||||
| Cable Satellite — 1.5% | ||||||||
| 15,215,000 | Charter Communication Operating LLC/Charter Communication Operating Capital Corp., 4.800%, 3/01/2050 | 16,044,284 | ||||||
| 6,695,000 | Charter Communications Operating LLC/Charter Communications Operating Capital Corp., 5.750%, 4/01/2048 | 7,819,254 | ||||||
| 10,320,000 | Cox Communications, Inc., 4.500%, 6/30/2043, 144A | 10,750,045 | ||||||
| 5,820,000 | Cox Communications, Inc., 4.700%, 12/15/2042, 144A | 6,310,272 | ||||||
| 13,630,000 | Time Warner Cable LLC, 4.125%, 2/15/2021 | 13,850,621 | ||||||
| 9,055,000 | Time Warner Cable LLC, 4.500%, 9/15/2042 | 9,257,638 | ||||||
| 15,815,000 | Time Warner Cable LLC, 5.500%, 9/01/2041 | 17,667,049 | ||||||
|
| |||||||
| 81,699,163 | ||||||||
|
| |||||||
| Chemicals — 0.8% | ||||||||
| 27,205,000 | CF Industries, Inc., 4.500%, 12/01/2026, 144A | 29,608,549 | ||||||
| 3,740,000 | FMC Corp., 3.450%, 10/01/2029 | 3,867,088 | ||||||
| 2,075,000 | FMC Corp., 4.500%, 10/01/2049 | 2,264,229 | ||||||
| 8,145,000 | LYB International Finance III LLC, 4.200%, 10/15/2049 | 8,501,263 | ||||||
|
| |||||||
| 44,241,129 | ||||||||
|
| |||||||
| Consumer Products — 0.2% | ||||||||
| 7,458,000 | Hasbro, Inc., 6.600%, 7/15/2028 | 8,895,400 | ||||||
|
| |||||||
| Diversified Manufacturing — 0.1% | ||||||||
| 5,305,000 | General Electric Co., Series A, MTN,3-month LIBOR + 0.300%, 2.301%, 5/13/2024(d) | 5,102,002 | ||||||
|
| |||||||
| Electric — 2.2% | ||||||||
| 20,316,424 | Alta Wind Holdings LLC, 7.000%, 6/30/2035, 144A | 22,661,634 | ||||||
| 30,430,000 | EDP Finance BV, 4.125%, 1/15/2020, 144A | 30,397,014 | ||||||
| 13,025,000 | Enel Finance International NV, 6.000%, 10/07/2039, 144A | 16,411,808 | ||||||
| 9,007,000 | Enel Finance International NV, 6.800%, 9/15/2037, 144A | 11,991,613 | ||||||
| 39,280,000 | Vistra Operations Co. LLC, 3.700%, 1/30/2027, 144A | 39,031,256 | ||||||
|
| |||||||
| 120,493,325 | ||||||||
|
| |||||||
| Finance Companies — 1.5% | ||||||||
| 12,430,000 | Aircastle Ltd., 4.125%, 5/01/2024 | 13,060,361 | ||||||
| 20,595,000 | Aircastle Ltd., 4.400%, 9/25/2023 | 21,776,176 | ||||||
| 8,160,000 | Aircastle Ltd., 5.000%, 4/01/2023 | 8,727,782 | ||||||
| 6,700,000 | Antares Holdings LP, 6.000%, 8/15/2023, 144A | 7,049,272 | ||||||
| 18,830,000 | International Lease Finance Corp., 4.625%, 4/15/2021 | 19,418,448 | ||||||
| 7,805,000 | Quicken Loans, Inc., 5.250%, 1/15/2028, 144A | 8,078,175 | ||||||
| 6,392,000 | Quicken Loans, Inc., 5.750%, 5/01/2025, 144A | 6,607,730 | ||||||
|
| |||||||
| 84,717,944 | ||||||||
|
| |||||||
| Food & Beverage — 2.1% | ||||||||
| 8,980,000 | BRF S.A., 4.875%, 1/24/2030, 144A | 9,260,715 | ||||||
| 13,750,000 | General Mills, Inc., 2.600%, 10/12/2022 | 13,960,789 | ||||||
See accompanying notes to financial statements.
37 |
Table of Contents
Portfolio of Investments – as of December 31, 2019
Loomis Sayles Investment Grade Bond Fund – (continued)
| Principal Amount (‡) | Description | Value (†) | ||||||
| Food & Beverage — continued | ||||||||
| $ | 8,595,000 | JBS USA LUX S.A./JBS USA Finance, Inc., 5.750%, 6/15/2025, 144A | $ | 8,895,825 | ||||
| 4,910,000 | JBS USA LUX S.A./JBS USA Finance, Inc., 6.750%, 2/15/2028, 144A | 5,425,599 | ||||||
| 10,660,000 | JBS USA LUX S.A./JBS USA Food Co./JBS USA Finance, Inc., 5.500%, 1/15/2030, 144A | 11,449,906 | ||||||
| 10,465,000 | NBM U.S Holdings, Inc., 7.000%, 5/14/2026, 144A | 11,333,700 | ||||||
| 9,535,000 | PepsiCo, Inc., 1.700%, 10/06/2021 | 9,539,187 | ||||||
| 45,980,000 | PepsiCo, Inc., 2.000%, 4/15/2021 | 46,111,181 | ||||||
|
| |||||||
| 115,976,902 | ||||||||
|
| |||||||
| Government Guaranteed — 1.0% | ||||||||
| 55,000,000 | Kreditanstalt fuer Wiederaufbau, 1.500%, 4/20/2020 | 54,963,095 | ||||||
|
| |||||||
| Government Owned – No Guarantee — 0.6% | ||||||||
| 21,545,000 | Petrobras Global Finance BV, 5.750%, 2/01/2029 | 24,302,760 | ||||||
| 6,130,000 | Petrobras Global Finance BV, 6.900%, 3/19/2049 | 7,190,490 | ||||||
|
| |||||||
| 31,493,250 | ||||||||
|
| |||||||
| Health Insurance — 0.5% | ||||||||
| 27,570,000 | Anthem, Inc., 2.500%, 11/21/2020 | 27,692,669 | ||||||
| 3,040,000 | Centene Corp., 6.125%, 2/15/2024 | 3,154,000 | ||||||
|
| |||||||
| 30,846,669 | ||||||||
|
| |||||||
| Healthcare — 2.3% | ||||||||
| 19,420,000 | Cigna Corp., 4.375%, 10/15/2028 | 21,515,185 | ||||||
| 1,261,000 | Cigna Corp., 7.875%, 5/15/2027, 144A | 1,636,465 | ||||||
| 13,765,000 | CVS Health Corp., 4.100%, 3/25/2025 | 14,778,987 | ||||||
| 23,120,000 | HCA, Inc., 4.500%, 2/15/2027 | 24,934,707 | ||||||
| 24,240,000 | HCA, Inc., 5.250%, 4/15/2025 | 27,122,373 | ||||||
| 4,580,000 | HCA, Inc., 5.250%, 6/15/2026 | 5,131,121 | ||||||
| 17,055,000 | HCA, Inc., 5.250%, 6/15/2049 | 19,066,276 | ||||||
| 4,806,000 | HCA, Inc., 7.050%, 12/01/2027 | 5,695,110 | ||||||
| 1,592,000 | HCA, Inc., 7.500%, 11/06/2033 | 2,005,920 | ||||||
| 1,295,000 | HCA, Inc., 7.690%, 6/15/2025 | 1,560,475 | ||||||
| 2,480,000 | HCA, Inc., MTN, 7.580%, 9/15/2025 | 2,963,600 | ||||||
| 3,068,000 | HCA, Inc., MTN, 7.750%, 7/15/2036 | 3,650,920 | ||||||
|
| |||||||
| 130,061,139 | ||||||||
|
| |||||||
| Independent Energy — 2.4% | ||||||||
| 30,195,000 | Continental Resources, Inc., 3.800%, 6/01/2024 | 31,230,311 | ||||||
| 10,525,000 | Continental Resources, Inc., 4.375%, 1/15/2028 | 11,192,075 | ||||||
| 20,900,000 | Diamondback Energy, Inc., 3.500%, 12/01/2029 | 21,267,840 | ||||||
| 10,475,000 | Hess Corp., 4.300%, 4/01/2027 | 11,170,788 | ||||||
| 21,000,000 | Newfield Exploration Co., 5.625%, 7/01/2024 | 23,076,580 | ||||||
| 6,090,000 | Occidental Petroleum Corp., 5.550%, 3/15/2026 | 6,906,736 | ||||||
| 26,185,000 | Seven Generations Energy Ltd., 5.375%, 9/30/2025, 144A | 26,315,925 | ||||||
| 1,885,000 | Viper Energy Partners LP, 5.375%, 11/01/2027, 144A | 1,960,400 | ||||||
| 60,000 | Whiting Petroleum Corp., 6.250%, 4/01/2023 | 50,501 | ||||||
|
| |||||||
| 133,171,156 | ||||||||
|
| |||||||
See accompanying notes to financial statements.
| 38
Table of Contents
Portfolio of Investments – as of December 31, 2019
Loomis Sayles Investment Grade Bond Fund – (continued)
| Principal Amount (‡) | Description | Value (†) | ||||||
| Integrated Energy — 1.9% | ||||||||
| $ | 55,470,000 | Chevron Corp., 2.100%, 5/16/2021 | $ | 55,820,295 | ||||
| 52,303,000 | Shell International Finance BV, 1.875%, 5/10/2021 | 52,364,230 | ||||||
|
| |||||||
| 108,184,525 | ||||||||
|
| |||||||
| Life Insurance — 2.9% | ||||||||
| 5,653,000 | American International Group, Inc., 4.200%, 4/01/2028 | 6,222,858 | ||||||
| 1,475,000 | American International Group, Inc., 4.875%, 6/01/2022 | 1,574,744 | ||||||
| 8,255,000 | CNO Financial Group, Inc., 5.250%, 5/30/2029 | 9,214,644 | ||||||
| 15,000,000 | Global Atlantic Fin Co., 8.625%, 4/15/2021, 144A | 16,032,411 | ||||||
| 5,895,000 | Metropolitan Life Global Funding I,3-month LIBOR + 0.230%, 2.257%, 1/08/2021, 144A(d) | 5,896,889 | ||||||
| 30,030,000 | Metropolitan Life Global Funding I, 3.375%, 1/11/2022, 144A | 30,874,969 | ||||||
| 9,063,000 | Mutual of Omaha Insurance Co., 6.800%, 6/15/2036, 144A | 11,839,927 | ||||||
| 26,914,000 | National Life Insurance Co., 10.500%, 9/15/2039, 144A(a)(b) | 44,419,441 | ||||||
| 6,440,000 | NLV Financial Corp., 7.500%, 8/15/2033, 144A(a)(b) | 8,686,031 | ||||||
| 2,872,000 | Penn Mutual Life Insurance Co. (The), 6.650%, 6/15/2034, 144A | 3,695,130 | ||||||
| 14,489,000 | Penn Mutual Life Insurance Co. (The), 7.625%, 6/15/2040, 144A | 20,845,306 | ||||||
|
| |||||||
| 159,302,350 | ||||||||
|
| |||||||
| Metals & Mining — 3.5% | ||||||||
| 34,334,000 | Anglo American Capital PLC, 4.500%, 3/15/2028, 144A | 36,798,080 | ||||||
| 8,785,000 | Anglo American Capital PLC, 4.750%, 4/10/2027, 144A | 9,609,741 | ||||||
| 47,920,000 | ArcelorMittal S.A., 6.750%, 3/01/2041 | 57,080,018 | ||||||
| 19,365,000 | ArcelorMittal S.A., 7.000%, 10/15/2039 | 23,604,524 | ||||||
| 7,688,000 | Glencore Funding LLC, 3.875%, 10/27/2027, 144A | 7,963,615 | ||||||
| 39,092,000 | Glencore Funding LLC, 4.000%, 3/27/2027, 144A | 40,632,231 | ||||||
| 11,700,000 | Glencore Funding LLC, 4.125%, 3/12/2024, 144A | 12,254,535 | ||||||
| 7,375,000 | Minera Mexico S.A. de CV, 4.500%, 1/26/2050, 144A | 7,493,737 | ||||||
|
| |||||||
| 195,436,481 | ||||||||
|
| |||||||
| Midstream — 4.3% | ||||||||
| 22,495,000 | Cheniere Corpus Christi Holdings LLC, 3.700%, 11/15/2029, 144A | 22,972,276 | ||||||
| 650,000 | DCP Midstream Operating LP, 6.450%, 11/03/2036, 144A | 682,500 | ||||||
| 7,000,000 | Energy Transfer Operating LP, 4.950%, 6/15/2028 | 7,670,707 | ||||||
| 36,405,000 | Energy Transfer Operating LP, 5.250%, 4/15/2029 | 40,908,672 | ||||||
| 3,115,000 | EnLink Midstream Partners LP, 5.050%, 4/01/2045 | 2,460,850 | ||||||
| 35,850,000 | EnLink Midstream Partners LP, 5.450%, 6/01/2047 | 28,948,875 | ||||||
| 7,695,000 | EnLink Midstream Partners LP, 5.600%, 4/01/2044 | 6,232,950 | ||||||
| 26,650,000 | EQM Midstream Partners LP, Series 10Y, 5.500%, 7/15/2028 | 26,195,171 | ||||||
| 14,300,000 | IFM U.S. Colonial Pipeline 2 LLC, 6.450%, 5/01/2021, 144A | 14,951,661 | ||||||
| 14,660,000 | Kinder Morgan Energy Partners LP, 3.500%, 9/01/2023 | 15,193,563 | ||||||
| 3,105,000 | Kinder Morgan Energy Partners LP, 5.300%, 9/15/2020 | 3,175,567 | ||||||
| 7,461,000 | Kinder Morgan Energy Partners LP, 5.800%, 3/01/2021 | 7,767,080 | ||||||
| 14,040,000 | MPLX LP, 4.250%, 12/01/2027, 144A | 14,784,260 | ||||||
| 85,000 | NGPL PipeCo LLC, 7.768%, 12/15/2037, 144A | 109,751 | ||||||
| 225,000 | Plains All American Pipeline LP/PAA Finance Corp., 2.850%, 1/31/2023 | 227,246 | ||||||
| 40,610,000 | Sunoco Logistics Partners Operations LP, 4.000%, 10/01/2027 | 42,017,038 | ||||||
| 8,405,000 | Williams Cos., Inc., 3.350%, 8/15/2022 | 8,612,025 | ||||||
|
| |||||||
| 242,910,192 | ||||||||
|
| |||||||
See accompanying notes to financial statements.
39 |
Table of Contents
Portfolio of Investments – as of December 31, 2019
Loomis Sayles Investment Grade Bond Fund – (continued)
| Principal Amount (‡) | Description | Value (†) | ||||||
| Mortgage Related — 0.0% | ||||||||
| $ | 1,531 | FNMA, 6.000%, 7/01/2029 | $ | 1,714 | ||||
|
| |||||||
| Non-Agency Commercial Mortgage-Backed Securities — 0.8% | ||||||||
| 405,000 | Commercial Mortgage Trust, Series2012-LC4, Class C, 5.537%, 12/10/2044(c) | 420,541 | ||||||
| 3,205,000 | Credit Suisse Commercial Mortgage Securities Corp., Series 2019-SKLZ, Class D,1-month LIBOR + 3.600%, 5.340%, 1/15/2034, 144A(d) | 3,221,000 | ||||||
| 12,790,000 | Credit Suisse Mortgage Trust, Series2014-USA, Class D, 4.373%, 9/15/2037, 144A | 12,565,772 | ||||||
| 5,095,000 | DBUBS Mortgage Trust, Series 2017-BRBK, Class D, 3.530%, 10/10/2034, 144A(c) | 5,168,617 | ||||||
| 9,406,000 | GS Mortgage Securities Corp. Trust, Series 2013-PEMB, Class D, 3.550%, 3/05/2033, 144A(c) | 8,168,264 | ||||||
| 3,456,000 | Morgan Stanley Capital I Trust, Series2011-C2, Class E, 5.488%, 6/15/2044, 144A(c) | 3,359,799 | ||||||
| 6,706,000 | UBS-Barclays Commercial Mortgage Trust, Series2012-C2, Class E, 4.890%, 5/10/2063, 144A(a)(b)(c) | 5,600,395 | ||||||
| 3,557,000 | WFRBS Commercial Mortgage Trust, Series2011-C2, Class D, 5.652%, 2/15/2044, 144A(c) | 3,621,132 | ||||||
| 2,125,000 | WFRBS Commercial Mortgage Trust, Series2011-C3, Class D, 5.683%, 3/15/2044, 144A(c) | 1,624,085 | ||||||
| 1,746,000 | WFRBS Commercial Mortgage Trust, Series2012-C7, Class C, 4.813%, 6/15/2045(c) | 1,782,563 | ||||||
| 865,000 | WFRBS Commercial Mortgage Trust, Series2012-C7, Class E, 4.813%, 6/15/2045, 144A(c) | 741,872 | ||||||
|
| |||||||
| 46,274,040 | ||||||||
|
| |||||||
| Paper — 0.1% | ||||||||
| 2,910,000 | WestRock MWV LLC, 7.550%, 3/01/2047(a)(b) | 4,003,917 | ||||||
|
| |||||||
| Pharmaceuticals — 1.3% | ||||||||
| 27,550,000 | Gilead Science, Inc., 2.550%, 9/01/2020 | 27,667,397 | ||||||
| 10,312,000 | Mylan NV, 5.250%, 6/15/2046 | 11,598,532 | ||||||
| 2,459,000 | Mylan, Inc., 5.200%, 4/15/2048 | 2,753,192 | ||||||
| 2,764,000 | Mylan, Inc., 5.400%, 11/29/2043 | 3,063,221 | ||||||
| 17,010,000 | Teva Pharmaceutical Finance Netherlands III BV, 2.800%, 7/21/2023 | 15,748,539 | ||||||
| 8,000,000 | Teva Pharmaceutical Finance Netherlands III BV, 3.150%, 10/01/2026 | 6,660,000 | ||||||
| 5,500,000 | Teva Pharmaceutical Finance Netherlands III BV, 6.000%, 4/15/2024 | 5,572,820 | ||||||
|
| |||||||
| 73,063,701 | ||||||||
|
| |||||||
| Property & Casualty Insurance — 0.1% | ||||||||
| 2,740,000 | Fidelity National Financial, Inc., 5.500%, 9/01/2022 | 2,950,234 | ||||||
|
| |||||||
| REITs – Health Care — 0.1% | ||||||||
| 5,972,000 | Welltower, Inc., 6.500%, 3/15/2041 | 8,093,807 | ||||||
|
| |||||||
| REITs – Mortgage — 0.2% | ||||||||
| 8,565,000 | Ladder Capital Finance Holdings LLLP/Ladder Capital Finance Corp., 5.250%, 3/15/2022, 144A | 8,896,894 | ||||||
|
| |||||||
| REITs – Single Tenant — 0.2% | ||||||||
| 8,690,000 | Realty Income Corp., 5.750%, 1/15/2021 | 8,939,740 | ||||||
|
| |||||||
See accompanying notes to financial statements.
| 40
Table of Contents
Portfolio of Investments – as of December 31, 2019
Loomis Sayles Investment Grade Bond Fund – (continued)
| Principal Amount (‡) | Description | Value (†) | ||||||
| Retailers — 0.5% | ||||||||
| $ | 391,381 | CVS Pass Through Trust, 5.773%, 1/10/2033, 144A | $ | 440,687 | ||||
| 430,009 | CVS Pass Through Trust, 6.036%, 12/10/2028 | 478,846 | ||||||
| 11,637,350 | CVS Pass Through Trust, Series 2013, 4.704%, 1/10/2036, 144A | 12,463,253 | ||||||
| 1,220,180 | CVS Pass Through Trust, Series 2014, 4.163%, 8/11/2036, 144A | 1,265,376 | ||||||
| 1,255,000 | Group 1 Automotive, Inc., 5.000%, 6/01/2022 | 1,272,256 | ||||||
| 8,064,000 | Marks & Spencer PLC, 7.125%, 12/01/2037, 144A | 9,108,965 | ||||||
| 3,755,000 | PVH Corp., 7.750%, 11/15/2023 | 4,412,876 | ||||||
|
| |||||||
| 29,442,259 | ||||||||
|
| |||||||
| Supermarkets — 0.0% | ||||||||
| 325,000 | Koninklijke Ahold Delhaize NV, 5.700%, 10/01/2040 | 401,319 | ||||||
|
| |||||||
| Technology — 4.0% | ||||||||
| 27,985,000 | Avnet, Inc., 4.625%, 4/15/2026 | 29,615,642 | ||||||
| 26,185,000 | Broadcom Corp./Broadcom Cayman Finance Ltd., 3.000%, 1/15/2022 | 26,572,385 | ||||||
| 27,405,000 | Broadcom, Inc., 4.750%, 4/15/2029, 144A | 29,966,901 | ||||||
| 27,558,000 | Cisco Systems, Inc., 1.850%, 9/20/2021 | 27,576,871 | ||||||
| 22,066,000 | Cisco Systems, Inc., 2.200%, 2/28/2021 | 22,195,159 | ||||||
| 13,560,000 | Equifax, Inc., 3.600%, 8/15/2021 | 13,873,934 | ||||||
| 17,195,000 | Equinix, Inc., 3.200%, 11/18/2029 | 17,258,965 | ||||||
| 7,440,000 | Jabil, Inc., 4.700%, 9/15/2022 | 7,884,816 | ||||||
| 16,735,000 | KLA Corp., 5.650%, 11/01/2034 | 20,059,106 | ||||||
| 10,768,000 | Micron technology, Inc., 4.663%, 2/15/2030 | 11,864,116 | ||||||
| 1,857,000 | Micron Technology, Inc., 5.327%, 2/06/2029 | 2,130,327 | ||||||
| 5,000,000 | Oracle Corp., 2.800%, 7/08/2021 | 5,076,442 | ||||||
| 9,135,000 | Verisk Analytics, Inc., 4.125%, 3/15/2029 | 10,032,340 | ||||||
|
| |||||||
| 224,107,004 | ||||||||
|
| |||||||
| Treasuries — 19.6% | ||||||||
| 210,910,000 | U.S. Treasury Bond, 3.000%, 8/15/2048 | 238,138,810 | ||||||
| 111,500,000 | U.S. Treasury Bond, 3.000%, 2/15/2049 | 126,116,953 | ||||||
| 55,260,000 | U.S. Treasury Note, 1.500%, 8/31/2021 | 55,173,656 | ||||||
| 88,910,000 | U.S. Treasury Note, 1.625%, 8/15/2029 | 86,683,777 | ||||||
| 30,000,000 | U.S. Treasury Note, 1.500%, 4/15/2020 | 29,991,797 | ||||||
| 166,145,000 | U.S. Treasury Note, 1.500%, 10/31/2021 | 165,917,848 | ||||||
| 67,000,000 | U.S. Treasury Note, 1.500%, 11/30/2021 | 66,911,016 | ||||||
| 28,000,000 | U.S. Treasury Note, 2.375%, 4/30/2020 | 28,067,813 | ||||||
| 284,065,000 | U.S. Treasury Note, 2.375%, 5/15/2029 | 295,460,890 | ||||||
|
| |||||||
| 1,092,462,560 | ||||||||
|
| |||||||
| Wireless — 0.6% | ||||||||
| 22,660,000 | Crown Castle International Corp., 3.650%, 9/01/2027 | 23,981,445 | ||||||
| 6,615,000 | Crown Castle International Corp., 4.000%, 3/01/2027 | 7,143,059 | ||||||
|
| |||||||
| 31,124,504 | ||||||||
|
| |||||||
| Wirelines — 2.1% | ||||||||
| 61,415,000 | AT&T, Inc., 4.300%, 2/15/2030 | 68,243,795 | ||||||
| 435,000 | AT&T, Inc., 4.350%, 6/15/2045 | 469,631 | ||||||
| 3,105,000 | AT&T, Inc., 4.500%, 3/09/2048 | 3,430,398 | ||||||
| 7,980,000 | AT&T, Inc., 4.850%, 3/01/2039 | 9,204,291 | ||||||
| 27,220,000 | Telefonica Emisiones S.A., 5.520%, 3/01/2049 | 34,149,463 | ||||||
|
| |||||||
| 115,497,578 | ||||||||
|
| |||||||
| TotalNon-Convertible Bonds (Identified Cost $4,909,449,415) | 5,232,967,808 | |||||||
|
| |||||||
See accompanying notes to financial statements.
41 |
Table of Contents
Portfolio of Investments – as of December 31, 2019
Loomis Sayles Investment Grade Bond Fund – (continued)
| Principal Amount (‡) | Description | Value (†) | ||||||
| Convertible Bonds — 0.7% | ||||||||
| Cable Satellite — 0.2% | ||||||||
| $ | 9,050,000 | DISH Network Corp., 2.375%, 3/15/2024 | $ | 8,263,555 | ||||
| 6,190,000 | DISH Network Corp., 3.375%, 8/15/2026 | 5,954,161 | ||||||
|
| |||||||
| 14,217,716 | ||||||||
|
| |||||||
| Diversified Manufacturing — 0.1% | ||||||||
| 5,165,000 | Greenbrier Cos., Inc. (The), 2.875%, 2/01/2024 | 4,985,885 | ||||||
|
| |||||||
| Independent Energy — 0.1% | ||||||||
| 6,390,000 | Chesapeake Energy Corp., 5.500%, 9/15/2026 | 3,044,094 | ||||||
|
| |||||||
| Pharmaceuticals — 0.3% | ||||||||
| 14,075,000 | BioMarin Pharmaceutical, Inc., 0.599%, 8/01/2024 | 14,870,220 | ||||||
|
| |||||||
| Total Convertible Bonds (Identified Cost $40,552,831) | 37,117,915 | |||||||
|
| |||||||
| Municipals — 0.1% | ||||||||
| Michigan — 0.0% | ||||||||
| 1,575,000 | Michigan Tobacco Settlement Finance Authority Taxable Turbo, Series A, 7.309%, 6/01/2034 | 1,630,141 | ||||||
|
| |||||||
| Virginia — 0.1% | ||||||||
| 7,595,000 | Tobacco Settlement Financing Corp., SeriesA-1, 6.706%, 6/01/2046 | 7,315,124 | ||||||
|
| |||||||
| Total Municipals (Identified Cost $8,905,434) | 8,945,265 | |||||||
|
| |||||||
| Total Bonds and Notes (Identified Cost $4,958,907,680) | 5,279,030,988 | |||||||
|
| |||||||
| Collateralized Loan Obligations — 2.0% | ||||||||
| 2,905,000 | Atrium XII, Series 12A,Class AR, 3-month LIBOR + 0.830%, 2.783%, 4/22/2027, 144A(d) | 2,901,318 | ||||||
| 9,918,973 | CVP Cascade CLO Ltd., Series2014-2A,Class A1R, 3-month LIBOR + 1.200%, 3.203%, 7/18/2026, 144A(d) | 9,918,489 | ||||||
| 8,702,094 | Elevation CLO Ltd., Series2015-4A,Class AR, 3-month LIBOR + 0.990%, 2.993%, 4/18/2027, 144A(d) | 8,701,466 | ||||||
| 1,785,164 | Flatiron CLO Ltd., Series2015-1A,Class AR, 3-month LIBOR + 0.890%, 2.891%, 4/15/2027, 144A(d) | 1,783,831 | ||||||
| 5,490,000 | Halcyon Loan Advisors Funding, Series2014-3A,Class B1R, 3-month LIBOR + 1.700%, 3.653%, 10/22/2025, 144A(d) | 5,502,457 | ||||||
| 6,696,544 | Halcyon Loan Advisors Funding Ltd., Series2014-2A, Class A1BR,3-month LIBOR + 1.180%, 3.116%, 4/28/2025, 144A(d) | 6,696,410 | ||||||
| 11,630,006 | Jamestown CLO VII Ltd., Series2015-7A,Class A1R, 3-month LIBOR + 0.830%, 2.770%, 7/25/2027, 144A(d) | 11,626,822 | ||||||
| 966,464 | Limerock CLO III LLC, Series2014-3A,Class A1R, 3-month LIBOR + 1.200%, 3.166%, 10/20/2026, 144A(d) | 965,735 | ||||||
| 13,685,000 | Mountain View CLO X Ltd., Series2015-10A,Class AR, 3-month LIBOR + 0.820%, 2.821%, 10/13/2027, 144A(d) | 13,636,346 | ||||||
| 11,250,000 | OCP CLO Ltd, Series2015-10A,Class A1R, 3-month LIBOR + 0.820%, 2.756%, 10/26/2027, 144A(d) | 11,246,469 | ||||||
See accompanying notes to financial statements.
| 42
Table of Contents
Portfolio of Investments – as of December 31, 2019
Loomis Sayles Investment Grade Bond Fund – (continued)
| Principal Amount (‡) | Description | Value (†) | ||||||
| Collateralized Loan Obligations — (continued) | ||||||||
| $ | 3,115,383 | OFSI Fund VII Ltd., Series2014-7A,Class AR, 3-month LIBOR + 0.900%, 2.903%, 10/18/2026, 144A(d) | $ | 3,115,245 | ||||
| 13,210,000 | Parallel Ltd., Series2015-1A,Class AR, 3-month LIBOR + 0.850%, 2.816%, 7/20/2027, 144A(d) | 13,186,096 | ||||||
| 6,012,067 | Staniford Street CLO Ltd., Series2014-1A,Class AR, 3-month LIBOR + 1.180%, 3.074%, 6/15/2025, 144A(d) | 6,010,854 | ||||||
| 4,471,640 | Venture VII CDO Ltd., Series2006-7A,Class B, 3-month LIBOR + 0.380%, 2.346%, 1/20/2022, 144A(d) | 4,470,318 | ||||||
| 5,960,386 | Venture XII CLO Ltd., Series2012-12A,Class ARR, 3-month LIBOR + 0.800%, 2.714%, 2/28/2026, 144A(d) | 5,950,385 | ||||||
| 8,219,760 | West CLO Ltd., Series2014-1A,Class A1R, 3-month LIBOR + 0.920%, 2.923%, 7/18/2026, 144A(d) | 8,212,081 | ||||||
|
| |||||||
| Total Collateralized Loan Obligations (Identified Cost $114,044,833) | 113,924,322 | |||||||
|
| |||||||
| Shares | ||||||||
| Preferred Stocks — 0.3% | ||||||||
| Food & Beverage — 0.3% | ||||||||
| 138,889 | Bunge Ltd., 4.875% | 14,301,982 | ||||||
|
| |||||||
| Independent Energy — 0.0% | ||||||||
| 40,860 | Chesapeake Energy Corp., 5.000%(a)(b)(e) | 721,179 | ||||||
|
| |||||||
| Total Preferred Stocks (Identified Cost $17,780,899) | 15,023,161 | |||||||
|
| |||||||
| Principal Amount (‡) | ||||||||
| Short-Term Investments — 2.3% | ||||||||
| 2,690,358,211 | Central Bank of Iceland, 0.000%, (ISK)(a)(b)(d)(f) | 22,221,510 | ||||||
| 104,719,265 | Tri-Party Repurchase Agreement with Fixed Income Clearing Corporation, dated 12/31/2019 at 0.900% to be repurchased at $104,724,501 on 1/02/2020 collateralized by $105,170,000 U.S. Treasury Note, 2.000% due 5/31/2024 valued at $106,815,385 including accrued interest (Note 2 of Notes to Financial Statements) | 104,719,265 | ||||||
|
| |||||||
| Total Short-Term Investments (Identified Cost $126,617,021) | 126,940,775 | |||||||
|
| |||||||
| Total Investments — 99.3% (Identified Cost $5,217,350,433) | 5,534,919,246 | |||||||
| Other assets less liabilities — 0.7% | 39,076,851 | |||||||
|
| |||||||
| Net Assets — 100.0% | $ | 5,573,996,097 | ||||||
|
| |||||||
| (‡) | Principal Amount stated in U.S. dollars unless otherwise noted. | |||||||
| (†) | See Note 2 of Notes to Financial Statements. |
| ||||||
| (a) | Illiquid security. (Unaudited) |
| ||||||
See accompanying notes to financial statements.
43 |
Table of Contents
Portfolio of Investments – as of December 31, 2019
Loomis Sayles Investment Grade Bond Fund – (continued)
| (b) | Securities classified as fair valued pursuant to the Fund’s pricing policies and procedures. At December 31, 2019, the value of these securities amounted to $163,123,037 or 2.9% of net assets. See Note 2 of Notes to Financial Statements. |
| ||||||
| (c) | Variable rate security. The interest rate adjusts periodically based on; (i) changes in current interest rates and/or prepayments on underlying pools of assets, if applicable, (ii) reference to a base lending rate plus or minus a margin, and/or (iii) reference to a base lending rate adjusted by a multiplier and/or subject to certain floors or caps. Rate as of December 31, 2019 is disclosed. |
| ||||||
| (d) | Variable rate security. Rate as of December 31, 2019 is disclosed. |
| ||||||
| (e) | Level 3 security. Value has been determined using significant unobservable inputs. See Note 3 of Notes to Financial Statements. |
| ||||||
| (f) | Security callable by issuer at any time. No specified maturity date. |
| ||||||
| 144A | All or a portion of these securities are exempt from registration under Rule 144A of the Securities Act of 1933. These securities may be resold in transactions exempt from registration, normally to qualified institutional buyers. At December 31, 2019, the value of Rule 144A holdings amounted to $1,736,780,922 or 31.2% of net assets. |
| ||||||
| ABS | Asset-Backed Securities |
| ||||||
| ARS | Auction Rate Security |
| ||||||
| FNMA | Federal National Mortgage Association |
| ||||||
| GMTN | Global Medium Term Note |
| ||||||
| LIBOR | London Interbank Offered Rate |
| ||||||
| MTN | Medium Term Note |
| ||||||
| REITs | Real Estate Investment Trusts |
| ||||||
| SLM | Sallie Mae |
| ||||||
| ISK | Icelandic Krona |
| ||||||
Industry Summary at December 31, 2019
Treasuries | 19.6 | % | ||
Banking | 7.9 | |||
ABS Car Loan | 7.6 | |||
ABS Home Equity | 4.7 | |||
Midstream | 4.3 | |||
Technology | 4.0 | |||
ABS Other | 3.5 | |||
Metals & Mining | 3.5 | |||
Life Insurance | 2.9 | |||
Independent Energy | 2.5 | |||
Food & Beverage | 2.4 | |||
Healthcare | 2.3 | |||
Electric | 2.2 | |||
Automotive | 2.1 | |||
Wirelines | 2.1 | |||
ABS Whole Business | 2.0 | |||
Other Investments, less than 2% each | 21.4 | |||
Short-Term Investments | 2.3 | |||
Collateralized Loan Obligations | 2.0 | |||
|
| |||
Total Investments | 99.3 | |||
Other assets less liabilities | 0.7 | |||
|
| |||
Net Assets | 100.0 | % | ||
|
|
See accompanying notes to financial statements.
| 44
Table of Contents
Portfolio of Investments – as of December 31, 2019
Loomis Sayles Multi-Asset Income Fund
| Shares | Description | Value (†) | ||||||
| Common Stocks — 44.0% of Net Assets | ||||||||
| Aerospace & Defense — 0.9% | ||||||||
| 693 | Boeing Co. (The) | $ | 225,752 | |||||
| 463 | General Dynamics Corp. | 81,650 | ||||||
| 443 | HEICO Corp. | 50,568 | ||||||
| 263 | Huntington Ingalls Industries, Inc. | 65,981 | ||||||
| 456 | L3Harris Technologies, Inc. | 90,229 | ||||||
| 677 | Spirit AeroSystems Holdings, Inc., Class A | 49,340 | ||||||
| 1,195 | United Technologies Corp. | 178,963 | ||||||
|
| |||||||
| 742,483 | ||||||||
|
| |||||||
| Air Freight & Logistics — 0.2% | ||||||||
| 441 | FedEx Corp. | 66,684 | ||||||
| 984 | United Parcel Service, Inc., Class B | 115,187 | ||||||
|
| |||||||
| 181,871 | ||||||||
|
| |||||||
| Airlines — 0.1% | ||||||||
| 100 | Delta Air Lines, Inc. | 5,848 | ||||||
| 2,900 | Japan Airlines Co. Ltd. | 90,294 | ||||||
|
| |||||||
| 96,142 | ||||||||
|
| |||||||
| Auto Components — 0.3% | ||||||||
| 5,224 | Faurecia SE | 283,599 | ||||||
|
| |||||||
| Automobiles — 0.1% | ||||||||
| 6,257 | Ford Motor Co. | 58,190 | ||||||
| 1,788 | General Motors Co. | 65,441 | ||||||
|
| |||||||
| 123,631 | ||||||||
|
| |||||||
| Banks — 6.5% | ||||||||
| 10,749 | Bank of America Corp. | 378,580 | ||||||
| 122,722 | Barclays PLC | 292,627 | ||||||
| 10,973 | BNP Paribas S.A. | 652,214 | ||||||
| 89,017 | CaixaBank S.A. | 280,320 | ||||||
| 200 | Canadian Imperial Bank of Commerce | 16,643 | ||||||
| 2,621 | Citigroup, Inc. | 209,392 | ||||||
| 1,590 | Citizens Financial Group, Inc. | 64,570 | ||||||
| 21,427 | Credit Agricole S.A. | 311,791 | ||||||
| 45,081 | DNB ASA | 843,596 | ||||||
| 2,059 | Fifth Third Bancorp | 63,294 | ||||||
| 3,983 | Huntington Bancshares, Inc. | 60,064 | ||||||
| 4,132 | JPMorgan Chase & Co. | 576,001 | ||||||
| 3,203 | KeyCorp | 64,829 | ||||||
| 330,303 | Lloyds Banking Group PLC | 273,630 | ||||||
| 569 | PNC Financial Services Group, Inc. (The) | 90,829 | ||||||
| 3,588 | Regions Financial Corp. | 61,570 | ||||||
| 28,051 | Societe Generale S.A. | 978,923 | ||||||
| 1,099 | Truist Financial Corp. | 61,896 | ||||||
| 934 | U.S. Bancorp | 55,377 | ||||||
| 4,927 | Wells Fargo & Co. | 265,072 | ||||||
|
| |||||||
| 5,601,218 | ||||||||
|
| |||||||
See accompanying notes to financial statements.
45 |
Table of Contents
Portfolio of Investments – as of December 31, 2019
Loomis Sayles Multi-Asset Income Fund – (continued)
| Shares | Description | Value (†) | ||||||
| Beverages — 0.8% | ||||||||
| 1,800 | Asahi Group Holdings Ltd. | $ | 82,117 | |||||
| 5,510 | Coca-Cola Co. (The) | 304,978 | ||||||
| 282 | Constellation Brands, Inc., Class A | 53,510 | ||||||
| 321 | Molson Coors Brewing Co., Class B | 17,302 | ||||||
| 1,896 | PepsiCo, Inc. | 259,126 | ||||||
|
| |||||||
| 717,033 | ||||||||
|
| |||||||
| Biotechnology — 0.8% | ||||||||
| 2,788 | AbbVie, Inc. | 246,849 | ||||||
| 1,083 | Amgen, Inc. | 261,079 | ||||||
| 3,105 | Gilead Sciences, Inc. | 201,763 | ||||||
|
| |||||||
| 709,691 | ||||||||
|
| |||||||
| Building Products — 0.1% | ||||||||
| 1,376 | Johnson Controls International PLC | 56,017 | ||||||
|
| |||||||
| Capital Markets — 1.3% | ||||||||
| 1,261 | Bank of New York Mellon Corp. (The) | 63,466 | ||||||
| 145 | BlackRock, Inc. | 72,892 | ||||||
| 1,754 | Charles Schwab Corp. (The) | 83,420 | ||||||
| 271 | CME Group, Inc. | 54,395 | ||||||
| 1,334 | Cohen & Steers, Inc. | 83,722 | ||||||
| 1,211 | Federated Investors, Inc., Class B | 39,466 | ||||||
| 505 | Goldman Sachs Group, Inc. (The) | 116,115 | ||||||
| 591 | Intercontinental Exchange, Inc. | 54,697 | ||||||
| 267 | Moody’s Corp. | 63,388 | ||||||
| 1,934 | Morgan Stanley | 98,866 | ||||||
| 246 | MSCI, Inc. | 63,512 | ||||||
| 229 | Northern Trust Corp. | 24,329 | ||||||
| 356 | S&P Global, Inc. | 97,206 | ||||||
| 13,500 | Singapore Exchange Ltd. | 88,913 | ||||||
| 453 | State Street Corp. | 35,832 | ||||||
| 496 | T. Rowe Price Group, Inc. | 60,433 | ||||||
|
| |||||||
| 1,100,652 | ||||||||
|
| |||||||
| Chemicals — 0.8% | ||||||||
| 262 | Air Products & Chemicals, Inc. | 61,567 | ||||||
| 467 | Celanese Corp. | 57,497 | ||||||
| 1,208 | Dow, Inc. | 66,114 | ||||||
| 1,086 | DuPont de Nemours, Inc. | 69,721 | ||||||
| 347 | Ecolab, Inc. | 66,967 | ||||||
| 674 | Linde PLC | 143,495 | ||||||
| 660 | LyondellBasell Industries NV, Class A | 62,357 | ||||||
| 497 | PPG Industries, Inc. | 66,345 | ||||||
| 119 | Sherwin-Williams Co. (The) | 69,441 | ||||||
|
| |||||||
| 663,504 | ||||||||
|
| |||||||
| Commercial Services & Supplies — 0.4% | ||||||||
| 232 | Cintas Corp. | 62,427 | ||||||
| 3,100 | Dai Nippon Printing Co. Ltd. | 83,847 | ||||||
See accompanying notes to financial statements.
| 46
Table of Contents
Portfolio of Investments – as of December 31, 2019
Loomis Sayles Multi-Asset Income Fund – (continued)
| Shares | Description | Value (†) | ||||||
| Commercial Services & Supplies — continued | ||||||||
| 1,013 | Republic Services, Inc. | $ | 90,795 | |||||
| 1,324 | Waste Management, Inc. | 150,883 | ||||||
|
| |||||||
| 387,952 | ||||||||
|
| |||||||
| Communications Equipment — 0.4% | ||||||||
| 5,934 | Cisco Systems, Inc. | 284,595 | ||||||
| 346 | Motorola Solutions, Inc. | 55,754 | ||||||
|
| |||||||
| 340,349 | ||||||||
|
| |||||||
| Construction & Engineering — 0.5% | ||||||||
| 2,264 | ACS Actividades de Construccion y Servicios S.A. | 90,818 | ||||||
| 2,348 | Eiffage S.A. | 269,379 | ||||||
| 615 | Jacobs Engineering Group, Inc. | 55,245 | ||||||
|
| |||||||
| 415,442 | ||||||||
|
| |||||||
| Consumer Finance — 0.3% | ||||||||
| 613 | American Express Co. | 76,313 | ||||||
| 697 | Capital One Financial Corp. | 71,728 | ||||||
| 693 | Discover Financial Services | 58,780 | ||||||
| 634 | Synchrony Financial | 22,830 | ||||||
|
| |||||||
| 229,651 | ||||||||
|
| |||||||
| Containers & Packaging — 0.1% | ||||||||
| 1,021 | Ball Corp. | 66,028 | ||||||
| 1,376 | International Paper Co. | 63,365 | ||||||
|
| |||||||
| 129,393 | ||||||||
|
| |||||||
| Diversified Telecommunication Services — 1.1% | ||||||||
| 12,367 | AT&T, Inc. | 483,302 | ||||||
| 51,000 | HKT Trust & HKT Ltd. | 71,874 | ||||||
| 6,265 | Verizon Communications, Inc. | 384,671 | ||||||
|
| |||||||
| 939,847 | ||||||||
|
| |||||||
| Electric Utilities — 1.0% | ||||||||
| 8,074 | Contact Energy Ltd. | 38,784 | ||||||
| 863 | Duke Energy Corp. | 78,714 | ||||||
| 795 | Edison International | 59,951 | ||||||
| 1,375 | Evergy, Inc. | 89,499 | ||||||
| 1,376 | Exelon Corp. | 62,732 | ||||||
| 1,203 | FirstEnergy Corp. | 58,466 | ||||||
| 2,128 | Fortum OYJ | 52,526 | ||||||
| 1,564 | Pinnacle West Capital Corp. | 140,651 | ||||||
| 4,430 | PPL Corp. | 158,948 | ||||||
| 1,466 | Southern Co. (The) | 93,384 | ||||||
|
| |||||||
| 833,655 | ||||||||
|
| |||||||
| Electrical Equipment — 0.3% | ||||||||
| 636 | AMETEK, Inc. | 63,435 | ||||||
| 675 | Eaton Corp. PLC | 63,936 | ||||||
| 891 | Emerson Electric Co. | 67,948 | ||||||
| 356 | Rockwell Automation, Inc. | 72,150 | ||||||
|
| |||||||
| 267,469 | ||||||||
|
| |||||||
See accompanying notes to financial statements.
47 |
Table of Contents
Portfolio of Investments – as of December 31, 2019
Loomis Sayles Multi-Asset Income Fund – (continued)
| Shares | Description | Value (†) | ||||||
| Electronic Equipment, Instruments & Components — 0.2% | ||||||||
| 609 | Amphenol Corp., Class A | $ | 65,912 | |||||
| 2,059 | Corning, Inc. | 59,938 | ||||||
| 617 | TE Connectivity Ltd. | 59,133 | ||||||
|
| |||||||
| 184,983 | ||||||||
|
| |||||||
| Energy Equipment & Services — 0.1% | ||||||||
| 1,910 | Schlumberger Ltd. | 76,782 | ||||||
|
| |||||||
| Entertainment — 0.5% | ||||||||
| 1,205 | Activision Blizzard, Inc. | 71,601 | ||||||
| 2,519 | Walt Disney Co. (The) | 364,323 | ||||||
|
| |||||||
| 435,924 | ||||||||
|
| |||||||
| Food & Staples Retailing — 0.8% | ||||||||
| 415 | Costco Wholesale Corp. | 121,977 | ||||||
| 2,225 | Kroger Co. (The) | 64,503 | ||||||
| 1,900 | Seven & I Holdings Co. Ltd. | 69,645 | ||||||
| 1,448 | Sysco Corp. | 123,862 | ||||||
| 1,140 | Walgreens Boots Alliance, Inc. | 67,214 | ||||||
| 1,943 | Walmart, Inc. | 230,906 | ||||||
|
| |||||||
| 678,107 | ||||||||
|
| |||||||
| Food Products — 0.7% | ||||||||
| 1,370 | Archer-Daniels-Midland Co. | 63,499 | ||||||
| 2,913 | General Mills, Inc. | 156,020 | ||||||
| 566 | Hershey Co. (The) | 83,191 | ||||||
| 2,023 | Kraft Heinz Co. (The) | 64,999 | ||||||
| 1,815 | Mondelez International, Inc., Class A | 99,970 | ||||||
| 9,385 | Tate & Lyle PLC | 94,562 | ||||||
| 647 | Tyson Foods, Inc., Class A | 58,903 | ||||||
|
| |||||||
| 621,144 | ||||||||
|
| |||||||
| Health Care Equipment & Supplies — 1.2% | ||||||||
| 2,255 | Abbott Laboratories | 195,869 | ||||||
| 776 | Baxter International, Inc. | 64,889 | ||||||
| 403 | Becton Dickinson & Co. | 109,604 | ||||||
| 895 | Danaher Corp. | 137,365 | ||||||
| 2,666 | Medtronic PLC | 302,458 | ||||||
| 432 | ResMed, Inc. | 66,947 | ||||||
| 494 | Stryker Corp. | 103,710 | ||||||
| 414 | Zimmer Biomet Holdings, Inc. | 61,968 | ||||||
|
| |||||||
| 1,042,810 | ||||||||
|
| |||||||
| Health Care Providers & Services — 1.1% | ||||||||
| 1,017 | AmerisourceBergen Corp. | 86,465 | ||||||
| 355 | Anthem, Inc. | 107,221 | ||||||
| 569 | Cigna Corp. | 116,355 | ||||||
| 1,903 | CVS Health Corp. | 141,374 | ||||||
| 455 | HCA Healthcare, Inc. | 67,253 | ||||||
| 215 | Humana, Inc. | 78,802 | ||||||
| 397 | McKesson Corp. | 54,913 | ||||||
See accompanying notes to financial statements.
| 48
Table of Contents
Portfolio of Investments – as of December 31, 2019
Loomis Sayles Multi-Asset Income Fund – (continued)
| Shares | Description | Value (†) | ||||||
| Health Care Providers & Services — continued | ||||||||
| 1,185 | UnitedHealth Group, Inc. | $ | 348,366 | |||||
|
| |||||||
| 1,000,749 | ||||||||
|
| |||||||
| Health Care Technology — 0.1% | ||||||||
| 850 | Cerner Corp. | 62,382 | ||||||
|
| |||||||
| Hotels, Restaurants & Leisure — 0.8% | ||||||||
| 605 | Hilton Worldwide Holdings, Inc. | 67,100 | ||||||
| 565 | Las Vegas Sands Corp. | 39,008 | ||||||
| 518 | Marriott International, Inc., Class A | 78,441 | ||||||
| 956 | McDonald’s Corp. | 188,915 | ||||||
| 2,842 | Starbucks Corp. | 249,869 | ||||||
| 655 | Yum! Brands, Inc. | 65,978 | ||||||
|
| |||||||
| 689,311 | ||||||||
|
| |||||||
| Household Durables — 0.1% | ||||||||
| 1,165 | DR Horton, Inc. | 61,454 | ||||||
| 500 | Sekisui House Ltd. | 10,677 | ||||||
| 388 | Whirlpool Corp. | 57,242 | ||||||
|
| |||||||
| 129,373 | ||||||||
|
| |||||||
| Household Products — 0.8% | ||||||||
| 472 | Clorox Co. (The) | 72,471 | ||||||
| 1,075 | Colgate-Palmolive Co. | 74,003 | ||||||
| 718 | Kimberly-Clark Corp. | 98,761 | ||||||
| 3,749 | Procter & Gamble Co. (The) | 468,250 | ||||||
|
| |||||||
| 713,485 | ||||||||
|
| |||||||
| Independent Power & Renewable Electricity Producers — 0.2% | ||||||||
| 3,615 | AES Corp. (The) | 71,939 | ||||||
| 4,400 | Northland Power, Inc. | 92,164 | ||||||
|
| |||||||
| 164,103 | ||||||||
|
| |||||||
| Industrial Conglomerates — 0.5% | ||||||||
| 800 | 3M Co. | 141,136 | ||||||
| 5,585 | General Electric Co. | 62,328 | ||||||
| 855 | Honeywell International, Inc. | 151,335 | ||||||
| 160 | Roper Technologies, Inc. | 56,677 | ||||||
|
| |||||||
| 411,476 | ||||||||
|
| |||||||
| Insurance — 2.3% | ||||||||
| 1,323 | Aflac, Inc. | 69,987 | ||||||
| 1,447 | American International Group, Inc. | 74,274 | ||||||
| 352 | Aon PLC | 73,318 | ||||||
| 98,694 | Aviva PLC | 547,806 | ||||||
| 20,772 | AXA S.A. | 586,939 | ||||||
| 584 | Chubb Ltd. | 90,905 | ||||||
| 1,853 | Fidelity National Financial, Inc. | 84,034 | ||||||
| 1,129 | Loews Corp. | 59,261 | ||||||
| 677 | Marsh & McLennan Cos., Inc. | 75,425 | ||||||
| 1,265 | MetLife, Inc. | 64,477 | ||||||
See accompanying notes to financial statements.
49 |
Table of Contents
Portfolio of Investments – as of December 31, 2019
Loomis Sayles Multi-Asset Income Fund – (continued)
| Shares | Description | Value (†) | ||||||
| Insurance — continued | ||||||||
| 1,016 | Principal Financial Group, Inc. | $ | 55,880 | |||||
| 864 | Progressive Corp. (The) | 62,545 | ||||||
| 714 | Prudential Financial, Inc. | 66,930 | ||||||
| 494 | Travelers Cos., Inc. (The) | 67,653 | ||||||
| 293 | Willis Towers Watson PLC | 59,168 | ||||||
|
| |||||||
| 2,038,602 | ||||||||
|
| |||||||
| Internet & Direct Marketing Retail — 0.1% | ||||||||
| 1,439 | eBay, Inc. | 51,962 | ||||||
|
| |||||||
| IT Services — 2.3% | ||||||||
| 841 | Accenture PLC, Class A | 177,090 | ||||||
| 1,273 | Amdocs Ltd. | 91,898 | ||||||
| 1,114 | Automatic Data Processing, Inc. | 189,937 | ||||||
| 909 | Cognizant Technology Solutions Corp., Class A | 56,376 | ||||||
| 937 | Fidelity National Information Services, Inc. | 130,327 | ||||||
| 347 | Global Payments, Inc. | 63,348 | ||||||
| 1,096 | International Business Machines Corp. | 146,908 | ||||||
| 980 | Leidos Holdings, Inc. | 95,932 | ||||||
| 1,161 | MasterCard, Inc., Class A | 346,663 | ||||||
| 1,600 | Nihon Unisys Ltd. | 50,190 | ||||||
| 1,779 | Paychex, Inc. | 151,322 | ||||||
| 2,433 | Visa, Inc., Class A | 457,161 | ||||||
|
| |||||||
| 1,957,152 | ||||||||
|
| |||||||
| Leisure Products — 0.1% | ||||||||
| 2,500 | Sankyo Co. Ltd. | 83,032 | ||||||
|
| |||||||
| Life Sciences Tools & Services — 0.3% | ||||||||
| 751 | Agilent Technologies, Inc. | 64,068 | ||||||
| 565 | Thermo Fisher Scientific, Inc. | 183,551 | ||||||
|
| |||||||
| 247,619 | ||||||||
|
| |||||||
| Machinery — 0.9% | ||||||||
| 776 | Caterpillar, Inc. | 114,599 | ||||||
| 352 | Cummins, Inc. | 62,994 | ||||||
| 461 | Deere & Co. | 79,873 | ||||||
| 836 | Fortive Corp. | 63,862 | ||||||
| 508 | Illinois Tool Works, Inc. | 91,252 | ||||||
| 465 | Ingersoll-Rand PLC | 61,808 | ||||||
| 1,900 | Mitsubishi Heavy Industries Ltd. | 73,676 | ||||||
| 1,397 | PACCAR, Inc. | 110,503 | ||||||
| 327 | Parker-Hannifin Corp. | 67,303 | ||||||
| 147 | Stanley Black & Decker, Inc. | 24,364 | ||||||
|
| |||||||
| 750,234 | ||||||||
|
| |||||||
| Marine — 0.1% | ||||||||
| 78,000 | SITC International Holdings Co. Ltd. | 95,189 | ||||||
|
| |||||||
| Media — 0.7% | ||||||||
| 1,000 | Cogeco Communications, Inc. | 87,174 | ||||||
| 8,266 | Comcast Corp., Class A | 371,722 | ||||||
See accompanying notes to financial statements.
| 50
Table of Contents
Portfolio of Investments – as of December 31, 2019
Loomis Sayles Multi-Asset Income Fund – (continued)
| Shares | Description | Value (†) | ||||||
| Media — continued | ||||||||
| 1,119 | Omnicom Group, Inc. | $ | 90,662 | |||||
| 657 | ViacomCBS, Inc., Class B | 27,574 | ||||||
|
| |||||||
| 577,132 | ||||||||
|
| |||||||
| Metals & Mining — 0.1% | ||||||||
| 1,105 | Nucor Corp. | 62,189 | ||||||
|
| |||||||
| Multi-Utilities — 0.7% | ||||||||
| 6,429 | AGL Energy Ltd. | 92,536 | ||||||
| 1,800 | Canadian Utilities Ltd., Class A | 54,296 | ||||||
| 2,487 | CenterPoint Energy, Inc. | 67,821 | ||||||
| 800 | Consolidated Edison, Inc. | 72,376 | ||||||
| 943 | Dominion Energy, Inc. | 78,099 | ||||||
| 554 | DTE Energy Co. | 71,948 | ||||||
| 2,496 | NiSource, Inc. | 69,489 | ||||||
| 940 | Public Service Enterprise Group, Inc. | 55,507 | ||||||
| 402 | Sempra Energy | 60,895 | ||||||
|
| |||||||
| 622,967 | ||||||||
|
| |||||||
| Multiline Retail — 0.3% | ||||||||
| 424 | Dollar General Corp. | 66,136 | ||||||
| 1,363 | Target Corp. | 174,750 | ||||||
|
| |||||||
| 240,886 | ||||||||
|
| |||||||
| Oil, Gas & Consumable Fuels — 1.7% | ||||||||
| 2,522 | Chevron Corp. | 303,926 | ||||||
| 1,482 | ConocoPhillips | 96,374 | ||||||
| 1,370 | CVR Energy, Inc. | 55,389 | ||||||
| 2,467 | Devon Energy Corp. | 64,068 | ||||||
| 855 | EOG Resources, Inc. | 71,615 | ||||||
| 5,587 | Exxon Mobil Corp. | 389,861 | ||||||
| 2,807 | Kinder Morgan, Inc. | 59,424 | ||||||
| 1,093 | Marathon Petroleum Corp. | 65,853 | ||||||
| 1,036 | Occidental Petroleum Corp. | 42,694 | ||||||
| 957 | ONEOK, Inc. | 72,416 | ||||||
| 556 | Phillips 66 | 61,944 | ||||||
| 523 | Pioneer Natural Resources Co. | 79,166 | ||||||
| 681 | Valero Energy Corp. | 63,776 | ||||||
| 2,948 | Williams Cos., Inc. (The) | 69,927 | ||||||
|
| |||||||
| 1,496,433 | ||||||||
|
| |||||||
| Personal Products — 0.2% | ||||||||
| 327 | Estee Lauder Cos., Inc. (The), Class A | 67,539 | ||||||
| 1,402 | Unilever PLC | 80,254 | ||||||
|
| |||||||
| 147,793 | ||||||||
|
| |||||||
| Pharmaceuticals — 2.3% | ||||||||
| 3,863 | Bristol-Myers Squibb Co. | 247,966 | ||||||
| 1,652 | Eli Lilly & Co. | 217,122 | ||||||
| 3,960 | Johnson & Johnson | 577,645 | ||||||
| 4,522 | Merck & Co., Inc. | 411,276 | ||||||
See accompanying notes to financial statements.
51 |
Table of Contents
Portfolio of Investments – as of December 31, 2019
Loomis Sayles Multi-Asset Income Fund – (continued)
| Shares | Description | Value (†) | ||||||
| Pharmaceuticals — continued | ||||||||
| 8,034 | Pfizer, Inc. | $ | 314,772 | |||||
| 290 | Roche Holding AG | 94,251 | ||||||
| 814 | Zoetis, Inc. | 107,733 | ||||||
|
| |||||||
| 1,970,765 | ||||||||
|
| |||||||
| Professional Services — 0.2% | ||||||||
| 408 | Equifax, Inc. | 57,169 | ||||||
| 710 | TransUnion | 60,783 | ||||||
| 460 | Verisk Analytics, Inc. | 68,697 | ||||||
|
| |||||||
| 186,649 | ||||||||
|
| |||||||
| Road & Rail — 0.5% | ||||||||
| 1,132 | CSX Corp. | 81,912 | ||||||
| 438 | Kansas City Southern | 67,084 | ||||||
| 424 | Norfolk Southern Corp. | 82,311 | ||||||
| 890 | Union Pacific Corp. | 160,903 | ||||||
| 900 | West Japan Railway Co. | 77,844 | ||||||
|
| |||||||
| 470,054 | ||||||||
|
| |||||||
| Semiconductors & Semiconductor Equipment — 1.5% | ||||||||
| 501 | Analog Devices, Inc. | 59,539 | ||||||
| 1,138 | Applied Materials, Inc. | 69,463 | ||||||
| 724 | ASM International NV | 81,720 | ||||||
| 475 | Broadcom, Inc. | 150,109 | ||||||
| 5,708 | Intel Corp. | 341,624 | ||||||
| 376 | KLA Corp. | 66,992 | ||||||
| 245 | Lam Research Corp. | 71,638 | ||||||
| 557 | NVIDIA Corp. | 131,062 | ||||||
| 1,708 | QUALCOMM, Inc. | 150,697 | ||||||
| 1,227 | Texas Instruments, Inc. | 157,412 | ||||||
| 555 | Xilinx, Inc. | 54,262 | ||||||
|
| |||||||
| 1,334,518 | ||||||||
|
| |||||||
| Software — 2.2% | ||||||||
| 394 | Intuit, Inc. | 103,200 | ||||||
| 646 | j2 Global, Inc. | 60,537 | ||||||
| 9,674 | Microsoft Corp. | 1,525,590 | ||||||
| 4,335 | Oracle Corp. | 229,668 | ||||||
|
| |||||||
| 1,918,995 | ||||||||
|
| |||||||
| Specialty Retail — 0.9% | ||||||||
| 1,300 | ABC-Mart, Inc. | 88,740 | ||||||
| 1,571 | Home Depot, Inc. (The) | 343,075 | ||||||
| 1,158 | Lowe’s Cos., Inc. | 138,682 | ||||||
| 599 | Ross Stores, Inc. | 69,736 | ||||||
| 1,837 | TJX Cos., Inc. (The) | 112,167 | ||||||
|
| |||||||
| 752,400 | ||||||||
|
| |||||||
| Technology Hardware, Storage & Peripherals — 2.1% | ||||||||
| 5,826 | Apple, Inc. | 1,710,805 | ||||||
See accompanying notes to financial statements.
| 52
Table of Contents
Portfolio of Investments – as of December 31, 2019
Loomis Sayles Multi-Asset Income Fund – (continued)
| Shares | Description | Value (†) | ||||||
| Technology Hardware, Storage & Peripherals — continued | ||||||||
| 1,329 | Hewlett Packard Enterprise Co. | $ | 21,078 | |||||
| 3,068 | HP, Inc. | 63,047 | ||||||
|
| |||||||
| 1,794,930 | ||||||||
|
| |||||||
| Textiles, Apparel & Luxury Goods — 0.3% | ||||||||
| 1,845 | NIKE, Inc., Class B | 186,917 | ||||||
| 659 | VF Corp. | 65,676 | ||||||
|
| |||||||
| 252,593 | ||||||||
|
| |||||||
| Tobacco — 0.8% | ||||||||
| 4,567 | Altria Group, Inc. | 227,939 | ||||||
| 2,341 | British American Tobacco PLC | 99,497 | ||||||
| 3,377 | Imperial Brands PLC | 83,548 | ||||||
| 3,079 | Philip Morris International, Inc. | 261,992 | ||||||
|
| |||||||
| 672,976 | ||||||||
|
| |||||||
| Trading Companies & Distributors — 0.1% | ||||||||
| 1,748 | Fastenal Co. | 64,589 | ||||||
| 1,400 | ITOCHU Corp. | 32,447 | ||||||
| 1,200 | Sumitomo Corp. | 17,824 | ||||||
|
| |||||||
| 114,860 | ||||||||
|
| |||||||
| Transportation Infrastructure — 0.1% | ||||||||
| 9,401 | Enav SpA, 144A | 56,105 | ||||||
|
| |||||||
| Wireless Telecommunication Services — 0.1% | ||||||||
| 2,900 | KDDI Corp. | 86,525 | ||||||
|
| |||||||
| Total Common Stocks (Identified Cost $35,187,434) | 38,012,788 | |||||||
|
| |||||||
| Principal Amount (‡) | ||||||||
| Bonds and Notes — 38.6% | ||||||||
| Banking — 16.3% | ||||||||
| $ | 1,200,000 | Banco Bilbao Vizcaya Argentaria S.A., (fixed rate to 11/16/2027, variable rate thereafter), 6.125%(a) | 1,234,500 | |||||
| 1,520,000 | Banco BTG Pactual SA, (fixed rate to 2/15/2024, variable rate thereafter), 7.750%, 2/15/2029, 144A | 1,609,315 | ||||||
| 985,000 | Barclays PLC, (fixed rate to 6/15/2024, variable rate thereafter), 8.000%(a) | 1,101,969 | ||||||
| 495,000 | Barclays PLC, (fixed rate to 9/15/2023, variable rate thereafter), 7.750%(a) | 540,788 | ||||||
| 400,000 | CaixaBank S.A., (fixed rate to 3/23/2026, variable rate thereafter), 5.250%, (EUR)(a) | 457,990 | ||||||
| 1,400,000 | Credit Agricole S.A., (fixed rate to 1/23/2024, variable rate thereafter), 7.875%, 144A(a) | 1,595,720 | ||||||
| 1,100,000 | Credit Suisse Group AG, (fixed rate to 9/12/2025, variable rate thereafter), 7.250%, 144A(a) | 1,227,875 | ||||||
| 1,560,000 | HSBC Holdings PLC, (fixed rate to 3/23/2023, variable rate thereafter), 6.250%(a) | 1,655,550 | ||||||
| 600,000 | Lloyds Banking Group PLC, (fixed rate to 9/27/2025, variable rate thereafter), 7.500%(a) | 672,750 | ||||||
See accompanying notes to financial statements.
53 |
Table of Contents
Portfolio of Investments – as of December 31, 2019
Loomis Sayles Multi-Asset Income Fund – (continued)
| Principal Amount (‡) | Description | Value (†) | ||||||
| Banking — continued | ||||||||
| $ | 1,405,000 | Royal Bank of Scotland Group PLC, (fixed rate to 8/10/2025, variable rate thereafter), 8.000%(a) | $ | 1,617,267 | ||||
| 1,800,000 | Standard Chartered PLC, (fixed rate to 4/02/2023, variable rate thereafter), 7.750%, 144A(a) | 1,991,250 | ||||||
| 310,000 | UniCredit SpA, (fixed rate to 6/03/2023, variable rate thereafter), 6.625%, (EUR)(a) | 375,980 | ||||||
|
| |||||||
| 14,080,954 | ||||||||
|
| |||||||
| Cable Satellite — 0.4% | ||||||||
| 325,000 | DISH DBS Corp., 7.750%, 7/01/2026 | 344,302 | ||||||
|
| |||||||
| Chemicals — 1.6% | ||||||||
| 335,000 | Alpek SAB de CV, 4.250%, 9/18/2029, 144A | 341,700 | ||||||
| 985,000 | SASOL Financing USA LLC, 5.875%, 3/27/2024 | 1,066,617 | ||||||
|
| |||||||
| 1,408,317 | ||||||||
|
| |||||||
| Finance Companies — 1.6% | ||||||||
| 565,000 | Quicken Loans, Inc., 5.250%, 1/15/2028, 144A | 584,775 | ||||||
| 795,000 | Unifin Financiera SAB de CV, 8.375%, 1/27/2028, 144A | 813,881 | ||||||
|
| |||||||
| 1,398,656 | ||||||||
|
| |||||||
| Financial Other — 0.6% | ||||||||
| 490,000 | Kuwait Projects Co. SPC Ltd., EMTN, 4.500%, 2/23/2027 | 512,148 | ||||||
|
| |||||||
| Food & Beverage — 1.2% | ||||||||
| 495,000 | JBS Investments II GmbH, 7.000%, 1/15/2026, 144A | 538,476 | ||||||
| 470,000 | NBM U.S Holdings, Inc., 7.000%, 5/14/2026, 144A | 509,015 | ||||||
|
| |||||||
| 1,047,491 | ||||||||
|
| |||||||
| Government Owned – No Guarantee — 2.8% | ||||||||
| 515,000 | DP World Crescent Ltd., 4.848%, 9/26/2028, 144A | 565,387 | ||||||
| 415,000 | OCP S.A., 6.875%, 4/25/2044, 144A | 527,457 | ||||||
| 240,000 | Oztel Holdings SPC Ltd., 5.625%, 10/24/2023, 144A | 255,900 | ||||||
| 480,000 | Perusahaan Listrik Negara PT, 4.125%, 5/15/2027, 144A | 505,800 | ||||||
| 480,000 | Petrobras Global Finance BV, 5.750%, 2/01/2029 | 541,440 | ||||||
|
| |||||||
| 2,395,984 | ||||||||
|
| |||||||
| Independent Energy — 2.0% | ||||||||
| 540,000 | MEG Energy Corp., 6.375%, 1/30/2023, 144A | 541,350 | ||||||
| 1,165,000 | MEG Energy Corp., 7.000%, 3/31/2024, 144A | 1,172,281 | ||||||
|
| |||||||
| 1,713,631 | ||||||||
|
| |||||||
| Industrial Other — 0.6% | ||||||||
| 475,000 | GEMS MENASA Cayman Ltd./GEMS Education Delaware LLC, 7.125%, 7/31/2026, 144A | 499,938 | ||||||
|
| |||||||
| Media Entertainment — 0.6% | ||||||||
| 515,000 | Prosus NV, 4.850%, 7/06/2027, 144A | 561,268 | ||||||
|
| |||||||
| Metals & Mining — 1.8% | ||||||||
| 625,000 | First Quantum Minerals Ltd., 7.500%, 4/01/2025, 144A | 639,062 | ||||||
| 820,000 | Gold Fields Orogen Holdings BVI Ltd., 6.125%, 5/15/2029, 144A | 910,200 | ||||||
|
| |||||||
| 1,549,262 | ||||||||
|
| |||||||
See accompanying notes to financial statements.
| 54
Table of Contents
Portfolio of Investments – as of December 31, 2019
Loomis Sayles Multi-Asset Income Fund – (continued)
| Principal Amount (‡) | Description | Value (†) | ||||||
| Midstream — 0.5% | ||||||||
| $ | 380,000 | Delek & Avner Tamar Bond Ltd., 5.412%, 12/30/2025, 144A | $ | 400,734 | ||||
|
| |||||||
| Oil Field Services — 0.7% | ||||||||
| 600,000 | Transocean Poseidon Ltd., 6.875%, 2/01/2027, 144A | 636,000 | ||||||
|
| |||||||
| Property & Casualty Insurance — 0.8% | ||||||||
| 510,000 | Ardonagh Midco 3 PLC, 8.375%, 7/15/2023, 144A, (GBP) | 671,371 | ||||||
|
| |||||||
| Sovereigns — 1.7% | ||||||||
| 530,000 | Oman Government International Bond, 6.000%, 8/01/2029, 144A | 554,327 | ||||||
| 355,000 | Qatar Government International Bond, 4.000%, 3/14/2029, 144A | 396,181 | ||||||
| 405,000 | Saudi Government International Bond, 5.250%, 1/16/2050 | 503,229 | ||||||
|
| |||||||
| 1,453,737 | ||||||||
|
| |||||||
| Supranational — 1.0% | ||||||||
| 830,000 | African Export-Import Bank (The), 3.994%, 9/21/2029, 144A | 842,243 | ||||||
|
| |||||||
| Technology — 1.0% | ||||||||
| 290,000 | Dell International LLC/EMC Corp., 8.350%, 7/15/2046, 144A | 399,602 | ||||||
| 455,000 | MTN Mauritius Investments Ltd., 6.500%, 10/13/2026, 144A | 502,775 | ||||||
|
| |||||||
| 902,377 | ||||||||
|
| |||||||
| Treasuries — 0.6% | ||||||||
| 6,514,000,000 | Indonesia Treasury Bond, 8.250%, 5/15/2029, (IDR) | 505,823 | ||||||
|
| |||||||
| Utility Other — 0.3% | ||||||||
| 260,000 | Acwa Power Management And Investments One Ltd., 5.950%, 12/15/2039, 144A | 276,487 | ||||||
|
| |||||||
| Wireless — 2.5% | ||||||||
| 900,000 | GTH Finance BV, 7.250%, 4/26/2023, 144A | 1,013,886 | ||||||
| 505,000 | Millicom International Cellular S.A., 6.250%, 3/25/2029, 144A | 557,161 | ||||||
| 565,000 | Sprint Corp., 7.625%, 3/01/2026 | 623,082 | ||||||
|
| |||||||
| 2,194,129 | ||||||||
|
| |||||||
| Total Bonds and Notes (Identified Cost $31,652,905) | 33,394,852 | |||||||
|
| |||||||
| Shares | ||||||||
| Exchange-Traded Funds — 5.1% | ||||||||
| 514,600 | Alerian MLP ETF (Identified Cost $4,707,757) | 4,374,100 | ||||||
|
| |||||||
| Principal Amount (‡) | ||||||||
| Senior Loans — 2.4% | ||||||||
| Airlines — 2.4% | ||||||||
| $ | 2,063,636 | Gol LuxCo S.A., 1st Lien Term Loan, 6.500%, 8/31/2020(b)(c) (Identified Cost $2,061,137) | 2,084,272 | |||||
|
| |||||||
| Shares | ||||||||
| Preferred Stocks — 0.7% | ||||||||
| Technology — 0.7% | ||||||||
| 515 | Broadcom, Inc., Series A, 8.000% (Identified Cost $523,250) | 606,655 | ||||||
|
| |||||||
See accompanying notes to financial statements.
55 |
Table of Contents
Portfolio of Investments – as of December 31, 2019
Loomis Sayles Multi-Asset Income Fund – (continued)
| Principal Amount (‡) | Description | Value (†) | ||||||
| Short-Term Investments — 9.0% | ||||||||
| $ | 7,827,130 | Tri-Party Repurchase Agreement with Fixed Income Clearing Corporation, dated 12/31/2019 at 0.900% to be repurchased at $7,827,521 on 1/02/2020 collateralized by $7,105,000 U.S. Treasury Inflation Indexed Note, 0.125% due 7/15/2022 valued at $7,983,952 including accrued interest (Note 2 of Notes to Financial Statements) (Identified Cost $7,827,130) | $ | 7,827,130 | ||||
|
| |||||||
| Total Investments — 99.8% (Identified Cost $81,959,613) | 86,299,797 | |||||||
| Other assets less liabilities — 0.2% | 140,350 | |||||||
|
| |||||||
| Net Assets — 100.0% | $ | 86,440,147 | ||||||
|
| |||||||
| (‡) | Principal Amount stated in U.S. dollars unless otherwise noted. |
| ||||||
| (†) | See Note 2 of Notes to Financial Statements. |
| ||||||
| (a) | Perpetual bond with no specified maturity date. |
| ||||||
| (b) | Illiquid security. (Unaudited) |
| ||||||
| (c) | Securities classified as fair valued pursuant to the Fund’s pricing policies and procedures. At December 31, 2019, the value of these securities amounted to $2,084,272 or 2.4% of net assets. See Note 2 of Notes to Financial Statements. |
| ||||||
| 144A | All or a portion of these securities are exempt from registration under Rule 144A of the Securities Act of 1933. These securities may be resold in transactions exempt from registration, normally to qualified institutional buyers. At December 31, 2019, the value of Rule 144A holdings amounted to $21,697,522 or 25.1% of net assets. |
| ||||||
| EMTN | Euro Medium Term Note |
| ||||||
| ETF | Exchange-Traded Fund |
| ||||||
| EUR | Euro |
| ||||||
| GBP | British Pound |
| ||||||
| IDR | Indonesian Rupiah |
| ||||||
Industry Summary at December 31, 2019
Banking | 16.3 | % | ||
Banks | 6.5 | |||
Government Owned – No Guarantee | 2.8 | |||
Wireless | 2.5 | |||
Airlines | 2.5 | |||
Chemicals | 2.4 | |||
Insurance | 2.3 | |||
Pharmaceuticals | 2.3 | |||
IT Services | 2.3 | |||
Software | 2.2 | |||
Technology Hardware, Storage & Peripherals | 2.1 | |||
Independent Energy | 2.0 | |||
Other Investments, less than 2% each | 39.5 | |||
Short-Term Investments | 9.0 | |||
Exchange-Traded Funds | 5.1 | |||
|
| |||
Total Investments | 99.8 | |||
Other assets less liabilities | 0.2 | |||
|
| |||
Net Assets | 100.0 | % | ||
|
|
See accompanying notes to financial statements.
| 56
Table of Contents
Statements of Assets and Liabilities
December 31, 2019
| High Income Fund | Investment Grade Bond Fund | Multi-Asset Income Fund | ||||||||||
ASSETS |
| |||||||||||
Investments at cost | $ | 144,884,838 | $ | 5,217,350,433 | $ | 81,959,613 | ||||||
Net unrealized appreciation | 184,563 | 317,568,813 | 4,340,184 | |||||||||
|
|
|
|
|
| |||||||
Investments at value | 145,069,401 | 5,534,919,246 | 86,299,797 | |||||||||
Cash | 19,643 | 482 | 30,757 | |||||||||
Due from broker | 103,848 | — | — | |||||||||
Foreign currency at value (identified cost $0, $34,356 and $9,422, respectively) | — | 34,864 | 9,462 | |||||||||
Receivable for Fund shares sold | 288,823 | 9,988,794 | 16,822 | |||||||||
Receivable for securities sold | 261,814 | 104,000 | — | |||||||||
Dividends and interest receivable | 1,949,048 | 40,239,831 | 640,699 | |||||||||
Tax reclaims receivable | — | 479 | 24,292 | |||||||||
Prepaid expenses (Note 8) | 6 | 226 | 4 | |||||||||
|
|
|
|
|
| |||||||
TOTAL ASSETS | 147,692,583 | 5,585,287,922 | 87,021,833 | |||||||||
|
|
|
|
|
| |||||||
LIABILITIES | ||||||||||||
Payable for Fund shares redeemed | 30,991 | 8,011,293 | 372,762 | |||||||||
Management fees payable (Note 6) | 61,121 | 1,729,877 | 33,618 | |||||||||
Deferred Trustees’ fees (Note 6) | 179,116 | 925,935 | 94,834 | |||||||||
Administrative fees payable (Note 6) | 5,058 | 207,086 | 3,315 | |||||||||
Payable to distributor (Note 6d) | 1,772 | 41,954 | 583 | |||||||||
Other accounts payable and accrued expenses | 87,541 | 375,680 | 76,574 | |||||||||
|
|
|
|
|
| |||||||
TOTAL LIABILITIES | 365,599 | 11,291,825 | 581,686 | |||||||||
|
|
|
|
|
| |||||||
NET ASSETS | $ | 147,326,984 | $ | 5,573,996,097 | $ | 86,440,147 | ||||||
|
|
|
|
|
| |||||||
NET ASSETS CONSIST OF: | ||||||||||||
Paid-in capital | $ | 152,974,132 | $ | 5,229,586,800 | $ | 87,066,139 | ||||||
Accumulated earnings (loss) | (5,647,148 | ) | 344,409,297 | (625,992 | ) | |||||||
|
|
|
|
|
| |||||||
NET ASSETS | $ | 147,326,984 | $ | 5,573,996,097 | $ | 86,440,147 | ||||||
|
|
|
|
|
| |||||||
See accompanying notes to financial statements.
57 |
Table of Contents
Statements of Assets and Liabilities (continued)
December 31, 2019
| High Income Fund | Investment Grade Bond Fund | Multi-Asset Income Fund | ||||||||||
COMPUTATION OF NET ASSET VALUE AND OFFERING PRICE: | ||||||||||||
Class A shares: | ||||||||||||
Net assets | $ | 23,199,445 | $ | 772,485,362 | $ | 28,845,182 | ||||||
|
|
|
|
|
| |||||||
Shares of beneficial interest | 5,454,982 | 68,180,197 | 2,199,442 | |||||||||
|
|
|
|
|
| |||||||
Net asset value and redemption price per share | $ | 4.25 | $ | 11.33 | $ | 13.11 | ||||||
|
|
|
|
|
| |||||||
Offering price per share (100/95.75 of net asset value) (Note 1) | $ | 4.44 | $ | 11.83 | $ | 13.69 | ||||||
|
|
|
|
|
| |||||||
Class C shares:(redemption price per share is equal to net asset value less any applicable contingent deferred sales charge) (Note 1) | ||||||||||||
Net assets | $ | 3,835,901 | $ | 204,394,573 | $ | 16,737,912 | ||||||
|
|
|
|
|
| |||||||
Shares of beneficial interest | 898,802 | 18,249,265 | 1,282,081 | |||||||||
|
|
|
|
|
| |||||||
Net asset value and offering price per share | $ | 4.27 | $ | 11.20 | $ | 13.06 | ||||||
|
|
|
|
|
| |||||||
Class N shares: | ||||||||||||
Net assets | $ | 11,976,561 | $ | 1,367,171,989 | $ | 198,001 | ||||||
|
|
|
|
|
| |||||||
Shares of beneficial interest | 2,814,782 | 120,656,644 | 15,196 | |||||||||
|
|
|
|
|
| |||||||
Net asset value, offering and redemption price per share | $ | 4.25 | $ | 11.33 | $ | 13.03 | ||||||
|
|
|
|
|
| |||||||
Class Y shares: | ||||||||||||
Net assets | $ | 108,315,077 | $ | 3,118,505,157 | $ | 40,659,052 | ||||||
|
|
|
|
|
| |||||||
Shares of beneficial interest | 25,504,177 | 275,056,548 | 3,120,428 | |||||||||
|
|
|
|
|
| |||||||
Net asset value, offering and redemption price per share | $ | 4.25 | $ | 11.34 | $ | 13.03 | ||||||
|
|
|
|
|
| |||||||
Admin Class shares: | ||||||||||||
Net assets | $ | — | $ | 111,439,016 | $ | — | ||||||
|
|
|
|
|
| |||||||
Shares of beneficial interest | — | 9,861,865 | — | |||||||||
|
|
|
|
|
| |||||||
Net asset value, offering and redemption price per share | $ | — | $ | 11.30 | $ | — | ||||||
|
|
|
|
|
| |||||||
See accompanying notes to financial statements.
| 58
Table of Contents
Statements of Operations
For the Year Ended December 31, 2019
| High Income Fund | Investment Grade Bond Fund | Multi-Asset Income Fund | ||||||||||
INVESTMENT INCOME |
| |||||||||||
Interest | $ | 8,398,038 | $ | 213,518,155 | $ | 3,324,106 | ||||||
Dividends | 201,777 | 857,168 | 1,370,894 | |||||||||
Less net foreign taxes withheld | (732 | ) | (17,886 | ) | (17,196 | ) | ||||||
|
|
|
|
|
| |||||||
| 8,599,083 | 214,357,437 | 4,677,804 | ||||||||||
|
|
|
|
|
| |||||||
Expenses |
| |||||||||||
Management fees (Note 6) | 881,481 | 22,174,684 | 595,472 | |||||||||
Service and distribution fees (Note 6) | 104,123 | 5,236,025 | 314,220 | |||||||||
Administrative fees (Note 6) | 64,514 | 2,440,159 | 47,707 | |||||||||
Trustees’ fees and expenses (Note 6) | 37,018 | 278,420 | 27,552 | |||||||||
Transfer agent fees and expenses (Notes 6 and 7) | 161,197 | 3,672,993 | 75,793 | |||||||||
Audit and tax services fees | 54,952 | 64,267 | 48,212 | |||||||||
Custodian fees and expenses | 12,794 | 134,406 | 43,164 | |||||||||
Legal fees (Note 8) | 4,232 | 170,820 | 3,084 | |||||||||
Registration fees | 77,677 | 206,502 | 66,381 | |||||||||
Shareholder reporting expenses | 34,722 | 440,542 | 8,553 | |||||||||
Miscellaneous expenses (Note 8) | 28,698 | 174,794 | 33,389 | |||||||||
|
|
|
|
|
| |||||||
Total expenses | 1,461,408 | 34,993,612 | 1,263,527 | |||||||||
Less waiver and/or expense reimbursement (Note 6) | (224,533 | ) | (1,590,978 | ) | (190,284 | ) | ||||||
|
|
|
|
|
| |||||||
Net expenses | 1,236,875 | 33,402,634 | 1,073,243 | |||||||||
|
|
|
|
|
| |||||||
Net investment income | 7,362,208 | 180,954,803 | 3,604,561 | |||||||||
|
|
|
|
|
| |||||||
NET REALIZED AND UNREALIZED GAIN (LOSS) ON INVESTMENTS, FORWARD FOREIGN CURRENCY CONTRACTS AND FOREIGN CURRENCY TRANSACTIONS | ||||||||||||
Net realized gain (loss) on: |
| |||||||||||
Investments | (386,388 | ) | 73,163,029 | (1,281,468 | ) | |||||||
Forward foreign currency contracts (Note 2d) | (44,094 | ) | (670,701 | ) | (5,147 | ) | ||||||
Foreign currency transactions (Note 2c) | — | 2,368,603 | (78,839 | ) | ||||||||
Net change in unrealized appreciation (depreciation) on: |
| |||||||||||
Investments | 9,712,862 | 217,944,856 | 13,596,978 | |||||||||
Forward foreign currency contracts (Note 2d) | 44,094 | 670,701 | — | |||||||||
Foreign currency translations (Note 2c) | 17 | (2,229,110 | ) | 1,859 | ||||||||
|
|
|
|
|
| |||||||
Net realized and unrealized gain on investments, forward foreign currency contracts and foreign currency transactions | 9,326,491 | 291,247,378 | 12,233,383 | |||||||||
|
|
|
|
|
| |||||||
NET INCREASE IN NET ASSETS RESULTING FROM OPERATIONS | $ | 16,688,699 | $ | 472,202,181 | $ | 15,837,944 | ||||||
|
|
|
|
|
| |||||||
See accompanying notes to financial statements.
59 |
Table of Contents
Statements of Changes in Net Assets
| High Income Fund | ||||||||||||
| Year Ended December 31, 2019 | Period Ended December 31, 2018(a) | Year Ended September 30, 2018 | ||||||||||
FROM OPERATIONS: | ||||||||||||
Net investment income | $ | 7,362,208 | $ | 2,214,373 | $ | 8,475,372 | ||||||
Net realized gain (loss) on investments and forward foreign currency contracts | (430,482 | ) | (6,387,716 | ) | 1,205,344 | |||||||
Net change in unrealized appreciation (depreciation) on investments, forward foreign currency contracts and foreign currency translations | 9,756,973 | (3,483,546 | ) | (7,029,759 | ) | |||||||
|
|
|
|
|
| |||||||
Net increase (decrease) in net assets resulting from operations | 16,688,699 | (7,656,889 | ) | 2,650,957 | ||||||||
|
|
|
|
|
| |||||||
FROM DISTRIBUTIONS TO SHAREHOLDERS: | ||||||||||||
Class A | (1,135,803 | ) | (410,882 | ) | (1,227,019 | ) | ||||||
Class C | (194,240 | ) | (81,814 | ) | (311,547 | ) | ||||||
Class N | (609,528 | ) | (178,711 | ) | (259,688 | ) | ||||||
Class Y | (5,638,962 | ) | (2,141,392 | ) | (5,752,686 | ) | ||||||
|
|
|
|
|
| |||||||
Total distributions | (7,578,533 | ) | (2,812,799 | ) | (7,550,940 | ) | ||||||
|
|
|
|
|
| |||||||
NET INCREASE (DECREASE) IN NET ASSETS FROM CAPITAL SHARE TRANSACTIONS (NOTE 11) | 1,738,584 | (23,511,576 | ) | (3,848,432 | ) | |||||||
|
|
|
|
|
| |||||||
Net increase (decrease) in net assets | 10,848,750 | (33,981,264 | ) | (8,748,415 | ) | |||||||
NET ASSETS | ||||||||||||
Beginning of the year | 136,478,234 | 170,459,498 | 179,207,913 | |||||||||
|
|
|
|
|
| |||||||
End of the year | $ | 147,326,984 | $ | 136,478,234 | $ | 170,459,498 | ||||||
|
|
|
|
|
| |||||||
| (a) | For the three month period ended December 31, 2018. See Note 1 of Notes to Financial Statements. |
See accompanying notes to financial statements.
| 60
Table of Contents
Statements of Changes in Net Assets (continued)
| Investment Grade Bond Fund | ||||||||||||
| Year Ended December 31, 2019 | Period Ended December 31, 2018(a) | Year Ended September 30, 2018 | ||||||||||
FROM OPERATIONS: |
| |||||||||||
Net investment income | $ | 180,954,803 | $ | 44,450,885 | $ | 171,956,415 | ||||||
Net realized gain (loss) on investments, forward foreign currency contracts and foreign currency transactions | 74,860,931 | (228,459,921 | ) | (68,790,141 | ) | |||||||
Net change in unrealized appreciation (depreciation) on investments, forward foreign currency contracts and foreign currency translations | 216,386,447 | 150,673,092 | (88,370,511 | ) | ||||||||
|
|
|
|
|
| |||||||
Net increase (decrease) in net assets resulting from operations | 472,202,181 | (33,335,944 | ) | 14,795,763 | ||||||||
|
|
|
|
|
| |||||||
FROM DISTRIBUTIONS TO SHAREHOLDERS: |
| |||||||||||
Class A | (25,364,474 | ) | (9,439,602 | ) | (26,935,957 | ) | ||||||
Class C | (6,942,862 | ) | (4,075,458 | ) | (15,654,049 | ) | ||||||
Class N | (47,788,079 | ) | (16,768,000 | ) | (41,987,053 | ) | ||||||
Class Y | (111,238,434 | ) | (39,150,105 | ) | (111,284,265 | ) | ||||||
Admin Class | (3,581,152 | ) | (1,369,684 | ) | (778,851 | ) | ||||||
|
|
|
|
|
| |||||||
Total distributions | (194,915,001 | ) | (70,802,849 | ) | (196,640,175 | ) | ||||||
|
|
|
|
|
| |||||||
NET DECREASE IN NET ASSETS FROM CAPITAL SHARE TRANSACTIONS (NOTE 11) | (31,559,822 | ) | (126,167,759 | ) | (534,159,760 | ) | ||||||
|
|
|
|
|
| |||||||
Net increase (decrease) in net assets | 245,727,358 | (230,306,552 | ) | (716,004,172 | ) | |||||||
NET ASSETS |
| |||||||||||
Beginning of the year | 5,328,268,739 | 5,558,575,291 | 6,274,579,463 | |||||||||
|
|
|
|
|
| |||||||
End of the year | $ | 5,573,996,097 | $ | 5,328,268,739 | $ | 5,558,575,291 | ||||||
|
|
|
|
|
| |||||||
| (a) | For the three month period ended December 31, 2018. See Note 1 of Notes to Financial Statements. |
See accompanying notes to financial statements.
61 |
Table of Contents
Statements of Changes in Net Assets (continued)
| Multi-Asset Income Fund | ||||||||
| Year Ended December 31, 2019 | Year Ended December 31, 2018 | |||||||
FROM OPERATIONS: |
| |||||||
Net investment income | $ | 3,604,561 | $ | 5,207,147 | ||||
Net realized loss on investments, forward foreign currency contracts and foreign currency transactions | (1,365,454 | ) | (1,541,137 | ) | ||||
Net change in unrealized appreciation (depreciation) on investments and foreign currency translations | 13,598,837 | (16,770,929 | ) | |||||
|
|
|
| |||||
Net increase (decrease) in net assets resulting from operations | 15,837,944 | (13,104,919 | ) | |||||
|
|
|
| |||||
FROM DISTRIBUTIONS TO SHAREHOLDERS: |
| |||||||
Accumulated earnings | ||||||||
Class A | (1,407,776 | ) | (3,689,139 | ) | ||||
Class C | (591,756 | ) | (1,796,319 | ) | ||||
Class N | (2,159 | ) | (2,353 | ) | ||||
Class Y | (1,679,151 | ) | (3,691,567 | ) | ||||
Paid-in capital | ||||||||
Class A | (72,102 | ) | — | |||||
Class C | (28,844 | ) | — | |||||
Class N | (532 | ) | — | |||||
Class Y | (109,510 | ) | — | |||||
|
|
|
| |||||
Total distributions | (3,891,830 | ) | (9,179,378 | ) | ||||
|
|
|
| |||||
NET DECREASE IN NET ASSETS FROM CAPITAL SHARE TRANSACTIONS (NOTE 11) | (44,926,409 | ) | (2,836,090 | ) | ||||
|
|
|
| |||||
Net decrease in net assets | (32,980,295 | ) | (25,120,387 | ) | ||||
NET ASSETS |
| |||||||
Beginning of the year | 119,420,442 | 144,540,829 | ||||||
|
|
|
| |||||
End of the year | $ | 86,440,147 | $ | 119,420,442 | ||||
|
|
|
| |||||
See accompanying notes to financial statements.
| 62
Table of Contents
Financial Highlights
For a share outstanding throughout each period.
| High Income Fund—Class A | ||||||||||||||||||||||||
| Year Ended December 31, 2019 | Period Ended December 31, 2018* | Year Ended September 30, 2018 | Year Ended September 30, 2017 | Year Ended September 30, 2016 | Year Ended September 30, 2015 | |||||||||||||||||||
Net asset value, beginning of the period | $ | 3.99 | $ | 4.25 | $ | 4.37 | $ | 4.23 | $ | 3.99 | $ | 4.49 | ||||||||||||
|
|
|
|
|
|
|
|
|
|
|
| |||||||||||||
INCOME (LOSS) FROM INVESTMENT OPERATIONS: | ||||||||||||||||||||||||
Net investment income(a) | 0.20 | 0.05 | 0.20 | 0.22 | 0.20 | 0.19 | ||||||||||||||||||
Net realized and unrealized gain (loss) | 0.27 | (0.24 | ) | (0.14 | ) | 0.12 | 0.21 | (0.39 | ) | |||||||||||||||
|
|
|
|
|
|
|
|
|
|
|
| |||||||||||||
Total from Investment Operations | 0.47 | (0.19 | ) | 0.06 | 0.34 | 0.41 | (0.20 | ) | ||||||||||||||||
|
|
|
|
|
|
|
|
|
|
|
| |||||||||||||
LESS DISTRIBUTIONS FROM: | ||||||||||||||||||||||||
Net investment income | (0.21 | ) | (0.06 | ) | (0.18 | ) | (0.20 | ) | (0.16 | ) | (0.19 | ) | ||||||||||||
Net realized capital gains | — | (0.01 | ) | — | — | (0.01 | ) | (0.11 | ) | |||||||||||||||
|
|
|
|
|
|
|
|
|
|
|
| |||||||||||||
Total Distributions | (0.21 | ) | (0.07 | ) | (0.18 | ) | (0.20 | ) | (0.17 | ) | (0.30 | ) | ||||||||||||
|
|
|
|
|
|
|
|
|
|
|
| |||||||||||||
Net asset value, end of the period | $ | 4.25 | $ | 3.99 | $ | 4.25 | $ | 4.37 | $ | 4.23 | $ | 3.99 | ||||||||||||
|
|
|
|
|
|
|
|
|
|
|
| |||||||||||||
Total return(b)(c) | 11.94 | % | (4.54 | )%(d) | 1.41 | % | 8.17 | % | 10.66 | % | (4.78 | )% | ||||||||||||
RATIOS TO AVERAGE NET ASSETS: | ||||||||||||||||||||||||
Net assets, end of the period (000’s) | $ | 23,199 | $ | 23,125 | $ | 26,175 | $ | 34,039 | $ | 34,820 | $ | 37,870 | ||||||||||||
Net expenses(e) | 1.03 | %(f) | 1.05 | %(g) | 1.05 | % | 1.09 | %(h) | 1.10 | % | 1.11 | %(i) | ||||||||||||
Gross expenses | 1.18 | % | 1.27 | %(g) | 1.16 | % | 1.15 | % | 1.14 | % | 1.13 | % | ||||||||||||
Net investment income | 4.84 | % | 5.13 | %(g) | 4.73 | % | 5.03 | % | 5.16 | % | 4.41 | % | ||||||||||||
Portfolio turnover rate | 48 | % | 17 | % | 55 | % | 46 | % | 38 | % | 69 | % | ||||||||||||
| * | For the three month period ended December 31, 2018. See Note 1 of Notes to Financial Statements. |
| (a) | Per share net investment income has been calculated using the average shares outstanding during the period. |
| (b) | A sales charge for Class A shares is not reflected in total return calculations. |
| (c) | Had certain expenses not been waived/reimbursed during the period, total returns would have been lower. |
| (d) | Periods less than one year are not annualized. |
| (e) | The investment adviser agreed to waive its fees and/or reimburse a portion of the Fund’s expenses during the period. Without this waiver/reimbursement, expenses would have been higher. |
| (f) | Effective July 1, 2019, the expense limit decreased from 1.05% to 1.00%. See Note 6 of Notes to Financial Statements. |
| (g) | Computed on an annualized basis for periods less than one year. |
| (h) | Effective July 1, 2017, the expense limit decreased to 1.05%. |
| (i) | Effective July 1, 2015, the expense limit decreased to 1.10%. |
See accompanying notes to financial statements.
63 |
Table of Contents
Financial Highlights (continued)
For a share outstanding throughout each period.
| High Income Fund—Class C | ||||||||||||||||||||||||
| Year Ended December 31, 2019 | Period Ended December 31, 2018* | Year Ended September 30, 2018 | Year Ended September 30, 2017 | Year Ended September 30, 2016 | Year Ended September 30, 2015 | |||||||||||||||||||
Net asset value, beginning of the period | $ | 4.00 | $ | 4.27 | $ | 4.38 | $ | 4.24 | $ | 4.00 | $ | 4.50 | ||||||||||||
|
|
|
|
|
|
|
|
|
|
|
| |||||||||||||
INCOME (LOSS) FROM INVESTMENT OPERATIONS: | ||||||||||||||||||||||||
Net investment income(a) | 0.17 | 0.05 | 0.17 | 0.18 | 0.18 | 0.16 | ||||||||||||||||||
Net realized and unrealized gain (loss) | 0.28 | (0.26 | ) | (0.13 | ) | 0.12 | 0.20 | (0.39 | ) | |||||||||||||||
|
|
|
|
|
|
|
|
|
|
|
| |||||||||||||
Total from Investment Operations | 0.45 | (0.21 | ) | 0.04 | 0.30 | 0.38 | (0.23 | ) | ||||||||||||||||
|
|
|
|
|
|
|
|
|
|
|
| |||||||||||||
LESS DISTRIBUTIONS FROM: | ||||||||||||||||||||||||
Net investment income | (0.18 | ) | (0.05 | ) | (0.15 | ) | (0.16 | ) | (0.13 | ) | (0.16 | ) | ||||||||||||
Net realized capital gains | — | (0.01 | ) | — | — | (0.01 | ) | (0.11 | ) | |||||||||||||||
|
|
|
|
|
|
|
|
|
|
|
| |||||||||||||
Total Distributions | (0.18 | ) | (0.06 | ) | (0.15 | ) | (0.16 | ) | (0.14 | ) | (0.27 | ) | ||||||||||||
|
|
|
|
|
|
|
|
|
|
|
| |||||||||||||
Net asset value, end of the period | $ | 4.27 | $ | 4.00 | $ | 4.27 | $ | 4.38 | $ | 4.24 | $ | 4.00 | ||||||||||||
|
|
|
|
|
|
|
|
|
|
|
| |||||||||||||
Total return(b)(c) | 11.32 | % | (4.95 | )%(d) | 0.86 | % | 7.33 | % | 9.81 | % | (5.48 | )% | ||||||||||||
RATIOS TO AVERAGE NET ASSETS: | ||||||||||||||||||||||||
Net assets, end of the period (000’s) | $ | 3,836 | $ | 5,351 | $ | 6,248 | $ | 11,227 | $ | 12,288 | $ | 12,609 | ||||||||||||
Net expenses(e) | 1.78 | %(f) | 1.80 | %(g) | 1.80 | % | 1.84 | %(h) | 1.85 | % | 1.86 | %(i) | ||||||||||||
Gross expenses | 1.93 | % | 2.02 | %(g) | 1.91 | % | 1.90 | % | 1.89 | % | 1.88 | % | ||||||||||||
Net investment income | 4.11 | % | 4.38 | %(g) | 3.99 | % | 4.29 | % | 4.43 | % | 3.68 | % | ||||||||||||
Portfolio turnover rate | 48 | % | 17 | % | 55 | % | 46 | % | 38 | % | 69 | % | ||||||||||||
| * | For the three month period ended December 31, 2018. See Note 1 of Notes to Financial Statements. |
| (a) | Per share net investment income has been calculated using the average shares outstanding during the period. |
| (b) | A contingent deferred sales charge for Class C shares is not reflected in total return calculations. |
| (c) | Had certain expenses not been waived/reimbursed during the period, total returns would have been lower. |
| (d) | Periods less than one year are not annualized. |
| (e) | The investment adviser agreed to waive its fees and/or reimburse a portion of the Fund’s expenses during the period. Without this waiver/reimbursement, expenses would have been higher. |
| (f) | Effective July 1, 2019, the expense limit decreased from 1.80% to 1.75%. See Note 6 of Notes to Financial Statements. |
| (g) | Computed on an annualized basis for periods less than one year. |
| (h) | Effective July 1, 2017, the expense limit decreased to 1.80%. |
| (i) | Effective July 1, 2015, the expense limit decreased to 1.85%. |
See accompanying notes to financial statements.
| 64
Table of Contents
Financial Highlights (continued)
For a share outstanding throughout each period.
| High Income Fund—Class N | ||||||||||||||||
| Year Ended December 31, 2019 | Period Ended December 31, 2018* | Year Ended September 30, 2018 | Period Ended September 30, 2017** | |||||||||||||
Net asset value, beginning of the period | $ | 3.99 | $ | 4.25 | $ | 4.36 | $ | 4.16 | ||||||||
|
|
|
|
|
|
|
| |||||||||
INCOME (LOSS) FROM INVESTMENT OPERATIONS: | ||||||||||||||||
Net investment income(a) | 0.22 | 0.06 | 0.20 | 0.19 | ||||||||||||
Net realized and unrealized gain (loss) | 0.26 | (0.25 | ) | (0.12 | ) | 0.18 | ||||||||||
|
|
|
|
|
|
|
| |||||||||
Total from Investment Operations | 0.48 | (0.19 | ) | 0.08 | 0.37 | |||||||||||
|
|
|
|
|
|
|
| |||||||||
LESS DISTRIBUTIONS FROM: |
| |||||||||||||||
Net investment income | (0.22 | ) | (0.06 | ) | (0.19 | ) | (0.17 | ) | ||||||||
Net realized capital gains | — | (0.01 | ) | — | — | |||||||||||
|
|
|
|
|
|
|
| |||||||||
Total Distributions | (0.22 | ) | (0.07 | ) | (0.19 | ) | (0.17 | ) | ||||||||
|
|
|
|
|
|
|
| |||||||||
Net asset value, end of the period | $ | 4.25 | $ | 3.99 | $ | 4.25 | $ | 4.36 | ||||||||
|
|
|
|
|
|
|
| |||||||||
Total return(b) | 12.28 | % | (4.47 | )%(c) | 1.96 | % | 8.99 | %(c) | ||||||||
RATIOS TO AVERAGE NET ASSETS: |
| |||||||||||||||
Net assets, end of the period (000’s) | $ | 11,977 | $ | 10,417 | $ | 10,338 | $ | 1 | ||||||||
Net expenses(d) | 0.72 | %(e) | 0.75 | %(f) | 0.75 | % | 0.75 | %(f)(g) | ||||||||
Gross expenses | 0.82 | % | 0.89 | %(f) | 0.79 | % | 31.73 | %(f) | ||||||||
Net investment income | 5.13 | % | 5.45 | %(f) | 4.65 | % | 5.19 | %(f) | ||||||||
Portfolio turnover rate | 48 | % | 17 | % | 55 | % | 46 | %(h) | ||||||||
| * | For the three month period ended December 31, 2018. See Note 1 of Notes to Financial Statements. |
| ** | From commencement of Class operations on November 30, 2016 through September 30, 2017. |
| (a) | Per share net investment income has been calculated using the average shares outstanding during the period. |
| (b) | Had certain expenses not been waived/reimbursed during the period, total returns would have been lower. |
| (c) | Periods less than one year are not annualized. |
| (d) | The investment adviser agreed to waive its fees and/or reimburse a portion of the Fund’s expenses during the period. Without this waiver/reimbursement, expenses would have been higher. |
| (e) | Effective July 1, 2019, the expense limit decreased from 0.75% to 0.70%. See Note 6 of Notes to Financial Statements. |
| (f) | Computed on an annualized basis for periods less than one year. |
| (g) | Effective July 1, 2017, the expense limit decreased to 0.75%. |
| (h) | Represents the Fund’s portfolio turnover rate for the year ended September 30, 2017. |
See accompanying notes to financial statements.
65 |
Table of Contents
Financial Highlights (continued)
For a share outstanding throughout each period.
| High Income Fund—Class Y | ||||||||||||||||||||||||
| Year Ended December 31, 2019 | Period Ended December 31, 2018* | Year Ended September 30, 2018 | Year Ended September 30, 2017 | Year Ended September 30, 2016 | Year Ended September 30, 2015 | |||||||||||||||||||
Net asset value, beginning of the period | $ | 3.98 | $ | 4.24 | $ | 4.36 | $ | 4.22 | $ | 3.98 | $ | 4.48 | ||||||||||||
|
|
|
|
|
|
|
|
|
|
|
| |||||||||||||
INCOME (LOSS) FROM INVESTMENT OPERATIONS: | ||||||||||||||||||||||||
Net investment income(a) | 0.21 | 0.06 | 0.21 | 0.23 | 0.21 | 0.20 | ||||||||||||||||||
Net realized and unrealized gain (loss) | 0.28 | (0.25 | ) | (0.14 | ) | 0.12 | 0.21 | (0.39 | ) | |||||||||||||||
|
|
|
|
|
|
|
|
|
|
|
| |||||||||||||
Total from Investment Operations | 0.49 | (0.19 | ) | 0.07 | 0.35 | 0.42 | (0.19 | ) | ||||||||||||||||
|
|
|
|
|
|
|
|
|
|
|
| |||||||||||||
LESS DISTRIBUTIONS FROM: | ||||||||||||||||||||||||
Net investment income | (0.22 | ) | (0.06 | ) | (0.19 | ) | (0.21 | ) | (0.17 | ) | (0.20 | ) | ||||||||||||
Net realized capital gains | — | (0.01 | ) | — | — | (0.01 | ) | (0.11 | ) | |||||||||||||||
|
|
|
|
|
|
|
|
|
|
|
| |||||||||||||
Total Distributions | (0.22 | ) | (0.07 | ) | (0.19 | ) | (0.21 | ) | (0.18 | ) | (0.31 | ) | ||||||||||||
|
|
|
|
|
|
|
|
|
|
|
| |||||||||||||
Net asset value, end of the period | $ | 4.25 | $ | 3.98 | $ | 4.24 | $ | 4.36 | $ | 4.22 | $ | 3.98 | ||||||||||||
|
|
|
|
|
|
|
|
|
|
|
| |||||||||||||
Total return(b) | 12.52 | % | (4.49 | )%(c) | 1.68 | % | 8.47 | % | 10.98 | % | (4.54 | )% | ||||||||||||
RATIOS TO AVERAGE NET ASSETS: | ||||||||||||||||||||||||
Net assets, end of the period (000’s) | $ | 108,315 | $ | 97,585 | $ | 127,699 | $ | 133,940 | $ | 129,169 | $ | 116,837 | ||||||||||||
Net expenses(d) | 0.77 | %(e) | 0.80 | %(f) | 0.80 | % | 0.84 | %(g) | 0.85 | % | 0.86 | %(h) | ||||||||||||
Gross expenses | 0.93 | % | 1.02 | %(f) | 0.91 | % | 0.90 | % | 0.89 | % | 0.88 | % | ||||||||||||
Net investment income | 5.07 | % | 5.39 | %(f) | 4.98 | % | 5.28 | % | 5.43 | % | 4.67 | % | ||||||||||||
Portfolio turnover rate | 48 | % | 17 | % | 55 | % | 46 | % | 38 | % | 69 | % | ||||||||||||
| * | For the three month period ended December 31, 2018. See Note 1 of Notes to Financial Statements. |
| (a) | Per share net investment income has been calculated using the average shares outstanding during the period. |
| (b) | Had certain expenses not been waived/reimbursed during the period, total returns would have been lower. |
| (c) | Periods less than one year are not annualized. |
| (d) | The investment adviser agreed to waive its fees and/or reimburse a portion of the Fund’s expenses during the period. Without this waiver/reimbursement, expenses would have been higher. |
| (e) | Effective July 1, 2019, the expense limit decreased from 0.80% to 0.75%. See Note 6 of Notes to Financial Statements. |
| (f) | Computed on an annualized basis for periods less than one year. |
| (g) | Effective July 1, 2017, the expense limit decreased to 0.80%. |
| (h) | Effective July 1, 2015, the expense limit decreased to 0.85%. |
See accompanying notes to financial statements.
| 66
Table of Contents
Financial Highlights (continued)
For a share outstanding throughout each period.
| Investment Grade Bond Fund—Class A | ||||||||||||||||||||||||
| Year Ended December 31, 2019 | Period Ended December 31, 2018* | Year Ended September 30, 2018 | Year Ended September 30, 2017 | Year Ended September 30, 2016 | Year Ended September 30, 2015 | |||||||||||||||||||
Net asset value, beginning of the period | $ | 10.77 | $ | 10.98 | $ | 11.30 | $ | 11.59 | $ | 11.10 | $ | 12.11 | ||||||||||||
|
|
|
|
|
|
|
|
|
|
|
| |||||||||||||
INCOME (LOSS) FROM INVESTMENT OPERATIONS: | ||||||||||||||||||||||||
Net investment income(a) | 0.35 | 0.08 | 0.30 | 0.36 | 0.39 | 0.40 | ||||||||||||||||||
Net realized and unrealized gain (loss) | 0.58 | (0.16 | ) | (0.28 | ) | 0.05 | 0.48 | (0.95 | ) | |||||||||||||||
|
|
|
|
|
|
|
|
|
|
|
| |||||||||||||
Total from Investment Operations | 0.93 | (0.08 | ) | 0.02 | 0.41 | 0.87 | (0.55 | ) | ||||||||||||||||
|
|
|
|
|
|
|
|
|
|
|
| |||||||||||||
LESS DISTRIBUTIONS FROM: | ||||||||||||||||||||||||
Net investment income | (0.36 | ) | (0.08 | ) | (0.21 | ) | (0.26 | ) | (0.23 | ) | (0.34 | ) | ||||||||||||
Net realized capital gains | (0.01 | ) | (0.05 | ) | (0.13 | ) | (0.44 | ) | (0.15 | ) | (0.12 | ) | ||||||||||||
|
|
|
|
|
|
|
|
|
|
|
| |||||||||||||
Total Distributions | (0.37 | ) | (0.13 | ) | (0.34 | ) | (0.70 | ) | (0.38 | ) | (0.46 | ) | ||||||||||||
|
|
|
|
|
|
|
|
|
|
|
| |||||||||||||
Net asset value, end of the period | $ | 11.33 | $ | 10.77 | $ | 10.98 | $ | 11.30 | $ | 11.59 | $ | 11.10 | ||||||||||||
|
|
|
|
|
|
|
|
|
|
|
| |||||||||||||
Total return(b) | 8.78 | %(c) | (0.66 | )%(c)(d) | 0.19 | %(c) | 3.88 | % | 8.06 | % | (4.72 | )% | ||||||||||||
RATIOS TO AVERAGE NET ASSETS: | ||||||||||||||||||||||||
Net assets, end of the period (000’s) | $ | 772,485 | $ | 721,110 | $ | 777,391 | $ | 902,955 | $ | 1,130,260 | $ | 1,628,216 | ||||||||||||
Net expenses | 0.77 | %(e)(f) | 0.78 | %(e)(g) | 0.80 | %(e)(h) | 0.82 | %(i) | 0.85 | % | 0.83 | % | ||||||||||||
Gross expenses | 0.81 | % | 0.82 | %(g) | 0.82 | % | 0.82 | % | 0.85 | % | 0.83 | % | ||||||||||||
Net investment income | 3.10 | % | 3.09 | %(g) | 2.73 | % | 3.23 | % | 3.49 | % | 3.38 | % | ||||||||||||
Portfolio turnover rate | 44 | %(j) | 39 | %(j) | 3 | % | 10 | % | 11 | % | 23 | % | ||||||||||||
| * | For the three month period ended December 31, 2018. See Note 1 of Notes to Financial Statements. |
| (a) | Per share net investment income has been calculated using the average shares outstanding during the period. |
| (b) | A sales charge for Class A shares is not reflected in total return calculations. |
| (c) | Had certain expenses not been waived/reimbursed during the period, total returns would have been lower. |
| (d) | Periods less than one year are not annualized. |
| (e) | The investment adviser agreed to waive its fees and/or reimburse a portion of the Fund’s expenses during the period. Without this waiver/reimbursement, expenses would have been higher. |
| (f) | Effective July 1, 2019, the expense limit decreased from 0.78% to 0.76%. See Note 6 of Notes to Financial Statements. |
| (g) | Computed on an annualized basis for periods less than one year. |
| (h) | Effective July 1, 2018, the expense limit decreased to 0.78%. |
| (i) | Effective July 1, 2017, the expense limit decreased to 0.80%. |
| (j) | The variation in the Fund’s turnover rate from the year ended September 30, 2018 to the period ended December 31, 2018 was primarily due to a changes in the investment strategy and portfolio management team of the Fund. During 2019, turnover has remained elevated due to a continued repositioning of the Fund. |
See accompanying notes to financial statements.
67 |
Table of Contents
Financial Highlights (continued)
For a share outstanding throughout each period.
| Investment Grade Bond Fund—Class C | ||||||||||||||||||||||||
| Year Ended December 31, 2019 | Period Ended December 31, 2018* | Year Ended September 30, 2018 | Year Ended September 30, 2017 | Year Ended September 30, 2016 | Year Ended September 30, 2015 | |||||||||||||||||||
Net asset value, beginning of the period | $ | 10.65 | $ | 10.86 | $ | 11.19 | $ | 11.48 | $ | 11.00 | $ | 12.00 | ||||||||||||
|
|
|
|
|
|
|
|
|
|
|
| |||||||||||||
INCOME (LOSS) FROM INVESTMENT OPERATIONS: | ||||||||||||||||||||||||
Net investment income(a) | 0.26 | 0.06 | 0.22 | 0.27 | 0.30 | 0.31 | ||||||||||||||||||
Net realized and unrealized gain (loss) | 0.58 | (0.16 | ) | (0.28 | ) | 0.06 | 0.47 | (0.94 | ) | |||||||||||||||
|
|
|
|
|
|
|
|
|
|
|
| |||||||||||||
Total from Investment Operations | 0.84 | (0.10 | ) | (0.06 | ) | 0.33 | 0.77 | (0.63 | ) | |||||||||||||||
|
|
|
|
|
|
|
|
|
|
|
| |||||||||||||
LESS DISTRIBUTIONS FROM: | ||||||||||||||||||||||||
Net investment income | (0.28 | ) | (0.06 | ) | (0.14 | ) | (0.18 | ) | (0.14 | ) | (0.25 | ) | ||||||||||||
Net realized capital gains | (0.01 | ) | (0.05 | ) | (0.13 | ) | (0.44 | ) | (0.15 | ) | (0.12 | ) | ||||||||||||
|
|
|
|
|
|
|
|
|
|
|
| |||||||||||||
Total Distributions | (0.29 | ) | (0.11 | ) | (0.27 | ) | (0.62 | ) | (0.29 | ) | (0.37 | ) | ||||||||||||
|
|
|
|
|
|
|
|
|
|
|
| |||||||||||||
Net asset value, end of the period | $ | 11.20 | $ | 10.65 | $ | 10.86 | $ | 11.19 | $ | 11.48 | $ | 11.00 | ||||||||||||
|
|
|
|
|
|
|
|
|
|
|
| |||||||||||||
Total return(b) | 7.94 | %(c) | (0.86 | )%(c)(d) | (0.53 | )%(c) | 3.12 | % | 7.18 | % | (5.40 | )% | ||||||||||||
RATIOS TO AVERAGE NET ASSETS: | ||||||||||||||||||||||||
Net assets, end of the period (000’s) | $ | 204,395 | $ | 366,068 | $ | 412,788 | $ | 689,798 | $ | 1,001,522 | $ | 1,219,687 | ||||||||||||
Net expenses | 1.52 | %(e)(f) | 1.53 | %(e)(g) | 1.55 | %(e)(h) | 1.57 | %(i) | 1.60 | % | 1.58 | % | ||||||||||||
Gross expenses | 1.56 | % | 1.57 | %(g) | 1.57 | % | 1.57 | % | 1.60 | % | 1.58 | % | ||||||||||||
Net investment income | 2.35 | % | 2.34 | %(g) | 1.96 | % | 2.49 | % | 2.74 | % | 2.63 | % | ||||||||||||
Portfolio turnover rate | 44 | %(j) | 39 | %(j) | 3 | % | 10 | % | 11 | % | 23 | % | ||||||||||||
| * | For the three month period ended December 31, 2018. See Note 1 of Notes to Financial Statements. |
| (a) | Per share net investment income has been calculated using the average shares outstanding during the period. |
| (b) | A contingent deferred sales charge for Class C shares is not reflected in total return calculations. |
| (c) | Had certain expenses not been waived/reimbursed during the period, total returns would have been lower. |
| (d) | Periods less than one year are not annualized. |
| (e) | The investment adviser agreed to waive its fees and/or reimburse a portion of the Fund’s expenses during the period. Without this waiver/reimbursement, expenses would have been higher. |
| (f) | Effective July 1, 2019, the expense limit decreased from 1.53% to 1.51%. See Note 6 of Notes to Financial Statements. |
| (g) | Computed on an annualized basis for periods less than one year. |
| (h) | Effective July 1, 2018, the expense limit decreased to 1.53%. |
| (i) | Effective July 1, 2017, the expense limit decreased to 1.55%. |
| (j) | The variation in the Fund’s turnover rate from the year ended September 30, 2018 to the period ended December 31, 2018 was primarily due to a changes in the investment strategy and portfolio management team of the Fund. During 2019, turnover has remained elevated due to a continued repositioning of the Fund. |
See accompanying notes to financial statements.
| 68
Table of Contents
Financial Highlights (continued)
For a share outstanding throughout each period.
| Investment Grade Bond Fund—Class N | ||||||||||||||||||||||||
| Year Ended December 31, 2019 | Period Ended December 31, 2018* | Year Ended September 30, 2018 | Year Ended September 30, 2017 | Year Ended September 30, 2016 | Year Ended September 30, 2015 | |||||||||||||||||||
Net asset value, beginning of the period | $ | 10.78 | $ | 10.98 | $ | 11.30 | $ | 11.58 | $ | 11.11 | $ | 12.11 | ||||||||||||
|
|
|
|
|
|
|
|
|
|
|
| |||||||||||||
INCOME (LOSS) FROM INVESTMENT OPERATIONS: | ||||||||||||||||||||||||
Net investment income(a) | 0.38 | 0.09 | 0.34 | 0.39 | 0.43 | 0.44 | ||||||||||||||||||
Net realized and unrealized gain (loss) | 0.58 | (0.15 | ) | (0.28 | ) | 0.07 | 0.47 | (0.93 | ) | |||||||||||||||
|
|
|
|
|
|
|
|
|
|
|
| |||||||||||||
Total from Investment Operations | 0.96 | (0.06 | ) | 0.06 | 0.46 | 0.90 | (0.49 | ) | ||||||||||||||||
|
|
|
|
|
|
|
|
|
|
|
| |||||||||||||
LESS DISTRIBUTIONS FROM: | ||||||||||||||||||||||||
Net investment income | (0.40 | ) | (0.09 | ) | (0.25 | ) | (0.30 | ) | (0.28 | ) | (0.39 | ) | ||||||||||||
Net realized capital gains | (0.01 | ) | (0.05 | ) | (0.13 | ) | (0.44 | ) | (0.15 | ) | (0.12 | ) | ||||||||||||
|
|
|
|
|
|
|
|
|
|
|
| |||||||||||||
Total Distributions | (0.41 | ) | (0.14 | ) | (0.38 | ) | (0.74 | ) | (0.43 | ) | (0.51 | ) | ||||||||||||
|
|
|
|
|
|
|
|
|
|
|
| |||||||||||||
Net asset value, end of the period | $ | 11.33 | $ | 10.78 | $ | 10.98 | $ | 11.30 | $ | 11.58 | $ | 11.11 | ||||||||||||
|
|
|
|
|
|
|
|
|
|
|
| |||||||||||||
Total return | 9.11 | % | (0.58 | )%(b) | 0.50 | % | 4.34 | % | 8.31 | % | (4.28 | )% | ||||||||||||
RATIOS TO AVERAGE NET ASSETS: | ||||||||||||||||||||||||
Net assets, end of the period (000’s) | $ | 1,367,172 | $ | 1,216,690 | $ | 1,251,189 | $ | 1,203,169 | $ | 47,343 | $ | 21,851 | ||||||||||||
Net expenses | 0.47 | %(c) | 0.48 | %(d) | 0.47 | %(e) | 0.48 | %(f) | 0.47 | % | 0.47 | % | ||||||||||||
Gross expenses | 0.47 | % | 0.48 | %(d) | 0.47 | % | 0.48 | % | 0.47 | % | 0.47 | % | ||||||||||||
Net investment income | 3.40 | % | 3.40 | %(d) | 3.05 | % | 3.51 | % | 3.88 | % | 3.78 | % | ||||||||||||
Portfolio turnover rate | 44 | %(g) | 39 | %(g) | 3 | % | 10 | % | 11 | % | 23 | % | ||||||||||||
| * | For the three month period ended December 31, 2018. See Note 1 of Notes to Financial Statements. |
| (a) | Per share net investment income has been calculated using the average shares outstanding during the period. |
| (b) | Periods less than one year are not annualized. |
| (c) | Effective July 1, 2019, the expense limit decreased from 0.48% to 0.46%. See Note 6 of Notes to Financial Statements. |
| (d) | Computed on an annualized basis for periods less than one year. |
| (e) | Effective July 1, 2018, the expense limit decreased to 0.48%. |
| (f) | Effective July 1, 2017, the expense limit decreased to 0.50%. |
| (g) | The variation in the Fund’s turnover rate from the year ended September 30, 2018 to the period ended December 31, 2018 was primarily due to a changes in the investment strategy and portfolio management team of the Fund. During 2019, turnover has remained elevated due to a continued repositioning of the Fund. |
See accompanying notes to financial statements.
69 |
Table of Contents
Financial Highlights (continued)
For a share outstanding throughout each period.
| Investment Grade Bond Fund—Class Y | ||||||||||||||||||||||||
| Year Ended December 31, 2019 | Period Ended December 31, 2018* | Year Ended September 30, 2018 | Year Ended September 30, 2017 | Year Ended September 30, 2016 | Year Ended September 30, 2015 | |||||||||||||||||||
Net asset value, beginning of the period | $ | 10.78 | $ | 10.99 | $ | 11.31 | $ | 11.59 | $ | 11.11 | $ | 12.12 | ||||||||||||
|
|
|
|
|
|
|
|
|
|
|
| |||||||||||||
INCOME (LOSS) FROM INVESTMENT OPERATIONS: | ||||||||||||||||||||||||
Net investment income(a) | 0.37 | 0.09 | 0.33 | 0.39 | 0.42 | 0.43 | ||||||||||||||||||
Net realized and unrealized gain (loss) | 0.59 | (0.16 | ) | (0.28 | ) | 0.06 | 0.47 | (0.95 | ) | |||||||||||||||
|
|
|
|
|
|
|
|
|
|
|
| |||||||||||||
Total from Investment Operations | 0.96 | (0.07 | ) | 0.05 | 0.45 | 0.89 | (0.52 | ) | ||||||||||||||||
|
|
|
|
|
|
|
|
|
|
|
| |||||||||||||
LESS DISTRIBUTIONS FROM: | ||||||||||||||||||||||||
Net investment income | (0.39 | ) | (0.09 | ) | (0.24 | ) | (0.29 | ) | (0.26 | ) | (0.37 | ) | ||||||||||||
Net realized capital gains | (0.01 | ) | (0.05 | ) | (0.13 | ) | (0.44 | ) | (0.15 | ) | (0.12 | ) | ||||||||||||
|
|
|
|
|
|
|
|
|
|
|
| |||||||||||||
Total Distributions | (0.40 | ) | (0.14 | ) | (0.37 | ) | (0.73 | ) | (0.41 | ) | (0.49 | ) | ||||||||||||
|
|
|
|
|
|
|
|
|
|
|
| |||||||||||||
Net asset value, end of the period | $ | 11.34 | $ | 10.78 | $ | 10.99 | $ | 11.31 | $ | 11.59 | $ | 11.11 | ||||||||||||
|
|
|
|
|
|
|
|
|
|
|
| |||||||||||||
Total return | 9.04 | %(b) | (0.59 | )%(b)(c) | 0.43 | %(b) | 4.24 | % | 8.25 | % | (4.47 | )% | ||||||||||||
RATIOS TO AVERAGE NET ASSETS: | ||||||||||||||||||||||||
Net assets, end of the period (000’s) | $ | 3,118,505 | $ | 2,912,537 | $ | 3,001,906 | $ | 3,453,137 | $ | 4,571,167 | $ | 6,081,536 | ||||||||||||
Net expenses | 0.52 | %(d)(e) | 0.53 | %(d)(f) | 0.55 | %(d)(g) | 0.57 | %(h) | 0.60 | % | 0.58 | % | ||||||||||||
Gross expenses | 0.56 | % | 0.57 | %(f) | 0.57 | % | 0.57 | % | 0.60 | % | 0.58 | % | ||||||||||||
Net investment income | 3.35 | % | 3.35 | %(f) | 2.98 | % | 3.48 | % | 3.74 | % | 3.63 | % | ||||||||||||
Portfolio turnover rate | 44 | %(i) | 39 | %(i) | 3 | % | 10 | % | 11 | % | 23 | % | ||||||||||||
| * | For the three month period ended December 31, 2018. See Note 1 of Notes to Financial Statements. |
| (a) | Per share net investment income has been calculated using the average shares outstanding during the period. |
| (b) | Had certain expenses not been waived/reimbursed during the period, total returns would have been lower. |
| (c) | Periods less than one year are not annualized. |
| (d) | The investment adviser agreed to waive its fees and/or reimburse a portion of the Fund’s expenses during the period. Without this waiver/reimbursement, expenses would have been higher. |
| (e) | Effective July 1, 2019, the expense limit decreased from 0.53% to 0.51%. See Note 6 of Notes to Financial Statements. |
| (f) | Computed on an annualized basis for periods less than one year. |
| (g) | Effective July 1, 2018, the expense limit decreased to 0.53%. |
| (h) | Effective July 1, 2017, the expense limit decreased to 0.55%. |
| (i) | The variation in the Fund’s turnover rate from the year ended September 30, 2018 to the period ended December 31, 2018 was primarily due to a changes in the investment strategy and portfolio management team of the Fund. During 2019, turnover has remained elevated due to a continued repositioning of the Fund. |
See accompanying notes to financial statements.
| 70
Table of Contents
Financial Highlights (continued)
For a share outstanding throughout each period.
| Investment Grade Bond Fund—Admin Class | ||||||||||||||||||||||||
| Year Ended December 31, 2019 | Period Ended December 31, 2018* | Year Ended September 30, 2018 | Year Ended September 30, 2017 | Year Ended September 30, 2016 | Year Ended September 30, 2015 | |||||||||||||||||||
Net asset value, beginning of the period | $ | 10.75 | $ | 10.95 | $ | 11.28 | $ | 11.56 | $ | 11.08 | $ | 12.09 | ||||||||||||
|
|
|
|
|
|
|
|
|
|
|
| |||||||||||||
INCOME (LOSS) FROM INVESTMENT OPERATIONS: | ||||||||||||||||||||||||
Net investment income(a) | 0.32 | 0.08 | 0.28 | 0.34 | 0.37 | 0.37 | ||||||||||||||||||
Net realized and unrealized gain (loss) | 0.58 | (0.15 | ) | (0.28 | ) | 0.06 | 0.47 | (0.95 | ) | |||||||||||||||
|
|
|
|
|
|
|
|
|
|
|
| |||||||||||||
Total from Investment Operations | 0.90 | (0.07 | ) | 0.00 | (b) | 0.40 | 0.84 | (0.58 | ) | |||||||||||||||
|
|
|
|
|
|
|
|
|
|
|
| |||||||||||||
LESS DISTRIBUTIONS FROM: | ||||||||||||||||||||||||
Net investment income | (0.34 | ) | (0.08 | ) | (0.20 | ) | (0.24 | ) | (0.21 | ) | (0.31 | ) | ||||||||||||
Net realized capital gains | (0.01 | ) | (0.05 | ) | (0.13 | ) | (0.44 | ) | (0.15 | ) | (0.12 | ) | ||||||||||||
|
|
|
|
|
|
|
|
|
|
|
| |||||||||||||
Total Distributions | (0.35 | ) | (0.13 | ) | (0.33 | ) | (0.68 | ) | (0.36 | ) | (0.43 | ) | ||||||||||||
|
|
|
|
|
|
|
|
|
|
|
| |||||||||||||
Net asset value, end of the period | $ | 11.30 | $ | 10.75 | $ | 10.95 | $ | 11.28 | $ | 11.56 | $ | 11.08 | ||||||||||||
|
|
|
|
|
|
|
|
|
|
|
| |||||||||||||
Total return | 8.43 | %(c) | (0.63 | )%(c)(d) | (0.07 | )%(c) | 3.76 | %(c) | 7.73 | % | (4.95 | )% | ||||||||||||
RATIOS TO AVERAGE NET ASSETS: | ||||||||||||||||||||||||
Net assets, end of the period (000’s) | $ | 111,439 | $ | 111,864 | $ | 115,301 | $ | 25,521 | $ | 35,294 | $ | 37,355 | ||||||||||||
Net expenses | 1.02 | %(e)(f) | 1.03 | %(e)(g) | 1.02 | %(e)(h)(i) | 1.02 | %(e)(j)(k) | 1.07 | %(l) | 1.08 | % | ||||||||||||
Gross expenses | 1.06 | % | 1.07 | %(g) | 1.05 | %(h) | 1.03 | %(j) | 1.07 | %(l) | 1.08 | % | ||||||||||||
Net investment income | 2.85 | % | 2.85 | %(g) | 2.56 | % | 3.03 | % | 3.27 | % | 3.14 | % | ||||||||||||
Portfolio turnover rate | 44 | %(m) | 39 | %(m) | 3 | % | 10 | % | 11 | % | 23 | % | ||||||||||||
| * | For the three month period ended December 31, 2018. See Note 1 of Notes to Financial Statements. |
| (a) | Per share net investment income has been calculated using the average shares outstanding during the period. |
| (b) | Amount rounds to less than $0.01 per share. |
| (c) | Had certain expenses not been waived/reimbursed during the period, total returns would have been lower. |
| (d) | Periods less than one year are not annualized. |
| (e) | The investment adviser agreed to waive its fees and/or reimburse a portion of the Fund’s expenses during the period. Without this waiver/reimbursement, expenses would have been higher. |
| (f) | Effective July 1, 2019, the expense limit decreased from 1.03% to 1.01%. See Note 6 of Notes to Financial Statements. |
| (g) | Computed on an annualized basis for periods less than one year. |
| (h) | Includes refund of prior year service fee of 0.02%. |
| (i) | Effective July 1, 2018, the expense limit decreased to 1.03%. |
| (j) | Includes refund of prior year service fee of 0.05%. |
| (k) | Effective July 1, 2017, the expense limit decreased to 1.05%. |
| (l) | Includes refund of prior year service fee of 0.03%. |
| (m) | The variation in the Fund’s turnover rate from the year ended September 30, 2018 to the period ended December 31, 2018 was primarily due to a change in the investment strategy and management structure of the Fund. During 2019, turnover has remained elevated due to a continued repositioning of the Fund. |
See accompanying notes to financial statements.
71 |
Table of Contents
Financial Highlights (continued)
For a share outstanding throughout each period.
| Multi-Asset Income Fund—Class A | ||||||||||||||||||||
| Year Ended December 31, 2019 | Year Ended December 31, 2018 | Year Ended December 31, 2017 | Year Ended December 31, 2016 | Year Ended December 31, 2015 | ||||||||||||||||
Net asset value, beginning of the period | $ | 11.78 | $ | 13.87 | $ | 13.24 | $ | 12.85 | $ | 13.45 | ||||||||||
|
|
|
|
|
|
|
|
|
| |||||||||||
INCOME (LOSS) FROM INVESTMENT OPERATIONS: | ||||||||||||||||||||
Net investment income(a) | 0.42 | 0.48 | 0.47 | 0.49 | 0.32 | |||||||||||||||
Net realized and unrealized gain (loss) | 1.36 | (1.71 | ) | 1.15 | 0.80 | (0.58 | ) | |||||||||||||
|
|
|
|
|
|
|
|
|
| |||||||||||
Total from Investment Operations | 1.78 | (1.23 | ) | 1.62 | 1.29 | (0.26 | ) | |||||||||||||
|
|
|
|
|
|
|
|
|
| |||||||||||
LESS DISTRIBUTIONS FROM: | ||||||||||||||||||||
Net investment income | (0.42 | ) | (0.42 | ) | (0.45 | ) | (0.40 | ) | (0.34 | ) | ||||||||||
Net realized capital gains | — | (0.44 | ) | (0.54 | ) | (0.50 | ) | — | ||||||||||||
Paid-in capital | (0.03 | ) | — | — | — | — | ||||||||||||||
|
|
|
|
|
|
|
|
|
| |||||||||||
Total Distributions | (0.45 | ) | (0.86 | ) | (0.99 | ) | (0.90 | ) | (0.34 | ) | ||||||||||
|
|
|
|
|
|
|
|
|
| |||||||||||
Net asset value, end of the period | $ | 13.11 | $ | 11.78 | $ | 13.87 | $ | 13.24 | $ | 12.85 | ||||||||||
|
|
|
|
|
|
|
|
|
| |||||||||||
Total return(b)(c) | 15.39 | % | (9.24 | )% | 12.41 | % | 10.14 | % | (1.96 | )% | ||||||||||
RATIOS TO AVERAGE NET ASSETS: | ||||||||||||||||||||
Net assets, end of the period (000’s) | $ | 28,845 | $ | 51,028 | $ | 54,754 | $ | 57,320 | $ | 63,254 | ||||||||||
Net expenses(d) | 0.95 | % | 0.95 | % | 0.95 | % | 0.95 | % | 1.04 | %(e) | ||||||||||
Gross expenses | 1.13 | % | 1.11 | % | 1.13 | % | 1.09 | % | 1.11 | % | ||||||||||
Net investment income | 3.37 | % | 3.63 | % | 3.37 | % | 3.70 | % | 2.40 | % | ||||||||||
Portfolio turnover rate | 277 | % | 282 | % | 221 | % | 341 | %(f) | 93 | % | ||||||||||
| (a) | Per share net investment income has been calculated using the average shares outstanding during the period. |
| (b) | A sales charge for Class A shares is not reflected in total return calculations. |
| (c) | Had certain expenses not been waived/reimbursed during the period, total returns would have been lower. |
| (d) | The investment adviser agreed to waive its fees and/or reimburse a portion of the Fund’s expenses during the period. Without this waiver/reimbursement, expenses would have been higher. |
| (e) | Effective September 1, 2015, the expense limit decreased from 1.25% to 0.95%. |
| (f) | The variation in the Fund’s turnover rate from 2015 to 2016 was primarily due to a repositioning of the portfolio as well as sales of additional securities as a result of a change in investment strategy in 2015. |
See accompanying notes to financial statements.
| 72
Table of Contents
Financial Highlights (continued)
For a share outstanding throughout each period.
| Multi-Asset Income Fund—Class C | ||||||||||||||||||||
| Year Ended December 31, 2019 | Year Ended December 31, 2018 | Year Ended December 31, 2017 | Year Ended December 31, 2016 | Year Ended December 31, 2015 | ||||||||||||||||
Net asset value, beginning of the period | $ | 11.73 | $ | 13.82 | $ | 13.18 | $ | 12.80 | $ | 13.41 | ||||||||||
|
|
|
|
|
|
|
|
|
| |||||||||||
INCOME (LOSS) FROM INVESTMENT OPERATIONS: | ||||||||||||||||||||
Net investment income(a) | 0.33 | 0.38 | 0.36 | 0.39 | 0.24 | |||||||||||||||
Net realized and unrealized gain (loss) | 1.36 | (1.71 | ) | 1.16 | 0.79 | (0.60 | ) | |||||||||||||
|
|
|
|
|
|
|
|
|
| |||||||||||
Total from Investment Operations | 1.69 | (1.33 | ) | 1.52 | 1.18 | (0.36 | ) | |||||||||||||
|
|
|
|
|
|
|
|
|
| |||||||||||
LESS DISTRIBUTIONS FROM: | ||||||||||||||||||||
Net investment income | (0.34 | ) | (0.32 | ) | (0.34 | ) | (0.30 | ) | (0.25 | ) | ||||||||||
Net realized capital gains | — | (0.44 | ) | (0.54 | ) | (0.50 | ) | — | ||||||||||||
Paid-in capital | (0.02 | ) | — | — | — | — | ||||||||||||||
|
|
|
|
|
|
|
|
|
| |||||||||||
Total Distributions | (0.36 | ) | (0.76 | ) | (0.88 | ) | (0.80 | ) | (0.25 | ) | ||||||||||
|
|
|
|
|
|
|
|
|
| |||||||||||
Net asset value, end of the period | $ | 13.06 | $ | 11.73 | $ | 13.82 | $ | 13.18 | $ | 12.80 | ||||||||||
|
|
|
|
|
|
|
|
|
| |||||||||||
Total return(b)(c) | 14.59 | % | (9.96 | )% | 11.70 | % | 9.27 | % | (2.73 | )% | ||||||||||
RATIOS TO AVERAGE NET ASSETS: | ||||||||||||||||||||
Net assets, end of the period (000’s) | $ | 16,738 | $ | 24,058 | $ | 36,814 | $ | 46,351 | $ | 47,791 | ||||||||||
Net expenses(d) | 1.70 | % | 1.70 | % | 1.70 | % | 1.70 | % | 1.80 | %(e) | ||||||||||
Gross expenses | 1.88 | % | 1.86 | % | 1.88 | % | 1.84 | % | 1.87 | % | ||||||||||
Net investment income | 2.62 | % | 2.83 | % | 2.65 | % | 2.96 | % | 1.78 | % | ||||||||||
Portfolio turnover rate | 277 | % | 282 | % | 221 | % | 341 | %(f) | 93 | % | ||||||||||
| (a) | Per share net investment income has been calculated using the average shares outstanding during the period. |
| (b) | A contingent deferred sales charge for Class C shares is not reflected in total return calculations. |
| (c) | Had certain expenses not been waived/reimbursed during the period, total returns would have been lower. |
| (d) | The investment adviser agreed to waive its fees and/or reimburse a portion of the Fund’s expenses during the period. Without this waiver/reimbursement, expenses would have been higher. |
| (e) | Effective September 1, 2015, the expense limit decreased from 2.00% to 1.70%. |
| (f) | The variation in the Fund’s turnover rate from 2015 to 2016 was primarily due to a repositioning of the portfolio as well as sales of additional securities as a result of a change in investment strategy in 2015. |
See accompanying notes to financial statements.
73 |
Table of Contents
Financial Highlights (continued)
For a share outstanding throughout each period.
| Multi-Asset Income Fund—Class N | ||||||||||||||||||||
| Year Ended December 31, 2019 | Year Ended December 31, 2018 | Year Ended December 31, 2017 | Year Ended December 31, 2016 | Period Ended December 31, 2015* | ||||||||||||||||
Net asset value, beginning of the period | $ | 11.70 | $ | 13.79 | $ | 13.16 | $ | 12.77 | $ | 12.70 | ||||||||||
|
|
|
|
|
|
|
|
|
| |||||||||||
INCOME (LOSS) FROM INVESTMENT OPERATIONS: | ||||||||||||||||||||
Net investment income(a) | 0.45 | 0.52 | 0.51 | 0.53 | 0.14 | |||||||||||||||
Net realized and unrealized gain (loss) | 1.37 | (1.71 | ) | 1.15 | 0.80 | 0.10 | ||||||||||||||
|
|
|
|
|
|
|
|
|
| |||||||||||
Total from Investment Operations | 1.82 | (1.19 | ) | 1.66 | 1.33 | 0.24 | ||||||||||||||
|
|
|
|
|
|
|
|
|
| |||||||||||
LESS DISTRIBUTIONS FROM: | ||||||||||||||||||||
Net investment income | (0.46 | ) | (0.46 | ) | (0.49 | ) | (0.44 | ) | (0.17 | ) | ||||||||||
Net realized capital gains | — | (0.44 | ) | (0.54 | ) | (0.50 | ) | — | ||||||||||||
Paid-in capital | (0.03 | ) | — | — | — | — | ||||||||||||||
|
|
|
|
|
|
|
|
|
| |||||||||||
Total Distributions | (0.49 | ) | (0.90 | ) | (1.03 | ) | (0.94 | ) | (0.17 | ) | ||||||||||
|
|
|
|
|
|
|
|
|
| |||||||||||
Net asset value, end of the period | $ | 13.03 | $ | 11.70 | $ | 13.79 | $ | 13.16 | $ | 12.77 | ||||||||||
|
|
|
|
|
|
|
|
|
| |||||||||||
Total return(b) | 15.86 | % | (9.02 | )% | 12.83 | % | 10.53 | % | 1.91 | %(c) | ||||||||||
RATIOS TO AVERAGE NET ASSETS: | ||||||||||||||||||||
Net assets, end of the period (000’s) | $ | 198 | $ | 32 | $ | 35 | $ | 1 | $ | 1 | ||||||||||
Net expenses(d) | 0.65 | % | 0.65 | % | 0.65 | % | 0.65 | % | 0.65 | %(e) | ||||||||||
Gross expenses | 1.96 | % | 1.35 | % | 1.35 | % | 13.53 | % | 13.66 | %(e) | ||||||||||
Net investment income | 3.57 | % | 3.93 | % | 3.71 | % | 4.02 | % | 3.22 | %(e) | ||||||||||
Portfolio turnover rate | 277 | % | 282 | % | 221 | % | 341 | %(f) | 93 | % | ||||||||||
| * | From commencement of Class operations on August 31, 2015 through December 31, 2015. |
| (a) | Per share net investment income has been calculated using the average shares outstanding during the period. |
| (b) | Had certain expenses not been waived/reimbursed during the period, total returns would have been lower. |
| (c) | Periods less than one year are not annualized. |
| (d) | The investment adviser agreed to waive its fees and/or reimburse a portion of the Fund’s expenses during the period. Without this waiver/reimbursement, expenses would have been higher. |
| (e) | Computed on an annualized basis for periods less than one year. |
| (f) | The variation in the Fund’s turnover rate from 2015 to 2016 was primarily due to a repositioning of the portfolio as well as sales of additional securities as a result of a change in investment strategy in 2015. |
See accompanying notes to financial statements.
| 74
Table of Contents
Financial Highlights (continued)
For a share outstanding throughout each period.
| Multi-Asset Income Fund—Class Y | ||||||||||||||||||||
| Year Ended December 31, 2019 | Year Ended December 31, 2018 | Year Ended December 31, 2017 | Year Ended December 31, 2016 | Year Ended December 31, 2015 | ||||||||||||||||
Net asset value, beginning of the period | $ | 11.70 | $ | 13.80 | $ | 13.17 | $ | 12.79 | $ | 13.39 | ||||||||||
|
|
|
|
|
|
|
|
|
| |||||||||||
INCOME (LOSS) FROM INVESTMENT OPERATIONS: | ||||||||||||||||||||
Net investment income(a) | 0.45 | 0.52 | 0.49 | 0.53 | 0.36 | |||||||||||||||
Net realized and unrealized gain (loss) | 1.37 | (1.73 | ) | 1.16 | 0.78 | (0.59 | ) | |||||||||||||
|
|
|
|
|
|
|
|
|
| |||||||||||
Total from Investment Operations | 1.82 | (1.21 | ) | 1.65 | 1.31 | (0.23 | ) | |||||||||||||
|
|
|
|
|
|
|
|
|
| |||||||||||
LESS DISTRIBUTIONS FROM: | ||||||||||||||||||||
Net investment income | (0.46 | ) | (0.45 | ) | (0.48 | ) | (0.43 | ) | (0.37 | ) | ||||||||||
Net realized capital gains | — | (0.44 | ) | (0.54 | ) | (0.50 | ) | — | ||||||||||||
Paid-in capital | (0.03 | ) | — | — | — | — | ||||||||||||||
|
|
|
|
|
|
|
|
|
| |||||||||||
Total Distributions | (0.49 | ) | (0.89 | ) | (1.02 | ) | (0.93 | ) | (0.37 | ) | ||||||||||
|
|
|
|
|
|
|
|
|
| |||||||||||
Net asset value, end of the period | $ | 13.03 | $ | 11.70 | $ | 13.80 | $ | 13.17 | $ | 12.79 | ||||||||||
|
|
|
|
|
|
|
|
|
| |||||||||||
Total return(b) | 15.80 | % | (9.13 | )% | 12.77 | % | 10.38 | % | (1.72 | )% | ||||||||||
RATIOS TO AVERAGE NET ASSETS: | ||||||||||||||||||||
Net assets, end of the period (000’s) | $ | 40,659 | $ | 44,303 | $ | 52,938 | $ | 20,101 | $ | 11,272 | ||||||||||
Net expenses(c) | 0.70 | % | 0.70 | % | 0.70 | % | 0.70 | % | 0.80 | %(d) | ||||||||||
Gross expenses | 0.87 | % | 0.86 | % | 0.88 | % | 0.84 | % | 0.86 | % | ||||||||||
Net investment income | 3.62 | % | 3.88 | % | 3.53 | % | 4.00 | % | 2.73 | % | ||||||||||
Portfolio turnover rate | 277 | % | 282 | % | 221 | % | 341 | %(e) | 93 | % | ||||||||||
| (a) | Per share net investment income has been calculated using the average shares outstanding during the period. |
| (b) | Had certain expenses not been waived/reimbursed during the period, total returns would have been lower. |
| (c) | The investment adviser agreed to waive its fees and/or reimburse a portion of the Fund’s expenses during the period. Without this waiver/reimbursement, expenses would have been higher. |
| (d) | Effective September 1, 2015, the expense limit decreased from 1.00% to 0.70%. |
| (e) | The variation in the Fund’s turnover rate from 2015 to 2016 was primarily due to a repositioning of the portfolio as well as sales of additional securities as a result of a change in investment strategy in 2015. |
See accompanying notes to financial statements.
75 |
Table of Contents
December 31, 2019
1. Organization. Natixis Funds Trust I and Loomis Sayles Funds II (the “Trusts” and each a “Trust”) are each organized as a Massachusetts business trust. Each Trust is registered under the Investment Company Act of 1940, as amended (the “1940 Act”), as anopen-end management investment company. Each Declaration of Trust permits the Board of Trustees to authorize the issuance of an unlimited number of shares of the Trust in multiple series. The financial statements for certain funds of the Trusts are presented in separate reports. The following funds (individually, a “Fund” and collectively, the “Funds”) are included in this report:
Natixis Funds Trust I:
Loomis Sayles Multi-Asset Income Fund (the “Multi-Asset Income Fund”)
Loomis Sayles Funds II:
Loomis Sayles High Income Fund (the “High Income Fund”)
Loomis Sayles Investment Grade Bond Fund (the “Investment Grade Bond Fund”)
Each Fund is a diversified investment company.
On October 5, 2018, the Board of Trustees approved a change to the fiscal year end of High Income Fund and Investment Grade Bond Fund from September 30 to December 31. Accordingly, the Funds’ financial statements and related notes include information as of and for the three month period ended December 31, 2018, and the year ended September 30, 2018.
Each Fund offers Class A, Class C, Class N and Class Y shares. In addition, Investment Grade Bond Fund also offers Admin Class shares.
Class A shares are sold with a maximumfront-end sales charge of 4.25%. Class C shares do not pay afront-end sales charge, pay higher Rule12b-1 fees than Class A shares for ten years (at which point they automatically convert to Class A shares) and may be subject to a contingent deferred sales charge (“CDSC”) of 1.00% if those shares are redeemed within one year of acquisition, except for reinvested distributions. Class N and Class Y shares do not pay afront-end sales charge, a CDSC or Rule12b-1 fees. Class N shares are offered with an initial minimum investment of $1,000,000. Class Y shares are offered with an initial minimum investment of $100,000. Certain categories of investors are exempted from the minimum investment amounts for Class N and Class Y as outlined in the relevant Funds’ prospectus. Admin Class shares do not pay afront-end sales charge or a CDSC, but do pay a Rule12b-1 fee. Admin Class shares are offered exclusively through intermediaries.
Most expenses can be directly attributed to a Fund. Expenses which cannot be directly attributed to a Fund are generally apportioned based on the relative net assets of each of the funds in Natixis Funds Trust I, Natixis Funds Trust II, Natixis Funds Trust IV and Gateway Trust (“Natixis Funds Trusts”), Loomis Sayles Funds I and Loomis Sayles Funds II (“Loomis Sayles Funds Trusts”), and Natixis ETF Trust. Expenses of a Fund are
| 76
Table of Contents
Notes to Financial Statements (continued)
December 31, 2019
bornepro rata by the holders of each class of shares, except that each class bears expenses unique to that class (such as the Rule12b-1 fees applicable to Class A, Class C and Admin Class), and transfer agent fees are borne collectively for Class A, Class C, Class Y, and Admin Class and individually for Class N. In addition, each class votes as a class only with respect to its own Rule12b-1 Plan. Shares of each class would receive theirpro rata share of the net assets of the Fund if the Fund were liquidated. The Trustees approve separate distributions from net investment income on each class of shares.
2. Significant Accounting Policies. The following is a summary of significant accounting policies consistently followed by each Fund in the preparation of its financial statements. The Funds’ financial statements follow the accounting and reporting guidelines provided for investment companies and are prepared in accordance with accounting principles generally accepted in the United States of America which require the use of management estimates that affect the reported amounts and disclosures in the financial statements. Actual results could differ from those estimates. Management has evaluated the events and transactions subsequent toyear-end through the date the financial statements were issued and has determined that there were no material events that would require disclosure in the Funds’ financial statements.
a. Valuation. Fund securities and other investments are valued at market value based on market quotations obtained or determined by independent pricing services recommended by the adviser and approved by the Board of Trustees. Fund securities and other investments for which market quotations are not readily available are valued at fair value as determined in good faith by the adviser pursuant to procedures approved by the Board of Trustees, as described below. Market value is determined as follows:
Debt securities and unlisted preferred equity securities are valued based on evaluated bids furnished to the Funds by an independent pricing service or bid prices obtained from broker-dealers. Senior loans and collateralized loan obligations are valued at bid prices supplied by an independent pricing service, if available. Listed equity securities (including shares ofclosed-end investment companies and exchange-traded funds) are valued at the last sale price quoted on the exchange where they are traded most extensively or, if there is no reported sale during the day, the closing bid quotation as reported by an independent pricing service. Securities traded on the NASDAQ Global Select Market, NASDAQ Global Market and NASDAQ Capital Market are valued at the NASDAQ Official Closing Price (“NOCP”), or if lacking an NOCP, at the most recent bid quotations on the applicable NASDAQ Market. Unlisted equity securities (except unlisted preferred equity securities) are valued at the last sale price quoted in the market where they are traded most extensively or, if there is no reported sale during the day, the closing bid quotation as reported by an independent pricing service. If
77 |
Table of Contents
Notes to Financial Statements (continued)
December 31, 2019
there is no last sale price or closing bid quotation available, unlisted equity securities will be valued using evaluated bids furnished by an independent pricing service, if available. In some foreign markets, an official close price and a last sale price may be available from the foreign exchange or market. In those cases, the official close price is used. Broker-dealer bid prices may be used to value debt and unlisted equity securities and senior loans and collateralized loan obligations where an independent pricing service is unable to price a security or where an independent pricing service does not provide a reliable price for the security. Forward foreign currency contracts are valued utilizing interpolated rates determined based on information provided by an independent pricing service. Futures contracts are valued at the most recent settlement price on the exchange on which the adviser believes that, over time, they are traded most extensively.
Fund securities and other investments for which market quotations are not readily available are valued at fair value as determined in good faith by the adviser pursuant to procedures approved by the Board of Trustees. The Funds may also value securities and other investments at fair value in other circumstances such as when extraordinary events occur after the close of a foreign market but prior to the close of the New York Stock Exchange. This may include situations relating to a single issuer (such as a declaration of bankruptcy or a delisting of the issuer’s security from the primary market on which it has traded) as well as events affecting the securities markets in general (such as market disruptions or closings and significant fluctuations in U.S. and/or foreign markets). When fair valuing its securities or other investments, the Funds may, among other things, use modeling tools or other processes that may take into account factors such as securities or other market activity and/or significant events that occur after the close of the foreign market and before the time the Fund’s net asset value (“NAV”) is calculated. Fair value pricing may require subjective determinations about the value of a security, and fair values used to determine a Fund’s NAV may differ from quoted or published prices, or from prices that are used by others, for the same securities. In addition, the use of fair value pricing may not always result in adjustments to the prices of securities held by a Fund.
Illiquid securities for which market quotations are readily available and have been evaluated by the adviser are considered and classified as fair valued securities pursuant to the Funds’ pricing policies and procedures.
| 78
Table of Contents
Notes to Financial Statements (continued)
December 31, 2019
As of December 31, 2019, securities held by the Funds were fair valued as follows:
Fund | Equity | Percentage of Net Assets | Securities | Percentage of Net Assets | Securities | Percentage of Net Assets | ||||||||||||||||||
High Income Fund | $ | — | — | % | $ | 1,646,883 | 1.1 | % | $ | 1,241,739 | 0.8 | % | ||||||||||||
Investment Grade Bond Fund | — | — | % | 163,123,037 | 2.9 | %�� | — | — | % | |||||||||||||||
Multi-Asset Income Fund | 7,288,259 | 8.4 | % | 2,084,272 | 2.4 | % | — | — | % | |||||||||||||||
| 1 | Certain foreign equity securities were fair valued pursuant to procedures approved by the Board of Trustees as events occurring after the close of the foreign market were believed to materially affect the value of those securities. |
b. Investment Transactions and Related Investment Income. Investment transactions are accounted for on a trade date plus one day basis for daily NAV calculation. However, for financial reporting purposes, investment transactions are reported on trade date. Dividend income (including income reinvested) and foreign withholding tax, if applicable, is recorded on theex-dividend date, or in the case of certain foreign securities, as soon as a Fund is notified, and interest income is recorded on an accrual basis. Interest income is increased by the accretion of discount and decreased by the amortization of premium, if applicable. Distributions received from investments in securities that represent a return of capital or capital gain are recorded as a reduction of cost of investments or as a realized gain, respectively. The calendaryear-end amounts of ordinary income, capital gains, and return of capital included in distributions received from the Funds’ investments in real estate investment trusts (“REITs”) are reported to the Funds after the end of the fiscal year; accordingly, the Funds estimate these amounts for accounting purposes until the characterization of REIT distributions is reported to the Funds after the end of the fiscal year. Estimates are based on the most recent REIT distribution information available. In determining net gain or loss on securities sold, the cost of securities has been determined on an identified cost basis. Investment income,non-class specific expenses and realized and unrealized gains and losses are allocated on apro rata basis to each class based on the relative net assets of each class to the total net assets of the Fund.
c. Foreign Currency Translation. The books and records of the Funds are maintained in U.S. dollars. The values of securities, currencies and other assets and liabilities denominated in currencies other than U.S. dollars, if any, are translated into U.S. dollars based upon foreign exchange rates prevailing at the end of the period. Purchases and sales of investment securities, income and expenses are translated into U.S. dollars on the respective dates of such transactions.
Net realized foreign exchange gains or losses arise from sales of foreign currency, changes in exchange rates between the trade and settlement dates on securities transactions and the difference between the amounts of dividends, interest and foreign
79 |
Table of Contents
Notes to Financial Statements (continued)
December 31, 2019
withholding taxes recorded on the Funds’ books and the U.S. dollar equivalent of the amounts actually received or paid. Net unrealized foreign exchange gains or losses arise from changes in the value of assets and liabilities, other than investment securities, as of the end of the fiscal period, resulting from changes in exchange rates. Net realized foreign exchange gains or losses and the net change in unrealized foreign exchange gains or losses are disclosed in the Statements of Operations. For federal income tax purposes, net realized foreign exchange gains or losses are characterized as ordinary income and may, if the Funds have net losses, reduce the amount of income available to be distributed by the Funds.
The values of investment securities are presented at the foreign exchange rates prevailing at the end of the period for financial reporting purposes. Net realized and unrealized gains or losses on investments reported in the Statements of Operations reflect gains or losses resulting from changes in exchange rates and fluctuations which arise due to changes in market prices of investment securities. For federal income tax purposes, a portion of the net realized gain or loss on investments arising from changes in exchange rates, which is reflected in the Statements of Operations, may be characterized as ordinary income and may, if the Funds have net losses, reduce the amount of income available to be distributed by the Funds.
For the year ended December 31, 2019, the amount of income available to be distributed has been reduced by the following amount as a result of losses arising from changes in exchange rates:
Multi-Asset Income Fund | $ | 475,027 |
The Funds may use foreign currency exchange contracts to facilitate transactions in foreign-denominated investments. Losses may arise from changes in the value of the foreign currency or if the counterparties do not perform under the contracts’ terms.
d. Forward Foreign Currency Contracts. The Funds may enter into forward foreign currency contracts, including forward foreign cross currency contracts to acquire exposure to foreign currencies or to hedge the Funds’ investments against currency fluctuation. A contract can also be used to offset a previous contract. These contracts involve market risk in excess of the unrealized appreciation (depreciation) reflected in the Funds’ Statements of Assets and Liabilities. The U.S. dollar value of the currencies a Fund has committed to buy or sell represents the aggregate exposure to each currency a Fund has acquired or hedged through currency contracts outstanding at period end. Gains or losses are recorded for financial statement purposes as unrealized until settlement date. Contracts are tradedover-the-counter directly with a counterparty. Risks may arise upon entering into these contracts from the potential inability of counterparties to meet the terms of their contracts and from unanticipated movements in the value of a foreign currency relative to the U.S. dollar. Certain contracts may require the movement of cash and/or securities as collateral for the Funds’ or counterparty’s net obligations under the contracts.
| 80
Table of Contents
Notes to Financial Statements (continued)
December 31, 2019
e. Futures Contracts. The Funds may enter into futures contracts. Futures contracts are agreements between two parties to buy and sell a particular instrument or index for a specified price on a specified future date.
When a Fund enters into a futures contract, it is required to deposit with (or for the benefit of) its broker an amount of cash or short-term high-quality securities as “initial margin.” As the value of the contract changes, the value of the futures contract position increases or declines. Subsequent payments, known as “variation margin,” are made or received by a Fund, depending on the price fluctuations in the fair value of the contract and the value of cash or securities on deposit with the broker. The aggregate principal amounts of the contracts are not recorded in the financial statements. Daily fluctuations in the value of the contracts are recorded in the Statements of Assets and Liabilities as a receivable (payable) and in the Statements of Operations as unrealized appreciation (depreciation) until the contracts are closed, when they are recorded as realized gains (losses). Realized gain or loss on a futures position is equal to the difference between the value of the contract at the time it was opened and the value at the time it was closed, minus brokerage commissions. When a Fund enters into a futures contract certain risks may arise, such as illiquidity in the futures market, which may limit a Fund’s ability to close out a futures contract prior to settlement date, and unanticipated movements in the value of securities or interest rates.
Futures contracts are exchange-traded. Exchange-traded futures contracts are standardized and are settled through a clearing house with fulfillment supported by the credit of the exchange. Therefore, counterparty credit risks to the Funds are reduced; however, in the event that a counterparty enters into bankruptcy, a Fund’s claim against initial/variation margin on deposit with the counterparty may be subject to terms of a final settlement in bankruptcy court.
No futures contracts were held by the Funds during the year ended December 31, 2019.
f. When-Issued and Delayed Delivery Transactions. The Funds may enter into when-issued or delayed delivery transactions. When-issued refers to transactions made conditionally because a security, although authorized, has not been issued. Delayed delivery refers to transactions for which delivery or payment will occur at a later date, beyond the normal settlement period. The price of when-issued and delayed delivery securities and the date when the securities will be delivered and paid for are fixed at the time the transaction is negotiated. The security and the obligation to pay for it are recorded by the Funds at the time the commitment is entered into. The value of the security may vary with market fluctuations during the time before the Funds take delivery of the security. No interest accrues to the Funds until the transaction settles.
Delayed delivery transactions include those designated as To Be Announced (“TBAs”) in the Portfolios of Investments. For TBAs, the actual security that will be delivered to
81 |
Table of Contents
Notes to Financial Statements (continued)
December 31, 2019
fulfill the transaction is not designated at the time of the trade. The security is “to be announced” 48 hours prior to the established trade settlement date. Certain transactions require the Funds or counterparty to post cash and/or securities as collateral for the netmark-to-market exposure to the other party. The Funds cover their net obligations under outstanding delayed delivery commitments by segregating or earmarking cash or securities at the custodian.
Purchases of when-issued or delayed delivery securities may have a similar effect on the Funds’ NAV as if the Funds’ had created a degree of leverage in the portfolio. Risks may arise upon entering into such transactions from the potential inability of counterparties to meet their obligations under the transactions. Additionally, losses may arise due to changes in the value of the underlying securities.
There were no when-issued or delayed delivery securities held by the Funds as of December 31, 2019.
g. Federal and Foreign Income Taxes. The Trusts treat each Fund as a separate entity for federal income tax purposes. Each Fund intends to meet the requirements of the Internal Revenue Code of 1986, as amended, applicable to regulated investment companies, and to distribute to its shareholders substantially all of its net investment income and any net realized capital gains at least annually. Management has performed an analysis of each Fund’s tax positions for the open tax years as of December 31, 2019 and has concluded that no provisions for income tax are required. The Funds’ federal tax returns for the prior three fiscal years remain subject to examination by the Internal Revenue Service. Management is not aware of any events that are reasonably possible to occur in the next twelve months that would result in the amounts of any unrecognized tax benefits significantly increasing or decreasing for the Funds. However, management’s conclusions regarding tax positions taken may be subject to review and adjustment at a later date based on factors including, but not limited to, new tax laws and accounting regulations and interpretations thereof.
A Fund may be subject to foreign withholding taxes on investment income and taxes on capital gains on investments that are accrued and paid based upon the Fund’s understanding of the tax rules and regulations that exist in the countries in which the Fund invests. Foreign withholding taxes on dividend and interest income are reflected on the Statements of Operations as a reduction of investment income, net of amounts eligible to be reclaimed. Dividends and interest receivable on the Statements of Assets and Liabilities are net of foreign withholding taxes. Foreign withholding taxes where reclaims have been or will be filed are reflected on the Statements of Assets and Liabilities as tax reclaims receivable. Capital gains taxes paid are included in net realized gain (loss) on investments in the Statements of Operations. Accrued but unpaid capital gains taxes are reflected as foreign taxes payable on the Statements of Assets and Liabilities, if applicable, and reduce unrealized gains on investments. In the event that realized gains on investments are subsequently offset by realized losses,
| 82
Table of Contents
Notes to Financial Statements (continued)
December 31, 2019
taxes paid on realized gains may be returned to a Fund. Such amounts, if applicable, are reflected as foreign tax rebates receivable on the Statements of Assets and Liabilities and are recorded as a realized gain when received.
h. Dividends and Distributions to Shareholders. Dividends and distributions are recorded on theex-dividend date. The timing and characterization of certain income and capital gain distributions are determined in accordance with federal tax regulations, which may differ from accounting principles generally accepted in the United States of America. Permanent differences are primarily due to differing treatments for book and tax purposes of items such as contingent payment debt instruments, convertible bonds, defaulted and/ornon-income producing securities, capital gains taxes, distributions in excess of income and/or capital gain, return of capital distributions received, perpetual bond adjustments, distributionre-designations, foreign currency gains and losses, passive foreign investment company adjustments, paydown gains and losses and premium amortization. Permanent book and tax basis differences relating to shareholder distributions will result in reclassifications to capital accounts. Temporary differences between book and tax distributable earnings are primarily due to convertible bonds, defaulted and/ornon-income producing securities, deferred Trustees’ fees, premium amortization, perpetual bond adjustments and wash sales. Amounts of income and capital gain available to be distributed on a tax basis are determined annually, and at other times during the Funds’ fiscal year as may be necessary to avoid knowingly declaring and paying a return of capital distribution. Distributions from net investment income and net realized short-term capital gains are reported as distributed from ordinary income for tax purposes.
The tax characterization of distributions is determined on an annual basis. The tax character of distributions paid to shareholders during the years ended December 31, 2019 and 2018 were as follows:
| 2019 Distributions Paid From: | 2018 Distributions Paid From: | |||||||||||||||||||||||||||
Fund | Ordinary | Long-Term | Return of | Total | Ordinary | Long-Term | Total | |||||||||||||||||||||
High Income Fund | $ | 7,578,533 | $ | — | $ | — | $ | 7,578,533 | $ | 2,342,939 | $ | 469,860 | $ | 2,812,799 | ||||||||||||||
Investment Grade Bond Fund | 194,915,001 | — | — | 194,915,001 | 44,211,096 | 26,591,753 | 70,802,849 | |||||||||||||||||||||
Multi-Asset Income Fund | 3,680,842 | — | 210,988 | 3,891,830 | 6,314,655 | 2,864,723 | 9,179,378 | |||||||||||||||||||||
Distributions paid to shareholders from net investment income and net realized capital gains, based on accounting principles generally accepted in the United States of America, are consolidated and reported on the Statements of Changes in Net Assets as Distributions to Shareholders. Distributions paid to shareholders from net investment income and net realized capital gains expressed inper-share amounts, based on accounting principles generally accepted in the United States of America, are separately stated and reported within the Financial Highlights.
83 |
Table of Contents
Notes to Financial Statements (continued)
December 31, 2019
As of December 31, 2019, the components of distributable earnings on a tax basis were as follows:
High Income | Investment | Multi-Asset | ||||||||||
Undistributed ordinary income | $ | 47,010 | $ | 16,063,355 | $ | — | ||||||
Undistributed long-term capital gains | — | 16,757,612 | — | |||||||||
|
|
|
|
|
| |||||||
Total undistributed earnings | 47,010 | 32,820,967 | — | |||||||||
|
|
|
|
|
| |||||||
Capital loss carryforward: |
| |||||||||||
Short-term: |
| |||||||||||
No expiration date | (525,013 | ) | — | (1,585,026 | ) | |||||||
Long-term: |
| |||||||||||
No expiration date | (4,818,541 | ) | — | (2,918,756 | ) | |||||||
|
|
|
|
|
| |||||||
Total capital loss carryforward | (5,343,554 | ) | — | (4,503,782 | ) | |||||||
|
|
|
|
|
| |||||||
Late-year ordinary and post-October capital loss deferrals* | — | — | (7,746 | ) | ||||||||
|
|
|
|
|
| |||||||
Unrealized appreciation (depreciation) | (143,972 | ) | 312,514,263 | 3,924,968 | ||||||||
|
|
|
|
|
| |||||||
Total accumulated earnings (losses) | $ | (5,440,516 | ) | $ | 345,335,230 | $ | (586,560 | ) | ||||
|
|
|
|
|
| |||||||
| * | Under current tax law, capital losses, foreign currency losses, and losses on passive foreign investment companies and contingent payment debt instruments after October 31 or December 31, as applicable, may be deferred and treated as occurring on the first day of the following taxable year. Multi-Asset Income Fund is deferring foreign currency losses and losses on contingent payment debt instruments. |
As of December 31, 2019, the tax cost of investments (including derivatives, if applicable) and unrealized appreciation (depreciation) on a federal tax basis were as follows:
High Income | Investment | Multi-Asset | ||||||||||
Federal tax cost | $ | 145,213,373 | $ | 5,222,405,497 | $ | 82,375,380 | ||||||
|
|
|
|
|
| |||||||
Gross tax appreciation | $ | 7,355,358 | $ | 334,098,218 | $ | 4,704,011 | ||||||
Gross tax depreciation | (7,499,330 | ) | (21,584,469 | ) | (779,594 | ) | ||||||
|
|
|
|
|
| |||||||
Net tax appreciation | $ | (143,972 | ) | $ | 312,513,749 | $ | 3,924,417 | |||||
|
|
|
|
|
| |||||||
The difference between these amounts and those reported in the components of distributable earnings are primarily attributable to foreign currencymark-to-market.
| 84
Table of Contents
Notes to Financial Statements (continued)
December 31, 2019
i. Senior Loans. Each Fund may invest in senior loans to corporate, governmental or other borrowers. Senior loans, which include both secured and unsecured loans made by banks and other financial institutions to corporate customers, typically hold the most senior position in a borrower’s capital structure, may be secured by the borrower’s assets and have interest rates that reset frequently. Senior Loans can include term loans, revolving credit facility loans and second lien loans. A senior loan is often administered by a bank or other financial institution that acts as agent for all holders. The agent administers the terms of the senior loan, as specified in the loan agreement. Large loans may be shared or syndicated among several lenders. A Fund may enter into the primary syndicate for a loan or it may also purchase all or a portion of loans from other lenders (sometimes referred to as loan assignments), in either case becoming a direct lender. Senior loans outstanding at the end of the period, if any, are listed in each applicable Fund’s Portfolio of Investments.
j. Loan Participations. A Fund’s investments in senior loans may be in the form of participations in loans. When investing in a loan participation, a Fund has the right to receive payments of principal, interest and any fees to which it is entitled only from the party from whom the Fund has purchased the participation and only upon receipt by that party of payments from the borrower. A Fund generally has no right to enforce compliance by the borrower with the terms of the loan agreement or to vote on matters arising under the loan agreement. Thus, a Fund may be subject to credit risk from both the party from whom it purchased the loan participation and the borrower. Additionally, a Fund may have minimal control over the terms of any loan modification. Loan participations outstanding at the end of the period, if any, are listed in each applicable Fund’s Portfolio of Investments.
k. Collateralized Loan Obligations. Certain Funds may invest in collateralized loan obligations (“CLOs”). A CLO is a type of asset-backed security designed to redirect the cash flows from a pool of leveraged loans to investors based on their risk preferences. Cash flows from a CLO are split into two or more portions, called tranches, varying in risk and yield. The risk of an investment in a CLO depends largely on the type of the collateral securities and the class of the instrument in which a Fund invests. The intent of the Funds when investing in CLOs is to purchase only higher level, investment grade level select tranches. CLOs outstanding at the end of the period, if any, are listed in each applicable Fund’s Portfolio of Investments.
l. Repurchase Agreements. Each Fund may enter into repurchase agreements, under the terms of a Master Repurchase Agreement, under which each Fund acquires securities as collateral and agrees to resell the securities at an agreed upon time and at an agreed upon price. It is each Fund’s policy that the market value of the collateral for repurchase agreements be at least equal to 102% of the repurchase price, including interest. Certain repurchase agreements aretri-party arrangements whereby the collateral is held in a segregated account for the benefit of the Fund and on behalf of the counterparty. Repurchase agreements could involve certain risks in the event of
85 |
Table of Contents
Notes to Financial Statements (continued)
December 31, 2019
default or insolvency of the counterparty, including possible delays or restrictions upon a Fund’s ability to dispose of the underlying securities. As of December 31, 2019, each Fund, as applicable, had investments in repurchase agreements for which the value of the related collateral exceeded the value of the repurchase agreement. The gross value of repurchase agreements is included in the Statements of Assets and Liabilities for financial reporting purposes.
m. Securities Lending. The Funds have entered into an agreement with State Street Bank and Trust Company (“State Street Bank”), as agent of the Funds, to lend securities to certain designated borrowers. The loans are collateralized with cash or securities in an amount equal to at least 105% or 102% of the market value (including accrued interest) of the loaned international or domestic securities, respectively, when the loan is initiated. Thereafter, the value of the collateral must remain at least 102% of the market value (including accrued interest) of loaned securities for U.S. equities and U.S. corporate debt; at least 105% of the market value (including accrued interest) of loaned securities fornon-U.S. equities; and at least 100% of the market value (including accrued interest) of loaned securities for U.S. Government securities, sovereign debt issued bynon-U.S. Governments andnon-U.S. corporate debt. In the event that the market value of the collateral falls below the required percentages described above, the borrower will deliver additional collateral on the next business day. As with other extensions of credit, the Funds may bear the risk of loss with respect to the investment of the collateral. The Funds invest cash collateral in short-term investments, a portion of the income from which is remitted to the borrowers and the remainder allocated between the Funds and State Street Bank as lending agent.
For the year ended December 31, 2019, none of the Funds had loaned securities under this agreement.
n. Indemnifications. Under the Trusts’ organizational documents, their officers and Trustees are indemnified against certain liabilities arising out of the performance of their duties to the Funds. Additionally, in the normal course of business, the Funds enter into contracts with service providers that contain general indemnification clauses. The Funds’ maximum exposure under these arrangements is unknown as this would involve future claims that may be made against the Funds that have not yet occurred. However, based on experience, the Funds expect the risk of loss to be remote.
o. Change in Accounting Policy. The Funds have adopted Financial Accounting Standards Board (FASB) Accounting Standards Update2017-08. Under the new standard, certain debt securities withnon-contingent call features purchased at a premium are amortized to the earliest call date. In accordance with the transition provisions of the standard, the Funds applied the new standard on a modified retrospective basis beginning with the fiscal period ended December 31, 2019. This change in accounting policy resulted in reclassifications to capital accounts as of the beginning of the period, but had no impact on the net asset value of the Funds.
| 86
Table of Contents
Notes to Financial Statements (continued)
December 31, 2019
p. New Accounting Pronouncement. In August 2018, the FASB issued Accounting Standards Update2018-13, Fair Value Measurement (Topic 820): Disclosure Framework —Changes to the Disclosure Requirements for Fair Value Measurement (“ASU2018-13”). The update introduces new fair value disclosure requirements, eliminates some prior fair value disclosure requirements, and modifies certain existing fair value disclosure requirements. ASU2018-13 will be effective for fiscal years beginning after December 15, 2019, including interim periods within those fiscal years. Management has evaluated the impact of the adoption of ASU 2018-13 and will incorporate required disclosure updates in the Funds’ semiannual financial statements as of June 30, 2020.
3. Fair Value Measurements. In accordance with accounting standards related to fair value measurements and disclosures, the Funds have categorized the inputs utilized in determining the value of each Fund’s assets or liabilities. These inputs are summarized in the three broad levels listed below:
| • | Level 1 – quoted prices in active markets for identical assets or liabilities; |
| • | Level 2 – prices determined using other significant inputs that are observable either directly, or indirectly through corroboration with observable market data (which could include quoted prices for similar assets or liabilities, interest rates, credit risk, etc.); and |
| • | Level 3 – prices determined using significant unobservable inputs when quoted prices or observable inputs are unavailable such as when there is little or no market activity for an asset or liability (unobservable inputs reflect each Fund’s own assumptions in determining the fair value of assets or liabilities and would be based on the best information available). |
The inputs or methodology used for valuing securities are not necessarily an indication of the risk associated with investing in those securities.
The Funds’ pricing policies and procedures are recommended by the adviser and approved by the Board of Trustees. Debt securities are valued based on evaluated bids furnished to the Funds by an independent pricing service. Broker-dealer bid prices may be used if an independent pricing service either is unable to price a security or does not provide a reliable price for a security. Broker-dealer bid prices for which the Funds do not have knowledge of the inputs used by the broker-dealer are categorized in Level 3. All security prices, including those obtained from an independent pricing service and broker-dealer bid prices, are reviewed on a daily basis by the adviser, subject to oversight by Fund management and the Board of Trustees. If the adviser, in good faith, believes that the price provided by an independent pricing service is unreliable, broker-dealer bid prices may be used until the price provided by the independent pricing service is considered to be reliable. Reliability of all security prices, including those obtained from an independent pricing service and broker-dealer bid prices, is tested in a variety of ways, including comparison to recent transaction prices and daily fluctuations, amongst
87 |
Table of Contents
Notes to Financial Statements (continued)
December 31, 2019
other validation procedures in place. Securities for which market quotations are not readily available are valued at fair value as determined in good faith by the Funds’ adviser pursuant to procedures approved by the Board of Trustees. Fair valued securities may be categorized in Level 3.
The following is a summary of the inputs used to value the Funds’ investments as of December 31, 2019, at value:
High Income Fund
Asset Valuation Inputs
Description | Level 1 | Level 2 | Level 3 | Total | ||||||||||||
Bonds and Notes | ||||||||||||||||
Non-Convertible Bonds | ||||||||||||||||
Home Construction | $ | — | $ | 2,559,600 | $ | — | (d) | $ | 2,559,600 | |||||||
Non-Agency Commercial Mortgage-Backed Securities | — | 1,713,284 | 325,435 | (b) | 2,038,719 | |||||||||||
All OtherNon-Convertible Bonds(a) | — | 124,733,836 | — | 124,733,836 | ||||||||||||
|
|
|
|
|
|
|
| |||||||||
TotalNon-Convertible Bonds | — | 129,006,720 | 325,435 | 129,332,155 | ||||||||||||
|
|
|
|
|
|
|
| |||||||||
Convertible Bonds(a) | — | 8,474,531 | — | 8,474,531 | ||||||||||||
|
|
|
|
|
|
|
| |||||||||
Total Bonds and Notes | — | 137,481,251 | 325,435 | 137,806,686 | ||||||||||||
|
|
|
|
|
|
|
| |||||||||
Senior Loans(a) | — | 2,051,248 | — | 2,051,248 | ||||||||||||
Loan Participations(a) | — | 398,373 | — | 398,373 | ||||||||||||
Preferred Stocks | ||||||||||||||||
Food & Beverage | — | 2,201,691 | — | 2,201,691 | ||||||||||||
Midstream | — | — | 196,350 | (c) | 196,350 | |||||||||||
|
|
|
|
|
|
|
| |||||||||
Total Preferred Stocks | — | 2,201,691 | 196,350 | 2,398,041 | ||||||||||||
|
|
|
|
|
|
|
| |||||||||
Other Investments(a) | — | — | 864,000 | (b) | 864,000 | |||||||||||
Common Stocks | ||||||||||||||||
Chemicals | — | 155,257 | — | 155,257 | ||||||||||||
Media | 418,657 | — | — | 418,657 | ||||||||||||
Oil, Gas & Consumable Fuels | — | — | 52,304 | (b) | 52,304 | |||||||||||
|
|
|
|
|
|
|
| |||||||||
Total Common Stocks | 418,657 | 155,257 | 52,304 | 626,218 | ||||||||||||
|
|
|
|
|
|
|
| |||||||||
Short-Term Investments | — | 924,835 | — | 924,835 | ||||||||||||
|
|
|
|
|
|
|
| |||||||||
Total | $ | 418,657 | $ | 143,212,655 | $ | 1,438,089 | $ | 145,069,401 | ||||||||
|
|
|
|
|
|
|
| |||||||||
| (a) | Details of the major categories of the Fund’s investments are reflected within the Portfolio of Investments. |
| (b) | Fair valued by the Fund’s adviser. |
| (c) | Valued using broker-dealer bid prices. |
| (d) | Includes securities fair valued at zero by the Fund’s adviser using level 3 inputs. |
| 88
Table of Contents
Notes to Financial Statements (continued)
December 31, 2019
Investment Grade Bond Fund
Asset Valuation Inputs
Description | Level 1 | Level 2 | Level 3 | Total | ||||||||||||
Bonds and Notes | ||||||||||||||||
Non-Convertible Bonds(a) | $ | — | $ | 5,232,967,808 | $ | — | $ | 5,232,967,808 | ||||||||
Convertible Bonds(a) | — | 37,117,915 | — | 37,117,915 | ||||||||||||
Municipals(a) | — | 8,945,265 | — | 8,945,265 | ||||||||||||
|
|
|
|
|
|
|
| |||||||||
Total Bonds and Notes | — | 5,279,030,988 | — | 5,279,030,988 | ||||||||||||
|
|
|
|
|
|
|
| |||||||||
Collateralized Loan Obligations(a) | — | 113,924,322 | — | 113,924,322 | ||||||||||||
Preferred Stocks | ||||||||||||||||
Food & Beverage | — | 14,301,982 | — | 14,301,982 | ||||||||||||
Independent Energy | — | — | 721,179 | (b) | 721,179 | |||||||||||
|
|
|
|
|
|
|
| |||||||||
Total Preferred Stocks | — | 14,301,982 | 721,179 | 15,023,161 | ||||||||||||
|
|
|
|
|
|
|
| |||||||||
Short-Term Investments | — | 126,940,775 | — | 126,940,775 | ||||||||||||
|
|
|
|
|
|
|
| |||||||||
Total | $ | — | $ | 5,534,198,067 | $ | 721,179 | $ | 5,534,919,246 | ||||||||
|
|
|
|
|
|
|
| |||||||||
| (a) | Details of the major categories of the Fund’s investments are reflected within the Portfolio of Investments. |
| (b) | Valued using broker-dealer bid prices. |
89 |
Table of Contents
Notes to Financial Statements (continued)
December 31, 2019
Multi-Asset Income Fund
Asset Valuation Inputs
Description | Level 1 | Level 2 | Level 3 | Total | ||||||||||||
Common Stocks | ||||||||||||||||
Airlines | $ | 5,848 | $ | 90,294 | $ | — | $ | 96,142 | ||||||||
Auto Components | — | 283,599 | — | 283,599 | ||||||||||||
Banks | 1,968,117 | 3,633,101 | — | 5,601,218 | ||||||||||||
Beverages | 634,916 | 82,117 | — | 717,033 | ||||||||||||
Capital Markets | 1,011,739 | 88,913 | — | 1,100,652 | ||||||||||||
Commercial Services & Supplies | 304,105 | 83,847 | — | 387,952 | ||||||||||||
Construction & Engineering | �� | 55,245 | 360,197 | — | 415,442 | |||||||||||
Diversified Telecommunication Services | 867,973 | 71,874 | — | 939,847 | ||||||||||||
Electric Utilities | 742,345 | 91,310 | — | 833,655 | ||||||||||||
Food & Staples Retailing | 608,462 | 69,645 | — | 678,107 | ||||||||||||
Food Products | 526,582 | 94,562 | — | 621,144 | ||||||||||||
Household Durables | 118,696 | 10,677 | — | 129,373 | ||||||||||||
Insurance | 903,857 | 1,134,745 | — | 2,038,602 | ||||||||||||
IT Services | 1,906,962 | 50,190 | — | 1,957,152 | ||||||||||||
Leisure Products | — | 83,032 | — | 83,032 | ||||||||||||
Machinery | 676,558 | 73,676 | — | 750,234 | ||||||||||||
Marine | — | 95,189 | — | 95,189 | ||||||||||||
Multi-Utilities | 530,431 | 92,536 | — | 622,967 | ||||||||||||
Personal Products | 67,539 | 80,254 | — | 147,793 | ||||||||||||
Pharmaceuticals | 1,876,514 | 94,251 | — | 1,970,765 | ||||||||||||
Road & Rail | 392,210 | 77,844 | — | 470,054 | ||||||||||||
Semiconductors & Semiconductor Equipment | 1,252,798 | 81,720 | — | 1,334,518 | ||||||||||||
Specialty Retail | 663,660 | 88,740 | — | 752,400 | ||||||||||||
Tobacco | 489,931 | 183,045 | — | 672,976 | ||||||||||||
Trading Companies & Distributors | 64,589 | 50,271 | — | 114,860 | ||||||||||||
Transportation Infrastructure | — | 56,105 | — | 56,105 | ||||||||||||
Wireless Telecommunication Services | — | 86,525 | — | 86,525 | ||||||||||||
All Other Common Stocks(a) | 15,055,452 | — | — | 15,055,452 | ||||||||||||
|
|
|
|
|
|
|
| |||||||||
Total Common Stocks | 30,724,529 | 7,288,259 | — | 38,012,788 | ||||||||||||
|
|
|
|
|
|
|
| |||||||||
Bonds and Notes(a) | — | 33,394,852 | — | 33,394,852 | ||||||||||||
Exchange-Traded Funds | 4,374,100 | — | — | 4,374,100 | ||||||||||||
Senior Loans(a) | — | 2,084,272 | — | 2,084,272 | ||||||||||||
Preferred Stocks(a) | 606,655 | — | — | 606,655 | ||||||||||||
Short-Term Investments | — | 7,827,130 | — | 7,827,130 | ||||||||||||
|
|
|
|
|
|
|
| |||||||||
Total | $ | 35,705,284 | $ | 50,594,513 | $ | — | $ | 86,299,797 | ||||||||
|
|
|
|
|
|
|
| |||||||||
| (a) | Details of the major categories of the Fund’s investments are reflected within the Portfolio of Investments. |
| 90
Table of Contents
Notes to Financial Statements (continued)
December 31, 2019
For the year ended December 31, 2019, there were no transfers among Levels 1, 2 and 3.
The following is a reconciliation of Level 3 investments for which significant unobservable inputs were used to determine fair value as of December 31, 2019:
High Income Fund
Asset Valuation Inputs
Investments in Securities | Balance as of | Accrued | Realized (Loss) | Change in | Purchases | |||||||||||||||
Bonds and Notes | ||||||||||||||||||||
Non-Convertible Bonds | ||||||||||||||||||||
ABS Home Equity | $ | 574 | $ | — | $ | 55 | $ | 122 | $ | — | ||||||||||
Home Construction | 12 | (16,439 | ) | — | 16,427 | — | ||||||||||||||
Non-Agency Commercial Mortgage-Backed Securities | — | — | — | 9,014 | — | |||||||||||||||
Loan Participations | ||||||||||||||||||||
ABS Other | 425,679 | — | — | — | — | |||||||||||||||
Preferred Stocks | ||||||||||||||||||||
Convertible Preferred Stocks | ||||||||||||||||||||
Midstream | 58,567 | — | — | (382,196 | ) | — | ||||||||||||||
Other Investments | ||||||||||||||||||||
Aircraft ABS | 865,625 | — | — | (1,625 | ) | — | ||||||||||||||
Common Stocks | ||||||||||||||||||||
Oil, Gas & Consumable Fuels | — | — | (122 | ) | (521,755 | ) | 574,181 | |||||||||||||
|
|
|
|
|
|
|
|
|
| |||||||||||
Total | $ | 1,350,457 | $ | (16,439 | ) | $ | (67 | ) | $ | (880,013 | ) | $ | 574,181 | |||||||
|
|
|
|
|
|
|
|
|
| |||||||||||
91 |
Table of Contents
Notes to Financial Statements (continued)
December 31, 2019
High Income Fund (continued)
Asset Valuation Inputs (continued)
Investments in Securities | Sales | Transfers | Transfers | Balance as of | Change in | |||||||||||||||
Bonds and Notes | ||||||||||||||||||||
Non-Convertible Bonds | ||||||||||||||||||||
ABS Home Equity | $ | (751 | ) | $ | — | $ | — | $ | — | $ | — | |||||||||
Home Construction | — | — | — | — | (a) | — | ||||||||||||||
Non-Agency Commercial Mortgage-Backed Securities | — | 316,421 | — | 325,435 | 9,014 | |||||||||||||||
Loan Participations | ||||||||||||||||||||
ABS Other | — | — | (425,679 | ) | — | — | ||||||||||||||
Preferred Stocks | ||||||||||||||||||||
Convertible Preferred Stocks | ||||||||||||||||||||
Midstream | — | 519,979 | — | 196,350 | (382,196 | ) | ||||||||||||||
Other Investments | ||||||||||||||||||||
Aircraft ABS | — | — | — | 864,000 | (1,625 | ) | ||||||||||||||
Common Stocks | ||||||||||||||||||||
Oil, Gas & Consumable Fuels | — | — | — | 52,304 | (521,755 | ) | ||||||||||||||
|
|
|
|
|
|
|
|
|
| |||||||||||
Total | $ | (751 | ) | $ | 836,400 | $ | (425,679 | ) | $ | 1,438,089 | $ | (896,562 | ) | |||||||
|
|
|
|
|
|
|
|
|
| |||||||||||
| (a) | Includes a security fair valued at zero using level 3 inputs. |
A debt security valued at $316,421 was transferred from Level 2 to Level 3 during the period ended December 31, 2019. At December 31, 2018, this security was valued on the basis of evaluated bids furnished to the Fund by an independent pricing service in accordance with the Fund’s valuation policies. At December 31, 2019 this security was valued at fair value as determined in good faith by the Fund’s adviser as an independent pricing service did not provide a reliable price for the security.
| 92
Table of Contents
Notes to Financial Statements (continued)
December 31, 2019
A debt security valued at $425,679 was transferred from Level 3 to Level 2 during the period ended December 31, 2019. At December 31, 2018, this security was valued using broker-dealer bid prices based on inputs unobservable to the Fund as an independent pricing service was unable to price the security. At December 31, 2019, this security was valued on the basis of evaluated bids furnished to the Fund by an independent pricing service in accordance with the Fund’s valuation policies.
Preferred stocks valued at $519,979 were transferred from Level 2 to Level 3 during the period ended December 31, 2019. At December 31, 2018, these securities were valued on the basis of evaluated bids furnished to the Fund by an independent pricing service in accordance with the Fund’s valuation policies. At December 31, 2019, these securities were valued using broker-dealer bid prices based on inputs unobservable to the Fund as an independent pricing service did not provide a reliable price for the securities.
All transfers are recognized as of the beginning of the reporting period.
Investment Grade Bond Fund
Asset Valuation Inputs
Investments in Securities | Balance as of | Accrued | Realized | Change in | Purchases | |||||||||||||||
Bonds and Notes | ||||||||||||||||||||
Non-Convertible Bonds | ||||||||||||||||||||
ABS Other | $ | 57,551,934 | $ | — | $ | — | $ | — | $ | — | ||||||||||
ABS Student Loan | 4,259,110 | — | — | — | — | |||||||||||||||
Airlines | 1,202,015 | — | — | — | — | |||||||||||||||
Metals & Mining | 845 | (8,513 | ) | (1,663,073 | ) | 1,670,741 | — | |||||||||||||
Preferred Stocks | ||||||||||||||||||||
Independent Energy | — | — | (94,793 | ) | (1,325,403 | ) | — | |||||||||||||
|
|
|
|
|
|
|
|
|
| |||||||||||
Total | $ | 63,013,904 | $ | (8,513 | ) | $ | (1,757,866 | ) | $ | 345,338 | $ | — | ||||||||
|
|
|
|
|
|
|
|
|
| |||||||||||
93 |
Table of Contents
Notes to Financial Statements (continued)
December 31, 2019
Investment Grade Bond Fund (continued)
Asset Valuation Inputs (continued)
Investments in Securities | Sales | Transfers | Transfers | Balance as of | Change in | |||||||||||||||
Bonds and Notes | ||||||||||||||||||||
Non-Convertible Bonds | ||||||||||||||||||||
ABS Other | $ | — | $ | — | $ | (57,551,934 | ) | $ | — | $ | — | |||||||||
ABS Student Loan | — | — | (4,259,110 | ) | — | — | ||||||||||||||
Airlines | — | — | (1,202,015 | ) | — | — | ||||||||||||||
Metals & Mining | — | — | — | — | — | |||||||||||||||
Preferred Stocks | ||||||||||||||||||||
Independent Energy | (91,073 | ) | 2,232,448 | — | 721,179 | (1,325,403 | ) | |||||||||||||
|
|
|
|
|
|
|
|
|
| |||||||||||
Total | $ | (91,073 | ) | $ | 2,232,448 | $ | (63,013,059 | ) | $ | 721,179 | $ | (1,325,403 | ) | |||||||
|
|
|
|
|
|
|
|
|
| |||||||||||
Debt securities valued at $47,877,340 were transferred from Level 3 to Level 2 during the period ended December 31, 2019. At December 31, 2018, these securities were valued using broker-dealer bid prices based on inputs unobservable to the Fund as an independent pricing service did not provide a reliable price for the securities. At December 31, 2019 these securities were valued on the basis of evaluated bids furnished to the Fund by an independent pricing service in accordance with the Fund’s valuation policies.
Debt securities valued at $15,135,719 were transferred from Level 3 to Level 2 during the period ended December 31, 2019. At December 31, 2018, these securities were valued using broker-dealer bid prices based on inputs unobservable to the Fund as an independent pricing service was unable to price the securities. At December 31, 2019, these securities were valued on the basis of evaluated bids furnished to the Fund by an independent pricing service in accordance with the Fund’s valuation policies.
A preferred stock valued at $2,232,448 was transferred from Level 2 to Level 3 during the period ended December 31, 2019. At December 31, 2018, this security was valued on the basis of evaluated bids furnished to the Fund by an independent pricing service in accordance with the Fund’s valuation policies. At December 31, 2019, this security was valued using broker-dealer bid prices based on inputs unobservable to the Fund as an independent pricing service did not provide a reliable price for the security.
| 94
Table of Contents
Notes to Financial Statements (continued)
December 31, 2019
All transfers are recognized as of the beginning of the reporting period.
4. Derivatives. Derivative instruments are defined as financial instruments whose value and performance are based on the value and performance of an underlying asset, reference rate or index. Derivative instruments that the Funds used during the period include forward foreign currency contracts.
The Funds are subject to the risk that changes in foreign currency exchange rates will have an unfavorable effect on the value of Fund assets denominated in foreign currencies. The Funds may enter into forward foreign currency contracts for hedging purposes to protect the value of the Funds’ holdings of foreign securities. The Funds may also use forward foreign currency contracts to gain exposure to foreign currencies, regardless of whether securities denominated in such currencies are held in the Funds. During the year ended December 31, 2019, the Funds engaged in forward foreign currency transactions for hedging purposes and to gain investment exposure.
Transactions in derivative instruments for High Income Fund during the year ended December 31, 2019, as reflected within the Statements of Operations, were as follows:
Net Realized Gain (Loss) on: | Forward foreign | |||
Foreign exchange contracts | $ | (44,094 | ) | |
Net Change in Unrealized Appreciation (Depreciation) on: | Forward foreign currency contracts | |||
Foreign exchange contracts | $ | 44,094 | ||
Transactions in derivative instruments for Investment Grade Bond Fund during the year ended December 31, 2019, as reflected within the Statements of Operations, were as follows:
Net Realized Gain (Loss) on: | Forward foreign currency contracts | |||
Foreign exchange contracts | $ | (670,701 | ) | |
Net Change in Unrealized Appreciation (Depreciation) on: | Forward foreign currency contracts | |||
Foreign exchange contracts | $ | 670,701 | ||
Transactions in derivative instruments for Multi-Asset Income Fund during the year ended December 31, 2019, as reflected within the Statements of Operations, were as follows:
Net Realized Gain (Loss) on: | Forward foreign currency contracts | |||
Foreign exchange contracts | $ | (5,147 | ) | |
95 |
Table of Contents
Notes to Financial Statements (continued)
December 31, 2019
As the Funds value their derivatives at fair value and recognize changes in fair value through the Statements of Operations, they do not qualify for hedge accounting under authoritative guidance for derivative instruments. The Funds’ investments in derivatives may represent an economic hedge; however, they are considered to benon-hedge transactions for the purpose of these disclosures.
The volume of forward foreign currency contract activity, as a percentage of net assets, based on grossmonth-end notional amounts outstanding during the period, including long and short positions at absolute value, was as follows for the year ended December 31, 2019:
High Income Fund | Forwards | |||
Average Notional Amount Outstanding | 0.48 | % | ||
Highest Notional Amount Outstanding | 3.29 | % | ||
Lowest Notional Amount Outstanding | 0.00 | % | ||
Notional Amount Outstanding as of December 31, 2019 | 0.00 | % | ||
Investment Grade Bond Fund | Forwards | |||
Average Notional Amount Outstanding | 0.16 | % | ||
Highest Notional Amount Outstanding | 1.09 | % | ||
Lowest Notional Amount Outstanding | 0.00 | % | ||
Notional Amount Outstanding as of December 31, 2019 | 0.00 | % | ||
Multi-Asset Income Fund | Forwards | |||
Average Notional Amount Outstanding | 0.07 | % | ||
Highest Notional Amount Outstanding | 0.87 | % | ||
Lowest Notional Amount Outstanding | 0.00 | % | ||
Notional Amount Outstanding as of December 31, 2019 | 0.00 | % | ||
Notional amounts outstanding at the end of the prior period, if applicable, are included in the average notional amount outstanding.
5. Purchases and Sales of Securities. For the year ended December 31, 2019, purchases and sales of securities (excluding short-term investments and including paydowns) were as follows:
| U.S. Government/ Agency Securities | Other Securities | |||||||||||||||
Fund | Purchases | Sales | Purchases | Sales | ||||||||||||
High Income Fund | $ | 3,705,584 | $ | 2,989,526 | $ | 68,037,667 | $ | 63,686,186 | ||||||||
Investment Grade Bond Fund | 943,732,762 | 272,410,181 | 1,963,530,750 | 2,003,034,970 | ||||||||||||
Multi-Asset Income Fund | 43,464,668 | 44,988,414 | 243,108,075 | 287,701,022 | ||||||||||||
| 96
Table of Contents
Notes to Financial Statements (continued)
December 31, 2019
6. Management Fees and Other Transactions with Affiliates.
a. Management Fees. Loomis, Sayles & Company, L.P. (“Loomis Sayles”) serves as investment adviser to High Income Fund and Investment Grade Bond Fund. Loomis Sayles is a limited partnership whose sole general partner, Loomis, Sayles & Company, Inc., is indirectly owned by Natixis Investment Managers, LLC (“Natixis”), which is part of Natixis Investment Managers, an international asset management group based in Paris, France.
Under the terms of the management agreements, each Fund pays a management fee at the following annual rates, calculated daily and payable monthly, based on each Fund’s average daily net assets:
| Percentage of Average Daily Net Assets | ||||||||
Fund | First $15 billion | Over $15 billion | ||||||
High Income Fund | 0.60 | % | 0.60 | % | ||||
Investment Grade Bond Fund | 0.40 | % | 0.38 | % | ||||
Natixis Advisors, L.P. (“Natixis Advisors”) serves as investment adviser to Multi-Asset Income Fund. Natixis Advisors is a wholly-owned subsidiary of Natixis.
Under the terms of the management agreement, Multi-Asset Income Fund pays a management fee at the following annual rates, calculated daily and payable monthly, based on the Fund’s average daily net assets:
| Percentage of Average Daily Net Assets | ||||||||
Fund | First $1 billion | Over $1 billion | ||||||
Multi-Asset Income Fund | 0.55 | % | 0.50 | % | ||||
Natixis Advisors has entered into a subadvisory agreement for the Fund with Loomis Sayles. Under the terms of the subadvisory agreement, the Fund has agreed to pay Loomis Sayles a subadvisory fee at the following annual rates, calculated daily and payable monthly, based on the Fund’s average daily net assets:
| Percentage of Average Daily Net Assets | ||||||||||||
Fund | Subadviser | First $1 billion | Over $1 billion | |||||||||
Multi-Asset Income Fund | Loomis Sayles | 0.325 | % | 0.30 | % | |||||||
Payments to Natixis Advisors are reduced by the amounts of payments to Loomis Sayles, as calculated based on the table above.
97 |
Table of Contents
Notes to Financial Statements (continued)
December 31, 2019
Natixis Advisors and Loomis Sayles have given binding undertakings to the Funds to waive management fees and/or reimburse certain expenses to limit the Funds’ operating expenses, exclusive of acquired fund fees and expenses, brokerage expenses, interest expense, taxes, organizational and extraordinary expenses such as litigation and indemnification expenses. These undertakings are in effect until April 30, 2020 for Multi-Asset Income Fund and are in effect until April 30, 2021 for High Income Fund and Investment Grade Bond Fund, may be terminated before then only with the consent of the Funds’ Board of Trustees, and are reevaluated on an annual basis. Management fees payable, as reflected on the Statements of Assets and Liabilities, is net of waivers and/or expense reimbursements, if any, pursuant to these undertakings. Waivers/reimbursements that exceed management fees payable are reflected on the Statements of Assets and Liabilities as receivable from investment adviser.
For the year ended December 31, 2019 the expense limits as a percentage of average daily net assets under the expense limitation agreements were as follows:
| Expense Limit as a Percentage of Average Daily Net Assets | ||||||||||||||||||||
Fund | Class A | Class C | Class N | Class Y | Admin Class | |||||||||||||||
High Income Fund | 1.00 | % | 1.75 | % | 0.70 | % | 0.75 | % | — | % | ||||||||||
Investment Grade Bond Fund | 0.76 | % | 1.51 | % | 0.46 | % | 0.51 | % | 1.01 | % | ||||||||||
Multi-Asset Income Fund | 0.95 | % | 1.70 | % | 0.65 | % | 0.70 | % | — | % | ||||||||||
Prior to July 1, 2019, the expense limits as a percentage of average daily net assets under the expense limitation agreements are as follows:
| Expense Limit as a Percentage of Average Daily Net Assets | ||||||||||||||||||||
Fund | Class A | Class C | Class N | Class Y | Admin Class | |||||||||||||||
High Income Fund | 1.05 | % | 1.80 | % | 0.75 | % | 0.80 | % | — | % | ||||||||||
Investment Grade Bond Fund | 0.78 | % | 1.53 | % | 0.48 | % | 0.53 | % | 1.03 | % | ||||||||||
Natixis Advisors and Loomis Sayles shall be permitted to recover expenses borne under the expense limitation agreements (whether through waiver of management fees or otherwise) on a class by class basis in later periods to the extent the annual operating expenses of a class fall below a class’ expense limits, provided, however, that a class is not obligated to pay such waived/reimbursed fees or expenses more than one year after the end of the fiscal year in which the fees or expenses were waived/reimbursed.
| 98
Table of Contents
Notes to Financial Statements (continued)
December 31, 2019
For the year ended December 31, 2019, the management fees and waivers of management fees for each Fund were as follows:
Fund | Gross | Contractual | Net | Percentage of | ||||||||||||||||
Gross | Net | |||||||||||||||||||
High Income Fund | $ | 881,481 | $ | 222,936 | $ | 658,545 | 0.60 | % | 0.45 | % | ||||||||||
Investment Grade Bond Fund | 22,174,684 | 1,562,210 | 20,612,474 | 0.40 | % | 0.37 | % | |||||||||||||
Multi-Asset Income Fund | 595,472 | 188,849 | 406,623 | 0.55 | % | 0.38 | % | |||||||||||||
| 1 | Waiver/expense reimbursements are subject to possible recovery until December 31, 2020. |
No expenses were recovered for any of the Funds during the year ended December 31, 2019 under the terms of the expense limitation agreements.
b. Service and Distribution Fees. Natixis Distribution, L.P. (“Natixis Distribution), which is a wholly-owned subsidiary of Natixis, has entered into a distribution agreement with the Trusts. Pursuant to this agreement, Natixis Distribution serves as principal underwriter of the Funds of the Trusts.
Pursuant to Rule12b-1 under the 1940 Act, the Trusts has adopted a Service Plan relating to each Fund’s Class A shares (the “Class A Plans”), a Distribution and Service Plan relating to each Fund’s Class C shares (the “Class C Plans”), and Investment Grade Bond Fund has adopted a Distribution Plan relating to its Admin Class shares (the “Admin Class Plan”).
Under the Class A Plans, each Fund pays Natixis Distribution a monthly service fee at an annual rate not to exceed 0.25% of the average daily net assets attributable to the Fund’s Class A shares, as reimbursement for expenses incurred by Natixis Distribution in providing personal services to investors in Class A shares and/or the maintenance of shareholder accounts.
Under the Class C Plans, each Fund pays Natixis Distribution a monthly service fee at an annual rate not to exceed 0.25% of the average daily net assets attributable to the Fund’s Class C shares, as compensation for services provided by Natixis Distribution in providing personal services to investors in Class C shares and/or the maintenance of shareholder accounts.
Also under the Class C Plans, each Fund pays Natixis Distribution a monthly distribution fee at an annual rate of 0.75% of the average daily net assets attributable to the Fund’s Class C shares, as compensation for services provided by Natixis Distribution in connection with the marketing or sale of Class C shares.
99 |
Table of Contents
Notes to Financial Statements (continued)
December 31, 2019
Under the Admin Class Plan, Investment Grade Bond Fund pays Natixis Distribution a monthly distribution fee at an annual rate not to exceed 0.25% of the average daily net assets attributable to the Fund’s Admin Class shares, as compensation for services provided by Natixis Distribution in connection with the marketing or sale of Admin Class shares or for payments made by Natixis Distribution to securities dealers or other financial intermediaries as commissions, asset-based sales charges or other compensation with respect to the sale of Admin Class shares, or for providing personal services to investors and/or the maintenance of shareholder accounts.
In addition, the Admin Class shares of Investment Grade Bond Fund may pay Natixis Distribution an administrative service fee, at an annual rate not to exceed 0.25% of the average daily net assets attributable to Admin Class shares. These fees are subsequently paid to securities dealers or financial intermediaries for providing personal services and/or account maintenance for their customers who hold such shares.
For the year ended December 31, 2019, the service and distribution fees for each Fund were as follows:
| Service Fees | Distribution Fees | |||||||||||||||||||
Fund | Class A | Class C | Admin Class | Class C | Admin Class | |||||||||||||||
High Income Fund | $ | 57,435 | $ | 11,672 | $ | — | $ | 35,016 | $ | — | ||||||||||
Investment Grade Bond Fund | 1,889,585 | 692,224 | 288,773 | 2,076,670 | 288,773 | |||||||||||||||
Multi-Asset Income Fund | 100,831 | 53,347 | — | 160,042 | — | |||||||||||||||
c. Administrative Fees. Natixis Advisors provides certain administrative services for the Funds and contracts with State Street Bank to serve assub-administrator. Pursuant to an agreement among Natixis Funds Trusts, Loomis Sayles Funds Trusts, Natixis ETF Trust and Natixis Advisors, effective July 1, 2019, each Fund pays Natixis Advisors monthly itspro rataportion of fees equal to an annual rate of 0.0540% of the first $15 billion of the average daily net assets of the Natixis Funds Trusts, Loomis Sayles Funds Trusts and Natixis ETF Trust, 0.0500% of the next $15 billion, 0.0400% of the next $30 billion, 0.0275% of the next $30 billion and 0.0225% of such assets in excess of $90 billion, subject to an annual aggregate minimum fee for the Natixis Funds Trusts, Loomis Sayles Funds Trusts and Natixis ETF Trust of $10 million, which is reevaluated on an annual basis.
Prior to July 1, 2019, each Fund paid Natixis Advisors monthly itspro rataportion of fees equal to an annual rate of 0.0575% of the first $15 billion of the average daily net assets of the Natixis Funds Trusts, Loomis Sayles Funds Trusts and Natixis ETF Trust, 0.0500% of the next $15 billion, 0.0400% of the next $30 billion, 0.0275% of the next
| 100
Table of Contents
Notes to Financial Statements (continued)
December 31, 2019
$30 billion and 0.0225% of such assets in excess of $90 billion, subject to an annual aggregate minimum fee for the Natixis Funds Trusts, Loomis Sayles Funds Trusts and Natixis ETF Trust of $10 million.
Effective October 1, 2018, State Street Bank agreed to reduce the fees it receives from Natixis Advisors for serving assub-administrator to the Funds. Also, effective October 1, 2018, Natixis Advisors agreed to voluntarily waive fees paid by the Funds in an amount equal to the reduction insub-administrative fees discussed above. The waiver was in effect through June 30, 2019.
For the year ended December 31, 2019, the administrative fees for each Fund were as follows:
Fund | Gross | Waiver of | Net | |||||||||
High Income Fund | $ | 64,514 | $ | 763 | $ | 63,751 | ||||||
Investment Grade Bond Fund | 2,440,159 | 28,768 | 2,411,391 | |||||||||
Multi-Asset Income Fund | 47,707 | 600 | 47,107 | |||||||||
d. Sub-Transfer Agent Fees. Natixis Distribution has entered into agreements, which include servicing agreements, with financial intermediaries that provide recordkeeping, processing, shareholder communications and other services to customers of the intermediaries that hold positions in the Funds and has agreed to compensate the intermediaries for providing those services. Intermediaries transact with the Funds primarily through the use of omnibus accounts on behalf of their customers who hold positions in the Funds. These services would have been provided by the Funds’ transfer agent and other service providers if the shareholders’ accounts were maintained directly at the Funds’ transfer agent. Accordingly, the Funds have agreed to reimburse Natixis Distribution for all or a portion of the servicing fees paid to these intermediaries. The reimbursement amounts(sub-transfer agent fees) paid to Natixis Distribution are subject to a currentper-account equivalent fee limit approved by the Funds’ Board of Trustees, which is based on fees for similar services paid to the Funds’ transfer agent and other service providers. Class N shares do not bear such expenses.
For the year ended December 31, 2019, thesub-transfer agent fees (which are reflected in transfer agent fees and expenses in the Statements of Operations) for each Fund were as follows:
Fund | Sub-Transfer | |||
High Income Fund | $ | 139,162 | ||
Investment Grade Bond Fund | 3,460,985 | |||
Multi-Asset Income Fund | 60,028 | |||
101 |
Table of Contents
Notes to Financial Statements (continued)
December 31, 2019
As of December 31, 2019, the Funds owe Natixis Distribution the following reimbursements forsub-transfer agent fees (which are reflected in the Statements of Assets and Liabilities as payable to distributor):
Fund | Reimbursements | |||
High Income Fund | $ | 1,772 | ||
Investment Grade Bond Fund | 41,954 | |||
Multi-Asset Income Fund | 583 | |||
Sub-transfer agent fees attributable to Class A, Class C, Class Y and Admin Class are allocated on apro rata basis to each class based on the relative net assets of each class to the total net assets of those classes.
e. Commissions. Commissions (including CDSCs) on Fund shares retained by Natixis Distribution during the year ended December 31, 2019 were as follows:
Fund | Commissions | |||
High Income Fund | $ | 2,107 | ||
Investment Grade Bond Fund | 33,030 | |||
Multi-Asset Income Fund | 6,160 | |||
f. Trustees Fees and Expenses. The Trusts do not pay any compensation directly to their officers or Trustees who are directors, officers or employees of Natixis Advisors, Natixis Distribution, Natixis or their affiliates. The Chairperson of the Board of Trustees receives a retainer fee at the annual rate of $360,000. The Chairperson does not receive any meeting attendance fees for Board of Trustees meetings or committee meetings that he attends. Each Independent Trustee (other than the Chairperson) receives, in the aggregate, a retainer fee at the annual rate of $190,000. Each Independent Trustee also receives a meeting attendance fee of $10,000 for each meeting of the Board of Trustees that he or she attends in person and $5,000 for each meeting of the Board of Trustees that he or she attends telephonically. In addition, the chairperson of the Contract Review Committee and the chairperson of the Audit Committee each receive an additional retainer fee at the annual rate of $20,000. The chairperson of the Governance Committee receives an additional retainer fee at the annual rate of $15,000. Each Contract Review Committee member is compensated $6,000 for each Committee meeting that he or she attends in person and $3,000 for each meeting that he or she attends telephonically. Each Audit Committee member is compensated $6,000 for each Committee meeting that he or she attends in person and $3,000 for each meeting that he or she attends telephonically. These fees are allocated among the funds in the Natixis Funds Trusts, Loomis Sayles Funds Trusts and Natixis ETF Trust based on a formula that takes into account, among other factors, the relative net assets of each fund. Trustees are reimbursed for travel expenses in connection with attendance at meetings.
| 102
Table of Contents
Notes to Financial Statements (continued)
December 31, 2019
Effective January 1, 2020, the Chairperson of the Board will receive a retainer fee at the annual rate of $369,000, each Independent Trustee (other than the Chairperson) will receive, in the aggregate, a retainer fee at the annual rate of $199,000, and the chairperson of the Governance Committee will receive an additional retainer fee at the annual rate of $20,000. All other Trustee fees will remain unchanged.
A deferred compensation plan (the “Plan”) is available to the Trustees on a voluntary basis. Deferred amounts remain in the Funds until distributed in accordance with the provisions of the Plan. The value of a participating Trustee’s deferral account is based on theoretical investments of deferred amounts, on the normal payment dates, in certain funds of the Natixis Funds Trusts, Loomis Sayles Funds Trusts and Natixis ETF Trust as designated by the participating Trustees. Changes in the value of participants’ deferral accounts are allocatedpro rata among the funds in the Natixis Funds Trusts, Loomis Sayles Funds Trusts and Natixis ETF Trust, and are normally reflected as Trustees’ fees and expenses in the Statements of Operations. The portions of the accrued obligations allocated to the Funds under the Plan are reflected as Deferred Trustees’ fees in the Statements of Assets and Liabilities.
Certain officers and employees of Natixis Advisors and Loomis Sayles are also officers and/or Trustees of the Trusts.
g. Affiliated Ownership. As of December 31, 2019, Loomis Sayles Employees’ Profit Sharing Retirement Plan held shares of Investment Grade Bond Fund and Multi-Asset Income Fund representing 0.11% and 0.53%, respectively, of the Funds’ net assets.
Investment activities of affiliated shareholders could have material impacts on the Funds.
h. Reimbursement of Transfer Agent Fees and Expenses. Natixis Advisors has given a binding contractual undertaking to the High Income Fund and Multi-Asset Income Fund to reimburse any and all transfer agency expenses for the Funds’ Class N shares. This undertaking is in effect through April 30, 2020 and is not subject to recovery under the expense limitation agreement described above.
For the year ended December 31, 2019, Natixis Advisors reimbursed the Funds for transfer agency expenses as follows:
| Reimbursement of Transfer Agent Fees and Expenses | ||||
Fund | Class N | |||
High Income Fund | $ | 834 | ||
Multi-Asset Income Fund | 835 | |||
103 |
Table of Contents
Notes to Financial Statements (continued)
December 31, 2019
7. Class-Specific Transfer Agent Fees and Expenses. Transfer agent fees and expenses attributable to Class A, Class C, Class Y and Admin Class are allocated on apro rata basis to each class based on the relative net assets of each class to the total net assets of those classes. Transfer agent fees and expenses attributable to Class N are allocated to Class N.
For the year ended December 31, 2019, the Funds incurred the following class-specific transfer agent fees and expenses (includingsub-transfer agent fees, where applicable):
| Transfer Agent Fees and Expenses | ||||||||||||||||||||
Fund | Class A | Class C | Class N | Class Y | Admin Class | |||||||||||||||
High Income Fund | $ | 27,380 | $ | 5,602 | $ | 834 | $ | 127,381 | $ | — | ||||||||||
Investment Grade Bond Fund | 653,750 | 240,470 | 5,494 | 2,673,316 | 99,963 | |||||||||||||||
Multi-Asset Income Fund | 28,559 | 14,801 | 835 | 31,598 | — | |||||||||||||||
8. Line of Credit. Each Fund, together with certain other funds of Natixis Funds Trusts, Loomis Sayles Funds Trusts and Natixis ETF Trust, entered into a $400,000,000 committed unsecured line of credit provided by State Street Bank. Any one Fund may borrow up to $350,000,000 under the line of credit agreement (as long as all borrowings by all Funds in the aggregate do not exceed the $400,000,000 limit at any time), subject to each Fund’s investment restrictions and its contractual obligations under the line of credit. Interest is charged to the Funds based upon the terms set forth in the agreement. In addition, a commitment fee of 0.15% per annum, payable at the end of each calendar quarter, is accrued and apportioned among the participating funds based on their average daily unused portion of the line of credit. The Funds paid an arrangement fee, an upfront fee, and certain other legal fees in connection with the line of credit agreement, which are being amortized over a period of 364 days and are reflected in legal fees and/or miscellaneous expenses on the Statements of Operations. The unamortized balance is reflected as prepaid expenses on the Statements of Assets and Liabilities.
For the year ended December 31, 2019, none of the Funds had borrowings under this agreement.
9. Concentration of Risk. Each Fund’s investments in foreign securities may be subject to greater political, economic, environmental, credit/counterparty and information risks. The Fund’s investments in foreign securities also are subject to foreign currency fluctuations and other foreign currency-related risks. Foreign securities may be subject to higher volatility than U.S. securities, varying degrees of regulation and limited liquidity.
10. Concentration of Ownership. From time to time, a Fund may have a concentration of one or more accounts constituting a significant percentage of shares outstanding.
| 104
Table of Contents
Notes to Financial Statements (continued)
December 31, 2019
Investment activities by holders of such accounts could have material impacts on the Funds. As of December 31, 2019, based on management’s evaluation of the shareholder account base, the Funds had accounts representing controlling ownership of more than 5% of the Fund’s total outstanding shares. The number of such accounts, based on accounts that represent more than 5% of an individual class of shares, and the aggregate percentage of net assets represented by such holdings were as follows:
Fund | Number of 5% | Percentage of | ||||||
High Income Fund | 2 | 13.46 | % | |||||
Investment Grade Bond Fund | 1 | 19.51 | % | |||||
Multi-Asset Income Fund | 1 | 12.54 | % | |||||
Omnibus shareholder accounts for which Natixis Advisors understands that the intermediary has discretion over the underlying shareholder accounts or investment models where a shareholder account may be invested for anon-discretionary customer are included in the table above. For other omnibus accounts, the Fund does not have information on the individual shareholder accounts underlying the omnibus accounts; therefore, there could be other 5% shareholders in addition to those disclosed in the table above.
105 |
Table of Contents
Notes to Financial Statements (continued)
December 31, 2019
11. Capital Shares. Each Fund may issue an unlimited number of shares of beneficial interest, without par value. Transactions in capital shares were as follows:
| | Year Ended December 31, 2019 | | Period Ended December 31, 2018(a) | |||||||||||||
High Income Fund | Shares | Amount | Shares | Amount | ||||||||||||
| Class A |
| |||||||||||||||
Issued from the sale of shares | 1,181,562 | $ | 4,961,757 | 318,942 | $ | 1,321,333 | ||||||||||
Issued in connection with the reinvestment of distributions | 224,427 | 943,693 | 84,926 | 349,137 | ||||||||||||
Redeemed | (1,744,701 | ) | (7,332,092 | ) | (764,361 | ) | (3,151,340 | ) | ||||||||
|
|
|
|
|
|
|
| |||||||||
Net change | (338,712 | ) | $ | (1,426,642 | ) | (360,493 | ) | $ | (1,480,870 | ) | ||||||
|
|
|
|
|
|
|
| |||||||||
| Class C |
| |||||||||||||||
Issued from the sale of shares | 104,622 | $ | 442,064 | 42,068 | $ | 171,916 | ||||||||||
Issued in connection with the reinvestment of distributions | 40,123 | 169,298 | 16,483 | 68,043 | ||||||||||||
Redeemed | (582,159 | ) | (2,454,372 | ) | (186,823 | ) | (777,538 | ) | ||||||||
|
|
|
|
|
|
|
| |||||||||
Net change | (437,414 | ) | $ | (1,843,010 | ) | (128,272 | ) | $ | (537,579 | ) | ||||||
|
|
|
|
|
|
|
| |||||||||
| Class N |
| |||||||||||||||
Issued from the sale of shares | 347,075 | $ | 1,464,639 | 169,687 | $ | 691,887 | ||||||||||
Issued in connection with the reinvestment of distributions | 144,891 | 609,528 | 43,495 | 178,710 | ||||||||||||
Redeemed | (290,834 | ) | (1,225,972 | ) | (33,788 | ) | (139,949 | ) | ||||||||
|
|
|
|
|
|
|
| |||||||||
Net change | 201,132 | $ | 848,195 | 179,394 | $ | 730,648 | ||||||||||
|
|
|
|
|
|
|
| |||||||||
| Class Y |
| |||||||||||||||
Issued from the sale of shares | 5,715,875 | $ | 23,998,846 | 2,504,282 | $ | 10,312,064 | ||||||||||
Issued in connection with the reinvestment of distributions | 1,050,566 | 4,412,148 | 433,237 | 1,776,880 | ||||||||||||
Redeemed | (5,779,231 | ) | (24,250,953 | ) | (8,528,009 | ) | (34,312,719 | ) | ||||||||
|
|
|
|
|
|
|
| |||||||||
Net change | 987,210 | $ | 4,160,041 | (5,590,490 | ) | $ | (22,223,775 | ) | ||||||||
|
|
|
|
|
|
|
| |||||||||
Increase (decrease) from capital share transactions | 412,216 | $ | 1,738,584 | (5,899,861 | ) | $ | (23,511,576 | ) | ||||||||
|
|
|
|
|
|
|
| |||||||||
| (a) | For the period October 1, 2018 through December 31, 2018. |
| 106
Table of Contents
Notes to Financial Statements (continued)
December 31, 2019
11. Capital Shares (continued).
| | Year Ended September 30, 2018 | |||||||
High Income Fund | Shares | Amount | ||||||
| Class A |
| |||||||
Issued from the sale of shares | 1,898,245 | $ | 8,166,854 | |||||
Issued in connection with the reinvestment of distributions | 243,140 | 1,040,786 | ||||||
Redeemed | (3,771,177 | ) | (16,210,208 | ) | ||||
|
|
|
| |||||
Net change | (1,629,792 | ) | $ | (7,002,568 | ) | |||
|
|
|
| |||||
| Class C |
| |||||||
Issued from the sale of shares | 122,450 | $ | 527,966 | |||||
Issued in connection with the reinvestment of distributions | 61,116 | 262,711 | ||||||
Redeemed | (1,279,539 | ) | (5,486,771 | ) | ||||
|
|
|
| |||||
Net change | (1,095,973 | ) | $ | (4,696,094 | ) | |||
|
|
|
| |||||
| Class N |
| |||||||
Issued from the sale of shares | 2,698,050 | $ | 11,518,120 | |||||
Issued in connection with the reinvestment of distributions | 61,394 | 259,688 | ||||||
Redeemed | (325,438 | ) | (1,383,775 | ) | ||||
|
|
|
| |||||
Net change | 2,434,006 | $ | 10,394,033 | |||||
|
|
|
| |||||
| Class Y |
| |||||||
Issued from the sale of shares | 9,865,696 | $ | 42,237,402 | |||||
Issued in connection with the reinvestment of distributions | 1,120,509 | 4,782,844 | ||||||
Redeemed | (11,587,593 | ) | (49,564,049 | ) | ||||
|
|
|
| |||||
Net change | (601,388 | ) | $ | (2,543,803 | ) | |||
|
|
|
| |||||
Increase (decrease) from capital share transactions | (893,147 | ) | $ | (3,848,432 | ) | |||
|
|
|
| |||||
107 |
Table of Contents
Notes to Financial Statements (continued)
December 31, 2019
11. Capital Shares (continued).
| | Year Ended December 31, 2019 | | Period Ended December 31, 2018(a) | |||||||||||||
Investment Grade Bond Fund | Shares | Amount | Shares | Amount | ||||||||||||
| Class A |
| |||||||||||||||
Issued from the sale of shares | 21,746,077 | $ | 242,390,732 | 6,491,737 | $ | 70,239,572 | ||||||||||
Issued in connection with the reinvestment of distributions | 1,759,350 | 19,703,186 | 692,485 | 7,466,489 | ||||||||||||
Redeemed | (22,252,474 | ) | (248,006,281 | ) | (11,048,598 | ) | (119,531,449 | ) | ||||||||
|
|
|
|
|
|
|
| |||||||||
Net change | 1,252,953 | $ | 14,087,637 | (3,864,376 | ) | $ | (41,825,388 | ) | ||||||||
|
|
|
|
|
|
|
| |||||||||
| Class C |
| |||||||||||||||
Issued from the sale of shares | 1,602,835 | $ | 17,702,080 | 945,273 | $ | 10,091,858 | ||||||||||
Issued in connection with the reinvestment of distributions | 469,346 | 5,182,790 | 284,418 | 3,032,080 | ||||||||||||
Redeemed | (18,184,031 | ) | (200,209,503 | ) | (4,883,774 | ) | (52,357,128 | ) | ||||||||
|
|
|
|
|
|
|
| |||||||||
Net change | (16,111,850 | ) | $ | (177,324,633 | ) | (3,654,083 | ) | $ | (39,233,190 | ) | ||||||
|
|
|
|
|
|
|
| |||||||||
| Class N |
| |||||||||||||||
Issued from the sale of shares | 30,937,052 | $ | 345,100,891 | 7,202,004 | $ | 78,146,326 | ||||||||||
Issued in connection with the reinvestment of distributions | 4,168,997 | 46,698,958 | 1,542,978 | 16,637,378 | ||||||||||||
Redeemed | (27,365,168 | ) | (305,705,875 | ) | (9,753,310 | ) | (105,566,599 | ) | ||||||||
|
|
|
|
|
|
|
| |||||||||
Net change | 7,740,881 | $ | 86,093,974 | (1,008,328 | ) | $ | (10,782,895 | ) | ||||||||
|
|
|
|
|
|
|
| |||||||||
| Class Y |
| |||||||||||||||
Issued from the sale of shares | 75,690,305 | $ | 842,848,095 | 26,286,587 | $ | 284,802,649 | ||||||||||
Issued in connection with the reinvestment of distributions | 8,703,543 | 97,536,256 | 3,150,471 | 33,984,081 | ||||||||||||
Redeemed | (79,477,156 | ) | (888,490,131 | ) | (32,471,159 | ) | (351,840,854 | ) | ||||||||
|
|
|
|
|
|
|
| |||||||||
Net change | 4,916,692 | $ | 51,894,220 | (3,034,101 | ) | $ | (33,054,124 | ) | ||||||||
|
|
|
|
|
|
|
| |||||||||
| Admin Class |
| |||||||||||||||
Issued from the sale of shares | 1,693,129 | $ | 18,816,328 | 286,732 | $ | 3,102,815 | ||||||||||
Issued in connection with the reinvestment of distributions | 297,880 | 3,326,874 | 117,845 | 1,266,981 | ||||||||||||
Redeemed | (2,538,140 | ) | (28,454,222 | ) | (521,944 | ) | (5,641,958 | ) | ||||||||
|
|
|
|
|
|
|
| |||||||||
Net change | (547,131 | ) | $ | (6,311,020 | ) | (117,367 | ) | $ | (1,272,162 | ) | ||||||
|
|
|
|
|
|
|
| |||||||||
Decrease from capital share transactions | (2,748,455 | ) | $ | (31,559,822 | ) | (11,678,255 | ) | $ | (126,167,759 | ) | ||||||
|
|
|
|
|
|
|
| |||||||||
| (a) | For the period October 1, 2018 through December 31, 2018. |
| 108
Table of Contents
Notes to Financial Statements (continued)
December 31, 2019
11. Capital Shares (continued).
| | Year Ended September 30, 2018 | |||||||
Investment Grade Bond Fund | Shares | Amount | ||||||
| Class A |
| |||||||
Issued from the sale of shares | 26,350,729 | $ | 290,166,021 | |||||
Issued in connection with the reinvestment of distributions | 1,939,385 | 21,405,938 | ||||||
Redeemed | (37,379,900 | ) | (411,498,034 | ) | ||||
|
|
|
| |||||
Net change | (9,089,786 | ) | $ | (99,926,075 | ) | |||
|
|
|
| |||||
| Class C |
| |||||||
Issued from the sale of shares | 2,011,124 | $ | 22,000,351 | |||||
Issued in connection with the reinvestment of distributions | 1,080,461 | 11,807,321 | ||||||
Redeemed | (26,695,866 | ) | (290,792,159 | ) | ||||
|
|
|
| |||||
Net change | (23,604,281 | ) | $ | (256,984,487 | ) | |||
|
|
|
| |||||
| Class N |
| |||||||
Issued from the sale of shares | 47,337,549 | $ | 520,862,751 | |||||
Issued in connection with the reinvestment of distributions | 3,799,061 | 41,897,623 | ||||||
Redeemed | (43,651,422 | ) | (478,691,782 | ) | ||||
|
|
|
| |||||
Net change | 7,485,188 | $ | 84,068,592 | |||||
|
|
|
| |||||
| Class Y |
| |||||||
Issued from the sale of shares | 83,609,222 | $ | 923,226,055 | |||||
Issued in connection with the reinvestment of distributions | 8,916,183 | 98,436,771 | ||||||
Redeemed | (124,671,025 | ) | (1,373,103,002 | ) | ||||
|
|
|
| |||||
Net change | (32,145,620 | ) | $ | (351,440,176 | ) | |||
|
|
|
| |||||
| Admin Class |
| |||||||
Issued from the sale of shares | 9,244,822 | $ | 100,929,159 | |||||
Issued in connection with the reinvestment of distributions | 37,178 | 408,621 | ||||||
Redeemed | (1,018,175 | ) | (11,215,394 | ) | ||||
|
|
|
| |||||
Net change | 8,263,825 | $ | 90,122,386 | |||||
|
|
|
| |||||
Increase (decrease) from capital share transactions | (49,090,674 | ) | $ | (534,159,760 | ) | |||
|
|
|
| |||||
109 |
Table of Contents
Notes to Financial Statements (continued)
December 31, 2019
11. Capital Shares (continued).
| | Year Ended December 31, 2019 | | Year Ended December 31, 2018 | |||||||||||||
Multi-Asset Income Fund | Shares | Amount | Shares | Amount | ||||||||||||
| Class A |
| |||||||||||||||
Issued from the sale of shares | 443,182 | $ | 5,566,407 | 1,636,199 | $ | 21,887,217 | ||||||||||
Issued in connection with the reinvestment of distributions | 97,878 | 1,223,830 | 246,032 | 3,167,673 | ||||||||||||
Redeemed | (2,674,820 | ) | (33,490,367 | ) | (1,495,395 | ) | (19,584,653 | ) | ||||||||
|
|
|
|
|
|
|
| |||||||||
Net change | (2,133,760 | ) | $ | (26,700,130 | ) | 386,836 | $ | 5,470,237 | ||||||||
|
|
|
|
|
|
|
| |||||||||
| Class C |
| |||||||||||||||
Issued from the sale of shares | 126,997 | $ | 1,590,185 | 610,774 | $ | 8,033,966 | ||||||||||
Issued in connection with the reinvestment of distributions | 34,171 | 425,455 | 102,629 | 1,321,750 | ||||||||||||
Redeemed | (930,886 | ) | (11,679,177 | ) | (1,326,399 | ) | (17,492,118 | ) | ||||||||
|
|
|
|
|
|
|
| |||||||||
Net change | (769,718 | ) | $ | (9,663,537 | ) | (612,996 | ) | $ | (8,136,402 | ) | ||||||
|
|
|
|
|
|
|
| |||||||||
| Class N |
| |||||||||||||||
Issued from the sale of shares | 12,277 | $ | 154,650 | — | $ | — | ||||||||||
Issued in connection with the reinvestment of distributions | 196 | 2,469 | 184 | 2,352 | ||||||||||||
Redeemed | (1 | ) | (12 | ) | — | — | ||||||||||
|
|
|
|
|
|
|
| |||||||||
Net change | 12,472 | $ | 157,107 | 184 | $ | 2,352 | ||||||||||
|
|
|
|
|
|
|
| |||||||||
| Class Y |
| |||||||||||||||
Issued from the sale of shares | 1,737,754 | $ | 21,459,332 | 1,950,280 | $ | 25,895,828 | ||||||||||
Issued in connection with the reinvestment of distributions | 106,224 | 1,325,157 | 213,365 | 2,746,556 | ||||||||||||
Redeemed | (2,509,023 | ) | (31,504,338 | ) | (2,215,349 | ) | (28,814,661 | ) | ||||||||
|
|
|
|
|
|
|
| |||||||||
Net change | (665,045 | ) | $ | (8,719,849 | ) | (51,704 | ) | $ | (172,277 | ) | ||||||
|
|
|
|
|
|
|
| |||||||||
Decrease from capital share transactions | (3,556,051 | ) | $ | (44,926,409 | ) | (277,680 | ) | $ | (2,836,090 | ) | ||||||
|
|
|
|
|
|
|
| |||||||||
12. Subsequent Event. On December 4, 2019, the Board of Trustees approved a plan to liquidate the Multi-Asset Income Fund. Such liquidation took place on February 3, 2020.
| 110
Table of Contents
Report of Independent Registered Public
Accounting Firm
To the Board of Trustees of Natixis Funds Trust I and Loomis Sayles Funds II and Shareholders of Sayles High Income Fund, Loomis Sayles Investment Grade Bond Fund and Loomis Sayles Multi-Asset Income Fund
Opinions on the Financial Statements
We have audited the accompanying statements of assets and liabilities, including the portfolios of investments, of Loomis Sayles High Income Fund and Loomis Sayles Investment Grade Bond Fund (two of the funds constituting Loomis Sayles Funds II), and Loomis Sayles Multi-Asset Income Fund (one of the funds constituting Natixis Funds Trust I) (hereafter collectively referred to as the “Funds”) as of December 31, 2019, the related statements of operations and of changes in net assets for each of the periods indicated therein, including the related notes, and the financial highlights for each of the periods indicated in the table below (collectively referred to as the “financial statements”). In our opinion, the financial statements present fairly, in all material respects, the financial position of each of the Funds as of December 31, 2019, the results of each of their operations, the changes in each of their net assets, and each of the financial highlights for each of the periods therein, in conformity with accounting principles generally accepted in the United States of America.
| Fund | Statement of operations | Statement of changes in net assets | ||
Loomis Sayles High Income Fund Loomis Sayles Investment Grade Bond Fund | For the year ended December 31, 2019 | For the year ended December 31, 2019, period October 1, 2018 through December 31, 2018, and year ended September 31, 2018 | ||
Loomis Sayles Multi-Asset Income Fund | For the year ended December 31, 2019 | For the two years ended December 31, 2019 |
Basis for Opinions
These financial statements are the responsibility of the Funds’ management. Our responsibility is to express an opinion on the Funds’ financial statements based on our audits. We are a public accounting firm registered with the Public Company Accounting Oversight Board (United States) (PCAOB) and are required to be independent with respect to the Funds in accordance with the U.S. federal securities laws and the applicable rules and regulations of the Securities and Exchange Commission and the PCAOB.
111 |
Table of Contents
Report of Independent Registered Public
Accounting Firm
We conducted our audits of these financial statements in accordance with the standards of the PCAOB. Those standards require that we plan and perform the audit to obtain reasonable assurance about whether the financial statements are free of material misstatement, whether due to error or fraud.
Our audits included performing procedures to assess the risks of material misstatement of the financial statements, whether due to error or fraud, and performing procedures that respond to those risks. Such procedures included examining, on a test basis, evidence regarding the amounts and disclosures in the financial statements. Our audits also included evaluating the accounting principles used and significant estimates made by management, as well as evaluating the overall presentation of the financial statements. Our procedures included confirmation of securities owned as of December 31, 2019 by correspondence with the custodian and brokers; when replies were not received from brokers, we performed other auditing procedures. We believe that our audits provide a reasonable basis for our opinions.
/s/ PricewaterhouseCoopers LLP
Boston, Massachusetts
February 21, 2020
We have served as the auditor of one or more of the investment companies in the Natixis Investment Company Complex since at least 1995. We have not been able to determine the specific year we began serving as auditor.
| 112
Table of Contents
2019 U.S. Tax Distribution Information to Shareholders (Unaudited)
Corporate Dividends Received Deduction. For the fiscal year ended December 31, 2019, a percentage of dividends distributed by the Funds listed below qualify for the dividends received deduction for corporate shareholders. These percentages are as follows:
Fund | Qualifying | |||
High Income Fund | 0.95 | % | ||
Investment Grade Bond Fund | 0.21 | % | ||
Multi-Asset Income Fund | 28.39 | % | ||
Qualified Dividend Income. For the fiscal year ended December 31, 2019, a percentage of the ordinary income dividends paid by the Funds are considered qualified dividend income eligible for reduced tax rates. These lower rates range from 0% to 20% depending on an individual’s tax bracket. If the Funds paid a distribution during calendar year 2019, complete information will be reported in conjunction withForm 1099-DIV. These percentages are noted below:
Fund | Qualifying | |||
High Income Fund | 2.36 | % | ||
Investment Grade Bond Fund | 0.61 | % | ||
Multi-Asset Income Fund | 29.94 | % | ||
113 |
Table of Contents
Trustee and Officer Information
The tables below provide certain information regarding the trustees and officers of Natixis Funds Trust I and Loomis Sayles Funds II (the “Trusts”). Unless otherwise indicated, the address of all persons below is 888 Boylston Street, Suite 800, Boston, MA 02199-8197. The Funds’ Statement of Additional Information includes additional information about the trustees of the Trusts and is available by calling Natixis Funds at800-225-5478.
Name and Year of | Position(s) Held | Principal | Number of and Other | Experience, | ||||
| INDEPENDENT TRUSTEES | ||||||||
Kenneth A. Drucker (1945) | Chairperson of the Board of Trustees since January 2017 Trustee since 2008 Ex Officio member of Audit Committee, Contract Review Committee and Governance Committee | Retired | 51 None | Significant experience on the Board and on the boards of other business organizations (including at investment companies); executive experience (including as treasurer of an aerospace, automotive, and metal manufacturing corporation) | ||||
Edmond J. English (1953) | Trustee since 2013 Chairperson of Governance Committee and Audit Committee Member | Executive Chairman of Bob’s Discount Furniture (retail) | 51 Director, Burlington Stores, Inc. (retail) | Significant experience on the Board and on the boards of other business organizations (including retail companies and a bank); executive experience (including at a retail company) | ||||
| 114
Table of Contents
Trustee and Officer Information
Name and Year of | Position(s) Held | Principal | Number of and Other | Experience, | ||||
INDEPENDENT TRUSTEES continued | ||||||||
Richard A. Goglia (1951) | Trustee since 2015 Contract Review Committee Member and Governance Committee Member | Retired; formerly Vice President and Treasurer of Raytheon Company (defense) | 51 None | Experience on the Board and executive experience (including his role as vice president and treasurer of a defense company and experience at a financial services company) | ||||
Wendell J. Knox (1948) | Trustee since 2009 Chairperson of Contract Review Committee | Director of Abt Associates Inc. (research and consulting) | 51 Director, The Hanover Insurance Group (property and casualty insurance); formerly, Director, Eastern Bank (bank) | Significant experience on the Board and on the boards of other business organizations (including at a bank and at a property and casualty insurance firm); executive experience (including roles as president and chief executive officer of a research and consulting company) | ||||
115 |
Table of Contents
Trustee and Officer Information
Name and Year of | Position(s) Held | Principal | Number of and Other | Experience, | ||||
INDEPENDENT TRUSTEES continued | ||||||||
Martin T. Meehan (1956) | Trustee since 2012 Audit Committee Member | President, University of Massachusetts; formerly, Chancellor and faculty member, University of Massachusetts Lowell | 51 None | Significant experience on the Board and on the boards of other business organizations; experience as President of the University of Massachusetts; government experience (including as a member of the U.S. House of Representatives); academic experience | ||||
Maureen B. Mitchell (1951) | Trustee since 2017 Contract Review Committee Member and Governance Committee Member | Retired; formerly President, Global Sales and Marketing, GE Asset Management, Inc. (financial services) | 51 Director, Sterling Bancorp (bank) | Experience on the Board ; financial services industry and executive experience (including role as president of global sales and marketing at a financial services company) | ||||
| 116
Table of Contents
Trustee and Officer Information
Name and Year of | Position(s) Held | Principal | Number of and Other | Experience, | ||||
INDEPENDENT TRUSTEES continued | ||||||||
James P. Palermo (1955) | Trustee since 2016 Contract Review Committee Member | Founding Partner, Breton Capital Management, LLC (private equity); Partner, STEP Partners, LLC (private equity) | 51 Director, FutureFuel.io (chemicals and biofuels) | Experience on the Board; financial services industry and executive experience (including roles as chief executive officer of client management and asset servicing for a banking and financial services company) | ||||
Erik R. Sirri (1958) | Trustee since 2009 Chairperson of the Audit Committee | Professor of Finance at Babson College | 51 None | Significant experience on the Board; experience as Director of the Division of Trading and Markets at the Securities and Exchange Commission; academic experience; training as an economist | ||||
Peter J. Smail (1952) | Trustee since 2009 Audit Committee Member and Governance Committee Member | Retired | 51 None | Significant experience on the Board; mutual fund industry and executive experience (including roles as president and chief executive officer for an investment adviser) | ||||
117 |
Table of Contents
Trustee and Officer Information
Name and Year of | Position(s) Held | Principal | Number of and Other | Experience, | ||||
INDEPENDENT TRUSTEES continued | ||||||||
Kirk A. Sykes (1958) | Trustee since 2019 Contract Review Committee Member | Managing Director of Accordia Partners, LLC (real estate development); President of Primary Corporation (real estate development); Managing Principal of Merrick Capital Partners (infrastructure finance); formerly, President of Urban Strategy America Fund (real estate fund manager) | 51 Trustee, Eastern Bank (bank); formerly Director, Ares Commercial Real Estate Corporation (real estate investment trust) | Experience on the Board and significant experience on the boards of other business organizations (including real estate companies and banks) | ||||
Cynthia L. Walker (1956) | Trustee since 2005 for Natixis Funds Trust I Audit Committee Member and Governance Committee Member | Deputy Dean for Finance and Administration, Yale University School of Medicine | 51 None | Significant experience on the Board; executive experience in a variety of academic organizations (including roles as dean for finance and administration) | ||||
| 118
Table of Contents
Trustee and Officer Information
Name and Year of | Position(s) Held | Principal | Number of and Other | Experience, | ||||
INTERESTED TRUSTEES | ||||||||
Kevin P. Charleston3 (1965) One Financial Center Boston, MA 02111 | Trustee since 2015 | President, Chief Executive Officer and Chairman of the Board of Directors; formerly, Chief Financial Officer, Loomis, Sayles & Company, L.P. | 51 None | Experience on the Board; continuing service as President, Chief Executive Officer and Chairman of the Board of Directors of Loomis, Sayles & Company, L.P. | ||||
David L. Giunta4 (1965) | Trustee since 2011 President and Chief Executive Officer of Natixis Funds Trust I; President of Loomis Sayles Funds II; Chief Executive Officer of Loomis Sayles Funds II since 2015 | President and Chief Executive Officer, Natixis Advisors, L.P., Natixis Distribution, L.P., Natixis Distribution Corporation and Chairman of the Board of Natixis Distribution Corporation | 51 None | Significant experience on the Board; experience as President and Chief Executive Officer, Natixis Advisors, L.P., Natixis Distribution, L.P., Natixis Distribution Corporation and Chairman of the Board of Natixis Distribution Corporation | ||||
| 1 | Each trustee serves until retirement, resignation or removal from the Board. The current retirement age is 75. The position of Chairperson of the Board is appointed for a three-year term. Mr. Drucker was appointed to serve an additional one year term as the Chairperson of the Board on June 12, 2019. |
| 2 | The trustees of the Trusts serve as trustees of a fund complex that includes all series of the Trusts, Natixis Funds Trust II, Natixis Funds Trust IV, Gateway Trust, Loomis Sayles Funds I, and Natixis ETF Trust (collectively, the “Fund Complex”). |
| 3 | Mr. Charleston is deemed an “interested person” of the Trusts because he holds the following positions with an affiliated person of the Trusts: President, Chief Executive Officer and Chairman of the Board of Directors of Loomis, Sayles & Company, L.P. |
| 4 | Mr. Giunta is deemed an “interested person” of the Trusts because he holds the following positions with an affiliated person of the Trusts: President and Chief Executive Officer, Natixis Advisors, L.P., Natixis Distribution, L.P., Natixis Distribution Corporation and Chairman of the Board of Natixis Distribution Corporation. |
119 |
Table of Contents
Trustee and Officer Information
Name and Year of Birth | Position(s) Held with the Trusts | Term of Office1 and Length of Time Served | Principal Occupation(s) During Past 5 Years2 | |||
| OFFICERS OF THE TRUSTS | ||||||
Daniel J. Fuss (1933) One Financial Center Boston, MA 02111 | Executive Vice President of Loomis Sayles Funds II | Since 2003 | Vice Chairman and Director, Loomis, Sayles & Company, L.P. | |||
Russell L. Kane (1969) | Secretary, Clerk and Chief Legal Officer | Since 2016 | Executive Vice President, General Counsel, Secretary and Clerk, Natixis Distribution Corporation, Natixis Advisors, L.P. and Natixis Distribution, L.P.; formerly, Chief Compliance Officer for Mutual Funds, Senior Vice President, Deputy General Counsel, Assistant Secretary and Assistant Clerk, Natixis Distribution Corporation, Natixis Advisors, L.P. and Natixis Distribution, L.P. | |||
Michael C. Kardok (1959) | Treasurer, Principal Financial and Accounting Officer | Since 2004 | Senior Vice President, Natixis Advisors, L.P. and Natixis Distribution, L.P. | |||
Kirk D. Johnson (1981) | Chief Compliance Officer, Assistant Secretary and Anti-Money Laundering Officer | Since 2018 | Senior Vice President, Deputy General Counsel, Assistant Secretary and Assistant Clerk, Natixis Distribution Corporation, Natixis Advisors, L.P. and Natixis Distribution, L.P.; formerly, Associate General Counsel, Natixis Distribution, L.P.; Vice President and Counsel, Natixis Investment Managers, LLC. | |||
| 120
Table of Contents
Trustee and Officer Information
| 1 | Each officer of the Trusts serves for an indefinite term in accordance with the Trusts’ currentby-laws until the date his or her successor is elected and qualified, or until he or she sooner dies, retires, is removed or becomes disqualified. |
| 2 | Each person listed above, except as noted, holds the same position(s) with the Fund Complex. Previous positions during the past five years with Natixis Distribution, L.P., Natixis Advisors, L.P. or Loomis, Sayles & Company, L.P. are omitted, if not materially different from an officer’s current position with such entity. |
121 |
Table of Contents
Item 2. Code of Ethics.
The Registrant has adopted a code of ethics that applies to the Registrant’s principal executive officer, principal financial officer and persons performing similar functions. There have been no amendments or waivers of the Registrant’s code of ethics during the period.
Item 3. Audit Committee Financial Expert.
The Board of Trustees of the Registrant has established an audit committee. Mr. Edmond J. English, Mr. Martin T. Meehan, Mr. Erik R. Sirri, Mr. Peter J. Smail and Ms. Cynthia L. Walker are members of the audit committee and have been designated as “audit committee financial experts” by the Board of Trustees. Each of these individuals is also an Independent Trustee of the Registrant.
Item 4. Principal Accountant Fees and Services.
Fees billed by the Principal Accountant for services rendered to the Registrant.
The table below sets forth fees billed by the principal accountant, PricewaterhouseCoopers LLP, for the past two fiscal years for professional services rendered in connection with a) the audit of the Registrant’s annual financial statements and services provided in connection with regulatory filings; b) audit-related services (including services that are reasonably related to the performance of the audit of the Registrant’s financial statements and but not reported under “Audit Fees”); c) tax compliance, tax advice and tax planning and d) all other fees billed for professional services rendered by the principal accountant to the Registrant, other than the services reported as a part of (a) through (c) of this Item.
| Audit fees | Audit-related fees1 | Tax fees2 | All other fees | |||||||||||||||||||||||||||||
| 10/1/18- 12/31/183 | 1/1/19- 12/31/19 | 10/1/18- 12/31/183 | 1/1/19- 12/31/19 | 10/1/18- 12/31/183 | 1/1/19- 12/31/19 | 10/1/18- 12/31/183 | 1/1/19- 12/31/19 | |||||||||||||||||||||||||
Loomis Sayles High Income Fund and Loomis Sayles Investment Grade Bond Fund | $ | 77,526 | $ | 97,986 | $ | — | $ | 1,025 | $ | 8,104 | $ | 16,208 | $ | — | $ | — | ||||||||||||||||
| 1. | Audit-related fees consist of: |
2019 – performance of agreed-upon procedures related to the Registrant’s deferred compensation plan.
| 2. | Tax fees consist of: |
2018 & 2019 – Review of Registrant’s tax returns.
| 3. | Effective November 1, 2018, each Fund’s fiscal year end changed from September 30th to December 31st. Fees paid for the period October 1, 2017 to September 30, 2018 were: Audit—$96,994; Audit-related—$1,054; Tax—$16,048; All other fees—$-. |
Aggregate fees billed to the Registrant fornon-audit services during 2018 and 2019 were $8,104 and $17,233, respectively.
Table of Contents
Fees billed by the Principal Accountant for services rendered to the Adviser and Control Affiliates.
The following table sets forth the fees billed by the Registrant’s principal accountant fornon-audit services rendered to Loomis, Sayles & Company, L.P. (“Loomis Sayles”) and entities controlling, controlled by or under common control with Loomis Sayles (“Control Affiliates”) that provide ongoing services to the Registrant, for engagements that related directly to the operations and financial reporting of the Registrant for the last two fiscal years.
| 10/1/18- 12/31/181 | 1/1/19- 12/31/19 | 10/1/18- 12/31/181 | 1/1/19- 12/31/19 | 10/1/18- 12/31/181 | 1/1/19- 12/31/19 | |||||||||||||||||||
Control Affiliates | $ | — | $ | — | $ | — | $ | — | $ | — | $ | — | ||||||||||||
| 1. | Effective November 1, 2018, each Fund’s fiscal year end changed from September 30th to December 31st. The information presented is for the period October 1, 2018 to December 31, 2018. No fees were paid for the period from October 1, 2017 to September 30, 2018. |
The following table sets forth the aggregate fees billed by the Registrant’s principal accountant fornon-audit services rendered to Loomis Sayles and Control Affiliates that provide ongoing services to the Registrant, for the last two fiscal years, including the fees disclosed in the table above.
| 10/1/18- 12/31/181 | 1/1/19- 12/31/19 | |||||||
Control Affiliates | $ | 51,815 | $ | 27,252 | ||||
| 1. | Effective November 1, 2018, each Fund’s fiscal year end changed from September 30th to December 31st. The information presented is for the period October 1, 2018 to December 31, 2018. Fees paid for the period from October 1, 2017 to September 30, 2018 were $62,411. |
None of the services described above were approved pursuant to paragraph (c)(7)(i)(C) of RegulationS-X.
Audit Committee Pre Approval Policies.
Annually, the Registrant’s Audit Committee reviews the audit, audit-related, tax and othernon-audit services together with the projected fees, for services proposed to be rendered to the Registrant and/or other entities for whichpre-approval is required during the upcoming year. Any subsequent revisions to alreadypre-approved services or fees (including fee increases) and requests forpre-approval of new services would be presented for consideration quarterly as needed.
If, in the opinion of management, a proposed engagement by the Registrant’s independent accountants needs to commence before the next regularly scheduled Audit Committee meeting, any member of the Audit Committee who is an independent Board member is authorized topre-approve the engagement, but only for engagements to provide audit, audit-related and tax services. This approval is subject to review by the full Audit Committee at its next quarterly meeting. All other engagements require the approval of all the members of the Audit Committee.
Table of Contents
Item 5. Audit Committee of Listed Registrants.
Not applicable.
Item 6. Schedule of Investments.
Included as part of the Report to Shareholders filed as Item 1 herewith.
Item 7. Disclosure of Proxy Voting Policies and Procedures forClosed-End Management Investment Companies.
Not applicable.
Item 8. Portfolio Managers ofClosed-End Management Investment Companies
Not applicable.
Item 9. Purchases of Equity Securities byClosed-End Management Investment Companies and Affiliated Purchasers.
Not applicable.
Item 10. Submission of Matters to a Vote of Securities Holders.
There were no material changes to the procedures by which shareholders may recommend nominees to the Registrant’s Board of Trustees.
Item 11. Controls and Procedures.
The Registrant’s principal executive officer and principal financial officer have concluded that the Registrant’s disclosure controls and procedures are sufficient to ensure that information required to be disclosed by the Registrant in this FormN-CSR was recorded, processed, summarized and reported within the time periods specified in the Securities and Exchange Commission’s rules and forms, based upon such officers’ evaluation of these controls and procedures as of a date within 90 days of the filing date of the report.
There were no changes in the Registrant’s internal control over financial reporting that occurred during the
Registrant’s last fiscal quarter of the period covered by the report that has materially affected, or is reasonably likely to materially affect, the Registrant’s internal control over financial reporting.
Item 12. Disclosure of Securities Lending Activities forClosed-End Management Investment Companies.
Not applicable.
Item 13. Exhibits.
| (a) (1) | Code of Ethics required by Item 2 hereof, filed herewith as Exhibit (a)(1). |
| (a) (2) | Certifications of Principal Executive Officer and Principal Financial Officer pursuant to Rule30a-2(a) under the Investment Company Act of 1940 (17 CFR270.30a-2(a)), filed herewith as Exhibits (a)(2)(1) and (a)(2)(2), respectively. |
| (a) (3) | Not applicable. |
| (b) | Certification of Principal Executive Officer and Principal Financial Officer pursuant to Section 906 of Sarbanes-Oxley Act of 2002 are filed herewith as Exhibit (b). |
Table of Contents
SIGNATURES
Pursuant to the requirements of the Securities Exchange Act of 1934 and the Investment Company Act of 1940, the Registrant has duly caused this report to be signed on its behalf by the undersigned, thereunto duly authorized.
| Loomis Sayles Funds II | ||
| By: | /s/ David L. Giunta | |
| Name: | David L. Giunta | |
| Title: | President and Chief Executive Officer | |
| Date: | February 21, 2020 |
Pursuant to the requirements of the Securities Exchange Act of 1934 and the Investment Company Act of 1940, this report has been signed by the following persons on behalf of the Registrant and in the capacities and on the dates indicated.
| By: | /s/ David L. Giunta |
| Name: | David L. Giunta | |
| Title: | President and Chief Executive Officer | |
| Date: | February 21, 2020 |
| By: | /s/ Michael C. Kardok |
| Name: | Michael C. Kardok | |
| Title: | Treasurer | |
| Date: | February 21, 2020 |