UNITED STATES
SECURITIES AND EXCHANGE COMMISSION
Washington, D.C. 20549
FORM N-CSR
CERTIFIED SHAREHOLDER REPORT OF REGISTERED
MANAGEMENT INVESTMENT COMPANIES
Investment Company Act file number: 811-06241
Loomis Sayles Funds II
(Exact name of Registrant as specified in charter)
888 Boylston Street, Suite 800 Boston, Massachusetts 02199-8197
(Address of principal executive offices) (Zip code)
Natalie Wagner, Esq.
Natixis Distribution, LLC
888 Boylston Street, Suite 800
Boston, Massachusetts 02199-8197
(Name and address of agent for service)
Registrant’s telephone number, including area code: (617) 449-2810
Date of fiscal year end: September 30
Date of reporting period: September 30, 2021
Item 1. Reports to Stockholders.
(a) The Registrant’s annual report transmitted to shareholders pursuant to Rule 30e-1 under the Investment Company Act of 1940 is as follows:


Annual Report
September 30, 2021
Loomis Sayles Core Plus Bond Fund
Loomis Sayles Credit Income Fund
Loomis Sayles Global Allocation Fund
Loomis Sayles Growth Fund
Loomis Sayles Intermediate Duration Bond Fund
Loomis Sayles Limited Term Government and Agency Fund
| Portfolio Review | 1 | |||
| Portfolio of Investments | 34 | |||
| Financial Statements | 77 | |||
| Notes to Financial Statements | 108 |

LOOMIS SAYLES CORE PLUS BOND FUND
| Managers | Symbols | |
| Lead Portfolio Managers | Class A NEFRX | |
| Peter W. Palfrey, CFA® | Class C NECRX | |
| Richard G. Raczkowski | Class N NERNX | |
| Agency MBS Portfolio Managers | Class Y NERYX | |
| Ian Anderson | ||
| Barath W. Sankaran, CFA® | ||
| Loomis, Sayles & Company, L.P. | ||
Investment Goal
The Fund seeks high total investment return through a combination of current income and capital appreciation.
Market Conditions
The bond market experienced mixed returns over the period as investors reacted to the combination of improving economic growth, rising inflation and the increasing likelihood that the US Federal Reserve (Fed) and other central banks will need to begin tightening monetary policy in the coming year.
Following the approval and rollout of multiple vaccines for Covid-19 in late 2020 and early 2021, business conditions gradually returned to normal. Economic growth surged as a result, allaying fears that the virus would lead to a protracted slowdown. The reopening of the economy, while fueling impressive headline GDP growth, was accompanied by rising commodity prices, disruptions in the global supply chain and a sharp increase in inflation. Although the Fed initially described the rise in inflation as a “transitory” phenomenon, the persistence of price pressures through the summer and early autumn led to a gradual shift in the outlook. In September, Fed Chair Jerome Powell stated that the central bank was likely to announce a tapering of its stimulative quantitative easing (QE) program before the end of 2021. In addition, the markets began to price in a significant likelihood that the Fed will enact its first rate hike in late 2022. Together, these factors dampened returns across the fixed income market.
US Treasuries underperformed the broad fixed income market as risk appetite drastically improved over the past year. Mounting concerns over inflation and Fed policy also played a role in the rise in yields. While the prices of short-term government debt were relatively stable, longer-maturity bonds declined sharply. The yield on the 10-year note rose from 0.69% on September 30, 2020, to 1.52% on the final day of the period, and the 30-year bond moved from 1.46% to 2.08% (prices and yields move in opposite directions).
Despite the weakness in US Treasuries, investment grade corporates registered a solid gain for the 12-month period. As growth accelerated and the credit outlook improved, investors sought opportunities in higher-yielding segments of the market. Corporate yield spreads over Treasuries fell sharply as a result, leading to positive relative performance.
Securitized assets — including mortgage-backed securities (MBS), asset-backed securities (ABS) and commercial mortgage-backed securities (CMBS) — produced marginally negative total returns as a group but outpaced the US Treasury market. The category’s underlying fundamentals remained firm, however, with continued strength in both real estate prices and consumer credit. ABS and CMBS posted positive total returns, but MBS experienced small negative total returns due in part to its higher interest rate sensitivity.
Investors’ increased appetite for risk translated to a strong, double-digit gain for high yield corporates. The category tends to have lower interest rate sensitivity than investment grade bonds, a key tailwind at a time in which concern about Fed policy was the key factor driving market performance. High yield further benefited from the combination of favorable credit conditions, robust gains for equities and an impressive rally in oil prices. Leveraged loans, which typically offer yields that adjust upward with prevailing interest rates, also outperformed.
Emerging market bonds, while experiencing bouts of volatility, nonetheless finished comfortably ahead of domestic investment grade debt. Although investors remained on edge due to persistently negative headlines out of China during the second half of the period, the asset class benefited from its above-average yield and the broader strength in higher-risk assets.
Performance Results
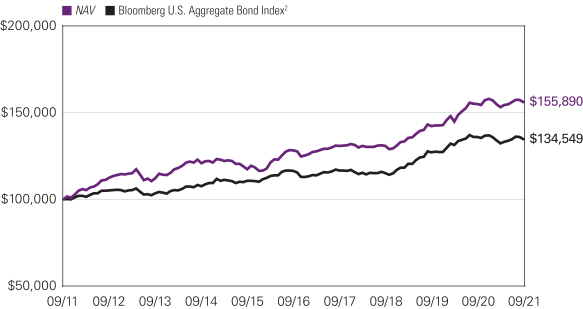
For the 12 months ended September 30, 2021, Class Y shares of the Fund returned 0.78% at net asset value. The Fund outperformed its benchmark, the Bloomberg U.S. Aggregate Bond Index, which returned -0.90%.
1 |
Explanation of Fund Performance
The Fund maintained an average allocation to high yield corporates of about 10% over the 12-month period, which buoyed performance as the sector strongly outperformed. Positioning in investment grade corporate bonds also contributed positively to relative return, driven by both security selection and sector allocation. Within corporates, an emphasis on the reopening theme within industrials across the quality spectrum proved beneficial. An underweight to US Treasuries and positioning within government sectors were additional sources of outperformance. Finally, small out-of-benchmark positions in bank loans and non-US dollar assets both added to relative performance.
The Fund’s positioning along the yield curve (which depicts the relationship among bond yields across the maturity spectrum) weighed on relative performance as the curve steepened over the 12 months. A shorter-than-benchmark stance with respect to duration (and corresponding interest rate sensitivity) for most of the period also detracted modestly. Finally, out-of-benchmark exposure to municipal bonds detracted slightly from relative performance.
Outlook
We believe the Fed will remain accommodative for the foreseeable future, keeping the fed funds rate unchanged at the zero lower bound and anchoring the very front end of the Treasury yield curve into late 2022 or early 2023. The Fed has now indicated that it is ready to address balance sheet policy. Our base case, based on Fed comments, is for tapering to be completed by mid-2022. Traditional monetary policy tightening is expected to start in late 2022 or early 2023 based on the current Fed “dot plot” chart, which displays individual FOMC member expectations for the trajectory of fed funds. This is in line with our expectations. We expect core inflation to remain above the Fed’s target of 2% for at least the next several quarters or perhaps longer, as inflationary pressure, while in part transitory due to base effect, may prove more lasting in our view.
We believe the credit cycle1 is currently in the early expansion phase, with continued strong corporate earnings and a healthy consumer supported by significant excess savings and easy financial conditions. We believe risk appetite should remain elevated given the strong expansionary environment, expectations for robust global growth, continued monetary and fiscal policy support, and the increasing availability of vaccines across more demographic groups.
We believe corporate fundamentals are currently healthy, reflecting the recovery in the US and, now to a greater degree, the global economy. Additionally, we believe very accommodative global central bank and fiscal policy have been a significant tailwind, although that may also be changing as heightened inflation concerns, elevated leverage and extended risk valuations have become a greater focus for central banks globally. In the US, corporate bond and equity valuations are at or near historic highs reflecting this very strong environment, and we believe may be vulnerable to some near-term profit-taking or volatility.
We believe we are positioned for a continued recovery in the US and global economies, with a pro-cyclical bias to the portfolio. We currently favor spread sectors, including securitized credit, high yield corporate credit and emerging market credit, versus sectors more vulnerable to interest rate and valuation risk, such as Treasuries and high grade corporate bonds. We are managing interest rate risk by maintaining a relatively short overall portfolio duration and are seeking to achieve better carry and roll-down by employing a bulleted yield curve strategy with more in the belly of the curve.
We expect overall portfolio credit quality to remain high, although it has come down from pre-pandemic levels when we were more concerned about preserving capital. Average credit quality currently stands at A2. Approximately 40% of the portfolio remains in AAA government issues, although we have a broad overweight to BBB and BB/B credits as well, balancing liquidity with total return opportunities in lower-rated securitized and corporate credits.
Within agency MBS, we continue to position for potential better-than-market convexity (i.e., a favorable risk/reward profile in a changing interest rate environment) and continue to maintain a modest underweight to the sector. With the recent underperformance of the MBS sector, we believe valuations have become more attractive, and we may consider adding back some exposure, in particular relative to corporate credit.
Within securitized credit, we remain overweight in non-agency CMBS, but more recently sold our agency CMBS exposure due to very tight valuations. We currently favor ABS as a high quality substitute for government bonds and prefer auto loans and credit card receivables within the sector, particularly with the improved employment and the continued strength of the consumer balance sheet.
Regarding investment grade corporate credit, we are approximately market neutral to the benchmark and about 0.6 years short on a contribution-to-duration basis versus the benchmark. While corporate fundamentals are healthy, we believe valuations are not as compelling and we now favor a lower use of our risk budget for the asset class..
Within the plus sector allocation, we continue to favor a mix of fixed rate high yield, bank loan, emerging market Yankee and non-dollar emerging market exposure as a way to seek portfolio yield and return potential in this improving, low-yielding economic environment. At the end of the third quarter of 2021, we had just under 13% in fixed rate high yield securities, just over 5% in high quality bank loans, and 3.5% in investment grade emerging market non-dollar bonds.
| 2
LOOMIS SAYLES CORE PLUS BOND FUND
During periods in which the US dollar appreciates relative to foreign currencies, funds that hold non-US-dollar-denominated bonds, foreign currency or foreign currency based derivative securities (“foreign currency exposures”) may realize currency losses in connection with the maturity or sale of certain foreign currency exposures. These losses impact a fund’s ordinary income distributions (to the extent that losses are not offset by realized currency gains within the fund’s fiscal year). A recognized currency loss, in accordance with federal tax rules, decreases the amount of ordinary income a fund has available to distribute, even though non-US dollar-denominated bonds continue to generate coupon income.
Fund officers have analyzed the Fund’s current portfolio of investments, realized currency gains and losses, schedule of maturities, and the corresponding amounts of unrealized currency losses that may become realized during the current fiscal year. This analysis is performed regularly to determine how realized currency losses have and will impact periodic ordinary income distributions for the Fund. Based on the most recent quarterly analysis (as of September 30, 2021), realized currency losses will continue to have an impact on the distributions in the 2022 fiscal year. This analysis is based on certain assumptions including, but not limited to, the amount of foreign currency exposures held by the Fund, the level of foreign currency exchange rates, security prices, interest rates, the Fund advisers’ ability to manage realized currency losses, and the net asset level of the Fund. Changes to these assumptions could materially impact the analysis and the amounts of future fund distributions. Fund officers will continue to monitor these amounts on a regular basis and take the necessary actions required to manage the Fund’s distributions to address realized currency losses while seeking to avoid a return of capital distribution.
| 1 | A credit cycle is a cyclical pattern that follows credit availability and corporate health. |
Hypothetical Growth of $100,000 Investment in Class Y Shares3
September 30, 2011 to September 30, 2021
3 |
Average Annual Total Returns — September 30, 20213
Life of Class N | Expense Ratios4 | |||||||||||||||||||||||
| 1 Year | 5 Years | 10 Years | Gross | Net | ||||||||||||||||||||
| Class Y (Inception 12/30/94) |
| |||||||||||||||||||||||
| NAV | 0.78 | % | 4.01 | % | 4.54 | % | — | 0.47 | % | 0.47 | % | |||||||||||||
| Class A (Inception 11/7/73) | ||||||||||||||||||||||||
| NAV | 0.53 | 3.75 | 4.27 | — | 0.72 | 0.72 | ||||||||||||||||||
| With 4.25% Maximum Sales Charge | -3.71 | 2.85 | 3.82 | — | ||||||||||||||||||||
| Class C (Inception 12/30/94) | ||||||||||||||||||||||||
| NAV | -0.24 | 2.97 | 3.65 | — | 1.47 | 1.47 | ||||||||||||||||||
| With CDSC1 | -1.20 | 2.97 | 3.65 | — | ||||||||||||||||||||
| Class N (Inception 2/1/13) |
| |||||||||||||||||||||||
| NAV | 0.86 | 4.10 | — | 3.72 | 0.38 | 0.38 | ||||||||||||||||||
| Comparative Performance |
| |||||||||||||||||||||||
| Bloomberg U.S. Aggregate Bond Index2 | -0.90 | 2.94 | 3.01 | 2.95 | ||||||||||||||||||||
Performance data shown represents past performance and is no guarantee of, and not necessarily indicative of, future results. Total return and value will vary, and you may have a gain or loss when shares are sold. Current performance may be lower or higher than quoted. For most recent month-end performance, visit im.natixis.com. Performance for other share classes will be greater or less than shown based on differences and sales charges. You may not invest directly in an index. Performance for periods less than one year is cumulative, not annualized. Returns reflect changes in share price and reinvestment of dividends and capital gains, if any. The table(s) do not reflect taxes shareholders might owe on any fund distributions or when they redeem their shares.
| 1 | Class C shares performance assumes a 1% CDSC applied when you sell shares within one year of purchase. |
| 2 | The Bloomberg U.S. Aggregate Bond Index is a broad-based index that covers the U.S. dollar-denominated, investment-grade, fixed-rate, taxable bond market of SEC-registered securities. The index includes bonds from the Treasury, government-related, corporate, mortgage-backed securities, asset-backed securities, and collateralized mortgage-backed securities sectors. |
| 3 | Fund performance has been increased by fee waivers and/or expense reimbursements, if any, without which performance would have been lower. |
| 4 | Expense ratios are as shown in the Fund’s prospectus in effect as of the date of this report. The expense ratios for the current reporting period can be found in the Financial Highlights section of this report under Ratios to Average Net Assets. Net expenses reflect contractual expense limitations set to expire on 1/31/22. When a Fund’s expenses are below the limitation, gross and net expense ratios will be the same. See Note 6 of the Notes to Financial Statements for more information about the Fund’s expense limitations. |
| 4
LOOMIS SAYLES CREDIT INCOME FUND
| Managers | Symbols | |
| Matthew J. Eagan, CFA® | Class A LOCAX | |
Brian P. Kennedy | Class C LOCCX | |
Elaine M. Stokes | Class N LOCNX | |
| Class Y LOCYX | ||
| Loomis, Sayles & Company, L.P. | ||
Investment Goal
The Fund seeks high current income with a secondary objective of capital growth.
Market Conditions
The bond market experienced mixed returns over the period, as investors reacted to the combination of improving economic growth, rising inflation and the increasing likelihood that the US Federal Reserve (Fed) and other central banks will need to begin tightening monetary policy in the coming year.
Following the approval and rollout of multiple vaccines for Covid-19 in late 2020 and early 2021, business conditions gradually returned to normal. Economic growth surged as a result, allaying fears that the virus would lead to a protracted slowdown. The reopening of the economy, while fueling impressive headline GDP growth, was accompanied by rising commodity prices, disruptions in the global supply chain and a sharp increase in inflation. Although the Fed initially described the rise in inflation as a “transitory” phenomenon, the persistence of price pressures through the summer and early autumn led to a gradual shift in the outlook. In September, Fed Chair Jerome Powell stated that the central bank was likely to announce a tapering of its stimulative quantitative easing (QE) program before the end of 2021. In addition, the markets began to price in a significant likelihood that the Fed will enact its first rate hike in late 2022. Together, these factors dampened returns across the fixed income market.
Despite the weakness in US Treasuries, investment grade corporates registered a solid gain for the 12-month period. As growth accelerated and the credit outlook improved, investors sought opportunities in higher-yielding segments of the market. Corporate yield spreads over Treasuries fell sharply as a result, leading to positive relative performance.
Investors’ increased appetite for risk translated to a strong, double-digit gain for high yield corporates. The category tends to have lower interest rate sensitivity than investment grade bonds, a key tailwind at a time in which concern about Fed policy was the key factor driving market performance. High yield further benefited from the combination of favorable credit conditions, robust gains for equities and an impressive rally in oil prices. Leveraged loans, which typically offer yields that adjust upward with prevailing interest rates, also outperformed.
US Treasuries underperformed the broad fixed income market as risk appetite drastically improved over the past year. Mounting concerns over inflation and Fed policy also played a role in the rise in yields. While the prices of short-term government debt were relatively stable, longer-maturity bonds declined sharply. The yield on the 10-year note rose from 0.69% on September 30, 2020, to 1.52% on the final day of the period, and the 30-year bond moved from 1.46% to 2.08% (prices and yields move in opposite directions).
Performance Results
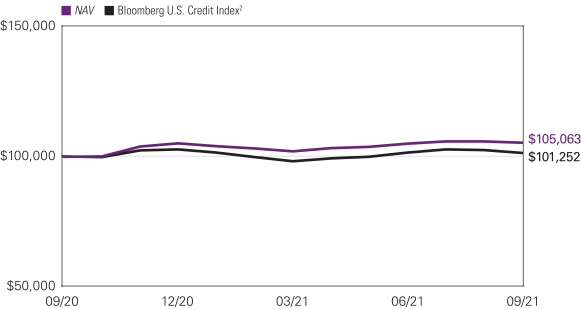
For the 12 months ended September 30, 2021, Class Y shares of the Loomis Sayles Credit Income Fund returned 5.38% at net asset value. The Fund outperformed its benchmark, the Bloomberg U.S. Credit Index, which returned 1.45%.
Explanation of Fund Performance
Though the Covid-19 global pandemic continued to shape the events of this past year, markets advanced on the back of optimism surrounding vaccine rollouts and economic reopenings. Security selection was the primary source of outperformance for the Fund, particularly within investment grade and high yield corporate credit. Consumer cyclical and finance company holdings aided relative return in investment grade. For high yield credit, consumer non-cyclical and energy names were positive contributors to performance. The Fund’s allocation to convertible securities, specifically in the consumer non-cyclical, communications and technology sectors, was also beneficial as stock markets posted strong gains for the period. The Fund’s position in US Treasuries was a modest detractor from performance on an absolute and relative basis.
5 |
Outlook
While our fundamental economic outlook remains positive, the world appears less synchronized than we expected at this point in the recovery. Leading indicators remain strong, financial conditions appear easy and monetary/fiscal policies continue to be a tailwind to economic activity. This macroeconomic backdrop, coupled with strong credit fundamentals, appears positive for risk assets. However, we are mindful of the risks inherent to our outlook, such as the lingering impact of the Covid-19 Delta variant, slowing Chinese growth (and deleveraging within its property sector) and ongoing global supply chain disruptions that could lead to a bumpier, if still solid, global growth environment.
Under our base case of a gradual economic expansion, we anticipate a slow rise in interest rates as the Fed likely initiates a taper of QE purchases later this year and into 2022. While the most recent Federal Open Market Committee (FOMC) statement sent a strong signal that we are approaching the end of the road on QE, the Fed has stated its belief that inflation has been boosted by transitory factors, which will presumably fade over time. We believe supply disruptions should work out over time and energy prices could ease in 2022, which would support the Fed’s view. While we expect rate lift-off in 2023, the Fed may find it necessary to delay hiking if growth is weaker or accelerate hiking if inflation is persistently higher than expected. Adding to the uncertainty of the timing and magnitude of the Fed’s taper and rate lift-off includes the early retirement of two Fed presidents over their 2020 trading activities, which adds risk to Fed Chair Powell’s renomination and the future composition of the FOMC. Given our views, we remain defensive on interest rates and positioned shorter than broad market benchmarks from a duration perspective.
In our view, we remain fully embedded in the expansion phase of the credit cycle1 with credit fundamentals, technical factors and default expectations continuing to appear attractive. We remain “pro risk” on credit for higher carry and potential outperformance of our best ideas. In this environment, we continue to focus on issue selection, which drives our investment process. Specifically, we are seeking out “rising star” candidates that possess strong balance sheets and catalysts to help drive upgrades. We believe accommodative global monetary policies coupled with the tailwind of fiscal support could drive a wave of credit upgrades going forward. From a sector perspective, we are targeting those that have strong carry, less interest rate sensitivity and positive convexity (i.e., a favorable risk/reward profile in a changing rate environment). As such, we currently favor high yield corporates and convertible securities along with securitized debt, which can provide diversification away from pure corporate risk, relatively attractive yield potential and shorter duration profiles. During the third quarter of 2021, credit markets were generally resilient to macroeconomic events, including Fed taper talk and concerns over Chinese growth and property sector challenges, suggesting to us that there could be a strong demand for yield. We suspect this dynamic will likely hold going forward given our outlook for downgrades, defaults and losses to trend notably below long-term averages. However, we recognize current elevated valuations and tight credit spreads, and have built flexibility into our portfolios in an effort to take advantage of opportunities that may arise as a result of short-term disruptions.
| 1 | A credit cycle is a cyclical pattern that follows credit availability and corporate health. |
| 6
LOOMIS SAYLES CREDIT INCOME FUND
Hypothetical Growth of $100,000 Investment in Class Y shares3
September 29, 2020 (inception) through September 30, 2021
7 |
Average Annual Total Returns — September 30, 20213
| Expense Ratios4 | ||||||||||||||||
| 1 Year | Life of Fund | Gross | Net | |||||||||||||
| Class Y (Inception 9/29/20) | ||||||||||||||||
| NAV | 5.38 | % | 5.05 | % | 0.90 | % | 0.90 | % | ||||||||
| Class A (Inception 9/29/20) | ||||||||||||||||
| NAV | 5.24 | 4.91 | 1.15 | 1.15 | ||||||||||||
| With 4.25% Maximum Sales Charge | 0.79 | 0.50 | ||||||||||||||
| Class C (Inception 9/29/20) | ||||||||||||||||
| NAV | 4.34 | 4.02 | 1.90 | 1.90 | ||||||||||||
| With CDSC1 | 3.34 | 4.02 | ||||||||||||||
| Class N (Inception 9/29/20) | ||||||||||||||||
| NAV | 5.54 | 5.21 | 0.82 | 0.82 | ||||||||||||
| Comparative Performance | ||||||||||||||||
| Bloomberg U.S. Credit Index2 | 1.45 | 1.25 | ||||||||||||||
Performance data shown represents past performance and is no guarantee of, and not necessarily indicative of, future results. Total return and value will vary, and you may have a gain or loss when shares are sold. Current performance may be lower or higher than quoted. For most recent month-end performance, visit im.natixis.com. Performance for other share classes will be greater or less than shown based on differences in fees and sales charges. You may not invest directly in an index. Performance for periods less than one year is cumulative, not annualized. Returns reflect changes in share price and reinvestment of dividends and capital gains, if any. The table(s) do not reflect taxes shareholders might owe on any fund distributions or when they redeem their shares.
| 1 | Class C shares performance assumes a 1% CDSC applied when you sell shares within one year of purchase. |
| 2 | The Bloomberg U.S. Credit Index measures the investment grade, U.S. dollar-denominated, fixed-rate, taxable corporate and government-related bond markets. It is composed of the U.S. Corporate Index and a non-corporate component that includes non-U.S. agencies, sovereigns, supranationals and local authorities. The U.S. Credit Index was called the U.S. Corporate Index until July 2000, when it was renamed to reflect its inclusion of both corporate and non-corporate issuers. The U.S. Credit Index is a subset of the U.S. Government/Credit Index and U.S. Aggregate Index. |
| 3 | Fund performance has been increased by fee waivers and/or expense reimbursements, if any, without which performance would have been lower. |
| 4 | Expense ratios are as shown in the Fund’s prospectus in effect as of the date of this report. The expense ratios for the current reporting period can be found in the Financial Highlights section of this report under Ratios to Average Net Assets. Net expenses reflect contractual expense limitations set to expire on 1/31/22. When a Fund’s expenses are below the limitation, gross and net expense ratios will be the same. See Note 6 of the Notes to Financial Statements for more information about the Fund’s expense limitations. |
| 8
LOOMIS SAYLES GLOBAL ALLOCATION FUND
| Managers | Symbols | |
| Matthew J. Eagan, CFA® | Class A LGMAX | |
Eileen N. Riley, CFA® | Class C LGMCX | |
David W. Rolley, CFA® | Class N LGMNX | |
Lee M. Rosenbaum | Class Y LSWWX | |
Loomis, Sayles & Company, L.P. | ||
Investment Goal
The Fund seeks high total investment return through a combination of capital appreciation and current income.
Market Conditions
Following the approval and rollout of multiple vaccines for Covid-19 in late 2020 and early 2021, business conditions gradually returned to normal. Economic growth surged as a result, allaying fears that the virus would lead to a protracted slowdown. The reopening of the economy, while fueling impressive headline GDP growth, was accompanied by rising commodity prices, disruptions in the global supply chain and a sharp increase in inflation. Although the US Federal Reserve (Fed) initially described the rise in inflation as a “transitory” phenomenon, the persistence of price pressures through the summer and early autumn led to a gradual shift in the outlook. In September, Fed Chair Jerome Powell stated that the central bank was likely to announce a tapering of its quantitative easing (QE) program before the end of 2021. In addition, the markets began to price in a significant likelihood that the Fed will enact its first rate hike in late 2022.
Global equities registered significant gains for the 12-month period, posting a return of just under 28% as measured by the MSCI All Country World Index. The reopening of economies led some equity indices to record highs. All sectors posted double-digit returns, with the energy sector posting the strongest return. The financials, information technology and communication services sectors also outperformed the broader market. The consumer staples, utilities and consumer discretionary sectors registered the lowest returns.
US Treasuries underperformed the broad fixed income market as risk appetite drastically improved over the period. Growing inflation concerns and Fed policy also contributed to the rise in yields. While the prices of short-term government debt were relatively stable, longer-maturity bonds declined sharply. The yield on the 10-year note rose from 0.69% on September 30, 2020 to 1.52% on the final day of the period, and the 30-year bond moved from 1.46% to 2.08% (prices and yields move in opposite directions).
Despite the weakness in US Treasuries, investment grade corporates registered a solid gain for the 12-month period. As growth accelerated and the credit outlook improved, investors sought opportunities in higher-yielding segments of the market. Corporate yield spreads over Treasuries fell sharply as a result, leading to positive relative performance.
Specifically, high yield corporates posted double-digit gains. The category tends to have lower interest rate sensitivity than investment grade bonds, a key tailwind as concerns about Fed policy were the main factor driving market performance. High yield also benefited from favorable credit conditions, robust gains for equities and a rally in oil prices. Leveraged loans, which typically offer yields that adjust upward with prevailing interest rates, also outperformed.
Emerging market bonds, while experiencing bouts of volatility, finished comfortably ahead of domestic investment grade debt. Although investors remained on edge due to negative headlines out of China during the second half of the period, the asset class benefited from its above-average yield and the broader strength in higher-risk assets.
Performance Results
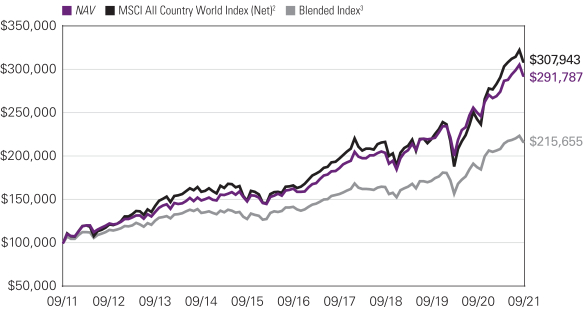
For the 12 months ended September 30, 2021 Class Y shares of the Loomis Sayles Global Allocation Fund returned 17.02% at net asset value. The Fund underperformed its primary index, the MSCI All Country World Index (Net), which returned 27.44%. The Fund outperformed its secondary blended index (60% MSCI All Country World Index (Net)/40% Bloomberg Global Aggregate Bond Index), which returned 15.48%.
9 |
Explanation of Fund Performance
In equities, the largest contributors to return were ASML Holding, Alphabet and IQVIA Holdings.
Shares of ASML, the leader in photolithography in the semiconductor industry, outperformed over the period. The company, with its critical manufacturing equipment, has been a beneficiary of the chip shortage as it has prompted governments to make investments in semiconductor production. Specifically, the Biden administration announced it would study supply chains for critical industries and sought $37 billion for chip manufacturing onshore while the European Union outlined a plan to produce 20% of the world’s chips by 2030. Shares were also supported by positive announcements from ASML’s customers. TSMC, a key customer for ASML’s next generation equipment, announced a large increase in spending, while Intel announced its intention to revive its manufacturing and foundry capabilities, a move which would require lithography equipment.
Alphabet shares outperformed as improved Covid-19 vaccination rates drove consumer optimism. Despite the stock price rally, we believe the market may still be underappreciating the extent of digital advertising market share gains during the pandemic. We expect Alphabet to benefit in the second half of 2021 as industries like travel, restaurants and entertainment come back online globally, building on a larger base of e-commerce advertisers. Our longer-term view is supported by revenue growth acceleration at Google Cloud, which suggests the cloud computing platform is gaining market share.
Shares of IQVIA, a healthcare services company, outperformed following better-than-expected results that underlined strong momentum in the company’s outsourced clinical research and healthcare technology businesses. Requests for proposals continued to increase, biotech funding was robust and clinical studies were able to progress with Covid-19 restrictions lifted in many regions. Looking ahead, we believe IQVIA’s differentiated data-driven offerings will enable the company to gain market share in key segments.
In fixed income, the Fund’s corporate credit allocation was a positive source of return during the period. Particularly helpful to performance were overweight allocations to the communications, consumer cyclical, transportation and energy sectors. Accommodative fiscal and monetary policy and strong corporate earnings helped to bolster the asset class.
Allocations to high yield corporate credit also contributed to performance. In particular, BB holdings contributed to results, generally outpacing higher-grade names as investors sought yield. Issuers within communications added value as cable and wireless operators continued to benefit from strong media and data demand.
Within the transportation sector, allocations to airline companies contributed to performance. Favored issuers, particularly in the US, benefited from government support throughout the pandemic. As vaccination rates improved and the economy began to reopen, the domestic market was further aided by pent-up consumer demand.
In equities, the largest detractors from return were Alibaba, Farfetch, and Nestle.
Shares of Alibaba, a Chinese e-commerce company, underperformed along with the broader Chinese technology sector due to increased regulatory actions by the Chinese government. Shares of Farfetch, a luxury goods marketplace platform, underperformed as physical stores reopened, moderating the surge in online shopping seen in 2020. Shares of Nestle, a multinational consumer packaged food company, underperformed over the period. We eliminated our position in early 2021 due to concerns around our intrinsic value growth alpha driver. We believe weakness in Nestle’s nutrition and confectionery businesses will continue, and margin growth will likely be pressured by increased investment around marketing. We found more attractive risk/reward within existing holdings and new opportunities.
In fixed income, allocations to US dollar fixed income markets detracted from performance. Allocations to US Treasuries in the ten and thirty-year maturity ranges were the primary detractors.
Positioning along the yield curve (which depicts the relationship among bond yields across the maturity spectrum) in the euro pay markets also detracted from performance as core euro zone government yields moved modestly higher in the period amid continued vaccination progress and optimism surrounding the economic recovery.
Although in line with the returns posted by the underlying cash bond markets, the Fund’s use of forward foreign currency contracts in managing relative exposures detracted from performance as currency markets experienced slightly higher levels of volatility in the period.
Finally, currency allocation detracted from performance, particularly exposure to the Japanese yen. Rising commodity prices, a stronger US dollar and slower-than-expected growth related to the pandemic proved to be a headwind for the yen.
Outlook
The economic outlook in large part continues to depend on the successful management of the pandemic on a global scale. While much of the developed world has made demonstrable progress in terms of infection rates, and some emerging markets have gained
| 10
LOOMIS SAYLES GLOBAL ALLOCATION FUND
better control of the virus, there remain regions that continue to struggle to manage the virus, such as Africa. The recent increase in vaccine production is positive, but with a lack of consensus on duration of antibodies and the potential for new variants, uncertainty persists. The outlook is also reliant on the duration of fiscal and monetary support, and other relief packages, in the US and globally. Supply chain issues and inflation surprises remain risks. Thus, our focus remains on investing in companies we believe have the ability to successfully navigate the current environment and generate value over the longer term.
In equities, we currently hold a diverse group of technology names spanning digital payments, cloud storage and collaboration, and semiconductor manufacturing and equipment. We have selective exposure to consumer-related names, focusing on best-in-class e-commerce platform retailers and physical retailers with compelling value propositions. We also have exposure to the growing online fitness industry. We have focused our healthcare exposure toward higher growth areas in the industry, and away from areas that are exposed to reimbursement risk. We continue to have no direct exposure to the energy or utilities sectors, as we typically do not find many opportunities, which meet our three alpha drivers.
As the pandemic continues to evolve, there could be further volatility in global equities. However, we believe our portfolio companies have sustainable competitive advantages and strong balance sheets that will prove resilient. This is evidenced by the portfolio’s return on equity, which is meaningfully higher than the MSCI ACWI (Net) benchmark,1 and financial leverage which is significantly less than the benchmark by key measures. This profile should allow our holdings the flexibility to weather challenging environments, and quite possibly emerge stronger.
In fixed income, most major developed market government bonds are expensive and we think yields are likely to see some upside pressure as the cyclical upturn gradually progresses, output gaps compress, and central banks look to move towards policy normalization. Although investment grade corporate credit spreads look fair-to-slightly-rich, we still like the yield advantage they offer. The fundamental backdrop underpinned by solid corporate profit growth and technical backdrop remain supportive.
Our primary US dollar view is for moderate softening as global growth starts to catch up to the US. Healthy investor risk appetites and cyclical improvement abroad are typically consistent with a weaker dollar. Rising twin deficits and higher commodities prices are additional headwinds for the dollar.
| 1 | The MSCI All Country World Index (Net) is a free float-adjusted market capitalization weighted index that is designed to measure the equity market performance of developed and emerging markets. |
Hypothetical Growth of $100,000 Investment in Class Y Shares4
September 30, 2011 through September 30, 2021
11 |
Top Ten Holdings as of September 30, 2021
| Security Name | % of Net Assets | |||||||
| 1 | ASML Holding NV | 3.52 | % | |||||
| 2 | Airbnb, Inc., Class A | 3.32 | ||||||
| 3 | Danaher Corp. | 3.15 | ||||||
| 4 | Amazon.com, Inc. | 2.91 | ||||||
| 5 | salesforce.com, Inc. | 2.83 | ||||||
| 6 | IQVIA Holdings, Inc. | 2.67 | ||||||
| 7 | Alphabet, Inc., Class A | 2.66 | ||||||
| 8 | S&P Global, Inc. | 2.48 | ||||||
| 9 | Facebook, Inc., Class A | 2.26 | ||||||
| 10 | Linde PLC | 2.23 | ||||||
The portfolio is actively managed and holdings are subject to change. There is no guarantee the Fund continues to invest in the securities referenced. The holdings listed exclude any temporary cash investments, are presented on an individual security basis and do not represent holdings of the issuer.
Average Annual Total Returns — September 30, 20214
| Life of Class N | Expense Ratios5 | |||||||||||||||||||||||
| 1 Year | 5 Years | 10 Years | Gross | Net | ||||||||||||||||||||
| Class Y (Inception 5/1/96) | ||||||||||||||||||||||||
| NAV | 17.02 | % | 12.47 | % | 11.31 | % | — | 0.90 | % | 0.90 | % | |||||||||||||
| Class A (Inception 2/1/06) | ||||||||||||||||||||||||
| NAV | 16.73 | 12.18 | 11.03 | — | 1.15 | 1.15 | ||||||||||||||||||
| With 5.75% Maximum Sales Charge | 10.02 | 10.86 | 10.38 | — | ||||||||||||||||||||
| Class C (Inception 2/1/06) | ||||||||||||||||||||||||
| NAV | 15.85 | 11.34 | 10.37 | — | 1.90 | 1.90 | ||||||||||||||||||
| With CDSC1 | 14.85 | 11.34 | 10.37 | — | ||||||||||||||||||||
| Class N (Inception 2/1/17) | ||||||||||||||||||||||||
| NAV | 17.10 | — | — | 13.25 | 0.82 | 0.82 | ||||||||||||||||||
| Comparative Performance | ||||||||||||||||||||||||
| MSCI All Country World Index (Net) | 27.44 | 13.20 | 11.90 | 13.20 | ||||||||||||||||||||
| Blended Index3 | 15.48 | 8.83 | 7.99 | 9.52 | ||||||||||||||||||||
Performance data shown represents past performance and is no guarantee of, and not necessarily indicative of, future results. Total return and value will vary, and you may have a gain or loss when shares are sold. Current performance may be lower or higher than quoted. For most recent month-end performance, visit im.natixis.com. Performance for other share classes will be greater or less than shown based on differences in fees and sales charges. You may not invest directly in an index. Performance for periods less than one year is cumulative, not annualized. Returns reflect changes in share price and reinvestment of dividends and capital gains, if any. The table(s) do not reflect taxes shareholders might owe on any fund distributions or when they redeem their shares.
| 1 | Performance for Class C shares assumes a 1% contingent deferred sales charge (“CDSC”) applied when you sell shares within one year of purchase. |
| 2 | The MSCI All Country World Index (Net) is a free float-adjusted market capitalization weighted index that is designed to measure the equity market performance of developed and emerging markets. |
| 3 | The Blended Index is an unmanaged, blended index composed of the following weights: 60% MSCI All Country World Index (Net) and 40% Bloomberg Global Aggregate Bond Index. The Bloomberg Global Aggregate Bond Index provides a broad-based measure of the global investment-grade fixed income markets. The four major components of this index are the U.S. Aggregate, the Pan-European Aggregate, the Asian-Pacific Aggregate, and the Canadian Aggregate Indices. The index also includes Eurodollar and Euro-Yen corporate bonds, Canadian government, agency and corporate securities, and USD investment grade 144A securities. |
| 4 | Fund performance has been increased by fee waivers and/or expense reimbursements, if any, without which performance would have been lower. |
| 5 | Expense ratios are as shown in the Fund’s prospectus in effect as of the date of this report. The expense ratios for the current reporting period can be found in the Financial Highlights section of this report under Ratios to Average Net Assets. Net expenses reflect contractual expense limitations set to expire on 1/31/22. When a Fund’s expenses are below the limitation, gross and net expense ratios will be the same. See Note 6 of the Notes to Financial Statements for more information about the Fund’s expense limitations. |
| 12
LOOMIS SAYLES GROWTH FUND
| Manager | Symbols | |
| Aziz V. Hamzaogullari, CFA® | Class A LGRRX | |
| Loomis, Sayles & Company, L.P. | Class C LGRCX | |
| Class N LGRNX | ||
| Class Y LSGRX | ||
Investment Goal
The Fund seeks long-term growth of capital.
Market Conditions
The US equity market delivered strong returns over the period, with a confluence of positive factors contributing to the gain. As business conditions slowly returned to normal, following the rollout of vaccinations and the gradual reopening of the economy, economic growth and corporate earnings rebounded off their previously depressed levels. The US Federal Reserve and other major central banks kept interest rates at ultra-low levels and continued to pursue stimulative quantitative easing policies. Low rates, in addition to helping the economy recover, also depressed bond yields and may have made equities a more compelling investment alternative. Consumers and businesses also benefited from aggressive fiscal stimulus enacted by the US government. Together, these factors helped stocks overcome periodic bouts of volatility caused by issues such as rising inflation, new Covid-19 variants, and worries about the health of China’s economy.
Although investors’ style preferences experienced a number of shifts over the course of the year, value stocks outperformed growth. The bulk of the advantage occurred in the five months following the approval of a Covid-19 vaccine in early November 2020, a milestone that fueled investor enthusiasm for the more economically sensitive stocks typically represented in the value category. Small- and mid-cap stocks both strongly outpaced large caps, reflecting investors’ robust appetite for risk amid optimism about the economic outlook.
Performance Results
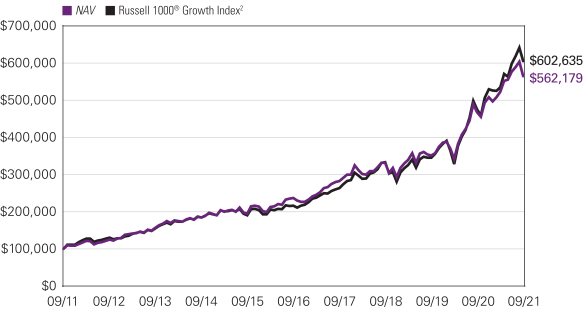
For the 12 months ended September 30, 2021, Class Y shares of the Loomis Sayles Growth Fund returned 20.72% at net asset value. The Fund underperformed its benchmark, the Russell 1000® Growth Index, which returned 27.32%.
Explanation of Fund Performance
We are an active manager with a long-term, private equity approach to investing. Through our proprietary bottom-up research framework, we look to invest in those few high-quality businesses with sustainable competitive advantages and profitable growth when they trade at a significant discount to intrinsic value. Given the rare confluence of quality, growth, and valuation, we may study dozens of companies but may only invest in a select few businesses each year. We believe identifying those few businesses with these characteristics is an art, not a science. Because of this rigorous approach, ours is a selective, high-conviction portfolio of typically 30-40 names.
The Fund’s positions in Alphabet, Nvidia, and Deere contributed the most to performance. Stock selection in the industrials and communication services sectors, along with our allocations in the communication services, energy, and healthcare sectors, contributed positively to relative performance.
Alphabet is a holding company that owns a collection of businesses — the largest and most important of which by far is Google. Google is the global leader in online search and advertising, and also offers online cloud solutions to businesses and consumers globally. We believe Alphabet’s competitive advantages include its scale, brand strength, the power of its network and business ecosystem, as well as its innovative culture that is reinforced by its massive investments in research and development (R&D). A long-term Fund holding, Alphabet reported financial results during the period that reflected a strong recovery in advertising spending, which had been depressed due to Covid-19, while revenue growth accelerated and adjusted operating margins expanded. Beginning in 2021, the company began presenting results in three segments. Google Services represents approximately 93% of total revenue and is driven by the secular shift of advertising to online and mobile platforms. The segment’s search and YouTube businesses both benefited from strong growth in direct response ads — particularly for YouTube, where in just three years direct response ads have grown from almost nothing to become one of the largest drivers. YouTube is also benefiting from strong demand from brand advertisers due to its reach and engagement with over 2 billion monthly users who spent over 1 billion hours daily on the platform. Google Cloud revenue represents approximately 7% of total revenue, and was driven by Google Cloud Platform, which encompasses the company’s infrastructure- and platform-as-a-service offerings. Other Bets includes a number of early-stage and pre-revenue businesses and represents less than 1% of revenues. Google’s attractive financial model generates strong free cash flow and earns high returns on
13 |
invested capital, enabling it to reinvest significantly in its business. Over the past five years, Google has invested over $100 billion in R&D, an amount very few companies could replicate. We believe the global secular shift from traditional advertising to online advertising is the biggest long-term growth driver for Google. Online advertising accounts for approximately $330 billion or around 20% of the $1.5 trillion annual spending on global advertising and marketing. Over our investment horizon, we believe this penetration will increase to over 40%. We believe investors underestimate Alphabet’s growth opportunities and the intrinsic value of the business given its unique and difficult-to-replicate attributes and business model. We believe the company’s shares trade at a significant discount to our estimate of intrinsic value and offer a compelling reward-to-risk opportunity.
Nvidia is the world leader in graphic processing units (GPUs), which enable computers to produce and utilize highly realistic 3D graphic imagery and models. We believe the company’s competitive advantages include its intellectual property, brands, and a large and growing ecosystem of developers and applications utilizing GPU technology. A portfolio holding since January 2019, Nvidia reported financial results during the period that were better than consensus expectations, driven by broad-based strength that included quarterly revenue records in the company’s gaming, data center, and professional visualization segments in the second half of the year. In gaming, Nvidia is benefiting from record sales of PCs and gaming laptops and the roll out of Turing, its newest GPU architecture, which is becoming the industry norm for the latest blockbuster titles. Data center revenue benefited from a pickup in demand from hyperscale data center customers and rising demand from industry verticals such as industrials and enterprise clients, which are adopting more artificial intelligence capabilities. The company saw strong traction for its latest architecture, Ampere, which for the first time enables clients to address both training and inferencing through a single architecture with performance that surpasses its already leading T4 inferencing and V100 training products. The company’s professional visualization segment addresses a more mature market, but Nvidia has been able to drive greater adoption of its products through ongoing innovation. Over our investment horizon, we believe Nvidia can sustain total annualized revenue growth of approximately 20%, driven by secular growth in spending on GPUs. As Nvidia’s business mix shifts increasingly towards its more profitable data center segment, we believe operating profits and free cash flow will grow faster than revenues. We believe Nvidia’s strong free cash flow growth prospects are not currently reflected in its share price. As a result, we believe the company’s shares trade at a significant discount to our estimate of intrinsic value and offer a compelling long-term reward-to-risk opportunity.
A Fund holding since the third quarter of 2016, Deere manufactures a full line of equipment used in agriculture, construction, forestry, and turf care, including value-added components such as precision agriculture tools. We believe the company’s competitive advantages include its iconic brand, scale, and global distribution. Deere’s distribution network of approximately 1,500 exclusive dealers in North America gives it unmatched reach for sales and service, and the company is among the market leaders in Europe and Latin America. During the period, Deere reported financial results that were well above consensus expectations and reflected strong global agricultural fundamentals, including grain prices that reached their highest levels since the prior cycle peak around 2012. The company also posted strong pricing gains and record margins. Despite strong growth in demand in 2021, agricultural equipment volumes have been near trough levels for the last seven years. Compared to the prior peak, average equipment age is at its highest in over 20 years, new and used inventories are near all-time lows, farmer incomes are expected to be higher, land values are also higher, and large agricultural equipment demands remain significantly below peak levels — all of which are conducive to above-average volume growth. Deere has seen very strong demand for sprayers, planters, and tractors in its 2022 order book, and the company expects its net pricing growth in 2022 to again be positive in spite of rising material and logistics costs. We believe Deere’s long-term secular growth driver is the global growth in demand for agricultural equipment, fueled by the steady increase in global demand for grains from a growing population with increasing affluence. We believe Deere’s market leadership, superior technology, and demonstrated pricing power leave it well positioned over our long-term investment horizon, and we believe continued adoption of its growing precision agricultural offerings, including subscription-based offerings, will lower cyclicality and enable the company to realize sustainably higher margins. We trimmed our position during the period following strong market appreciation, but we believe the company’s shares continue to trade at a discount to our estimate of intrinsic value.
The Fund’s positions in Alibaba, Vertex Pharmaceuticals, and Novartis detracted the most from performance. Stock selection in the consumer discretionary, healthcare, information technology, financials, consumer staples, and energy sectors, along with our allocations in the industrials, information technology, financials, and consumer staples sectors, detracted from relative performance.
A Fund holding since its initial public offering in the third quarter of 2014, Alibaba Group is a leading China e-commerce and consumer-engagement platform provider. With over 60% of China’s e-commerce transactions estimated to take place through its marketplaces, Alibaba is the world’s largest retail platform, and we believe Alibaba’s scale and interconnected sites create an unparalleled and difficult-to-replicate business ecosystem. During the period, Alibaba reported solid fundamentals and continued market share gains. However, shares have been under pressure since late-2020, despite good fundamentals, due to investor concern regarding increasing regulatory intervention by the Chinese government and the uncertainty these measures have created among investors questioning the ultimate impact on the businesses. In April, China’s State Administration for Market Regulation (SAMR) concluded that Alibaba’s practices had violated antitrust law. The company was fined approximately $2.8 billion and ordered to carry
| 14
LOOMIS SAYLES GROWTH FUND
out “comprehensive” self-inspections to standardize business practices and ensure compliance with anti-monopoly laws. Alibaba cooperated fully with the investigation and has changed certain business practices. Before the ruling, we believed that Alibaba could potentially be fined a meaningful percentage of prior-year revenue if it was found to have violated the rules. The $2.8 billion fine represented under 3% of FY 2021 revenues, approximately 20% of Alibaba’s free cash flow in the preceding quarter, and a fraction of the company’s approximately $70 billion of cash and short-term investments. We do not believe the investigation, fine, or any potential remedies will ultimately impact Alibaba’s strong and sustainable competitive advantages. In August, China passed the Personal Information Protection Law (PIPL) which is focused on protecting personal information rights and interests by standardizing the handling and usage of personal information by businesses. The law allows companies such as Alibaba to continue to collect, maintain, and use personalized data in their operations, but with certain restrictions. We believe the focus of PIPL is similar to the General Data Protection Regulation (GDPR) which went into effect in the European Union in 2018. The GDPR impacted other portfolio holdings such as Alphabet and Facebook, which incurred increased compliance costs and other disruptions as they adjusted certain business practices to comply with the new regulations. However, both companies continued to generate strong growth in revenue and free cash flow due to their competitive advantages and strong value propositions. While PIPL will go into effect beginning in November, we believe Alibaba has already started to implement portions of PIPL’s requirements into its business. As with Facebook and Google, we expect that Alibaba will experience other short-term disruptions as it further modifies its practices to fully comply with the law. However, we do not believe the law’s provisions will ultimately impact the company’s difficult-to-replicate competitive advantages. We believe SAMR and other Chinese regulatory efforts are focused on promoting sustainable and healthy development of China’s online ecosystem, fair competitive behavior, compliance with social responsibility, and setting reasonable limits on the usage of personal information. We believe that many of the companies to which the regulations pertain, including Alibaba, are engaged in activities that are supportive of the Chinese government’s long-term strategic goals. These goals include promoting domestic consumption as well as the development of domestic cloud technologies in order to reduce China’s dependence on foreign companies and countries. On both of these counts, Alibaba is a leader and its continued success advances those long-term goals. We believe Alibaba continues to execute well on its business model, allowing it to expand its already dominant market position and to invest to strengthen its competitive advantages. We believe the near-term uncertainty regarding the regulatory environment does not change the long-term fundamentals; namely, China remains one of the largest and most attractive e-commerce markets and Alibaba is one of the best-positioned companies to take advantage of this long-term secular opportunity. Many great businesses in our portfolio, including Microsoft, Google, Facebook, Visa, and others, have faced significant regulatory challenges around the globe over the last few decades, which often resulted in near-term uncertainty and share weakness. We recognize that the individual circumstances of these challenges had significant differences in terms of regulatory bodies and geographies. We also recognize that China offers both unique differences and challenges that we do not take lightly. However, while all of these situations are different, what is similar is that the uncertainty associated with these challenges did not change the strong underlying business characteristics of these companies; nor did it prevent them from continuing to generate strong long-term returns for shareholders. We believe the current market price embeds expectations for revenue and cash flow growth that are well below our long-term assumptions, and we added to our position in July, taking advantage of the long-term secular opportunity. With its shares trading at a significant discount to our estimate of intrinsic value, we believe Alibaba offers a compelling reward-to-risk opportunity.
Vertex Pharmaceuticals, founded in 1989, is a global biopharmaceutical company with deep expertise in protein and genetic science and a focus on specialty markets. The company is the leader in creating therapies for patients suffering from cystic fibrosis (CF), with four currently approved treatments, and the company is building out its capabilities to address related diseases that lever its core expertise in biology and medicinal chemistry. We initiated a new position in Vertex in June 2021. While the share price declined modestly during our holding period, given our short length of ownership, it was among the lowest contributors in a full-year period during which the Fund returned approximately 21.5% (gross). We believe Vertex’s strong and sustainable competitive advantages include its unparalleled understanding of CF, rooted in its history of investment and innovation for which it is recognized as setting the standard of care, its partnerships with the CF Foundation and other entities that enhance its solutions capabilities, and its broader understanding of biology and serial approach to drug development. Vertex created the only four therapies approved for CF, which currently account for all of the company’s revenues. Over our long-term investment horizon, we believe growing medical access, ongoing market penetration, lower patient mortality, and ongoing innovation will drive mid-single-digit growth in the company’s dominant CF franchise. We also believe the company’s deep understanding of biology, well-defined and disciplined approach to innovation, and growing pipeline of clinical therapies addressing diseases outside of CF, will collectively enable the company to realize high-single-digit growth in revenues over our forecast period. As the company continues to penetrate its core CF market, we expect it to realize operating leverage from its existing distribution infrastructure and for operating margins and free cash flow to grow faster than revenues, in the low double digits. We believe expectations embedded in Vertex’s share price underestimate the defensibility of its dominant CF franchise, the life-changing benefit of its therapies for its growing base of 40,000 patients, and the strength of its science and innovation ability that is contributing to a growing pipeline of potentially transformative therapies. We believe the shares embed expectations for revenue and free cash flow that are well below our long-term expectations. At today’s valuation, we believe we are buying the core, established CF franchise at a discount and receiving the pipeline for free. As a result, we believe the shares are trading at a significant discount to our estimate of intrinsic value and offer a compelling long-term reward-to-risk opportunity.
15 |
Novartis is a diversified global healthcare company with market leadership in branded and generic pharmaceuticals. The company’s Innovative Medicines division accounts for about 80% of total revenue and 85% of core operating income while the Sandoz generics and biosimilars division accounts for about 20% of revenue and approximately 15% of core operating income. We believe Novartis’ strong and sustainable competitive advantages include its brand, culture of innovation, product breadth, clinical trials expertise, powerful global manufacturing and distribution network, and the benefits of scale. Decades of investment in innovative research and development and the accumulation of intellectual property has resulted in a broad suite of mature, successful products, newer, differentiated, rapidly growing products, and a large, well-balanced clinical pipeline of approximately 75 new molecular entities that we believe will lay the foundation of growth for the next 10 years. A holding since 2010, Novartis reported financial results that were fundamentally solid but mixed versus consensus expectations during the period. Results were impacted earlier in the period by a decline in patient visits to physician offices due to Covid-19. Shares also declined in response to management’s guidance for lower margins due to increased investment spending. We view the market reaction to higher investment spending as short sighted as the company’s continued investments in innovation and its pipeline represent the cornerstone of its competitive differentiation and lay the groundwork for sustainable long-term revenue generation. We believe the company executed well during the period, which included strong performance in its “growth” portfolio that now accounts for over 50% of sales. Novartis remains a differentiated business that we believe will benefit from accelerating growth, continued solid execution, a structurally improving business, and a strong management team that is making sound strategic decisions to enable greater focus on the company’s long-term competitive advantages of brand, scale, technology, and innovation. We believe the company is focused on and executing in the right areas of growth to create long-term shareholder value, and the current stock price embeds future growth well below our forecasts. As a result, we believe the shares are selling at a significant discount to our estimate of intrinsic value and offer a compelling reward-to-risk opportunity.
All aspects of our quality-growth-valuation investment thesis must be present simultaneously for us to make an investment. Often our research is completed well in advance of the opportunity to invest. We are patient investors and maintain coverage of high-quality businesses in order to take advantage of meaningful price dislocations if and when they occur. During the period we initiated a new position in Vertex Pharmaceuticals. We added to our existing holdings in Alibaba, Boeing, Disney, Novartis, Schlumberger, and Starbucks. We trimmed our existing positions in Cerner, Deere, Expeditors International, and Qualcomm. We sold our position in Varian Medical Systems, which was in the process of being acquired by Siemens Healthineers and reached our view of intrinsic value.
Outlook
Our investment process is characterized by bottom-up, fundamental research and a long-term investment time horizon. The nature of the process leads to a lower-turnover portfolio in which sector positioning is the result of stock selection. The Fund ended the year with overweight positions in the healthcare, communication services, industrials, energy, financials, and consumer staples sectors and underweight positions in the information technology and consumer discretionary sectors. We did not own positions in the real estate, materials, or utilities sectors.
| 16
LOOMIS SAYLES GROWTH FUND
Hypothetical Growth of $100,000 Investment in Class Y Shares3
September 30, 2011 through September 30, 2021
Top Ten Holdings as of September 30, 2021
Security Name | % of Net Assets | |||||||
| 1 | NVIDIA Corp. | 6.60 | % | |||||
| 2 | Amazon.com, Inc. | 6.42 | ||||||
| 3 | Facebook, Inc., Class A | 6.25 | ||||||
| 4 | Visa, Inc., Class A | 5.18 | ||||||
| 5 | Microsoft Corp. | 4.67 | ||||||
| 6 | Oracle Corp. | 4.53 | ||||||
| 7 | Autodesk, Inc. | 4.33 | ||||||
| 8 | salesforce.com, Inc. | 4.17 | ||||||
| 9 | Boeing Co. (The) | 4.10 | ||||||
| 10 | Alphabet, Inc., Class A | 3.61 | ||||||
The portfolio is actively managed and holdings are subject to change. There is no guarantee the Fund continues to invest in the securities referenced. The holdings listed exclude any temporary cash investments, are presented on an individual security basis and do not represent holdings of the issuer.
17 |
Average Annual Total Returns — September 30, 20213
| Life of Class N | Expense Ratios4 | |||||||||||||||||||||||
| 1 Year | 5 Years | 10 Years | Gross | Net | ||||||||||||||||||||
| Class Y (Inception 5/16/91) | ||||||||||||||||||||||||
| NAV | 20.72 | % | 18.99 | % | 18.85 | % | — | 0.65 | % | 0.65 | % | |||||||||||||
| Class A (Inception 12/31/96) | ||||||||||||||||||||||||
| NAV | 20.43 | 18.69 | 18.56 | — | 0.90 | 0.90 | ||||||||||||||||||
| With 5.75% Maximum Sales Charge | 13.53 | 17.29 | 17.86 | — | ||||||||||||||||||||
| Class C (Inception 9/12/03) | ||||||||||||||||||||||||
| NAV | 19.55 | 17.79 | 17.84 | — | 1.65 | 1.65 | ||||||||||||||||||
| With CDSC1 | 18.55 | 17.79 | 17.84 | — | ||||||||||||||||||||
| Class N (Inception 2/1/13) | ||||||||||||||||||||||||
| NAV | 20.80 | 19.08 | — | 17.62 | 0.57 | 0.57 | ||||||||||||||||||
| Comparative Performance | ||||||||||||||||||||||||
| Russell 1000® Growth Index2 | 27.32 | 22.84 | 19.68 | 18.86 | ||||||||||||||||||||
Performance data shown represents past performance and is no guarantee of, and not necessarily indicative of, future results. Total return and value will vary, and you may have a gain or loss when shares are sold. Current performance may be lower or higher than quoted. For most recent month-end performance, visit im.natixis.com. Performance for other share classes will be greater or less than shown based on differences in fees and sales charges. You may not invest directly in an index. Performance for periods less than one year is cumulative, not annualized. Returns reflect changes in share price and reinvestment of dividends and capital gains, if any. The table(s) do not reflect taxes shareholders might owe on any fund distributions or when they redeem their shares.
| 1 | Performance for Class C shares assumes a 1% contingent deferred sales charge (“CDSC”) applied when you sell shares within one year of purchase. |
| 2 | The Russell 1000® Growth Index is an unmanaged index that measures the performance of the large-cap growth segment of the U.S. equity universe. It includes those Russell 1000® Growth Index companies with higher price-to-book ratios and higher forecasted growth values. |
| 3 | Fund performance has been increased by fee waivers and/or expense reimbursements, if any, without which performance would have been lower. |
| 4 | Expense ratios are as shown in the Fund’s prospectus in effect as of the date of this report. The expense ratios for the current reporting period can be found in the Financial Highlights section of this report under Ratios to Average Net Assets. Net expenses reflect contractual expense limitations set to expire on 1/31/22. When a Fund’s expenses are below the limitation, gross and net expense ratios will be the same. See Note 6 of the Notes to Financial Statements for more information about the Fund’s expense limitations. |
| 18
LOOMIS SAYLES INTERMEDIATE DURATION BOND FUND
| Managers | Symbols | |
| Daniel Conklin, CFA® | Class A LSDRX | |
| Christopher T. Harms | Class C LSCDX | |
| Clifton V. Rowe, CFA® | Class N LSDNX | |
| Class Y LSDIX | ||
| Loomis, Sayles & Company, L.P. | ||
Investment Goal
The Fund seeks above-average total return through a combination of current income and capital appreciation.
Market Conditions
The bond market experienced mixed returns over the period as investors reacted to the combination of improving economic growth, rising inflation and the increasing likelihood that the US Federal Reserve (Fed) and other central banks will need to begin tightening monetary policy in the coming year.
Following the approval and rollout of multiple vaccines for Covid-19 in late 2020 and early 2021, business conditions gradually returned to normal. Economic growth surged as a result, allaying fears that the virus would lead to a protracted slowdown. The reopening of the economy, while fueling impressive headline GDP growth, was accompanied by rising commodity prices, disruptions in the global supply chain and a sharp increase in inflation. Although the Fed initially described the rise in inflation as a “transitory” phenomenon, the persistence of price pressures through the summer and early autumn led to a gradual shift in the outlook. In September, Fed Chair Jerome Powell stated that the central bank was likely to announce a tapering of its stimulative quantitative easing (QE) program before the end of 2021. In addition, the markets began to price in a significant likelihood that the Fed will enact its first rate hike in late 2022. Together, these factors dampened returns across the fixed income market.
US Treasuries underperformed the broad fixed income market as risk appetite drastically improved over the past year. Mounting concerns over inflation and Fed policy also played a role in the rise in yields. While the prices of short-term government debt were relatively stable, longer-maturity bonds declined sharply. The yield on the 10-year note rose from 0.69% on September 30, 2020 to 1.52% on the final day of the period, and the 30-year bond moved from 1.46% to 2.08% (prices and yields move in opposite directions).
Despite the weakness in US Treasuries, investment grade corporates registered a solid gain for the 12-month period. As growth accelerated and the credit outlook improved, investors sought opportunities in higher-yielding segments of the market. Corporate yield spreads over Treasuries fell sharply as a result, leading to positive relative performance.
Securitized assets — including mortgage-backed securities (MBS), asset-backed securities (ABS) and commercial mortgage-backed securities (CMBS) — produced marginally negative total returns as a group but outpaced the US Treasury market. The category’s underlying fundamentals remained firm, however, with continued strength in both real estate prices and consumer credit. ABS and CMBS posted positive total returns, but MBS experienced small negative total returns due in part to its higher interest rate sensitivity.
Performance Results
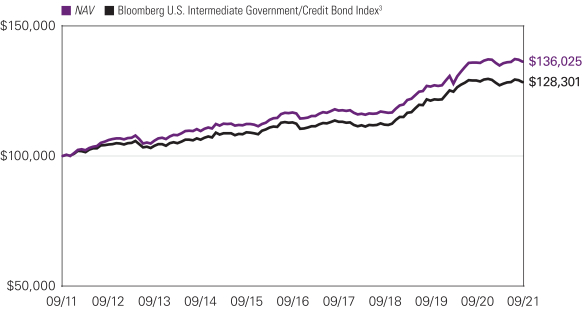
For the 12 months ended September 30, 2021, Class Y shares of the Fund returned 0.20% at net asset value. The Fund outperformed its benchmark, the Bloomberg U.S. Intermediate Government/Credit Bond Index, which returned -0.40%.
Explanation of Fund Performance
The Fund favored spread sectors such as corporate bonds and securitized assets, benefiting performance relative to the benchmark during a period of declining risk premiums. While sector allocation provided the bulk of positive contributions to performance, issuer selection also proved additive. The Fund’s overweight allocation to corporate bonds led positive contributions to performance over the period as spreads (the incremental income provided by lower quality bonds relative to Treasuries) declined. Issuer selection within corporates also aided return.
Results within securitized assets were positive overall but more mixed as agency-backed holdings detracted slightly while securitized credit exposures proved beneficial. In particular, holdings of CMBS were the most helpful to performance during the period.
On the downside, holdings of agency MBS detracted from relative performance during the period. Exposure to auto loans within ABS also weighed on return. Finally, within corporate bonds, issuer selection among banking names proved to be a constraint on performance.
19 |
Outlook
We believe the Fed will remain accommodative for the foreseeable future, keeping the fed funds rate unchanged at the zero lower bound and anchoring the front end of the Treasury yield curve into 2023. We expect the Fed to address balance sheet policy later this year and tapering of bond purchases could be completed sometime in 2022. We continue to expect economic activity to be healthy but expectations have moderated from earlier this year as recent data suggests some bumpiness due to increasing Covid-19 Delta variant cases nationwide.
We believe the credit cycle1 is currently in the expansion phase, with strong corporate fundamentals and a healthy consumer supported by significant excess savings and easy financial conditions. We believe risk appetite should remain elevated given the strong expansionary environment, expectations for global growth and continued monetary accommodation.
Inflation is expected to be in the 2% to 2.5% range but could be elevated for some time or settle above this range. We expect tighter monetary conditions if inflation trends toward the higher end of the range while lower inflation could keep the Fed at bay longer.
Corporate debt levels are currently elevated but fundamentals are healthy with stable-to-improving margins and significant free cash flow in a number of industries. While valuations are not overly compelling, we may see some additional spread tightening given low expectations for losses.
We continue to favor spread sectors, such as corporate bonds and securitized assets. However, we are maintaining a risk posture in the lower end of our range, in a similar posture to the beginning of 2020.
We remain overweight in both agency and non-agency CMBS, particularly senior parts of the capital stack.
Within MBS, we remain focused on securities with limited prepayment risk.
We favor ABS in the front end of the curve and prefer consumer-related areas such as auto loans and credit card receivables.
We continue to follow our process in building diversified exposures by asset class, industry and issuer.
We continue to hold select high yield corporate names, which we view as inexpensive.
| 1 | A credit cycle is a cyclical pattern that follows credit availability and corporate health. |
Hypothetical Growth of $100,000 Investment in Class Y Shares1,4
September 30, 2011 through September 30, 2021
See notes to chart on page 21.
| 20
LOOMIS SAYLES INTERMEDIATE DURATION BOND FUND
Average Annual Total Returns — September 30, 20214
Life of Class N | Expense Ratios5 | |||||||||||||||||||||||
| 1 Year | 5 Years | 10 Years | Gross | Net | ||||||||||||||||||||
| Class Y (Inception 1/28/98)1 | ||||||||||||||||||||||||
| NAV | 0.20 | % | 3.13 | % | 3.12 | % | — | 0.47 | % | 0.40 | % | |||||||||||||
| Class A (Inception 5/28/10)1 | ||||||||||||||||||||||||
| NAV | -0.06 | 2.87 | 2.85 | — | 0.72 | 0.65 | ||||||||||||||||||
| With 4.25% Maximum Sales Charge | -4.32 | 1.97 | 2.40 | — | ||||||||||||||||||||
| Class C (Inception 8/31/16)1 | ||||||||||||||||||||||||
| NAV | -0.76 | 2.09 | 2.19 | — | 1.46 | 1.40 | ||||||||||||||||||
| With CDSC2 | -1.72 | 2.09 | 2.19 | — | ||||||||||||||||||||
Class N (Inception 2/01/19) | | 0.25 | | — | — | 5.16 | 0.43 | 0.35 | ||||||||||||||||
| Comparative Performance | ||||||||||||||||||||||||
Bloomberg U.S. Intermediate Government/Credit Bond Index3 | -0.40 | 2.60 | 2.52 | 4.31 | ||||||||||||||||||||
Performance data shown represents past performance and is no guarantee of, and not necessarily indicative of, future results. Total return and value will vary, and you may have a gain or loss when shares are sold. Current performance may be lower or higher than quoted. For most recent month-end performance, visit im.natixis.com. Performance for other share classes will be greater or less than shown based on differences in fees and sales charges. You may not invest directly in an index. Performance for periods less than one year is cumulative, not annualized. Returns reflect changes in share price and reinvestment of dividends and capital gains, if any. The table(s) do not reflect taxes shareholders might owe on any fund distributions or when they redeem their shares.
| 1 | As of August 31, 2016, the Fund’s Retail Class shares and Institutional Class shares were redesignated as Class A shares and Class Y shares, respectively. Accordingly, the returns shown in the table for Class A shares prior to August 31, 2016 are those of Retail Class shares, restated to reflect the sales loads of Class A shares, and the returns in the table for Class Y shares prior to August 31, 2016 are those of Institutional Class shares. |
| 2 | Class C shares performance assumes a 1% CDSC applied when you sell shares within one year of purchase. |
| 3 | The Bloomberg U.S. Intermediate Government/Credit Bond Index includes securities in the intermediate maturity range within the Government and Credit Indices. The Government Index includes treasuries (i.e., public obligations of the U.S. Treasury that have remaining maturities of more than one year) and agencies (i.e., publicly issued debt of U.S. Government agencies, quasi-federal corporations, and corporate or foreign debt guaranteed by the U.S. Government). The Credit Index includes publicly issued U.S. corporate and foreign debentures and secured notes that meet specified maturity, liquidity, and quality requirements. |
| 4 | Fund performance has been increased by fee waivers and/or expense reimbursements, if any, without which performance would have been lower. |
| 5 | Expense ratios are as shown in the Fund’s prospectus in effect as of the date of this report. The expense ratios for the current reporting period can be found in the Financial Highlights section of this report under Ratios to Average Net Assets. Net expenses reflect contractual expense limitations set to expire on 1/31/22. When a Fund’s expenses are below the limitation, gross and net expense ratios will be the same. See Note 6 of the Notes to Financial Statements for more information about the Fund’s expense limitations. |
21 |
LOOMIS SAYLES LIMITED TERM GOVERNMENT AND AGENCY FUND
| Managers | Symbols | |
| Daniel Conklin, CFA® | Class A NEFLX | |
| Christopher T. Harms | Class C NECLX | |
| Clifton V. Rowe, CFA® | Class N LGANX | |
| Class Y NELYX | ||
| Loomis, Sayles & Company, L.P. | ||
Investment Goal
The Fund seeks high current return consistent with preservation of capital.
Market Conditions
The bond market experienced mixed returns over the period, as investors reacted to the combination of improving economic growth, rising inflation and the increasing likelihood that the US Federal Reserve (Fed) and other central banks will need to begin tightening monetary policy in the coming year.
Following the approval and rollout of multiple vaccines for Covid-19 in late 2020 and early 2021, business conditions gradually returned to normal. Economic growth surged as a result, allaying fears that the virus would lead to a protracted slowdown. The reopening of the economy, while fueling impressive headline GDP growth, was accompanied by rising commodity prices, disruptions in the global supply chain and a sharp increase in inflation. Although the Fed initially described the rise in inflation as a “transitory” phenomenon, the persistence of price pressures through the summer and early autumn led to a gradual shift in the outlook. In September, Fed Chair Jerome Powell stated that the central bank was likely to announce a tapering of its stimulative quantitative easing (QE) program before the end of 2021. In addition, the markets began to price in a significant likelihood that the Fed will enact its first rate hike in late 2022. Together, these factors dampened returns across the fixed income market.
US Treasuries underperformed the broad fixed income market as risk appetite drastically improved over the past year. Mounting concerns over inflation and Fed policy also played a role in the rise in yields. While the prices of short-term government debt were relatively stable, longer-maturity bonds declined sharply. The yield on the 10-year note rose from 0.69% on September 30, 2020, to 1.52% on the final day of the period, and the 30-year bond moved from 1.46% to 2.08% (prices and yields move in opposite directions).
Securitized assets — including mortgage-backed securities (MBS), asset-backed securities (ABS) and commercial mortgage-backed securities (CMBS) — produced marginally negative total returns as a group but outpaced the US Treasury market. The category’s underlying fundamentals remained firm, however, with continued strength in both real estate prices and consumer credit. ABS and CMBS posted positive total returns, but MBS experienced small negative total returns due in part to its higher interest rate sensitivity.
Performance Review
For the 12 months ended September 30, 2021, Class Y shares of the Limited Term Government and Agency Fund returned -0.33% at net asset value. The Fund held up better than its benchmark, the Bloomberg U.S. 1-5 Year Government Bond Index, which returned -0.43%.
Explanation of Fund Performance
The Fund’s security selection within agency-backed securitized assets was a leading positive contributor to performance relative to the benchmark for the 12 months, most notably holdings of agency CMBS and collateralized mortgage obligations. Within non-agency securitized assets, holdings of ABS and CMBS contributed positively.
Asset allocation decisions were a slight constraint in relative return for the period due to an underweight to US agency securities. The Fund’s cash position was also a slight detractor.
The Fund’s positioning along the yield curve (which depicts the relationship among bond yields across the maturity spectrum) detracted from performance during the period.
Outlook
Agency MBS spreads (the difference in yield between agency MBS and Treasuries of similar maturity) have declined below their longer-term averages. We continue to favor MBS sectors less likely to face refinancing and extension risk, such as low loan balance mortgages and home equity conversion mortgages. Within the commercial real estate sector, we have focused on agency CMBS
| 22
LOOMIS SAYLES LIMITED TERM GOVERNMENT AND AGENCY FUND
opportunities. Our non-agency securitized exposures remain steady, although we have marginally adjusted upward exposure to ABS relative to CMBS. The ABS market has recovered faster than CMBS, and we continue to find opportunities that offer strong credit quality and enhanced yield.
Hypothetical Growth of $100,000 Investment in Class Y Shares3
September 30, 2011 through September 30, 2021
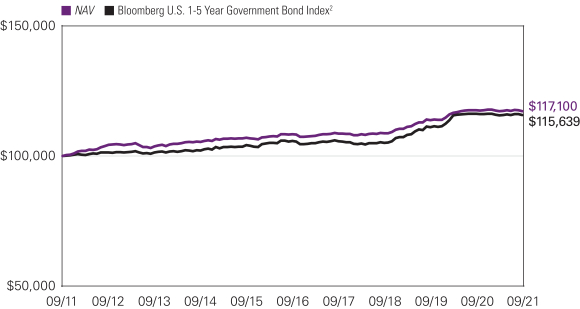
23 |
Average Annual Total Returns — September 30, 20213
| Life of Class N | Expense Ratios4 | |||||||||||||||||||||||
| 1 Year | 5 Years | 10 Years | Gross | Net | ||||||||||||||||||||
| Class Y (Inception 3/31/94) | ||||||||||||||||||||||||
| NAV | -0.33 | % | 1.58 | % | 1.59 | % | — | 0.49 | % | 0.49 | % | |||||||||||||
| Class A (Inception 1/3/89) | ||||||||||||||||||||||||
| NAV | -0.58 | 1.34 | 1.34 | — | 0.74 | 0.74 | ||||||||||||||||||
| With 2.25% Maximum Sales Charge | -2.85 | 0.89 | 1.11 | — | ||||||||||||||||||||
| Class C (Inception 12/30/94) | ||||||||||||||||||||||||
| NAV | -1.35 | 0.57 | 0.74 | — | 1.49 | 1.49 | ||||||||||||||||||
| With CDSC1 | -2.34 | 0.57 | 0.74 | — | ||||||||||||||||||||
| Class N (Inception 2/1/17) | ||||||||||||||||||||||||
| NAV | -0.25 | — | — | 1.97 | 0.42 | 0.41 | ||||||||||||||||||
| Comparative Performance | ||||||||||||||||||||||||
| Bloomberg U.S. 1-5 Year Government Bond Index2 | -0.43 | 1.82 | 1.46 | 2.16 | ||||||||||||||||||||
Performance data shown represents past performance and is no guarantee of, and not necessarily indicative of, future results. Total return and value will vary, and you may have a gain or loss when shares are sold. Current performance may be lower or higher than quoted. For most recent month-end performance, visit im.natixis.com. Performance for other share classes will be greater or less than shown based on differences in fees and sales charges. You may not invest directly in an index. Performance for periods less than one year is cumulative, not annualized. Returns reflect changes in share price and reinvestment of dividends and capital gains, if any. The table(s) do not reflect taxes shareholders might owe on any fund distributions or when they redeem their shares.
| 1 | Class C shares performance assumes a 1% CDSC applied when you sell shares within one year of purchase. |
| 2 | The Bloomberg U.S. 1-5 Year Government Bond Index is a subindex of the Bloomberg U.S. Government Index, which is comprised of the Bloomberg U.S. Treasury and U.S. Agency Indices. The Bloomberg U.S. Government Index includes Treasuries (public obligations of the U.S. Treasury that have remaining maturities of more than one year) and U.S. agency debentures (publicly issued debt of U.S. government agencies, quasi-federal corporations, and corporate or foreign debt guaranteed by the U.S. government). The Bloomberg U.S. Government Index is a component of the Bloomberg U.S. Government/Credit Index and the Bloomberg U.S. Aggregate Bond Index. |
| 3 | Fund performance has been increased by fee waivers and/or expense reimbursements, if any, without which performance would have been lower. |
| 4 | Expense ratios are as shown in the Fund’s prospectus in effect as of the date of this report. The expense ratios for the current reporting period can be found in the Financial Highlights section of this report under Ratios to Average Net Assets. Net expenses reflect contractual expense limitations set to expire on 1/31/22. When a Fund’s expenses are below the limitation, gross and net expense ratios will be the same. See Note 6 of the Notes to Financial Statements for more information about the Fund’s expense limitations. |
| 24
ADDITIONAL INFORMATION
The views expressed in this report reflect those of the portfolio managers as of the dates indicated. The managers’ views are subject to change at any time without notice based on changes in market or other conditions. References to specific securities or industries should not be regarded as investment advice. Because the Fund is actively managed, there is no assurance that they will continue to invest in the securities or industries mentioned.
All investing involves risk, including the risk of loss. There is no assurance that any investment will meet its performance objectives or that losses will be avoided.
ADDITIONAL INDEX INFORMATION
This document may contain references to third party copyrights, indexes, and trademarks, each of which is the property of its respective owner. Such owner is not affiliated with Natixis Investment Managers or any of its related or affiliated companies (collectively “Natixis Affiliates”) and does not sponsor, endorse or participate in the provision of any Natixis Affiliates services, funds or other financial products.
The index information contained herein is derived from third parties and is provided on an “as is” basis. The user of this information assumes the entire risk of use of this information. Each of the third party entities involved in compiling, computing or creating index information disclaims all warranties (including, without limitation, any warranties of originality, accuracy, completeness, timeliness, non-infringement, merchantability and fitness for a particular purpose) with respect to such information.
PROXY VOTING INFORMATION
A description of the Natixis Funds’ proxy voting policies and procedures is available without charge, upon request, by calling Natixis Funds at 800-225-5478; on the Fund’s website at im.natixis.com; and on the Securities and Exchange Commission’s (“SEC’s”) website at www.sec.gov. Information regarding how the Fund voted proxies relating to portfolio securities during the most recent 12-month period ended June 30 is available from the Fund’s website and the SEC’s website.
QUARTERLY PORTFOLIO SCHEDULES
The Natixis Funds file a complete schedule of portfolio holdings with the SEC for the first and third quarters of each fiscal year as an exhibit to its reports on Form N-PORT. The Funds’ Form N-PORT reports are available on the SEC’s website at www.sec.gov. First and third quarter schedules of portfolio holdings are also available at im.natixis.com/funddocuments. A hard copy may be requested from the Fund at no charge by calling 800-225-5478.
CFA® and Chartered Financial Analyst® are registered trademarks owned by the CFA Institute.
25 |
UNDERSTANDING FUND EXPENSES
As a mutual fund shareholder, you incur different costs: transaction costs, including sales charges (loads) on purchases and contingent deferred sales charges on redemptions; and ongoing costs, including management fees, distribution and/or service fees (12b-1 fees), and other fund expenses. Certain exemptions may apply. These costs are described in more detail in the Fund’s prospectuses. The following examples are intended to help you understand the ongoing costs of investing in the Fund and help you compare these with the ongoing costs of investing in other mutual funds.
The first line in the table of each class of Fund shares shows the actual account values and actual fund expenses you would have paid on a $1,000 investment in the Fund from April 1, 2021 through September 30, 2021. To estimate the expenses you paid over the period, simply divide your account value by $1,000 (for example $8,600 account value divided by $1,000 = 8.6) and multiply the result by the number in the Expenses Paid During Period column as shown below for your class.
The second line in the table of each class of Fund shares provides information about hypothetical account values and hypothetical expenses based on the Fund’s actual expense ratios and an assumed rate of return of 5% per year before expenses, which is not the Fund’s actual return. The hypothetical account values and expenses may not be used to estimate the actual ending account balance or expenses you paid on your investment for the period. You may use this information to compare the ongoing costs of investing in the Fund to other funds. To do so, compare this 5% hypothetical example with the 5% hypothetical examples that appear in the shareholder reports of the other funds.
Please note that the expenses shown reflect ongoing costs only, and do not include any transaction costs, such as sales charges. Therefore, the second line in the table of the fund is useful in comparing ongoing costs only, and will not help you determine the relative costs of owning different funds. If transaction costs were included, total costs would be higher.
| LOOMIS SAYLES CORE PLUS BOND FUND | BEGINNING ACCOUNT VALUE 4/1/2021 | ENDING ACCOUNT VALUE 9/30/2021 | EXPENSES PAID DURING PERIOD* 4/1/2021 – 9/30/2021 | |||||||||
| Class A | ||||||||||||
| Actual | $1,000.00 | $1,018.20 | $3.64 | |||||||||
| Hypothetical (5% return before expenses) | $1,000.00 | $1,021.46 | $3.65 | |||||||||
| Class C | ||||||||||||
| Actual | $1,000.00 | $1,015.00 | $7.43 | |||||||||
| Hypothetical (5% return before expenses) | $1,000.00 | $1,017.70 | $7.44 | |||||||||
| Class N | ||||||||||||
| Actual | $1,000.00 | $1,020.60 | $1.92 | |||||||||
| Hypothetical (5% return before expenses) | $1,000.00 | $1,023.16 | $1.93 | |||||||||
| Class Y | ||||||||||||
| Actual | $1,000.00 | $1,020.10 | $2.38 | |||||||||
| Hypothetical (5% return before expenses) | $1,000.00 | $1,022.71 | $2.38 | |||||||||
| * | Expenses are equal to the Fund’s annualized expense ratio: 0.72%, 1.47%, 0.38% and 0.47% for Class A, C, N and Y, respectively, multiplied by the average account value over the period, multiplied by the number of days in the most recent fiscal half-year (183), divided by 365 (to reflect the half-year period). |
| 26
| LOOMIS SAYLES CREDIT INCOME FUND | BEGINNING ACCOUNT VALUE 4/1/2021 | ENDING ACCOUNT VALUE 9/30/2021 | EXPENSES PAID DURING PERIOD* 4/1/2021 – 9/30/2021 | |||||||||
| Class A | ||||||||||||
| Actual | $1,000.00 | $1,030.40 | $4.17 | |||||||||
| Hypothetical (5% return before expenses) | $1,000.00 | $1,020.96 | $4.15 | |||||||||
| Class C | ||||||||||||
| Actual | $1,000.00 | $1,026.50 | $7.98 | |||||||||
| Hypothetical (5% return before expenses) | $1,000.00 | $1,017.20 | $7.94 | |||||||||
| Class N | ||||||||||||
| Actual | $1,000.00 | $1,033.10 | $2.65 | |||||||||
| Hypothetical (5% return before expenses) | $1,000.00 | $1,022.46 | $2.64 | |||||||||
| Class Y | ||||||||||||
| Actual | $1,000.00 | $1,031.80 | $2.90 | |||||||||
| Hypothetical (5% return before expenses) | $1,000.00 | $1,022.21 | $2.89 | |||||||||
| * | Expenses are equal to the Fund’s annualized expense ratio (after waiver/reimbursement): 0.82%, 1.57%, 0.52% and 0.57% for Class A, C, N and Y, respectively, multiplied by the average account value over the period, multiplied by the number of days in the most recent fiscal half-year (183), divided by 365 (to reflect the half-year period). |
| LOOMIS SAYLES GLOBAL ALLOCATION FUND | BEGINNING ACCOUNT VALUE 4/1/2021 | ENDING ACCOUNT VALUE 9/30/2021 | EXPENSES PAID DURING PERIOD* 4/1/2021 – 9/30/2021 | |||||||||
| Class A | ||||||||||||
| Actual | $1,000.00 | $1,066.10 | $5.85 | |||||||||
| Hypothetical (5% return before expenses) | $1,000.00 | $1,019.40 | $5.72 | |||||||||
| Class C | ||||||||||||
| Actual | $1,000.00 | $1,061.60 | $9.72 | |||||||||
| Hypothetical (5% return before expenses) | $1,000.00 | $1,015.64 | $9.50 | |||||||||
| Class N | ||||||||||||
| Actual | $1,000.00 | $1,067.50 | $4.20 | |||||||||
| Hypothetical (5% return before expenses) | $1,000.00 | $1,021.01 | $4.10 | |||||||||
| Class Y | ||||||||||||
| Actual | $1,000.00 | $1,067.10 | $4.56 | |||||||||
| Hypothetical (5% return before expenses) | $1,000.00 | $1,020.66 | $4.46 | |||||||||
| * | Expenses are equal to the Fund’s annualized expense ratio: 1.13%, 1.88%, 0.81% and 0.88% for Class A, C, N and Y, respectively, multiplied by the average account value over the period, multiplied by the number of days in the most recent fiscal half-year (183), divided by 365 (to reflect the half-year period). |
27 |
| LOOMIS SAYLES GROWTH FUND | BEGINNING ACCOUNT VALUE 4/1/2021 | ENDING ACCOUNT VALUE 9/30/2021 | EXPENSES PAID DURING PERIOD* 4/1/2021 – 9/30/2021 | |||||||||
| Class A | ||||||||||||
| Actual | $1,000.00 | $1,078.70 | $4.59 | |||||||||
| Hypothetical (5% return before expenses) | $1,000.00 | $1,020.66 | $4.46 | |||||||||
| Class C | ||||||||||||
| Actual | $1,000.00 | $1,074.50 | $8.48 | |||||||||
| Hypothetical (5% return before expenses) | $1,000.00 | $1,016.90 | $8.24 | |||||||||
| Class N | ||||||||||||
| Actual | $1,000.00 | $1,080.60 | $2.92 | |||||||||
| Hypothetical (5% return before expenses) | $1,000.00 | $1,022.26 | $2.84 | |||||||||
| Class Y | ||||||||||||
| Actual | $1,000.00 | $1,080.20 | $3.29 | |||||||||
| Hypothetical (5% return before expenses) | $1,000.00 | $1,021.91 | $3.19 | |||||||||
| * | Expenses are equal to the Fund’s annualized expense ratio: 0.88%, 1.63%, 0.56% and 0.63% for Class A, C, N and Y, respectively, multiplied by the average account value over the period, multiplied by the number of days in the most recent fiscal half-year (183), divided by 365 (to reflect the half-year period). |
| LOOMIS SAYLES INTERMEDIATE DURATION BOND FUND | BEGINNING ACCOUNT VALUE 4/1/2021 | ENDING ACCOUNT VALUE 9/30/2021 | EXPENSES PAID DURING PERIOD* 4/1/2021 – 9/30/2021 | |||||||||
| Class A | ||||||||||||
| Actual | $1,000.00 | $1,009.10 | $3.27 | |||||||||
| Hypothetical (5% return before expenses) | $1,000.00 | $1,021.81 | $3.29 | |||||||||
| Class C | ||||||||||||
| Actual | $1,000.00 | $1,005.80 | $7.04 | |||||||||
| Hypothetical (5% return before expenses) | $1,000.00 | $1,018.05 | $7.08 | |||||||||
| Class N | ||||||||||||
| Actual | $1,000.00 | $1,009.60 | $1.76 | |||||||||
| Hypothetical (5% return before expenses) | $1,000.00 | $1,023.31 | $1.78 | |||||||||
| Class Y | ||||||||||||
| Actual | $1,000.00 | $1,010.30 | $2.02 | |||||||||
| Hypothetical (5% return before expenses) | $1,000.00 | $1,023.06 | $2.03 | |||||||||
| * | Expenses are equal to the Fund’s annualized expense ratio (after waiver/reimbursement): 0.65%, 1.40%, 0.35% and 0.40% for Class A, C, N and Y, respectively, multiplied by the average account value over the period, multiplied by the number of days in the most recent fiscal half-year (183), divided by 365 (to reflect the half-year period). |
| 28
| LOOMIS SAYLES LIMITED TERM GOVERNMENT AND AGENCY FUND | BEGINNING ACCOUNT VALUE 4/1/2021 | ENDING ACCOUNT VALUE 9/30/2021 | EXPENSES PAID DURING PERIOD* 4/1/2021 – 9/30/2021 | |||||||||
| Class A | ||||||||||||
| Actual | $1,000.00 | $999.20 | $3.61 | |||||||||
| Hypothetical (5% return before expenses) | $1,000.00 | $1,021.46 | $3.65 | |||||||||
| Class C | ||||||||||||
| Actual | $1,000.00 | $994.80 | $7.35 | |||||||||
| Hypothetical (5% return before expenses) | $1,000.00 | $1,017.70 | $7.44 | |||||||||
| Class N | ||||||||||||
| Actual | $1,000.00 | $1,000.90 | $2.01 | |||||||||
| Hypothetical (5% return before expenses) | $1,000.00 | $1,023.06 | $2.03 | |||||||||
| Class Y | ||||||||||||
| Actual | $1,000.00 | $999.60 | $2.36 | |||||||||
| Hypothetical (5% return before expenses) | $1,000.00 | $1,022.71 | $2.38 | |||||||||
| * | Expenses are equal to the Fund’s annualized expense ratio (after waiver/reimbursement): 0.72%, 1.47%, 0.40% and 0.47% for Class A, C, N and Y, respectively, multiplied by the average account value over the period, multiplied by the number of days in the most recent fiscal half-year (183), divided by 365 (to reflect the half-year period). |
29 |
BOARD APPROVAL OF THE EXISTING ADVISORY AGREEMENTS
The Board of Trustees of the Trusts (the “Board”), including the Independent Trustees, considers matters bearing on each Fund’s advisory agreement (collectively, the “Agreements”) at most of its meetings throughout the year. Each year, usually in the spring, the Contract Review Committee of the Board meets to review the Agreements to determine whether to recommend that the full Board approve the continuation of the Agreements, typically for an additional one-year period. This meeting typically includes all the Independent Trustees, including the Trustees who do not serve on the Contract Review Committee. After the Contract Review Committee has made its recommendation, the full Board, including the Independent Trustees, determines whether to approve the continuation of the Agreements at its June board meeting. The Loomis Sayles Credit Income Fund was not included in the most recent annual review as the Fund’s initial board-approved investment advisory agreement is effective until September 29, 2022.
In connection with these meetings, the Trustees receive materials that the Funds’ investment adviser and Loomis Sayles Core Plus Bond Fund’s advisory administrator (the “Advisers”) believe to be reasonably necessary for the Trustees to evaluate the Agreements. These materials generally include, among other items, (i) information on the investment performance of the Funds and the performance of peer groups of funds and the Funds’ performance benchmarks, (ii) information on the Funds’ advisory fees and other expenses, including information comparing the Funds’ advisory fees to the fees charged to institutional accounts with similar strategies managed by the Advisers, if any, and to those of peer groups of funds and information about any applicable expense limitations and/or fee “breakpoints,” (iii) sales and redemption data in respect of the Funds, (iv) information about the profitability of the Agreements to the Advisers and (v) information obtained through the completion by the Advisers of a questionnaire distributed on behalf of the Trustees. The Board, including the Independent Trustees, also considers other matters such as (i) each Fund’s investment objective and strategies and the size, education and experience of the Advisers’ investment staffs and their use of technology, external research and trading cost measurement tools, (ii) arrangements in respect of the distribution of the Funds’ shares and the related costs, (iii) the allocation of the Funds’ brokerage, if any, including, to the extent applicable, the use of “soft” commission dollars to pay for research and other similar services, (iv) the Advisers’ policies and procedures relating to, among other things, compliance, trading and best execution, proxy voting, liquidity and valuation, (v) information about amounts invested by the Funds’ portfolio managers in the Funds or in similar accounts that they manage and (vi) the general economic outlook with particular emphasis on the mutual fund industry. Throughout the process, the Trustees are afforded the opportunity to ask questions of and request additional materials from the Advisers.
In addition to the materials requested by the Trustees in connection with their annual consideration of the continuation of the Agreements, the Trustees receive materials in advance of each regular quarterly meeting of the Board that provide detailed information about the Funds’ investment performance and the fees charged to the Funds for advisory and other services. This information generally includes, among other things, an internal performance rating for each Fund based on agreed-upon criteria, graphs showing each Fund’s performance and expense differentials against each Fund’s peer group/category of funds, performance ratings provided by a third-party, total return information for various periods, and third-party performance rankings for various periods comparing a Fund against similarly categorized funds. The portfolio management team for each Fund or other representatives of the Advisers make periodic presentations to the Contract Review Committee and/or the full Board, and Funds identified as presenting possible performance concerns may be subject to more frequent Board or Committee presentations and reviews. In addition, the Trustees are periodically provided with detailed statistical information about each Fund’s portfolio. The Trustees also receive periodic updates between meetings, both at the Board and at the Committee level.
The Board most recently approved the continuation of the Agreements for a one-year period at its meeting held in June 2021. In the case of each of Loomis Sayles Global Allocation Fund and Loomis Sayles Limited Term Government and Agency Fund, the Board approved the Agreement with an amendment that introduced an additional breakpoint in the Fund’s advisory fee effective July 1, 2021. In considering whether to approve the continuation of the Agreements, the Board, including the Independent Trustees, did not identify any single factor as determinative. Individual Trustees may have evaluated the information presented differently from one another, giving different weights to various factors. Matters considered by the Trustees, including the Independent Trustees, in connection with their approval of the Agreements included, but were not limited to, the factors listed below.
The nature, extent and quality of the services provided to the Funds under the Agreements. The Trustees considered the nature, extent and quality of the services provided by the Advisers and their affiliates to the Funds and the resources dedicated to the Funds by the Advisers and their affiliates. The Trustees also considered their experience with other funds advised or sub-advised by the Advisers, as well as the affiliation between the Advisers and Natixis Investment Managers, LLC, whose affiliates provide investment advisory services to other funds in the Natixis family of funds.
The Trustees considered not only the advisory services provided by the Advisers to the Funds, but also the benefits to the Funds from the monitoring and oversight services provided by Natixis Advisors, LLC (“Natixis Advisors”). They also considered the administrative and shareholder services provided by Natixis Advisors and its affiliates to the Funds. They also took into consideration increases in the services provided resulting from new regulatory requirements.
| 30
For each Fund, the Trustees also considered the benefits to shareholders of investing in a mutual fund that is part of a family of funds that offers shareholders the right to exchange shares of one type of fund for shares of another type of fund, and provides a variety of fund and shareholder services.
After reviewing these and related factors, the Trustees concluded, within the context of their overall conclusions regarding each of the Agreements, that the nature, extent and quality of services provided supported the renewal of the Agreements.
Investment performance of the Funds and the Advisers. As noted above, the Trustees received information about the performance of Loomis Sayles Core Plus Bond Fund, Loomis Sayles Global Allocation Fund, Loomis Sayles Growth Fund, Loomis Sayles Intermediate Duration Bond Fund and Loomis Sayles Limited Term Government and Agency Fund (the “Existing Funds”) over various time periods, including information that compared the performance of the Funds to the performance of peer groups and categories of funds and the Funds’ respective performance benchmarks. In addition, the Trustees reviewed data prepared by an independent third party that analyzed the performance of the Funds using a variety of performance metrics, including metrics that measured the performance of the Funds on a risk adjusted basis. The Trustees noted that the Loomis Sayles Credit Income Fund did not yet have one year of performance.
The Board noted that, through December 31, 2020, each Existing Fund’s one-, three- and five-year performance, stated as percentile rankings within categories selected by the independent third-party data provider, was as follows (where the best performance would be in the first percentile of its category):
| One-Year | Three-Year | Five-Year | ||||||||||
| Loomis Sayles Core Plus Bond Fund | 16 | % | 29 | % | 12 | % | ||||||
| Loomis Sayles Global Allocation Fund | 13 | % | 4 | % | 1 | % | ||||||
| Loomis Sayles Growth Fund | 62 | % | 66 | % | 46 | % | ||||||
| Loomis Sayles Intermediate Duration Bond Fund | 65 | % | 61 | % | 83 | % | ||||||
| Loomis Sayles Limited Term Government and Agency Fund | 43 | % | 45 | % | 42 | % | ||||||
In the case of a Fund that had performance that lagged that of a relevant category median as determined by the independent third party for certain (although not necessarily all) periods, the Board concluded that other factors relevant to performance supported renewal of the Agreements. These factors included one or more of the following: (1) that the underperformance was attributable, to a significant extent, to investment decisions (such as security selection or sector allocation) by the Advisers that were reasonable and consistent with the Fund’s investment objective and policies; (2) that the Fund’s more recent performance had resulted in relative outperformance over certain time periods; and (3) that the Fund had outperformed its relevant performance benchmark for all periods. The Board also considered information about the Funds’ more recent performance, including how that performance had been impacted by the Covid-19 crisis.
The Trustees also considered the Advisers’ performance and reputation generally, the performance of the fund family generally, and the historical responsiveness of the Advisers to Trustee concerns about performance and the willingness of the Advisers to take steps intended to improve performance.
After reviewing these and related factors, the Trustees concluded, within the context of their overall conclusions regarding each of the Agreements, that the performance of the Funds and the Advisers and/or other relevant factors supported the renewal of the Agreements.
The costs of the services to be provided and profits to be realized by the Advisers and their affiliates from their respective relationships with the Funds. The Trustees considered the fees charged to the Funds for advisory and administrative services as well as the total expense levels of the Funds. This information included comparisons (provided both by management and by an independent third party) of the Funds’ advisory fees and total expense levels to those of their peer groups and information about the advisory fees charged by the Advisers to comparable accounts (such as institutional separate accounts), as well as information about differences in such fees and the reasons for any such differences. In considering the fees charged to comparable accounts, the Trustees considered, among other things, management’s representations about the differences between managing mutual funds as compared to other types of accounts, including the additional resources required to effectively manage mutual fund assets, the greater regulatory costs associated with the management of such assets, and the entrepreneurial, regulatory and other risks associated with sponsoring and managing mutual funds. In evaluating each Fund’s advisory fee, the Trustees also took into account the demands, complexity and quality of the investment management of such Fund, as well as the need for the Advisers to offer competitive compensation and the potential need to expend additional resources to the extent the Fund grows in size. The Trustees considered that over the past several years, management had demonstrated its intention to have competitive fee levels by making recommendations regarding reductions in advisory fee rates, implementation of advisory fee breakpoints and the institution of advisory fee waivers and expense limitations for various funds in the fund family. They noted that the Funds have expense limitations in place, and they considered the amounts
31 |
waived or reimbursed by the Advisers for Loomis Sayles Credit Income Fund and Loomis Sayles Intermediate Duration Bond Fund under their respective expense limitation agreements. The Trustees also considered that the current expenses for Loomis Sayles Core Plus Bond Fund, Loomis Sayles Global Allocation Fund, Loomis Sayles Growth Fund, and Loomis Sayles Limited Term Government and Agency Fund were below each Fund’s limitation. They further noted that management had proposed to reduce the expense limitation for Loomis Sayles Limited Term Government and Agency Fund on all share classes, effective as of July 1, 2021. The Trustees also noted that the total advisory fee rate for each Fund was at or below the median of its peer group of funds. They further noted that management had proposed to amend the advisory fee for each of Loomis Sayles Global Allocation Fund and Loomis Sayles Limited Term Government and Agency Fund to introduce an additional breakpoint in each Fund’s advisory fee.
The Trustees also considered the compensation directly or indirectly received by the Advisers and their affiliates from their relationships with the Funds. The Trustees reviewed information provided by management as to the profitability of the Advisers’ and their affiliates’ relationships with the Funds, and information about how expenses are determined and allocated for purposes of profitability calculations. They also reviewed information provided by management about the effect of distribution costs and changes in asset levels on Adviser profitability, including information regarding resources spent on distribution activities. When reviewing profitability, the Trustees also considered information about court cases in which adviser compensation or profitability were issues, the performance of the Funds, the expense levels of the Funds, whether the Advisers had implemented breakpoints and/or expense limitations with respect to such Funds and the overall profit margin of Natixis Investment Managers, LLC compared to that of certain other investment managers for which such data was available.
After reviewing these and related factors, the Trustees concluded, within the context of their overall conclusions regarding each of the Agreements, that the advisory fee charged to each of the Funds was fair and reasonable, and that the costs of these services generally and the related profitability of the Advisers and their affiliates in respect of their relationships with the Funds supported the renewal of the Agreements.
Economies of Scale. The Trustees considered the existence of any economies of scale in the provision of services by the Advisers and whether those economies are shared with the Funds through breakpoints in their investment advisory fees or other means, such as expense limitations. The Trustees also considered management’s explanation of the factors that are taken into account with respect to the implementation of breakpoints in investment advisory fees or expense limitations. With respect to economies of scale, the Trustees noted that each of Loomis Sayles Core Plus Bond Fund, Loomis Sayles Global Allocation Fund and Loomis Sayles Limited Term Government and Agency Fund had breakpoints in its advisory fee and that each of the Funds was subject to an expense limitation. The Trustees also considered management’s proposal to reduce the expense limitation for Loomis Sayles Limited Term Government and Agency Fund. In considering these issues, the Trustees also took note of the costs of the services provided (both on an absolute and on a relative basis) and the profitability to the Advisers and their affiliates of their relationships with the Funds, as discussed above. The Trustees also considered that the Funds have benefitted from the substantial reinvestment each Adviser has made into its business.
After reviewing these and related factors, the Trustees concluded, within the context of their overall conclusions regarding the Agreements, that the extent to which economies of scale were shared with the Funds supported the renewal of the Agreements.
The Trustees also considered other factors, which included but were not limited to the following:
| • | The effect of recent market and economic events, including but not limited to the Covid-19 crisis and its significant disruptions to the economy and business operations, on the performance, asset levels and expense ratios of each Fund. |
| • | Whether each Fund has operated in accordance with its investment objective and the Fund’s record of compliance with its investment restrictions, and the compliance programs of the Funds and the Advisers. They also considered the compliance-related resources the Advisers and their affiliates were providing to the Funds. |
| • | So-called “fallout benefits” to the Advisers, such as the engagement of affiliates of the Advisers to provide distribution and administrative services to the Funds, and the benefits of research made available to the Advisers by reason of brokerage commissions (if any) generated by the Funds’ securities transactions. The Trustees also considered the benefits to the parent company of Natixis Advisors from the retention of the Advisers. The Trustees considered the possible conflicts of interest associated with these fallout and other benefits, and the reporting, disclosure and other processes in place to disclose and monitor such possible conflicts of interest. |
| • | The Trustees’ review and discussion of the Funds’ advisory arrangements in prior years, and management’s record of responding to Trustee concerns raised during the year and in prior years. |
Based on their evaluation of all factors that they deemed to be material, including those factors described above, and assisted by the advice of independent counsel, the Trustees, including the Independent Trustees, concluded that the existing Agreements, reflecting the amendments to the advisory fee schedule for each of Loomis Sayles Global Allocation Fund and Loomis Sayles Limited Term Government and Agency Fund described above, should be continued through June 30, 2022.
| 32
LIQUIDITY RISK MANAGEMENT PROGRAM
Annual Report for the Period Commencing on January 1, 2020 and ending December 31, 2020 (including updates through September 30, 2021)
Effective December 1, 2018 (September 29, 2020 for Credit Income Fund), the Funds adopted a liquidity risk management program (the “Program”) pursuant to the requirements of Rule 22e-4 under the Investment Company Act of 1940, as amended (the “Rule”). The Rule requires registered open-end funds, including mutual funds and exchange-traded funds to establish liquidity risk management programs in order to effectively manage fund liquidity and mitigate the risk that a fund could not meet redemption requests without significantly diluting the interests of remaining investors.
The rule requires the Funds to assess, manage and review their liquidity risk considering applicable factors during normal and foreseeable stressed conditions. In fulfilling this requirement, each Fund assesses and reviews (where applicable and amongst other matters) its investment strategy, portfolio holdings, possible investment concentrations, use of derivatives, short-term and long-term cash flow projections, use of cash and cash equivalents, as well as borrowing arrangements and other funding sources. Each Program has established a Program Administrator, which is the adviser or sub-adviser of the Fund.
In accordance with the Program, each of the Fund’s portfolio investments is classified into one of four liquidity categories based on a determination of a reasonable expectation for how long it would take to convert the investment to cash (or sell or dispose of the investment) without significantly changing its market value.
Each Fund is prohibited from acquiring an investment if, after the acquisition, its holdings of illiquid assets will exceed 15% of its net assets. If a Fund does not hold a majority of highly liquid investments in its portfolio, then the Fund is required to establish a highly liquid investment minimum (“HLIM”). Loomis Sayles Core Plus Bond Fund, Loomis Sayles Credit Income Fund and Loomis Sayles Intermediate Duration Bond Fund have established an HLIM.
During the period from January 1, 2020 to December 31, 2020, there were no material changes to the Program and no material events that impacted the operation of the Funds’ Programs. During the period, the Funds held sufficient liquid assets to meet redemptions on a timely basis and did not have any HLIM or illiquid security violations during the period.
During the period January 1, 2021 through September 30, 2021, the Funds held sufficient liquid assets to meet redemptions on a timely basis and did not have any HLIM or illiquid security violations.
Annual Program Assessment and Conclusion
In the opinion of the Program Administrators, the Program of each Fund approved by the Funds’ Board has been implemented effectively. The Program Administrator has also monitored, assessed and managed each Fund’s liquidity risk regularly and has determined that the Program is operating effectively.
Pursuant to the Rule’s requirements, the Board has received and reviewed a written report prepared by each Fund’s Program Administrator that addressed the operation of the Program, assessed its adequacy and effectiveness and described any material changes made to the Program.
33 |
Portfolio of Investments – as of September 30, 2021
Loomis Sayles Core Plus Bond Fund
| Principal Amount (‡) | Description | Value (†) | ||||||
| Bonds and Notes — 91.6% of Net Assets | ||||||||
| Non-Convertible Bonds — 91.4% | ||||||||
| ABS Car Loan — 0.7% |
| |||||||
| $ | 4,240,667 | Avis Budget Rental Car Funding AESOP LLC, Series 2016-2A, Class A, 2.720%, 11/20/2022, 144A | $ | 4,249,162 | ||||
| 8,775,000 | Avis Budget Rental Car Funding AESOP LLC, Series 2017-1A, Class A, 3.070%, 9/20/2023, 144A | 8,957,002 | ||||||
| 4,226,000 | Avis Budget Rental Car Funding AESOP LLC, Series 2019-1A, Class A, 3.450%, 3/20/2023, 144A | 4,259,425 | ||||||
| 6,444,000 | Avis Budget Rental Car Funding AESOP LLC, Series 2019-2A, Class A, 3.350%, 9/22/2025, 144A | 6,868,722 | ||||||
| 7,064,000 | Avis Budget Rental Car Funding AESOP LLC, Series 2020-2A, Class A, 2.020%, 2/20/2027, 144A | 7,231,777 | ||||||
| 1,259,536 | Exeter Automobile Receivables Trust, Series 2020-1A, Class B, 2.260%, 4/15/2024, 144A | 1,263,145 | ||||||
| 2,460,000 | Exeter Automobile Receivables Trust, Series 2021-2A, Class B, 0.570%, 9/15/2025 | 2,463,221 | ||||||
| 3,525,000 | Exeter Automobile Receivables Trust, Series 2021-2A, Class C, 0.980%, 6/15/2026 | 3,531,172 | ||||||
| 8,181,000 | Santander Drive Auto Receivables Trust, Series 2021-1, Class C, 0.750%, 2/17/2026 | 8,214,474 | ||||||
| 8,315,000 | Santander Drive Auto Receivables Trust, Series 2021-2, Class C, 0.900%, 6/15/2026 | 8,344,183 | ||||||
| 9,095,000 | Santander Drive Auto Receivables Trust, Series 2021-3, Class C, 0.950%, 9/15/2027 | 9,111,451 | ||||||
|
| |||||||
| 64,493,734 | ||||||||
|
| |||||||
| ABS Home Equity — 0.7% |
| |||||||
| 1,062,732 | Bayview Koitere Fund Trust, Series 2017-SPL3, Class A, 4.000%, 11/28/2053, 144A(a) | 1,084,688 | ||||||
| 1,151,085 | Bayview Opportunity Master Fund IVa Trust, Series 2016-SPL1, Class A, 4.000%, 4/28/2055, 144A | 1,158,127 | ||||||
| 654,813 | Bayview Opportunity Master Fund IVa Trust, Series 2017-RT1, Class A1, 3.000%, 3/28/2057, 144A(a) | 662,467 | ||||||
| 3,696,741 | Bayview Opportunity Master Fund IVa Trust, Series 2017-RT5, Class A, 3.500%, 5/28/2069, 144A(a) | 3,762,610 | ||||||
| 2,509,637 | Bayview Opportunity Master Fund IVa Trust, Series 2017-SPL1, Class A, 4.000%, 10/28/2064, 144A(a) | 2,559,554 | ||||||
| 977,939 | Bayview Opportunity Master Fund IVb Trust, Series 2017-SPL2, Class A, 4.000%, 6/28/2054, 144A(a) | 1,000,216 | ||||||
| 3,857,019 | CoreVest American Finance Trust, Series 2019-3, Class A, 2.705%, 10/15/2052, 144A | 4,016,514 | ||||||
| 16,474 | Countrywide Asset-Backed Certificates, Series 2004-S1, Class A3, 5.115%, 2/25/2035(a) | 16,709 | ||||||
| 20,182,430 | Invitation Homes Trust, Series 2018-SFR2, Class A, 1-month LIBOR + 0.900%, 0.984%, 6/17/2037, 144A(b) | 20,210,352 | ||||||
| 300,144 | Mill City Mortgage Loan Trust, Series 2016-1, Class A1, 2.500%, 4/25/2057, 144A(a) | 301,071 | ||||||
| 2,197,939 | Onslow Bay Financial LLC, Series 2018-EXP1, Class 1A3, 4.000%, 4/25/2048, 144A(a) | 2,231,867 | ||||||
| 414,054 | Sequoia Mortgage Trust, Series 2017-CH1, Class A1, 4.000%, 8/25/2047, 144A(a) | 418,322 | ||||||
| ABS Home Equity — continued | ||||||||
| 1,079,126 | Sequoia Mortgage Trust, Series 2018-CH1, Class A1, 4.000%, 2/25/2048, 144A(a) | 1,096,459 | ||||||
| 1,915,021 | Sequoia Mortgage Trust, Series 2018-CH3, Class A2, 4.000%, 8/25/2048, 144A(a) | 1,941,852 | ||||||
| 1,298,545 | Towd Point Mortgage Trust, Series 2015-1, Class A5, 3.184%, 10/25/2053, 144A(a) | 1,349,817 | ||||||
| 4,254,377 | Towd Point Mortgage Trust, Series 2015-4, Class M2, 3.750%, 4/25/2055, 144A(a) | 4,389,436 | ||||||
| 1,168,002 | Towd Point Mortgage Trust, Series 2016-2, Class A1A, 2.750%, 8/25/2055, 144A(a) | 1,173,682 | ||||||
| 5,101,352 | Towd Point Mortgage Trust, Series 2016-2, Class M2, 3.000%, 8/25/2055, 144A(a) | 5,320,479 | ||||||
| 6,752,955 | Towd Point Mortgage Trust, Series 2018-3, Class A1, 3.750%, 5/25/2058, 144A(a) | 7,062,211 | ||||||
|
| |||||||
| 59,756,433 | ||||||||
|
| |||||||
| ABS Other — 1.3% |
| |||||||
| 21,164,065 | CLI Funding VIII LLC, Series 2021-1A, Class A, 1.640%, 2/18/2046, 144A | 20,892,155 | ||||||
| 11,628,000 | Donlen Fleet Lease Funding 2 LLC, Series 2021-2, Class A2, 0.560%, 12/11/2034, 144A | 11,641,390 | ||||||
| 7,094,000 | OneMain Financial Issuance Trust, Series 2020-1A, Class A, 3.840%, 5/14/2032, 144A | 7,330,535 | ||||||
| 13,500,000 | OneMain Financial Issuance Trust, Series 2021-1A, Class A2, 30-day Average SOFR + 0.760%, 0.810%, 6/16/2036, 144A(b) | 13,607,649 | ||||||
| 27,038,533 | Textainer Marine Containers Ltd., Series 2021-3A, Class A, 1.940%, 8/20/2046, 144A | 26,826,416 | ||||||
| 10,650,637 | Textainer Marine Containers VII Ltd., Series 2021-1A, Class A, 1.680%, 2/20/2046, 144A | 10,486,253 | ||||||
| 9,247,740 | Textainer Marine Containers VIII Ltd., Series 2020-2A, Class A, 2.100%, 9/20/2045, 144A | 9,328,657 | ||||||
| 11,484,255 | Triton Container Finance VIII LLC, Series 2021-1A, Class A, 1.860%, 3/20/2046, 144A | 11,379,584 | ||||||
|
| |||||||
| 111,492,639 | ||||||||
|
| |||||||
| ABS Student Loan — 0.3% |
| |||||||
| 6,562,235 | Navient Private Education Refi Loan Trust, Series 2020-HA, Class A, 1.310%, 1/15/2069, 144A | 6,606,263 | ||||||
| 13,443,181 | Navient Private Education Refi Loan Trust, Series 2021-CA, Class A, 1.060%, 10/15/2069, 144A | 13,461,665 | ||||||
| 5,363,664 | SMB Private Education Loan Trust, Series 2021-A, Class APT2, 1.070%, 1/15/2053, 144A | 5,283,789 | ||||||
| 3,777,000 | SoFi Professional Loan Program Trust, Series 2020-A, Class A2FX, 2.540%, 5/15/2046, 144A | 3,876,410 | ||||||
|
| |||||||
| 29,228,127 | ||||||||
|
| |||||||
| ABS Whole Business — 0.2% |
| |||||||
| 5,505,203 | Domino’s Pizza Master Issuer LLC, Series 2021-1A, Class A21, 2.662%, 4/25/2051, 144A | 5,661,638 | ||||||
| 11,907,720 | Planet Fitness Master Issuer LLC, Series 2018-1A, Class A2I, 4.262%, 9/05/2048, 144A | 11,915,448 | ||||||
|
| |||||||
| 17,577,086 | ||||||||
|
| |||||||
See accompanying notes to financial statements.
| 34
Portfolio of Investments – as of September 30, 2021
Loomis Sayles Core Plus Bond Fund – (continued)
| Principal Amount (‡) | Description | Value (†) | ||||||
| Aerospace & Defense — 1.4% |
| |||||||
| $ | 22,001,000 | Boeing Co. (The), 1.433%, 2/04/2024 | $ | 22,033,893 | ||||
| 16,774,000 | Boeing Co. (The), 5.705%, 5/01/2040 | 21,315,654 | ||||||
| 20,949,000 | Boeing Co. (The), 5.805%, 5/01/2050 | 27,924,396 | ||||||
| 3,211,000 | Boeing Co. (The), 5.930%, 5/01/2060 | 4,386,467 | ||||||
| 12,659,000 | Embraer Netherlands Finance BV, 5.050%, 6/15/2025 | 13,323,598 | ||||||
| 29,847,000 | Textron, Inc., 3.000%, 6/01/2030 | 31,362,957 | ||||||
|
| |||||||
| 120,346,965 | ||||||||
|
| |||||||
| Airlines — 0.8% |
| |||||||
| 7,734,112 | American Airlines, Inc./AAdvantage Loyalty IP Ltd., 5.500%, 4/20/2026, 144A | 8,130,485 | ||||||
| 8,850,467 | American Airlines, Inc./AAdvantage Loyalty IP Ltd., 5.750%, 4/20/2029, 144A | 9,536,378 | ||||||
| 1,681,114 | Continental Airlines Pass Through Trust, Series 2012-2, Class A, 4.000%, 4/29/2026 | 1,762,312 | ||||||
| 16,151,433 | Delta Air Lines, Inc./SkyMiles IP Ltd., 4.750%, 10/20/2028, 144A | 18,008,848 | ||||||
| 15,602,000 | Southwest Airlines Co., 5.125%, 6/15/2027 | 18,246,164 | ||||||
| 4,592,773 | United Airlines Pass Through Trust, Series 2020-1, Class B, 4.875%, 7/15/2027 | 4,859,338 | ||||||
| 4,381,000 | United Airlines, Inc., 4.375%, 4/15/2026, 144A | 4,496,001 | ||||||
| 6,533,000 | United Airlines, Inc., 4.625%, 4/15/2029, 144A | 6,751,529 | ||||||
|
| |||||||
| 71,791,055 | ||||||||
|
| |||||||
| Automotive — 2.1% |
| |||||||
| 9,280,000 | Dana, Inc., 4.250%, 9/01/2030 | 9,544,015 | ||||||
| 16,276,000 | Ford Motor Credit Co. LLC, 2.900%, 2/16/2028 | 16,255,655 | ||||||
| 20,142,000 | General Motors Co., 5.000%, 4/01/2035 | 23,782,418 | ||||||
| 7,067,000 | General Motors Financial Co., Inc., 2.900%, 2/26/2025 | 7,414,468 | ||||||
| 23,341,000 | Goodyear Tire & Rubber Co. (The), 5.625%, 4/30/2033 | 25,441,690 | ||||||
| 7,091,000 | Hyundai Capital America, 2.375%, 10/15/2027, 144A | 7,186,925 | ||||||
| 10,356,000 | Hyundai Capital America, 2.650%, 2/10/2025, 144A | 10,757,025 | ||||||
| 7,453,000 | Hyundai Capital America, 3.000%, 2/10/2027, 144A | 7,838,618 | ||||||
| 16,811,000 | Lear Corp., 5.250%, 5/15/2049 | 20,879,328 | ||||||
| 7,676,000 | Nissan Motor Co. Ltd., 3.043%, 9/15/2023, 144A | 7,985,085 | ||||||
| 15,593,000 | Nissan Motor Co. Ltd., 3.522%, 9/17/2025, 144A | 16,577,854 | ||||||
| 9,825,000 | Toyota Motor Corp., 2.358%, 7/02/2024 | 10,285,092 | ||||||
| 16,490,000 | Toyota Motor Credit Corp., MTN, 1.800%, 2/13/2025 | 16,937,469 | ||||||
| 7,096,000 | Volkswagen Group of America Finance LLC, 3.200%, 9/26/2026, 144A | 7,593,738 | ||||||
|
| |||||||
| 188,479,380 | ||||||||
|
| |||||||
| Banking — 9.0% |
| |||||||
| 27,986,000 | Ally Financial, Inc., 3.050%, 6/05/2023 | 29,033,414 | ||||||
| 17,876,000 | American Express Co., 2.500%, 7/30/2024 | 18,791,995 | ||||||
| 10,051,000 | Banco Santander Chile, 2.700%, 1/10/2025, 144A | 10,453,542 | ||||||
| 13,578,000 | Banco Santander Chile, 3.875%, 9/20/2022, 144A | 13,959,542 | ||||||
| 14,000,000 | Banco Santander S.A., 1.849%, 3/25/2026 | 14,180,102 | ||||||
| 3,200,000 | Banco Santander S.A., 2.958%, 3/25/2031 | 3,292,096 | ||||||
| 28,476,000 | Bangkok Bank PCL, 4.050%, 3/19/2024, 144A | 30,574,918 | ||||||
| 8,624,000 | Bank of America Corp., (fixed rate to 12/20/2022, variable rate thereafter), 3.004%, 12/20/2023 | 8,887,636 | ||||||
| 31,146,000 | Bank of America Corp., (fixed rate to 4/22/2024, variable rate thereafter), 0.976%, 4/22/2025 | 31,311,644 | ||||||
| Banking — continued | ||||||||
| 37,210,000 | Bank of America Corp., (fixed rate to 4/23/2026, variable rate thereafter), MTN, 3.559%, 4/23/2027 | 40,493,023 | ||||||
| 22,064,000 | Barclays PLC, (fixed rate to 3/10/2041, variable rate thereafter), 3.811%, 3/10/2042 | 23,417,518 | ||||||
| 7,864,000 | BBVA Bancomer S.A., 1.875%, 9/18/2025, 144A | 7,906,859 | ||||||
| 17,513,000 | BNP Paribas S.A., (fixed rate to 1/13/2026, variable rate thereafter), 1.323%, 1/13/2027, 144A | 17,218,957 | ||||||
| 26,613,000 | BNP Paribas S.A., (fixed rate to 11/19/2024, variable rate thereafter), 2.819%, 11/19/2025, 144A | 27,873,547 | ||||||
| 5,935,000 | Citigroup, Inc., 4.000%, 8/05/2024 | 6,437,468 | ||||||
| 25,481,000 | Citigroup, Inc., 4.050%, 7/30/2022 | 26,253,486 | ||||||
| 9,645,000 | Citigroup, Inc., (fixed rate to 3/31/2030, variable rate thereafter), 4.412%, 3/31/2031 | 11,136,671 | ||||||
| 8,154,000 | Citigroup, Inc., (fixed rate to 5/01/2024, variable rate thereafter), 0.981%, 5/01/2025 | 8,180,407 | ||||||
| 5,227,000 | Credit Suisse AG, 2.100%, 11/12/2021 | 5,237,923 | ||||||
| 9,780,000 | Deutsche Bank AG, 0.898%, 5/28/2024 | 9,771,023 | ||||||
| 10,038,000 | Deutsche Bank AG, 1.686%, 3/19/2026 | 10,095,043 | ||||||
| 9,382,000 | Deutsche Bank AG, (fixed rate to 1/14/2031, variable rate thereafter), 3.729%, 1/14/2032 | 9,686,771 | ||||||
| 11,985,000 | Deutsche Bank AG, (fixed rate to 11/24/2025, variable rate thereafter), 2.129%, 11/24/2026 | 12,173,983 | ||||||
| 30,369,000 | DNB Bank ASA, 2.150%, 12/02/2022, 144A | 31,063,697 | ||||||
| 10,768,000 | Goldman Sachs Group, Inc. (The), 3.625%, 1/22/2023 | 11,222,920 | ||||||
| 15,206,000 | Goldman Sachs Group, Inc. (The), 6.750%, 10/01/2037 | 21,779,346 | ||||||
| 5,359,000 | Goldman Sachs Group, Inc. (The), (fixed rate to 6/05/2027, variable rate thereafter), 3.691%, 6/05/2028 | 5,898,823 | ||||||
| 2,326,000 | HSBC Holdings PLC, 4.950%, 3/31/2030 | 2,766,290 | ||||||
| 13,610,000 | HSBC Holdings PLC, (fixed rate to 5/24/2024, variable rate thereafter), 0.976%, 5/24/2025 | 13,586,028 | ||||||
| 16,885,000 | Huntington Bancshares, Inc., 2.625%, 8/06/2024 | 17,710,251 | ||||||
| 4,740,000 | Intesa Sanpaolo SpA, 4.198%, 6/01/2032, 144A | 4,858,216 | ||||||
| 12,576,000 | JPMorgan Chase & Co., (fixed rate to 5/13/2030, variable rate thereafter), 2.956%, 5/13/2031 | 13,083,540 | ||||||
| 9,258,000 | JPMorgan Chase & Co., 3.200%, 1/25/2023 | 9,610,429 | ||||||
| 20,006,000 | JPMorgan Chase & Co., 4.500%, 1/24/2022 | 20,270,158 | ||||||
| 28,355,000 | JPMorgan Chase & Co., (fixed rate to 10/15/2029, variable rate thereafter), 2.739%, 10/15/2030 | 29,365,053 | ||||||
| 2,889,000 | Lloyds Banking Group PLC, 3.000%, 1/11/2022 | 2,910,399 | ||||||
| 23,028,000 | Morgan Stanley, (fixed rate to 4/05/2023, variable rate thereafter), 0.731%, 4/05/2024 | 23,104,437 | ||||||
| 8,931,000 | Morgan Stanley, (fixed rate to 7/22/2027, variable rate thereafter), 3.591%, 7/22/2028 | 9,794,070 | ||||||
| 2,867,000 | Morgan Stanley, GMTN, 3.700%, 10/23/2024 | 3,109,876 | ||||||
| 18,457,000 | Morgan Stanley, Series F, 3.875%, 4/29/2024 | 19,914,365 | ||||||
| 14,159,000 | Nationwide Building Society, (fixed rate to 4/26/2022, variable rate thereafter), 3.622%, 4/26/2023, 144A | 14,405,201 | ||||||
| 15,693,000 | PNC Bank NA, (fixed rate to 12/09/2021, variable rate thereafter), 2.028%, 12/09/2022 | 15,741,263 | ||||||
| 9,780,000 | Santander UK Group Holdings PLC, 5.625%, 9/15/2045, 144A | 12,623,778 | ||||||
| 26,503,000 | Societe Generale S.A., 2.625%, 1/22/2025, 144A | 27,518,567 | ||||||
| 24,346,000 | Standard Chartered PLC, (fixed rate to 1/30/2025, variable rate thereafter), 2.819%, 1/30/2026, 144A | 25,353,715 | ||||||
See accompanying notes to financial statements.
35 |
Portfolio of Investments – as of September 30, 2021
Loomis Sayles Core Plus Bond Fund – (continued)
| Principal Amount (‡) | Description | Value (†) | ||||||
| Banking — continued | ||||||||
| $ | 14,566,000 | Sumitomo Mitsui Financial Group, Inc., 1.474%, 7/08/2025 | $ | 14,683,256 | ||||
| 18,720,000 | Sumitomo Mitsui Financial Group, Inc., 2.696%, 7/16/2024 | 19,662,911 | ||||||
| 12,213,000 | Sumitomo Mitsui Financial Group, Inc., 3.040%, 7/16/2029 | 12,940,284 | ||||||
| 21,438,000 | Toronto-Dominion Bank (The), MTN, 2.650%, 6/12/2024 | 22,559,105 | ||||||
| 17,630,000 | UniCredit SpA, (fixed rate to 6/03/2026, variable rate thereafter), 1.982%, 6/03/2027, 144A | 17,585,324 | ||||||
|
| |||||||
| 799,488,870 | ||||||||
|
| |||||||
| Brokerage — 0.1% |
| |||||||
| 11,958,000 | Owl Rock Technology Finance Corp., 3.750%, 6/17/2026, 144A | 12,623,999 | ||||||
|
| |||||||
| Building Materials — 0.7% |
| |||||||
| 19,920,000 | American Builders & Contractors Supply Co., Inc., 3.875%, 11/15/2029, 144A | 19,826,575 | ||||||
| 10,762,000 | Cemex SAB de CV, 3.875%, 7/11/2031, 144A | 10,768,457 | ||||||
| 19,521,000 | Mohawk Industries, Inc., 3.625%, 5/15/2030 | 21,265,397 | ||||||
| 7,260,000 | Owens Corning, 4.200%, 12/01/2024 | 7,916,730 | ||||||
| 1,112,000 | Summit Materials LLC/Summit Materials Finance Corp., 5.250%, 1/15/2029, 144A | 1,167,600 | ||||||
|
| |||||||
| 60,944,759 | ||||||||
|
| |||||||
| Cable Satellite — 0.7% |
| |||||||
| 23,720,000 | CCO Holdings LLC/CCO Holdings Capital Corp., 4.250%, 1/15/2034, 144A | 23,497,625 | ||||||
| 14,725,000 | Sirius XM Radio, Inc., 4.000%, 7/15/2028, 144A | 14,973,484 | ||||||
| 6,180,000 | Time Warner Cable LLC, 4.500%, 9/15/2042 | 6,763,028 | ||||||
| 783,000 | Time Warner Cable LLC, 5.500%, 9/01/2041 | 959,638 | ||||||
| 2,245,000 | Time Warner Cable LLC, 5.875%, 11/15/2040 | 2,831,847 | ||||||
| 7,162,000 | Time Warner Cable LLC, 6.550%, 5/01/2037 | 9,663,580 | ||||||
| 1,707,000 | Time Warner Cable LLC, 6.750%, 6/15/2039 | 2,336,348 | ||||||
|
| |||||||
| 61,025,550 | ||||||||
|
| |||||||
| Chemicals — 1.4% |
| |||||||
| 1,610,000 | Alpek SAB de CV, 3.250%, 2/25/2031, 144A | 1,626,116 | ||||||
| 22,620,000 | Ashland LLC, 3.375%, 9/01/2031, 144A | 22,817,925 | ||||||
| 25,853,000 | Braskem America Finance Co., 7.125%, 7/22/2041, 144A | 33,415,002 | ||||||
| 8,792,000 | Koppers, Inc., 6.000%, 2/15/2025, 144A | 8,989,820 | ||||||
| 11,671,000 | Orbia Advance Corp. SAB de CV, 5.875%, 9/17/2044, 144A | 14,383,340 | ||||||
| 9,466,000 | Orbia Advance Corp. SAB de CV, 6.750%, 9/19/2042, 144A | 12,554,377 | ||||||
| 3,732,000 | RPM International, Inc., 3.450%, 11/15/2022 | 3,823,380 | ||||||
| 4,630,000 | Sociedad Quimica y Minera de Chile S.A., 3.500%, 9/10/2051, 144A | 4,460,311 | ||||||
| 11,424,000 | Sociedad Quimica y Minera de Chile S.A., 4.250%, 1/22/2050, 144A | 12,314,044 | ||||||
| 5,549,000 | Univar Solutions USA, Inc., 5.125%, 12/01/2027, 144A | 5,826,173 | ||||||
|
| |||||||
| 120,210,488 | ||||||||
|
| |||||||
| Collateralized Mortgage Obligations — 0.2% |
| |||||||
| 4,239,116 | Federal Home Loan Mortgage Corp., REMIC, Series 3654, Class DC, 5.000%, 4/15/2030 | 4,748,927 | ||||||
| 308,569 | Government National Mortgage Association, Series 2010-H24, Class FA, 1-month LIBOR + 0.350%, 0.440%, 10/20/2060(b) | 308,740 | ||||||
| 245,978 | Government National Mortgage Association, Series 2012-H18, Class NA, 1-month LIBOR + 0.520%, 0.610%, 8/20/2062(b) | 247,023 | ||||||
| Collateralized Mortgage Obligations — continued | ||||||||
| 40,474 | Government National Mortgage Association, Series 2013-H01, Class FA, 1.650%, 1/20/2063(c)(d) | 40,172 | ||||||
| 25,821 | Government National Mortgage Association, Series 2013-H03, Class HA, 1.750%, 12/20/2062(c)(d) | 25,615 | ||||||
| 88,125 | Government National Mortgage Association, Series 2013-H04, Class BA, 1.650%, 2/20/2063(c)(d) | 88,318 | ||||||
| 99,950 | Government National Mortgage Association, Series 2013-H07, Class DA, 2.500%, 3/20/2063(c)(d) | 99,806 | ||||||
| 729,786 | Government National Mortgage Association, Series 2013-H10, Class PA, 2.500%, 4/20/2063(c)(d) | 730,585 | ||||||
| 8,939,017 | Government National Mortgage Association, Series 2015-H10, Class JA, 2.250%, 4/20/2065 | 9,156,419 | ||||||
| 17,534 | Government National Mortgage Association, Series 2015-H13, Class FL, 1-month LIBOR + 0.280%, 0.370%, 5/20/2063(b)(c)(d) | 17,426 | ||||||
|
| |||||||
| 15,463,031 | ||||||||
|
| |||||||
| Construction Machinery — 0.4% |
| |||||||
| 5,985,000 | Caterpillar Financial Services Corp., MTN, 2.150%, 11/08/2024 | 6,252,625 | ||||||
| 5,805,000 | CNH Industrial Capital LLC, 1.950%, 7/02/2023 | 5,933,748 | ||||||
| 7,380,000 | CNH Industrial Capital LLC, 4.375%, 4/05/2022 | 7,521,084 | ||||||
| 4,061,000 | John Deere Capital Corp., MTN, 2.600%, 3/07/2024 | 4,263,155 | ||||||
| 13,280,000 | United Rentals North America, Inc., 3.750%, 1/15/2032 | 13,429,400 | ||||||
|
| |||||||
| 37,400,012 | ||||||||
|
| |||||||
| Consumer Cyclical Services — 0.2% |
| |||||||
| 7,466,000 | Expedia Group, Inc., 3.600%, 12/15/2023 | 7,902,645 | ||||||
| 5,734,000 | Expedia Group, Inc., 4.625%, 8/01/2027 | 6,500,521 | ||||||
| 1,791,000 | Expedia Group, Inc., 6.250%, 5/01/2025, 144A | 2,064,902 | ||||||
| 3,523,000 | MercadoLibre, Inc., 2.375%, 1/14/2026 | 3,465,786 | ||||||
|
| |||||||
| 19,933,854 | ||||||||
|
| |||||||
| Consumer Products — 0.3% |
| |||||||
| 881,000 | Hasbro, Inc., 3.900%, 11/19/2029 | 973,117 | ||||||
| 2,157,000 | Kimberly-Clark de Mexico SAB de CV, 2.431%, 7/01/2031, 144A | 2,149,882 | ||||||
| 11,615,000 | Natura Cosmeticos S.A., 4.125%, 5/03/2028, 144A | 11,757,284 | ||||||
| 2,823,000 | Newell Brands, Inc., 4.875%, 6/01/2025 | 3,115,745 | ||||||
| 7,940,000 | Valvoline, Inc., 3.625%, 6/15/2031, 144A | 7,840,750 | ||||||
| 2,535,000 | Valvoline, Inc., 4.250%, 2/15/2030, 144A | 2,628,288 | ||||||
|
| |||||||
| 28,465,066 | ||||||||
|
| |||||||
| Diversified Manufacturing — 0.3% |
| |||||||
| 2,755,000 | Clark Equipment Co., 5.875%, 6/01/2025, 144A | 2,882,419 | ||||||
| 14,817,000 | General Electric Co., 4.250%, 5/01/2040 | 17,309,366 | ||||||
| 5,319,000 | General Electric Co., 4.350%, 5/01/2050 | 6,422,407 | ||||||
|
| |||||||
| 26,614,192 | ||||||||
|
| |||||||
| Electric — 2.1% |
| |||||||
| 3,587,000 | AES Corp. (The), 3.300%, 7/15/2025, 144A | 3,810,183 | ||||||
| 3,609,000 | AES Corp. (The), 3.950%, 7/15/2030, 144A | 3,968,529 | ||||||
| 13,678,000 | Calpine Corp., 3.750%, 3/01/2031, 144A | 13,165,075 | ||||||
| 14,879,000 | Calpine Corp., 5.000%, 2/01/2031, 144A | 14,879,000 | ||||||
| 13,220,000 | CenterPoint Energy, Inc., SOFR + 0.650%, 0.700%, 5/13/2024(b) | 13,246,969 | ||||||
| 18,219,000 | Clearway Energy Operating LLC, 3.750%, 2/15/2031, 144A | 18,264,547 | ||||||
See accompanying notes to financial statements.
| 36
Portfolio of Investments – as of September 30, 2021
Loomis Sayles Core Plus Bond Fund – (continued)
| Principal Amount (‡) | Description | Value (†) | ||||||
| Electric — continued | ||||||||
| $ | 26,317,716 | Cometa Energia S.A. de CV, 6.375%, 4/24/2035, 144A | $ | 30,857,522 | ||||
| 3,408,000 | DPL, Inc., 4.125%, 7/01/2025 | 3,646,560 | ||||||
| 7,440,000 | DPL, Inc., 4.350%, 4/15/2029 | 8,091,000 | ||||||
| 852,000 | Edison International, 4.950%, 4/15/2025 | 938,099 | ||||||
| 2,811,000 | Enel Americas S.A., 4.000%, 10/25/2026 | 3,069,190 | ||||||
| 2,853,000 | Enel Generacion Chile S.A., 4.250%, 4/15/2024 | 3,045,242 | ||||||
| 6,711,000 | Entergy Corp., 2.800%, 6/15/2030 | 6,921,990 | ||||||
| 14,622,000 | National Rural Utilities Cooperative Finance Corp., (fixed rate to 4/30/2023, variable rate thereafter), 4.750%, 4/30/2043 | 15,246,315 | ||||||
| 6,785,000 | NRG Energy, Inc., 3.875%, 2/15/2032, 144A | 6,708,669 | ||||||
| 9,234,000 | Pattern Energy Operations LP/Pattern Energy Operations, Inc., 4.500%, 8/15/2028, 144A | 9,626,445 | ||||||
| 11,619,000 | PG&E Corp., 5.000%, 7/01/2028 | 11,836,856 | ||||||
| 8,950,000 | PG&E Corp., 5.250%, 7/01/2030 | 9,162,562 | ||||||
| 7,133,000 | Transelec S.A., 4.250%, 1/14/2025, 144A | 7,748,293 | ||||||
| 3,713,000 | Transelec S.A., 4.625%, 7/26/2023, 144A | 3,938,565 | ||||||
|
| |||||||
| 188,171,611 | ||||||||
|
| |||||||
| Finance Companies — 2.4% |
| |||||||
| 1,370,000 | AerCap Ireland Capital DAC/AerCap Global Aviation Trust, 3.300%, 1/23/2023 | 1,411,643 | ||||||
| 19,050,000 | Air Lease Corp., GMTN, 3.750%, 6/01/2026 | 20,619,887 | ||||||
| 24,287,000 | Aircastle Ltd., 2.850%, 1/26/2028, 144A | 24,596,902 | ||||||
| 28,047,000 | Ares Capital Corp., 2.150%, 7/15/2026 | 28,121,598 | ||||||
| 21,425,000 | Avolon Holdings Funding Ltd., 2.750%, 2/21/2028, 144A | 21,370,059 | ||||||
| 18,929,000 | FS KKR Capital Corp., 3.400%, 1/15/2026 | 19,778,556 | ||||||
| 4,133,000 | GATX Corp., 4.000%, 6/30/2030 | 4,611,275 | ||||||
| 3,315,000 | International Lease Finance Corp., 5.875%, 8/15/2022 | 3,467,139 | ||||||
| 15,720,000 | Navient Corp., 5.000%, 3/15/2027 | 16,191,600 | ||||||
| 907,000 | Navient Corp., 5.875%, 10/25/2024 | 968,223 | ||||||
| 954,000 | Navient Corp., 6.750%, 6/15/2026 | 1,052,863 | ||||||
| 7,547,000 | Navient Corp., MTN, 6.125%, 3/25/2024 | 8,080,950 | ||||||
| 22,635,000 | OneMain Finance Corp., 3.875%, 9/15/2028 | 22,493,305 | ||||||
| 15,397,000 | Owl Rock Capital Corp., 3.400%, 7/15/2026 | 16,034,935 | ||||||
| 4,537,000 | Owl Rock Capital Corp., 2.625%, 1/15/2027 | 4,545,009 | ||||||
| 3,702,000 | Rocket Mortgage LLC/Rocket Mortgage Co-Issuer, Inc., 3.625%, 3/01/2029, 144A | 3,743,647 | ||||||
| 12,169,000 | Rocket Mortgage LLC/Rocket Mortgage Co-Issuer, Inc., 3.875%, 3/01/2031, 144A | 12,275,479 | ||||||
| 4,045,000 | Rocket Mortgage LLC/Rocket Mortgage Co-Issuer, Inc., 4.000%, 10/15/2033, 144A | 4,014,662 | ||||||
|
| |||||||
| 213,377,732 | ||||||||
|
| |||||||
| Financial Other — 0.2% |
| |||||||
| 12,588,000 | Icahn Enterprises LP/Icahn Enterprises Finance Corp., 4.375%, 2/01/2029 | 12,572,265 | ||||||
| 5,354,000 | Icahn Enterprises LP/Icahn Enterprises Finance Corp., 5.250%, 5/15/2027 | 5,554,775 | ||||||
|
| |||||||
| 18,127,040 | ||||||||
|
| |||||||
| Food & Beverage — 1.7% |
| |||||||
| 22,778,000 | Anheuser-Busch Cos. LLC/Anheuser-Busch InBev Worldwide, Inc., 4.900%, 2/01/2046 | 27,999,055 | ||||||
| 12,823,000 | Anheuser-Busch InBev Worldwide, Inc., 4.350%, 6/01/2040 | 14,900,878 | ||||||
| 15,493,000 | Anheuser-Busch InBev Worldwide, Inc., 4.600%, 6/01/2060 | 18,615,591 | ||||||
| 2,684,000 | Bacardi Ltd., 5.300%, 5/15/2048, 144A | 3,487,080 | ||||||
| 17,808,000 | BRF S.A., 5.750%, 9/21/2050, 144A | 17,081,968 | ||||||
| 3,117,000 | Gruma SAB de CV, 4.875%, 12/01/2024, 144A | 3,440,420 | ||||||
| 6,690,000 | Kraft Heinz Foods Co., 3.875%, 5/15/2027 | 7,304,896 | ||||||
| Food & Beverage — continued | ||||||||
| 12,765,000 | Minerva Luxembourg S.A., 4.375%, 3/18/2031, 144A | 12,330,352 | ||||||
| 21,099,000 | Post Holdings, Inc., 4.500%, 9/15/2031, 144A | 20,848,555 | ||||||
| 18,264,000 | Post Holdings, Inc., 4.625%, 4/15/2030, 144A | 18,405,181 | ||||||
| 1,599,000 | Smithfield Foods, Inc., 3.000%, 10/15/2030, 144A | 1,609,466 | ||||||
|
| |||||||
| 146,023,442 | ||||||||
|
| |||||||
| Government Owned – No Guarantee — 2.7% |
| |||||||
| 6,872,000 | Antares Holdings LP, 3.950%, 7/15/2026, 144A | 7,241,666 | ||||||
| 18,141,000 | BOC Aviation USA Corp., 1.625%, 4/29/2024, 144A | 18,280,405 | ||||||
| 6,577,000 | CNPC General Capital Ltd., 3.950%, 4/19/2022, 144A | 6,690,190 | ||||||
| 15,245,000 | Dolphin Energy Ltd. LLC, 5.500%, 12/15/2021, 144A | 15,379,156 | ||||||
| 3,903,000 | Empresa de los Ferrocarriles del Estado, 3.068%, 8/18/2050, 144A | 3,435,421 | ||||||
| 19,956,000 | NBN Co. Ltd., 1.450%, 5/05/2026, 144A | 19,877,573 | ||||||
| 7,985,000 | OCP S.A., 3.750%, 6/23/2031, 144A | 7,955,455 | ||||||
| 19,460,000 | OCP S.A., 5.625%, 4/25/2024, 144A | 21,068,135 | ||||||
| 16,491,000 | Ooredoo International Finance Ltd., 2.625%, 4/08/2031, 144A | 16,791,796 | ||||||
| 6,236,000 | Ooredoo International Finance Ltd., 3.250%, 2/21/2023, 144A | 6,437,423 | ||||||
| 9,288,000 | Ooredoo International Finance Ltd., 3.875%, 1/31/2028, 144A | 10,405,012 | ||||||
| 14,555,000 | Qatar Petroleum, 3.125%, 7/12/2041, 144A | 14,548,014 | ||||||
| 8,035,000 | SA Global Sukuk Ltd., 0.946%, 6/17/2024, 144A | 7,955,614 | ||||||
| 12,588,000 | Saudi Arabian Oil Co., 3.500%, 11/24/2070, 144A | 11,835,867 | ||||||
| 10,431,000 | Saudi Arabian Oil Co., 4.375%, 4/16/2049, 144A | 11,843,462 | ||||||
| 12,825,000 | Tennessee Valley Authority, 4.250%, 9/15/2065 | 17,892,003 | ||||||
| 7,669,000 | Tennessee Valley Authority, 4.625%, 9/15/2060 | 11,142,372 | ||||||
| 5,427,000 | Tennessee Valley Authority, 4.875%, 1/15/2048 | 7,775,897 | ||||||
| 9,290,000 | Tennessee Valley Authority, 5.250%, 9/15/2039 | 13,182,666 | ||||||
| 9,267,000 | Transportadora de Gas Internacional S.A. E.S.P., 5.550%, 11/01/2028, 144A | 10,534,726 | ||||||
|
| |||||||
| 240,272,853 | ||||||||
|
| |||||||
| Health Insurance — 0.5% |
| |||||||
| 21,336,000 | Centene Corp., 2.500%, 3/01/2031 | 21,042,630 | ||||||
| 8,295,000 | Centene Corp., 2.625%, 8/01/2031 | 8,238,926 | ||||||
| 10,179,000 | Centene Corp., 3.375%, 2/15/2030 | 10,538,319 | ||||||
|
| |||||||
| 39,819,875 | ||||||||
|
| |||||||
| Healthcare — 0.2% |
| |||||||
| 15,396,000 | DaVita, Inc., 4.625%, 6/01/2030, 144A | 15,836,492 | ||||||
|
| |||||||
| Home Construction — 0.2% |
| |||||||
| 7,881,000 | Forestar Group, Inc., 3.850%, 5/15/2026, 144A | 7,871,149 | ||||||
| 246,000 | Lennar Corp., 4.500%, 4/30/2024 | 265,983 | ||||||
| 1,153,000 | Lennar Corp., 4.750%, 11/15/2022 | 1,191,072 | ||||||
| 11,190,000 | NVR, Inc., 3.000%, 5/15/2030 | 11,710,205 | ||||||
|
| |||||||
| 21,038,409 | ||||||||
|
| |||||||
| Independent Energy — 1.0% |
| |||||||
| 2,626,000 | Aker BP ASA, 3.000%, 1/15/2025, 144A | 2,764,371 | ||||||
| 2,639,000 | Chesapeake Energy Corp., 5.875%, 2/01/2029, 144A | 2,819,640 | ||||||
| 10,277,000 | Devon Energy Corp., 4.500%, 1/15/2030, 144A | 11,200,773 | ||||||
| 8,296,000 | Diamondback Energy, Inc., 4.750%, 5/31/2025 | 9,266,877 | ||||||
| 11,391,292 | Energean Israel Finance Ltd., 4.500%, 3/30/2024, 144A | 11,624,244 | ||||||
| 1,765,000 | EQT Corp., 3.125%, 5/15/2026, 144A | 1,809,337 | ||||||
| 6,641,000 | EQT Corp., 3.900%, 10/01/2027 | 7,187,089 | ||||||
| 1,371,000 | EQT Corp., 5.000%, 1/15/2029 | 1,543,677 | ||||||
See accompanying notes to financial statements.
37 |
Portfolio of Investments – as of September 30, 2021
Loomis Sayles Core Plus Bond Fund – (continued)
| Principal Amount (‡) | Description | Value (†) | ||||||
| Independent Energy — continued |
| |||||||
| $ | 9,078,204 | Leviathan Bond Ltd., 6.125%, 6/30/2025, 144A | $ | 9,857,477 | ||||
| 17,482,000 | Occidental Petroleum Corp., 5.875%, 9/01/2025 | 19,592,951 | ||||||
| 2,152,000 | Occidental Petroleum Corp., 8.000%, 7/15/2025 | 2,569,488 | ||||||
| 8,181,000 | Pan American Energy LLC, 9.125%, 4/30/2027, 144A | 9,166,811 | ||||||
|
| |||||||
| 89,402,735 | ||||||||
|
| |||||||
| Industrial Other — 0.2% |
| |||||||
| 8,410,000 | CK Hutchison International 20 Ltd., 2.500%, 5/08/2030, 144A | 8,553,304 | ||||||
| 3,408,000 | Georgetown University (The), Class A, 5.215%, 10/01/2118 | 4,944,940 | ||||||
|
| |||||||
| 13,498,244 | ||||||||
|
| |||||||
| Life Insurance — 0.4% |
| |||||||
| 11,059,000 | Athene Global Funding, 2.450%, 8/20/2027, 144A | 11,409,683 | ||||||
| 15,491,000 | Brighthouse Financial, Inc., 5.625%, 5/15/2030 | 18,700,283 | ||||||
| 3,077,000 | OneAmerica Financial Partners, Inc., 4.250%, 10/15/2050, 144A | 3,278,390 | ||||||
|
| |||||||
| 33,388,356 | ||||||||
|
| |||||||
| Lodging — 0.4% |
| |||||||
| 14,012,000 | Hilton Domestic Operating Co., Inc., 3.625%, 2/15/2032, 144A | 13,801,820 | ||||||
| 21,403,000 | Marriott International, Inc., 3.500%, 10/15/2032 | 22,739,492 | ||||||
|
| |||||||
| 36,541,312 | ||||||||
|
| |||||||
| Media Entertainment — 0.9% |
| |||||||
| 19,514,000 | AMC Networks, Inc., 4.250%, 2/15/2029 | 19,416,430 | ||||||
| 54,020,000 | Grupo Televisa SAB, EMTN, 7.250%, 5/14/2043, (MXN) | 1,820,949 | ||||||
| 9,132,000 | Lamar Media Corp., 3.625%, 1/15/2031 | 9,132,731 | ||||||
| 4,899,000 | Lamar Media Corp., 4.000%, 2/15/2030 | 5,043,520 | ||||||
| 12,633,000 | Outfront Media Capital LLC/Outfront Media Capital Corp., 4.250%, 1/15/2029, 144A | 12,521,198 | ||||||
| 15,950,000 | Prosus NV, 3.832%, 2/08/2051, 144A | 14,518,175 | ||||||
| 13,803,000 | Prosus NV, 3.680%, 1/21/2030, 144A | 14,320,067 | ||||||
|
| |||||||
| 76,773,070 | ||||||||
|
| |||||||
| Metals & Mining — 1.0% |
| |||||||
| 1,835,000 | Anglo American Capital PLC, 2.250%, 3/17/2028, 144A | 1,823,963 | ||||||
| 2,286,000 | Anglo American Capital PLC, 2.625%, 9/10/2030, 144A | 2,270,708 | ||||||
| 3,322,000 | Anglo American Capital PLC, 3.950%, 9/10/2050, 144A | 3,552,831 | ||||||
| 8,696,000 | Anglo American Capital PLC, 5.625%, 4/01/2030, 144A | 10,495,411 | ||||||
| 15,187,000 | FMG Resources August 2006 Pty Ltd., 4.375%, 4/01/2031, 144A | 15,693,486 | ||||||
| 16,183,000 | Fresnillo PLC, 4.250%, 10/02/2050, 144A | 16,874,338 | ||||||
| 31,977,000 | Glencore Funding LLC, 2.500%, 9/01/2030, 144A | 31,378,710 | ||||||
| 6,210,000 | SunCoke Energy, Inc., 4.875%, 6/30/2029, 144A | 6,186,712 | ||||||
|
| |||||||
| 88,276,159 | ||||||||
|
| |||||||
| Midstream — 1.8% |
| |||||||
| 568,000 | Energy Transfer LP, 5.150%, 2/01/2043 | 635,114 | ||||||
| 4,890,000 | Energy Transfer LP, 5.400%, 10/01/2047 | 5,826,995 | ||||||
| 5,900,000 | Energy Transfer LP, 5.950%, 10/01/2043 | 7,194,858 | ||||||
| 8,548,000 | Energy Transfer LP, 6.500%, 2/01/2042 | 11,105,756 | ||||||
| 1,338,000 | Energy Transfer LP, 6.625%, 10/15/2036 | 1,755,558 | ||||||
| 11,222,000 | Energy Transfer LP/Regency Energy Finance Corp., 5.000%, 10/01/2022 | 11,576,795 | ||||||
| 2,327,000 | Energy Transfer LP/Regency Energy Finance Corp., 5.875%, 3/01/2022 | 2,346,733 | ||||||
| Midstream — continued |
| |||||||
| 11,798,000 | EQM Midstream Partners LP, 4.500%, 1/15/2029, 144A | 12,240,425 | ||||||
| 3,485,000 | EQM Midstream Partners LP, 4.750%, 7/15/2023 | 3,639,386 | ||||||
| 5,575,000 | EQM Midstream Partners LP, 6.500%, 7/01/2027, 144A | 6,270,481 | ||||||
| 2,014,000 | Gray Oak Pipeline LLC, 2.600%, 10/15/2025, 144A | 2,064,516 | ||||||
| 982,000 | Gray Oak Pipeline LLC, 3.450%, 10/15/2027, 144A | 1,035,104 | ||||||
| 3,060,000 | Kinder Morgan Energy Partners LP, 4.150%, 2/01/2024 | 3,272,856 | ||||||
| 10,503,000 | Kinder Morgan Energy Partners LP, 4.300%, 5/01/2024 | 11,325,635 | ||||||
| 15,243,000 | Kinder Morgan, Inc., 5.625%, 11/15/2023, 144A | 16,592,931 | ||||||
| 5,653,000 | New Fortress Energy, Inc., 6.500%, 9/30/2026, 144A | 5,405,681 | ||||||
| 15,687,000 | New Fortress Energy, Inc., 6.750%, 9/15/2025, 144A | 15,098,738 | ||||||
| 6,694,000 | Rattler Midstream LP, 5.625%, 7/15/2025, 144A | 6,970,462 | ||||||
| 6,783,000 | Southern Natural Gas Co. LLC, 0.625%, 4/28/2023, 144A | 6,779,087 | ||||||
| 3,310,000 | Targa Resources Partners LP/Targa Resources Partners Finance Corp., 6.500%, 7/15/2027 | 3,568,941 | ||||||
| 19,358,000 | Williams Cos., Inc. (The) , 3.500%, 11/15/2030 | 21,029,757 | ||||||
|
| |||||||
| 155,735,809 | ||||||||
|
| |||||||
| Mortgage Related — 25.4% |
| |||||||
| 66,159,657 | FHLMC, 1.500%, with various maturities from 2050 to 2051(e)(f) | 63,458,856 | ||||||
| 166,178,113 | FHLMC, 2.000%, with various maturities from 2050 to 2051(e)(f) | 167,655,519 | ||||||
| 31,640,958 | FHLMC, 2.500%, with various maturities in 2050(e)(f) | 32,523,579 | ||||||
| 21,284,057 | FHLMC, 3.000%, with various maturities from 2042 to 2050(e)(f) | 22,462,250 | ||||||
| 14,411,543 | FHLMC, 3.500%, with various maturities from 2043 to 2050(e) | 15,598,898 | ||||||
| 2,609,219 | FHLMC, 4.000%, with various maturities from 2044 to 2048(e) | 2,833,353 | ||||||
| 72,761,667 | FHLMC, 4.500%, with various maturities from 2041 to 2049(e)(f) | 78,715,489 | ||||||
| 169,642,729 | FHLMC, 5.000%, with various maturities from 2048 to 2050(e)(f) | 186,860,247 | ||||||
| 5,656 | FHLMC, 6.000%, 6/01/2035 | 6,646 | ||||||
| 45,914,321 | FNMA, 1.500%, with various maturities in 2051(e)(f) | 44,577,931 | ||||||
| 204,623,325 | FNMA, 2.000%, with various maturities from 2050 to 2051(e)(f) | 206,458,615 | ||||||
| 70,830,247 | FNMA, 2.500%, with various maturities from 2045 to 2051(e)(f) | 73,250,188 | ||||||
| 63,402,451 | FNMA, 3.000%, with various maturities from 2045 to 2050(e)(f) | 66,776,933 | ||||||
| 48,427,027 | FNMA, 3.500%, with various maturities from 2043 to 2050(e)(f) | 51,375,207 | ||||||
| 182,811,530 | FNMA, 4.000%, with various maturities from 2041 to 2050(e)(f) | 196,290,863 | ||||||
| 202,761,138 | FNMA, 4.500%, with various maturities from 2043 to 2050(e)(f) | 219,513,316 | ||||||
| 37,137,543 | FNMA, 5.000%, with various maturities from 2048 to 2050(e)(f) | 40,891,839 | ||||||
| 6,000,952 | FNMA, 5.500%, 4/01/2050 | 6,710,138 | ||||||
| 4,590,198 | FNMA, 6.000%, with various maturities from 2034 to 2049(e) | 5,177,147 | ||||||
See accompanying notes to financial statements.
| 38
Portfolio of Investments – as of September 30, 2021
Loomis Sayles Core Plus Bond Fund – (continued)
| Principal Amount (‡) | Description | Value (†) | ||||||
| Mortgage Related — continued |
| |||||||
| $ | 7,146 | FNMA, 6.500%, with various maturities from 2029 to 2031(e) | $ | 8,026 | ||||
| 20,727 | FNMA, 7.000%, with various maturities in 2030(e) | 22,397 | ||||||
| 12,495 | FNMA, 7.500%, with various maturities from 2024 to 2032(e) | 14,113 | ||||||
| 14,160 | GNMA, 3.794%, 7/20/2063(a) | 14,791 | ||||||
| 1,501 | GNMA, 3.890%, 12/20/2062(a) | 1,559 | ||||||
| 2,156 | GNMA, 4.005%, 1/20/2063(a) | 2,201 | ||||||
| 5,790 | GNMA, 4.063%, 5/20/2063(a) | 6,025 | ||||||
| 28,017 | GNMA, 4.125%, 7/20/2063(a) | 28,577 | ||||||
| 5,067 | GNMA, 4.327%, 8/20/2061(a) | 5,493 | ||||||
| 7,015,899 | GNMA, 4.381%, 12/20/2066(a) | 7,742,074 | ||||||
| 27,285 | GNMA, 4.390%, with various maturities in 2062(a)(e) | 27,536 | ||||||
| 4,555,502 | GNMA, 4.407%, 11/20/2066(a) | 4,958,711 | ||||||
| 2,126,968 | GNMA, 4.419%, 10/20/2066(a) | 2,332,291 | ||||||
| 2,107 | GNMA, 4.422%, 5/20/2063(a) | 2,256 | ||||||
| 2,836,462 | GNMA, 4.438%, 2/20/2066(a) | 3,095,875 | ||||||
| 1,315,292 | GNMA, 4.449%, 2/20/2066(a) | 1,437,121 | ||||||
| 3,569,949 | GNMA, 4.522%, 12/20/2064(a) | 3,811,092 | ||||||
| 2,158,856 | GNMA, 4.538%, 9/20/2066(a) | 2,362,207 | ||||||
| 2,607,401 | GNMA, 4.539%, 12/20/2063(a) | 2,749,603 | ||||||
| 2,806,946 | GNMA, 4.545%, 6/20/2066(a) | 3,055,255 | ||||||
| 3,345,088 | GNMA, 4.557%, 6/20/2066(a) | 3,650,976 | ||||||
| 3,033,820 | GNMA, 4.561%, 2/20/2065(a) | 3,247,847 | ||||||
| 1,563,442 | GNMA, 4.571%, 1/20/2065(a) | 1,667,836 | ||||||
| 2,583,198 | GNMA, 4.584%, 6/20/2064(a) | 2,749,106 | ||||||
| 1,737,851 | GNMA, 4.585%, 4/20/2066(a) | 1,886,625 | ||||||
| 7,048,006 | GNMA, 4.591%, with various maturities from 2064 to 2066(a)(e) | 7,625,905 | ||||||
| 4,391,641 | GNMA, 4.605%, 2/20/2065(a) | 4,749,973 | ||||||
| 4,284,504 | GNMA, 4.614%, 10/20/2064(a) | 4,609,823 | ||||||
| 2,041,106 | GNMA, 4.625%, 3/20/2065(a) | 2,201,026 | ||||||
| 20,445 | GNMA, 4.630%, 12/20/2061(a) | 20,525 | ||||||
| 2,975,008 | GNMA, 4.640%, 3/20/2066(a) | 3,280,858 | ||||||
| 5,847,577 | GNMA, 4.642%, 12/20/2066(a) | 6,467,847 | ||||||
| 546,336 | GNMA, 4.644%, 1/20/2064(a) | 571,381 | ||||||
| 2,489,464 | GNMA, 4.665%, 1/20/2064(a) | 2,608,496 | ||||||
| 3,370,107 | GNMA, 4.666%, 1/20/2065(a) | 3,643,466 | ||||||
| 4,053,977 | GNMA, 4.671%, 6/20/2064(a) | 4,313,592 | ||||||
| 44,633 | GNMA, 4.700%, with various maturities in 2062(a)(e) | 46,160 | ||||||
| 2,884,995 | GNMA, 4.715%, 1/20/2064(a) | 3,072,318 | ||||||
| 113,754 | GNMA, 5.500%, 4/15/2038 | 132,723 | ||||||
| 24,801 | GNMA, 6.000%, with various maturities from 2029 to 2038(e) | 28,926 | ||||||
| 25,587 | GNMA, 6.500%, with various maturities from 2029 to 2032(e) | 28,584 | ||||||
| 34,489 | GNMA, 7.000%, 9/15/2025 | 35,639 | ||||||
| 3,145 | GNMA, 7.500%, with various maturities from 2025 to 2030(e) | 3,312 | ||||||
| 87,976,000 | UMBS® (TBA), 2.500%, 12/01/2051(g) | 90,323,172 | ||||||
| 236,058,000 | UMBS® (TBA), 2.000%, 11/01/2051(g) | 236,270,084 | ||||||
| 9,907,000 | UMBS® (TBA), 2.000%, 10/01/2051(g) | 9,933,703 | ||||||
| 309,259,000 | UMBS® (TBA), 2.500%, 11/01/2051(g) | 318,258,919 | ||||||
| 26,588,000 | UMBS® (TBA), 3.000%, 11/01/2051(g) | 27,786,132 | ||||||
|
| |||||||
| 2,252,029,171 | ||||||||
|
| |||||||
| Natural Gas — 0.2% |
| |||||||
| 11,262,000 | Atmos Energy Corp., 0.625%, 3/09/2023 | 11,262,374 | ||||||
| 2,701,000 | Boston Gas Co., 3.001%, 8/01/2029, 144A | 2,815,370 | ||||||
|
| |||||||
| 14,077,744 | ||||||||
|
| |||||||
| Non-Agency Commercial Mortgage-Backed Securities — 1.5% |
| |||||||
| 12,696,152 | BANK, Series 2019-BN22, Class A4, 2.978%, 11/15/2062 | 13,581,832 | ||||||
| 1,531,640 | BANK, Series 2019-BN16, Class A4, 4.005%, 2/15/2052 | 1,742,081 | ||||||
| 3,409,380 | BANK, Series 2019-BN20, Class A3, 3.011%, 9/15/2062 | 3,654,258 | ||||||
| 6,138,240 | BANK, Series 2019-BN24, Class A3, 2.960%, 11/15/2062 | 6,555,810 | ||||||
| 14,179,842 | Citigroup Commercial Mortgage Trust, Series 2019-C7, Class A4, 3.102%, 12/15/2072(f) | 15,279,985 | ||||||
| 18,570,071 | Citigroup Commercial Mortgage Trust, Series 2019-GC43, Class A4, 3.038%, 11/10/2052(f) | 19,922,349 | ||||||
| 9,877,514 | Citigroup Commercial Mortgage Trust, Series 2020-GC46, Class A5, 2.717%, 2/15/2053 | 10,329,687 | ||||||
| 915,412 | Commercial Mortgage Trust, Series 2010-C1, Class D, 5.985%, 7/10/2046, 144A(a) | 928,391 | ||||||
| 2,112,208 | Credit Suisse Mortgage Trust, Series 2014-USA, Class A1, 3.304%, 9/15/2037, 144A | 2,215,817 | ||||||
| 11,367,000 | Credit Suisse Mortgage Trust, Series 2014-USA, Class A2, 3.953%, 9/15/2037, 144A | 12,192,666 | ||||||
| 6,366,877 | Extended Stay America Trust, Series 2021-ESH, Class A, 1-month LIBOR + 1.080%, 1.164%, 7/15/2038, 144A(b) | 6,384,849 | ||||||
| 1,477,314 | Extended Stay America Trust, Series 2021-ESH, Class D, 1-month LIBOR + 2.250%, 2.334%, 7/15/2038, 144A(b) | 1,495,627 | ||||||
| 5,627,003 | GS Mortgage Securities Trust, Series 2011-GC5, Class C, 5.303%, 8/10/2044, 144A(a) | 4,797,020 | ||||||
| 2,317,554 | GS Mortgage Securities Trust, Series 2014-GC18, Class B, 4.885%, 1/10/2047(a) | 2,296,720 | ||||||
| 6,596,065 | GS Mortgage Securities Trust, Series 2020-GC45, Class A5, 2.911%, 2/13/2053 | 6,994,566 | ||||||
| 3,825,000 | Morgan Stanley Bank of America Merrill Lynch Trust, Series 2013-C11, Class A4, 4.297%, 8/15/2046(a) | 4,028,379 | ||||||
| 6,909,759 | UBS-Barclays Commercial Mortgage Trust, Series 2013-C5, Class A4, 3.185%, 3/10/2046 | 7,079,383 | ||||||
| 4,982,141 | WFRBS Commercial Mortgage Trust, Series 2011-C4, Class D, 5.024%, 6/15/2044, 144A(a) | 4,744,155 | ||||||
| 5,245,978 | WFRBS Commercial Mortgage Trust, Series 2014-C20, Class AS, 4.176%, 5/15/2047 | 5,576,540 | ||||||
|
| |||||||
| 129,800,115 | ||||||||
|
| |||||||
| Oil Field Services — 0.3% |
| |||||||
| 25,364,000 | Thaioil Treasury Center Co. Ltd., 4.875%, 1/23/2043, 144A | 26,662,637 | ||||||
|
| |||||||
| Paper — 0.4% |
| |||||||
| 4,915,000 | Celulosa Arauco y Constitucion S.A., 4.500%, 8/01/2024 | 5,314,245 | ||||||
| 13,075,000 | Klabin Austria GmbH, 7.000%, 4/03/2049, 144A | 15,816,828 | ||||||
| 8,445,000 | Suzano Austria GmbH, 3.125%, 1/15/2032 | 8,155,759 | ||||||
| 8,529,000 | Suzano Austria GmbH, 3.750%, 1/15/2031 | 8,761,415 | ||||||
|
| |||||||
| 38,048,247 | ||||||||
|
| |||||||
| Pharmaceuticals — 0.4% |
| |||||||
| 9,325,000 | Bausch Health Cos., Inc., 5.250%, 1/30/2030, 144A | 8,695,562 | ||||||
| 3,863,000 | Jazz Securities DAC, 4.375%, 1/15/2029, 144A | 4,003,227 | ||||||
| 12,284,000 | Teva Pharmaceutical Finance Netherlands III BV, 3.150%, 10/01/2026 | 11,761,930 | ||||||
| 7,588,000 | Teva Pharmaceutical Finance Netherlands III BV, 7.125%, 1/31/2025 | 8,299,375 | ||||||
| 2,903,000 | Viatris, Inc., 4.000%, 6/22/2050, 144A | 3,085,489 | ||||||
|
| |||||||
| 35,845,583 | ||||||||
|
| |||||||
See accompanying notes to financial statements.
39 |
Portfolio of Investments – as of September 30, 2021
Loomis Sayles Core Plus Bond Fund – (continued)
| Principal Amount (‡) | Description | Value (†) | ||||||
| Property & Casualty Insurance — 0.1% |
| |||||||
| $ | 2,585,000 | Ascot Group Ltd., 4.250%, 12/15/2030, 144A | $ | 2,740,355 | ||||
| 7,865,000 | Liberty Mutual Group, Inc., 3.950%, 5/15/2060, 144A | 8,733,314 | ||||||
|
| |||||||
| 11,473,669 | ||||||||
|
| |||||||
| Refining — 0.1% |
| |||||||
| 12,089,000 | Ultrapar International S.A., 5.250%, 10/06/2026, 144A | 13,146,788 | ||||||
|
| |||||||
| REITs – Apartments — 0.0% |
| |||||||
| 1,220,000 | American Homes 4 Rent, 2.375%, 7/15/2031 | 1,208,510 | ||||||
| 1,715,000 | American Homes 4 Rent, 3.375%, 7/15/2051 | 1,738,896 | ||||||
|
| |||||||
| 2,947,406 | ||||||||
|
| |||||||
| REITs – Diversified — 0.2% |
| |||||||
| 16,503,000 | iStar, Inc., 4.250%, 8/01/2025 | 17,142,161 | ||||||
| 1,267,000 | iStar, Inc., 4.750%, 10/01/2024 | 1,339,853 | ||||||
|
| |||||||
| 18,482,014 | ||||||||
|
| |||||||
| REITs – Health Care — 0.1% |
| |||||||
| 5,434,000 | Welltower, Inc., 2.750%, 1/15/2031 | 5,599,932 | ||||||
|
| |||||||
| REITs – Shopping Centers — 0.0% |
| |||||||
| 2,026,000 | Brixmor Operating Partnership LP, 4.050%, 7/01/2030 | 2,262,325 | ||||||
|
| |||||||
| Retailers — 1.0% |
| |||||||
| 4,081,000 | Alibaba Group Holding Ltd., 3.250%, 2/09/2061 | 3,790,082 | ||||||
| 1,942,000 | Asbury Automotive Group, Inc., 4.500%, 3/01/2028 | 1,992,978 | ||||||
| 1,942,000 | Asbury Automotive Group, Inc., 4.750%, 3/01/2030 | 2,026,963 | ||||||
| 27,444,000 | El Puerto de Liverpool SAB de CV, 3.875%, 10/06/2026, 144A | 29,605,489 | ||||||
| 8,418,000 | Falabella S.A., 3.750%, 4/30/2023, 144A | 8,775,849 | ||||||
| 6,409,000 | Falabella S.A., 4.375%, 1/27/2025, 144A | 6,921,784 | ||||||
| 5,300,000 | Group 1 Automotive, Inc., 4.000%, 8/15/2028, 144A | 5,392,750 | ||||||
| 856,000 | Hanesbrands, Inc., 4.625%, 5/15/2024, 144A | 902,464 | ||||||
| 4,042,000 | Hanesbrands, Inc., 4.875%, 5/15/2026, 144A | 4,377,486 | ||||||
| 5,024,000 | Hanesbrands, Inc., 5.375%, 5/15/2025, 144A | 5,259,525 | ||||||
| 3,889,000 | Ken Garff Automotive LLC, 4.875%, 9/15/2028, 144A | 3,995,947 | ||||||
| 3,280,000 | Lithia Motors, Inc., 3.875%, 6/01/2029, 144A | 3,410,610 | ||||||
| 10,257,000 | Lithia Motors, Inc., 4.375%, 1/15/2031, 144A | 10,949,347 | ||||||
| 4,582,000 | MercadoLibre, Inc., 3.125%, 1/14/2031 | 4,421,676 | ||||||
|
| |||||||
| 91,822,950 | ||||||||
|
| |||||||
| Sovereigns — 3.4% |
| |||||||
| 13,213,000 | Colombia Government International Bond, 4.125%, 5/15/2051 | 11,338,340 | ||||||
| 23,769,000 | Dominican Republic, 4.875%, 9/23/2032, 144A | 24,244,618 | ||||||
| 11,070,000 | Dominican Republic, 5.300%, 1/21/2041, 144A | 10,948,341 | ||||||
| 16,076,000 | Egypt Government International Bond, 5.875%, 2/16/2031, 144A | 14,770,147 | ||||||
| 6,795,000 | Indonesia Government International Bond, 3.700%, 1/08/2022, 144A | 6,851,874 | ||||||
| 8,600,000 | Kenya Government International Bond, 6.300%, 1/23/2034, 144A | 8,491,382 | ||||||
| 27,253,000 | Kingdom of Saudi Arabia, 3.250%, 10/26/2026, 144A | 29,367,560 | ||||||
| 17,866,000 | Mexico Government International Bond, 3.771%, 5/24/2061 | 15,864,472 | ||||||
| 14,611,000 | Morocco Government International Bond, 4.000%, 12/15/2050, 144A | 13,328,154 | ||||||
| 6,285,000 | Oman Sovereign Sukuk Co., 4.875%, 6/15/2030, 144A | 6,614,271 | ||||||
| Sovereigns — continued |
| |||||||
| 2,980,000 | Peruvian Government International Bond, 2.392%, 1/23/2026 | 3,040,554 | ||||||
| 7,473,000 | Qatar Government International Bond, 4.400%, 4/16/2050, 144A | 9,107,644 | ||||||
| 14,497,000 | Republic of Ghana, 7.750%, 4/07/2029, 144A | 13,804,043 | ||||||
| 9,432,000 | Republic of Oman, 3.875%, 3/08/2022, 144A | 9,492,176 | ||||||
| 10,029,000 | State of Qatar, 3.875%, 4/23/2023, 144A | 10,549,625 | ||||||
| 18,089,000 | Ukraine Government International Bond, 7.253%, 3/15/2033, 144A | 18,300,279 | ||||||
| 4,000,460,000 | Uruguay Government International Bond, 8.250%, 5/21/2031, (UYU) | 94,651,425 | ||||||
|
| |||||||
| 300,764,905 | ||||||||
|
| |||||||
| Supermarkets — 0.3% |
| |||||||
| 12,271,000 | Albertsons Cos., Inc./Safeway, Inc./New Albertsons LP/Albertsons LLC, 3.500%, 3/15/2029, 144A | 12,246,151 | ||||||
| 15,901,000 | Albertsons Cos., Inc./Safeway, Inc./New Albertsons LP/Albertsons LLC, 3.250%, 3/15/2026, 144A | 16,139,515 | ||||||
|
| |||||||
| 28,385,666 | ||||||||
|
| |||||||
| Technology — 2.8% |
| |||||||
| 3,425,000 | Baidu, Inc., 2.375%, 10/09/2030 | 3,361,843 | ||||||
| 4,515,000 | Baidu, Inc., 3.075%, 4/07/2025 | 4,737,183 | ||||||
| 4,890,000 | Broadcom, Inc., 3.137%, 11/15/2035, 144A | 4,874,626 | ||||||
| 18,789,000 | Corning, Inc., 5.450%, 11/15/2079 | 25,502,596 | ||||||
| 3,133,000 | Equifax, Inc., 2.600%, 12/15/2025 | 3,284,995 | ||||||
| 2,544,000 | Equifax, Inc., 3.300%, 12/15/2022 | 2,612,387 | ||||||
| 4,324,000 | Equifax, Inc., 7.000%, 7/01/2037 | 6,130,224 | ||||||
| 13,320,000 | HCL America, Inc., 1.375%, 3/10/2026, 144A | 13,158,828 | ||||||
| 7,756,000 | Hewlett Packard Enterprise Co., 4.450%, 10/02/2023 | 8,307,781 | ||||||
| 4,916,000 | Hewlett Packard Enterprise Co., 4.650%, 10/01/2024 | 5,430,698 | ||||||
| 17,421,000 | Hewlett Packard Enterprise Co., 6.200%, 10/15/2035 | 23,064,478 | ||||||
| 16,919,000 | Iron Mountain, Inc., 4.500%, 2/15/2031, 144A | 17,160,942 | ||||||
| 21,206,000 | J2 Global, Inc., 4.625%, 10/15/2030, 144A | 22,531,375 | ||||||
| 6,975,000 | Jabil, Inc., 3.000%, 1/15/2031 | 7,152,767 | ||||||
| 13,294,000 | Microchip Technology, Inc., 2.670%, 9/01/2023 | 13,783,127 | ||||||
| 6,371,000 | Microchip Technology, Inc., 4.333%, 6/01/2023 | 6,733,609 | ||||||
| 13,101,000 | Micron Technology, Inc., 2.497%, 4/24/2023 | 13,484,597 | ||||||
| 6,151,000 | Molex Electronic Technologies LLC, 3.900%, 4/15/2025, 144A | 6,461,762 | ||||||
| 17,571,000 | Oracle Corp., 4.100%, 3/25/2061 | 18,706,552 | ||||||
| 5,778,000 | Sabre GLBL, Inc., 7.375%, 9/01/2025, 144A | 6,158,192 | ||||||
| 1,475,000 | Sabre GLBL, Inc., 9.250%, 4/15/2025, 144A | 1,704,790 | ||||||
| 1,374,000 | Science Applications International Corp., 4.875%, 4/01/2028, 144A | 1,419,960 | ||||||
| 2,060,000 | Seagate HDD Cayman, 4.125%, 1/15/2031 | 2,144,151 | ||||||
| 5,644,000 | Sensata Technologies BV, 4.000%, 4/15/2029, 144A | 5,745,310 | ||||||
| 7,989,000 | Sensata Technologies, Inc., 3.750%, 2/15/2031, 144A | 8,043,645 | ||||||
| 16,293,000 | Tencent Holdings Ltd., 3.290%, 6/03/2060, 144A | 15,179,211 | ||||||
|
| |||||||
| 246,875,629 | ||||||||
|
| |||||||
| Tobacco — 0.4% |
| |||||||
| 3,362,000 | Altria Group, Inc., 2.350%, 5/06/2025 | 3,485,865 | ||||||
| 31,751,000 | BAT Capital Corp., 2.789%, 9/06/2024 | 33,391,067 | ||||||
|
| |||||||
| 36,876,932 | ||||||||
|
| |||||||
| Transportation Services — 0.1% |
| |||||||
| 9,293,000 | Ryder System, Inc., MTN, 2.500%, 9/01/2024 | 9,712,747 | ||||||
|
| |||||||
See accompanying notes to financial statements.
| 40
Portfolio of Investments – as of September 30, 2021
Loomis Sayles Core Plus Bond Fund – (continued)
| Principal Amount (‡) | Description | Value (†) | ||||||
| Treasuries — 16.1% |
| |||||||
| 9,838,100(††) | Mexican Fixed Rate Bonds, Series M, 5.750%, 3/05/2026, (MXN) | $ | 45,448,338 | |||||
| 25,562,431(††) | Mexican Fixed Rate Bonds, Series M 20, 8.500%, 5/31/2029, (MXN) | 132,456,774 | ||||||
| 468,727,000 | Republic of Uruguay, 8.500%, 3/15/2028, 144A, (UYU) | 11,415,531 | ||||||
| 250,098,000 | Republic of Uruguay, 9.875%, 6/20/2022, 144A, (UYU) | 5,929,895 | ||||||
| 40,725,000 | U.S. Treasury Bond, 2.000%, 8/15/2051 | 40,005,949 | ||||||
| 10,150,000 | U.S. Treasury Bond, 2.250%, 5/15/2041 | 10,554,414 | ||||||
| 1,860,000 | U.S. Treasury Bond, 2.375%, 5/15/2051 | 1,984,969 | ||||||
| 38,381,800 | U.S. Treasury Note, 0.250%, 5/31/2025(f) | 37,734,107 | ||||||
| 448,836,000 | U.S. Treasury Note, 0.625%, 7/31/2026 | 441,647,613 | ||||||
| 35,580,500 | U.S. Treasury Note, 0.750%, 3/31/2026 | 35,328,935 | ||||||
| 72,580,000 | U.S. Treasury Note, 0.750%, 8/31/2026 | 71,803,168 | ||||||
| 115,805,000 | U.S. Treasury Note, 0.875%, 9/30/2026 | 115,180,739 | ||||||
| 201,725,000 | U.S. Treasury Note, 1.250%, 9/30/2028 | 200,873,973 | ||||||
| 25,590,000 | U.S. Treasury Note, 1.250%, 8/15/2031 | 24,970,242 | ||||||
| 61,745,000 | U.S. Treasury Note, 1.625%, 10/31/2023 | 63,423,692 | ||||||
| 4,267,700 | U.S. Treasury Note, 2.375%, 5/15/2029 | 4,581,109 | ||||||
| 20,372,800 | U.S. Treasury Note, 2.625%, 2/15/2029 | 22,212,719 | ||||||
| 62,385,000 | U.S. Treasury Note, 2.875%, 10/15/2021 | 62,452,202 | ||||||
| 81,104,600 | U.S. Treasury Note, 3.125%, 11/15/2028(f) | 91,122,285 | ||||||
| 93,095,000 | Uruguay Government International Bond, 8.500%, 3/15/2028, (UYU) | 2,267,266 | ||||||
|
| |||||||
| 1,421,393,920 | ||||||||
|
| |||||||
| Utility Other — 0.3% |
| |||||||
| 25,543,639 | Acwa Power Management & Investments One Ltd., 5.950%, 12/15/2039, 144A | 30,652,367 | ||||||
|
| |||||||
| Wireless — 1.1% |
| |||||||
| 13,487,000 | America Movil SAB de CV, 2.875%, 5/07/2030 | 14,030,094 | ||||||
| 1,207,000 | American Tower Corp., 4.700%, 3/15/2022 | 1,230,250 | ||||||
| 19,567,000 | Bharti Airtel Ltd., 4.375%, 6/10/2025, 144A | 21,030,807 | ||||||
| 983,000 | Crown Castle International Corp., 4.150%, 7/01/2050 | 1,115,971 | ||||||
| 5,305,000 | Empresa Nacional de Telecomunicaciones S.A., 3.050%, 9/14/2032, 144A | 5,212,163 | ||||||
| 7,180,000 | Kenbourne Invest S.A., 4.700%, 1/22/2028, 144A | 7,220,495 | ||||||
| 5,452,000 | Millicom International Cellular S.A., 4.500%, 4/27/2031, 144A | 5,700,066 | ||||||
| 17,920,000 | SBA Communications Corp., 3.125%, 2/01/2029, 144A | 17,315,200 | ||||||
| 20,429,000 | T-Mobile USA, Inc., 3.875%, 4/15/2030 | 22,556,927 | ||||||
|
| |||||||
| 95,411,973 | ||||||||
|
| |||||||
| Wirelines — 0.7% |
| |||||||
| 22,028,000 | AT&T, Inc., 1.700%, 3/25/2026 | 22,300,700 | ||||||
| 7,956,000 | AT&T, Inc., 3.500%, 9/15/2053 | 7,874,212 | ||||||
| 2,128,000 | AT&T, Inc., 3.550%, 9/15/2055 | 2,098,514 | ||||||
| 3,863,000 | AT&T, Inc., 3.650%, 6/01/2051 | 3,936,349 | ||||||
| 15,891,000 | AT&T, Inc., 3.650%, 9/15/2059 | 15,842,101 | ||||||
| 7,539,000 | AT&T, Inc., 3.800%, 12/01/2057 | 7,701,480 | ||||||
|
| |||||||
| 59,753,356 | ||||||||
|
| |||||||
| Total Non-Convertible Bonds (Identified Cost $7,958,866,090) | 8,093,644,455 | |||||||
|
| |||||||
| Municipals — 0.2% | ||||||||
| Virginia — 0.2% |
| |||||||
| 14,765,000 | University of Virginia, Revenue Bond, Series A, 3.227%, 9/01/2119 | 14,837,710 | ||||||
|
| |||||||
| Total Municipals (Identified Cost $14,765,000) | 14,837,710 | |||||||
|
| |||||||
| Total Bonds and Notes (Identified Cost $7,973,631,090) | 8,108,482,165 | |||||||
|
| |||||||
| Senior Loans — 5.1% | ||||||||
| Aerospace & Defense — 0.2% |
| |||||||
| 12,817,414 | TransDigm, Inc., 2020 Term Loan F, 1-month LIBOR + 2.250%, 2.334%, 12/09/2025(b) | 12,657,196 | ||||||
| 6,328,521 | TransDigm, Inc., 2020 Term Loan G, 1-month LIBOR + 2.250%, 2.334%, 8/22/2024(b) | 6,257,325 | ||||||
|
| |||||||
| 18,914,521 | ||||||||
|
| |||||||
| Automotive — 0.0% |
| |||||||
| 2,724,400 | KAR Auction Services, Inc., 2019 Term Loan B6, 1-month LIBOR + 2.250%, 2.375%, 9/19/2026(b) | 2,656,290 | ||||||
| 1,487,781 | Visteon Corp., 2018 Term Loan B, LIBOR + 1.750%, 1.834%, 3/25/2024(a) | 1,472,903 | ||||||
|
| |||||||
| 4,129,193 | ||||||||
|
| |||||||
| Brokerage — 0.2% |
| |||||||
| 10,157,273 | Citadel Securities LP, 2021 Term Loan B, 1-month LIBOR + 2.500%, 2.584%, 2/02/2028(b) | 10,059,357 | ||||||
| 6,231,250 | Zebra Buyer LLC, Term Loan B, 4/21/2028(h) | 6,247,950 | ||||||
|
| |||||||
| 16,307,307 | ||||||||
|
| |||||||
| Building Materials — 0.8% |
| |||||||
| 19,590,076 | American Builders & Contractors Supply Co., Inc., 2019 Term Loan, 1-month LIBOR + 2.000%, 2.084%, 1/15/2027(b) | 19,450,203 | ||||||
| 15,290,908 | Beacon Roofing Supply, Inc., 2021 Term Loan B, 1-month LIBOR + 2.250%, 2.334%, 5/19/2028(b) | 15,196,868 | ||||||
| 10,132,652 | Quikrete Holdings, Inc., 2016 1st Lien Term Loan, 1-month LIBOR + 2.500%, 2.584%, 2/01/2027(b) | 10,041,863 | ||||||
| 7,323,510 | Quikrete Holdings, Inc., 2021 Term Loan B1, 2/21/2028(h) | 7,296,999 | ||||||
| 17,961,174 | Summit Materials Cos. I LLC, 2017 Term Loan B, 1-month LIBOR + 2.000%, 2.084%, 11/21/2024(b) | 17,921,839 | ||||||
|
| |||||||
| 69,907,772 | ||||||||
|
| |||||||
| Cable Satellite — 0.4% |
| |||||||
| 12,245,142 | CSC Holdings LLC, 2017 Term Loan B1, 1-month LIBOR + 2.250%, 2.334%, 7/17/2025(b) | 12,061,465 | ||||||
| 4,217,424 | Telenet Financing USD LLC, 2020 USD Term Loan AR, 1-month LIBOR + 2.000%, 2.084%, 4/30/2028(b) | 4,166,477 | ||||||
| 9,994,764 | UPC Broadband Holding BV, 2020 USD Term Loan AT, 1-month LIBOR + 2.250%, 2.334%, 4/30/2028(b) | 9,884,422 | ||||||
| 12,405,000 | Virgin Media Bristol LLC, USD Term Loan N, 1-month LIBOR + 2.500%, 2.584%, 1/31/2028(b) | 12,316,676 | ||||||
|
| |||||||
| 38,429,040 | ||||||||
|
| |||||||
| Chemicals — 0.0% |
| |||||||
| 4,070,400 | Venator Materials Corp., Term Loan B, 1-month LIBOR + 3.000%, 3.084%, 8/08/2024(b) | 4,011,054 | ||||||
|
| |||||||
See accompanying notes to financial statements.
41 |
Portfolio of Investments – as of September 30, 2021
Loomis Sayles Core Plus Bond Fund – (continued)
| Principal Amount (‡) | Description | Value (†) | ||||||
| Consumer Cyclical Services — 0.2% |
| |||||||
| $ | 430,375 | FrontDoor, Inc., 2021 Term Loan B, 1-month LIBOR + 2.250%, 2.334%, 6/17/2028(b) | $ | 429,299 | ||||
| 4,344,113 | RE/MAX International, Inc., 2021 Term Loan B, 3-month LIBOR + 2.500%, 3.000%, 7/21/2028(b) | 4,327,822 | ||||||
| 11,055,399 | Trans Union LLC, 2019 Term Loan B5, 1-month LIBOR + 1.750%, 1.834%, 11/16/2026(b) | 10,981,107 | ||||||
|
| |||||||
| 15,738,228 | ||||||||
|
| |||||||
| Consumer Products — 0.1% |
| |||||||
| 6,887,092 | Coty, Inc., 2018 USD Term Loan B, 1-month LIBOR + 2.250%, 2.333%, 4/07/2025(b) | 6,753,689 | ||||||
| 4,859,697 | SRAM LLC, 2021 Term Loan B, LIBOR + 2.750%, 3.250%, 5/12/2028(a) | 4,851,582 | ||||||
|
| |||||||
| 11,605,271 | ||||||||
|
| |||||||
| Electric — 0.2% |
| |||||||
| 5,771,649 | Calpine Corp., 2019 Term Loan B10, 1-month LIBOR + 2.000%, 2.084%, 8/12/2026(b) | 5,698,407 | ||||||
| 4,360,722 | Calpine Corp., Term Loan B9, 1-month LIBOR + 2.000%, 2.090%, 4/05/2026(b) | 4,308,960 | ||||||
| 9,904,625 | Pacific Gas & Electric Co., 2020 Term Loan, 3-month LIBOR + 3.000%, 3.500%, 6/23/2025(b) | 9,728,224 | ||||||
|
| |||||||
| 19,735,591 | ||||||||
|
| |||||||
| Food & Beverage — 0.1% |
| |||||||
| 8,942,631 | Aramark Services, Inc., 2021 Term Loan B, 1-month LIBOR + 2.500%, 2.584%, 4/06/2028(b) | 8,875,561 | ||||||
|
| |||||||
| Gaming — 0.2% |
| |||||||
| 4,363,013 | Churchill Downs, Inc., 2017 Term Loan B, 1-month LIBOR + 2.000%, 2.086%, 12/27/2024(b) | 4,352,105 | ||||||
| 10,062,478 | Churchill Downs, Inc., 2021 Incremental Term Loan B1, 1-month LIBOR + 2.000%, 2.090%, 3/10/2028(b) | 9,961,853 | ||||||
|
| |||||||
| 14,313,958 | ||||||||
|
| |||||||
| Industrial Other — 0.3% |
| |||||||
| 14,330,952 | AEA International Holdings (Lux) S.a.r.l., Term Loan B, 3-month LIBOR + 3.750%, 4.250%, 9/07/2028(b) | 14,313,039 | ||||||
| 7,790,475 | AECOM, 2021 Term Loan B, 1-month LIBOR + 1.750%, 1.834%, 4/13/2028(b) | 7,782,684 | ||||||
| 2,315,746 | Altra Industrial Motion Corp., 2018 Term Loan B, 1-month LIBOR + 2.000%, 2.084%, 10/01/2025(b) | 2,300,694 | ||||||
|
| |||||||
| 24,396,417 | ||||||||
|
| |||||||
| Media Entertainment — 0.6% |
| |||||||
| 5,005,475 | E.W. Scripps Co. (The), 2020 Term Loan B3, 1-month LIBOR + 3.000%, 3.750%, 1/07/2028(b) | 5,012,433 | ||||||
| 9,400,342 | Entercom Media Corp., 2019 Term Loan, 1-month LIBOR + 2.500%, 2.585%, 11/18/2024(b) | 9,253,508 | ||||||
| 3,468,383 | Lamar Media Corp., 2020 Term Loan B, 1-month LIBOR + 1.500%, 1.583%, 2/05/2027(b) | 3,436,959 | ||||||
| 12,965,920 | Meredith Corp., 2020 Term Loan B2, 1-month LIBOR + 2.500%, 2.584%, 1/31/2025(b) | 12,932,598 | ||||||
| 12,900,777 | Nielsen Finance LLC, USD Term Loan B4, 1-month LIBOR + 2.000%, 2.083%, 10/04/2023(b) | 12,876,653 | ||||||
| 5,929,000 | Sinclair Television Group, Inc., Term Loan B2B, 1-month LIBOR + 2.500%, 2.590%, 9/30/2026(b) | 5,821,566 | ||||||
| 6,690,750 | WMG Acquisition Corp., 2021 Term Loan G, 1-month LIBOR + 2.125%, 2.209%, 1/20/2028(b) | 6,650,338 | ||||||
|
| |||||||
| 55,984,055 | ||||||||
|
| |||||||
| Midstream — 0.1% |
| |||||||
| 7,448,000 | DT Midstream, Inc., Term Loan B, LIBOR + 2.000%, 2.500%, 6/26/2028(a) | 7,442,191 | ||||||
|
| |||||||
| Packaging — 0.0% |
| |||||||
| 2,474,305 | Plastipak Packaging, Inc., 2018 Term Loan B, 1-month LIBOR + 2.500%, 2.590%, 10/14/2024(b) | 2,470,915 | ||||||
|
| |||||||
| Pharmaceuticals — 0.4% |
| |||||||
| 4,275,592 | Bausch Health Cos., Inc., Term Loan B, 1-month LIBOR + 2.750%, 2.834%, 11/27/2025(b) | 4,262,765 | ||||||
| 6,383,967 | Change Healthcare Holdings LLC, 2017 Term Loan B, LIBOR + 2.500%, 3.500%, 3/01/2024(a) | 6,376,306 | ||||||
| 19,573,645 | Elanco Animal Health, Inc., Term Loan B, 1-month LIBOR + 1.750%, 1.836%, 8/01/2027(b) | 19,321,928 | ||||||
| 4,925,273 | Grifols Worldwide Operations USA, Inc., USD 2019 Term Loan B, 1 Week LIBOR + 2.000%, 2.072%, 11/15/2027(b) | 4,843,168 | ||||||
|
| |||||||
| 34,804,167 | ||||||||
|
| |||||||
| Property & Casualty Insurance — 0.1% |
| |||||||
| 2,659,200 | USI, Inc., 2017 Repriced Term Loan, 3-month LIBOR + 3.000%, 3.132%, 5/16/2024(b) | 2,639,734 | ||||||
| 2,087,838 | USI, Inc., 2019 Incremental Term Loan B, 3-month LIBOR + 3.250%, 3.382%, 12/02/2026(b) | 2,072,827 | ||||||
|
| |||||||
| 4,712,561 | ||||||||
|
| |||||||
| Restaurants — 0.2% |
| |||||||
| 18,171,338 | 1011778 B.C. Unlimited Liability Co., Term Loan B4, 1-month LIBOR + 1.750%, 1.837%, 11/19/2026(b) | 17,936,564 | ||||||
|
| |||||||
| Technology — 0.6% |
| |||||||
| 9,777,738 | Iron Mountain, Inc., 2018 Term Loan B, 1-month LIBOR + 1.750%, 1.834%, 1/02/2026(b) | 9,679,961 | ||||||
| 19,673,393 | ON Semiconductor Corp., 2019 Term Loan B, 1-month LIBOR + 2.000%, 2.084%, 9/19/2026(b) | 19,641,522 | ||||||
| 1,924,856 | Sabre GLBL, Inc., 2018 Term Loan B, 1-month LIBOR + 2.000%, 2.084%, 2/22/2024(b) | 1,900,449 | ||||||
| 3,547,052 | Sabre GLBL, Inc., 2021 Term Loan B1, 1-month LIBOR + 3.500%, 4.000%, 12/17/2027(b) | 3,525,982 | ||||||
| 5,654,211 | Sabre GLBL, Inc., 2021 Term Loan B2, 1-month LIBOR + 3.500%, 4.000%, 12/17/2027(b) | 5,620,625 | ||||||
| 9,584,398 | SS&C Technologies Inc., 2018 Term Loan B5, 1-month LIBOR + 1.750%, 1.834%, 4/16/2025(b) | 9,492,580 | ||||||
|
| |||||||
| 49,861,119 | ||||||||
|
| |||||||
| Transportation Services — 0.2% |
| |||||||
| 10,388,901 | Uber Technologies, Inc., 2021 Term Loan B, 1-month LIBOR + 3.500%, 3.584%, 2/25/2027(b) | 10,380,278 | ||||||
| 4,673,193 | WEX, Inc., 2021 Term Loan, 1-month LIBOR + 2.250%, 2.334%, 3/31/2028(b) | 4,651,136 | ||||||
|
| |||||||
| 15,031,414 | ||||||||
|
| |||||||
| Wireless — 0.2% |
| |||||||
| 2,375,530 | Asurion LLC, 2018 Term Loan B6, 1-month LIBOR + 3.125%, 3.209%, 11/03/2023(b) | 2,360,683 | ||||||
| 15,698,240 | Asurion LLC, 2020 Term Loan B8, 1-month LIBOR + 3.250%, 3.334%, 12/23/2026(b) | 15,457,115 | ||||||
|
| |||||||
| 17,817,798 | ||||||||
|
| |||||||
| Total Senior Loans (Identified Cost $453,853,278) | 452,424,697 | |||||||
|
| |||||||
See accompanying notes to financial statements.
| 42
Portfolio of Investments – as of September 30, 2021
Loomis Sayles Core Plus Bond Fund – (continued)
| Principal Amount (‡) | Description | Value (†) | ||||||
| Short-Term Investments — 11.0% | ||||||||
| $ | 770,683,768 | Tri-Party Repurchase Agreement with Fixed Income Clearing Corporation, dated 9/30/2021 at 0.000% to be repurchased at $770,683,768 on 10/01/2021 collateralized by $117,000,000 U.S. Treasury Bond, 3.875% due 8/15/2040 valued at $153,429,939; $117,829,600 U.S. Treasury Bond, 1.125% due 8/15/2040 valued at $101,526,726; $588,165,000 U.S. Treasury Bond, 1.375% due 11/15/2040 valued at $531,140,786 including accrued interest (Note 2 of Notes to Financial Statements) | $ | 770,683,768 | ||||
| 186,490,000 | U.S. Treasury Bills, 0.002%-0.014%, 10/12/2021(i)(j) | 186,488,363 | ||||||
| 13,380,000 | U.S. Treasury Bills, 0.010%, 10/07/2021(i) | 13,379,916 | ||||||
|
| |||||||
| Total Short-Term Investments (Identified Cost $970,553,291) | 970,552,047 | |||||||
|
| |||||||
| Total Investments — 107.7% (Identified Cost $9,398,037,659) | 9,531,458,909 | |||||||
| Other assets less liabilities — (7.7)% | (681,908,562 | ) | ||||||
|
| |||||||
| Net Assets — 100.0% | $ | 8,849,550,347 | ||||||
|
| |||||||
| (‡) | Principal Amount stated in U.S. dollars unless otherwise noted. |
| ||||||
| (†) | See Note 2 of Notes to Financial Statements. |
| ||||||
| (††) | Amount shown represents units. One unit represents a principal amount of 100. |
| ||||||
| (a) | Variable rate security. The interest rate adjusts periodically based on; (i) changes in current interest rates and/or prepayments on underlying pools of assets, if applicable, (ii) reference to a base lending rate plus or minus a margin, and/or (iii) reference to a base lending rate adjusted by a multiplier and/or subject to certain floors or caps. Rate as of September 30, 2021 is disclosed. |
| ||||||
| (b) | Variable rate security. Rate as of September 30, 2021 is disclosed. |
| ||||||
| (c) | Level 3 security. Value has been determined using significant unobservable inputs. See Note 3 of Notes to Financial Statements. |
| ||||||
| (d) | Fair valued by the Fund’s adviser. At September 30, 2021, the value of these securities amounted to $1,001,922 or less than 0.1% of net assets. See Note 2 of Notes to Financial Statements. |
| ||||||
| (e) | The Fund’s investment in mortgage related securities of Federal Home Loan Mortgage Corporation, Federal National Mortgage Association and Government National Mortgage Association are interests in separate pools of mortgages. All separate investments in securities of each issuer which have the same coupon rate have been aggregated for the purpose of presentation in the Portfolio of Investments. |
| ||||||
| (f) | Security (or a portion thereof) has been designated to cover the Fund’s obligations under open TBA transactions. |
| ||||||
| (g) | When-issued/delayed delivery. See Note 2 of Notes to Financial Statements. |
| ||||||
| (h) | Position is unsettled. Contract rate was not determined at September 30, 2021 and does not take effect until settlement date. Maturity date is not finalized until settlement date. |
| ||||||
| (i) | Interest rate represents discount rate at time of purchase; not a coupon rate. |
| ||||||
| (j) | The Fund’s investment in U.S. Government/Agency securities is comprised of various lots with differing discount rates. These separate investments, which have the same maturity date, have been aggregated for the purpose of presentation in the Portfolio of Investments. |
| ||||||
| 144A | All or a portion of these securities are exempt from registration under Rule 144A of the Securities Act of 1933. These securities may be resold in transactions exempt from registration, normally to qualified institutional buyers. At September 30, 2021, the value of Rule 144A holdings amounted to $2,193,450,851 or 24.8% of net assets. |
| ||||||
| ABS | Asset-Backed Securities |
| ||||||
| EMTN | Euro Medium Term Note |
| ||||||
| FHLMC | Federal Home Loan Mortgage Corp. |
| ||||||
| FNMA | Federal National Mortgage Association |
| ||||||
| GMTN | Global Medium Term Note |
| ||||||
| GNMA | Government National Mortgage Association |
| ||||||
| LIBOR | London Interbank Offered Rate |
| ||||||
| MTN | Medium Term Note |
| ||||||
| REITs | Real Estate Investment Trusts |
| ||||||
| REMIC | Real Estate Mortgage Investment Conduit |
| ||||||
| SOFR | Secured Overnight Financing Rate |
| ||||||
| TBA | To Be Announced |
| ||||||
| UMBS® | Uniform Mortgage-Backed Securities |
| ||||||
| MXN | Mexican Peso |
| ||||||
| UYU | Uruguayan Peso |
| ||||||
Industry Summary at September 30, 2021
Mortgage Related | 25.4 | % | ||
Treasuries | 16.1 | |||
Banking | 9.0 | |||
Sovereigns | 3.4 | |||
Technology | 3.4 | |||
Government Owned - No Guarantee | 2.7 | |||
Finance Companies | 2.4 | |||
Electric | 2.3 | |||
Automotive | 2.1 | |||
Other Investments, less than 2% each | 29.9 | |||
Short-Term Investments | 11.0 | |||
|
| |||
Total Investments | 107.7 | |||
Other assets less liabilities | (7.7 | ) | ||
|
| |||
Net Assets | 100.0 | % | ||
|
|
See accompanying notes to financial statements.
43 |
Portfolio of Investments – as of September 30, 2021
Loomis Sayles Credit Income Fund
| Principal Amount | Description | Value (†) | ||||||
| Bonds and Notes — 92.6% of Net Assets | ||||||||
| Non-Convertible Bonds — 87.5% | ||||||||
| Aerospace & Defense — 3.4% |
| |||||||
| $ | 125,000 | Boeing Co. (The), 2.196%, 2/04/2026 | $ | 125,921 | ||||
| 20,000 | Boeing Co. (The), 2.250%, 6/15/2026 | 20,329 | ||||||
| 20,000 | Boeing Co. (The), 2.950%, 2/01/2030 | 20,392 | ||||||
| 5,000 | Boeing Co. (The), 3.100%, 5/01/2026 | 5,285 | ||||||
| 10,000 | Boeing Co. (The), 3.200%, 3/01/2029 | 10,406 | ||||||
| 5,000 | Boeing Co. (The), 3.250%, 2/01/2035 | 5,000 | ||||||
| 5,000 | Boeing Co. (The), 3.375%, 6/15/2046 | 4,815 | ||||||
| 5,000 | Boeing Co. (The), 3.500%, 3/01/2039 | 5,012 | ||||||
| 15,000 | Boeing Co. (The), 3.550%, 3/01/2038 | 15,236 | ||||||
| 220,000 | Boeing Co. (The), 3.625%, 2/01/2031 | 235,512 | ||||||
| 5,000 | Boeing Co. (The), 3.625%, 3/01/2048 | 4,909 | ||||||
| 40,000 | Boeing Co. (The), 3.750%, 2/01/2050 | 40,554 | ||||||
| 15,000 | Boeing Co. (The), 3.825%, 3/01/2059 | 14,714 | ||||||
| 10,000 | Boeing Co. (The), 3.850%, 11/01/2048 | 10,189 | ||||||
| 15,000 | Boeing Co. (The), 3.900%, 5/01/2049 | 15,441 | ||||||
| 30,000 | Boeing Co. (The), 3.950%, 8/01/2059 | 30,789 | ||||||
| 40,000 | Boeing Co. (The), 5.150%, 5/01/2030 | 46,948 | ||||||
| 20,000 | Boeing Co. (The), 5.805%, 5/01/2050 | 26,659 | ||||||
| 30,000 | Huntington Ingalls Industries, Inc., 3.844%, 5/01/2025 | 32,492 | ||||||
| 20,000 | Huntington Ingalls Industries, Inc., 4.200%, 5/01/2030 | 22,574 | ||||||
| 5,000 | Spirit AeroSystems, Inc., 4.600%, 6/15/2028 | 4,963 | ||||||
| 30,000 | Spirit AeroSystems, Inc., 7.500%, 4/15/2025, 144A | 31,762 | ||||||
| 125,000 | Textron, Inc., 3.000%, 6/01/2030 | 131,349 | ||||||
|
| |||||||
| 861,251 | ||||||||
|
| |||||||
| Airlines — 0.6% |
| |||||||
| 75,745 | American Airlines Pass Through Trust, Series 2016-3, Class A, 3.250%, 4/15/2030 | 73,172 | ||||||
| 15,000 | American Airlines, Inc./AAdvantage Loyalty IP Ltd., 5.500%, 4/20/2026, 144A | 15,769 | ||||||
| 15,000 | American Airlines, Inc./AAdvantage Loyalty IP Ltd., 5.750%, 4/20/2029, 144A | 16,162 | ||||||
| 14,014 | United Airlines Pass Through Trust, Series 2020-1, Class B, 4.875%, 7/15/2027 | 14,827 | ||||||
| 10,000 | United Airlines, Inc., 4.375%, 4/15/2026, 144A | 10,263 | ||||||
| 15,000 | United Airlines, Inc., 4.625%, 4/15/2029, 144A | 15,502 | ||||||
|
| |||||||
| 145,695 | ||||||||
|
| |||||||
| Automotive — 1.7% |
| |||||||
| 60,000 | Allison Transmission, Inc., 3.750%, 1/30/2031, 144A | 58,350 | ||||||
| 40,000 | Ford Motor Co., 9.000%, 4/22/2025 | 48,101 | ||||||
| 30,000 | Ford Motor Co., 9.625%, 4/22/2030 | 42,464 | ||||||
| 170,000 | General Motors Co., 5.200%, 4/01/2045 | 207,017 | ||||||
| 40,000 | General Motors Co., 6.250%, 10/02/2043 | 53,878 | ||||||
| 5,000 | General Motors Financial Co., Inc., Series C, (fixed rate to 9/30/2030, variable rate thereafter), 5.700%(a) | 5,756 | ||||||
|
| |||||||
| 415,566 | ||||||||
|
| |||||||
| Banking — 10.0% |
| |||||||
| 65,000 | Ally Financial, Inc., Series B, (fixed rate to 5/15/2026, variable rate thereafter), 4.700%(a) | 67,655 | ||||||
| 50,000 | Ally Financial, Inc., Series C, (fixed rate to 5/15/2028, variable rate thereafter), 4.700%(a) | 52,250 | ||||||
| 270,000 | Bank of America Corp., MTN, 4.250%, 10/22/2026(b) | 303,910 | ||||||
| 200,000 | Barclays PLC, (fixed rate to 9/23/2030, variable rate thereafter), 3.564%, 9/23/2035 | 207,495 | ||||||
| 215,000 | Citigroup, Inc., 4.450%, 9/29/2027(b) | 244,496 | ||||||
| 250,000 | Credit Agricole S.A., (fixed rate to 1/10/2028, variable rate thereafter), 4.000%, 1/10/2033, 144A(b) | 269,807 | ||||||
| 150,000 | Deutsche Bank AG, (fixed rate to 9/18/2030, variable rate thereafter), 3.547%, 9/18/2031 | 160,068 | ||||||
| 390,000 | Morgan Stanley, 3.625%, 1/20/2027(b) | 429,912 | ||||||
| Banking — continued |
| |||||||
| 200,000 | NatWest Group PLC, (fixed rate to 6/14/2026, variable rate thereafter), 1.642%, 6/14/2027 | 199,987 | ||||||
| 115,000 | Santander Holdings USA, Inc., 3.244%, 10/05/2026 | 122,845 | ||||||
| 200,000 | Societe Generale S.A., (fixed rate to 7/08/2030, variable rate thereafter), 3.653%, 7/08/2035, 144A | 207,255 | ||||||
| 200,000 | Standard Chartered PLC, (fixed rate to 4/01/2030, variable rate thereafter), 4.644%, 4/01/2031, 144A(b) | 230,700 | ||||||
|
| |||||||
| 2,496,380 | ||||||||
|
| |||||||
| Brokerage — 1.3% |
| |||||||
| 15,000 | Jefferies Group LLC, 6.250%, 1/15/2036 | 20,149 | ||||||
| 180,000 | Jefferies Group LLC, 6.500%, 1/20/2043 | 249,736 | ||||||
| 60,000 | Owl Rock Technology Finance Corp., 2.500%, 1/15/2027 | 60,233 | ||||||
|
| |||||||
| 330,118 | ||||||||
|
| |||||||
| Building Materials — 0.4% |
| |||||||
| 40,000 | Builders FirstSource, Inc., 6.750%, 6/01/2027, 144A | 42,400 | ||||||
| 55,000 | JELD-WEN, Inc., 4.875%, 12/15/2027, 144A | 57,312 | ||||||
|
| |||||||
| 99,712 | ||||||||
|
| |||||||
| Cable Satellite — 3.2% |
| |||||||
| 120,000 | CCO Holdings LLC/CCO Holdings Capital Corp., 4.250%, 2/01/2031, 144A | 122,059 | ||||||
| 120,000 | CCO Holdings LLC/CCO Holdings Capital Corp., 4.500%, 8/15/2030, 144A | 123,807 | ||||||
| 90,000 | Charter Communications Operating LLC/Charter Communications Operating Capital Corp., 3.950%, 6/30/2062 | 86,822 | ||||||
| 165,000 | Charter Communications Operating LLC/Charter Communications Operating Capital Corp., 4.800%, 3/01/2050 | 185,164 | ||||||
| 15,000 | DIRECTV Holdings LLC/DIRECTV Financing Co., Inc., 5.875%, 8/15/2027, 144A | 15,656 | ||||||
| 40,000 | DISH DBS Corp., 5.125%, 6/01/2029 | 39,192 | ||||||
| 5,000 | Sirius XM Radio, Inc., 5.500%, 7/01/2029, 144A | 5,406 | ||||||
| 200,000 | Time Warner Cable LLC, 4.500%, 9/15/2042 | 218,868 | ||||||
|
| |||||||
| 796,974 | ||||||||
|
| |||||||
| Chemicals — 1.5% |
| |||||||
| 70,000 | CF Industries, Inc., 4.500%, 12/01/2026, 144A | 79,812 | ||||||
| 15,000 | FMC Corp., 3.450%, 10/01/2029 | 16,188 | ||||||
| 60,000 | Hercules LLC, 6.500%, 6/30/2029 | 68,163 | ||||||
| 200,000 | Orbia Advance Corp. SAB de CV, 2.875%, 5/11/2031, 144A | 201,488 | ||||||
|
| |||||||
| 365,651 | ||||||||
|
| |||||||
| Consumer Cyclical Services — 3.5% |
| |||||||
| 185,000 | Expedia Group, Inc., 3.250%, 2/15/2030 | 191,328 | ||||||
| 50,000 | Go Daddy Operating Co. LLC/GD Finance Co., Inc., 3.500%, 3/01/2029, 144A | 49,562 | ||||||
| 45,000 | TriNet Group, Inc., 3.500%, 3/01/2029, 144A | 45,113 | ||||||
| 115,000 | Uber Technologies, Inc., 7.500%, 5/15/2025, 144A | 122,590 | ||||||
| 325,000 | Uber Technologies, Inc., 4.500%, 8/15/2029, 144A | 327,234 | ||||||
| 5,000 | Uber Technologies, Inc., 7.500%, 9/15/2027, 144A | 5,459 | ||||||
| 115,000 | Uber Technologies, Inc., 8.000%, 11/01/2026, 144A | 121,541 | ||||||
|
| |||||||
| 862,827 | ||||||||
|
| |||||||
| Electric — 1.6% |
| |||||||
| 15,000 | AES Corp. (The), 2.450%, 1/15/2031 | 14,794 | ||||||
| 5,000 | AES Corp. (The), 3.950%, 7/15/2030, 144A | 5,498 | ||||||
| 85,000 | Calpine Corp., 3.750%, 3/01/2031, 144A | 81,812 | ||||||
| 40,000 | Calpine Corp., 5.125%, 3/15/2028, 144A | 40,509 | ||||||
| 20,000 | IPALCO Enterprises, Inc., 4.250%, 5/01/2030 | 22,435 | ||||||
| 35,000 | NRG Energy, Inc., 4.450%, 6/15/2029, 144A | 38,724 | ||||||
| 35,000 | NRG Energy, Inc., 5.250%, 6/15/2029, 144A | 37,231 | ||||||
See accompanying notes to financial statements.
| 44
Portfolio of Investments – as of September 30, 2021
Loomis Sayles Credit Income Fund – (continued)
| Principal Amount | Description | Value (†) | ||||||
| Electric — continued |
| |||||||
| $ | 140,000 | Pacific Gas & Electric Co., 3.500%, 8/01/2050 | $ | 127,321 | ||||
| 20,000 | Vistra Operations Co. LLC, 3.700%, 1/30/2027, 144A | 21,092 | ||||||
|
| |||||||
| 389,416 | ||||||||
|
| |||||||
| Finance Companies — 6.6% |
| |||||||
| 150,000 | AerCap Ireland Capital DAC/AerCap Global Aviation Trust, 3.875%, 1/23/2028 | 161,043 | ||||||
| 105,000 | Air Lease Corp., 3.125%, 12/01/2030 | 107,568 | ||||||
| 205,000 | Air Lease Corp., MTN, 3.000%, 2/01/2030 | 208,015 | ||||||
| 40,000 | Air Lease Corp., Series B, (fixed rate to 6/15/2026, variable rate thereafter), 4.650%(a) | 41,850 | ||||||
| 125,000 | Aircastle Ltd., 4.125%, 5/01/2024 | 132,966 | ||||||
| 15,000 | Aircastle Ltd., (fixed rate to 6/15/2026, variable rate thereafter), 5.250%, 144A(a) | 15,349 | ||||||
| 100,000 | Ares Capital Corp., 2.875%, 6/15/2028 | 101,302 | ||||||
| 25,000 | Aviation Capital Group LLC, 1.950%, 1/30/2026, 144A | 24,910 | ||||||
| 35,000 | FS KKR Capital Corp., 3.400%, 1/15/2026 | 36,571 | ||||||
| 200,000 | GE Capital Funding LLC, 4.400%, 5/15/2030 | 231,744 | ||||||
| 75,000 | Navient Corp., 5.000%, 3/15/2027 | 77,250 | ||||||
| 35,000 | Oaktree Specialty Lending Corp., 2.700%, 1/15/2027 | 35,111 | ||||||
| 10,000 | OneMain Finance Corp., 7.125%, 3/15/2026 | 11,587 | ||||||
| 50,000 | Owl Rock Capital Corp., 2.625%, 1/15/2027 | 50,088 | ||||||
| 50,000 | Owl Rock Capital Corp., 2.875%, 6/11/2028 | 49,907 | ||||||
| 80,000 | Rocket Mortgage LLC/Rocket Mortgage Co-Issuer, Inc., 2.875%, 10/15/2026, 144A | 78,176 | ||||||
| 75,000 | Rocket Mortgage LLC/Rocket Mortgage Co-Issuer, Inc., 3.625%, 3/01/2029, 144A | 75,844 | ||||||
| 155,000 | Rocket Mortgage LLC/Rocket Mortgage Co-Issuer, Inc., 3.875%, 3/01/2031, 144A | 156,356 | ||||||
| 55,000 | Rocket Mortgage LLC/Rocket Mortgage Co-Issuer, Inc., 4.000%, 10/15/2033, 144A | 54,587 | ||||||
|
| |||||||
| 1,650,224 | ||||||||
|
| |||||||
| Financial Other — 1.0% |
| |||||||
| 115,000 | Blackstone Secured Lending Fund, 2.125%, 2/15/2027, 144A | 113,713 | ||||||
| 30,000 | Icahn Enterprises LP/Icahn Enterprises Finance Corp., 4.375%, 2/01/2029 | 29,963 | ||||||
| 115,000 | Icahn Enterprises LP/Icahn Enterprises Finance Corp., 5.250%, 5/15/2027 | 119,312 | ||||||
|
| |||||||
| 262,988 | ||||||||
|
| |||||||
| Food & Beverage — 3.0% |
| |||||||
| 150,000 | Fomento Economico Mexicano SAB de CV, 3.500%, 1/16/2050(b) | 156,934 | ||||||
| 145,000 | Kraft Heinz Foods Co., 4.375%, 6/01/2046 | 165,444 | ||||||
| 95,000 | Kraft Heinz Foods Co., 4.875%, 10/01/2049 | 115,624 | ||||||
| 10,000 | Pilgrim’s Pride Corp., 3.500%, 3/01/2032, 144A | 10,171 | ||||||
| 50,000 | Pilgrim’s Pride Corp., 5.875%, 9/30/2027, 144A | 53,162 | ||||||
| 60,000 | Post Holdings, Inc., 4.625%, 4/15/2030, 144A | 60,464 | ||||||
| 190,000 | Smithfield Foods, Inc., 3.000%, 10/15/2030, 144A | 191,244 | ||||||
|
| |||||||
| 753,043 | ||||||||
|
| |||||||
| Gaming — 0.7% |
| |||||||
| 85,000 | MGM Growth Properties Operating Partnership LP/MGP Finance Co-Issuer, Inc., 3.875%, 2/15/2029, 144A | 90,525 | ||||||
| 15,000 | Penn National Gaming, Inc., 4.125%, 7/01/2029, 144A | 14,826 | ||||||
| 55,000 | Scientific Games International, Inc., 7.000%, 5/15/2028, 144A | 59,331 | ||||||
| 5,000 | Scientific Games International, Inc., 7.250%, 11/15/2029, 144A | 5,618 | ||||||
|
| |||||||
| 170,300 | ||||||||
|
| |||||||
| Health Insurance — 0.6% |
| |||||||
| 90,000 | Centene Corp., 2.500%, 3/01/2031 | 88,763 | ||||||
| 35,000 | Centene Corp., 2.625%, 8/01/2031 | 34,763 | ||||||
| 20,000 | Centene Corp., 3.000%, 10/15/2030 | 20,500 | ||||||
| 5,000 | Centene Corp., 4.625%, 12/15/2029 | 5,449 | ||||||
|
| |||||||
| 149,475 | ||||||||
|
| |||||||
| Healthcare — 2.3% |
| |||||||
| 15,000 | Catalent Pharma Solutions, Inc., 3.125%, 2/15/2029, 144A | 14,729 | ||||||
| 10,000 | Charles River Laboratories International, Inc., 3.750%, 3/15/2029, 144A | 10,212 | ||||||
| 75,000 | Cigna Corp., 4.375%, 10/15/2028 | 86,671 | ||||||
| 5,000 | Encompass Health Corp., 4.750%, 2/01/2030 | 5,259 | ||||||
| 165,000 | HCA, Inc., 4.125%, 6/15/2029 | 184,309 | ||||||
| 100,000 | HCA, Inc., 5.250%, 6/15/2049 | 127,635 | ||||||
| 90,000 | Hologic, Inc., 3.250%, 2/15/2029, 144A | 90,043 | ||||||
| 25,000 | Tenet Healthcare Corp., 4.625%, 6/15/2028, 144A | 25,904 | ||||||
| 30,000 | Tenet Healthcare Corp., 6.125%, 10/01/2028, 144A | 31,514 | ||||||
|
| |||||||
| 576,276 | ||||||||
|
| |||||||
| Home Construction — 0.8% |
| |||||||
| 90,000 | Lennar Corp., 4.750%, 11/29/2027 | 104,283 | ||||||
| 70,000 | PulteGroup, Inc., 6.000%, 2/15/2035 | 90,475 | ||||||
|
| |||||||
| 194,758 | ||||||||
|
| |||||||
| Independent Energy — 2.4% |
| |||||||
| 150,000 | Aker BP ASA, 4.000%, 1/15/2031, 144A | 163,155 | ||||||
| 10,000 | Cimarex Energy Co., 4.375%, 6/01/2024 | 10,783 | ||||||
| 20,000 | Continental Resources, Inc., 3.800%, 6/01/2024 | 21,016 | ||||||
| 40,000 | Continental Resources, Inc., 5.750%, 1/15/2031, 144A | 48,350 | ||||||
| 20,000 | Diamondback Energy, Inc., 3.125%, 3/24/2031 | 20,768 | ||||||
| 25,000 | Energean Israel Finance Ltd., 5.375%, 3/30/2028, 144A | 25,585 | ||||||
| 40,000 | Energean Israel Finance Ltd., 5.875%, 3/30/2031, 144A | 41,086 | ||||||
| 5,000 | EQT Corp., 3.125%, 5/15/2026, 144A | 5,126 | ||||||
| 10,000 | EQT Corp., 3.625%, 5/15/2031, 144A | 10,420 | ||||||
| 5,000 | EQT Corp., 5.000%, 1/15/2029 | 5,630 | ||||||
| 55,000 | Hess Corp., 4.300%, 4/01/2027 | 61,086 | ||||||
| 60,000 | Hess Corp., 5.600%, 2/15/2041 | 74,967 | ||||||
| 30,000 | Occidental Petroleum Corp., 5.550%, 3/15/2026 | 33,300 | ||||||
| 45,000 | Ovintiv Exploration, Inc., 5.375%, 1/01/2026 | 50,880 | ||||||
| 20,000 | Ovintiv Exploration, Inc., 5.625%, 7/01/2024 | 22,177 | ||||||
|
| |||||||
| 594,329 | ||||||||
|
| |||||||
| Industrial Other — 0.1% |
| |||||||
| 20,000 | TopBuild Corp., 4.125%, 2/15/2032, 144A | 20,200 | ||||||
|
| |||||||
| Leisure — 0.6% |
| |||||||
| 55,000 | Carnival Corp., 5.750%, 3/01/2027, 144A | 56,856 | ||||||
| 30,000 | NCL Corp. Ltd., 5.875%, 3/15/2026, 144A | 30,750 | ||||||
| 10,000 | NCL Finance Ltd., 6.125%, 3/15/2028, 144A | 10,375 | ||||||
| 60,000 | Royal Caribbean Cruises Ltd., 5.500%, 4/01/2028, 144A | 61,369 | ||||||
|
| |||||||
| 159,350 | ||||||||
|
| |||||||
| Life Insurance — 0.8% |
| |||||||
| 50,000 | Athene Global Funding, 1.608%, 6/29/2026, 144A | 49,964 | ||||||
| 95,000 | Athene Global Funding, 2.550%, 11/19/2030, 144A | 95,143 | ||||||
| 30,000 | Athene Holding Ltd., 3.500%, 1/15/2031 | 32,121 | ||||||
| 30,000 | CNO Financial Group, Inc., 5.250%, 5/30/2029 | 35,247 | ||||||
|
| |||||||
| 212,475 | ||||||||
|
| |||||||
| Lodging — 1.2% |
| |||||||
| 60,000 | Hilton Domestic Operating Co., Inc., 3.625%, 2/15/2032, 144A | 59,100 | ||||||
| 40,000 | Hilton Domestic Operating Co., Inc., 4.000%, 5/01/2031, 144A | 40,774 | ||||||
See accompanying notes to financial statements.
45 |
Portfolio of Investments – as of September 30, 2021
Loomis Sayles Credit Income Fund – (continued)
| Principal Amount | Description | Value (†) | ||||||
| Lodging — continued |
| |||||||
| $ | 10,000 | Hilton Grand Vacations Borrower Escrow LLC/Hilton Grand Vacations Borrower Escrow, 4.875%, 7/01/2031, 144A | $ | 10,037 | ||||
| 25,000 | Hilton Grand Vacations Borrower Escrow LLC/Hilton Grand Vacations Borrower Escrow, 5.000%, 6/01/2029, 144A | 25,500 | ||||||
| 5,000 | Hyatt Hotels Corp., 5.375%, 4/23/2025 | 5,585 | ||||||
| 15,000 | Hyatt Hotels Corp., 5.750%, 4/23/2030 | 18,006 | ||||||
| 3,000 | Marriott International, Inc., Series EE, 5.750%, 5/01/2025 | 3,431 | ||||||
| 25,000 | Marriott International, Inc., Series FF, 4.625%, 6/15/2030 | 28,562 | ||||||
| 20,000 | Marriott International, Inc., Series HH, 2.850%, 4/15/2031 | 20,256 | ||||||
| 20,000 | Marriott Ownership Resorts, Inc., 4.500%, 6/15/2029, 144A | 20,250 | ||||||
| 75,000 | Travel & Leisure Co., 4.625%, 3/01/2030, 144A | 77,062 | ||||||
|
| |||||||
| 308,563 | ||||||||
|
| |||||||
| Media Entertainment — 2.5% |
| |||||||
| 25,000 | AMC Networks, Inc., 4.250%, 2/15/2029 | 24,875 | ||||||
| 60,000 | Clear Channel Worldwide Holdings, Inc., 5.125%, 8/15/2027, 144A | 62,089 | ||||||
| 85,000 | iHeartCommunications, Inc., 4.750%, 1/15/2028, 144A | 87,592 | ||||||
| 75,000 | iHeartCommunications, Inc., 5.250%, 8/15/2027, 144A | 77,930 | ||||||
| 35,000 | iHeartCommunications, Inc., 8.375%, 5/01/2027 | 37,406 | ||||||
| 25,000 | Lamar Media Corp., 3.750%, 2/15/2028 | 25,715 | ||||||
| 30,000 | Lamar Media Corp., 4.000%, 2/15/2030 | 30,885 | ||||||
| 10,000 | Netflix, Inc., 4.875%, 4/15/2028 | 11,525 | ||||||
| 120,000 | Netflix, Inc., 4.875%, 6/15/2030, 144A | 141,300 | ||||||
| 115,000 | ViacomCBS, Inc., 4.375%, 3/15/2043 | 131,555 | ||||||
|
| |||||||
| 630,872 | ||||||||
|
| |||||||
| Metals & Mining — 3.7% |
| |||||||
| 45,000 | Allegheny Technologies, Inc., 5.875%, 12/01/2027 | 47,587 | ||||||
| 200,000 | Anglo American Capital PLC, 4.500%, 3/15/2028, 144A | 225,525 | ||||||
| 35,000 | ArcelorMittal S.A., 7.000%, 10/15/2039 | 49,394 | ||||||
| 200,000 | First Quantum Minerals Ltd., 6.875%, 10/15/2027, 144A | 211,500 | ||||||
| 45,000 | FMG Resources August 2006 Pty Ltd., 4.375%, 4/01/2031, 144A | 46,501 | ||||||
| 60,000 | Freeport-McMoRan, Inc., 4.625%, 8/01/2030 | 64,875 | ||||||
| 40,000 | Freeport-McMoRan, Inc., 5.400%, 11/14/2034 | 48,050 | ||||||
| 10,000 | Freeport-McMoRan, Inc., 5.450%, 3/15/2043 | 12,313 | ||||||
| 135,000 | Glencore Funding LLC, 3.875%, 10/27/2027, 144A | 147,502 | ||||||
| 20,000 | Glencore Funding LLC, 4.000%, 3/27/2027, 144A | 21,995 | ||||||
| 35,000 | Novelis Corp., 4.750%, 1/30/2030, 144A | 36,844 | ||||||
| 10,000 | Volcan Cia Minera SAA, 4.375%, 2/11/2026, 144A | 9,735 | ||||||
|
| |||||||
| 921,821 | ||||||||
|
| |||||||
| Midstream — 2.4% |
| |||||||
| 115,000 | Cheniere Corpus Christi Holdings LLC, 5.125%, 6/30/2027 | 132,952 | ||||||
| 55,000 | Energy Transfer LP, 4.000%, 10/01/2027 | 60,679 | ||||||
| 30,000 | EnLink Midstream Partners LP, 5.450%, 6/01/2047 | 28,945 | ||||||
| 35,000 | EQM Midstream Partners LP, Series 10Y, 5.500%, 7/15/2028 | 38,452 | ||||||
| 15,000 | Hess Midstream Operations LP, 4.250%, 2/15/2030, 144A | 15,169 | ||||||
| 50,000 | Hess Midstream Operations LP, 5.625%, 2/15/2026, 144A | 51,875 | ||||||
| 80,000 | NGPL PipeCo LLC, 4.875%, 8/15/2027, 144A | 90,797 | ||||||
| 15,000 | Plains All American Pipeline LP/PAA Finance Corp., 3.800%, 9/15/2030 | 16,014 | ||||||
| Midstream — continued |
| |||||||
| 35,000 | Plains All American Pipeline LP/PAA Finance Corp., 4.300%, 1/31/2043 | 35,940 | ||||||
| 35,000 | Plains All American Pipeline LP/PAA Finance Corp., 4.700%, 6/15/2044 | 37,562 | ||||||
| 15,000 | Targa Resources Partners LP/Targa Resources Partners Finance Corp., 4.000%, 1/15/2032, 144A | 15,502 | ||||||
| 60,000 | Valero Energy Partners LP, 4.500%, 3/15/2028 | 67,734 | ||||||
|
| |||||||
| 591,621 | ||||||||
|
| |||||||
| Paper — 0.2% |
| |||||||
| 45,000 | Suzano Austria GmbH, 3.750%, 1/15/2031 | 46,226 | ||||||
|
| |||||||
| Pharmaceuticals — 2.3% |
| |||||||
| 245,000 | Merck & Co., Inc., 2.350%, 2/10/2022(b) | 246,886 | ||||||
| 50,000 | Teva Pharmaceutical Finance Co. LLC, 6.150%, 2/01/2036 | 54,657 | ||||||
| 70,000 | Teva Pharmaceutical Finance Netherlands III BV, 3.150%, 10/01/2026 | 67,025 | ||||||
| 250,000 | Teva Pharmaceutical Finance Netherlands III BV, 4.100%, 10/01/2046 | 215,625 | ||||||
|
| |||||||
| 584,193 | ||||||||
|
| |||||||
| Property & Casualty Insurance — 1.0% |
| |||||||
| 175,000 | Fidelity National Financial, Inc., 2.450%, 3/15/2031 | 174,060 | ||||||
| 65,000 | Sirius International Group Ltd., 4.600%, 11/01/2026, 144A | 66,369 | ||||||
|
| |||||||
| 240,429 | ||||||||
|
| |||||||
| REITs – Apartments — 0.0% |
| |||||||
| 10,000 | American Homes 4 Rent, 2.375%, 7/15/2031 | 9,906 | ||||||
|
| |||||||
| REITs – Mortgage — 0.2% |
| |||||||
| 15,000 | Ladder Capital Finance Holdings LLLP/Ladder Capital Finance Corp., 4.250%, 2/01/2027, 144A | 14,850 | ||||||
| 25,000 | Ladder Capital Finance Holdings LLLP/Ladder Capital Finance Corp., 5.250%, 10/01/2025, 144A | 25,311 | ||||||
|
| |||||||
| 40,161 | ||||||||
|
| |||||||
| REITs – Office Property — 0.0% |
| |||||||
| 10,000 | Corporate Office Properties LP, 2.750%, 4/15/2031 | 10,101 | ||||||
|
| |||||||
| REITs – Shopping Centers — 0.8% |
| |||||||
| 115,000 | Brixmor Operating Partnership LP, 4.050%, 7/01/2030 | 128,414 | ||||||
| 75,000 | SITE Centers Corp., 3.625%, 2/01/2025 | 79,476 | ||||||
|
| |||||||
| 207,890 | ||||||||
|
| |||||||
| Restaurants — 1.0% |
| |||||||
| 125,000 | 1011778 B.C. ULC/New Red Finance, Inc., 4.375%, 1/15/2028, 144A | 126,901 | ||||||
| 45,000 | Yum! Brands, Inc., 4.625%, 1/31/2032 | 48,038 | ||||||
| 60,000 | Yum! Brands, Inc., 4.750%, 1/15/2030, 144A | 65,029 | ||||||
|
| |||||||
| 239,968 | ||||||||
|
| |||||||
| Retailers — 0.8% |
| |||||||
| 55,000 | Carvana Co., 5.625%, 10/01/2025, 144A | 56,864 | ||||||
| 92,525 | CVS Pass-Through Trust, Series 2014, 4.163%, 8/11/2036, 144A | 102,158 | ||||||
| 20,000 | Lithia Motors, Inc., 3.875%, 6/01/2029, 144A | 20,796 | ||||||
| 10,000 | Murphy Oil USA, Inc., 3.750%, 2/15/2031, 144A | 10,063 | ||||||
|
| |||||||
| 189,881 | ||||||||
|
| |||||||
| Sovereigns — 0.8% |
| |||||||
| 200,000 | Mexico Government International Bond, 4.280%, 8/14/2041 | 204,060 | ||||||
|
| |||||||
| Technology — 4.8% |
| |||||||
| 85,000 | Avnet, Inc., 4.625%, 4/15/2026 | 94,794 | ||||||
| 115,000 | Broadcom, Inc., 4.300%, 11/15/2032 | 128,873 | ||||||
| 130,000 | CommScope Technologies LLC, 5.000%, 3/15/2027, 144A | 123,651 | ||||||
See accompanying notes to financial statements.
| 46
Portfolio of Investments – as of September 30, 2021
Loomis Sayles Credit Income Fund – (continued)
| Principal Amount | Description | Value (†) | ||||||
| Technology — continued |
| |||||||
| $ | 60,000 | CommScope, Inc., 4.750%, 9/01/2029, 144A | $ | 59,925 | ||||
| 5,000 | Everi Holdings, Inc., 5.000%, 7/15/2029, 144A | 5,123 | ||||||
| 55,000 | IHS Markit Ltd., 4.250%, 5/01/2029 | 62,679 | ||||||
| 60,000 | Iron Mountain, Inc., 5.250%, 7/15/2030, 144A | 63,674 | ||||||
| 35,000 | Jabil, Inc., 1.700%, 4/15/2026 | 35,184 | ||||||
| 30,000 | Marvell Technology, Inc., 2.450%, 4/15/2028, 144A | 30,563 | ||||||
| 25,000 | Marvell Technology, Inc., 2.950%, 4/15/2031, 144A | 25,697 | ||||||
| 265,000 | Micron Technology, Inc., 4.663%, 2/15/2030 | 305,876 | ||||||
| 25,000 | MSCI, Inc., 3.250%, 8/15/2033, 144A | 25,286 | ||||||
| 60,000 | Open Text Holdings, Inc., 4.125%, 2/15/2030, 144A | 61,650 | ||||||
| 60,000 | Qorvo, Inc., 3.375%, 4/01/2031, 144A | 63,264 | ||||||
| 10,000 | Sabre GLBL, Inc., 9.250%, 4/15/2025, 144A | 11,558 | ||||||
| 60,000 | SYNNEX Corp., 1.750%, 8/09/2026, 144A | 59,358 | ||||||
| 35,000 | Verisk Analytics, Inc., 4.125%, 3/15/2029 | 39,749 | ||||||
|
| |||||||
| 1,196,904 | ||||||||
|
| |||||||
| Treasuries — 15.6% |
| |||||||
| 135,000 | U.S. Treasury Bond, 1.125%, 8/15/2040 | 116,174 | ||||||
| 430,000 | U.S. Treasury Bond, 1.875%, 2/15/2051 | 410,045 | ||||||
| 1,705,000 | U.S. Treasury Note, 0.125%, 1/31/2023(b)(c) | 1,704,134 | ||||||
| 780,000 | U.S. Treasury Note, 0.125%, 4/30/2023 | 778,964 | ||||||
| 875,000 | U.S. Treasury Note, 0.250%, 9/30/2023 | 874,317 | ||||||
|
| |||||||
| 3,883,634 | ||||||||
|
| |||||||
| Wireless — 2.7% |
| |||||||
| 80,000 | Crown Castle International Corp., 2.500%, 7/15/2031 | 79,935 | ||||||
| 70,000 | SBA Communications Corp., 3.125%, 2/01/2029, 144A | 67,638 | ||||||
| 30,000 | Sprint Capital Corp., 6.875%, 11/15/2028 | 38,400 | ||||||
| 130,000 | T-Mobile USA, Inc., 3.375%, 4/15/2029 | 135,622 | ||||||
| 65,000 | T-Mobile USA, Inc., 3.500%, 4/15/2031 | 68,551 | ||||||
| 265,000 | T-Mobile USA, Inc., 3.875%, 4/15/2030 | 292,603 | ||||||
|
| |||||||
| 682,749 | ||||||||
|
| |||||||
| Wirelines — 1.4% |
| |||||||
| 130,000 | AT&T, Inc., 3.650%, 6/01/2051(b) | 132,468 | ||||||
| 150,000 | Telefonica Emisiones S.A., 5.520%, 3/01/2049 | 196,311 | ||||||
| 20,000 | Verizon Communications, Inc., 2.850%, 9/03/2041 | 19,520 | ||||||
|
| |||||||
| 348,299 | ||||||||
|
| |||||||
| Total Non-Convertible Bonds (Identified Cost $21,349,732) | 21,844,286 | |||||||
|
| |||||||
| Convertible Bonds — 5.1% | ||||||||
| Airlines — 0.6% |
| |||||||
| 20,000 | JetBlue Airways Corp., 0.500%, 4/01/2026, 144A | 19,597 | ||||||
| 80,000 | Southwest Airlines Co., 1.250%, 5/01/2025 | 119,500 | ||||||
|
| |||||||
| 139,097 | ||||||||
|
| |||||||
| Cable Satellite — 1.5% |
| |||||||
| 25,000 | DISH Network Corp., Zero Coupon, 0.000%, 12/15/2025, 144A(d) | 29,875 | ||||||
| 340,000 | DISH Network Corp., 3.375%, 8/15/2026 | 353,430 | ||||||
|
| |||||||
| 383,305 | ||||||||
|
| |||||||
| Consumer Cyclical Services — 0.3% |
| |||||||
| 25,000 | Expedia Group, Inc., Zero Coupon, 0.000%, 2/15/2026, 144A(d) | 26,992 | ||||||
| 25,000 | Peloton Interactive, Inc., Zero Coupon, 0.000%-1.003%, 2/15/2026, 144A(e) | 22,007 | ||||||
| 35,000 | Uber Technologies, Inc., Zero Coupon, 0.000%, 12/15/2025, 144A(d) | 34,042 | ||||||
|
| |||||||
| 83,041 | ||||||||
|
| |||||||
| Gaming — 0.1% |
| |||||||
| 10,000 | Penn National Gaming, Inc., 2.750%, 5/15/2026 | 31,910 | ||||||
|
| |||||||
| Healthcare — 0.5% |
| |||||||
| 120,000 | Teladoc Health, Inc., 1.250%, 6/01/2027 | 120,532 | ||||||
|
| |||||||
| Media Entertainment — 0.2% |
| |||||||
| 35,000 | Twitter, Inc., Zero Coupon, 0.000%, 3/15/2026, 144A(d) | 32,492 | ||||||
| 5,000 | Zynga, Inc., Zero Coupon, 0.779%, 12/15/2026, 144A(d) | 4,828 | ||||||
|
| |||||||
| 37,320 | ||||||||
|
| |||||||
| Pharmaceuticals — 1.2% |
| |||||||
| 240,000 | BioMarin Pharmaceutical, Inc., 1.250%, 5/15/2027 | 240,198 | ||||||
| 15,000 | Guardant Health, Inc., Zero Coupon, 0.000%, 11/15/2027, 144A(d) | 17,175 | ||||||
| 25,000 | Ionis Pharmaceuticals, Inc., Zero Coupon, 0.000%, 4/01/2026, 144A(d) | 22,718 | ||||||
| 10,000 | Livongo Health, Inc., 0.875%, 6/01/2025 | 13,211 | ||||||
|
| |||||||
| 293,302 | ||||||||
|
| |||||||
| Technology — 0.7% |
| |||||||
| 80,000 | Palo Alto Networks, Inc., 0.375%, 6/01/2025 | 132,086 | ||||||
| 40,000 | Splunk, Inc., 1.125%, 6/15/2027 | 39,225 | ||||||
|
| |||||||
| 171,311 | ||||||||
|
| |||||||
| Total Convertible Bonds (Identified Cost $1,204,578) | 1,259,818 | |||||||
|
| |||||||
| Total Bonds and Notes (Identified Cost $22,554,310) | 23,104,104 | |||||||
|
| |||||||
| Collateralized Loan Obligations — 3.0% | ||||||||
| 250,000 | AIMCO CLO Ltd., Series 2021-14A, Class D, 3-month LIBOR + 2.900%, 3.098%, 4/20/2034, 144A(f) | 249,995 | ||||||
| 250,000 | Fillmore Park CLO Ltd., Series 2018-1A, Class D, 3-month LIBOR + 2.900%, 3.026%, 7/15/2030, 144A(f) | 249,998 | ||||||
| 250,000 | Recette CLO Ltd., Series 2015-1A, Class DRR, 3-month LIBOR + 3.250%, 3.384%, 4/20/2034, 144A(f) | 251,339 | ||||||
|
| |||||||
| Total Collateralized Loan Obligations (Identified Cost $750,000) | 751,332 | |||||||
|
| |||||||
| Shares | ||||||||
| Preferred Stocks — 2.8% | ||||||||
| Convertible Preferred Stocks — 2.8% | ||||||||
| Banking — 1.0% |
| |||||||
| 97 | Bank of America Corp., Series L, 7.250% | 139,915 | ||||||
| 83 | Wells Fargo & Co., Class A, Series L, 7.500% | 123,006 | ||||||
|
| |||||||
| 262,921 | ||||||||
|
| |||||||
| Food & Beverage — 0.7% |
| |||||||
| 1,391 | Bunge Ltd., 4.875% | 165,449 | ||||||
|
| |||||||
| Wireless — 1.1% |
| |||||||
| 250 | 2020 Cash Mandatory Exchangeable Trust, 5.250%, 144A(g)(h) | 282,692 | ||||||
|
| |||||||
| Total Convertible Preferred Stocks (Identified Cost $702,116) | 711,062 | |||||||
|
| |||||||
| Total Preferred Stocks (Identified Cost $702,116) | 711,062 | |||||||
|
| |||||||
See accompanying notes to financial statements.
47 |
Portfolio of Investments – as of September 30, 2021
Loomis Sayles Credit Income Fund – (continued)
| Principal Amount | Description | Value (†) | ||||||
| Short-Term Investments — 2.5% | ||||||||
| $ | 624,662 | Tri-Party Repurchase Agreement with Fixed Income Clearing Corporation, dated 9/30/2021 at 0.000% to be repurchased at $624,662 on 10/01/2021 collateralized by $640,500 U.S. Treasury Note, 1.250% due 9/30/2028 valued at $637,198 including accrued interest (Note 2 of Notes to Financial Statements) (Identified Cost $624,662) | $ | 624,662 | ||||
|
| |||||||
| Total Investments — 100.9% (Identified Cost $24,631,088) | 25,191,160 | |||||||
| Other assets less liabilities — (0.9)% | (235,620 | ) | ||||||
|
| |||||||
| Net Assets — 100.0% | $ | 24,955,540 | ||||||
|
| |||||||
| (†) | See Note 2 of Notes to Financial Statements. |
| ||||||
| (a) | Perpetual bond with no specified maturity date. |
| ||||||
| (b) | Security (or a portion thereof) has been designated to cover the Fund’s obligations under open derivative contracts. |
| ||||||
| (c) | Security (or a portion thereof) has been pledged as collateral for open derivative contracts. |
| ||||||
| (d) | Interest rate represents annualized yield at time of purchase; not a coupon rate. |
| ||||||
| (e) | Interest rate represents annualized yield at time of purchase; not a coupon rate. The Fund’s investment in this security is comprised of various lots with differing annualized yields. |
| ||||||
| (f) | Variable rate security. Rate as of September 30, 2021 is disclosed. |
| ||||||
| (g) | Illiquid security. (Unaudited) |
| ||||||
| (h) | Securities classified as fair valued pursuant to the Fund’s pricing policies and procedures. At September 30, 2021, the value of these securities amounted to $282,692 or 1.1% of net assets. See Note 2 of Notes to Financial Statements. |
| ||||||
| 144A | All or a portion of these securities are exempt from registration under Rule 144A of the Securities Act of 1933. These securities may be resold in transactions exempt from registration, normally to qualified institutional buyers. At September 30, 2021, the value of Rule 144A holdings amounted to $7,998,989 or 32.1% of net assets. |
| ||||||
| LIBOR | London Interbank Offered Rate |
| ||||||
| MTN | Medium Term Note |
| ||||||
| REITs | Real Estate Investment Trusts |
| ||||||
At September 30, 2021, open short futures contracts were as follows:
| Financial Futures | Expiration Date | Contracts | Notional Amount | Value | Unrealized Appreciation (Depreciation) | |||||||||||||||
Ultra 10 Year U.S. Treasury Note | 12/21/2021 | 16 | $ | 2,359,718 | $ | 2,324,000 | $ | 35,718 | ||||||||||||
|
| |||||||||||||||||||
Industry Summary at September 30, 2021
Treasuries | 15.6 | % | ||
Banking | 11.0 | |||
Finance Companies | 6.6 | |||
Technology | 5.5 | |||
Cable Satellite | 4.7 | |||
Wireless | 3.8 | |||
Consumer Cyclical Services | 3.8 | |||
Metals & Mining | 3.7 | |||
Food & Beverage | 3.7 | |||
Pharmaceuticals | 3.5 | |||
Aerospace & Defense | 3.4 | |||
Healthcare | 2.8 | |||
Media Entertainment | 2.7 | |||
Independent Energy | 2.4 | |||
Midstream | 2.4 | |||
Other Investments, less than 2% each | 19.8 | |||
Collateralized Loan Obligations | 3.0 | |||
Short-Term Investments | 2.5 | |||
|
| |||
Total Investments | 100.9 | |||
Other assets less liabilities (including futures contracts) | (0.9 | ) | ||
|
| |||
Net Assets | 100.0 | % | ||
|
|
See accompanying notes to financial statements.
| 48
Portfolio of Investments – as of September 30, 2021
Loomis Sayles Global Allocation Fund
| Shares | Description | Value (†) | ||||||
| Common Stocks — 68.3% of Net Assets | ||||||||
| Canada — 1.4% |
| |||||||
| 1,147,249 | Canada Goose Holdings, Inc.(a) | $ | 40,968,003 | |||||
| 362,764 | Descartes Systems Group, Inc. (The)(a) | 29,528,634 | ||||||
|
| |||||||
| 70,496,637 | ||||||||
|
| |||||||
| China — 0.8% |
| |||||||
| 251,023 | Alibaba Group Holding Ltd., Sponsored ADR(a) | 37,163,955 | ||||||
|
| |||||||
| France — 0.8% |
| |||||||
| 722,714 | Dassault Systemes SE | 38,033,194 | ||||||
|
| |||||||
| Hong Kong — 0.7% |
| |||||||
| 2,898,200 | AIA Group Ltd. | 33,342,052 | ||||||
|
| |||||||
| India — 1.2% |
| |||||||
| 2,690,437 | HDFC Bank Ltd. | 57,516,834 | ||||||
|
| |||||||
| Japan — 1.3% |
| |||||||
| 1,710,461 | Nomura Research Institute Ltd. | 62,870,911 | ||||||
|
| |||||||
| Netherlands — 3.5% |
| |||||||
| 229,666 | ASML Holding NV | 171,573,864 | ||||||
|
| |||||||
| Sweden — 1.1% |
| |||||||
| 937,369 | Atlas Copco AB, Class A | 56,603,634 | ||||||
|
| |||||||
| Taiwan — 2.2% |
| |||||||
| 5,112,000 | Taiwan Semiconductor Manufacturing Co. Ltd. | 105,726,810 | ||||||
|
| |||||||
| United Kingdom — 3.3% |
| |||||||
| 557,068 | Farfetch Ltd., Class A(a) | 20,878,909 | ||||||
| 869,975 | Halma PLC | 33,183,893 | ||||||
| 370,983 | Linde PLC | 108,838,993 | ||||||
|
| |||||||
| 162,901,795 | ||||||||
|
| |||||||
| United States — 52.0% |
| |||||||
| 304,439 | Accenture PLC, Class A | 97,396,125 | ||||||
| 964,607 | Airbnb, Inc., Class A(a) | 161,812,824 | ||||||
| 6,127 | Alphabet, Inc., Class C(a) | 16,330,354 | ||||||
| 48,559 | Alphabet, Inc., Class A(a) | 129,823,458 | ||||||
| 43,213 | Amazon.com, Inc.(a) | 141,956,434 | ||||||
| 264,894 | Copart, Inc.(a) | 36,746,096 | ||||||
| 219,531 | Costco Wholesale Corp. | 98,646,255 | ||||||
| 477,365 | Cummins, Inc. | 107,197,084 | ||||||
| 505,058 | Danaher Corp. | 153,759,858 | ||||||
| 1,709,250 | Dropbox, Inc., Class A(a) | 49,944,285 | ||||||
| 284,361 | Estee Lauder Cos., Inc. (The), Class A | 85,288,395 | ||||||
| 325,276 | Facebook, Inc., Class A(a) | 110,395,422 | ||||||
| 91,353 | Goldman Sachs Group, Inc. (The) | 34,534,175 | ||||||
| 245,807 | Home Depot, Inc. (The) | 80,688,606 | ||||||
| 544,589 | IQVIA Holdings, Inc.(a) | 130,450,849 | ||||||
| 231,630 | M&T Bank Corp. | 34,591,624 | ||||||
| 304,881 | MasterCard, Inc., Class A | 106,001,026 | ||||||
| 47,335 | Mettler-Toledo International, Inc.(a) | 65,197,336 | ||||||
| 133,527 | Northrop Grumman Corp. | 48,089,749 | ||||||
| 480,770 | NVIDIA Corp. | 99,596,313 | ||||||
| 809,310 | Peloton Interactive, Inc., Class A(a) | 70,450,435 | ||||||
| 203,465 | Roper Technologies, Inc. | 90,771,840 | ||||||
| 284,643 | S&P Global, Inc. | 120,941,964 | ||||||
| 508,609 | salesforce.com, Inc.(a) | 137,944,933 | ||||||
| 298,164 | Sherwin-Williams Co. (The) | 83,405,416 | ||||||
| 309,450 | Texas Instruments, Inc. | 59,479,384 | ||||||
| 270,076 | UnitedHealth Group, Inc. | 105,529,496 | ||||||
| 96,301 | Vail Resorts, Inc.(a) | 32,169,349 | ||||||
| 226,834 | VeriSign, Inc.(a) | 46,503,238 | ||||||
|
| |||||||
| 2,535,642,323 | ||||||||
|
| |||||||
| Total Common Stocks (Identified Cost $2,284,347,624) | 3,331,872,009 | |||||||
|
| |||||||
| Principal Amount (‡) | Description | Value (†) | ||||||
| Bonds and Notes — 30.3% | ||||||||
| Non-Convertible Bonds — 28.3% | ||||||||
| Australia — 0.4% |
| |||||||
| 3,010,000 | Australia Government Bond, Series 133, 5.500%, 4/21/2023, (AUD)(b) | $ | 2,359,885 | |||||
| 800,000 | FMG Resources August 2006 Pty Ltd., 4.375%, 4/01/2031, 144A | 826,680 | ||||||
| 670,000 | GAIF Bond Issuer Pty Ltd., 3.400%, 9/30/2026, 144A(b) | 725,065 | ||||||
| 3,560,000 | Glencore Funding LLC, 1.625%, 9/01/2025, 144A(b) | 3,574,382 | ||||||
| 4,000,000 | Macquarie Group Ltd., (fixed rate to 9/23/2026, variable rate thereafter), 1.629%, 9/23/2027, 144A | 3,980,484 | ||||||
| 11,610,000 | New South Wales Treasury Corp., 2.000%, 3/08/2033, (AUD)(b) | 8,386,569 | ||||||
| 95,000 | Sydney Airport Finance Co. Pty Ltd., 3.375%, 4/30/2025, 144A | 100,790 | ||||||
| 1,370,000 | Westpac Banking Corp., 2.650%, 1/16/2030(b) | 1,457,027 | ||||||
|
| |||||||
| 21,410,882 | ||||||||
|
| |||||||
| Belgium — 0.1% |
| |||||||
| 2,745,000 | Anheuser-Busch InBev S.A., EMTN, 2.000%, 1/23/2035, (EUR)(b) | 3,513,373 | ||||||
| 1,690,000 | Anheuser-Busch InBev Worldwide, Inc., 4.750%, 1/23/2029(b) | 1,989,599 | ||||||
|
| |||||||
| 5,502,972 | ||||||||
|
| |||||||
| Brazil — 0.5% |
| |||||||
| 1,150,000 | Banco Bradesco S.A., 2.850%, 1/27/2023, 144A | 1,167,388 | ||||||
| 1,035,000 | Braskem Netherlands Finance BV, 4.500%, 1/10/2028 | 1,099,584 | ||||||
| 1,785,000 | Braskem Netherlands Finance BV, 4.500%, 1/31/2030 | 1,899,240 | ||||||
| 22,385(††) | Brazil Notas do Tesouro Nacional, Series F, 10.000%, 1/01/2031, (BRL) | 3,859,778 | ||||||
| 2,685,000 | Brazilian Government International Bond, 4.500%, 5/30/2029 | 2,755,615 | ||||||
| 1,085,000 | Brazilian Government International Bond, 4.625%, 1/13/2028 | 1,140,552 | ||||||
| 2,980,000 | BRF S.A., 4.875%, 1/24/2030 | 2,983,725 | ||||||
| 650,000 | Centrais Eletricas Brasileiras S.A., 4.625%, 2/04/2030, 144A | 645,775 | ||||||
| 400,000 | Cosan Luxembourg S.A., 5.000%, 3/14/2023, 144A | 399,000 | ||||||
| 1,100,000 | Embraer Netherlands Finance BV, 5.050%, 6/15/2025 | 1,157,750 | ||||||
| 1,250,000 | Itau Unibanco Holding S.A., 2.900%, 1/24/2023, 144A | 1,268,763 | ||||||
| 2,465,000 | Petrobras Global Finance BV, 5.999%, 1/27/2028 | 2,780,520 | ||||||
| 150,000 | Petrobras Global Finance BV, 6.875%, 1/20/2040 | 171,933 | ||||||
| 575,000 | Raizen Fuels Finance S.A., 5.300%, 1/20/2027, 144A | 644,690 | ||||||
| 2,515,000 | Suzano Austria GmbH, 2.500%, 9/15/2028 | 2,445,837 | ||||||
| 1,185,000 | Suzano Austria GmbH, 3.125%, 1/15/2032 | 1,144,414 | ||||||
| 550,000 | Suzano Austria GmbH, 3.750%, 1/15/2031 | 564,988 | ||||||
|
| |||||||
| 26,129,552 | ||||||||
|
| |||||||
| Canada — 5.0% |
| |||||||
| 790,000 | 1011778 BC ULC/New Red Finance, Inc., 4.000%, 10/15/2030, 144A | 782,100 | ||||||
| 375,651 | Air Canada Pass Through Trust, Series 2015-2, Class A, 4.125%, 6/15/2029, 144A(b) | 371,493 | ||||||
See accompanying notes to financial statements.
49 |
Portfolio of Investments – as of September 30, 2021
Loomis Sayles Global Allocation Fund – (continued)
| Principal Amount (‡) | Description | Value (†) | ||||||
| Canada — continued |
| |||||||
| $ | 757,528 | Air Canada Pass Through Trust, Series 2017-1, Class AA, 3.300%, 7/15/2031, 144A(b) | $ | 772,853 | ||||
| 1,210,000 | Antares Holdings LP, 3.950%, 7/15/2026, 144A | 1,275,090 | ||||||
| 1,010,000 | Antares Holdings LP, 6.000%, 8/15/2023, 144A | 1,092,642 | ||||||
| 4,500,000 | Bank of Montreal, (fixed rate to 1/22/2026, variable rate thereafter), MTN, 0.949%, 1/22/2027(b) | 4,427,190 | ||||||
| 2,675,000 | Bank of Nova Scotia (The), 1.050%, 3/02/2026(b) | 2,644,847 | ||||||
| 2,525,000 | Bank of Nova Scotia (The), 1.300%, 9/15/2026 | 2,506,444 | ||||||
| 2,835,000 | Bell Telephone Co. of Canada/Bell Canada (The), MTN, 3.600%, 9/29/2027, (CAD) | 2,410,377 | ||||||
| 1,735,000 | Brookfield Finance I UK PLC, 2.340%, 1/30/2032 | 1,707,176 | ||||||
| 1,015,000 | Brookfield Finance, Inc., 3.900%, 1/25/2028(b) | 1,126,046 | ||||||
| 2,715,000 | Brookfield Renewable Partners ULC, MTN, 4.250%, 1/15/2029, (CAD) | 2,408,003 | ||||||
| 63,600,000 | Canadian Government Bond, 0.250%, 2/01/2023, (CAD)(b) | 50,104,709 | ||||||
| 61,465,000 | Canadian Government Bond, 0.250%, 5/01/2023, (CAD)(b) | 48,366,443 | ||||||
| 11,680,000 | Canadian Government Bond, 0.500%, 3/01/2022, (CAD)(b) | 9,233,341 | ||||||
| 89,175,000 | Canadian Government Bond, 0.500%, 9/01/2025, (CAD)(b) | 69,142,659 | ||||||
| 970,000 | Canadian Imperial Bank of Commerce, 3.500%, 9/13/2023(b) | 1,028,195 | ||||||
| 1,800,000 | Canadian Imperial Bank of Commerce, (fixed rate to 7/22/2022, variable rate thereafter), 2.606%, 7/22/2023(b) | 1,831,780 | ||||||
| 800,000 | CPPIB Capital, Inc., 0.375%, 6/20/2024, 144A, (EUR)(b) | 945,732 | ||||||
| 4,695,000 | Enbridge Gas, Inc., MTN, 2.900%, 4/01/2030, (CAD) | 3,871,132 | ||||||
| 430,000 | Enbridge, Inc., 2.900%, 7/15/2022(b) | 437,651 | ||||||
| 4,770,000 | Enbridge, Inc., MTN, 2.990%, 10/03/2029, (CAD) | 3,866,276 | ||||||
| 905,000 | Export Development Canada, 1.800%, 9/01/2022, (CAD)(b) | 723,814 | ||||||
| 2,965,000 | Federation des Caisses Desjardins du Quebec, (fixed rate to 5/26/2025, variable rate thereafter), 2.856%, 5/26/2030, (CAD) | 2,423,547 | ||||||
| 197,076 | Institutional Mortgage Securities Canada, Inc., Series 2014-5A, Class A2, 2.616%, 7/12/2047, 144A, (CAD)(b) | 153,248 | ||||||
| 4,670,000 | Ontario Power Generation, Inc., MTN, 2.977%, 9/13/2029, (CAD) | 3,874,264 | ||||||
| 5,000,000 | Province of British Columbia Canada, Series 10, 1.750%, 9/27/2024(b) | 5,167,098 | ||||||
| 2,355,000 | Province of Quebec Canada, 2.300%, 9/01/2029, (CAD)(b) | 1,925,779 | ||||||
| 2,725,000 | Royal Bank of Canada, 0.875%, 1/20/2026(b) | 2,682,519 | ||||||
| 2,040,000 | Royal Bank of Canada, 1.200%, 4/27/2026(b) | 2,027,387 | ||||||
| 2,475,000 | Royal Bank of Canada, GMTN, 2.250%, 11/01/2024(b) | 2,583,555 | ||||||
| 2,960,000 | Shaw Communications, Inc., 3.300%, 12/10/2029, (CAD) | 2,415,487 | ||||||
| 2,500,000 | Toronto-Dominion Bank (The), 2.100%, 7/15/2022, 144A(b) | 2,537,107 | ||||||
| 1,690,000 | Toronto-Dominion Bank (The), GMTN, 3.500%, 7/19/2023(b) | 1,785,340 | ||||||
| 1,675,000 | Toronto-Dominion Bank (The), MTN, 1.150%, 6/12/2025(b) | 1,678,708 | ||||||
| 1,580,000 | Videotron Ltd., 5.125%, 4/15/2027, 144A | 1,635,300 | ||||||
|
| |||||||
| 241,965,332 | ||||||||
|
| |||||||
| Chile — 0.3% |
| |||||||
| 950,000 | Celulosa Arauco y Constitucion S.A., 4.500%, 8/01/2024 | 1,027,168 | ||||||
| 1,500,000 | Chile Government International Bond, 2.450%, 1/31/2031(b) | 1,484,895 | ||||||
| 1,005,000 | Chile Government International Bond, 2.550%, 1/27/2032(b) | 995,784 | ||||||
| 2,580,000 | Colbun S.A., 3.150%, 3/06/2030 | 2,650,950 | ||||||
| 1,960,000 | Corp. Nacional del Cobre de Chile, 3.000%, 9/30/2029, 144A(b) | 2,002,920 | ||||||
| 570,000 | Corp. Nacional del Cobre de Chile, 3.750%, 1/15/2031, 144A(b) | 613,176 | ||||||
| 595,000 | Empresa Nacional de Telecomunicaciones S.A., 3.050%, 9/14/2032, 144A | 584,588 | ||||||
| 1,980,000 | Empresa Nacional del Petroleo, 3.450%, 9/16/2031, 144A | 1,940,697 | ||||||
| 525,000 | Enel Chile S.A., 4.875%, 6/12/2028(b) | 601,125 | ||||||
| 2,690,000 | Engie Energia Chile S.A., 3.400%, 1/28/2030 | 2,763,975 | ||||||
| 800,000 | Inversiones CMPC S.A., 4.375%, 5/15/2023, 144A(b) | 834,400 | ||||||
| 1,120,000 | Transelec S.A., 4.250%, 1/14/2025, 144A(b) | 1,216,611 | ||||||
|
| |||||||
| 16,716,289 | ||||||||
|
| |||||||
| China — 1.0% |
| |||||||
| 920,000 | Alibaba Group Holding Ltd., 3.400%, 12/06/2027(b) | 985,416 | ||||||
| 795,000 | Baidu, Inc., 3.875%, 9/29/2023(b) | 839,448 | ||||||
| 67,500,000 | China Government Bond, 4.000%, 11/30/2035, (CNY)(b) | 11,930,048 | ||||||
| 98,500,000 | China Government Bond, 2.200%, 7/27/2025, (CNY)(b) | 15,109,816 | ||||||
| 6,500,000 | China Government Bond, 3.390%, 5/21/2025, (CNH)(b) | 1,039,091 | ||||||
| 500,000 | China Government Bond, 3.480%, 6/29/2027, (CNH)(b) | 81,417 | ||||||
| 25,000,000 | China Government Bond, 3.900%, 7/04/2036, (CNH)(b) | 4,268,256 | ||||||
| 2,600,000 | Country Garden Holdings Co. Ltd., 2.700%, 7/12/2026 | 2,415,187 | ||||||
| 2,435,000 | Country Garden Holdings Co. Ltd., 8.000%, 1/27/2024 | 2,516,060 | ||||||
| 905,000 | Industrial & Commercial Bank of China Ltd., 2.957%, 11/08/2022(b) | 926,928 | ||||||
| 2,750,000 | Shimao Group Holdings Ltd., 3.450%, 1/11/2031 | 2,448,654 | ||||||
| 2,750,000 | Sunac China Holdings Ltd., 5.950%, 4/26/2024 | 2,213,942 | ||||||
| 625,000 | Tencent Holdings Ltd., 2.880%, 4/22/2031, 144A | 637,917 | ||||||
| 500,000 | Tencent Holdings Ltd., 2.985%, 1/19/2023, 144A(b) | 513,300 | ||||||
| 1,175,000 | Tencent Holdings Ltd., 3.280%, 4/11/2024, 144A(b) | 1,239,402 | ||||||
| 1,270,000 | Weibo Corp., 3.500%, 7/05/2024(b) | 1,322,983 | ||||||
|
| |||||||
| 48,487,865 | ||||||||
|
| |||||||
| Colombia — 0.4% |
| |||||||
| 1,395,000 | Colombia Government International Bond, 3.125%, 4/15/2031 | 1,305,762 | ||||||
| 2,536,000 | Ecopetrol S.A., 5.875%, 5/28/2045 | 2,561,360 | ||||||
| 1,300,000 | Empresas Publicas de Medellin ESP, 4.250%, 7/18/2029, 144A | 1,294,475 | ||||||
| 1,026,000 | Millicom International Cellular S.A., 6.250%, 3/25/2029, 144A | 1,123,470 | ||||||
| 1,035,000 | Millicom International Cellular S.A., 6.625%, 10/15/2026 | 1,087,785 | ||||||
See accompanying notes to financial statements.
| 50
Portfolio of Investments – as of September 30, 2021
Loomis Sayles Global Allocation Fund – (continued)
| Principal Amount (‡) | Description | Value (†) | ||||||
| Colombia — continued |
| |||||||
| $ | 575,000 | Republic of Colombia, 3.875%, 4/25/2027 | $ | 595,913 | ||||
| 7,073,300,000 | Republic of Colombia, Series B, 6.250%, 11/26/2025, (COP) | 1,860,368 | ||||||
| 29,559,900,000 | Titulos De Tesoreria, Series B, 7.500%, 8/26/2026, (COP)(b) | 8,040,435 | ||||||
| 870,000 | Transportadora de Gas Internacional S.A. E.S.P., 5.550%, 11/01/2028, 144A | 989,016 | ||||||
|
| |||||||
| 18,858,584 | ||||||||
|
| |||||||
| Denmark — 0.1% |
| |||||||
| 2,055,000 | Orsted A/S, EMTN, 2.125%, 5/17/2027, (GBP) | 2,886,056 | ||||||
|
| |||||||
| Dominican Republic — 0.1% |
| |||||||
| 2,160,000 | Dominican Republic, 4.500%, 1/30/2030, 144A | 2,197,822 | ||||||
| 1,155,000 | Dominican Republic, 4.875%, 9/23/2032, 144A | 1,178,111 | ||||||
| 590,000 | Dominican Republic, 5.950%, 1/25/2027, 144A | 662,806 | ||||||
| 995,000 | Dominican Republic, 6.000%, 7/19/2028, 144A | 1,122,042 | ||||||
| 425,000 | Dominican Republic, 8.625%, 4/20/2027, 144A | 512,975 | ||||||
|
| |||||||
| 5,673,756 | ||||||||
|
| |||||||
| Egypt — 0.1% |
| |||||||
| 1,515,000 | Egypt Government International Bond, 5.250%, 10/06/2025 | 1,545,603 | ||||||
| 1,435,000 | Egypt Government International Bond, 7.625%, 5/29/2032 | 1,430,021 | ||||||
|
| |||||||
| 2,975,624 | ||||||||
|
| |||||||
| Finland — 0.1% |
| |||||||
| 3,575,000 | Nordea Bank Abp, 0.750%, 8/28/2025, 144A(b) | 3,534,717 | ||||||
|
| |||||||
| France — 0.3% |
| |||||||
| 205,000 | BNP Paribas S.A., 4.375%, 5/12/2026, 144A(b) | 226,400 | ||||||
| 890,000 | BNP Paribas S.A., (fixed rate to 6/09/2025, variable rate thereafter), 2.219%, 6/09/2026, 144A(b) | 913,479 | ||||||
| 1,415,000 | Caisse d’Amortissement de la Dette Sociale, 1.875%, 2/12/2022(b) | 1,423,745 | ||||||
| 250,000 | Credit Agricole S.A., 3.250%, 10/04/2024, 144A(b) | 266,629 | ||||||
| 4,500,000 | Credit Agricole S.A., (fixed rate to 1/26/2026, variable rate thereafter), 1.247%, 1/26/2027, 144A(b) | 4,436,404 | ||||||
| 1,300,000 | Edenred, 1.875%, 3/06/2026, (EUR)(b) | 1,622,197 | ||||||
| 1,400,000 | Engie S.A., 1.250%, 10/24/2041, (EUR)(b) | 1,637,469 | ||||||
| 500,000 | Holding d’Infrastructures de Transport SASU, EMTN, 1.625%, 11/27/2027, (EUR) | 615,135 | ||||||
| 500,000 | Holding d’Infrastructures de Transport SASU, EMTN, 0.625%, 3/27/2023, (EUR) | 584,625 | ||||||
| 1,015,000 | Societe Generale S.A., 4.750%, 11/24/2025, 144A(b) | 1,126,398 | ||||||
| 230,000 | SPCM S.A., 3.125%, 3/15/2027, 144A | 230,276 | ||||||
| 215,000 | SPCM S.A., 3.375%, 3/15/2030, 144A | 214,833 | ||||||
|
| |||||||
| 13,297,590 | ||||||||
|
| |||||||
| Germany — 0.2% |
| |||||||
| 1,165,000 | BMW U.S. Capital LLC, 3.150%, 4/18/2024, 144A(b) | 1,235,447 | ||||||
| 1,395,000 | BMW U.S. Capital LLC, 4.150%, 4/09/2030, 144A(b) | 1,609,029 | ||||||
| 1,255,000 | Deutsche Bank AG, (fixed rate to 1/14/2031, variable rate thereafter), 3.729%, 1/14/2032 | 1,295,768 | ||||||
| 680,000 | Deutsche Bank AG, (fixed rate to 5/28/2031, variable rate thereafter), 3.035%, 5/28/2032 | 689,934 | ||||||
| 3,790,000 | Kreditanstalt fuer Wiederaufbau, EMTN, 1.250%, 8/28/2023, (NOK)(b) | 434,523 | ||||||
| 1,450,000 | Siemens Financieringsmaatschappij NV, 2.350%, 10/15/2026, 144A(b) | 1,514,533 | ||||||
| Germany — continued |
| |||||||
| 490,000 | Volkswagen Group of America Finance LLC, 1.625%, 11/24/2027, 144A(b) | 484,763 | ||||||
| 420,000 | Volkswagen Group of America Finance LLC, 3.350%, 5/13/2025, 144A(b) | 449,026 | ||||||
|
| |||||||
| 7,713,023 | ||||||||
|
| |||||||
| Hong Kong — 0.1% |
| |||||||
| 355,000 | AIA Group Ltd., 3.200%, 3/11/2025, 144A(b) | 375,597 | ||||||
| 1,405,000 | AIA Group Ltd., 3.600%, 4/09/2029(b) | 1,538,541 | ||||||
| 1,135,000 | AIA Group Ltd., 3.900%, 4/06/2028, 144A(b) | 1,262,120 | ||||||
|
| |||||||
| 3,176,258 | ||||||||
|
| |||||||
| India — 0.2% |
| |||||||
| 1,195,000 | Adani Ports & Special Economic Zone Ltd., 3.100%, 2/02/2031, 144A | 1,140,711 | ||||||
| 2,480,000 | Adani Ports & Special Economic Zone Ltd., 4.200%, 8/04/2027 | 2,601,346 | ||||||
| 2,940,000 | Bharti Airtel Ltd., 3.250%, 6/03/2031 | 2,955,828 | ||||||
| 2,790,000 | Export-Import Bank of India, 2.250%, 1/13/2031, 144A | 2,588,561 | ||||||
| 1,230,000 | ICICI Bank Ltd., EMTN, 3.250%, 9/09/2022 | 1,252,286 | ||||||
| 1,250,000 | Power Finance Corp. Ltd., 3.950%, 4/23/2030, 144A | 1,277,988 | ||||||
|
| |||||||
| 11,816,720 | ||||||||
|
| |||||||
| Indonesia — 0.2% |
| |||||||
| 300,000 | Indonesia Government International Bond, 4.125%, 1/15/2025, 144A | 328,068 | ||||||
| 735,000 | Indonesia Government International Bond, 4.750%, 1/08/2026 | 833,993 | ||||||
| 50,092,000,000 | Indonesia Treasury Bond, Series FR75, 7.500%, 5/15/2038, (IDR)(b) | 3,643,372 | ||||||
| 43,840,000,000 | Indonesia Treasury Bond, Series FR82, 7.000%, 9/15/2030, (IDR)(b) | 3,211,615 | ||||||
| 1,475,000 | Republic of Indonesia, 2.850%, 2/14/2030(b) | 1,527,289 | ||||||
| 525,000 | Republic of Indonesia, 4.750%, 1/08/2026, 144A | 596,479 | ||||||
|
| |||||||
| 10,140,816 | ||||||||
|
| |||||||
| Ireland — 0.1% |
| |||||||
| 1,250,000 | Bank of Ireland Group PLC, 4.500%, 11/25/2023, 144A | 1,339,665 | ||||||
| 3,710,000 | Ireland Government Bond, Zero Coupon, 0.029%, 10/18/2031, (EUR)(b)(c) | 4,216,565 | ||||||
| 375,000 | Ireland Government Bond, 3.400%, 3/18/2024, (EUR)(b) | 477,214 | ||||||
|
| |||||||
| 6,033,444 | ||||||||
|
| |||||||
| Israel — 0.5% |
| |||||||
| 10,950,000 | State of Israel, 1.000%, 3/31/2030, (ILS)(b) | 3,344,782 | ||||||
| 2,300,000 | Teva Pharmaceutical Finance Co. LLC, 6.150%, 2/01/2036 | 2,514,222 | ||||||
| 4,140,000 | Teva Pharmaceutical Finance Netherlands III BV, 3.150%, 10/01/2026 | 3,964,050 | ||||||
| 19,171,000 | Teva Pharmaceutical Finance Netherlands III BV, 4.100%, 10/01/2046 | 16,534,988 | ||||||
|
| |||||||
| 26,358,042 | ||||||||
|
| |||||||
| Italy — 0.6% |
| |||||||
| 175,000 | Assicurazioni Generali SpA, EMTN (fixed rate to 10/27/2027, variable rate thereafter), 5.500%, 10/27/2047, (EUR) | 249,228 | ||||||
| 200,000 | Intesa Sanpaolo SpA, 5.710%, 1/15/2026, 144A | 224,377 | ||||||
| 530,000 | Intesa Sanpaolo SpA, EMTN, 3.928%, 9/15/2026, (EUR) | 694,030 | ||||||
See accompanying notes to financial statements.
51 |
Portfolio of Investments – as of September 30, 2021
Loomis Sayles Global Allocation Fund – (continued)
| Principal Amount (‡) | Description | Value (†) | ||||||
| Italy — continued |
| |||||||
| 6,965,000 | Italy Buoni Poliennali Del Tesoro, 1.350%, 4/01/2030, (EUR)(b) | $ | 8,510,609 | |||||
| 3,305,000 | Italy Buoni Poliennali Del Tesoro, 2.000%, 2/01/2028, (EUR) | 4,219,259 | ||||||
| 4,255,000 | Italy Buoni Poliennali Del Tesoro, 5.000%, 3/01/2022, (EUR)(b) | 5,040,613 | ||||||
| 1,975,000 | Italy Government International Bond, 2.375%, 10/17/2024 | 2,048,956 | ||||||
| 3,335,000 | Republic of Italy, 2.500%, 11/15/2025, (EUR) | 4,264,411 | ||||||
| 630,000 | UniCredit SpA, (fixed rate to 4/02/2029, variable rate thereafter), 7.296%, 4/02/2034, 144A | 763,768 | ||||||
| 635,000 | UniCredit SpA, (fixed rate to 6/19/2027, variable rate thereafter), 5.861%, 6/19/2032, 144A | 705,383 | ||||||
|
| |||||||
| 26,720,634 | ||||||||
|
| |||||||
| Japan — 0.8% |
| |||||||
| 991,720,800(†††) | Japan Government CPI Linked Bond, Series 23, 0.100%, 3/10/2028, (JPY)(b) | 9,169,042 | ||||||
| 2,020,350,000 | Japan Government Thirty Year Bond, Series 62, 0.500%, 3/20/2049, (JPY)(b) | 17,557,322 | ||||||
| 2,020,000 | Mizuho Financial Group, Inc., 2.564%, 9/13/2031 | 1,991,523 | ||||||
| 2,000,000 | Mizuho Financial Group, Inc., (fixed rate to 7/10/2023, variable rate thereafter), 1.241%, 7/10/2024(b) | 2,023,340 | ||||||
| 2,000,000 | Nomura Holdings, Inc., 1.851%, 7/16/2025(b) | 2,029,766 | ||||||
| 3,050,000 | Sumitomo Mitsui Financial Group, Inc., 1.402%, 9/17/2026 | 3,024,997 | ||||||
| 1,445,000 | Sumitomo Mitsui Financial Group, Inc., 3.040%, 7/16/2029(b) | 1,531,050 | ||||||
| 2,790,000 | Toyota Motor Corp., 2.362%, 3/25/2031(b) | 2,884,950 | ||||||
|
| |||||||
| 40,211,990 | ||||||||
|
| |||||||
| Korea — 0.9% |
| |||||||
| 765,000 | Export-Import Bank of Korea, 3.000%, 11/01/2022(b) | 786,170 | ||||||
| 160,900,000 | Export-Import Bank of Korea, MTN, 6.750%, 8/09/2022, (INR)(b) | 2,205,931 | ||||||
| 636,300,000 | Export-Import Bank of Korea, MTN, 6.900%, 2/07/2023, (INR)(b)(d)(e) | 8,767,057 | ||||||
| 1,100,000 | Hyundai Capital Services, Inc., 3.750%, 3/05/2023, 144A(b) | 1,144,910 | ||||||
| 1,650,000 | Kia Corp., 1.750%, 10/16/2026, 144A | 1,652,475 | ||||||
| 1,575,000 | Kia Corp., 3.000%, 4/25/2023, 144A(b) | 1,631,858 | ||||||
| 2,720,000 | Kookmin Bank, 1.375%, 5/06/2026, 144A(b) | 2,714,696 | ||||||
| 1,515,000 | Korea East-West Power Co. Ltd., 1.750%, 5/06/2025, 144A(b) | 1,540,210 | ||||||
| 910,000 | Korea Gas Corp., 2.750%, 7/20/2022, 144A(b) | 926,544 | ||||||
| 670,000 | KT Corp., 2.500%, 7/18/2026, 144A(b) | 700,632 | ||||||
| 1,180,000 | LG Chem Ltd., 3.250%, 10/15/2024, 144A(b) | 1,259,787 | ||||||
| 4,500,000,000 | Republic of Korea, 0.875%, 12/10/2023, (KRW)(b) | 3,748,291 | ||||||
| 4,500,000,000 | Republic of Korea, 1.125%, 9/10/2025, (KRW)(b) | 3,697,444 | ||||||
| 13,130,550,000 | Republic of Korea, 1.500%, 12/10/2030, (KRW)(b) | 10,413,222 | ||||||
| 1,440,000,000 | Republic of Korea, Series 2209, 2.000%, 9/10/2022, (KRW)(b) | 1,226,485 | ||||||
| 770,000 | Shinhan Bank Co. Ltd., 3.875%, 3/24/2026, 144A(b) | 837,629 | ||||||
| 2,765,000 | SK Hynix, Inc., 2.375%, 1/19/2031, 144A | 2,683,767 | ||||||
| Korea — continued |
| |||||||
| 140,000 | SK Telecom Co. Ltd., 6.625%, 7/20/2027, 144A(b) | 177,969 | ||||||
|
| |||||||
| 46,115,077 | ||||||||
|
| |||||||
| Luxembourg — 0.0% |
| |||||||
| 920,000 | ArcelorMittal S.A., 6.750%, 3/01/2041 | 1,264,425 | ||||||
|
| |||||||
| Malaysia — 0.1% |
| |||||||
| 28,570,000 | Malaysia Government Bond, 3.480%, 3/15/2023, (MYR)(b) | 6,969,624 | ||||||
|
| |||||||
| Mexico — 1.0% |
| |||||||
| 620,000 | Alfa SAB de CV, 6.875%, 3/25/2044 | 824,600 | ||||||
| 770,000 | America Movil SAB de CV, 2.125%, 3/10/2028, (EUR)(b) | 987,633 | ||||||
| 860,000 | America Movil SAB de CV, 2.875%, 5/07/2030(b) | 894,631 | ||||||
| 10,000,000 | America Movil SAB de CV, 6.450%, 12/05/2022, (MXN)(b) | 483,250 | ||||||
| 730,000 | Banco Santander Mexico S.A. Institucion de Banca Multiple Grupo Financiero Santander, 5.375%, 4/17/2025, 144A(b) | 815,921 | ||||||
| 1,905,000 | Cemex SAB de CV, 3.875%, 7/11/2031, 144A | 1,906,143 | ||||||
| 855,000 | Cemex SAB de CV, 5.450%, 11/19/2029 | 926,606 | ||||||
| 400,000 | Cemex SAB de CV, 7.375%, 6/05/2027, 144A | 443,096 | ||||||
| 1,775,000 | Coca-Cola Femsa SAB de CV, 2.750%, 1/22/2030(b) | 1,830,309 | ||||||
| 1,205,000 | Comision Federal de Electricidad, 4.750%, 2/23/2027(b) | 1,349,600 | ||||||
| 800,000 | Gruma SAB de CV, 4.875%, 12/01/2024(b) | 883,008 | ||||||
| 10,000,000 | Grupo Televisa SAB, EMTN, 7.250%, 5/14/2043, (MXN)(b) | 337,088 | ||||||
| 840,000 | Kimberly-Clark de Mexico SAB de CV, 2.431%, 7/01/2031, 144A(b) | 837,228 | ||||||
| 1,707,184(††††) | Mexican Fixed Rate Bonds, Series M, 5.750%, 3/05/2026, (MXN)(b) | 7,886,551 | ||||||
| 1,294,043(††††) | Mexican Fixed Rate Bonds, Series M 20, 8.500%, 5/31/2029, (MXN)(b) | 6,705,339 | ||||||
| 637,836(††††) | Mexican Fixed Rate Bonds, Series M 30, 8.500%, 11/18/2038, (MXN)(b) | 3,284,740 | ||||||
| 724,558(††††) | Mexican Fixed Rate Bonds, Series M-20, 7.500%, 6/03/2027, (MXN)(b) | 3,565,977 | ||||||
| 2,665,000 | Mexico Government International Bond, 3.250%, 4/16/2030(b) | 2,728,880 | ||||||
| 196,000 | Mexico Government International Bond, 4.000%, 3/15/2115, (EUR)(b) | 246,671 | ||||||
| 1,850,000 | Orbia Advance Corp. SAB de CV, 1.875%, 5/11/2026, 144A | 1,852,960 | ||||||
| 1,240,000 | Orbia Advance Corp. SAB de CV, 4.000%, 10/04/2027 | 1,351,612 | ||||||
| 3,505,000 | Petroleos Mexicanos, 5.950%, 1/28/2031 | 3,397,747 | ||||||
| 100,000 | Sigma Alimentos S.A. de CV, 2.625%, 2/07/2024, 144A, (EUR) | 121,400 | ||||||
| 835,000 | Sigma Alimentos S.A. de CV, 4.125%, 5/02/2026 | 911,845 | ||||||
| 2,090,000 | Sigma Finance Netherlands BV, 4.875%, 3/27/2028 | 2,382,600 | ||||||
| 1,010,000 | Unifin Financiera SAB de CV, 7.250%, 9/27/2023 | 1,012,414 | ||||||
| 2,195,000 | Unifin Financiera SAB de CV, 9.875%, 1/28/2029 | 2,205,997 | ||||||
|
| |||||||
| 50,173,846 | ||||||||
|
| |||||||
| Netherlands — 0.1% |
| |||||||
| 870,000 | Cooperatieve Rabobank U.A., 4.375%, 8/04/2025(b) | 964,030 | ||||||
See accompanying notes to financial statements.
| 52
Portfolio of Investments – as of September 30, 2021
Loomis Sayles Global Allocation Fund – (continued)
| Principal Amount (‡) | Description | Value (†) | ||||||
| Netherlands — continued |
| |||||||
| $ | 1,725,000 | ING Groep NV, (fixed rate to 7/01/2025, variable rate thereafter), 1.400%, 7/01/2026, 144A(b) | $ | 1,729,395 | ||||
|
| |||||||
| 2,693,425 | ||||||||
|
| |||||||
| New Zealand — 0.3% |
| |||||||
| 3,495,000 | ANZ New Zealand International Ltd., 1.250%, 6/22/2026, 144A(b) | 3,479,917 | ||||||
| 2,200,000 | Bank of New Zealand, 1.000%, 3/03/2026, 144A(b) | 2,164,467 | ||||||
| 5,000,000 | Fonterra Co-operative Group Ltd., MTN, 5.500%, 2/26/2024, (AUD)(b) | 4,032,999 | ||||||
| 6,310,000 | New Zealand Government Bond, 1.500%, 5/15/2031, (NZD)(b) | 4,163,742 | ||||||
| 3,575,000 | New Zealand Government Bond, 3.000%, 4/20/2029, (NZD)(b) | 2,666,033 | ||||||
|
| |||||||
| 16,507,158 | ||||||||
|
| |||||||
| Nigeria — 0.0% |
| |||||||
| 1,975,000 | Nigeria Government International Bond, 6.125%, 9/28/2028, 144A | 1,981,636 | ||||||
|
| |||||||
| Norway — 0.3% |
| |||||||
| 3,660,000 | DNB Bank ASA, (fixed rate to 5/25/2026, variable rate thereafter), 1.535%, 5/25/2027, 144A(b) | 3,661,669 | ||||||
| 2,790,000 | Equinor ASA, 3.625%, 4/06/2040(b) | 3,117,231 | ||||||
| 16,500,000 | Norway Government Bond, Series 478, 1.500%, 2/19/2026, 144A, (NOK)(b) | 1,896,592 | ||||||
| 46,500,000 | Norway Government Bond, Series 482, 1.375%, 8/19/2030, 144A, (NOK)(b) | 5,233,873 | ||||||
|
| |||||||
| 13,909,365 | ||||||||
|
| |||||||
| Panama — 0.0% |
| |||||||
| 1,485,000 | Cable Onda S.A., 4.500%, 1/30/2030, 144A | 1,557,765 | ||||||
|
| |||||||
| Paraguay — 0.1% |
| |||||||
| 1,420,000 | Paraguay Government International Bond, 4.950%, 4/28/2031, 144A | 1,601,760 | ||||||
| 800,000 | Republic of Paraguay, 5.000%, 4/15/2026, 144A | 888,008 | ||||||
|
| |||||||
| 2,489,768 | ||||||||
|
| |||||||
| Peru — 0.1% |
| |||||||
| 3,220,000 | Corp. Financiera de Desarrollo S.A., 2.400%, 9/28/2027, 144A | 3,202,708 | ||||||
| 2,005,000 | Peruvian Government International Bond, 2.392%, 1/23/2026(b) | 2,045,742 | ||||||
| 1,050,000 | Transportadora de Gas del Peru S.A., 4.250%, 4/30/2028, 144A(b) | 1,138,200 | ||||||
|
| |||||||
| 6,386,650 | ||||||||
|
| |||||||
| Philippines — 0.0% |
| |||||||
| 1,060,000 | Philippine Government International Bond, 2.457%, 5/05/2030(b) | 1,084,020 | ||||||
|
| |||||||
| Poland — 0.2% |
| |||||||
| 26,400,000 | Republic of Poland Government Bond, 1.250%, 10/25/2030, (PLN)(b) | 6,200,324 | ||||||
| 12,970,000 | Republic of Poland Government Bond, 3.250%, 7/25/2025, (PLN)(b) | 3,508,887 | ||||||
|
| |||||||
| 9,709,211 | ||||||||
|
| |||||||
| Portugal — 0.1% |
| |||||||
| 3,590,000 | EDP Finance BV, 1.710%, 1/24/2028, 144A | 3,524,016 | ||||||
|
| |||||||
| Qatar — 0.1% |
| |||||||
| 1,770,000 | Ooredoo International Finance Ltd., 2.625%, 4/08/2031, 144A | 1,802,285 | ||||||
| 1,600,000 | Qatar Petroleum, 2.250%, 7/12/2031, 144A(b) | 1,584,640 | ||||||
|
| |||||||
| 3,386,925 | ||||||||
|
| |||||||
| Romania — 0.2% |
| |||||||
| 29,970,000 | Romania Government Bond, 4.150%, 10/24/2030, (RON) | 6,996,914 | ||||||
| 1,100,000 | Romania Government International Bond, 2.000%, 4/14/2033, 144A, (EUR) | 1,214,680 | ||||||
|
| |||||||
| 8,211,594 | ||||||||
|
| |||||||
| Singapore — 0.3% |
| |||||||
| 785,000 | BOC Aviation Ltd., 2.750%, 9/18/2022, 144A(b) | 797,073 | ||||||
| 1,450,000 | BOC Aviation Ltd., 3.250%, 4/29/2025, 144A(b) | 1,518,784 | ||||||
| 860,000 | BOC Aviation USA Corp., 1.625%, 4/29/2024, 144A | 866,609 | ||||||
| 345,000 | DBS Group Holdings Ltd., (fixed rate to 12/11/2023, variable rate thereafter), 4.520%, 12/11/2028, 144A(b) | 369,750 | ||||||
| 4,510,000 | Republic of Singapore, 2.750%, 7/01/2023, (SGD)(b) | 3,452,237 | ||||||
| 10,055,000 | Singapore Government Bond, 2.125%, 6/01/2026, (SGD)(b) | �� | 7,801,623 | |||||
|
| |||||||
| 14,806,076 | ||||||||
|
| |||||||
| South Africa — 0.5% |
| |||||||
| 1,400,000 | Anglo American Capital PLC, 2.625%, 9/10/2030, 144A | 1,390,635 | ||||||
| 1,400,000 | Anglo American Capital PLC, 5.625%, 4/01/2030, 144A(b) | 1,689,693 | ||||||
| 1,420,000 | MTN (Mauritius) Investments Ltd., 4.755%, 11/11/2024 | 1,485,607 | ||||||
| 930,000 | MTN (Mauritius) Investments Ltd., 4.755%, 11/11/2024, 144A | 972,968 | ||||||
| 116,835,000 | Republic of South Africa, Series 2035, 8.875%, 2/28/2035, (ZAR) | 6,893,252 | ||||||
| 39,185,000 | Republic of South Africa, Series R213, 7.000%, 2/28/2031, (ZAR) | 2,189,442 | ||||||
| 7,585,000 | South Africa Government International Bond, 5.750%, 9/30/2049 | 7,224,712 | ||||||
|
| |||||||
| 21,846,309 | ||||||||
|
| |||||||
| Spain — 0.4% |
| |||||||
| 2,300,000 | Banco Bilbao Vizcaya Argentaria S.A., GMTN, 0.750%, 9/11/2022, (EUR)(b) | 2,693,218 | ||||||
| 400,000 | Banco Santander S.A., 3.125%, 2/23/2023(b) | 414,243 | ||||||
| 2,000,000 | Banco Santander S.A., (fixed rate to 9/14/2026, variable rate thereafter), 1.722%, 9/14/2027 | 1,990,706 | ||||||
| 600,000 | CaixaBank S.A., (fixed rate to 4/17/2025, variable rate thereafter), EMTN, 2.250%, 4/17/2030, (EUR) | 731,502 | ||||||
| 500,000 | CaixaBank S.A., (fixed rate to 7/14/2023, variable rate thereafter), EMTN, 2.750%, 7/14/2028, (EUR) | 603,628 | ||||||
| 3,700,000 | Cellnex Telecom S.A., EMTN, 1.750%, 10/23/2030, (EUR) | 4,220,106 | ||||||
| 270,000 | Grifols Escrow Issuer S.A., 4.750%, 10/15/2028, 144A | 275,737 | ||||||
| 700,000 | Naturgy Finance BV, EMTN, 1.500%, 1/29/2028, (EUR)(b) | 870,640 | ||||||
| 430,000 | Spain Government Bond, 1.600%, 4/30/2025, 144A, (EUR)(b) | 534,351 | ||||||
| 2,525,000 | Spain Government Bond, 1.950%, 7/30/2030, 144A, (EUR)(b) | 3,355,077 | ||||||
| 2,565,000 | Spain Government Bond, 4.400%, 10/31/2023, 144A, (EUR)(b) | 3,278,529 | ||||||
|
| |||||||
| 18,967,737 | ||||||||
|
| |||||||
See accompanying notes to financial statements.
53 |
Portfolio of Investments – as of September 30, 2021
Loomis Sayles Global Allocation Fund – (continued)
| Principal Amount (‡) | Description | Value (†) | ||||||
| Supranationals — 0.3% |
| |||||||
| $ | 1,495,000 | Corporacion Andina de Fomento, 2.375%, 5/12/2023(b) | $ | 1,536,367 | ||||
| 1,115,000 | Corporacion Andina de Fomento, 4.375%, 6/15/2022(b) | 1,146,183 | ||||||
| 3,360,000 | European Investment Bank, 1.750%, 7/30/2024, 144A, (CAD)(b) | 2,715,270 | ||||||
| 2,560,000 | International Bank for Reconstruction & Development, 0.250%, 12/23/2022, (SEK)(b) | 293,091 | ||||||
| 10,030,000 | International Bank for Reconstruction & Development, 1.200%, 7/22/2026, (CAD)(b) | 7,867,841 | ||||||
| 16,750,000 | Nordic Investment Bank, EMTN, 1.500%, 3/13/2025, (NOK)(b) | 1,918,633 | ||||||
|
| |||||||
| 15,477,385 | ||||||||
|
| |||||||
| Sweden — 0.1% |
| |||||||
| 1,675,000 | Svenska Handelsbanken AB, 0.625%, 6/30/2023, 144A(b) | 1,683,034 | ||||||
| 38,000,000 | Sweden Government Bond, 0.125%, 5/12/2031, 144A, (SEK)(b) | 4,221,211 | ||||||
|
| |||||||
| 5,904,245 | ||||||||
|
| |||||||
| Switzerland — 0.1% |
| |||||||
| 930,000 | Credit Suisse AG, 2.950%, 4/09/2025(b) | 985,836 | ||||||
| 2,180,000 | Credit Suisse Group AG, (fixed rate to 4/01/2030, variable rate thereafter), 4.194%, 4/01/2031, 144A(b) | 2,441,707 | ||||||
| 1,500,000 | Credit Suisse Group AG, (fixed rate to 5/14/2031, variable rate thereafter), 3.091%, 5/14/2032, 144A | 1,533,789 | ||||||
| 1,375,000 | Novartis Capital Corp., 2.000%, 2/14/2027(b) | 1,421,187 | ||||||
| 340,000 | Willow No. 2 (Ireland) PLC for Zurich Insurance Co. Ltd., EMTN, (fixed rate to 10/01/2025, variable rate thereafter), 4.250%, 10/01/2045(b) | 367,669 | ||||||
|
| |||||||
| 6,750,188 | ||||||||
|
| |||||||
| Tanzania — 0.0% |
| |||||||
| 985,000 | HTA Group Ltd., 7.000%, 12/18/2025, 144A | 1,034,250 | ||||||
|
| |||||||
| Thailand — 0.1% |
| |||||||
| 1,570,000 | Kasikornbank PCL, EMTN, 3.256%, 7/12/2023(b) | 1,637,227 | ||||||
| 950,000 | Thaioil Treasury Center Co. Ltd., 3.625%, 1/23/2023, 144A(b) | 976,895 | ||||||
|
| |||||||
| 2,614,122 | ||||||||
|
| |||||||
| Trinidad — 0.0% |
| |||||||
| 415,000 | Trinidad Generation Unlimited, 5.250%, 11/04/2027, 144A | 424,860 | ||||||
|
| |||||||
| Turkey — 0.4% |
| |||||||
| 2,045,000 | Aydem Yenilenebilir Enerji A/S, 7.750%, 2/02/2027, 144A | 1,991,830 | ||||||
| 2,250,000 | TC Ziraat Bankasi A/S, 5.375%, 3/02/2026, 144A | 2,183,036 | ||||||
| 2,830,000 | Turk Telekomunikasyon AS, 6.875%, 2/28/2025 | 3,060,079 | ||||||
| 525,000 | Turk Telekomunikasyon AS, 6.875%, 2/28/2025, 144A | 567,683 | ||||||
| 2,875,000 | Turkcell Iletisim Hizmetleri AS, 5.800%, 4/11/2028 | 3,051,237 | ||||||
| 6,970,000 | Turkey Government International Bond, 5.250%, 3/13/2030 | 6,426,953 | ||||||
| 1,345,000 | Turkey Government International Bond, 7.625%, 4/26/2029 | 1,433,614 | ||||||
|
| |||||||
| 18,714,432 | ||||||||
|
| |||||||
| Ukraine — 0.0% |
| |||||||
| 1,035,000 | Ukraine Government International Bond, 7.253%, 3/15/2033, 144A | 1,047,089 | ||||||
|
| |||||||
| United Arab Emirates — 0.1% |
| |||||||
| 1,610,000 | Abu Dhabi Crude Oil Pipeline LLC, 3.650%, 11/02/2029(b) | 1,789,112 | ||||||
| 1,295,000 | Abu Dhabi Government International Bond, 3.125%, 4/16/2030, 144A(b) | 1,405,464 | ||||||
|
| |||||||
| 3,194,576 | ||||||||
|
| |||||||
| United Kingdom — 0.3% |
| |||||||
| 95,000 | Avon Products, Inc., 8.450%, 3/15/2043 | 120,175 | ||||||
| 1,350,000 | CK Hutchison International 19 Ltd., 3.625%, 4/11/2029, 144A(b) | 1,476,900 | ||||||
| 1,420,000 | Diageo Capital PLC, 2.125%, 4/29/2032(b) | 1,411,988 | ||||||
| 635,000 | Lloyds Banking Group PLC, 4.050%, 8/16/2023(b) | 676,078 | ||||||
| 400,000 | Lloyds Banking Group PLC, 4.500%, 11/04/2024(b) | 439,241 | ||||||
| 1,125,000 | Lloyds Banking Group PLC, (fixed rate to 7/09/2024, variable rate thereafter), 3.870%, 7/09/2025(b) | 1,212,963 | ||||||
| 1,395,000 | Nationwide Building Society, (fixed rate to 7/18/2029, variable rate thereafter), 3.960%, 7/18/2030, 144A(b) | 1,550,753 | ||||||
| 1,190,000 | NatWest Markets PLC, 0.800%, 8/12/2024, 144A | 1,187,489 | ||||||
| 235,000 | Network Rail Infrastructure Finance PLC, EMTN, 4.750%, 1/22/2024, (GBP)(b) | 346,691 | ||||||
| 1,455,000 | Standard Chartered PLC, (fixed rate to 11/18/2030, variable rate thereafter), 3.265%, 2/18/2036, 144A | 1,443,510 | ||||||
| 250,000 | Standard Chartered PLC, EMTN, 3.125%, 11/19/2024, (EUR)(b) | 316,568 | ||||||
| 1,035,000 | United Kingdom Gilt, 2.750%, 9/07/2024, (GBP)(b) | 1,488,800 | ||||||
| 1,660,000 | Vodafone Group PLC, 4.375%, 5/30/2028(b) | 1,906,481 | ||||||
|
| |||||||
| 13,577,637 | ||||||||
|
| |||||||
| United States — 11.0% |
| |||||||
| 165,000 | AES Corp. (The), 3.950%, 7/15/2030, 144A | 181,437 | ||||||
| 315,000 | Aircastle Ltd., (fixed rate to 6/15/2026, variable rate thereafter), 5.250%, 144A(f) | 322,340 | ||||||
| 480,000 | Allison Transmission, Inc., 4.750%, 10/01/2027, 144A | 499,200 | ||||||
| 1,145,000 | Ally Financial, Inc., Series B, (fixed rate to 5/15/2026, variable rate thereafter), 4.700%(f) | 1,191,773 | ||||||
| 965,000 | Ally Financial, Inc., Series C, (fixed rate to 5/15/2028, variable rate thereafter), 4.700%(f) | 1,008,425 | ||||||
| 435,000 | AMC Networks, Inc., 4.250%, 2/15/2029 | 432,825 | ||||||
| 70,000 | American Airlines Group, Inc., 3.750%, 3/01/2025, 144A | 63,077 | ||||||
| 1,416,756 | American Airlines Pass Through Trust, Series 2016-1, Class B, 5.250%, 7/15/2025 | 1,398,381 | ||||||
| 1,208,651 | American Airlines Pass Through Trust, Series 2016-3, Class B, 3.750%, 4/15/2027 | 1,163,665 | ||||||
| 336,330 | American Airlines Pass Through Trust, Series 2017-1B, Class B, 4.950%, 8/15/2026 | 337,287 | ||||||
| 438,909 | American Airlines Pass Through Trust, Series 2017-2, Class B, 3.700%, 4/15/2027 | 424,222 | ||||||
| 3,910,000 | American Airlines, Inc., 11.750%, 7/15/2025, 144A | 4,838,625 | ||||||
| 220,000 | American Airlines, Inc./AAdvantage Loyalty IP Ltd., 5.500%, 4/20/2026, 144A | 231,275 | ||||||
| 255,000 | American Airlines, Inc./AAdvantage Loyalty IP Ltd., 5.750%, 4/20/2029, 144A | 274,763 | ||||||
See accompanying notes to financial statements.
| 54
Portfolio of Investments – as of September 30, 2021
Loomis Sayles Global Allocation Fund – (continued)
| Principal Amount (‡) | Description | Value (†) | ||||||
| United States — continued |
| |||||||
| 3,975,000 | Apple, Inc., Series MPLE, 2.513%, 8/19/2024, (CAD)(b) | $ | 3,256,136 | |||||
| 260,000 | Aptiv PLC, 1.600%, 9/15/2028, (EUR) | 322,744 | ||||||
| 1,300,000 | Ashland LLC, 3.375%, 9/01/2031, 144A | 1,311,375 | ||||||
| 915,000 | AT&T, Inc., 3.500%, 9/15/2053 | 905,594 | ||||||
| 804,000 | AT&T, Inc., 3.650%, 9/15/2059 | 801,526 | ||||||
| 945,000 | Athene Global Funding, 1.608%, 6/29/2026, 144A | 944,315 | ||||||
| 2,865,000 | Bank of America Corp., (fixed rate to 9/15/2026, variable rate thereafter), 1.978%, 9/15/2027, (CAD)(b) | 2,257,596 | ||||||
| 2,345,000 | Bank of America Corp., MTN, (fixed rate to 6/14/2023, variable rate thereafter), 0.523%, 6/14/2024(b) | 2,344,009 | ||||||
| 1,140,000 | Beazer Homes USA, Inc., 7.250%, 10/15/2029 | 1,255,425 | ||||||
| 2,240,000 | Boeing Co. (The), 2.196%, 2/04/2026(b) | 2,256,513 | ||||||
| 140,000 | Boeing Co. (The), 3.100%, 5/01/2026 | 147,976 | ||||||
| 25,000 | Boeing Co. (The), 3.250%, 2/01/2035 | 24,998 | ||||||
| 165,000 | Boeing Co. (The), 3.550%, 3/01/2038 | 167,592 | ||||||
| 25,000 | Boeing Co. (The), 3.625%, 3/01/2048 | 24,544 | ||||||
| 90,000 | Boeing Co. (The), 3.750%, 2/01/2050 | 91,247 | ||||||
| 635,000 | Boeing Co. (The), 3.850%, 11/01/2048 | 647,021 | ||||||
| 640,000 | Boeing Co. (The), 3.950%, 8/01/2059 | 656,830 | ||||||
| 585,000 | BP Capital Markets America, Inc., 3.216%, 11/28/2023(b) | 617,122 | ||||||
| 690,000 | Broadcom, Inc., 3.187%, 11/15/2036, 144A | 687,996 | ||||||
| 4,730,000 | Carnival Corp., 5.750%, 3/01/2027, 144A | 4,889,637 | ||||||
| 1,720,000 | Carvana Co., 5.500%, 4/15/2027, 144A | 1,755,604 | ||||||
| 260,000 | Catalent Pharma Solutions, Inc., 3.125%, 2/15/2029, 144A | 255,307 | ||||||
| 12,500,000 | CCO Holdings LLC/CCO Holdings Capital Corp., 4.250%, 2/01/2031, 144A | 12,714,500 | ||||||
| 2,360,000 | CCO Holdings LLC/CCO Holdings Capital Corp., 4.250%, 1/15/2034, 144A | 2,337,875 | ||||||
| 2,510,000 | Centene Corp., 2.500%, 3/01/2031 | 2,475,487 | ||||||
| 160,000 | Centene Corp., 2.625%, 8/01/2031 | 158,918 | ||||||
| 975,000 | Centene Corp., 3.000%, 10/15/2030 | 999,375 | ||||||
| 165,000 | Charles River Laboratories International, Inc., 3.750%, 3/15/2029, 144A | 168,506 | ||||||
| 175,000 | Charles River Laboratories International, Inc., 4.000%, 3/15/2031, 144A | 183,353 | ||||||
| 1,085,000 | Charter Communications Operating LLC/Charter Communications Operating Capital Corp., 3.950%, 6/30/2062 | 1,046,689 | ||||||
| 6,835,000 | Charter Communications Operating LLC/Charter Communications Operating Capital Corp., 4.400%, 12/01/2061 | 7,108,127 | ||||||
| 40,000 | Cincinnati Bell, Inc., 8.000%, 10/15/2025, 144A | 41,688 | ||||||
| 1,240,000 | Clear Channel Worldwide Holdings, Inc., 5.125%, 8/15/2027, 144A | 1,283,164 | ||||||
| 5,315,000 | CommScope Technologies LLC, 5.000%, 3/15/2027, 144A | 5,055,415 | ||||||
| 7,265,000 | CommScope, Inc., 4.750%, 9/01/2029, 144A | 7,255,919 | ||||||
| 95,000 | Continental Resources, Inc., 3.800%, 6/01/2024 | 99,826 | ||||||
| 920,000 | Continental Resources, Inc., 5.750%, 1/15/2031, 144A | 1,112,050 | ||||||
| 595,000 | CSC Holdings LLC, 5.375%, 2/01/2028, 144A | 621,775 | ||||||
| 490,000 | Dana, Inc., 5.375%, 11/15/2027 | 516,338 | ||||||
| 940,000 | DH Europe Finance II S.a.r.l., 0.750%, 9/18/2031, (EUR)(b) | 1,095,378 | ||||||
| 50,000 | Dillard’s, Inc., 7.000%, 12/01/2028 | 59,049 | ||||||
| 8,000 | Dillard’s, Inc., 7.750%, 7/15/2026 | 9,553 | ||||||
| 355,000 | DIRECTV Holdings LLC/DIRECTV Financing Co., Inc., 5.875%, 8/15/2027, 144A | 370,531 | ||||||
| United States — continued |
| |||||||
| 705,000 | DISH DBS Corp., 5.125%, 6/01/2029 | 690,752 | ||||||
| 3,035,000 | DISH DBS Corp., 5.875%, 11/15/2024 | 3,263,475 | ||||||
| 1,385,000 | DISH DBS Corp., 7.750%, 7/01/2026 | 1,563,977 | ||||||
| 310,000 | DR Horton, Inc., 4.375%, 9/15/2022 | 318,279 | ||||||
| 160,000 | Edison International, 4.950%, 4/15/2025 | 176,169 | ||||||
| 235,000 | Enbridge Energy Partners LP, 7.375%, 10/15/2045 | 370,573 | ||||||
| 575,000 | EnLink Midstream Partners LP, 5.450%, 6/01/2047 | 554,783 | ||||||
| 70,000 | EQT Corp., 3.125%, 5/15/2026, 144A | 71,758 | ||||||
| 145,000 | EQT Corp., 3.625%, 5/15/2031, 144A | 151,090 | ||||||
| 115,000 | Everi Holdings, Inc., 5.000%, 7/15/2029, 144A | 117,838 | ||||||
| 3,780,000 | Expedia Group, Inc., 2.950%, 3/15/2031 | 3,819,917 | ||||||
| 2,105,000 | Ford Motor Co., 6.625%, 10/01/2028 | 2,526,042 | ||||||
| 2,710,000 | Freeport-McMoRan, Inc., 4.375%, 8/01/2028 | 2,835,337 | ||||||
| 6,640,000 | Freeport-McMoRan, Inc., 5.400%, 11/14/2034 | 7,976,300 | ||||||
| 3,005,000 | Freeport-McMoRan, Inc., 5.450%, 3/15/2043 | 3,699,906 | ||||||
| 2,710,000 | General Motors Co., 5.200%, 4/01/2045 | 3,300,089 | ||||||
| 405,000 | General Motors Co., 6.250%, 10/02/2043 | 545,514 | ||||||
| 100,000 | General Motors Financial Co., Inc., EMTN, 0.955%, 9/07/2023, (EUR) | 117,938 | ||||||
| 635,000 | General Motors Financial Co., Inc., EMTN, 2.250%, 9/06/2024, (GBP) | 876,578 | ||||||
| 770,000 | General Motors Financial of Canada Ltd., Series 5, 3.250%, 11/07/2023, (CAD) | 631,885 | ||||||
| 315,000 | Georgia-Pacific LLC, 8.875%, 5/15/2031 | 491,675 | ||||||
| 855,000 | Go Daddy Operating Co. LLC/GD Finance Co., Inc., 3.500%, 3/01/2029, 144A | 847,519 | ||||||
| 2,340,000 | Goldman Sachs Group, Inc. (The), (fixed rate to 9/10/2023, variable rate thereafter), 0.657%, 9/10/2024 | 2,340,796 | ||||||
| 975,000 | Goodyear Tire & Rubber Co. (The), 7.000%, 3/15/2028 | 1,113,469 | ||||||
| 830,000 | HCA, Inc., 3.500%, 9/01/2030 | 879,294 | ||||||
| 20,000 | HCA, Inc., 4.750%, 5/01/2023 | 21,251 | ||||||
| 1,275,000 | HCA, Inc., 5.250%, 6/15/2049 | 1,627,345 | ||||||
| 4,285,000 | HCA, Inc., 5.375%, 9/01/2026 | 4,905,554 | ||||||
| 245,000 | Hess Midstream Operations LP, 4.250%, 2/15/2030, 144A | 247,756 | ||||||
| 660,000 | Hilton Grand Vacations Borrower Escrow LLC/Hilton Grand Vacations Borrower Escrow, 4.875%, 7/01/2031, 144A | 662,475 | ||||||
| 470,000 | Hilton Grand Vacations Borrower Escrow LLC/Hilton Grand Vacations Borrower Escrow, 5.000%, 6/01/2029, 144A | 479,400 | ||||||
| 3,065,000 | Hyundai Capital America, 0.875%, 6/14/2024, 144A | 3,048,855 | ||||||
| 1,000,000 | Hyundai Capital America, 2.650%, 2/10/2025(b) | 1,038,724 | ||||||
| 835,000 | Hyundai Capital America, 2.650%, 2/10/2025, 144A(b) | 867,334 | ||||||
| 1,585,000 | Hyundai Capital America, 2.750%, 9/27/2026, 144A(b) | 1,643,062 | ||||||
| 1,395,000 | Hyundai Capital America, 6.375%, 4/08/2030, 144A(b) | 1,791,335 | ||||||
| 11,250,000 | Icahn Enterprises LP/Icahn Enterprises Finance Corp., 4.375%, 2/01/2029 | 11,235,937 | ||||||
| 1,085,000 | iHeartCommunications, Inc., 4.750%, 1/15/2028, 144A | 1,118,092 | ||||||
| 620,000 | iHeartCommunications, Inc., 5.250%, 8/15/2027, 144A | 644,217 | ||||||
| 2,160,000 | iHeartCommunications, Inc., 8.375%, 5/01/2027 | 2,308,500 | ||||||
| 1,135,000 | Iron Mountain, Inc., 4.875%, 9/15/2029, 144A | 1,188,912 | ||||||
See accompanying notes to financial statements.
55 |
Portfolio of Investments – as of September 30, 2021
Loomis Sayles Global Allocation Fund – (continued)
| Principal Amount (‡) | Description | Value (†) | ||||||
| United States — continued |
| |||||||
| $ | 200,000 | Jazz Securities DAC, 4.375%, 1/15/2029, 144A | $ | 207,260 | ||||
| 745,000 | JBS USA LUX S.A./JBS USA Food Co./JBS USA Finance, Inc., 3.750%, 12/01/2031, 144A | 775,195 | ||||||
| 7,760,000 | JELD-WEN, Inc., 4.625%, 12/15/2025, 144A | 7,878,961 | ||||||
| 1,875,000 | JELD-WEN, Inc., 4.875%, 12/15/2027, 144A | 1,953,825 | ||||||
| 1,135,000 | John Deere Capital Corp., MTN, 0.450%, 6/07/2024 | 1,131,764 | ||||||
| 3,185,000 | John Deere Financial, Inc., 1.340%, 9/08/2027, (CAD) | 2,429,336 | ||||||
| 2,435,000 | Kraft Heinz Foods Co., 4.375%, 6/01/2046 | 2,778,311 | ||||||
| 1,970,000 | Kraft Heinz Foods Co., 5.500%, 6/01/2050 | 2,599,160 | ||||||
| 760,000 | Level 3 Financing, Inc., 5.375%, 5/01/2025 | 776,388 | ||||||
| 345,000 | Lithia Motors, Inc., 3.875%, 6/01/2029, 144A | 358,738 | ||||||
| 60,000 | Lumen Technologies, Inc., 5.625%, 4/01/2025 | 65,250 | ||||||
| 870,000 | Marriott Ownership Resorts, Inc., 4.500%, 6/15/2029, 144A | 880,875 | ||||||
| 44,000 | Masco Corp., 6.500%, 8/15/2032 | 58,150 | ||||||
| 615,000 | Medtronic Global Holdings SCA, 1.125%, 3/07/2027, (EUR)(b) | 749,728 | ||||||
| 2,355,000 | Mileage Plus Holdings LLC/Mileage Plus Intellectual Property Assets Ltd., 6.500%, 6/20/2027, 144A | 2,560,874 | ||||||
| 1,025,000 | Minerals Technologies, Inc., 5.000%, 7/01/2028, 144A | 1,063,355 | ||||||
| 25,000 | MPLX LP, 4.500%, 7/15/2023 | 26,466 | ||||||
| 95,000 | MPLX LP, 4.875%, 6/01/2025 | 106,165 | ||||||
| 490,000 | MSCI, Inc., 3.250%, 8/15/2033, 144A | 495,615 | ||||||
| 2,135,000 | Nationstar Mortgage Holdings, Inc., 5.500%, 8/15/2028, 144A | 2,199,050 | ||||||
| 4,605,000 | Nationwide Mutual Insurance Co., 4.350%, 4/30/2050, 144A(b) | 5,194,693 | ||||||
| 1,370,000 | Navient Corp., 5.000%, 3/15/2027 | 1,411,100 | ||||||
| 421,000 | Navient Corp., MTN, 5.625%, 8/01/2033 | 400,476 | ||||||
| 4,045,000 | NCL Corp. Ltd., 5.875%, 3/15/2026, 144A | 4,146,125 | ||||||
| 790,000 | NCL Finance Ltd., 6.125%, 3/15/2028, 144A | 819,625 | ||||||
| 835,000 | Netflix, Inc., 4.875%, 4/15/2028 | 962,338 | ||||||
| 2,250,000 | Netflix, Inc., 4.875%, 6/15/2030, 144A | 2,649,375 | ||||||
| 245,000 | Netflix, Inc., 5.375%, 11/15/2029, 144A | 296,756 | ||||||
| 20,000 | NGPL PipeCo LLC, 7.768%, 12/15/2037, 144A | 28,662 | ||||||
| 2,550,000 | Nissan Motor Acceptance Co. LLC, 1.125%, 9/16/2024, 144A | 2,545,206 | ||||||
| 475,000 | Novelis Corp., 4.750%, 1/30/2030, 144A | 500,033 | ||||||
| 775,000 | NRG Energy, Inc., 3.625%, 2/15/2031, 144A | 761,244 | ||||||
| 300,000 | Occidental Petroleum Corp., 4.500%, 7/15/2044 | 301,227 | ||||||
| 2,355,000 | Occidental Petroleum Corp., 6.625%, 9/01/2030 | 2,902,537 | ||||||
| 1,795,000 | Occidental Petroleum Corp., 8.875%, 7/15/2030 | 2,438,382 | ||||||
| 420,000 | Old Republic International Corp., 4.875%, 10/01/2024 | 466,588 | ||||||
| 1,170,000 | OneMain Finance Corp., 5.625%, 3/15/2023 | 1,230,659 | ||||||
| 860,000 | OneMain Finance Corp., 6.875%, 3/15/2025 | 966,425 | ||||||
| 2,310,000 | OneMain Finance Corp., 7.125%, 3/15/2026 | 2,676,712 | ||||||
| 130,000 | OneMain Finance Corp., 8.250%, 10/01/2023 | 145,279 | ||||||
| 100,000 | Ovintiv, Inc., 6.500%, 8/15/2034 | 134,868 | ||||||
| 45,000 | Ovintiv, Inc., 6.500%, 2/01/2038 | 61,900 | ||||||
| 230,000 | Ovintiv, Inc., 6.625%, 8/15/2037 | 315,432 | ||||||
| 30,000 | Ovintiv, Inc., 7.200%, 11/01/2031 | 40,258 | ||||||
| 30,000 | Ovintiv, Inc., 7.375%, 11/01/2031 | 40,694 | ||||||
| 130,000 | Ovintiv, Inc., 8.125%, 9/15/2030 | 178,849 | ||||||
| 8,630,000 | Owl Rock Capital Corp., 4.250%, 1/15/2026 | 9,262,603 | ||||||
| 1,550,000 | Owl Rock Technology Finance Corp., 2.500%, 1/15/2027 | 1,556,008 | ||||||
| United States — continued |
| |||||||
| 2,120,000 | Owl Rock Technology Finance Corp., 4.750%, 12/15/2025, 144A | 2,317,473 | ||||||
| 1,250,000 | Pacific Gas & Electric Co., 3.500%, 8/01/2050 | 1,136,794 | ||||||
| 1,645,000 | Pacific Gas & Electric Co., 3.950%, 12/01/2047 | 1,583,037 | ||||||
| 310,000 | Penn National Gaming, Inc., 4.125%, 7/01/2029, 144A | 306,404 | ||||||
| 970,000 | Pilgrim’s Pride Corp., 3.500%, 3/01/2032, 144A | 986,606 | ||||||
| 2,165,000 | Prologis Euro Finance LLC, 0.250%, 9/10/2027, (EUR)(b) | 2,509,608 | ||||||
| 1,530,000 | Prologis Euro Finance LLC, 0.375%, 2/06/2028, (EUR)(b) | 1,783,760 | ||||||
| 365,000 | Prologis LP, 2.250%, 6/30/2029, (GBP)(b) | 516,716 | ||||||
| 890,000 | Range Resources Corp., 4.875%, 5/15/2025 | 939,662 | ||||||
| 165,000 | Range Resources Corp., 5.000%, 3/15/2023 | 171,188 | ||||||
| 1,100,000 | Realty Income Corp., EMTN, 1.625%, 12/15/2030, (GBP)(b) | 1,455,847 | ||||||
| 295,000 | Rocket Mortgage LLC, 5.250%, 1/15/2028, 144A | 317,863 | ||||||
| 4,370,000 | Rocket Mortgage LLC/Rocket Mortgage Co-Issuer, Inc., 2.875%, 10/15/2026, 144A | 4,270,364 | ||||||
| 6,794,000 | Rocket Mortgage LLC/Rocket Mortgage Co-Issuer, Inc., 3.625%, 3/01/2029, 144A | 6,870,432 | ||||||
| 10,226,000 | Rocket Mortgage LLC/Rocket Mortgage Co-Issuer, Inc., 3.875%, 3/01/2031, 144A | 10,315,477 | ||||||
| 2,915,000 | Rocket Mortgage LLC/Rocket Mortgage Co-Issuer, Inc., 4.000%, 10/15/2033, 144A | 2,893,137 | ||||||
| 790,000 | Royal Caribbean Cruises Ltd., 4.250%, 7/01/2026, 144A | 773,845 | ||||||
| 4,130,000 | Royal Caribbean Cruises Ltd., 5.500%, 4/01/2028, 144A | 4,224,201 | ||||||
| 810,000 | Santander Holdings USA, Inc., 3.450%, 6/02/2025(b) | 867,309 | ||||||
| 1,450,000 | SBA Communications Corp., 3.125%, 2/01/2029, 144A | 1,401,062 | ||||||
| 1,020,000 | Scientific Games International, Inc., 7.000%, 5/15/2028, 144A | 1,100,325 | ||||||
| 525,000 | Scientific Games International, Inc., 7.250%, 11/15/2029, 144A | 589,910 | ||||||
| 435,000 | Sensata Technologies BV, 4.000%, 4/15/2029, 144A | 442,808 | ||||||
| 140,000 | Silgan Holdings, Inc., 3.250%, 3/15/2025, (EUR) | 163,462 | ||||||
| 130,000 | Skyworks Solutions, Inc., 1.800%, 6/01/2026 | 131,723 | ||||||
| 500,000 | Square, Inc., 3.500%, 6/01/2031, 144A | 512,865 | ||||||
| 2,785,000 | Summit Materials LLC/Summit Materials Finance Corp., 5.250%, 1/15/2029, 144A | 2,924,250 | ||||||
| 6,900,000 | T-Mobile USA, Inc., 3.375%, 4/15/2029 | 7,198,425 | ||||||
| 4,305,000 | T-Mobile USA, Inc., 3.500%, 4/15/2031 | 4,540,202 | ||||||
| 2,805,000 | T-Mobile USA, Inc., 3.875%, 4/15/2030 | 3,097,175 | ||||||
| 1,695,000 | Tenet Healthcare Corp., 6.875%, 11/15/2031 | 1,945,012 | ||||||
| 420,000 | Terminix Co. LLC (The), 7.450%, 8/15/2027 | 509,250 | ||||||
| 100,000 | Thermo Fisher Scientific, Inc., EMTN, 1.500%, 10/01/2039, (EUR) | 118,400 | ||||||
| 245,000 | Thermo Fisher Scientific, Inc., EMTN, 1.875%, 10/01/2049, (EUR)(b) | 298,213 | ||||||
| 90,000 | Time Warner Cable LLC, 4.500%, 9/15/2042 | 98,491 | ||||||
| 85,000 | Time Warner Cable LLC, 5.500%, 9/01/2041 | 104,175 | ||||||
| 400,000 | TopBuild Corp., 4.125%, 2/15/2032, 144A | 404,000 | ||||||
| 1,635,000 | Toyota Motor Credit Corp., MTN, 2.650%, 4/12/2022(b) | 1,655,913 | ||||||
| 635,000 | TransDigm, Inc., 5.500%, 11/15/2027 | 652,463 | ||||||
| 50,000 | TransDigm, Inc., 7.500%, 3/15/2027 | 52,375 | ||||||
| 2,615,000 | TransDigm, Inc., 8.000%, 12/15/2025, 144A | 2,788,244 | ||||||
See accompanying notes to financial statements.
| 56
Portfolio of Investments – as of September 30, 2021
Loomis Sayles Global Allocation Fund – (continued)
| Principal Amount (‡) | Description | Value (†) | ||||||
| United States — continued |
| |||||||
| $ | 615,000 | Travel & Leisure Co., 4.625%, 3/01/2030, 144A | $ | 631,913 | ||||
| 75,000 | Travel & Leisure Co., 6.000%, 4/01/2027 | 83,117 | ||||||
| 90,000 | Travel & Leisure Co., 6.625%, 7/31/2026, 144A | 102,489 | ||||||
| 5,000 | TRI Pointe Group, Inc./TRI Pointe Homes, Inc., 5.875%, 6/15/2024 | 5,500 | ||||||
| 775,000 | TriNet Group, Inc., 3.500%, 3/01/2029, 144A | 776,938 | ||||||
| 68,117 | U.S. Airways Pass Through Trust, Series 2012-1A, Class A, 5.900%, 4/01/2026 | 71,663 | ||||||
| 263,253 | U.S. Airways Pass Through Trust, Series 2012-2A, Class A, 4.625%, 12/03/2026 | 263,781 | ||||||
| 4,366,097 | U.S. Treasury Inflation Indexed Note, 0.125%, 4/15/2022(b)(g) | 4,427,040 | ||||||
| 4,407,647 | U.S. Treasury Inflation Indexed Note, 0.375%, 7/15/2027(b)(g) | 4,902,991 | ||||||
| 12,489,112 | U.S. Treasury Inflation Indexed Note, 0.625%, 4/15/2023(b)(g) | 13,068,035 | ||||||
| 36,290,000 | U.S. Treasury Note, 0.125%, 1/31/2023(h) | 36,271,572 | ||||||
| 10,300,000 | U.S. Treasury Note, 0.125%, 3/31/2023 | 10,289,941 | ||||||
| 9,320,000 | U.S. Treasury Note, 0.125%, 4/30/2023(b) | 9,307,622 | ||||||
| 23,105,000 | U.S. Treasury Note, 0.125%, 5/31/2023 | 23,067,996 | ||||||
| 13,295,000 | U.S. Treasury Note, 0.750%, 3/31/2026(b) | 13,201,000 | ||||||
| 35,000,000 | U.S. Treasury Note, 0.875%, 6/30/2026 | 34,876,953 | ||||||
| 5,130,000 | U.S. Treasury Note, 1.500%, 11/30/2021 | 5,142,123 | ||||||
| 8,590,000 | U.S. Treasury Note, 1.625%, 10/31/2026(b) | 8,853,740 | ||||||
| 14,060,000 | U.S. Treasury Note, 1.625%, 8/15/2029(b) | 14,320,330 | ||||||
| 10,235,000 | U.S. Treasury Note, 1.750%, 11/15/2029(b)(h) | 10,518,062 | ||||||
| 4,515,000 | U.S. Treasury Note, 1.875%, 3/31/2022(b) | 4,555,564 | ||||||
| 4,700,000 | U.S. Treasury Note, 2.875%, 5/15/2028(b) | 5,183,770 | ||||||
| 13,090,000 | Uber Technologies, Inc., 4.500%, 8/15/2029, 144A | 13,179,994 | ||||||
| 10,745,000 | Uber Technologies, Inc., 6.250%, 1/15/2028, 144A | 11,523,905 | ||||||
| 1,080,000 | Uber Technologies, Inc., 7.500%, 9/15/2027, 144A | 1,179,225 | ||||||
| 357,118 | United Airlines Pass Through Trust, Series 2016-2, Class B, 3.650%, 4/07/2027 | 355,643 | ||||||
| 2,337,237 | United Airlines Pass Through Trust, Series 2020-1, Class A, 5.875%, 4/15/2029(b) | 2,606,440 | ||||||
| 195,000 | United Airlines, Inc., 4.375%, 4/15/2026, 144A | 200,119 | ||||||
| 290,000 | United Airlines, Inc., 4.625%, 4/15/2029, 144A | 299,701 | ||||||
| 390,000 | Verizon Communications, Inc., 2.850%, 9/03/2041 | 380,628 | ||||||
| 3,095,000 | Verizon Communications, Inc., Series MPLE, 2.500%, 5/16/2030, (CAD) | 2,425,858 | ||||||
| 60,000 | Weyerhaeuser Co., 6.950%, 10/01/2027 | 76,687 | ||||||
| 315,000 | Weyerhaeuser Co., 7.375%, 3/15/2032 | 448,566 | ||||||
| 1,595,000 | Yum! Brands, Inc., 4.625%, 1/31/2032 | 1,702,662 | ||||||
|
| |||||||
| 535,610,174 | ||||||||
|
| |||||||
| Uruguay — 0.1% |
| |||||||
| 1,415,000 | Uruguay Government International Bond, 4.375%, 1/23/2031(b) | 1,636,066 | ||||||
| 86,955,000 | Uruguay Government International Bond, 8.250%, 5/21/2031, (UYU) | 2,057,367 | ||||||
|
| |||||||
| 3,693,433 | ||||||||
|
| |||||||
| Total Non-Convertible Bonds (Identified Cost $1,351,965,492) | 1,379,237,164 | |||||||
|
| |||||||
| Convertible Bonds — 2.0% | ||||||||
| United States — 2.0% |
| |||||||
| 3,485,000 | BioMarin Pharmaceutical, Inc., 0.599%, 8/01/2024 | 3,565,804 | ||||||
| 18,255,000 | BioMarin Pharmaceutical, Inc., 1.250%, 5/15/2027 | 18,270,031 | ||||||
| United States — continued |
| |||||||
| 5,315,000 | DISH Network Corp., Zero Coupon, 0.000%, 12/15/2025, 144A(c) | 6,351,425 | ||||||
| 545,000 | DISH Network Corp., 2.375%, 3/15/2024 | 531,034 | ||||||
| 21,905,000 | DISH Network Corp., 3.375%, 8/15/2026 | 22,770,248 | ||||||
| 4,220,000 | Expedia Group, Inc., Zero Coupon, 0.000%, 2/15/2026, 144A(c) | 4,556,127 | ||||||
| 805,000 | Ionis Pharmaceuticals, Inc., Zero Coupon, 0.000%-0.979%, 4/01/2026, 144A(i) | 731,534 | ||||||
| 305,000 | JetBlue Airways Corp., 0.500%, 4/01/2026, 144A | 298,852 | ||||||
| 1,345,000 | Livongo Health, Inc., 0.875%, 6/01/2025 | 1,776,866 | ||||||
| 6,525,000 | Palo Alto Networks, Inc., 0.375%, 6/01/2025 | 10,773,255 | ||||||
| 810,000 | Peloton Interactive, Inc., Zero Coupon, 0.519%-1.734%, 2/15/2026, 144A(i) | 713,031 | ||||||
| 155,000 | Penn National Gaming, Inc., 2.750%, 5/15/2026 | 494,605 | ||||||
| 6,745,000 | Southwest Airlines Co., 1.250%, 5/01/2025(b) | 10,075,344 | ||||||
| 820,000 | Splunk, Inc., 1.125%, 6/15/2027 | 804,113 | ||||||
| 9,500,000 | Teladoc Health, Inc., 1.250%, 6/01/2027 | 9,542,147 | ||||||
| 1,100,000 | Twitter, Inc., Zero Coupon, 0.000%-1.483%, 3/15/2026, 144A(i) | 1,021,174 | ||||||
| 3,275,000 | Uber Technologies, Inc., Zero Coupon, 0.000%, 12/15/2025, 144A(c) | 3,185,365 | ||||||
| 170,000 | Zynga, Inc., Zero Coupon, 0.779%-0.859%, 12/15/2026, 144A(i) | 164,156 | ||||||
|
| |||||||
| Total Convertible Bonds (Identified Cost $93,156,750) | 95,625,111 | |||||||
|
| |||||||
| Municipals — 0.0% | ||||||||
| United States — 0.0% |
| |||||||
| 125,000 | Tobacco Settlement Financing Corp., Series A-1, 6.706%, 6/01/2046 (Identified Cost $124,989) | 130,525 | ||||||
|
| |||||||
| Total Bonds and Notes (Identified Cost $1,445,247,231) | 1,474,992,800 | |||||||
|
| |||||||
| Senior Loans — 0.1% | ||||||||
| United States — 0.1% |
| |||||||
| 521,874 | Hilton Grand Vacations Borrower LLC, 2021 Term Loan B, 1-month LIBOR + 3.000%, 3.500%, 8/02/2028(j) | 523,048 | ||||||
| 441,893 | Jazz Financing Lux S.a.r.l., USD Term Loan, 1-month LIBOR + 3.500%, 4.000%, 5/05/2028(j) | 442,392 | ||||||
| 469,394 | Medline Industries, Inc., USD Term Loan B, 9/20/2028(k) | 468,366 | ||||||
| 496,133 | United Airlines, Inc., 2021 Term Loan B, 3-month LIBOR + 3.750%, 4.500%, 4/21/2028(j) | 499,179 | ||||||
|
| |||||||
| Total Senior Loans (Identified Cost $1,919,951) | 1,932,985 | |||||||
|
| |||||||
| Shares | ||||||||
| Preferred Stocks — 0.0% | ||||||||
| Convertible Preferred Stocks — 0.0% | ||||||||
| United States — 0.0% |
| |||||||
| 38,952 | El Paso Energy Capital Trust I, 4.750% (Identified Cost $1,828,520) | 1,930,072 | ||||||
|
| |||||||
See accompanying notes to financial statements.
57 |
Portfolio of Investments – as of September 30, 2021
Loomis Sayles Global Allocation Fund – (continued)
| Principal Amount (‡) | Description | Value (†) | ||||||
| Short-Term Investments — 0.9% | ||||||||
| $ | 45,159,597 | Tri-Party Repurchase Agreement with Fixed Income Clearing Corporation, dated 9/30/2021 at 0.000% to be repurchased at $45,159,597 on 10/01/2021 collateralized by $46,301,600 U.S. Treasury Note, 1.250% due 9/30/2028 valued at $46,062,869 including accrued interest (Note 2 of Notes to Financial Statements) (Identified Cost $45,159,597) | $ | 45,159,597 | ||||
|
| |||||||
| Total Investments — 99.6% (Identified Cost $3,778,502,923) | 4,855,887,463 | |||||||
| Other assets less liabilities — 0.4% | 21,556,871 | |||||||
|
| |||||||
| Net Assets — 100.0% | $ | 4,877,444,334 | ||||||
|
| |||||||
| (‡) | Principal Amount stated in U.S. dollars unless otherwise noted. |
| ||||||
| (†) | See Note 2 of Notes to Financial Statements. |
| ||||||
| (††) | Amount shown represents units. One unit represents a principal amount of 1,000. |
| ||||||
| (†††) | Amount shown represents principal amount including inflation adjustments. |
| ||||||
| (††††) | Amount shown represents units. One unit represents a principal amount of 100. |
| ||||||
| (a) | Non-income producing security. |
| ||||||
| (b) | Security (or a portion thereof) has been designated to cover the Fund’s obligations under open derivative contracts. |
| ||||||
| (c) | Interest rate represents annualized yield at time of purchase; not a coupon rate. |
| ||||||
| (d) | Illiquid security. (Unaudited) |
| ||||||
| (e) | Securities classified as fair valued pursuant to the Fund’s pricing policies and procedures. At September 30, 2021, the value of these securities amounted to $8,767,057 or 0.2% of net assets. See Note 2 of Notes to Financial Statements. |
| ||||||
| (f) | Perpetual bond with no specified maturity date. |
| ||||||
| (g) | Treasury Inflation Protected Security (TIPS). |
| ||||||
| (h) | Security (or a portion thereof) has been pledged as collateral for open derivative contracts. |
| ||||||
| (i) | Interest rate represents annualized yield at time of purchase; not a coupon rate. The Fund’s investment in this security is comprised of various lots with differing annualized yields. |
| ||||||
| (j) | Variable rate security. Rate as of September 30, 2021 is disclosed. |
| ||||||
| (k) | Position is unsettled. Contract rate was not determined at September 30, 2021 and does not take effect until settlement date. Maturity date is not finalized until settlement date. |
| ||||||
| 144A | All or a portion of these securities are exempt from registration under Rule 144A of the Securities Act of 1933. These securities may be resold in transactions exempt from registration, normally to qualified institutional buyers. At September 30, 2021, the value of Rule 144A holdings amounted to $353,199,824 or 7.2% of net assets. | |||||||
| ADR | An American Depositary Receipt is a certificate issued by a custodian bank representing the right to receive securities of the foreign issuer described. The values of ADRs may be significantly influenced by trading on exchanges not located in the United States. | |||||||
| CPI | Consumer Price Index | |||||||
| EMTN | Euro Medium Term Note | |||||||
| GMTN | Global Medium Term Note | |||||||
| LIBOR | London Interbank Offered Rate | |||||||
| MTN | Medium Term Note | |||||||
| AUD | Australian Dollar | |||||||
| BRL | Brazilian Real | |||||||
| CAD | Canadian Dollar | |||||||
| CNH | Chinese Yuan Renminbi Offshore | |||||||
| CNY | Chinese Yuan Renminbi | |||||||
| COP | Colombian Peso | |||||||
| EUR | Euro | |||||||
| GBP | British Pound | |||||||
| IDR | Indonesian Rupiah | |||||||
| ILS | Israeli Shekel | |||||||
| INR | Indian Rupee | |||||||
| JPY | Japanese Yen | |||||||
| KRW | South Korean Won | |||||||
| MXN | Mexican Peso | |||||||
| MYR | Malaysian Ringgit | |||||||
| NOK | Norwegian Krone | |||||||
| NZD | New Zealand Dollar | |||||||
| PLN | Polish Zloty | |||||||
| RON | Romanian Leu | |||||||
| SEK | Swedish Krona | |||||||
| SGD | Singapore Dollar | |||||||
| UYU | Uruguayan Peso | |||||||
| ZAR | South African Rand | |||||||
See accompanying notes to financial statements.
| 58
Portfolio of Investments – as of September 30, 2021
Loomis Sayles Global Allocation Fund – (continued)
At September 30, 2021, the Fund had the following open forward foreign currency contracts:
| Counterparty | Delivery Date | Currency Bought/ Sold (B/S) | Units of Currency | In Exchange for | Notional Value | Unrealized Appreciation (Depreciation) | ||||||||||||||||||||
| Bank of America, N.A. | 12/15/2021 | KRW | B | 5,850,000,000 | $ | 5,020,597 | $ | 4,935,617 | $ | (84,980 | ) | |||||||||||||||
| Bank of America, N.A. | 12/15/2021 | MXN | S | 256,059,000 | 12,673,239 | 12,277,219 | 396,020 | |||||||||||||||||||
| Bank of America, N.A. | 12/02/2021 | BRL | S | 27,000,000 | 5,060,255 | 4,910,704 | 149,551 | |||||||||||||||||||
| Citibank, N.A. | 12/15/2021 | ZAR | S | 71,581,000 | 4,913,746 | 4,706,949 | 206,797 | |||||||||||||||||||
| Credit Suisse International | 12/15/2021 | CAD | S | 254,417,000 | 200,926,697 | 200,863,281 | 63,416 | |||||||||||||||||||
| Credit Suisse International | 12/15/2021 | COP | S | 38,844,665,000 | 10,113,165 | 10,152,288 | (39,123 | ) | ||||||||||||||||||
| Credit Suisse International | 12/15/2021 | GBP | B | 12,371,000 | 17,114,957 | 16,670,387 | (444,570 | ) | ||||||||||||||||||
| Credit Suisse International | 12/15/2021 | JPY | B | 11,200,164,000 | 101,668,095 | 100,696,676 | (971,419 | ) | ||||||||||||||||||
| HSBC Bank USA | 12/15/2021 | AUD | B | 18,075,000 | 13,467,231 | 13,071,622 | (395,609 | ) | ||||||||||||||||||
| Morgan Stanley Capital Services, Inc. | 12/15/2021 | EUR | B | 144,681,000 | 171,509,820 | 167,839,265 | (3,670,555 | ) | ||||||||||||||||||
| Morgan Stanley Capital Services, Inc. | 12/15/2021 | NZD | S | 6,003,000 | 4,274,376 | 4,141,899 | 132,477 | |||||||||||||||||||
| UBS AG | 12/15/2021 | IDR | S | 105,333,420,000 | 7,321,634 | 7,307,646 | 13,988 | |||||||||||||||||||
| UBS AG | 12/15/2021 | SEK | B | 7,350,000 | 856,151 | 840,125 | (16,026 | ) | ||||||||||||||||||
|
| |||||||||||||||||||||||||
| Total | $ | (4,660,033 | ) | |||||||||||||||||||||||
|
| |||||||||||||||||||||||||
At September 30, 2021, the Fund had the following open forward cross currency contracts:
| Counterparty | Settlement Date | Deliver/Units of Currency | Receive/Units of Currency | Notional Value | Unrealized Appreciation (Depreciation) | |||||||||||||||||||||
| Morgan Stanley Capital Services, Inc. | 12/15/2021 | NOK | 30,959,000 | EUR | 2,996,891 | $ | 3,476,586 | $ | (62,832 | ) | ||||||||||||||||
|
| |||||||||||||||||||||||||
At September 30, 2021, open short futures contracts were as follows:
| Financial Futures | Expiration Date | Contracts | Notional Amount | Value | Unrealized Appreciation (Depreciation) | |||||||||||||
| Ultra 10 Year U.S. Treasury Note | 12/21/2021 | 185 | $ | 27,299,811 | $ | 26,871,250 | $ | 428,561 | ||||||||||
| Ultra Long U.S. Treasury Bond | 12/21/2021 | 40 | 7,882,086 | 7,642,500 | 239,586 | |||||||||||||
|
| |||||||||||||||||
| Total | $ | 668,147 | ||||||||||||||||
|
| |||||||||||||||||
Industry Summary at September 30, 2021
Treasuries | 12.9 | % | ||
Semiconductors & Semiconductor Equipment | 8.9 | |||
IT Services | 6.5 | |||
Interactive Media & Services | 5.3 | |||
Software | 5.2 | |||
Internet & Direct Marketing Retail | 4.1 | |||
Life Sciences Tools & Services | 4.0 | |||
Hotels, Restaurants & Leisure | 4.0 | |||
Chemicals | 3.9 | |||
Machinery | 3.3 | |||
Capital Markets | 3.2 | |||
Health Care Equipment & Supplies | 3.1 | |||
Banking | 2.2 | |||
Health Care Providers & Services | 2.2 | |||
Food & Staples Retailing | 2.0 | |||
Other Investments, less than 2% each | 27.9 | |||
Short-Term Investments | 0.9 | |||
|
| |||
Total Investments | 99.6 | |||
Other assets less liabilities (including forward foreign currency and futures contracts) | 0.4 | |||
|
| |||
Net Assets | 100.0 | % | ||
|
|
Currency Exposure Summary at September 30, 2021
United States Dollar | 75.2 | % | ||
Canadian Dollar | 6.4 | |||
Euro | 5.7 | |||
New Taiwan Dollar | 2.2 | |||
Other, less than 2% each | 10.1 | |||
|
| |||
Total Investments | 99.6 | |||
Other assets less liabilities (including forward foreign currency and futures contracts) | 0.4 | |||
|
| |||
Net Assets | 100.0 | % | ||
|
|
See accompanying notes to financial statements.
59 |
Portfolio of Investments – as of September 30, 2021
Loomis Sayles Growth Fund
| Shares | Description | Value (†) | ||||||
| Common Stocks — 99.0% of Net Assets | ||||||||
| Aerospace & Defense — 4.1% |
| |||||||
| 2,563,845 | Boeing Co. (The)(a) | $ | 563,892,069 | |||||
|
| |||||||
| Air Freight & Logistics — 2.1% |
| |||||||
| 2,461,694 | Expeditors International of Washington, Inc. | 293,261,606 | ||||||
|
| |||||||
| Beverages — 3.0% |
| |||||||
| 4,701,484 | Monster Beverage Corp.(a) | 417,632,824 | ||||||
|
| |||||||
| Biotechnology — 5.0% |
| |||||||
| 642,511 | Regeneron Pharmaceuticals, Inc.(a) | 388,834,807 | ||||||
| 1,682,068 | Vertex Pharmaceuticals, Inc.(a) | 305,110,314 | ||||||
|
| |||||||
| 693,945,121 | ||||||||
|
| |||||||
| Capital Markets — 2.9% |
| |||||||
| 546,105 | FactSet Research Systems, Inc. | 215,591,332 | ||||||
| 3,103,806 | SEI Investments Co. | 184,055,696 | ||||||
|
| |||||||
| 399,647,028 | ||||||||
|
| |||||||
| Communications Equipment — 1.8% |
| |||||||
| 4,532,387 | Cisco Systems, Inc. | 246,697,824 | ||||||
|
| |||||||
| Energy Equipment & Services — 1.5% |
| |||||||
| 6,727,536 | Schlumberger NV | 199,404,167 | ||||||
|
| |||||||
| Entertainment — 3.1% |
| |||||||
| 2,539,005 | Walt Disney Co. (The)(a) | 429,523,476 | ||||||
|
| |||||||
| Health Care Equipment & Supplies — 1.4% |
| |||||||
| 199,487 | Intuitive Surgical, Inc.(a) | 198,320,001 | ||||||
|
| |||||||
| Health Care Technology — 0.9% |
| |||||||
| 1,736,498 | Cerner Corp. | 122,457,839 | ||||||
|
| |||||||
| Hotels, Restaurants & Leisure — 4.6% |
| |||||||
| 3,068,017 | Starbucks Corp. | 338,432,955 | ||||||
| 2,064,960 | Yum China Holdings, Inc. | 119,994,826 | ||||||
| 1,452,062 | Yum! Brands, Inc. | 177,601,703 | ||||||
|
| |||||||
| 636,029,484 | ||||||||
|
| |||||||
| Household Products — 1.2% |
| |||||||
| 2,148,239 | Colgate-Palmolive Co. | 162,363,904 | ||||||
|
| |||||||
| Interactive Media & Services — 13.5% |
| |||||||
| 185,959 | Alphabet, Inc., Class A(a) | 497,165,106 | ||||||
| 185,703 | Alphabet, Inc., Class C(a) | 494,956,063 | ||||||
| 2,535,412 | Facebook, Inc., Class A(a) | 860,493,478 | ||||||
|
| |||||||
| 1,852,614,647 | ||||||||
|
| |||||||
| Internet & Direct Marketing Retail — 9.4% |
| |||||||
| 2,727,205 | Alibaba Group Holding Ltd., Sponsored ADR(a) | 403,762,700 | ||||||
| 269,186 | Amazon.com, Inc.(a) | 884,286,778 | ||||||
|
| |||||||
| 1,288,049,478 | ||||||||
|
| |||||||
| IT Services — 5.9% |
| |||||||
| 510,413 | Automatic Data Processing, Inc. | 102,041,767 | ||||||
| 3,204,895 | Visa, Inc., Class A | 713,890,361 | ||||||
|
| |||||||
| 815,932,128 | ||||||||
|
| |||||||
| Life Sciences Tools & Services — 2.2% |
| |||||||
| 749,729 | Illumina, Inc.(a) | 304,097,580 | ||||||
|
| |||||||
| Machinery — 2.6% |
| |||||||
| 1,080,265 | Deere & Co. | 361,964,394 | ||||||
|
| |||||||
| Pharmaceuticals — 6.2% |
| |||||||
| 4,501,930 | Novartis AG, Sponsored ADR | 368,167,835 | ||||||
| 1,507,774 | Novo Nordisk A/S, Sponsored ADR | 144,761,382 | ||||||
| 7,478,844 | Roche Holding AG, Sponsored ADR | 340,063,037 | ||||||
|
| |||||||
| 852,992,254 | ||||||||
|
| |||||||
| Semiconductors & Semiconductor Equipment — 8.5% |
| |||||||
| 4,384,032 | NVIDIA Corp. | 908,196,069 | ||||||
| 1,982,057 | QUALCOMM, Inc. | 255,645,712 | ||||||
|
| |||||||
| 1,163,841,781 | ||||||||
|
| |||||||
| Software — 19.1% |
| |||||||
| 2,088,760 | Autodesk, Inc.(a) | 595,651,689 | ||||||
| 2,279,290 | Microsoft Corp. | 642,577,437 | ||||||
| 7,165,695 | Oracle Corp. | 624,347,005 | ||||||
| 2,117,114 | salesforce.com, Inc.(a) | 574,203,659 | ||||||
| 756,354 | Workday, Inc., Class A(a) | 189,005,301 | ||||||
|
| |||||||
| 2,625,785,091 | ||||||||
|
| |||||||
| Total Common Stocks (Identified Cost $7,044,124,379) | 13,628,452,696 | |||||||
|
| |||||||
| Principal Amount | ||||||||
| Short-Term Investments — 0.9% | ||||||||
| $ | 130,851,234 | Tri-Party Repurchase Agreement with Fixed Income Clearing Corporation, dated 9/30/2021 at 0.000% to be repurchased at $130,851,234 on 10/01/2021 collateralized by $112,570,100 U.S. Treasury Inflation Indexed Note, 0.250% due 7/15/2029 valued at $133,468,279 including accrued interest (Note 2 of Notes to Financial Statements) (Identified Cost $130,851,234) | 130,851,234 | |||||
|
| |||||||
| Total Investments — 99.9% (Identified Cost $7,174,975,613) | 13,759,303,930 | |||||||
| Other assets less liabilities — 0.1% | 9,330,227 | |||||||
|
| |||||||
| Net Assets — 100.0% | $ | 13,768,634,157 | ||||||
|
| |||||||
| (†) | See Note 2 of Notes to Financial Statements. |
| ||||||
| (a) | Non-income producing security. |
| ||||||
| ADR | An American Depositary Receipt is a certificate issued by a custodian bank representing the right to receive securities of the foreign issuer described. The values of ADRs may be significantly influenced by trading on exchanges not located in the United States. |
| ||||||
Industry Summary at September 30, 2021
Software | 19.1 | % | ||
Interactive Media & Services | 13.5 | |||
Internet & Direct Marketing Retail | 9.4 | |||
Semiconductors & Semiconductor Equipment | 8.5 | |||
Pharmaceuticals | 6.2 | |||
IT Services | 5.9 | |||
Biotechnology | 5.0 | |||
Hotels, Restaurants & Leisure | 4.6 | |||
Aerospace & Defense | 4.1 | |||
Entertainment | 3.1 | |||
Beverages | 3.0 | |||
Capital Markets | 2.9 | |||
Machinery | 2.6 | |||
Life Sciences Tools & Services | 2.2 | |||
Air Freight & Logistics | 2.1 | |||
Other Investments, less than 2% each | 6.8 | |||
Short-Term Investments | 0.9 | |||
|
| |||
Total Investments | 99.9 | |||
Other assets less liabilities | 0.1 | |||
|
| |||
Net Assets | 100.0 | % | ||
|
|
See accompanying notes to financial statements.
| 60
Portfolio of Investments – as of September 30, 2021
Loomis Sayles Intermediate Duration Bond Fund
| Principal Amount | Description | Value (†) | ||||||
| Bonds and Notes — 95.6% of Net Assets | ||||||||
| ABS Car Loan — 7.6% |
| |||||||
| $ | 754,600 | American Credit Acceptance Receivables Trust, Series 2019-4, Class C, 2.690%, 12/12/2025, 144A | $ | 760,840 | ||||
| 90,000 | American Credit Acceptance Receivables Trust, Series 2020-2, Class B, 2.480%, 9/13/2024, 144A | 90,646 | ||||||
| 135,000 | American Credit Acceptance Receivables Trust, Series 2020-3, Class B, 1.150%, 8/13/2024, 144A | 135,385 | ||||||
| 240,000 | American Credit Acceptance Receivables Trust, Series 2020-4, Class C, 1.310%, 12/14/2026, 144A | 241,827 | ||||||
| 385,000 | American Credit Acceptance Receivables Trust, Series 2021-3, Class B, 0.660%, 2/13/2026, 144A | 385,399 | ||||||
| 510,000 | AmeriCredit Automobile Receivables Trust, Series 2018-3, Class B, 3.580%, 10/18/2024 | 514,704 | ||||||
| 480,000 | AmeriCredit Automobile Receivables Trust, Series 2019-2, Class B, 2.540%, 7/18/2024 | 486,965 | ||||||
| 423,830 | AmeriCredit Automobile Receivables Trust, Series 2019-3, Class A3, 2.060%, 4/18/2024 | 426,080 | ||||||
| 333,554 | AmeriCredit Automobile Receivables Trust, Series 2020-1, Class A3, 1.110%, 8/19/2024 | 334,757 | ||||||
| 110,000 | AmeriCredit Automobile Receivables Trust, Series 2020-2, Class A3, 0.660%, 12/18/2024 | 110,390 | ||||||
| 265,000 | AmeriCredit Automobile Receivables Trust, Series 2020-2, Class B, 0.970%, 2/18/2026 | 267,102 | ||||||
| 125,000 | AmeriCredit Automobile Receivables Trust, Series 2020-3, Class C, 1.060%, 8/18/2026 | 125,832 | ||||||
| 215,000 | AmeriCredit Automobile Receivables Trust, Series 2021-2, Class B, 0.690%, 1/19/2027 | 214,575 | ||||||
| 100,000 | Avis Budget Rental Car Funding AESOP LLC, Series 2019-1A, Class A, 3.450%, 3/20/2023, 144A | 100,791 | ||||||
| 140,000 | Avis Budget Rental Car Funding AESOP LLC, Series 2019-2A, Class A, 3.350%, 9/22/2025, 144A | 149,227 | ||||||
| 266,086 | Bank of The West Auto Trust, Series 2019-1, Class A3, 2.430%, 4/15/2024, 144A | 268,446 | ||||||
| 397,682 | Capital One Prime Auto Receivables Trust, Series 2019-2, Class A3, 1.920%, 5/15/2024 | 401,589 | ||||||
| 488,317 | CarMax Auto Owner Trust, Series 2020-2, Class A3, 1.700%, 11/15/2024 | 492,788 | ||||||
| 485,000 | CarMax Auto Owner Trust, Series 2020-3, Class A3, 0.620%, 3/17/2025 | 486,699 | ||||||
| 220,000 | Carvana Auto Receivables Trust, Series 2021-N2, Class B, 0.750%, 3/10/2028 | 219,439 | ||||||
| 90,730 | CPS Auto Receivables Trust, Series 2020-A, Class B, 2.360%, 2/15/2024, 144A | 91,009 | ||||||
| 595,000 | Credit Acceptance Auto Loan Trust, Series 2019-3A, Class A, 2.380%, 11/15/2028, 144A | 603,431 | ||||||
| 435,000 | Credit Acceptance Auto Loan Trust, Series 2020-1A, Class A, 2.010%, 2/15/2029, 144A | 441,098 | ||||||
| 585,000 | Credit Acceptance Auto Loan Trust, Series 2020-1A, Class B, 2.390%, 4/16/2029, 144A | 600,170 | ||||||
| 315,000 | Credit Acceptance Auto Loan Trust, Series 2020-2A, Class A, 1.370%, 7/16/2029, 144A | 318,116 | ||||||
| 265,000 | Credit Acceptance Auto Loan Trust, Series 2021-3A, Class A, 1.000%, 5/15/2030, 144A | 265,146 | ||||||
| 17,852 | Drive Auto Receivables Trust, Series 2019-3, Class B, 2.650%, 2/15/2024 | 17,870 | ||||||
| 405,000 | Drive Auto Receivables Trust, Series 2021-1, Class B, 0.650%, 7/15/2025 | 406,111 | ||||||
| 585,000 | Drive Auto Receivables Trust, Series 2021-2, Class B, 0.580%, 12/15/2025 | 585,131 | ||||||
| 113,355 | DT Auto Owner Trust, Series 2019-1A, Class C, 3.610%, 11/15/2024, 144A | 113,946 | ||||||
| 227,705 | DT Auto Owner Trust, Series 2019-2A, Class C, 3.180%, 2/18/2025, 144A | 229,848 | ||||||
| ABS Car Loan — continued | ||||||||
| 54,981 | DT Auto Owner Trust, Series 2019-4A, Class B, 2.360%, 1/16/2024, 144A | 55,120 | ||||||
| 46,171 | DT Auto Owner Trust, Series 2020-2A, Class A, 1.140%, 1/16/2024, 144A | 46,281 | ||||||
| 320,000 | DT Auto Owner Trust, Series 2020-2A, Class C, 3.280%, 3/16/2026, 144A | 332,032 | ||||||
| 30,000 | DT Auto Owner Trust, Series 2021-1A, Class B, 0.620%, 9/15/2025, 144A | 30,046 | ||||||
| 300,000 | DT Auto Owner Trust, Series 2021-2A, Class B, 0.810%, 1/15/2027, 144A | 300,766 | ||||||
| 87,755 | Exeter Automobile Receivables Trust, Series 2020-1A, Class B, 2.260%, 4/15/2024, 144A | 88,006 | ||||||
| 440,000 | Exeter Automobile Receivables Trust, Series 2020-2A, Class C, 3.280%, 5/15/2025, 144A | 451,450 | ||||||
| 275,000 | Exeter Automobile Receivables Trust, Series 2021-1A, Class B, 0.500%, 2/18/2025 | 275,187 | ||||||
| 330,000 | Exeter Automobile Receivables Trust, Series 2021-2A, Class B, 0.570%, 9/15/2025 | 330,432 | ||||||
| 70,339 | First Investors Auto Owner Trust, Series 2019-2A, Class A, 2.210%, 9/16/2024, 144A | 70,655 | ||||||
| 392,379 | Flagship Credit Auto Trust, Series 2018-4, Class B, 3.880%, 10/16/2023, 144A | 393,954 | ||||||
| 235,037 | Flagship Credit Auto Trust, Series 2020-1, Class A, 1.900%, 8/15/2024, 144A(a) | 236,734 | ||||||
| 915,000 | Flagship Credit Auto Trust, Series 2020-1, Class B, 2.050%, 2/17/2025, 144A | 926,114 | ||||||
| 290,000 | Flagship Credit Auto Trust, Series 2021-2, Class B, 0.930%, 6/15/2027, 144A | 290,557 | ||||||
| 595,000 | Ford Credit Auto Owner Trust, Series 2018-1, Class A, 3.190%, 7/15/2031, 144A(a) | 637,087 | ||||||
| 167,511 | Ford Credit Auto Owner Trust, Series 2020-A, Class A3, 1.040%, 8/15/2024 | 168,423 | ||||||
| 785,000 | Ford Credit Auto Owner Trust, Series 2020-B, Class A3, 0.560%, 10/15/2024(a) | 787,211 | ||||||
| 570,000 | Ford Credit Auto Owner Trust, Series 2021-1, Class A, 1.370%, 10/17/2033, 144A | 572,407 | ||||||
| 635,000 | Ford Credit Floorplan Master Owner Trust, Series 2019-1, Class A, 2.840%, 3/15/2024 | 642,440 | ||||||
| 260,000 | GLS Auto Receivables Issuer Trust, Series 2019-4A, Class B, 2.780%, 9/16/2024, 144A | 263,837 | ||||||
| 77,251 | GLS Auto Receivables Issuer Trust, Series 2020-2A, Class A, 1.580%, 8/15/2024, 144A | 77,571 | ||||||
| 300,000 | GLS Auto Receivables Issuer Trust, Series 2020-3A, Class B, 1.380%, 8/15/2024, 144A | 301,683 | ||||||
| 265,000 | GLS Auto Receivables Issuer Trust, Series 2020-4A, Class C, 1.140%, 11/17/2025, 144A | 266,284 | ||||||
| 42,419 | GLS Auto Receivables Trust, Series 2018-3A, Class B, 3.780%, 8/15/2023, 144A | 42,560 | ||||||
| 340,000 | GLS Auto Receivables Trust, Series 2021-2A, Class B, 0.770%, 9/15/2025, 144A | 340,102 | ||||||
| 140,000 | GM Financial Automobile Leasing Trust, Series 2020-2, Class A3, 0.800%, 7/20/2023 | 140,578 | ||||||
| 251,157 | GM Financial Consumer Automobile Receivables Trust, Series 2019-3, Class A3, 2.180%, 4/16/2024 | 253,528 | ||||||
| 145,000 | GM Financial Consumer Automobile Receivables Trust, Series 2020-2, Class A3, 1.490%, 12/16/2024 | 146,308 | ||||||
| 180,000 | GMF Floorplan Owner Revolving Trust, Series 2020-1, Class A, 0.680%, 8/15/2025, 144A | 180,688 | ||||||
| 74,395 | Honda Auto Receivables Owner Trust, Series 2020-2, Class A2, 0.740%, 11/15/2022 | 74,444 | ||||||
| 455,000 | Honda Auto Receivables Owner Trust, Series 2020-2, Class A3, 0.820%, 7/15/2024 | 457,350 | ||||||
| 298,925 | Hyundai Auto Receivables Trust, Series 2019-B, Class A3, 1.940%, 2/15/2024 | 301,420 | ||||||
See accompanying notes to financial statements.
61 |
Portfolio of Investments – as of September 30, 2021
Loomis Sayles Intermediate Duration Bond Fund – (continued)
| Principal Amount | Description | Value (†) | ||||||
| ABS Car Loan — continued | ||||||||
| $ | 170,000 | Hyundai Auto Receivables Trust, Series 2020-A, Class A3, 1.410%, 11/15/2024 | $ | 171,910 | ||||
| 290,000 | Mercedes-Benz Auto Receivables Trust, Series 2020-1, Class A3, 0.550%, 2/18/2025 | 290,797 | ||||||
| 310,000 | NextGear Floorplan Master Owner Trust, Series 2018-2A, Class A2, 3.690%, 10/15/2023, 144A | 310,384 | ||||||
| 865,000 | NextGear Floorplan Master Owner Trust, Series 2020-1A, Class A2, 1.550%, 2/15/2025, 144A(a) | 878,379 | ||||||
| 17,262 | Prestige Auto Receivables Trust, Series 2019-1A, Class A3, 2.450%, 5/15/2023, 144A(a) | 17,277 | ||||||
| 695,000 | Prestige Auto Receivables Trust, Series 2020-1A, Class C, 1.310%, 11/16/2026, 144A | 699,506 | ||||||
| 210,000 | Santander Consumer Auto Receivables Trust, Series 2020-AA, Class C, 3.710%, 2/17/2026, 144A | 219,339 | ||||||
| 300,000 | Santander Consumer Auto Receivables Trust, Series 2020-BA, Class A3, 0.460%, 8/15/2024, 144A | 300,342 | ||||||
| 306,709 | Santander Drive Auto Receivables Trust, Series 2019-2, Class C, 2.900%, 10/15/2024 | 308,860 | ||||||
| 68,140 | Santander Drive Auto Receivables Trust, Series 2020-1, Class A3, 2.030%, 2/15/2024 | 68,275 | ||||||
| 90,717 | Santander Drive Auto Receivables Trust, Series 2020-2, Class A3, 0.670%, 4/15/2024 | 90,759 | ||||||
| 520,000 | Santander Drive Auto Receivables Trust, Series 2020-2, Class B, 0.960%, 11/15/2024 | 522,054 | ||||||
| 615,000 | Santander Drive Auto Receivables Trust, Series 2020-3, Class C, 1.120%, 1/15/2026 | 618,876 | ||||||
| 170,000 | Santander Drive Auto Receivables Trust, Series 2020-4, Class C, 1.010%, 1/15/2026 | 171,099 | ||||||
| 460,000 | Santander Drive Auto Receivables Trust, Series 2021-2, Class C, 0.900%, 6/15/2026 | 461,614 | ||||||
| 745,000 | Santander Drive Auto Receivables Trust, Series 2021-3, Class C, 0.950%, 9/15/2027 | 746,348 | ||||||
| 440,000 | Toyota Auto Loan Extended Note Trust, Series 2020-1A, Class A, 1.350%, 5/25/2033, 144A | 446,090 | ||||||
| 200,000 | Toyota Auto Receivables Owner Trust, Series 2020-B, Class A3, 1.360%, 8/15/2024 | 201,809 | ||||||
| 190,270 | Westlake Automobile Receivables Trust, Series 2019-2A, Class B, 2.620%, 7/15/2024, 144A(a) | 190,488 | ||||||
| 202,440 | Westlake Automobile Receivables Trust, Series 2019-3A, Class B, 2.410%, 10/15/2024, 144A | 203,098 | ||||||
| 311,812 | Westlake Automobile Receivables Trust, Series 2020-2A, Class A2A, 0.930%, 2/15/2024, 144A(a) | 312,432 | ||||||
| 400,000 | Westlake Automobile Receivables Trust, Series 2020-2A, Class C, 2.010%, 7/15/2025, 144A | 407,330 | ||||||
| 590,000 | Westlake Automobile Receivables Trust, Series 2021-1A, Class B, 0.640%, 3/16/2026, 144A | 591,079 | ||||||
| 270,000 | Westlake Automobile Receivables Trust, Series 2021-2A, Class B, 0.620%, 7/15/2026, 144A | 269,951 | ||||||
| 4,855 | World Omni Auto Receivables Trust, Series 2017-B, Class A3, 1.950%, 2/15/2023 | 4,862 | ||||||
| 635,000 | World Omni Auto Receivables Trust, Series 2020-B, Class A3, 0.630%, 5/15/2025 | 637,378 | ||||||
| 310,000 | World Omni Select Auto Trust, Series 2020-A, Class A3, 0.550%, 7/15/2025 | 310,481 | ||||||
| 360,000 | World Omni Select Auto Trust, Series 2021-A, Class B, 0.850%, 8/16/2027 | 358,952 | ||||||
|
| |||||||
| 29,176,381 | ||||||||
|
| |||||||
| ABS Credit Card — 0.6% | ||||||||
| 620,000 | American Express Credit Account Master Trust, Series 2019-1, Class A, 2.870%, 10/15/2024 | 627,693 | ||||||
| ABS Credit Card — continued | ||||||||
| 925,000 | Barclays Dryrock Issuance Trust, Series 2019-1, Class A, 1.960%, 5/15/2025(a) | 938,030 | ||||||
| 585,000 | World Financial Network Credit Card Master Trust, Series 2019-C, Class A, 2.210%, 7/15/2026 | 596,034 | ||||||
|
| |||||||
| 2,161,757 | ||||||||
|
| |||||||
| ABS Home Equity — 0.0% | ||||||||
| 106,445 | Bayview Opportunity Master Fund IVa Trust, Series 2016-SPL1, Class A, 4.000%, 4/28/2055, 144A | 107,096 | ||||||
| 2,482 | Countrywide Asset-Backed Certificates, Series 2004-S1, Class A3, 5.115%, 2/25/2035(b) | 2,518 | ||||||
| 13,283 | Mill City Mortgage Loan Trust, Series 2016-1, Class A1, 2.500%, 4/25/2057, 144A(b) | 13,324 | ||||||
|
| |||||||
| 122,938 | ||||||||
|
| |||||||
| ABS Other — 1.4% | ||||||||
| 395,000 | Affirm Asset Securitization Trust, Series 2021-B, Class A, 1.030%, 8/17/2026, 144A | 395,459 | ||||||
| 565,000 | Aqua Finance Trust, Series 2021-A, Class A, 1.540%, 7/17/2046, 144A(c) | 564,912 | ||||||
| 244,914 | Chesapeake Funding II LLC, Series 2020-1A, Class A1, 0.870%, 8/16/2032, 144A | 246,112 | ||||||
| �� | 75,924 | CNH Equipment Trust, Series 2020-A, Class A2, 1.080%, 7/17/2023 | 75,978 | |||||
| 250,000 | CNH Equipment Trust, Series 2020-A, Class A3, 1.160%, 6/16/2025 | 252,160 | ||||||
| 88,816 | Diamond Resorts Owner Trust, Series 2018-1, Class A, 3.700%, 1/21/2031, 144A | 91,966 | ||||||
| 795,000 | Donlen Fleet Lease Funding 2 LLC, Series 2021-2, Class A2, 0.560%, 12/11/2034, 144A | 795,915 | ||||||
| 255,000 | Kubota Credit Owner Trust, Series 2020-1A, Class A3, 1.960%, 3/15/2024, 144A | 258,948 | ||||||
| 174,286 | Merlin Aviation Holdings DAC, Series 2016-1, Class A, 4.500%, 12/15/2032, 144A(b) | 168,727 | ||||||
| 118,291 | MVW LLC, Series 2020-1A, Class A, 1.740%, 10/20/2037, 144A | 119,535 | ||||||
| 265,725 | OneMain Financial Issuance Trust, Series 2018-1A, Class A, 3.300%, 3/14/2029, 144A(a) | 266,391 | ||||||
| 251,884 | S-Jets Ltd., Series 2017-1, Class A, 3.967%, 8/15/2042, 144A | 249,818 | ||||||
| 27,755 | Sierra Timeshare Conduit Receivables Funding LLC, Series 2017-1A, Class A, 2.910%, 3/20/2034, 144A | 27,941 | ||||||
| 162,734 | Sierra Timeshare Receivables Funding LLC, Series 2020-2A, Class A, 1.330%, 7/20/2037, 144A | 163,666 | ||||||
| 1,504,466 | Verizon Owner Trust, Series 2019-B, Class A1A, 2.330%, 12/20/2023(a) | 1,518,104 | ||||||
| 73,242 | Wheels SPV 2 LLC, Series 2019-1A, Class A2, 2.300%, 5/22/2028, 144A | 73,609 | ||||||
|
| |||||||
| 5,269,241 | ||||||||
|
| |||||||
| ABS Student Loan — 0.1% | ||||||||
| 21,284 | Earnest Student Loan Program LLC, Series 2017-A, Class A2, 2.650%, 1/25/2041, 144A | 21,329 | ||||||
| 153,076 | Massachusetts Educational Financing Authority, Series 2018-A, Class A, 3.850%, 5/25/2033 | 161,140 | ||||||
| 94,316 | Navient Private Education Refi Loan Trust, Series 2020-GA, Class A, 1.170%, 9/16/2069, 144A | 96,679 | ||||||
| 130,925 | Navient Private Education Refi Loan Trust, Series 2020-HA, Class A, 1.310%, 1/15/2069, 144A | 131,804 | ||||||
| 8,408 | North Carolina State Education Assistance Authority, Series 2011-2, Class A2, 3-month LIBOR + 0.800%, 0.925%, 7/25/2025(d) | 8,425 | ||||||
| 35,118 | SoFi Professional Loan Program LLC, Series 2016-B, Class A2B, 2.740%, 10/25/2032, 144A | 35,443 | ||||||
See accompanying notes to financial statements.
| 62
Portfolio of Investments – as of September 30, 2021
Loomis Sayles Intermediate Duration Bond Fund – (continued)
| Principal Amount | Description | Value (†) | ||||||
| ABS Student Loan — continued | ||||||||
| $ | 66,954 | SoFi Professional Loan Program LLC, Series 2017-E, Class A2B, 2.720%, 11/26/2040, 144A | $ | 67,945 | ||||
|
| |||||||
| 522,765 | ||||||||
|
| |||||||
| ABS Whole Business — 0.1% | ||||||||
| 518,950 | Planet Fitness Master Issuer LLC, Series 2018-1A, Class A2II, 4.666%, 9/05/2048, 144A | 533,334 | ||||||
|
| |||||||
| Aerospace & Defense — 0.2% | ||||||||
| 640,000 | Raytheon Technologies Corp., 1.900%, 9/01/2031 | 621,013 | ||||||
| 29,000 | Raytheon Technologies Corp., 3.650%, 8/16/2023 | 30,632 | ||||||
|
| |||||||
| 651,645 | ||||||||
|
| |||||||
| Agency Commercial Mortgage-Backed Securities — 0.7% |
| |||||||
| 509,476 | FHLMC Multifamily Structured Pass Through Certificates, Series K029, Class A2, 3.320%, 2/25/2023(a)(b) | 527,900 | ||||||
| 701,647 | FHLMC Multifamily Structured Pass Through Certificates, Series K042, Class A2, 2.670%, 12/25/2024(a) | 741,067 | ||||||
| 1,175,000 | FHLMC Multifamily Structured Pass Through Certificates, Series KJ26, Class A2, 2.606%, 7/25/2027(a) | 1,250,283 | ||||||
| 69,553 | FHLMC Multifamily Structured Pass Through Certificates, Series KJ28, Class A1, 1.766%, 2/25/2025 | 70,206 | ||||||
|
| |||||||
| 2,589,456 | ||||||||
|
| |||||||
| Automotive — 2.5% | ||||||||
| 1,440,000 | American Honda Finance Corp., MTN, 0.875%, 7/07/2023 | 1,451,257 | ||||||
| 145,000 | American Honda Finance Corp., MTN, 3.625%, 10/10/2023 | 154,070 | ||||||
| 160,000 | Daimler Finance North America LLC, 3.350%, 2/22/2023, 144A | 166,273 | ||||||
| 665,000 | Denso Corp., 1.239%, 9/16/2026, 144A | 660,157 | ||||||
| 360,000 | General Motors Financial Co., Inc., 4.150%, 6/19/2023 | 380,476 | ||||||
| 295,000 | Harley-Davidson Financial Services, Inc., 3.350%, 6/08/2025, 144A | 313,252 | ||||||
| 220,000 | Harley-Davidson Financial Services, Inc., 4.050%, 2/04/2022, 144A | 222,668 | ||||||
| 1,295,000 | Hyundai Capital America, 2.100%, 9/15/2028, 144A | 1,276,280 | ||||||
| 195,000 | Hyundai Capital America, 2.375%, 2/10/2023, 144A | 199,293 | ||||||
| 95,000 | Hyundai Capital America, 3.000%, 6/20/2022, 144A | 96,639 | ||||||
| 240,000 | Kia Corp., 1.000%, 4/16/2024, 144A | 240,083 | ||||||
| 275,000 | Nissan Motor Acceptance Co. LLC, 3.450%, 3/15/2023, 144A | 284,613 | ||||||
| 105,000 | PACCAR Financial Corp., MTN, 0.800%, 6/08/2023 | 105,601 | ||||||
| 160,000 | PACCAR Financial Corp., MTN, 1.800%, 2/06/2025 | 164,705 | ||||||
| 955,000 | PACCAR Financial Corp., MTN, 1.900%, 2/07/2023 | 974,740 | ||||||
| 1,150,000 | Toyota Motor Credit Corp., 1.900%, 9/12/2031 | 1,128,946 | ||||||
| 250,000 | Toyota Motor Credit Corp., MTN, 1.150%, 5/26/2022 | 251,557 | ||||||
| 295,000 | Toyota Motor Credit Corp., MTN, 1.800%, 10/07/2021 | 295,033 | ||||||
| 480,000 | Toyota Motor Credit Corp., MTN, 1.900%, 4/06/2028 | 486,329 | ||||||
| 275,000 | Volkswagen Group of America Finance LLC, 3.350%, 5/13/2025, 144A | 294,005 | ||||||
| 290,000 | Volkswagen Group of America Finance LLC, 4.250%, 11/13/2023, 144A | 311,045 | ||||||
|
| |||||||
| 9,457,022 | ||||||||
|
| |||||||
| Banking — 16.8% | ||||||||
| 1,165,000 | Ally Financial, Inc., 3.050%, 6/05/2023 | 1,208,602 | ||||||
| 495,000 | American Express Co., 3.700%, 8/03/2023 | 523,490 | ||||||
| Banking — continued | ||||||||
| 625,000 | ANZ New Zealand International Ltd., 1.900%, 2/13/2023, 144A | 638,338 | ||||||
| 1,190,000 | Australia & New Zealand Banking Group Ltd., MTN, 2.050%, 11/21/2022 | 1,215,081 | ||||||
| 800,000 | Banco Bilbao Vizcaya Argentaria S.A., 0.875%, 9/18/2023 | 804,848 | ||||||
| 805,000 | Bank of America Corp., MTN, (fixed rate to 6/14/2028, variable rate thereafter), 2.087%, 6/14/2029 | 803,708 | ||||||
| 395,000 | Bank of Ireland Group PLC, 4.500%, 11/25/2023, 144A | 423,334 | ||||||
| 910,000 | Bank of Ireland Group PLC, (fixed rate to 9/30/2026, variable rate thereafter), 2.029%, 9/30/2027, 144A | 909,470 | ||||||
| 175,000 | Bank of Montreal, MTN, 1.850%, 5/01/2025 | 180,075 | ||||||
| 655,000 | Bank of New York Mellon Corp. (The), MTN, 1.600%, 4/24/2025 | 669,537 | ||||||
| 595,000 | Bank of New York Mellon Corp. (The), MTN, 1.800%, 7/28/2031 | 581,588 | ||||||
| 1,235,000 | Bank of New Zealand, 2.000%, 2/21/2025, 144A | 1,270,718 | ||||||
| 1,325,000 | Bank of Nova Scotia (The), 1.300%, 9/15/2026 | 1,315,263 | ||||||
| 870,000 | Bank of Nova Scotia (The), 2.000%, 11/15/2022 | 887,065 | ||||||
| 280,000 | Bank of Nova Scotia (The), 2.150%, 8/01/2031 | 277,914 | ||||||
| 200,000 | Banque Federative du Credit Mutuel S.A., 2.375%, 11/21/2024, 144A | 208,408 | ||||||
| 460,000 | Banque Federative du Credit Mutuel S.A., 2.700%, 7/20/2022, 144A | 469,095 | ||||||
| 485,000 | Banque Federative du Credit Mutuel S.A., 3.750%, 7/20/2023, 144A | 513,137 | ||||||
| 795,000 | Barclays PLC, (fixed rate to 5/16/2023, variable rate thereafter), 4.338%, 5/16/2024 | 841,520 | ||||||
| 215,000 | BNP Paribas S.A., (fixed rate to 1/13/2026, variable rate thereafter), 1.323%, 1/13/2027, 144A | 211,390 | ||||||
| 450,000 | BNP Paribas S.A., (fixed rate to 4/19/2031, variable rate thereafter), 2.871%, 4/19/2032, 144A | 459,569 | ||||||
| 675,000 | BNP Paribas S.A., (fixed rate to 6/09/2025, variable rate thereafter), 2.219%, 6/09/2026, 144A | 692,807 | ||||||
| 645,000 | BNP Paribas S.A., (fixed rate to 9/15/2028, variable rate thereafter), 2.159%, 9/15/2029, 144A | 639,846 | ||||||
| 505,000 | Capital One Financial Corp., (fixed rate to 7/29/2031, variable rate thereafter), 2.359%, 7/29/2032 | 494,410 | ||||||
| 940,000 | Citigroup, Inc., (fixed rate to 11/04/2021, variable rate thereafter), 2.312%, 11/04/2022 | 941,439 | ||||||
| 510,000 | Citigroup, Inc., (fixed rate to 4/08/2025, variable rate thereafter), 3.106%, 4/08/2026 | 541,493 | ||||||
| 230,000 | Citigroup, Inc., (fixed rate to 5/01/2024, variable rate thereafter), 0.981%, 5/01/2025 | 230,745 | ||||||
| 225,000 | Comerica, Inc., 3.700%, 7/31/2023 | 237,632 | ||||||
| 715,000 | Commonwealth Bank of Australia, 1.875%, 9/15/2031, 144A | 702,212 | ||||||
| 660,000 | Cooperatieve Rabobank U.A., 2.750%, 1/10/2023 | 680,458 | ||||||
| 320,000 | Cooperatieve Rabobank U.A., (fixed rate to 2/24/2026, variable rate thereafter), 1.106%, 2/24/2027, 144A | 315,436 | ||||||
| 750,000 | Credit Agricole S.A., (fixed rate to 6/16/2025, variable rate thereafter), 1.907%, 6/16/2026, 144A | 764,267 | ||||||
| 575,000 | Credit Suisse AG, 1.250%, 8/07/2026 | 566,833 | ||||||
| 405,000 | Credit Suisse AG, 2.100%, 11/12/2021 | 405,846 | ||||||
| 725,000 | Credit Suisse Group AG, (fixed rate to 5/14/2031, variable rate thereafter), 3.091%, 5/14/2032, 144A | 741,331 | ||||||
| 940,000 | Danske Bank A/S, 3.875%, 9/12/2023, 144A | 994,483 | ||||||
| 800,000 | Danske Bank A/S, (fixed rate to 9/10/2024, variable rate thereafter), 0.976%, 9/10/2025, 144A | 798,658 | ||||||
See accompanying notes to financial statements.
63 |
Portfolio of Investments – as of September 30, 2021
Loomis Sayles Intermediate Duration Bond Fund – (continued)
| Principal Amount | Description | Value (†) | ||||||
| Banking — continued | ||||||||
| $ | 250,000 | Deutsche Bank AG, (fixed rate to 11/24/2025, variable rate thereafter), 2.129%, 11/24/2026 | $ | 253,942 | ||||
| 395,000 | Deutsche Bank AG, (fixed rate to 11/26/2024, variable rate thereafter), 3.961%, 11/26/2025 | 427,197 | ||||||
| 205,000 | DNB Bank ASA, 2.150%, 12/02/2022, 144A | 209,689 | ||||||
| 790,000 | DNB Bank ASA, (fixed rate to 9/16/2025, variable rate thereafter), 1.127%, 9/16/2026, 144A | 780,481 | ||||||
| 520,000 | Goldman Sachs Group, Inc. (The), (fixed rate to 10/31/2021, variable rate thereafter), 2.876%, 10/31/2022 | 520,901 | ||||||
| 510,000 | Goldman Sachs Group, Inc. (The), (fixed rate to 12/09/2025, variable rate thereafter), 1.093%, 12/09/2026 | 502,566 | ||||||
| 480,000 | Goldman Sachs Group, Inc. (The), (fixed rate to 3/09/2026, variable rate thereafter), 1.431%, 3/09/2027 | 478,680 | ||||||
| 605,000 | HSBC Holdings PLC, (fixed rate to 5/24/2031, variable rate thereafter), 2.804%, 5/24/2032 | 613,148 | ||||||
| 790,000 | HSBC Holdings PLC, (fixed rate to 8/17/2028, variable rate thereafter), 2.206%, 8/17/2029 | 783,569 | ||||||
| 520,000 | HSBC Holdings PLC, (fixed rate to 9/12/2025, variable rate thereafter), 4.292%, 9/12/2026 | 573,629 | ||||||
| 865,000 | JPMorgan Chase & Co., (fixed rate to 11/19/2025, variable rate thereafter), 1.045%, 11/19/2026 | 851,880 | ||||||
| 535,000 | JPMorgan Chase & Co., (fixed rate to 4/01/2022, variable rate thereafter), 3.207%, 4/01/2023 | 542,479 | ||||||
| 1,070,000 | JPMorgan Chase & Co., (fixed rate to 6/01/2028, variable rate thereafter), 2.069%, 6/01/2029 | 1,072,410 | ||||||
| 1,520,000 | JPMorgan Chase & Co., (fixed rate to 6/23/2024, variable rate thereafter), 0.969%, 6/23/2025 | 1,521,864 | ||||||
| 495,000 | Lloyds Banking Group PLC, 4.050%, 8/16/2023 | 527,021 | ||||||
| 375,000 | Lloyds Banking Group PLC, (fixed rate to 7/09/2024, variable rate thereafter), 3.870%, 7/09/2025 | 404,321 | ||||||
| 1,195,000 | Macquarie Bank Ltd., 2.100%, 10/17/2022, 144A | 1,217,881 | ||||||
| 65,000 | Macquarie Bank Ltd., 2.300%, 1/22/2025, 144A | 67,606 | ||||||
| 595,000 | Macquarie Group Ltd., (fixed rate to 6/23/2031, variable rate thereafter), 2.691%, 6/23/2032, 144A | 594,112 | ||||||
| 280,000 | Mitsubishi UFJ Financial Group, Inc., (fixed rate to 7/20/2031, variable rate thereafter), 2.309%, 7/20/2032 | 277,413 | ||||||
| 600,000 | Mizuho Financial Group, Inc., (fixed rate to 7/9/2031, variable rate thereafter), 2.260%, 7/09/2032 | 591,293 | ||||||
| 910,000 | Morgan Stanley, (fixed rate to 5/30/2024, variable rate thereafter), 0.790%, 5/30/2025 | 907,206 | ||||||
| 570,000 | Morgan Stanley, GMTN, (fixed rate to 7/20/2026, variable rate thereafter), 1.512%, 7/20/2027 | 567,290 | ||||||
| 930,000 | National Australia Bank Ltd., 3.700%, 11/04/2021 | 932,502 | ||||||
| 625,000 | National Bank of Canada, 2.150%, 10/07/2022, 144A | 636,893 | ||||||
| 620,000 | Nationwide Building Society, (fixed rate to 3/08/2023, variable rate thereafter), 3.766%, 3/08/2024, 144A | 646,375 | ||||||
| 570,000 | NatWest Markets PLC, 0.800%, 8/12/2024, 144A | 568,797 | ||||||
| 1,215,000 | NatWest Markets PLC, 1.600%, 9/29/2026, 144A | 1,214,337 | ||||||
| 1,020,000 | NatWest Markets PLC, 3.625%, 9/29/2022, 144A | 1,053,648 | ||||||
| 1,305,000 | Nordea Bank Abp, 1.500%, 9/30/2026, 144A | 1,301,124 | ||||||
| 210,000 | Northern Trust Corp., (fixed rate to 5/08/2027, variable rate thereafter), 3.375%, 5/08/2032 | 226,061 | ||||||
| 1,215,000 | Royal Bank of Canada, 0.650%, 7/29/2024 | 1,212,424 | ||||||
| 410,000 | Royal Bank of Canada, 1.200%, 4/27/2026 | 407,465 | ||||||
| 690,000 | Santander Holdings USA, Inc., 3.450%, 6/02/2025 | 738,818 | ||||||
| 245,000 | Societe Generale S.A., 1.375%, 7/08/2025, 144A | 245,191 | ||||||
| 935,000 | Societe Generale S.A., (fixed rate to 6/9/2026, variable rate thereafter), 1.792%, 6/09/2027, 144A | 929,926 | ||||||
| Banking — continued | ||||||||
| 820,000 | Standard Chartered PLC, (fixed rate to 1/30/2025, variable rate thereafter), 2.819%, 1/30/2026, 144A | 853,941 | ||||||
| 375,000 | Standard Chartered PLC, (fixed rate to 6/29/2031, variable rate thereafter), 2.678%, 6/29/2032, 144A | 373,091 | ||||||
| 245,000 | State Street Corp., (fixed rate to 3/30/2025, variable rate thereafter), 2.901%, 3/30/2026 | 259,915 | ||||||
| 305,000 | State Street Corp., (fixed rate to 5/15/2022, variable rate thereafter), 2.653%, 5/15/2023 | 309,457 | ||||||
| 1,540,000 | Sumitomo Mitsui Financial Group, Inc., 1.902%, 9/17/2028 | 1,521,922 | ||||||
| 545,000 | Sumitomo Mitsui Financial Group, Inc., 2.696%, 7/16/2024 | 572,451 | ||||||
| 235,000 | Sumitomo Mitsui Financial Group, Inc., 2.784%, 7/12/2022 | 239,581 | ||||||
| 840,000 | Sumitomo Mitsui Trust Bank Ltd., 0.850%, 3/25/2024, 144A | 842,039 | ||||||
| 515,000 | Svenska Handelsbanken AB, 3.900%, 11/20/2023 | 553,315 | ||||||
| 1,400,000 | Swedbank AB, 1.300%, 6/02/2023, 144A | 1,419,936 | ||||||
| 75,000 | Synchrony Financial, 4.250%, 8/15/2024 | 81,045 | ||||||
| 675,000 | Toronto-Dominion Bank (The), 0.750%, 9/11/2025 | 666,338 | ||||||
| 1,260,000 | Toronto-Dominion Bank (The), MTN, 1.250%, 9/10/2026 | 1,250,893 | ||||||
| 700,000 | Toronto-Dominion Bank (The), MTN, 1.900%, 12/01/2022 | 713,066 | ||||||
| 770,000 | Truist Financial Corp., MTN, 3.050%, 6/20/2022 | 783,830 | ||||||
| 515,000 | Truist Financial Corp., MTN, (fixed rate to 6/7/2028, variable rate thereafter), 1.887%, 6/07/2029 | 514,498 | ||||||
| 1,565,000 | UBS Group AG, (fixed rate to 8/10/2026, variable rate thereafter), 1.494%, 8/10/2027, 144A | 1,548,035 | ||||||
| 665,000 | UniCredit SpA, 3.750%, 4/12/2022, 144A | 675,950 | ||||||
| 375,000 | UniCredit SpA, (fixed rate to 6/03/2026, variable rate thereafter), 1.982%, 6/03/2027, 144A | 374,050 | ||||||
| 585,000 | UniCredit SpA, (fixed rate to 9/22/2025, variable rate thereafter), 2.569%, 9/22/2026, 144A | 594,796 | ||||||
| 340,000 | Wells Fargo & Co., (fixed rate to 4/30/2025, variable rate thereafter), 2.188%, 4/30/2026 | 350,926 | ||||||
| 680,000 | Westpac Banking Corp., 2.150%, 6/03/2031 | 685,981 | ||||||
| 195,000 | Westpac Banking Corp., 2.800%, 1/11/2022 | 196,418 | ||||||
|
| |||||||
| 63,941,659 | ||||||||
|
| |||||||
| Brokerage — 1.4% | ||||||||
| 415,000 | Ameriprise Financial, Inc., 3.000%, 3/22/2022 | 420,240 | ||||||
| 1,270,000 | Blackstone Holdings Finance Co. LLC, 2.000%, 1/30/2032, 144A | 1,220,285 | ||||||
| 970,000 | Blackstone Private Credit Fund, 2.625%, 12/15/2026, 144A | 966,998 | ||||||
| 560,000 | Blue Owl Finance LLC, 3.125%, 6/10/2031, 144A | 553,875 | ||||||
| 155,000 | Brookfield Finance I UK PLC, 2.340%, 1/30/2032 | 152,514 | ||||||
| 230,000 | Charles Schwab Corp. (The), 2.000%, 3/20/2028 | 234,749 | ||||||
| 465,000 | Intercontinental Exchange, Inc., 2.100%, 6/15/2030 | 459,880 | ||||||
| 1,300,000 | National Securities Clearing Corp., 1.200%, 4/23/2023, 144A(a) | 1,318,087 | ||||||
|
| |||||||
| 5,326,628 | ||||||||
|
| |||||||
| Building Materials — 0.1% | ||||||||
| 270,000 | Eagle Materials, Inc., 2.500%, 7/01/2031 | 268,308 | ||||||
|
| |||||||
| Chemicals — 0.4% | ||||||||
| 360,000 | Cabot Corp., 4.000%, 7/01/2029 | 393,297 | ||||||
| 960,000 | Nutrien Ltd., 1.900%, 5/13/2023 | 980,656 | ||||||
|
| |||||||
| 1,373,953 | ||||||||
|
| |||||||
| Collateralized Mortgage Obligations — 1.3% | ||||||||
| 364,105 | Government National Mortgage Association, Series 2010-H02, Class FA, 1-month LIBOR + 0.680%, 0.768%, 2/20/2060(d) | 365,778 | ||||||
See accompanying notes to financial statements.
| 64
Portfolio of Investments – as of September 30, 2021
Loomis Sayles Intermediate Duration Bond Fund – (continued)
| Principal Amount | Description | Value (†) | ||||||
| Collateralized Mortgage Obligations — continued | ||||||||
| $ | 222,724 | Government National Mortgage Association, Series 2010-H03, Class FA, 1-month LIBOR + 0.550%, 0.638%, 3/20/2060(d) | $ | 223,678 | ||||
| 129,132 | Government National Mortgage Association, Series 2014-H14, Class FA, 1-month LIBOR + 0.500%, 0.603%, 7/20/2064(d) | 129,960 | ||||||
| 102,462 | Government National Mortgage Association, Series 2014-H15, Class FA, 1-month LIBOR + 0.500%, 0.590%, 7/20/2064(d) | 103,044 | ||||||
| 529 | Government National Mortgage Association, Series 2015-H09, Class HA, 1.750%, 3/20/2065(c)(e) | 531 | ||||||
| 264,307 | Government National Mortgage Association, Series 2015-H10, Class JA, 2.250%, 4/20/2065(a) | 270,735 | ||||||
| 392,767 | Government National Mortgage Association, Series 2016-H06, Class FC, 1-month LIBOR + 0.920%, 1.010%, 2/20/2066(a)(d) | 398,821 | ||||||
| 1,204,073 | Government National Mortgage Association, Series 2018-H17, Class JA, 3.750%, 9/20/2068(a)(b) | 1,297,826 | ||||||
| 292,751 | Government National Mortgage Association, Series 2019-H01, Class FL, 1-month LIBOR + 0.450%, 0.540%, 12/20/2068(d) | 293,490 | ||||||
| 991,904 | Government National Mortgage Association, Series 2019-H01, Class FT, 1-month LIBOR + 0.400%, 0.490%, 10/20/2068(a)(d) | 993,121 | ||||||
| 920,362 | Government National Mortgage Association, Series 2019-H10, Class FM, 1-month LIBOR + 0.400%, 0.490%, 5/20/2069(a)(d) | 920,676 | ||||||
|
| |||||||
| 4,997,660 | ||||||||
|
| |||||||
| Construction Machinery — 0.2% | ||||||||
| 240,000 | Ashtead Capital, Inc., 2.450%, 8/12/2031, 144A | 235,929 | ||||||
| 275,000 | Caterpillar Financial Services Corp., MTN, 0.950%, 5/13/2022 | 276,308 | ||||||
| 300,000 | CNH Industrial Capital LLC, 1.950%, 7/02/2023 | 306,653 | ||||||
|
| |||||||
| 818,890 | ||||||||
|
| |||||||
| Consumer Cyclical Services — 0.4% | ||||||||
| 1,255,000 | eBay, Inc., 1.400%, 5/10/2026 | 1,259,036 | ||||||
| 165,000 | Expedia Group, Inc., 6.250%, 5/01/2025, 144A | 190,234 | ||||||
|
| |||||||
| 1,449,270 | ||||||||
|
| |||||||
| Consumer Products — 0.1% | ||||||||
| 205,000 | Hasbro, Inc., 3.550%, 11/19/2026 | 223,160 | ||||||
|
| |||||||
| Diversified Manufacturing — 0.6% | ||||||||
| 135,000 | Amphenol Corp., 2.050%, 3/01/2025 | 139,303 | ||||||
| 265,000 | Amphenol Corp., 2.200%, 9/15/2031 | 262,797 | ||||||
| 465,000 | Honeywell International, Inc., 1.750%, 9/01/2031 | 453,156 | ||||||
| 745,000 | Johnson Controls International PLC/Tyco Fire & Security Finance SCA, 2.000%, 9/16/2031 | 725,523 | ||||||
| 225,000 | Kennametal, Inc., 4.625%, 6/15/2028 | 253,235 | ||||||
| 135,000 | Timken Co. (The), 4.500%, 12/15/2028 | 150,616 | ||||||
| 275,000 | WW Grainger, Inc., 1.850%, 2/15/2025 | 283,441 | ||||||
|
| |||||||
| 2,268,071 | ||||||||
|
| |||||||
| Electric — 3.5% |
| |||||||
| 370,000 | AES Corp. (The), 1.375%, 1/15/2026 | 365,143 | ||||||
| 435,000 | AES Corp. (The), 3.300%, 7/15/2025, 144A | 462,066 | ||||||
| 360,000 | Alliant Energy Finance LLC, 4.250%, 6/15/2028, 144A | 407,329 | ||||||
| 465,000 | Ameren Corp., 1.750%, 3/15/2028 | 455,718 | ||||||
| 370,000 | Arizona Public Service Co., 2.200%, 12/15/2031 | 365,675 | ||||||
| 120,000 | Consolidated Edison Co. of New York, Inc., Series B, 2.900%, 12/01/2026 | 127,078 | ||||||
| 225,000 | Dominion Energy, Inc., 3.071%, 8/15/2024 | 237,827 | ||||||
| 270,000 | DTE Energy Co., 2.250%, 11/01/2022 | 275,401 | ||||||
| Electric — continued | ||||||||
| 1,135,000 | Duke Energy Carolinas LLC, 3.050%, 3/15/2023 | 1,177,212 | ||||||
| 570,000 | Duke Energy Corp., 0.900%, 9/15/2025 | 565,076 | ||||||
| 635,000 | Enel Finance International NV, 1.875%, 7/12/2028, 144A | 632,395 | ||||||
| 605,000 | Entergy Corp., 0.900%, 9/15/2025 | 594,899 | ||||||
| 116,000 | Exelon Generation Co. LLC, 4.250%, 6/15/2022 | 118,015 | ||||||
| 188,000 | National Rural Utilities Cooperative Finance Corp., (fixed rate to 4/30/2023, variable rate thereafter), 4.750%, 4/30/2043 | 196,027 | ||||||
| 900,000 | NextEra Energy Capital Holdings, Inc., 0.650%, 3/01/2023 | 903,043 | ||||||
| 730,000 | Ohio Power Co., 2.900%, 10/01/2051 | 705,375 | ||||||
| 765,000 | Pacific Gas & Electric Co., 3-month LIBOR + 1.375%, 1.500%, 11/15/2021(d) | 765,309 | ||||||
| 370,000 | Pacific Gas & Electric Co., 3.000%, 6/15/2028 | 376,514 | ||||||
| 370,000 | PSEG Power LLC, 3.850%, 6/01/2023 | 389,214 | ||||||
| 235,000 | Public Service Enterprise Group, Inc., 2.875%, 6/15/2024 | 247,505 | ||||||
| 515,000 | Southern California Edison Co., 0.700%, 8/01/2023 | 515,799 | ||||||
| 255,000 | Southern California Edison Co., Series G, 2.500%, 6/01/2031 | 255,900 | ||||||
| 720,000 | Southern Power Co., Series E, 2.500%, 12/15/2021 | 721,807 | ||||||
| 260,000 | Southwestern Electric Power Co., 1.650%, 3/15/2026 | 261,796 | ||||||
| 600,000 | Vistra Operations Co. LLC, 3.550%, 7/15/2024, 144A | 631,095 | ||||||
| 1,540,000 | WEC Energy Group, Inc., 0.550%, 9/15/2023 | 1,539,876 | ||||||
|
| |||||||
| 13,293,094 | ||||||||
|
| |||||||
| Finance Companies — 1.6% | ||||||||
| 510,000 | AerCap Ireland Capital DAC/AerCap Global Aviation Trust, 3.150%, 2/15/2024 | 531,804 | ||||||
| 360,000 | Air Lease Corp., 1.875%, 8/15/2026 | 358,743 | ||||||
| 555,000 | Aircastle Ltd., 2.850%, 1/26/2028, 144A | 562,082 | ||||||
| 915,000 | Ares Capital Corp., 2.875%, 6/15/2028 | 926,912 | ||||||
| 50,000 | Ares Capital Corp., 4.250%, 3/01/2025 | 53,666 | ||||||
| 305,000 | Aviation Capital Group LLC, 3.875%, 5/01/2023, 144A | 318,253 | ||||||
| 225,000 | Aviation Capital Group LLC, 4.375%, 1/30/2024, 144A | 240,241 | ||||||
| 285,000 | Avolon Holdings Funding Ltd., 2.750%, 2/21/2028, 144A | 284,269 | ||||||
| 47,000 | Avolon Holdings Funding Ltd., 3.625%, 5/01/2022, 144A | 47,703 | ||||||
| 210,000 | FS KKR Capital Corp., 4.125%, 2/01/2025 | 224,386 | ||||||
| 425,000 | GE Capital Funding LLC, 4.050%, 5/15/2027 | 477,166 | ||||||
| 335,000 | Hercules Capital, Inc., 2.625%, 9/16/2026 | 334,892 | ||||||
| 945,000 | Main Street Capital Corp., 3.000%, 7/14/2026 | 963,871 | ||||||
| 150,000 | Oaktree Specialty Lending Corp., 3.500%, 2/25/2025 | 157,119 | ||||||
| 175,000 | Owl Rock Capital Corp., 3.400%, 7/15/2026 | 182,251 | ||||||
| 260,000 | Owl Rock Capital Corp., 3.750%, 7/22/2025 | 273,425 | ||||||
| 90,000 | Owl Rock Capital Corp., 4.250%, 1/15/2026 | 96,597 | ||||||
|
| |||||||
| 6,033,380 | ||||||||
|
| |||||||
| Financial Other — 0.5% | ||||||||
| 675,000 | Blackstone Secured Lending Fund, 2.850%, 9/30/2028, 144A | 670,430 | ||||||
| 470,000 | LeasePlan Corp NV, 2.875%, 10/24/2024, 144A | 491,980 | ||||||
| 410,000 | Mitsubishi HC Capital, Inc., 2.652%, 9/19/2022, 144A | 417,416 | ||||||
| 185,000 | ORIX Corp., 3.250%, 12/04/2024 | 198,113 | ||||||
|
| |||||||
| 1,777,939 | ||||||||
|
| |||||||
| Food & Beverage — 1.7% | ||||||||
| 120,000 | Brown-Forman Corp., 3.500%, 4/15/2025 | 129,868 | ||||||
| 355,000 | Bunge Ltd. Finance Corp., 2.750%, 5/14/2031 | 359,704 | ||||||
| 525,000 | Bunge Ltd. Finance Corp., 4.350%, 3/15/2024 | 567,655 | ||||||
See accompanying notes to financial statements.
65 |
Portfolio of Investments – as of September 30, 2021
Loomis Sayles Intermediate Duration Bond Fund – (continued)
| Principal Amount | Description | Value (†) | ||||||
| Food & Beverage — continued | ||||||||
| $ | 1,060,000 | Coca-Cola Europacific Partners PLC, 0.800%, 5/03/2024, 144A | $ | 1,056,696 | ||||
| 1,095,000 | General Mills, Inc., 2.600%, 10/12/2022 | 1,118,163 | ||||||
| 535,000 | J M Smucker Co. (The), 2.125%, 3/15/2032 | 522,228 | ||||||
| 205,000 | JDE Peet’s NV, 2.250%, 9/24/2031, 144A | 200,419 | ||||||
| 1,085,000 | Nestle Holdings, Inc., 1.875%, 9/14/2031, 144A | 1,074,899 | ||||||
| 1,065,000 | Pernod Ricard International Finance LLC, 1.250%, 4/01/2028, 144A | 1,017,660 | ||||||
| 340,000 | Viterra Finance BV, 2.000%, 4/21/2026, 144A | 342,412 | ||||||
|
| |||||||
| 6,389,704 | ||||||||
|
| |||||||
| Government Owned – No Guarantee — 0.4% | ||||||||
| 330,000 | Antares Holdings LP, 2.750%, 1/15/2027, 144A | 330,299 | ||||||
| 350,000 | BOC Aviation USA Corp., 1.625%, 4/29/2024, 144A | 352,690 | ||||||
| 325,000 | DAE Funding LLC, 1.550%, 8/01/2024, 144A | 322,029 | ||||||
| 380,000 | NBN Co. Ltd., 2.625%, 5/05/2031, 144A | 385,523 | ||||||
|
| |||||||
| 1,390,541 | ||||||||
|
| |||||||
| Health Insurance — 0.2% | ||||||||
| 605,000 | Centene Corp., 2.625%, 8/01/2031 | 600,910 | ||||||
|
| |||||||
| Healthcare — 0.6% | ||||||||
| 227,000 | Cigna Corp., 3.750%, 7/15/2023 | 239,942 | ||||||
| 92,000 | CVS Health Corp., 4.300%, 3/25/2028 | 104,940 | ||||||
| 510,000 | DH Europe Finance II S.a.r.l., 2.200%, 11/15/2024 | 530,997 | ||||||
| 865,000 | McKesson Corp., 1.300%, 8/15/2026 | 857,845 | ||||||
| 510,000 | Universal Health Services, Inc., 2.650%, 1/15/2032, 144A | 505,021 | ||||||
|
| |||||||
| 2,238,745 | ||||||||
|
| |||||||
| Hybrid ARMs — 0.0% | ||||||||
| 28,958 | FHLMC, 1-year CMT + 2.225%, 2.280%, 1/01/2035(d) | 30,983 | ||||||
| 46,002 | FHLMC, 1-year CMT + 2.500%, 2.601%, 5/01/2036(d) | 49,140 | ||||||
|
| |||||||
| 80,123 | ||||||||
|
| |||||||
| Independent Energy — 0.4% | ||||||||
| 200,000 | Aker BP ASA, 3.750%, 1/15/2030, 144A | 214,129 | ||||||
| 210,000 | Diamondback Energy, Inc., 0.900%, 3/24/2023 | 209,936 | ||||||
| 470,000 | Diamondback Energy, Inc., 4.750%, 5/31/2025 | 525,004 | ||||||
| 530,000 | Pioneer Natural Resources Co., 0.550%, 5/15/2023 | 530,539 | ||||||
|
| |||||||
| 1,479,608 | ||||||||
|
| |||||||
| Industrial Other — 0.1% | ||||||||
| 455,000 | CK Hutchison International Ltd., 1.500%, 4/15/2026, 144A | 455,118 | ||||||
|
| |||||||
| Integrated Energy — 0.2% | ||||||||
| 660,000 | Suncor Energy, Inc., 2.800%, 5/15/2023 | 683,049 | ||||||
|
| |||||||
| Life Insurance — 4.4% | ||||||||
| 1,385,000 | AIG Global Funding, 0.800%, 7/07/2023, 144A | 1,396,007 | ||||||
| 535,000 | AIG Global Funding, 0.900%, 9/22/2025, 144A | 527,313 | ||||||
| 490,000 | Athene Global Funding, 1.608%, 6/29/2026, 144A | 489,645 | ||||||
| 875,000 | Athene Global Funding, 2.500%, 3/24/2028, 144A | 895,562 | ||||||
| 1,295,000 | Athene Global Funding, 2.646%, 10/04/2031, 144A | 1,296,420 | ||||||
| 235,000 | Brighthouse Financial Global Funding, 1.000%, 4/12/2024, 144A | 236,170 | ||||||
| 565,000 | CNO Global Funding, 1.750%, 10/07/2026, 144A | 564,921 | ||||||
| 1,285,000 | Equitable Financial Life Global Funding, 1.800%, 3/08/2028, 144A | 1,276,742 | ||||||
| 920,000 | F&G Global Funding, 2.000%, 9/20/2028, 144A | 905,803 | ||||||
| 600,000 | GA Global Funding Trust, 1.000%, 4/08/2024, 144A | 602,592 | ||||||
| 730,000 | GA Global Funding Trust, 1.950%, 9/15/2028, 144A | 719,389 | ||||||
| 665,000 | Great-West Lifeco U.S. Finance LP, 0.904%, 8/12/2025, 144A | 654,744 | ||||||
| 1,370,000 | Guardian Life Global Funding, 1.100%, 6/23/2025, 144A | 1,373,577 | ||||||
| Life Insurance — continued | ||||||||
| 155,000 | Jackson National Life Global Funding, 3.875%, 6/11/2025, 144A | 168,918 | ||||||
| 795,000 | Metropolitan Life Global Funding I, 0.900%, 6/08/2023, 144A | 802,675 | ||||||
| 700,000 | Metropolitan Life Global Funding I, 0.950%, 7/02/2025, 144A | 696,311 | ||||||
| 590,000 | New York Life Global Funding, 1.850%, 8/01/2031, 144A | 574,401 | ||||||
| 1,070,000 | New York Life Global Funding, 2.875%, 4/10/2024, 144A(a) | 1,131,419 | ||||||
| 460,000 | Reliance Standard Life Global Funding II, 1.512%, 9/28/2026, 144A | 457,705 | ||||||
| 655,000 | Reliance Standard Life Global Funding II, 2.750%, 5/07/2025, 144A | 686,654 | ||||||
| 565,000 | Reliance Standard Life Global Funding II, 3.850%, 9/19/2023, 144A | 600,047 | ||||||
| 755,000 | Security Benefit Global Funding, 1.250%, 5/17/2024, 144A | 760,058 | ||||||
|
| |||||||
| 16,817,073 | ||||||||
|
| |||||||
| Lodging — 0.1% | ||||||||
| 350,000 | Marriott International, Inc., Series Z, 4.150%, 12/01/2023 | 373,306 | ||||||
|
| |||||||
| Media Entertainment — 0.1% | ||||||||
| 580,000 | Prosus NV, 3.061%, 7/13/2031, 144A | 566,643 | ||||||
|
| |||||||
| Metals & Mining — 0.4% | ||||||||
| 425,000 | Anglo American Capital PLC, 2.250%, 3/17/2028, 144A | 422,444 | ||||||
| 1,085,000 | Glencore Funding LLC, 2.625%, 9/23/2031, 144A | 1,062,541 | ||||||
| 155,000 | Glencore Funding LLC, 4.125%, 3/12/2024, 144A | 166,058 | ||||||
|
| |||||||
| 1,651,043 | ||||||||
|
| |||||||
| Midstream — 0.1% | ||||||||
| 25,000 | Energy Transfer LP, 4.250%, 3/15/2023 | 26,062 | ||||||
| 440,000 | Midwest Connector Capital Co. LLC, 3.625%, 4/01/2022, 144A | 445,207 | ||||||
|
| |||||||
| 471,269 | ||||||||
|
| |||||||
| Mortgage Related — 0.8% | ||||||||
| 1,248 | FHLMC, 3.000%, 10/01/2026 | 1,314 | ||||||
| 82 | FHLMC, 6.500%, 1/01/2024 | 92 | ||||||
| 26 | FHLMC, 8.000%, 7/01/2025 | 28 | ||||||
| 37,146 | GNMA, 3.630%, with various maturities in 2063(a)(b)(f) | 37,352 | ||||||
| 4,758 | GNMA, 3.890%, 10/20/2062(b) | 4,979 | ||||||
| 6,026 | GNMA, 3.990%, 5/20/2062(b) | 6,420 | ||||||
| 13,142 | GNMA, 4.015%, 4/20/2063(a)(b) | 13,868 | ||||||
| 55,387 | GNMA, 4.362%, 6/20/2066(b) | 60,134 | ||||||
| 8,065 | GNMA, 4.408%, 11/20/2064(b) | 8,487 | ||||||
| 196,518 | GNMA, 4.419%, 10/20/2066(b) | 215,488 | ||||||
| 71,534 | GNMA, 4.428%, 9/20/2066(b) | 76,952 | ||||||
| 58,136 | GNMA, 4.434%, 11/20/2066(b) | 62,917 | ||||||
| 65,397 | GNMA, 4.456%, 10/20/2066(b) | 72,520 | ||||||
| 66,966 | GNMA, 4.462%, 11/20/2066(b) | 74,018 | ||||||
| 70,965 | GNMA, 4.491%, 10/20/2066(b) | 77,613 | ||||||
| 41,716 | GNMA, 4.512%, 8/20/2066(b) | 46,058 | ||||||
| 462,778 | GNMA, 4.537%, 7/20/2067(a)(b) | 515,368 | ||||||
| 152,781 | GNMA, 4.538%, 9/20/2066(b) | 167,172 | ||||||
| 2,093 | GNMA, 4.630%, 7/20/2062(b) | 2,170 | ||||||
| 712,315 | GNMA, 4.647%, 4/20/2067(a)(b) | 792,317 | ||||||
| 676,438 | GNMA, 4.683%, 1/20/2067(a)(b) | 748,343 | ||||||
| 255,718 | GNMA, 4.700%, with various maturities from 2061 to 2064(a)(b)(f) | 268,980 | ||||||
| 277 | GNMA, 6.500%, 12/15/2023 | 310 | ||||||
|
| |||||||
| 3,252,900 | ||||||||
|
| |||||||
See accompanying notes to financial statements.
| 66
Portfolio of Investments – as of September 30, 2021
Loomis Sayles Intermediate Duration Bond Fund – (continued)
| Principal Amount | Description | Value (†) | ||||||
| Natural Gas — 0.2% | ||||||||
| $ | 945,000 | Atmos Energy Corp., 2.850%, 2/15/2052 | $ | 902,573 | ||||
|
| |||||||
| Non-Agency Commercial Mortgage-Backed Securities — 3.7% |
| |||||||
| 230,000 | BANK, Series 2019-BN24, Class A3, 2.960%, 11/15/2062 | 245,646 | ||||||
| 270,000 | BANK, Series 2020-BN25, Class A5, 2.649%, 1/15/2063 | 282,292 | ||||||
| 414,186 | Barclays Commercial Mortgage Securities Trust, Series 2017-C1, Class A2, 3.189%, 2/15/2050(a) | 417,339 | ||||||
| 660,000 | Barclays Commercial Mortgage Securities Trust, Series 2020-BID, Class A, 1-month LIBOR + 2.140%, 2.224%, 10/15/2037, 144A(d) | 663,904 | ||||||
| 285,000 | Benchmark Mortgage Trust, Series 2020-B16, Class A5, 2.732%, 2/15/2053 | 298,811 | ||||||
| 491,600 | CFCRE Commercial Mortgage Trust, Series 2016-C3, Class A3, 3.865%, 1/10/2048(a) | 539,005 | ||||||
| 361,996 | CFCRE Commercial Mortgage Trust, Series 2016-C4, Class A4, 3.283%, 5/10/2058 | 387,688 | ||||||
| 145,000 | CIM Retail Portfolio Trust, Series 2021-RETL, Class A, 1-month LIBOR + 1.400%, 1.484%, 8/15/2036, 144A(d) | 145,180 | ||||||
| 992,138 | Citigroup Commercial Mortgage Trust, Series 2016-GC37, Class A4, 3.314%, 4/10/2049(a) | 1,069,858 | ||||||
| 540,000 | Citigroup Commercial Mortgage Trust, Series 2019-C7, Class A4, 3.102%, 12/15/2072 | 581,896 | ||||||
| 535,000 | Commercial Mortgage Pass Through Certificates, Series 2012-LTRT, Class A2, 3.400%, 10/05/2030, 144A(a) | 532,335 | ||||||
| 263,676 | Commercial Mortgage Pass Through Certificates, Series 2013-CR8, Class A5, 3.612%, 6/10/2046(b) | 274,939 | ||||||
| 24,122 | Commercial Mortgage Pass Through Certificates, Series 2014-CR14, Class A2, 3.147%, 2/10/2047 | 24,324 | ||||||
| 5,640 | Commercial Mortgage Pass Through Certificates, Series 2014-CR15, Class A2, 2.928%, 2/10/2047 | 5,581 | ||||||
| 93,487 | Commercial Mortgage Pass Through Certificates, Series 2014-CR16, Class ASB, 3.653%, 4/10/2047 | 96,474 | ||||||
| 280,000 | Commercial Mortgage Pass Through Certificates, Series 2014-UBS3, Class A4, 3.819%, 6/10/2047 | 300,060 | ||||||
| 280,000 | Commercial Mortgage Pass Through Certificates, Series 2015-DC1, Class A5, 3.350%, 2/10/2048 | 299,453 | ||||||
| 520,299 | Commercial Mortgage Pass Through Certificates, Series 2016-DC2, Class A5, 3.765%, 2/10/2049(a) | 568,708 | ||||||
| 640,000 | Credit Suisse Mortgage Trust, Series 2014-USA, Class A2, 3.953%, 9/15/2037, 144A(a) | 686,488 | ||||||
| 68,789 | CSAIL Commercial Mortgage Trust, Series 2015-C4, Class ASB, 3.617%, 11/15/2048 | 72,436 | ||||||
| 470,000 | CSAIL Commercial Mortgage Trust, Series 2019-C18, Class A4, 2.968%, 12/15/2052 | 495,972 | ||||||
| 605,000 | GS Mortgage Securities Corp. II, Series 2012-BWTR, Class A, 2.954%, 11/05/2034, 144A | 614,133 | ||||||
| 440,000 | GS Mortgage Securities Corp. Trust, Series 2013-PEMB, Class A, 3.668%, 3/05/2033, 144A(b) | 457,266 | ||||||
| 330,000 | GS Mortgage Securities Trust, Series 2014-GC18, Class A4, 4.074%, 1/10/2047 | 350,906 | ||||||
| 245,000 | GS Mortgage Securities Trust, Series 2020-GC45, Class A5, 2.911%, 2/13/2053 | 259,802 | ||||||
| 180,000 | Hudsons Bay Simon JV Trust, Series 2015-HB10, Class A10, 4.155%, 8/05/2034, 144A | 166,689 | ||||||
| 355,000 | Hudsons Bay Simon JV Trust, Series 2015-HB7, Class A7, 3.914%, 8/05/2034, 144A | 327,989 | ||||||
| 55,298 | JPMorgan Chase Commercial Mortgage Securities Trust, Series 2014-C19, Class ASB, 3.584%, 4/15/2047 | 57,132 | ||||||
| Non-Agency Commercial Mortgage-Backed Securities — continued |
| |||||||
| 575,000 | JPMorgan Chase Commercial Mortgage Securities Trust, Series 2019-COR5, Class A4, 3.386%, 6/13/2052(a) | 626,165 | ||||||
| 240,000 | Morgan Stanley Bank of America Merrill Lynch Trust, Series 2013-C10, Class A4, 4.216%, 7/15/2046(b) | 251,451 | ||||||
| 129,604 | Morgan Stanley Bank of America Merrill Lynch Trust, Series 2015-C22, Class A4, 3.306%, 4/15/2048 | 138,269 | ||||||
| 550,000 | Morgan Stanley Capital I Trust, Series 2020-L4, Class A3, 2.698%, 2/15/2053 | 574,017 | ||||||
| 211,070 | UBS-Barclays Commercial Mortgage Trust, Series 2012-TFT, Class A, 2.892%, 6/05/2030, 144A(a) | 211,257 | ||||||
| 565,000 | UBS-Barclays Commercial Mortgage Trust, Series 2013-C6, Class A4, 3.244%, 4/10/2046(a) | 582,357 | ||||||
| 201,109 | Wells Fargo Commercial Mortgage Trust, Series 2016-C33, Class A4, 3.426%, 3/15/2059 | 217,957 | ||||||
| 340,655 | Wells Fargo Commercial Mortgage Trust, Series 2017-RC1, Class A2, 3.118%, 1/15/2060(a) | 343,066 | ||||||
| 490,000 | Wells Fargo Commercial Mortgage Trust, Series 2020-C58, Class A4, 2.092%, 7/15/2053 | 488,694 | ||||||
| 127,432 | WFRBS Commercial Mortgage Trust, Series 2014-C19, Class A3, 3.660%, 3/15/2047 | 127,655 | ||||||
| 325,000 | WFRBS Commercial Mortgage Trust, Series 2014-C19, Class A5, 4.101%, 3/15/2047 | 349,149 | ||||||
| 179,836 | WFRBS Commercial Mortgage Trust, Series 2014-C20, Class ASB, 3.638%, 5/15/2047(a) | 186,546 | ||||||
|
| |||||||
| 14,318,889 | ||||||||
|
| |||||||
| Oil Field Services — 0.3% | ||||||||
| 850,000 | Baker Hughes a GE Co. LLC/Baker Hughes Co-Obligor, Inc., 2.773%, 12/15/2022 | 873,259 | ||||||
| 190,000 | Helmerich & Payne, Inc., 2.900%, 9/29/2031, 144A | 190,549 | ||||||
|
| |||||||
| 1,063,808 | ||||||||
|
| |||||||
| Pharmaceuticals — 0.7% | ||||||||
| 335,000 | AbbVie, Inc., 2.600%, 11/21/2024 | 352,162 | ||||||
| 1,275,000 | Amgen, Inc., 2.000%, 1/15/2032 | 1,226,133 | ||||||
| 235,000 | Bayer U.S. Finance II LLC, 3.375%, 7/15/2024, 144A | 248,443 | ||||||
| 265,000 | Pfizer, Inc., 1.750%, 8/18/2031 | 258,983 | ||||||
| 525,000 | Pfizer, Inc., 3.200%, 9/15/2023 | 552,175 | ||||||
|
| |||||||
| 2,637,896 | ||||||||
|
| |||||||
| Property & Casualty Insurance — 0.7% | ||||||||
| 645,000 | American Financial Group, Inc., 3.500%, 8/15/2026 | 703,897 | ||||||
| 180,000 | Assurant, Inc., 4.200%, 9/27/2023 | 191,643 | ||||||
| 450,000 | Enstar Group Ltd., 3.100%, 9/01/2031 | 442,738 | ||||||
| 940,000 | Everest Reinsurance Holdings, Inc., 3.125%, 10/15/2052 | 916,381 | ||||||
| 580,000 | Hartford Financial Services Group, Inc. (The), 2.900%, 9/15/2051 | 559,415 | ||||||
|
| |||||||
| 2,814,074 | ||||||||
|
| |||||||
| Railroads — 0.1% | ||||||||
| 215,000 | Union Pacific Corp., 3.646%, 2/15/2024 | 228,465 | ||||||
|
| |||||||
| REITs – Apartments — 0.1% | ||||||||
| 225,000 | Invitation Homes Operating Partnership LP, 2.000%, 8/15/2031 | 216,084 | ||||||
|
| |||||||
| REITs – Diversified — 0.1% | ||||||||
| 295,000 | Lexington Realty Trust, 2.375%, 10/01/2031 | 286,032 | ||||||
|
| |||||||
| REITs – Health Care — 0.2% | ||||||||
| 235,000 | Omega Healthcare Investors, Inc., 4.500%, 1/15/2025 | 256,187 | ||||||
See accompanying notes to financial statements.
67 |
Portfolio of Investments – as of September 30, 2021
Loomis Sayles Intermediate Duration Bond Fund – (continued)
| Principal Amount | Description | Value (†) | ||||||
| REITs – Health Care — continued | ||||||||
| $ | 450,000 | Ventas Realty LP, 2.500%, 9/01/2031 | $ | 444,210 | ||||
|
| |||||||
| 700,397 | ||||||||
|
| |||||||
| REITs – Office Property — 0.7% | ||||||||
| 790,000 | Kilroy Realty LP, 2.650%, 11/15/2033 | 779,101 | ||||||
| 300,000 | Office Properties Income Trust, 2.400%, 2/01/2027 | 296,455 | ||||||
| 950,000 | Office Properties Income Trust, 3.450%, 10/15/2031 | 929,316 | ||||||
| 340,000 | Office Properties Income Trust, 4.500%, 2/01/2025 | 364,449 | ||||||
| 195,000 | Piedmont Operating Partnership LP, 3.150%, 8/15/2030 | 200,423 | ||||||
|
| |||||||
| 2,569,744 | ||||||||
|
| |||||||
| REITs – Regional Malls — 0.3% | ||||||||
| 310,000 | Simon Property Group LP, 1.750%, 2/01/2028 | 307,674 | ||||||
| 895,000 | Simon Property Group LP, 2.250%, 1/15/2032 | 875,004 | ||||||
|
| |||||||
| 1,182,678 | ||||||||
|
| |||||||
| REITs – Single Tenant — 0.1% | ||||||||
| 530,000 | National Retail Properties, Inc., 3.000%, 4/15/2052 | 501,621 | ||||||
|
| |||||||
| REITs – Storage — 0.1% | ||||||||
| 570,000 | Life Storage LP, 2.400%, 10/15/2031 | 564,471 | ||||||
|
| |||||||
| REITs – Warehouse/Industrials — 0.1% | ||||||||
| 210,000 | Rexford Industrial Realty LP, 2.150%, 9/01/2031 | 202,379 | ||||||
|
| |||||||
| Restaurants — 0.4% | ||||||||
| 1,280,000 | McDonald’s Corp., MTN, 2.625%, 1/15/2022 | 1,288,866 | ||||||
| 420,000 | McDonald’s Corp., MTN, 3.350%, 4/01/2023 | 437,460 | ||||||
|
| |||||||
| 1,726,326 | ||||||||
|
| |||||||
| Retailers — 0.8% | ||||||||
| 345,000 | AutoNation, Inc., 3.500%, 11/15/2024 | 369,841 | ||||||
| 290,000 | AutoNation, Inc., 4.500%, 10/01/2025 | 321,469 | ||||||
| 995,000 | Home Depot, Inc. (The), 1.500%, 9/15/2028 | 984,211 | ||||||
| 545,000 | Lowe’s Cos, Inc., 1.700%, 9/15/2028 | 540,231 | ||||||
| 1,010,000 | Walmart, Inc., 1.800%, 9/22/2031 | 1,001,324 | ||||||
|
| |||||||
| 3,217,076 | ||||||||
|
| |||||||
| Technology — 2.6% | ||||||||
| 280,000 | Avnet, Inc., 3.000%, 5/15/2031 | 280,871 | ||||||
| 985,000 | CGI, Inc., 1.450%, 9/14/2026, 144A | 974,973 | ||||||
| 1,775,000 | DXC Technology Co., 1.800%, 9/15/2026 | 1,772,701 | ||||||
| 575,000 | Equifax, Inc., 2.350%, 9/15/2031 | 566,052 | ||||||
| 165,000 | Flex Ltd., 4.875%, 6/15/2029 | 189,833 | ||||||
| 450,000 | Genpact Luxembourg S.a.r.l., 3.700%, 4/01/2022 | 455,935 | ||||||
| 485,000 | Hewlett Packard Enterprise Co., 4.650%, 10/01/2024 | 535,779 | ||||||
| 490,000 | HP, Inc., 1.450%, 6/17/2026, 144A | 487,372 | ||||||
| 315,000 | Infor, Inc., 1.450%, 7/15/2023, 144A | 318,315 | ||||||
| 530,000 | International Business Machines Corp., 2.850%, 5/13/2022 | 538,650 | ||||||
| 175,000 | Marvell Technology, Inc., 4.200%, 6/22/2023, 144A | 184,790 | ||||||
| 285,000 | Microchip Technology, Inc., 0.972%, 2/15/2024, 144A | 285,179 | ||||||
| 460,000 | Microchip Technology, Inc., 2.670%, 9/01/2023 | 476,925 | ||||||
| 755,000 | Micron Technology, Inc., 2.497%, 4/24/2023 | 777,106 | ||||||
| 565,000 | Panasonic Corp., 2.536%, 7/19/2022, 144A | 573,259 | ||||||
| 925,000 | PayPal Holdings, Inc., 1.350%, 6/01/2023 | 940,376 | ||||||
| 275,000 | SYNNEX Corp., 1.750%, 8/09/2026, 144A | 272,056 | ||||||
| 265,000 | Western Union Co. (The), 1.350%, 3/15/2026 | 261,393 | ||||||
| 165,000 | Western Union Co. (The), 4.250%, 6/09/2023 | 174,348 | ||||||
|
| |||||||
| 10,065,913 | ||||||||
|
| |||||||
| Tobacco — 0.4% | ||||||||
| 585,000 | Altria Group, Inc., 2.450%, 2/04/2032 | 560,565 | ||||||
| 1,025,000 | BAT Capital Corp., 4.700%, 4/02/2027 | 1,157,913 | ||||||
|
| |||||||
| 1,718,478 | ||||||||
|
| |||||||
| Transportation Services — 0.5% | ||||||||
| 450,000 | Element Fleet Management Corp., 3.850%, 6/15/2025, 144A | 484,531 | ||||||
| 175,000 | Penske Truck Leasing Co. LP/PTL Finance Corp., 4.000%, 7/15/2025, 144A | 191,255 | ||||||
| 695,000 | Penske Truck Leasing Co. LP/PTL Finance Corp., 4.125%, 8/01/2023, 144A | 736,548 | ||||||
| 255,000 | Ryder System, Inc., MTN, 3.750%, 6/09/2023 | 268,683 | ||||||
| 370,000 | Ryder System, Inc., MTN, 4.625%, 6/01/2025 | 414,391 | ||||||
|
| |||||||
| 2,095,408 | ||||||||
|
| |||||||
| Treasuries — 33.6% | ||||||||
| 10,860,000 | U.S. Treasury Note, 0.250%, 8/31/2025(a) | 10,638,134 | ||||||
| 3,855,000 | U.S. Treasury Note, 0.250%, 9/30/2025 | 3,772,328 | ||||||
| 24,385,000 | U.S. Treasury Note, 0.250%, 10/31/2025 | 23,825,860 | ||||||
| 7,010,000 | U.S. Treasury Note, 0.375%, 11/30/2025 | 6,876,098 | ||||||
| 23,985,000 | U.S. Treasury Note, 0.375%, 12/31/2025 | 23,501,552 | ||||||
| 14,355,000 | U.S. Treasury Note, 0.500%, 3/31/2025(a) | 14,275,375 | ||||||
| 7,525,000 | U.S. Treasury Note, 0.625%, 7/31/2026 | 7,404,482 | ||||||
| 3,580,000 | U.S. Treasury Note, 0.750%, 3/31/2026 | 3,554,688 | ||||||
| 4,705,000 | U.S. Treasury Note, 0.750%, 5/31/2026 | 4,665,485 | ||||||
| 9,505,000 | U.S. Treasury Note, 0.750%, 8/31/2026 | 9,403,267 | ||||||
| 2,305,000 | U.S. Treasury Note, 0.875%, 6/30/2026 | 2,296,897 | ||||||
| 2,890,000 | U.S. Treasury Note, 1.125%, 2/15/2031(a) | 2,799,236 | ||||||
| 9,760,000 | U.S. Treasury Note, 1.250%, 8/15/2031 | 9,523,625 | ||||||
| 5,515,000 | U.S. Treasury Note, 1.625%, 5/15/2031 | 5,579,629 | ||||||
|
| |||||||
| 128,116,656 | ||||||||
|
| |||||||
| Wireless — 0.1% | ||||||||
| 200,000 | SK Telecom Co. Ltd., 3.750%, 4/16/2023, 144A | 209,322 | ||||||
|
| |||||||
| Wirelines — 0.2% | ||||||||
| 205,000 | British Telecommunications PLC, 4.500%, 12/04/2023 | 221,300 | ||||||
| 710,000 | Verizon Communications, Inc., 2.100%, 3/22/2028 | 720,714 | ||||||
|
| |||||||
| 942,014 | ||||||||
|
| |||||||
| Total Bonds and Notes (Identified Cost $363,617,256) | 364,986,887 | |||||||
|
| |||||||
| Short-Term Investments — 5.8% | ||||||||
| 8,541,562 | Tri-Party Repurchase Agreement with Fixed Income Clearing Corporation, dated 9/30/2021 at 0.000% to be repurchased at $8,541,562 on 10/01/2021 collateralized by $8,757,600 U.S. Treasury Note, 1.250% due 9/30/2028 valued at $8,712,446 including accrued interest (Note 2 of Notes to Financial Statements) | 8,541,562 | ||||||
| 13,320,000 | U.S. Treasury Bills, 0.010%-0.032%, 12/02/2021(g)(h) | 13,319,155 | ||||||
|
| |||||||
| Total Short-Term Investments (Identified Cost $21,861,038) | 21,860,717 | |||||||
|
| |||||||
| Total Investments — 101.4% (Identified Cost $385,478,294) | 386,847,604 | |||||||
| Other assets less liabilities — (1.4)% | (5,171,122 | ) | ||||||
|
| |||||||
| Net Assets — 100.0% | $ | 381,676,482 | ||||||
|
| |||||||
| (†) | See Note 2 of Notes to Financial Statements. |
| ||||||
| (a) | Security (or a portion thereof) has been designated to cover the Fund’s obligations under open derivative contracts. |
| ||||||
See accompanying notes to financial statements.
| 68
Portfolio of Investments – as of September 30, 2021
Loomis Sayles Intermediate Duration Bond Fund – (continued)
| (b) | Variable rate security. The interest rate adjusts periodically based on; (i) changes in current interest rates and/or prepayments on underlying pools of assets, if applicable, (ii) reference to a base lending rate plus or minus a margin, and/or (iii) reference to a base lending rate adjusted by a multiplier and/or subject to certain floors or caps. Rate as of September 30, 2021 is disclosed. |
| ||||||
| (c) | Level 3 security. Value has been determined using significant unobservable inputs. See Note 3 of Notes to Financial Statements. |
| ||||||
| (d) | Variable rate security. Rate as of September 30, 2021 is disclosed. |
| ||||||
| (e) | Fair valued by the Fund’s adviser. At September 30, 2021, the value of this security amounted to $531 or less than 0.1% of net assets. See Note 2 of Notes to Financial Statements. |
| ||||||
| (f) | The Fund’s investment in mortgage related securities of Government National Mortgage Association are interests in separate pools of mortgages. All separate investments in securities of each issuer which have the same coupon rate have been aggregated for the purpose of presentation in the Portfolio of Investments. |
| ||||||
| (g) | Interest rate represents discount rate at time of purchase; not a coupon rate. |
| ||||||
| (h) | The Fund’s investment in U.S. Government/Agency securities is comprised of various lots with differing discount rates. These separate investments, which have the same maturity date, have been aggregated for the purpose of presentation in the Portfolio of Investments. |
| ||||||
| 144A | All or a portion of these securities are exempt from registration under Rule 144A of the Securities Act of 1933. These securities may be resold in transactions exempt from registration, normally to qualified institutional buyers. At September 30, 2021, the value of Rule 144A holdings amounted to $95,288,973 or 25.0% of net assets. |
| ||||||
| ABS | Asset-Backed Securities |
| ||||||
| ARMs | Adjustable Rate Mortgages |
| ||||||
| CMT | Constant Maturity Treasury |
| ||||||
| FHLMC | Federal Home Loan Mortgage Corp. |
| ||||||
| GMTN | Global Medium Term Note |
| ||||||
| GNMA | Government National Mortgage Association |
| ||||||
| LIBOR | London Interbank Offered Rate |
| ||||||
| MTN | Medium Term Note |
| ||||||
| REITs | Real Estate Investment Trusts |
| ||||||
At September 30, 2021, open long futures contracts were as follows:
| Financial Futures | Expiration Date | Contracts | Notional Amount | Value | Unrealized Appreciation (Depreciation) | |||||||||||||||
5 Year U.S. Treasury Note | 12/31/2021 | 174 | $ | 21,476,669 | $ | 21,357,141 | $ | (119,528 | ) | |||||||||||
|
| |||||||||||||||||||
At September 30, 2021, open short futures contracts were as follows:
| Financial Futures | Expiration Date | Contracts | Notional Amount | Value | Unrealized Appreciation (Depreciation) | |||||||||||||||
Ultra 10 Year U.S. Treasury Note | 12/21/2021 | 20 | $ | 2,949,647 | $ | 2,905,000 | $ | 44,647 | ||||||||||||
Ultra Long U.S. Treasury Bond | 12/21/2021 | 10 | 1,988,729 | 1,910,625 | 78,104 | |||||||||||||||
|
| |||||||||||||||||||
Total |
| $ | 122,751 | |||||||||||||||||
|
| |||||||||||||||||||
Industry Summary at September 30, 2021
Treasuries | 33.6 | % | ||
Banking | 16.8 | |||
ABS Car Loan | 7.6 | |||
Life Insurance | 4.4 | |||
Non-Agency Commercial Mortgage-Backed Securities | 3.7 | |||
Electric | 3.5 | |||
Technology | 2.6 | |||
Automotive | 2.5 | |||
Other Investments, less than 2% each | 20.9 | |||
Short-Term Investments | 5.8 | |||
|
| |||
Total Investments | 101.4 | |||
Other assets less liabilities (including futures contracts) | (1.4 | ) | ||
|
| |||
Net Assets | 100.0 | % | ||
|
|
See accompanying notes to financial statements.
69 |
Portfolio of Investments – as of September 30, 2021
Loomis Sayles Limited Term Government and Agency Fund
| Principal Amount | Description | Value (†) | ||||||
| Bonds and Notes — 95.9% of Net Assets | ||||||||
| ABS Car Loan — 2.9% |
| |||||||
| $ | 395,000 | AmeriCredit Automobile Receivables Trust, Series 2020-2, Class A3, 0.660%, 12/18/2024 | $ | 396,399 | ||||
| 840,000 | Avis Budget Rental Car Funding AESOP LLC, Series 2019-1A, Class A, 3.450%, 3/20/2023, 144A | 846,644 | ||||||
| 1,637,300 | CarMax Auto Owner Trust, Series 2020-2, Class A3, 1.700%, 11/15/2024 | 1,652,291 | ||||||
| 1,865,000 | Carvana Auto Receivables Trust, Series 2021-N2, Class A2, 0.970%, 3/10/2028 | 1,868,577 | ||||||
| 1,955,000 | Credit Acceptance Auto Loan Trust, Series 2019-3A, Class A, 2.380%, 11/15/2028, 144A | 1,982,701 | ||||||
| 9,695,000 | Credit Acceptance Auto Loan Trust, Series 2020-3A, Class A, 1.240%, 10/15/2029, 144A | 9,779,951 | ||||||
| 257,290 | Flagship Credit Auto Trust, Series 2020-2, Class A, 1.490%, 7/15/2024, 144A | 258,028 | ||||||
| 481,028 | Flagship Credit Auto Trust, Series 2020-3, Class A, 0.700%, 4/15/2025, 144A | 481,995 | ||||||
| 569,538 | Ford Credit Auto Owner Trust, Series 2020-A, Class A3, 1.040%, 8/15/2024 | 572,638 | ||||||
| 475,000 | GM Financial Automobile Leasing Trust, Series 2020-2, Class A3, 0.800%, 7/20/2023 | 476,960 | ||||||
| 823,238 | GM Financial Consumer Automobile Receivables Trust, Series 2019-3, Class A3, 2.180%, 4/16/2024 | 831,009 | ||||||
| 666,084 | GM Financial Consumer Automobile Receivables Trust, Series 2019-4, Class A3, 1.750%, 7/16/2024 | 671,716 | ||||||
| 941,509 | GM Financial Consumer Automobile Receivables Trust, Series 2020-1, Class A3, 1.840%, 9/16/2024 | 951,550 | ||||||
| 500,000 | GM Financial Consumer Automobile Receivables Trust, Series 2020-2, Class A3, 1.490%, 12/16/2024 | 504,509 | ||||||
| 655,000 | GM Financial Revolving Receivables Trust, Series 2021-1, Class A, 1.170%, 6/12/2034, 144A | 650,993 | ||||||
| 97,042 | Honda Auto Receivables Owner Trust, Series 2019-2, Class A3, 2.520%, 6/21/2023 | 98,025 | ||||||
| 410,000 | Honda Auto Receivables Owner Trust, Series 2020-1, Class A3, 1.610%, 4/22/2024 | 414,315 | ||||||
| 585,000 | Hyundai Auto Receivables Trust, Series 2020-A, Class A3, 1.410%, 11/15/2024 | 591,573 | ||||||
| 1,805,000 | Nissan Auto Receivables Owner Trust, Series 2020-A, Class A3, 1.380%, 12/16/2024 | 1,821,462 | ||||||
| 1,009,202 | Santander Consumer Auto Receivables Trust, Series 2020-AA, Class A, 1.370%, 10/15/2024, 144A | 1,013,742 | ||||||
| 326,582 | Santander Drive Auto Receivables Trust, Series 2020-2, Class A3, 0.670%, 4/15/2024 | 326,732 | ||||||
| 765,000 | Toyota Auto Loan Extended Note Trust, Series 2020-1A, Class A, 1.350%, 5/25/2033, 144A | 775,588 | ||||||
| 521,996 | Toyota Auto Receivables Owner Trust, Series 2019-A, Class A3, 2.910%, 7/17/2023 | 527,265 | ||||||
| 450,000 | Toyota Auto Receivables Owner Trust, Series 2020-A, Class A3, 1.660%, 5/15/2024 | 454,343 | ||||||
| 670,000 | Toyota Auto Receivables Owner Trust, Series 2020-B, Class A3, 1.360%, 8/15/2024 | 676,061 | ||||||
| 1,097,877 | Westlake Automobile Receivables Trust, Series 2020-2A, Class A2A, 0.930%, 2/15/2024, 144A | 1,100,060 | ||||||
| 382,994 | World Omni Auto Receivables Trust, Series 2019-B, Class A3, 2.590%, 7/15/2024 | 386,298 | ||||||
|
| |||||||
| 30,111,425 | ||||||||
|
| |||||||
| ABS Other — 0.8% |
| |||||||
| 841,228 | Chesapeake Funding II LLC, Series 2020-1A, Class A1, 0.870%, 8/16/2032, 144A | 845,340 | ||||||
| ABS Other — continued |
| |||||||
| 430,000 | CNH Equipment Trust, Series 2020-A, Class A3, 1.160%, 6/16/2025 | 433,716 | ||||||
| 334,367 | Diamond Resorts Owner Trust, Series 2018-1, Class A, 3.700%, 1/21/2031, 144A | 346,225 | ||||||
| 2,250,000 | Donlen Fleet Lease Funding 2 LLC, Series 2021-2, Class A2, 0.560%, 12/11/2034, 144A | 2,252,591 | ||||||
| 805,000 | Kubota Credit Owner Trust, Series 2020-1A, Class A3, 1.960%, 3/15/2024, 144A | 817,463 | ||||||
| 672,567 | MVW LLC, Series 2020-1A, Class A, 1.740%, 10/20/2037, 144A | 679,639 | ||||||
| 1,124,863 | Sierra Timeshare Receivables Funding LLC, Series 2020-2A, Class A, 1.330%, 7/20/2037, 144A | 1,131,304 | ||||||
| 1,288,720 | Welk Resorts LLC, Series 2019-AA, Class A, 2.800%, 6/15/2038, 144A | 1,336,148 | ||||||
|
| |||||||
| 7,842,426 | ||||||||
|
| |||||||
| ABS Student Loan — 1.2% |
| |||||||
| 2,684,981 | Navient Private Education Refi Loan Trust, Series 2019-FA, Class A2, 2.600%, 8/15/2068, 144A | 2,738,184 | ||||||
| 827,946 | Navient Private Education Refi Loan Trust, Series 2020-DA, Class A, 1.690%, 5/15/2069, 144A | 836,001 | ||||||
| 2,391,928 | Navient Private Education Refi Loan Trust, Series 2021-CA, Class A, 1.060%, 10/15/2069, 144A | 2,395,216 | ||||||
| 5,196,554 | Navient Private Education Refi Loan Trust, Series 2021-EA, Class A, 0.970%, 12/16/2069, 144A | 5,171,393 | ||||||
| 1,450,000 | SMB Private Education Loan Trust, Series 2021-D, Class A1A, 1.340%, 3/17/2053, 144A | 1,449,494 | ||||||
| 32,501 | SoFi Professional Loan Program LLC, Series 2016-D, Class A1, 1-month LIBOR + 0.950%, 1.036%, 1/25/2039, 144A(a) | 32,658 | ||||||
|
| |||||||
| 12,622,946 | ||||||||
|
| |||||||
| Agency Commercial Mortgage-Backed Securities — 30.2% |
| |||||||
| 4,135,000 | Federal Home Loan Mortgage Corp., Series Q016, Class APT1, 1.242%, 5/25/2051(b) | 4,155,530 | ||||||
| 4,916,140 | Federal National Mortgage Association, Series 2014-M2, Class A2, 3.513%, 12/25/2023(b) | 5,190,476 | ||||||
| 691,477 | Federal National Mortgage Association, Series 2015-M17, Class FA, 1-month LIBOR + 0.930%, 1.017%, 11/25/2022(a) | 691,973 | ||||||
| 143,383 | Federal National Mortgage Association, Series 2016-M3, Class ASQ2, 2.263%, 2/25/2023 | 143,876 | ||||||
| 4,321,109 | Federal National Mortgage Association, Series 2020-M5, Class FA, 1-month LIBOR + 0.460%, 0.546%, 1/25/2027(a) | 4,372,975 | ||||||
| 7,596,590 | FHLMC Multifamily Structured Pass Through Certificates, Series KF74, Class AS, 1-month Average Compounded SOFR + 0.530%, 0.580%, 1/25/2027(a) | 7,643,014 | ||||||
| 13,208,657 | FHLMC Multifamily Structured Pass Through Certificates, Series KF77, Class AL, 1-month LIBOR + 0.700%, 0.783%, 2/25/2027(a) | 13,336,365 | ||||||
| 17,372,769 | FHLMC Multifamily Structured Pass Through Certificates, Series KF77, Class AS, 30-day Average SOFR + 0.900%, 0.950%, 2/25/2027(a) | 17,235,976 | ||||||
| 31,041,037 | FHLMC Multifamily Structured Pass Through Certificates, Series KF78, Class AL, 1-month LIBOR + 0.800%, 0.883%, 3/25/2030(a) | 31,092,472 | ||||||
| 31,041,037 | FHLMC Multifamily Structured Pass Through Certificates, Series KF78, Class AS, 30-day Average SOFR + 1.000%, 1.050%, 3/25/2030(a) | 31,385,443 | ||||||
See accompanying notes to financial statements.
| 70
Portfolio of Investments – as of September 30, 2021
Loomis Sayles Limited Term Government and Agency Fund – (continued)
| Principal Amount | Description | Value (†) | ||||||
| Agency Commercial Mortgage-Backed Securities — continued |
| |||||||
| $ | 8,515,000 | FHLMC Multifamily Structured Pass Through Certificates, Series KS12, Class A, 1-month LIBOR + 0.650%, 0.733%, 8/25/2029(a) | $ | 8,527,440 | ||||
| 12,857,120 | FHLMC Multifamily Structured Pass Through Certificates, Series KJ20, Class A2, 3.799%, 12/25/2025 | 13,924,828 | ||||||
| 5,974,381 | FHLMC Multifamily Structured Pass Through Certificates, Series K-F100, Class AS, 30-day Average SOFR + 0.180%, 0.230%, 1/25/2028(a) | 5,979,605 | ||||||
| 2,611,351 | FHLMC Multifamily Structured Pass Through Certificates, Series K017, Class A2, 2.873%, 12/25/2021 | 2,614,654 | ||||||
| 7,900,000 | FHLMC Multifamily Structured Pass Through Certificates, Series K034, Class A2, 3.531%, 7/25/2023(b) | 8,290,734 | ||||||
| 7,835,000 | FHLMC Multifamily Structured Pass Through Certificates, Series K035, Class A2, 3.458%, 8/25/2023(b) | 8,234,073 | ||||||
| 7,500,000 | FHLMC Multifamily Structured Pass Through Certificates, Series K038, Class A2, 3.389%, 3/25/2024 | 7,971,578 | ||||||
| 2,580,000 | FHLMC Multifamily Structured Pass Through Certificates, Series K064, Class A2, 3.224%, 3/25/2027 | 2,834,797 | ||||||
| 1,115,359 | FHLMC Multifamily Structured Pass Through Certificates, Series K725, Class A1, 2.666%, 5/25/2023 | 1,127,040 | ||||||
| 8,000,000 | FHLMC Multifamily Structured Pass Through Certificates, Series KC06, Class A2, 2.541%, 8/25/2026 | 8,282,265 | ||||||
| 46,362 | FHLMC Multifamily Structured Pass Through Certificates, Series KF06, Class A, 1-month LIBOR + 0.330%, 0.413%, 11/25/2021(a) | 46,366 | ||||||
| 424,061 | FHLMC Multifamily Structured Pass Through Certificates, Series KF14, Class A, 1-month LIBOR + 0.650%, 0.733%, 1/25/2023(a) | 424,419 | ||||||
| 2,336,955 | FHLMC Multifamily Structured Pass Through Certificates, Series KF53, Class A, 1-month LIBOR + 0.390%, 0.473%, 10/25/2025(a) | 2,344,529 | ||||||
| 10,264,896 | FHLMC Multifamily Structured Pass Through Certificates, Series KF72, Class A, 1-month LIBOR + 0.500%, 0.583%, 10/25/2026(a) | 10,333,289 | ||||||
| 4,722,478 | FHLMC Multifamily Structured Pass Through Certificates, Series KF79, Class AL, 1-month LIBOR + 0.470%, 0.553%, 5/25/2030(a) | 4,744,731 | ||||||
| 4,357,714 | FHLMC Multifamily Structured Pass Through Certificates, Series KF79, Class AS, 30-day Average SOFR + 0.580%, 0.630%, 5/25/2030(a) | 4,385,659 | ||||||
| 8,424,411 | FHLMC Multifamily Structured Pass Through Certificates, Series KF80, Class AL, 1-month LIBOR + 0.440%, 0.523%, 6/25/2030(a) | 8,464,765 | ||||||
| 4,733,352 | FHLMC Multifamily Structured Pass Through Certificates, Series KF80, Class AS, 30-day Average SOFR + 0.510%, 0.560%, 6/25/2030(a) | 4,760,834 | ||||||
| 2,976,053 | FHLMC Multifamily Structured Pass Through Certificates, Series KF81, Class AL, 1-month LIBOR + 0.360%, 0.443%, 6/25/2027(a) | 2,994,805 | ||||||
| 2,232,039 | FHLMC Multifamily Structured Pass Through Certificates, Series KF81, Class AS, 30-day Average SOFR + 0.400%, 0.450%, 6/25/2027(a) | 2,239,084 | ||||||
| 1,650,698 | FHLMC Multifamily Structured Pass Through Certificates, Series KF84, Class AL, 1-month LIBOR + 0.300%, 0.383%, 7/25/2030(a) | 1,652,472 | ||||||
| Agency Commercial Mortgage-Backed Securities — continued |
| |||||||
| 1,388,682 | FHLMC Multifamily Structured Pass Through Certificates, Series KF84, Class AS, 30-day Average SOFR + 0.320%, 0.370%, 7/25/2030(a) | 1,393,358 | ||||||
| 1,669,306 | FHLMC Multifamily Structured Pass Through Certificates, Series KF85, Class AL, 1-month LIBOR + 0.300%, 0.383%, 8/25/2030(a) | 1,672,014 | ||||||
| 4,449,984 | FHLMC Multifamily Structured Pass Through Certificates, Series KF85, Class AS, 30-day Average SOFR + 0.330%, 0.380%, 8/25/2030(a) | 4,464,869 | ||||||
| 1,874,634 | FHLMC Multifamily Structured Pass Through Certificates, Series KF86, Class AL, 1-month LIBOR + 0.290%, 0.373%, 8/25/2027(a) | 1,876,917 | ||||||
| 1,673,994 | FHLMC Multifamily Structured Pass Through Certificates, Series KF86, Class AS, 30-day Average SOFR + 0.320%, 0.370%, 8/25/2027(a) | 1,677,230 | ||||||
| 10,261,000 | FHLMC Multifamily Structured Pass Through Certificates, Series KJ21, Class A2, 3.700%, 9/25/2026 | 11,232,049 | ||||||
| 7,720,000 | FHLMC Multifamily Structured Pass Through Certificates, Series KJ26, Class A2, 2.606%, 7/25/2027 | 8,214,630 | ||||||
| 776,067 | FHLMC Multifamily Structured Pass Through Certificates, Series KJ28, Class A1, 1.766%, 2/25/2025 | 783,350 | ||||||
| 2,855,000 | FHLMC Multifamily Structured Pass Through Certificates, Series KS14, Class AL, 1-month LIBOR + 0.340%, 0.423%, 4/25/2030(a) | 2,856,742 | ||||||
| 3,140,000 | FHLMC Multifamily Structured Pass Through Certificates, Series KS14, Class AS, 30-day Average SOFR + 0.370%, 0.420%, 4/25/2030(a) | 3,167,051 | ||||||
| 2,176,597 | FHLMC Multifamily Structured Pass Through Certificates, Series Q008, Class A, 1-month LIBOR + 0.390%, 0.473%, 10/25/2045(a) | 2,182,150 | ||||||
| 5,200,000 | FNMA, 3.580%, 1/01/2026 | 5,682,246 | ||||||
| 20,600,000 | Freddie Mac Multifamily Structured Pass Through Certificates, Series K-107, Class AS, 30-day Average SOFR + 0.250%, 0.300%, 3/25/2028(a) | 20,581,893 | ||||||
| 9,395,000 | Freddie Mac Multifamily Structured Pass Through Certificates, Series K-F121, Class AS, 30-day Average SOFR + 0.180%, 0.230%, 8/25/2028(a) | 9,401,582 | ||||||
| 1,332,856 | Freddie Mac Multifamily Structured Pass Through Certificates, Series KF93, Class AL, 1-month LIBOR + 0.280%, 0.363%, 10/25/2027(a) | 1,335,155 | ||||||
| 1,600,290 | Freddie Mac Multifamily Structured Pass Through Certificates, Series KF93, Class AS, 30-day Average SOFR + 0.310%, 0.360%, 10/25/2027(a) | 1,603,496 | ||||||
| 5,185,000 | Freddie Mac Multifamily Structured Pass Through Certificates, Series KF97, Class AS, 30-day Average SOFR + 0.250%, 0.300%, 12/25/2030(a) | 5,204,167 | ||||||
| 3,190,780 | Freddie Mac Multifamily Structured Pass Through Certificates, Series Q015, Class A, 30-day Average SOFR + 0.200%, 0.250%, 8/25/2024(a) | 3,190,780 | ||||||
| 107,069 | Government National Mortgage Association, Series 2003-72, Class Z, 5.297%, 11/16/2045(b) | 116,486 | ||||||
|
| |||||||
| 312,062,232 | ||||||||
|
| |||||||
| Collateralized Mortgage Obligations — 14.0% |
| |||||||
| 8,857 | Federal Home Loan Mortgage Corp., REMIC, Series 1500, Class FD, 7-year CMT – 0.200%, 0.810%, 5/15/2023(a)(c)(d) | 8,712 | ||||||
See accompanying notes to financial statements.
71 |
Portfolio of Investments – as of September 30, 2021
Loomis Sayles Limited Term Government and Agency Fund – (continued)
| Principal Amount | Description | Value (†) | ||||||
| Collateralized Mortgage Obligations — continued |
| |||||||
| $ | 7,980 | Federal Home Loan Mortgage Corp., REMIC, Series 1552, Class I, 10-year CMT – 0.650%, 0.610%, 8/15/2023(a)(c)(d) | $ | 7,817 | ||||
| 74,779 | Federal Home Loan Mortgage Corp., REMIC, Series 2131, Class ZB, 6.000%, 3/15/2029(c)(d) | 82,149 | ||||||
| 579,443 | Federal Home Loan Mortgage Corp., REMIC, Series 2978, Class JG, 5.500%, 5/15/2035(c)(d) | 653,019 | ||||||
| 795,586 | Federal Home Loan Mortgage Corp., REMIC, Series 3036, Class NE, 5.000%, 9/15/2035 | 901,900 | ||||||
| 345,677 | Federal Home Loan Mortgage Corp., REMIC, Series 3412, Class AY, 5.500%, 2/15/2038(c)(d) | 361,866 | ||||||
| 781,009 | Federal Home Loan Mortgage Corp., REMIC, Series 3561, Class W, IO, 2.704%, 6/15/2048(b)(e) | 833,716 | ||||||
| 761,832 | Federal Home Loan Mortgage Corp., REMIC, Series 3620, Class AT, IO, 3.840%, 12/15/2036(b)(e) | 808,478 | ||||||
| 159,486 | Federal Home Loan Mortgage Corp., REMIC, Series 4212, Class FW, 2.184%, 6/15/2043(b)(c)(d) | 168,680 | ||||||
| 732,288 | Federal National Mortgage Association, REMIC, Series 2003-48, Class GH, 5.500%, 6/25/2033(c)(d) | 833,039 | ||||||
| 2,234,738 | Federal National Mortgage Association, REMIC, Series 2012-58, Class KF, 1-month LIBOR + 0.550%, 0.636%, 6/25/2042(a) | 2,266,740 | ||||||
| 4,019,379 | Federal National Mortgage Association, REMIC, Series 2012-83, Class LF, 1-month LIBOR + 0.510%, 0.596%, 8/25/2042(a) | 4,073,854 | ||||||
| 3,408 | Federal National Mortgage Association, REMIC, Series 1992-162, Class FB, 7-year CMT – 0.050%, 1.070%, 9/25/2022(a)(c)(d) | 3,367 | ||||||
| 10,307 | Federal National Mortgage Association, REMIC, Series 1994-42, Class FD, 10-year CMT – 0.500%, 0.810%, 4/25/2024(a)(c)(d) | 10,073 | ||||||
| 6,258 | Federal National Mortgage Association, REMIC, Series 2002-W10, Class A7, 4.113%, 8/25/2042(b)(c)(d) | 6,694 | ||||||
| 137,271 | Federal National Mortgage Association, REMIC, Series 2005-100, Class BQ, 5.500%, 11/25/2025(c)(d) | 141,683 | ||||||
| 407,424 | Federal National Mortgage Association, REMIC, Series 2007-73, Class A1, 1-month LIBOR + 0.060%, 0.136%, 7/25/2037(a)(c)(d) | 398,387 | ||||||
| 747,424 | Federal National Mortgage Association, REMIC, Series 2008-86, Class LA, 3.492%, 8/25/2038(b) | 780,586 | ||||||
| 1,577,388 | Federal National Mortgage Association, REMIC, Series 2012-56, Class FK, 1-month LIBOR + 0.450%, 0.536%, 6/25/2042(a) | 1,593,455 | ||||||
| 2,470,552 | Federal National Mortgage Association, REMIC, Series 2013-67, Class NF, 1-month LIBOR + 1.000%, 1.086%, 7/25/2043(a) | 2,412,504 | ||||||
| 4,557,268 | Federal National Mortgage Association, REMIC, Series 2015-4, Class BF, 1-month LIBOR + 0.400%, 0.486%, 2/25/2045(a) | 4,587,593 | ||||||
| 7,638,820 | Federal National Mortgage Association, REMIC, Series 2020-35, Class FA, 1-month LIBOR + 0.500%, 0.596%, 6/25/2050(a) | 7,687,556 | ||||||
| 6,034 | FHLMC Structured Pass Through Securities, Series T-60, Class 2A1, 3.553%, 3/25/2044(b)(c)(d) | 6,968 | ||||||
| 339,417 | FHLMC Structured Pass Through Securities, Series T-62, Class 1A1, 12-month MTA + 1.200%, 1.292%, 10/25/2044(a)(c)(d) | 346,359 | ||||||
| 2,976,046 | Government National Mortgage Association, Series 2017-H05, Class FC, 1-month LIBOR + 0.750%, 0.840%, 2/20/2067(a) | 3,013,418 | ||||||
| Collateralized Mortgage Obligations — continued |
| |||||||
| 3,131,419 | Government National Mortgage Association, Series 2019-H13, Class FT, 1-year CMT + 0.450%, 0.520%, 8/20/2069(a) | 3,128,948 | ||||||
| 4,680,903 | Government National Mortgage Association, Series 2020-H02, Class FG, 1-month LIBOR + 0.600%, 0.690%, 1/20/2070(a) | 4,729,809 | ||||||
| 1,266,291 | Government National Mortgage Association, Series 2005-18, Class F, 1-month LIBOR + 0.200%, 0.287%, 2/20/2035(a) | 1,265,500 | ||||||
| 950,332 | Government National Mortgage Association, Series 2007-59, Class FM, 1-month LIBOR + 0.520%, 0.607%, 10/20/2037(a)(c)(d) | 951,185 | ||||||
| 357,360 | Government National Mortgage Association, Series 2009-H01, Class FA, 1-month LIBOR + 1.150%, 1.237%, 11/20/2059(a)(c)(d) | 358,459 | ||||||
| 873,073 | Government National Mortgage Association, Series 2010-H20, Class AF, 1-month LIBOR + 0.330%, 0.420%, 10/20/2060(a) | 873,139 | ||||||
| 736,309 | Government National Mortgage Association, Series 2010-H24, Class FA, 1-month LIBOR + 0.350%, 0.440%, 10/20/2060(a) | 736,718 | ||||||
| 417,939 | Government National Mortgage Association, Series 2010-H27, Class FA, 1-month LIBOR + 0.380%, 0.470%, 12/20/2060(a) | 418,476 | ||||||
| 44,045 | Government National Mortgage Association, Series 2011- H20, Class FA, 1-month LIBOR + 0.550%, 0.640%, 9/20/2061(a) | 44,257 | ||||||
| 552,843 | Government National Mortgage Association, Series 2011-H06, Class FA, 1-month LIBOR + 0.450%, 0.540%, 2/20/2061(a) | 554,402 | ||||||
| 38,808 | Government National Mortgage Association, Series 2011-H08, Class FA, 1-month LIBOR + 0.600%, 0.690%, 2/20/2061(a) | 39,007 | ||||||
| 32,218 | Government National Mortgage Association, Series 2011-H23, Class HA, 3.000%, 12/20/2061(c)(d) | 33,570 | ||||||
| 30,807 | Government National Mortgage Association, Series 2012-124, Class HT, 6.500%, 7/20/2032(b)(c)(d) | 30,194 | ||||||
| 2,814,237 | Government National Mortgage Association, Series 2012-18, Class FM, 1-month LIBOR + 0.250%, 0.337%, 9/20/2038(a) | 2,817,861 | ||||||
| 143 | Government National Mortgage Association, Series 2012-H15, Class FA, 1-month LIBOR + 0.450%, 0.540%, 5/20/2062(a)(c)(d) | 142 | ||||||
| 494,248 | Government National Mortgage Association, Series 2012-H18, Class NA, 1-month LIBOR + 0.520%, 0.610%, 8/20/2062(a) | 496,348 | ||||||
| 1,611,561 | Government National Mortgage Association, Series 2012-H20, Class PT, 0.919%, 7/20/2062(b) | 1,608,864 | ||||||
| 23,992 | Government National Mortgage Association, Series 2012-H29, Class HF, 1-month LIBOR + 0.500%, 0.590%, 10/20/2062(a)(c)(d) | 23,824 | ||||||
| 41,695 | Government National Mortgage Association, Series 2013-H02, Class GF, 1-month LIBOR + 0.500%, 0.590%, 12/20/2062(a)(c)(d) | 41,460 | ||||||
| 1,728,621 | Government National Mortgage Association, Series 2013-H08, Class FA, 1-month LIBOR + 0.350%, 0.440%, 3/20/2063(a) | 1,729,360 | ||||||
| 1,407,886 | Government National Mortgage Association, Series 2013-H10, Class FA, 1-month LIBOR + 0.400%, 0.490%, 3/20/2063(a) | 1,410,031 | ||||||
See accompanying notes to financial statements.
| 72
Portfolio of Investments – as of September 30, 2021
Loomis Sayles Limited Term Government and Agency Fund – (continued)
| Principal Amount | Description | Value (†) | ||||||
| Collateralized Mortgage Obligations — continued |
| |||||||
| $ | 225,066 | Government National Mortgage Association, Series 2013-H14, Class FG, 1-month LIBOR + 0.470%, 0.560%, 5/20/2063(a) | $ | 225,704 | ||||
| 5,523,513 | Government National Mortgage Association, Series 2013-H22, Class FT, 1-year CMT + 0.650%, 0.720%, 4/20/2063(a) | 5,502,594 | ||||||
| 3,887,419 | Government National Mortgage Association, Series 2014-H14, Class FA, 1-month LIBOR + 0.500%, 0.603%, 7/20/2064(a) | 3,912,333 | ||||||
| 3,044,960 | Government National Mortgage Association, Series 2014-H15, Class FA, 1-month LIBOR + 0.500%, 0.590%, 7/20/2064(a) | 3,062,262 | ||||||
| 2,280,828 | Government National Mortgage Association, Series 2015-H04, Class FL, 1-month LIBOR + 0.470%, 0.560%, 2/20/2065(a) | 2,292,993 | ||||||
| 20,401 | Government National Mortgage Association, Series 2015-H05, Class FA, 1-month LIBOR + 0.300%, 0.390%, 4/20/2061(a)(c)(d) | 20,188 | ||||||
| 14,128 | Government National Mortgage Association, Series 2015-H09, Class HA, 1.750%, 3/20/2065(c)(d) | 14,195 | ||||||
| 287,018 | Government National Mortgage Association, Series 2015-H10, Class FC, 1-month LIBOR + 0.480%, 0.570%, 4/20/2065(a) | 288,427 | ||||||
| 4,467,115 | Government National Mortgage Association, Series 2015-H10, Class JA, 2.250%, 4/20/2065 | 4,575,758 | ||||||
| 4,807 | Government National Mortgage Association, Series 2015-H11, Class FA, 1-month LIBOR + 0.250%, 0.340%, 4/20/2065(a)(c)(d) | 4,753 | ||||||
| 2,820,295 | Government National Mortgage Association, Series 2015-H12, Class FL, 1-month LIBOR + 0.230%, 0.320%, 5/20/2065(a) | 2,814,654 | ||||||
| 110,990 | Government National Mortgage Association, Series 2015-H19, Class FH, 1-month LIBOR + 0.300%, 0.390%, 7/20/2065(a)(c)(d) | 110,402 | ||||||
| 5,429 | Government National Mortgage Association, Series 2015-H29, Class FA, 1-month LIBOR + 0.700%, 0.790%, 10/20/2065(a)(c)(d) | 5,404 | ||||||
| 6,555 | Government National Mortgage Association, Series 2015-H30, Class FA, 1-month LIBOR + 0.680%, 0.770%, 8/20/2061(a)(c)(d) | 6,562 | ||||||
| 4,303,114 | Government National Mortgage Association, Series 2016-H06, Class FC, 1-month LIBOR + 0.920%, 1.010%, 2/20/2066(a) | 4,369,433 | ||||||
| 1,309,387 | Government National Mortgage Association, Series 2016-H20, Class FB, 1-month LIBOR + 0.550%, 0.640%, 9/20/2066(a) | 1,317,274 | ||||||
| 81,218 | Government National Mortgage Association, Series 2018-H02, Class FJ, 1-month LIBOR + 0.200%, 0.290%, 10/20/2064(a) | 81,159 | ||||||
| 6,023,677 | Government National Mortgage Association, Series 2018-H11, Class FJ, 12-month LIBOR + 0.080%, 0.327%, 6/20/2068(a) | 5,952,755 | ||||||
| 141,678 | Government National Mortgage Association, Series 2018-H14, Class FG, 1-month LIBOR + 0.350%, 0.440%, 9/20/2068(a) | 141,765 | ||||||
| 8,684,851 | Government National Mortgage Association, Series 2018-H16, Class FA, 1-month LIBOR + 0.420%, 0.510%, 9/20/2068(a) | 8,702,061 | ||||||
| 7,605,630 | Government National Mortgage Association, Series 2019-H04, Class NA, 3.500%, 9/20/2068 | 8,129,007 | ||||||
| 2,612,820 | Government National Mortgage Association, Series 2020-30, Class F, 1-month LIBOR + 0.400%, 0.486%, 4/20/2048(a) | 2,624,749 | ||||||
| Collateralized Mortgage Obligations — continued |
| |||||||
| 4,841,427 | Government National Mortgage Association, Series 2020-53, Class NF, 1-month LIBOR + 0.450%, 0.536%, 5/20/2046(a) | 4,821,378 | ||||||
| 5,186,399 | Government National Mortgage Association, Series 2020-H04, Class FP, 1-month LIBOR + 0.500%, 0.590%, 6/20/2069(a) | 5,219,784 | ||||||
| 10,651,442 | Government National Mortgage Association, Series 2020-H07, Class FL, 1-month LIBOR + 0.650%, 0.737%, 4/20/2070(a) | 10,766,808 | ||||||
| 11,406,315 | Government National Mortgage Association, Series 2020-H10, Class FD, 1-month LIBOR + 0.400%, 0.487%, 5/20/2070(a) | 11,390,506 | ||||||
| 5,128,478 | Government National Mortgage Association, Series 2020-HO1, Class FT, 1-year CMT + 0.500%, 0.610%, 1/20/2070(a) | 5,145,828 | ||||||
|
| |||||||
| 144,778,903 | ||||||||
|
| |||||||
| Hybrid ARMs — 2.9% |
| |||||||
| 112,025 | FHLMC, 12-month LIBOR + 1.666%, 1.933%, 11/01/2038(a) | 112,748 | ||||||
| 300,521 | FHLMC, 6-month LIBOR + 1.712%, 1.961%, 6/01/2037(a) | 300,652 | ||||||
| 165,906 | FHLMC, 12-month LIBOR + 1.735%, 2.029%, 3/01/2038(a) | 167,461 | ||||||
| 517,159 | FHLMC, 12-month LIBOR + 1.764%, 2.044%, 9/01/2035(a) | 539,594 | ||||||
| 112,820 | FHLMC, 12-month LIBOR + 1.791%, 2.061%, 11/01/2038(a) | 114,047 | ||||||
| 202,582 | FHLMC, 1-year CMT + 1.940%, 2.065%, 9/01/2038(a) | 203,448 | ||||||
| 175,079 | FHLMC, 12-month LIBOR + 1.734%, 2.107%, 4/01/2037(a) | 182,768 | ||||||
| 998,658 | FHLMC, 12-month LIBOR + 1.895%, 2.145%, 9/01/2041(a) | 1,056,590 | ||||||
| 52,502 | FHLMC, 12-month LIBOR + 1.742%, 2.180%, 12/01/2037(a) | 52,854 | ||||||
| 2,182,726 | FHLMC, 12-month LIBOR + 1.842%, 2.202%, 1/01/2046(a) | 2,265,765 | ||||||
| 382,036 | FHLMC, 1-year CMT + 2.220%, 2.220%, 7/01/2033(a) | 382,945 | ||||||
| 359,134 | FHLMC, 1-year CMT + 2.247%, 2.272%, 9/01/2038(a) | 384,808 | ||||||
| 468,402 | FHLMC, 12-month LIBOR + 1.899%, 2.274%, 4/01/2037(a) | 471,893 | ||||||
| 175,694 | FHLMC, 12-month LIBOR + 1.936%, 2.275%, 12/01/2034(a) | 177,749 | ||||||
| 393,696 | FHLMC, 1-year CMT + 2.165%, 2.290%, 4/01/2036(a) | 394,145 | ||||||
| 112,796 | FHLMC, 1-year CMT + 2.209%, 2.316%, 9/01/2038(a) | 113,370 | ||||||
| 1,717,593 | FHLMC, 1-year CMT + 2.248%, 2.323%, 3/01/2037(a) | 1,833,972 | ||||||
| 374,748 | FHLMC, 1-year CMT + 2.245%, 2.367%, 3/01/2036(a) | 400,192 | ||||||
| 973,536 | FHLMC, 1-year CMT + 2.256%, 2.372%, 2/01/2036(a) | 1,035,337 | ||||||
| 121,370 | FHLMC, 1-year CMT + 2.250%, 2.375%, 2/01/2035(a) | 129,352 | ||||||
| 515,680 | FHLMC, 1-year CMT + 2.285%, 2.409%, 2/01/2036(a) | 544,840 | ||||||
| 50,601 | FHLMC, 12-month LIBOR + 2.180%, 2.555%, 3/01/2037(a) | 50,931 | ||||||
| 22,002 | FNMA, 6-month LIBOR + 1.460%, 1.585%, 2/01/2037(a) | 22,486 | ||||||
See accompanying notes to financial statements.
73 |
Portfolio of Investments – as of September 30, 2021
Loomis Sayles Limited Term Government and Agency Fund – (continued)
| Principal Amount | Description | Value (†) | ||||||
| Hybrid ARMs — continued |
| |||||||
| $ | 113,951 | FNMA, 12-month LIBOR + 1.479%, 1.729%, 8/01/2035(a) | $ | 113,856 | ||||
| 379,161 | FNMA, 6-month LIBOR + 1.544%, 1.767%, 7/01/2035(a) | 393,693 | ||||||
| 572,600 | FNMA, 12-month LIBOR + 1.595%, 1.849%, 9/01/2037(a) | 595,757 | ||||||
| 229,131 | FNMA, 12-month LIBOR + 1.639%, 1.889%, 8/01/2038(a) | 231,249 | ||||||
| 863,217 | FNMA, 12-month LIBOR + 1.549%, 1.919%, 4/01/2037(a) | 905,416 | ||||||
| 327,156 | FNMA, 12-month LIBOR + 1.669%, 1.919%, 7/01/2038(a) | 332,043 | ||||||
| 573,186 | FNMA, 12-month LIBOR + 1.574%, 1.926%, 7/01/2035(a) | 595,364 | ||||||
| 198,763 | FNMA, 12-month LIBOR + 1.587%, 1.928%, 4/01/2037(a) | 200,435 | ||||||
| 316,324 | FNMA, 12-month LIBOR + 1.678%, 1.953%, 8/01/2034(a) | 318,764 | ||||||
| 168,218 | FNMA, 12-month LIBOR + 1.665%, 2.016%, 11/01/2036(a) | 177,217 | ||||||
| 185,478 | FNMA, 12-month LIBOR + 1.608%, 2.060%, 10/01/2033(a) | 192,718 | ||||||
| 847,381 | FNMA, 12-month LIBOR + 1.741%, 2.063%, 9/01/2037(a) | 897,045 | ||||||
| 66,539 | FNMA, 12-month LIBOR + 1.802%, 2.072%, 7/01/2041(a) | 66,796 | ||||||
| 44,090 | FNMA, 12-month LIBOR + 1.754%, 2.129%, 1/01/2037(a) | 44,751 | ||||||
| 373,700 | FNMA, 12-month LIBOR + 1.760%, 2.135%, 2/01/2037(a) | 378,161 | ||||||
| 766,117 | FNMA, 12-month LIBOR + 1.781%, 2.156%, 3/01/2037(a) | 811,908 | ||||||
| 69,927 | FNMA, 1-year CMT + 2.145%, 2.171%, 9/01/2036(a) | 71,268 | ||||||
| 125,430 | FNMA, 12-month LIBOR + 1.800%, 2.175%, 3/01/2034(a) | 132,406 | ||||||
| 119,246 | FNMA, 12-month LIBOR + 1.800%, 2.175%, 12/01/2041(a) | 120,035 | ||||||
| 125,778 | FNMA, 12-month LIBOR + 1.729%, 2.181%, 11/01/2035(a) | 132,801 | ||||||
| 979,442 | FNMA, 12-month LIBOR + 1.820%, 2.195%, 2/01/2047(a) | 1,051,792 | ||||||
| 1,113,253 | FNMA, 1-year CMT + 2.175%, 2.216%, 11/01/2033(a) | 1,188,240 | ||||||
| 202,894 | FNMA, 1-year CMT + 2.149%, 2.223%, 9/01/2034(a) | 214,460 | ||||||
| 264,116 | FNMA, 1-year CMT + 2.223%, 2.223%, 8/01/2035(a) | 264,502 | ||||||
| 1,022,223 | FNMA, 1-year CMT + 2.172%, 2.240%, 12/01/2040(a) | 1,090,752 | ||||||
| 308,261 | FNMA, 1-year CMT + 2.159%, 2.249%, 6/01/2036(a) | 318,902 | ||||||
| 181,716 | FNMA, 1-year CMT + 2.185%, 2.259%, 12/01/2034(a) | 182,195 | ||||||
| 95,284 | FNMA, 1-year CMT + 2.141%, 2.266%, 4/01/2033(a) | 95,455 | ||||||
| 2,220,753 | FNMA, 1-year CMT + 2.212%, 2.268%, 10/01/2034(a) | 2,371,523 | ||||||
| 624,994 | FNMA, 1-year CMT + 2.274%, 2.274%, 6/01/2037(a) | 671,192 | ||||||
| 1,183,264 | FNMA, 12-month LIBOR + 1.800%, 2.300%, 10/01/2041(a) | 1,247,879 | ||||||
| 373,945 | FNMA, 1-year CMT + 2.287%, 2.303%, 6/01/2033(a) | 373,452 | ||||||
| Hybrid ARMs — continued |
| |||||||
| 396,883 | FNMA, 1-year CMT + 2.185%, 2.310%, 1/01/2036(a) | 412,382 | ||||||
| 199,468 | FNMA, 1-year CMT + 2.205%, 2.323%, 4/01/2034(a) | 200,561 | ||||||
| 1,205,874 | FNMA, 1-year CMT + 2.225%, 2.330%, 4/01/2034(a) | 1,282,273 | ||||||
| 215,436 | FNMA, 1-year CMT + 2.287%, 2.362%, 10/01/2033(a) | 216,942 | ||||||
| 58,201 | FNMA, 1-year CMT + 2.440%, 2.440%, 8/01/2033(a) | 58,521 | ||||||
| 449,616 | FNMA, 6-month LIBOR + 2.193%, 2.443%, 7/01/2037(a) | 473,605 | ||||||
| 132,628 | FNMA, 1-year CMT + 2.500%, 2.592%, 8/01/2036(a) | 142,649 | ||||||
| 156,825 | FNMA, 1-year CMT + 2.480%, 2.605%, 5/01/2035(a) | 166,390 | ||||||
| 66,934 | FNMA, 12-month LIBOR + 2.473%, 2.723%, 6/01/2035(a) | 67,792 | ||||||
|
| |||||||
| 29,741,089 | ||||||||
|
| |||||||
| Mortgage Related — 1.9% |
| |||||||
| 25,473 | FHLMC, 3.000%, 10/01/2026 | 26,837 | ||||||
| 180,478 | FHLMC, 4.000%, with various maturities from 2024 to 2042(f) | 196,730 | ||||||
| 77,731 | FHLMC, 4.500%, with various maturities from 2025 to 2034(f) | 82,309 | ||||||
| 13,266 | FHLMC, 5.500%, 10/01/2023 | 13,615 | ||||||
| 143,903 | FHLMC, 6.500%, 12/01/2034 | 165,035 | ||||||
| 65 | FHLMC, 7.500%, 6/01/2026 | 70 | ||||||
| 85,130 | FNMA, 3.000%, 3/01/2042 | 92,007 | ||||||
| 746,189 | FNMA, 5.000%, with various maturities from 2037 to 2038(f) | 848,755 | ||||||
| 323,358 | FNMA, 5.500%, with various maturities from 2023 to 2033(f) | 356,634 | ||||||
| 70,646 | FNMA, 6.000%, with various maturities in 2022(f) | 71,840 | ||||||
| 147,232 | FNMA, 6.500%, with various maturities from 2032 to 2037(f) | 166,221 | ||||||
| 41,133 | FNMA, 7.500%, with various maturities from 2030 to 2032(f) | 44,724 | ||||||
| 1,751,635 | GNMA, 1-month LIBOR + 1.748%, 1.863%, 2/20/2061(a) | 1,827,665 | ||||||
| 1,406,413 | GNMA, 1-month LIBOR + 1.890%, 1.986%, 2/20/2063(a) | 1,463,741 | ||||||
| 1,452,852 | GNMA, 1-month LIBOR + 2.190%, 2.283%, 3/20/2063(a) | 1,505,876 | ||||||
| 642,615 | GNMA, 1-month LIBOR + 2.233%, 2.329%, 5/20/2065(a) | 686,460 | ||||||
| 673,642 | GNMA, 1-month LIBOR + 2.242%, 2.342%, 6/20/2065(a) | 724,456 | ||||||
| 742,235 | GNMA, 1-month LIBOR + 2.339%, 2.437%, 2/20/2063(a) | 778,296 | ||||||
| 48,260 | GNMA, 3.640%, 3/20/2063(b) | 48,252 | ||||||
| 25,902 | GNMA, 3.687%, 2/20/2063(b) | 26,104 | ||||||
| 54,016 | GNMA, 4.006%, 12/20/2062(b) | 56,530 | ||||||
| 24,184 | GNMA, 4.140%, 12/20/2061(b) | 26,019 | ||||||
| 85,595 | GNMA, 4.284%, 4/20/2063(b) | 88,859 | ||||||
| 13,898 | GNMA, 4.327%, 8/20/2061(b) | 15,066 | ||||||
| 2,829,196 | GNMA, 4.434%, 10/20/2065(b) | 3,089,210 | ||||||
| 273,941 | GNMA, 4.529%, 7/20/2063(b) | 291,532 | ||||||
| 1,489,784 | GNMA, 4.601%, 2/20/2066(b) | 1,595,877 | ||||||
| 8,089 | GNMA, 4.604%, 2/20/2062(b) | 8,327 | ||||||
| 1,832,667 | GNMA, 4.613%, 3/20/2064(b) | 1,934,841 | ||||||
| 245,727 | GNMA, 4.622%, 1/20/2064(b) | 260,443 | ||||||
See accompanying notes to financial statements.
| 74
Portfolio of Investments – as of September 30, 2021
Loomis Sayles Limited Term Government and Agency Fund – (continued)
| Principal Amount | Description | Value (†) | ||||||
| Mortgage Related — continued |
| |||||||
| $ | 25,958 | GNMA, 4.630%, with various maturities from 2061 to 2062(b)(f) | $ | 26,127 | ||||
| 4,543 | GNMA, 4.632%, 8/20/2062(b) | 4,890 | ||||||
| 1,768,285 | GNMA, 4.670%, 11/20/2063(b) | 1,874,214 | ||||||
| 923,837 | GNMA, 4.700%, with various maturities from 2061 to 2064(b)(f) | 970,183 | ||||||
| 2,500 | GNMA, 4.882%, 4/20/2061(b) | 2,627 | ||||||
| 6,844 | GNMA, 6.000%, 12/15/2031 | 7,959 | ||||||
| 30,007 | GNMA, 6.500%, 5/15/2031 | 34,936 | ||||||
| 33,021 | GNMA, 7.000%, 10/15/2028 | 36,203 | ||||||
|
| |||||||
| 19,449,470 | ||||||||
|
| |||||||
| Non-Agency Commercial Mortgage-Backed Securities — 2.0% |
| |||||||
| 1,595,000 | BANK, Series 2020-BN25, Class A5, 2.649%, 1/15/2063 | 1,667,611 | ||||||
| 3,895,000 | Barclays Commercial Mortgage Securities Trust, Series 2020-BID, Class A, 1-month LIBOR + 2.140%, 2.224%, 10/15/2037, 144A(a) | 3,918,040 | ||||||
| 1,310,000 | Commercial Mortgage Pass Through Certificates, Series 2012-LTRT, Class A2, 3.400%, 10/05/2030, 144A | 1,303,474 | ||||||
| 1,488,000 | Commercial Mortgage Pass Through Certificates, Series 2014-UBS2, Class A5, 3.961%, 3/10/2047 | 1,588,114 | ||||||
| 3,804,856 | Commercial Mortgage Pass Through Certificates, Series 2016-DC2, Class ASB, 3.550%, 2/10/2049 | 4,018,671 | ||||||
| 2,570,000 | DROP Mortgage Trust, Series 2021-FILE, Class A, 1-month LIBOR + 1.150%, 1.230%, 4/15/2026, 144A(a) | 2,577,968 | ||||||
| 2,600,000 | Hudsons Bay Simon JV Trust, Series 2015-HB7, Class A7, 3.914%, 8/05/2034, 144A | 2,402,176 | ||||||
| 1,040,000 | Morgan Stanley Bank of America Merrill Lynch Trust, Series 2013-C8, Class A4, 3.134%, 12/15/2048 | 1,064,531 | ||||||
| 3,279,464 | Starwood Retail Property Trust, Series 2014-STAR, Class A, 1-month LIBOR + 1.470%, 1.554%, 11/15/2027, 144A(a) | 2,033,268 | ||||||
|
| |||||||
| 20,573,853 | ||||||||
|
| |||||||
| Treasuries — 40.0% |
| |||||||
| 41,575,000 | U.S. Treasury Note, 0.250%, 9/30/2023 | 41,542,519 | ||||||
| 4,845,000 | U.S. Treasury Note, 0.250%, 6/15/2024 | 4,818,125 | ||||||
| 18,650,000 | U.S. Treasury Note, 0.250%, 6/30/2025 | 18,317,797 | ||||||
| 13,840,000 | U.S. Treasury Note, 0.250%, 8/31/2025 | 13,557,253 | ||||||
| 13,070,000 | U.S. Treasury Note, 0.250%, 9/30/2025 | 12,789,710 | ||||||
| 13,605,000 | U.S. Treasury Note, 0.250%, 10/31/2025 | 13,293,042 | ||||||
| 47,425,000 | U.S. Treasury Note, 0.375%, 4/30/2025 | 46,898,879 | ||||||
| 7,255,000 | U.S. Treasury Note, 0.375%, 11/30/2025 | 7,116,418 | ||||||
| 56,000,000 | U.S. Treasury Note, 0.375%, 12/31/2025 | 54,871,250 | ||||||
| 24,685,000 | U.S. Treasury Note, 0.375%, 1/31/2026 | 24,154,658 | ||||||
| 4,600,000 | U.S. Treasury Note, 0.500%, 3/31/2025 | 4,574,484 | ||||||
| 11,585,000 | U.S. Treasury Note, 0.500%, 2/28/2026 | 11,389,503 | ||||||
| 13,225,000 | U.S. Treasury Note, 0.750%, 3/31/2026 | 13,131,495 | ||||||
| 71,995,000 | U.S. Treasury Note, 0.750%, 8/31/2026 | 71,224,429 | ||||||
| 11,470,000 | U.S. Treasury Note, 2.000%, 2/15/2025 | 11,997,351 | ||||||
| 6,915,000 | U.S. Treasury Note, 2.250%, 1/31/2024 | 7,218,612 | ||||||
| 3,340,000 | U.S. Treasury Note, 2.250%, 10/31/2024 | 3,514,437 | ||||||
| 40,295,000 | U.S. Treasury Note, 2.875%, 10/31/2023 | 42,438,820 | ||||||
| 9,955,000 | U.S. Treasury Note, 2.875%, 7/31/2025 | 10,753,733 | ||||||
|
| |||||||
| 413,602,515 | ||||||||
|
| |||||||
| Total Bonds and Notes (Identified Cost $988,328,988) | 990,784,859 | |||||||
|
| |||||||
| Short-Term Investments — 4.0% | ||||||||
| 9,469,399 | Tri-Party Repurchase Agreement with Fixed Income Clearing Corporation, dated 9/30/2021 at 0.000% to be repurchased at $9,469,399 on 10/01/2021 collateralized by $11,209,800 U.S. Treasury Bond, 1.125% due 08/15/2040 valued at $9,658,815 including accrued interest (Note 2 of Notes to Financial Statements) | 9,469,399 | ||||||
| 31,675,000 | U.S. Treasury Bills, 0.002%-0.018%, 10/12/2021(g)(h) | 31,674,722 | ||||||
|
| |||||||
| Total Short-Term Investments (Identified Cost $41,144,281) | 41,144,121 | |||||||
|
| |||||||
| Total Investments — 99.9% (Identified Cost $1,029,473,269) | 1,031,928,980 | |||||||
| Other assets less liabilities — 0.1% | 1,112,424 | |||||||
|
| |||||||
| Net Assets — 100.0% | $ | 1,033,041,404 | ||||||
|
| |||||||
| (†) | See Note 2 of Notes to Financial Statements. |
| ||||||
| (a) | Variable rate security. Rate as of September 30, 2021 is disclosed. |
| ||||||
| (b) | Variable rate security. The interest rate adjusts periodically based on; (i) changes in current interest rates and/or prepayments on underlying pools of assets, if applicable, (ii) reference to a base lending rate plus or minus a margin, and/or (iii) reference to a base lending rate adjusted by a multiplier and/or subject to certain floors or caps. Rate as of September 30, 2021 is disclosed. |
| ||||||
| (c) | Level 3 security. Value has been determined using significant unobservable inputs. See Note 3 of Notes to Financial Statements. |
| ||||||
| (d) | Fair valued by the Fund’s adviser. At September 30, 2021, the value of these securities amounted to $4,629,151 or 0.4% of net assets. See Note 2 of Notes to Financial Statements. |
| ||||||
| (e) | Interest only security. Security represents right to receive monthly interest payments on an underlying pool of mortgages. Principal shown is the outstanding par amount of the pool held as of the end of the period. |
| ||||||
| (f) | The Fund’s investment in mortgage related securities of Federal Home Loan Mortgage Corporation, Federal National Mortgage Association and Government National Mortgage Association are interests in separate pools of mortgages. All separate investments in securities of each issuer which have the same coupon rate have been aggregated for the purpose of presentation in the Portfolio of Investments. |
| ||||||
| (g) | Interest rate represents discount rate at time of purchase; not a coupon rate. |
| ||||||
| (h) | The Fund’s investment in U.S. Government/Agency securities is comprised of various lots with differing discount rates. These separate investments, which have the same maturity date, have been aggregated for the purpose of presentation in the Portfolio of Investments. |
| ||||||
| 144A | All or a portion of these securities are exempt from registration under Rule 144A of the Securities Act of 1933. These securities may be resold in transactions exempt from registration, normally to qualified institutional buyers. At September 30, 2021, the value of Rule 144A holdings amounted to $49,156,284 or 4.8% of net assets. |
| ||||||
| ABS | Asset-Backed Securities |
| ||||||
| ARMs | Adjustable Rate Mortgages |
| ||||||
| CMT | Constant Maturity Treasury |
| ||||||
| FHLMC | Federal Home Loan Mortgage Corp. |
| ||||||
| FNMA | Federal National Mortgage Association |
| ||||||
| GNMA | Government National Mortgage Association |
| ||||||
| LIBOR | London Interbank Offered Rate |
| ||||||
| MTA | Monthly Treasury Average Interest |
| ||||||
| REMIC | Real Estate Mortgage Investment Conduit |
| ||||||
| SOFR | Secured Overnight Financing Rate |
| ||||||
See accompanying notes to financial statements.
75 |
Portfolio of Investments – as of September 30, 2021
Loomis Sayles Limited Term Government and Agency Fund – (continued)
Industry Summary at September 30, 2021
Treasuries | 40.0 | % | ||
Agency Commercial Mortgage-Backed Securities | 30.2 | |||
Collateralized Mortgage Obligations | 14.0 | |||
ABS Car Loan | 2.9 | |||
Hybrid ARMs | 2.9 | |||
Non-Agency Commercial Mortgage-Backed Securities | 2.0 | |||
Other Investments, less than 2% each | 3.9 | |||
Short-Term Investments | 4.0 | |||
|
| |||
Total Investments | 99.9 | |||
Other assets less liabilities | 0.1 | |||
|
| |||
Net Assets | 100.0 | % | ||
|
|
See accompanying notes to financial statements.
| 76
Statements of Assets and Liabilities
September 30, 2021
| Core Plus Bond Fund | Credit Income Fund | Global Allocation Fund | ||||||||||
ASSETS |
| |||||||||||
Investments at cost | $ | 9,398,037,659 | $ | 24,631,088 | $ | 3,778,502,923 | ||||||
Net unrealized appreciation | 133,421,250 | 560,072 | 1,077,384,540 | |||||||||
|
|
|
|
|
| |||||||
Investments at value | 9,531,458,909 | 25,191,160 | 4,855,887,463 | |||||||||
Cash | 4,996,292 | — | 150,228 | |||||||||
Due from brokers (Note 2) | 6,480,102 | — | 4,145,238 | |||||||||
Foreign currency at value (identified cost $0, $0 and $15,213,836, respectively) | — | — | 14,822,124 | |||||||||
Receivable for Fund shares sold | 13,687,769 | — | 4,925,564 | |||||||||
Receivable from investment adviser (Note 6) | — | 16,371 | — | |||||||||
Receivable for securities sold | 262,748,214 | 754,252 | 9,345,847 | |||||||||
Receivable for when-issued/delayed delivery securities sold (Note 2) | 207,302,160 | — | — | |||||||||
Collateral received for open forward foreign currency contracts (Notes 2 and 4) | — | — | 590,000 | |||||||||
Dividends and interest receivable | 52,431,367 | 195,682 | 10,857,171 | |||||||||
Unrealized appreciation on forward foreign currency contracts (Note 2) | — | — | 962,249 | |||||||||
Tax reclaims receivable | — | — | 702,153 | |||||||||
Prepaid expenses (Note 9) | 1,170 | 3 | 557 | |||||||||
|
|
|
|
|
| |||||||
TOTAL ASSETS | 10,079,105,983 | 26,157,468 | 4,902,388,594 | |||||||||
|
|
|
|
|
| |||||||
LIABILITIES |
| |||||||||||
Payable for securities purchased | 319,583,965 | 1,118,521 | 9,564,537 | |||||||||
Payable for when-issued/delayed delivery securities purchased (Note 2) | 895,336,641 | — | — | |||||||||
Payable for Fund shares redeemed | 10,585,652 | — | 2,918,294 | |||||||||
Unrealized depreciation on forward foreign currency contracts (Note 2) | — | — | 5,685,114 | |||||||||
Foreign taxes payable (Note 2) | — | — | 2,146,613 | |||||||||
Due to brokers (Note 2) | — | — | 590,000 | |||||||||
Payable for variation margin on futures contracts (Note 2) | — | 2,750 | 25,547 | |||||||||
Management fees payable (Note 6) | 2,344,632 | — | 3,053,825 | |||||||||
Deferred Trustees’ fees (Note 6) | 917,200 | 3,008 | 407,023 | |||||||||
Administrative fees payable (Note 6) | 313,629 | 921 | 176,988 | |||||||||
Payable to distributor (Note 6d) | 64,591 | 5 | 57,346 | |||||||||
Other accounts payable and accrued expenses | 409,326 | 76,723 | 318,973 | |||||||||
|
|
|
|
|
| |||||||
TOTAL LIABILITIES | 1,229,555,636 | 1,201,928 | 24,944,260 | |||||||||
|
|
|
|
|
| |||||||
NET ASSETS | $ | 8,849,550,347 | $ | 24,955,540 | $ | 4,877,444,334 | ||||||
|
|
|
|
|
| |||||||
NET ASSETS CONSIST OF: |
| |||||||||||
Paid-in capital | $ | 8,721,602,439 | $ | 24,430,295 | $ | 3,463,722,292 | ||||||
Accumulated earnings | 127,947,908 | 525,245 | 1,413,722,042 | |||||||||
|
|
|
|
|
| |||||||
NET ASSETS | $ | 8,849,550,347 | $ | 24,955,540 | $ | 4,877,444,334 | ||||||
|
|
|
|
|
| |||||||
COMPUTATION OF NET ASSET VALUE AND OFFERING PRICE: |
| |||||||||||
Class A shares: |
| |||||||||||
Net assets | $ | 747,496,573 | $ | 90,833 | $ | 737,469,453 | ||||||
|
|
|
|
|
| |||||||
Shares of beneficial interest | 54,997,773 | 8,898 | 25,553,630 | |||||||||
|
|
|
|
|
| |||||||
Net asset value and redemption price per share | $ | 13.59 | $ | 10.21 | $ | 28.86 | ||||||
|
|
|
|
|
| |||||||
Offering price per share (100/[100-maximum sales charge] of net asset value) (Note 1) | $ | 14.19 | $ | 10.66 | $ | 30.62 | ||||||
|
|
|
|
|
| |||||||
Class C shares: (redemption price per share is equal to net asset value less any applicable contingent deferred sales charge) (Note 1) | ||||||||||||
Net assets | $ | 95,754,823 | $ | 1,040 | $ | 503,072,774 | ||||||
|
|
|
|
|
| |||||||
Shares of beneficial interest | 7,041,346 | 102 | 17,798,725 | |||||||||
|
|
|
|
|
| |||||||
Net asset value and offering price per share | $ | 13.60 | $ | 10.20 | $ | 28.26 | ||||||
|
|
|
|
|
| |||||||
Class N shares: |
| |||||||||||
Net assets | $ | 2,563,736,037 | $ | 24,841,678 | $ | 350,221,891 | ||||||
|
|
|
|
|
| |||||||
Shares of beneficial interest | 186,882,456 | 2,434,178 | 12,038,151 | |||||||||
|
|
|
|
|
| |||||||
Net asset value, offering and redemption price per share | $ | 13.72 | $ | 10.21 | $ | 29.09 | ||||||
|
|
|
|
|
| |||||||
Class Y shares: |
| |||||||||||
Net assets | $ | 5,442,562,914 | $ | 21,989 | $ | 3,286,680,216 | ||||||
|
|
|
|
|
| |||||||
Shares of beneficial interest | 396,976,803 | 2,155 | 112,981,209 | |||||||||
|
|
|
|
|
| |||||||
Net asset value, offering and redemption price per share | $ | 13.71 | $ | 10.20 | $ | 29.09 | ||||||
|
|
|
|
|
| |||||||
See accompanying notes to financial statements.
77 |
Statements of Assets and Liabilities (continued)
September 30, 2021
| Growth Fund | Intermediate Duration Bond Fund | Limited Term Government and Agency Fund | ||||||||||
ASSETS |
| |||||||||||
Investments at cost | $ | 7,174,975,613 | $ | 385,478,294 | $ | 1,029,473,269 | ||||||
Net unrealized appreciation | 6,584,328,317 | 1,369,310 | 2,455,711 | |||||||||
|
|
|
|
|
| |||||||
Investments at value | 13,759,303,930 | 386,847,604 | 1,031,928,980 | |||||||||
Due from brokers (Note 2) | — | 165,000 | — | |||||||||
Receivable for Fund shares sold | 19,401,913 | 863,712 | 879,800 | |||||||||
Receivable for securities sold | — | 4,395,277 | 19,043,112 | |||||||||
Dividends and interest receivable | 2,831,934 | 1,083,504 | 1,672,689 | |||||||||
Tax reclaims receivable | 6,317,585 | 363 | — | |||||||||
Receivable for variation margin on futures contracts (Note 2) | — | 13,033 | — | |||||||||
Prepaid expenses (Note 9) | 1,567 | 43 | 122 | |||||||||
|
|
|
|
|
| |||||||
TOTAL ASSETS | 13,787,856,929 | 393,368,536 | 1,053,524,703 | |||||||||
|
|
|
|
|
| |||||||
LIABILITIES |
| |||||||||||
Payable for securities purchased | — | 11,188,877 | 18,444,955 | |||||||||
Payable for Fund shares redeemed | 11,360,084 | 163,862 | 955,152 | |||||||||
Distributions payable | — | — | 128,684 | |||||||||
Management fees payable (Note 6) | 5,925,968 | 72,437 | 242,612 | |||||||||
Deferred Trustees’ fees (Note 6) | 822,003 | 168,206 | 490,303 | |||||||||
Administrative fees payable (Note 6) | 502,471 | 13,236 | 36,100 | |||||||||
Payable to distributor (Note 6d) | 98,926 | 3,327 | 13,868 | |||||||||
Other accounts payable and accrued expenses | 513,320 | 82,109 | 171,625 | |||||||||
|
|
|
|
|
| |||||||
TOTAL LIABILITIES | 19,222,772 | 11,692,054 | 20,483,299 | |||||||||
|
|
|
|
|
| |||||||
NET ASSETS | $ | 13,768,634,157 | $ | 381,676,482 | $ | 1,033,041,404 | ||||||
|
|
|
|
|
| |||||||
NET ASSETS CONSIST OF: |
| |||||||||||
Paid-in capital | $ | 6,536,950,316 | $ | 378,658,824 | $ | 1,060,615,704 | ||||||
Accumulated earnings (loss) | 7,231,683,841 | 3,017,658 | (27,574,300 | ) | ||||||||
|
|
|
|
|
| |||||||
NET ASSETS | $ | 13,768,634,157 | $ | 381,676,482 | $ | 1,033,041,404 | ||||||
|
|
|
|
|
| |||||||
COMPUTATION OF NET ASSET VALUE AND OFFERING PRICE: |
| |||||||||||
Class A shares: |
| |||||||||||
Net assets | $ | 1,740,523,283 | $ | 20,941,833 | $ | 287,243,903 | ||||||
|
|
|
|
|
| |||||||
Shares of beneficial interest | 72,982,489 | 1,979,277 | 25,207,226 | |||||||||
|
|
|
|
|
| |||||||
Net asset value and redemption price per share | $ | 23.85 | $ | 10.58 | $ | 11.40 | ||||||
|
|
|
|
|
| |||||||
Offering price per share (100/[100-maximum sales charge] of net asset value) (Note 1) | $ | 25.31 | $ | 11.05 | $ | 11.66 | ||||||
|
|
|
|
|
| |||||||
Class C shares: (redemption price per share is equal to net asset value less any applicable contingent deferred sales charge) (Note 1) | ||||||||||||
Net assets | $ | 127,002,763 | $ | 315,130 | $ | 24,921,677 | ||||||
|
|
|
|
|
| |||||||
Shares of beneficial interest | 5,988,326 | 29,682 | 2,189,243 | |||||||||
|
|
|
|
|
| |||||||
Net asset value and offering price per share | $ | 21.21 | $ | 10.62 | $ | 11.38 | ||||||
|
|
|
|
|
| |||||||
Class N shares: |
| |||||||||||
Net assets | $ | 806,186,080 | $ | 20,093,747 | $ | 12,971,503 | ||||||
|
|
|
|
|
| |||||||
Shares of beneficial interest | 31,335,350 | 1,900,845 | 1,135,204 | |||||||||
|
|
|
|
|
| |||||||
Net asset value, offering and redemption price per share | $ | 25.73 | $ | 10.57 | $ | 11.43 | ||||||
|
|
|
|
|
| |||||||
Class Y shares: |
| |||||||||||
Net assets | $ | 11,094,922,031 | $ | 340,325,772 | $ | 707,904,321 | ||||||
|
|
|
|
|
| |||||||
Shares of beneficial interest | 431,263,125 | 32,177,540 | 61,926,959 | |||||||||
|
|
|
|
|
| |||||||
Net asset value, offering and redemption price per share | $ | 25.73 | $ | 10.58 | $ | 11.43 | ||||||
|
|
|
|
|
| |||||||
See accompanying notes to financial statements.
| 78
Statements of Operations
For the Year Ended September 30, 2021
| Core Plus Bond Fund | Credit Income Fund | Global Allocation Fund | ||||||||||
INVESTMENT INCOME |
| |||||||||||
Interest | $ | 208,087,794 | $ | 724,402 | $ | 38,727,553 | ||||||
Dividends | — | 27,565 | 24,815,255 | |||||||||
Less net foreign taxes withheld | — | (14 | ) | (793,058 | ) | |||||||
|
|
|
|
|
| |||||||
| 208,087,794 | 751,953 | 62,749,750 | ||||||||||
|
|
|
|
|
| |||||||
Expenses |
| |||||||||||
Management fees (Note 6) | 29,609,686 | 109,063 | 33,980,508 | |||||||||
Service and distribution fees (Note 6) | 2,917,327 | 202 | 6,889,543 | |||||||||
Administrative fees (Note 6) | 4,007,984 | 11,116 | 1,972,813 | |||||||||
Trustees’ fees and expenses (Note 6) | 457,095 | 13,751 | 225,703 | |||||||||
Transfer agent fees and expenses (Notes 6 and 8) | 5,590,449 | 4,294 | 3,179,009 | |||||||||
Audit and tax services fees | 56,767 | 62,608 | 62,418 | |||||||||
Custodian fees and expenses (Note 7) | 328,996 | 8,207 | 443,326 | |||||||||
Legal fees (Note 9) | 326,652 | 969 | 154,682 | |||||||||
Registration fees | 313,993 | 58,651 | 171,447 | |||||||||
Shareholder reporting expenses | 244,631 | 4,992 | 187,610 | |||||||||
Miscellaneous expenses (Notes 7 and 9) | 261,615 | 29,594 | 195,423 | |||||||||
|
|
|
|
|
| |||||||
Total expenses | 44,115,195 | 303,447 | 47,462,482 | |||||||||
Less waiver and/or expense reimbursement (Notes 6 and 7) | — | (168,167 | ) | — | ||||||||
|
|
|
|
|
| |||||||
Net expenses | 44,115,195 | 135,280 | 47,462,482 | |||||||||
|
|
|
|
|
| |||||||
Net investment income | 163,972,599 | 616,673 | 15,287,268 | |||||||||
|
|
|
|
|
| |||||||
NET REALIZED AND UNREALIZED GAIN (LOSS) ON INVESTMENTS, FUTURES CONTRACTS, SHORT SALES, FORWARD FOREIGN CURRENCY CONTRACTS AND FOREIGN CURRENCY TRANSACTIONS | ||||||||||||
Net realized gain (loss) on: |
| |||||||||||
Investments | 116,389,278 | 127,665 | 379,925,633 | |||||||||
Futures contracts | — | (35,988 | ) | (617,791 | ) | |||||||
Short sales | 173,375 | — | — | |||||||||
Forward foreign currency contracts (Note 2e) | — | — | (10,850,551 | ) | ||||||||
Foreign currency transactions (Note 2d) | 360,619 | — | 599,384 | |||||||||
Net change in unrealized appreciation (depreciation) on: |
| |||||||||||
Investments | (226,451,764 | ) | 645,166 | 313,836,021 | ||||||||
Futures contracts | — | 35,718 | 640,419 | |||||||||
Forward foreign currency contracts (Note 2e) | — | — | (6,734,696 | ) | ||||||||
Foreign currency translations (Note 2d) | (72,727 | ) | — | (363,160 | ) | |||||||
|
|
|
|
|
| |||||||
Net realized and unrealized gain (loss) on investments, futures contracts, short sales, forward foreign currency contracts and foreign currency transactions | (109,601,219 | ) | 772,561 | 676,435,259 | ||||||||
|
|
|
|
|
| |||||||
NET INCREASE IN NET ASSETS RESULTING FROM OPERATIONS | $ | 54,371,380 | $ | 1,389,234 | $ | 691,722,527 | ||||||
|
|
|
|
|
| |||||||
See accompanying notes to financial statements.
79 |
Statements of Operations (continued)
For the Year Ended September 30, 2021
| Growth Fund | Intermediate Duration Bond Fund | Limited Term Government and Agency Fund | ||||||||||
INVESTMENT INCOME |
| |||||||||||
Interest | $ | — | $ | 5,994,515 | $ | 11,333,597 | ||||||
Dividends | 89,046,896 | — | — | |||||||||
Less net foreign taxes withheld | (2,656,488 | ) | — | — | ||||||||
|
|
|
|
|
| |||||||
| 86,390,408 | 5,994,515 | 11,333,597 | ||||||||||
|
|
|
|
|
| |||||||
Expenses |
| |||||||||||
Management fees (Note 6) | 65,539,656 | 893,605 | 3,243,640 | |||||||||
Service and distribution fees (Note 6) | 5,517,442 | 56,392 | 953,555 | |||||||||
Administrative fees (Note 6) | 5,608,769 | 152,980 | 445,799 | |||||||||
Trustees’ fees and expenses (Note 6) | 559,504 | 52,993 | 131,177 | |||||||||
Transfer agent fees and expenses (Notes 6 and 8) | 9,057,488 | 270,734 | 877,292 | |||||||||
Audit and tax services fees | 79,594 | 54,716 | 58,946 | |||||||||
Custodian fees and expenses (Note 7) | 603,260 | 23,553 | 45,644 | |||||||||
Legal fees (Note 9) | 435,715 | 12,075 | 35,546 | |||||||||
Registration fees | 221,979 | 76,394 | 99,415 | |||||||||
Shareholder reporting expenses | 280,271 | 18,316 | 73,905 | |||||||||
Miscellaneous expenses (Notes 7 and 9) | 366,625 | 36,405 | 53,302 | |||||||||
|
|
|
|
|
| |||||||
Total expenses | 88,270,303 | 1,648,163 | 6,018,221 | |||||||||
Less waiver and/or expense reimbursement (Notes 6 and 7) | — | (170,162 | ) | (62,613 | ) | |||||||
|
|
|
|
|
| |||||||
Net expenses | 88,270,303 | 1,478,001 | 5,955,608 | |||||||||
|
|
|
|
|
| |||||||
Net investment income (loss) | (1,879,895 | ) | 4,516,514 | 5,377,989 | ||||||||
|
|
|
|
|
| |||||||
NET REALIZED AND UNREALIZED GAIN (LOSS) ON INVESTMENTS AND FUTURES CONTRACTS |
| |||||||||||
Net realized gain (loss) on: |
| |||||||||||
Investments | 688,859,379 | 2,740,390 | 4,014,542 | |||||||||
Futures contracts | — | (121,824 | ) | — | ||||||||
Net change in unrealized appreciation (depreciation) on: |
| |||||||||||
Investments | 1,682,057,052 | (6,659,758 | ) | (13,859,882 | ) | |||||||
Futures contracts | — | (9,936 | ) | — | ||||||||
Foreign currency translations (Note 2d) | (8,389 | ) | — | — | ||||||||
|
|
|
|
|
| |||||||
Net realized and unrealized gain (loss) on investments and futures contracts | 2,370,908,042 | (4,051,128 | ) | (9,845,340 | ) | |||||||
|
|
|
|
|
| |||||||
NET INCREASE (DECREASE) IN NET ASSETS RESULTING FROM OPERATIONS | $ | 2,369,028,147 | $ | 465,386 | $ | (4,467,351 | ) | |||||
|
|
|
|
|
| |||||||
See accompanying notes to financial statements.
| 80
Statements of Changes in Net Assets
| Core Plus Bond Fund | Credit Income Fund | |||||||||||||||
| Year Ended September 30, 2021 | Year Ended September 30, 2020 | Year Ended September 30, 2021 | Period Ended September 30, 2020(a) | |||||||||||||
FROM OPERATIONS: |
| |||||||||||||||
Net investment income | $ | 163,972,599 | $ | 170,336,486 | $ | 616,673 | $ | 374 | ||||||||
Net realized gain on investments, futures contracts, short sales and foreign currency transactions | 116,923,272 | 299,827,757 | 91,677 | — | ||||||||||||
Net change in unrealized appreciation (depreciation) on investments, futures contracts and foreign currency translations | (226,524,491 | ) | 200,630,915 | 680,884 | (85,094 | ) | ||||||||||
|
|
|
|
|
|
|
| |||||||||
Net increase (decrease) in net assets resulting from operations | 54,371,380 | 670,795,158 | 1,389,234 | (84,720 | ) | |||||||||||
|
|
|
|
|
|
|
| |||||||||
FROM DISTRIBUTIONS TO SHAREHOLDERS: |
| |||||||||||||||
Class A | (26,989,208 | ) | (11,953,860 | ) | (2,194 | ) | — | |||||||||
Class C | (4,109,684 | ) | (2,056,615 | ) | (20 | ) | — | |||||||||
Class N | (114,300,522 | ) | (67,400,814 | ) | (776,415 | ) | — | |||||||||
Class Y | (253,871,577 | ) | (111,898,170 | ) | (642 | ) | — | |||||||||
|
|
|
|
|
|
|
| |||||||||
Total distributions | (399,270,991 | ) | (193,309,459 | ) | (779,271 | ) | — | |||||||||
|
|
|
|
|
|
|
| |||||||||
NET INCREASE (DECREASE) IN NET ASSETS FROM CAPITAL SHARE TRANSACTIONS (NOTE 12) | (84,293,745 | ) | 1,308,282,070 | (572,703 | ) | 25,003,000 | ||||||||||
|
|
|
|
|
|
|
| |||||||||
Net increase (decrease) in net assets | (429,193,356 | ) | 1,785,767,769 | 37,260 | 24,918,280 | |||||||||||
NET ASSETS |
| |||||||||||||||
Beginning of the year | 9,278,743,703 | 7,492,975,934 | 24,918,280 | — | ||||||||||||
|
|
|
|
|
|
|
| |||||||||
End of the year | $ | 8,849,550,347 | $ | 9,278,743,703 | $ | 24,955,540 | $ | 24,918,280 | ||||||||
|
|
|
|
|
|
|
| |||||||||
| (a) | From commencement of operations on September 29, 2020 through September 30, 2020. |
See accompanying notes to financial statements.
81 |
Statements of Changes in Net Assets (continued)
| Global Allocation Fund | Growth Fund | |||||||||||||||
| Year Ended September 30, 2021 | Year Ended September 30, 2020 | Year Ended September 30, 2021 | Year Ended September 30, 2020 | |||||||||||||
FROM OPERATIONS: |
| |||||||||||||||
Net investment income (loss) | $ | 15,287,268 | $ | 17,209,846 | $ | (1,879,895 | ) | $ | 23,245,547 | |||||||
Net realized gain on investments, futures contracts, forward foreign currency contracts and foreign currency transactions | 369,056,675 | 216,871,990 | 688,859,379 | 534,694,084 | ||||||||||||
Net change in unrealized appreciation (depreciation) on investments, futures contracts, forward foreign currency contracts and foreign currency translations | 307,378,584 | 212,609,579 | 1,682,048,663 | 2,336,956,869 | ||||||||||||
|
|
|
|
|
|
|
| |||||||||
Net increase in net assets resulting from operations | 691,722,527 | 446,691,415 | 2,369,028,147 | 2,894,896,500 | ||||||||||||
|
|
|
|
|
|
|
| |||||||||
FROM DISTRIBUTIONS TO SHAREHOLDERS: |
| |||||||||||||||
Class A | (37,700,764 | ) | (13,439,861 | ) | (71,172,533 | ) | (35,045,986 | ) | ||||||||
Class C | (27,793,335 | ) | (11,301,039 | ) | (6,613,461 | ) | (3,210,189 | ) | ||||||||
Class N | (17,490,999 | ) | (6,572,302 | ) | (27,159,617 | ) | (16,996,001 | ) | ||||||||
Class Y | (172,869,178 | ) | (60,646,702 | ) | (427,889,322 | ) | (197,277,542 | ) | ||||||||
|
|
|
|
|
|
|
| |||||||||
Total distributions | (255,854,276 | ) | (91,959,904 | ) | (532,834,933 | ) | (252,529,718 | ) | ||||||||
|
|
|
|
|
|
|
| |||||||||
NET INCREASE IN NET ASSETS FROM CAPITAL SHARE TRANSACTIONS (NOTE 12) | 400,018,429 | 612,522,950 | 432,416,142 | 26,641,271 | ||||||||||||
|
|
|
|
|
|
|
| |||||||||
Net increase in net assets | 835,886,680 | 967,254,461 | 2,268,609,356 | 2,669,008,053 | ||||||||||||
NET ASSETS |
| |||||||||||||||
Beginning of the year | 4,041,557,654 | 3,074,303,193 | 11,500,024,801 | 8,831,016,748 | ||||||||||||
|
|
|
|
|
|
|
| |||||||||
End of the year | $ | 4,877,444,334 | $ | 4,041,557,654 | $ | 13,768,634,157 | $ | 11,500,024,801 | ||||||||
|
|
|
|
|
|
|
| |||||||||
See accompanying notes to financial statements.
| 82
Statements of Changes in Net Assets (continued)
| Intermediate Duration Bond Fund | Limited Term Government and Agency Fund | |||||||||||||||
| Year Ended September 30, 2021 | Year Ended September 30, 2020 | Year Ended September 30, 2021 | Year Ended September 30, 2020 | |||||||||||||
FROM OPERATIONS: |
| |||||||||||||||
Net investment income | $ | 4,516,514 | $ | 5,315,122 | $ | 5,377,989 | $ | 9,045,389 | ||||||||
Net realized gain on investments and futures contracts | 2,618,566 | 8,937,549 | 4,014,542 | 9,395,293 | ||||||||||||
Net change in unrealized appreciation (depreciation) on investments and futures contracts | (6,669,694 | ) | 4,520,840 | (13,859,882 | ) | 8,389,983 | ||||||||||
|
|
|
|
|
|
|
| |||||||||
Net increase (decrease) in net assets resulting from operations | 465,386 | 18,773,511 | (4,467,351 | ) | 26,830,665 | |||||||||||
|
|
|
|
|
|
|
| |||||||||
FROM DISTRIBUTIONS TO SHAREHOLDERS: |
| |||||||||||||||
Class A | (742,805 | ) | (502,738 | ) | (1,888,946 | ) | (4,298,464 | ) | ||||||||
Class C | (18,045 | ) | (8,696 | ) | (6,855 | ) | (141,631 | ) | ||||||||
Class N | (788,205 | ) | (94,763 | ) | (104,954 | ) | (149,308 | ) | ||||||||
Class Y | (12,363,185 | ) | (6,108,309 | ) | (6,301,562 | ) | (8,468,385 | ) | ||||||||
|
|
|
|
|
|
|
| |||||||||
Total distributions | (13,912,240 | ) | (6,714,506 | ) | (8,302,317 | ) | (13,057,788 | ) | ||||||||
|
|
|
|
|
|
|
| |||||||||
NET INCREASE IN NET ASSETS FROM CAPITAL SHARE TRANSACTIONS (NOTE 12) | 77,608,974 | 64,275,136 | 27,315,308 | 211,874,926 | ||||||||||||
|
|
|
|
|
|
|
| |||||||||
Net increase in net assets | 64,162,120 | 76,334,141 | 14,545,640 | 225,647,803 | ||||||||||||
NET ASSETS |
| |||||||||||||||
Beginning of the year | 317,514,362 | 241,180,221 | 1,018,495,764 | 792,847,961 | ||||||||||||
|
|
|
|
|
|
|
| |||||||||
End of the year | $ | 381,676,482 | $ | 317,514,362 | $ | 1,033,041,404 | $ | 1,018,495,764 | ||||||||
|
|
|
|
|
|
|
| |||||||||
See accompanying notes to financial statements.
83 |
Financial Highlights
For a share outstanding throughout each period.
| Core Plus Bond Fund—Class A | ||||||||||||||||||||
| Year Ended September 30, 2021 | Year Ended September 30, 2020 | Year Ended September 30, 2019 | Year Ended September 30, 2018 | Year Ended September 30, 2017 | ||||||||||||||||
Net asset value, beginning of the period | $ | 14.08 | $ | 13.25 | $ | 12.53 | $ | 12.96 | $ | 13.06 | ||||||||||
|
|
|
|
|
|
|
|
|
| |||||||||||
INCOME (LOSS) FROM INVESTMENT OPERATIONS: | ||||||||||||||||||||
Net investment income(a) | 0.21 | 0.26 | 0.34 | 0.35 | 0.28 | |||||||||||||||
Net realized and unrealized gain (loss) | (0.13 | ) | 0.86 | 0.70 | (0.38 | ) | (0.04 | ) | ||||||||||||
|
|
|
|
|
|
|
|
|
| |||||||||||
Total from Investment Operations | 0.08 | 1.12 | 1.04 | (0.03 | ) | 0.24 | ||||||||||||||
|
|
|
|
|
|
|
|
|
| |||||||||||
LESS DISTRIBUTIONS FROM: | ||||||||||||||||||||
Net investment income | (0.29 | ) | (0.29 | ) | (0.32 | ) | (0.40 | ) | (0.34 | ) | ||||||||||
Net realized capital gains | (0.28 | ) | — | — | — | — | ||||||||||||||
|
|
|
|
|
|
|
|
|
| |||||||||||
Total Distributions | (0.57 | ) | (0.29 | ) | (0.32 | ) | (0.40 | ) | (0.34 | ) | ||||||||||
|
|
|
|
|
|
|
|
|
| |||||||||||
Net asset value, end of the period | $ | 13.59 | $ | 14.08 | $ | 13.25 | $ | 12.53 | $ | 12.96 | ||||||||||
|
|
|
|
|
|
|
|
|
| |||||||||||
Total return(b) | 0.53 | % | 8.60 | % | 8.39 | % | (0.27 | )% | 1.86 | % | ||||||||||
RATIOS TO AVERAGE NET ASSETS: | ||||||||||||||||||||
Net assets, end of the period (000’s) | $ | 747,497 | $ | 617,609 | $ | 558,291 | $ | 600,762 | $ | 676,892 | ||||||||||
Net expenses | 0.71 | % | 0.72 | %(c) | 0.73 | % | 0.73 | % | 0.73 | % | ||||||||||
Gross expenses | 0.71 | % | 0.72 | % | 0.73 | % | 0.73 | % | 0.73 | % | ||||||||||
Net investment income | 1.51 | % | 1.88 | % | 2.63 | % | 2.71 | % | 2.19 | % | ||||||||||
Portfolio turnover rate | 266 | % | 359 | %(d) | 297 | %(e) | 181 | % | 195 | % | ||||||||||
| (a) | Per share net investment income has been calculated using the average shares outstanding during the period. |
| (b) | A sales charge for Class A shares is not reflected in total return calculations. |
| (c) | Effective July 1, 2020, the expense limit decreased from 0.80% to 0.75%. |
| (d) | The variation in the Fund’s turnover rate from 2019 to 2020 was primarily due to a significant repositioning of the portfolio. |
| (e) | The variation in the Fund’s turnover rate from 2018 to 2019 is due to an increase in the volume of U.S. Treasury securities related to certain trading strategies. |
See accompanying notes to financial statements.
| 84
Financial Highlights (continued)
For a share outstanding throughout each period.
| Core Plus Bond Fund—Class C | ||||||||||||||||||||
| Year Ended September 30, 2021 | Year Ended September 30, 2020 | Year Ended September 30, 2019 | Year Ended September 30, 2018 | Year Ended September 30, 2017 | ||||||||||||||||
Net asset value, beginning of the period | $ | 14.09 | $ | 13.25 | $ | 12.53 | $ | 12.96 | $ | 13.06 | ||||||||||
|
|
|
|
|
|
|
|
|
| |||||||||||
INCOME (LOSS) FROM INVESTMENT OPERATIONS: | ||||||||||||||||||||
Net investment income(a) | 0.10 | 0.15 | 0.24 | 0.25 | 0.19 | |||||||||||||||
Net realized and unrealized gain (loss) | (0.13 | ) | 0.88 | 0.70 | (0.38 | ) | (0.05 | ) | ||||||||||||
|
|
|
|
|
|
|
|
|
| |||||||||||
Total from Investment Operations | (0.03 | ) | 1.03 | 0.94 | (0.13 | ) | 0.14 | |||||||||||||
|
|
|
|
|
|
|
|
|
| |||||||||||
LESS DISTRIBUTIONS FROM: | ||||||||||||||||||||
Net investment income | (0.18 | ) | (0.19 | ) | (0.22 | ) | (0.30 | ) | (0.24 | ) | ||||||||||
Net realized capital gains | (0.28 | ) | — | — | — | — | ||||||||||||||
|
|
|
|
|
|
|
|
|
| |||||||||||
Total Distributions | (0.46 | ) | (0.19 | ) | (0.22 | ) | (0.30 | ) | (0.24 | ) | ||||||||||
|
|
|
|
|
|
|
|
|
| |||||||||||
Net asset value, end of the period | $ | 13.60 | $ | 14.09 | $ | 13.25 | $ | 12.53 | $ | 12.96 | ||||||||||
|
|
|
|
|
|
|
|
|
| |||||||||||
Total return(b) | (0.24 | )% | 7.83 | % | 7.57 | % | (1.03 | )% | 1.08 | % | ||||||||||
RATIOS TO AVERAGE NET ASSETS: | ||||||||||||||||||||
Net assets, end of the period (000’s) | $ | 95,755 | $ | 132,590 | $ | 160,201 | $ | 185,758 | $ | 248,687 | ||||||||||
Net expenses | 1.46 | % | 1.47 | %(c) | 1.48 | % | 1.48 | % | 1.48 | % | ||||||||||
Gross expenses | 1.46 | % | 1.47 | % | 1.48 | % | 1.48 | % | 1.48 | % | ||||||||||
Net investment income | 0.75 | % | 1.13 | % | 1.88 | % | 1.96 | % | 1.44 | % | ||||||||||
Portfolio turnover rate | 266 | % | 359 | %(d) | 297 | %(e) | 181 | % | 195 | % | ||||||||||
| (a) | Per share net investment income has been calculated using the average shares outstanding during the period. |
| (b) | A contingent deferred sales charge for Class C shares is not reflected in total return calculations. |
| (c) | Effective July 1, 2020, the expense limit decreased from 1.55% to 1.50%. |
| (d) | The variation in the Fund’s turnover rate from 2019 to 2020 was primarily due to a significant repositioning of the portfolio. |
| (e) | The variation in the Fund’s turnover rate from 2018 to 2019 is due to an increase in the volume of U.S. Treasury securities related to certain trading strategies. |
See accompanying notes to financial statements.
85 |
Financial Highlights (continued)
For a share outstanding throughout each period.
| Core Plus Bond Fund—Class N | ||||||||||||||||||||
| Year Ended September 30, 2021 | Year Ended September 30, 2020 | Year Ended September 30, 2019 | Year Ended September 30, 2018 | Year Ended September 30, 2017 | ||||||||||||||||
Net asset value, beginning of the period | $ | 14.21 | $ | 13.37 | $ | 12.63 | $ | 13.06 | $ | 13.17 | ||||||||||
|
|
|
|
|
|
|
|
|
| |||||||||||
INCOME (LOSS) FROM INVESTMENT OPERATIONS: | ||||||||||||||||||||
Net investment income(a) | 0.26 | 0.30 | 0.38 | 0.39 | 0.33 | |||||||||||||||
Net realized and unrealized gain (loss) | (0.14 | ) | 0.88 | 0.72 | (0.38 | ) | (0.06 | ) | ||||||||||||
|
|
|
|
|
|
|
|
|
| |||||||||||
Total from Investment Operations | 0.12 | 1.18 | 1.10 | 0.01 | 0.27 | |||||||||||||||
|
|
|
|
|
|
|
|
|
| |||||||||||
LESS DISTRIBUTIONS FROM: | ||||||||||||||||||||
Net investment income | (0.33 | ) | (0.34 | ) | (0.36 | ) | (0.44 | ) | (0.38 | ) | ||||||||||
Net realized capital gains | (0.28 | ) | — | — | — | — | ||||||||||||||
|
|
|
|
|
|
|
|
|
| |||||||||||
Total Distributions | (0.61 | ) | (0.34 | ) | (0.36 | ) | (0.44 | ) | (0.38 | ) | ||||||||||
|
|
|
|
|
|
|
|
|
| |||||||||||
Net asset value, end of the period | $ | 13.72 | $ | 14.21 | $ | 13.37 | $ | 12.63 | $ | 13.06 | ||||||||||
|
|
|
|
|
|
|
|
|
| |||||||||||
Total return | 0.86 | % | 8.95 | % | 8.85 | % | 0.07 | % | 2.12 | % | ||||||||||
RATIOS TO AVERAGE NET ASSETS: | ||||||||||||||||||||
Net assets, end of the period (000’s) | $ | 2,563,736 | $ | 2,682,487 | $ | 2,610,699 | $ | 1,899,190 | $ | 1,784,150 | ||||||||||
Net expenses | 0.38 | % | 0.38 | %(b) | 0.39 | % | 0.39 | % | 0.39 | % | ||||||||||
Gross expenses | 0.38 | % | 0.38 | % | 0.39 | % | 0.39 | % | 0.39 | % | ||||||||||
Net investment income | 1.84 | % | 2.21 | % | 2.96 | % | 3.06 | % | 2.53 | % | ||||||||||
Portfolio turnover rate | 266 | % | 359 | %(c) | 297 | %(d) | 181 | % | 195 | % | ||||||||||
| (a) | Per share net investment income has been calculated using the average shares outstanding during the period. |
| (b) | Effective July 1, 2020, the expense limit decreased from 0.50% to 0.45%. |
| (c) | The variation in the Fund’s turnover rate from 2019 to 2020 was primarily due to a significant repositioning of the portfolio. |
| (d) | The variation in the Fund’s turnover rate from 2018 to 2019 is due to an increase in the volume of U.S. Treasury securities related to certain trading strategies. |
See accompanying notes to financial statements.
| 86
Financial Highlights (continued)
For a share outstanding throughout each period.
| Core Plus Bond Fund—Class Y | ||||||||||||||||||||
| Year Ended September 30, 2021 | Year Ended September 30, 2020 | Year Ended September 30, 2019 | Year Ended September 30, 2018 | Year Ended September 30, 2017 | ||||||||||||||||
Net asset value, beginning of the period | $ | 14.20 | $ | 13.36 | $ | 12.63 | $ | 13.06 | $ | 13.16 | ||||||||||
|
|
|
|
|
|
|
|
|
| |||||||||||
INCOME (LOSS) FROM INVESTMENT OPERATIONS: | ||||||||||||||||||||
Net investment income(a) | 0.24 | 0.29 | 0.37 | 0.38 | 0.31 | |||||||||||||||
Net realized and unrealized gain (loss) | (0.13 | ) | 0.88 | 0.71 | (0.38 | ) | (0.04 | ) | ||||||||||||
|
|
|
|
|
|
|
|
|
| |||||||||||
Total from Investment Operations | 0.11 | 1.17 | 1.08 | 0.00 | (b) | 0.27 | ||||||||||||||
|
|
|
|
|
|
|
|
|
| |||||||||||
LESS DISTRIBUTIONS FROM: | ||||||||||||||||||||
Net investment income | (0.32 | ) | (0.33 | ) | (0.35 | ) | (0.43 | ) | (0.37 | ) | ||||||||||
Net realized capital gains | (0.28 | ) | — | — | — | — | ||||||||||||||
|
|
|
|
|
|
|
|
|
| |||||||||||
Total Distributions | (0.60 | ) | (0.33 | ) | (0.35 | ) | (0.43 | ) | (0.37 | ) | ||||||||||
|
|
|
|
|
|
|
|
|
| |||||||||||
Net asset value, end of the period | $ | 13.71 | $ | 14.20 | $ | 13.36 | $ | 12.63 | $ | 13.06 | ||||||||||
|
|
|
|
|
|
|
|
|
| |||||||||||
Total return | 0.78 | % | 8.87 | % | 8.67 | % | (0.02 | )% | 2.10 | % | ||||||||||
RATIOS TO AVERAGE NET ASSETS: | ||||||||||||||||||||
Net assets, end of the period (000’s) | $ | 5,442,563 | $ | 5,846,057 | $ | 4,163,785 | $ | 3,733,751 | $ | 3,846,208 | ||||||||||
Net expenses | 0.46 | % | 0.47 | %(c) | 0.48 | % | 0.48 | % | 0.48 | % | ||||||||||
Gross expenses | 0.46 | % | 0.47 | % | 0.48 | % | 0.48 | % | 0.48 | % | ||||||||||
Net investment income | 1.76 | % | 2.11 | % | 2.87 | % | 2.97 | % | 2.43 | % | ||||||||||
Portfolio turnover rate | 266 | % | 359 | %(d) | 297 | %(e) | 181 | % | 195 | % | ||||||||||
| (a) | Per share net investment income has been calculated using the average shares outstanding during the period. |
| (b) | Amount rounds to less than $0.01 per share. |
| (c) | Effective July 1, 2020, the expense limit decreased from 0.55% to 0.50%. |
| (d) | The variation in the Fund’s turnover rate from 2019 to 2020 was primarily due to a significant repositioning of the portfolio. |
| (e) | The variation in the Fund’s turnover rate from 2018 to 2019 is due to an increase in the volume of U.S. Treasury securities related to certain trading strategies. |
See accompanying notes to financial statements.
87 |
Financial Highlights (continued)
For a share outstanding throughout each period.
| Credit Income Fund—Class A | ||||||||
| Year Ended September 30, 2021 | Period Ended September 30, 2020* | |||||||
Net asset value, beginning of the period | $ | 9.97 | $ | 10.00 | ||||
|
|
|
| |||||
INCOME (LOSS) FROM INVESTMENT OPERATIONS: | ||||||||
Net investment income (loss)(a) | 0.21 | (0.00 | )(b) | |||||
Net realized and unrealized gain (loss) | 0.31 | (0.03 | ) | |||||
|
|
|
| |||||
Total from Investment Operations | 0.52 | (0.03 | ) | |||||
|
|
|
| |||||
LESS DISTRIBUTIONS FROM: | ||||||||
Net investment income | (0.28 | ) | — | |||||
Net realized capital gains | (0.00 | )(b) | — | |||||
|
|
|
| |||||
Total Distributions | (0.28 | ) | — | |||||
|
|
|
| |||||
Net asset value, end of the period | $ | 10.21 | $ | 9.97 | ||||
|
|
|
| |||||
Total return(c)(d) | 5.24 | % | (0.30 | )%(e) | ||||
RATIOS TO AVERAGE NET ASSETS: | ||||||||
Net assets, end of the period (000’s) | $ | 91 | $ | 1 | ||||
Net expenses(f) | 0.82 | % | 0.82 | %(g) | ||||
Gross expenses | 4.79 | % | 125.79 | %(g) | ||||
Net investment income (loss) | 2.07 | % | (0.82 | )%(g) | ||||
Portfolio turnover rate | 55 | % | 0 | % | ||||
| * | From commencement of operations on September 29, 2020 through September 30, 2020. |
| (a) | Per share net investment income (loss) has been calculated using the average shares outstanding during the period. |
| (b) | Amount rounds to less than $0.01 per share. |
| (c) | A sales charge for Class A shares is not reflected in total return calculations. |
| (d) | Had certain expenses not been waived/reimbursed during the period, total returns would have been lower. |
| (e) | Periods less than one year are not annualized. |
| (f) | The investment adviser agreed to waive its fees and/or reimburse a portion of the Fund’s expenses during the period. Without this waiver/reimbursement, expenses would have been higher. |
| (g) | Computed on an annualized basis for periods less than one year. |
See accompanying notes to financial statements.
| 88
Financial Highlights (continued)
For a share outstanding throughout each period.
| Credit Income Fund—Class C | ||||||||
| Year Ended September 30, 2021 | Period Ended September 30, 2020* | |||||||
Net asset value, beginning of the period | $ | 9.97 | $ | 10.00 | ||||
|
|
|
| |||||
INCOME (LOSS) FROM INVESTMENT OPERATIONS: | ||||||||
Net investment income (loss)(a) | 0.13 | (0.00 | )(b) | |||||
Net realized and unrealized gain (loss) | 0.30 | (0.03 | ) | |||||
|
|
|
| |||||
Total from Investment Operations | 0.43 | (0.03 | ) | |||||
|
|
|
| |||||
LESS DISTRIBUTIONS FROM: | ||||||||
Net investment income | (0.20 | ) | — | |||||
Net realized capital gains | (0.00 | )(b) | — | |||||
|
|
|
| |||||
Total Distributions | (0.20 | ) | — | |||||
|
|
|
| |||||
Net asset value, end of the period | $ | 10.20 | $ | 9.97 | ||||
|
|
|
| |||||
Total return(c)(d) | 4.34 | % | (0.30 | )%(e) | ||||
RATIOS TO AVERAGE NET ASSETS: | ||||||||
Net assets, end of the period (000’s) | $ | 1 | $ | 1 | ||||
Net expenses(f) | 1.57 | % | 1.57 | %(g) | ||||
Gross expenses | 5.60 | % | 126.54 | %(g) | ||||
Net investment income (loss) | 1.29 | % | (1.57 | )%(g) | ||||
Portfolio turnover rate | 55 | % | 0 | % | ||||
| * | From commencement of operations on September 29, 2020 through September 30, 2020. |
| (a) | Per share net investment income (loss) has been calculated using the average shares outstanding during the period. |
| (b) | Amount rounds to less than $0.01 per share. |
| (c) | A contingent deferred sales charge for Class C shares is not reflected in total return calculations. |
| (d) | Had certain expenses not been waived/reimbursed during the period, total returns would have been lower. |
| (e) | Periods less than one year are not annualized. |
| (f) | The investment adviser agreed to waive its fees and/or reimburse a portion of the Fund’s expenses during the period. Without this waiver/reimbursement, expenses would have been higher. |
| (g) | Computed on an annualized basis for periods less than one year. |
See accompanying notes to financial statements.
89 |
Financial Highlights (continued)
For a share outstanding throughout each period.
| Credit Income Fund—Class N | ||||||||
| Year Ended September 30, 2021 | Period Ended September 30, 2020* | |||||||
Net asset value, beginning of the period | $ | 9.97 | $ | 10.00 | ||||
|
|
|
| |||||
INCOME (LOSS) FROM INVESTMENT OPERATIONS: | ||||||||
Net investment income(a) | 0.24 | 0.00 | (b) | |||||
Net realized and unrealized gain (loss) | 0.31 | (0.03 | ) | |||||
|
|
|
| |||||
Total from Investment Operations | 0.55 | (0.03 | ) | |||||
|
|
|
| |||||
LESS DISTRIBUTIONS FROM: | ||||||||
Net investment income | (0.31 | ) | — | |||||
Net realized capital gains | (0.00 | )(b) | — | |||||
|
|
|
| |||||
Total Distributions | (0.31 | ) | — | |||||
|
|
|
| |||||
Net asset value, end of the period | $ | 10.21 | $ | 9.97 | ||||
|
|
|
| |||||
Total return(c) | 5.54 | % | (0.30 | )%(d) | ||||
RATIOS TO AVERAGE NET ASSETS: | ||||||||
Net assets, end of the period (000’s) | $ | 24,842 | $ | 24,915 | ||||
Net expenses(e) | 0.52 | % | 0.52 | %(f) | ||||
Gross expenses | 1.16 | % | 27.91 | %(f) | ||||
Net investment income | 2.38 | % | 0.55 | %(f) | ||||
Portfolio turnover rate | 55 | % | 0 | % | ||||
| * | From commencement of operations on September 29, 2020 through September 30, 2020. |
| (a) | Per share net investment income has been calculated using the average shares outstanding during the period. |
| (b) | Amount rounds to less than $0.01 per share. |
| (c) | Had certain expenses not been waived/reimbursed during the period, total returns would have been lower. |
| (d) | Periods less than one year are not annualized. |
| (e) | The investment adviser agreed to waive its fees and/or reimburse a portion of the Fund’s expenses during the period. Without this waiver/reimbursement, expenses would have been higher. |
| (f) | Computed on an annualized basis for periods less than one year. |
See accompanying notes to financial statements.
| 90
Financial Highlights (continued)
For a share outstanding throughout each period.
| Credit Income Fund—Class Y | ||||||||
| Year Ended September 30, 2021 | Period Ended September 30, 2020* | |||||||
Net asset value, beginning of the period | $ | 9.97 | $ | 10.00 | ||||
|
|
|
| |||||
INCOME (LOSS) FROM INVESTMENT OPERATIONS: | ||||||||
Net investment income (loss)(a) | 0.24 | (0.00 | )(b) | |||||
Net realized and unrealized gain (loss) | 0.29 | (0.03 | ) | |||||
|
|
|
| |||||
Total from Investment Operations | 0.53 | (0.03 | ) | |||||
|
|
|
| |||||
LESS DISTRIBUTIONS FROM: | ||||||||
Net investment income | (0.30 | ) | — | |||||
Net realized capital gains | (0.00 | )(b) | — | |||||
|
|
|
| |||||
Total Distributions | (0.30 | ) | — | |||||
|
|
|
| |||||
Net asset value, end of the period | $ | 10.20 | $ | 9.97 | ||||
|
|
|
| |||||
Total return(c) | 5.38 | % | (0.30 | )%(d) | ||||
RATIOS TO AVERAGE NET ASSETS: | ||||||||
Net assets, end of the period (000’s) | $ | 22 | $ | 1 | ||||
Net expenses(e) | 0.57 | % | 0.57 | %(f) | ||||
Gross expenses | 4.54 | % | 125.54 | %(f) | ||||
Net investment income (loss) | 2.33 | % | (0.57 | )%(f) | ||||
Portfolio turnover rate | 55 | % | 0 | % | ||||
| * | From commencement of operations on September 29, 2020 through September 30, 2020. |
| (a) | Per share net investment income (loss) has been calculated using the average shares outstanding during the period. |
| (b) | Amount rounds to less than $0.01 per share. |
| (c) | Had certain expenses not been waived/reimbursed during the period, total returns would have been lower. |
| (d) | Periods less than one year are not annualized. |
| (e) | The investment adviser agreed to waive its fees and/or reimburse a portion of the Fund’s expenses during the period. Without this waiver/reimbursement, expenses would have been higher. |
| (f) | Computed on an annualized basis for periods less than one year. |
See accompanying notes to financial statements.
91 |
Financial Highlights (continued)
For a share outstanding throughout each period.
| Global Allocation Fund—Class A | ||||||||||||||||||||
| Year Ended September 30, 2021 | Year Ended September 30, 2020 | Year Ended September 30, 2019 | Year Ended September 30, 2018 | Year Ended September 30, 2017 | ||||||||||||||||
Net asset value, beginning of the period | $ | 26.23 | $ | 23.76 | $ | 23.10 | $ | 21.60 | $ | 19.17 | ||||||||||
|
|
|
|
|
|
|
|
|
| |||||||||||
INCOME (LOSS) FROM INVESTMENT OPERATIONS: | ||||||||||||||||||||
Net investment income(a) | 0.06 | 0.10 | 0.19 | 0.23 | 0.31 | |||||||||||||||
Net realized and unrealized gain (loss) | 4.18 | 3.05 | 1.38 | 1.75 | 2.36 | |||||||||||||||
|
|
|
|
|
|
|
|
|
| |||||||||||
Total from Investment Operations | 4.24 | 3.15 | 1.57 | 1.98 | 2.67 | |||||||||||||||
|
|
|
|
|
|
|
|
|
| |||||||||||
LESS DISTRIBUTIONS FROM: | ||||||||||||||||||||
Net investment income | (0.13 | ) | (0.12 | ) | (0.16 | ) | (0.19 | ) | (0.24 | ) | ||||||||||
Net realized capital gains | (1.48 | ) | (0.56 | ) | (0.75 | ) | (0.29 | ) | — | |||||||||||
|
|
|
|
|
|
|
|
|
| |||||||||||
Total Distributions | (1.61 | ) | (0.68 | ) | (0.91 | ) | (0.48 | ) | (0.24 | ) | ||||||||||
|
|
|
|
|
|
|
|
|
| |||||||||||
Net asset value, end of the period | $ | 28.86 | $ | 26.23 | $ | 23.76 | $ | 23.10 | $ | 21.60 | ||||||||||
|
|
|
|
|
|
|
|
|
| |||||||||||
Total return(b) | 16.73 | % | 13.41 | % | 7.66 | % | 9.26 | % | 14.10 | % | ||||||||||
RATIOS TO AVERAGE NET ASSETS: | ||||||||||||||||||||
Net assets, end of the period (000’s) | $ | 737,469 | $ | 632,479 | $ | 453,009 | $ | 401,036 | $ | 305,275 | ||||||||||
Net expenses | 1.13 | % | 1.15 | % | 1.16 | % | 1.16 | % | 1.18 | % | ||||||||||
Gross expenses | 1.13 | % | 1.15 | % | 1.16 | % | 1.16 | % | 1.18 | % | ||||||||||
Net investment income | 0.23 | % | 0.42 | % | 0.83 | % | 1.03 | % | 1.57 | % | ||||||||||
Portfolio turnover rate | 45 | % | 37 | % | 27 | % | 22 | % | 35 | % | ||||||||||
| (a) | Per share net investment income has been calculated using the average shares outstanding during the period. |
| (b) | A sales charge for Class A shares is not reflected in total return calculations. |
See accompanying notes to financial statements.
| 92
Financial Highlights (continued)
For a share outstanding throughout each period.
| Global Allocation Fund—Class C | ||||||||||||||||||||
| Year Ended September 30, 2021 | Year Ended September 30, 2020 | Year Ended September 30, 2019 | Year Ended September 30, 2018 | Year Ended September 30, 2017 | ||||||||||||||||
Net asset value, beginning of the period | $ | 25.78 | $ | 23.43 | $ | 22.78 | $ | 21.29 | $ | 18.89 | ||||||||||
|
|
|
|
|
|
|
|
|
| |||||||||||
INCOME (LOSS) FROM INVESTMENT OPERATIONS: | ||||||||||||||||||||
Net investment income (loss)(a) | (0.14 | ) | (0.08 | ) | 0.02 | 0.06 | 0.16 | |||||||||||||
Net realized and unrealized gain (loss) | 4.10 | 2.99 | 1.38 | 1.73 | 2.33 | |||||||||||||||
|
|
|
|
|
|
|
|
|
| |||||||||||
Total from Investment Operations | 3.96 | 2.91 | 1.40 | 1.79 | 2.49 | |||||||||||||||
|
|
|
|
|
|
|
|
|
| |||||||||||
LESS DISTRIBUTIONS FROM: | ||||||||||||||||||||
Net investment income | — | — | (0.00 | )(b) | (0.01 | ) | (0.09 | ) | ||||||||||||
Net realized capital gains | (1.48 | ) | (0.56 | ) | (0.75 | ) | (0.29 | ) | — | |||||||||||
|
|
|
|
|
|
|
|
|
| |||||||||||
Total Distributions | (1.48 | ) | (0.56 | ) | (0.75 | ) | (0.30 | ) | (0.09 | ) | ||||||||||
|
|
|
|
|
|
|
|
|
| |||||||||||
Net asset value, end of the period | $ | 28.26 | $ | 25.78 | $ | 23.43 | $ | 22.78 | $ | 21.29 | ||||||||||
|
|
|
|
|
|
|
|
|
| |||||||||||
Total return(c) | 15.85 | % | 12.55 | % | 6.85 | % | 8.46 | % | 13.22 | % | ||||||||||
RATIOS TO AVERAGE NET ASSETS: | ||||||||||||||||||||
Net assets, end of the period (000’s) | $ | 503,073 | $ | 483,814 | $ | 480,479 | $ | 412,610 | $ | 354,017 | ||||||||||
Net expenses | 1.88 | % | 1.90 | % | 1.91 | % | 1.91 | % | 1.93 | % | ||||||||||
Gross expenses | 1.88 | % | 1.90 | % | 1.91 | % | 1.91 | % | 1.93 | % | ||||||||||
Net investment income (loss) | (0.52 | )% | (0.33 | )% | 0.08 | % | 0.29 | % | 0.84 | % | ||||||||||
Portfolio turnover rate | 45 | % | 37 | % | 27 | % | 22 | % | 35 | % | ||||||||||
| (a) | Per share net investment income (loss) has been calculated using the average shares outstanding during the period. |
| (b) | Amount rounds to less than $0.01 per share. |
| (c) | A contingent deferred sales charge for Class C shares is not reflected in total return calculations. |
See accompanying notes to financial statements.
93 |
Financial Highlights (continued)
For a share outstanding throughout each period.
| Global Allocation Fund—Class N | ||||||||||||||||||||
| Year Ended September 30, 2021 | Year Ended September 30, 2020 | Year Ended September 30, 2019 | Year Ended September 30, 2018 | Period Ended September 30, 2017* | ||||||||||||||||
Net asset value, beginning of the period | $ | 26.42 | $ | 23.92 | $ | 23.25 | $ | 21.73 | $ | 19.20 | ||||||||||
|
|
|
|
|
|
|
|
|
| |||||||||||
INCOME (LOSS) FROM INVESTMENT OPERATIONS: | ||||||||||||||||||||
Net investment income(a) | 0.15 | 0.18 | 0.27 | 0.31 | 0.20 | |||||||||||||||
Net realized and unrealized gain (loss) | 4.21 | 3.07 | 1.38 | 1.75 | 2.33 | |||||||||||||||
|
|
|
|
|
|
|
|
|
| |||||||||||
Total from Investment Operations | 4.36 | 3.25 | 1.65 | 2.06 | 2.53 | |||||||||||||||
|
|
|
|
|
|
|
|
|
| |||||||||||
LESS DISTRIBUTIONS FROM: | ||||||||||||||||||||
Net investment income | (0.21 | ) | (0.19 | ) | (0.23 | ) | (0.25 | ) | — | |||||||||||
Net realized capital gains | (1.48 | ) | (0.56 | ) | (0.75 | ) | (0.29 | ) | — | |||||||||||
|
|
|
|
|
|
|
|
|
| |||||||||||
Total Distributions | (1.69 | ) | (0.75 | ) | (0.98 | ) | (0.54 | ) | — | |||||||||||
|
|
|
|
|
|
|
|
|
| |||||||||||
Net asset value, end of the period | $ | 29.09 | $ | 26.42 | $ | 23.92 | $ | 23.25 | $ | 21.73 | ||||||||||
|
|
|
|
|
|
|
|
|
| |||||||||||
Total return | 17.10 | % | 13.78 | % | 8.04 | % | 9.60 | % | 13.18 | %(b) | ||||||||||
RATIOS TO AVERAGE NET ASSETS: | ||||||||||||||||||||
Net assets, end of the period (000’s) | $ | 350,222 | $ | 264,338 | $ | 202,692 | $ | 80,346 | $ | 59,512 | ||||||||||
Net expenses | 0.81 | % | 0.82 | % | 0.82 | % | 0.83 | % | 0.87 | %(c) | ||||||||||
Gross expenses | 0.81 | % | 0.82 | % | 0.82 | % | 0.83 | % | 0.87 | %(c) | ||||||||||
Net investment income | 0.55 | % | 0.76 | % | 1.20 | % | 1.36 | % | 1.48 | %(c) | ||||||||||
Portfolio turnover rate | 45 | % | 37 | % | 27 | % | 22 | % | 35 | %(d) | ||||||||||
| * | From commencement of Class operations on February 1, 2017 through September 30, 2017. |
| (a) | Per share net investment income has been calculated using the average shares outstanding during the period. |
| (b) | Periods less than one year are not annualized. |
| (c) | Computed on an annualized basis for periods less than one year. |
| (d) | Represents the Fund’s portfolio turnover rate for the year ended September 30, 2017. |
See accompanying notes to financial statements.
| 94
Financial Highlights (continued)
For a share outstanding throughout each period.
| Global Allocation Fund—Class Y | ||||||||||||||||||||
| Year Ended September 30, 2021 | Year Ended September 30, 2020 | Year Ended September 30, 2019 | Year Ended September 30, 2018 | Year Ended September 30, 2017 | ||||||||||||||||
Net asset value, beginning of the period | $ | 26.42 | $ | 23.92 | $ | 23.25 | $ | 21.74 | $ | 19.29 | ||||||||||
|
|
|
|
|
|
|
|
|
| |||||||||||
INCOME (LOSS) FROM INVESTMENT OPERATIONS: | ||||||||||||||||||||
Net investment income(a) | 0.13 | 0.16 | 0.24 | 0.29 | 0.36 | |||||||||||||||
Net realized and unrealized gain (loss) | 4.21 | 3.07 | 1.40 | 1.75 | 2.37 | |||||||||||||||
|
|
|
|
|
|
|
|
|
| |||||||||||
Total from Investment Operations | 4.34 | 3.23 | 1.64 | 2.04 | 2.73 | |||||||||||||||
|
|
|
|
|
|
|
|
|
| |||||||||||
LESS DISTRIBUTIONS FROM: | ||||||||||||||||||||
Net investment income | (0.19 | ) | (0.17 | ) | (0.22 | ) | (0.24 | ) | (0.28 | ) | ||||||||||
Net realized capital gains | (1.48 | ) | (0.56 | ) | (0.75 | ) | (0.29 | ) | — | |||||||||||
|
|
|
|
|
|
|
|
|
| |||||||||||
Total Distributions | (1.67 | ) | (0.73 | ) | (0.97 | ) | (0.53 | ) | (0.28 | ) | ||||||||||
|
|
|
|
|
|
|
|
|
| |||||||||||
Net asset value, end of the period | $ | 29.09 | $ | 26.42 | $ | 23.92 | $ | 23.25 | $ | 21.74 | ||||||||||
|
|
|
|
|
|
|
|
|
| |||||||||||
Total return | 17.02 | % | 13.70 | % | 7.95 | % | 9.49 | % | 14.42 | % | ||||||||||
RATIOS TO AVERAGE NET ASSETS: | ||||||||||||||||||||
Net assets, end of the period (000’s) | $ | 3,286,680 | $ | 2,660,927 | $ | 1,938,124 | $ | 1,549,689 | $ | 1,067,062 | ||||||||||
Net expenses | 0.88 | % | 0.90 | % | 0.91 | % | 0.91 | % | 0.93 | % | ||||||||||
Gross expenses | 0.88 | % | 0.90 | % | 0.91 | % | 0.91 | % | 0.93 | % | ||||||||||
Net investment income | 0.48 | % | 0.67 | % | 1.08 | % | 1.29 | % | 1.79 | % | ||||||||||
Portfolio turnover rate | 45 | % | 37 | % | 27 | % | 22 | % | 35 | % | ||||||||||
| (a) | Per share net investment income has been calculated using the average shares outstanding during the period. |
See accompanying notes to financial statements.
95 |
Financial Highlights (continued)
For a share outstanding throughout each period.
| Growth Fund—Class A | ||||||||||||||||||||
| Year Ended September 30, 2021 | Year Ended September 30, 2020 | Year Ended September 30, 2019 | Year Ended September 30, 2018 | Year Ended September 30, 2017 | ||||||||||||||||
Net asset value, beginning of the period | $ | 20.72 | $ | 16.02 | $ | 16.05 | $ | 14.04 | $ | 11.96 | ||||||||||
|
|
|
|
|
|
|
|
|
| |||||||||||
INCOME (LOSS) FROM INVESTMENT OPERATIONS: | ||||||||||||||||||||
Net investment income (loss)(a) | (0.05 | ) | 0.01 | 0.05 | 0.06 | 0.06 | ||||||||||||||
Net realized and unrealized gain (loss) | 4.17 | 5.14 | 0.71 | 2.29 | 2.18 | |||||||||||||||
|
|
|
|
|
|
|
|
|
| |||||||||||
Total from Investment Operations | 4.12 | 5.15 | 0.76 | 2.35 | 2.24 | |||||||||||||||
|
|
|
|
|
|
|
|
|
| |||||||||||
LESS DISTRIBUTIONS FROM: | ||||||||||||||||||||
Net investment income | — | (0.05 | ) | (0.05 | ) | (0.05 | ) | (0.05 | ) | |||||||||||
Net realized capital gains | (0.99 | ) | (0.40 | ) | (0.74 | ) | (0.29 | ) | (0.11 | ) | ||||||||||
|
|
|
|
|
|
|
|
|
| |||||||||||
Total Distributions | (0.99 | ) | (0.45 | ) | (0.79 | ) | (0.34 | ) | (0.16 | ) | ||||||||||
|
|
|
|
|
|
|
|
|
| |||||||||||
Net asset value, end of the period | $ | 23.85 | $ | 20.72 | $ | 16.02 | $ | 16.05 | $ | 14.04 | ||||||||||
|
|
|
|
|
|
|
|
|
| |||||||||||
Total return(b) | 20.43 | % | 32.80 | % | 5.81 | % | 16.98 | % | 18.99 | % | ||||||||||
RATIOS TO AVERAGE NET ASSETS: | ||||||||||||||||||||
Net assets, end of the period (000’s) | $ | 1,740,523 | $ | 1,477,915 | $ | 1,250,030 | $ | 1,083,362 | $ | 983,047 | ||||||||||
Net expenses | 0.89 | % | 0.90 | % | 0.91 | % | 0.90 | % | 0.91 | % | ||||||||||
Gross expenses | 0.89 | % | 0.90 | % | 0.91 | % | 0.90 | % | 0.91 | % | ||||||||||
Net investment income (loss) | (0.22 | )% | 0.04 | % | 0.35 | % | 0.39 | % | 0.45 | % | ||||||||||
Portfolio turnover rate | 9 | % | 19 | % | 7 | % | 11 | % | 8 | % | ||||||||||
| (a) | Per share net investment income (loss) has been calculated using the average shares outstanding during the period. |
| (b) | A sales charge for Class A shares is not reflected in total return calculations. |
See accompanying notes to financial statements.
| 96
Financial Highlights (continued)
For a share outstanding throughout each period.
| Growth Fund—Class C | ||||||||||||||||||||
| Year Ended September 30, 2021 | Year Ended September 30, 2020 | Year Ended September 30, 2019 | Year Ended September 30, 2018 | Year Ended September 30, 2017 | ||||||||||||||||
Net asset value, beginning of the period | $ | 18.66 | $ | 14.53 | $ | 14.68 | $ | 12.92 | $ | 11.06 | ||||||||||
|
|
|
|
|
|
|
|
|
| |||||||||||
INCOME (LOSS) FROM INVESTMENT OPERATIONS: | ||||||||||||||||||||
Net investment loss(a) | (0.20 | ) | (0.11 | ) | (0.06 | ) | (0.05 | ) | (0.03 | ) | ||||||||||
Net realized and unrealized gain (loss) | 3.74 | 4.64 | 0.65 | 2.10 | 2.00 | |||||||||||||||
|
|
|
|
|
|
|
|
|
| |||||||||||
Total from Investment Operations | 3.54 | 4.53 | 0.59 | 2.05 | 1.97 | |||||||||||||||
|
|
|
|
|
|
|
|
|
| |||||||||||
LESS DISTRIBUTIONS FROM: | ||||||||||||||||||||
Net realized capital gains | (0.99 | ) | (0.40 | ) | (0.74 | ) | (0.29 | ) | (0.11 | ) | ||||||||||
|
|
|
|
|
|
|
|
|
| |||||||||||
Net asset value, end of the period | $ | 21.21 | $ | 18.66 | $ | 14.53 | $ | 14.68 | $ | 12.92 | ||||||||||
|
|
|
|
|
|
|
|
|
| |||||||||||
Total return(b) | 19.55 | % | 31.76 | % | 5.05 | % | 16.09 | % | 18.03 | % | ||||||||||
RATIOS TO AVERAGE NET ASSETS: | ||||||||||||||||||||
Net assets, end of the period (000’s) | $ | 127,003 | $ | 128,764 | $ | 120,493 | $ | 130,133 | $ | 133,329 | ||||||||||
Net expenses | 1.63 | % | 1.65 | % | 1.66 | % | 1.65 | % | 1.66 | % | ||||||||||
Gross expenses | 1.63 | % | 1.65 | % | 1.66 | % | 1.65 | % | 1.66 | % | ||||||||||
Net investment loss | (0.97 | )% | (0.71 | )% | (0.39 | )% | (0.36 | )% | (0.29 | )% | ||||||||||
Portfolio turnover rate | 9 | % | 19 | % | 7 | % | 11 | % | 8 | % | ||||||||||
| (a) | Per share net investment loss has been calculated using the average shares outstanding during the period. |
| (b) | A contingent deferred sales charge for Class C shares is not reflected in total return calculations. |
See accompanying notes to financial statements.
97 |
Financial Highlights (continued)
For a share outstanding throughout each period.
| Growth Fund—Class N | ||||||||||||||||||||
| Year Ended September 30, 2021 | Year Ended September 30, 2020 | Year Ended September 30, 2019 | Year Ended September 30, 2018 | Year Ended September 30, 2017 | ||||||||||||||||
Net asset value, beginning of the period | $ | 22.26 | $ | 17.17 | $ | 17.15 | $ | 14.97 | $ | 12.73 | ||||||||||
|
|
|
|
|
|
|
|
|
| |||||||||||
INCOME (LOSS) FROM INVESTMENT OPERATIONS: | ||||||||||||||||||||
Net investment income(a) | 0.02 | 0.07 | 0.11 | 0.12 | 0.11 | |||||||||||||||
Net realized and unrealized gain (loss) | 4.49 | 5.53 | 0.76 | 2.44 | 2.32 | |||||||||||||||
|
|
|
|
|
|
|
|
|
| |||||||||||
Total from Investment Operations | 4.51 | 5.60 | 0.87 | 2.56 | 2.43 | |||||||||||||||
|
|
|
|
|
|
|
|
|
| |||||||||||
LESS DISTRIBUTIONS FROM: | ||||||||||||||||||||
Net investment income | (0.05 | ) | (0.11 | ) | (0.11 | ) | (0.09 | ) | (0.08 | ) | ||||||||||
Net realized capital gains | (0.99 | ) | (0.40 | ) | (0.74 | ) | (0.29 | ) | (0.11 | ) | ||||||||||
|
|
|
|
|
|
|
|
|
| |||||||||||
Total Distributions | (1.04 | ) | (0.51 | ) | (0.85 | ) | (0.38 | ) | (0.19 | ) | ||||||||||
|
|
|
|
|
|
|
|
|
| |||||||||||
Net asset value, end of the period | $ | 25.73 | $ | 22.26 | $ | 17.17 | $ | 17.15 | $ | 14.97 | ||||||||||
|
|
|
|
|
|
|
|
|
| |||||||||||
Total return | 20.80 | % | 33.26 | % | 6.14 | % | 17.40 | %(b) | 19.39 | %(b) | ||||||||||
RATIOS TO AVERAGE NET ASSETS: | ||||||||||||||||||||
Net assets, end of the period (000’s) | $ | 806,186 | $ | 579,571 | $ | 442,787 | $ | 1,001,688 | $ | 341,160 | ||||||||||
Net expenses | 0.56 | % | 0.57 | % | 0.56 | % | 0.57 | %(c) | 0.57 | %(c) | ||||||||||
Gross expenses | 0.56 | % | 0.57 | % | 0.56 | % | 0.58 | % | 0.58 | % | ||||||||||
Net investment income | 0.09 | % | 0.38 | % | 0.69 | % | 0.73 | % | 0.80 | % | ||||||||||
Portfolio turnover rate | 9 | % | 19 | % | 7 | % | 11 | % | 8 | % | ||||||||||
| (a) | Per share net investment income has been calculated using the average shares outstanding during the period. |
| (b) | Had certain expenses not been waived/reimbursed during the period, total returns would have been lower. |
| (c) | The investment adviser agreed to waive its fees and/or reimburse a portion of the Fund’s expenses during the period. Without this waiver/reimbursement, expenses would have been higher. |
See accompanying notes to financial statements.
| 98
Financial Highlights (continued)
For a share outstanding throughout each period.
| Growth Fund—Class Y | ||||||||||||||||||||
| Year Ended September 30, 2021 | Year Ended September 30, 2020 | Year Ended September 30, 2019 | Year Ended September 30, 2018 | Year Ended September 30, 2017 | ||||||||||||||||
Net asset value, beginning of the period | $ | 22.26 | $ | 17.17 | $ | 17.14 | $ | 14.97 | $ | 12.73 | ||||||||||
|
|
|
|
|
|
|
|
|
| |||||||||||
INCOME (LOSS) FROM INVESTMENT OPERATIONS: | ||||||||||||||||||||
Net investment income(a) | 0.01 | 0.05 | 0.10 | 0.10 | 0.09 | |||||||||||||||
Net realized and unrealized gain (loss) | 4.48 | 5.53 | 0.77 | 2.44 | 2.33 | |||||||||||||||
|
|
|
|
|
|
|
|
|
| |||||||||||
Total from Investment Operations | 4.49 | 5.58 | 0.87 | 2.54 | 2.42 | |||||||||||||||
|
|
|
|
|
|
|
|
|
| |||||||||||
LESS DISTRIBUTIONS FROM: | ||||||||||||||||||||
Net investment income | (0.03 | ) | (0.09 | ) | (0.10 | ) | (0.08 | ) | (0.07 | ) | ||||||||||
Net realized capital gains | (0.99 | ) | (0.40 | ) | (0.74 | ) | (0.29 | ) | (0.11 | ) | ||||||||||
|
|
|
|
|
|
|
|
|
| |||||||||||
Total Distributions | (1.02 | ) | (0.49 | ) | (0.84 | ) | (0.37 | ) | (0.18 | ) | ||||||||||
|
|
|
|
|
|
|
|
|
| |||||||||||
Net asset value, end of the period | $ | 25.73 | $ | 22.26 | $ | 17.17 | $ | 17.14 | $ | 14.97 | ||||||||||
|
|
|
|
|
|
|
|
|
| |||||||||||
Total return | 20.72 | % | 33.15 | % | 6.09 | % | 17.25 | % | 19.31 | % | ||||||||||
RATIOS TO AVERAGE NET ASSETS: | ||||||||||||||||||||
Net assets, end of the period (000’s) | $ | 11,094,922 | $ | 9,313,775 | $ | 7,017,707 | $ | 6,620,996 | $ | 5,749,576 | ||||||||||
Net expenses | 0.64 | % | 0.65 | % | 0.66 | % | 0.65 | % | 0.66 | % | ||||||||||
Gross expenses | 0.64 | % | 0.65 | % | 0.66 | % | 0.65 | % | 0.66 | % | ||||||||||
Net investment income | 0.02 | % | 0.27 | % | 0.60 | % | 0.64 | % | 0.69 | % | ||||||||||
Portfolio turnover rate | 9 | % | 19 | % | 7 | % | 11 | % | 8 | % | ||||||||||
| (a) | Per share net investment income has been calculated using the average shares outstanding during the period. |
See accompanying notes to financial statements.
99 |
Financial Highlights (continued)
For a share outstanding throughout each period.
| Intermediate Duration Bond Fund—Class A | ||||||||||||||||||||
| Year Ended September 30, 2021 | Year Ended September 30, 2020 | Year Ended September 30, 2019 | Year Ended September 30, 2018 | Year Ended September 30, 2017 | ||||||||||||||||
Net asset value, beginning of the period | $ | 10.99 | $ | 10.51 | $ | 9.97 | $ | 10.29 | $ | 10.52 | ||||||||||
|
|
|
|
|
|
|
|
|
| |||||||||||
INCOME (LOSS) FROM INVESTMENT OPERATIONS: | ||||||||||||||||||||
Net investment income(a) | 0.11 | 0.19 | 0.25 | 0.22 | 0.17 | |||||||||||||||
Net realized and unrealized gain (loss) | (0.11 | ) | 0.54 | 0.55 | (0.31 | ) | (0.12 | ) | ||||||||||||
|
|
|
|
|
|
|
|
|
| |||||||||||
Total from Investment Operations | (0.00 | )(b) | 0.73 | 0.80 | (0.09 | ) | 0.05 | |||||||||||||
|
|
|
|
|
|
|
|
|
| |||||||||||
LESS DISTRIBUTIONS FROM: | ||||||||||||||||||||
Net investment income | (0.12 | ) | (0.20 | ) | (0.26 | ) | (0.23 | ) | (0.20 | ) | ||||||||||
Net realized capital gains | (0.29 | ) | (0.05 | ) | — | — | (0.08 | ) | ||||||||||||
|
|
|
|
|
|
|
|
|
| |||||||||||
Total Distributions | (0.41 | ) | (0.25 | ) | (0.26 | ) | (0.23 | ) | (0.28 | ) | ||||||||||
|
|
|
|
|
|
|
|
|
| |||||||||||
Net asset value, end of the period | $ | 10.58 | $ | 10.99 | $ | 10.51 | $ | 9.97 | $ | 10.29 | ||||||||||
|
|
|
|
|
|
|
|
|
| |||||||||||
Total return(c)(d) | (0.06 | )% | 7.06 | % | 8.11 | % | (0.85 | )% | 0.44 | % | ||||||||||
RATIOS TO AVERAGE NET ASSETS: | ||||||||||||||||||||
Net assets, end of the period (000’s) | $ | 20,942 | $ | 19,962 | $ | 21,415 | $ | 19,149 | $ | 21,828 | ||||||||||
Net expenses(e) | 0.65 | % | 0.65 | % | 0.65 | % | 0.65 | % | 0.65 | % | ||||||||||
Gross expenses | 0.70 | % | 0.72 | % | 0.72 | % | 0.70 | % | 0.72 | % | ||||||||||
Net investment income | 1.03 | % | 1.78 | % | 2.42 | % | 2.17 | % | 1.69 | % | ||||||||||
Portfolio turnover rate | 100 | % | 123 | % | 135 | % | 152 | % | 216 | % | ||||||||||
| (a) | Per share net investment income has been calculated using the average shares outstanding during the period. |
| (b) | Amount rounds to less than $0.01 per share. |
| (c) | A sales charge for Class A shares is not reflected in total return calculations. |
| (d) | Had certain expenses not been waived/reimbursed during the period, total returns would have been lower. |
| (e) | The investment adviser agreed to waive its fees and/or reimburse a portion of the Fund’s expenses during the period. Without this waiver/reimbursement, expenses would have been higher. |
See accompanying notes to financial statements.
| 100
Financial Highlights (continued)
For a share outstanding throughout each period.
| Intermediate Duration Bond Fund—Class C | ||||||||||||||||||||
| Year Ended September 30, 2021 | Year Ended September 30, 2020 | Year Ended September 30, 2019 | Year Ended September 30, 2018 | Year Ended September 30, 2017 | ||||||||||||||||
Net asset value, beginning of the period | $ | 11.02 | $ | 10.54 | $ | 10.00 | $ | 10.30 | $ | 10.53 | ||||||||||
|
|
|
|
|
|
|
|
|
| |||||||||||
INCOME (LOSS) FROM INVESTMENT OPERATIONS: | ||||||||||||||||||||
Net investment income(a) | 0.03 | 0.11 | 0.17 | 0.13 | 0.10 | |||||||||||||||
Net realized and unrealized gain (loss) | (0.11 | ) | 0.54 | 0.55 | (0.31 | ) | (0.13 | ) | ||||||||||||
|
|
|
|
|
|
|
|
|
| |||||||||||
Total from Investment Operations | (0.08 | ) | 0.65 | 0.72 | (0.18 | ) | (0.03 | ) | ||||||||||||
|
|
|
|
|
|
|
|
|
| |||||||||||
LESS DISTRIBUTIONS FROM: | ||||||||||||||||||||
Net investment income | (0.03 | ) | (0.12 | ) | (0.18 | ) | (0.12 | ) | (0.12 | ) | ||||||||||
Net realized capital gains | (0.29 | ) | (0.05 | ) | — | — | (0.08 | ) | ||||||||||||
|
|
|
|
|
|
|
|
|
| |||||||||||
Total Distributions | (0.32 | ) | (0.17 | ) | (0.18 | ) | (0.12 | ) | (0.20 | ) | ||||||||||
|
|
|
|
|
|
|
|
|
| |||||||||||
Net asset value, end of the period | $ | 10.62 | $ | 11.02 | $ | 10.54 | $ | 10.00 | $ | 10.30 | ||||||||||
|
|
|
|
|
|
|
|
|
| |||||||||||
Total return(b)(c) | (0.76 | )% | 6.27 | % | 7.28 | % | (1.71 | )% | (0.29 | )% | ||||||||||
RATIOS TO AVERAGE NET ASSETS: | ||||||||||||||||||||
Net assets, end of the period (000’s) | $ | 315 | $ | 668 | $ | 467 | $ | 2 | $ | 3,225 | ||||||||||
Net expenses(d) | 1.40 | % | 1.40 | % | 1.40 | % | 1.40 | % | 1.40 | % | ||||||||||
Gross expenses | 1.45 | % | 1.46 | % | 1.48 | % | 1.45 | % | 1.48 | % | ||||||||||
Net investment income | 0.30 | % | 1.00 | % | 1.64 | % | 1.31 | % | 0.95 | % | ||||||||||
Portfolio turnover rate | 100 | % | 123 | % | 135 | % | 152 | % | 216 | % | ||||||||||
| (a) | Per share net investment income has been calculated using the average shares outstanding during the period. |
| (b) | A contingent deferred sales charge for Class C shares is not reflected in total return calculations. |
| (c) | Had certain expenses not been waived/reimbursed during the period, total returns would have been lower. |
| (d) | The investment adviser agreed to waive its fees and/or reimburse a portion of the Fund’s expenses during the period. Without this waiver/reimbursement, expenses would have been higher. |
See accompanying notes to financial statements.
101 |
Financial Highlights (continued)
For a share outstanding throughout each period.
| Intermediate Duration Bond Fund—Class N | ||||||||||||
| Year Ended September 30, 2021 | Year Ended September 30, 2020 | Period Ended September 30, 2019* | ||||||||||
Net asset value, beginning of the period | $ | 10.98 | $ | 10.50 | $ | 10.07 | ||||||
|
|
|
|
|
| |||||||
INCOME (LOSS) FROM INVESTMENT OPERATIONS: |
| |||||||||||
Net investment income(a) | 0.14 | 0.22 | 0.17 | |||||||||
Net realized and unrealized gain (loss) | (0.11 | ) | 0.54 | 0.45 | ||||||||
|
|
|
|
|
| |||||||
Total from Investment Operations | 0.03 | 0.76 | 0.62 | |||||||||
|
|
|
|
|
| |||||||
LESS DISTRIBUTIONS FROM: |
| |||||||||||
Net investment income | (0.15 | ) | (0.23 | ) | (0.19 | ) | ||||||
Net realized capital gains | (0.29 | ) | (0.05 | ) | — | |||||||
|
|
|
|
|
| |||||||
Total Distributions | (0.44 | ) | (0.28 | ) | (0.19 | ) | ||||||
|
|
|
|
|
| |||||||
Net asset value, end of the period | $ | 10.57 | $ | 10.98 | $ | 10.50 | ||||||
|
|
|
|
|
| |||||||
Total return(b) | 0.25 | % | 7.39 | % | 6.19 | %(c) | ||||||
RATIOS TO AVERAGE NET ASSETS: |
| |||||||||||
Net assets, end of the period (000’s) | $ | 20,094 | $ | 3,307 | $ | 3,546 | ||||||
Net expenses(d) | 0.35 | % | 0.35 | % | 0.35 | %(e) | ||||||
Gross expenses | 0.38 | % | 0.43 | % | 0.42 | %(e) | ||||||
Net investment income | 1.32 | % | 2.09 | % | 2.54 | %(e) | ||||||
Portfolio turnover rate | 100 | % | 123 | % | 135 | %(f) | ||||||
| * | From commencement of Class operations on February 1, 2019 through September 30, 2019. |
| (a) | Per share net investment income has been calculated using the average shares outstanding during the period. |
| (b) | Had certain expenses not been waived/reimbursed during the period, total returns would have been lower. |
| (c) | Periods less than one year are not annualized. |
| (d) | The investment adviser agreed to waive its fees and/or reimburse a portion of the Fund’s expenses during the period. Without this waiver/reimbursement, expenses would have been higher. |
| (e) | Computed on an annualized basis for periods less than one year. |
| (f) | Represents the Fund’s portfolio turnover rate for year ended September 30, 2019. |
See accompanying notes to financial statements.
| 102
Financial Highlights (continued)
For a share outstanding throughout each period.
| Intermediate Duration Bond Fund—Class Y | ||||||||||||||||||||
| Year Ended September 30, 2021 | Year Ended September 30, 2020 | Year Ended September 30, 2019 | Year Ended September 30, 2018 | Year Ended September 30, 2017 | ||||||||||||||||
Net asset value, beginning of the period | $ | 10.99 | $ | 10.51 | $ | 9.97 | $ | 10.29 | $ | 10.52 | ||||||||||
|
|
|
|
|
|
|
|
|
| |||||||||||
INCOME (LOSS) FROM INVESTMENT OPERATIONS: | ||||||||||||||||||||
Net investment income(a) | 0.14 | 0.21 | 0.27 | 0.25 | 0.20 | |||||||||||||||
Net realized and unrealized gain (loss) | (0.11 | ) | 0.54 | 0.55 | (0.31 | ) | (0.13 | ) | ||||||||||||
|
|
|
|
|
|
|
|
|
| |||||||||||
Total from Investment Operations | 0.03 | 0.75 | 0.82 | (0.06 | ) | 0.07 | ||||||||||||||
|
|
|
|
|
|
|
|
|
| |||||||||||
LESS DISTRIBUTIONS FROM: | ||||||||||||||||||||
Net investment income | (0.15 | ) | (0.22 | ) | (0.28 | ) | (0.26 | ) | (0.22 | ) | ||||||||||
Net realized capital gains | (0.29 | ) | (0.05 | ) | — | — | (0.08 | ) | ||||||||||||
|
|
|
|
|
|
|
|
|
| |||||||||||
Total Distributions | (0.44 | ) | (0.27 | ) | (0.28 | ) | (0.26 | ) | (0.30 | ) | ||||||||||
|
|
|
|
|
|
|
|
|
| |||||||||||
Net asset value, end of the period | $ | 10.58 | $ | 10.99 | $ | 10.51 | $ | 9.97 | $ | 10.29 | ||||||||||
|
|
|
|
|
|
|
|
|
| |||||||||||
Total return(b) | 0.20 | % | 7.33 | % | 8.38 | % | (0.60 | )% | 0.69 | % | ||||||||||
RATIOS TO AVERAGE NET ASSETS: | ||||||||||||||||||||
Net assets, end of the period (000’s) | $ | 340,326 | $ | 293,577 | $ | 215,752 | $ | 148,119 | $ | 154,668 | ||||||||||
Net expenses(c) | 0.40 | % | 0.40 | % | 0.40 | % | 0.40 | % | 0.40 | % | ||||||||||
Gross expenses | 0.45 | % | 0.47 | % | 0.48 | % | 0.45 | % | 0.47 | % | ||||||||||
Net investment income | 1.28 | % | 2.01 | % | 2.67 | % | 2.43 | % | 1.93 | % | ||||||||||
Portfolio turnover rate | 100 | % | 123 | % | 135 | % | 152 | % | 216 | % | ||||||||||
| (a) | Per share net investment income has been calculated using the average shares outstanding during the period. |
| (b) | Had certain expenses not been waived/reimbursed during the period, total returns would have been lower. |
| (c) | The investment adviser agreed to waive its fees and/or reimburse a portion of the Fund’s expenses during the period. Without this waiver/reimbursement, expenses would have been higher. |
See accompanying notes to financial statements.
103 |
Financial Highlights (continued)
For a share outstanding throughout each period.
| Limited Term Government and Agency Fund—Class A | ||||||||||||||||||||
| Year Ended September 30, 2021 | Year Ended September 30, 2020 | Year Ended September 30, 2019 | Year Ended September 30, 2018 | Year Ended September 30, 2017 | ||||||||||||||||
Net asset value, beginning of the period | $ | 11.54 | $ | 11.34 | $ | 11.09 | $ | 11.32 | $ | 11.51 | ||||||||||
|
|
|
|
|
|
|
|
|
| |||||||||||
INCOME (LOSS) FROM INVESTMENT OPERATIONS: | ||||||||||||||||||||
Net investment income(a) | 0.04 | 0.11 | 0.15 | 0.11 | 0.08 | |||||||||||||||
Net realized and unrealized gain (loss) | (0.11 | ) | 0.25 | 0.34 | (0.13 | ) | (0.09 | ) | ||||||||||||
|
|
|
|
|
|
|
|
|
| |||||||||||
Total from Investment Operations | (0.07 | ) | 0.36 | 0.49 | (0.02 | ) | (0.01 | ) | ||||||||||||
|
|
|
|
|
|
|
|
|
| |||||||||||
LESS DISTRIBUTIONS FROM: | ||||||||||||||||||||
Net investment income | (0.07 | ) | (0.16 | ) | (0.24 | ) | (0.21 | ) | (0.18 | ) | ||||||||||
|
|
|
|
|
|
|
|
|
| |||||||||||
Net asset value, end of the period | $ | 11.40 | $ | 11.54 | $ | 11.34 | $ | 11.09 | $ | 11.32 | ||||||||||
|
|
|
|
|
|
|
|
|
| |||||||||||
Total return(b) | (0.58 | )%(c) | 3.19 | % | 4.42 | % | (0.17 | )% | (0.04 | )% | ||||||||||
RATIOS TO AVERAGE NET ASSETS: | ||||||||||||||||||||
Net assets, end of the period (000’s) | $ | 287,244 | $ | 296,217 | $ | 308,186 | $ | 328,475 | $ | 336,227 | ||||||||||
Net expenses | 0.73 | %(d)(e)(f) | 0.78 | %(g) | 0.80 | % | 0.80 | % | 0.80 | % | ||||||||||
Gross expenses | 0.73 | %(e) | 0.78 | % | 0.80 | % | 0.80 | % | 0.80 | % | ||||||||||
Net investment income | 0.36 | % | 0.93 | % | 1.31 | % | 1.02 | % | 0.67 | % | ||||||||||
Portfolio turnover rate | 247 | % | 319 | %(h) | 527 | %(h) | 157 | % | 126 | % | ||||||||||
| (a) | Per share net investment income has been calculated using the average shares outstanding during the period. |
| (b) | A sales charge for Class A shares is not reflected in total return calculations. |
| (c) | Had certain expenses not been waived/reimbursed during the period, total returns would have been lower. |
| (d) | The investment adviser agreed to waive its fees and/or reimburse a portion of the Fund’s expenses during the period. Without this waiver/reimbursement, expenses would have been higher. |
| (e) | Includes refund of prior year service fee of 0.01%. See Note 6b of Notes to Financial Statements. |
| (f) | Effective July 1, 2021, the expense limit decreased from 0.75% to 0.70%. See Note 6 of Notes to Financial Statements. |
| (g) | Effective July 1, 2020, the expense limit decreased from 0.80% to 0.75%. |
| (h) | The variation in the Fund’s turnover rate from 2018 to 2020 is due to changes in volume of U.S. Treasury securities related to certain trading strategies. |
See accompanying notes to financial statements.
| 104
Financial Highlights (continued)
For a share outstanding throughout each period.
| Limited Term Government and Agency Fund—Class C | ||||||||||||||||||||
| Year Ended September 30, 2021 | Year Ended September 30, 2020 | Year Ended September 30, 2019 | Year Ended September 30, 2018 | Year Ended September 30, 2017 | ||||||||||||||||
Net asset value, beginning of the period | $ | 11.54 | $ | 11.35 | $ | 11.10 | $ | 11.33 | $ | 11.52 | ||||||||||
|
|
|
|
|
|
|
|
|
| |||||||||||
INCOME (LOSS) FROM INVESTMENT OPERATIONS: | ||||||||||||||||||||
Net investment income (loss)(a) | (0.05 | ) | 0.02 | 0.06 | 0.03 | (0.01 | ) | |||||||||||||
Net realized and unrealized gain (loss) | (0.11 | ) | 0.24 | 0.34 | (0.13 | ) | (0.08 | ) | ||||||||||||
|
|
|
|
|
|
|
|
|
| |||||||||||
Total from Investment Operations | (0.16 | ) | 0.26 | 0.40 | (0.10 | ) | (0.09 | ) | ||||||||||||
|
|
|
|
|
|
|
|
|
| |||||||||||
LESS DISTRIBUTIONS FROM: | ||||||||||||||||||||
Net investment income | (0.00 | )(b) | (0.07 | ) | (0.15 | ) | (0.13 | ) | (0.10 | ) | ||||||||||
|
|
|
|
|
|
|
|
|
| |||||||||||
Net asset value, end of the period | $ | 11.38 | $ | 11.54 | $ | 11.35 | $ | 11.10 | $ | 11.33 | ||||||||||
|
|
|
|
|
|
|
|
|
| |||||||||||
Total return(c) | (1.35 | )%(d) | 2.34 | % | 3.64 | % | (0.91 | )% | (0.79 | )% | ||||||||||
RATIOS TO AVERAGE NET ASSETS: | ||||||||||||||||||||
Net assets, end of the period (000’s) | $ | 24,922 | $ | 19,628 | $ | 22,142 | $ | 23,341 | $ | 43,319 | ||||||||||
Net expenses | 1.48 | %(e)(f) | 1.53 | %(g) | 1.55 | % | 1.55 | % | 1.55 | % | ||||||||||
Gross expenses | 1.49 | % | 1.53 | % | 1.55 | % | 1.55 | % | 1.55 | % | ||||||||||
Net investment income (loss) | (0.40 | )% | 0.18 | % | 0.57 | % | 0.24 | % | (0.09 | )% | ||||||||||
Portfolio turnover rate | 247 | % | 319 | %(h) | 527 | %(h) | 157 | % | 126 | % | ||||||||||
| (a) | Per share net investment income (loss) has been calculated using the average shares outstanding during the period. |
| (b) | Amount rounds to less than $0.01 per share. |
| (c) | A contingent deferred sales charge for Class C shares is not reflected in total return calculations. |
| (d) | Had certain expenses not been waived/reimbursed during the period, total returns would have been lower. |
| (e) | The investment adviser agreed to waive its fees and/or reimburse a portion of the Fund’s expenses during the period. Without this waiver/reimbursement, expenses would have been higher. |
| (f) | Effective July 1, 2021, the expense limit decreased from 1.50% to 1.45%. See Note 6 of Notes to Financial Statements. |
| (g) | Effective July 1, 2020, the expense limit decreased from 1.55% to 1.50%. |
| (h) | The variation in the Fund’s turnover rate from 2018 to 2020 is due to changes in volume of U.S. Treasury securities related to certain trading strategies. |
See accompanying notes to financial statements.
105 |
Financial Highlights (continued)
For a share outstanding throughout each period.
| Limited Term Government and Agency Fund—Class N | ||||||||||||||||||||
| Year Ended September 30, 2021 | Year Ended September 30, 2020 | Year Ended September 30, 2019 | Year Ended September 30, 2018 | Period Ended September 30, 2017* | ||||||||||||||||
Net asset value, beginning of the period | $ | 11.57 | $ | 11.37 | $ | 11.12 | $ | 11.36 | $ | 11.39 | ||||||||||
|
|
|
|
|
|
|
|
|
| |||||||||||
INCOME (LOSS) FROM INVESTMENT OPERATIONS: | ||||||||||||||||||||
Net investment income(a) | 0.08 | 0.14 | 0.19 | 0.15 | 0.05 | |||||||||||||||
Net realized and unrealized gain (loss) | (0.11 | ) | 0.26 | 0.33 | (0.14 | ) | 0.08 | (b) | ||||||||||||
|
|
|
|
|
|
|
|
|
| |||||||||||
Total from Investment Operations | (0.03 | ) | 0.40 | 0.52 | 0.01 | 0.13 | ||||||||||||||
|
|
|
|
|
|
|
|
|
| |||||||||||
LESS DISTRIBUTIONS FROM: | ||||||||||||||||||||
Net investment income | (0.11 | ) | (0.20 | ) | (0.27 | ) | (0.25 | ) | (0.16 | ) | ||||||||||
|
|
|
|
|
|
|
|
|
| |||||||||||
Net asset value, end of the period | $ | 11.43 | $ | 11.57 | $ | 11.37 | $ | 11.12 | $ | 11.36 | ||||||||||
|
|
|
|
|
|
|
|
|
| |||||||||||
Total return(c) | (0.25 | )% | 3.53 | % | 4.77 | % | 0.09 | % | 1.12 | %(d) | ||||||||||
RATIOS TO AVERAGE NET ASSETS: | ||||||||||||||||||||
Net assets, end of the period (000’s) | $ | 12,972 | $ | 11,035 | $ | 5,272 | $ | 3,176 | $ | 1,900 | ||||||||||
Net expenses(e) | 0.40 | %(f) | 0.45 | %(g) | 0.46 | % | 0.46 | % | 0.47 | %(h) | ||||||||||
Gross expenses | 0.41 | % | 0.46 | % | 0.48 | % | 0.48 | % | 0.50 | %(h) | ||||||||||
Net investment income | 0.68 | % | 1.20 | % | 1.65 | % | 1.37 | % | 0.64 | %(h) | ||||||||||
Portfolio turnover rate | 247 | % | 319 | %(i) | 527 | %(i) | 157 | % | 126 | %(j) | ||||||||||
| * | From commencement of Class operations on February 1, 2017 through September 30, 2017. |
| (a) | Per share net investment income has been calculated using the average shares outstanding during the period. |
| (b) | The amount shown for a share outstanding does not correspond with the aggregate realized and unrealized gain (loss) on investments for the period due to the timing of sales and redemptions of fund shares in relation to fluctuating market values of investments of the Fund. |
| (c) | Had certain expenses not been waived/reimbursed during the period, total returns would have been lower. |
| (d) | Periods less than one year are not annualized. |
| (e) | The investment adviser agreed to waive its fees and/or reimburse a portion of the Fund’s expenses during the period. Without this waiver/reimbursement, expenses would have been higher. |
| (f) | Effective July 1, 2021, the expense limit decreased from 0.45% to 0.40%. See Note 6 of Notes to Financial Statements. |
| (g) | Effective July 1, 2020, the expense limit decreased from 0.50% to 0.45%. |
| (h) | Computed on an annualized basis for periods less than one year. |
| (i) | The variation in the Fund’s turnover rate from 2018 to 2020 is due to changes in volume of U.S. Treasury securities related to certain trading strategies. |
| (j) | Represents the Fund’s portfolio turnover rate for the year ended September 30, 2017. |
See accompanying notes to financial statements.
| 106
Financial Highlights (continued)
For a share outstanding throughout each period.
| Limited Term Government and Agency Fund—Class Y | ||||||||||||||||||||
| Year Ended September 30, 2021 | Year Ended September 30, 2020 | Year Ended September 30, 2019 | Year Ended September 30, 2018 | Year Ended September 30, 2017 | ||||||||||||||||
Net asset value, beginning of the period | $ | 11.57 | $ | 11.38 | $ | 11.13 | $ | 11.36 | $ | 11.55 | ||||||||||
|
|
|
|
|
|
|
|
|
| |||||||||||
INCOME (LOSS) FROM INVESTMENT OPERATIONS: | ||||||||||||||||||||
Net investment income(a) | 0.07 | 0.13 | 0.17 | 0.14 | 0.11 | |||||||||||||||
Net realized and unrealized gain (loss) | (0.11 | ) | 0.25 | 0.34 | (0.13 | ) | (0.09 | ) | ||||||||||||
|
|
|
|
|
|
|
|
|
| |||||||||||
Total from Investment Operations | (0.04 | ) | 0.38 | 0.51 | 0.01 | 0.02 | ||||||||||||||
|
|
|
|
|
|
|
|
|
| |||||||||||
LESS DISTRIBUTIONS FROM: | ||||||||||||||||||||
Net investment income | (0.10 | ) | (0.19 | ) | (0.26 | ) | (0.24 | ) | (0.21 | ) | ||||||||||
|
|
|
|
|
|
|
|
|
| |||||||||||
Net asset value, end of the period | $ | 11.43 | $ | 11.57 | $ | 11.38 | $ | 11.13 | $ | 11.36 | ||||||||||
|
|
|
|
|
|
|
|
|
| |||||||||||
Total return | (0.33 | )%(b) | 3.35 | % | 4.67 | % | 0.09 | % | 0.22 | % | ||||||||||
RATIOS TO AVERAGE NET ASSETS: | ||||||||||||||||||||
Net assets, end of the period (000’s) | $ | 707,904 | $ | 691,616 | $ | 457,248 | $ | 366,847 | $ | 360,322 | ||||||||||
Net expenses | 0.48 | %(c)(d) | 0.53 | %(e) | 0.55 | % | 0.55 | % | 0.55 | % | ||||||||||
Gross expenses | 0.49 | % | 0.53 | % | 0.55 | % | 0.55 | % | 0.55 | % | ||||||||||
Net investment income | 0.61 | % | 1.11 | % | 1.55 | % | 1.26 | % | 0.92 | % | ||||||||||
Portfolio turnover rate | 247 | % | 319 | %(f) | 527 | %(f) | 157 | % | 126 | % | ||||||||||
| (a) | Per share net investment income has been calculated using the average shares outstanding during the period. |
| (b) | Had certain expenses not been waived/reimbursed during the period, total returns would have been lower. |
| (c) | The investment adviser agreed to waive its fees and/or reimburse a portion of the Fund’s expenses during the period. Without this waiver/reimbursement, expenses would have been higher. |
| (d) | Effective July 1, 2021, the expense limit decreased from 0.50% to 0.45%. See Note 6 of Notes to Financial Statements. |
| (e) | Effective July 1, 2020, the expense limit decreased from 0.55% to 0.50%. |
| (f) | The variation in the Fund’s turnover rate from 2018 to 2020 is due to changes in volume of U.S. Treasury securities related to certain trading strategies. |
See accompanying notes to financial statements.
107 |
September 30, 2021
1. Organization. Natixis Funds Trust I, Loomis Sayles Funds I and Loomis Sayles Funds II (the “Trusts” and each a “Trust”) are each organized as a Massachusetts business trust. Each Trust is registered under the Investment Company Act of 1940, as amended (the “1940 Act”) as an open-end management investment company. Each Declaration of Trust permits the Board of Trustees to authorize the issuance of an unlimited number of shares of the Trust in multiple series. The financial statements for certain funds of the Trusts are presented in separate reports. The following funds (individually, a “Fund” and collectively, the “Funds”) are included in this report:
Natixis Funds Trust I:
Loomis Sayles Core Plus Bond Fund (the “Core Plus Bond Fund”)
Loomis Sayles Funds I:
Loomis Sayles Intermediate Duration Bond Fund (the “Intermediate Duration Bond Fund”)
Loomis Sayles Funds II:
Loomis Sayles Credit Income Fund (the “Credit Income Fund”)
Loomis Sayles Global Allocation Fund (the “Global Allocation Fund”)
Loomis Sayles Growth Fund (the “Growth Fund”)
Loomis Sayles Limited Term Government and Agency Fund (the “Limited Term Government and Agency Fund”)
Each Fund is a diversified investment company.
Each Fund, except Growth Fund, offers Class A, Class C, Class N and Class Y shares. Growth Fund was closed to new investors effective April 28, 2017. Growth Fund offers Class A, Class C, Class N, and Class Y shares to defined contribution and defined benefit plans, clients of registered investment advisers and registered representatives trading through intermediary programs/platforms on which the Fund is already available and existing shareholders.
Class A shares are sold with a maximum front-end sales charge of 4.25% for Core Plus Bond Fund, Credit Income Fund and Intermediate Duration Bond Fund, 5.75% for Global Allocation Fund and Growth Fund, and 2.25% for Limited Term Government and Agency Fund. Class C shares do not pay a front-end sales charge, pay higher Rule 12b-1 fees than Class A shares for eight years (at which point they automatically convert to Class A shares) (prior to May 1, 2021, Class C shares automatically converted to Class A shares after ten years) and may be subject to a contingent deferred sales charge (“CDSC”) of 1.00% if those shares are redeemed within one year of acquisition, except for reinvested distributions. Class N and Class Y shares do not pay a front-end sales charge, a CDSC or Rule 12b-1 fees. Class N shares are offered with an initial minimum investment of $1,000,000. Class Y shares are offered with an initial minimum investment of $100,000. Certain categories of investors are exempted from the minimum investment amounts for Class N and Class Y as outlined in the relevant Funds’ prospectus.
Most expenses can be directly attributed to a Fund. Expenses which cannot be directly attributed to a Fund are generally apportioned based on the relative net assets of each of the Funds in Natixis Funds Trust I, Natixis Funds Trust II, Natixis Funds Trust IV and Gateway Trust (“Natixis Funds Trusts”), Loomis Sayles Funds I and Loomis Sayles Funds II (“Loomis Sayles Funds Trusts”), and Natixis ETF Trust and Natixis ETF Trust II (“Natixis ETF Trusts”). Expenses of a Fund are borne pro rata by the holders of each class of shares, except that each class bears expenses unique to that class (such as the Rule 12b-1 fees applicable to Class A and Class C), and transfer agent fees are borne collectively for Class A, Class C and Class Y, and individually for Class N. In addition, each class votes as a class only with respect to its own Rule 12b-1 Plan. Shares of each class would receive their pro rata share of the net assets of the Fund if the Fund were liquidated. The Trustees approve separate distributions from net investment income on each class of shares.
2. Significant Accounting Policies. The following is a summary of significant accounting policies consistently followed by each Fund in the preparation of its financial statements. The Funds’ financial statements follow the accounting and reporting guidelines provided for investment companies and are prepared in accordance with accounting principles generally accepted in the United States of America which require the use of management estimates that affect the reported amounts and disclosures in the financial statements. Actual results could differ from those estimates. Management has evaluated the events and transactions subsequent to year-end through the date the financial statements were issued and has determined that there were no material events that would require disclosure in the Funds’ financial statements.
a. Valuation. Fund securities and other investments are valued at market value based on market quotations obtained or determined by independent pricing services recommended by the adviser and approved by the Board of Trustees. Fund securities and other investments for which market quotations are not readily available are valued at fair value as determined in good faith by the adviser pursuant to procedures approved by the Board of Trustees, as described below. Market value is determined as follows:
Debt securities and unlisted preferred equity securities are valued based on evaluated bids furnished to the Funds by an independent pricing service or bid prices obtained from broker-dealers. Senior loans and collateralized loan obligations are valued at bid prices
| 108
Notes to Financial Statements (continued)
September 30, 2021
supplied by an independent pricing service, if available. Short sales of debt securities are valued based on an evaluated ask price furnished to the Funds by an independent pricing service. Listed equity securities (including shares of closed-end investment companies and exchange-traded funds) are valued at the last sale price quoted on the exchange where they are traded most extensively or, if there is no reported sale during the day, the closing bid quotation as reported by an independent pricing service. Securities traded on the NASDAQ Global Select Market, NASDAQ Global Market and NASDAQ Capital Market are valued at the NASDAQ Official Closing Price (“NOCP”), or if lacking an NOCP, at the most recent bid quotations on the applicable NASDAQ Market. Unlisted equity securities (except unlisted preferred equity securities) are valued at the last sale price quoted in the market where they are traded most extensively or, if there is no reported sale during the day, the closing bid quotation as reported by an independent pricing service. If there is no last sale price or closing bid quotation available, unlisted equity securities will be valued using evaluated bids furnished by an independent pricing service, if available. In some foreign markets, an official close price and a last sale price may be available from the foreign exchange or market. In those cases, the official close price is used. Broker-dealer bid prices may be used to value debt and unlisted equity securities and senior loans and collateralized loan obligations where an independent pricing service is unable to price a security or where an independent pricing service does not provide a reliable price for the security. Forward foreign currency contracts are valued utilizing interpolated rates determined based on information provided by an independent pricing service. Futures contracts are valued at the most recent settlement price on the exchange on which the adviser believes that, over time, they are traded most extensively.
Fund securities and other investments for which market quotations are not readily available are valued at fair value as determined in good faith by the adviser pursuant to procedures approved by the Board of Trustees. The Funds may also value securities and other investments at fair value in other circumstances such as when extraordinary events occur after the close of a foreign market but prior to the close of the New York Stock Exchange. This may include situations relating to a single issuer (such as a declaration of bankruptcy or a delisting of the issuer’s security from the primary market on which it has traded) as well as events affecting the securities markets in general (such as market disruptions or closings and significant fluctuations in U.S. and/or foreign markets). When fair valuing its securities or other investments, the Funds may, among other things, use modeling tools or other processes that may take into account factors such as securities or other market activity and/or significant events that occur after the close of the foreign market and before the time the Fund’s net asset value (“NAV”) is calculated. Fair value pricing may require subjective determinations about the value of a security, and fair values used to determine a Fund’s NAV may differ from quoted or published prices, or from prices that are used by others, for the same securities. In addition, the use of fair value pricing may not always result in adjustments to the prices of securities held by a Fund.
Illiquid securities for which market quotations are readily available and have been evaluated by the adviser are considered and classified as fair valued securities pursuant to the Funds’ pricing policies and procedures.
As of September 30, 2021, securities held by the Funds were fair valued as follows:
Fund | Equity | Percentage of | Securities | Percentage | Securities fair | Percentage of | ||||||||||||||||||
Core Plus Bond Fund | $ | — | — | $ | — | — | $ | 1,001,922 | Less than 0.1% | |||||||||||||||
Credit Income Fund | — | — | 282,692 | 1.1% | — | — | ||||||||||||||||||
Global Allocation Fund | 558,851,192 | 11.5% | 8,767,057 | 0.2% | — | — | ||||||||||||||||||
Intermediate Duration Bond Fund | — | — | — | — | 531 | Less than 0.1% | ||||||||||||||||||
Limited Term Government and Agency Fund | — | — | — | — | 4,629,151 | 0.4% | ||||||||||||||||||
| 1 | Certain foreign equity securities were fair valued pursuant to procedures approved by the Board of Trustees as events occurring after the close of the foreign market were believed to materially affect the value of those securities. |
b. Investment Transactions and Related Investment Income. Investment transactions are accounted for on a trade date plus one day basis for daily NAV calculation. However, for financial reporting purposes, investment transactions are reported on trade date. Dividend income (including income reinvested) and foreign withholding tax, if applicable, is recorded on the ex-dividend date, or in the case of certain foreign securities, as soon as a Fund is notified, and interest income is recorded on an accrual basis. Loan consent fees, upfront origination fees and/or amendment fees are recorded when received and included in interest income on the Statements of Operations. Interest income is increased by the accretion of discount and decreased by the amortization of premium, if applicable. Periodic principal adjustments for inflation-protected securities are recorded to interest income. Negative principal adjustments (in the event of deflation) are recorded as reductions of interest income to the extent of interest income earned, not to exceed the amount of positive principal adjustments on a cumulative basis. For securities with paydown provisions, principal payments received are treated as a proportionate reduction to the cost basis of the securities, and excess or shortfall amounts are recorded as income. In determining net gain or loss on securities sold, the cost of securities has been determined on an identified cost basis. Investment
109 |
Notes to Financial Statements (continued)
September 30, 2021
income, non-class specific expenses and realized and unrealized gains and losses are allocated on a pro rata basis to each class based on the relative net assets of each class to the total net assets of the Fund.
c. Short Sales. A short sale is a transaction in which a Fund sells a security it does not own, usually in anticipation of a decline in the fair market value of the security. When closing out a short position, a Fund will have to purchase the security it originally sold short. The value of short sales is reflected as a liability in the Statements of Assets and Liabilities and is marked-to-market daily. A Fund will realize a profit from closing out a short position if the price of the security sold short has declined since the short position was opened; a Fund will realize a loss from closing out a short position if the value of the shorted security has risen since the short position was opened. Because there is no upper limit on the price to which a security can rise, short selling exposes a Fund to potentially unlimited losses. The Funds intend to cover their short sale transactions by segregating or earmarking liquid assets, such that the segregated/earmarked amount, equals the current market value of the securities underlying the short sale.
For the year ended September 30, 2021, Core Plus Bond Fund engaged in short sales.
d. Foreign Currency Translation. The books and records of the Funds are maintained in U.S. dollars. The values of securities, currencies and other assets and liabilities denominated in currencies other than U.S. dollars, if any, are translated into U.S. dollars based upon foreign exchange rates prevailing at the end of the period. Purchases and sales of investment securities, income and expenses are translated into U.S. dollars on the respective dates of such transactions.
Net realized foreign exchange gains or losses arise from sales of foreign currency, changes in exchange rates between the trade and settlement dates on securities transactions and the difference between the amounts of dividends, interest and foreign withholding taxes recorded on the Funds’ books and the U.S. dollar equivalent of the amounts actually received or paid. Net unrealized foreign exchange gains or losses arise from changes in the value of assets and liabilities, other than investment securities, as of the end of the fiscal period, resulting from changes in exchange rates. Net realized foreign exchange gains or losses and the net change in unrealized foreign exchange gains or losses are disclosed in the Statements of Operations. For federal income tax purposes, net realized foreign exchange gains or losses are characterized as ordinary income and may, if the Funds have net losses, reduce the amount of income available to be distributed by the Funds.
The values of investment securities are presented at the foreign exchange rates prevailing at the end of the period for financial reporting purposes. Net realized and unrealized gains or losses on investments reported in the Statements of Operations reflect gains or losses resulting from changes in exchange rates and fluctuations which arise due to changes in market prices of investment securities. For federal income tax purposes, a portion of the net realized gain or loss on investments arising from changes in exchange rates, which is reflected in the Statements of Operations, may be characterized as ordinary income and may, if the Funds have net losses, reduce the amount of income available to be distributed by the Funds.
For the year ended September 30, 2021, the amount of income available to be distributed has been reduced by the following amounts as a result of losses arising from changes in exchange rates:
Core Plus Bond Fund | $ | 9,809,979 | ||
Global Allocation Fund | 9,233,847 |
The Funds may use foreign currency exchange contracts to facilitate transactions in foreign-denominated investments. Losses may arise from changes in the value of the foreign currency or if the counterparties do not perform under the contracts’ terms.
e. Forward Foreign Currency Contracts. The Funds may enter into forward foreign currency contracts, including forward foreign cross currency contracts to acquire exposure to foreign currencies or to hedge the Funds’ investments against currency fluctuation. A contract can also be used to offset a previous contract. These contracts involve market risk in excess of the unrealized appreciation (depreciation) reflected in the Funds’ Statements of Assets and Liabilities. The U.S. dollar value of the currencies a Fund has committed to buy or sell represents the aggregate exposure to each currency the Fund has acquired or hedged through currency contracts outstanding at period end. Gains or losses are recorded for financial statement purposes as unrealized until settlement date. Contracts are traded over-the-counter directly with a counterparty. Risks may arise upon entering into these contracts from the potential inability of counterparties to meet the terms of their contracts and from unanticipated movements in the value of a foreign currency relative to the U.S. dollar. Certain contracts may require the movement of cash and/or securities as collateral for the Funds’ or counterparty’s net obligations under the contracts. Forward foreign currency contracts outstanding at the end of the period, if any, are listed in each applicable Fund’s Portfolio of Investments.
f. Futures Contracts. The Funds may enter into futures contracts. Futures contracts are agreements between two parties to buy and sell a particular instrument or index for a specified price on a specified future date.
When a Fund enters into a futures contract, it is required to deposit with (or for the benefit of) its broker an amount of cash or short-term high-quality securities as “initial margin.” As the value of the contract changes, the value of the futures contract position
| 110
Notes to Financial Statements (continued)
September 30, 2021
increases or declines. Subsequent payments, known as “variation margin,” are made or received by a Fund, depending on the price fluctuations in the fair value of the contract and the value of cash or securities on deposit with the broker. The aggregate principal amounts of the contracts are not recorded in the financial statements. Daily fluctuations in the value of the contracts are recorded in the Statements of Assets and Liabilities as a receivable (payable) and in the Statements of Operations as unrealized appreciation (depreciation) until the contracts are closed, when they are recorded as realized gains (losses). Realized gain or loss on a futures position is equal to the difference between the value of the contract at the time it was opened and the value at the time it was closed, minus brokerage commissions. When a Fund enters into a futures contract certain risks may arise, such as illiquidity in the futures market, which may limit a Fund’s ability to close out a futures contract prior to settlement date, and unanticipated movements in the value of securities or interest rates. Futures contracts outstanding at the end of the period, if any, are listed in each applicable Fund’s Portfolio of Investments.
Futures contracts are exchange-traded. Exchange-traded futures contracts are standardized and are settled through a clearing house with fulfillment supported by the credit of the exchange. Therefore, counterparty credit risks to the Funds are reduced; however, in the event that a counterparty enters into bankruptcy, a Fund’s claim against initial/variation margin on deposit with the counterparty may be subject to terms of a final settlement in bankruptcy court.
g. When-Issued and Delayed Delivery Transactions. The Funds may enter into when-issued or delayed delivery transactions. When-issued refers to transactions made conditionally because a security, although authorized, has not been issued. Delayed delivery refers to transactions for which delivery or payment will occur at a later date, beyond the normal settlement period. The price of when-issued and delayed delivery securities and the date when the securities will be delivered and paid for are fixed at the time the transaction is negotiated. The security and the obligation to pay for it are recorded by the Funds at the time the commitment is entered into. The value of the security may vary with market fluctuations during the time before the Funds take delivery of the security. No interest accrues to the Funds until the transaction settles.
Delayed delivery transactions include those designated as To Be Announced (“TBAs”) in the Portfolios of Investments. For TBAs, the actual security that will be delivered to fulfill the transaction is not designated at the time of the trade. The security is “to be announced” 48 hours prior to the established trade settlement date. Certain transactions require the Funds or counterparty to post cash and/or securities as collateral for the net mark-to-market exposure to the other party. The Funds cover their net obligations under outstanding delayed delivery commitments by segregating or earmarking cash or securities.
Purchases of when-issued or delayed delivery securities may have a similar effect on the Funds’ NAV as if the Funds’ had created a degree of leverage in the portfolio. Risks may arise upon entering into such transactions from the potential inability of counterparties to meet their obligations under the transactions. Additionally, losses may arise due to changes in the value of the underlying securities.
h. Federal and Foreign Income Taxes. The Trusts treat each Fund as a separate entity for federal income tax purposes. Each Fund intends to meet the requirements of the Internal Revenue Code of 1986, as amended, applicable to regulated investment companies, and to distribute to its shareholders substantially all of its net investment income and any net realized capital gains at least annually. Management has performed an analysis of each Fund’s tax positions for the open tax years as of September 30, 2021 and has concluded that no provisions for income tax are required. The Funds’ federal tax returns for the prior three fiscal years, where applicable, remain subject to examination by the Internal Revenue Service. Management is not aware of any events that are reasonably possible to occur in the next twelve months that would result in the amounts of any unrecognized tax benefits significantly increasing or decreasing for the Funds. However, management’s conclusions regarding tax positions taken may be subject to review and adjustment at a later date based on factors including, but not limited to, new tax laws and accounting regulations and interpretations thereof.
A Fund may be subject to foreign withholding taxes on investment income and taxes on capital gains on investments that are accrued and paid based upon the Fund’s understanding of the tax rules and regulations that exist in the countries in which the Fund invests. Foreign withholding taxes on dividend and interest income are reflected on the Statements of Operations as a reduction of investment income, net of amounts that have been or are expected to be reclaimed and paid. Dividends and interest receivable on the Statements of Assets and Liabilities are net of foreign withholding taxes. Foreign withholding taxes where reclaims have been or are expected to be filed and paid are reflected on the Statements of Assets and Liabilities as tax reclaims receivable. Capital gains taxes paid are included in net realized gain (loss) on investments in the Statements of Operations. Accrued but unpaid capital gains taxes are reflected as foreign taxes payable on the Statements of Assets and Liabilities, if applicable, and reduce unrealized gains on investments. In the event that realized gains on investments are subsequently offset by realized losses, taxes paid on realized gains may be returned to a Fund. Such amounts, if applicable, are reflected as foreign tax rebates receivable on the Statements of Assets and Liabilities and are recorded as a realized gain when received.
111 |
Notes to Financial Statements (continued)
September 30, 2021
In certain countries across the European Union, certain Funds filed tax reclaims for previously withheld taxes on dividends earned in certain countries (EU reclaims) and may continue to make such filings when it is determined to be in the best interest of the Funds and their shareholders. These filings are subject to various administrative proceedings by the local jurisdictions’ tax authorities within the European Union, as well as a number of related judicial proceedings. EU reclaims are recognized by a Fund when deemed more likely than not to be collected, and are reflected as a reduction of foreign taxes withheld in the Statements of Operations. Any related receivable is reflected as tax reclaims receivable in the Statements of Assets and Liabilities.
i. Dividends and Distributions to Shareholders. Dividends and distributions are recorded on the ex-dividend date. The timing and characterization of certain income and capital gain distributions are determined in accordance with federal tax regulations, which may differ from accounting principles generally accepted in the United States of America. Permanent differences are primarily due to differing treatments for book and tax purposes of items such as foreign currency gains and losses, convertible bond adjustments, defaulted and/or non-income producing securities, distribution re-designations, contingent payment debt instruments, return of capital distributions received, net operating losses, redemptions in-kind, treasury inflation-protected bonds, premium amortization and paydown gains and losses. Permanent book and tax basis differences relating to shareholder distributions will result in reclassifications to capital accounts reported on the Statements of Assets and Liabilities. Temporary differences between book and tax distributable earnings are primarily due to deferred Trustees’ fees, forward foreign currency contract mark-to-market, wash sales, premium amortization, trust preferred securities, futures contract mark-to-market, return of capital distributions received and dividends payable. Amounts of income and capital gain available to be distributed on a tax basis are determined annually, and at other times during the Funds’ fiscal year as may be necessary to avoid knowingly declaring and paying a return of capital distribution. Distributions from net investment income and net realized short-term capital gains are considered to be distributed from ordinary income for tax purposes.
The tax characterization of distributions is determined on an annual basis. The tax character of distributions paid to shareholders during the years ended September 30, 2021 and 2020 was as follows:
2021 Distributions | 2020 Distributions | |||||||||||||||||||||||
Fund | Ordinary | Long-Term | Total | Ordinary | Long-Term | Total | ||||||||||||||||||
Core Plus Bond Fund | $ | 363,707,896 | $ | 35,563,095 | $ | 399,270,991 | $ | 193,309,459 | $ | — | $ | 193,309,459 | ||||||||||||
Credit Income Fund | 779,271 | — | 779,271 | — | — | — | ||||||||||||||||||
Global Allocation Fund | 26,444,526 | 229,409,750 | 255,854,276 | 18,191,927 | 73,767,977 | 91,959,904 | ||||||||||||||||||
Growth Fund | 24,536,652 | 508,298,281 | 532,834,933 | 44,589,045 | 207,940,673 | 252,529,718 | ||||||||||||||||||
Intermediate Duration Bond Fund | 12,774,431 | 1,137,809 | 13,912,240 | 6,686,899 | 27,607 | 6,714,506 | ||||||||||||||||||
Limited Term Government and Agency Fund | 8,302,317 | — | 8,302,317 | 13,057,788 | — | 13,057,788 | ||||||||||||||||||
Distributions paid to shareholders from net investment income and net realized capital gains, based on accounting principles generally accepted in the United States of America, are consolidated and reported on the Statements of Changes in Net Assets as Distributions to Shareholders. Distributions paid to shareholders from net investment income and net realized capital gains expressed in per-share amounts, based on accounting principles generally accepted in the United States of America, are separately stated and reported within the Financial Highlights.
| 112
Notes to Financial Statements (continued)
September 30, 2021
As of September 30, 2021, the components of distributable earnings on a tax basis were as follows:
Core Plus Bond | Credit Income | Global | Growth Fund | Intermediate | Limited Term | |||||||||||||||||||
Undistributed ordinary income | $ | 1,853,128 | $ | 61,261 | $ | 17,822,376 | $ | 38,619,525 | $ | 684,715 | $ | 527,209 | ||||||||||||
Undistributed long-term capital gains | 17,404,702 | — | 331,575,389 | 626,991,994 | 1,181,959 | — | ||||||||||||||||||
|
|
|
|
|
|
|
|
|
|
|
| |||||||||||||
Total undistributed earnings | 19,257,830 | 61,261 | 349,397,765 | 665,611,519 | 1,866,674 | 527,209 | ||||||||||||||||||
|
|
|
|
|
|
|
|
|
|
|
| |||||||||||||
Capital loss carryforward: | ||||||||||||||||||||||||
Short-term: | ||||||||||||||||||||||||
No expiration date | — | — | — | — | — | (183,761 | ) | |||||||||||||||||
Long-term: | ||||||||||||||||||||||||
No expiration date | — | — | — | — | — | (28,753,709 | ) | |||||||||||||||||
|
|
|
|
|
|
|
|
|
|
|
| |||||||||||||
Total capital loss carryforward | — | — | — | — | — | (28,937,470 | ) | |||||||||||||||||
|
|
|
|
|
|
|
|
|
|
|
| |||||||||||||
Unrealized appreciation | 109,607,278 | 466,992 | 1,064,731,300 | 6,566,894,325 | 1,319,190 | 1,454,948 | ||||||||||||||||||
|
|
|
|
|
|
|
|
|
|
|
| |||||||||||||
Total accumulated earnings (losses) | $ | 128,865,108 | $ | 528,253 | $ | 1,414,129,065 | $ | 7,232,505,844 | $ | 3,185,864 | $ | (26,955,313 | ) | |||||||||||
|
|
|
|
|
|
|
|
|
|
|
| |||||||||||||
Capital loss carryforward utilized in the current year | $ | — | $ | — | $ | — | $ | — | $ | — | $ | 1,601,626 | ||||||||||||
|
|
|
|
|
|
|
|
|
|
|
| |||||||||||||
As of September 30, 2021, unrealized appreciation (depreciation) as a component of distributable earnings was approximately as follows:
Core Plus Bond | Credit Income | Global | Growth Fund | Intermediate | Limited Term | |||||||||||||||||||
Unrealized appreciation (depreciation) Investments | $ | 119,996,463 | $ | 466,992 | $ | 1,069,206,190 | $ | 6,566,902,714 | $ | 1,319,190 | $ | 1,454,948 | ||||||||||||
Foreign currency translations | (10,389,185 | ) | — | (4,474,890 | ) | (8,389 | ) | — | — | |||||||||||||||
|
|
|
|
|
|
|
|
|
|
|
| |||||||||||||
Total unrealized appreciation | $ | 109,607,278 | $ | 466,992 | $ | 1,064,731,300 | $ | 6,566,894,325 | $ | 1,319,190 | $ | 1,454,948 | ||||||||||||
|
|
|
|
|
|
|
|
|
|
|
| |||||||||||||
As of September 30, 2021, the tax cost of investments (including derivatives, if applicable) and unrealized appreciation (depreciation) on a federal tax basis were as follows:
Core Plus Bond | Credit Income | Global | Growth | Intermediate | Limited Term | |||||||||||||||||||
Federal tax cost | $ | 9,421,782,953 | $ | 24,724,168 | $ | 3,788,579,816 | $ | 7,192,401,216 | $ | 385,528,414 | $ | 1,030,474,032 | ||||||||||||
|
|
|
|
|
|
|
|
|
|
|
| |||||||||||||
Gross tax appreciation | $ | 195,686,915 | $ | 668,426 | $ | 1,123,111,729 | $ | 6,704,831,604 | $ | 4,080,617 | $ | 8,474,375 | ||||||||||||
Gross tax depreciation | (86,010,959 | ) | (201,434 | ) | (55,790,094 | ) | (137,928,890 | ) | (2,761,427 | ) | (7,019,427 | ) | ||||||||||||
|
|
|
|
|
|
|
|
|
|
|
| |||||||||||||
Net tax appreciation | $ | 109,675,956 | $ | 466,992 | $ | 1,067,321,635 | $ | 6,566,902,714 | $ | 1,319,190 | $ | 1,454,948 | ||||||||||||
|
|
|
|
|
|
|
|
|
|
|
| |||||||||||||
The difference between these amounts and those reported in the preceding table, if any, are primarily attributable to capital gains taxes and foreign exchange gains or losses.
j. Senior Loans. Each Fund may invest in senior loans to corporate, governmental or other borrowers. Senior loans, which include both secured and unsecured loans made by banks and other financial institutions to corporate customers, typically hold the most senior position in a borrower’s capital structure, may be secured by the borrower’s assets and have interest rates that reset frequently. Senior Loans can include term loans, revolving credit facility loans and second lien loans. A senior loan is often administered by a bank or other financial institution that acts as agent for all holders. The agent administers the terms of the senior loan, as specified in the loan agreement. Large loans may be shared or syndicated among several lenders. A Fund may enter into the primary syndicate for a loan or it may also purchase all or a portion of loans from other lenders (sometimes referred to as loan assignments), in either case becoming a direct lender. The settlement period for senior loans is uncertain as there is no standardized settlement schedule
113 |
Notes to Financial Statements (continued)
September 30, 2021
applicable to such investments. Senior loans outstanding at the end of the period, if any, are listed in each applicable Fund’s Portfolio of Investments.
k. Collateralized Loan Obligations. Each Fund may invest in collateralized loan obligations (“CLOs”). A CLO is a type of asset-backed security designed to redirect the cash flows from a pool of leveraged loans to investors based on their risk preferences. Cash flows from a CLO are split into two or more portions, called tranches, varying in risk and yield. The risk of an investment in a CLO depends largely on the type of the collateralized securities and the class of the instrument in which the Fund invests. The intent of the Funds when investing in CLOs is to purchase only higher level, investment grade level select tranches. CLOs outstanding at the end of the period, if any, are listed in each applicable Fund’s Portfolio of Investments.
l. Repurchase Agreements. Each Fund may enter into repurchase agreements, under the terms of a Master Repurchase Agreement, under which each Fund acquires securities as collateral and agrees to resell the securities at an agreed upon time and at an agreed upon price. It is each Fund’s policy that the market value of the collateral for repurchase agreements be at least equal to 102% of the repurchase price, including interest. Certain repurchase agreements are tri-party arrangements whereby the collateral is held in a segregated account for the benefit of the Fund and on behalf of the counterparty. Repurchase agreements could involve certain risks in the event of default or insolvency of the counterparty, including possible delays or restrictions upon a Fund’s ability to dispose of the underlying securities. As of September 30, 2021, each Fund, as applicable, had investments in repurchase agreements for which the value of the related collateral exceeded the value of the repurchase agreement. The gross value of repurchase agreements is included in the Statements of Assets and Liabilities for financial reporting purposes.
m. Due to/from Brokers. Transactions and positions in certain futures, forward foreign currency contracts and delayed delivery commitments are maintained and cleared by registered U.S. broker/dealers pursuant to customer agreements between the Funds and the various broker/dealers. The due from brokers balance in the Statements of Assets and Liabilities for Core Plus Bond Fund represents cash pledged as collateral for delayed delivery securities. The due from brokers balance in the Statements of Assets and Liabilities for Global Allocation Fund represents cash pledged as collateral for forward foreign currency contracts and as initial margin for futures contracts. The due from brokers balance in the Statements of Assets and Liabilities for Intermediate Duration Bond Fund represents cash pledged as initial margin for futures contracts. The due to brokers balance in the Statements of Assets and Liabilities for Global Allocation Fund represents cash received as collateral for forward foreign currency contracts. In certain circumstances a Fund’s use of cash held at brokers is restricted by regulation or broker mandated limits.
n. Securities Lending. Each Fund, except Credit Income Fund, has entered into an agreement with State Street Bank and Trust Company (“State Street Bank”), as agent of the Funds, to lend securities to certain designated borrowers. The loans are collateralized with cash or securities in an amount equal to at least 105% or 102% of the market value (including accrued interest) of the loaned international or domestic securities, respectively, when the loan is initiated. Thereafter, the value of the collateral must remain at least 102% of the market value (including accrued interest) of loaned securities for U.S. equities and U.S. corporate debt; at least 105% of the market value (including accrued interest) of loaned securities for non-U.S. equities; and at least 100% of the market value (including accrued interest) of loaned securities for U.S. Government securities, sovereign debt issued by non-U.S. Governments and non-U.S. corporate debt. In the event that the market value of the collateral falls below the required percentages described above, the borrower will deliver additional collateral on the next business day. As with other extensions of credit, the Funds may bear the risk of loss with respect to the investment of the collateral. The Funds invest cash collateral in short-term investments, a portion of the income from which is remitted to the borrowers and the remainder allocated between the Funds and State Street Bank as lending agent.
For the year ended September 30, 2021, none of the Funds had loaned securities under this agreement.
o. Indemnifications. Under the Trusts’ organizational documents, their officers and Trustees are indemnified against certain liabilities arising out of the performance of their duties to the Funds. Additionally, in the normal course of business, the Funds enter into contracts with service providers that contain general indemnification clauses. The Funds’ maximum exposure under these arrangements is unknown as this would involve future claims that may be made against the Funds that have not yet occurred. However, based on experience, the Funds expect the risk of loss to be remote.
p. New Accounting Pronouncement. In January 2021, the Financial Accounting Standards Board issued Accounting Standard Update 2021-01, Reference Rate Reform (Topic 848) (“ASU 2021-01”). ASU 2021-01 is an update of ASU 2020-04, which was issued in response to concerns about structural risks of interbank offered rates, and particularly the risk of cessation of the London Interbank Offered Rate (“LIBOR”), expected to occur no later than June 30, 2023. Regulators have undertaken reference rate reform initiatives to identify alternative reference rates that are more observable or transaction based and less susceptible to manipulation. ASU 2020-04 provides temporary guidance to ease the potential burden in accounting for (or recognizing the effects of) reference rate reform on financial reporting. ASU 2020-04 is elective and applies to all entities, subject to meeting certain criteria, that have contracts that reference LIBOR or another reference rate expected to be discontinued because of reference rate reform. ASU 2020-04 amendments
| 114
Notes to Financial Statements (continued)
September 30, 2021
offer optional expedients for contract modifications that would allow an entity to account for such modifications by prospectively adjusting the effective interest rate, instead of evaluating each contract, in accordance with existing accounting standards, as to whether reference rate modifications constitute the establishment of new contracts or the continuation of existing contracts. ASU 2021-01 clarifies that provisions in Topic 848, if elected by an entity, apply to derivative instruments that use an interest rate for margining, discounting, or contract price alignment that is modified as a result of reference rate reform. The amendments are currently effective and an entity may elect to apply its provisions as of any date from the beginning of an interim period that includes or is subsequent to March 12, 2020. Management expects to apply the optional expedients when appropriate.
3. Fair Value Measurements. In accordance with accounting standards related to fair value measurements and disclosures, the Funds have categorized the inputs utilized in determining the value of each Fund’s assets or liabilities. These inputs are summarized in the three broad levels listed below:
| • | Level 1 – quoted prices in active markets for identical assets or liabilities; |
| • | Level 2 – prices determined using other significant inputs that are observable either directly, or indirectly through corroboration with observable market data (which could include quoted prices for similar assets or liabilities, interest rates, credit risk, etc.); and |
| • | Level 3 – prices determined using significant unobservable inputs when quoted prices or observable inputs are unavailable such as when there is little or no market activity for an asset or liability (unobservable inputs reflect each Fund’s own assumptions in determining the fair value of assets or liabilities and would be based on the best information available). |
The inputs or methodology used for valuing securities are not necessarily an indication of the risk associated with investing in those securities.
The Funds’ pricing policies and procedures are recommended by the adviser and approved by the Board of Trustees. Debt securities are valued based on evaluated bids furnished to the Funds by an independent pricing service. Broker-dealer bid prices may be used if an independent pricing service either is unable to price a security or does not provide a reliable price for a security. The Funds’ adviser may use internally developed models to validate broker-dealer bid prices that are only available from a single broker or market maker. Such securities are considered and classified as fair valued. Broker-dealer bid prices for which the Funds do not have knowledge of the inputs used by the broker-dealer are categorized in Level 3. Securities for which market quotations are not readily available are valued at fair value as determined in good faith by the Funds’ adviser pursuant to procedures approved by the Board of Trustees. Fair valued securities may be categorized in Level 3.
The following is a summary of the inputs used to value the Funds’ investments as of September 30, 2021, at value:
Core Plus Bond Fund
Asset Valuation Inputs
Description | Level 1 | Level 2 | Level 3 | Total | ||||||||||||
Bonds and Notes | ||||||||||||||||
Non-Convertible Bonds | ||||||||||||||||
Collateralized Mortgage Obligations | $ | — | $ | 14,461,109 | $ | 1,001,922 | (b) | $ | 15,463,031 | |||||||
All Other Non-Convertible Bonds(a) | — | 8,078,181,424 | — | 8,078,181,424 | ||||||||||||
|
|
|
|
|
|
|
| |||||||||
Total Non-Convertible Bonds | — | 8,092,642,533 | 1,001,922 | 8,093,644,455 | ||||||||||||
|
|
|
|
|
|
|
| |||||||||
Municipals(a) | — | 14,837,710 | — | 14,837,710 | ||||||||||||
|
|
|
|
|
|
|
| |||||||||
Total Bonds and Notes | — | 8,107,480,243 | 1,001,922 | 8,108,482,165 | ||||||||||||
|
|
|
|
|
|
|
| |||||||||
Senior Loans(a) | — | 452,424,697 | — | 452,424,697 | ||||||||||||
Short-Term Investments | — | 970,552,047 | — | 970,552,047 | ||||||||||||
|
|
|
|
|
|
|
| |||||||||
Total | $ | — | $ | 9,530,456,987 | $ | 1,001,922 | $ | 9,531,458,909 | ||||||||
|
|
|
|
|
|
|
| |||||||||
| (a) | Details of the major categories of the Fund’s investments are reflected within the Portfolio of Investments. |
| (b) | Fair valued by the Fund’s adviser. |
115 |
Notes to Financial Statements (continued)
September 30, 2021
Credit Income Fund
Asset Valuation Inputs
Description | Level 1 | Level 2 | Level 3 | Total | ||||||||||||
Bonds and Notes(a) | $ | — | $ | 23,104,104 | $ | — | $ | 23,104,104 | ||||||||
Collateralized Loan Obligations | — | 751,332 | — | 751,332 | ||||||||||||
Preferred Stocks | ||||||||||||||||
Banking | 262,921 | — | — | 262,921 | ||||||||||||
Food & Beverage | — | 165,449 | — | 165,449 | ||||||||||||
Wireless | — | 282,692 | — | 282,692 | ||||||||||||
|
|
|
|
|
|
|
| |||||||||
Total Preferred Stocks | 262,921 | 448,141 | — | 711,062 | ||||||||||||
|
|
|
|
|
|
|
| |||||||||
Short-Term Investments | — | 624,662 | — | 624,662 | ||||||||||||
|
|
|
|
|
|
|
| |||||||||
Total Investments | 262,921 | 24,928,239 | — | 25,191,160 | ||||||||||||
|
|
|
|
|
|
|
| |||||||||
Futures Contracts (unrealized appreciation) | 35,718 | — | — | 35,718 | ||||||||||||
|
|
|
|
|
|
|
| |||||||||
Total | $ | 298,639 | $ | 24,928,239 | $ | — | $ | 25,226,878 | ||||||||
|
|
|
|
|
|
|
| |||||||||
| (a) | Details of the major categories of the Fund’s investments are reflected within the Portfolio of Investments. |
Global Allocation Fund
Asset Valuation Inputs
Description | Level 1 | Level 2 | Level 3 | Total | ||||||||||||
Common Stocks | ||||||||||||||||
France | $ | — | $ | 38,033,194 | $ | — | $ | 38,033,194 | ||||||||
Hong Kong | — | 33,342,052 | — | 33,342,052 | ||||||||||||
India | — | 57,516,834 | — | 57,516,834 | ||||||||||||
Japan | — | 62,870,911 | — | 62,870,911 | ||||||||||||
Netherlands | — | 171,573,864 | — | 171,573,864 | ||||||||||||
Sweden | — | 56,603,634 | — | 56,603,634 | ||||||||||||
Taiwan | — | 105,726,810 | — | 105,726,810 | ||||||||||||
United Kingdom | 129,717,902 | 33,183,893 | — | 162,901,795 | ||||||||||||
All Other Common Stocks(a) | 2,643,302,915 | — | — | 2,643,302,915 | ||||||||||||
|
|
|
|
|
|
|
| |||||||||
Total Common Stocks | 2,773,020,817 | 558,851,192 | — | 3,331,872,009 | ||||||||||||
|
|
|
|
|
|
|
| |||||||||
Bonds and Notes(a) | — | 1,474,992,800 | — | 1,474,992,800 | ||||||||||||
Senior Loans(a) | — | 1,932,985 | — | 1,932,985 | ||||||||||||
Preferred Stocks(a) | 1,930,072 | — | — | 1,930,072 | ||||||||||||
Short-Term Investments | — | 45,159,597 | — | 45,159,597 | ||||||||||||
|
|
|
|
|
|
|
| |||||||||
Total Investments | 2,774,950,889 | 2,080,936,574 | — | 4,855,887,463 | ||||||||||||
|
|
|
|
|
|
|
| |||||||||
Forward Foreign Currency Contracts (unrealized appreciation) | — | 962,249 | — | 962,249 | ||||||||||||
Futures Contracts (unrealized appreciation) | 668,147 | — | — | 668,147 | ||||||||||||
|
|
|
|
|
|
|
| |||||||||
Total | $ | 2,775,619,036 | $ | 2,081,898,823 | $ | — | $ | 4,857,517,859 | ||||||||
|
|
|
|
|
|
|
| |||||||||
| Liability Valuation Inputs |
| |||||||||||||||
Description | Level 1 | Level 2 | Level 3 | Total | ||||||||||||
Forward Foreign Currency Contracts (unrealized depreciation) | $ | — | $ | (5,685,114 | ) | $ | — | $ | (5,685,114 | ) | ||||||
|
|
|
|
|
|
|
| |||||||||
| (a) | Details of the major categories of the Fund’s investments are reflected within the Portfolio of Investments. |
| 116
Notes to Financial Statements (continued)
September 30, 2021
Growth Fund
Asset Valuation Inputs
Description | Level 1 | Level 2 | Level 3 | Total | ||||||||||||
Common Stocks(a) | $ | 13,628,452,696 | $ | — | $ | — | $ | 13,628,452,696 | ||||||||
Short-Term Investments | — | 130,851,234 | — | 130,851,234 | ||||||||||||
|
|
|
|
|
|
|
| |||||||||
Total | $ | 13,628,452,696 | $ | 130,851,234 | $ | — | $ | 13,759,303,930 | ||||||||
|
|
|
|
|
|
|
| |||||||||
| (a) | Details of the major categories of the Fund’s investments are reflected within the Portfolio of Investments. |
Intermediate Duration Bond Fund
Asset Valuation Inputs
Description | Level 1 | Level 2 | Level 3 | Total | ||||||||||||
Bonds and Notes | ||||||||||||||||
ABS Other | $ | — | $ | 4,704,329 | $ | 564,912 | (b) | $ | 5,269,241 | |||||||
Collateralized Mortgage Obligations | — | 4,997,129 | 531 | (c) | 4,997,660 | |||||||||||
All Other Bonds and Notes(a) | — | 354,719,986 | — | 354,719,986 | ||||||||||||
|
|
|
|
|
|
|
| |||||||||
Total Bonds and Notes | — | 364,421,444 | 565,443 | 364,986,887 | ||||||||||||
|
|
|
|
|
|
|
| |||||||||
Short-Term Investments | — | 21,860,717 | — | 21,860,717 | ||||||||||||
|
|
|
|
|
|
|
| |||||||||
Total Investments | — | 386,282,161 | 565,443 | 386,847,604 | ||||||||||||
|
|
|
|
|
|
|
| |||||||||
Futures Contracts (unrealized appreciation) | 122,751 | — | — | 122,751 | ||||||||||||
|
|
|
|
|
|
|
| |||||||||
Total | $ | 122,751 | $ | 386,282,161 | $ | 565,443 | $ | 386,970,355 | ||||||||
|
|
|
|
|
|
|
| |||||||||
| Liability Valuation Inputs |
| |||||||||||||||
Description | Level 1 | Level 2 | Level 3 | Total | ||||||||||||
Futures Contracts (unrealized depreciation) | $ | (119,528 | ) | $ | — | $ | — | $ | (119,528 | ) | ||||||
|
|
|
|
|
|
|
| |||||||||
| (a) | Details of the major categories of the Fund’s investments are reflected within the Portfolio of Investments. |
| (b) | Valued using broker-dealer bid prices. |
| (c) | Fair valued by the Fund’s adviser. |
Limited Term Government and Agency Fund
Asset Valuation Inputs
Description | Level 1 | Level 2 | Level 3 | Total | ||||||||||||
Bonds and Notes | ||||||||||||||||
Collateralized Mortgage Obligations | $ | — | $ | 140,149,752 | $ | 4,629,151 | (b) | $ | 144,778,903 | |||||||
All Other Bonds and Notes(a) | — | 846,005,956 | — | 846,005,956 | ||||||||||||
|
|
|
|
|
|
|
| |||||||||
Total Bonds and Notes | — | 986,155,708 | 4,629,151 | 990,784,859 | ||||||||||||
|
|
|
|
|
|
|
| |||||||||
Short-Term Investments | — | 41,144,121 | — | 41,144,121 | ||||||||||||
|
|
|
|
|
|
|
| |||||||||
Total | $ | — | $ | 1,027,299,829 | $ | 4,629,151 | $ | 1,031,928,980 | ||||||||
|
|
|
|
|
|
|
| |||||||||
| (a) | Details of the major categories of the Fund’s investments are reflected within the Portfolio of Investments. |
| (b) | Fair valued by the Fund’s adviser. |
117 |
Notes to Financial Statements (continued)
September 30, 2021
The following is a reconciliation of Level 3 investments for which significant unobservable inputs were used to determine fair value as of September 30, 2020 and/or September 30, 2021:
Core Plus Bond Fund
Asset Valuation Inputs
Investments in Securities | Balance as of | Accrued | Realized | Change in | Purchases | Sales | Transfers | Transfers | Balance as of | Change in | ||||||||||||||||||||||||||||||
Bonds and Notes | ||||||||||||||||||||||||||||||||||||||||
Non-Convertible Bonds | ||||||||||||||||||||||||||||||||||||||||
ABS Home Equity | $ | 27,065 | $ | — | $ | — | $ | — | $ | — | $ | — | $ | — | $ | (27,065 | ) | $ | — | $ | — | |||||||||||||||||||
Collateralized Mortgage Obligations | 2,280,311 | — | (79,147 | ) | 59,110 | 7,083 | (4,521,397 | ) | 3,255,962 | — | 1,001,922 | 36,575 | ||||||||||||||||||||||||||||
Common Stocks | ||||||||||||||||||||||||||||||||||||||||
Oil, Gas & Consumable Fuels | — | (a) | — | (429,948 | ) | 429,948 | — | — | — | — | — | — | ||||||||||||||||||||||||||||
|
|
|
|
|
|
|
|
|
|
|
|
|
|
|
|
|
|
|
| |||||||||||||||||||||
Total | $ | 2,307,376 | $ | — | $ | (509,095 | ) | $ | 489,058 | $ | 7,083 | $ | (4,521,397 | ) | $ | 3,255,962 | $ | (27,065 | ) | $ | 1,001,922 | $ | 36,575 | |||||||||||||||||
|
|
|
|
|
|
|
|
|
|
|
|
|
|
|
|
|
|
|
| |||||||||||||||||||||
| (a) | Includes a security fair valued at zero by the Fund’s adviser using Level 3 Inputs. |
A debt security valued at $27,065 was transferred from Level 3 to Level 2 during the period ended September 30, 2021. At September 30, 2020, this security was valued at fair value as determined in good faith by the Fund’s investment adviser as an independent pricing service did not provide a reliable price for the security. At September 30, 2021, this security was valued on the basis of evaluated bids furnished to the Fund by an independent pricing service in accordance with the Fund’s valuation policies.
A debt security valued at $3,255,962 was transferred from Level 2 to Level 3 during the period ended September 30, 2021. At September 30, 2020, this security was valued on the basis of evaluated bids furnished to the Fund by an independent pricing service in accordance with the Fund’s valuation policies. At September 30, 2021, this security was valued at fair value as determined in good faith by the Fund’s adviser as an independent pricing service did not provide a reliable price for the security.
Global Allocation Fund
Asset Valuation Inputs
Investments in Securities | Balance as of | Accrued | Realized | Change in | Purchases | Sales | Transfers | Transfers | Balance as of | Change in | ||||||||||||||||||||||||||||||
Preferred Stocks | ||||||||||||||||||||||||||||||||||||||||
United States | $ | — | (a) | $ | — | $ | (457,096 | ) | $ | 457,096 | $ | — | $ | — | $ | — | $ | — | $ | — | $ | — | ||||||||||||||||||
|
|
|
|
|
|
|
|
|
|
|
|
|
|
|
|
|
|
|
| |||||||||||||||||||||
| (a) | Includes securities fair valued at zero by the Fund’s adviser using Level 3 Inputs. |
| 118
Notes to Financial Statements (continued)
September 30, 2021
Intermediate Duration Bond Fund
Asset Valuation Inputs
Investments in Securities | Balance as of | Accrued | Realized | Change in | Purchases | Sales | Transfers | Transfers | Balance as of | Change in | ||||||||||||||||||||||||||||||
Bonds and Notes | ||||||||||||||||||||||||||||||||||||||||
ABS Home Equity | $ | 3,643 | $ | — | $ | — | $ | — | $ | — | $ | — | $ | — | $ | (3,643 | ) | $ | — | $ | — | |||||||||||||||||||
ABS Other | — | — | — | (14 | ) | 564,926 | — | — | — | 564,912 | (14 | ) | ||||||||||||||||||||||||||||
Collateralized Mortgage Obligations | 4,042 | — | (41 | ) | 38 | — | (3,508 | ) | — | — | 531 | 1 | ||||||||||||||||||||||||||||
|
|
|
|
|
|
|
|
|
|
|
|
|
|
|
|
|
|
|
| |||||||||||||||||||||
Total | $ | 7,685 | $ | — | $ | (41 | ) | $ | 24 | $ | 564,926 | $ | (3,508 | ) | $ | — | $ | (3,643 | ) | $ | 565,443 | $ | (13 | ) | ||||||||||||||||
|
|
|
|
|
|
|
|
|
|
|
|
|
|
|
|
|
|
|
| |||||||||||||||||||||
A debt security valued at $3,643 was transferred from Level 3 to Level 2 during the period ended September 30, 2021. At September 30, 2020, this security was valued at fair value as determined in good faith by the Fund’s investment adviser as an independent pricing service did not provide a reliable price for the security. At September 30, 2021, this security was valued on the basis of evaluated bids furnished to the Fund by an independent pricing service in accordance with the Fund’s valuation policies.
Limited Term Government and Agency Fund
Asset Valuation Inputs
Investments in | Balance as of | Accrued | Realized | Change in | Purchases | Sales | Transfers | Transfers | Balance as of | Change in | ||||||||||||||||||||||||||||||
Bonds and Notes | ||||||||||||||||||||||||||||||||||||||||
Collateralized Mortgage Obligations | $ | 2,501,798 | $ | — | $ | (76,513 | ) | $ | (74,902 | ) | $ | 474 | $ | (2,607,532 | ) | $ | 4,885,826 | $ | — | $ | 4,629,151 | $ | (90,208 | ) | ||||||||||||||||
|
|
|
|
|
|
|
|
|
|
|
|
|
|
|
|
|
|
|
| |||||||||||||||||||||
Debt securities valued at $4,885,826 were transferred from Level 2 to Level 3 during the period ended September 30, 2021. At September 30, 2020, these securities were valued on the basis of evaluated bids furnished to the Fund by an independent pricing service in accordance with the Fund’s valuation policies. At September 30, 2021, these securities were valued at fair value as determined in good faith by the Fund’s adviser as an independent pricing service did not provide a reliable price for the securities.
4. Derivatives. Derivative instruments are defined as financial instruments whose value and performance are based on the value and performance of an underlying asset, reference rate or index. Derivative instruments that Credit Income Fund, Global Allocation Fund and Intermediate Duration Bond Fund used during the period include forward foreign currency contracts and futures contracts.
Credit Income Fund, Global Allocation Fund and Intermediate Duration Bond Fund are subject to the risk that changes in interest rates will affect the value of the Funds’ investments in fixed income securities. The Funds will be subject to increased interest rate risk to the extent that they invest in fixed income securities with longer maturities or durations, as compared to investing in fixed income securities with shorter maturities or durations. The Funds may use futures contracts to hedge against changes in interest rates and to manage duration without having to buy or sell portfolio securities. The Funds may also use futures contracts to gain investment exposure. During the year ended September 30, 2021, Credit Income Fund, Global Allocation Fund and Intermediate Duration Bond Fund each used futures contracts to manage duration.
119 |
Notes to Financial Statements (continued)
September 30, 2021
Global Allocation Fund is subject to the risk that changes in foreign currency exchange rates will have an unfavorable effect on the value of Fund assets denominated in foreign currencies. The Fund may enter into forward foreign currency contracts for hedging purposes to protect the value of the Fund’s holdings of foreign securities. The Fund may also use forward foreign currency contracts to gain exposure to foreign currencies, regardless of whether securities denominated in such currencies are held in the Fund. During the year ended September 30, 2021, Global Allocation Fund engaged in forward foreign currency transactions for hedging purposes and to gain exposure to foreign currencies.
The following is a summary of derivative instruments for Credit Income Fund as of September 30, 2021, as reflected within the Statements of Assets and Liabilities:
Assets | Unrealized | |||
Exchange-traded asset derivatives | ||||
Interest rate contracts | $ | 35,718 | ||
| 1 | Represents cumulative unrealized appreciation (depreciation) on futures contracts. Only the current day’s variation margin on futures contracts is reported within the Statements of Assets and Liabilities as receivable or payable for variation margin, as applicable. |
Transactions in derivative instruments for Credit Income Fund during the year ended September 30, 2021, as reflected within the Statements of Operations, were as follows:
Net Realized Gain (Loss) on: | Futures | |||
Interest rate contracts | $ | (35,988 | ) | |
Net Change in Unrealized | Futures | |||
Interest rate contracts | $ | 35,718 | ||
The following is a summary of derivative instruments for Global Allocation Fund as of September 30, 2021, as reflected within the Statements of Assets and Liabilities:
Assets | Unrealized | Unrealized | ||||||
Over-the-counter asset derivatives | ||||||||
Foreign exchange contracts | $ | 962,249 | $ | — | ||||
|
|
|
| |||||
Exchange-traded asset derivatives |
| |||||||
Interest rate contracts | — | 668,147 | ||||||
|
|
|
| |||||
Total asset derivatives | $ | 962,249 | $ | 668,147 | ||||
|
|
|
| |||||
Liabilities | Unrealized | |||||||
Over-the-counter liability derivatives | ||||||||
Foreign exchange contracts | $ | (5,685,114 | ) | |||||
| 1 | Represents cumulative unrealized appreciation (depreciation) on futures contracts. Only the current day’s variation margin on futures contracts is reported within the Statements of Assets and Liabilities as receivable or payable for variation margin, as applicable. |
| 120
Notes to Financial Statements (continued)
September 30, 2021
Transactions in derivative instruments for Global Allocation Fund during the year ended September 30, 2021, as reflected within the Statements of Operations, were as follows:
Net Realized Gain (Loss) on: | Forward foreign | Futures | ||||||
Interest rate contracts | $ | — | $ | (617,791 | ) | |||
Foreign exchange contracts | (10,850,551 | ) | — | |||||
|
|
|
| |||||
Total | $ | (10,850,551 | ) | $ | (617,791 | ) | ||
|
|
|
| |||||
Net Change in Unrealized | Forward foreign | Futures | ||||||
Interest rate contracts | $ | — | $ | 640,419 | ||||
Foreign exchange contracts | (6,734,696 | ) | — | |||||
|
|
|
| |||||
Total | $ | (6,734,696 | ) | $ | 640,419 | |||
|
|
|
| |||||
The following is a summary of derivative instruments for Intermediate Duration Bond Fund as of September 30, 2021, as reflected within the Statements of Assets and Liabilities:
Assets | Unrealized | |||
Exchange-traded asset derivatives |
| |||
Interest rate contracts | $ | 122,751 | ||
Liabilities | Unrealized | |||
Exchange-traded liability derivatives |
| |||
Interest rate contracts | $ | (119,528 | ) | |
| 1 | Represents cumulative unrealized appreciation (depreciation) on futures contracts. Only the current day’s variation margin on futures contracts is reported within the Statements of Assets and Liabilities as receivable or payable for variation margin, as applicable. |
Transactions in derivative instruments for Intermediate Duration Bond Fund during the year ended September 30, 2021, as reflected within the Statements of Operations, were as follows:
Net Realized Gain (Loss) on: | Futures | |||
Interest rate contracts | $ | (121,824 | ) | |
Net Change in Unrealized | Futures | |||
Interest rate contracts | $ | (9,936 | ) | |
As the Funds value their derivatives at fair value and recognize changes in fair value through the Statements of Operations, they do not qualify for hedge accounting under authoritative guidance for derivative instruments. The Funds’ investments in derivatives may represent an economic hedge; however, they are considered to be non-hedge transactions for the purpose of these disclosures.
121 |
Notes to Financial Statements (continued)
September 30, 2021
The volume of forward foreign currency contract and futures contract activity, as a percentage of net assets for Credit Income Fund, Global Allocation Fund and Intermediate Duration Bond Fund, based on gross month-end notional amounts outstanding during the period, including long and short positions at absolute value, was as follows for the year ended September 30, 2021:
Credit Income Fund | Futures | |||||||
Average Notional Amount Outstanding | 3.11 | % | ||||||
Highest Notional Amount Outstanding | 10.20 | % | ||||||
Lowest Notional Amount Outstanding | 0.00 | % | ||||||
Notional Amount Outstanding as of September 30, 2021 | 9.31 | % | ||||||
Global Allocation Fund | Forwards | Futures | ||||||
Average Notional Amount Outstanding | 11.44 | % | 0.35 | % | ||||
Highest Notional Amount Outstanding | 12.10 | % | 0.73 | % | ||||
Lowest Notional Amount Outstanding | 10.98 | % | 0.13 | % | ||||
Notional Amount Outstanding as of September 30, 2021 | 11.39 | % | 0.71 | % | ||||
Intermediate Duration Bond Fund | Futures | |||||||
Average Notional Amount Outstanding | 6.96 | % | ||||||
Highest Notional Amount Outstanding | 7.78 | % | ||||||
Lowest Notional Amount Outstanding | 6.45 | % | ||||||
Notional Amount Outstanding as of September 30, 2021 | 6.86 | % | ||||||
Notional amounts outstanding at the end of the prior period are included in the average notional amount outstanding.
Unrealized gain and/or loss on open forwards and futures is recorded in the Statements of Assets and Liabilities. The aggregate notional values of forwards and futures contracts are not recorded in the Statements of Assets and Liabilities, and therefore are not included in the Funds’ net assets.
Over-the-counter derivatives, including forward foreign currency contracts, are entered into pursuant to International Swaps and Derivatives Association, Inc. (“ISDA”) agreements negotiated between the Funds and their counterparties. ISDA agreements typically contain, among other things, terms for the posting of collateral and master netting provisions in the event of a default or other termination event. Collateral is posted by a Fund or the counterparty to the extent of the net mark-to-market exposure to the other party of all open contracts under the agreement, subject to minimum transfer requirements. Master netting provisions allow the Funds and the counterparty, in the event of a default or other termination event, to offset amounts owed by each related to derivative contracts, including any posted collateral, to one net amount payable by either the Funds or the counterparty. The Funds’ ISDA agreements typically contain provisions that allow a counterparty to terminate open contracts early if the NAV of a Fund declines beyond a certain threshold. For financial reporting purposes, the Funds do not offset derivative assets and liabilities, and any related collateral received or pledged, on the Statements of Assets and Liabilities.
As of September 30, 2021, gross amounts of over-the-counter derivative assets and liabilities not offset in the Statements of Assets and Liabilities and the related net amounts after taking into account master netting arrangements, by counterparty, are as follows:
Global Allocation Fund
Counterparty | Gross Amounts of | Offset | Net Asset | Collateral | Net | |||||||||||||||
Bank of America, N.A. | $ | 545,571 | $ | (84,980 | ) | $ | 460,591 | $ | (340,000 | ) | $ | 120,591 | ||||||||
Citibank, N.A. | 206,797 | — | 206,797 | (206,797 | ) | — | ||||||||||||||
Credit Suisse International | 63,416 | (63,416 | ) | — | — | — | ||||||||||||||
Morgan Stanley Capital Services, Inc. | 132,477 | (132,477 | ) | — | — | — | ||||||||||||||
UBS AG | 13,988 | (13,988 | ) | — | — | — | ||||||||||||||
|
|
|
|
|
|
|
|
|
| |||||||||||
| $ | 962,249 | $ | (294,861 | ) | $ | 667,388 | $ | (546,797 | ) | $ | 120,591 | |||||||||
|
|
|
|
|
|
|
|
|
| |||||||||||
| 122
Notes to Financial Statements (continued)
September 30, 2021
Global Allocation Fund (continued)
Counterparty | Gross Amounts of | Offset | Net Liability | Collateral | Net | |||||||||||||||
Bank of America, N.A. | $ | (84,980 | ) | $ | 84,980 | $ | — | $ | — | $ | — | |||||||||
Credit Suisse International | (1,455,112 | ) | 63,416 | (1,391,696 | ) | 720,000 | (671,696 | ) | ||||||||||||
HSBC Bank USA | (395,609 | ) | — | (395,609 | ) | 280,000 | (115,609 | ) | ||||||||||||
Morgan Stanley Capital Services, Inc. | (3,733,387 | ) | 132,477 | (3,600,910 | ) | 3,070,238 | (530,672 | ) | ||||||||||||
UBS AG | (16,026 | ) | 13,988 | (2,038 | ) | — | (2,038 | ) | ||||||||||||
|
|
|
|
|
|
|
|
|
| |||||||||||
| $ | (5,685,114 | ) | $ | 294,861 | $ | (5,390,253 | ) | $ | 4,070,238 | $ | (1,320,015 | ) | ||||||||
|
|
|
|
|
|
|
|
|
| |||||||||||
The actual collateral received or pledged, if any, may exceed the amounts shown in the table due to overcollateralization. Timing differences may exist between when contracts under the ISDA agreements are marked-to-market and when collateral moves. The ISDA agreements include tri-party control agreements under which collateral is held for the benefit of the secured party at a third party custodian, State Street Bank.
Counterparty risk is managed based on policies and procedures established by each Fund’s adviser. Such policies and procedures may include, but are not limited to, minimum counterparty credit rating requirements, monitoring of counterparty credit default swap spreads and posting of collateral. A Fund’s risk of loss from counterparty credit risk on over-the-counter derivatives is generally limited to the Fund’s aggregated unrealized gains and the amount of any collateral pledged to the counterparty, which may be offset by any collateral posted to the Fund by the counterparty. ISDA master agreements can help to manage counterparty risk by specifying collateral posting arrangements at pre-arranged exposure levels. Under these ISDA agreements, collateral is routinely transferred if the total net exposure in respect of certain transactions, net of existing collateral already in place, exceeds a specified amount (typically $250,000, depending on the counterparty). With exchange-traded derivatives, there is minimal counterparty credit risk to the Fund because the exchange’s clearing house, as counterparty to these instruments, stands between the buyer and the seller of the contract. Credit risk still exists in exchange-traded derivatives with respect to initial and variation margin that is held in a broker’s customer accounts. While brokers typically are required to segregate customer margin for exchange-traded derivatives from their own assets, in the event that a broker becomes insolvent or goes into bankruptcy and at that time there is a shortfall in the aggregate amount of margin held by the broker for all its customers, U.S. bankruptcy laws will typically allocate that shortfall on a pro rata basis across all of the broker’s customers, potentially resulting in losses to the Fund. Based on balances reflected on each Fund’s Statement of Assets and Liabilities, the following table shows (i) the maximum amount of loss due to credit risk that, based on the gross fair value of the financial instrument, the Fund would incur if parties (including OTC derivative counterparties and brokers holding margin for exchange-traded derivatives) to the relevant financial instruments failed completely to perform according to the terms of the contracts and the collateral or other security, if any, for the amount due proved to be of no value to the Fund, and (ii) the amount of loss that the Fund would incur after taking into account master netting provisions pursuant to ISDA agreements, as of September 30, 2021:
Fund | Maximum Amount of Loss - Gross | Maximum Amount of Loss - Net | ||||||
Credit Income Fund | $ | 49,975 | $ | 49,975 | ||||
Global Allocation Fund | 6,134,783 | 1,222,887 | ||||||
Intermediate Duration Bond Fund | 178,033 | 178,033 | ||||||
Net loss amount reflects cash received as collateral for Global Allocation Fund of $590,000, which is recorded on the Statements of Assets and Liabilities.
5. Purchases and Sales of Securities. For the year ended September 30, 2021, purchases and sales of securities (excluding short-term investments and including paydowns) were as follows:
U.S. Government/Agency | Other Securities | |||||||||||||||
Fund | Purchases | Sales | Purchases | Sales | ||||||||||||
Core Plus Bond Fund | $ | 20,291,804,025 | $ | 20,573,833,094 | $ | 2,663,253,287 | $ | 2,209,505,691 | ||||||||
Credit Income Fund | 5,006,734 | 1,968,936 | 9,171,608 | 11,974,553 | ||||||||||||
Global Allocation Fund | 216,720,089 | 320,823,736 | 1,951,666,485 | 1,687,345,272 | ||||||||||||
Growth Fund | — | — | 1,093,709,010 | 1,225,021,327 | ||||||||||||
Intermediate Duration Bond Fund | 151,175,130 | 85,701,398 | 253,881,999 | 262,679,520 | ||||||||||||
Limited Term Government and Agency Fund | 2,444,459,052 | 2,377,207,451 | 30,265,463 | 23,520,661 | ||||||||||||
123 |
Notes to Financial Statements (continued)
September 30, 2021
6. Management Fees and Other Transactions with Affiliates.
a. Management Fees. Loomis, Sayles & Company, L.P. (“Loomis Sayles”) serves as investment adviser to each Fund. Loomis Sayles is a limited partnership whose sole general partner, Loomis, Sayles & Company, Inc., is indirectly owned by Natixis Investment Managers, LLC, which is part of Natixis Investment Managers, an international asset management group based in Paris, France.
Under the terms of the management agreements, each Fund pays a management fee at the following annual rates, calculated daily and payable monthly, based on the Fund’s average daily net assets:
| Percentage of Average Daily Net Assets | ||||||||||||||||||||||||
Fund | First $100 million | Next $400 million | Next $500 million | Next | Next | Over | ||||||||||||||||||
Core Plus Bond Fund | 0.2000 | % | 0.1875 | % | 0.1875 | % | 0.1875 | % | 0.1500 | % | 0.1500 | % | ||||||||||||
Credit Income Fund | 0.4200 | % | 0.4200 | % | 0.4200 | % | 0.4200 | % | 0.4200 | % | 0.4200 | % | ||||||||||||
Global Allocation Fund | 0.7500 | % | 0.7500 | % | 0.7500 | % | 0.7500 | % | 0.7300 | % | 0.7000 | % | ||||||||||||
Growth Fund | 0.5000 | % | 0.5000 | % | 0.5000 | % | 0.5000 | % | 0.5000 | % | 0.5000 | % | ||||||||||||
Intermediate Duration Bond Fund | 0.2500 | % | 0.2500 | % | 0.2500 | % | 0.2500 | % | 0.2500 | % | 0.2500 | % | ||||||||||||
Limited Term Government and Agency Fund | 0.3250 | % | 0.3250 | % | 0.3000 | % | 0.2500 | % | 0.2500 | % | 0.2500 | % | ||||||||||||
Prior to July 1, 2021, Global Allocation Fund and Limited Term Government and Agency Fund paid a management fee at the following annual rates, calculated daily and payable monthly, based on each Fund’s average daily net assets:
| Percentage of Average Daily Net Assets | ||||||||||||
Fund | First $500 million | Next | Over | |||||||||
Global Allocation Fund | 0.7500 | % | 0.7500 | % | 0.7300 | % | ||||||
Limited Term Government and Agency Fund | 0.3250 | % | 0.3000 | % | 0.3000 | % | ||||||
Natixis Advisors, LLC (“Natixis Advisors”) serves as the advisory administrator to Core Plus Bond Fund. Natixis Advisors is a wholly-owned subsidiary of Natixis Investment Managers, LLC. Under the terms of the advisory administration agreement, the Fund pays an advisory administration fee at the following annual rates, calculated daily and payable monthly, based on its average daily net assets:
| Percentage of Average Daily Net Assets | ||||||||||||
Fund | First $100 million | Next | Over | |||||||||
Core Plus Bond Fund | 0.2000 | % | 0.1875 | % | 0.1500 | % | ||||||
Management and advisory administration fees are presented in the Statements of Operations as management fees.
Loomis Sayles has given binding undertakings to the Funds to waive management fees and/or reimburse certain expenses to limit the Funds’ operating expenses, exclusive of acquired fund fees and expenses, brokerage expenses, interest expense, taxes, organizational and extraordinary expenses such as litigation and indemnification expenses. These undertakings are in effect until January 31, 2022, except for Limited Term Government and Agency Fund which is in effect until January 31, 2023, may be terminated before then only with the consent of the Funds’ Board of Trustees and are reevaluated on an annual basis. Management fees payable, as reflected on the Statements of Assets and Liabilities, is net of waivers and/or expense reimbursements, if any, pursuant to these undertakings. Waivers/reimbursements that exceed management fees payable are reflected on the Statements of Assets and Liabilities as receivable from investment adviser.
| 124
Notes to Financial Statements (continued)
September 30, 2021
For the year ended September 30, 2021 the expense limits as a percentage of average daily net assets under the expense limitation agreements were as follows:
| Expense Limit as a Percentage of Average Daily Net Assets | ||||||||||||||||
Fund | Class A | Class C | Class N | Class Y | ||||||||||||
Core Plus Bond Fund | 0.75 | % | 1.50 | % | 0.45 | % | 0.50 | % | ||||||||
Credit Income Fund | 0.82 | % | 1.57 | % | 0.52 | % | 0.57 | % | ||||||||
Global Allocation Fund | 1.25 | % | 2.00 | % | 0.95 | % | 1.00 | % | ||||||||
Growth Fund | 1.25 | % | 2.00 | % | 0.95 | % | 1.00 | % | ||||||||
Intermediate Duration Bond Fund | 0.65 | % | 1.40 | % | 0.35 | % | 0.40 | % | ||||||||
Limited Term Government and Agency Fund | 0.70 | % | 1.45 | % | 0.40 | % | 0.45 | % | ||||||||
Prior to July 1, 2021, the expense limits as a percentage of average daily net assets under the expense limitation agreement for Limited Term Government and Agency Fund were as follows:
| Expense Limit as a Percentage of Average Daily Net Assets | ||||||||||||||||
Fund | Class A | Class C | Class N | Class Y | ||||||||||||
Limited Term Government and Agency Fund | 0.75 | % | 1.50 | % | 0.45 | % | 0.50 | % | ||||||||
Loomis Sayles and Natixis Advisors have agreed to equally bear the waivers and/or expense reimbursements for Core Plus Bond Fund.
Loomis Sayles (and Natixis Advisors for Core Plus Bond Fund) shall be permitted to recover expenses borne under the expense limitation agreements (whether through waiver of management fees or otherwise) on a class by class basis in later periods to the extent the annual operating expenses of a class fall below both (1) a class’ expense limitation ratio in place at the time such amounts were waived/reimbursed and (2) a class’ current applicable expense limitation ratio, provided, however, that a class is not obligated to pay such waived/reimbursed fees or expenses more than one year after the end of the fiscal year in which the fees or expenses were waived/reimbursed.
For the year ended September 30, 2021, the management fees and waivers of management fees for each Fund were as follows:
Gross Fees | Contractual Fees1 | Net Fees | Percentage of Daily Net Assets | |||||||||||||||||
Fund | Gross | Net | ||||||||||||||||||
Core Plus Bond Fund | $ | 14,804,843 | $ | — | $ | 14,804,843 | 0.16 | % | 0.16 | % | ||||||||||
Credit Income Fund | 109,063 | 109,063 | — | 0.42 | % | — | % | |||||||||||||
Global Allocation Fund | 33,980,508 | — | 33,980,508 | 0.74 | % | 0.74 | % | |||||||||||||
Growth Fund | 65,539,656 | — | 65,539,656 | 0.50 | % | 0.50 | % | |||||||||||||
Intermediate Duration Bond Fund | 893,605 | 169,115 | 724,490 | 0.25 | % | 0.20 | % | |||||||||||||
Limited Term Government and Agency Fund | 3,243,640 | — | 3,243,640 | 0.31 | % | 0.31 | % | |||||||||||||
For the year ended September 30, 2021, class-specific expenses have been reimbursed as follows:
| Reimbursement1 | ||||||||||||||||||||
Fund | Class A | Class C | Class N | Class Y | Total | |||||||||||||||
Credit Income Fund | $ | 2,582 | $ | 35 | $ | — | $ | 701 | $ | 3,318 | ||||||||||
Limited Term Government and Agency Fund | 17,410 | 1,490 | — | 42,321 | 61,221 | |||||||||||||||
| 1 | Waiver/expense reimbursements are subject to possible recovery until September 30, 2022. |
In addition, Loomis Sayles reimbursed non-class specific expenses of Credit Income Fund in the amount of $35,465. Expense reimbursements are subject to possible recovery until September 30, 2022.
For the year ended September 30, 2021, the advisory administration fees for Core Plus Bond Fund were $14,804,843 (effective rate of 0.16% of average daily net assets).
No expenses were recovered for any of the Funds during the year ended September 30, 2021 under the terms of the expense limitation agreements.
125 |
Notes to Financial Statements (continued)
September 30, 2021
b. Service and Distribution Fees. Natixis Distribution, LLC (“Natixis Distribution”), which is a wholly-owned subsidiary of Natixis Investment Managers, LLC, has entered into a distribution agreement with the Trusts. Pursuant to this agreement, Natixis Distribution serves as principal underwriter of the Funds of the Trusts.
Pursuant to Rule 12b-1 under the 1940 Act, the Trusts have adopted a Service Plan relating to each Fund’s Class A shares (the “Class A Plans”), and a Distribution and Service Plan relating to each Fund’s Class C shares (the “Class C Plans”).
Under the Class A Plans, each Fund pays Natixis Distribution a monthly service fee at an annual rate not to exceed 0.25% of the average daily net assets attributable to the Fund’s Class A shares, as reimbursement for expenses incurred by Natixis Distribution in providing personal services to investors in Class A shares and/or the maintenance of shareholder accounts.
Under the Class C Plans, each Fund pays Natixis Distribution a monthly service fee at an annual rate not to exceed 0.25% of the average daily net assets attributable to the Fund’s Class C shares, as compensation for services provided by Natixis Distribution in providing personal services to investors in Class C shares and/or the maintenance of shareholder accounts.
Also under the Class C Plans, each Fund pays Natixis Distribution a monthly distribution fee at an annual rate of 0.75% of the average daily net assets attributable to the Fund’s Class C shares, as compensation for services provided by Natixis Distribution in connection with the marketing or sale of Class C shares.
For the year ended September 30, 2021, the service and distribution fees for each Fund were as follows:
| Service Fees | Distribution Fees | |||||||||||
Fund | Class A | Class C | Class C | |||||||||
Core Plus Bond Fund | $ | 1,737,291 | $ | 295,009 | $ | 885,027 | ||||||
Credit Income Fund | 191 | 3 | 8 | |||||||||
Global Allocation Fund | 1,734,474 | 1,288,767 | 3,866,302 | |||||||||
Growth Fund | 4,188,567 | 332,219 | 996,656 | |||||||||
Intermediate Duration Bond Fund | 51,861 | 1,133 | 3,398 | |||||||||
Limited Term Government and Agency Fund | 722,768 | 57,697 | 173,090 | |||||||||
For the year ended September 30, 2021, Natixis Distribution refunded Limited Term Government and Agency Fund $17,234 of prior year Class A service fees paid to Natixis Distribution in excess of amounts subsequently paid to securities dealers or financial intermediaries. Service and distribution fees on the Statements of Operations have been reduced by these amounts.
c. Administrative Fees. Natixis Advisors provides certain administrative services for the Funds and contracts with State Street Bank to serve as sub-administrator. Pursuant to an agreement among Natixis Funds Trusts, Loomis Sayles Funds Trusts, Natixis ETF Trusts and Natixis Advisors, each Fund pays Natixis Advisors monthly its pro rata portion of fees equal to an annual rate of 0.0540% of the first $15 billion of the average daily net assets of the Natixis Funds Trusts, Loomis Sayles Funds Trusts and Natixis ETF Trusts, 0.0500% of the next $15 billion, 0.0400% of the next $30 billion, 0.0275% of the next $30 billion and 0.0225% of such assets in excess of $90 billion, subject to an annual aggregate minimum fee for the Natixis Funds Trusts, Loomis Sayles Funds Trusts and Natixis ETF Trusts of $10 million, which is reevaluated on an annual basis.
For the year ended September 30, 2021, the administrative fees for each Fund were as follows:
Fund | Administrative Fees | |||
Core Plus Bond Fund | $ | 4,007,984 | ||
Credit Income Fund | 11,116 | |||
Global Allocation Fund | 1,972,813 | |||
Growth Fund | 5,608,769 | |||
Intermediate Duration Bond Fund | 152,980 | |||
Limited Term Government and Agency Fund | 445,799 | |||
d. Sub-Transfer Agent Fees. Natixis Distribution has entered into agreements, which include servicing agreements, with financial intermediaries that provide recordkeeping, processing, shareholder communications and other services to customers of the intermediaries that hold positions in the Funds and has agreed to compensate the intermediaries for providing those services. Intermediaries transact with the Funds primarily through the use of omnibus accounts on behalf of their customers who hold positions in the Funds. These services would have been provided by the Funds’ transfer agent and other service providers if the shareholders’ accounts were maintained directly at the Funds’ transfer agent. Accordingly, the Funds have agreed to reimburse Natixis Distribution for all or a portion of the servicing fees paid to these intermediaries. The reimbursement amounts (sub-transfer agent fees) paid to
| 126
Notes to Financial Statements (continued)
September 30, 2021
Natixis Distribution are subject to a current per-account equivalent fee limit approved by the Funds’ Board of Trustees, which is based on fees for similar services paid to the Funds’ transfer agent and other service providers. Class N shares do not bear such expenses.
For the year ended September 30, 2021, the sub-transfer agent fees (which are reflected in transfer agent fees and expenses in the Statements of Operations) for each Fund were as follows:
Fund | Sub-Transfer | |||
Core Plus Bond Fund | $ | 5,273,250 | ||
Credit Income Fund | 7 | |||
Global Allocation Fund | 3,089,988 | |||
Growth Fund | 8,279,948 | |||
Intermediate Duration Bond Fund | 260,810 | |||
Limited Term Government and Agency Fund | 568,606 | |||
As of September 30, 2021, the Funds owe Natixis Distribution the following reimbursements for sub-transfer agent fees (which are reflected in the Statements of Assets and Liabilities as payable to distributor):
Fund | Reimbursements of | |||
Core Plus Bond Fund | $ | 64,591 | ||
Credit Income Fund | 5 | |||
Global Allocation Fund | 57,346 | |||
Growth Fund | 98,926 | |||
Intermediate Duration Bond Fund | 3,327 | |||
Limited Term Government and Agency Fund | 13,868 | |||
Sub-transfer agent fees attributable to Class A, Class C and Class Y are allocated on a pro rata basis to each class based on the relative net assets of each class to the total net assets of those classes.
e. Commissions. Commissions (including CDSCs) on Fund shares retained by Natixis Distribution during the year ended September 30, 2021, were as follows:
Fund | Commissions | |||
Core Plus Bond Fund | $ | 52,059 | ||
Global Allocation Fund | 198,188 | |||
Growth Fund | 81,590 | |||
Limited Term Government and Agency Fund | 79,062 | |||
f. Trustees Fees and Expenses. The Trusts do not pay any compensation directly to their officers or Trustees who are directors, officers or employees of Natixis Advisors, Natixis Distribution, Natixis Investment Managers, LLC or their affiliates. The Chairperson of the Board of Trustees receives a retainer fee at the annual rate of $369,000. The Chairperson does not receive any meeting attendance fees for Board of Trustees meetings or committee meetings that he attends. Each Independent Trustee (other than the Chairperson) receives, in the aggregate, a retainer fee at the annual rate of $199,000. Each Independent Trustee also receives a meeting attendance fee of $10,000 for each meeting of the Board of Trustees that he or she attends in person and $5,000 for each meeting of the Board of Trustees that he or she attends telephonically. In addition, the chairperson of the Contract Review Committee, the chairperson of the Audit Committee and the chairperson of the Governance Committee each receive an additional retainer fee at the annual rate of $20,000. Each Contract Review Committee member is compensated $6,000 for each Committee meeting that he or she attends in person and $3,000 for each meeting that he or she attends telephonically. Each Audit Committee member is compensated $6,000 for each Committee meeting that he or she attends in person and $3,000 for each meeting that he or she attends telephonically. These fees are allocated among the funds in the Natixis Funds Trusts, Loomis Sayles Funds Trusts and Natixis ETF Trusts based on a formula that takes into account, among other factors, the relative net assets of each fund. Trustees are reimbursed for travel expenses in connection with attendance at meetings.
A deferred compensation plan (the “Plan”) is available to the Trustees on a voluntary basis. Deferred amounts remain in the Funds until distributed in accordance with the provisions of the Plan. The value of a participating Trustee’s deferral account is based on theoretical investments of deferred amounts, on the normal payment dates, in certain funds of the Natixis Funds Trusts, Loomis Sayles Funds Trusts and Natixis ETF Trusts as designated by the participating Trustees. Changes in the value of participants’ deferral
127 |
Notes to Financial Statements (continued)
September 30, 2021
accounts are allocated pro rata among the funds in the Natixis Funds Trusts, Loomis Sayles Funds Trusts and Natixis ETF Trusts, and are normally reflected as Trustees’ fees and expenses in the Statements of Operations. The portions of the accrued obligations allocated to the Funds under the Plan are reflected as Deferred Trustees’ fees in the Statements of Assets and Liabilities.
Certain officers and employees of Natixis Advisors and Loomis Sayles are also officers and/or Trustees of the Trusts.
g. Affiliated Ownership. As of September 30, 2021, the percentage of each Fund’s net assets owned by affiliates is as follows:
Core Plus Bond Fund | Percentage of | |||
Loomis Sayles Employees’ Profit Sharing Retirement Plan | 0.10 | % | ||
Credit Income Fund | ||||
Natixis and Affiliates | 99.63 | % | ||
Loomis Sayles Employees | 0.04 | % | ||
Global Allocation Fund | ||||
Loomis Sayles Employees’ Profit Sharing Retirement Plan | 0.54 | % | ||
Growth Fund | ||||
Loomis Sayles Employees’ Profit Sharing Retirement Plan | 0.69 | % | ||
Loomis Sayles Funded Pension Plan and Trust | 0.08 | % | ||
Intermediate Duration Bond Fund | ||||
Loomis Sayles Employees’ Profit Sharing Retirement Plan | 0.81 | % | ||
Limited Term Government and Agency Fund | ||||
Loomis Sayles Employees’ Profit Sharing Retirement Plan | 0.19 | % | ||
Loomis Sayles Distribution | 0.12 | % | ||
Natixis Sustainable Future 2015 Fund | 0.05 | % | ||
Natixis Sustainable Future 2020 Fund | 0.04 | % | ||
Natixis Sustainable Future 2025 Fund | 0.06 | % | ||
Natixis Sustainable Future 2030 Fund | 0.07 | % | ||
Natixis Sustainable Future 2035 Fund | 0.05 | % | ||
Natixis Sustainable Future 2040 Fund | 0.02 | % | ||
Natixis Sustainable Future 2045 Fund | 0.02 | % | ||
Investment activities of affiliated shareholders could have material impacts on the Funds.
h. Reimbursement of Transfer Agent Fees and Expenses. Natixis Advisors has given a binding contractual undertaking to Credit Income Fund, Intermediate Duration Bond Fund and Limited Term Government and Agency Fund to reimburse any and all transfer agency expenses for the Funds’ Class N shares. This undertaking is in effect through January 31, 2022 and is not subject to recovery under the expense limitation agreement described above.
For the year ended September 30, 2021, Natixis Advisors reimbursed the Funds for transfer agency expenses as follows:
Reimbursement of | ||||
Fund | Class N | |||
Credit Income Fund | $ | 975 | ||
Intermediate Duration Bond Fund | 1,047 | |||
Limited Term Government and Agency Fund | 1,392 | |||
7. Custodian Fees and Expenses. State Street Bank, custodian to the Funds, has agreed to waive custodian fees and certain other expenses for the first 12 months of operations for Credit Income Fund. For the period ended September 30, 2021, total fees waived for the Fund were $19,346 (which are reflected in the Statements of Operations as part of waiver and/or expense reimbursement).
| 128
Notes to Financial Statements (continued)
September 30, 2021
8. Class-Specific Transfer Agent Fees and Expenses. Transfer agent fees and expenses attributable to Class A, Class C and Class Y are allocated on a pro rata basis to each class based on the relative net assets of each class to the total net assets of those classes. Transfer agent fees and expenses attributable to Class N are allocated to Class N.
For the year ended September 30, 2021, the Funds incurred the following class-specific transfer agent fees and expenses (including sub-transfer agent fees, where applicable):
| Transfer Agent Fees and Expenses | ||||||||||||||||
Fund | Class A | Class C | Class N | Class Y | ||||||||||||
Core Plus Bond Fund | $ | 584,734 | $ | 97,697 | $ | 10,006 | $ | 4,898,012 | ||||||||
Credit Income Fund | 2,583 | 35 | 975 | 701 | ||||||||||||
Global Allocation Fund | 513,456 | 381,942 | 3,514 | 2,280,097 | ||||||||||||
Growth Fund | 1,221,765 | 97,087 | 3,158 | 7,735,478 | ||||||||||||
Intermediate Duration Bond Fund | 16,461 | 359 | 1,047 | 252,867 | ||||||||||||
Limited Term Government and Agency Fund | 251,884 | 19,681 | 1,392 | 604,335 | ||||||||||||
9. Line of Credit. Each Fund, together with certain other funds of Natixis Funds Trusts, Loomis Sayles Funds Trusts and Natixis ETF Trusts, entered into a $500,000,000 committed unsecured line of credit provided by State Street Bank. Any one Fund may borrow up to $350,000,000 under the line of credit agreement (as long as all borrowings by all Funds in the aggregate do not exceed the $500,000,000 limit at any time), subject to each Fund’s investment restrictions and its contractual obligations under the line of credit. Interest is charged to the Funds based upon the terms set forth in the agreement. In addition, a commitment fee of 0.15% per annum, payable at the end of each calendar quarter, is accrued and apportioned among the participating funds based on their average daily unused portion of the line of credit. The Funds paid an arrangement fee, an upfront fee, and certain other legal fees in connection with the line of credit agreement, which are being amortized over a period of 364 days and are reflected in legal fees and/or miscellaneous expenses on the Statements of Operations. The unamortized balance is reflected as prepaid expenses on the Statements of Assets and Liabilities.
Prior to April 8, 2021, each Fund, except for Credit Income Fund, together with certain other funds of Natixis Funds Trusts, Loomis Sayles Funds Trusts and Natixis ETF Trusts, entered into a $400,000,000 committed unsecured line of credit provided by State Street Bank. Any one Fund may borrow up to $350,000,000 under the line of credit agreement (as long as all borrowings by all Funds in the aggregate do not exceed the $400,000,000 limit at any time), subject to each Fund’s investment restrictions and its contractual obligations under the line of credit.
For the year ended September 30, 2021, none of the Funds had borrowings under this agreement.
10. Risk. Global Allocation Fund’s investments in foreign securities may be subject to greater political, economic, environmental, credit/counterparty and information risks. The Fund’s investments in foreign securities also are subject to foreign currency fluctuations and other foreign currency-related risks. Foreign securities may be subject to higher volatility than U.S. securities, varying degrees of regulation and limited liquidity.
Core Plus Bond Fund and Limited Term Government and Agency Fund’s investments in mortgage-related and asset-backed securities are subject to certain risks not associated with investments in other securities. Mortgage-related and asset-backed securities are subject to the risk that unexpected changes in interest rates will have a direct effect on expected maturity. A shortened maturity may result in the reinvestment of prepaid amounts in securities with lower yields than the original obligations. An extended maturity may result in a reduction of a security’s value.
Global markets have experienced periods of high volatility triggered by the Covid-19 pandemic. The impact of this pandemic and any other epidemic or pandemic that may arise in the future could adversely affect the economies of many nations or the entire global economy and the financial performance of individual issuers, sectors, industries, asset classes, and markets in significant and unforeseen ways. Such effects could impair the Funds’ ability to maintain operational standards, disrupt the operations of the Funds’ service providers, adversely affect the value and liquidity of the Funds’ investments and negatively impact the Funds’ performance.
129 |
Notes to Financial Statements (continued)
September 30, 2021
11. Concentration of Ownership. From time to time, a Fund may have a concentration of one or more accounts constituting a significant percentage of shares outstanding. Investment activities by holders of such accounts could have material impacts on the Funds. As of September 30, 2021, based on management’s evaluation of the shareholder account base, the Funds had accounts representing controlling ownership of more than 5% of the Fund’s total outstanding shares. The number of such accounts, based on accounts that represent more than 5% of an individual class of shares, and the aggregate percentage of net assets represented by such holdings were as follows:
Number of 5% | Percentage of | |||||||
Growth Fund | 2 | 18.61 | % | |||||
Intermediate Duration Bond Fund | 3 | 63.08 | % | |||||
Omnibus shareholder accounts for which Natixis Advisors understands that the intermediary has discretion over the underlying shareholder accounts or investment models where a shareholder account may be invested for a non-discretionary customer are included in the table above. For other omnibus accounts, the Funds do not have information on the individual shareholder accounts underlying the omnibus accounts; therefore, there could be other 5% shareholders in addition to those disclosed in the table above.
12. Capital Shares. Each Fund may issue an unlimited number of shares of beneficial interest, without par value. Transactions in capital shares were as follows:
Year Ended | Year Ended | |||||||||||||||
Core Plus Bond Fund | Shares | Amount | Shares | Amount | ||||||||||||
| Class A |
| |||||||||||||||
Issued from the sale of shares | 29,816,749 | $ | 411,705,864 | 17,898,810 | $ | 246,212,136 | ||||||||||
Issued in connection with the reinvestment of distributions | 1,418,984 | 19,617,302 | 648,421 | 8,793,629 | ||||||||||||
Redeemed | (20,094,174 | ) | (276,883,383 | ) | (16,819,374 | ) | (227,319,033 | ) | ||||||||
|
|
|
|
|
|
|
| |||||||||
Net change | 11,141,559 | $ | 154,439,783 | 1,727,857 | $ | 27,686,732 | ||||||||||
|
|
|
|
|
|
|
| |||||||||
| Class C |
| |||||||||||||||
Issued from the sale of shares | 1,270,632 | $ | 17,680,906 | 2,130,053 | $ | 29,237,104 | ||||||||||
Issued in connection with the reinvestment of distributions | 267,935 | 3,719,298 | 119,932 | 1,623,298 | ||||||||||||
Redeemed | (3,908,443 | ) | (53,805,611 | ) | (4,925,789 | ) | (67,833,185 | ) | ||||||||
|
|
|
|
|
|
|
| |||||||||
Net change | (2,369,876 | ) | $ | (32,405,407 | ) | (2,675,804 | ) | $ | (36,972,783 | ) | ||||||
|
|
|
|
|
|
|
| |||||||||
| Class N |
| |||||||||||||||
Issued from the sale of shares | 74,310,781 | $ | 1,036,339,256 | 84,014,957 | $ | 1,156,522,813 | ||||||||||
Issued in connection with the reinvestment of distributions | 7,758,533 | 108,261,976 | 4,691,629 | 64,237,460 | ||||||||||||
Redeemed | (83,980,462 | ) | (1,169,430,230 | ) | (62,741,955 | ) | (854,510,574 | ) | ||||||||
Redeemed in-kind (Note 13) | — | — | (32,463,709 | ) | (456,764,389 | ) | ||||||||||
|
|
|
|
|
|
|
| |||||||||
Net change | (1,911,148 | ) | $ | (24,828,998 | ) | (6,499,078 | ) | $ | (90,514,690 | ) | ||||||
|
|
|
|
|
|
|
| |||||||||
| Class Y |
| |||||||||||||||
Issued from the sale of shares | 165,904,514 | $ | 2,311,069,290 | 190,014,284 | $ | 2,636,656,671 | ||||||||||
Issued in connection with the reinvestment of distributions | 15,514,659 | 216,562,574 | 6,961,003 | 95,521,951 | ||||||||||||
Redeemed | (118,855,676 | ) | (1,651,141,438 | ) | (96,927,942 | ) | (1,324,095,811 | ) | ||||||||
Redeemed in-kind (Note 13) | (77,281,925 | ) | (1,057,989,549 | ) | — | — | ||||||||||
|
|
|
|
|
|
|
| |||||||||
Net change | (14,718,428 | ) | $ | (181,499,123 | ) | 100,047,345 | $ | 1,408,082,811 | ||||||||
|
|
|
|
|
|
|
| |||||||||
Increase (decrease) from capital share transactions | (7,857,893 | ) | $ | (84,293,745 | ) | 92,600,320 | $ | 1,308,282,070 | ||||||||
|
|
|
|
|
|
|
| |||||||||
| 130
Notes to Financial Statements (continued)
September 30, 2021
12. Capital Shares (continued).
Year Ended | Period Ended | |||||||||||||||
Credit Income Fund | Shares | Amount | Shares | Amount | ||||||||||||
| Class A |
| |||||||||||||||
Issued from the sale of shares | 8,583 | $ | 87,178 | 100 | $ | 1,000 | ||||||||||
Issued in connection with the reinvestment of distributions | 215 | 2,194 | — | — | ||||||||||||
|
|
|
|
|
|
|
| |||||||||
Net change | 8,798 | $ | 89,372 | 100 | $ | 1,000 | ||||||||||
|
|
|
|
|
|
|
| |||||||||
| Class C |
| |||||||||||||||
Issued from the sale of shares | — | $ | — | 100 | $ | 1,000 | ||||||||||
Issued in connection with the reinvestment of distributions | 2 | 20 | — | — | ||||||||||||
|
|
|
|
|
|
|
| |||||||||
Net change | 2 | $ | 20 | 100 | $ | 1,000 | ||||||||||
|
|
|
|
|
|
|
| |||||||||
| Class N |
| |||||||||||||||
Issued from the sale of shares | — | $ | — | 2,500,000 | $ | 25,000,000 | ||||||||||
Issued in connection with the reinvestment of distributions | 70,365 | 717,264 | — | — | ||||||||||||
Redeemed | (136,187 | ) | (1,400,000 | ) | — | — | ||||||||||
|
|
|
|
|
|
|
| |||||||||
Net change | (65,822 | ) | $ | (682,736 | ) | 2,500,000 | $ | 25,000,000 | ||||||||
|
|
|
|
|
|
|
| |||||||||
| Class Y |
| |||||||||||||||
Issued from the sale of shares | 1,992 | $ | 20,000 | 100 | $ | 1,000 | ||||||||||
Issued in connection with the reinvestment of distributions | 63 | 641 | — | — | ||||||||||||
|
|
|
|
|
|
|
| |||||||||
Net change | 2,055 | $ | 20,641 | 100 | $ | 1,000 | ||||||||||
|
|
|
|
|
|
|
| |||||||||
Increase (decrease) from capital share transactions | (54,967 | ) | $ | (572,703 | ) | 2,500,300 | $ | 25,003,000 | ||||||||
|
|
|
|
|
|
|
| |||||||||
| (a) | From commencement of operations on September 29, 2020 through September 30, 2020. |
Year Ended | Year Ended | |||||||||||||||
Global Allocation Fund | Shares | Amount | Shares | Amount | ||||||||||||
| Class A |
| |||||||||||||||
Issued from the sale of shares | 6,524,893 | $ | 180,992,665 | 9,934,108 | $ | 244,510,222 | ||||||||||
Issued in connection with the reinvestment of distributions | 920,421 | 24,308,308 | 408,536 | 10,037,738 | ||||||||||||
Redeemed | (6,008,771 | ) | (165,998,676 | ) | (5,288,773 | ) | (125,525,882 | ) | ||||||||
|
|
|
|
|
|
|
| |||||||||
Net change | 1,436,543 | $ | 39,302,297 | 5,053,871 | $ | 129,022,078 | ||||||||||
|
|
|
|
|
|
|
| |||||||||
| Class C |
| |||||||||||||||
Issued from the sale of shares | 3,263,944 | $ | 88,556,205 | 5,429,302 | $ | 129,254,637 | ||||||||||
Issued in connection with the reinvestment of distributions | 874,791 | 22,762,056 | 335,475 | 8,148,688 | ||||||||||||
Redeemed | (5,108,914 | ) | (139,833,825 | ) | (7,501,444 | ) | (180,254,496 | ) | ||||||||
|
|
|
|
|
|
|
| |||||||||
Net change | (970,179 | ) | $ | (28,515,564 | ) | (1,736,667 | ) | $ | (42,851,171 | ) | ||||||
| �� |
|
|
|
|
|
|
|
| ||||||||
| Class N |
| |||||||||||||||
Issued from the sale of shares | 2,841,756 | $ | 79,949,134 | 2,473,848 | $ | 60,506,193 | ||||||||||
Issued in connection with the reinvestment of distributions | 538,052 | 14,290,673 | 229,737 | 5,672,201 | ||||||||||||
Redeemed | (1,348,272 | ) | (37,935,362 | ) | (1,170,090 | ) | (28,432,814 | ) | ||||||||
|
|
|
|
|
|
|
| |||||||||
Net change | 2,031,536 | $ | 56,304,445 | 1,533,495 | $ | 37,745,580 | ||||||||||
|
|
|
|
|
|
|
| |||||||||
| Class Y |
| |||||||||||||||
Issued from the sale of shares | 28,068,845 | $ | 781,608,888 | 39,782,349 | $ | 960,786,370 | ||||||||||
Issued in connection with the reinvestment of distributions | 5,159,028 | 137,075,378 | 1,901,677 | 46,971,422 | ||||||||||||
Redeemed | (20,980,436 | ) | (585,757,015 | ) | (21,963,125 | ) | (519,151,329 | ) | ||||||||
|
|
|
|
|
|
|
| |||||||||
Net change | 12,247,437 | $ | 332,927,251 | 19,720,901 | $ | 488,606,463 | ||||||||||
|
|
|
|
|
|
|
| |||||||||
Increase from capital share transactions | 14,745,337 | $ | 400,018,429 | 24,571,600 | $ | 612,522,950 | ||||||||||
|
|
|
|
|
|
|
| |||||||||
131 |
Notes to Financial Statements (continued)
September 30, 2021
12. Capital Shares (continued).
Year Ended | Year Ended | |||||||||||||||
Growth Fund | Shares | Amount | Shares | Amount | ||||||||||||
| Class A |
| |||||||||||||||
Issued from the sale of shares | 14,830,602 | $ | 336,860,802 | 17,054,510 | $ | 295,932,287 | ||||||||||
Issued in connection with the reinvestment of distributions | 2,584,797 | 55,159,560 | 1,535,788 | 26,261,967 | ||||||||||||
Redeemed | (15,759,091 | ) | (358,878,253 | ) | (25,287,462 | ) | (430,112,221 | ) | ||||||||
|
|
|
|
|
|
|
| |||||||||
Net change | 1,656,308 | $ | 33,142,109 | (6,697,164 | ) | $ | (107,917,967 | ) | ||||||||
|
|
|
|
|
|
|
| |||||||||
| Class C |
| |||||||||||||||
Issued from the sale of shares | 758,965 | $ | 15,406,250 | 1,233,665 | $ | 19,482,505 | ||||||||||
Issued in connection with the reinvestment of distributions | 217,137 | 4,145,151 | 120,727 | 1,870,055 | ||||||||||||
Redeemed | (1,887,469 | ) | (38,343,784 | ) | (2,748,722 | ) | (44,108,509 | ) | ||||||||
|
|
|
|
|
|
|
| |||||||||
Net change | (911,367 | ) | $ | (18,792,383 | ) | (1,394,330 | ) | $ | (22,755,949 | ) | ||||||
|
|
|
|
|
|
|
| |||||||||
| Class N |
| |||||||||||||||
Issued from the sale of shares | 9,306,755 | $ | 236,713,241 | 17,025,202 | $ | 315,167,287 | ||||||||||
Issued in connection with the reinvestment of distributions | 791,041 | 18,170,220 | 728,950 | 13,354,361 | ||||||||||||
Redeemed | (4,802,896 | ) | (118,776,438 | ) | (17,501,743 | ) | (331,093,667 | ) | ||||||||
|
|
|
|
|
|
|
| |||||||||
Net change | 5,294,900 | $ | 136,107,023 | 252,409 | $ | (2,572,019 | ) | |||||||||
|
|
|
|
|
|
|
| |||||||||
| Class Y |
| |||||||||||||||
Issued from the sale of shares | 103,087,646 | $ | 2,516,764,085 | 129,418,130 | $ | 2,410,503,407 | ||||||||||
Issued in connection with the reinvestment of distributions | 14,341,619 | 329,570,400 | 8,337,704 | 152,830,107 | ||||||||||||
Redeemed | (104,651,246 | ) | (2,564,375,092 | ) | (127,998,579 | ) | (2,403,446,308 | ) | ||||||||
|
|
|
|
|
|
|
| |||||||||
Net change | 12,778,019 | $ | 281,959,393 | 9,757,255 | $ | 159,887,206 | ||||||||||
|
|
|
|
|
|
|
| |||||||||
Increase from capital share transactions | 18,817,860 | $ | 432,416,142 | 1,918,170 | $ | 26,641,271 | ||||||||||
|
|
|
|
|
|
|
| |||||||||
Year Ended | Year Ended | |||||||||||||||
Intermediate Duration Bond Fund | Shares | Amount | Shares | Amount | ||||||||||||
| Class A |
| |||||||||||||||
Issued from the sale of shares | 391,289 | $ | 4,178,504 | 324,729 | $ | 3,474,978 | ||||||||||
Issued in connection with the reinvestment of distributions | 67,348 | 722,081 | 46,350 | 490,629 | ||||||||||||
Redeemed | (295,471 | ) | (3,162,591 | ) | (592,250 | ) | (6,368,788 | ) | ||||||||
|
|
|
|
|
|
|
| |||||||||
Net change | 163,166 | $ | 1,737,994 | (221,171 | ) | $ | (2,403,181 | ) | ||||||||
|
|
|
|
|
|
|
| |||||||||
| Class C |
| |||||||||||||||
Issued from the sale of shares | 33,975 | $ | 362,538 | 19,815 | $ | 211,443 | ||||||||||
Issued in connection with the reinvestment of distributions | 1,594 | 17,157 | 773 | 8,198 | ||||||||||||
Redeemed | (66,527 | ) | (713,206 | ) | (4,252 | ) | (45,689 | ) | ||||||||
|
|
|
|
|
|
|
| |||||||||
Net change | (30,958 | ) | $ | (333,511 | ) | 16,336 | $ | 173,952 | ||||||||
|
|
|
|
|
|
|
| |||||||||
| Class N |
| |||||||||||||||
Issued from the sale of shares | 1,919,981 | $ | 20,990,656 | 8,686 | $ | 92,320 | ||||||||||
Issued in connection with the reinvestment of distributions | 73,626 | 788,205 | 8,959 | 94,763 | ||||||||||||
Redeemed | (393,996 | ) | (4,192,408 | ) | (54,098 | ) | (585,173 | ) | ||||||||
|
|
|
|
|
|
|
| |||||||||
Net change | 1,599,611 | $ | 17,586,453 | (36,453 | ) | $ | (398,090 | ) | ||||||||
|
|
|
|
|
|
|
| |||||||||
| Class Y |
| |||||||||||||||
Issued from the sale of shares | 10,808,587 | $ | 115,946,231 | 12,426,531 | $ | 132,862,309 | ||||||||||
Issued in connection with the reinvestment of distributions | 1,146,148 | 12,285,740 | 557,209 | 5,914,095 | ||||||||||||
Redeemed | (6,495,177 | ) | (69,613,933 | ) | (6,797,325 | ) | (71,873,949 | ) | ||||||||
|
|
|
|
|
|
|
| |||||||||
Net change | 5,459,558 | $ | 58,618,038 | 6,186,415 | $ | 66,902,455 | ||||||||||
|
|
|
|
|
|
|
| |||||||||
Increase from capital share transactions | 7,191,377 | $ | 77,608,974 | 5,945,127 | $ | 64,275,136 | ||||||||||
|
|
|
|
|
|
|
| |||||||||
| 132
Notes to Financial Statements (continued)
September 30, 2021
12. Capital Shares (continued).
Year Ended | Year Ended | |||||||||||||||
Limited Term Government and Agency Fund | Shares | Amount | Shares | Amount | ||||||||||||
| Class A |
| |||||||||||||||
Issued from the sale of shares | 4,147,975 | $ | 47,644,899 | 8,119,093 | $ | 93,051,564 | ||||||||||
Issued in connection with the reinvestment of distributions | 142,329 | 1,632,849 | 294,326 | 3,364,566 | ||||||||||||
Redeemed | (4,760,500 | ) | (54,613,007 | ) | (9,910,542 | ) | (113,643,142 | ) | ||||||||
|
|
|
|
|
|
|
| |||||||||
Net change | (470,196 | ) | $ | (5,335,259 | ) | (1,497,123 | ) | $ | (17,227,012 | ) | ||||||
|
|
|
|
|
|
|
| |||||||||
| Class C |
| |||||||||||||||
Issued from the sale of shares | 1,491,979 | $ | 17,130,682 | 1,390,000 | $ | 15,896,924 | ||||||||||
Issued in connection with the reinvestment of distributions | 565 | 6,501 | 8,812 | 100,557 | ||||||||||||
Redeemed | (1,003,816 | ) | (11,516,279 | ) | (1,649,132 | ) | (18,865,977 | ) | ||||||||
|
|
|
|
|
|
|
| |||||||||
Net change | 488,728 | $ | 5,620,904 | (250,320 | ) | $ | (2,868,496 | ) | ||||||||
|
|
|
|
|
|
|
| |||||||||
| Class N |
| |||||||||||||||
Issued from the sale of shares | 647,112 | $ | 7,445,249 | 719,991 | $ | 8,232,916 | ||||||||||
Issued in connection with the reinvestment of distributions | 9,104 | 104,691 | 12,962 | 148,889 | ||||||||||||
Redeemed | (474,940 | ) | (5,474,545 | ) | (242,561 | ) | (2,793,313 | ) | ||||||||
|
|
|
|
|
|
|
| |||||||||
Net change | 181,276 | $ | 2,075,395 | 490,392 | $ | 5,588,492 | ||||||||||
|
|
|
|
|
|
|
| |||||||||
| Class Y |
| |||||||||||||||
Issued from the sale of shares | 31,129,058 | $ | 358,564,945 | 54,197,489 | $ | 624,437,973 | ||||||||||
Issued in connection with the reinvestment of distributions | 418,562 | 4,816,720 | 574,408 | 6,596,941 | ||||||||||||
Redeemed | (29,381,773 | ) | (338,427,397 | ) | (35,196,219 | ) | (404,652,972 | ) | ||||||||
|
|
|
|
|
|
|
| |||||||||
Net change | 2,165,847 | $ | 24,954,268 | 19,575,678 | $ | 226,381,942 | ||||||||||
|
|
|
|
|
|
|
| |||||||||
Increase from capital share transactions | 2,365,655 | $ | 27,315,308 | 18,318,627 | $ | 211,874,926 | ||||||||||
|
|
|
|
|
|
|
| |||||||||
13. Redemption In-Kind. In certain circumstances, a Fund may distribute portfolio securities rather than cash as payment for redemption of Fund shares (redemption in-kind). For financial reporting purposes, the Fund will recognize a gain on in-kind redemptions to the extent the value of the distributed securities on the date of redemption exceeds the cost of those securities; the Fund will recognize a loss if the cost exceeds value. Gains and losses realized on redemptions in-kind are not recognized for tax purposes and are re-classified from realized gain (loss) to paid-in-capital. Core Plus Bond Fund realized a gain of $31,368,945 on redemptions-in-kind during the year ended September 30, 2021. This amount is included in realized gain (loss) on the Statements of Operations.
133 |
Report of Independent Registered Public Accounting Firm
To the Board of Trustees of Loomis Sayles Funds I, Loomis Sayles Funds II and Natixis Funds Trust I and Shareholders of Loomis Sayles Intermediate Duration Bond Fund, Loomis Sayles Global Allocation Fund, Loomis Sayles Growth Fund, Loomis Sayles Limited Term Government and Agency Fund, Loomis Sayles Credit Income Fund and Loomis Sayles Core Plus Bond Fund:
Opinions on the Financial Statements
We have audited the accompanying statements of assets and liabilities, including the portfolios of investments, of Loomis Sayles Intermediate Duration Bond Fund (one of the funds constituting Loomis Sayles Funds I), Loomis Sayles Global Allocation Fund, Loomis Sayles Growth Fund, Loomis Sayles Limited Term Government and Agency Fund and Loomis Sayles Credit Income Fund (four of the funds constituting Loomis Sayles Funds II), and Loomis Sayles Core Plus Bond Fund (the fund constituting Natixis Funds Trust I) (hereafter collectively referred to as the “Funds”) as of September 30, 2021, the related statements of operations for the year ended September 30, 2021, the statements of changes in net assets for each of the two years in the period ended September 30, 2021, including the related notes, and the financial highlights for each of the periods indicated therein (collectively referred to as the “financial statements”). In our opinion, the financial statements present fairly, in all material respects, the financial position of each of the Funds as of September 30, 2021, the results of each of their operations for the year then ended, the changes in each of their net assets for each of the two years in the period ended September 30, 2021 and each of the financial highlights for each of the periods indicated therein, in conformity with accounting principles generally accepted in the United States of America.
Basis for Opinions
These financial statements are the responsibility of the Funds’ management. Our responsibility is to express an opinion on the Funds’ financial statements based on our audits. We are a public accounting firm registered with the Public Company Accounting Oversight Board (United States) (PCAOB) and are required to be independent with respect to the Funds in accordance with the U.S. federal securities laws and the applicable rules and regulations of the Securities and Exchange Commission and the PCAOB.
We conducted our audits of these financial statements in accordance with the standards of the PCAOB. Those standards require that we plan and perform the audit to obtain reasonable assurance about whether the financial statements are free of material misstatement, whether due to error or fraud.
Our audits included performing procedures to assess the risks of material misstatement of the financial statements, whether due to error or fraud, and performing procedures that respond to those risks. Such procedures included examining, on a test basis, evidence regarding the amounts and disclosures in the financial statements. Our audits also included evaluating the accounting principles used and significant estimates made by management, as well as evaluating the overall presentation of the financial statements. Our procedures included confirmation of securities owned as of September 30, 2021 by correspondence with the custodian, transfer agent and brokers; when replies were not received from brokers, we performed other auditing procedures. We believe that our audits provide a reasonable basis for our opinions.
/s/PricewaterhouseCoopers LLP
Boston, Massachusetts
November 22, 2021
We have served as the auditor of one or more investment companies in the Natixis Investment Company Complex since at least 1995. We have not determined the specific year we began serving as auditor.
| 134
2021 U.S. Tax Distribution Information to Shareholders (Unaudited)
Corporate Dividends Received Deduction. For the fiscal year ended September 30, 2021, a percentage of dividends distributed by the Funds listed below qualify for the dividends received deduction for corporate shareholders. These percentages are as follows:
Fund | Qualifying | |||
Credit Income Fund | 2.31 | % | ||
Global Allocation Fund | 53.99 | % | ||
Growth Fund | 100.00 | % | ||
Capital Gains Distributions. Pursuant to Internal Revenue Section 852(b), the following Funds paid distributions, which have been designated as capital gains distributions for the fiscal year ended September 30, 2021, unless subsequently determined to be different.
Fund | Amount | |||
Core Plus Bond Fund | $ | 35,563,095 | ||
Global Allocation Fund | 229,409,750 | |||
Growth Fund | 508,298,281 | |||
Intermediate Duration Bond Fund | 1,137,809 | |||
Qualified Dividend Income. For the fiscal year ended September 30, 2021, the Funds below will designate up to the maximum amount allowable pursuant to the Internal Revenue Code as qualified dividend income eligible for reduced tax rates. These lower rates range from 0% to 20% depending on an individual’s tax bracket. If the Funds pay a distribution during calendar year 2021, complete information will be reported in conjunction with Form 1099-DIV.
Fund | ||
Credit Income Fund | ||
Global Allocation Fund | ||
Growth Fund |
135 |
Trustee and Officer Information
The tables below provide certain information regarding the Trustees and officers of Natixis Funds Trust I, Loomis Sayles Funds I and Loomis Sayles Funds II (the “Trusts”). Unless otherwise indicated, the address of all persons below is 888 Boylston Street, Suite 800, Boston, MA 02199-8197. The Funds’ Statement of Additional Information includes additional information about the Trustees of the Trusts and is available by calling Natixis Funds at 800-225-5478.
Name and Year of Birth | Position(s) Held with of Time Served and Term of Office1 | Principal During Past 5 Years | Number of Portfolios | Experience, | ||||
| INDEPENDENT TRUSTEES | ||||||||
| Edmond J. English (1953) | Trustee since 2013 Chairperson of the Governance Committee and Contract Review Committee Member | Executive Chairman of Bob’s Discount Furniture (retail) | 54 Director, Burlington Stores, Inc. (retail) | Significant experience on the Board and on the boards of other business organizations (including retail companies and a bank); executive experience (including at a retail company) | ||||
Richard A. Goglia (1951) | Trustee since 2015 Contract Review Committee Member and Governance Committee Member | Retired | 54 Director of Triumph Group (aerospace industry) | Significant experience on the Board and executive experience (including his role as vice president and treasurer of a defense company and experience at a financial services company) | ||||
Wendell J. Knox (1948) | Trustee since 2009 Chairperson of the Contract Review Committee | Retired | 54 Director, Abt Associates Inc. (research and consulting); Director, The Hanover Insurance Group (property and casualty insurance); formerly, Director, Eastern Bank (bank) | Significant experience on the Board and on the boards of other business organizations (including at a bank and at a property and casualty insurance firm); executive experience (including roles as president and chief executive officer of a research and consulting company) | ||||
| 136
Trustee and Officer Information
Name and Year of Birth | Position(s) Held with of Time Served and Term of Office1 | Principal During Past 5 Years | Number of Portfolios | Experience, | ||||
| INDEPENDENT TRUSTEES – continued | ||||||||
Martin T. Meehan (1956) | Trustee since 2012 Audit Committee Member and Governance Committee Member | President, University of Massachusetts | 54 None | Significant experience on the Board and on the boards of other business organizations; experience as President of the University of Massachusetts; government experience (including as a member of the U.S. House of Representatives); academic experience | ||||
Maureen B. Mitchell (1951) | Trustee since 2017 Audit Committee Member and Governance Committee Member | Retired | 54 Director, Sterling Bancorp (bank) | Experience on the Board; financial services industry and executive experience (including role as president of global sales and marketing at a financial services company) | ||||
James P. Palermo (1955) | Trustee since 2016 Audit Committee Member | Founding Partner, Breton Capital Management, LLC (private equity); Partner, STEP Partners, LLC (private equity) | 54 Director, FutureFuel.io (chemicals and biofuels) | Significant experience on the Board; financial services industry and executive experience (including roles as chief executive officer of client management and asset servicing for a banking and financial services company) | ||||
Erik R. Sirri (1958) | Chairperson of the Board of Trustees since January 2021 Trustee since 2009 Ex Officio member of the Audit Committee, Contract Review Committee and Governance Committee | Professor of Finance at Babson College | 54 None | Significant experience on the Board; experience as Director of the Division of Trading and Markets at the Securities and Exchange Commission; academic experience; training as an economist | ||||
137 |
Trustee and Officer Information
Name and Year of Birth | Position(s) Held with of Time Served and Term of Office1 | Principal During Past 5 Years | Number of Portfolios | Experience, | ||||
| INDEPENDENT TRUSTEES – continued | ||||||||
Peter J. Smail (1952) | Trustee since 2009 Audit Committee Member | Retired | 54 None | Significant experience on the Board; mutual fund industry and executive experience (including roles as president and chief executive officer for an investment adviser) | ||||
Kirk A. Sykes (1958) | Trustee since 2019 Contract Review Committee Member and Governance Committee Member | Managing Director of Accordia Partners, LLC (real estate development); President of Primary Corporation (real estate development); Managing Principal of Merrick Capital Partners (infrastructure finance); formerly, President of Urban Strategy America Fund (real estate fund manager) | 54 Trustee, Eastern Bank (bank); Director, Apartment Investment and Management Company (real estate investment trust); formerly, Director, Ares Commercial Real Estate Corporation (real estate investment trust) | Experience on the Board and significant experience on the boards of other business organizations (including real estate companies and banks) | ||||
Cynthia L. Walker (1956) | Trustee since 2005 Chairperson of the Audit Committee | Retired; formerly, Deputy Dean for Finance and Administration, Yale University School of Medicine | 54 None | Significant experience on the Board; executive experience in a variety of academic organizations (including roles as dean for finance and administration) | ||||
| INTERESTED TRUSTEES | ||||||||
Kevin P. Charleston3 (1965) One Financial Center Boston, MA 02111 | Trustee since 2015 President and Chief Executive Officer of Loomis Sayles Funds I since 2015 | President, Chief Executive Officer and Chairman of the Board of Directors, Loomis, Sayles & Company, L.P. | 54 None | Significant experience on the Board; continuing service as President, Chief Executive Officer and Chairman of the Board of Directors of Loomis, Sayles & Company, L.P. | ||||
| 138
Trustee and Officer Information
Name and Year of Birth | Position(s) Held with of Time Served and Term of Office1 | Principal During Past 5 Years | Number of Portfolios | Experience, | ||||
| INTERESTED TRUSTEES – continued | ||||||||
| David L. Giunta4 (1965) | Trustee since 2011 President and Chief Executive Officer of Natixis Funds Trust I; Chief Executive Officer of Loomis Sayles Funds II since 2015; President of Loomis Sayles Funds II and Executive Vice President of Loomis Sayles Funds I since 2008 | President and Chief Executive Officer, Natixis Advisors, LLC and Natixis Distribution, LLC | 54 None | Significant experience on the Board; experience as President and Chief Executive Officer of Natixis Advisors, LLC and Natixis Distribution, LLC | ||||
| 1 | Each Trustee serves until retirement, resignation or removal from the Board. The current retirement age is 75. The position of Chairperson of the Board is appointed for a three-year term. |
| 2 | The Trustees of the Trusts serve as Trustees of a fund complex that includes all series of the Natixis Funds Trust I, Natixis Funds Trust II, Natixis Funds Trust IV, Gateway Trust, Loomis Sayles Funds I, Loomis Sayles Funds II, Natixis ETF Trust and Natixis ETF Trust II (collectively, the “Fund Complex”). |
| 3 | Mr. Charleston is deemed an “interested person” of the Trusts because he holds the following positions with an affiliated person of the Trusts: President, Chief Executive Officer and Chairman of the Board of Directors of Loomis, Sayles & Company, L.P. |
| 4 | Mr. Giunta is deemed an “interested person” of the Trusts because he holds the following positions with an affiliated person of the Trusts: President and Chief Executive Officer, Natixis Advisors, LLC and Natixis Distribution, LLC. |
Name and Year of Birth | Position(s) Held with the Trusts | Term of Office1 and Length | Principal Occupation(s) | |||
| OFFICERS OF THE TRUSTS | ||||||
Michael C. Kardok (1959) | Treasurer, Principal Financial and Accounting Officer | Since 2004 | Senior Vice President, Natixis Advisors, LLC and Natixis Distribution, LLC | |||
Natalie R. Wagner (1979) | Chief Compliance Officer, Assistant Secretary and Anti-Money Laundering Officer
Chief Legal Officer | Since May 2021
Since July 2021 | Formerly, Vice President, Head of Corporate Compliance, Global Atlantic Financial Group | |||
| 1 | Each officer of the Trusts serves for an indefinite term in accordance with the Trusts’ current by-laws until the date his or her successor is elected and qualified, or until he or she sooner dies, retires, is removed or becomes disqualified. |
| 2 | Each person listed above, except as noted, holds the same position(s) with the Fund Complex. Previous positions during the past five years with Natixis Distribution, LLC, Natixis Advisors, LLC or Loomis, Sayles & Company, L.P. are omitted, if not materially different from an officer’s current position with such entity. |
139 |

Loomis Sayles Small Cap Growth Fund
Loomis Sayles Small Cap Value Fund
Loomis Sayles Small/Mid Cap Growth Fund
Annual Report
September 30, 2021
| TABLE OF CONTENTS | ||||
| Portfolio Review | 1 | |||
| Portfolio of Investments | 17 | |||
| Financial Statements | 24 | |||
| Notes to Financial Statements | 33 | |||
LOOMIS SAYLES SMALL CAP GROWTH FUND
| Managers | Symbols | |||
| Mark F. Burns, CFA® | Institutional Class | LSSIX | ||
| John J. Slavik, CFA® | Retail Class | LCGRX | ||
| Class N | LSSNX | |||
Investment Objective
The Fund’s investment objective is long-term capital growth from investments in common stocks or other equity securities.
Market Conditions
The one-year period ending September 30, 2021 was very strong for the overall market, although punctuated by choppiness and volatility. Markets rallied sharply during the fourth quarter of 2020 as Covid-19 vaccines received emergency use authorization approval and uncertainty about the US presidential election resolved itself. Lower-quality stocks, as well as stocks that are more sensitive to market movements, led the market higher. At the beginning of 2021, the market steadied, but the spring months brought new concerns, including heightened valuations, challenging year-over-year comparisons on economic data, and the rise of the Delta variant. This produced a greater degree of choppiness in the market, which persisted through the end of the period.
Performance Results
For the 12 months ended September 30, 2021, Institutional Class shares of the Loomis Sayles Small Cap Growth Fund returned 30.53% at net asset value. The Fund underperformed its benchmark, the Russell 2000® Growth Index, which returned 33.27%.
Explanation of Fund Performance
Given our strategy’s high quality focus, the early part of the period was very challenging on a relative basis. Since then, however, the Fund’s relative performance has improved.
Among top contributors to relative performance were stock selection in the healthcare and communication services sectors, as well as relative positioning in the utilities sector. Conversely, stock selection in the information technology and industrials sectors, along with relative positioning and stock selection in the financials sector, detracted from relative performance.
The Fund’s top contributors to relative performance at the individual stock level were digital printing specialist Kornit Digital Ltd., cybersecurity services provider Rapid7 Inc. and implantable ocular lens company STAAR Surgical. Kornit Digital has led the secular shift away from traditional methods of printing on fabrics and garments toward digital alternatives, and it introduced a number of new printing machines to the market that drove further demand and widened its competitive advantage versus its peers. With the boom in e-commerce during the pandemic, the demand for Kornit’s products has accelerated. Rapid7 has been strong for the last year as an emerging leader within cloud cybersecurity for the mid-market, having expanded its suite of solutions. As a result, Rapid7 has seen acceleration in new customer growth, consistently better-than-expected total annual recurring revenue growth, and profit gains coming more quickly than anticipated. STAAR Surgical has performed well as investors have recognized its ability to outperform internationally while overcoming pandemic-related headwinds. Anticipation of STAAR’s entry into the US market in 2022 with its newest lens product also spurred investor interest.
Conversely, the largest detractors from relative performance among individual stocks were insurance provider Palomar Holdings Inc., cloud-based healthcare platform provider Inovalon Holdings Inc. and home-health services company LHC Group Inc. Palomar triggered the Fund’s stop loss after announcing a larger-than-expected catastrophe loss related to three moderate-sized hurricanes near the Gulf Coast of the US during the 2020 storm season. Inovalon saw its stock fall on uncertainty that its bookings would be sufficient to meet the company’s full-year guidance, given the choppy macroeconomic environment. With LHC Group, later-than-usual referrals due to Covid-19 weighed on its hospice business, and the slowdown in hospital discharges hurt its home-health segment. LHC Group has also seen costs rise as a result of the nationwide shortage of nursing professionals.
Outlook
As market correlations fall, we see investors placing greater importance on company-specific fundamentals. This, in turn, should lead to earnings growth becoming the primary driver of stock returns.
The economic outlook is still generally positive although uncertainties remain. These include more difficult growth comparisons for companies in the coming quarters, continued supply chain disruptions, lingering concerns about Covid-19 variants, and ongoing fiscal and monetary policy uncertainty from Washington and the US Federal Reserve.
Despite these uncertainties, we remain focused on the underlying business fundamentals of our companies. Uncertainty drives markets, and with market correlations low, earnings growth increasing in importance, and small-cap stocks looking ready to catch up to their large-cap counterparts, we believe that the Fund is well positioned for the future.
1 |
Top Ten Holdings as of September 30, 2021
| Security name | % of Net Assets | |||||
| 1 | Kornit Digital Ltd. | 2.18 | % | |||
| 2 | SiteOne Landscape Supply, Inc. | 2.04 | ||||
| 3 | Rapid7, Inc. | 1.87 | ||||
| 4 | Shutterstock, Inc. | 1.68 | ||||
| 5 | Novanta, Inc. | 1.58 | ||||
| 6 | Casella Waste Systems, Inc., Class A | 1.53 | ||||
| 7 | MACOM Technology Solutions Holdings, Inc. | 1.52 | ||||
| 8 | Varonis Systems, Inc. | 1.44 | ||||
| 9 | WNS Holdings Ltd., ADR | 1.43 | ||||
| 10 | Advanced Drainage Systems, Inc. | 1.41 | ||||
The portfolio is actively managed and holdings are subject to change. There is no guarantee the Fund continues to invest in the securities referenced. The holdings listed exclude any temporary cash investments, are presented on an individual security basis and do not represent holdings of the issuer.
Hypothetical Growth of $100,000 Investment in Institutional Class Shares2
September 30, 2011 through September 30, 2021
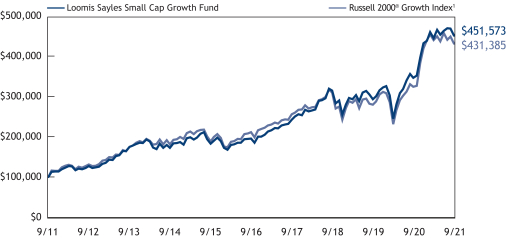
See notes to charts on Page 3.
| 2
LOOMIS SAYLES SMALL CAP GROWTH FUND
Average Annual Total Returns — September 30, 20212
| Expense Ratios3 | ||||||||||||||||||||||||
| 1 Year | 5 Years | 10 Years | Life of Class N | Gross | Net | |||||||||||||||||||
| Institutional Class (Inception 12/31/96) | 30.53 | % | 18.25 | % | 16.27 | % | — | % | 0.94 | % | 0.94 | % | ||||||||||||
| Retail Class (Inception 12/31/96) | 30.20 | 17.95 | 15.96 | — | 1.19 | 1.19 | ||||||||||||||||||
| Class N (Inception 2/1/13) | 30.66 | 18.38 | — | 15.15 | 0.82 | 0.82 | ||||||||||||||||||
| Comparative Performance | ||||||||||||||||||||||||
| Russell 2000® Growth Index1 | 33.27 | 15.34 | 15.74 | 13.66 | ||||||||||||||||||||
Performance data shown represents past performance and is no guarantee of, and not necessarily indicative of, future results. Total return and value will vary, and you may have a gain or loss when shares are sold. Current performance may be lower or higher than quoted. For most recent month-end performance, visit loomissayles.com. Performance for other share classes will be greater or less than shown based on differences in fees and sales charges. You may not invest directly in an index. Performance for periods less than one year is cumulative, not annualized. Returns reflect changes in share price and reinvestment of dividends and capital gains, if any. The table(s) do not reflect taxes shareholders might owe on any fund distributions or when they redeem their shares.
| 1 | Russell 2000® Growth Index is an unmanaged index that measures the performance of the small-cap growth segment of the U.S. equity universe. It includes those Russell 2000® companies with higher price-to-book ratios and higher forecasted growth values. |
| 2 | Fund performance has been increased by fee waivers and/or expense reimbursements, if any, without which performance would have been lower. |
| 3 | Expense ratios are as shown in the Fund’s prospectus in effect as of the date of this report. The expense ratios for the current reporting period can be found in the Financial Highlights section of this report under Ratios to Average Net Assets. Net expenses reflect contractual expense limitations set to expire on 1/31/22. When a Fund’s expenses are below the limitation, gross and net expense ratios will be the same. See Note 5 of the Notes to Financial Statements for more information about the Fund’s expense limitations. |
3 |
LOOMIS SAYLES SMALL CAP VALUE FUND
| Managers | Symbols | |||
| Joseph R. Gatz, CFA® | Institutional Class | LSSCX | ||
| Jeffrey Schwartz, CFA® | Retail Class | LSCRX | ||
| Admin Class | LSVAX | |||
| Class N | LSCNX | |||
Investment Objective
The Fund’s investment objective is long-term capital growth from investments in common stocks or other equity securities.
Market Conditions
The trailing 12 months ended September 30, 2021 was one of the highest-returning periods in the 37-year history of the Russell 2000® Index, against a backdrop of sustained economic recovery fueled by notable progress on the vaccine front, anticipation of new fiscal stimulus measures, monetary accommodation, and positive corporate earnings surprises. After a strong market rally during the fourth quarter of 2020, US equities advanced in early 2021, continuing the robust rally from the pandemic-driven lows in March 2020. The market experienced a rotation to value-oriented sectors such as energy, financials and materials during the period, amid an uptick in interest rates.
Domestic equities were higher during the first three quarters of the 12-month period, marking five consecutive quarters of gains. Earnings grew as the global economy reopened, and ample liquidity supported capital markets. Below the surface of the steady market gains, however, debate arose concerning the potential for rising inflation, headwinds from higher input costs, peaking profits, and fears of a new variant of the Covid-19 virus. These factors affected relative performance between cyclicals and defensive stocks, between growth and value stocks, and between large-cap and small-cap stocks.
During the final three months of the period, US equities remained within a fairly tight range, with slight gains achieved in large cap stocks and modest losses in small caps. Positive contributors such as robust earnings growth and ample liquidity from central banks began to give way late in the quarter to heightened uncertainty over worsening supply chain disruptions, inflationary pressures, potential tapering by the US Federal Reserve, and waves of new Covid-19 outbreaks. The period ended with higher-quality stocks back in favor after lagging substantially during the initial stages of the economy reopening.
Small cap stocks fully participated in the equity market recovery, outperforming larger cap stocks, as the small cap value index was the best performing segment of the domestic equity market, returning almost 64% during the 12-month period. Reversing the trend of the last few years, value stocks outperformed growth stocks across all market capitalizations.
Although there were several market rotations during the past year within the Russell 2000® Value Index, overall the market gains were led by stocks with the smallest market capitalization, the lowest quality fundamentals or money-losing companies. Cyclical areas of the market such as energy, materials and consumer discretionary were the leading sectors along with communication services. Conversely, defensive sectors such as utilities, healthcare, and consumer staples were laggards within the small cap value index.
Performance Results
For the 12 months ended September 30, 2021, Institutional Class shares of the Loomis Sayles Small Cap Value Fund returned 55.05% at net asset value. The Fund underperformed its benchmark, the Russell 2000® Value Index, which returned 63.92%.
Explanation of Performance
The Fund’s underweight positions in real estate and healthcare, which were two of the worst-performing sectors in the small-cap value market, contributed to relative performance. In addition, stock selection was favorable in the financials, healthcare and utilities sectors.
Overall, the primary detractor from the Fund’s relative performance was adverse security selection, which resulted from the Fund’s focus on higher-quality stocks and those with higher market capitalizations, both of which underperformed within the small cap value segment of the stock market. Stock selection lagged particularly within the communication services, real estate and information technology sectors. In addition, sector positioning also detracted from the Fund’s returns relative to the index. More specifically, the Fund’s sector selection was negatively affected by its underweight to energy which was the best performing sector in the benchmark, and an underweight to the financials sector.
Among individual stocks, Herc Holdings, Inc., InMode Ltd. and Triumph Bancorp, Inc. made the largest positive contributions to performance for the period. Herc Holdings, one of the leading equipment rental suppliers in North America, specializes in industrial products such as aerial platforms, earthmoving equipment, and tele-handlers. Herc had been a turnaround story prior to our taking an initial position in the stock in late 2019, and the market was slow to recognize the significant improvement in the fleet of equipment for rent, as well as strong cash flow which repaired a formerly over-leveraged balance sheet. While the Covid-19 pandemic proved to be a temporary setback in terms of rental demand in 2020, Herc was able to maintain strong profitability and cash flow remained robust on a decline in new fleet equipment purchases. Coming into 2021, the stock was further helped by signs of a rebounding industrial economy, as well as Herc’s role as a
| 4
LOOMIS SAYLES SMALL CAP VALUE FUND
potential beneficiary of infrastructure-related investment activity. Late in the period, the company announced ambitious new targets for growth and profitability for the next three to four years and initiated a common dividend for the first time.
InMode produces minimally invasive medical aesthetic surgery platforms for fat reduction, skin tightening and tissue remodeling applications. The company has had strong demand for its proprietary systems due to pent-up demand from physicians, the expansion of its sales force in the US, and continued momentum of hands-free technologies. Earnings continued to exceed investor expectations, driven by the continued opening of the economy, both within the US and internationally. Also, InMode’s introductions of two new platforms (women’s health & ophthalmology), increases in research and development activity, and expanding its international distribution capability helped produce strong returns for shareholders.
Triumph Bancorp, a Texas-based niche bank with a focus on freight payment factoring, continued with its business model transformation from a traditional bank structure into a digital freight payments business. This strategic pivot has substantially increased its market opportunity and outlook for growth. Recently, its TriumphPay division announced that annualized payments volume for the third quarter of 2021 will make it the largest payer in brokered freight. The division’s goal is to “own” the payment channel for freight brokers and then move on to shippers. As the company continues to reach payments milestones, investors have reassessed its future earnings outlook and have increased the firm’s valuation.
Conversely, during the 12-month period, individual names Emergent BioSolutions Inc., Modine Manufacturing Co. and Cannae Holdings, Inc. detracted the most from relative performance. Emergent BioSolutions is specialty biopharmaceutical company focused on clinical and commercial products that address the public health threats associated with chemical and biological agents, radiation, infectious diseases, and opioid abuse. A key initiative was the development of a growing outsourced pharmaceutical development and manufacturing business. With the Covid-19 pandemic, the company received substantial new contracts for the manufacture of vaccines, including key wins with Johnson & Johnson and AstraZeneca. In April 2021, media reports of a manufacturing error in the development of the J&J vaccine were confirmed, and a subsequent inspection by the FDA found various deficiencies at an Emergent BioSolutions facility. This widely publicized event placed considerable doubt on the investment thesis and expectations regarding the company’s ability to establish itself as a contract drug manufacturer, and we chose to exit the position.
Modine Manufacturing is a manufacturer of heat transfer and heat storage equipment and was added to the Fund in early July 2021. Key end markets include building HVAC, commercial and industrial solutions, and heavy-duty equipment. New management has been implementing a business improvement process, and several legacy divisions have already been sold or are slated for divestment, which will transform the business from an auto-parts supplier to more of a core-industrial company. While the most recent quarterly report showed sales and profits in line with investor expectations and management reaffirmed its earnings outlook, the sales process has taken more time than investors have expected.
Cannae Holdings operates as a publicly traded holding company which owns significant equity stakes in several companies including Dun & Bradstreet, Paysafe and Ceridian. Cannae has significantly increased its ownership in several special purpose acquisition companies (SPACs) this year, which has created a modest amount of underlying shareholder value. Unfortunately, the complexity of these investments has resulted in investors applying a much greater discount to the company’s net asset value, and that was reflected in the decline in its stock price. We added to the position during the period.
Outlook
We remain committed to identifying inefficiencies in the small cap market that result in stock prices and valuations that do not accurately reflect our assessment of the underlying value of the corporate enterprise.
While many forms of inefficiency may exist, we focus on companies that are misunderstood, underfollowed or in the midst of a “special situation” where we believe we can use our strengths in the form of our time horizon, resource deployment or a willingness to solve complex situations. We require fundamentally sound business models, capable management teams and financial stability.
Key to our process are distinct, company-specific catalysts on the horizon to sustain, enhance, or highlight the fundamental outlook. These principles are applied consistently over time, regardless of the current market environment. With a margin of safety and a proper time horizon, our goal is to achieve an attractive total return for our investors, while managing to an appropriate level of risk.
5 |
Top Ten Holdings as of September 30, 2021
| Security name | % of Net Assets | |||||
| 1 | Herc Holdings, Inc. | 2.42 | % | |||
| 2 | Inmode Ltd. | 1.79 | ||||
| 3 | Triumph Bancorp, Inc. | 1.69 | ||||
| 4 | Concentrix Corp. | 1.54 | ||||
| 5 | Popular, Inc. | 1.41 | ||||
| 6 | Kadant, Inc. | 1.34 | ||||
| 7 | Genco Shipping & Trading Ltd. | 1.33 | ||||
| 8 | ChampionX Corp. | 1.31 | ||||
| 9 | Wintrust Financial Corp. | 1.30 | ||||
| 10 | Meta Financial Group, Inc. | 1.30 | ||||
The portfolio is actively managed and holdings are subject to change. There is no guarantee the Fund continues to invest in the securities referenced. The holdings listed exclude any temporary cash investments, are presented on an individual security basis and do not represent holdings of the issuer.
Hypothetical Growth of $100,000 Investment in Institutional Class Shares3
September 30, 2011 through September 30, 2021
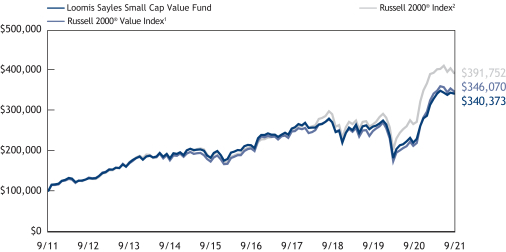
See notes to charts on Page 7.
| 6
LOOMIS SAYLES SMALL CAP VALUE FUND
Average Annual Total Returns — September 30, 20213
| Expense Ratios4 | ||||||||||||||||||||||||
| 1 Year | 5 Years | 10 Years | Life of Class N | Gross | Net | |||||||||||||||||||
Institutional Class (Inception 5/13/91) | 55.05 | % | 9.86 | % | 13.03 | % | — | % | 0.95 | % | 0.90 | % | ||||||||||||
Retail Class (Inception 12/31/96) | 54.69 | 9.59 | 12.74 | — | 1.20 | 1.15 | ||||||||||||||||||
Admin Class (Inception 1/2/98) | 54.29 | 9.32 | 12.47 | — | 1.45 | 1.40 | ||||||||||||||||||
Class N (Inception 2/1/13) | 55.15 | 9.93 | — | 10.40 | 0.85 | 0.85 | ||||||||||||||||||
Comparative Performance | ||||||||||||||||||||||||
Russell 2000® Value Index1 | 63.92 | 11.03 | 13.22 | 10.39 | ||||||||||||||||||||
Russell 2000® Index2 | 47.68 | 13.45 | 14.63 | 12.19 | ||||||||||||||||||||
Performance data shown represents past performance and is no guarantee of, and not necessarily indicative of, future results. Total return and value will vary, and you may have a gain or loss when shares are sold. Current performance may be lower or higher than quoted. For most recent month-end performance, visit loomissayles.com. Performance for other share classes will be greater or less than shown based on differences in fees and sales charges. You may not invest directly in an index. Performance for periods less than one year is cumulative, not annualized. Returns reflect changes in share price and reinvestment of dividends and capital gains, if any. The table(s) do not reflect taxes shareholders might owe on any fund distributions or when they redeem their shares.
| 1 | Russell 2000® Value Index is an unmanaged index that measures the performance of the small-cap value segment of the U.S. equity universe. It includes those Russell 2000® companies with lower price-to-book ratios and lower forecasted growth values. |
| 2 | Russell 2000® Index is an unmanaged index that measures the performance of the small-cap segment of the U.S. equity universe. |
| 3 | Fund performance has been increased by fee waivers and/or expense reimbursements, if any, without which performance would have been lower. |
| 4 | Expense ratios are as shown in the Fund’s prospectus in effect as of the date of this report. The expense ratios for the current reporting period can be found in the Financial Highlights section of this report under Ratios to Average Net Assets. Net expenses reflect contractual expense limitations set to expire on 1/31/22. When a Fund’s expenses are below the limitation, gross and net expense ratios will be the same. See Note 5 of the Notes to Financial Statements for more information about the Fund’s expense limitations. |
7 |
LOOMIS SAYLES SMALL/MID CAP GROWTH FUND
| Managers | Symbols | |||
| Mark F. Burns, CFA® | Institutional Class | LSMIX | ||
| John J. Slavik, CFA® | Class N | LSMNX | ||
Investment Objective
The Fund’s investment objective is long-term capital growth from investments in common stocks or other equity securities.
Market Conditions
The one-year period ending September 30, 2021 was very strong for the overall market, although punctuated by choppiness and volatility. Markets rallied sharply during the fourth quarter of 2020 as Covid-19 vaccines received emergency use authorization approval and uncertainty about the US presidential election resolved itself. Lower-quality stocks, as well as stocks that are more sensitive to market movements, led the market higher. At the beginning of 2021, the market steadied, but the spring months brought new concerns, including heightened valuations, challenging year-over-year comparisons on economic data, and the rise of the Delta variant. This produced a greater degree of choppiness in the market, which persisted through the end of the period.
Performance Results
For the 12 months ended September 30, 2021, Institutional Class shares of the Loomis Sayles Small/Mid Cap Growth Fund returned 30.00% at net asset value. The Fund underperformed its benchmark, the Russell 2500™ Growth Index, which returned 31.98%.
Explanation of Fund Performance
Given our strategy’s high quality focus, the early part of the period was very challenging on a relative basis. Since then, however, the Fund has performed well on a relative basis.
Among contributors to the Fund’s relative performance were stock selection in the industrials and financials sectors, as well as relative positioning in the communications services and materials sectors. By contrast, stock selection in the information technology, healthcare, and consumer discretionary sectors detracted from relative performance.
The Fund’s top contributors to relative performance at the individual stock level were power generation equipment manufacturer Generac Holdings Inc., alternative asset manager Ares Management Corp. and digital engineering and software development provider EPAM Systems Inc. Generac had very positive absolute performance over the 12-month period, although some of its industry peers were exceptionally strong and actually outperformed the company. Ares Management’s focus on private credit asset investment solutions for clients outperformed during the past year, benefiting from strong inflows from new and existing clients. Ares also made several strategic acquisitions that expanded its total addressable market by adding investment capabilities and distribution. EPAM Systems saw organic growth reaccelerate as it made very strong market share gains within the massive global IT services market. EPAM has augmented its world-class engineering and development capability with improving consulting expertise to capture greater wallet share among clients of all sizes, and its industry has spurred positive revisions to earnings estimates and multiple expansion that in turn have helped push the stock higher.
Conversely, the largest detractors from relative performance among individual stocks were biotech company Acadia Pharmaceuticals Inc., home-health services company LHC Group Inc. and biopharmaceutical developer Global Blood Therapeutics Inc. Acadia’s application with the US Food and Drug Administration to extend use of its approved psychiatric medicine into adjacent populations was rejected, and the resulting reduction in expected revenues drove the stock down. With LHC Group, later-than-usual referrals due to Covid-19 weighed on its hospice business, and the slowdown in hospital discharges hurt its home-health segment. LHC Group has also seen costs rise as a result of the nationwide shortage of nursing professionals. Global Blood Therapeutics faced challenges to its sickle cell disease drug launch from Covid-19, resulting in lower expectations and underperformance from the stock.
Outlook
As market correlations fall, we see investors placing greater importance on company-specific fundamentals. This, in turn, should lead to earnings growth becoming the primary driver of stock returns.
The economic outlook is still generally positive. However, uncertainties remain, including more difficult growth comparisons for companies in the coming quarters, continued supply chain disruptions, lingering concerns about Covid-19 variants, and ongoing fiscal and monetary policy uncertainty from Washington and the US Federal Reserve.
Despite these uncertainties, we remain focused on the underlying business fundamentals of our companies. Uncertainty drives markets, and with market correlations low, earnings growth increasing in importance, and small-cap stocks looking ready to catch up to their large-cap counterparts, we believe that the Fund is well positioned for the future.
| 8
LOOMIS SAYLES SMALL/MID CAP GROWTH FUND
Top Ten Holdings as of September 30, 2021
| Security name | % of Net Assets | |||||
| 1 | SiteOne Landscape Supply, Inc. | 2.20 | % | |||
| 2 | Paylocity Holding Corp. | 2.10 | ||||
| 3 | Axon Enterprise, Inc. | 1.93 | ||||
| 4 | Insulet Corp. | 1.91 | ||||
| 5 | Catalent, Inc. | 1.67 | ||||
| 6 | Floor & Decor Holdings, Inc., Class A | 1.67 | ||||
| 7 | POOL CORP. | 1.63 | ||||
| 8 | Tetra Tech, Inc. | 1.60 | ||||
| 9 | Acadia Healthcare Co., Inc. | 1.53 | ||||
| 10 | Syneos Health, Inc. | 1.53 | ||||
The portfolio is actively managed and holdings are subject to change. There is no guarantee the Fund continues to invest in the securities referenced. The holdings listed exclude any temporary cash investments, are presented on an individual security basis and do not represent holdings of the issuer.
Hypothetical Growth of $100,000 Investment in Institutional Class Shares2
June 30, 2015 (inception) through September 30, 2021
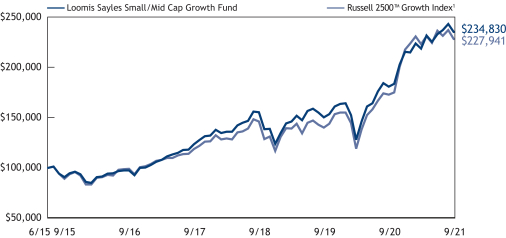
9 |
Average Annual Total Returns — September 30, 20212
| Life of | Life of | Expense Ratios3 | ||||||||||||||||||||||
| 1 Year | 5 Years | Class I | Class N | Gross | Net | |||||||||||||||||||
| Institutional Class (Inception 6/30/15) | 30.00 | % | 19.28 | % | 14.64 | % | — | % | 1.21 | % | 0.85 | % | ||||||||||||
| Class N (Inception 10/1/19) | 30.08 | — | — | 26.02 | 107.49 | 0.83 | ||||||||||||||||||
| Comparative Performance | ||||||||||||||||||||||||
| Russell 2500TM Growth Index1 | 31.98 | 18.21 | 14.03 | 28.53 | ||||||||||||||||||||
Performance data shown represents past performance and is no guarantee of, and not necessarily indicative of, future results. Total return and value will vary, and you may have a gain or loss when shares are sold. Current performance may be lower or higher than quoted. For most recent month-end performance, visit loomissayles.com. Performance for other share classes will be greater or less than shown based on differences in fees and sales charges. You may not invest directly in an index. Performance for periods less than one year is cumulative, not annualized. Returns reflect changes in share price and reinvestment of dividends and capital gains, if any. The table(s) do not reflect taxes shareholders might owe on any fund distributions or when they redeem their shares.
| 1 | The Russell 2500™ Growth Index measures the performance of the small-to-mid-cap growth segment of the U.S. equity universe. It includes those Russell 2500TM Index companies with higher price-to-book ratios and higher forecasted growth values. The Russell 2500TM Growth Index is constructed to provide a comprehensive and unbiased barometer of the small-to-mid-cap growth market. The Index is completely reconstituted annually to ensure larger stocks do not distort the performance and characteristics of the true small-to-mid-cap opportunity set and that the represented companies continue to reflect growth characteristics. Indices are unmanaged. |
| 2 | Fund performance has been increased by fee waivers and/or expense reimbursements, if any, without which performance would have been lower. |
| 3 | Expense ratios are as shown in the Fund’s prospectus in effect as of the date of this report. The expense ratios for the current reporting period can be found in the Financial Highlights section of this report under Ratios to Average Net Assets. Net expenses reflect contractual expense limitations set to expire on 1/31/22. When a Fund’s expenses are below the limitation, gross and net expense ratios will be the same. See Note 5 of the Notes to Financial Statements for more information about the Fund’s expense limitations. |
| 10
ADDITIONAL INFORMATION
The views expressed in this report reflect those of the portfolio managers as of the dates indicated. The managers’ views are subject to change at any time without notice based on changes in market or other conditions. References to specific securities or industries should not be regarded as investment advice. Because the Funds are actively managed, there is no assurance that they will continue to invest in the securities or industries mentioned.
All investing involves risk, including the risk of loss. There is no assurance that any investment will meet its performance objectives or that losses will be avoided.
Additional Index Information
This document may contain references to third party copyrights, indexes, and trademarks, each of which is the property of its respective owner. Such owner is not affiliated with Natixis Investment Managers or any of its related or affiliated companies (collectively “Natixis Affiliates”) and does not sponsor, endorse or participate in the provision of any Natixis Affiliates services, funds or other financial products.
The index information contained herein is derived from third parties and is provided on an “as is” basis. The user of this information assumes the entire risk of use of this information. Each of the third party entities involved in compiling, computing or creating index information disclaims all warranties (including, without limitation, any warranties of originality, accuracy, completeness, timeliness, non-infringement, merchantability and fitness for a particular purpose) with respect to such information.
Proxy Voting Information
A description of the Funds’ proxy voting policies and procedures is available without charge upon request, by calling Loomis Sayles at 800-633-3330; on the Funds’ website, at www.loomissayles.com, and on the Securities and Exchange Commission’s (“SEC”) website at www.sec.gov. Information about how the Funds voted proxies relating to portfolio securities during the most recent 12-month period ended June 30 is available on the Funds’ website and the SEC’s website.
Quarterly Portfolio Schedules
The Loomis Sayles Funds file a complete schedule of portfolio holdings with the SEC for the first and third quarters of each fiscal year as an exhibit to its reports on Form N-PORT. The Funds’ Form N-PORT reports are available on the SEC’s website at www.sec.gov. First and third quarter schedules of portfolio holdings are also available at loomissayles.com. A hard copy may be requested from the Fund at no charge by calling 800-633-3330.
CFA® and Chartered Financial Analyst® are registered trademarks owned by the CFA Institute.
UNDERSTANDING YOUR FUND’S EXPENSES
As a mutual fund shareholder you incur two types of costs: (1) transaction costs and (2) ongoing costs, including management fees, distribution and/or service fees (12b-1 fees), and other fund expenses. Certain exemptions may apply. These costs are described in more detail in the Funds’ prospectus. The following examples are intended to help you understand the ongoing costs of investing in the Funds and help you compare these with the ongoing costs of investing in other mutual funds.
The first line in the table of each Fund shows the actual amount of Fund expenses you would have paid on a $1,000 investment in the Fund from April 1, 2021 through September 30, 2021. To estimate the expenses you paid over the period, simply divide your account value by $1,000 (for example $8,600 account value divided by $1,000 = 8.6) and multiply the result by the number in the Expenses Paid During Period column as shown below for your class.
The second line in the table of each Fund provides information about hypothetical account values and hypothetical expenses based on the Fund’s actual expense ratios and an assumed rate of return of 5% per year before expenses, which is not the Fund’s actual return. The hypothetical account values and expenses may not be used to estimate the actual ending account balance or expenses you paid on your investment for the period. You may use this information to compare the ongoing costs of investing in the Funds to other funds. To do so, compare this 5% hypothetical example with the 5% hypothetical examples that appear in the shareholder reports of other funds.
Please note that the expenses shown reflect ongoing costs only, and do not include any transaction costs. Therefore, the second line in the table is useful in comparing ongoing costs only, and will not help you determine the relative costs of owning different funds. If transaction costs were included, total costs would be higher.
11 |
Loomis Sayles Small Cap Growth Fund
Institutional Class | Beginning Account Value 4/1/2021 | Ending Account Value 9/30/2021 | Expenses Paid During Period* 4/1/2021 – 9/30/2021 | |||||||||
Actual | $1,000.00 | $1,015.50 | $4.65 | |||||||||
Hypothetical (5% return before expenses) | $1,000.00 | $1,020.46 | $4.66 | |||||||||
Retail Class | ||||||||||||
Actual | $1,000.00 | $1,014.20 | $5.91 | |||||||||
Hypothetical (5% return before expenses) | $1,000.00 | $1,019.20 | $5.92 | |||||||||
Class N | ||||||||||||
Actual | $1,000.00 | $1,015.90 | $4.09 | |||||||||
Hypothetical (5% return before expenses) | $1,000.00 | $1,021.01 | $4.10 | |||||||||
* Expenses are equal to the Fund’s annualized expense ratio: 0.92%, 1.17% and 0.81% for Institutional Class, Retail Class and Class N, respectively, multiplied by the average account value over the period, multiplied by the number of days in the most recent fiscal half-year (183), divided by 365 (to reflect the half-year period). |
| |||||||||||
Loomis Sayles Small Cap Value Fund
Institutional Class | Beginning Account Value 4/1/2021 | Ending Account Value 9/30/2021 | Expenses Paid During Period* 4/1/2021 – 9/30/2021 | |||||||||
Actual | $1,000.00 | $1,038.60 | $4.60 | |||||||||
Hypothetical (5% return before expenses) | $1,000.00 | $1,020.56 | $4.56 | |||||||||
Retail Class | ||||||||||||
Actual | $1,000.00 | $1,037.10 | $5.87 | |||||||||
Hypothetical (5% return before expenses) | $1,000.00 | $1,019.30 | $5.82 | |||||||||
Admin Class | ||||||||||||
Actual | $1,000.00 | $1,035.90 | $7.15 | |||||||||
Hypothetical (5% return before expenses) | $1,000.00 | $1,018.05 | $7.08 | |||||||||
Class N | ||||||||||||
Actual | $1,000.00 | $1,038.50 | $4.34 | |||||||||
Hypothetical (5% return before expenses) | $1,000.00 | $1,020.81 | $4.31 | |||||||||
* Expenses are equal to the Fund’s annualized expense ratio (after waiver/reimbursement): 0.90%, 1.15%, 1.40% and 0.85% for Institutional Class, Retail Class, Admin Class and Class N, respectively, multiplied by the average account value over the period, multiplied by the number of days in the most recent fiscal half-year (183), divided by 365 (to reflect the half-year period). |
| |||||||||||
Loomis Sayles Small/Mid Cap Growth Fund
Institutional Class | Beginning Account Value 4/1/2021 | Ending Account Value 9/30/2021 | Expenses Paid During Period* 4/1/2021 – 9/30/2021 | |||||||||
Actual | $1,000.00 | $1,074.70 | $4.32 | |||||||||
Hypothetical (5% return before expenses) | $1,000.00 | $1,020.91 | $4.20 | |||||||||
Class N | ||||||||||||
Actual | $1,000.00 | $1,074.60 | $4.32 | |||||||||
Hypothetical (5% return before expenses) | $1,000.00 | $1,020.91 | $4.20 | |||||||||
* Expenses are equal to the Fund’s annualized expense ratio (after waiver/reimbursement) 0.83% and 0.83% for Institutional Class and Class N, respectively, multiplied by the average account value over the period, multiplied by the number of days in the most recent fiscal half-year (183), divided by 365 (to reflect the half-year period). |
| |||||||||||
| 12
BOARD APPROVAL OF THE EXISTING ADVISORY AGREEMENTS
The Board of Trustees of the Trusts (the “Board”), including the Independent Trustees, considers matters bearing on each Fund’s advisory agreement (collectively, the “Agreements”) at most of its meetings throughout the year. Each year, usually in the spring, the Contract Review Committee of the Board meets to review the Agreements to determine whether to recommend that the full Board approve the continuation of the Agreements, typically for an additional one-year period. This meeting typically includes all the Independent Trustees, including the Trustees who do not serve on the Contract Review Committee. After the Contract Review Committee has made its recommendation, the full Board, including the Independent Trustees, determines whether to approve the continuation of the Agreements at its June Board Meeting.
In connection with these meetings, the Trustees receive materials that the Funds’ investment adviser (the “Adviser”) believes to be reasonably necessary for the Trustees to evaluate the Agreements. These materials generally include, among other items, (i) information on the investment performance of the Funds and the performance of peer groups of funds and the Funds’ performance benchmarks, (ii) information on the Funds’ advisory fees and other expenses, including information comparing the Funds’ advisory fees to the fees charged to institutional accounts with similar strategies managed by the Adviser, if any, and to those of peer groups of funds and information about any applicable expense limitations and/or fee “breakpoints,” (iii) sales and redemption data in respect of the Funds, (iv) information about the profitability of the Agreements to the Adviser and (v) information obtained through the completion by the Adviser of a questionnaire distributed on behalf of the Trustees. The Board, including the Independent Trustees, also considers other matters such as (i) each Fund’s investment objective and strategies and the size, education and experience of the Adviser’s investment staff and its use of technology, external research and trading cost measurement tools, (ii) arrangements in respect of the distribution of the Funds’ shares and the related costs, (iii) the allocation of the Funds’ brokerage, if any, including, to the extent applicable, the use of “soft” commission dollars to pay for research and other similar services, (iv) each Adviser’s policies and procedures relating to, among other things, compliance, trading and best execution, proxy voting, liquidity and valuation, (v) information about amounts invested by the Funds’ portfolio managers in the Funds or in similar accounts that they manage and (vi) the general economic outlook with particular emphasis on the mutual fund industry. Throughout the process, the Trustees are afforded the opportunity to ask questions of and request additional materials from the Adviser.
In addition to the materials requested by the Trustees in connection with their annual consideration of the continuation of the Agreements, the Trustees receive materials in advance of each regular quarterly meeting of the Board that provide detailed information about the Funds’ investment performance and the fees charged to the Funds for advisory and other services. This information generally includes, among other things, an internal performance rating for each Fund based on agreed-upon criteria, graphs showing each Fund’s performance and expense differentials against each Fund’s peer group/category of funds, performance ratings provided by a third-party, total return information for various periods, and third-party performance rankings for various periods comparing a Fund against similarly categorized funds. The portfolio management team for each Fund or other representatives of the Adviser make periodic presentations to the Contract Review Committee and/or the full Board, and Funds identified as presenting possible performance concerns may be subject to more frequent Board or Committee presentations and reviews. In addition, the Trustees are periodically provided with detailed statistical information about each Fund’s portfolio. The Trustees also receive periodic updates between meetings, both at the Board and at the Committee level.
The Board most recently approved the continuation of the Agreements for a one-year period at its meeting held in June 2021. In considering whether to approve the continuation of the Agreements, the Board, including the Independent Trustees, did not identify any single factor as determinative. Individual Trustees may have evaluated the information presented differently from one another, giving different weights to various factors. Matters considered by the Trustees, including the Independent Trustees, in connection with their approval of the Agreements included, but were not limited to, the factors listed below.
The nature, extent and quality of the services provided to the Funds under the Agreements. The Trustees considered the nature, extent and quality of the services provided by the Adviser and its affiliates to the Funds and the resources dedicated to the Funds by the Adviser and its affiliates. The Trustees also considered their experience with other funds advised or sub-advised by the Adviser as well as the affiliation between the Adviser and Natixis Investment Managers, LLC, whose affiliates provide investment advisory services to other funds in the Natixis family of funds.
The Trustees considered not only the advisory services provided by the Adviser to the Funds, but also the benefits to the Funds from the monitoring and oversight services provided by Natixis Advisors, LLC (“Natixis Advisors”). They also considered the administrative and shareholder services provided by Natixis Advisors and its affiliates to the Funds. They also took into consideration increases in the services provided resulting from new regulatory requirements.
For each Fund, the Trustees also considered the benefits to shareholders of investing in a mutual fund that is part of a family of funds that offers shareholders the right to exchange shares of one type of fund for shares of another type of fund, and provides a variety of fund and shareholder services.
After reviewing these and related factors, the Trustees concluded, within the context of their overall conclusions regarding each of the Agreements, that the nature, extent and quality of services provided supported the renewal of the Agreements.
Investment performance of the Funds and the Adviser. As noted above, the Trustees received information about the performance of the Funds over various time periods, including information that compared the performance of the Funds to the performance of peer groups and categories of funds and the Funds’ respective performance benchmarks. In addition, the Trustees reviewed data prepared by an independent
13 |
third party that analyzed the performance of the Funds using a variety of performance metrics, including metrics that measured the performance of the Funds on a risk adjusted basis.
The Board noted that, through December 31, 2020, each Fund’s one-, three- and five-year performance, stated as percentile rankings within categories selected by the independent third-party data provider was as follows (where the best performance would be in the first percentile of its category):
| One-Year | Three-Year | Five-Year | ||||||||||
Loomis Sayles Small Cap Growth Fund | 56% | 45% | 47% | |||||||||
Loomis Sayles Small Cap Value Fund | 80% | 87% | 81% | |||||||||
Loomis Sayles Small/Mid Cap Growth Fund | 64% | 65% | 50% | |||||||||
In the case of each Fund that had performance that lagged that of a relevant category median as determined by the independent third party for certain (although not necessarily all) periods, the Board concluded that other factors relevant to performance supported renewal of the Agreements. These factors included one or more of the following: (1) that the underperformance was attributable, to a significant extent, to investment decisions (such as security selection or sector allocation) by the Adviser that were reasonable and consistent with the Fund’s investment objective and policies; (2) that the Fund’s performance over the five- and ten-year periods has been stronger; and (3) that the Adviser’s investment strategy is expected to result in cyclical underperformance from time to time, but that this style of investing is showing improved performance generally, which is expected to help the Fund’s performance. The Board also considered information about the Funds’ more recent performance, including how that performance had been impacted by the Covid-19 crisis.
The Trustees also considered the Adviser’s performance and reputation generally, the performance of the fund family generally, and the historical responsiveness of the Adviser to Trustee concerns about performance and the willingness of the Adviser to take steps intended to improve performance.
After reviewing these and related factors, the Trustees concluded, within the context of their overall conclusions regarding each of the Agreements, that the performance of the Funds and the Adviser and/or other relevant factors supported the renewal of the Agreements.
The costs of the services to be provided and profits to be realized by the Adviser and its affiliates from their respective relationships with the Funds. The Trustees considered the fees charged to the Funds for advisory and administrative services as well as the total expense levels of the Funds. This information included comparisons (provided both by management and by an independent third party) of the Funds’ advisory fees and total expense levels to those of their peer groups and information about the advisory fees charged by the Adviser to comparable accounts (such as institutional separate accounts), as well as information about differences in such fees and the reasons for any such differences. In considering the fees charged to comparable accounts, the Trustees considered, among other things, management’s representations about the differences between managing mutual funds as compared to other types of accounts, including the additional resources required to effectively manage mutual fund assets, the greater regulatory costs associated with the management of such assets, and the entrepreneurial, regulatory and other risks associated with sponsoring and managing mutual funds. In evaluating each Fund’s advisory fee, the Trustees also took into account the demands, complexity and quality of the investment management of such Fund and the need for the Adviser to offer competitive compensation and the potential need to expend additional resources to the extent the Fund grows in size. The Trustees considered that over the past several years, management had demonstrated its intention to have competitive fee levels by making recommendations regarding reductions in advisory fee rates, implementation of advisory fee breakpoints and the institution of advisory fee waivers and expense limitations for various funds in the fund family. They noted that all of the Funds have expense limitations in place, and they considered the amounts waived or reimbursed by the Adviser for certain Funds under their respective expense limitation agreements. The Trustees also considered that Loomis Sayles Small Cap Growth Fund’s current expenses are below its expense limitation. The Trustees noted that the Funds had total advisory fee rates that were at or below the medians of their respective peer groups of funds.
The Trustees also considered the compensation directly or indirectly received by the Adviser and its affiliates from their relationships with the Funds. The Trustees reviewed information provided by management as to the profitability of the Adviser’s and its affiliates’ relationships with the Funds, and information about how expenses are determined and allocated for purposes of profitability calculations. They also reviewed information provided by management about the effect of distribution costs and changes in asset levels on Adviser profitability, including information regarding resources spent on distribution activities. When reviewing profitability, the Trustees also considered information about court cases in which adviser compensation or profitability were issues, the performance of the Funds, the expense levels of the Funds, whether the Adviser had implemented breakpoints and/or expense limitations with respect to such Funds and the overall profit margin of Natixis Investment Managers, LLC compared to that of certain other investment managers for which such data was available.
After reviewing these and related factors, the Trustees concluded, within the context of their overall conclusions regarding each of the Agreements, that the advisory fee charged to each of the Funds was fair and reasonable, and that the costs of these services generally and the related profitability of the Adviser and its affiliates in respect of their relationships with the Funds supported the renewal of the Agreements.
Economies of Scale. The Trustees considered the existence of any economies of scale in the provision of services by the Adviser and whether those economies are shared with the Funds through breakpoints in their investment advisory fees or other means, such as expense limitations. The Trustees also considered management’s explanation of the factors that are taken into account with respect to the implementation of breakpoints in investment advisory fees or expense limitations. With respect to economies of scale, the Trustees noted that although none of
| 14
the Funds’ management fees were subject to breakpoints, each of the Funds was subject to an expense limitation. In considering these issues, the Trustees also took note of the costs of the services provided (both on an absolute and on a relative basis) and the profitability to the Adviser and its affiliates of their relationships with the Funds, as discussed above. The Trustees also considered that the Funds have benefitted from the substantial reinvestment the Adviser has made into its business.
After reviewing these and related factors, the Trustees concluded, within the context of their overall conclusions regarding each of the Agreements, that the extent to which economies of scale were shared with the Funds supported the renewal of the Agreements.
The Trustees also considered other factors, which included but were not limited to the following:
| • | The effect of recent market and economic events, including but not limited to the Covid-19 crisis and its significant disruptions to the economy and business operations, on the performance, asset levels and expense ratios of each Fund. |
| • | Whether each Fund has operated in accordance with its investment objective and the Fund’s record of compliance with its investment restrictions, and the compliance programs of the Funds and the Adviser. They also considered the compliance-related resources the Adviser and its affiliates were providing to the Funds. |
| • | So-called “fallout benefits” to the Adviser, such as the engagement of affiliates of the Adviser to provide distribution and administrative services to the Funds, and the benefits of research made available to the Adviser by reason of brokerage commissions (if any) generated by the Funds’ securities transactions. The Trustees also considered the benefits to the parent company of Natixis Advisors from the retention of the Adviser. The Trustees considered the possible conflicts of interest associated with these fallout and other benefits, and the reporting, disclosure and other processes in place to disclose and monitor such possible conflicts of interest. |
| • | The Trustees’ review and discussion of the Funds’ advisory arrangements in prior years, and management’s record of responding to Trustee concerns raised during the year and in prior years. |
Based on their evaluation of all factors that they deemed to be material, including those factors described above, and assisted by the advice of independent counsel, the Trustees, including the Independent Trustees, concluded that each of the existing Agreements should be continued through June 30, 2022.
15 |
LIQUIDITY RISK MANAGEMENT PROGRAM
Annual Report for the Period Commencing on January 1, 2020 and ending December 31, 2020 (including updates through September 30, 2021)
Effective December 1, 2018, the Funds adopted a liquidity risk management program (the “Program”) pursuant to the requirements of Rule 22e-4 under the Investment Company Act of 1940, as amended (the “Rule”). The Rule requires registered open-end funds, including mutual funds and exchange-traded funds to establish liquidity risk management programs in order to effectively manage fund liquidity and mitigate the risk that a fund could not meet redemption requests without significantly diluting the interests of remaining investors.
The rule requires the Funds to assess, manage and review their liquidity risk considering applicable factors during normal and foreseeable stressed conditions. In fulfilling this requirement, each Fund assesses and reviews (where applicable and amongst other matters) its investment strategy, portfolio holdings, possible investment concentrations, use of derivatives, short-term and long-term cash flow projections, use of cash and cash equivalents, as well as borrowing arrangements and other funding sources. Each Program has established a Program Administrator, which is the adviser of the Fund.
In accordance with the Program, each of the Fund’s portfolio investments is classified into one of four liquidity categories based on a determination of a reasonable expectation for how long it would take to convert the investment to cash (or sell or dispose of the investment) without significantly changing its market value.
Each Fund is prohibited from acquiring an investment if, after the acquisition, its holdings of illiquid assets will exceed 15% of its net assets. If a Fund does not hold a majority of highly liquid investments in its portfolio, then the Fund is required to establish a highly liquid investment minimum (“HLIM”). None of the Funds has established an HLIM.
During the period from January 1, 2020 to December 31, 2020, there were no material changes to the Program and no material events that impacted the operation of the Funds’ Programs. During the period, the Funds held sufficient liquid assets to meet redemptions on a timely basis and did not have any illiquid security violations during the period.
During the period January 1, 2021 through September 30, 2021, the Funds held sufficient liquid assets to meet redemptions on a timely basis and did not have any illiquid security violations.
Annual Program Assessment and Conclusion
In the opinion of the Program Administrators, the Program of each Fund approved by the Funds’ Board has been implemented effectively. The Program Administrator has also monitored, assessed and managed each Fund’s liquidity risk regularly and has determined that the Program is operating effectively.
Pursuant to the Rule’s requirements, the Board has received and reviewed a written report prepared by each Fund’s Program Administrator that addressed the operation of the Program, assessed its adequacy and effectiveness and described any material changes made to the Program.
| 16
Portfolio of Investments – as of September 30, 2021
Loomis Sayles Small Cap Growth Fund
| Shares | Description | Value (†) | ||||||
| Common Stocks – 96.8% of Net Assets | ||||||||
| Aerospace & Defense – 2.4% |
| |||||||
| 285,129 | AeroVironment, Inc.(a) | $ | 24,612,335 | |||||
| 1,423,894 | Kratos Defense & Security Solutions, Inc.(a) | 31,767,075 | ||||||
| 242,980 | Mercury Systems, Inc.(a) | 11,522,112 | ||||||
|
| |||||||
| 67,901,522 | ||||||||
|
| |||||||
| Air Freight & Logistics – 1.1% |
| |||||||
| 470,199 | HUB Group, Inc., Class A(a) | 32,326,181 | ||||||
|
| |||||||
| Auto Components – 4.9% |
| |||||||
| 298,068 | Dorman Products, Inc.(a) | 28,218,098 | ||||||
| 240,715 | Fox Factory Holding Corp.(a) | 34,792,946 | ||||||
| 358,917 | Gentherm, Inc.(a) | 29,047,153 | ||||||
| 378,966 | Patrick Industries, Inc. | 31,567,868 | ||||||
| 834,273 | Stoneridge, Inc.(a) | 17,010,826 | ||||||
|
| |||||||
| 140,636,891 | ||||||||
|
| |||||||
| Banks – 2.7% |
| |||||||
| 495,069 | Ameris Bancorp | 25,684,179 | ||||||
| 1,131,275 | Bancorp, Inc. (The)(a) | 28,790,949 | ||||||
| 314,079 | Lakeland Financial Corp. | 22,374,988 | ||||||
|
| |||||||
| 76,850,116 | ||||||||
|
| |||||||
| Beverages – 0.7% |
| |||||||
| 1,375,051 | Primo Water Corp. | 21,615,802 | ||||||
|
| |||||||
| Biotechnology – 6.8% |
| |||||||
| 226,611 | Blueprint Medicines Corp.(a) | 23,297,877 | ||||||
| 805,376 | Halozyme Therapeutics, Inc.(a) | 32,762,695 | ||||||
| 720,442 | Insmed, Inc.(a) | 19,840,973 | ||||||
| 262,631 | Natera, Inc.(a) | 29,267,598 | ||||||
| 457,732 | PTC Therapeutics, Inc.(a) | 17,032,208 | ||||||
| 662,802 | Replimune Group, Inc.(a) | 19,645,451 | ||||||
| 324,179 | SpringWorks Therapeutics, Inc.(a) | 20,565,916 | ||||||
| 914,075 | Sutro Biopharma, Inc.(a) | 17,266,877 | ||||||
| 539,115 | Xencor, Inc.(a) | 17,607,496 | ||||||
|
| |||||||
| 197,287,091 | ||||||||
|
| |||||||
| Building Products – 2.3% |
| |||||||
| 375,010 | Advanced Drainage Systems, Inc. | 40,564,832 | ||||||
| 397,681 | UFP Industries, Inc. | 27,034,354 | ||||||
|
| |||||||
| 67,599,186 | ||||||||
|
| |||||||
| Capital Markets – 3.4% |
| |||||||
| 278,998 | AssetMark Financial Holdings, Inc.(a) | 6,938,680 | ||||||
| 537,150 | Focus Financial Partners, Inc., Class A(a) | 28,130,546 | ||||||
| 361,131 | Hamilton Lane, Inc., Class A | 30,631,131 | ||||||
| 411,722 | PJT Partners, Inc., Class A | 32,571,328 | ||||||
|
| |||||||
| 98,271,685 | ||||||||
|
| |||||||
| Commercial Services & Supplies – 1.5% |
| |||||||
| 580,049 | Casella Waste Systems, Inc., Class A(a) | 44,048,921 | ||||||
|
| |||||||
| Communications Equipment – 1.2% |
| |||||||
| 396,680 | Calix, Inc.(a) | 19,607,892 | ||||||
| 428,447 | Radware Ltd.(a) | 14,447,233 | ||||||
|
| |||||||
| 34,055,125 | ||||||||
|
| |||||||
| Construction & Engineering – 1.4% |
| |||||||
| 1,265,826 | WillScot Mobile Mini Holdings Corp.(a) | $ | 40,152,001 | |||||
|
| |||||||
| Containers & Packaging – 0.7% |
| |||||||
| 755,871 | Ranpak Holdings Corp.(a) | 20,272,460 | ||||||
|
| |||||||
| Diversified Consumer Services – 0.9% |
| |||||||
| 647,542 | Frontdoor, Inc.(a) | 27,132,010 | ||||||
|
| |||||||
| Electronic Equipment, Instruments & Components – 4.0% |
| |||||||
| 248,889 | Advanced Energy Industries, Inc. | 21,840,010 | ||||||
| 351,456 | Itron, Inc.(a) | 26,580,617 | ||||||
| 748,024 | nLight, Inc.(a) | 21,086,797 | ||||||
| 295,153 | Novanta, Inc.(a) | 45,601,138 | ||||||
|
| |||||||
| 115,108,562 | ||||||||
|
| |||||||
| Energy Equipment & Services – 0.9% |
| |||||||
| 721,178 | Cactus, Inc., Class A | 27,202,834 | ||||||
|
| |||||||
| Food Products – 2.3% |
| |||||||
| 246,367 | Freshpet, Inc.(a) | 35,154,107 | ||||||
| 872,404 | Simply Good Foods Co. (The)(a) | 30,089,214 | ||||||
|
| |||||||
| 65,243,321 | ||||||||
|
| |||||||
| Health Care Equipment & Supplies – 8.2% |
| |||||||
| 516,751 | AtriCure, Inc.(a) | 35,940,032 | ||||||
| 572,122 | Axonics, Inc.(a) | 37,239,421 | ||||||
| 210,524 | CONMED Corp. | 27,542,855 | ||||||
| 515,688 | CryoPort, Inc.(a) | 34,298,409 | ||||||
| 272,243 | Inogen, Inc.(a) | 11,730,951 | ||||||
| 472,455 | Merit Medical Systems, Inc.(a) | 33,922,269 | ||||||
| 462,546 | NuVasive, Inc.(a) | 27,683,378 | ||||||
| 211,264 | STAAR Surgical Co.(a) | 27,153,762 | ||||||
|
| |||||||
| 235,511,077 | ||||||||
|
| |||||||
| Health Care Providers & Services – 3.9% |
| |||||||
| 175,787 | Ensign Group, Inc. (The) | 13,164,689 | ||||||
| 510,224 | HealthEquity, Inc.(a) | 33,042,106 | ||||||
| 193,854 | LHC Group, Inc.(a) | 30,417,631 | ||||||
| 99,057 | ModivCare, Inc.(a) | 17,990,732 | ||||||
| 719,177 | Option Care Health, Inc.(a) | 17,447,234 | ||||||
|
| |||||||
| 112,062,392 | ||||||||
|
| |||||||
| Health Care Technology – 3.2% |
| |||||||
| 924,710 | Evolent Health, Inc., Class A(a) | 28,666,010 | ||||||
| 153,172 | Inspire Medical Systems, Inc.(a) | 35,670,695 | ||||||
| 454,154 | Phreesia, Inc.(a) | 28,021,302 | ||||||
|
| |||||||
| 92,358,007 | ||||||||
|
| |||||||
| Hotels, Restaurants & Leisure – 4.0% |
| |||||||
| 438,300 | Chuy’s Holdings, Inc.(a) | 13,819,599 | ||||||
| 275,017 | Papa John’s International, Inc. | 34,924,409 | ||||||
| 316,253 | Texas Roadhouse, Inc. | 28,883,386 | ||||||
| 224,862 | Wingstop, Inc. | 36,861,628 | ||||||
|
| |||||||
| 114,489,022 | ||||||||
|
| |||||||
| Household Durables – 0.9% |
| |||||||
| 237,931 | Installed Building Products, Inc. | 25,494,307 | ||||||
|
| |||||||
| Insurance – 0.8% |
| |||||||
| 658,430 | BRP Group, Inc., Class A(a) | 21,919,135 | ||||||
|
| |||||||
| Internet & Direct Marketing Retail – 1.7% |
| |||||||
| 426,865 | Shutterstock, Inc. | 48,372,342 | ||||||
|
| |||||||
See accompanying notes to financial statements.
17 |
Portfolio of Investments – as of September 30, 2021
Loomis Sayles Small Cap Growth Fund – continued
| Shares | Description | Value (†) | ||||||
| Common Stocks – continued | ||||||||
| IT Services – 3.4% |
| |||||||
| 742,108 | EVERTEC, Inc. | $ | 33,929,178 | |||||
| 189,775 | Perficient, Inc.(a) | 21,956,967 | ||||||
| 502,995 | WNS Holdings Ltd., ADR(a) | 41,144,991 | ||||||
|
| |||||||
| 97,031,136 | ||||||||
|
| |||||||
| Leisure Products – 0.9% |
| |||||||
| 361,715 | Malibu Boats, Inc., Class A(a) | 25,312,816 | ||||||
|
| |||||||
| Life Sciences Tools & Services – 1.4% |
| |||||||
| 54,420 | Medpace Holdings, Inc.(a) | 10,300,618 | ||||||
| 595,435 | NeoGenomics, Inc.(a) | 28,723,784 | ||||||
|
| |||||||
| 39,024,402 | ||||||||
|
| |||||||
| Machinery – 5.8% |
| |||||||
| 343,296 | Albany International Corp., Class A | 26,389,164 | ||||||
| 279,839 | Helios Technologies, Inc. | 22,977,580 | ||||||
| 433,986 | Kornit Digital Ltd.(a) | 62,815,134 | ||||||
| 148,276 | RBC Bearings, Inc.(a) | 31,464,167 | ||||||
| 622,019 | Shyft Group, Inc. (The) | 23,642,942 | ||||||
|
| |||||||
| 167,288,987 | ||||||||
|
| |||||||
| Media – 1.2% |
| |||||||
| 429,324 | TechTarget, Inc.(a) | 35,384,884 | ||||||
|
| |||||||
| Personal Products – 0.7% |
| |||||||
| 685,943 | elf Beauty, Inc.(a) | 19,926,644 | ||||||
|
| |||||||
| Pharmaceuticals – 1.6% |
| |||||||
| 488,541 | Pacira BioSciences, Inc.(a) | 27,358,296 | ||||||
| 712,937 | Supernus Pharmaceuticals, Inc.(a) | 19,014,030 | ||||||
|
| |||||||
| 46,372,326 | ||||||||
|
| |||||||
| Professional Services – 1.3% |
| |||||||
| 935,585 | KBR, Inc. | 36,862,049 | ||||||
|
| |||||||
| Semiconductors & Semiconductor Equipment – 6.1% |
| |||||||
| 674,353 | MACOM Technology Solutions Holdings, Inc.(a) | 43,745,279 | ||||||
| 805,596 | MaxLinear, Inc.(a) | 39,675,603 | ||||||
| 1,448,606 | Rambus, Inc.(a) | 32,159,053 | ||||||
| 233,489 | Silicon Laboratories, Inc.(a) | 32,725,818 | ||||||
| 415,335 | Silicon Motion Technology Corp., ADR | 28,649,809 | ||||||
|
| |||||||
| 176,955,562 | ||||||||
|
| |||||||
| Software – 6.4% |
| |||||||
| 264,782 | Blackline, Inc.(a) | 31,260,163 | ||||||
| 400,299 | Envestnet, Inc.(a) | 32,119,992 | ||||||
| 336,535 | Q2 Holdings, Inc.(a) | 26,969,915 | ||||||
| 475,485 | Rapid7, Inc.(a) | 53,739,314 | ||||||
| 679,598 | Varonis Systems, Inc.(a) | 41,353,538 | ||||||
|
| |||||||
| 185,442,922 | ||||||||
|
| |||||||
| Specialty Retail – 2.5% |
| |||||||
| 364,512 | Boot Barn Holdings, Inc.(a) | 32,394,181 | ||||||
| 705,011 | National Vision Holdings, Inc.(a) | 40,023,475 | ||||||
|
| |||||||
| 72,417,656 | ||||||||
|
| |||||||
| Technology Hardware, Storage & Peripherals – 0.8% |
| |||||||
| 920,081 | Pure Storage, Inc., Class A(a) | 23,149,238 | ||||||
|
| |||||||
| Textiles, Apparel & Luxury Goods – 1.8% |
| |||||||
| 324,224 | Columbia Sportswear Co. | 31,073,628 | ||||||
| 231,170 | Oxford Industries, Inc. | 20,844,599 | ||||||
|
| |||||||
| 51,918,227 | ||||||||
|
| |||||||
| Trading Companies & Distributors – 3.0% |
| |||||||
| 373,022 | McGrath RentCorp | $ | 26,838,933 | |||||
| 294,687 | SiteOne Landscape Supply, Inc.(a) | 58,781,216 | ||||||
|
| |||||||
| 85,620,149 | ||||||||
|
| |||||||
| Total Common Stocks | ||||||||
| (Identified Cost $2,026,920,760) | 2,788,616,988 | |||||||
|
| |||||||
| | Principal Amount | |||||||
| Short-Term Investments – 3.9% | ||||||||
| $ | 110,757,237 | Tri-Party Repurchase Agreement with Fixed Income Clearing Corporation, dated 9/30/2021 at 0.000% to be repurchased at $110,757,237 on 10/01/2021 collateralized by $113,557,900 U.S.Treasury Note, 1.250% due 9/30/2028 valued at $112,972,396 including accrued interest (Note 2 of Notes to Financial Statements) (Identified Cost $110,757,237) | 110,757,237 | |||||
|
| |||||||
| Total Investments – 100.7% | ||||||||
| (Identified Cost $2,137,677,997) | 2,899,374,225 | |||||||
| Other assets less liabilities—(0.7)% | (19,431,158 | ) | ||||||
|
| |||||||
| Net Assets – 100.0% | $ | 2,879,943,067 | ||||||
|
| |||||||
| (†) | See Note 2 of Notes to Financial Statements. |
| ||||||
| (a) | Non-income producing security. |
| ||||||
| ADR | An American Depositary Receipt is a certificate issued by a custodian bank representing the right to receive securities of the foreign issuer described. The values of ADRs may be significantly influenced by trading on exchanges not located in the United States. |
| ||||||
Industry Summary at September 30, 2021
Health Care Equipment & Supplies | 8.2 | % | ||
Biotechnology | 6.8 | |||
Software | 6.4 | |||
Semiconductors & Semiconductor Equipment | 6.1 | |||
Machinery | 5.8 | |||
Auto Components | 4.9 | |||
Electronic Equipment, Instruments & Components | 4.0 | |||
Hotels, Restaurants & Leisure | 4.0 | |||
Health Care Providers & Services | 3.9 | |||
Capital Markets | 3.4 | |||
IT Services | 3.4 | |||
Health Care Technology | 3.2 | |||
Trading Companies & Distributors | 3.0 | |||
Banks | 2.7 | |||
Specialty Retail | 2.5 | |||
Aerospace & Defense | 2.4 | |||
Building Products | 2.3 | |||
Food Products | 2.3 | |||
Other Investments, less than 2% each | 21.5 | |||
Short-Term Investments | 3.9 | |||
|
| |||
Total Investments | 100.7 | |||
Other assets less liabilities | (0.7 | ) | ||
|
| |||
Net Assets | 100.0 | % | ||
|
|
See accompanying notes to financial statements.
| 18
Portfolio of Investments – as of September 30, 2021
Loomis Sayles Small Cap Value Fund
Shares | Description | Value (†) | ||||||
| Common Stocks – 98.1% of Net Assets | ||||||||
| Auto Components – 3.4% |
| |||||||
| 319,113 | Dana, Inc. | $ | 7,097,073 | |||||
| 230,509 | Garrett Motion, Inc.(a) | 1,698,852 | ||||||
| 217,043 | Goodyear Tire & Rubber Co. (The)(a) | 3,841,661 | ||||||
| 40,937 | LCI Industries | 5,511,348 | ||||||
| 177,706 | Modine Manufacturing Co.(a) | 2,013,409 | ||||||
|
| |||||||
| 20,162,343 | ||||||||
|
| |||||||
| Banks – 13.7% |
| |||||||
| 128,529 | Ameris Bancorp | 6,668,085 | ||||||
| 150,850 | Atlantic Union Bankshares Corp. | 5,558,822 | ||||||
| 182,586 | BancorpSouth Bank | 5,437,411 | ||||||
| 119,078 | Bryn Mawr Bank Corp. | 5,471,634 | ||||||
| 181,713 | CVB Financial Corp. | 3,701,494 | ||||||
| 275,568 | Home BancShares, Inc. | 6,484,115 | ||||||
| 255,850 | OceanFirst Financial Corp. | 5,477,749 | ||||||
| 78,320 | Pinnacle Financial Partners, Inc. | 7,368,346 | ||||||
| 107,551 | Popular, Inc. | 8,353,486 | ||||||
| 66,748 | Prosperity Bancshares, Inc. | 4,747,785 | ||||||
| 57,412 | SouthState Corp. | 4,286,954 | ||||||
| 99,805 | Triumph Bancorp, Inc.(a) | 9,993,475 | ||||||
| 96,185 | Wintrust Financial Corp. | 7,730,388 | ||||||
|
| |||||||
| 81,279,744 | ||||||||
|
| |||||||
| Beverages – 0.4% |
| |||||||
| 141,677 | Primo Water Corp. | 2,227,162 | ||||||
|
| |||||||
| Biotechnology – 0.8% |
| |||||||
| 26,739 | United Therapeutics Corp.(a) | 4,935,484 | ||||||
|
| |||||||
| Building Products – 2.0% |
| |||||||
| 32,080 | Armstrong World Industries, Inc. | 3,062,678 | ||||||
| 176,947 | Quanex Building Products Corp. | 3,788,435 | ||||||
| 72,186 | UFP Industries, Inc. | 4,907,204 | ||||||
|
| |||||||
| 11,758,317 | ||||||||
|
| |||||||
| Capital Markets – 2.0% |
| |||||||
| 130,858 | Donnelley Financial Solutions, Inc.(a) | 4,530,304 | ||||||
| 103,405 | Stifel Financial Corp. | 7,027,404 | ||||||
|
| |||||||
| 11,557,708 | ||||||||
|
| |||||||
| Chemicals – 2.5% |
| |||||||
| 37,204 | Ashland Global Holdings, Inc. | 3,315,620 | ||||||
| 76,932 | Cabot Corp. | 3,855,832 | ||||||
| 31,072 | Ingevity Corp.(a) | 2,217,609 | ||||||
| 179,393 | Valvoline, Inc. | 5,593,474 | ||||||
|
| |||||||
| 14,982,535 | ||||||||
|
| |||||||
| Commercial Services & Supplies – 2.9% |
| |||||||
| 59,236 | Clean Harbors, Inc.(a) | 6,152,843 | ||||||
| 89,131 | IAA, Inc.(a) | 4,863,879 | ||||||
| 242,300 | KAR Auction Services, Inc.(a) | 3,971,297 | ||||||
| 43,092 | VSE Corp. | 2,075,742 | ||||||
|
| |||||||
| 17,063,761 | ||||||||
|
| |||||||
| Communications Equipment – 0.8% |
| |||||||
| 297,674 | Viavi Solutions, Inc.(a) | 4,685,389 | ||||||
|
| |||||||
| Construction & Engineering – 2.0% |
| |||||||
| 96,870 | AECOM(a) | 6,117,340 | ||||||
| 120,156 | Arcosa, Inc. | 6,028,227 | ||||||
|
| |||||||
| 12,145,567 | ||||||||
|
| |||||||
| Consumer Finance – 0.7% |
| |||||||
| 94,994 | PROG Holdings, Inc. | $ | 3,990,698 | |||||
|
| |||||||
| Containers & Packaging – 0.6% |
| |||||||
| 117,548 | TriMas Corp.(a) | 3,803,853 | ||||||
|
| |||||||
| Diversified Consumer Services – 1.3% |
| |||||||
| 99,437 | Frontdoor, Inc.(a) | 4,166,410 | ||||||
| 259,010 | Houghton Mifflin Harcourt Co.(a) | 3,478,504 | ||||||
|
| |||||||
| 7,644,914 | ||||||||
| �� |
|
| ||||||
| Diversified Financial Services – 0.7% |
| |||||||
| 132,315 | Cannae Holdings, Inc.(a) | 4,116,320 | ||||||
|
| |||||||
| Diversified Telecommunication Services – 0.5% |
| |||||||
| 110,049 | Frontier Communications Parent, Inc.(a) | 3,067,066 | ||||||
|
| |||||||
| Electric Utilities – 0.7% |
| |||||||
| 72,343 | ALLETE, Inc. | 4,305,855 | ||||||
|
| |||||||
| Electrical Equipment – 2.0% |
| |||||||
| 52,846 | Atkore, Inc.(a) | 4,593,374 | ||||||
| 35,203 | AZZ, Inc. | 1,872,800 | ||||||
| 230,123 | Vertiv Holdings Co. | 5,543,663 | ||||||
|
| |||||||
| 12,009,837 | ||||||||
|
| |||||||
| Electronic Equipment, Instruments & Components – 5.0% |
| |||||||
| 38,303 | Advanced Energy Industries, Inc. | 3,361,088 | ||||||
| 130,581 | Kimball Electronics, Inc.(a) | 3,365,072 | ||||||
| 12,733 | Littelfuse, Inc. | 3,479,547 | ||||||
| 151,773 | Methode Electronics, Inc. | 6,382,055 | ||||||
| 31,859 | SYNNEX Corp. | 3,316,522 | ||||||
| 355,177 | TTM Technologies, Inc.(a) | 4,464,575 | ||||||
| 164,562 | Vontier Corp. | 5,529,283 | ||||||
|
| |||||||
| 29,898,142 | ||||||||
|
| |||||||
| Energy Equipment & Services – 1.9% |
| |||||||
| 348,478 | ChampionX Corp.(a) | 7,791,968 | ||||||
| 87,531 | DMC Global, Inc.(a) | 3,230,769 | ||||||
|
| |||||||
| 11,022,737 | ||||||||
|
| |||||||
| Entertainment – 0.5% |
| |||||||
| 113,210 | Liberty Media Corp.-Liberty Braves, Class C(a) | 2,991,008 | ||||||
|
| |||||||
| Food Products – 3.6% |
| |||||||
| 42,662 | Darling Ingredients, Inc.(a) | 3,067,398 | ||||||
| 331,026 | Dole PLC(a) | 5,614,201 | ||||||
| 18,218 | J&J Snack Foods Corp. | 2,784,075 | ||||||
| 244,381 | Nomad Foods Ltd.(a) | 6,735,140 | ||||||
| 288,696 | Whole Earth Brands, Inc.(a) | 3,334,439 | ||||||
|
| |||||||
| 21,535,253 | ||||||||
|
| |||||||
| Health Care Equipment & Supplies – 3.2% |
| |||||||
| 30,936 | CONMED Corp. | 4,047,357 | ||||||
| 66,525 | Inmode Ltd.(a) | 10,607,411 | ||||||
| 157,238 | Lantheus Holdings, Inc.(a) | 4,037,872 | ||||||
|
| |||||||
| 18,692,640 | ||||||||
|
| |||||||
| Health Care Providers & Services – 0.4% |
| |||||||
| 20,633 | AMN Healthcare Services, Inc.(a) | 2,367,637 | ||||||
|
| |||||||
| Health Care Technology – 0.8% |
| |||||||
| 344,378 | Allscripts Healthcare Solutions, Inc.(a) | 4,604,334 | ||||||
|
| |||||||
See accompanying notes to financial statements.
19 |
Portfolio of Investments – as of September 30, 2021
Loomis Sayles Small Cap Value Fund – continued
| Shares | Description | Value (†) | ||||||
| Common Stocks – continued | ||||||||
| Hotels, Restaurants & Leisure – 2.4% |
| |||||||
| 25,437 | Churchill Downs, Inc. | $ | 6,106,915 | |||||
| 14,794 | Cracker Barrel Old Country Store, Inc. | 2,068,793 | ||||||
| 38,857 | Marriott Vacations Worldwide Corp. | 6,113,372 | ||||||
|
| |||||||
| 14,289,080 | ||||||||
|
| |||||||
| Household Durables – 2.1% |
| |||||||
| 19,689 | Helen of Troy Ltd.(a) | 4,423,725 | ||||||
| 106,882 | KB Home | 4,159,847 | ||||||
| 59,915 | Skyline Champion Corp.(a) | 3,598,495 | ||||||
|
| |||||||
| 12,182,067 | ||||||||
|
| |||||||
| Household Products – 1.0% |
| |||||||
| 60,466 | Spectrum Brands Holdings, Inc. | 5,784,782 | ||||||
|
| |||||||
| Independent Power & Renewable Electricity Producers – 1.1% |
| |||||||
| 88,036 | NextEra Energy Partners LP | 6,634,393 | ||||||
|
| |||||||
| Insurance – 1.9% |
| |||||||
| 118,835 | Employers Holdings, Inc. | 4,692,794 | ||||||
| 95,581 | First American Financial Corp. | 6,408,706 | ||||||
|
| |||||||
| 11,101,500 | ||||||||
|
| |||||||
| Internet & Direct Marketing Retail – 0.8% |
| |||||||
| 437,044 | Qurate Retail, Inc., Class A | 4,453,478 | ||||||
|
| |||||||
| IT Services – 4.8% |
| |||||||
| 51,461 | Concentrix Corp.(a) | 9,108,597 | ||||||
| 78,836 | CSG Systems International, Inc. | 3,799,895 | ||||||
| 32,352 | Euronet Worldwide, Inc.(a) | 4,117,763 | ||||||
| 180,807 | International Money Express, Inc.(a) | 3,019,477 | ||||||
| 208,244 | Unisys Corp.(a) | 5,235,254 | ||||||
| 18,839 | WEX, Inc.(a) | 3,318,301 | ||||||
|
| |||||||
| 28,599,287 | ||||||||
|
| |||||||
| Leisure Products – 1.0% |
| |||||||
| 63,310 | Brunswick Corp. | 6,031,544 | ||||||
|
| |||||||
| Machinery – 6.3% |
| |||||||
| 43,456 | Alamo Group, Inc. | 6,063,416 | ||||||
| 58,355 | Albany International Corp., Class A | 4,485,749 | ||||||
| 116,644 | Altra Industrial Motion Corp. | 6,456,245 | ||||||
| 126,859 | Columbus McKinnon Corp. | 6,133,633 | ||||||
| 20,993 | John Bean Technologies Corp. | 2,950,566 | ||||||
| 38,902 | Kadant, Inc. | 7,939,898 | ||||||
| 103,261 | Miller Industries, Inc. | 3,515,004 | ||||||
|
| |||||||
| 37,544,511 | ||||||||
|
| |||||||
| Marine – 1.3% |
| |||||||
| 390,577 | Genco Shipping & Trading Ltd. | 7,862,315 | ||||||
|
| |||||||
| Media – 2.0% |
| |||||||
| 207,501 | Gray Television, Inc. | 4,735,173 | ||||||
| 58,348 | John Wiley & Sons, Inc., Class A | 3,046,349 | ||||||
| 62,218 | Scholastic Corp. | 2,218,071 | ||||||
| 68,473 | Thryv Holdings, Inc.(a) | 2,056,929 | ||||||
|
| |||||||
| 12,056,522 | ||||||||
|
| |||||||
| Metals & Mining – 0.7% |
| |||||||
| 130,911 | Arconic Corp.(a) | 4,128,933 | ||||||
|
| |||||||
| Multi-Utilities – 1.6% |
| |||||||
| 210,891 | MDU Resources Group, Inc. | 6,257,136 | ||||||
| Multi-Utilities – continued |
| |||||||
| 60,243 | NorthWestern Corp. | $ | 3,451,924 | |||||
|
| |||||||
| 9,709,060 | ||||||||
|
| |||||||
| Pharmaceuticals – 1.2% |
| |||||||
| 23,015 | Catalent, Inc.(a) | 3,062,606 | ||||||
| 152,530 | Supernus Pharmaceuticals, Inc.(a) | 4,067,975 | ||||||
|
| |||||||
| 7,130,581 | ||||||||
|
| |||||||
| Professional Services – 3.0% |
| |||||||
| 43,267 | Insperity, Inc. | 4,791,387 | ||||||
| 103,185 | Korn Ferry | 7,466,467 | ||||||
| 63,089 | Science Applications International Corp. | 5,397,895 | ||||||
|
| |||||||
| 17,655,749 | ||||||||
|
| |||||||
| REITs – Single Tenant – 0.8% |
| |||||||
| 67,391 | Agree Realty Corp. | 4,463,306 | ||||||
|
| |||||||
| REITs – Storage – 0.8% |
| |||||||
| 92,678 | CubeSmart | 4,490,249 | ||||||
|
| |||||||
| REITs – Warehouse/Industrials – 1.7% |
| |||||||
| 77,993 | Rexford Industrial Realty, Inc. | 4,426,103 | ||||||
| 140,795 | STAG Industrial, Inc. | 5,526,203 | ||||||
|
| |||||||
| 9,952,306 | ||||||||
|
| |||||||
| Semiconductors & Semiconductor Equipment – 1.9% |
| |||||||
| 206,425 | Rambus, Inc.(a) | 4,582,635 | ||||||
| 216,090 | Tower Semiconductor Ltd.(a) | 6,461,091 | ||||||
|
| |||||||
| 11,043,726 | ||||||||
|
| |||||||
| Software – 0.4% |
| |||||||
| 85,938 | ACI Worldwide, Inc.(a) | 2,640,875 | ||||||
|
| |||||||
| Specialty Retail – 1.4% |
| |||||||
| 171,975 | Aaron’s Co., Inc. (The) | 4,736,192 | ||||||
| 121,509 | Urban Outfitters, Inc.(a) | 3,607,602 | ||||||
|
| |||||||
| 8,343,794 | ||||||||
|
| |||||||
| Thrifts & Mortgage Finance – 2.1% |
| |||||||
| 42,908 | Federal Agricultural Mortgage Corp., Class C | 4,656,376 | ||||||
| 146,774 | Meta Financial Group, Inc. | 7,702,700 | ||||||
|
| |||||||
| 12,359,076 | ||||||||
|
| |||||||
| Tobacco – 0.6% |
| |||||||
| 69,041 | Turning Point Brands, Inc. | 3,296,708 | ||||||
|
| |||||||
| Trading Companies & Distributors – 3.6% |
| |||||||
| 200,693 | Alta Equipment Group, Inc.(a) | 2,755,515 | ||||||
| 87,675 | Herc Holdings, Inc.(a) | 14,331,356 | ||||||
| 60,235 | McGrath RentCorp | 4,333,908 | ||||||
|
| |||||||
| 21,420,779 | ||||||||
|
| |||||||
| Water Utilities – 0.4% |
| |||||||
| 195,915 | Pure Cycle Corp.(a) | 2,607,629 | ||||||
|
| |||||||
| Wireless Telecommunication Services – 0.8% |
| |||||||
| 141,524 | United States Cellular Corp.(a) | 4,513,200 | ||||||
|
| |||||||
| Total Common Stocks | ||||||||
| (Identified Cost $374,791,318) | 581,143,754 | |||||||
|
| |||||||
See accompanying notes to financial statements.
| 20
Portfolio of Investments – as of September 30, 2021
Loomis Sayles Small Cap Value Fund – continued
| Shares | Description | Value (†) | ||||||
| Other Investments – 0.0% | ||||||||
| Metals & Mining – 0.0% |
| |||||||
| 507,316 | Ferroglobe R&W Trust(a)(b)(c)(d) (Identified Cost $0) | $ | — | |||||
|
| |||||||
| | Principal Amount | |||||||
| Short-Term Investments – 1.9% | ||||||||
| $ | 11,208,671 | Tri-Party Repurchase Agreement with Fixed Income Clearing Corporation, dated 9/30/2021 at 0.000% to be repurchased at $11,208,671 on 10/01/2021 collateralized by $10,212,400 U.S. Treasury Inflation Indexed Note, 0.125% due 7/15/2031 valued at $11,432,910 including accrued interest (Note 2 of Notes to Financial Statements) (Identified Cost $11,208,671) | 11,208,671 | |||||
|
| |||||||
| Total Investments – 100.0% | ||||||||
| (Identified Cost $385,999,989) | 592,352,425 | |||||||
| Other assets less liabilities—0.0% | 290,436 | |||||||
|
| |||||||
| Net Assets – 100.0% | $ | 592,642,861 | ||||||
|
| |||||||
| (†) | See Note 2 of Notes to Financial Statements. |
| ||||||
| (a) | Non-income producing security. |
| ||||||
| (b) | Illiquid security. (Unaudited) |
| ||||||
| (c) | Security classified as fair valued pursuant to the Fund’s pricing policies and procedures. |
| ||||||
| (d) | Security subject to restrictions on resale. This security was acquired on November 29, 2016 at a cost of $0. |
| ||||||
| REITs | Real Estate Investment Trusts |
| ||||||
Industry Summary at September 30, 2021
Banks | 13.7 | % | ||
Machinery | 6.3 | |||
Electronic Equipment, Instruments & Components | 5.0 | |||
IT Services | 4.8 | |||
Food Products | 3.6 | |||
Trading Companies & Distributors | 3.6 | |||
Auto Components | 3.4 | |||
Health Care Equipment & Supplies | 3.2 | |||
Professional Services | 3.0 | |||
Commercial Services & Supplies | 2.9 | |||
Chemicals | 2.5 | |||
Hotels, Restaurants & Leisure | 2.4 | |||
Thrifts & Mortgage Finance | 2.1 | |||
Household Durables | 2.1 | |||
Construction & Engineering | 2.0 | |||
Media | 2.0 | |||
Electrical Equipment | 2.0 | |||
Building Products | 2.0 | |||
Capital Markets | 2.0 | |||
Other Investments, less than 2% each | 29.5 | |||
Short-Term Investments | 1.9 | |||
|
| |||
Total Investments | 100.0 | |||
Other assets less liabilities | 0.0 | * | ||
|
| |||
Net Assets | 100.0 | % | ||
|
|
* Less than 0.1%
See accompanying notes to financial statements.
21 |
Portfolio of Investments – as of September 30, 2021
Loomis Sayles Small/Mid Cap Growth Fund
| Shares | Description | Value (†) | ||||||
| Common Stocks – 97.0% of Net Assets | ||||||||
| Aerospace & Defense – 4.3% |
| |||||||
| 8,820 | Axon Enterprise, Inc.(a) | $ | 1,543,677 | |||||
| 7,152 | HEICO Corp. | 943,134 | ||||||
| 15,310 | Hexcel Corp.(a) | 909,261 | ||||||
|
| |||||||
| 3,396,072 | ||||||||
|
| |||||||
| Auto Components – 2.2% |
| |||||||
| 5,889 | Fox Factory Holding Corp.(a) | 851,196 | ||||||
| 6,441 | LCI Industries | 867,152 | ||||||
|
| |||||||
| 1,718,348 | ||||||||
|
| |||||||
| Banks – 1.8% |
| |||||||
| 11,902 | Glacier Bancorp, Inc. | 658,776 | ||||||
| 18,512 | Pacific Premier Bancorp, Inc. | 767,137 | ||||||
|
| |||||||
| 1,425,913 | ||||||||
|
| |||||||
| Biotechnology – 6.9% |
| |||||||
| 2,832 | Acceleron Pharma, Inc.(a) | 487,387 | ||||||
| 2,125 | Argenx SE, ADR(a) | 641,750 | ||||||
| 12,248 | BridgeBio Pharma, Inc.(a) | 574,064 | ||||||
| 17,607 | Halozyme Therapeutics, Inc.(a) | 716,253 | ||||||
| 10,227 | Horizon Therapeutics PLC(a) | 1,120,265 | ||||||
| 8,117 | Neurocrine Biosciences, Inc.(a) | 778,501 | ||||||
| 15,137 | PTC Therapeutics, Inc.(a) | 563,248 | ||||||
| 19,633 | Xencor, Inc.(a) | 641,214 | ||||||
|
| |||||||
| 5,522,682 | ||||||||
|
| |||||||
| Building Products – 3.8% |
| |||||||
| 10,104 | Advanced Drainage Systems, Inc. | 1,092,950 | ||||||
| 25,066 | AZEK Co., Inc. (The)(a) | 915,661 | ||||||
| 9,699 | Trex Co., Inc.(a) | 988,619 | ||||||
|
| |||||||
| 2,997,230 | ||||||||
|
| |||||||
| Capital Markets – 3.8% |
| |||||||
| 15,854 | Ares Management Corp., Class A | 1,170,501 | ||||||
| 8,487 | Hamilton Lane, Inc., Class A | 719,867 | ||||||
| 4,352 | Morningstar, Inc. | 1,127,299 | ||||||
|
| |||||||
| 3,017,667 | ||||||||
|
| |||||||
| Commercial Services & Supplies – 1.6% |
| |||||||
| 8,533 | Tetra Tech, Inc. | 1,274,318 | ||||||
|
| |||||||
| Communications Equipment – 1.1% |
| |||||||
| 17,267 | Ciena Corp.(a) | 886,660 | ||||||
|
| |||||||
| Distributors – 1.6% |
| |||||||
| 2,988 | POOL CORP. | 1,298,017 | ||||||
|
| |||||||
| Diversified Consumer Services – 0.9% |
| |||||||
| 10,612 | Chegg, Inc.(a) | 721,828 | ||||||
|
| |||||||
| Electrical Equipment – 0.7% |
| |||||||
| 1,368 | Generac Holdings, Inc.(a) | 559,061 | ||||||
|
| |||||||
| Electronic Equipment, Instruments & Components – 2.3% |
| |||||||
| 8,774 | Advanced Energy Industries, Inc. | 769,918 | ||||||
| 12,723 | Trimble, Inc.(a) | 1,046,467 | ||||||
|
| |||||||
| 1,816,385 | ||||||||
|
| |||||||
| Food & Staples Retailing – 1.8% |
| |||||||
| 12,273 | BJ’s Wholesale Club Holdings, Inc.(a) | 674,033 | ||||||
| 4,265 | Casey’s General Stores, Inc. | 803,739 | ||||||
|
| |||||||
| 1,477,772 | ||||||||
|
| |||||||
| Food Products – 2.3% |
| |||||||
| 6,369 | Freshpet, Inc.(a) | $ | 908,793 | |||||
| 25,795 | Simply Good Foods Co. (The)(a) | 889,669 | ||||||
|
| |||||||
| 1,798,462 | ||||||||
|
| |||||||
| Health Care Equipment & Supplies – 6.1% |
| |||||||
| 21,811 | AngioDynamics, Inc.(a) | 565,777 | ||||||
| 10,671 | Axonics, Inc.(a) | 694,575 | ||||||
| 7,064 | CONMED Corp. | 924,183 | ||||||
| 15,139 | Globus Medical, Inc., Class A(a) | 1,159,950 | ||||||
| 5,367 | Insulet Corp.(a) | 1,525,463 | ||||||
|
| |||||||
| 4,869,948 | ||||||||
|
| |||||||
| Health Care Providers & Services – 3.9% |
| |||||||
| 19,132 | Acadia Healthcare Co., Inc.(a) | 1,220,239 | ||||||
| 7,399 | Encompass Health Corp. | 555,221 | ||||||
| 4,939 | LHC Group, Inc.(a) | 774,978 | ||||||
| 26,682 | R1 RCM, Inc.(a) | 587,271 | ||||||
|
| |||||||
| 3,137,709 | ||||||||
|
| |||||||
| Hotels, Restaurants & Leisure – 2.2% |
| |||||||
| 2,821 | Churchill Downs, Inc. | 677,265 | ||||||
| 11,563 | Texas Roadhouse, Inc. | 1,056,049 | ||||||
|
| |||||||
| 1,733,314 | ||||||||
|
| |||||||
| Household Durables – 1.4% |
| |||||||
| 4,947 | Helen of Troy Ltd.(a) | 1,111,492 | ||||||
|
| |||||||
| IT Services – 2.4% |
| |||||||
| 6,122 | Broadridge Financial Solutions, Inc. | 1,020,170 | ||||||
| 6,761 | Endava PLC, Sponsored ADR(a) | 918,482 | ||||||
|
| |||||||
| 1,938,652 | ||||||||
|
| |||||||
| Leisure Products – 1.3% |
| |||||||
| 10,883 | Brunswick Corp. | 1,036,823 | ||||||
|
| |||||||
| Life Sciences Tools & Services – 5.4% |
| |||||||
| 2,272 | Bio-Techne Corp. | 1,100,943 | ||||||
| 2,407 | Charles River Laboratories International, Inc.(a) | 993,297 | ||||||
| 3,835 | ICON PLC(a) | 1,004,847 | ||||||
| 13,920 | Syneos Health, Inc.(a) | 1,217,721 | ||||||
|
| |||||||
| 4,316,808 | ||||||||
|
| |||||||
| Machinery – 4.6% |
| |||||||
| 8,698 | ESCO Technologies, Inc. | 669,746 | ||||||
| 20,123 | Ingersoll Rand, Inc.(a) | 1,014,401 | ||||||
| 4,806 | John Bean Technologies Corp. | 675,483 | ||||||
| 4,923 | Kornit Digital Ltd.(a) | 712,555 | ||||||
| 2,770 | RBC Bearings, Inc.(a) | 587,794 | ||||||
|
| |||||||
| 3,659,979 | ||||||||
|
| |||||||
| Personal Products – 0.8% |
| |||||||
| 21,304 | BellRing Brands, Inc., Class A(a) | 655,098 | ||||||
|
| |||||||
| Pharmaceuticals – 2.3% |
| |||||||
| 10,019 | Catalent, Inc.(a) | 1,333,228 | ||||||
| 9,383 | Pacira BioSciences, Inc.(a) | 525,448 | ||||||
|
| |||||||
| 1,858,676 | ||||||||
|
| |||||||
| Professional Services – 1.1% |
| |||||||
| 22,700 | KBR, Inc. | 894,380 | ||||||
|
| |||||||
| Road & Rail – 1.2% |
| |||||||
| 6,297 | Landstar System, Inc. | 993,793 | ||||||
|
| |||||||
See accompanying notes to financial statements.
| 22
Portfolio of Investments – as of September 30, 2021
Loomis Sayles Small/Mid Cap Growth Fund – continued
| Shares | Description | Value (†) | ||||||
| Common Stocks – continued | ||||||||
| Semiconductors & Semiconductor Equipment – 8.1% |
| |||||||
| 7,007 | MKS Instruments, Inc. | $ | 1,057,426 | |||||
| 2,469 | Monolithic Power Systems, Inc. | 1,196,675 | ||||||
| 10,824 | Nova Ltd.(a) | 1,107,187 | ||||||
| 14,923 | Semtech Corp.(a) | 1,163,546 | ||||||
| 6,979 | Silicon Laboratories, Inc.(a) | 978,177 | ||||||
| 5,365 | Synaptics, Inc.(a) | 964,252 | ||||||
|
| |||||||
| 6,467,263 | ||||||||
|
| |||||||
| Software – 12.3% |
| |||||||
| 6,031 | Avalara, Inc.(a) | 1,054,038 | ||||||
| 9,097 | Black Knight, Inc.(a) | 654,984 | ||||||
| 9,075 | Blackline, Inc.(a) | 1,071,395 | ||||||
| 5,614 | Five9, Inc.(a) | 896,780 | ||||||
| 5,962 | Paylocity Holding Corp.(a) | 1,671,745 | ||||||
| 6,703 | Pegasystems, Inc. | 851,951 | ||||||
| 10,388 | Q2 Holdings, Inc.(a) | 832,494 | ||||||
| 8,147 | Rapid7, Inc.(a) | 920,774 | ||||||
| 13,203 | Smartsheet, Inc., Class A(a) | 908,631 | ||||||
| 2,060 | Tyler Technologies, Inc.(a) | 944,819 | ||||||
|
| |||||||
| 9,807,611 | ||||||||
|
| |||||||
| Specialty Retail – 2.4% |
| |||||||
| 3,258 | Five Below, Inc.(a) | 576,047 | ||||||
| 11,019 | Floor & Decor Holdings, Inc., Class A(a) | 1,330,985 | ||||||
|
| |||||||
| 1,907,032 | ||||||||
|
| |||||||
| Technology Hardware, Storage & Peripherals – 1.0% |
| |||||||
| 31,927 | Pure Storage, Inc., Class A(a) | 803,283 | ||||||
|
| |||||||
| Textiles, Apparel & Luxury Goods – 2.0% |
| |||||||
| 7,790 | Columbia Sportswear Co. | 746,594 | ||||||
| 19,550 | Skechers U.S.A., Inc., Class A(a) | 823,446 | ||||||
|
| |||||||
| 1,570,040 | ||||||||
|
| |||||||
| Thrifts & Mortgage Finance – 1.2% |
| |||||||
| 18,214 | Axos Financial, Inc.(a) | 938,750 | ||||||
|
| |||||||
| Trading Companies & Distributors – 2.2% |
| |||||||
| 8,797 | SiteOne Landscape Supply, Inc.(a) | 1,754,738 | ||||||
|
| |||||||
| Total Common Stocks | ||||||||
| (Identified Cost $58,697,920) | 77,365,804 | |||||||
|
| |||||||
| | Principal Amount | |||||||
| Short-Term Investments – 3.2% | ||||||||
| $ | 2,569,192 | Tri-Party Repurchase Agreement with Fixed Income Clearing Corporation, dated 9/30/2021 at 0.000% to be repurchased at $2,569,192 on 10/01/2021 collateralized by $2,902,000 U.S. Treasury Bond, 1.375% due 11/15/2040 valued at $2,620,643 including accrued interest (Note 2 of Notes to Financial Statements) (Identified Cost $2,569,192) | 2,569,192 | |||||
|
| |||||||
| Total Investments – 100.2% | ||||||||
| (Identified Cost $61,267,112) | 79,934,996 | |||||||
| Other assets less liabilities—(0.2)% | (149,591 | ) | ||||||
|
| |||||||
| Net Assets – 100.0% | $ | 79,785,405 | ||||||
|
| |||||||
| (†) | See Note 2 of Notes to Financial Statements. | |||||||
| (a) | Non-income producing security. | |||||||
| ADR | An American Depositary Receipt is a certificate issued by a custodian bank representing the right to receive securities of the foreign issuer described. The values of ADRs may be significantly influenced by trading on exchanges not located in the United States. | |||||||
Industry Summary at September 30, 2021
Software | 12.3 | % | ||
Semiconductors & Semiconductor Equipment | 8.1 | |||
Biotechnology | 6.9 | |||
Health Care Equipment & Supplies | 6.1 | |||
Life Sciences Tools & Services | 5.4 | |||
Machinery | 4.6 | |||
Aerospace & Defense | 4.3 | |||
Health Care Providers & Services | 3.9 | |||
Capital Markets | 3.8 | |||
Building Products | 3.8 | |||
IT Services | 2.4 | |||
Specialty Retail | 2.4 | |||
Pharmaceuticals | 2.3 | |||
Electronic Equipment, Instruments & Components | 2.3 | |||
Food Products | 2.3 | |||
Trading Companies & Distributors | 2.2 | |||
Hotels, Restaurants & Leisure | 2.2 | |||
Auto Components | 2.2 | |||
Textiles, Apparel & Luxury Goods | 2.0 | |||
Other Investments, less than 2% each | 17.5 | |||
Short-Term Investments | 3.2 | |||
|
| |||
Total Investments | 100.2 | |||
Other assets less liabilities | (0.2 | ) | ||
|
| |||
Net Assets | 100.0 | % | ||
|
|
See accompanying notes to financial statements.
23 |
Statements of Assets and Liabilities
September 30, 2021
| Small Cap Growth Fund | Small Cap Value Fund | Small/Mid Cap Growth Fund | ||||||||||
ASSETS |
| |||||||||||
Investments at cost | $ | 2,137,677,997 | $ | 385,999,989 | $ | 61,267,112 | ||||||
Net unrealized appreciation | 761,696,228 | 206,352,436 | 18,667,884 | |||||||||
|
|
|
|
|
| |||||||
Investments at value | 2,899,374,225 | 592,352,425 | 79,934,996 | |||||||||
Cash | 1,778,493 | — | — | |||||||||
Receivable for Fund shares sold | 4,089,013 | 980,335 | 4,326 | |||||||||
Receivable for securities sold | 5,733,537 | 1,236,249 | 238,061 | |||||||||
Dividends receivable | 428,613 | 352,906 | 15,685 | |||||||||
Prepaid expenses (Note 7) | 374 | 76 | 10 | |||||||||
|
|
|
|
|
| |||||||
TOTAL ASSETS | 2,911,404,255 | 594,921,991 | 80,193,078 | |||||||||
|
|
|
|
|
| |||||||
| LIABILITIES |
| |||||||||||
Payable for securities purchased | 23,595,476 | 1,235,975 | 266,534 | |||||||||
Payable for Fund shares redeemed | 5,454,256 | 235,109 | — | |||||||||
Management fees payable (Note 5) | 1,831,613 | 354,021 | 40,689 | |||||||||
Deferred Trustees’ fees (Note 5) | 321,059 | 341,862 | 41,325 | |||||||||
Administrative fees payable (Note 5) | 103,537 | 20,621 | 2,875 | |||||||||
Payable to distributor (Note 5d) | 17,801 | 4,972 | 23 | |||||||||
Audit and tax services fees payable | 42,476 | 43,318 | 42,601 | |||||||||
Other accounts payable and accrued expenses | 94,970 | 43,252 | 13,626 | |||||||||
|
|
|
|
|
| |||||||
TOTAL LIABILITIES | 31,461,188 | 2,279,130 | 407,673 | |||||||||
|
|
|
|
|
| |||||||
NET ASSETS | $ | 2,879,943,067 | $ | 592,642,861 | $ | 79,785,405 | ||||||
|
|
|
|
|
| |||||||
NET ASSETS CONSIST OF: |
| |||||||||||
Paid-in capital | $ | 1,623,695,819 | $ | 292,564,136 | $ | 53,031,302 | ||||||
Accumulated earnings | 1,256,247,248 | 300,078,725 | 26,754,103 | |||||||||
|
|
|
|
|
| |||||||
NET ASSETS | $ | 2,879,943,067 | $ | 592,642,861 | $ | 79,785,405 | ||||||
|
|
|
|
|
| |||||||
| COMPUTATION OF NET ASSET VALUE AND OFFERING PRICE: |
| |||||||||||
Institutional Class: |
| |||||||||||
Net assets | $ | 1,299,776,658 | $ | 378,856,352 | $ | 70,525,723 | ||||||
|
|
|
|
|
| |||||||
Shares of beneficial interest | 35,538,108 | 11,821,837 | 4,624,749 | |||||||||
|
|
|
|
|
| |||||||
Net asset value, offering and redemption price per share | $ | 36.57 | $ | 32.05 | $ | 15.25 | ||||||
|
|
|
|
|
| |||||||
Retail Class: |
| |||||||||||
Net assets | $ | 105,026,939 | $ | 92,035,713 | $ | — | ||||||
|
|
|
|
|
| |||||||
Shares of beneficial interest | 3,203,282 | 2,937,541 | — | |||||||||
|
|
|
|
|
| |||||||
Net asset value, offering and redemption price per share | $ | 32.79 | $ | 31.33 | $ | — | ||||||
|
|
|
|
|
| |||||||
Admin Class shares: |
| |||||||||||
Net assets | $ | — | $ | 9,440,456 | $ | — | ||||||
|
|
|
|
|
| |||||||
Shares of beneficial interest | — | 320,721 | — | |||||||||
|
|
|
|
|
| |||||||
Net asset value, offering and redemption price per share | $ | — | $ | 29.44 | $ | — | ||||||
|
|
|
|
|
| |||||||
Class N shares: |
| |||||||||||
Net assets | $ | 1,475,139,470 | $ | 112,310,340 | $ | 9,259,682 | ||||||
|
|
|
|
|
| |||||||
Shares of beneficial interest | 39,858,871 | 3,502,195 | 606,773 | |||||||||
|
|
|
|
|
| |||||||
Net asset value, offering and redemption price per share | $ | 37.01 | $ | 32.07 | $ | 15.26 | ||||||
|
|
|
|
|
| |||||||
See accompanying notes to financial statements.
| 24
Statements of Operations
For the Year Ended September 30, 2021
| Small Cap Growth Fund | Small Cap Value Fund | Small/Mid Cap Growth Fund | ||||||||||
INVESTMENT INCOME |
| |||||||||||
Dividends | $ | 5,894,541 | $ | 6,150,452 | $ | 530,001 | (a) | |||||
Less net foreign taxes withheld | (48,237 | ) | (31,020 | ) | (791 | ) | ||||||
|
|
|
|
|
| |||||||
| 5,846,304 | 6,119,432 | 529,210 | ||||||||||
|
|
|
|
|
| |||||||
Expenses |
| |||||||||||
Management fees (Note 5) | 21,669,026 | 4,483,393 | 569,723 | |||||||||
Service and distribution fees (Note 5) | 286,313 | 290,334 | — | |||||||||
Administrative fees (Note 5) | 1,236,240 | 255,823 | 32,493 | |||||||||
Trustees’ fees and expenses (Note 5) | 157,990 | 90,852 | 22,214 | |||||||||
Transfer agent fees and expenses (Notes 5 and 6) | 1,462,415 | 426,161 | 4,649 | |||||||||
Audit and tax services fees | 42,776 | 43,322 | 42,612 | |||||||||
Custodian fees and expenses | 88,758 | 18,490 | 8,254 | |||||||||
Legal fees (Note 7) | 99,995 | 19,107 | 2,554 | |||||||||
Registration fees | 106,446 | 74,757 | 40,506 | |||||||||
Shareholder reporting expenses | 57,511 | 36,820 | 5,824 | |||||||||
Miscellaneous expenses (Note 7) | 89,695 | 40,765 | 27,608 | |||||||||
|
|
|
|
|
| |||||||
Total expenses | 25,297,165 | 5,779,824 | 756,437 | |||||||||
Fee/expense recovery (Note 5) | — | 1,568 | — | |||||||||
Less waiver and/or expense reimbursement (Note 5) | — | (169,338 | ) | (122,222 | ) | |||||||
|
|
|
|
|
| |||||||
Net expenses | 25,297,165 | 5,612,054 | 634,215 | |||||||||
|
|
|
|
|
| |||||||
Net investment income (loss) | (19,450,861 | ) | 507,378 | (105,005 | ) | |||||||
|
|
|
|
|
| |||||||
| NET REALIZED AND UNREALIZED GAIN ON INVESTMENTS |
| |||||||||||
Net realized gain on: |
| |||||||||||
Investments | 533,253,178 | 100,227,931 | 9,142,738 | |||||||||
|
|
|
|
|
| |||||||
Net change in unrealized appreciation (depreciation) on: |
| |||||||||||
Investments | 177,322,872 | 147,963,359 | 8,684,917 | |||||||||
|
|
|
|
|
| |||||||
Net realized and unrealized gain on investments | 710,576,050 | 248,191,290 | 17,827,655 | |||||||||
|
|
|
|
|
| |||||||
| NET INCREASE IN NET ASSETS RESULTING FROM OPERATIONS | $ | 691,125,189 | $ | 248,698,668 | $ | 17,722,650 | ||||||
|
|
|
|
|
| |||||||
| (a) | Includes a non-recurring dividend of $291,045. |
See accompanying notes to financial statements.
25 |
Statements of Changes in Net Assets
| Small Cap Growth Fund | Small Cap Value Fund | |||||||||||||||
| Year Ended September 30, 2021 | Year Ended September 30, 2020 | Year Ended September 30, 2021 | Year Ended September 30, 2020 | |||||||||||||
| FROM OPERATIONS: |
| |||||||||||||||
Net investment income (loss) | $ | (19,450,861 | ) | $ | (11,503,268 | ) | $ | 507,378 | $ | 2,531,907 | ||||||
Net realized gain on investments | 533,253,178 | 44,416,635 | 100,227,931 | 39,651,898 | ||||||||||||
Net change in unrealized appreciation (depreciation) on investments | 177,322,872 | 311,230,363 | 147,963,359 | (146,094,001 | ) | |||||||||||
|
|
|
|
|
|
|
| |||||||||
Net increase (decrease) in net assets resulting from operations | 691,125,189 | 344,143,730 | 248,698,668 | (103,910,196 | ) | |||||||||||
|
|
|
|
|
|
|
| |||||||||
| FROM DISTRIBUTIONS TO SHAREHOLDERS: |
| |||||||||||||||
Institutional Class | (22,559,287 | ) | (80,218,616 | ) | (26,695,330 | ) | (34,882,909 | ) | ||||||||
Retail Class | (2,296,488 | ) | (9,162,211 | ) | (7,238,030 | ) | (10,573,237 | ) | ||||||||
Admin Class | — | — | (668,585 | ) | (1,107,925 | ) | ||||||||||
Class N | (24,308,305 | ) | (61,460,368 | ) | (8,552,785 | ) | (11,045,289 | ) | ||||||||
|
|
|
|
|
|
|
| |||||||||
Total distributions | (49,164,080 | ) | (150,841,195 | ) | (43,154,730 | ) | (57,609,360 | ) | ||||||||
|
|
|
|
|
|
|
| |||||||||
| NET INCREASE (DECREASE) IN NET ASSETS FROM CAPITAL SHARE TRANSACTIONS (NOTE 10) | 36,085,434 | 374,429,835 | (91,550,412 | ) | (82,803,607 | ) | ||||||||||
|
|
|
|
|
|
|
| |||||||||
Net increase (decrease) in net assets | 678,046,543 | 567,732,370 | 113,993,526 | (244,323,163 | ) | |||||||||||
| NET ASSETS |
| |||||||||||||||
Beginning of the year | 2,201,896,524 | 1,634,164,154 | 478,649,335 | 722,972,498 | ||||||||||||
|
|
|
|
|
|
|
| |||||||||
End of the year | $ | 2,879,943,067 | $ | 2,201,896,524 | $ | 592,642,861 | $ | 478,649,335 | ||||||||
|
|
|
|
|
|
|
| |||||||||
See accompanying notes to financial statements.
| 26
Statements of Changes in Net Assets – continued
| Small/Mid Cap Growth Fund | ||||||||
| Year Ended September 30, 2021 | Year Ended September 30, 2020 | |||||||
| FROM OPERATIONS: |
| |||||||
Net investment loss | $ | (105,005 | ) | $ | (142,634 | ) | ||
Net realized gain on investments | 9,142,738 | 478,820 | ||||||
Net change in unrealized appreciation (depreciation) on investments | 8,684,917 | 7,645,216 | ||||||
|
|
|
| |||||
Net increase in net assets resulting from operations | 17,722,650 | 7,981,402 | ||||||
|
|
|
| |||||
| FROM DISTRIBUTIONS TO SHAREHOLDERS: |
| |||||||
Institutional Class | (450,185 | ) | (817,090 | ) | ||||
Class N | (58,589 | ) | (24 | ) | ||||
|
|
|
| |||||
Total distributions | (508,774 | ) | (817,114 | ) | ||||
|
|
|
| |||||
| NET INCREASE IN NET ASSETS FROM CAPITAL SHARE TRANSACTIONS (NOTE 10) | 10,400,054 | 10,695,219 | ||||||
|
|
|
| |||||
Net increase in net assets | 27,613,930 | 17,859,507 | ||||||
| NET ASSETS |
| |||||||
Beginning of the year | 52,171,475 | 34,311,968 | ||||||
|
|
|
| |||||
End of the year | $ | 79,785,405 | $ | 52,171,475 | ||||
|
|
|
| |||||
See accompanying notes to financial statements.
27 |
Financial Highlights
For a share outstanding throughout each period.
| Small Cap Growth Fund – Institutional Class | ||||||||||||||||||||
| Year Ended September 30, 2021 | Year Ended September 30, 2020 | Year Ended September 30, 2019 | Year Ended September 30, 2018 | Year Ended September 30, 2017 | ||||||||||||||||
Net asset value, beginning of the period | $ | 28.51 | $ | 26.30 | $ | 31.55 | $ | 27.37 | $ | 22.03 | ||||||||||
|
|
|
|
|
|
|
|
|
| |||||||||||
INCOME (LOSS) FROM INVESTMENT OPERATIONS: | ||||||||||||||||||||
Net investment loss(a) | (0.26 | ) | (0.17 | ) | (0.16 | ) | (0.16 | ) | (0.12 | ) | ||||||||||
Net realized and unrealized gain (loss) | 8.94 | 4.73 | (2.51 | ) | 7.54 | 5.46 | ||||||||||||||
|
|
|
|
|
|
|
|
|
| |||||||||||
Total from Investment Operations | 8.68 | 4.56 | (2.67 | ) | 7.38 | 5.34 | ||||||||||||||
|
|
|
|
|
|
|
|
|
| |||||||||||
LESS DISTRIBUTIONS FROM: | ||||||||||||||||||||
Net realized capital gains | (0.62 | ) | (2.35 | ) | (2.58 | ) | (3.20 | ) | — | |||||||||||
|
|
|
|
|
|
|
|
|
| |||||||||||
Net asset value, end of the period | $ | 36.57 | $ | 28.51 | $ | 26.30 | $ | 31.55 | $ | 27.37 | ||||||||||
|
|
|
|
|
|
|
|
|
| |||||||||||
Total return | 30.53 | % | 17.98 | % | (6.88 | )% | 29.77 | % | 24.24 | % | ||||||||||
RATIOS TO AVERAGE NET ASSETS: | ||||||||||||||||||||
Net assets, end of the period (000’s) | $ | 1,299,777 | $ | 1,037,625 | $ | 908,616 | $ | 926,914 | $ | 824,103 | ||||||||||
Net expenses | 0.92 | % | 0.94 | % | 0.95 | % | 0.94 | % | 0.95 | % | ||||||||||
Gross expenses | 0.92 | % | 0.94 | % | 0.95 | % | 0.94 | % | 0.95 | % | ||||||||||
Net investment loss | (0.72 | )% | (0.66 | )% | (0.62 | )% | (0.58 | )% | (0.49 | )% | ||||||||||
Portfolio turnover rate | 52 | % | 52 | % | 67 | % | 41 | % | 45 | % | ||||||||||
| (a) | Per share net investment loss has been calculated using the average shares outstanding during the period. |
| Small Cap Growth Fund – Retail Class | ||||||||||||||||||||
| Year Ended September 30, 2021 | Year Ended September 30, 2020 | Year Ended September 30, 2019 | Year Ended September 30, 2018 | Year Ended September 30, 2017 | ||||||||||||||||
Net asset value, beginning of the period | $ | 25.67 | $ | 23.95 | $ | 29.09 | $ | 25.53 | $ | 20.61 | ||||||||||
|
|
|
|
|
|
|
|
|
| |||||||||||
INCOME (LOSS) FROM INVESTMENT OPERATIONS: | ||||||||||||||||||||
Net investment loss(a) | (0.30 | ) | (0.21 | ) | (0.21 | ) | (0.22 | ) | (0.16 | ) | ||||||||||
Net realized and unrealized gain (loss) | 8.04 | 4.28 | (2.35 | ) | 6.98 | 5.08 | ||||||||||||||
|
|
|
|
|
|
|
|
|
| |||||||||||
Total from Investment Operations | 7.74 | 4.07 | (2.56 | ) | 6.76 | 4.92 | ||||||||||||||
|
|
|
|
|
|
|
|
|
| |||||||||||
LESS DISTRIBUTIONS FROM: | ||||||||||||||||||||
Net realized capital gains | (0.62 | ) | (2.35 | ) | (2.58 | ) | (3.20 | ) | — | |||||||||||
|
|
|
|
|
|
|
|
|
| |||||||||||
Net asset value, end of the period | $ | 32.79 | $ | 25.67 | $ | 23.95 | $ | 29.09 | $ | 25.53 | ||||||||||
|
|
|
|
|
|
|
|
|
| |||||||||||
Total return | 30.20 | % | 17.67 | % | (7.11 | )%(b) | 29.45 | % | 23.93 | % | ||||||||||
RATIOS TO AVERAGE NET ASSETS: | ||||||||||||||||||||
Net assets, end of the period (000’s) | $ | 105,027 | $ | 98,205 | $ | 95,635 | $ | 136,415 | $ | 107,387 | ||||||||||
Net expenses | 1.17 | % | 1.19 | % | 1.19 | %(c) | 1.19 | % | 1.20 | % | ||||||||||
Gross expenses | 1.17 | % | 1.19 | % | 1.20 | % | 1.19 | % | 1.20 | % | ||||||||||
Net investment loss | (0.92 | )% | (0.91 | )% | (0.86 | )% | (0.82 | )% | (0.73 | )% | ||||||||||
Portfolio turnover rate | 52 | % | 52 | % | 67 | % | 41 | % | 45 | % | ||||||||||
| (a) | Per share net investment loss has been calculated using the average shares outstanding during the period. |
| (b) | Had certain expenses not been waived/reimbursed during the period, total returns would have been lower. |
| (c) | The administrator agreed to waive its fees and/or reimburse a portion of the Fund’s expenses during the period. Without this waiver/reimbursement, expenses would have been higher. |
See accompanying notes to financial statements.
| 28
Financial Highlights – continued
For a share outstanding throughout each period.
| Small Cap Growth Fund – Class N | ||||||||||||||||||||
| Year Ended September 30, 2021 | Year Ended September 30, 2020 | Year Ended September 30, 2019 | Year Ended September 30, 2018 | Year Ended September 30, 2017 | ||||||||||||||||
Net asset value, beginning of the period | $ | 28.81 | $ | 26.53 | $ | 31.76 | $ | 27.50 | $ | 22.11 | ||||||||||
|
|
|
|
|
|
|
|
|
| |||||||||||
INCOME (LOSS) FROM INVESTMENT OPERATIONS: | ||||||||||||||||||||
Net investment loss(a) | (0.22 | ) | (0.14 | ) | (0.13 | ) | (0.12 | ) | (0.09 | ) | ||||||||||
Net realized and unrealized gain (loss) | 9.04 | 4.77 | (2.52 | ) | 7.58 | 5.48 | ||||||||||||||
|
|
|
|
|
|
|
|
|
| |||||||||||
Total from Investment Operations | 8.82 | 4.63 | (2.65 | ) | 7.46 | 5.39 | ||||||||||||||
|
|
|
|
|
|
|
|
|
| |||||||||||
LESS DISTRIBUTIONS FROM: | ||||||||||||||||||||
Net realized capital gains | (0.62 | ) | (2.35 | ) | (2.58 | ) | (3.20 | ) | — | |||||||||||
|
|
|
|
|
|
|
|
|
| |||||||||||
Net asset value, end of the period | $ | 37.01 | $ | 28.81 | $ | 26.53 | $ | 31.76 | $ | 27.50 | ||||||||||
|
|
|
|
|
|
|
|
|
| |||||||||||
Total return | 30.66 | % | 18.09 | % | (6.76 | )% | 29.93 | % | 24.38 | % | ||||||||||
RATIOS TO AVERAGE NET ASSETS: | ||||||||||||||||||||
Net assets, end of the period (000’s) | $ | 1,475,139 | $ | 1,066,067 | $ | 629,914 | $ | 517,734 | $ | 279,508 | ||||||||||
Net expenses | 0.82 | % | 0.82 | % | 0.82 | % | 0.82 | % | 0.82 | % | ||||||||||
Gross expenses | 0.82 | % | 0.82 | % | 0.82 | % | 0.82 | % | 0.82 | % | ||||||||||
Net investment loss | (0.62 | )% | (0.54 | )% | (0.49 | )% | (0.43 | )% | (0.39 | )% | ||||||||||
Portfolio turnover rate | 52 | % | 52 | % | 67 | % | 41 | % | 45 | % | ||||||||||
| (a) | Per share net investment loss has been calculated using the average shares outstanding during the period. |
| Small Cap Value Fund – Institutional Class | ||||||||||||||||||||
| Year Ended September 30, 2021 | Year Ended September 30, 2020 | Year Ended September 30, 2019 | Year Ended September 30, 2018 | Year Ended September 30, 2017 | ||||||||||||||||
Net asset value, beginning of the period | $ | 22.34 | $ | 28.66 | $ | 35.27 | $ | 37.37 | $ | 33.78 | ||||||||||
|
| |||||||||||||||||||
INCOME (LOSS) FROM INVESTMENT OPERATIONS: | ||||||||||||||||||||
Net investment income(a) | 0.04 | 0.12 | 0.10 | 0.09 | 0.13 | |||||||||||||||
Net realized and unrealized gain (loss) | 11.79 | (4.03 | ) | (2.49 | ) | 2.11 | 6.36 | |||||||||||||
|
| |||||||||||||||||||
Total from Investment Operations | 11.83 | (3.91 | ) | (2.39 | ) | 2.20 | 6.49 | |||||||||||||
|
| |||||||||||||||||||
LESS DISTRIBUTIONS FROM: | ||||||||||||||||||||
Net investment income | (0.13 | ) | (0.12 | ) | (0.08 | ) | (0.05 | ) | (0.14 | ) | ||||||||||
Net realized capital gains | (1.99 | ) | (2.29 | ) | (4.14 | ) | (4.25 | ) | (2.76 | ) | ||||||||||
|
| |||||||||||||||||||
Total Distributions | (2.12 | ) | (2.41 | ) | (4.22 | ) | (4.30 | ) | (2.90 | ) | ||||||||||
|
| |||||||||||||||||||
Net asset value, end of the period | $ | 32.05 | $ | 22.34 | $ | 28.66 | $ | 35.27 | $ | 37.37 | ||||||||||
|
| |||||||||||||||||||
Total return(b) | 55.05 | % | (15.31 | )% | (4.11 | )% | 6.21 | % | 19.68 | % | ||||||||||
RATIOS TO AVERAGE NET ASSETS: | ||||||||||||||||||||
Net assets, end of the period (000’s) | $ | 378,856 | $ | 295,006 | $ | 433,360 | $ | 587,198 | $ | 665,229 | ||||||||||
Net expenses(c) | 0.90 | % | 0.90 | % | 0.90 | % | 0.90 | % | 0.90 | % | ||||||||||
Gross expenses | 0.94 | % | 0.95 | % | 0.93 | % | 0.92 | % | 0.93 | % | ||||||||||
Net investment income | 0.12 | % | 0.48 | % | 0.36 | % | 0.26 | % | 0.37 | % | ||||||||||
Portfolio turnover rate | 23 | % | 23 | % | 24 | % | 19 | % | 25 | % | ||||||||||
| (a) | Per share net investment income has been calculated using the average shares outstanding during the period. |
| (b) | Had certain expenses not been waived/reimbursed during the period, total returns would have been lower. |
| (c) | The investment adviser agreed to waive its fees and/or reimburse a portion of the Fund’s expenses during the period. Without this waiver/reimbursement, expenses would have been higher. |
See accompanying notes to financial statements.
29 |
Financial Highlights – continued
For a share outstanding throughout each period.
| Small Cap Value Fund – Retail Class | ||||||||||||||||||||
| Year Ended September 30, 2021 | Year Ended September 30, 2020 | Year Ended September 30, 2019 | Year Ended September 30, 2018 | Year Ended September 30, 2017 | ||||||||||||||||
Net asset value, beginning of the period | $ | 21.87 | $ | 28.11 | $ | 34.66 | $ | 36.83 | $ | 33.33 | ||||||||||
|
| |||||||||||||||||||
INCOME (LOSS) FROM INVESTMENT OPERATIONS: | ||||||||||||||||||||
Net investment income (loss)(a) | (0.04 | ) | 0.05 | 0.03 | 0.00 | (b) | 0.04 | |||||||||||||
Net realized and unrealized gain (loss) | 11.55 | (3.96 | ) | (2.44 | ) | 2.08 | 6.27 | |||||||||||||
|
| |||||||||||||||||||
Total from Investment Operations | 11.51 | (3.91 | ) | (2.41 | ) | 2.08 | 6.31 | |||||||||||||
|
| |||||||||||||||||||
LESS DISTRIBUTIONS FROM: | ||||||||||||||||||||
Net investment income | (0.06 | ) | (0.04 | ) | — | — | (0.05 | ) | ||||||||||||
Net realized capital gains | (1.99 | ) | (2.29 | ) | (4.14 | ) | (4.25 | ) | (2.76 | ) | ||||||||||
|
| |||||||||||||||||||
Total Distributions | (2.05 | ) | (2.33 | ) | (4.14 | ) | (4.25 | ) | (2.81 | ) | ||||||||||
|
| |||||||||||||||||||
Net asset value, end of the period | $ | 31.33 | $ | 21.87 | $ | 28.11 | $ | 34.66 | $ | 36.83 | ||||||||||
|
| |||||||||||||||||||
Total return(c) | 54.69 | % | (15.56 | )% | (4.33 | )% | 5.95 | % | 19.38 | % | ||||||||||
RATIOS TO AVERAGE NET ASSETS: | ||||||||||||||||||||
Net assets, end of the period (000’s) | $ | 92,036 | $ | 83,163 | $ | 134,434 | $ | 208,310 | $ | 251,405 | ||||||||||
Net expenses(d) | 1.15 | % | 1.15 | % | 1.15 | % | 1.15 | % | 1.15 | % | ||||||||||
Gross expenses | 1.19 | % | 1.20 | % | 1.18 | % | 1.17 | % | 1.18 | % | ||||||||||
Net investment income (loss) | (0.12 | )% | 0.23 | % | 0.10 | % | 0.01 | % | 0.12 | % | ||||||||||
Portfolio turnover rate | 23 | % | 23 | % | 24 | % | 19 | % | 25 | % | ||||||||||
| (a) | Per share net investment income (loss) has been calculated using the average shares outstanding during the period. |
| (b) | Amount rounds to less than $0.01 per share. |
| (c) | Had certain expenses not been waived/reimbursed during the period, total returns would have been lower. |
| (d) | The investment adviser agreed to waive its fees and/or reimburse a portion of the Fund’s expenses during the period. Without this waiver/reimbursement, expenses would have been higher. |
| Small Cap Value Fund – Admin Class | ||||||||||||||||||||
| Year Ended September 30, 2021 | Year Ended September 30, 2020 | Year Ended September 30, 2019 | Year Ended September 30, 2018 | Year Ended September 30, 2017 | ||||||||||||||||
Net asset value, beginning of the period | $ | 20.65 | $ | 26.68 | $ | 33.25 | $ | 35.58 | $ | 32.31 | ||||||||||
|
| |||||||||||||||||||
INCOME (LOSS) FROM INVESTMENT OPERATIONS: | ||||||||||||||||||||
Net investment loss(a) | (0.10 | ) | (0.01 | ) | (0.04 | ) | (0.08 | ) | (0.04 | ) | ||||||||||
Net realized and unrealized gain (loss) | 10.88 | (3.73 | ) | (2.39 | ) | 2.00 | 6.07 | |||||||||||||
|
| |||||||||||||||||||
Total from Investment Operations | 10.78 | (3.74 | ) | (2.43 | ) | 1.92 | 6.03 | |||||||||||||
|
| |||||||||||||||||||
LESS DISTRIBUTIONS FROM: | ||||||||||||||||||||
Net realized capital gains | (1.99 | ) | (2.29 | ) | (4.14 | ) | (4.25 | ) | (2.76 | ) | ||||||||||
|
|
|
|
|
|
|
|
|
| |||||||||||
Net asset value, end of the period | $ | 29.44 | $ | 20.65 | $ | 26.68 | $ | 33.25 | $ | 35.58 | ||||||||||
|
| |||||||||||||||||||
Total return(b) | 54.29 | % | (15.74 | )% | (4.60 | )% | 5.68 | % | 19.10 | % | ||||||||||
RATIOS TO AVERAGE NET ASSETS: | ||||||||||||||||||||
Net assets, end of the period (000’s) | $ | 9,440 | $ | 7,662 | $ | 13,357 | $ | 24,530 | $ | 30,533 | ||||||||||
Net expenses(c) | 1.40 | % | 1.40 | % | 1.40 | % | 1.40 | % | 1.40 | % | ||||||||||
Gross expenses | 1.43 | % | 1.45 | % | 1.43 | % | 1.42 | % | 1.43 | % | ||||||||||
Net investment loss | (0.38 | )% | (0.03 | )% | (0.15 | )% | (0.24 | )% | (0.11 | )% | ||||||||||
Portfolio turnover rate | 23 | % | 23 | % | 24 | % | 19 | % | 25 | % | ||||||||||
| (a) | Per share net investment loss has been calculated using the average shares outstanding during the period. |
| (b) | Had certain expenses not been waived/reimbursed during the period, total returns would have been lower. |
| (c) | The investment adviser agreed to waive its fees and/or reimburse a portion of the Fund’s expenses during the period. Without this waiver/reimbursement, expenses would have been higher. |
See accompanying notes to financial statements.
| 30
Financial Highlights – continued
For a share outstanding throughout each period.
| Small Cap Value Fund – Class N | ||||||||||||||||||||
| Year Ended September 30, 2021 | Year Ended September 30, 2020 | Year Ended September 30, 2019 | Year Ended September 30, 2018 | Year Ended September 30, 2017 | ||||||||||||||||
Net asset value, beginning of the period | $ | 22.35 | $ | 28.68 | $ | 35.31 | $ | 37.41 | $ | 33.81 | ||||||||||
|
| |||||||||||||||||||
INCOME (LOSS) FROM INVESTMENT OPERATIONS: | ||||||||||||||||||||
Net investment income(a) | 0.05 | 0.13 | 0.12 | 0.12 | 0.15 | |||||||||||||||
Net realized and unrealized gain (loss) | 11.80 | (4.03 | ) | (2.50 | ) | 2.11 | 6.37 | |||||||||||||
|
| |||||||||||||||||||
Total from Investment Operations | 11.85 | (3.90 | ) | (2.38 | ) | 2.23 | 6.52 | |||||||||||||
|
| |||||||||||||||||||
LESS DISTRIBUTIONS FROM: | ||||||||||||||||||||
Net investment income | (0.14 | ) | (0.14 | ) | (0.11 | ) | (0.08 | ) | (0.16 | ) | ||||||||||
Net realized capital gains | (1.99 | ) | (2.29 | ) | (4.14 | ) | (4.25 | ) | (2.76 | ) | ||||||||||
|
| |||||||||||||||||||
Total Distributions | (2.13 | ) | (2.43 | ) | (4.25 | ) | (4.33 | ) | (2.92 | ) | ||||||||||
|
| |||||||||||||||||||
Net asset value, end of the period | $ | 32.07 | $ | 22.35 | $ | 28.68 | $ | 35.31 | $ | 37.41 | ||||||||||
|
| |||||||||||||||||||
Total return | 55.15 | % | (15.28 | )% | (4.07 | )% | 6.28 | % | 19.78 | % | ||||||||||
RATIOS TO AVERAGE NET ASSETS: | ||||||||||||||||||||
Net assets, end of the period (000’s) | $ | 112,310 | $ | 92,818 | $ | 141,821 | $ | 153,646 | $ | 136,162 | ||||||||||
Net expenses | 0.85 | % | 0.85 | % | 0.83 | % | 0.83 | % | 0.83 | % | ||||||||||
Gross expenses | 0.85 | % | 0.85 | % | 0.83 | % | 0.83 | % | 0.83 | % | ||||||||||
Net investment income | 0.17 | % | 0.53 | % | 0.43 | % | 0.33 | % | 0.44 | % | ||||||||||
Portfolio turnover rate | 23 | % | 23 | % | 24 | % | 19 | % | 25 | % | ||||||||||
| (a) | Per share net investment income has been calculated using the average shares outstanding during the period. |
| Small/Mid Cap Growth Fund – Institutional Class | ||||||||||||||||||||
| Year Ended September 30, 2021 | Year Ended September 30, 2020 | Year Ended September 30, 2019 | Year Ended September 30, 2018 | Year Ended September 30, 2017 | ||||||||||||||||
Net asset value, beginning of the period | $ | 11.81 | $ | 10.03 | $ | 15.49 | $ | 12.31 | $ | 9.73 | ||||||||||
|
|
|
|
|
|
|
|
|
| |||||||||||
INCOME (LOSS) FROM INVESTMENT OPERATIONS: | ||||||||||||||||||||
Net investment income (loss)(a) | (0.02 | )(b) | (0.04 | ) | (0.04 | ) | (0.05 | ) | 0.00 | (c) | ||||||||||
Net realized and unrealized gain (loss) | �� | 3.56 | 2.06 | (1.55 | )(d) | 3.23 | 2.60 | |||||||||||||
|
|
|
|
|
|
|
|
|
| |||||||||||
Total from Investment Operations | 3.54 | 2.02 | (1.59 | ) | 3.18 | 2.60 | ||||||||||||||
|
|
|
|
|
|
|
|
|
| |||||||||||
LESS DISTRIBUTIONS FROM: | ||||||||||||||||||||
Net investment income | — | — | — | — | (0.02 | ) | ||||||||||||||
Net realized capital gains | (0.10 | ) | (0.24 | ) | (3.87 | ) | — | — | ||||||||||||
|
|
|
|
|
|
|
|
|
| |||||||||||
Total Distributions | (0.10 | ) | (0.24 | ) | (3.87 | ) | — | (0.02 | ) | |||||||||||
|
|
|
|
|
|
|
|
|
| |||||||||||
Net asset value, end of the period | $ | 15.25 | $ | 11.81 | $ | 10.03 | $ | 15.49 | $ | 12.31 | ||||||||||
|
|
|
|
|
|
|
|
|
| |||||||||||
Total return(e) | 30.00 | %(b) | 20.38 | % | (3.27 | )% | 25.83 | % | 26.74 | % | ||||||||||
RATIOS TO AVERAGE NET ASSETS: | ||||||||||||||||||||
Net assets, end of the period (000’s) | $ | 70,526 | $ | 52,170 | $ | 34,312 | $ | 17,500 | $ | 14,592 | ||||||||||
Net expenses(f) | 0.84 | %(g) | 0.84 | % | 0.85 | % | 0.85 | % | 0.85 | % | ||||||||||
Gross expenses | 0.99 | % | 1.21 | % | 1.30 | % | 1.43 | % | 1.57 | % | ||||||||||
Net investment income (loss) | (0.14 | )%(b) | (0.34 | )% | (0.35 | )% | (0.35 | )% | 0.01 | % | ||||||||||
Portfolio turnover rate | 50 | % | 60 | % | 67 | % | 102 | %(h) | 49 | % | ||||||||||
| (a) | Per share net investment income (loss) has been calculated using the average shares outstanding during the period. |
| (b) | Includes a non-recurring dividend. Without this dividend, net investment loss per share would have been $(0.08), total return would have been 29.49% and the ratio of net investment loss to average net assets would have been (0.52%). |
| (c) | Amount rounds to less than $0.01. |
| (d) | The amount shown for a share outstanding does not correspond with the aggregate realized and unrealized gain (loss) on investments for the period due to the timing of sales and redemptions of fund shares in relation to fluctuating market values of investments of the Fund. |
| (e) | Had certain expenses not been waived/reimbursed during the period, total returns would have been lower. |
| (f) | The investment adviser agreed to waive its fees and/or reimburse a portion of the Fund’s expenses during the period. Without this waiver/reimbursement, expenses would have been higher. |
| (g) | Includes additional voluntary waiver of advisory fee of 0.01%. |
| (h) | The variation in the Fund’s turnover rate from 2017 to 2018 was primarily due to significant shareholder flows. |
See accompanying notes to financial statements.
31 |
Financial Highlights – continued
For a share outstanding throughout each period.
| Small/Mid Cap Growth Fund – Class N | ||||||||
| Year Ended September 30, 2021 | Period Ended September 30, 2020* | |||||||
Net asset value, beginning of the period | $ | 11.81 | $ | 9.89 | ||||
|
|
|
| |||||
INCOME (LOSS) FROM INVESTMENT OPERATIONS: | ||||||||
Net investment loss(a) | (0.01 | )(b) | (0.04 | ) | ||||
Net realized and unrealized gain (loss) | 3.56 | 2.20 | ||||||
|
|
|
| |||||
Total from Investment Operations | 3.55 | 2.16 | ||||||
|
|
|
| |||||
LESS DISTRIBUTIONS FROM: | ||||||||
Net realized capital gains | (0.10 | ) | (0.24 | ) | ||||
|
|
|
| |||||
Net asset value, end of the period | $ | 15.26 | $ | 11.81 | ||||
|
|
|
| |||||
Total return(c) | 30.08 | %(b) | 22.08 | %(d) | ||||
RATIOS TO AVERAGE NET ASSETS: | ||||||||
Net assets, end of the period (000’s) | $ | 9,260 | $ | 1 | ||||
Net expenses(e) | 0.83 | % | 0.83 | %(f) | ||||
Gross expenses | 1.00 | % | 107.49 | %(f) | ||||
Net investment loss | (0.08 | )%(b) | (0.34 | )%(f) | ||||
Portfolio turnover rate | 50 | % | 60 | %(g) | ||||
| * | Class operations commenced on October 1, 2019. |
| (a) | Per share net investment loss has been calculated using the average shares outstanding during the period. |
| (b) | Includes a non-recurring dividend. Without this dividend, net investment loss per share would have been $(0.07), total return would have been 29.66% and the ratio of net investment loss to average net assets would have been (0.50%). |
| (c) | Had certain expenses not been waived/reimbursed during the period, total returns would have been lower. |
| (d) | Periods less than one year are not annualized. |
| (e) | The investment adviser agreed to waive its fees and/or reimburse a portion of the Fund’s expenses during the period. Without this waiver/reimbursement, expenses would have been higher. |
| (f) | Computed on an annualized basis for periods less than one year. |
| (g) | Represents the Fund’s portfolio turnover rate for the year ended September 30, 2020. |
See accompanying notes to financial statements.
| 32
September 30, 2021
1. Organization. Loomis Sayles Funds I and Loomis Sayles Funds II (the “Trusts” and each a “Trust”) are each organized as a Massachusetts business trust. Each Trust is registered under the Investment Company Act of 1940, as amended (the “1940 Act”), as an open-end management investment company. Each Declaration of Trust permits the Board of Trustees to authorize the issuance of an unlimited number of shares of the Trust in multiple series. The financial statements for certain funds of the Trusts are presented in separate reports. The following funds (individually, a “Fund” and collectively, the “Funds”) are included in this report:
Loomis Sayles Funds I:
Loomis Sayles Small Cap Value Fund (the “Small Cap Value Fund”)
Loomis Sayles Funds II:
Loomis Sayles Small Cap Growth Fund (the “Small Cap Growth Fund”)
Loomis Sayles Small/Mid Cap Growth Fund (the “Small/Mid Cap Growth Fund”)
Each Fund is a diversified investment company.
Small Cap Growth Fund offers Institutional Class, Retail Class and Class N shares. Small Cap Value Fund offers Institutional Class, Retail Class, Admin Class and Class N shares. Small/Mid Cap Growth Fund offers Institutional Class and Class N shares.
Each share class is sold without a sales charge. Retail Class and Admin Class shares pay a Rule 12b-1 fee. Class N shares are offered with an initial minimum investment of $1,000,000. Institutional Class shares are intended for institutional investors with a minimum initial investment of $100,000. Certain categories of investors are exempted from the minimum investment amount for Class N and Institutional Class as outlined in the relevant Fund’s prospectus. Admin Class shares are offered exclusively through intermediaries.
Most expenses can be directly attributed to a Fund. Expenses which cannot be directly attributed to a Fund are generally apportioned based on the relative net assets of each of the Funds in Natixis Funds Trust I, Natixis Funds Trust II, Natixis Funds Trust IV and Gateway Trust (“Natixis Funds Trusts”), Loomis Sayles Funds I and Loomis Sayles Funds II (“Loomis Sayles Funds Trusts”), and Natixis ETF Trust and Natixis ETF Trust II (“Natixis ETF Trusts”). Expenses of a Fund are borne pro rata by the holders of each class of shares, except that each class bears expenses unique to that class (such as the Rule 12b-1 fees applicable to Retail Class and Admin Class), and transfer agent fees are borne collectively for Institutional Class, Retail Class and Admin Class, and individually for Class N. In addition, each class votes as a class only with respect to its own Rule 12b-1 Plan. Shares of each class would receive their pro rata share of the net assets of a Fund if the Fund were liquidated. The Trustees approve separate distributions from net investment income on each class of shares.
2. Significant Accounting Policies. The following is a summary of significant accounting policies consistently followed by each Fund in the preparation of its financial statements. The Funds’ financial statements follow the accounting and reporting guidelines provided for investment companies and are prepared in accordance with accounting principles generally accepted in the United States of America which require the use of management estimates that affect the reported amounts and disclosures in the financial statements. Actual results could differ from those estimates. Management has evaluated the events and transactions subsequent to year-end through the date the financial statements were issued and has determined that there were no material events that would require disclosure in the Funds’ financial statements.
a. Valuation. Fund securities and other investments are valued at market value based on market quotations obtained or determined by independent pricing services recommended by the adviser and approved by the Board of Trustees. Fund securities and other investments for which market quotations are not readily available are valued at fair value as determined in good faith by the adviser pursuant to procedures approved by the Board of Trustees, as described below. Market value is determined as follows:
Listed equity securities (including shares of closed-end investment companies and exchange-traded funds) are valued at the last sale price quoted on the exchange where they are traded most extensively or, if there is no reported sale during the day, the closing bid quotation as reported by an independent pricing service. Securities traded on the NASDAQ Global Select Market, NASDAQ Global Market and NASDAQ Capital Market are valued at the NASDAQ Official Closing Price (“NOCP”), or if lacking an NOCP, at the most recent bid quotations on the applicable NASDAQ Market. Unlisted equity securities (except unlisted preferred equity securities) are valued at the last sale price quoted in the market where they are traded most extensively or, if there is no reported sale during the day, the closing bid quotation as reported by an independent pricing service. If there is no last sale price or closing bid quotation available, unlisted equity securities will be valued using evaluated bids furnished by an independent pricing service, if available. In some foreign markets, an official close price and a last sale price may be available from the foreign exchange or market. In those cases, the official close price is used. Debt securities and unlisted preferred equity securities are valued based on evaluated bids furnished to the Funds by an independent pricing service or bid prices obtained from broker-dealers. Broker-dealer bid prices may be used to value debt and unlisted equity securities where an independent pricing service is unable to price a security or where an independent pricing service does not provide a reliable price for the security.
Fund securities and other investments for which market quotations are not readily available are valued at fair value as determined in good faith by the adviser pursuant to procedures approved by the Board of Trustees. The Funds may also value securities and other investments at fair value in other circumstances such as when extraordinary events occur after the close of a foreign market but prior to the close of the New York
33 |
Notes to Financial Statements – continued
September 30, 2021
Stock Exchange. This may include situations relating to a single issuer (such as a declaration of bankruptcy or a delisting of the issuer’s security from the primary market on which it has traded) as well as events affecting the securities markets in general (such as market disruptions or closings and significant fluctuations in U.S. and/or foreign markets). When fair valuing its securities or other investments, the Funds may, among other things, use modeling tools or other processes that may take into account factors such as securities or other market activity and/or significant events that occur after the close of the foreign market and before the time the Fund’s net asset value (“NAV”) is calculated. Fair value pricing may require subjective determinations about the value of a security, and fair values used to determine a Fund’s NAV may differ from quoted or published prices, or from prices that are used by others, for the same securities. In addition, the use of fair value pricing may not always result in adjustments to the prices of securities held by a Fund.
b. Investment Transactions and Related Investment Income. Investment transactions are accounted for on a trade date plus one day basis for daily NAV calculation. However, for financial reporting purposes, investment transactions are reported on trade date. Dividend income (including income reinvested) and foreign withholding tax, if applicable, is recorded on the ex-dividend date, or in the case of certain foreign securities, as soon as a Fund is notified, and interest income is recorded on an accrual basis. Interest income is increased by the accretion of discount and decreased by the amortization of premium, if applicable. Distributions received from investments in securities that represent a return of capital or capital gain are recorded as a reduction of cost of investments or as a realized gain, respectively. The calendar year-end amounts of ordinary income, capital gains and return of capital included in distributions received from the Funds’ investments in real estate investment trusts (“REITs”) are reported to the Funds after the end of the fiscal year; accordingly, the Funds estimate these amounts for accounting purposes until the characterization of REIT distributions is reported to the Funds after the end of the fiscal year. Estimates are based on the most recent REIT distribution information available. In determining net gain or loss on securities sold, the cost of securities has been determined on an identified cost basis. Investment income, non-class specific expenses and realized and unrealized gains and losses are allocated on a pro rata basis to each class based on the relative net assets of each class to the total net assets of the Fund.
c. Foreign Currency Translation. The books and records of the Funds are maintained in U.S. dollars. The values of securities, currencies and other assets and liabilities denominated in currencies other than U.S. dollars, if any, are translated into U.S. dollars based upon foreign exchange rates prevailing at the end of the period. Purchases and sales of investment securities, income and expenses are translated into U.S. dollars on the respective dates of such transactions.
Net realized foreign exchange gains or losses arise from sales of foreign currency, changes in exchange rates between the trade and settlement dates on securities transactions and the difference between the amounts of dividends, interest and foreign withholding taxes recorded on the Funds’ books and the U.S. dollar equivalent of the amounts actually received or paid. Net unrealized foreign exchange gains or losses arise from changes in the value of assets and liabilities, other than investment securities, as of the end of the fiscal period, resulting from changes in exchange rates.
The values of investment securities are presented at the foreign exchange rates prevailing at the end of the period for financial reporting purposes. Net realized and unrealized gains or losses on investments reported in the Statements of Operations reflect gains or losses resulting from changes in exchange rates and fluctuations which arise due to changes in market prices of investment securities.
The Funds may use foreign currency exchange contracts to facilitate transactions in foreign-denominated investments. Losses may arise from changes in the value of the foreign currency or if the counterparties do not perform under the contracts’ terms.
d. Federal and Foreign Income Taxes. The Trusts treat each Fund as a separate entity for federal income tax purposes. Each Fund intends to meet the requirements of the Internal Revenue Code of 1986, as amended, applicable to regulated investment companies, and to distribute to its shareholders substantially all of its net investment income and any net realized capital gains at least annually. Management has performed an analysis of each Fund’s tax positions for the open tax years as of September 30, 2021 and has concluded that no provisions for income tax are required. The Funds’ federal tax returns for the prior three fiscal years remain subject to examination by the Internal Revenue Service. Management is not aware of any events that are reasonably possible to occur in the next twelve months that would result in the amounts of any unrecognized tax benefits significantly increasing or decreasing for the Funds. However, management’s conclusions regarding tax positions taken may be subject to review and adjustment at a later date based on factors including, but not limited to, new tax laws and accounting regulations and interpretations thereof.
A Fund may be subject to foreign withholding taxes on investment income and taxes on capital gains on investments that are accrued and paid based upon the Fund’s understanding of the tax rules and regulations that exist in the countries in which the Fund invests. Foreign withholding taxes on dividend and interest income are reflected on the Statements of Operations as a reduction of investment income, net of amounts that have been or are expected to be reclaimed and paid. Dividends and interest receivable on the Statements of Assets and Liabilities are net of foreign withholding taxes. Foreign withholding taxes where reclaims have been or are expected to be filed and paid are reflected on the Statements of Assets and Liabilities as tax reclaims receivable. Capital gains taxes paid are included in net realized gain (loss) on investments in the Statements of Operations. Accrued but unpaid capital gains taxes are reflected as foreign taxes payable on the Statements of Assets and Liabilities, if applicable, and reduce unrealized gains on investments. In the event that realized gains on investments are subsequently offset by realized losses, taxes paid on realized gains may be returned to a Fund. Such amounts, if applicable, are reflected as foreign tax rebates receivable on the Statements of Assets and Liabilities and are recorded as a realized gain when received.
| 34
Notes to Financial Statements – continued
September 30, 2021
e. Dividends and Distributions to Shareholders. Dividends and distributions are recorded on the ex-dividend date. The timing and characterization of certain income and capital gain distributions are determined in accordance with federal tax regulations, which may differ from accounting principles generally accepted in the United States of America. Permanent differences are primarily due to differing treatments for book and tax purposes of items such as return of capital distributions received, distribution re-designations, capital gain distributions received and net operating losses. Permanent book and tax basis differences relating to shareholder distributions will result in reclassifications to capital accounts reported on the Statements of Assets and Liabilities. Temporary differences between book and tax distributable earnings are primarily due to return of capital distributions received, deferred Trustees’ fees and wash sales. Amounts of income and capital gain available to be distributed on a tax basis are determined annually, and at other times during the Funds’ fiscal year as may be necessary to avoid knowingly declaring and paying a return of capital distribution. Distributions from net investment income and short-term capital gains are reported as distributed from ordinary income for tax purposes.
The tax characterization of distributions is determined on an annual basis. The tax character of distributions paid to shareholders during the years ended September 30, 2021 and 2020 was as follows:
| 2021 Distributions | 2020 Distributions | |||||||||||||||||||||||
Fund | Ordinary Income | Long-Term Capital Gains | Total | Ordinary Income | Long-Term Capital Gains | Total | ||||||||||||||||||
Small Cap Growth Fund | $ | — | $ | 49,164,080 | $ | 49,164,080 | $ | — | $ | 150,841,195 | $ | 150,841,195 | ||||||||||||
Small Cap Value Fund | 2,422,269 | 40,732,461 | 43,154,730 | 2,526,541 | 55,082,819 | 57,609,360 | ||||||||||||||||||
Small/Mid Cap Growth Fund | — | 508,774 | 508,774 | — | 817,114 | 817,114 | ||||||||||||||||||
Distributions paid to shareholders from net investment income and net realized capital gains, based on accounting principles generally accepted in the United States of America, are consolidated and reported on the Statements of Changes in Net Assets as Distributions to Shareholders. Distributions paid to shareholders from net investment income and net realized capital gains expressed in per-share amounts, based on accounting principles generally accepted in the United States of America, are separately stated and reported within the Financial Highlights.
As of September 30, 2021, the components of distributable earnings on a tax basis were as follows:
| Small Cap Growth Fund | Small Cap Value Fund | Small/Mid Cap Growth Fund | ||||||||||
Undistributed ordinary income | $ | 14,122,150 | $ | 7,392,623 | $ | — | ||||||
Undistributed long-term capital gains | 483,888,077 | 87,266,175 | 8,186,206 | |||||||||
|
|
|
|
|
| |||||||
Total undistributed earnings | 498,010,227 | 94,658,798 | 8,186,206 | |||||||||
|
|
|
|
|
| |||||||
Unrealized appreciation | 758,558,080 | 205,761,791 | 18,609,222 | |||||||||
|
|
|
|
|
| |||||||
Total accumulated earnings | $ | 1,256,568,307 | $ | 300,420,589 | $ | 26,795,428 | ||||||
|
|
|
|
|
| |||||||
As of September 30, 2021, the tax cost of investments and unrealized appreciation (depreciation) on a federal tax basis were as follows:
| Small Cap Growth Fund | Small Cap Value Fund | Small/Mid Cap Growth Fund | ||||||||||
Federal tax cost | $ | 2,140,816,145 | $ | 386,590,634 | $ | 61,325,774 | ||||||
|
|
|
|
|
| |||||||
Gross tax appreciation | $ | 817,562,809 | $ | 212,799,813 | $ | 19,861,470 | ||||||
Gross tax depreciation | (59,004,729 | ) | (7,038,022 | ) | (1,252,248 | ) | ||||||
|
|
|
|
|
| |||||||
Net tax appreciation | $ | 758,558,080 | $ | 205,761,791 | $ | 18,609,222 | ||||||
|
|
|
|
|
| |||||||
f. Repurchase Agreements. Each Fund may enter into repurchase agreements, under the terms of a Master Repurchase Agreement, under which each Fund acquires securities as collateral and agrees to resell the securities at an agreed upon time and at an agreed upon price. It is each Fund’s policy that the market value of the collateral for repurchase agreements be at least equal to 102% of the repurchase price, including interest. Certain repurchase agreements are tri-party arrangements whereby the collateral is held in a segregated account for the benefit of the Fund and on behalf of the counterparty. Repurchase agreements could involve certain risks in the event of default or insolvency of the counterparty, including possible delays or restrictions upon a Fund’s ability to dispose of the underlying securities. As of September 30, 2021, each Fund, as applicable, had investments in repurchase agreements for which the value of the related collateral exceeded the value of the repurchase agreement. The gross value of repurchase agreements is included in the Statements of Assets and Liabilities for financial reporting purposes.
35 |
Notes to Financial Statements – continued
September 30, 2021
g. Securities Lending. Small Cap Growth Fund and Small Cap Value Fund have entered into an agreement with State Street Bank and Trust Company (“State Street Bank”), as agent of the Funds, to lend securities to certain designated borrowers. The loans are collateralized with cash or securities in an amount equal to at least 105% or 102% of the market value (including accrued interest) of the loaned international or domestic securities, respectively, when the loan is initiated. Thereafter, the value of the collateral must remain at least 102% of the market value (including accrued interest) of loaned securities for U.S. equities and U.S. corporate debt; at least 105% of the market value (including accrued interest) of loaned securities for non-U.S. equities; and at least 100% of the market value (including accrued interest) of loaned securities for U.S. Government securities, sovereign debt issued by non-U.S. Governments and non-U.S. corporate debt. In the event that the market value of the collateral falls below the required percentages described above, the borrower will deliver additional collateral on the next business day. As with other extensions of credit, the Funds may bear the risk of loss with respect to the investment of the collateral. The Funds invest cash collateral in short-term investments, a portion of the income from which is remitted to the borrowers and the remainder allocated between the Funds and State Street Bank as lending agent.
For the year ended September 30, 2021, neither Fund had loaned securities under this agreement.
h. Indemnifications. Under the Trusts’ organizational documents, their officers and Trustees are indemnified against certain liabilities arising out of the performance of their duties to the Funds. Additionally, in the normal course of business, the Funds enter into contracts with service providers that contain general indemnification clauses. The Funds’ maximum exposure under these arrangements is unknown as this would involve future claims that may be made against the Funds that have not yet occurred. However, based on experience, the Funds expect the risk of loss to be remote.
3. Fair Value Measurements. In accordance with accounting standards related to fair value measurements and disclosures, the Funds have categorized the inputs utilized in determining the value of each Fund’s assets or liabilities. These inputs are summarized in the three broad levels listed below:
| • | Level 1—quoted prices in active markets for identical assets or liabilities; |
| • | Level 2—prices determined using other significant inputs that are observable either directly, or indirectly through corroboration with observable market data (which could include quoted prices for similar assets or liabilities, interest rates, credit risk, etc.); and |
| • | Level 3—prices determined using significant unobservable inputs when quoted prices or observable inputs are unavailable such as when there is little or no market activity for an asset or liability (unobservable inputs reflect each Fund’s own assumptions in determining the fair value of assets or liabilities and would be based on the best information available). |
The inputs or methodology used for valuing securities are not necessarily an indication of the risk associated with investing in those securities.
The following is a summary of the inputs used to value the Funds’ investments as of September 30, 2021, at value:
Small Cap Growth Fund
Asset Valuation Inputs
Description | Level 1 | Level 2 | Level 3 | Total | ||||||||||||
Common Stocks(a) | $ | 2,788,616,988 | $ | — | $ | — | $ | 2,788,616,988 | ||||||||
Short-Term Investments | — | 110,757,237 | — | 110,757,237 | ||||||||||||
|
|
|
|
|
|
|
| |||||||||
Total | $ | 2,788,616,988 | $ | 110,757,237 | $ | — | $ | 2,899,374,225 | ||||||||
|
|
|
|
|
|
|
| |||||||||
(a) Details of the major categories of the Fund’s investments are reflected within the Portfolio of Investments.
Small Cap Value Fund
Asset Valuation Inputs
Description | Level 1 | Level 2 | Level 3 | Total | ||||||||||||
Common Stocks(a) | $ | 581,143,754 | $ | — | $ | — | $ | 581,143,754 | ||||||||
Other Investments(a) | — | (b) | — | — | — | |||||||||||
Short-Term Investments | — | 11,208,671 | — | 11,208,671 | ||||||||||||
|
|
|
|
|
|
|
| |||||||||
Total | $ | 581,143,754 | $ | 11,208,671 | $ | — | $ | 592,352,425 | ||||||||
|
|
|
|
|
|
|
| |||||||||
(a) Details of the major categories of the Fund’s investments are reflected within the Portfolio of Investments.
(b) Includes a security valued at zero.
| 36
Notes to Financial Statements – continued
September 30, 2021
Small/Mid Cap Growth Fund
Asset Valuation Inputs
Description | Level 1 | Level 2 | Level 3 | Total | ||||||||||||
Common Stocks(a) | $ | 77,365,804 | $ | — | $ | — | $ | 77,365,804 | ||||||||
Short-Term Investments | — | 2,569,192 | — | 2,569,192 | ||||||||||||
|
|
|
|
|
|
|
| |||||||||
Total | $ | 77,365,804 | $ | 2,569,192 | $ | — | $ | 79,934,996 | ||||||||
|
|
|
|
|
|
|
| |||||||||
(a) Details of the major categories of the Fund’s investments are reflected within the Portfolio of Investments.
4. Purchases and Sales of Securities. For the year ended September 30, 2021, purchases and sales of securities (excluding short-term investments) were as follows:
Fund | Purchases | Sales | ||||||
Small Cap Growth Fund | $ | 1,418,938,557 | $ | 1,418,379,258 | ||||
Small Cap Value Fund | 130,375,644 | 265,564,331 | ||||||
Small/Mid Cap Growth Fund | 45,519,968 | 36,183,222 | ||||||
5. Management Fees and Other Transactions with Affiliates.
a. Management Fees. Loomis, Sayles & Company, L.P. (“Loomis Sayles”) serves as investment adviser to each Fund. Loomis Sayles is a limited partnership whose sole general partner, Loomis, Sayles & Company, Inc., is indirectly owned by Natixis Investment Managers, LLC, which is part of Natixis Investment Managers, an international asset management group based in Paris, France.
Under the terms of the management agreements, each Fund pays a management fee at the following annual rates, calculated daily and payable monthly, based on each Fund’s average daily net assets:
Fund | Percentage of Average Daily Net Assets | |||
Small Cap Growth Fund | 0.75% | |||
Small Cap Value Fund | 0.75% | |||
Small/Mid Cap Growth Fund | 0.75% | |||
Loomis Sayles has given binding undertakings to the Funds to waive management fees and/or reimburse certain expenses to limit the Funds’ operating expenses, exclusive of acquired fund fees and expenses, brokerage expenses, interest expense, taxes, organizational and extraordinary expenses such as litigation and indemnification expenses. These undertakings are in effect until January 31, 2022, may be terminated before then only with the consent of the Funds’ Board of Trustees and are reevaluated on an annual basis. Management fees payable, as reflected on the Statements of Assets and Liabilities, is net of waivers and/or expense reimbursements, if any, pursuant to these undertakings. Waivers/ reimbursements that exceed management fees payable are reflected on the Statements of Assets and Liabilities as receivable from investment adviser.
For the year ended September 30, 2021, the expense limits as a percentage of average daily net assets under the expense limitation agreements were as follows:
| Expense Limit as a Percentage of Average Daily Net Assets | ||||||||||||||||
Fund | Institutional Class | Retail Class | Admin Class | Class N | ||||||||||||
Small Cap Growth Fund | 1.00% | 1.25% | — | 0.95% | ||||||||||||
Small Cap Value Fund | 0.90% | 1.15% | 1.40% | 0.85% | ||||||||||||
Small/Mid Cap Growth Fund | 0.85% | — | — | 0.83% | ||||||||||||
Loomis Sayles shall be permitted to recover expenses borne under the expense limitation agreements (whether through waiver of management fees or otherwise) on a class by class basis in later periods to the extent the annual operating expenses of a class fall below both (1) a class’ expense limitation ratio in place at the time such amounts were waived/reimbursed and (2) a class’ current applicable expense limitation ratio, provided, however, that a class is not obligated to pay such waived/reimbursed fees or expenses more than one year after the end of the fiscal year in which the fees or expenses were waived/reimbursed.
37 |
Notes to Financial Statements – continued
September 30, 2021
For the year ended September 30, 2021, the management fees for each Fund were as follows:
Fund | Gross Management Fees | Contractual Waivers of Management Fees1 | Voluntary Waivers of Management Fees2 | Net Management Fees | Percentage of Average Daily Net Assets | |||||||||||||||||||
| Gross | Net | |||||||||||||||||||||||
Small Cap Growth Fund | $ | 21,669,026 | $ | — | $ | — | $ | 21,669,026 | 0.75 | % | 0.75 | % | ||||||||||||
Small Cap Value Fund | 4,483,393 | — | — | 4,483,393 | 0.75 | % | 0.75 | % | ||||||||||||||||
Small/Mid Cap Growth Fund | 569,723 | 111,300 | 9,895 | 448,528 | 0.75 | % | 0.59 | % | ||||||||||||||||
For the year ended September 30, 2021, class-specific expenses have been reimbursed as follows:
| Reimbursement1 | ||||||||||||||||||||
Fund | Institutional Class | Retail Class | Admin Class | Class N | Total | |||||||||||||||
Small Cap Value Fund | $ | 131,922 | $ | 34,175 | $ | 3,241 | $ | — | $ | 169,338 | ||||||||||
1 Waiver/expense reimbursements are subject to possible recovery until September 30, 2022.
2 In order to ensure that the total annual fund operating expenses after fee waiver and/or expense reimbursement do not exceed limitations, the Adviser may voluntarily waive additional advisory fees for the Small/Mid Cap Growth Fund. Voluntary management fee waivers are not subject to recovery under the expense limitation agreement described above.
For the year ended September 30, 2021, expense reimbursements related to the prior fiscal year were recovered as follows:
Fund | Recovered Expenses | |||
Small Cap Value Fund | $ | 1,568 | ||
b. Service and Distribution Fees. Natixis Distribution, LLC (“Natixis Distribution”), which is a wholly-owned subsidiary of Natixis Investment Managers, LLC, has entered into a distribution agreement with the Trusts. Pursuant to this agreement, Natixis Distribution serves as principal underwriter of the Funds of the Trusts.
Pursuant to Rule 12b-1 under the 1940 Act, Small Cap Growth Fund and Small Cap Value Fund have adopted a Distribution Plan relating to each Fund’s Retail Class shares (the “Retail Class Plans”) and Small Cap Value Fund has adopted a Distribution Plan relating to its Admin Class shares (the “Admin Class Plan”).
Under the Retail Class Plans, each Fund pays Natixis Distribution a monthly distribution fee at an annual rate not to exceed 0.25% of the average daily net assets attributable to the Fund’s Retail Class shares, as compensation for services provided by Natixis Distribution in connection with the marketing or sale of Retail Class shares or for payments made by Natixis Distribution to securities dealers or other financial intermediaries as commissions, asset-based sales charges or other compensation with respect to the sale of Retail Class shares, or for providing personal services to investors and/or the maintenance of shareholder accounts.
Under the Admin Class Plan, Small Cap Value Fund pays Natixis Distribution a monthly distribution fee at an annual rate not to exceed 0.25% of the average daily net assets attributable to the Fund’s Admin Class shares, as compensation for services provided by Natixis Distribution in connection with the marketing or sale of Admin Class shares or for payments made by Natixis Distribution to securities dealers or other financial intermediaries as commissions, asset-based sales charges or other compensation with respect to the sale of Admin Class shares, or for providing personal services to investors and/or the maintenance of shareholder accounts.
In addition, the Admin Class shares of Small Cap Value Fund may pay Natixis Distribution an administrative service fee, at an annual rate not to exceed 0.25% of the average daily net assets attributable to Admin Class shares. These fees are subsequently paid to securities dealers or financial intermediaries for providing personal services and/or account maintenance for their customers who hold such shares.
For the year ended September 30, 2021, the service and distribution fees for each Fund were as follows:
| Service Fees | Distribution Fees | |||||||||||
Fund | Admin Class | Retail Class | Admin Class | |||||||||
Small Cap Growth Fund | $ | — | $ | 286,313 | $ | — | ||||||
Small Cap Value Fund | 23,186 | 243,962 | 23,186 | |||||||||
c. Administrative Fees. Natixis Advisors, LLC (“Natixis Advisors”) provides certain administrative services for the Funds and contracts with State Street Bank to serve as sub-administrator. Natixis Advisors is a wholly-owned subsidiary of Natixis Investment Managers, LLC. Pursuant to an agreement among Natixis Funds Trusts, Loomis Sayles Funds Trusts, Natixis ETF Trusts and Natixis Advisors, each Fund pays Natixis Advisors monthly its pro rata portion of fees equal to an annual rate of 0.0540% of the first $15 billion of the average daily net assets of the Natixis Funds Trusts, Loomis Sayles Funds Trusts and Natixis ETF Trusts, 0.0500% of the next $15 billion, 0.0400% of the next $30 billion, 0.0275% of the next $30 billion and 0.0225% of such assets in excess of $90 billion, subject to an annual aggregate minimum fee for the Natixis Funds Trusts, Loomis Sayles Funds Trusts and Natixis ETF Trusts of $10 million, which is reevaluated on an annual basis.
| 38
Notes to Financial Statements – continued
September 30, 2021
For the year ended September 30, 2021, the administrative fees for each Fund were as follows:
Fund | Administrative Fees | |||
Small Cap Growth Fund | $ | 1,236,240 | ||
Small Cap Value Fund | 255,823 | |||
Small/Mid Cap Growth Fund | 32,493 | |||
d. Sub-Transfer Agent Fees. Natixis Distribution has entered into agreements, which include servicing agreements, with financial intermediaries that provide recordkeeping, processing, shareholder communications and other services to customers of the intermediaries that hold positions in the Funds and has agreed to compensate the intermediaries for providing those services. Intermediaries transact with the Funds primarily through the use of omnibus accounts on behalf of their customers who hold positions in the Funds. These services would have been provided by the Funds’ transfer agent and other service providers if the shareholders’ accounts were maintained directly at the Funds’ transfer agent. Accordingly, the Funds have agreed to reimburse Natixis Distribution for all or a portion of the servicing fees paid to these intermediaries. The reimbursement amounts (sub-transfer agent fees) paid to Natixis Distribution are subject to a current per-account equivalent fee limit approved by the Funds’ Board of Trustees, which is based on fees for similar services paid to the Funds’ transfer agent and other service providers. Class N shares do not bear such expenses.
For the year ended September 30, 2021, the sub-transfer agent fees (which are reflected in transfer agent fees and expenses in the Statements of Operations) for each Fund were as follows:
Fund | Sub-Transfer Agent Fees | |||
Small Cap Growth Fund | $ | 1,430,850 | ||
Small Cap Value Fund | 400,517 | |||
Small/Mid Cap Growth Fund | 871 | |||
As of September 30, 2021, the Funds owe Natixis Distribution the following reimbursements for sub-transfer agent fees (which are reflected in the Statements of Assets and Liabilities as payable to distributor):
Fund | Reimbursements of Sub-Transfer Agent Fees | |||
Small Cap Growth Fund | $ | 17,801 | ||
Small Cap Value Fund | 4,972 | |||
Small/Mid Cap Growth Fund | 23 | |||
Sub-transfer agent fees attributable to Institutional Class, Retail Class and Admin Class are allocated on a pro rata basis to each class based on the relative net assets of each class to the total net assets of those classes.
e. Trustees Fees and Expenses. The Trusts do not pay any compensation directly to their officers or Trustees who are directors, officers or employees of Natixis Advisors, Natixis Distribution, Natixis Investment Managers, LLC or their affiliates. The Chairperson of the Board of Trustees receives a retainer fee at the annual rate of $369,000. The Chairperson does not receive any meeting attendance fees for Board of Trustees meetings or committee meetings that he attends. Each Independent Trustee (other than the Chairperson) receives, in the aggregate, a retainer fee at the annual rate of $199,000. Each Independent Trustee also receives a meeting attendance fee of $10,000 for each meeting of the Board of Trustees that he or she attends in person and $5,000 for each meeting of the Board of Trustees that he or she attends telephonically. In addition, the chairperson of the Contract Review Committee, the chairperson of the Audit Committee and the chairperson of the Governance Committee each receive an additional retainer fee at the annual rate of $20,000. Each Contract Review Committee member is compensated $6,000 for each Committee meeting that he or she attends in person and $3,000 for each meeting that he or she attends telephonically. Each Audit Committee member is compensated $6,000 for each Committee meeting that he or she attends in person and $3,000 for each meeting that he or she attends telephonically. These fees are allocated among the funds in the Natixis Funds Trusts, Loomis Sayles Funds Trusts and Natixis ETF Trusts based on a formula that takes into account, among other factors, the relative net assets of each fund. Trustees are reimbursed for travel expenses in connection with attendance at meetings.
A deferred compensation plan (the “Plan”) is available to the Trustees on a voluntary basis. Deferred amounts remain in the Funds until distributed in accordance with the provisions of the Plan. The value of a participating Trustee’s deferral account is based on theoretical investments of deferred amounts, on the normal payment dates, in certain funds of the Natixis Funds Trusts, Loomis Sayles Funds Trusts and Natixis ETF Trusts as designated by the participating Trustees. Changes in the value of participants’ deferral accounts are allocated pro rata among the funds in the Natixis Funds Trusts, Loomis Sayles Funds Trusts and Natixis ETF Trusts, and are normally reflected as Trustees’ fees and expenses in the Statements of Operations. The portions of the accrued obligations allocated to the Funds under the Plan are reflected as Deferred Trustees’ fees in the Statements of Assets and Liabilities.
39 |
Notes to Financial Statements – continued
September 30, 2021
Certain officers and employees of Natixis Advisors and Loomis Sayles are also officers and/or Trustees of the Trusts.
f. Affiliated Ownership. As of September 30, 2021, Loomis Sayles Funded Pension Plan and Trust (“Pension Plan”), Loomis Sayles Employees’ Profit Sharing Retirement Plan (“Retirement Plan”) and Loomis Sayles non-qualified retirement plans held shares of the Funds representing the following percentages of the Funds’ net assets:
Fund | Pension Plan | Retirement Plan | Non-Qualified Retirement Plans | Total Affiliated Ownership | ||||||||||||
Small Cap Growth Fund | 0.06% | 1.09% | — | 1.15% | ||||||||||||
Small Cap Value Fund | 0.27% | 5.17% | 5.95% | 11.39% | ||||||||||||
Investment activities of affiliated shareholders could have material impacts on the Funds.
g. Reimbursement of Transfer Agent Fees and Expenses. Natixis Advisors has given a binding contractual undertaking to Small/Mid Cap Growth Fund to reimburse any and all transfer agency expenses for the Fund’s Class N shares. This undertaking is in effect through January 31, 2022 and is not subject to recovery under the expense limitation agreement described above.
For the year ended September 30, 2021, Natixis Advisors reimbursed Small/Mid Cap Growth Fund $1,027 for transfer agency expenses related to Class N shares.
6. Class-Specific Transfer Agent Fees and Expenses. Transfer agent fees and expenses attributable to Institutional Class, Retail Class and Admin Class are allocated on a pro rata basis to each class based on the relative net assets of each class to the total net assets of those classes. Transfer agent fees and expenses attributable to Class N are allocated to Class N.
For the year ended September 30, 2021, the Funds incurred the following class-specific transfer agent fees and expenses (including sub-transfer agent fees, where applicable):
| Transfer Agent Fees and Expenses | ||||||||||||||||
Fund | Institutional Class | Retail Class | Admin Class | Class N | ||||||||||||
Small Cap Growth Fund | $ | 1,336,755 | $ | 116,880 | $ | — | $ | 8,780 | ||||||||
Small Cap Value Fund | 330,090 | 86,123 | 8,179 | 1,769 | ||||||||||||
Small/Mid Cap Growth Fund | 3,622 | — | — | 1,027 | ||||||||||||
7. Line of Credit. Each Fund, together with certain other funds of Natixis Funds Trusts, Loomis Sayles Funds Trusts and Natixis ETF Trusts, entered into a $500,000,000 committed unsecured line of credit provided by State Street Bank. Any one Fund may borrow up to $350,000,000 under the line of credit agreement (as long as all borrowings by all Funds in the aggregate do not exceed the $500,000,000 limit at any time), subject to each Fund’s investment restrictions and its contractual obligations under the line of credit. Interest is charged to the Funds based upon the terms set forth in the agreement. In addition, a commitment fee of 0.15% per annum, payable at the end of each calendar quarter, is accrued and apportioned among the participating funds based on their average daily unused portion of the line of credit. The Funds paid an arrangement fee, an upfront fee, and certain other legal fees in connection with the line of credit agreement, which are being amortized over a period of 364 days and are reflected in legal fees and/or miscellaneous expenses on the Statements of Operations. The unamortized balance is reflected as prepaid expenses on the Statements of Assets and Liabilities.
Prior to April 8, 2021, each Fund, together with certain other funds of Natixis Funds Trusts, Loomis Sayles Funds Trusts and Natixis ETF Trusts, entered into a $400,000,000 committed unsecured line of credit provided by State Street Bank. Any one Fund may borrow up to $350,000,000 under the line of credit agreement (as long as all borrowings by all Funds in the aggregate do not exceed the $400,000,000 limit at any time), subject to each Fund’s investment restrictions and its contractual obligations under the line of credit.
For the year ended September 30, 2021, none of the Funds had borrowings under this agreement.
8. Concentration of Ownership. From time to time, a Fund may have a concentration of one or more accounts constituting a significant percentage of shares outstanding. Investment activities by holders of such accounts could have material impacts on the Funds. As of September 30, 2021, based on management’s evaluation of the shareholder account base, the Funds had accounts representing controlling ownership of more than 5% of the Fund’s total outstanding shares. The number of such accounts, based on accounts that represent more than 5% of an individual class of shares, and the aggregate percentage of net assets represented by such holdings were as follows:
Fund | Number of 5% Non-Affiliated Account Holders | Percentage of Non-Affiliated Ownership | Percentage of Affiliated Ownership Ownership (Note 5f) | Total Percentage of Ownership | ||||||||||
Small Cap Value Fund | 1 | 12.37% | 11.39% | 23.76% | ||||||||||
Small/Mid Cap Growth Fund | 5 | 81.19% | — | 81.19% | ||||||||||
| 40
Notes to Financial Statements – continued
September 30, 2021
Omnibus shareholder accounts for which Natixis Advisors understands that the intermediary has discretion over the underlying shareholder accounts or investment models where a shareholder account may be invested for a non-discretionary customer are included in the table above. For other omnibus accounts, the Funds do not have information on the individual shareholder accounts underlying the omnibus accounts; therefore, there could be other 5% shareholders in addition to those disclosed in the table above.
9. Risk. Global markets have experienced periods of high volatility triggered by the Covid-19 pandemic. The impact of this pandemic and any other epidemic or pandemic that may arise in the future could adversely affect the economies of many nations or the entire global economy and the financial performance of individual issuers, sectors, industries, asset classes, and markets in significant and unforeseen ways. Such effects could impair the Funds’ ability to maintain operational standards, disrupt the operations of the Funds’ service providers, adversely affect the value and liquidity of the Funds’ investments and negatively impact the Funds’ performance.
10. Capital Shares. Each Fund may issue an unlimited number of shares of beneficial interest, without par value. Transactions in capital shares were as follows:
| Small Cap Growth Fund | ||||||||||||||||
| Year Ended September 30, 2021 | Year Ended September 30, 2020 | |||||||||||||||
| Institutional Class | Shares | Amount | Shares | Amount | ||||||||||||
Issued from the sale of shares | 9,135,230 | $ | 323,499,208 | 13,167,719 | $ | 318,448,815 | ||||||||||
Issued in connection with the reinvestment of distributions | 603,506 | 21,484,823 | 2,907,753 | 77,404,396 | ||||||||||||
Redeemed | (10,600,777 | ) | (379,032,001 | ) | (14,223,727 | ) | (360,653,006 | ) | ||||||||
|
|
|
|
|
|
|
| |||||||||
Net change | (862,041 | ) | $ | (34,047,970 | ) | 1,851,745 | $ | 35,200,205 | ||||||||
|
|
|
|
|
|
|
| |||||||||
| Retail Class | ||||||||||||||||
Issued from the sale of shares | 559,662 | $ | 17,611,050 | 912,597 | $ | 20,495,084 | ||||||||||
Issued in connection with the reinvestment of distributions | 71,504 | 2,286,695 | 379,550 | 9,116,785 | ||||||||||||
Redeemed | (1,253,848 | ) | (39,965,014 | ) | (1,459,375 | ) | (33,506,278 | ) | ||||||||
|
|
|
|
|
|
|
| |||||||||
Net change | (622,682 | ) | $ | (20,067,269 | ) | (167,228 | ) | $ | (3,894,409 | ) | ||||||
|
|
|
|
|
|
|
| |||||||||
| Class N | ||||||||||||||||
Issued from the sale of shares | 12,972,678 | $ | 459,829,686 | 17,628,357 | $ | 452,596,699 | ||||||||||
Issued in connection with the reinvestment of distributions | 666,169 | 23,982,068 | 2,249,879 | 60,476,756 | ||||||||||||
Redeemed | (10,783,445 | ) | (393,611,081 | ) | (6,620,566 | ) | (169,949,416 | ) | ||||||||
|
|
|
|
|
|
|
| |||||||||
Net change | 2,855,402 | $ | 90,200,673 | 13,257,670 | $ | 343,124,039 | ||||||||||
|
|
|
|
|
|
|
| |||||||||
Increase from capital share transactions | 1,370,679 | $ | 36,085,434 | 14,942,187 | $ | 374,429,835 | ||||||||||
|
|
|
|
|
|
|
| |||||||||
41 |
Notes to Financial Statements – continued
September 30, 2021
10. Capital Shares – continued
| Small Cap Value Fund | ||||||||||||||||
| Year Ended September 30, 2021 | Year Ended September 30, 2020 | |||||||||||||||
| Institutional Class | Shares | Amount | Shares | Amount | ||||||||||||
Issued from the sale of shares | 2,185,029 | $ | 65,327,936 | 3,070,880 | $ | 72,483,944 | ||||||||||
Issued in connection with the reinvestment of distributions | 969,486 | 25,449,017 | 1,187,726 | 33,101,927 | ||||||||||||
Redeemed | (4,539,392 | ) | (134,099,821 | ) | (6,171,314 | ) | (143,712,872 | ) | ||||||||
|
|
|
|
|
|
|
| |||||||||
Net change | (1,384,877 | ) | $ | (43,322,868 | ) | (1,912,708 | ) | $ | (38,127,001 | ) | ||||||
|
|
|
|
|
|
|
| |||||||||
| Retail Class | ||||||||||||||||
Issued from the sale of shares | 272,038 | $ | 7,899,117 | 209,646 | $ | 4,830,652 | ||||||||||
Issued in connection with the reinvestment of distributions | 280,859 | 7,220,881 | 385,444 | 10,541,881 | ||||||||||||
Redeemed | (1,417,269 | ) | (40,836,991 | ) | (1,576,219 | ) | (38,194,968 | ) | ||||||||
|
|
|
|
|
|
|
| |||||||||
Net change | (864,372 | ) | $ | (25,716,993 | ) | (981,129 | ) | $ | (22,822,435 | ) | ||||||
|
|
|
|
|
|
|
| |||||||||
| Admin Class | ||||||||||||||||
Issued from the sale of shares | 23,426 | $ | 655,054 | 89,240 | $ | 2,047,167 | ||||||||||
Issued in connection with the reinvestment of distributions | 27,530 | 666,234 | 33,393 | 863,879 | ||||||||||||
Redeemed | (101,301 | ) | (2,619,066 | ) | (252,153 | ) | (5,146,329 | ) | ||||||||
|
|
|
|
|
|
|
| |||||||||
Net change | (50,345 | ) | $ | (1,297,778 | ) | (129,520 | ) | $ | (2,235,283 | ) | ||||||
|
|
|
|
|
|
|
| |||||||||
| Class N | ||||||||||||||||
Issued from the sale of shares | 710,243 | $ | 21,428,894 | 606,779 | $ | 14,233,156 | ||||||||||
Issued in connection with the reinvestment of distributions | 325,820 | 8,552,785 | 396,172 | 11,045,289 | ||||||||||||
Redeemed | (1,686,418 | ) | (51,194,452 | ) | (1,794,608 | ) | (44,897,333 | ) | ||||||||
|
|
|
|
|
|
|
| |||||||||
Net change | (650,355 | ) | $ | (21,212,773 | ) | (791,657 | ) | $ | (19,618,888 | ) | ||||||
|
|
|
|
|
|
|
| |||||||||
Decrease from capital share transactions | (2,949,949 | ) | $ | (91,550,412 | ) | (3,815,014 | ) | $ | (82,803,607 | ) | ||||||
|
|
|
|
|
|
|
| |||||||||
| Small/Mid Cap Growth Fund | ||||||||||||||||
| Year Ended September 30, 2021 | Year Ended September 30, 2020(a) | |||||||||||||||
| Institutional Class | Shares | Amount | Shares | Amount | ||||||||||||
Issued from the sale of shares | 770,533 | $ | 10,719,355 | 2,299,458 | $ | 24,306,399 | ||||||||||
Issued in connection with the reinvestment of distributions | 31,883 | 450,185 | 74,958 | 787,810 | ||||||||||||
Redeemed | (596,871 | ) | (8,728,075 | ) | (844,906 | ) | (8,799,784 | ) | ||||||||
Redeemed in-kind (Note 11) | — | — | (532,341 | ) | (5,600,230 | ) | ||||||||||
|
|
|
|
|
|
|
| |||||||||
Net change | 205,545 | $ | 2,441,465 | 997,169 | $ | 10,694,195 | ||||||||||
|
|
|
|
|
|
|
| |||||||||
| Class N | ||||||||||||||||
Issued from the sale of shares | 673,195 | �� | $ | 8,900,000 | 101 | $ | 1,000 | |||||||||
Issued in connection with the reinvestment of distributions | 4,146 | 58,589 | 2 | 24 | ||||||||||||
Redeemed | (70,671 | ) | (1,000,000 | ) | — | — | ||||||||||
|
|
|
|
|
|
|
| |||||||||
Net change | 606,670 | $ | 7,958,589 | 103 | $ | 1,024 | ||||||||||
|
|
|
|
|
|
|
| |||||||||
Increase from capital share transactions | 812,215 | $ | 10,400,054 | 997,272 | $ | 10,695,219 | ||||||||||
|
|
|
|
|
|
|
| |||||||||
(a) From commencement of operations on October 1, 2019 for Class N shares.
11. Redemption In-Kind. In certain circumstances, a Fund may distribute portfolio securities rather than cash as payment for redemption of Fund shares (redemption in-kind). For financial reporting purposes, the Fund will recognize a gain on in-kind redemptions to the extent the value of the distributed securities on the date of redemption exceeds the cost of those securities; the Fund will recognize a loss if the cost exceeds value. Gains and losses realized on redemptions in-kind are not recognized for tax purposes, and are re-classified from realized gain (loss) to paid-in-capital. For the year ended September 30, 2020, Small/Mid Cap Growth Fund participated in a redemption in-kind transaction.
| 42
Report of Independent Registered Public Accounting Firm
To the Board of Trustees of Loomis Sayles Funds I and Loomis Sayles Funds II and Shareholders of Loomis Sayles Small Cap Value Fund, Loomis Sayles Small Cap Growth Fund and Loomis Sayles Small/Mid Cap Growth Fund:
Opinions on the Financial Statements
We have audited the accompanying statements of assets and liabilities, including the portfolios of investments, of Loomis Sayles Small Cap Value Fund (one of the funds constituting Loomis Sayles Funds I), and Loomis Sayles Small Cap Growth Fund and Loomis Sayles Small/Mid Cap Growth Fund (two of the funds constituting Loomis Sayles Funds II) (hereafter collectively referred to as the “Funds”) as of September 30, 2021, the related statements of operations for the year ended September 30, 2021, the statements of changes in net assets for each of the two years in the period ended September 30, 2021, including the related notes, and the financial highlights for each of the periods indicated therein (collectively referred to as the “financial statements”). In our opinion, the financial statements present fairly, in all material respects, the financial position of each of the Funds as of September 30, 2021, the results of each of their operations for the year then ended, the changes in each of their net assets for each of the two years in the period ended September 30, 2021 and each of the financial highlights for each of the periods indicated therein in conformity with accounting principles generally accepted in the United States of America.
Basis for Opinions
These financial statements are the responsibility of the Funds’ management. Our responsibility is to express an opinion on the Funds’ financial statements based on our audits. We are a public accounting firm registered with the Public Company Accounting Oversight Board (United States) (PCAOB) and are required to be independent with respect to the Funds in accordance with the U.S. federal securities laws and the applicable rules and regulations of the Securities and Exchange Commission and the PCAOB.
We conducted our audits of these financial statements in accordance with the standards of the PCAOB. Those standards require that we plan and perform the audit to obtain reasonable assurance about whether the financial statements are free of material misstatement, whether due to error or fraud.
Our audits included performing procedures to assess the risks of material misstatement of the financial statements, whether due to error or fraud, and performing procedures that respond to those risks. Such procedures included examining, on a test basis, evidence regarding the amounts and disclosures in the financial statements. Our audits also included evaluating the accounting principles used and significant estimates made by management, as well as evaluating the overall presentation of the financial statements. Our procedures included confirmation of securities owned as of September 30, 2021 by correspondence with the custodian, transfer agent and brokers; when replies were not received from brokers, we performed other auditing procedures. We believe that our audits provide a reasonable basis for our opinions.
/s/PricewaterhouseCoopers LLP
Boston, Massachusetts
November 22, 2021
We have served as the auditor of one or more investment companies in the Natixis Investment Company Complex since at least 1995. We have not determined the specific year we began serving as auditor.
43 |
2021 U.S. Tax Distribution Information to Shareholders (Unaudited)
Corporate Dividends Received Deduction. For the fiscal year ended September 30, 2021, a percentage of dividends distributed by the Fund listed below qualifies for the dividends received deduction for corporate shareholders. This percentage is as follows:
Fund | Qualifying Percentage | |||
Small Cap Value Fund | 89.61% | |||
Capital Gains Distributions. Pursuant to Internal Revenue Section 852(b), the following Funds paid distributions, which have been designated as capital gains distributions for the fiscal year ended September 30, 2021, unless subsequently determined to be different.
Fund | Amount | |||
Small Cap Growth Fund | $ | 49,164,080 | ||
Small Cap Value Fund | 40,732,461 | |||
Small/Mid Cap Growth Fund | 508,774 | |||
Qualified Dividend Income. For the fiscal year ended September 30, 2021, the Funds below will designate up to the maximum amount allowable pursuant to the Internal Revenue Code as qualified dividend income eligible for reduced tax rates. These lower rates range from 0% to 20% depending on an individual’s tax bracket. If the Funds pay a distribution during calendar year 2021, complete information will be reported in conjunction with Form 1099-DIV.
Fund |
Small Cap Value Fund |
| 44
Trustee and Officer Information
The tables below provide certain information regarding the trustees and officers of Loomis Sayles Funds I and Loomis Sayles Funds II (the “Trusts”). Unless otherwise indicated, the address of all persons below is 888 Boylston Street, Suite 800, Boston, MA 02199-8197. The Funds’ Statement of Additional Information includes additional information about the trustees of the Trusts and is available by calling Loomis Sayles Funds at 800-633-3330.
| Name and Year of Birth | Position(s) Term of Office1 | Principal Occupation(s) During Past 5 Years | Number of Portfolios in and Other Directorships | Experience, Qualifications, Attributes, Skills for Board Membership | ||||
Independent Trustees | ||||||||
| Edmond J. English (1953) | Trustee since 2013 Chairperson of the Governance Committee and Contract Review Committee Member | Executive Chairman of Bob’s Discount Furniture (retail) | 54 Director, Burlington Stores, Inc. (retail) | Significant experience on the Board and on the boards of other business organizations (including retail companies and a bank); executive experience (including at a retail company) | ||||
Richard A. Goglia (1951) | Trustee since 2015 Contract Review Committee Member and Governance Committee Member | Retired | 54 Director of Triumph Group (aerospace industry) | Significant experience on the Board and executive experience (including his role as vice president and treasurer of a defense company and experience at a financial services company) | ||||
Wendell J. Knox (1948) | Trustee since 2009 Chairperson of the Contract Review Committee | Retired | 54 Director, Abt Associates Inc. (research and consulting); Director, The Hanover Insurance Group (property and casualty insurance); formerly, Director, Eastern Bank (bank) | Significant experience on the Board and on the boards of other business organizations (including at a bank and at a property and casualty insurance firm); executive experience (including roles as president and chief executive officer of a research and consulting company) | ||||
| Martin T. Meehan (1956) | Trustee since 2012 Audit Committee Member and Governance Committee Member | President, University of Massachusetts | 54 None | Significant experience on the Board and on the boards of other business organizations; experience as President of the University of Massachusetts; government experience (including as a member of the U.S. House of Representatives); academic experience | ||||
45 |
| Name and Year of Birth | Position(s) Term of Office1 | Principal Occupation(s) During Past 5 Years | Number of Portfolios in and Other Directorships | Experience, Qualifications, Attributes, Skills for Board Membership | ||||
Maureen B. Mitchell (1951) | Trustee since 2017 Audit Committee Member and Governance Committee Member | Retired | 54 Director, Sterling Bancorp (bank) | Experience on the Board; financial services industry and executive experience (including role as president of global sales and marketing at a financial services company) | ||||
James P. Palermo (1955) | Trustee since 2016 Audit Committee Member | Founding Partner, Breton Capital Management, LLC (private equity); Partner, STEP Partners, LLC (private equity) | 54 Director, FutureFuel.io (chemicals and biofuels) | Significant experience on the Board; financial services industry and executive experience (including roles as chief executive officer of client management and asset servicing for a banking and financial services company) | ||||
Erik R. Sirri (1958) | Chairperson of the Board of Trustees since January 2021 Trustee since 2009 Ex Officio member of the Audit Committee, Contract Review Committee and Governance Committee | Professor of Finance at Babson College | 54 None | Significant experience on the Board; experience as Director of the Division of Trading and Markets at the Securities and Exchange Commission; academic experience; training as an economist | ||||
Peter J. Smail (1952) | Trustee since 2009 Audit Committee Member | Retired | 54 None | Significant experience on the Board; mutual fund industry and executive experience (including roles as president and chief executive officer for an investment adviser) | ||||
Kirk A. Sykes (1958) | Trustee since 2019 Contract Review Committee Member and Governance Committee Member | Managing Director of Accordia Partners, LLC (real estate development); President of Primary Corporation (real estate development); Managing Principal of Merrick Capital Partners (infrastructure finance); formerly, President of Urban Strategy America Fund (real estate fund manager) | 54 Trustee, Eastern Bank (bank); Director, Apartment Investment and Management Company (real estate investment trust); formerly, Director, Ares Commercial Real Estate Corporation (real estate investment trust) | Experience on the Board and significant experience on the boards of other business organizations (including real estate companies and banks) | ||||
Cynthia L. Walker (1956) | Trustee since 2005 Chairperson of the Audit Committee | Retired; formerly, Deputy Dean for Finance and Administration, Yale University School of Medicine | 54 None | Significant experience on the Board; executive experience in a variety of academic organizations (including roles as dean for finance and administration) | ||||
| 46
| Name and Year of Birth | Position(s) Term of Office1 | Principal Occupation(s) During Past 5 Years | Number of Portfolios in and Other Directorships | Experience, Qualifications, Attributes, Skills for Board Membership | ||||
Interested Trustees | ||||||||
Kevin P. Charleston3 (1965) One Financial Center Boston, MA 02111 | Trustee since 2015 President and Chief Executive Officer of Loomis Sayles Funds I since 2015 | President, Chief Executive Officer and Chairman of the Board of Directors, Loomis, Sayles & Company, L.P. | 54 None | Significant experience on the Board; continuing service as President, Chief Executive Officer and Chairman of the Board of Directors of Loomis, Sayles & Company, L.P. | ||||
| David L. Giunta4 (1965) | Trustee since 2011 President of Loomis Sayles Funds II and Executive Vice President of Loomis Sayles Funds I since 2008; Chief Executive Officer of Loomis Sayles Funds II since 2015 | President and Chief Executive Officer, Natixis Advisors, LLC and Natixis Distribution, LLC | 54 None | Significant experience on the Board; experience as President and Chief Executive Officer of Natixis Advisors, LLC and Natixis Distribution, LLC | ||||
| 1 | Each trustee serves until retirement, resignation or removal from the Board. The current retirement age is 75. The position of Chairperson of the Board is appointed for a three-year term. |
| 2 | The trustees of the Trusts serve as trustees of a fund complex that includes all series of the Natixis Funds Trust I, Natixis Funds Trust II, Natixis Funds Trust IV, Gateway Trust, Loomis Sayles Funds I, Loomis Sayles Funds II, Natixis ETF Trust and Natixis ETF Trust II (collectively, the “Fund Complex”). |
| 3 | Mr. Charleston is deemed an “interested person” of the Trusts because he holds the following positions with an affiliated person of the Trusts: President, Chief Executive Officer and Chairman of the Board of Directors of Loomis, Sayles & Company, L.P. |
| 4 | Mr. Giunta is deemed an “interested person” of the Trusts because he holds the following positions with an affiliated person of the Trusts: President and Chief Executive Officer, Natixis Advisors, LLC and Natixis Distribution, LLC. |
| Name and Year of Birth | Position(s) Held with the Trusts | Term of Office1 and Length of Time Served | Principal Occupation(s) During Past 5 Years2 | |||
Officers of the Trusts | ||||||
Michael C. Kardok (1959) | Treasurer, Principal Financial and Accounting Officer | Since 2004 | Senior Vice President, Natixis Advisors, LLC and Natixis Distribution, LLC | |||
Natalie R. Wagner (1979) | Chief Compliance Officer, Assistant Secretary and Anti-Money Laundering Officer | Since May 2021 | Formerly, Vice President, Head of Corporate Compliance, Global Atlantic Financial Group | |||
| Chief Legal Officer | Since July 2021 | |||||
| 1 | Each officer of the Trusts serves for an indefinite term in accordance with the Trusts’ current by-laws until the date his or her successor is elected and qualified, or until he or she sooner dies, retires, is removed or becomes disqualified. |
| 2 | Each person listed above, except as noted, holds the same position(s) with the Fund Complex. Previous positions during the past five years with Natixis Distribution, LLC, Natixis Advisors, LLC or Loomis, Sayles & Company, L.P. are omitted, if not materially different from an officer’s current position with such entity. |
47 |
(b) Not Applicable.
Item 2. Code of Ethics.
The Registrant has adopted a code of ethics that applies to the Registrant’s principal executive officer, principal financial officer and persons performing similar functions. There have been no amendments or waivers of the Registrant’s code of ethics during the period.
Item 3. Audit Committee Financial Expert.
The Board of Trustees of the Registrant has established an audit committee. Mr. Martin T. Meehan, Ms. Maureen Mitchell, Mr. James Palermo, Mr. Peter Smail, and Ms. Cynthia L. Walker are members of the audit committee and have been designated as “audit committee financial experts” by the Board of Trustees. Each of these individuals is also an Independent Trustee of the Registrant.
Item 4. Principal Accountant Fees and Services.
Fees billed by the Principal Accountant for services rendered to the Registrant.
The table below sets forth fees billed by the principal accountant, PricewaterhouseCoopers LLP, for the past two fiscal years for professional services rendered in connection with a) the audit of the Registrant’s annual financial statements and services provided in connection with regulatory filings; b) audit-related services (including services that are reasonably related to the performance of the audit of the Registrant’s financial statements but not reported under “Audit Fees”); c) tax compliance, tax advice and tax planning and d) all other fees billed for professional services rendered by the principal accountant to the Registrant, other than the services reported as a part of (a) through (c) of this Item.
| Audit fees | Audit-related fees1 | Tax fees2 | All other fees | |||||||||||||||||||||||||||||
| 10/1/19- 9/30/20 | 10/1/20- 9/30/21 | 10/1/19- 9/30/20 | 10/1/20- 9/30/21 | 10/1/19- 9/30/20 | 10/1/20- 9/30/21 | 10/1/19- 9/30/20 | 10/1/20- 9/30/21 | |||||||||||||||||||||||||
Loomis Sayles Funds II | $ | 268,648 | $ | 253,570 | $ | 3,920 | $ | 3,828 | $ | 46,726 | $ | 81,725 | $ | — | $ | — | ||||||||||||||||
| 1. | Audit-related fees consist of: |
2020 & 2021 – performance of agreed-upon procedures related to the Registrant’s deferred compensation plan.
| 2. | Tax fees consist of: |
2020 & 2021 – review of Registrant’s tax returns
2021 - filings with the French tax authorities to reclaim taxes withheld on dividend income received from French resident companies
Aggregate fees billed to the Registrant for non-audit services during 2020 and 2021 were $50,646 and $85,553, respectively.
Fees billed by the Principal Accountant for services rendered to the Adviser and Control Affiliates.
The following table sets forth the fees billed by the Registrant’s principal accountant for non-audit services rendered to Loomis, Sayles & Company, L.P. and entities controlling, controlled by or under common control with Loomis, Sayles & Company, L.P. Registrant (“Control Affiliates”) that provide ongoing services to the Registrant, for engagements that related directly to the operations and financial reporting of the Registrant for the last two fiscal years.
| Audit-related fees | Tax fees | All other fees | ||||||||||||||||||||||
| 10/1/19-9/30/20 | 10/1/20-9/30/21 | 10/1/19-9/30/20 | 10/1/20-9/30/21 | 10/1/19-9/30/20 | 10/1/20-9/30/21 | |||||||||||||||||||
Control Affiliates | $ | — | $ | — | $ | — | $ | — | $ | — | $ | — | ||||||||||||
The following table sets forth the aggregate fees billed by the Registrant’s principal accountant for non-audit services rendered to Loomis, Sayles & Company, L.P. and Control Affiliates that provide ongoing services to the Registrant, for the last two fiscal years, including the fees disclosed in the table above.
| Aggregate Non-Audit Fees | ||||
| 10/1/19-9/30/20 | 10/1/20-9/30/21 | |||
Control Affiliates | $1,646 | $972 | ||
None of the services described above were approved pursuant to (c)(7)(i)(C) of Regulation S-X.
Audit Committee Pre Approval Policies.
Annually, the Registrant’s Audit Committee reviews the audit, audit-related, tax and other non-audit services together with the projected fees, for services proposed to be rendered to the Registrant and/or other entities for which pre-approval is required during the upcoming year. Any subsequent revisions to already pre-approved services or fees (including fee increases) and requests for pre-approval of new services would be presented for consideration quarterly as needed. If, in the opinion of management, a proposed engagement by the Registrant’s independent accountants needs to commence before the next regularly scheduled Audit Committee meeting, any member of the Audit Committee who is an independent Board member is authorized to pre-approve the engagement, but only for engagements to provide audit, audit related and tax services. This approval is subject to review of the full Audit Committee at its next quarterly meeting. All other engagements require the approval of all the members of the Audit Committee.
Item 5. Audit Committee of Listed Registrants.
Not applicable.
Item 6. Schedule of Investments.
Included as part of the Report to Shareholders filed as Item 1 herewith.
Item 7. Disclosure of Proxy Voting Policies and Procedures for Closed-End Management Investment Companies.
Not applicable.
Item 8. Portfolio Managers of Closed-End Management Investment Companies
Not applicable.
Item 9. Purchases of Equity Securities by Closed-End Management Investment Companies and Affiliated Purchasers.
Not applicable.
Item 10. Submission of Matters to a Vote of Securities Holders.
There were no material changes to the procedures by which shareholders may recommend nominees to the Registrant’s Board of Trustees.
Item 11. Controls and Procedures.
The Registrant’s principal executive officer and principal financial officer have concluded that the Registrant’s disclosure controls and procedures are sufficient to ensure that information required to be disclosed by the Registrant in this Form N-CSR was recorded, processed, summarized and reported within the time periods specified in the Securities and Exchange Commission’s rules and forms, based upon such officers’ evaluation of these controls and procedures as of a date within 90 days of the filing date of the report.
There were no changes in the Registrant’s internal control over financial reporting that occurred during the period covered by the report that have materially affected, or is reasonably likely to materially affect, the Registrant’s internal control over financial reporting.
Item 12. Disclosure of Securities Lending Activities for Closed-End Management Investment Companies.
Not applicable.
Item 13. Exhibits.
SIGNATURES
Pursuant to the requirements of the Securities Exchange Act of 1934 and the Investment Company Act of 1940, the Registrant has duly caused this report to be signed on its behalf by the undersigned, thereunto duly authorized.
| Loomis Sayles Funds II | ||
| By: | /s/ David L. Giunta | |
| Name: | David L. Giunta | |
| Title: | President and Chief Executive Officer | |
| Date: | November 22, 2021 | |
Pursuant to the requirements of the Securities Exchange Act of 1934 and the Investment Company Act of 1940, this report has been signed by the following persons on behalf of the Registrant and in the capacities and on the dates indicated.
| By: | /s/ David L. Giunta | |
| Name: | David L. Giunta | |
| Title: | President and Chief Executive Officer | |
| Date: | November 22, 2021 | |
| By: | /s/ Michael C. Kardok | |
| Name: | Michael C. Kardok | |
| Title: | Treasurer and Principal Financial and | |
| Accounting Officer | ||
| Date: | November 22, 2021 | |