UNITED STATES
SECURITIES AND EXCHANGE COMMISSION
Washington, D.C. 20549
FORM N-CSR
CERTIFIED SHAREHOLDER REPORT OF REGISTERED
MANAGEMENT INVESTMENT COMPANIES
| Investment Company Act file number | 811-06247 | |||||
| AMERICAN CENTURY WORLD MUTUAL FUNDS, INC. | ||||||
| (Exact name of registrant as specified in charter) | ||||||
| 4500 MAIN STREET, KANSAS CITY, MISSOURI | 64111 | |||||
| (Address of principal executive offices) | (Zip Code) | |||||
CHARLES A. ETHERINGTON 4500 MAIN STREET, KANSAS CITY, MISSOURI 64111 | ||||||
| (Name and address of agent for service) | ||||||
| Registrant’s telephone number, including area code: | 816-531-5575 | |||||
| Date of fiscal year end: | 11-30 | |||||
| Date of reporting period: | 11-30-2015 | |||||
ITEM 1. REPORTS TO STOCKHOLDERS.
| ANNUAL REPORT | NOVEMBER 30, 2015 |


Emerging Markets Fund
| Table of Contents |
| President’s Letter | 2 | |
| Performance | 3 | |
| Portfolio Commentary | ||
| Fund Characteristics | ||
| Shareholder Fee Example | ||
| Schedule of Investments | ||
| Statement of Assets and Liabilities | ||
| Statement of Operations | ||
| Statement of Changes in Net Assets | ||
| Notes to Financial Statements | ||
| Financial Highlights | ||
| Report of Independent Registered Public Accounting Firm | ||
| Management | ||
| Approval of Management Agreement | ||
| Additional Information | ||
Any opinions expressed in this report reflect those of the author as of the date of the report, and do not necessarily represent the opinions of American Century Investments® or any other person in the American Century Investments organization. Any such opinions are subject to change at any time based upon market or other conditions and American Century Investments disclaims any responsibility to update such opinions. These opinions may not be relied upon as investment advice and, because investment decisions made by American Century Investments funds are based on numerous factors, may not be relied upon as an indication of trading intent on behalf of any American Century Investments fund. Security examples are used for representational purposes only and are not intended as recommendations to purchase or sell securities. Performance information for comparative indices and securities is provided to American Century Investments by third party vendors. To the best of American Century Investments’ knowledge, such information is accurate at the time of printing.
| President’s Letter |
 | Dear Investor: Thank you for reviewing this annual report for the 12 months ended November 30, 2015. It provides investment performance and portfolio information for the reporting period, plus longer-term historical performance data. Annual reports remain important vehicles for conveying information about fund performance, including market and economic factors that affected returns during the reporting period. For additional, updated investment and market insights, we encourage you to visit our website, americancentury.com. |
| Jonathan Thomas | |
Divergence in Economic Growth and Monetary Policies, Combined With China Turmoil, Triggered Market Volatility
Divergence between the U.S. and the rest of the world—along with China’s struggles, plunging commodity prices, capital market volatility, and risk-off trading—were dominant themes during the reporting period. Global divergence described not only the relatively stronger economic growth enjoyed by the U.S. compared with most of the world, but also the related contrast between the U.S. Federal Reserve’s (the Fed’s) unwinding of monetary stimulus versus the continuation and expansion of stimulus by other major central banks.
In 2014, the Fed ended its latest massive bond-buying program (quantitative easing, QE), leading to expectations that interest rates would soar in 2015. But while QE was halted in the U.S., other major central banks were starting or increasing QE as their economies faltered, particularly the European Central Bank, the Bank of Japan, and the People’s Bank of China. This monetary policy divergence helped fuel increased demand for the U.S. dollar and U.S. dollar-denominated assets, and put downward pressure on commodity prices, most notably crude oil, which declined approximately 40% for the reporting period. Low inflation also prevailed after oil prices plunged amid a supply glut and muted demand for commodities in general, especially as China’s economy slowed. In this environment, the U.S. dollar, U.S. growth stocks, and U.S. municipal bonds generally benefited from “flight to quality” capital flows, while emerging market and commodity-related investments suffered significant declines.
We expect continued economic and monetary policy divergence between the U.S. and non-U.S. economies in 2016, accompanied by further market volatility. This could present both challenges and opportunities for active investment managers. In this environment, we continue to believe in a disciplined, diversified, long-term investment approach, using professionally managed stock and bond portfolios to meet financial goals. We appreciate your continued trust in us in the coming year.
Sincerely,

Jonathan Thomas
President and Chief Executive Officer
American Century Investments
2
| Performance |
| Total Returns as of November 30, 2015 | ||||||
Average Annual Returns | ||||||
Ticker Symbol | 1 year | 5 years | 10 years | Since Inception | Inception Date | |
Investor Class | TWMIX | -9.93%(1) | -0.71%(1) | 4.79%(1) | 5.76%(1) | 9/30/97 |
| MSCI Emerging Markets Index | — | -16.99% | -3.05% | 4.44% | N/A(2) | — |
| Institutional Class | AMKIX | -9.83%(1) | -0.52%(1) | 4.99%(1) | 8.91%(1) | 1/28/99 |
A Class(3) | AEMMX | 5/12/99 | ||||
| No sales charge* | -10.11%(1) | -0.93%(1) | 4.55%(1) | 6.85%(1) | ||
| With sales charge* | -15.28%(1) | -2.09%(1) | 3.94%(1) | 6.47%(1) | ||
| C Class | ACECX | -10.67%(1) | -1.68%(1) | 3.76%(1) | 7.52%(1) | 12/18/01 |
| R Class | AEMRX | -10.43%(1) | -1.22%(1) | — | -3.67%(1) | 9/28/07 |
| R6 Class | AEDMX | -9.58%(1) | — | — | -0.29%(1) | 7/26/13 |
* Sales charges include initial sales charges and contingent deferred sales charges (CDSCs), as applicable. A Class shares have a 5.75% maximum initial sales charge and may be subject to a maximum CDSC of 1.00%. C Class shares redeemed within 12 months of purchase are subject to a maximum CDSC of 1.00%. The SEC requires that mutual funds provide performance information net of maximum sales charges in all cases where charges could be applied.
| (1) | Returns would have been lower if a portion of the management fee had not been waived. |
| (2) | Benchmark data first available Janaury 2001. |
| (3) | Prior to September 4, 2007, the A Class was referred to as the Advisor Class and did not have a front-end sales charge. Performance prior to that date has been adjusted to reflect this charge. |
Data presented reflect past performance. Past performance is no guarantee of future results. Current performance may be higher or lower than the performance shown. Investment return and principal value will fluctuate, and redemption value may be more or less than original cost. Data assumes reinvestment of dividends and capital gains, and none of the charts reflect the deduction of taxes that a shareholder would pay on fund distributions or the redemption of fund shares. To obtain performance data current to the most recent month end, please call 1-800-345-2021 or visit americancentury.com. For additional information about the fund, please consult the prospectus.
3
| Growth of $10,000 Over 10 Years |
| $10,000 investment made November 30, 2005 |
| Performance for other share classes will vary due to differences in fee structure. |
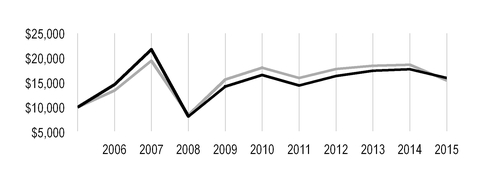
| Value on November 30, 2015 | |
| Investor Class — $15,964* | |
| MSCI Emerging Markets Index — $15,449 | |
*Ending value would have been lower if a portion of the management fee had not been waived.
Total Annual Fund Operating Expenses | |||||
Investor Class | Institutional Class | A Class | C Class | R Class | R6 Class |
| 1.70% | 1.50% | 1.95% | 2.70% | 2.20% | 1.35% |
The total annual fund operating expenses shown is as stated in the fund’s prospectus current as of the date of this report. The prospectus may vary from the expense ratio shown elsewhere in this report because it is based on a different time period, includes acquired fund fees and expenses, and, if applicable, does not include fee waivers or expense reimbursements.
Data presented reflect past performance. Past performance is no guarantee of future results. Current performance may be higher or lower than the performance shown. Investment return and principal value will fluctuate, and redemption value may be more or less than original cost. Data assumes reinvestment of dividends and capital gains, and none of the charts reflect the deduction of taxes that a shareholder would pay on fund distributions or the redemption of fund shares. To obtain performance data current to the most recent month end, please call 1-800-345-2021 or visit americancentury.com. For additional information about the fund, please consult the prospectus.
4
| Portfolio Commentary |
Portfolio Managers: Patricia Ribeiro and Anthony Han
Performance Summary
Emerging Markets declined -9.93%* for the 12 months ended November 30, 2015. The portfolio’s benchmark, the MSCI Emerging Markets Index, declined -16.99% for the same period.
Emerging markets stocks faced significant pressures during the 12-month period. Early on, emerging markets stocks generally advanced, despite ongoing concerns about slowing global growth, declining commodities prices, and a rallying U.S. dollar. Strong performance from China’s stock market largely offset weaker results from Latin America and drove the broad emerging markets benchmark higher. Although China faced lower growth forecasts and subdued economic data, various stimulus measures, including rate cuts, reforms, and liquidity efforts aimed at stabilizing China’s decelerating economy, fueled the broad market gains.
But those positive influences quickly faded as renewed concerns about growth, commodities prices, a strong U.S. dollar, and a potential rate hike from the U.S. Federal Reserve (Fed) worried investors. Evidence emerged that China’s economy was cooling more than previously believed, and in response the People’s Bank of China unexpectedly devalued the nation’s currency, raising uncertainty about China’s central bank policy and fueling a broad sell-off in the global equity markets. Oil and commodities prices dropped to new lows, due in part to falling demand from China. Anxiety about U.S. interest rate policy remained a key theme, persisting even after the Fed decided in September 2015 to leave rates unchanged due to concerns about the state of the global economy. Emerging markets stocks rallied in October as China’s central bank cut interest rates for the sixth time in 12 months, but manufacturing in China fell to a three-year low in November and emerging markets stocks ended the period on a negative note.
The fund outperformed its benchmark during the period, primarily due to stock selection in the consumer discretionary, financials, and energy sectors. An overweight position relative to the benchmark in the consumer discretionary sector and underweight positions in financials and energy also contributed to the fund’s outperformance. Regionally, stock selection in China, Taiwan, and South Africa and an overweight position in China also helped.
Automobile Parts Company was a Top Contributor
Within the top-performing consumer discretionary sector, the automobile components industry was a leading contributor. A portfolio-only position in Hota Industrial Manufacturing, a Taiwan-based automotive transmission system parts manufacturer, was a top contributor. The company experienced strong growth from clients, including Tesla, and reported historically high sales in May 2015. Accumulated January-May sales were up 25% year over year. Analysts responded by revising earnings forecasts higher to incorporate better-than-expected sales and margin outlooks.
In addition, a portfolio-only position in Ctrip.com International, a China-based online travel agency, was a main contributor to performance. After making aggressive investments in 2014, the company reported strong, consensus-beating revenues in early 2015, driven by air revenues and a strong rebound in package tour revenues. As the industry leader in China, we believe Ctrip.com should gain market share as the company leverages the shift from offline travel bookings to online and mobile.
| * | All fund returns referenced in this commentary are for Investor Class shares. Returns would have been lower if a portion of the management fee had not been waived. Performance for other share classes will vary due to differences in fee structure; when Investor Class performance exceeds that of the fund's benchmark, other share classes may not. See page 3 for returns for all share classes. |
5
Also in China, an overweight position in Shenzhou International, a textile and fabric manufacturer, was a main contributor. The company's stock advanced on high order visibility and strong relationships with core clients. We believe the shift from casual wear toward sportswear is likely to support the company's profit margins.
Stock Selection in Mexico Was a Main Detractor
Stock selection in Mexico and overweight positions in Peru and Indonesia weighed on relative performance, as did stock selection in the health care sector.
In terms of individual holdings, an overweight position in Itau Unibanco, a Brazil-based bank, detracted from relative performance. The company struggled amid uncertainty surrounding the weakening global economic climate and the negative effects in emerging markets of a rallying U.S. dollar.
In addition, an overweight position in Mexico-based Cemex, a building materials provider, was a main detractor. Volatility in currency exchange rates drove down the company’s stock price, as a stronger U.S. dollar weighed on the company’s revenue estimates. Plunging oil prices also pressured Cemex’s business in Mexico, where the government relies on oil for a meaningful portion of its fiscal revenue, which finances public spending and infrastructure investments, a key driver of Cemex’s business.
An overweight position in Sinotrans, also was a main detractor. The share price of the China-based logistics company dropped sharply over the three trading days following Sinotrans’s announcement of fiscal 2014 results. The company’s core business missed analyst expectations, and management slightly revised downward its 2015 guidance. Also, neither the chairman nor the CEO attended the analyst briefing, which they had done in the past, adding to investor concerns, and we exited the position.
Outlook
The macroeconomic environment remains volatile as market participants grapple with uneven global growth, China's deceleration, the collapse in oil prices, and persistent uncertainty regarding U.S. monetary policy. Nevertheless, we continue to uncover emerging markets opportunities stemming from changes in discretionary spending patterns as incomes rise. In particular, e-commerce continues to take market share, domestic and international travel is increasing, and demand for health care and beauty products is rising. In addition, we will seek to capture opportunities arising from growing access to banking and insurance, increasing public investment in infrastructure, and improving economic recoveries in the U.S. and Europe.
We remain active in China, as the nation influences much of the growth prospects in the emerging markets. China’s economy is a significant importer of commodities as well as a source of goods, which will now be more competitive as China’s currency weakens. However, as China’s risk premium falls, we believe there are also reasons to be optimistic. Within China, housing, employment, and Purchasing Managers Index (PMI) data have recently trended positively.
Although we believe emerging markets valuations are attractive and currently stand at historically low levels, we also believe earnings growth must return to sustain a broad, long-term rally. We continue to implement our bottom-up investment process, which is uncovering several interesting opportunities in the emerging markets.
6
| Fund Characteristics |
| NOVEMBER 30, 2015 | |
Top Ten Holdings | % of net assets |
| Tencent Holdings Ltd. | 4.4% |
| Taiwan Semiconductor Manufacturing Co. Ltd. | 3.9% |
| Samsung Electronics Co. Ltd. | 3.6% |
| Industrial & Commercial Bank of China Ltd., H Shares | 2.4% |
| China Mobile Ltd. | 2.3% |
| HDFC Bank Ltd. | 2.3% |
| Ping An Insurance Group Co., H Shares | 2.2% |
| Naspers Ltd., N Shares | 1.9% |
| LG Chem Ltd. | 1.8% |
| China Overseas Land & Investment Ltd. | 1.7% |
Types of Investments in Portfolio | % of net assets |
| Common Stocks | 95.2% |
| Exchange-Traded Funds | 1.8% |
| Total Equity Exposure | 97.0% |
| Temporary Cash Investments | 2.8% |
| Other Assets and Liabilities | 0.2% |
Investments by Country | % of net assets |
| China | 25.7% |
| South Korea | 13.8% |
| Taiwan | 12.8% |
| Mexico | 6.3% |
| India | 6.0% |
| South Africa | 5.8% |
| Brazil | 4.2% |
| Thailand | 4.0% |
| Indonesia | 3.4% |
| Russia | 3.2% |
| Turkey | 2.4% |
| Other Countries | 7.6% |
| Exchange-Traded Funds* | 1.8% |
| Cash and Equivalents** | 3.0% |
*Category may increase exposure to the countries indicated. The Schedule of Investments provides additional information on the fund's portfolio holdings. | |
| **Includes temporary cash investments and other assets and liabilities. | |
7
| Shareholder Fee Example |
Fund shareholders may incur two types of costs: (1) transaction costs, including sales charges (loads) on purchase payments and redemption/exchange fees; and (2) ongoing costs, including management fees; distribution and service (12b-1) fees; and other fund expenses. This example is intended to help you understand your ongoing costs (in dollars) of investing in your fund and to compare these costs with the ongoing cost of investing in other mutual funds.
The example is based on an investment of $1,000 made at the beginning of the period and held for the entire period from June 1, 2015 to November 30, 2015.
Actual Expenses
The table provides information about actual account values and actual expenses for each class. You may use the information, together with the amount you invested, to estimate the expenses that you paid over the period. First, identify the share class you own. Then simply divide your account value by $1,000 (for example, an $8,600 account value divided by $1,000 = 8.6), then multiply the result by the number under the heading “Expenses Paid During Period” to estimate the expenses you paid on your account during this period.
If you hold Investor Class shares of any American Century Investments fund, or Institutional Class shares of the American Century Diversified Bond Fund, in an American Century Investments account (i.e., not a financial intermediary or retirement plan account), American Century Investments may charge you a $12.50 semiannual account maintenance fee if the value of those shares is less than $10,000. We will redeem shares automatically in one of your accounts to pay the $12.50 fee. In determining your total eligible investment amount, we will include your investments in all personal accounts (including American Century Investments Brokerage accounts) registered under your Social Security number. Personal accounts include individual accounts, joint accounts, UGMA/UTMA accounts, personal trusts, Coverdell Education Savings Accounts and IRAs (including traditional, Roth, Rollover, SEP-, SARSEP- and SIMPLE-IRAs), and certain other retirement accounts. If you have only business, business retirement, employer-sponsored or American Century Investments Brokerage accounts, you are currently not subject to this fee. If you are subject to the Account Maintenance Fee, your account value could be reduced by the fee amount.
Hypothetical Example for Comparison Purposes
The table also provides information about hypothetical account values and hypothetical expenses based on the actual expense ratio of each class of your fund and an assumed rate of return of 5% per year before expenses, which is not the actual return of a fund’s share class. The hypothetical account values and expenses may not be used to estimate the actual ending account balance or expenses you paid for the period. You may use this information to compare the ongoing costs of investing in your fund and other funds. To do so, compare this 5% hypothetical example with the 5% hypothetical examples that appear in the shareholder reports of the other funds.
Please note that the expenses shown in the table are meant to highlight your ongoing costs only and do not reflect any transactional costs, such as sales charges (loads) or redemption/exchange fees. Therefore, the table is useful in comparing ongoing costs only, and will not help you determine the relative total costs of owning different funds. In addition, if these transactional costs were included, your costs would have been higher.
8
| Beginning Account Value 6/1/15 | Ending Account Value 11/30/15 | Expenses Paid During Period(1) 6/1/15 - 11/30/15 | Annualized Expense Ratio(1) | |
Actual | ||||
| Investor Class (after waiver) | $1,000 | $860.80 | $6.67 | 1.43% |
| Investor Class (before waiver) | $1,000 | $860.80(2) | $7.84 | 1.68% |
| Institutional Class (after waiver) | $1,000 | $862.00 | $5.74 | 1.23% |
| Institutional Class (before waiver) | $1,000 | $862.00(2) | $6.91 | 1.48% |
| A Class (after waiver) | $1,000 | $861.20 | $7.84 | 1.68% |
| A Class (before waiver) | $1,000 | $861.20(2) | $9.00 | 1.93% |
| C Class (after waiver) | $1,000 | $858.50 | $11.32 | 2.43% |
| C Class (before waiver) | $1,000 | $858.50(2) | $12.49 | 2.68% |
| R Class (after waiver) | $1,000 | $858.70 | $8.99 | 1.93% |
| R Class (before waiver) | $1,000 | $858.70(2) | $10.16 | 2.18% |
| R6 Class (after waiver) | $1,000 | $863.20 | $5.04 | 1.08% |
| R6 Class (before waiver) | $1,000 | $863.20(2) | $6.21 | 1.33% |
| Hypothetical | ||||
| Investor Class (after waiver) | $1,000 | $1,017.90 | $7.23 | 1.43% |
| Investor Class (before waiver) | $1,000 | $1,016.65 | $8.49 | 1.68% |
| Institutional Class (after waiver) | $1,000 | $1,018.90 | $6.23 | 1.23% |
| Institutional Class (before waiver) | $1,000 | $1,017.65 | $7.49 | 1.48% |
| A Class (after waiver) | $1,000 | $1,016.65 | $8.49 | 1.68% |
| A Class (before waiver) | $1,000 | $1,015.39 | $9.75 | 1.93% |
| C Class (after waiver) | $1,000 | $1,012.89 | $12.26 | 2.43% |
| C Class (before waiver) | $1,000 | $1,011.63 | $13.51 | 2.68% |
| R Class (after waiver) | $1,000 | $1,015.39 | $9.75 | 1.93% |
| R Class (before waiver) | $1,000 | $1,014.14 | $11.01 | 2.18% |
| R6 Class (after waiver) | $1,000 | $1,019.65 | $5.47 | 1.08% |
| R6 Class (before waiver) | $1,000 | $1,018.40 | $6.73 | 1.33% |
| (1) | Expenses are equal to the class's annualized expense ratio listed in the table above, multiplied by the average account value over the period, multiplied by 183, the number of days in the most recent fiscal half-year, divided by 365, to reflect the one-half year period. |
| (2) | Ending account value assumes the return earned after waiver and would have been lower if a portion of the management fee had not been waived. |
9
| Schedule of Investments |
NOVEMBER 30, 2015
| Shares | Value | ||||
| COMMON STOCKS — 95.2% | |||||
| Brazil — 4.2% | |||||
| BB Seguridade Participacoes SA | 368,300 | $ | 2,472,151 | ||
| BRF SA ADR | 159,991 | 2,278,272 | |||
| Cielo SA | 368,860 | 3,347,292 | |||
| Itau Unibanco Holding SA ADR | 341,375 | 2,416,935 | |||
| Raia Drogasil SA | 442,200 | 4,531,721 | |||
| Ultrapar Participacoes SA | 275,800 | 4,471,681 | |||
| 19,518,052 | |||||
| Chile — 0.7% | |||||
| SACI Falabella | 544,845 | 3,279,497 | |||
| China — 25.7% | |||||
Alibaba Group Holding Ltd. ADR(1) | 55,470 | 4,663,918 | |||
| Beijing Enterprises Water Group Ltd. | 8,748,000 | 6,837,328 | |||
| China Gas Holdings Ltd. | 2,910,000 | 4,135,991 | |||
| China Mobile Ltd. | 935,000 | 10,624,109 | |||
| China Overseas Land & Investment Ltd. | 2,408,000 | 7,981,685 | |||
| China Railway Construction Corp. Ltd., H Shares | 3,513,000 | 4,666,813 | |||
| CNOOC Ltd. | 3,563,000 | 3,942,831 | |||
Ctrip.com International Ltd. ADR(1) | 72,301 | 7,736,930 | |||
| Great Wall Motor Co. Ltd., H Shares | 3,191,500 | 3,914,537 | |||
| Industrial & Commercial Bank of China Ltd., H Shares | 18,128,645 | 10,965,873 | |||
| KWG Property Holding Ltd. | 6,701,000 | 4,788,003 | |||
| PAX Global Technology Ltd. | 3,350,000 | 4,143,510 | |||
| Ping An Insurance Group Co., H Shares | 1,843,500 | 10,093,129 | |||
| Shenzhou International Group Holdings Ltd. | 1,440,000 | 7,558,958 | |||
| Tencent Holdings Ltd. | 1,016,200 | 20,223,212 | |||
| Xinyi Solar Holdings Ltd. | 14,714,000 | 5,958,890 | |||
| 118,235,717 | |||||
| Egypt — 0.8% | |||||
| Commercial International Bank Egypt S.A.E. | 685,650 | 3,809,142 | |||
| Greece — 0.4% | |||||
| Titan Cement Co. SA | 95,060 | 1,707,405 | |||
| Hungary — 1.2% | |||||
| Richter Gedeon Nyrt | 282,699 | 5,370,729 | |||
| India — 6.0% | |||||
| Bharti Infratel Ltd. | 794,500 | 4,584,273 | |||
| HCL Technologies Ltd. | 343,345 | 4,486,330 | |||
| HDFC Bank Ltd. | 539,149 | 10,359,943 | |||
| ICICI Bank Ltd. ADR | 481,886 | 4,004,473 | |||
| Larsen & Toubro Ltd. | 196,457 | 4,051,456 | |||
| 27,486,475 | |||||
10
| Shares | Value | ||||
| Indonesia — 3.4% | |||||
| PT Astra International Tbk | 6,512,700 | $ | 2,789,140 | ||
| PT Bank Rakyat Indonesia (Persero) Tbk | 4,534,800 | 3,531,801 | |||
| PT Matahari Department Store Tbk | 3,359,400 | 3,800,116 | |||
| PT Siloam International Hospitals Tbk | 3,464,400 | 2,341,319 | |||
| PT Wijaya Karya Persero Tbk | 15,258,900 | 3,104,720 | |||
| 15,567,096 | |||||
| Mexico — 6.3% | |||||
| Alsea SAB de CV | 1,473,719 | 5,255,456 | |||
Cemex SAB de CV ADR(1) | 460,262 | 2,899,651 | |||
| Corp. Inmobiliaria Vesta SAB de CV | 1,851,734 | 2,830,392 | |||
| Fomento Economico Mexicano SAB de CV ADR | 65,364 | 6,299,782 | |||
| Grupo Aeroportuario del Centro Norte Sab de CV | 969,630 | 4,928,790 | |||
| Grupo Mexico SAB de CV | 1,230,253 | 2,685,619 | |||
| Infraestructura Energetica Nova SAB de CV | 963,747 | 4,222,215 | |||
| 29,121,905 | |||||
| Peru — 1.2% | |||||
| Credicorp Ltd. | 54,114 | 5,714,980 | |||
| Philippines — 1.9% | |||||
| Ayala Land, Inc. | 5,765,900 | 4,134,831 | |||
| Universal Robina Corp. | 1,074,260 | 4,595,274 | |||
| 8,730,105 | |||||
| Poland — 1.0% | |||||
Alior Bank SA(1) | 139,284 | 2,520,248 | |||
| Powszechny Zaklad Ubezpieczen SA | 212,500 | 2,029,794 | |||
| 4,550,042 | |||||
| Qatar — 0.4% | |||||
| Qatar National Bank SAQ | 44,810 | 1,968,616 | |||
| Russia — 3.2% | |||||
| Magnit PJSC GDR | 45,891 | 2,212,864 | |||
| NovaTek OAO GDR | 62,474 | 5,847,566 | |||
X5 Retail Group NV GDR(1) | 288,830 | 6,527,558 | |||
| 14,587,988 | |||||
| South Africa — 5.8% | |||||
| Aspen Pharmacare Holdings Ltd. | 144,012 | 3,114,250 | |||
| Capitec Bank Holdings Ltd. | 129,173 | 5,361,359 | |||
| Discovery Holdings Ltd. | 611,968 | 6,106,133 | |||
| Mr Price Group Ltd. | 244,266 | 3,396,507 | |||
| Naspers Ltd., N Shares | 57,870 | 8,626,217 | |||
| 26,604,466 | |||||
| South Korea — 13.8% | |||||
| Amorepacific Corp. | 18,355 | 6,395,443 | |||
Boryung Medience Co. Ltd.(1) | 107,397 | 2,137,646 | |||
| CJ CheilJedang Corp. | 7,421 | 2,310,151 | |||
CJ Korea Express Co. Ltd.(1) | 31,461 | 5,229,690 | |||
| Coway Co. Ltd. | 35,908 | 2,620,116 | |||
| Hana Tour Service, Inc. | 18,571 | 1,844,191 | |||
| LG Chem Ltd. | 30,286 | 8,316,522 | |||
11
| Shares | Value | ||||
| LG Household & Health Care Ltd. | 7,991 | $ | 6,955,596 | ||
| Medy-Tox, Inc. | 13,680 | 5,552,092 | |||
| Samsung Electronics Co. Ltd. | 15,045 | 16,681,300 | |||
| Samsung Fire & Marine Insurance Co. Ltd. | 19,840 | 5,251,034 | |||
| 63,293,781 | |||||
| Taiwan — 12.8% | |||||
| Delta Electronics, Inc. | 670,000 | 3,212,272 | |||
| Eclat Textile Co. Ltd. | 496,000 | 6,670,670 | |||
| Ginko International Co. Ltd. | 503,000 | 6,410,391 | |||
| Hota Industrial Manufacturing Co. Ltd. | 1,037,000 | 4,002,880 | |||
| PChome Online, Inc. | 241,553 | 2,271,821 | |||
| President Chain Store Corp. | 1,018,000 | 6,518,044 | |||
| Taiwan Paiho Ltd. | 1,810,000 | 4,064,487 | |||
| Taiwan Semiconductor Manufacturing Co. Ltd. | 4,255,939 | 18,123,140 | |||
| Tung Thih Electronic Co. Ltd. | 525,000 | 4,607,944 | |||
| Uni-President Enterprises Corp. | 1,811,000 | 2,984,860 | |||
| 58,866,509 | |||||
| Thailand — 4.0% | |||||
| Airports of Thailand PCL | 600,300 | 5,209,076 | |||
| CP ALL PCL | 4,891,200 | 6,414,241 | |||
| Kasikornbank PCL | 447,800 | 2,117,804 | |||
| Siam Cement PCL (The) | 238,800 | 2,985,000 | |||
| Thaicom PCL | 2,434,500 | 1,691,380 | |||
| 18,417,501 | |||||
| Turkey — 2.4% | |||||
| TAV Havalimanlari Holding AS | 576,072 | 4,160,493 | |||
| Tofas Turk Otomobil Fabrikasi AS | 668,753 | 4,414,355 | |||
| Ulker Biskuvi Sanayi AS | 347,280 | 2,242,285 | |||
| 10,817,133 | |||||
TOTAL COMMON STOCKS (Cost $392,007,439) | 437,647,139 | ||||
| EXCHANGE-TRADED FUNDS — 1.8% | |||||
| iShares MSCI Malaysia ETF | 325,217 | 3,447,300 | |||
| iShares MSCI South Korea Capped ETF | 87,852 | 4,640,343 | |||
TOTAL EXCHANGE-TRADED FUNDS (Cost $7,957,361) | 8,087,643 | ||||
| TEMPORARY CASH INVESTMENTS — 2.8% | |||||
| Repurchase Agreement, Credit Suisse First Boston, Inc., (collateralized by various U.S. Treasury obligations, 0.625%, 8/31/17, valued at $4,383,428), in a joint trading account at 0.01%, dated 11/30/15, due 12/1/15 (Delivery value $4,298,673) | 4,298,672 | ||||
| Repurchase Agreement, Fixed Income Clearing Corp., (collateralized by various U.S. Treasury obligations, 3.00%, 11/15/44, valued at $7,310,850), at 0.01%, dated 11/30/15, due 12/1/15 (Delivery value $7,166,002) | 7,166,000 | ||||
| State Street Institutional Liquid Reserves Fund, Premier Class | 1,637,965 | 1,637,965 | |||
TOTAL TEMPORARY CASH INVESTMENTS (Cost $13,102,637) | 13,102,637 | ||||
TOTAL INVESTMENT SECURITIES — 99.8% (Cost $413,067,437) | 458,837,419 | ||||
| OTHER ASSETS AND LIABILITIES — 0.2% | 825,502 | ||||
| TOTAL NET ASSETS — 100.0% | $ | 459,662,921 | |||
12
| MARKET SECTOR DIVERSIFICATION | ||
(as a % of net assets) | ||
| Financials | 21.3 | % |
| Information Technology | 18.0 | % |
| Consumer Discretionary | 16.3 | % |
| Consumer Staples | 13.6 | % |
| Industrials | 6.8 | % |
| Health Care | 5.0 | % |
| Materials | 4.0 | % |
| Telecommunication Services | 3.7 | % |
| Utilities | 3.3 | % |
| Energy | 3.2 | % |
| Exchange-Traded Funds | 1.8 | % |
| Cash and Equivalents* | 3.0 | % |
*Includes temporary cash investments and other assets and liabilities.
| NOTES TO SCHEDULE OF INVESTMENTS | ||
| ADR | - | American Depositary Receipt |
| GDR | - | Global Depositary Receipt |
| PJSC | - | Public Joint Stock Company |
(1) Non-income producing.
See Notes to Financial Statements.
13
| Statement of Assets and Liabilities |
| NOVEMBER 30, 2015 | |||
| Assets | |||
| Investment securities, at value (cost of $413,067,437) | $ | 458,837,419 | |
| Foreign currency holdings, at value (cost of $42,354) | 41,422 | ||
| Receivable for capital shares sold | 1,445,719 | ||
| Dividends and interest receivable | 42,599 | ||
| 460,367,159 | |||
| Liabilities | |||
| Payable for capital shares redeemed | 164,250 | ||
| Accrued management fees | 531,742 | ||
| Distribution and service fees payable | 8,246 | ||
| 704,238 | |||
| Net Assets | $ | 459,662,921 | |
| Net Assets Consist of: | |||
| Capital (par value and paid-in surplus) | $ | 475,116,643 | |
| Undistributed net investment income | 762,888 | ||
| Accumulated net realized loss | (61,969,415 | ) | |
| Net unrealized appreciation | 45,752,805 | ||
| $ | 459,662,921 | ||
| Net Assets | Shares Outstanding | Net Asset Value Per Share | ||||
| Investor Class, $0.01 Par Value | $399,694,124 | 49,332,594 | $8.10 | |||
| Institutional Class, $0.01 Par Value | $4,797,327 | 577,053 | $8.31 | |||
| A Class, $0.01 Par Value | $25,632,430 | 3,279,353 | $7.82* | |||
| C Class, $0.01 Par Value | $3,149,060 | 432,705 | $7.28 | |||
| R Class, $0.01 Par Value | $1,424,925 | 180,279 | $7.90 | |||
| R6 Class, $0.01 Par Value | $24,965,055 | 2,998,115 | $8.33 | |||
*Maximum offering price $8.30 (net asset value divided by 0.9425).
See Notes to Financial Statements.
14
| Statement of Operations |
| YEAR ENDED NOVEMBER 30, 2015 | |||
| Investment Income (Loss) | |||
| Income: | |||
| Dividends (net of foreign taxes withheld of $877,628) | $ | 7,608,187 | |
| Interest | 2,450 | ||
| 7,610,637 | |||
| Expenses: | |||
| Management fees | 7,280,948 | ||
| Distribution and service fees: | |||
| A Class | 40,201 | ||
| C Class | 32,323 | ||
| R Class | 7,796 | ||
| Directors' fees and expenses | 15,439 | ||
| Other expenses | 6,297 | ||
| 7,383,004 | |||
| Fees waived | (1,097,581 | ) | |
| 6,285,423 | |||
| Net investment income (loss) | 1,325,214 | ||
| Realized and Unrealized Gain (Loss) | |||
| Net realized gain (loss) on: | |||
| Investment transactions | (2,617,009 | ) | |
| Foreign currency transactions | (558,438 | ) | |
| (3,175,447 | ) | ||
| Change in net unrealized appreciation (depreciation) on: | |||
| Investments | (44,671,453 | ) | |
| Translation of assets and liabilities in foreign currencies | (5,799 | ) | |
| (44,677,252 | ) | ||
| Net realized and unrealized gain (loss) | (47,852,699 | ) | |
| Net Increase (Decrease) in Net Assets Resulting from Operations | $ | (46,527,485 | ) |
See Notes to Financial Statements.
15
| Statement of Changes in Net Assets |
| YEARS ENDED NOVEMBER 30, 2015 AND NOVEMBER 30, 2014 | ||||||
| Increase (Decrease) in Net Assets | November 30, 2015 | November 30, 2014 | ||||
| Operations | ||||||
| Net investment income (loss) | $ | 1,325,214 | $ | 1,313,691 | ||
| Net realized gain (loss) | (3,175,447 | ) | 37,996,250 | |||
| Change in net unrealized appreciation (depreciation) | (44,677,252 | ) | (31,478,024 | ) | ||
| Net increase (decrease) in net assets resulting from operations | (46,527,485 | ) | 7,831,917 | |||
| Distributions to Shareholders | ||||||
| From net investment income: | ||||||
| Investor Class | (277,848 | ) | (1,395,788 | ) | ||
| Institutional Class | (40,979 | ) | (127,266 | ) | ||
| A Class | — | (30,576 | ) | |||
| C Class | — | (2,582 | ) | |||
| R Class | — | (2,497 | ) | |||
| R6 Class | (59,777 | ) | (117 | ) | ||
| Decrease in net assets from distributions | (378,604 | ) | (1,558,826 | ) | ||
| Capital Share Transactions | ||||||
| Net increase (decrease) in net assets from capital share transactions (Note 5) | 67,583,843 | (37,366,838 | ) | |||
| Redemption Fees | ||||||
| Increase in net assets from redemption fees | 34,209 | 13,217 | ||||
| Net increase (decrease) in net assets | 20,711,963 | (31,080,530 | ) | |||
| Net Assets | ||||||
| Beginning of period | 438,950,958 | 470,031,488 | ||||
| End of period | $ | 459,662,921 | $ | 438,950,958 | ||
| Undistributed net investment income | $ | 762,888 | $ | 354,510 | ||
See Notes to Financial Statements.
16
| Notes to Financial Statements |
NOVEMBER 30, 2015
1. Organization
American Century World Mutual Funds, Inc. (the corporation) is registered under the Investment Company Act of 1940, as amended (the 1940 Act), as an open-end management investment company and is organized as a Maryland corporation. Emerging Markets Fund (the fund) is one fund in a series issued by the corporation. The fund is diversified as defined under the 1940 Act. The fund’s investment objective is to seek capital growth.
The fund offers the Investor Class, the Institutional Class, the A Class, the C Class, the R Class and the R6 Class. The A Class may incur an initial sales charge. The A Class and C Class may be subject to a contingent deferred sales charge. The share classes differ principally in their respective sales charges and distribution and shareholder servicing expenses and arrangements. The Institutional Class and R6 Class shareholders do not require the same level of shareholder and administrative services from American Century Investment Management, Inc. (ACIM) (the investment advisor) as shareholders of other classes. In addition, financial intermediaries do not receive any service, distribution or administrative fees for the R6 Class. As a result, the Institutional Class and R6 Class are charged lower unified management fees.
2. Significant Accounting Policies
The following is a summary of significant accounting policies consistently followed by the fund in preparation of its financial statements. The fund is an investment company and follows accounting and reporting guidance in accordance with accounting principles generally accepted in the United States of America. This may require management to make certain estimates and assumptions at the date of the financial statements. Actual results could differ from these estimates. Management evaluated the impact of events or transactions occurring through the date the financial statements were issued that would merit recognition or disclosure.
Investment Valuations — The fund determines the fair value of its investments and computes its net asset value per share at the close of regular trading (usually 4 p.m. Eastern time) on the New York Stock Exchange (NYSE) on each day the NYSE is open. The Board of Directors has adopted valuation policies and procedures to guide the investment advisor in the fund’s investment valuation process and to provide methodologies for the oversight of the fund’s pricing function.
Equity securities that are listed or traded on a domestic securities exchange are valued at the last reported sales price or at the official closing price as provided by the exchange. Equity securities traded on foreign securities exchanges are generally valued at the closing price of such securities on the exchange where primarily traded or at the close of the NYSE, if that is earlier. If no last sales price is reported, or if local convention or regulation so provides, the mean of the latest bid and asked prices may be used. Securities traded over-the-counter are valued at the mean of the latest bid and asked prices, the last sales price, or the official closing price. Equity securities initially expressed in local currencies are translated into U.S. dollars at the mean of the appropriate currency exchange rate at the close of the NYSE as provided by an independent pricing service.
Open-end management investment companies are valued at the reported net asset value per share. Repurchase agreements are valued at cost, which approximates fair value.
If the fund determines that the market price for an investment is not readily available or the valuation methods mentioned above do not reflect an investment’s fair value, such investment is valued as determined in good faith by the Board of Directors or its delegate, in accordance with policies and procedures adopted by the Board of Directors. In its determination of fair value, the fund may review several factors including, but not limited to, market information regarding the specific investment or comparable investments and correlation with other investment types, futures indices or general market indicators. Circumstances that may cause the fund to use these procedures to value an investment include, but are not limited to: an investment has been declared in default or is distressed; trading in a security has been suspended during the trading day or a security is not actively trading on its principal exchange; prices received from a regular pricing source are deemed unreliable; or there is a foreign market holiday and no trading occurred.
The fund monitors for significant events occurring after the close of an investment’s primary exchange but before the fund’s net asset value per share is determined. Significant events may include, but are not limited
17
to: corporate announcements and transactions; governmental action and political unrest that could impact a specific investment or an investment sector; or armed conflicts, natural disasters and similar events that could affect investments in a specific country or region. The fund also monitors for significant fluctuations between domestic and foreign markets, as evidenced by the U.S. market or such other indicators that the Board of Directors, or its delegate, deems appropriate. If significant fluctuations in foreign markets are identified, the fund may apply a model-derived factor to the closing price of equity securities traded on foreign securities exchanges. The factor is based on observable market data as provided by an independent pricing service.
Security Transactions — Security transactions are accounted for as of the trade date. Net realized gains and losses are determined on the identified cost basis, which is also used for federal income tax purposes.
Investment Income — Dividend income less foreign taxes withheld, if any, is recorded as of the ex-dividend date. Distributions received on securities that represent a return of capital or long-term capital gain are recorded as a reduction of cost of investments and/or as a realized gain. The fund may estimate the components of distributions received that may be considered nontaxable distributions or long-term capital gain distributions for income tax purposes. Interest income is recorded on the accrual basis and includes accretion of discounts and amortization of premiums.
Foreign Currency Translations — All assets and liabilities initially expressed in foreign currencies are translated into U.S. dollars at prevailing exchange rates at period end. The fund may enter into spot foreign currency exchange contracts to facilitate transactions denominated in a foreign currency. Purchases and sales of investment securities, dividend and interest income, spot foreign currency exchange contracts, and expenses are translated at the rates of exchange prevailing on the respective dates of such transactions. Net realized and unrealized foreign currency exchange gains or losses related to investment securities are a component of net realized gain (loss) on investment transactions and change in net unrealized appreciation (depreciation) on investments, respectively.
Repurchase Agreements — The fund may enter into repurchase agreements with institutions that ACIM has determined are creditworthy pursuant to criteria adopted by the Board of Directors. The fund requires that the collateral, represented by securities, received in a repurchase transaction be transferred to the custodian in a manner sufficient to enable the fund to obtain those securities in the event of a default under the repurchase agreement. ACIM monitors, on a daily basis, the securities transferred to ensure the value, including accrued interest, of the securities under each repurchase agreement is equal to or greater than amounts owed to the fund under each repurchase agreement.
Joint Trading Account — Pursuant to an Exemptive Order issued by the Securities and Exchange Commission, the fund, along with certain other funds in the American Century Investments family of funds, may transfer uninvested cash balances into a joint trading account. These balances are invested in one or more repurchase agreements that are collateralized by U.S. Treasury or Agency obligations.
Income Tax Status — It is the fund’s policy to distribute substantially all net investment income and net realized gains to shareholders and to otherwise qualify as a regulated investment company under provisions of the Internal Revenue Code. Accordingly, no provision has been made for income taxes. The fund files U.S. federal, state, local and non-U.S. tax returns as applicable. The fund's tax returns are subject to examination by the relevant taxing authority until expiration of the applicable statute of limitations, which is generally three years from the date of filing but can be longer in certain jurisdictions. At this time, management believes there are no uncertain tax positions which, based on their technical merit, would not be sustained upon examination and for which it is reasonably possible that the total amounts of unrecognized tax benefits will significantly change in the next twelve months.
Multiple Class — All shares of the fund represent an equal pro rata interest in the net assets of the class to which such shares belong, and have identical voting, dividend, liquidation and other rights and the same terms and conditions, except for class specific expenses and exclusive rights to vote on matters affecting only individual classes. Income, non-class specific expenses, and realized and unrealized capital gains and losses of the fund are allocated to each class of shares based on their relative net assets.
Distributions to Shareholders — Distributions from net investment income and net realized gains, if any, are generally declared and paid annually. The fund may make distributions on a more frequent basis to comply with the distribution requirements of the Internal Revenue Code, in all events in a manner consistent with provisions of the 1940 Act.
18
Redemption Fees — The fund may impose a 2.00% redemption fee on shares held less than 60 days. The fee may not be applicable to all classes. The redemption fee is retained by the fund and helps cover transaction costs that long-term investors may bear when the fund sells securities to meet investor redemptions.
Indemnifications — Under the corporation’s organizational documents, its officers and directors are indemnified against certain liabilities arising out of the performance of their duties to the fund. In addition, in the normal course of business, the fund enters into contracts that provide general indemnifications. The maximum exposure under these arrangements is unknown as this would involve future claims that may be made against a fund. The risk of material loss from such claims is considered by management to be remote.
3. Fees and Transactions with Related Parties
Certain officers and directors of the corporation are also officers and/or directors of American Century Companies, Inc. (ACC). The corporation’s investment advisor, ACIM, the corporation's distributor, American Century Investment Services, Inc. (ACIS), and the corporation’s transfer agent, American Century Services, LLC, are wholly owned, directly or indirectly, by ACC. Various funds issued by American Century Asset Allocation Portfolios, Inc. and American Century Strategic Asset Allocations, Inc. own, in aggregate, 31% of the shares of the fund. Related parties do not invest in the fund for the purpose of exercising management or control.
Management Fees — The corporation has entered into a management agreement with ACIM, under which ACIM provides the fund with investment advisory and management services in exchange for a single, unified management fee (the fee) per class. The agreement provides that all expenses of managing and operating the fund, except distribution and service fees, brokerage expenses, taxes, interest, fees and expenses of the independent directors (including legal counsel fees), and extraordinary expenses, will be paid by ACIM. The fee is computed and accrued daily based on each class’s daily net assets and paid monthly in arrears. The rate of the fee is determined by applying a fee rate calculation formula. This formula takes into account the fund’s assets as well as certain assets, if any, of other clients of the investment advisor outside the American Century Investments family of funds (such as subadvised funds and separate accounts) that have very similar investment teams and investment strategies (strategy assets). The strategy assets of the fund also include the assets of NT Emerging Markets Fund, one fund in a series issued by the corporation. The annual management fee schedule ranges from 1.250% to 1.850% for the Investor Class, A Class, C Class and R Class. The annual management fee schedule ranges from 1.050% to 1.650% for the Institutional Class and 0.900% to 1.500% for the R6 Class. During the year ended November 30, 2015, the investment advisor voluntarily agreed to waive 0.250% of the fund's management fee. The investment advisor expects this waiver to continue until March 31, 2016 and cannot terminate it prior to such date without the approval of the Board of Directors. The total amount of the waiver for each class for the year ended November 30, 2015 was $969,877, $18,960, $40,201, $8,080, $3,898 and $56,565 for the Investor Class, Institutional Class, A Class, C Class, R Class and R6 Class, respectively. The effective annual management fee before waiver for each class for the year ended November 30, 2015 was 1.68% for the Investor Class, A Class, C Class and R Class, 1.48% for the Institutional Class and 1.33% for the R6 Class. The effective annual management fee after waiver for each class for the year ended November 30, 2015 was 1.43% for the Investor Class, A Class, C Class and R Class, 1.23% for the Institutional Class and 1.08% for the R6 Class.
Distribution and Service Fees — The Board of Directors has adopted a separate Master Distribution and Individual Shareholder Services Plan for each of the A Class, C Class and R Class (collectively the plans), pursuant to Rule 12b-1 of the 1940 Act. The plans provide that the A Class will pay ACIS an annual distribution and service fee of 0.25%. The plans provide that the C Class will pay ACIS an annual distribution and service fee of 1.00%, of which 0.25% is paid for individual shareholder services and 0.75% is paid for distribution services. The plans provide that the R Class will pay ACIS an annual distribution and service fee of 0.50%. The fees are computed and accrued daily based on each class’s daily net assets and paid monthly in arrears. The fees are used to pay financial intermediaries for distribution and individual shareholder services. Fees incurred under the plans during the year ended November 30, 2015 are detailed in the Statement of Operations.
Directors' Fees and Expenses — The Board of Directors is responsible for overseeing the investment advisor’s management and operations of the fund. The directors receive detailed information about the fund and its investment advisor regularly throughout the year, and meet at least quarterly with management of the investment advisor to review reports about fund operations. The fund’s officers do not receive compensation from the fund.
19
4. Investment Transactions
Purchases and sales of investment securities, excluding short-term investments, for the year ended November 30, 2015 were $313,858,299 and $248,403,673, respectively.
5. Capital Share Transactions
Transactions in shares of the fund were as follows:
Year ended November 30, 2015 | Year ended November 30, 2014 | |||||||||
| Shares | Amount | Shares | Amount | |||||||
| Investor Class/Shares Authorized | 400,000,000 | 400,000,000 | ||||||||
| Sold | 13,659,639 | $ | 116,335,445 | 6,046,004 | $ | 53,257,554 | ||||
| Issued in reinvestment of distributions | 31,378 | 272,985 | 163,232 | 1,369,513 | ||||||
| Redeemed | (8,051,549 | ) | (69,730,913 | ) | (10,001,738 | ) | (88,028,807 | ) | ||
| 5,639,468 | 46,877,517 | (3,792,502 | ) | (33,401,740 | ) | |||||
| Institutional Class/Shares Authorized | 40,000,000 | 40,000,000 | ||||||||
| Sold | 493,583 | 4,194,048 | 502,581 | 4,463,970 | ||||||
| Issued in reinvestment of distributions | 4,598 | 40,966 | 14,812 | 127,234 | ||||||
| Redeemed | (1,685,794 | ) | (15,221,632 | ) | (2,323,383 | ) | (21,877,486 | ) | ||
| (1,187,613 | ) | (10,986,618 | ) | (1,805,990 | ) | (17,286,282 | ) | |||
| A Class/Shares Authorized | 30,000,000 | 40,000,000 | ||||||||
| Sold | 3,008,091 | 25,809,533 | 800,095 | 6,886,332 | ||||||
| Issued in reinvestment of distributions | — | — | 3,655 | 29,682 | ||||||
| Redeemed | (795,069 | ) | (6,632,037 | ) | (1,084,971 | ) | (9,426,423 | ) | ||
| 2,213,022 | 19,177,496 | (281,221 | ) | (2,510,409 | ) | |||||
| C Class/Shares Authorized | 30,000,000 | 5,000,000 | ||||||||
| Sold | 197,372 | 1,638,348 | 56,096 | 451,926 | ||||||
| Issued in reinvestment of distributions | — | — | 322 | 2,462 | ||||||
| Redeemed | (148,454 | ) | (1,145,309 | ) | (113,862 | ) | (900,439 | ) | ||
| 48,918 | 493,039 | (57,444 | ) | (446,051 | ) | |||||
| R Class/Shares Authorized | 25,000,000 | 10,000,000 | ||||||||
| Sold | 84,391 | 708,493 | 86,235 | 740,864 | ||||||
| Issued in reinvestment of distributions | — | — | 303 | 2,497 | ||||||
| Redeemed | (98,265 | ) | (839,815 | ) | (22,314 | ) | (189,885 | ) | ||
| (13,874 | ) | (131,322 | ) | 64,224 | 553,476 | |||||
| R6 Class/Shares Authorized | 30,000,000 | 50,000,000 | ||||||||
| Sold | 1,902,631 | 17,049,003 | 1,702,690 | 16,329,589 | ||||||
| Issued in reinvestment of distributions | 6,701 | 59,777 | 14 | 117 | ||||||
| Redeemed | (551,800 | ) | (4,955,049 | ) | (65,076 | ) | (605,538 | ) | ||
| 1,357,532 | 12,153,731 | 1,637,628 | 15,724,168 | |||||||
| Net increase (decrease) | 8,057,453 | $ | 67,583,843 | (4,235,305 | ) | $ | (37,366,838 | ) | ||
6. Fair Value Measurements
The fund’s investments valuation process is based on several considerations and may use multiple inputs to determine the fair value of the investments held by the fund. In conformity with accounting principles generally accepted in the United States of America, the inputs used to determine a valuation are classified into three broad levels.
| • | Level 1 valuation inputs consist of unadjusted quoted prices in an active market for identical investments. |
| • | Level 2 valuation inputs consist of direct or indirect observable market data (including quoted prices for comparable investments, evaluations of subsequent market events, interest rates, prepayment speeds, |
20
credit risk, etc.). These inputs also consist of quoted prices for identical investments initially expressed in local currencies that are adjusted through translation into U.S. dollars.
| • | Level 3 valuation inputs consist of unobservable data (including a fund’s own assumptions). |
The level classification is based on the lowest level input that is significant to the fair valuation measurement. The valuation inputs are not necessarily an indication of the risks associated with investing in these securities or other financial instruments. There were no significant transfers between levels during the period.
The following is a summary of the level classifications as of period end. The Schedule of Investments provides additional information on the fund’s portfolio holdings.
| Level 1 | Level 2 | Level 3 | ||||||
| Assets | ||||||||
| Investment Securities | ||||||||
| Common Stocks | ||||||||
| Brazil | $ | 4,695,207 | $ | 14,822,845 | — | |||
| China | 12,400,848 | 105,834,869 | — | |||||
| India | 4,004,473 | 23,482,002 | — | |||||
| Mexico | 9,199,433 | 19,922,472 | — | |||||
| Peru | 5,714,980 | — | — | |||||
| Other Countries | — | 237,570,010 | — | |||||
| Exchange-Traded Funds | 8,087,643 | — | — | |||||
| Temporary Cash Investments | 1,637,965 | 11,464,672 | — | |||||
| $ | 45,740,549 | $ | 413,096,870 | — | ||||
7. Risk Factors
There are certain risks involved in investing in foreign securities. These risks include those resulting from future adverse political, social and economic developments, fluctuations in currency exchange rates, the possible imposition of exchange controls, and other foreign laws or restrictions. Investing in emerging markets may accentuate these risks.
8. Federal Tax Information
The tax character of distributions paid during the years ended November 30, 2015 and November 30, 2014 were as follows:
| 2015 | 2014 | |||||
| Distributions Paid From | ||||||
| Ordinary income | $ | 378,604 | $ | 1,558,826 | ||
| Long-term capital gains | — | — | ||||
The book-basis character of distributions made during the year from net investment income or net realized gains may differ from their ultimate characterization for federal income tax purposes. These differences reflect the differing character of certain income items and net realized gains and losses for financial statement and tax purposes, and may result in reclassification among certain capital accounts on the financial statements.
21
As of November 30, 2015, the federal tax cost of investments and the components of distributable earnings on a tax-basis were as follows:
| Federal tax cost of investments | $ | 413,381,097 | |
| Gross tax appreciation of investments | $ | 78,746,141 | |
| Gross tax depreciation of investments | (33,289,819 | ) | |
| Net tax appreciation (depreciation) of investments | 45,456,322 | ||
| Net tax appreciation (depreciation) on translation of assets and liabilities in foreign currencies | (17,177 | ) | |
| Net tax appreciation (depreciation) | $ | 45,439,145 | |
| Undistributed ordinary income | $ | 762,888 | |
| Accumulated short-term capital losses | $ | (60,876,446 | ) |
| Post-October capital loss deferral | $ | (779,309 | ) |
The difference between book-basis and tax-basis unrealized appreciation (depreciation) is attributable primarily to the tax deferral of losses on wash sales.
Accumulated capital losses represent net capital loss carryovers that may be used to offset future realized capital gains for federal income tax purposes. Any unlimited losses will be required to be utilized prior to the losses which carry an expiration date. Future capital loss carryover utilization in any given year may be subject to Internal Revenue Code limitations. Capital loss carryovers of $(57,815,598) expire in 2017 and the remaining losses are unlimited.
Loss deferrals represent certain qualified losses that the fund has elected to treat as having been incurred in the following fiscal year for federal income tax purposes.
22
| Financial Highlights |
| For a Share Outstanding Throughout the Years Ended November 30 (except as noted) | |||||||||||||||
| Per-Share Data | Ratios and Supplemental Data | ||||||||||||||
| Income From Investment Operations: | Ratio to Average Net Assets of: | ||||||||||||||
| Net Asset Value, Beginning of Period | Net Investment Income (Loss)(1) | Net Realized and Unrealized Gain (Loss) | Total From Investment Operations | Distributions From Net Investment Income | Net Asset Value, End of Period | Total Return(2) | Operating Expenses | Operating Expenses (before expense waiver) | Net Investment Income (Loss) | Net Investment Income (Loss) (before expense waiver) | Portfolio Turnover Rate | Net Assets, End of Period (in thousands) | |||
| Investor Class | |||||||||||||||
| 2015 | $9.00 | 0.03 | (0.92) | (0.89) | (0.01) | $8.10 | (9.93)% | 1.43% | 1.68% | 0.30% | 0.05% | 58% | $399,694 | ||
| 2014 | $8.87 | 0.03 | 0.13 | 0.16 | (0.03) | $9.00 | 1.84% | 1.45% | 1.70% | 0.29% | 0.04% | 74% | $393,357 | ||
| 2013 | $8.36 | 0.01 | 0.53 | 0.54 | (0.03) | $8.87 | 6.48% | 1.63% | 1.72% | 0.17% | 0.08% | 68% | $421,274 | ||
| 2012 | $7.38 | 0.02 | 0.96 | 0.98 | — | $8.36 | 13.28% | 1.74% | 1.74% | 0.29% | 0.29% | 85% | $452,331 | ||
| 2011 | $8.46 | 0.01 | (1.09) | (1.08) | — | $7.38 | (12.77)% | 1.71% | 1.71% | 0.17% | 0.17% | 71% | $435,079 | ||
| Institutional Class | |||||||||||||||
| 2015 | $9.24 | 0.02 | (0.93) | (0.91) | (0.02) | $8.31 | (9.83)% | 1.23% | 1.48% | 0.50% | 0.25% | 58% | $4,797 | ||
| 2014 | $9.09 | 0.05 | 0.14 | 0.19 | (0.04) | $9.24 | 2.07% | 1.25% | 1.50% | 0.49% | 0.24% | 74% | $16,300 | ||
| 2013 | $8.56 | 0.03 | 0.55 | 0.58 | (0.05) | $9.09 | 6.77% | 1.43% | 1.52% | 0.37% | 0.28% | 68% | $32,452 | ||
| 2012 | $7.56 | 0.04 | 0.97 | 1.01 | (0.01) | $8.56 | 13.43% | 1.54% | 1.54% | 0.49% | 0.49% | 85% | $28,536 | ||
| 2011 | $8.65 | 0.03 | (1.12) | (1.09) | — | $7.56 | (12.60)% | 1.51% | 1.51% | 0.37% | 0.37% | 71% | $29,695 | ||
| A Class | |||||||||||||||
| 2015 | $8.70 | 0.01 | (0.89) | (0.88) | — | $7.82 | (10.11)% | 1.68% | 1.93% | 0.05% | (0.20)% | 58% | $25,632 | ||
| 2014 | $8.59 | 0.01 | 0.12 | 0.13 | (0.02) | $8.70 | 1.59% | 1.70% | 1.95% | 0.04% | (0.21)% | 74% | $9,278 | ||
| 2013 | $8.09 | (0.01) | 0.52 | 0.51 | (0.01) | $8.59 | 6.30% | 1.88% | 1.97% | (0.08)% | (0.17)% | 68% | $11,575 | ||
| 2012 | $7.16 | —(3) | 0.93 | 0.93 | — | $8.09 | 12.99% | 1.99% | 1.99% | 0.04% | 0.04% | 85% | $13,745 | ||
| 2011 | $8.23 | (0.01) | (1.06) | (1.07) | — | $7.16 | (13.00)% | 1.96% | 1.96% | (0.08)% | (0.08)% | 71% | $15,339 | ||
23
| For a Share Outstanding Throughout the Years Ended November 30 (except as noted) | |||||||||||||||
| Per-Share Data | Ratios and Supplemental Data | ||||||||||||||
| Income From Investment Operations: | Ratio to Average Net Assets of: | ||||||||||||||
| Net Asset Value, Beginning of Period | Net Investment Income (Loss)(1) | Net Realized and Unrealized Gain (Loss) | Total From Investment Operations | Distributions From Net Investment Income | Net Asset Value, End of Period | Total Return(2) | Operating Expenses | Operating Expenses (before expense waiver) | Net Investment Income (Loss) | Net Investment Income (Loss) (before expense waiver) | Portfolio Turnover Rate | Net Assets, End of Period (in thousands) | |||
| C Class | |||||||||||||||
| 2015 | $8.15 | (0.05) | (0.82) | (0.87) | — | $7.28 | (10.67)% | 2.43% | 2.68% | (0.70)% | (0.95)% | 58% | $3,149 | ||
| 2014 | $8.09 | (0.06) | 0.13 | 0.07 | (0.01) | $8.15 | 0.82% | 2.45% | 2.70% | (0.71)% | (0.96)% | 74% | $3,129 | ||
| 2013 | $7.67 | (0.06) | 0.48 | 0.42 | — | $8.09 | 5.48% | 2.63% | 2.72% | (0.83)% | (0.92)% | 68% | $3,571 | ||
| 2012 | $6.84 | (0.05) | 0.88 | 0.83 | — | $7.67 | 12.13% | 2.74% | 2.74% | (0.71)% | (0.71)% | 85% | $3,376 | ||
| 2011 | $7.93 | (0.07) | (1.02) | (1.09) | — | $6.84 | (13.75)% | 2.71% | 2.71% | (0.83)% | (0.83)% | 71% | $3,896 | ||
| R Class | |||||||||||||||
| 2015 | $8.82 | (0.02) | (0.90) | (0.92) | — | $7.90 | (10.43)% | 1.93% | 2.18% | (0.20)% | (0.45)% | 58% | $1,425 | ||
| 2014 | $8.72 | (0.02) | 0.14 | 0.12 | (0.02) | $8.82 | 1.38% | 1.95% | 2.20% | (0.21)% | (0.46)% | 74% | $1,712 | ||
| 2013 | $8.23 | (0.02) | 0.51 | 0.49 | — | $8.72 | 5.95% | 2.13% | 2.22% | (0.33)% | (0.42)% | 68% | $1,133 | ||
| 2012 | $7.30 | (0.02) | 0.95 | 0.93 | — | $8.23 | 12.74% | 2.24% | 2.24% | (0.21)% | (0.21)% | 85% | $824 | ||
| 2011 | $8.42 | (0.03) | (1.09) | (1.12) | — | $7.30 | (13.30)% | 2.21% | 2.21% | (0.33)% | (0.33)% | 71% | $631 | ||
| R6 Class | |||||||||||||||
| 2015 | $9.25 | 0.07 | (0.95) | (0.88) | (0.04) | $8.33 | (9.58)% | 1.08% | 1.33% | 0.65% | 0.40% | 58% | $24,965 | ||
| 2014 | $9.09 | —(3) | 0.20 | 0.20 | (0.04) | $9.25 | 2.23% | 1.10% | 1.35% | 0.64% | 0.39% | 74% | $15,174 | ||
2013(4) | $8.46 | —(3) | 0.63 | 0.63 | – | $9.09 | 7.45% | 1.12%(5) | 1.37%(5) | 0.14%(5) | (0.11)%(5) | 68%(6) | $27 | ||
24
| Notes to Financial Highlights | |
| (1) | Computed using average shares outstanding throughout the period. |
| (2) | Total returns are calculated based on the net asset value of the last business day and do not reflect applicable sales charges, if any. Total returns for periods less than one year are not annualized. |
| (3) | Per-share amount was less than $0.005. |
| (4) | July 26, 2013 (commencement of sale) through November 30, 2013. |
| (5) | Annualized. |
| (6) | Portfolio turnover is calculated at the fund level. Percentage indicated was calculated for the year ended November 30, 2013. |
See Notes to Financial Statements.
25
| Report of Independent Registered Public Accounting Firm |
To the Board of Directors and Shareholders of American Century World Mutual Funds, Inc.:
We have audited the accompanying statement of assets and liabilities, including the schedule of investments, of Emerging Markets Fund (the “Fund”), one of the funds constituting American Century World Mutual Funds, Inc., as of November 30, 2015, and the related statement of operations for the year then ended, the statements of changes in net assets for each of the two years in the period then ended, and the financial highlights for each of the periods presented. These financial statements and financial highlights are the responsibility of the Fund’s management. Our responsibility is to express an opinion on these financial statements and financial highlights based on our audits.
We conducted our audits in accordance with the standards of the Public Company Accounting Oversight Board (United States). Those standards require that we plan and perform the audit to obtain reasonable assurance about whether the financial statements and financial highlights are free of material misstatement. The Fund is not required to have, nor were we engaged to perform, an audit of its internal control over financial reporting. Our audits included consideration of internal control over financial reporting as a basis for designing audit procedures that are appropriate in the circumstances, but not for the purpose of expressing an opinion on the effectiveness of the Fund’s internal control over financial reporting. Accordingly, we express no such opinion. An audit also includes examining, on a test basis, evidence supporting the amounts and disclosures in the financial statements, assessing the accounting principles used and significant estimates made by management, as well as evaluating the overall financial statement presentation. Our procedures included confirmation of securities owned as of November 30, 2015, by correspondence with the custodian and brokers; when replies were not received from brokers, we performed other auditing procedures. We believe that our audits provide a reasonable basis for our opinion.
In our opinion, the financial statements and financial highlights referred to above present fairly, in all material respects, the financial position of Emerging Markets Fund of American Century World Mutual Funds, Inc. as of November 30, 2015, the results of its operations for the year then ended, the changes in its net assets for each of the two years in the period then ended, and the financial highlights for each of the periods presented, in conformity with accounting principles generally accepted in the United States of America.
DELOITTE & TOUCHE LLP
Kansas City, Missouri
January 19, 2016
26
| Management |
The Board of Directors
The individuals listed below serve as directors of the funds. Each director will continue to serve in this capacity until death, retirement, resignation or removal from office. The board has adopted a mandatory retirement age for directors who are not “interested persons,” as that term is defined in the Investment Company Act (independent directors). Independent directors shall retire by December 31 of the year in which they reach their 75th birthday.
Mr. Thomas is an “interested person” because he currently serves as President and Chief Executive Officer of American Century Companies, Inc. (ACC), the parent company of American Century Investment Management, Inc. (ACIM or the advisor). Mr. Fink is treated as an “interested person” because of his recent employment with ACC and American Century Services, LLC (ACS). The other directors (more than three-fourths of the total number) are independent. They are not employees, directors or officers of, and have no financial interest in, ACC or any of its wholly owned, direct or indirect, subsidiaries, including ACIM, American Century Investment Services, Inc. (ACIS) and ACS, and they do not have any other affiliations, positions or relationships that would cause them to be considered “interested persons” under the Investment Company Act. The directors serve in this capacity for seven (in the case of Mr. Thomas, 15) registered investment companies in the American Century Investments family of funds.
The following table presents additional information about the directors. The mailing address for each director is 4500 Main Street, Kansas City, Missouri 64111.
Name (Year of Birth) | Position(s) Held with Funds | Length of Time Served | Principal Occupation(s) During Past 5 Years | Number of American Century Portfolios Overseen by Director | Other Directorships Held During Past 5 Years |
| Independent Directors | |||||
Thomas A. Brown(1) (1940) | Director | Since 1980 | Managing Member, Associated Investments, LLC (real estate investment company) | 80 | None |
| Andrea C. Hall (1945) | Director | Since 1997 | Retired | 80 | None |
| Jan M. Lewis (1957) | Director | Since 2011 | Retired; President and Chief Executive Officer, Catholic Charities of Northeast Kansas (human services organization) (2006 to 2013) | 80 | None |
| James A. Olson (1942) | Director and Chairman of the Board | Since 2007 (Chairman since 2014) | Member, Plaza Belmont LLC (private equity fund manager) | 80 | Saia, Inc. (2002 to 2012) and EPR Properties (2003 to 2013) |
| M. Jeannine Strandjord (1945) | Director | Since 1994 | Retired | 80 | Euronet Worldwide Inc.; MGP Ingredients, Inc.; Charming Shoppes, Inc. (2006 to 2010); and DST Systems Inc. (1996 to 2012) |
| John R. Whitten (1946) | Director | Since 2008 | Retired | 80 | Rudolph Technologies, Inc. |
27
| Name (Year of Birth) | Position(s) Held with Funds | Length of Time Served | Principal Occupation(s) During Past 5 Years | Number of American Century Portfolios Overseen by Director | Other Directorships Held During Past 5 Years |
| Independent Directors | |||||
| Stephen E. Yates (1948) | Director | Since 2012 | Retired; Executive Vice President, Technology & Operations, KeyCorp. (computer services) (2004 to 2010) | 80 | Applied Industrial Technologies, Inc. (2001 to 2010) |
| Interested Directors | |||||
| Barry Fink (1955) | Director | Since 2012 | Retired; Executive Vice President, ACC (September 2007 to February 2013); President, ACS (October 2007 to February 2013); Chief Operating Officer, ACC (September 2007 to November 2012) | 80 | None |
| Jonathan S. Thomas (1963) | Director and President | Since 2007 | President and Chief Executive Officer, ACC (March 2007 to present). Also serves as Chief Executive Officer, ACS; Executive Vice President, ACIM; Director, ACC, ACIM and other ACC subsidiaries | 125 | BioMed Valley Discoveries, Inc. |
(1) Thomas A. Brown retired as Director of the Board effective December 31, 2015.
The Statement of Additional Information has additional information about the fund's directors and is available without charge, upon request, by calling 1-800-345-2021.
28
Officers
The following table presents certain information about the executive officers of the funds. Each officer serves as an officer for each of the 15 investment companies in the American Century family of funds, unless otherwise noted. No officer is compensated for his or her service as an officer of the funds. The listed officers are interested persons of the funds and are appointed or re-appointed on an annual basis. The mailing address for each officer listed below is 4500 Main Street, Kansas City, Missouri 64111.
Name (Year of Birth) | Offices with the Funds | Principal Occupation(s) During the Past Five Years |
| Jonathan S. Thomas (1963) | Director and President since 2007 | President and Chief Executive Officer, ACC (March 2007 to present). Also serves as Chief Executive Officer, ACS; Executive Vice President, ACIM; Director, ACC, ACIM and other ACC subsidiaries |
| Amy D. Shelton (1964) | Chief Compliance Officer and Vice President since 2014 | Chief Compliance Officer, American Century funds, (March 2014 to present); Chief Compliance Officer, ACIM (February 2014 to present); Chief Compliance Officer, ACIS (October 2009 to present); Vice President, Client Interactions and Marketing, ACIS (February 2013 to January 2014); Director, Client Interactions and Marketing, ACIS (June 2007 to January 2013). Also serves as Vice President, ACIS |
| Charles A. Etherington (1957) | General Counsel since 2007 and Senior Vice President since 2006 | Attorney, ACC (February 1994 to present); Vice President, ACC (November 2005 to present); General Counsel, ACC (March 2007 to present). Also serves as General Counsel, ACIM, ACS, ACIS and other ACC subsidiaries; and Senior Vice President, ACIM and ACS |
| C. Jean Wade (1964) | Vice President, Treasurer and Chief Financial Officer since 2012 | Vice President, ACS (February 2000 to present) |
| Robert J. Leach (1966) | Vice President since 2006 and Assistant Treasurer since 2012 | Vice President, ACS (February 2000 to present) |
| David H. Reinmiller (1963) | Vice President since 2000 | Attorney, ACC (January 1994 to present); Associate General Counsel, ACC (January 2001 to present). Also serves as Vice President, ACIM and ACS |
| Ward D. Stauffer (1960) | Secretary since 2005 | Attorney, ACC (June 2003 to present) |
29
| Approval of Management Agreement |
At a meeting held on June 30, 2015, the Fund’s Board of Directors unanimously approved the renewal of the management agreement pursuant to which American Century Investment Management, Inc. (the “Advisor”) acts as the investment advisor for the Fund. Under Section 15(c) of the Investment Company Act, contracts for investment advisory services are required to be reviewed, evaluated, and approved by a majority of a fund’s directors (the “Directors”), including a majority of the independent Directors, each year.
Prior to its consideration of the renewal of the management agreement, the Directors requested and reviewed extensive data and information compiled by the Advisor and certain independent providers of evaluation data concerning the Fund and the services provided to the Fund by the Advisor. This review was in addition to the oversight and evaluation undertaken by the Board and its committees on a continuous basis and the information received was supplemental to the extensive information that the Board and its committees receive and consider throughout the year.
In connection with its consideration of the renewal of the management agreement, the Board’s review and evaluation of the services provided by the Advisor included, but was not limited to, the following:
| • | the nature, extent, and quality of investment management, shareholder services, and other services provided by the Advisor to the Fund; |
| • | the wide range of other programs and services the Advisor provides to the Fund and its shareholders on a routine and non-routine basis; |
| • | the Fund’s investment performance compared to appropriate benchmarks and/or a peer group of other mutual funds with similar investment objectives and strategies; |
| • | the cost of owning the Fund compared to the cost of owning similar funds; |
| • | the compliance policies, procedures, and regulatory experience of the Fund's service providers; |
| • | financial data showing the cost of services provided to the Fund, the profitability of the Fund to the Advisor, and the overall profitability of the Advisor; |
| • | possible economies of scale associated with the Advisor’s management of the Fund and other accounts under its management; |
| • | data comparing services provided and charges to the Advisor's other investment management clients; |
| • | acquired fund fees and expenses; |
| • | payments by the Fund and the Advisor to financial intermediaries; and |
| • | any collateral benefits derived by the Advisor from the management of the Fund. |
In keeping with their practice, the Directors held two in-person meetings and one telephonic meeting to review and discuss the information provided. The independent Directors also had the benefit of the advice of their independent counsel throughout the process.
Factors Considered
The Directors considered all of the information provided by the Advisor, the independent data providers, and independent counsel in connection with the approval. They determined that the information was sufficient for them to evaluate the management agreement for the Fund. In connection with their review, the Directors did not identify any single factor as being all-important or controlling, and each Director may have attributed different levels of importance to different factors. In deciding to renew the management agreement, the Board based its decision on a number of factors, including the following:
30
Nature, Extent and Quality of Services - Generally. Under the management agreement, the Advisor is responsible for providing or arranging for all services necessary for the operation of the
Fund. The Board noted that under the management agreement, the Advisor provides or arranges at its own expense a wide variety of services including:
| • | constructing and designing the Fund |
| • | portfolio research and security selection |
| • | initial capitalization/funding |
| • | securities trading |
| • | Fund administration |
| • | custody of Fund assets |
| • | daily valuation of the Fund’s portfolio |
| • | shareholder servicing and transfer agency, including shareholder confirmations, recordkeeping, and communications |
| • | legal services (except the independent Directors’ counsel) |
| • | regulatory and portfolio compliance |
| • | financial reporting |
| • | marketing and distribution (except Rule 12b-1 plans) |
The Board noted that many of these services have expanded over time both in terms of quantity and complexity in response to shareholder demands, competition in the industry, changing distribution channels, and the changing regulatory environment.
Investment Management Services. The nature of the investment management services provided to the Fund is quite complex and allows Fund shareholders access to professional money management, instant diversification of their investments within an asset class, the opportunity to easily diversify among asset classes by investing in or exchanging among various American Century Investments funds, and liquidity. In evaluating investment performance, the Board expects the Advisor to manage the Fund in accordance with its investment objectives and approved strategies. Further, the Directors recognize that the Advisor has an obligation to monitor trading activities, and in particular to seek the best execution of fund trades, and to evaluate the use of and payment for research. In providing these services, the Advisor utilizes teams of investment professionals (portfolio managers, analysts, research assistants, and securities traders) who require extensive information technology, research, training, compliance and other systems to conduct their business. The Board, directly and through its Fund Performance Review Committee, regularly reviews investment performance information for the Fund, together with comparative information for appropriate benchmarks and/or peer groups of similarly-managed funds, over different time horizons. The Directors also review detailed performance information during the management agreement approval process. If performance concerns are identified, the Fund receives special reviews until performance improves, during which the Board discusses with the Advisor the reasons for such results (e.g., market conditions, security selection) and any efforts being undertaken to improve performance. The Fund’s performance was above its benchmark for the one-, three-, five-, and ten-year periods reviewed by the Board. The Board found the investment management services provided by the Advisor to the Fund to be satisfactory and consistent with the management agreement.
Shareholder and Other Services. Under the management agreement, the Advisor provides the Fund with a comprehensive package of transfer agency, shareholder, and other services. The Board, directly and through various committees of the Board, regularly reviews reports and evaluations of such services at its regular meetings. These reports include, but are not limited to, information regarding the operational efficiency and accuracy of the shareholder and transfer agency services provided, staffing levels, shareholder satisfaction (as measured by external as well as internal sources), technology support, new products and services offered to Fund shareholders, securities trading activities, portfolio valuation services, auditing services, and legal and operational compliance activities. The Board particularly noted the Advisor’s continual efforts to maintain effective business continuity plans and to address cybersecurity threats. Certain aspects of shareholder and transfer agency service level efficiency and the quality of securities trading
31
activities are measured by independent third party providers and are presented in comparison to other fund groups not managed by the Advisor. The Board found the services provided by the Advisor to the Fund under the management agreement to be competitive and of high quality.
Costs of Services and Profitability. The Advisor provides detailed information concerning its cost of providing various services to the Fund, its profitability in managing the Fund (pre- and post-distribution), its overall profitability, and its financial condition. The Directors have reviewed with the Advisor the methodology used to prepare this financial information. This information is considered in evaluating the Advisor’s financial condition, its ability to continue to provide services under the management agreement, and the reasonableness of the current management fee. The Board concluded that the Advisor’s profits were reasonable in light of the services provided to the Fund.
Ethics. The Board generally considers the Advisor’s commitment to providing quality services to shareholders and to conducting its business ethically. They noted that the Advisor’s practices generally meet or exceed industry best practices.
Economies of Scale. The Board also reviewed information provided by the Advisor regarding the possible existence of economies of scale in connection with the management of the Fund. The Board concluded that economies of scale are difficult to measure and predict with precision, especially on a fund-by-fund basis. The Board concluded that the Advisor is appropriately sharing economies of scale through its competitive fee structure, offering competitive fees from fund inception, and through reinvestment in its business to provide shareholders additional content and services. The Board also noted that economies of scale are shared with the Fund and its shareholders through management fee breakpoints that serve to reduce the effective management fee as the assets of the Fund grow.
Comparison to Other Funds’ Fees. The management agreement provides that the Fund pays the Advisor a single, all-inclusive (or unified) management fee for providing all services necessary for the management and operation of the Fund, other than brokerage expenses, taxes, interest, extraordinary expenses, and the fees and expenses of the Fund’s independent Directors (including their independent legal counsel) and expenses incurred in connection with the provision of shareholder services and distribution services under a plan adopted pursuant to Rule 12b-1 under the 1940 Act. Under the unified fee structure, the Advisor is responsible for providing all investment advisory, custody, audit, administrative, compliance, recordkeeping, marketing and shareholder services, or arranging and supervising third parties to provide such services. By contrast, most other funds are charged a variety of fees, including an investment advisory fee, a transfer agency fee, an administrative fee, distribution charges, and other expenses. Other than their investment advisory fees and any applicable Rule 12b-1 distribution fees, all other components of the total fees charged by these other funds may be increased without shareholder approval. The Board believes the unified fee structure is a benefit to Fund shareholders because it clearly discloses to shareholders the cost of owning Fund shares, and, since the unified fee cannot be increased without a vote of Fund shareholders, it shifts to the Advisor the risk of increased costs of operating the Fund and provides a direct incentive to minimize administrative inefficiencies. Part of the Board’s analysis of fee levels involves reviewing certain evaluative data compiled by an independent provider comparing the Fund’s unified fee to the total expense ratios of its peers. The unified fee charged to shareholders of the Fund was above the median of the total expense ratios of the Fund’s peer expense universe and was within the range of its peer expense group. The Board concluded that the management fee paid by the Fund to the Advisor under the management agreement is reasonable in light of the services provided to the Fund.
32
Comparison to Fees and Services Provided to Other Clients of the Advisor. The Directors also requested and received information from the Advisor concerning the nature of the services, fees, costs and profitability of its advisory services to advisory clients other than the Fund. They observed that these varying types of client accounts require different services and involve different regulatory and entrepreneurial risks than the management of the Fund. The Board analyzed this information and concluded that the fees charged and services provided to the Fund were reasonable by comparison.
Payments to Intermediaries. The Directors also requested and received a description of payments made to intermediaries by the Fund and the Advisor. These payments include various payments made by the Fund or the Advisor to different types of intermediaries and recordkeepers for distribution and service activities provided for the Fund. The Board reviewed such information and found the payments to be reasonable in scope and purpose.
Collateral or “Fall-Out” Benefits Derived by the Advisor. The Board considered the existence of collateral benefits the Advisor may receive as a result of its relationship with the Fund. They concluded that the Advisor’s primary business is managing mutual funds and it generally does not use fund or shareholder information to generate profits in other lines of business, and therefore does not derive any significant collateral benefits from them. The Board noted that additional assets from other clients may offer the Advisor some benefit from increased leverage with service providers and counterparties. Additionally, the Advisor receives proprietary research from broker-dealers that execute fund portfolio transactions, which the Board concluded is likely to benefit other clients of the Advisor as well as Fund shareholders. The Board also determined that the Advisor is able to provide investment management services to certain clients other than the Fund, at least in part, due to its existing infrastructure built to serve the fund complex. The Board concluded that appropriate allocation methodologies had been employed to assign resources and the cost of those resources to these other clients and, where expressly provided, these other client assets may be included with the assets of the Fund to determine breakpoints in the management fee schedule.
Existing Relationship. The Board also considered whether there was any reason for not continuing the existing arrangement with the Advisor. In this regard, the Board was mindful of the potential disruptions of the Fund’s operations and various risks, uncertainties, and other effects that could occur as a result of a decision not to continue such relationship. In particular, the Board recognized that most shareholders have invested in the Fund on the strength of the Advisor’s industry standing and reputation and in the expectation that the Advisor will have a continuing role in providing advisory services to the Fund.
Conclusion of the Directors. As a result of this process, the Board, including all of the independent Directors, taking into account all of the factors discussed above and the information provided by the Advisor and others in connection with its review and throughout the year, determined that the management fee is fair and reasonable in light of the services provided and that the investment management agreement between the Fund and the Advisor should be renewed.
33
| Additional Information |
Retirement Account Information
As required by law, distributions you receive from certain IRAs are subject to federal income tax withholding, unless you elect not to have withholding apply. Tax will be withheld on the total amount withdrawn even though you may be receiving amounts that are not subject to withholding, such as nondeductible contributions. In such case, excess amounts of withholding could occur. You may adjust your withholding election so that a greater or lesser amount will be withheld.
If you don’t want us to withhold on this amount, you must notify us to not withhold the federal income tax. You may notify us in writing or in certain situations by telephone or through other electronic means. For systematic withdrawals, your withholding election will remain in effect until revoked or changed by filing a new election. You have the right to revoke your election at any time.
Remember, even if you elect not to have income tax withheld, you are liable for paying income tax on the taxable portion of your withdrawal. If you elect not to have income tax withheld or you don’t have enough income tax withheld, you may be responsible for payment of estimated tax. You may incur penalties under the estimated tax rules if your withholding and estimated tax payments are not sufficient. You can reduce or defer the income tax on a distribution by directly or indirectly rolling such distribution over to another IRA or eligible plan. You should consult your tax advisor for additional information.
State tax will be withheld if, at the time of your distribution, your address is within one of the mandatory withholding states and you have federal income tax withheld (or as otherwise required by state law). State taxes will be withheld from your distribution in accordance with the respective state rules.
Distributions you receive from 403(b), 457 and qualified plans are subject to special tax and withholding rules. Your plan administrator or plan sponsor is required to provide you with a special tax notice explaining those rules at the time you request a distribution. If applicable, federal and/or state taxes may be withheld from your distribution amount.
Proxy Voting Policies
A description of the policies that the fund's investment advisor uses in exercising the voting rights associated with the securities purchased and/or held by the fund is available without charge, upon request, by calling 1-800-345-2021. It is also available on the "About Us" page of American Century Investments’ website at americancentury.com and on the Securities and Exchange Commission’s website at sec.gov. Information regarding how the investment advisor voted proxies relating to portfolio securities during the most recent 12-month period ended June 30 is available on the "About Us" page at americancentury.com. It is also available at sec.gov.
Quarterly Portfolio Disclosure
The fund files its complete schedule of portfolio holdings with the Securities and Exchange Commission (SEC) for the first and third quarters of each fiscal year on Form N-Q. The fund’s Forms N-Q are available on the SEC’s website at sec.gov, and may be reviewed and copied at the SEC’s Public Reference Room in Washington, DC. Information on the operation of the Public Reference Room may be obtained by calling 1-800-SEC-0330. The fund also makes its complete schedule of portfolio holdings for the most recent quarter of its fiscal year available on its
website at americancentury.com and, upon request, by calling 1-800-345-2021.
34
Other Tax Information
The following information is provided pursuant to provisions of the Internal Revenue Code.
The fund hereby designates up to the maximum amount allowable as qualified dividend income for the fiscal year ended November 30, 2015.
For the fiscal year ended November 30, 2015, the fund intends to pass through to shareholders foreign source income of $8,484,052 and foreign taxes paid of $867,311, or up to the maximum amount allowable, as a foreign tax credit. Foreign source income and foreign tax expense per outstanding share on November 30, 2015 are $0.1494 and $0.0153, respectively.
35
| Notes |
36
| ||
| Contact Us | americancentury.com | |
| Automated Information Line | 1-800-345-8765 | |
| Investor Services Representative | 1-800-345-2021 or 816-531-5575 | |
| Investors Using Advisors | 1-800-378-9878 | |
| Business, Not-For-Profit, Employer-Sponsored Retirement Plans | 1-800-345-3533 | |
| Banks and Trust Companies, Broker-Dealers, Financial Professionals, Insurance Companies | 1-800-345-6488 | |
| Telecommunications Relay Service for the Deaf | 711 | |
| American Century World Mutual Funds, Inc. | ||
Investment Advisor: American Century Investment Management, Inc. Kansas City, Missouri | ||
| This report and the statements it contains are submitted for the general information of our shareholders. The report is not authorized for distribution to prospective investors unless preceded or accompanied by an effective prospectus. | ||
| ©2016 American Century Proprietary Holdings, Inc. All rights reserved. CL-ANN-87753 1601 | ||
| ANNUAL REPORT | NOVEMBER 30, 2015 |
Global Growth Fund
| Table of Contents |
| President’s Letter | 2 | |
| Performance | 3 | |
| Portfolio Commentary | ||
| Fund Characteristics | ||
| Shareholder Fee Example | ||
| Schedule of Investments | ||
| Statement of Assets and Liabilities | ||
| Statement of Operations | ||
| Statement of Changes in Net Assets | ||
| Notes to Financial Statements | ||
| Financial Highlights | ||
| Report of Independent Registered Public Accounting Firm | ||
| Management | ||
| Approval of Management Agreement | ||
| Additional Information | ||
Any opinions expressed in this report reflect those of the author as of the date of the report, and do not necessarily represent the opinions of American Century Investments® or any other person in the American Century Investments organization. Any such opinions are subject to change at any time based upon market or other conditions and American Century Investments disclaims any responsibility to update such opinions. These opinions may not be relied upon as investment advice and, because investment decisions made by American Century Investments funds are based on numerous factors, may not be relied upon as an indication of trading intent on behalf of any American Century Investments fund. Security examples are used for representational purposes only and are not intended as recommendations to purchase or sell securities. Performance information for comparative indices and securities is provided to American Century Investments by third party vendors. To the best of American Century Investments’ knowledge, such information is accurate at the time of printing.
| President’s Letter |
| Dear Investor: Thank you for reviewing this annual report for the 12 months ended November 30, 2015. It provides investment performance and portfolio information for the reporting period, plus longer-term historical performance data. Annual reports remain important vehicles for conveying information about fund performance, including market and economic factors that affected returns during the reporting period. For additional, updated investment and market insights, we encourage you to visit our website, americancentury.com. |
| Jonathan Thomas | |
Divergence in Economic Growth and Monetary Policies, Combined With China Turmoil, Triggered Market Volatility
Divergence between the U.S. and the rest of the world—along with China’s struggles, plunging commodity prices, capital market volatility, and risk-off trading—were dominant themes during the reporting period. Global divergence described not only the relatively stronger economic growth enjoyed by the U.S. compared with most of the world, but also the related contrast between the U.S. Federal Reserve’s (the Fed’s) unwinding of monetary stimulus versus the continuation and expansion of stimulus by other major central banks.
In 2014, the Fed ended its latest massive bond-buying program (quantitative easing, QE), leading to expectations that interest rates would soar in 2015. But while QE was halted in the U.S., other major central banks were starting or increasing QE as their economies faltered, particularly the European Central Bank, the Bank of Japan, and the People’s Bank of China. This monetary policy divergence helped fuel increased demand for the U.S. dollar and U.S. dollar-denominated assets, and put downward pressure on commodity prices, most notably crude oil, which declined approximately 40% for the reporting period. Low inflation also prevailed after oil prices plunged amid a supply glut and muted demand for commodities in general, especially as China’s economy slowed. In this environment, the U.S. dollar, U.S. growth stocks, and U.S. municipal bonds generally benefited from “flight to quality” capital flows, while emerging market and commodity-related investments suffered significant declines.
We expect continued economic and monetary policy divergence between the U.S. and non-U.S. economies in 2016, accompanied by further market volatility. This could present both challenges and opportunities for active investment managers. In this environment, we continue to believe in a disciplined, diversified, long-term investment approach, using professionally managed stock and bond portfolios to meet financial goals. We appreciate your continued trust in us in the coming year.
Sincerely,
Jonathan Thomas
President and Chief Executive Officer
American Century Investments
2
| Performance |
| Total Returns as of November 30, 2015 | ||||||
Average Annual Returns | ||||||
Ticker Symbol | 1 year | 5 years | 10 years | Since Inception | Inception Date | |
Investor Class | TWGGX | 1.37% | 10.19% | 6.79% | 8.24% | 12/1/98 |
MSCI World Index | — | -0.72% | 9.51% | 5.39% | 4.45%(1) | — |
| Institutional Class | AGGIX | 1.60% | 10.42% | 7.00% | 4.50% | 8/1/00 |
A Class(2) | AGGRX | 2/5/99 | ||||
| No sales charge* | 1.14% | 9.93% | 6.52% | 7.37% | ||
| With sales charge* | -4.71% | 8.63% | 5.89% | 6.99% | ||
| C Class | AGLCX | 0.40% | 9.09% | 5.72% | 6.70% | 3/1/02 |
| R Class | AGORX | 0.89% | 9.64% | 6.26% | 6.63% | 7/29/05 |
| R6 Class | AGGDX | 1.76% | — | — | 9.03% | 7/26/13 |
* Sales charges include initial sales charges and contingent deferred sales charges (CDSCs), as applicable. A Class shares have a 5.75% maximum initial sales charge and may be subject to a maximum CDSC of 1.00%. C Class shares redeemed within 12 months of purchase are subject to a maximum CDSC of 1.00%. The SEC requires that mutual funds provide performance information net of maximum sales charges in all cases where charges could be applied.
| (1) | Since November 30, 1998, the date nearest the Investor Class’s inception for which data are available. |
| (2) | Prior to September 4, 2007, the A Class was referred to as the Advisor Class and did not have a front-end sales charge. Performance prior to that date has been adjusted to reflect this charge. |
Data presented reflect past performance. Past performance is no guarantee of future results. Current performance may be higher or lower than the performance shown. Investment return and principal value will fluctuate, and redemption value may be more or less than original cost. Data assumes reinvestment of dividends and capital gains, and none of the charts reflect the deduction of taxes that a shareholder would pay on fund distributions or the redemption of fund shares. To obtain performance data current to the most recent month end, please call 1-800-345-2021 or visit americancentury.com. For additional information about the fund, please consult the prospectus.
3
| Growth of $10,000 Over 10 Years |
| $10,000 investment made November 30, 2005 |
| Performance for other share classes will vary due to differences in fee structure. |
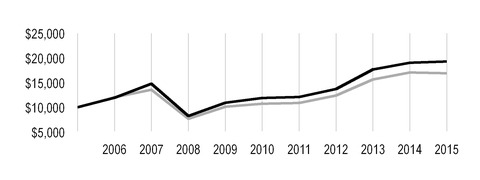
| Value on November 30, 2015 | |
| Investor Class — $19,287 | |
| MSCI World Index — $16,914 | |
Total Annual Fund Operating Expenses | |||||
Investor Class | Institutional Class | A Class | C Class | R Class | R6 Class |
| 1.08% | 0.88% | 1.33% | 2.08% | 1.58% | 0.73% |
The total annual fund operating expenses shown is as stated in the fund’s prospectus current as of the date of this report. The prospectus may vary from the expense ratio shown elsewhere in this report because it is based on a different time period, includes acquired fund fees and expenses, and, if applicable, does not include fee waivers or expense reimbursements.
Data presented reflect past performance. Past performance is no guarantee of future results. Current performance may be higher or lower than the performance shown. Investment return and principal value will fluctuate, and redemption value may be more or less than original cost. Data assumes reinvestment of dividends and capital gains, and none of the charts reflect the deduction of taxes that a shareholder would pay on fund distributions or the redemption of fund shares. To obtain performance data current to the most recent month end, please call 1-800-345-2021 or visit americancentury.com. For additional information about the fund, please consult the prospectus.
4
| Portfolio Commentary |
Portfolio Managers: Keith Creveling, Brent Puff, and Ted Harlan
Performance Summary
Global Growth returned 1.37%* for the 12 months ended November 30, 2015, outperforming its benchmark, the MSCI World Index, which returned -0.72%.
During a period of disappointing global growth, falling oil and commodity prices, and geo-political instability, most global indices produced declines. Notable exceptions included U.S. stocks, which managed modest advances amid economic growth that surpassed most of the rest of the world. Japanese equities also outperformed, bolstered by a weak yen that supported an exporter-led rally. Small- and mid-cap holdings generally outpaced large-cap stocks, and global growth equities again outperformed global value stocks.
Geographically, stock selection in the U.S. was a leading driver of the fund’s outperformance, while select emerging markets holdings and security selection in Switzerland and the U.K. dampened results. On a sector basis, security selection in the information technology sector drove relative results. Financials sector investments also contributed favorably to performance. Conversely, industrials sector holdings and several investments in emerging markets pressured relative gains.
Information Technology Sector Drove Relative Gains
Internet software and services providers were leading contributors to the fund’s gains in the information technology sector. Overweight positions, relative to the benchmark, in two U.S.-based holdings were key contributors to the sector’s results. Alphabet, the parent company of Google, advanced after the leader in online search announced a reorganization with plans to separate its core businesses, including search, YouTube and Android, from other ventures such as its Google X research lab, Nest, and Google Fiber. Later in the period, the company’s third-quarter financial results surpassed expectations, with growth in mobile search and YouTube the main drivers of revenue gains. Facebook was a leading driver of outperformance as the social networking site’s stock price rose to record highs on ongoing gains in mobile advertising revenues driven by rising user engagement for both its flagship brand as well as Instagram, which led to strong earnings and revenue gains.
The financials sector’s outperformance was attributed primarily to several investments in specialty real estate investment trusts (REITs). U.S.-based data-center operator Equinix, the largest contributor, gained steadily over the course of the period, driven by continued strength in tenant demand and plans to acquire U.K.-based TeleCity Group, which will create Europe’s largest data center operator.
Elsewhere, several retail holdings in the consumer discretionary sector made key contributions. U.S.-based The Home Depot benefited from the ongoing improvement in employment and the rise in U.S. home prices, which has helped to drive consumer spending on home-improvement projects. Several consecutive quarters of stronger-than-expected revenue and earnings propelled the home improvement retailer’s stock to reach record levels. An overweight position in U.S.-based Amazon.com also bolstered results. The internet retailer’s stock price steadily gained over the course of the year on rising revenues and earnings, driven in large part by the strength of its cloud computing business.
| * | All fund returns referenced in this commentary are for Investor Class shares. Performance for other share classes will vary due to differences in fee structure; when Investor Class performance exceeds that of the fund's benchmark, other share classes may not. See page 3 for returns for all share classes. |
5
Industrials Holdings Main Detractors
Overweight positioning in a number of U.S. railway operators contributed to the industrials sector’s underperformance. U.S.-based Union Pacific and its peer Kansas City Southern were both hurt by a decline in cargo volumes. Lower natural gas prices in the U.S. led to reduced demand for utility coal shipments and the strength of the U.S. dollar served to reduce U.S. export volumes significantly. Falling energy prices likewise contributed to the underperformance of EQT, another key fund detractor. The U.S.-based natural gas producer declined on ongoing oversupply and falling natural gas prices, which has been exacerbated by unusually warm weather.
Elsewhere, Mexico-based cement manufacturer CEMEX was a leading underperformer, declining on strains of Mexico’s macroeconomic growth and the Mexican peso’s dramatic depreciation relative to the U.S. dollar. Portfolio detractors also included a portfolio-only investment in Brazil-based private education provider Kroton, which suffered amid concerns about changes to the government’s post-secondary education funding guidelines. We sold both positions from the portfolio. China-based Baidu declined after several consecutive quarters of earnings disappointments, and we sold the position on concern that the internet search provider was investing in new business initiatives, which would diminish profitability for the foreseeable future.
Outlook
Economic activity in the U.S. remains slow and steady and continues to outpace most other developed markets. We believe that divergence in monetary policy between the U.S. and much of the rest of the world is likely to continue in 2016 as the U.S. Federal Reserve (the Fed) gradually raises interest rates, whereas most central banks elsewhere maintain monetary policy easing. Investor sentiment in financial markets is likely to be driven by the timing and magnitude of Fed moves, as well as by the trajectory of global economic growth, particularly in China. We continue to adhere to our strict bottom-up stock picking process in search of companies with attractive growth potential, while remaining aware of the global macroeconomic environment. The fund remains overweight to the U.S., where we continue to find diverse opportunities in the consumer discretionary, information technology, and health care sectors. Likewise, we have been increasing the fund’s overweight in Europe, where we are able to find opportunities that fit our investment process. Additional monetary stimulus measures by the European Central Bank appear likely and should support the ongoing economic recovery in the region and be supportive to the corporate profit cycle. Meanwhile, our exposure to Japan, given the continued uneven economic recovery, remains limited. Our investments in emerging markets such as China, India, and Peru are focused on companies benefiting from the expansion of the middle class and the resultant rise in consumer spending.
On a sector basis, allocations are a residual of our bottom-up focus. The largest overweight exposure remains to consumer discretionary holdings, where we have been successful in finding companies that are likely to benefit from wage growth and improving consumer confidence. The fund is also overweight in the information technology sector as we are able to find opportunities that fit our sustainable earnings growth models. Conversely, we remain underweight in materials and consumer staples due to the difficulty in identifying investment opportunities that fit our sustainable earnings acceleration models in those sectors.
6
| Fund Characteristics |
| NOVEMBER 30, 2015 | |
Top Ten Holdings | % of net assets |
| Alphabet, Inc.* | 3.7% |
| Facebook, Inc., Class A | 2.6% |
| Adobe Systems, Inc. | 2.5% |
| Roche Holding AG | 2.4% |
| Home Depot, Inc. (The) | 2.4% |
| Cognizant Technology Solutions Corp., Class A | 2.1% |
| Amazon.com, Inc. | 2.0% |
| Liberty Global plc* | 2.0% |
| AIA Group Ltd. | 1.9% |
| Becton Dickinson and Co. | 1.7% |
| *Includes all classes of the issuer. | |
Types of Investments in Portfolio | % of net assets |
| Domestic Common Stocks | 61.4% |
| Foreign Common Stocks | 38.2% |
| Total Common Stocks | 99.6% |
| Temporary Cash Investments | 0.5% |
| Other Assets and Liabilities | (0.1)% |
Investments by Country | % of net assets |
| United States | 61.4% |
| United Kingdom | 9.1% |
| France | 5.2% |
| Japan | 3.5% |
| Switzerland | 3.4% |
| Germany | 3.0% |
| Hong Kong | 2.3% |
| Italy | 2.3% |
| China | 2.1% |
| Other Countries | 7.3% |
| Cash and Equivalents** | 0.4% |
**Includes temporary cash investments and other assets and liabilities.
7
| Shareholder Fee Example |
Fund shareholders may incur two types of costs: (1) transaction costs, including sales charges (loads) on purchase payments and redemption/exchange fees; and (2) ongoing costs, including management fees; distribution and service (12b-1) fees; and other fund expenses. This example is intended to help you understand your ongoing costs (in dollars) of investing in your fund and to compare these costs with the ongoing cost of investing in other mutual funds.
The example is based on an investment of $1,000 made at the beginning of the period and held for the entire period from June 1, 2015 to November 30, 2015.
Actual Expenses
The table provides information about actual account values and actual expenses for each class. You may use the information, together with the amount you invested, to estimate the expenses that you paid over the period. First, identify the share class you own. Then simply divide your account value by $1,000 (for example, an $8,600 account value divided by $1,000 = 8.6), then multiply the result by the number under the heading “Expenses Paid During Period” to estimate the expenses you paid on your account during this period.
If you hold Investor Class shares of any American Century Investments fund, or Institutional Class shares of the American Century Diversified Bond Fund, in an American Century Investments account (i.e., not a financial intermediary or retirement plan account), American Century Investments may charge you a $12.50 semiannual account maintenance fee if the value of those shares is less than $10,000. We will redeem shares automatically in one of your accounts to pay the $12.50 fee. In determining your total eligible investment amount, we will include your investments in all personal accounts (including American Century Investments Brokerage accounts) registered under your Social Security number. Personal accounts include individual accounts, joint accounts, UGMA/UTMA accounts, personal trusts, Coverdell Education Savings Accounts and IRAs (including traditional, Roth, Rollover, SEP-, SARSEP- and SIMPLE-IRAs), and certain other retirement accounts. If you have only business, business retirement, employer-sponsored or American Century Investments Brokerage accounts, you are currently not subject to this fee. If you are subject to the Account Maintenance Fee, your account value could be reduced by the fee amount.
Hypothetical Example for Comparison Purposes
The table also provides information about hypothetical account values and hypothetical expenses based on the actual expense ratio of each class of your fund and an assumed rate of return of 5% per year before expenses, which is not the actual return of a fund’s share class. The hypothetical account values and expenses may not be used to estimate the actual ending account balance or expenses you paid for the period. You may use this information to compare the ongoing costs of investing in your fund and other funds. To do so, compare this 5% hypothetical example with the 5% hypothetical examples that appear in the shareholder reports of the other funds.
Please note that the expenses shown in the table are meant to highlight your ongoing costs only and do not reflect any transactional costs, such as sales charges (loads) or redemption/exchange fees. Therefore, the table is useful in comparing ongoing costs only, and will not help you determine the relative total costs of owning different funds. In addition, if these transactional costs were included, your costs would have been higher.
8
| Beginning Account Value 6/1/15 | Ending Account Value 11/30/15 | Expenses Paid During Period(1)6/1/15 - 11/30/15 | Annualized Expense Ratio(1) | |
Actual | ||||
| Investor Class | $1,000 | $982.80 | $5.37 | 1.08% |
| Institutional Class | $1,000 | $983.90 | $4.38 | 0.88% |
| A Class | $1,000 | $981.60 | $6.61 | 1.33% |
| C Class | $1,000 | $977.90 | $10.31 | 2.08% |
| R Class | $1,000 | $980.70 | $7.85 | 1.58% |
| R6 Class | $1,000 | $984.70 | $3.63 | 0.73% |
Hypothetical | ||||
| Investor Class | $1,000 | $1,019.65 | $5.47 | 1.08% |
| Institutional Class | $1,000 | $1,020.66 | $4.46 | 0.88% |
| A Class | $1,000 | $1,018.40 | $6.73 | 1.33% |
| C Class | $1,000 | $1,014.64 | $10.50 | 2.08% |
| R Class | $1,000 | $1,017.15 | $7.99 | 1.58% |
| R6 Class | $1,000 | $1,021.41 | $3.70 | 0.73% |
| (1) | Expenses are equal to the class's annualized expense ratio listed in the table above, multiplied by the average account value over the period, multiplied by 183, the number of days in the most recent fiscal half-year, divided by 365, to reflect the one-half year period. |
9
| Schedule of Investments |
NOVEMBER 30, 2015
| Shares | Value | |||
| COMMON STOCKS — 99.6% | ||||
| Austria — 1.0% | ||||
Erste Group Bank AG(1) | 187,890 | $ | 5,764,879 | |
| Belgium — 0.7% | ||||
| UCB SA | 41,870 | 3,738,974 | ||
| China — 2.1% | ||||
Alibaba Group Holding Ltd. ADR(1) | 44,190 | 3,715,495 | ||
| Tencent Holdings Ltd. | 392,300 | 7,807,091 | ||
| 11,522,586 | ||||
| Denmark — 1.9% | ||||
| GN Store Nord A/S | 164,299 | 3,013,252 | ||
| Pandora A/S | 64,106 | 7,598,972 | ||
| 10,612,224 | ||||
| France — 5.2% | ||||
| Accor SA | 185,556 | 7,830,203 | ||
| Carrefour SA | 240,450 | 7,413,102 | ||
Peugeot SA(1) | 161,150 | 2,879,147 | ||
| Total SA | 117,214 | 5,820,594 | ||
| Valeo SA | 31,560 | 4,886,667 | ||
| 28,829,713 | ||||
| Germany — 3.0% | ||||
| Fresenius Medical Care AG & Co. KGaA | 93,243 | 7,703,941 | ||
| Symrise AG | 50,250 | 3,401,049 | ||
| Wirecard AG | 114,040 | 5,586,469 | ||
| 16,691,459 | ||||
| Hong Kong — 2.3% | ||||
| AIA Group Ltd. | 1,744,200 | 10,415,552 | ||
| Hang Seng Bank Ltd. | 127,400 | 2,308,611 | ||
| 12,724,163 | ||||
| India — 1.8% | ||||
| HDFC Bank Ltd. | 265,500 | 5,101,679 | ||
| Maruti Suzuki India Ltd. | 70,190 | 4,851,223 | ||
| 9,952,902 | ||||
| Italy — 2.3% | ||||
| Intesa Sanpaolo SpA | 2,593,640 | 8,900,525 | ||
| Mediaset SpA | 815,640 | 3,586,663 | ||
| 12,487,188 | ||||
| Japan — 3.5% | ||||
| Keyence Corp. | 9,100 | 4,932,185 | ||
| Nidec Corp. | 83,600 | 6,463,889 | ||
| ORIX Corp. | 300,800 | 4,340,952 | ||
| Unicharm Corp. | 186,600 | 3,935,123 | ||
| 19,672,149 | ||||
10
| Shares | Value | |||
| Peru — 0.5% | ||||
| Credicorp Ltd. | 25,234 | $ | 2,664,963 | |
| Portugal — 0.4% | ||||
| Jeronimo Martins SGPS SA | 153,100 | 2,124,688 | ||
| Sweden — 1.0% | ||||
| Skandinaviska Enskilda Banken AB, A Shares | 511,430 | 5,438,686 | ||
| Switzerland — 3.4% | ||||
| Adecco SA | 74,522 | 5,099,236 | ||
| Roche Holding AG | 50,311 | 13,472,013 | ||
| 18,571,249 | ||||
| United Kingdom — 9.1% | ||||
| Admiral Group plc | 180,290 | 4,401,576 | ||
| Ashtead Group plc | 166,568 | 2,747,003 | ||
| Capita plc | 304,043 | 5,824,728 | ||
Liberty Global plc(1) | 132,470 | 5,431,270 | ||
Liberty Global plc, Class A(1) | 131,270 | 5,567,161 | ||
| Prudential plc | 230,270 | 5,339,131 | ||
Royal Bank of Scotland Group plc(1) | 1,543,268 | 7,028,726 | ||
| Shire plc | 127,980 | 8,955,190 | ||
| Whitbread plc | 77,430 | 5,303,752 | ||
| 50,598,537 | ||||
| United States — 61.4% | ||||
Adobe Systems, Inc.(1) | 150,970 | 13,807,716 | ||
Alexion Pharmaceuticals, Inc.(1) | 27,294 | 4,870,341 | ||
Alliance Data Systems Corp.(1) | 13,162 | 3,775,520 | ||
Alphabet, Inc., Class A(1) | 12,205 | 9,310,584 | ||
Alphabet, Inc., Class C(1) | 14,934 | 11,089,988 | ||
Amazon.com, Inc.(1) | 16,660 | 11,075,568 | ||
| American Tower Corp. | 90,710 | 9,014,760 | ||
| Becton Dickinson and Co. | 64,150 | 9,638,538 | ||
Boston Scientific Corp.(1) | 228,780 | 4,182,098 | ||
| Bristol-Myers Squibb Co. | 120,310 | 8,061,973 | ||
Celgene Corp.(1) | 81,728 | 8,945,130 | ||
Cerner Corp.(1) | 103,116 | 6,145,714 | ||
| Charles Schwab Corp. (The) | 152,764 | 5,149,675 | ||
Chipotle Mexican Grill, Inc.(1) | 4,300 | 2,492,065 | ||
Cognizant Technology Solutions Corp., Class A(1) | 182,190 | 11,765,830 | ||
Continental Resources, Inc.(1) | 92,678 | 3,364,211 | ||
| Costco Wholesale Corp. | 41,177 | 6,646,791 | ||
| Delphi Automotive plc | 19,710 | 1,732,115 | ||
Dollar Tree, Inc.(1) | 26,730 | 2,017,046 | ||
| EOG Resources, Inc. | 99,680 | 8,316,302 | ||
| EQT Corp. | 91,540 | 5,237,919 | ||
| Equinix, Inc. | 25,976 | 7,701,884 | ||
| Estee Lauder Cos., Inc. (The), Class A | 76,835 | 6,463,360 | ||
Facebook, Inc., Class A(1) | 138,111 | 14,396,691 | ||
| FedEx Corp. | 32,501 | 5,152,709 | ||
11
| Shares | Value | |||
| Fortune Brands Home & Security, Inc. | 157,423 | $ | 8,653,542 | |
| Harman International Industries, Inc. | 90,214 | 9,306,476 | ||
HD Supply Holdings, Inc.(1) | 97,230 | 3,075,385 | ||
| Home Depot, Inc. (The) | 99,964 | 13,383,180 | ||
| Ingersoll-Rand plc | 122,660 | 7,196,462 | ||
| Interactive Brokers Group, Inc., Class A | 53,310 | 2,311,522 | ||
| Intercontinental Exchange, Inc. | 27,975 | 7,269,024 | ||
| Kansas City Southern | 60,958 | 5,542,301 | ||
LendingClub Corp.(1) | 284,610 | 3,421,012 | ||
| MarketAxess Holdings, Inc. | 3,670 | 391,883 | ||
| MasterCard, Inc., Class A | 81,190 | 7,950,125 | ||
MGIC Investment Corp.(1) | 525,424 | 5,012,545 | ||
| Mondelez International, Inc., Class A | 130,540 | 5,699,376 | ||
| Owens Corning | 103,488 | 4,847,378 | ||
| Public Storage | 26,320 | 6,318,379 | ||
| Schlumberger Ltd. | 60,114 | 4,637,795 | ||
| Signet Jewelers Ltd. | 54,950 | 7,219,881 | ||
Sirius XM Holdings, Inc.(1) | 1,331,250 | 5,471,438 | ||
Skechers U.S.A., Inc., Class A(1) | 71,010 | 2,144,502 | ||
SolarCity Corp.(1) | 58,250 | 1,675,270 | ||
| Tractor Supply Co. | 80,373 | 7,181,328 | ||
Ulta Salon Cosmetics & Fragrance, Inc.(1) | 44,520 | 7,434,840 | ||
| Union Pacific Corp. | 92,292 | 7,747,913 | ||
Vertex Pharmaceuticals, Inc.(1) | 31,521 | 4,077,557 | ||
| Visa, Inc., Class A | 109,432 | 8,646,222 | ||
WhiteWave Foods Co. (The), Class A(1) | 126,699 | 5,147,780 | ||
| Zions Bancorp | 250,552 | 7,506,538 | ||
| 339,624,182 | ||||
TOTAL COMMON STOCKS (Cost $417,131,767) | 551,018,542 | |||
| TEMPORARY CASH INVESTMENTS — 0.5% | ||||
| Repurchase Agreement, Credit Suisse First Boston, Inc., (collateralized by various U.S. Treasury obligations, 0.625%, 8/31/17, valued at $959,557), in a joint trading account at 0.01%, dated 11/30/15, due 12/1/15 (Delivery value $941,003) | 941,003 | |||
| Repurchase Agreement, Fixed Income Clearing Corp., (collateralized by various U.S. Treasury obligations, 3.00%, 11/15/44, valued at $1,602,994), at 0.01%, dated 11/30/15, due 12/1/15 (Delivery value $1,568,000) | 1,568,000 | |||
| State Street Institutional Liquid Reserves Fund, Premier Class | 369,796 | 369,796 | ||
TOTAL TEMPORARY CASH INVESTMENTS (Cost $2,878,799) | 2,878,799 | |||
TOTAL INVESTMENT SECURITIES — 100.1% (Cost $420,010,566) | 553,897,341 | |||
| OTHER ASSETS AND LIABILITIES — (0.1)% | (468,770) | |||
| TOTAL NET ASSETS — 100.0% | $ | 553,428,571 | ||
12
| MARKET SECTOR DIVERSIFICATION | ||
(as a % of net assets) | ||
| Consumer Discretionary | 21.3 | % |
| Financials | 20.9 | % |
| Information Technology | 18.6 | % |
| Health Care | 15.0 | % |
| Industrials | 11.5 | % |
| Consumer Staples | 6.7 | % |
| Energy | 5.0 | % |
| Materials | 0.6 | % |
| Cash and Equivalents* | 0.4 | % |
*Includes temporary cash investments and other assets and liabilities.
| NOTES TO SCHEDULE OF INVESTMENTS | ||
| ADR | - | American Depositary Receipt |
| (1) | Non-income producing. |
See Notes to Financial Statements.
13
| Statement of Assets and Liabilities |
| NOVEMBER 30, 2015 | |||
| Assets | |||
| Investment securities, at value (cost of $420,010,566) | $ | 553,897,341 | |
| Foreign currency holdings, at value (cost of $143,300) | 136,714 | ||
| Receivable for investments sold | 2,382,249 | ||
| Receivable for capital shares sold | 180,185 | ||
| Dividends and interest receivable | 599,272 | ||
| Other assets | 16,486 | ||
| 557,212,247 | |||
| Liabilities | |||
| Payable for investments purchased | 2,472,734 | ||
| Payable for capital shares redeemed | 809,929 | ||
| Accrued management fees | 482,017 | ||
| Distribution and service fees payable | 18,996 | ||
| 3,783,676 | |||
| Net Assets | $ | 553,428,571 | |
| Net Assets Consist of: | |||
| Capital (par value and paid-in surplus) | $ | 386,792,079 | |
| Distributions in excess of net investment income | (2,134,173 | ) | |
| Undistributed net realized gain | 34,897,687 | ||
| Net unrealized appreciation | 133,872,978 | ||
| $ | 553,428,571 | ||
| Net Assets | Shares Outstanding | Net Asset Value Per Share | ||||
| Investor Class, $0.01 Par Value | $443,914,720 | 36,972,449 | $12.01 | |||
| Institutional Class, $0.01 Par Value | $33,211,292 | 2,725,534 | $12.19 | |||
| A Class, $0.01 Par Value | $45,854,956 | 3,900,747 | $11.76* | |||
| C Class, $0.01 Par Value | $8,520,080 | 801,712 | $10.63 | |||
| R Class, $0.01 Par Value | $6,040,121 | 517,781 | $11.67 | |||
| R6 Class, $0.01 Par Value | $15,887,402 | 1,299,517 | $12.23 | |||
*Maximum offering price $12.48 (net asset value divided by 0.9425).
See Notes to Financial Statements.
14
| Statement of Operations |
| YEAR ENDED NOVEMBER 30, 2015 | |||
| Investment Income (Loss) | |||
| Income: | |||
| Dividends (net of foreign taxes withheld of $293,731) | $ | 6,505,719 | |
| Interest | 1,313 | ||
| 6,507,032 | |||
| Expenses: | |||
| Management fees | 6,084,444 | ||
| Distribution and service fees: | |||
| A Class | 128,201 | ||
| C Class | 79,308 | ||
| R Class | 29,094 | ||
| Directors' fees and expenses | 20,661 | ||
| Other expenses | 9,631 | ||
| 6,351,339 | |||
| Net investment income (loss) | 155,693 | ||
| Realized and Unrealized Gain (Loss) | |||
| Net realized gain (loss) on: | |||
| Investment transactions | 39,118,703 | ||
| Foreign currency transactions | (50,300 | ) | |
| 39,068,403 | |||
| Change in net unrealized appreciation (depreciation) on: | |||
| Investments | (30,739,591 | ) | |
| Translation of assets and liabilities in foreign currencies | (21,699 | ) | |
| (30,761,290 | ) | ||
| Net realized and unrealized gain (loss) | 8,307,113 | ||
| Net Increase (Decrease) in Net Assets Resulting from Operations | $ | 8,462,806 | |
See Notes to Financial Statements.
15
| Statement of Changes in Net Assets |
| YEARS ENDED NOVEMBER 30, 2015 AND NOVEMBER 30, 2014 | ||||||
| Increase (Decrease) in Net Assets | November 30, 2015 | November 30, 2014 | ||||
| Operations | ||||||
| Net investment income (loss) | $ | 155,693 | $ | 153,777 | ||
| Net realized gain (loss) | 39,068,403 | 51,896,007 | ||||
| Change in net unrealized appreciation (depreciation) | (30,761,290 | ) | (8,620,122 | ) | ||
| Net increase (decrease) in net assets resulting from operations | 8,462,806 | 43,429,662 | ||||
| Distributions to Shareholders | ||||||
| From net investment income: | ||||||
| Investor Class | — | (2,865,018 | ) | |||
| Institutional Class | — | (560,772 | ) | |||
| A Class | — | (302,173 | ) | |||
| C Class | — | (24,440 | ) | |||
| R Class | — | (23,517 | ) | |||
| R6 Class | — | (209 | ) | |||
| From net realized gains: | ||||||
| Investor Class | (37,785,567 | ) | (9,757,039 | ) | ||
| Institutional Class | (6,379,960 | ) | (1,784,697 | ) | ||
| A Class | (4,516,949 | ) | (1,171,760 | ) | ||
| C Class | (670,176 | ) | (140,516 | ) | ||
| R Class | (478,017 | ) | (100,231 | ) | ||
| R6 Class | (1,376,962 | ) | (620 | ) | ||
| Decrease in net assets from distributions | (51,207,631 | ) | (16,730,992 | ) | ||
| Capital Share Transactions | ||||||
| Net increase (decrease) in net assets from capital share transactions (Note 5) | (29,475,736 | ) | 18,873,715 | |||
| Redemption Fees | ||||||
| Increase in net assets from redemption fees | 9,942 | 15,930 | ||||
| Net increase (decrease) in net assets | (72,210,619 | ) | 45,588,315 | |||
| Net Assets | ||||||
| Beginning of period | 625,639,190 | 580,050,875 | ||||
| End of period | $ | 553,428,571 | $ | 625,639,190 | ||
| Distributions in excess of net investment income | $ | (2,134,173 | ) | $ | (2,780,335 | ) |
See Notes to Financial Statements.
16
| Notes to Financial Statements |
NOVEMBER 30, 2015
1. Organization
American Century World Mutual Funds, Inc. (the corporation) is registered under the Investment Company Act of 1940, as amended (the 1940 Act), as an open-end management investment company and is organized as a Maryland corporation. Global Growth Fund (the fund) is one fund in a series issued by the corporation. The fund is diversified as defined under the 1940 Act. The fund's investment objective is to seek capital growth.
The fund offers the Investor Class, the Institutional Class, the A Class, the C Class, the R Class and the R6 Class. The A Class may incur an initial sales charge. The A Class and C Class may be subject to a contingent deferred sales charge. The share classes differ principally in their respective sales charges and distribution and shareholder servicing expenses and arrangements. The Institutional Class and R6 Class shareholders do not require the same level of shareholder and administrative services from American Century Investment Management, Inc. (ACIM) (the investment advisor) as shareholders of other classes. In addition, financial intermediaries do not receive any service, distribution or administrative fees for the R6 Class. As a result, the Institutional Class and R6 Class are charged lower unified management fees.
2. Significant Accounting Policies
The following is a summary of significant accounting policies consistently followed by the fund in preparation of its financial statements. The fund is an investment company and follows accounting and reporting guidance in accordance with accounting principles generally accepted in the United States of America. This may require management to make certain estimates and assumptions at the date of the financial statements. Actual results could differ from these estimates. Management evaluated the impact of events or transactions occurring through the date the financial statements were issued that would merit recognition or disclosure.
Investment Valuations — The fund determines the fair value of its investments and computes its net asset value per share at the close of regular trading (usually 4 p.m. Eastern time) on the New York Stock Exchange (NYSE) on each day the NYSE is open. The Board of Directors has adopted valuation policies and procedures to guide the investment advisor in the fund’s investment valuation process and to provide methodologies for the oversight of the fund’s pricing function.
Equity securities that are listed or traded on a domestic securities exchange are valued at the last reported sales price or at the official closing price as provided by the exchange. Equity securities traded on foreign securities exchanges are generally valued at the closing price of such securities on the exchange where primarily traded or at the close of the NYSE, if that is earlier. If no last sales price is reported, or if local convention or regulation so provides, the mean of the latest bid and asked prices may be used. Securities traded over-the-counter are valued at the mean of the latest bid and asked prices, the last sales price, or the official closing price. Equity securities initially expressed in local currencies are translated into U.S. dollars at the mean of the appropriate currency exchange rate at the close of the NYSE as provided by an independent pricing service.
Open-end management investment companies are valued at the reported net asset value per share. Repurchase agreements are valued at cost, which approximates fair value.
If the fund determines that the market price for an investment is not readily available or the valuation methods mentioned above do not reflect an investment’s fair value, such investment is valued as determined in good faith by the Board of Directors or its delegate, in accordance with policies and procedures adopted by the Board of Directors. In its determination of fair value, the fund may review several factors including, but not limited to, market information regarding the specific investment or comparable investments and correlation with other investment types, futures indices or general market indicators. Circumstances that may cause the fund to use these procedures to value an investment include, but are not limited to: an investment has been declared in default or is distressed; trading in a security has been suspended during the trading day or a security is not actively trading on its principal exchange; prices received from a regular pricing source are deemed unreliable; or there is a foreign market holiday and no trading occurred.
17
The fund monitors for significant events occurring after the close of an investment’s primary exchange but before the fund’s net asset value per share is determined. Significant events may include, but are not limited to: corporate announcements and transactions; governmental action and political unrest that could impact a specific investment or an investment sector; or armed conflicts, natural disasters and similar events that could affect investments in a specific country or region. The fund also monitors for significant fluctuations between domestic and foreign markets, as evidenced by the U.S. market or such other indicators that the Board of Directors, or its delegate, deems appropriate. If significant fluctuations in foreign markets are identified, the fund may apply a model-derived factor to the closing price of equity securities traded on foreign securities exchanges. The factor is based on observable market data as provided by an independent pricing service.
Security Transactions — Security transactions are accounted for as of the trade date. Net realized gains and losses are determined on the identified cost basis, which is also used for federal income tax purposes.
Investment Income — Dividend income less foreign taxes withheld, if any, is recorded as of the ex-dividend date. Distributions received on securities that represent a return of capital or long-term capital gain are recorded as a reduction of cost of investments and/or as a realized gain. The fund may estimate the components of distributions received that may be considered nontaxable distributions or long-term capital gain distributions for income tax purposes. Interest income is recorded on the accrual basis and includes accretion of discounts and amortization of premiums.
Foreign Currency Translations — All assets and liabilities initially expressed in foreign currencies are translated into U.S. dollars at prevailing exchange rates at period end. The fund may enter into spot foreign currency exchange contracts to facilitate transactions denominated in a foreign currency. Purchases and sales of investment securities, dividend and interest income, spot foreign currency exchange contracts, and expenses are translated at the rates of exchange prevailing on the respective dates of such transactions. Net realized and unrealized foreign currency exchange gains or losses related to investment securities are a component of net realized gain (loss) on investment transactions and change in net unrealized appreciation (depreciation) on investments, respectively.
Repurchase Agreements — The fund may enter into repurchase agreements with institutions that ACIM has determined are creditworthy pursuant to criteria adopted by the Board of Directors. The fund requires that the collateral, represented by securities, received in a repurchase transaction be transferred to the custodian in a manner sufficient to enable the fund to obtain those securities in the event of a default under the repurchase agreement. ACIM monitors, on a daily basis, the securities transferred to ensure the value, including accrued interest, of the securities under each repurchase agreement is equal to or greater than amounts owed to the fund under each repurchase agreement.
Joint Trading Account — Pursuant to an Exemptive Order issued by the Securities and Exchange Commission, the fund, along with certain other funds in the American Century Investments family of funds, may transfer uninvested cash balances into a joint trading account. These balances are invested in one or more repurchase agreements that are collateralized by U.S. Treasury or Agency obligations.
Income Tax Status — It is the fund’s policy to distribute substantially all net investment income and net realized gains to shareholders and to otherwise qualify as a regulated investment company under provisions of the Internal Revenue Code. Accordingly, no provision has been made for income taxes. The fund files U.S. federal, state, local and non-U.S. tax returns as applicable. The fund's tax returns are subject to examination by the relevant taxing authority until expiration of the applicable statute of limitations, which is generally three years from the date of filing but can be longer in certain jurisdictions. At this time, management believes there are no uncertain tax positions which, based on their technical merit, would not be sustained upon examination and for which it is reasonably possible that the total amounts of unrecognized tax benefits will significantly change in the next twelve months.
Multiple Class — All shares of the fund represent an equal pro rata interest in the net assets of the class to which such shares belong, and have identical voting, dividend, liquidation and other rights and the same terms and conditions, except for class specific expenses and exclusive rights to vote on matters affecting only individual classes. Income, non-class specific expenses, and realized and unrealized capital gains and losses of the fund are allocated to each class of shares based on their relative net assets.
18
Distributions to Shareholders — Distributions from net investment income and net realized gains, if any, are generally declared and paid annually. The fund may make distributions on a more frequent basis to comply with the distribution requirements of the Internal Revenue Code, in all events in a manner consistent with provisions of the 1940 Act. The fund may elect to treat a portion of its payment to a redeeming shareholder, which represents the pro rata share of undistributed net investment income and net realized gains, as a distribution for federal income tax purposes (tax equalization).
Redemption Fees — The fund may impose a 2.00% redemption fee on shares held less than 60 days. The fee may not be applicable to all classes. The redemption fee is retained by the fund and helps cover transaction costs that long-term investors may bear when the fund sells securities to meet investor redemptions.
Indemnifications — Under the corporation’s organizational documents, its officers and directors are indemnified against certain liabilities arising out of the performance of their duties to the fund. In addition, in the normal course of business, the fund enters into contracts that provide general indemnifications. The maximum exposure under these arrangements is unknown as this would involve future claims that may be made against a fund. The risk of material loss from such claims is considered by management to be remote.
3. Fees and Transactions with Related Parties
Certain officers and directors of the corporation are also officers and/or directors of American Century Companies, Inc. (ACC). The corporation’s investment advisor, ACIM, the corporation's distributor, American Century Investment Services, Inc. (ACIS), and the corporation’s transfer agent, American Century Services, LLC, are wholly owned, directly or indirectly, by ACC.
Management Fees — The corporation has entered into a management agreement with ACIM, under which ACIM provides the fund with investment advisory and management services in exchange for a single, unified management fee (the fee) per class. The agreement provides that all expenses of managing and operating the fund, except distribution and service fees, brokerage expenses, taxes, interest, fees and expenses of the independent directors (including legal counsel fees), and extraordinary expenses, will be paid by ACIM. The fee is computed and accrued daily based on each class’s daily net assets and paid monthly in arrears. The rate of the fee is determined by applying a fee rate calculation formula. This formula takes into account the fund’s assets as well as certain assets, if any, of other clients of the investment advisor outside the American Century Investments family of funds (such as subadvised funds and separate accounts) that have very similar investment teams and investment strategies (strategy assets). The annual management fee schedule ranges from 1.050% to 1.300% for the Investor Class, A Class, C Class and R Class. The annual management fee schedule ranges from 0.850% to 1.100% for the Institutional Class and 0.700% to 0.950% for the R6 Class. The effective annual management fee for each class for the year ended November 30, 2015 was 1.07% for the Investor Class, A Class, C Class and R Class, 0.87% for the Institutional Class and 0.72% for the R6 Class.
Distribution and Service Fees — The Board of Directors has adopted a separate Master Distribution and Individual Shareholder Services Plan for each of the A Class, C Class and R Class (collectively the plans), pursuant to Rule 12b-1 of the 1940 Act. The plans provide that the A Class will pay ACIS an annual distribution and service fee of 0.25%. The plans provide that the C Class will pay ACIS an annual distribution and service fee of 1.00%, of which 0.25% is paid for individual shareholder services and 0.75% is paid for distribution services. The plans provide that the R Class will pay ACIS an annual distribution and service fee of 0.50%. The fees are computed and accrued daily based on each class’s daily net assets and paid monthly in arrears. The fees are used to pay financial intermediaries for distribution and individual shareholder services. Fees incurred under the plans during the year ended November 30, 2015 are detailed in the Statement of Operations.
Directors' Fees and Expenses — The Board of Directors is responsible for overseeing the investment advisor’s management and operations of the fund. The directors receive detailed information about the fund and its investment advisor regularly throughout the year, and meet at least quarterly with management of the investment advisor to review reports about fund operations. The fund’s officers do not receive compensation from the fund.
4. Investment Transactions
Purchases and sales of investment securities, excluding short-term investments, for the year ended November 30, 2015 were $289,130,525 and $366,330,127, respectively.
19
5. Capital Share Transactions
Transactions in shares of the fund were as follows:
Year ended November 30, 2015 | Year ended November 30, 2014 | |||||||||
| Shares | Amount | Shares | Amount | |||||||
| Investor Class/Shares Authorized | 310,000,000 | 200,000,000 | ||||||||
| Sold | 3,089,165 | $ | 37,049,796 | 3,938,235 | $ | 48,885,183 | ||||
| Issued in reinvestment of distributions | 3,197,823 | 36,927,269 | 1,019,394 | 12,336,801 | ||||||
| Redeemed | (5,095,303 | ) | (61,226,074 | ) | (4,485,388 | ) | (55,928,846 | ) | ||
| 1,191,685 | 12,750,991 | 472,241 | 5,293,138 | |||||||
| Institutional Class/Shares Authorized | 40,000,000 | 35,000,000 | ||||||||
| Sold | 344,330 | 4,207,103 | 1,303,256 | 16,573,202 | ||||||
| Issued in reinvestment of distributions | 511,275 | 5,962,760 | 191,773 | 2,345,469 | ||||||
| Redeemed | (4,150,252 | ) | (51,025,377 | ) | (1,942,389 | ) | (24,606,149 | ) | ||
| (3,294,647 | ) | (40,855,514 | ) | (447,360 | ) | (5,687,478 | ) | |||
| A Class/Shares Authorized | 40,000,000 | 35,000,000 | ||||||||
| Sold | 1,031,144 | 12,115,263 | 1,276,731 | 15,619,984 | ||||||
| Issued in reinvestment of distributions | 392,995 | 4,454,209 | 122,631 | 1,460,436 | ||||||
| Redeemed | (1,776,564 | ) | (20,780,515 | ) | (1,351,849 | ) | (16,591,233 | ) | ||
| (352,425 | ) | (4,211,043 | ) | 47,513 | 489,187 | |||||
| C Class/Shares Authorized | 30,000,000 | 10,000,000 | ||||||||
| Sold | 265,307 | 2,849,458 | 196,729 | 2,219,689 | ||||||
| Issued in reinvestment of distributions | 44,246 | 457,296 | 11,449 | 125,535 | ||||||
| Redeemed | (127,055 | ) | (1,364,173 | ) | (85,886 | ) | (964,322 | ) | ||
| 182,498 | 1,942,581 | 122,292 | 1,380,902 | |||||||
| R Class/Shares Authorized | 30,000,000 | 5,000,000 | ||||||||
| Sold | 196,169 | 2,307,770 | 158,047 | 1,930,221 | ||||||
| Issued in reinvestment of distributions | 42,408 | 478,017 | 10,431 | 123,748 | ||||||
| Redeemed | (165,733 | ) | (1,933,558 | ) | (92,275 | ) | (1,129,865 | ) | ||
| 72,844 | 852,229 | 76,203 | 924,104 | |||||||
| R6 Class/Shares Authorized | 30,000,000 | 50,000,000 | ||||||||
| Sold | 225,533 | 2,791,939 | 1,337,765 | 17,030,076 | ||||||
| Issued in reinvestment of distributions | 117,575 | 1,376,962 | 67 | 829 | ||||||
| Redeemed | (339,633 | ) | (4,123,881 | ) | (44,018 | ) | (557,043 | ) | ||
| 3,475 | 45,020 | 1,293,814 | 16,473,862 | |||||||
| Net increase (decrease) | (2,196,570 | ) | $ | (29,475,736 | ) | 1,564,703 | $ | 18,873,715 | ||
20
6. Fair Value Measurements
The fund’s investments valuation process is based on several considerations and may use multiple inputs to determine the fair value of the investments held by the fund. In conformity with accounting principles generally accepted in the United States of America, the inputs used to determine a valuation are classified into three broad levels.
| • | Level 1 valuation inputs consist of unadjusted quoted prices in an active market for identical investments. |
| • | Level 2 valuation inputs consist of direct or indirect observable market data (including quoted prices for comparable investments, evaluations of subsequent market events, interest rates, prepayment speeds, credit risk, etc.). These inputs also consist of quoted prices for identical investments initially expressed in local currencies that are adjusted through translation into U.S. dollars. |
| • | Level 3 valuation inputs consist of unobservable data (including a fund’s own assumptions). |
The level classification is based on the lowest level input that is significant to the fair valuation measurement. The valuation inputs are not necessarily an indication of the risks associated with investing in these securities or other financial instruments. There were no significant transfers between levels during the period.
The following is a summary of the level classifications as of period end. The Schedule of Investments provides additional information on the fund’s portfolio holdings.
| Level 1 | Level 2 | Level 3 | ||||||
| Assets | ||||||||
| Investment Securities | ||||||||
| Common Stocks | ||||||||
| Austria | — | $ | 5,764,879 | — | ||||
| Belgium | — | 3,738,974 | — | |||||
| China | $ | 3,715,495 | 7,807,091 | — | ||||
| Denmark | — | 10,612,224 | — | |||||
| France | — | 28,829,713 | — | |||||
| Germany | — | 16,691,459 | — | |||||
| Hong Kong | — | 12,724,163 | — | |||||
| India | — | 9,952,902 | — | |||||
| Italy | — | 12,487,188 | — | |||||
| Japan | — | 19,672,149 | — | |||||
| Portugal | — | 2,124,688 | — | |||||
| Sweden | — | 5,438,686 | — | |||||
| Switzerland | — | 18,571,249 | — | |||||
| United Kingdom | 10,998,431 | 39,600,106 | — | |||||
| Other Countries | 342,289,145 | — | — | |||||
| Temporary Cash Investments | 369,796 | 2,509,003 | — | |||||
| $ | 357,372,867 | $ | 196,524,474 | — | ||||
7. Risk Factors
There are certain risks involved in investing in foreign securities. These risks include those resulting from future adverse political, social and economic developments, fluctuations in currency exchange rates, the possible imposition of exchange controls, and other foreign laws or restrictions. Investing in emerging markets may accentuate these risks.
21
8. Federal Tax Information
On December 22, 2015, the fund declared and paid a per-share distribution from net realized gains to shareholders of record on December 21, 2015 of $0.7736 for the Investor Class, Institutional Class, A Class, C Class, R Class and R6 Class.
On December 22, 2015, the fund declared and paid the following per-share distributions from net investment income to shareholders of record on December 21, 2015:
| Investor Class | Institutional Class | A Class | C Class | R Class | R6 Class |
| $0.0130 | $0.0362 | — | — | — | $0.0537 |
The tax character of distributions paid during the years ended November 30, 2015 and November 30, 2014 were as follows:
| 2015 | 2014 | |||||
| Distributions Paid From | ||||||
| Ordinary income | — | $ | 3,771,929 | |||
| Long-term capital gains | $ | 51,207,631 | $ | 12,959,063 | ||
The book-basis character of distributions made during the year from net investment income or net realized gains may differ from their ultimate characterization for federal income tax purposes. These differences reflect the differing character of certain income items and net realized gains and losses for financial statement and tax purposes, and may result in reclassification among certain capital accounts on the financial statements.
As of November 30, 2015, the federal tax cost of investments and the components of distributable earnings on a tax-basis were as follows:
| Federal tax cost of investments | $ | 423,317,031 | |
| Gross tax appreciation of investments | $ | 145,465,380 | |
| Gross tax depreciation of investments | (14,885,070 | ) | |
| Net tax appreciation (depreciation) of investments | 130,580,310 | ||
| Net tax appreciation (depreciation) on translation of assets and liabilities in foreign currencies | (13,797 | ) | |
| Net tax appreciation (depreciation) | $ | 130,566,513 | |
| Undistributed ordinary income | $ | 542,472 | |
Accumulated long-term gains | $ | 35,527,507 | |
The difference between book-basis and tax-basis unrealized appreciation (depreciation) is attributable primarily to the realization to ordinary income for tax purposes of unrealized gains on investments in passive foreign investment companies.
22
| Financial Highlights |
| For a Share Outstanding Throughout the Years Ended November 30 (except as noted) | |||||||||||||||
| Per-Share Data | Ratios and Supplemental Data | ||||||||||||||
| Income From Investment Operations: | Distributions From: | Ratio to Average Net Assets of: | |||||||||||||
Net Asset Value, Beginning of Period | Net Investment Income (Loss)(1) | Net Realized and Unrealized Gain (Loss) | Total From Investment Operations | Net Investment Income | Net Realized Gains | Total Distributions | Net Asset Value, End of Period | Total Return(2) | Operating Expenses | Net Investment Income (Loss) | Portfolio Turnover Rate | Net Assets, End of Period (in thousands) | |||
| Investor Class | |||||||||||||||
| 2015 | $12.94 | —(3) | 0.12 | 0.12 | — | (1.05) | (1.05) | $12.01 | 1.37% | 1.08% | 0.04% | 50% | $443,915 | ||
| 2014 | $12.39 | —(3) | 0.91 | 0.91 | (0.08) | (0.28) | (0.36) | $12.94 | 7.53% | 1.08% | 0.03% | 46% | $462,889 | ||
| 2013 | $9.63 | 0.01 | 2.79 | 2.80 | (0.04) | — | (0.04) | $12.39 | 29.15% | 1.09% | 0.11% | 64% | $437,599 | ||
| 2012 | $8.52 | 0.03 | 1.11 | 1.14 | (0.03) | — | (0.03) | $9.63 | 13.37% | 1.10% | 0.28% | 54% | $373,887 | ||
| 2011 | $8.41 | 0.03 | 0.13 | 0.16 | (0.05) | — | (0.05) | $8.52 | 1.82% | 1.11% | 0.28% | 53% | $322,672 | ||
| Institutional Class | |||||||||||||||
| 2015 | $13.09 | 0.03 | 0.12 | 0.15 | — | (1.05) | (1.05) | $12.19 | 1.60% | 0.88% | 0.24% | 50% | $33,211 | ||
| 2014 | $12.52 | 0.03 | 0.91 | 0.94 | (0.09) | (0.28) | (0.37) | $13.09 | 7.68% | 0.88% | 0.23% | 46% | $78,802 | ||
| 2013 | $9.73 | 0.03 | 2.82 | 2.85 | (0.06) | — | (0.06) | $12.52 | 29.42% | 0.89% | 0.31% | 64% | $80,968 | ||
| 2012 | $8.60 | 0.05 | 1.13 | 1.18 | (0.05) | — | (0.05) | $9.73 | 13.71% | 0.90% | 0.48% | 54% | $47,203 | ||
| 2011 | $8.49 | 0.04 | 0.13 | 0.17 | (0.06) | — | (0.06) | $8.60 | 2.00% | 0.91% | 0.48% | 53% | $35,991 | ||
| A Class | |||||||||||||||
| 2015 | $12.72 | (0.02) | 0.11 | 0.09 | — | (1.05) | (1.05) | $11.76 | 1.14% | 1.33% | (0.21)% | 50% | $45,855 | ||
| 2014 | $12.21 | (0.03) | 0.89 | 0.86 | (0.07) | (0.28) | (0.35) | $12.72 | 7.23% | 1.33% | (0.22)% | 46% | $54,091 | ||
| 2013 | $9.49 | (0.02) | 2.75 | 2.73 | (0.01) | — | (0.01) | $12.21 | 28.83% | 1.34% | (0.14)% | 64% | $51,351 | ||
| 2012 | $8.39 | —(3) | 1.10 | 1.10 | —(3) | — | —(3) | $9.49 | 13.16% | 1.35% | 0.03% | 54% | $33,938 | ||
| 2011 | $8.28 | —(3) | 0.13 | 0.13 | (0.02) | — | (0.02) | $8.39 | 1.58% | 1.36% | 0.03% | 53% | $26,908 | ||
23
| For a Share Outstanding Throughout the Years Ended November 30 (except as noted) | |||||||||||||||
| Per-Share Data | Ratios and Supplemental Data | ||||||||||||||
| Income From Investment Operations: | Distributions From: | Ratio to Average Net Assets of: | |||||||||||||
Net Asset Value, Beginning of Period | Net Investment Income (Loss)(1) | Net Realized and Unrealized Gain (Loss) | Total From Investment Operations | Net Investment Income | Net Realized Gains | Total Distributions | Net Asset Value, End of Period | Total Return(2) | Operating Expenses | Net Investment Income (Loss) | Portfolio Turnover Rate | Net Assets, End of Period (in thousands) | |||
| C Class | |||||||||||||||
| 2015 | $11.68 | (0.10) | 0.10 | —(3) | — | (1.05) | (1.05) | $10.63 | 0.40% | 2.08% | (0.96)% | 50% | $8,520 | ||
| 2014 | $11.30 | (0.11) | 0.81 | 0.70 | (0.04) | (0.28) | (0.32) | $11.68 | 6.39% | 2.08% | (0.97)% | 46% | $7,234 | ||
| 2013 | $8.84 | (0.09) | 2.55 | 2.46 | — | — | — | $11.30 | 27.97% | 2.09% | (0.89)% | 64% | $5,615 | ||
| 2012 | $7.87 | (0.06) | 1.03 | 0.97 | — | — | — | $8.84 | 12.20% | 2.10% | (0.72)% | 54% | $4,098 | ||
| 2011 | $7.81 | (0.06) | 0.12 | 0.06 | — | — | — | $7.87 | 0.77% | 2.11% | (0.72)% | 53% | $3,557 | ||
| R Class | |||||||||||||||
| 2015 | $12.66 | (0.05) | 0.11 | 0.06 | — | (1.05) | (1.05) | $11.67 | 0.89% | 1.58% | (0.46)% | 50% | $6,040 | ||
| 2014 | $12.18 | (0.06) | 0.88 | 0.82 | (0.06) | (0.28) | (0.34) | $12.66 | 7.00% | 1.58% | (0.47)% | 46% | $5,632 | ||
| 2013 | $9.47 | (0.04) | 2.75 | 2.71 | — | — | — | $12.18 | 28.51% | 1.59% | (0.39)% | 64% | $4,489 | ||
| 2012 | $8.39 | (0.02) | 1.10 | 1.08 | — | — | — | $9.47 | 12.87% | 1.60% | (0.22)% | 54% | $1,587 | ||
| 2011 | $8.29 | (0.02) | 0.12 | 0.10 | — | — | — | $8.39 | 1.21% | 1.61% | (0.22)% | 53% | $636 | ||
| R6 Class | |||||||||||||||
| 2015 | $13.11 | 0.05 | 0.12 | 0.17 | — | (1.05) | (1.05) | $12.23 | 1.76% | 0.73% | 0.39% | 50% | $15,887 | ||
| 2014 | $12.53 | 0.02 | 0.93 | 0.95 | (0.09) | (0.28) | (0.37) | $13.11 | 7.80% | 0.73% | 0.38% | 46% | $16,992 | ||
2013(4) | $11.22 | —(3) | 1.31 | 1.31 | — | — | — | $12.53 | 11.68% | 0.74%(5) | 0.00%(5)(6) | 64%(7) | $28 | ||
24
| Notes to Financial Highlights |
| (1) | Computed using average shares outstanding throughout the period. |
| (2) | Total returns are calculated based on the net asset value of the last business day and do not reflect applicable sales charges, if any. Total returns for periods less than one year are not annualized. |
| (3) | Per-share amount was less than $0.005. |
| (4) | July 26, 2013 (commencement of sale) through November 30, 2013. |
| (5) | Annualized. |
| (6) | Ratio was less than 0.005%. |
| (7) | Portfolio turnover is calculated at the fund level. Percentage indicated was calculated for the year ended November 30, 2013. |
See Notes to Financial Statements.
25
| Report of Independent Registered Public Accounting Firm |
To the Board of Directors and Shareholders of American Century World Mutual Funds, Inc.:
We have audited the accompanying statement of assets and liabilities, including the schedule of investments, of Global Growth Fund (the “Fund”), one of the funds constituting American Century World Mutual Funds, Inc., as of November 30, 2015, and the related statement of operations for the year then ended, the statements of changes in net assets for each of the two years in the period then ended, and the financial highlights for each of the periods presented. These financial statements and financial highlights are the responsibility of the Fund’s management. Our responsibility is to express an opinion on these financial statements and financial highlights based on our audits.
We conducted our audits in accordance with the standards of the Public Company Accounting Oversight Board (United States). Those standards require that we plan and perform the audit to obtain reasonable assurance about whether the financial statements and financial highlights are free of material misstatement. The Fund is not required to have, nor were we engaged to perform, an audit of its internal control over financial reporting. Our audits included consideration of internal control over financial reporting as a basis for designing audit procedures that are appropriate in the circumstances, but not for the purpose of expressing an opinion on the effectiveness of the Fund’s internal control over financial reporting. Accordingly, we express no such opinion. An audit also includes examining, on a test basis, evidence supporting the amounts and disclosures in the financial statements, assessing the accounting principles used and significant estimates made by management, as well as evaluating the overall financial statement presentation. Our procedures included confirmation of securities owned as of November 30, 2015, by correspondence with the custodian and brokers; when replies were not received from brokers, we performed other auditing procedures. We believe that our audits provide a reasonable basis for our opinion.
In our opinion, the financial statements and financial highlights referred to above present fairly, in all material respects, the financial position of Global Growth Fund of American Century World Mutual Funds, Inc. as of November 30, 2015, the results of its operations for the year then ended, the changes in its net assets for each of the two years in the period then ended, and the financial highlights for each of the periods presented, in conformity with accounting principles generally accepted in the United States of America.
DELOITTE & TOUCHE LLP
Kansas City, Missouri
January 19, 2016
26
| Management |
The Board of Directors
The individuals listed below serve as directors of the funds. Each director will continue to serve in this capacity until death, retirement, resignation or removal from office. The board has adopted a mandatory retirement age for directors who are not “interested persons,” as that term is defined in the Investment Company Act (independent directors). Independent directors shall retire by December 31 of the year in which they reach their 75th birthday.
Mr. Thomas is an “interested person” because he currently serves as President and Chief Executive Officer of American Century Companies, Inc. (ACC), the parent company of American Century Investment Management, Inc. (ACIM or the advisor). Mr. Fink is treated as an “interested person” because of his recent employment with ACC and American Century Services, LLC (ACS). The other directors (more than three-fourths of the total number) are independent. They are not employees, directors or officers of, and have no financial interest in, ACC or any of its wholly owned, direct or indirect, subsidiaries, including ACIM, American Century Investment Services, Inc. (ACIS) and ACS, and they do not have any other affiliations, positions or relationships that would cause them to be considered “interested persons” under the Investment Company Act. The directors serve in this capacity for seven (in the case of Mr. Thomas, 15) registered investment companies in the American Century Investments family of funds.
The following table presents additional information about the directors. The mailing address for each director is 4500 Main Street, Kansas City, Missouri 64111.
Name (Year of Birth) | Position(s) Held with Funds | Length of Time Served | Principal Occupation(s) During Past 5 Years | Number of American Century Portfolios Overseen by Director | Other Directorships Held During Past 5 Years |
| Independent Directors | |||||
Thomas A. Brown(1) (1940) | Director | Since 1980 | Managing Member, Associated Investments, LLC (real estate investment company) | 80 | None |
| Andrea C. Hall (1945) | Director | Since 1997 | Retired | 80 | None |
| Jan M. Lewis (1957) | Director | Since 2011 | Retired; President and Chief Executive Officer, Catholic Charities of Northeast Kansas (human services organization) (2006 to 2013) | 80 | None |
| James A. Olson (1942) | Director and Chairman of the Board | Since 2007 (Chairman since 2014) | Member, Plaza Belmont LLC (private equity fund manager) | 80 | Saia, Inc. (2002 to 2012) and EPR Properties (2003 to 2013) |
| M. Jeannine Strandjord (1945) | Director | Since 1994 | Retired | 80 | Euronet Worldwide Inc.; MGP Ingredients, Inc.; Charming Shoppes, Inc. (2006 to 2010); and DST Systems Inc. (1996 to 2012) |
| John R. Whitten (1946) | Director | Since 2008 | Retired | 80 | Rudolph Technologies, Inc. |
27
| Name (Year of Birth) | Position(s) Held with Funds | Length of Time Served | Principal Occupation(s) During Past 5 Years | Number of American Century Portfolios Overseen by Director | Other Directorships Held During Past 5 Years |
| Independent Directors | |||||
| Stephen E. Yates (1948) | Director | Since 2012 | Retired; Executive Vice President, Technology & Operations, KeyCorp. (computer services) (2004 to 2010) | 80 | Applied Industrial Technologies, Inc. (2001 to 2010) |
| Interested Directors | |||||
| Barry Fink (1955) | Director | Since 2012 | Retired; Executive Vice President, ACC (September 2007 to February 2013); President, ACS (October 2007 to February 2013); Chief Operating Officer, ACC (September 2007 to November 2012) | 80 | None |
| Jonathan S. Thomas (1963) | Director and President | Since 2007 | President and Chief Executive Officer, ACC (March 2007 to present). Also serves as Chief Executive Officer, ACS; Executive Vice President, ACIM; Director, ACC, ACIM and other ACC subsidiaries | 125 | BioMed Valley Discoveries, Inc. |
(1) Thomas A. Brown retired as Director of the Board effective December 31, 2015.
The Statement of Additional Information has additional information about the fund's directors and is available without charge, upon request, by calling 1-800-345-2021.
28
Officers
The following table presents certain information about the executive officers of the funds. Each officer serves as an officer for each of the 15 investment companies in the American Century family of funds, unless otherwise noted. No officer is compensated for his or her service as an officer of the funds. The listed officers are interested persons of the funds and are appointed or re-appointed on an annual basis. The mailing address for each officer listed below is 4500 Main Street, Kansas City, Missouri 64111.
Name (Year of Birth) | Offices with the Funds | Principal Occupation(s) During the Past Five Years |
| Jonathan S. Thomas (1963) | Director and President since 2007 | President and Chief Executive Officer, ACC (March 2007 to present). Also serves as Chief Executive Officer, ACS; Executive Vice President, ACIM; Director, ACC, ACIM and other ACC subsidiaries |
| Amy D. Shelton (1964) | Chief Compliance Officer and Vice President since 2014 | Chief Compliance Officer, American Century funds, (March 2014 to present); Chief Compliance Officer, ACIM (February 2014 to present); Chief Compliance Officer, ACIS (October 2009 to present); Vice President, Client Interactions and Marketing, ACIS (February 2013 to January 2014); Director, Client Interactions and Marketing, ACIS (June 2007 to January 2013). Also serves as Vice President, ACIS |
| Charles A. Etherington (1957) | General Counsel since 2007 and Senior Vice President since 2006 | Attorney, ACC (February 1994 to present); Vice President, ACC (November 2005 to present); General Counsel, ACC (March 2007 to present). Also serves as General Counsel, ACIM, ACS, ACIS and other ACC subsidiaries; and Senior Vice President, ACIM and ACS |
| C. Jean Wade (1964) | Vice President, Treasurer and Chief Financial Officer since 2012 | Vice President, ACS (February 2000 to present) |
| Robert J. Leach (1966) | Vice President since 2006 and Assistant Treasurer since 2012 | Vice President, ACS (February 2000 to present) |
| David H. Reinmiller (1963) | Vice President since 2000 | Attorney, ACC (January 1994 to present); Associate General Counsel, ACC (January 2001 to present). Also serves as Vice President, ACIM and ACS |
| Ward D. Stauffer (1960) | Secretary since 2005 | Attorney, ACC (June 2003 to present) |
29
| Approval of Management Agreement |
At a meeting held on June 30, 2015, the Fund’s Board of Directors unanimously approved the renewal of the management agreement pursuant to which American Century Investment Management, Inc. (the “Advisor”) acts as the investment advisor for the Fund. Under Section 15(c) of the Investment Company Act, contracts for investment advisory services are required to be reviewed, evaluated, and approved by a majority of a fund’s directors (the “Directors”), including a majority of the independent Directors, each year.
Prior to its consideration of the renewal of the management agreement, the Directors requested and reviewed extensive data and information compiled by the Advisor and certain independent providers of evaluation data concerning the Fund and the services provided to the Fund by the Advisor. This review was in addition to the oversight and evaluation undertaken by the Board and its committees on a continuous basis and the information received was supplemental to the extensive information that the Board and its committees receive and consider throughout the year.
In connection with its consideration of the renewal of the management agreement, the Board’s review and evaluation of the services provided by the Advisor included, but was not limited to, the following:
| • | the nature, extent, and quality of investment management, shareholder services, and other services provided by the Advisor to the Fund; |
| • | the wide range of other programs and services the Advisor provides to the Fund and its shareholders on a routine and non-routine basis; |
| • | the Fund’s investment performance compared to appropriate benchmarks and/or a peer group of other mutual funds with similar investment objectives and strategies; |
| • | the cost of owning the Fund compared to the cost of owning similar funds; |
| • | the compliance policies, procedures, and regulatory experience of the Fund's service providers; |
| • | financial data showing the cost of services provided to the Fund, the profitability of the Fund to the Advisor, and the overall profitability of the Advisor; |
| • | possible economies of scale associated with the Advisor’s management of the Fund and other accounts under its management; |
| • | data comparing services provided and charges to the Advisor's other investment management clients; |
| • | acquired fund fees and expenses; |
| • | payments by the Fund and the Advisor to financial intermediaries; and |
| • | any collateral benefits derived by the Advisor from the management of the Fund. |
In keeping with their practice, the Directors held two in-person meetings and one telephonic meeting to review and discuss the information provided. The independent Directors also had the benefit of the advice of their independent counsel throughout the process.
Factors Considered
The Directors considered all of the information provided by the Advisor, the independent data providers, and independent counsel in connection with the approval. They determined that the information was sufficient for them to evaluate the management agreement for the Fund. In connection with their review, the Directors did not identify any single factor as being all-important or controlling, and each Director may have attributed different levels of importance to different factors. In deciding to renew the management agreement, the Board based its decision on a number of factors, including the following:
30
Nature, Extent and Quality of Services - Generally. Under the management agreement, the Advisor is responsible for providing or arranging for all services necessary for the operation of the
Fund. The Board noted that under the management agreement, the Advisor provides or arranges at its own expense a wide variety of services including:
| • | constructing and designing the Fund |
| • | portfolio research and security selection |
| • | initial capitalization/funding |
| • | securities trading |
| • | Fund administration |
| • | custody of Fund assets |
| • | daily valuation of the Fund’s portfolio |
| • | shareholder servicing and transfer agency, including shareholder confirmations, recordkeeping, and communications |
| • | legal services (except the independent Directors’ counsel) |
| • | regulatory and portfolio compliance |
| • | financial reporting |
| • | marketing and distribution (except Rule 12b-1 plans) |
The Board noted that many of these services have expanded over time both in terms of quantity and complexity in response to shareholder demands, competition in the industry, changing distribution channels, and the changing regulatory environment.
Investment Management Services. The nature of the investment management services provided to the Fund is quite complex and allows Fund shareholders access to professional money management, instant diversification of their investments within an asset class, the opportunity to easily diversify among asset classes by investing in or exchanging among various American Century Investments funds, and liquidity. In evaluating investment performance, the Board expects the Advisor to manage the Fund in accordance with its investment objectives and approved strategies. Further, the Directors recognize that the Advisor has an obligation to monitor trading activities, and in particular to seek the best execution of fund trades, and to evaluate the use of and payment for research. In providing these services, the Advisor utilizes teams of investment professionals (portfolio managers, analysts, research assistants, and securities traders) who require extensive information technology, research, training, compliance and other systems to conduct their business. The Board, directly and through its Fund Performance Review Committee, regularly reviews investment performance information for the Fund, together with comparative information for appropriate benchmarks and/or peer groups of similarly-managed funds, over different time horizons. The Directors also review detailed performance information during the management agreement approval process. If performance concerns are identified, the Fund receives special reviews until performance improves, during which the Board discusses with the Advisor the reasons for such results (e.g., market conditions, security selection) and any efforts being undertaken to improve performance. The Fund’s performance was above its benchmark for the three-, five-, and ten-year periods and below its benchmark for the one-year period reviewed by the Board. The Board discussed the Fund's performance with the Advisor and was satisfied with the efforts being undertaken by the Advisor. The Board found the investment management services provided by the Advisor to the Fund to be satisfactory and consistent with the management agreement.
Shareholder and Other Services. Under the management agreement, the Advisor provides the Fund with a comprehensive package of transfer agency, shareholder, and other services. The Board, directly and through various committees of the Board, regularly reviews reports and evaluations of such services at its regular meetings. These reports include, but are not limited to, information regarding the operational efficiency and accuracy of the shareholder and transfer agency services provided, staffing levels, shareholder satisfaction (as measured by external as well as internal sources), technology support, new products and services offered to Fund shareholders, securities trading activities, portfolio valuation services, auditing services, and legal and operational compliance activities. The Board particularly noted the Advisor’s continual efforts to maintain
31
effective business continuity plans and to address cybersecurity threats. Certain aspects of shareholder and transfer agency service level efficiency and the quality of securities trading activities are measured by independent third party providers and are presented in comparison to other fund groups not managed by the Advisor. The Board found the services provided by the Advisor to the Fund under the management agreement to be competitive and of high quality.
Costs of Services and Profitability. The Advisor provides detailed information concerning its cost of providing various services to the Fund, its profitability in managing the Fund (pre- and post-distribution), its overall profitability, and its financial condition. The Directors have reviewed with the Advisor the methodology used to prepare this financial information. This information is considered in evaluating the Advisor’s financial condition, its ability to continue to provide services under the management agreement, and the reasonableness of the current management fee. The Board concluded that the Advisor’s profits were reasonable in light of the services provided to the Fund.
Ethics. The Board generally considers the Advisor’s commitment to providing quality services to shareholders and to conducting its business ethically. They noted that the Advisor’s practices generally meet or exceed industry best practices.
Economies of Scale. The Board also reviewed information provided by the Advisor regarding the possible existence of economies of scale in connection with the management of the Fund. The Board concluded that economies of scale are difficult to measure and predict with precision, especially on a fund-by-fund basis. The Board concluded that the Advisor is appropriately sharing economies of scale through its competitive fee structure, offering competitive fees from fund inception, and through reinvestment in its business to provide shareholders additional content and services. The Board also noted that economies of scale are shared with the Fund and its shareholders through management fee breakpoints that serve to reduce the effective management fee as the assets of the Fund grow.
Comparison to Other Funds’ Fees. The management agreement provides that the Fund pays the Advisor a single, all-inclusive (or unified) management fee for providing all services necessary for the management and operation of the Fund, other than brokerage expenses, taxes, interest, extraordinary expenses, and the fees and expenses of the Fund’s independent Directors (including their independent legal counsel) and expenses incurred in connection with the provision of shareholder services and distribution services under a plan adopted pursuant to Rule 12b-1 under the 1940 Act. Under the unified fee structure, the Advisor is responsible for providing all investment advisory, custody, audit, administrative, compliance, recordkeeping, marketing and shareholder services, or arranging and supervising third parties to provide such services. By contrast, most other funds are charged a variety of fees, including an investment advisory fee, a transfer agency fee, an administrative fee, distribution charges, and other expenses. Other than their investment advisory fees and any applicable Rule 12b-1 distribution fees, all other components of the total fees charged by these other funds may be increased without shareholder approval. The Board believes the unified fee structure is a benefit to Fund shareholders because it clearly discloses to shareholders the cost of owning Fund shares, and, since the unified fee cannot be increased without a vote of Fund shareholders, it shifts to the Advisor the risk of increased costs of operating the Fund and provides a direct incentive to minimize administrative inefficiencies. Part of the Board’s analysis of fee levels involves reviewing certain evaluative data compiled by an independent provider comparing the Fund’s unified fee to the total expense ratios of its peers. The unified fee charged to shareholders of the Fund was below the median of the total expense ratios of the Fund’s peer expense universe and was within the range of its peer expense group. The Board concluded that the management fee paid by the Fund to the Advisor under the management agreement is reasonable in light of the services provided to the Fund.
32
Comparison to Fees and Services Provided to Other Clients of the Advisor. The Directors also requested and received information from the Advisor concerning the nature of the services, fees, costs and profitability of its advisory services to advisory clients other than the Fund. They observed that these varying types of client accounts require different services and involve different regulatory and entrepreneurial risks than the management of the Fund. The Board analyzed this information and concluded that the fees charged and services provided to the Fund were reasonable by comparison.
Payments to Intermediaries. The Directors also requested and received a description of payments made to intermediaries by the Fund and the Advisor. These payments include various payments made by the Fund or the Advisor to different types of intermediaries and recordkeepers for distribution and service activities provided for the Fund. The Board reviewed such information and found the payments to be reasonable in scope and purpose.
Collateral or “Fall-Out” Benefits Derived by the Advisor. The Board considered the existence of collateral benefits the Advisor may receive as a result of its relationship with the Fund. They concluded that the Advisor’s primary business is managing mutual funds and it generally does not use fund or shareholder information to generate profits in other lines of business, and therefore does not derive any significant collateral benefits from them. The Board noted that additional assets from other clients may offer the Advisor some benefit from increased leverage with service providers and counterparties. Additionally, the Advisor receives proprietary research from broker-dealers that execute fund portfolio transactions, which the Board concluded is likely to benefit other clients of the Advisor as well as Fund shareholders. The Board also determined that the Advisor is able to provide investment management services to certain clients other than the Fund, at least in part, due to its existing infrastructure built to serve the fund complex. The Board concluded that appropriate allocation methodologies had been employed to assign resources and the cost of those resources to these other clients and, where expressly provided, these other client assets may be included with the assets of the Fund to determine breakpoints in the management fee schedule.
Existing Relationship. The Board also considered whether there was any reason for not continuing the existing arrangement with the Advisor. In this regard, the Board was mindful of the potential disruptions of the Fund’s operations and various risks, uncertainties, and other effects that could occur as a result of a decision not to continue such relationship. In particular, the Board recognized that most shareholders have invested in the Fund on the strength of the Advisor’s industry standing and reputation and in the expectation that the Advisor will have a continuing role in providing advisory services to the Fund.
Conclusion of the Directors. As a result of this process, the Board, including all of the independent Directors, taking into account all of the factors discussed above and the information provided by the Advisor and others in connection with its review and throughout the year, determined that the management fee is fair and reasonable in light of the services provided and that the investment management agreement between the Fund and the Advisor should be renewed.
33
| Additional Information |
Retirement Account Information
As required by law, distributions you receive from certain IRAs are subject to federal income tax withholding, unless you elect not to have withholding apply. Tax will be withheld on the total amount withdrawn even though you may be receiving amounts that are not subject to withholding, such as nondeductible contributions. In such case, excess amounts of withholding could occur. You may adjust your withholding election so that a greater or lesser amount will be withheld.
If you don’t want us to withhold on this amount, you must notify us to not withhold the federal income tax. You may notify us in writing or in certain situations by telephone or through other electronic means. For systematic withdrawals, your withholding election will remain in effect until revoked or changed by filing a new election. You have the right to revoke your election at any time.
Remember, even if you elect not to have income tax withheld, you are liable for paying income tax on the taxable portion of your withdrawal. If you elect not to have income tax withheld or you don’t have enough income tax withheld, you may be responsible for payment of estimated tax. You may incur penalties under the estimated tax rules if your withholding and estimated tax payments are not sufficient. You can reduce or defer the income tax on a distribution by directly or indirectly rolling such distribution over to another IRA or eligible plan. You should consult your tax advisor for additional information.
State tax will be withheld if, at the time of your distribution, your address is within one of the mandatory withholding states and you have federal income tax withheld (or as otherwise required by state law). State taxes will be withheld from your distribution in accordance with the respective state rules.
Distributions you receive from 403(b), 457 and qualified plans are subject to special tax and withholding rules. Your plan administrator or plan sponsor is required to provide you with a special tax notice explaining those rules at the time you request a distribution. If applicable, federal and/or state taxes may be withheld from your distribution amount.
Proxy Voting Policies
A description of the policies that the fund's investment advisor uses in exercising the voting rights associated with the securities purchased and/or held by the fund is available without charge, upon request, by calling 1-800-345-2021. It is also available on the "About Us" page of American Century Investments’ website at americancentury.com and on the Securities and Exchange Commission’s website at sec.gov. Information regarding how the investment advisor voted proxies relating to portfolio securities during the most recent 12-month period ended June 30 is available on the "About Us" page at americancentury.com. It is also available at sec.gov.
Quarterly Portfolio Disclosure
The fund files its complete schedule of portfolio holdings with the Securities and Exchange Commission (SEC) for the first and third quarters of each fiscal year on Form N-Q. The fund’s Forms N-Q are available on the SEC’s website at sec.gov, and may be reviewed and copied at the SEC’s Public Reference Room in Washington, DC. Information on the operation of the Public Reference Room may be obtained by calling 1-800-SEC-0330. The fund also makes its complete schedule of portfolio holdings for the most recent quarter of its fiscal year available on its
website at americancentury.com and, upon request, by calling 1-800-345-2021.
34
Other Tax Information
The following information is provided pursuant to provisions of the Internal Revenue Code.
The fund hereby designates $54,473,748, or up to the maximum amount allowable, as long-term capital gain distributions for the fiscal year ended November 30, 2015.
The fund utilized earnings and profits of $3,315,981 distributed to shareholders on redemption of shares as part of the dividends paid deduction (tax equalization).
35
| Notes |
36
| ||
| Contact Us | americancentury.com | |
| Automated Information Line | 1-800-345-8765 | |
| Investor Services Representative | 1-800-345-2021 or 816-531-5575 | |
| Investors Using Advisors | 1-800-378-9878 | |
| Business, Not-For-Profit, Employer-Sponsored Retirement Plans | 1-800-345-3533 | |
| Banks and Trust Companies, Broker-Dealers, Financial Professionals, Insurance Companies | 1-800-345-6488 | |
| Telecommunications Relay Service for the Deaf | 711 | |
| American Century World Mutual Funds, Inc. | ||
Investment Advisor: American Century Investment Management, Inc. Kansas City, Missouri | ||
| This report and the statements it contains are submitted for the general information of our shareholders. The report is not authorized for distribution to prospective investors unless preceded or accompanied by an effective prospectus. | ||
| ©2016 American Century Proprietary Holdings, Inc. All rights reserved. CL-ANN-87751 1601 | ||
| ANNUAL REPORT | NOVEMBER 30, 2015 |
International Discovery Fund
| Table of Contents |
| President’s Letter | 2 | |
| Performance | 3 | |
| Portfolio Commentary | ||
| Fund Characteristics | ||
| Shareholder Fee Example | ||
| Schedule of Investments | ||
| Statement of Assets and Liabilities | ||
| Statement of Operations | ||
| Statement of Changes in Net Assets | ||
| Notes to Financial Statements | ||
| Financial Highlights | ||
| Report of Independent Registered Public Accounting Firm | ||
| Management | ||
| Approval of Management Agreement | ||
| Additional Information | ||
Any opinions expressed in this report reflect those of the author as of the date of the report, and do not necessarily represent the opinions of American Century Investments® or any other person in the American Century Investments organization. Any such opinions are subject to change at any time based upon market or other conditions and American Century Investments disclaims any responsibility to update such opinions. These opinions may not be relied upon as investment advice and, because investment decisions made by American Century Investments funds are based on numerous factors, may not be relied upon as an indication of trading intent on behalf of any American Century Investments fund. Security examples are used for representational purposes only and are not intended as recommendations to purchase or sell securities. Performance information for comparative indices and securities is provided to American Century Investments by third party vendors. To the best of American Century Investments’ knowledge, such information is accurate at the time of printing.
| President’s Letter |
| Dear Investor: Thank you for reviewing this annual report for the 12 months ended November 30, 2015. It provides investment performance and portfolio information for the reporting period, plus longer-term historical performance data. Annual reports remain important vehicles for conveying information about fund performance, including market and economic factors that affected returns during the reporting period. For additional, updated investment and market insights, we encourage you to visit our website, americancentury.com. |
| Jonathan Thomas | |
Divergence in Economic Growth and Monetary Policies, Combined With China Turmoil, Triggered Market Volatility
Divergence between the U.S. and the rest of the world—along with China’s struggles, plunging commodity prices, capital market volatility, and risk-off trading—were dominant themes during the reporting period. Global divergence described not only the relatively stronger economic growth enjoyed by the U.S. compared with most of the world, but also the related contrast between the U.S. Federal Reserve’s (the Fed’s) unwinding of monetary stimulus versus the continuation and expansion of stimulus by other major central banks.
In 2014, the Fed ended its latest massive bond-buying program (quantitative easing, QE), leading to expectations that interest rates would soar in 2015. But while QE was halted in the U.S., other major central banks were starting or increasing QE as their economies faltered, particularly the European Central Bank, the Bank of Japan, and the People’s Bank of China. This monetary policy divergence helped fuel increased demand for the U.S. dollar and U.S. dollar-denominated assets, and put downward pressure on commodity prices, most notably crude oil, which declined approximately 40% for the reporting period. Low inflation also prevailed after oil prices plunged amid a supply glut and muted demand for commodities in general, especially as China’s economy slowed. In this environment, the U.S. dollar, U.S. growth stocks, and U.S. municipal bonds generally benefited from “flight to quality” capital flows, while emerging market and commodity-related investments suffered significant declines.
We expect continued economic and monetary policy divergence between the U.S. and non-U.S. economies in 2016, accompanied by further market volatility. This could present both challenges and opportunities for active investment managers. In this environment, we continue to believe in a disciplined, diversified, long-term investment approach, using professionally managed stock and bond portfolios to meet financial goals. We appreciate your continued trust in us in the coming year.
Sincerely,
Jonathan Thomas
President and Chief Executive Officer
American Century Investments
2
| Performance |
| Total Returns as of November 30, 2015 | ||||||
Average Annual Returns | ||||||
Ticker Symbol | 1 year | 5 years | 10 years | Since Inception | Inception Date | |
| Investor Class | TWEGX | 4.61% | 6.06% | 5.59% | 10.45% | 4/1/94 |
| MSCI ACWI ex-U.S. Mid Cap Growth Index | — | 1.80% | 4.39% | 4.11% | N/A(1) | — |
| Institutional Class | TIDIX | 4.84% | 6.26% | 5.79% | 9.24% | 1/2/98 |
A Class(2) | ACIDX | 4/28/98 | ||||
| No sales charge* | 4.32% | 5.79% | 5.33% | 7.64% | ||
| With sales charge* | -1.65% | 4.55% | 4.71% | 7.28% | ||
| C Class | TWECX | 3.58% | 5.03% | — | 7.01% | 3/1/10 |
| R Class | TWERX | 4.09% | 5.54% | — | 7.54% | 3/1/10 |
* Sales charges include initial sales charges and contingent deferred sales charges (CDSCs), as applicable. A Class shares have a 5.75% maximum initial sales charge and may be subject to a maximum CDSC of 1.00%. C Class shares redeemed within 12 months of purchase are subject to a maximum CDSC of 1.00%. The SEC requires that mutual funds provide performance information net of maximum sales charges in all cases where charges could be applied.
| (1) | Benchmark data first available June 1994. |
| (2) | Prior to March 1, 2010, the A Class was referred to as the Advisor Class and did not have a front-end sales charge. Performance prior to that date has been adjusted to reflect this charge. |
Data presented reflect past performance. Past performance is no guarantee of future results. Current performance may be higher or lower than the performance shown. Investment return and principal value will fluctuate, and redemption value may be more or less than original cost. Data assumes reinvestment of dividends and capital gains, and none of the charts reflect the deduction of taxes that a shareholder would pay on fund distributions or the redemption of fund shares. To obtain performance data current to the most recent month end, please call 1-800-345-2021 or visit americancentury.com. For additional information about the fund, please consult the prospectus.
3
| Growth of $10,000 Over 10 Years |
| $10,000 investment made November 30, 2005 |
| Performance for other share classes will vary due to differences in fee structure. |
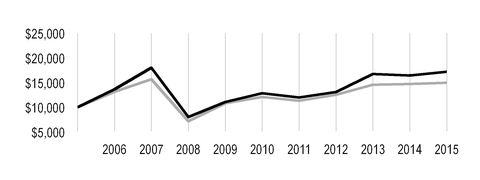
| Value on November 30, 2015 | |
| Investor Class — $17,228 | |
| MSCI ACWI ex-U.S. Mid Cap Growth Index — $14,969 | |
Total Annual Fund Operating Expenses | ||||
Investor Class | Institutional Class | A Class | C Class | R Class |
| 1.70% | 1.50% | 1.95% | 2.70% | 2.20% |
The total annual fund operating expenses shown is as stated in the fund’s prospectus current as of the date of this report. The prospectus may vary from the expense ratio shown elsewhere in this report because it is based on a different time period, includes acquired fund fees and expenses, and, if applicable, does not include fee waivers or expense reimbursements.
Data presented reflect past performance. Past performance is no guarantee of future results. Current performance may be higher or lower than the performance shown. Investment return and principal value will fluctuate, and redemption value may be more or less than original cost. Data assumes reinvestment of dividends and capital gains, and none of the charts reflect the deduction of taxes that a shareholder would pay on fund distributions or the redemption of fund shares. To obtain performance data current to the most recent month end, please call 1-800-345-2021 or visit americancentury.com. For additional information about the fund, please consult the prospectus.
4
| Portfolio Commentary |
Portfolio Managers: Brian Brady and Pratik Patel
Performance Summary
International Discovery advanced 4.61%* for the 12 months ended November 30, 2015. The portfolio’s benchmark, the MSCI ACWI ex-U.S. Mid Cap Growth Index, advanced 1.80% for the same period.
Non-U.S. stocks generally posted modest gains in local currency terms during the 12-month period, but the ongoing relative strength of the U.S. dollar reduced returns for U.S.-based investors. Throughout the period, global divergence of economic growth and central bank policy remained a prominent theme. As the U.S. continued to set itself apart from the rest of the developed world, with better relative economic growth and fewer central bank stimulus efforts in play, the U.S. dollar gained strength versus other currencies, where central bank stimulus plans remained in full force.
Stock performance during the period was choppy. Early on, non-U.S. stocks rallied and outpaced U.S. stocks, as investors largely overlooked sluggish growth data, geopolitical concerns, and continued weakness among commodity prices to focus instead on supportive central bank policies from the European Central Bank (ECB) and Bank of Japan. But those positive influences quickly faded, as renewed concerns about growth, commodities prices, a strong U.S. dollar, and a potential rate hike from the U.S. Federal Reserve (Fed) worried investors. Furthermore, in late July, Greece defaulted on its debt payment to the International Monetary Fund, sparking a sharp sell-off among global stocks. The sell-off intensified in the third quarter of 2015, as evidence emerged that China’s economy was cooling more than previously believed. In addition, oil and commodities prices dropped to new lows, due in part to falling demand from China. Anxiety about U.S. interest rate policy also remained a key theme, which persisted even after the Fed decided in September 2015 to leave rates unchanged due to concerns about the state of the global economy. Stocks rallied again in October, after the ECB pledged to take additional steps to jump-start the region’s lackluster economy and China’s central bank cut interest rates for the sixth time in 12 months, but they tumbled to close out the period in November.
Overall, developed market stocks outpaced their emerging market counterparts, and small- and mid-cap stocks outperformed large-cap stocks. Among non-U.S. small- and mid-cap stocks, growth stocks significantly outperformed value stocks. Within the fund, stock selection primarily accounted for the outperformance versus the benchmark, particularly within the consumer discretionary, industrials, and health care sectors. Overweight positions relative to the benchmark in the consumer discretionary and health care sectors also aided results. From a regional perspective, positioning in Denmark, the U.K., and Japan contributed to the fund’s relative performance.
Drug Company Was a Top Contributor
A portfolio-only position in Ono Pharmaceutical was among the largest contributors to performance. The Japan-based pharmaceutical company posted strong results based on its cancer-fighting antibody treatment developed jointly with Bristol-Myers Squibb.
| * | All fund returns referenced in this commentary are for Investor Class shares. Performance for other share classes will vary due to differences in fee structure; when Investor Class performance exceeds that of the fund's benchmark, other share classes may not. See page 3 for returns for all share classes. |
5
In addition, an overweight position in Peugeot, a France-based automobile manufacturer, was a top contributor. The company’s stock advanced early in the period on first-quarter 2015 revenue gains. Specifically, Peugeot benefited from corporate restructuring and a narrowing of the company’s business focus to more profitable automobile lines. Later in the period, weakness in China triggered a slowdown in the global automobile industry, and we exited the position.
An overweight position in Hanssem also was a main contributor to fund performance. The South Korea-based maker of kitchen furnishings benefited from improving sales growth and market share expansion in the furniture industry. In addition, stronger apartment transaction volume growth in South Korea and the company’s entry into new product lines supported stock gains. We took profits and exited the position.
Canada-based Health Care Company Detracted
Stock selection in the information technology and utilities sectors detracted from relative performance. In addition, an overweight position in the information technology sector also weighed on results. Regionally, stock selection in Canada, Israel, and Taiwan, along with an overweight position in Taiwan, detracted from performance.
A portfolio-only position in Concordia Healthcare, a Canada-based specialty pharmaceuticals company, was among the fund’s leading detractors. The company’s stock price declined along with shares of other pharmaceuticals companies due to U.S. political wrangling regarding prescription drug prices, which triggered “panic selling.” Nevertheless, we believe the sell-off was unwarranted, particularly because Concordia expects to derive less than 10% of its revenues from U.S. government reimbursements in 2016. We believe acquisitions and solid cost controls should continue to drive Concordia’s earnings growth.
In addition, a portfolio-only position in Caesarstone, an Israel-based manufacturer of kitchen materials and countertops, was a main detractor. Delays in production facilities and lack of pricing power in the U.S. and Australia drove down the stock price, and we exited the position.
A portfolio-only position in Germany-based MorphoSys, a biotechnology company, also was a main detractor for the period. One of the company’s key competitors announced strong test results for a competing drug, causing investors to lower their expectations for MorphoSys. We exited the position.
Outlook
We will continue to focus on companies we believe demonstrate improving, sustainable earnings growth, particularly those in the consumer, asset management, and real estate industries. We expect select companies in these industries to benefit from weak energy and commodity prices, a strong U.S. dollar, and ongoing central bank accommodations (especially in Europe and Japan). In Europe, unemployment levels are lower, and expansion in money supply and credit growth suggest ECB policies are gaining traction. We expect any additional quantitative easing (QE) to support Europe’s recovery at the macroeconomic and company levels, but growth may remain modest. A weaker euro should continue to act as a tailwind, helping European manufacturers and exporters by making their goods more competitive in foreign markets. Similarly, QE has weakened the yen, and Japan-based manufacturers and exporters have benefited, though certain domestically focused sectors of the economy remain challenged. We continue to underweight emerging markets, but we have increased the fund’s China exposure due to stabilizing economic data and central bank stimulus measures there.
6
| Fund Characteristics |
| NOVEMBER 30, 2015 | |
Top Ten Holdings | % of net assets |
| Pandora A/S | 3.3% |
| Qantas Airways Ltd. | 2.8% |
| Ono Pharmaceutical Co. Ltd. | 2.4% |
| Element Financial Corp. | 2.2% |
| DSV A/S | 2.0% |
| Thales SA | 2.0% |
| Zalando SE | 2.0% |
| DCC plc | 2.0% |
| Genmab A/S | 1.7% |
| MEIJI Holdings Co. Ltd. | 1.7% |
Types of Investments in Portfolio | % of net assets |
| Common Stocks | 99.6% |
| Temporary Cash Investments | 0.4% |
| Other Assets and Liabilities | —* |
| *Category is less than 0.05% of total net assets. | |
Investments by Country | % of net assets |
| Japan | 21.8% |
| United Kingdom | 11.1% |
| Germany | 9.0% |
| France | 8.2% |
| Denmark | 7.5% |
| Canada | 7.3% |
| Australia | 6.7% |
| China | 4.1% |
| Spain | 3.9% |
| Switzerland | 3.6% |
| South Korea | 3.3% |
| Other Countries | 13.1% |
| Cash and Equivalents** | 0.4% |
**Includes temporary cash investments and other assets and liabilities.
7
| Shareholder Fee Example |
Fund shareholders may incur two types of costs: (1) transaction costs, including sales charges (loads) on purchase payments and redemption/exchange fees; and (2) ongoing costs, including management fees; distribution and service (12b-1) fees; and other fund expenses. This example is intended to help you understand your ongoing costs (in dollars) of investing in your fund and to compare these costs with the ongoing cost of investing in other mutual funds.
The example is based on an investment of $1,000 made at the beginning of the period and held for the entire period from June 1, 2015 to November 30, 2015.
Actual Expenses
The table provides information about actual account values and actual expenses for each class. You may use the information, together with the amount you invested, to estimate the expenses that you paid over the period. First, identify the share class you own. Then simply divide your account value by $1,000 (for example, an $8,600 account value divided by $1,000 = 8.6), then multiply the result by the number under the heading “Expenses Paid During Period” to estimate the expenses you paid on your account during this period.
If you hold Investor Class shares of any American Century Investments fund, or Institutional Class shares of the American Century Diversified Bond Fund, in an American Century Investments account (i.e., not a financial intermediary or retirement plan account), American Century Investments may charge you a $12.50 semiannual account maintenance fee if the value of those shares is less than $10,000. We will redeem shares automatically in one of your accounts to pay the $12.50 fee. In determining your total eligible investment amount, we will include your investments in all personal accounts (including American Century Investments Brokerage accounts) registered under your Social Security number. Personal accounts include individual accounts, joint accounts, UGMA/UTMA accounts, personal trusts, Coverdell Education Savings Accounts and IRAs (including traditional, Roth, Rollover, SEP-, SARSEP- and SIMPLE-IRAs), and certain other retirement accounts. If you have only business, business retirement, employer-sponsored or American Century Investments Brokerage accounts, you are currently not subject to this fee. If you are subject to the Account Maintenance Fee, your account value could be reduced by the fee amount.
Hypothetical Example for Comparison Purposes
The table also provides information about hypothetical account values and hypothetical expenses based on the actual expense ratio of each class of your fund and an assumed rate of return of 5% per year before expenses, which is not the actual return of a fund’s share class. The hypothetical account values and expenses may not be used to estimate the actual ending account balance or expenses you paid for the period. You may use this information to compare the ongoing costs of investing in your fund and other funds. To do so, compare this 5% hypothetical example with the 5% hypothetical examples that appear in the shareholder reports of the other funds.
Please note that the expenses shown in the table are meant to highlight your ongoing costs only and do not reflect any transactional costs, such as sales charges (loads) or redemption/exchange fees. Therefore, the table is useful in comparing ongoing costs only, and will not help you determine the relative total costs of owning different funds. In addition, if these transactional costs were included, your costs would have been higher.
8
| Beginning Account Value 6/1/15 | Ending Account Value 11/30/15 | Expenses Paid During Period(1)6/1/15 - 11/30/15 | Annualized Expense Ratio(1) | |
Actual | ||||
| Investor Class | $1,000 | $944.30 | $7.85 | 1.61% |
| Institutional Class | $1,000 | $945.00 | $6.87 | 1.41% |
| A Class | $1,000 | $942.90 | $9.06 | 1.86% |
| C Class | $1,000 | $939.60 | $12.69 | 2.61% |
| R Class | $1,000 | $942.20 | $10.27 | 2.11% |
Hypothetical | ||||
| Investor Class | $1,000 | $1,017.00 | $8.14 | 1.61% |
| Institutional Class | $1,000 | $1,018.00 | $7.13 | 1.41% |
| A Class | $1,000 | $1,015.74 | $9.40 | 1.86% |
| C Class | $1,000 | $1,011.98 | $13.16 | 2.61% |
| R Class | $1,000 | $1,014.49 | $10.66 | 2.11% |
| (1) | Expenses are equal to the class's annualized expense ratio listed in the table above, multiplied by the average account value over the period, multiplied by 183, the number of days in the most recent fiscal half-year, divided by 365, to reflect the one-half year period. |
9
| Schedule of Investments |
NOVEMBER 30, 2015
| Shares | Value | |||
| COMMON STOCKS — 99.6% | ||||
| Australia — 6.7% | ||||
| Aristocrat Leisure Ltd. | 997,820 | $ | 6,848,208 | |
| Qantas Airways Ltd. | 5,809,261 | 15,292,580 | ||
| Star Entertainment Grp Ltd. (The) | 1,595,980 | 5,563,307 | ||
| Sydney Airport | 760,360 | 3,629,291 | ||
| Treasury Wine Estates Ltd. | 854,750 | 4,679,436 | ||
| 36,012,822 | ||||
| Austria — 1.7% | ||||
Erste Group Bank AG(1) | 296,100 | 9,085,000 | ||
| Belgium — 1.4% | ||||
| UCB SA | 84,850 | 7,577,069 | ||
| Canada — 7.3% | ||||
| Cineplex, Inc. | 72,330 | 2,711,867 | ||
| Concordia Healthcare Corp. | 170,850 | 6,579,667 | ||
| Dollarama, Inc. | 90,690 | 6,064,336 | ||
Element Financial Corp.(1) | 903,630 | 11,570,686 | ||
| Gildan Activewear, Inc. | 113,890 | 3,533,238 | ||
Lundin Mining Corp.(1) | 535,110 | 1,462,542 | ||
| PrairieSky Royalty Ltd. | 103,350 | 1,985,044 | ||
Shopify, Inc., Class A(1) | 116,980 | 3,081,253 | ||
| Silver Wheaton Corp. | 157,980 | 2,072,698 | ||
| 39,061,331 | ||||
| China — 4.1% | ||||
| Beijing Enterprises Water Group Ltd. | 2,716,000 | 2,122,792 | ||
Fuyao Glass Industry Group Co. Ltd., H Shares(1) | 920,800 | 2,071,175 | ||
| Geely Automobile Holdings Ltd. | 9,415,000 | 4,942,193 | ||
| Kingdee International Software Group Co. Ltd. | 3,892,000 | 1,882,388 | ||
| KWG Property Holding Ltd. | 5,058,500 | 3,614,403 | ||
| Shenzhou International Group Holdings Ltd. | 672,000 | 3,527,513 | ||
| Xinyi Solar Holdings Ltd. | 9,274,000 | 3,755,794 | ||
| 21,916,258 | ||||
| Denmark — 7.5% | ||||
| Chr Hansen Holding A/S | 44,450 | 2,789,358 | ||
| DSV A/S | 279,490 | 10,869,199 | ||
Genmab A/S(1) | 72,760 | 9,377,019 | ||
| Pandora A/S | 147,170 | 17,445,180 | ||
| 40,480,756 | ||||
| Finland — 1.0% | ||||
| Amer Sports Oyj | 180,030 | 5,244,107 | ||
| France — 8.2% | ||||
| Iliad SA | 31,390 | 7,001,152 | ||
| Ingenico Group SA | 38,800 | 4,884,450 | ||
10
| Shares | Value | |||
Nexans SA(1) | 128,160 | $ | 4,901,748 | |
| Plastic Omnium SA | 121,540 | 3,553,831 | ||
| Societe BIC SA | 33,930 | 5,581,648 | ||
| Technip SA | 39,350 | 2,062,547 | ||
| Teleperformance | 62,630 | 5,206,390 | ||
| Thales SA | 145,970 | 10,868,205 | ||
| 44,059,971 | ||||
| Germany — 9.0% | ||||
| Drillisch AG | 115,450 | 5,165,796 | ||
| Grand City Properties SA | 66,280 | 1,365,548 | ||
| KION Group AG | 81,730 | 4,045,582 | ||
| LANXESS AG | 125,330 | 6,382,517 | ||
| ProSiebenSat.1 Media SE | 144,770 | 7,601,948 | ||
| Stroeer SE | 72,050 | 4,281,237 | ||
| Symrise AG | 112,320 | 7,602,107 | ||
| Vonovia SE | 45,330 | 1,404,953 | ||
Zalando SE(1) | 315,540 | 10,701,617 | ||
| 48,551,305 | ||||
| India — 0.9% | ||||
| Ashok Leyland Ltd. | 1,893,030 | 2,686,680 | ||
| Container Corp. Of India Ltd. | 98,750 | 2,059,594 | ||
| 4,746,274 | ||||
| Ireland — 0.9% | ||||
| Smurfit Kappa Group plc | 172,750 | 4,719,940 | ||
| Italy — 1.3% | ||||
| FinecoBank Banca Fineco SpA | 311,420 | 2,431,537 | ||
Finmeccanica SpA(1) | 301,880 | 4,372,821 | ||
| 6,804,358 | ||||
| Japan — 21.8% | ||||
| DeNA Co. Ltd. | 117,100 | 1,843,540 | ||
| Financial Products Group Co. Ltd. | 313,900 | 2,144,516 | ||
| Gulliver International Co. Ltd. | 572,300 | 5,346,426 | ||
| Haseko Corp. | 621,000 | 6,941,478 | ||
| HIS Co. Ltd. | 141,700 | 4,598,631 | ||
| Japan Airport Terminal Co. Ltd. | 68,300 | 3,445,516 | ||
| Japan Exchange Group, Inc. | 391,800 | 6,142,762 | ||
Laox Co. Ltd.(1) | 1,586,000 | 3,916,686 | ||
| Mazda Motor Corp. | 239,100 | 4,967,492 | ||
| MEIJI Holdings Co. Ltd. | 117,000 | 9,361,901 | ||
| Ono Pharmaceutical Co. Ltd. | 79,000 | 12,648,985 | ||
| Open House Co. Ltd. | 152,300 | 3,204,362 | ||
| Pigeon Corp. | 67,900 | 1,947,092 | ||
| Skylark Co. Ltd. | 316,400 | 4,318,050 | ||
| Sundrug Co. Ltd. | 103,000 | 6,635,175 | ||
| Suruga Bank Ltd. | 283,400 | 5,737,066 | ||
| Sysmex Corp. | 104,700 | 6,540,560 | ||
| TDK Corp. | 81,600 | 5,866,450 | ||
11
| Shares | Value | |||
| Teijin Ltd. | 1,631,000 | $ | 5,803,233 | |
| Temp Holdings Co. Ltd. | 372,000 | 6,007,604 | ||
| Tosoh Corp. | 776,000 | 4,349,634 | ||
| TOTO Ltd. | 156,500 | 5,403,127 | ||
| 117,170,286 | ||||
| Malaysia — 0.5% | ||||
| MISC Bhd | 1,270,400 | 2,752,931 | ||
| Mexico — 0.4% | ||||
| Infraestructura Energetica Nova SAB de CV | 471,960 | 2,067,676 | ||
| Netherlands — 0.5% | ||||
| USG People NV | 174,660 | 2,685,936 | ||
| Portugal — 0.2% | ||||
| Jeronimo Martins SGPS SA | 92,950 | 1,289,940 | ||
| South Korea — 3.3% | ||||
| Hyundai Marine & Fire Insurance Co. Ltd. | 186,540 | 5,460,650 | ||
| LG Household & Health Care Ltd. | 6,000 | 5,222,573 | ||
| Medy-Tox, Inc. | 10,120 | 4,107,249 | ||
| NongShim Co. Ltd. | 7,410 | 2,658,655 | ||
| 17,449,127 | ||||
| Spain — 3.9% | ||||
Cellnex Telecom SAU(1) | 305,890 | 5,557,217 | ||
| Gamesa Corp. Tecnologica SA | 501,130 | 8,773,297 | ||
| Melia Hotels International SA | 238,894 | 3,038,937 | ||
| Merlin Properties Socimi SA | 293,500 | 3,656,048 | ||
| 21,025,499 | ||||
| Sweden — 1.5% | ||||
| Boliden AB | 285,250 | 5,242,677 | ||
Lundin Petroleum AB(1) | 167,440 | 2,678,103 | ||
| 7,920,780 | ||||
| Switzerland — 3.6% | ||||
| Chocoladefabriken Lindt & Spruengli AG | 560 | 3,377,363 | ||
| dorma+kaba Holding AG | 12,904 | 8,290,367 | ||
| Lonza Group AG | 49,170 | 7,770,853 | ||
| 19,438,583 | ||||
| Taiwan — 1.6% | ||||
| Catcher Technology Co. Ltd. | 563,000 | 5,450,279 | ||
| Hermes Microvision, Inc. | 33,000 | 1,177,777 | ||
| Makalot Industrial Co. Ltd. | 294,475 | 2,011,762 | ||
| 8,639,818 | ||||
| United Kingdom — 11.1% | ||||
| Ashtead Group plc | 367,120 | 6,054,464 | ||
Auto Trader Group plc(1) | 480,010 | 2,937,316 | ||
| DCC plc | 117,000 | 10,519,951 | ||
| Direct Line Insurance Group plc | 833,380 | 5,168,719 | ||
| easyJet plc | 152,020 | 3,784,662 | ||
| Howden Joinery Group plc | 799,460 | 6,261,142 | ||
| London Stock Exchange Group plc | 43,320 | 1,728,971 | ||
| Persimmon plc | 196,250 | 5,660,202 | ||
12
| Shares | Value | |||
| Provident Financial plc | 128,530 | $ | 6,914,638 | |
| Rightmove plc | 44,850 | 2,702,617 | ||
| St. James's Place plc | 202,810 | 3,103,392 | ||
Worldpay Group plc(1) | 990,240 | 4,459,284 | ||
| 59,295,358 | ||||
| United States — 1.2% | ||||
IMAX Corp.(1) | 167,190 | 6,333,157 | ||
TOTAL COMMON STOCKS (Cost $497,333,927) | 534,328,282 | |||
| TEMPORARY CASH INVESTMENTS — 0.4% | ||||
| Repurchase Agreement, Credit Suisse First Boston, Inc., (collateralized by various U.S. Treasury obligations, 0.625%, 8/31/17, valued at $784,408), in a joint trading account at 0.01%, dated 11/30/15, due 12/1/15 (Delivery value $769,241) | 769,241 | |||
| Repurchase Agreement, Fixed Income Clearing Corp., (collateralized by various U.S. Treasury obligations, 3.00%, 11/15/44, valued at $1,308,363), at 0.01%, dated 11/30/15, due 12/1/15 (Delivery value $1,282,000) | 1,282,000 | |||
| State Street Institutional Liquid Reserves Fund, Premier Class | 302,078 | 302,078 | ||
TOTAL TEMPORARY CASH INVESTMENTS (Cost $2,353,319) | 2,353,319 | |||
TOTAL INVESTMENT SECURITIES — 100.0% (Cost $499,687,246) | 536,681,601 | |||
OTHER ASSETS AND LIABILITIES† | 45,351 | |||
| TOTAL NET ASSETS — 100.0% | $ | 536,726,952 | ||
| MARKET SECTOR DIVERSIFICATION | ||
(as a % of net assets) | ||
| Consumer Discretionary | 26.4 | % |
| Industrials | 23.4 | % |
| Financials | 13.7 | % |
| Health Care | 10.2 | % |
| Materials | 7.6 | % |
| Consumer Staples | 6.5 | % |
| Information Technology | 6.4 | % |
| Telecommunication Services | 3.3 | % |
| Energy | 1.3 | % |
| Utilities | 0.8 | % |
| Cash and Equivalents* | 0.4 | % |
*Includes temporary cash investments and other assets and liabilities.
| NOTES TO SCHEDULE OF INVESTMENTS | ||
† Category is less than 0.05% of total net assets.
| (1) | Non-income producing. |
See Notes to Financial Statements.
13
| Statement of Assets and Liabilities |
| NOVEMBER 30, 2015 | |||
| Assets | |||
| Investment securities, at value (cost of $499,687,246) | $ | 536,681,601 | |
| Foreign currency holdings, at value (cost of $159,499) | 157,513 | ||
| Receivable for capital shares sold | 59,961 | ||
| Dividends and interest receivable | 807,300 | ||
| Other assets | 428,118 | ||
| 538,134,493 | |||
| Liabilities | |||
| Payable for investments purchased | 597,310 | ||
| Payable for capital shares redeemed | 103,791 | ||
| Accrued management fees | 704,451 | ||
| Distribution and service fees payable | 1,989 | ||
| 1,407,541 | |||
| Net Assets | $ | 536,726,952 | |
| Net Assets Consist of: | |||
| Capital (par value and paid-in surplus) | $ | 613,143,380 | |
| Undistributed net investment income | 1,655,698 | ||
| Accumulated net realized loss | (114,942,482 | ) | |
| Net unrealized appreciation | 36,870,356 | ||
| $ | 536,726,952 | ||
| Net Assets | Shares Outstanding | Net Asset Value Per Share | ||||
| Investor Class, $0.01 Par Value | $506,817,117 | 39,289,315 | $12.90 | |||
| Institutional Class, $0.01 Par Value | $22,415,141 | 1,716,363 | $13.06 | |||
| A Class, $0.01 Par Value | $6,595,860 | 525,251 | $12.56* | |||
| C Class, $0.01 Par Value | $719,545 | 57,805 | $12.45 | |||
| R Class, $0.01 Par Value | $179,289 | 14,088 | $12.73 | |||
*Maximum offering price $13.33 (net asset value divided by 0.9425).
See Notes to Financial Statements.
14
| Statement of Operations |
| YEAR ENDED NOVEMBER 30, 2015 | |||
| Investment Income (Loss) | |||
| Income: | |||
| Dividends (net of foreign taxes withheld of $623,236) | $ | 9,394,086 | |
| Interest | 1,518 | ||
| 9,395,604 | |||
| Expenses: | |||
| Management fees | 9,043,769 | ||
| Distribution and service fees: | |||
| A Class | 15,445 | ||
| C Class | 6,249 | ||
| R Class | 1,337 | ||
| Directors' fees and expenses | 295,089 | ||
| Other expenses | 29,408 | ||
| 9,391,297 | |||
| Net investment income (loss) | 4,307 | ||
| Realized and Unrealized Gain (Loss) | |||
| Net realized gain (loss) on: | |||
| Investment transactions | 52,554,354 | ||
| Foreign currency transactions | (416,099 | ) | |
| 52,138,255 | |||
| Change in net unrealized appreciation (depreciation) on: | |||
| Investments | (26,919,591 | ) | |
| Translation of assets and liabilities in foreign currencies | (18,748 | ) | |
| (26,938,339 | ) | ||
| Net realized and unrealized gain (loss) | 25,199,916 | ||
| Net Increase (Decrease) in Net Assets Resulting from Operations | $ | 25,204,223 | |
See Notes to Financial Statements.
15
| Statement of Changes in Net Assets |
| YEARS ENDED NOVEMBER 30, 2015 AND NOVEMBER 30, 2014 | ||||||
| Increase (Decrease) in Net Assets | November 30, 2015 | November 30, 2014 | ||||
| Operations | ||||||
| Net investment income (loss) | $ | 4,307 | $ | 1,361,881 | ||
| Net realized gain (loss) | 52,138,255 | 53,332,305 | ||||
| Change in net unrealized appreciation (depreciation) | (26,938,339 | ) | (62,731,842 | ) | ||
| Net increase (decrease) in net assets resulting from operations | 25,204,223 | (8,037,656 | ) | |||
| Distributions to Shareholders | ||||||
| From net investment income: | ||||||
| Investor Class | (1,194,380 | ) | (6,710,325 | ) | ||
| Institutional Class | (96,309 | ) | (445,178 | ) | ||
| A Class | — | (31,274 | ) | |||
| C Class | — | (1,497 | ) | |||
| R Class | — | (1,905 | ) | |||
| Decrease in net assets from distributions | (1,290,689 | ) | (7,190,179 | ) | ||
| Capital Share Transactions | ||||||
| Net increase (decrease) in net assets from capital share transactions (Note 5) | (57,317,465 | ) | (66,706,975 | ) | ||
| Redemption Fees | ||||||
| Increase in net assets from redemption fees | 11,710 | 39,362 | ||||
| Net increase (decrease) in net assets | (33,392,221 | ) | (81,895,448 | ) | ||
| Net Assets | ||||||
| Beginning of period | 570,119,173 | 652,014,621 | ||||
| End of period | $ | 536,726,952 | $ | 570,119,173 | ||
| Undistributed (distributions in excess of) net investment income | $ | 1,655,698 | $ | (2,491,942 | ) | |
See Notes to Financial Statements.
16
| Notes to Financial Statements |
NOVEMBER 30, 2015
1. Organization
American Century World Mutual Funds, Inc. (the corporation) is registered under the Investment Company Act of 1940, as amended (the 1940 Act), as an open-end management investment company and is organized as a Maryland corporation. International Discovery Fund (the fund) is one fund in a series issued by the corporation. The fund is diversified as defined under the 1940 Act. The fund's investment objective is to seek capital growth.
The fund offers the Investor Class, the Institutional Class, the A Class, the C Class and the R Class. The A Class may incur an initial sales charge. The A Class and C Class may be subject to a contingent deferred sales charge. The share classes differ principally in their respective sales charges and distribution and shareholder servicing expenses and arrangements. The Institutional Class is made available to institutional shareholders or through financial intermediaries whose clients do not require the same level of shareholder and administrative services as shareholders of other classes. As a result, the Institutional Class is charged a lower unified management fee.
2. Significant Accounting Policies
The following is a summary of significant accounting policies consistently followed by the fund in preparation of its financial statements. The fund is an investment company and follows accounting and reporting guidance in accordance with accounting principles generally accepted in the United States of America. This may require management to make certain estimates and assumptions at the date of the financial statements. Actual results could differ from these estimates. Management evaluated the impact of events or transactions occurring through the date the financial statements were issued that would merit recognition or disclosure.
Investment Valuations — The fund determines the fair value of its investments and computes its net asset value per share at the close of regular trading (usually 4 p.m. Eastern time) on the New York Stock Exchange (NYSE) on each day the NYSE is open. The Board of Directors has adopted valuation policies and procedures to guide the investment advisor in the fund’s investment valuation process and to provide methodologies for the oversight of the fund’s pricing function.
Equity securities that are listed or traded on a domestic securities exchange are valued at the last reported sales price or at the official closing price as provided by the exchange. Equity securities traded on foreign securities exchanges are generally valued at the closing price of such securities on the exchange where primarily traded or at the close of the NYSE, if that is earlier. If no last sales price is reported, or if local convention or regulation so provides, the mean of the latest bid and asked prices may be used. Securities traded over-the-counter are valued at the mean of the latest bid and asked prices, the last sales price, or the official closing price. Equity securities initially expressed in local currencies are translated into U.S. dollars at the mean of the appropriate currency exchange rate at the close of the NYSE as provided by an independent pricing service.
Open-end management investment companies are valued at the reported net asset value per share. Repurchase agreements are valued at cost, which approximates fair value.
If the fund determines that the market price for an investment is not readily available or the valuation methods mentioned above do not reflect an investment’s fair value, such investment is valued as determined in good faith by the Board of Directors or its delegate, in accordance with policies and procedures adopted by the Board of Directors. In its determination of fair value, the fund may review several factors including, but not limited to, market information regarding the specific investment or comparable investments and correlation with other investment types, futures indices or general market indicators. Circumstances that may cause the fund to use these procedures to value an investment include, but are not limited to: an investment has been declared in default or is distressed; trading in a security has been suspended during the trading day or a security is not actively trading on its principal exchange; prices received from a regular pricing source are deemed unreliable; or there is a foreign market holiday and no trading occurred.
The fund monitors for significant events occurring after the close of an investment’s primary exchange but before the fund’s net asset value per share is determined. Significant events may include, but are not limited
17
to: corporate announcements and transactions; governmental action and political unrest that could impact a specific investment or an investment sector; or armed conflicts, natural disasters and similar events that could affect investments in a specific country or region. The fund also monitors for significant fluctuations between domestic and foreign markets, as evidenced by the U.S. market or such other indicators that the Board of Directors, or its delegate, deems appropriate. If significant fluctuations in foreign markets are identified, the fund may apply a model-derived factor to the closing price of equity securities traded on foreign securities exchanges. The factor is based on observable market data as provided by an independent pricing service.
Security Transactions — Security transactions are accounted for as of the trade date. Net realized gains and losses are determined on the identified cost basis, which is also used for federal income tax purposes.
Investment Income — Dividend income less foreign taxes withheld, if any, is recorded as of the ex-dividend date. Distributions received on securities that represent a return of capital or long-term capital gain are recorded as a reduction of cost of investments and/or as a realized gain. The fund may estimate the components of distributions received that may be considered nontaxable distributions or long-term capital gain distributions for income tax purposes. Interest income is recorded on the accrual basis and includes accretion of discounts and amortization of premiums.
Foreign Currency Translations — All assets and liabilities initially expressed in foreign currencies are translated into U.S. dollars at prevailing exchange rates at period end. The fund may enter into spot foreign currency exchange contracts to facilitate transactions denominated in a foreign currency. Purchases and sales of investment securities, dividend and interest income, spot foreign currency exchange contracts, and expenses are translated at the rates of exchange prevailing on the respective dates of such transactions. Net realized and unrealized foreign currency exchange gains or losses related to investment securities are a component of net realized gain (loss) on investment transactions and change in net unrealized appreciation (depreciation) on investments, respectively.
Repurchase Agreements — The fund may enter into repurchase agreements with institutions that American Century Investment Management, Inc. (ACIM) (the investment advisor) has determined are creditworthy pursuant to criteria adopted by the Board of Directors. The fund requires that the collateral, represented by securities, received in a repurchase transaction be transferred to the custodian in a manner sufficient to enable the fund to obtain those securities in the event of a default under the repurchase agreement. ACIM monitors, on a daily basis, the securities transferred to ensure the value, including accrued interest, of the securities under each repurchase agreement is equal to or greater than amounts owed to the fund under each repurchase agreement.
Joint Trading Account — Pursuant to an Exemptive Order issued by the Securities and Exchange Commission, the fund, along with certain other funds in the American Century Investments family of funds, may transfer uninvested cash balances into a joint trading account. These balances are invested in one or more repurchase agreements that are collateralized by U.S. Treasury or Agency obligations.
Income Tax Status — It is the fund’s policy to distribute substantially all net investment income and net realized gains to shareholders and to otherwise qualify as a regulated investment company under provisions of the Internal Revenue Code. Accordingly, no provision has been made for income taxes. The fund files U.S. federal, state, local and non-U.S. tax returns as applicable. The fund's tax returns are subject to examination by the relevant taxing authority until expiration of the applicable statute of limitations, which is generally three years from the date of filing but can be longer in certain jurisdictions. At this time, management believes there are no uncertain tax positions which, based on their technical merit, would not be sustained upon examination and for which it is reasonably possible that the total amounts of unrecognized tax benefits will significantly change in the next twelve months.
Multiple Class — All shares of the fund represent an equal pro rata interest in the net assets of the class to which such shares belong, and have identical voting, dividend, liquidation and other rights and the same terms and conditions, except for class specific expenses and exclusive rights to vote on matters affecting only individual classes. Income, non-class specific expenses, and realized and unrealized capital gains and losses of the fund are allocated to each class of shares based on their relative net assets.
Distributions to Shareholders — Distributions from net investment income and net realized gains, if any, are generally declared and paid annually. The fund may make distributions on a more frequent basis to comply with the distribution requirements of the Internal Revenue Code, in all events in a manner consistent with provisions of the 1940 Act.
18
Redemption Fees — The fund may impose a 2.00% redemption fee on shares held less than 60 days. The fee may not be applicable to all classes. The redemption fee is retained by the fund and helps cover transaction costs that long-term investors may bear when the fund sells securities to meet investor redemptions.
Indemnifications — Under the corporation’s organizational documents, its officers and directors are indemnified against certain liabilities arising out of the performance of their duties to the fund. In addition, in the normal course of business, the fund enters into contracts that provide general indemnifications. The maximum exposure under these arrangements is unknown as this would involve future claims that may be made against a fund. The risk of material loss from such claims is considered by management to be remote.
3. Fees and Transactions with Related Parties
Certain officers and directors of the corporation are also officers and/or directors of American Century Companies, Inc. (ACC). The corporation’s investment advisor, ACIM, the corporation's distributor, American Century Investment Services, Inc. (ACIS), and the corporation’s transfer agent, American Century Services, LLC, are wholly owned, directly or indirectly, by ACC.
Management Fees — The corporation has entered into a management agreement with ACIM, under which ACIM provides the fund with investment advisory and management services in exchange for a single, unified management fee (the fee) per class. The agreement provides that all expenses of managing and operating the fund, except distribution and service fees, brokerage expenses, taxes, interest, fees and expenses of the independent directors (including legal counsel fees), and extraordinary expenses, will be paid by ACIM. The fee is computed and accrued daily based on each class’s daily net assets and paid monthly in arrears. The rate of the fee is determined by applying a fee rate calculation formula. This formula takes into account the fund’s assets as well as certain assets, if any, of other clients of the investment advisor outside the American Century Investments family of funds (such as subadvised funds and separate accounts) that have very similar investment teams and investment strategies (strategy assets). The annual management fee schedule ranges from 1.200% to 1.750% for the Investor Class, A Class, C Class and R Class. The annual management fee schedule ranges from 1.000% to 1.550% for the Institutional Class. The effective annual management fee for each class for the year ended November 30, 2015 was 1.61% for the Investor Class, A Class, C Class and R Class and 1.41% for the Institutional Class.
Distribution and Service Fees — The Board of Directors has adopted a separate Master Distribution and Individual Shareholder Services Plan for each of the A Class, C Class and R Class (collectively the plans), pursuant to Rule 12b-1 of the 1940 Act. The plans provide that the A Class will pay ACIS an annual distribution and service fee of 0.25%. The plans provide that the C Class will pay ACIS an annual distribution and service fee of 1.00%, of which 0.25% is paid for individual shareholder services and 0.75% is paid for distribution services. The plans provide that the R Class will pay ACIS an annual distribution and service fee of 0.50%. The fees are computed and accrued daily based on each class’s daily net assets and paid monthly in arrears. The fees are used to pay financial intermediaries for distribution and individual shareholder services. Fees incurred under the plans during the year ended November 30, 2015 are detailed in the Statement of Operations.
Directors' Fees and Expenses — The Board of Directors is responsible for overseeing the investment advisor’s management and operations of the fund. The directors receive detailed information about the fund and its investment advisor regularly throughout the year, and meet at least quarterly with management of the investment advisor to review reports about fund operations. The impact of directors' fees and expenses (including legal counsel fees) to the ratio of operating expenses to average net assets was 0.05% for the year ended November 30, 2015. The fund’s officers do not receive compensation from the fund.
4. Investment Transactions
Purchases and sales of investment securities, excluding short-term investments, for the year ended November 30, 2015 were $950,429,772 and $1,003,553,854, respectively.
19
5. Capital Share Transactions
Transactions in shares of the fund were as follows:
| Year ended November 30, 2015 | Year ended November 30, 2014 | |||||||||
| Shares | Amount | Shares | Amount | |||||||
| Investor Class/Shares Authorized | 400,000,000 | 400,000,000 | ||||||||
| Sold | 1,973,067 | $ | 26,172,142 | 4,156,039 | $ | 55,774,195 | ||||
| Issued in reinvestment of distributions | 89,395 | 1,141,578 | 493,153 | 6,430,257 | ||||||
| Redeemed | (6,612,888 | ) | (84,604,777 | ) | (9,653,900 | ) | (126,648,667 | ) | ||
| (4,550,426 | ) | (57,291,057 | ) | (5,004,708 | ) | (64,444,215 | ) | |||
| Institutional Class/Shares Authorized | 40,000,000 | 70,000,000 | ||||||||
| Sold | 207,249 | 2,735,825 | 1,492,577 | 20,057,215 | ||||||
| Issued in reinvestment of distributions | 7,460 | 96,309 | 33,648 | 444,778 | ||||||
| Redeemed | (282,242 | ) | (3,687,250 | ) | (1,868,085 | ) | (25,112,803 | ) | ||
| (67,533 | ) | (855,116 | ) | (341,860 | ) | (4,610,810 | ) | |||
| A Class/Shares Authorized | 30,000,000 | 10,000,000 | ||||||||
| Sold | 226,922 | 2,883,104 | 251,885 | 3,206,500 | ||||||
| Issued in reinvestment of distributions | — | — | 2,425 | 31,274 | ||||||
| Redeemed | (165,320 | ) | (2,093,362 | ) | (80,633 | ) | (1,025,435 | ) | ||
| 61,602 | 789,742 | 173,677 | 2,212,339 | |||||||
| C Class/Shares Authorized | 20,000,000 | 10,000,000 | ||||||||
| Sold | 38,351 | 487,665 | 24,659 | 311,509 | ||||||
| Issued in reinvestment of distributions | — | — | 113 | 1,497 | ||||||
| Redeemed | (18,489 | ) | (226,895 | ) | (14,404 | ) | (177,537 | ) | ||
| 19,862 | 260,770 | 10,368 | 135,469 | |||||||
| R Class/Shares Authorized | 20,000,000 | 10,000,000 | ||||||||
| Sold | 2,256 | 28,656 | 9,628 | 127,326 | ||||||
| Issued in reinvestment of distributions | — | — | 141 | 1,905 | ||||||
| Redeemed | (18,745 | ) | (250,460 | ) | (10,089 | ) | (128,989 | ) | ||
| (16,489 | ) | (221,804 | ) | (320 | ) | 242 | ||||
| Net increase (decrease) | (4,552,984 | ) | $ | (57,317,465 | ) | (5,162,843 | ) | $ | (66,706,975 | ) |
6. Fair Value Measurements
The fund’s investments valuation process is based on several considerations and may use multiple inputs to determine the fair value of the investments held by the fund. In conformity with accounting principles generally accepted in the United States of America, the inputs used to determine a valuation are classified into three broad levels.
| • | Level 1 valuation inputs consist of unadjusted quoted prices in an active market for identical investments. |
| • | Level 2 valuation inputs consist of direct or indirect observable market data (including quoted prices for comparable investments, evaluations of subsequent market events, interest rates, prepayment speeds, credit risk, etc.). These inputs also consist of quoted prices for identical investments initially expressed in local currencies that are adjusted through translation into U.S. dollars. |
| • | Level 3 valuation inputs consist of unobservable data (including a fund’s own assumptions). |
The level classification is based on the lowest level input that is significant to the fair valuation measurement. The valuation inputs are not necessarily an indication of the risks associated with investing in these securities or other financial instruments. There were no significant transfers between levels during the period.
20
The following is a summary of the level classifications as of period end. The Schedule of Investments provides additional information on the fund’s portfolio holdings.
| Level 1 | Level 2 | Level 3 | ||||||
| Assets | ||||||||
| Investment Securities | ||||||||
| Common Stocks | $ | 11,487,108 | $ | 522,841,174 | — | |||
| Temporary Cash Investments | 302,078 | 2,051,241 | — | |||||
| $ | 11,789,186 | $ | 524,892,415 | — | ||||
7. Risk Factors
There are certain risks involved in investing in foreign securities. These risks include those resulting from future adverse political, social and economic developments, fluctuations in currency exchange rates, the possible imposition of exchange controls, and other foreign laws or restrictions. Investing in emerging markets may accentuate these risks.
The fund invests in common stocks of small companies. Because of this, the fund may be subject to greater risk and market fluctuations than a fund investing in larger, more established companies.
The fund’s investment process may result in high portfolio turnover, which could mean high transaction costs, affecting both performance and capital gains tax liabilities to investors.
8. Federal Tax Information
The tax character of distributions paid during the years ended November 30, 2015 and November 30, 2014 were as follows:
| 2015 | 2014 | |||||
| Distributions Paid From | ||||||
| Ordinary income | $ | 1,290,689 | $ | 7,190,179 | ||
| Long-term capital gains | — | — | ||||
The book-basis character of distributions made during the year from net investment income or net realized gains may differ from their ultimate characterization for federal income tax purposes. These differences reflect the differing character of certain income items and net realized gains and losses for financial statement and tax purposes, and may result in reclassification among certain capital accounts on the financial statements.
The reclassifications, which are primarily due to gains on investments in passive foreign investment companies, were made to undistributed net investment income $5,434,022, and accumulated net realized loss $(5,434,022).
As of November 30, 2015, the federal tax cost of investments and the components of distributable earnings on a tax-basis were as follows:
| Federal tax cost of investments | $ | 501,304,507 | |
| Gross tax appreciation of investments | $ | 55,966,406 | |
| Gross tax depreciation of investments | (20,589,312 | ) | |
| Net tax appreciation (depreciation) of investments | 35,377,094 | ||
| Net tax appreciation (depreciation) on translation of assets and liabilities in foreign currencies | (123,997 | ) | |
| Net tax appreciation (depreciation) | $ | 35,253,097 | |
| Undistributed ordinary income | $ | 2,729,110 | |
| Accumulated short-term capital losses | $ | (114,127,606 | ) |
| Post-October capital loss deferral | $ | (271,029 | ) |
21
The difference between book-basis and tax-basis unrealized appreciation (depreciation) is attributable primarily to the realization to ordinary income for tax purposes of unrealized gains on investments in passive foreign investment companies.
Accumulated capital losses represent net capital loss carryovers that may be used to offset future realized capital gains for federal income tax purposes. Future capital loss carryover utilization in any given year may be subject to Internal Revenue Code limitations. Capital loss carryovers expire in 2017.
Loss deferrals represent certain qualified losses that the fund has elected to treat as having been incurred in the following fiscal year for federal income tax purposes.
| Financial Highlights |
| For a Share Outstanding Throughout the Years Ended November 30 (except as noted) | |||||||||||||
| Per-Share Data | Ratios and Supplemental Data | ||||||||||||
| Income From Investment Operations: | Ratio to Average Net Assets of: | ||||||||||||
Net Asset Value, Beginning of Period | Net Investment Income (Loss)(1) | Net Realized and Unrealized Gain (Loss) | Total From Investment Operations | Distributions From Net Investment Income | Net Asset Value, End of Period | Total Return(2) | Operating Expenses | Net Investment Income (Loss) | Portfolio Turnover Rate | Net Assets, End of Period (in thousands) | |||
| Investor Class | |||||||||||||
| 2015 | $12.35 | —(3) | 0.58 | 0.58 | (0.03) | $12.90 | 4.61% | 1.67% | 0.00%(4) | 171% | $506,817 | ||
| 2014 | $12.70 | 0.03 | (0.24) | (0.21) | (0.14) | $12.35 | (1.73)% | 1.61% | 0.20% | 134% | $541,410 | ||
| 2013 | $10.08 | —(3) | 2.79 | 2.79 | (0.17) | $12.70 | 27.97% | 1.56% | 0.03% | 157% | $620,359 | ||
| 2012 | $9.22 | 0.04 | 0.82 | 0.86 | —(3) | $10.08 | 9.23% | 1.50% | 0.42% | 154% | $582,331 | ||
| 2011 | $9.88 | 0.02 | (0.68) | (0.66) | — | $9.22 | (6.58)% | 1.42% | 0.14% | 167% | $660,971 | ||
| Institutional Class | |||||||||||||
| 2015 | $12.50 | 0.03 | 0.58 | 0.61 | (0.05) | $13.06 | 4.84% | 1.47% | 0.20% | 171% | $22,415 | ||
| 2014 | $12.86 | 0.06 | (0.25) | (0.19) | (0.17) | $12.50 | (1.55)% | 1.41% | 0.40% | 134% | $22,304 | ||
| 2013 | $10.20 | 0.05 | 2.80 | 2.85 | (0.19) | $12.86 | 28.16% | 1.36% | 0.23% | 157% | $27,341 | ||
| 2012 | $9.34 | 0.05 | 0.83 | 0.88 | (0.02) | $10.20 | 9.44% | 1.30% | 0.62% | 154% | $48,794 | ||
| 2011 | $9.99 | 0.03 | (0.68) | (0.65) | — | $9.34 | (6.41)% | 1.22% | 0.34% | 167% | $97,063 | ||
| A Class | |||||||||||||
| 2015 | $12.03 | (0.03) | 0.56 | 0.53 | — | $12.56 | 4.32% | 1.92% | (0.25)% | 171% | $6,596 | ||
| 2014 | $12.36 | (0.01) | (0.22) | (0.23) | (0.10) | $12.03 | (1.92)% | 1.86% | (0.05)% | 134% | $5,576 | ||
| 2013 | $9.81 | (0.03) | 2.72 | 2.69 | (0.14) | $12.36 | 27.69% | 1.81% | (0.22)% | 157% | $3,585 | ||
| 2012 | $9.00 | 0.01 | 0.80 | 0.81 | — | $9.81 | 8.88% | 1.75% | 0.17% | 154% | $2,838 | ||
| 2011 | $9.67 | (0.02) | (0.65) | (0.67) | — | $9.00 | (6.83)% | 1.67% | (0.11)% | 167% | $3,182 | ||
22
| For a Share Outstanding Throughout the Years Ended November 30 (except as noted) | |||||||||||||
| Per-Share Data | Ratios and Supplemental Data | ||||||||||||
| Income From Investment Operations: | Ratio to Average Net Assets of: | ||||||||||||
Net Asset Value, Beginning of Period | Net Investment Income (Loss)(1) | Net Realized and Unrealized Gain (Loss) | Total From Investment Operations | Distributions From Net Investment Income | Net Asset Value, End of Period | Total Return(2) | Operating Expenses | Net Investment Income (Loss) | Portfolio Turnover Rate | Net Assets, End of Period (in thousands) | |||
| C Class | |||||||||||||
| 2015 | $12.01 | (0.12) | 0.56 | 0.44 | — | $12.45 | 3.58% | 2.67% | (1.00)% | 171% | $720 | ||
| 2014 | $12.39 | (0.10) | (0.23) | (0.33) | (0.05) | $12.01 | (2.74)% | 2.61% | (0.80)% | 134% | $456 | ||
| 2013 | $9.83 | (0.14) | 2.76 | 2.62 | (0.06) | $12.39 | 26.75% | 2.56% | (0.97)% | 157% | $342 | ||
| 2012 | $9.08 | (0.05) | 0.80 | 0.75 | — | $9.83 | 8.14% | 2.50% | (0.58)% | 154% | $93 | ||
| 2011 | $9.82 | (0.07) | (0.67) | (0.74) | — | $9.08 | (7.43)% | 2.42% | (0.86)% | 167% | $87 | ||
| R Class | |||||||||||||
| 2015 | $12.22 | (0.08) | 0.59 | 0.51 | — | $12.73 | 4.09% | 2.17% | (0.50)% | 171% | $179 | ||
| 2014 | $12.55 | (0.05) | (0.22) | (0.27) | (0.06) | $12.22 | (2.19)% | 2.11% | (0.30)% | 134% | $374 | ||
| 2013 | $9.96 | (0.06) | 2.76 | 2.70 | (0.11) | $12.55 | 27.35% | 2.06% | (0.47)% | 157% | $388 | ||
| 2012 | $9.15 | —(3) | 0.81 | 0.81 | — | $9.96 | 8.73% | 2.00% | (0.08)% | 154% | $290 | ||
| 2011 | $9.86 | (0.04) | (0.67) | (0.71) | — | $9.15 | (7.10)% | 1.92% | (0.36)% | 167% | $27 | ||
| Notes to Financial Highlights |
| (1) | Computed using average shares outstanding throughout the period. |
| (2) | Total returns are calculated based on the net asset value of the last business day and do not reflect applicable sales charges, if any. Total returns for periods less than one year are not annualized. |
| (3) | Per-share amount was less than $0.005. |
| (4) | Ratio was less than 0.005%. |
See Notes to Financial Statements.
23
| Report of Independent Registered Public Accounting Firm |
To the Board of Directors and Shareholders of American Century World Mutual Funds, Inc.:
We have audited the accompanying statement of assets and liabilities, including the schedule of investments, of International Discovery Fund (the “Fund”), one of the funds constituting American Century World Mutual Funds, Inc., as of November 30, 2015, and the related statement of operations for the year then ended, the statements of changes in net assets for each of the two years in the period then ended, and the financial highlights for each of the periods presented. These financial statements and financial highlights are the responsibility of the Fund’s management. Our responsibility is to express an opinion on these financial statements and financial highlights based on our audits.
We conducted our audits in accordance with the standards of the Public Company Accounting Oversight Board (United States). Those standards require that we plan and perform the audit to obtain reasonable assurance about whether the financial statements and financial highlights are free of material misstatement. The Fund is not required to have, nor were we engaged to perform, an audit of its internal control over financial reporting. Our audits included consideration of internal control over financial reporting as a basis for designing audit procedures that are appropriate in the circumstances, but not for the purpose of expressing an opinion on the effectiveness of the Fund’s internal control over financial reporting. Accordingly, we express no such opinion. An audit also includes examining, on a test basis, evidence supporting the amounts and disclosures in the financial statements, assessing the accounting principles used and significant estimates made by management, as well as evaluating the overall financial statement presentation. Our procedures included confirmation of securities owned as of November 30, 2015, by correspondence with the custodian and brokers; when replies were not received from brokers, we performed other auditing procedures. We believe that our audits provide a reasonable basis for our opinion.
In our opinion, the financial statements and financial highlights referred to above present fairly, in all material respects, the financial position of International Discovery Fund of American Century World Mutual Funds, Inc. as of November 30, 2015, the results of its operations for the year then ended, the changes in its net assets for each of the two years in the period then ended, and the financial highlights for each of the periods presented, in conformity with accounting principles generally accepted in the United States of America.
DELOITTE & TOUCHE LLP
Kansas City, Missouri
January 19, 2016
24
| Management |
The Board of Directors
The individuals listed below serve as directors of the funds. Each director will continue to serve in this capacity until death, retirement, resignation or removal from office. The board has adopted a mandatory retirement age for directors who are not “interested persons,” as that term is defined in the Investment Company Act (independent directors). Independent directors shall retire by December 31 of the year in which they reach their 75th birthday.
Mr. Thomas is an “interested person” because he currently serves as President and Chief Executive Officer of American Century Companies, Inc. (ACC), the parent company of American Century Investment Management, Inc. (ACIM or the advisor). Mr. Fink is treated as an “interested person” because of his recent employment with ACC and American Century Services, LLC (ACS). The other directors (more than three-fourths of the total number) are independent. They are not employees, directors or officers of, and have no financial interest in, ACC or any of its wholly owned, direct or indirect, subsidiaries, including ACIM, American Century Investment Services, Inc. (ACIS) and ACS, and they do not have any other affiliations, positions or relationships that would cause them to be considered “interested persons” under the Investment Company Act. The directors serve in this capacity for seven (in the case of Mr. Thomas, 15) registered investment companies in the American Century Investments family of funds.
The following table presents additional information about the directors. The mailing address for each director is 4500 Main Street, Kansas City, Missouri 64111.
Name (Year of Birth) | Position(s) Held with Funds | Length of Time Served | Principal Occupation(s) During Past 5 Years | Number of American Century Portfolios Overseen by Director | Other Directorships Held During Past 5 Years |
| Independent Directors | |||||
Thomas A. Brown(1) (1940) | Director | Since 1980 | Managing Member, Associated Investments, LLC (real estate investment company) | 80 | None |
| Andrea C. Hall (1945) | Director | Since 1997 | Retired | 80 | None |
| Jan M. Lewis (1957) | Director | Since 2011 | Retired; President and Chief Executive Officer, Catholic Charities of Northeast Kansas (human services organization) (2006 to 2013) | 80 | None |
| James A. Olson (1942) | Director and Chairman of the Board | Since 2007 (Chairman since 2014) | Member, Plaza Belmont LLC (private equity fund manager) | 80 | Saia, Inc. (2002 to 2012) and EPR Properties (2003 to 2013) |
| M. Jeannine Strandjord (1945) | Director | Since 1994 | Retired | 80 | Euronet Worldwide Inc.; MGP Ingredients, Inc.; Charming Shoppes, Inc. (2006 to 2010); and DST Systems Inc. (1996 to 2012) |
| John R. Whitten (1946) | Director | Since 2008 | Retired | 80 | Rudolph Technologies, Inc. |
25
| Name (Year of Birth) | Position(s) Held with Funds | Length of Time Served | Principal Occupation(s) During Past 5 Years | Number of American Century Portfolios Overseen by Director | Other Directorships Held During Past 5 Years |
| Independent Directors | |||||
| Stephen E. Yates (1948) | Director | Since 2012 | Retired; Executive Vice President, Technology & Operations, KeyCorp. (computer services) (2004 to 2010) | 80 | Applied Industrial Technologies, Inc. (2001 to 2010) |
| Interested Directors | |||||
| Barry Fink (1955) | Director | Since 2012 | Retired; Executive Vice President, ACC (September 2007 to February 2013); President, ACS (October 2007 to February 2013); Chief Operating Officer, ACC (September 2007 to November 2012) | 80 | None |
| Jonathan S. Thomas (1963) | Director and President | Since 2007 | President and Chief Executive Officer, ACC (March 2007 to present). Also serves as Chief Executive Officer, ACS; Executive Vice President, ACIM; Director, ACC, ACIM and other ACC subsidiaries | 125 | BioMed Valley Discoveries, Inc. |
(1) Thomas A. Brown retired as Director of the Board effective December 31, 2015.
The Statement of Additional Information has additional information about the fund's directors and is available without charge, upon request, by calling 1-800-345-2021.
26
Officers
The following table presents certain information about the executive officers of the funds. Each officer serves as an officer for each of the 15 investment companies in the American Century family of funds, unless otherwise noted. No officer is compensated for his or her service as an officer of the funds. The listed officers are interested persons of the funds and are appointed or re-appointed on an annual basis. The mailing address for each officer listed below is 4500 Main Street, Kansas City, Missouri 64111.
Name (Year of Birth) | Offices with the Funds | Principal Occupation(s) During the Past Five Years |
| Jonathan S. Thomas (1963) | Director and President since 2007 | President and Chief Executive Officer, ACC (March 2007 to present). Also serves as Chief Executive Officer, ACS; Executive Vice President, ACIM; Director, ACC, ACIM and other ACC subsidiaries |
| Amy D. Shelton (1964) | Chief Compliance Officer and Vice President since 2014 | Chief Compliance Officer, American Century funds, (March 2014 to present); Chief Compliance Officer, ACIM (February 2014 to present); Chief Compliance Officer, ACIS (October 2009 to present); Vice President, Client Interactions and Marketing, ACIS (February 2013 to January 2014); Director, Client Interactions and Marketing, ACIS (June 2007 to January 2013). Also serves as Vice President, ACIS |
| Charles A. Etherington (1957) | General Counsel since 2007 and Senior Vice President since 2006 | Attorney, ACC (February 1994 to present); Vice President, ACC (November 2005 to present); General Counsel, ACC (March 2007 to present). Also serves as General Counsel, ACIM, ACS, ACIS and other ACC subsidiaries; and Senior Vice President, ACIM and ACS |
| C. Jean Wade (1964) | Vice President, Treasurer and Chief Financial Officer since 2012 | Vice President, ACS (February 2000 to present) |
| Robert J. Leach (1966) | Vice President since 2006 and Assistant Treasurer since 2012 | Vice President, ACS (February 2000 to present) |
| David H. Reinmiller (1963) | Vice President since 2000 | Attorney, ACC (January 1994 to present); Associate General Counsel, ACC (January 2001 to present). Also serves as Vice President, ACIM and ACS |
| Ward D. Stauffer (1960) | Secretary since 2005 | Attorney, ACC (June 2003 to present) |
27
| Approval of Management Agreement |
At a meeting held on June 30, 2015, the Fund’s Board of Directors unanimously approved the renewal of the management agreement pursuant to which American Century Investment Management, Inc. (the “Advisor”) acts as the investment advisor for the Fund. Under Section 15(c) of the Investment Company Act, contracts for investment advisory services are required to be reviewed, evaluated, and approved by a majority of a fund’s directors (the “Directors”), including a majority of the independent Directors, each year.
Prior to its consideration of the renewal of the management agreement, the Directors requested and reviewed extensive data and information compiled by the Advisor and certain independent providers of evaluation data concerning the Fund and the services provided to the Fund by the Advisor. This review was in addition to the oversight and evaluation undertaken by the Board and its committees on a continuous basis and the information received was supplemental to the extensive information that the Board and its committees receive and consider throughout the year.
In connection with its consideration of the renewal of the management agreement, the Board’s review and evaluation of the services provided by the Advisor included, but was not limited to, the following:
| • | the nature, extent, and quality of investment management, shareholder services, and other services provided by the Advisor to the Fund; |
| • | the wide range of other programs and services the Advisor provides to the Fund and its shareholders on a routine and non-routine basis; |
| • | the Fund’s investment performance compared to appropriate benchmarks and/or a peer group of other mutual funds with similar investment objectives and strategies; |
| • | the cost of owning the Fund compared to the cost of owning similar funds; |
| • | the compliance policies, procedures, and regulatory experience of the Fund's service providers; |
| • | financial data showing the cost of services provided to the Fund, the profitability of the Fund to the Advisor, and the overall profitability of the Advisor; |
| • | possible economies of scale associated with the Advisor’s management of the Fund and other accounts under its management; |
| • | data comparing services provided and charges to the Advisor's other investment management clients; |
| • | acquired fund fees and expenses; |
| • | payments by the Fund and the Advisor to financial intermediaries; and |
| • | any collateral benefits derived by the Advisor from the management of the Fund. |
In keeping with their practice, the Directors held two in-person meetings and one telephonic meeting to review and discuss the information provided. The independent Directors also had the benefit of the advice of their independent counsel throughout the process.
Factors Considered
The Directors considered all of the information provided by the Advisor, the independent data providers, and independent counsel in connection with the approval. They determined that the information was sufficient for them to evaluate the management agreement for the Fund. In connection with their review, the Directors did not identify any single factor as being all-important or controlling, and each Director may have attributed different levels of importance to different factors. In deciding to renew the management agreement, the Board based its decision on a number of factors, including the following:
28
Nature, Extent and Quality of Services - Generally. Under the management agreement, the Advisor is responsible for providing or arranging for all services necessary for the operation of the
Fund. The Board noted that under the management agreement, the Advisor provides or arranges at its own expense a wide variety of services including:
| • | constructing and designing the Fund |
| • | portfolio research and security selection |
| • | initial capitalization/funding |
| • | securities trading |
| • | Fund administration |
| • | custody of Fund assets |
| • | daily valuation of the Fund’s portfolio |
| • | shareholder servicing and transfer agency, including shareholder confirmations, recordkeeping, and communications |
| • | legal services (except the independent Directors’ counsel) |
| • | regulatory and portfolio compliance |
| • | financial reporting |
| • | marketing and distribution (except Rule 12b-1 plans) |
The Board noted that many of these services have expanded over time both in terms of quantity and complexity in response to shareholder demands, competition in the industry, changing distribution channels, and the changing regulatory environment.
Investment Management Services. The nature of the investment management services provided to the Fund is quite complex and allows Fund shareholders access to professional money management, instant diversification of their investments within an asset class, the opportunity to easily diversify among asset classes by investing in or exchanging among various American Century Investments funds, and liquidity. In evaluating investment performance, the Board expects the Advisor to manage the Fund in accordance with its investment objectives and approved strategies. Further, the Directors recognize that the Advisor has an obligation to monitor trading activities, and in particular to seek the best execution of fund trades, and to evaluate the use of and payment for research. In providing these services, the Advisor utilizes teams of investment professionals (portfolio managers, analysts, research assistants, and securities traders) who require extensive information technology, research, training, compliance and other systems to conduct their business. The Board, directly and through its Fund Performance Review Committee, regularly reviews investment performance information for the Fund, together with comparative information for appropriate benchmarks and/or peer groups of similarly-managed funds, over different time horizons. The Directors also review detailed performance information during the management agreement approval process. If performance concerns are identified, the Fund receives special reviews until performance improves, during which the Board discusses with the Advisor the reasons for such results (e.g., market conditions, security selection) and any efforts being undertaken to improve performance. The Fund’s performance was above its benchmark for the three-, five-, and ten-year periods and below its benchmark for the one-year period reviewed by the Board. The Board found the investment management services provided by the Advisor to the Fund to be satisfactory and consistent with the management agreement.
Shareholder and Other Services. Under the management agreement, the Advisor provides the Fund with a comprehensive package of transfer agency, shareholder, and other services. The Board, directly and through various committees of the Board, regularly reviews reports and evaluations of such services at its regular meetings. These reports include, but are not limited to, information regarding the operational efficiency and accuracy of the shareholder and transfer agency services provided, staffing levels, shareholder satisfaction (as measured by external as well as internal sources), technology support, new products and services offered to Fund shareholders, securities trading activities, portfolio valuation services, auditing services, and legal and operational compliance activities. The Board particularly noted the Advisor’s continual efforts to maintain effective business continuity plans and to address cybersecurity threats. Certain aspects of shareholder and transfer agency service level efficiency and the quality of securities trading
29
activities are measured by independent third party providers and are presented in comparison to other fund groups not managed by the Advisor. The Board found the services provided by the Advisor to the Fund under the management agreement to be competitive and of high quality.
Costs of Services and Profitability. The Advisor provides detailed information concerning its cost of providing various services to the Fund, its profitability in managing the Fund (pre- and post-distribution), its overall profitability, and its financial condition. The Directors have reviewed with the Advisor the methodology used to prepare this financial information. This information is considered in evaluating the Advisor’s financial condition, its ability to continue to provide services under the management agreement, and the reasonableness of the current management fee. The Board concluded that the Advisor’s profits were reasonable in light of the services provided to the Fund.
Ethics. The Board generally considers the Advisor’s commitment to providing quality services to shareholders and to conducting its business ethically. They noted that the Advisor’s practices generally meet or exceed industry best practices.
Economies of Scale. The Board also reviewed information provided by the Advisor regarding the possible existence of economies of scale in connection with the management of the Fund. The Board concluded that economies of scale are difficult to measure and predict with precision, especially on a fund-by-fund basis. The Board concluded that the Advisor is appropriately sharing economies of scale through its competitive fee structure, offering competitive fees from fund inception, and through reinvestment in its business to provide shareholders additional content and services. The Board also noted that economies of scale are shared with the Fund and its shareholders through management fee breakpoints that serve to reduce the effective management fee as the assets of the Fund grow.
Comparison to Other Funds’ Fees. The management agreement provides that the Fund pays the Advisor a single, all-inclusive (or unified) management fee for providing all services necessary for the management and operation of the Fund, other than brokerage expenses, taxes, interest, extraordinary expenses, and the fees and expenses of the Fund’s independent Directors (including their independent legal counsel) and expenses incurred in connection with the provision of shareholder services and distribution services under a plan adopted pursuant to Rule 12b-1 under the 1940 Act. Under the unified fee structure, the Advisor is responsible for providing all investment advisory, custody, audit, administrative, compliance, recordkeeping, marketing and shareholder services, or arranging and supervising third parties to provide such services. By contrast, most other funds are charged a variety of fees, including an investment advisory fee, a transfer agency fee, an administrative fee, distribution charges, and other expenses. Other than their investment advisory fees and any applicable Rule 12b-1 distribution fees, all other components of the total fees charged by these other funds may be increased without shareholder approval. The Board believes the unified fee structure is a benefit to Fund shareholders because it clearly discloses to shareholders the cost of owning Fund shares, and, since the unified fee cannot be increased without a vote of Fund shareholders, it shifts to the Advisor the risk of increased costs of operating the Fund and provides a direct incentive to minimize administrative inefficiencies. Part of the Board’s analysis of fee levels involves reviewing certain evaluative data compiled by an independent provider comparing the Fund’s unified fee to the total expense ratios of its peers. The unified fee charged to shareholders of the Fund was above the median of the total expense ratios of the Fund’s peer expense universe and was within the range of its peer expense group. The Board concluded that the management fee paid by the Fund to the Advisor under the management agreement is reasonable in light of the services provided to the Fund.
30
Comparison to Fees and Services Provided to Other Clients of the Advisor. The Directors also requested and received information from the Advisor concerning the nature of the services, fees, costs and profitability of its advisory services to advisory clients other than the Fund. They observed that these varying types of client accounts require different services and involve different regulatory and entrepreneurial risks than the management of the Fund. The Board analyzed this information and concluded that the fees charged and services provided to the Fund were reasonable by comparison.
Payments to Intermediaries. The Directors also requested and received a description of payments made to intermediaries by the Fund and the Advisor. These payments include various payments made by the Fund or the Advisor to different types of intermediaries and recordkeepers for distribution and service activities provided for the Fund. The Board reviewed such information and found the payments to be reasonable in scope and purpose.
Collateral or “Fall-Out” Benefits Derived by the Advisor. The Board considered the existence of collateral benefits the Advisor may receive as a result of its relationship with the Fund. They concluded that the Advisor’s primary business is managing mutual funds and it generally does not use fund or shareholder information to generate profits in other lines of business, and therefore does not derive any significant collateral benefits from them. The Board noted that additional assets from other clients may offer the Advisor some benefit from increased leverage with service providers and counterparties. Additionally, the Advisor receives proprietary research from broker-dealers that execute fund portfolio transactions, which the Board concluded is likely to benefit other clients of the Advisor as well as Fund shareholders. The Board also determined that the Advisor is able to provide investment management services to certain clients other than the Fund, at least in part, due to its existing infrastructure built to serve the fund complex. The Board concluded that appropriate allocation methodologies had been employed to assign resources and the cost of those resources to these other clients and, where expressly provided, these other client assets may be included with the assets of the Fund to determine breakpoints in the management fee schedule.
Existing Relationship. The Board also considered whether there was any reason for not continuing the existing arrangement with the Advisor. In this regard, the Board was mindful of the potential disruptions of the Fund’s operations and various risks, uncertainties, and other effects that could occur as a result of a decision not to continue such relationship. In particular, the Board recognized that most shareholders have invested in the Fund on the strength of the Advisor’s industry standing and reputation and in the expectation that the Advisor will have a continuing role in providing advisory services to the Fund.
Conclusion of the Directors. As a result of this process, the Board, including all of the independent Directors, taking into account all of the factors discussed above and the information provided by the Advisor and others in connection with its review and throughout the year, determined that the management fee is fair and reasonable in light of the services provided and that the investment management agreement between the Fund and the Advisor should be renewed.
31
| Additional Information |
Retirement Account Information
As required by law, distributions you receive from certain IRAs are subject to federal income tax withholding, unless you elect not to have withholding apply. Tax will be withheld on the total amount withdrawn even though you may be receiving amounts that are not subject to withholding, such as nondeductible contributions. In such case, excess amounts of withholding could occur. You may adjust your withholding election so that a greater or lesser amount will be withheld.
If you don’t want us to withhold on this amount, you must notify us to not withhold the federal income tax. You may notify us in writing or in certain situations by telephone or through other electronic means. For systematic withdrawals, your withholding election will remain in effect until revoked or changed by filing a new election. You have the right to revoke your election at any time.
Remember, even if you elect not to have income tax withheld, you are liable for paying income tax on the taxable portion of your withdrawal. If you elect not to have income tax withheld or you don’t have enough income tax withheld, you may be responsible for payment of estimated tax. You may incur penalties under the estimated tax rules if your withholding and estimated tax payments are not sufficient. You can reduce or defer the income tax on a distribution by directly or indirectly rolling such distribution over to another IRA or eligible plan. You should consult your tax advisor for additional information.
State tax will be withheld if, at the time of your distribution, your address is within one of the mandatory withholding states and you have federal income tax withheld (or as otherwise required by state law). State taxes will be withheld from your distribution in accordance with the respective state rules.
Distributions you receive from 403(b), 457 and qualified plans are subject to special tax and withholding rules. Your plan administrator or plan sponsor is required to provide you with a special tax notice explaining those rules at the time you request a distribution. If applicable, federal and/or state taxes may be withheld from your distribution amount.
Proxy Voting Policies
A description of the policies that the fund's investment advisor uses in exercising the voting rights associated with the securities purchased and/or held by the fund is available without charge, upon request, by calling 1-800-345-2021. It is also available on the "About Us" page of American Century Investments’ website at americancentury.com and on the Securities and Exchange Commission’s website at sec.gov. Information regarding how the investment advisor voted proxies relating to portfolio securities during the most recent 12-month period ended June 30 is available on the "About Us" page at americancentury.com. It is also available at sec.gov.
Quarterly Portfolio Disclosure
The fund files its complete schedule of portfolio holdings with the Securities and Exchange Commission (SEC) for the first and third quarters of each fiscal year on Form N-Q. The fund’s Forms N-Q are available on the SEC’s website at sec.gov, and may be reviewed and copied at the SEC’s Public Reference Room in Washington, DC. Information on the operation of the Public Reference Room may be obtained by calling 1-800-SEC-0330. The fund also makes its complete schedule of portfolio holdings for the most recent quarter of its fiscal year available on its
website at americancentury.com and, upon request, by calling 1-800-345-2021.
32
Other Tax Information
The following information is provided pursuant to provisions of the Internal Revenue Code.
The fund hereby designates up to the maximum amount allowable as qualified dividend income for the fiscal year ended November 30, 2015.
For the fiscal year ended November 30, 2015, the fund intends to pass through to shareholders foreign source income of $9,919,611 and foreign taxes paid of $541,060, or up to the maximum amount allowable, as a foreign tax credit. Foreign source income and foreign tax expense per outstanding share on November 30, 2015 are $0.2384 and $0.0130, respectively.
33
| Notes |
34
| Notes |
35
| ||
| Contact Us | americancentury.com | |
| Automated Information Line | 1-800-345-8765 | |
| Investor Services Representative | 1-800-345-2021 or 816-531-5575 | |
| Investors Using Advisors | 1-800-378-9878 | |
| Business, Not-For-Profit, Employer-Sponsored Retirement Plans | 1-800-345-3533 | |
| Banks and Trust Companies, Broker-Dealers, Financial Professionals, Insurance Companies | 1-800-345-6488 | |
| Telecommunications Relay Service for the Deaf | 711 | |
| American Century World Mutual Funds, Inc. | ||
Investment Advisor: American Century Investment Management, Inc. Kansas City, Missouri | ||
| This report and the statements it contains are submitted for the general information of our shareholders. The report is not authorized for distribution to prospective investors unless preceded or accompanied by an effective prospectus. | ||
| ©2016 American Century Proprietary Holdings, Inc. All rights reserved. CL-ANN-87754 1601 | ||
| ANNUAL REPORT | NOVEMBER 30, 2015 |
International Growth Fund
| Table of Contents |
| President’s Letter | 2 | |
| Performance | 3 | |
| Portfolio Commentary | ||
| Fund Characteristics | ||
| Shareholder Fee Example | ||
| Schedule of Investments | ||
| Statement of Assets and Liabilities | ||
| Statement of Operations | ||
| Statement of Changes in Net Assets | ||
| Notes to Financial Statements | ||
| Financial Highlights | ||
| Report of Independent Registered Public Accounting Firm | ||
| Management | ||
| Approval of Management Agreement | ||
| Additional Information | ||
Any opinions expressed in this report reflect those of the author as of the date of the report, and do not necessarily represent the opinions of American Century Investments® or any other person in the American Century Investments organization. Any such opinions are subject to change at any time based upon market or other conditions and American Century Investments disclaims any responsibility to update such opinions. These opinions may not be relied upon as investment advice and, because investment decisions made by American Century Investments funds are based on numerous factors, may not be relied upon as an indication of trading intent on behalf of any American Century Investments fund. Security examples are used for representational purposes only and are not intended as recommendations to purchase or sell securities. Performance information for comparative indices and securities is provided to American Century Investments by third party vendors. To the best of American Century Investments’ knowledge, such information is accurate at the time of printing.
| President’s Letter |
| Dear Investor: Thank you for reviewing this annual report for the 12 months ended November 30, 2015. It provides investment performance and portfolio information for the reporting period, plus longer-term historical performance data. Annual reports remain important vehicles for conveying information about fund performance, including market and economic factors that affected returns during the reporting period. For additional, updated investment and market insights, we encourage you to visit our website, americancentury.com. |
| Jonathan Thomas | |
Divergence in Economic Growth and Monetary Policies, Combined With China Turmoil, Triggered Market Volatility
Divergence between the U.S. and the rest of the world—along with China’s struggles, plunging commodity prices, capital market volatility, and risk-off trading—were dominant themes during the reporting period. Global divergence described not only the relatively stronger economic growth enjoyed by the U.S. compared with most of the world, but also the related contrast between the U.S. Federal Reserve’s (the Fed’s) unwinding of monetary stimulus versus the continuation and expansion of stimulus by other major central banks.
In 2014, the Fed ended its latest massive bond-buying program (quantitative easing, QE), leading to expectations that interest rates would soar in 2015. But while QE was halted in the U.S., other major central banks were starting or increasing QE as their economies faltered, particularly the European Central Bank, the Bank of Japan, and the People’s Bank of China. This monetary policy divergence helped fuel increased demand for the U.S. dollar and U.S. dollar-denominated assets, and put downward pressure on commodity prices, most notably crude oil, which declined approximately 40% for the reporting period. Low inflation also prevailed after oil prices plunged amid a supply glut and muted demand for commodities in general, especially as China’s economy slowed. In this environment, the U.S. dollar, U.S. growth stocks, and U.S. municipal bonds generally benefited from “flight to quality” capital flows, while emerging market and commodity-related investments suffered significant declines.
We expect continued economic and monetary policy divergence between the U.S. and non-U.S. economies in 2016, accompanied by further market volatility. This could present both challenges and opportunities for active investment managers. In this environment, we continue to believe in a disciplined, diversified, long-term investment approach, using professionally managed stock and bond portfolios to meet financial goals. We appreciate your continued trust in us in the coming year.
Sincerely,
Jonathan Thomas
President and Chief Executive Officer
American Century Investments
2
| Performance |
| Total Returns as of November 30, 2015 | ||||||
Average Annual Returns | ||||||
Ticker Symbol | 1 year | 5 years | 10 years | Since Inception | Inception Date | |
| Investor Class | TWIEX | -1.86% | 6.62% | 5.10% | 7.60% | 5/9/91 |
| MSCI EAFE Index | — | -2.94% | 5.51% | 3.64% | 5.20%(1) | — |
| MSCI EAFE Growth Index | — | 1.25% | 6.36% | 4.64% | 4.22%(1) | — |
| Institutional Class | TGRIX | -1.63% | 6.85% | 5.31% | 5.64% | 11/20/97 |
A Class(2) | TWGAX | 10/2/96 | ||||
| No sales charge* | -2.13% | 6.36% | 4.83% | 5.98% | ||
| With sales charge* | -7.74% | 5.10% | 4.22% | 5.65% | ||
| C Class | AIWCX | -2.81% | 5.56% | 4.05% | 3.12% | 6/4/01 |
| R Class | ATGRX | -2.31% | 6.09% | 4.58% | 6.60% | 8/29/03 |
| R6 Class | ATGDX | -1.50% | — | — | 3.71% | 7/26/13 |
* Sales charges include initial sales charges and contingent deferred sales charges (CDSCs), as applicable. A Class shares have a 5.75% maximum initial sales charge and may be subject to a maximum CDSC of 1.00%. C Class shares redeemed within 12 months of purchase are subject to a maximum CDSC of 1.00%. The SEC requires that mutual funds provide performance information net of maximum sales charges in all cases where charges could be applied.
| (1) | Since April 30, 1991, the date nearest the Investor Class’s inception for which data are available. |
| (2) | Prior to December 3, 2007, the A Class was referred to as the Advisor Class and did not have a front-end sales charge. Performance prior to that date has been adjusted to reflect this charge. |
Data presented reflect past performance. Past performance is no guarantee of future results. Current performance may be higher or lower than the performance shown. Investment return and principal value will fluctuate, and redemption value may be more or less than original cost. Data assumes reinvestment of dividends and capital gains, and none of the charts reflect the deduction of taxes that a shareholder would pay on fund distributions or the redemption of fund shares. To obtain performance data current to the most recent month end, please call 1-800-345-2021 or visit americancentury.com. For additional information about the fund, please consult the prospectus.
3
| Growth of $10,000 Over 10 Years |
| $10,000 investment made November 30, 2005 |
| Performance for other share classes will vary due to differences in fee structure. |
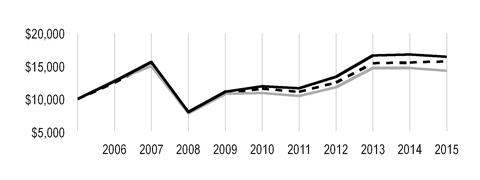
| Value on November 30, 2015 | |
| Investor Class — $16,455 | |
| MSCI EAFE Index — $14,299 | |
MSCI EAFE Growth Index — $15,750 | |
Total Annual Fund Operating Expenses | |||||
| Investor Class | Institutional Class | A Class | C Class | R Class | R6 Class |
| 1.18% | 0.98% | 1.43% | 2.18% | 1.68% | 0.83% |
The total annual fund operating expenses shown is as stated in the fund’s prospectus current as of the date of this report. The prospectus may vary from the expense ratio shown elsewhere in this report because it is based on a different time period, includes acquired fund fees and expenses, and, if applicable, does not include fee waivers or expense reimbursements.
Data presented reflect past performance. Past performance is no guarantee of future results. Current performance may be higher or lower than the performance shown. Investment return and principal value will fluctuate, and redemption value may be more or less than original cost. Data assumes reinvestment of dividends and capital gains, and none of the charts reflect the deduction of taxes that a shareholder would pay on fund distributions or the redemption of fund shares. To obtain performance data current to the most recent month end, please call 1-800-345-2021 or visit americancentury.com. For additional information about the fund, please consult the prospectus.
4
| Portfolio Commentary |
Portfolio Manager: Raj Gandhi and James Gendelman
In February 2015, portfolio manager James Gendelman joined International Growth’s management team.
Performance Summary
International Growth declined -1.86%* for the 12 months ended November 30, 2015. The portfolio’s benchmark, the MSCI EAFE Index, declined -2.94% for the same period.
Non-U.S. developed market stocks declined during the 12-month period, largely due to the ongoing relative strength of the U.S. dollar, which reduced returns for U.S.-based investors. In local currency terms, non-U.S. developed market stocks generally advanced for the period. Global divergence of economic growth and central bank policy remained a prominent theme. As the U.S. continued to set itself apart from the rest of the developed world, with better relative economic growth and fewer central bank stimulus efforts in play, the U.S. dollar gained strength versus other currencies, where central bank stimulus plans remained in full force.
Meanwhile, stocks generated choppy performance. Early on, non-U.S. developed market stocks rallied and outpaced U.S. stocks as investors largely overlooked sluggish growth data, geopolitical concerns, and continued weakness among commodity prices to focus instead on supportive central bank policies from the European Central Bank (ECB) and Bank of Japan. In addition, lower oil prices and a weaker euro remained positive factors for Europe’s economic recovery. But those positive influences faded in late July, when Greece defaulted on its debt payment to the International Monetary Fund, sparking a sharp sell-off among global stocks. The sell-off intensified in the third quarter of 2015, as evidence emerged that China’s economy was cooling more than previously believed. In addition, oil and commodities prices dropped to new lows, due in part to falling demand from China. Anxiety about U.S. interest rate policy also remained a key theme, persisting even after the Fed decided in September 2015 to leave rates unchanged due to concerns about the state of the global economy. Stocks rallied again in October, after the ECB pledged to take additional steps to support the region’s economic recovery and China’s central bank cut interest rates for the sixth time in 12 months, but tumbled to close out the period in November.
Overall, the fund outperformed its benchmark primarily due to positioning in the consumer discretionary, energy, and information technology sectors. Regionally, stock selection in the U.K., Australia, and Spain, along with underweight positions relative to the benchmark in Australia and Spain, also contributed to the fund’s outperformance.
Drug Company was a Top Contributor
Among individual contributors to performance, an overweight position in Ono Pharmaceutical was a main contributor. The Japan-based pharmaceutical company posted strong results based on its cancer-fighting antibody treatment developed jointly with Bristol-Myers Squibb.
| * | All fund returns referenced in this commentary are for Investor Class shares. Performance for other share classes will vary due to differences in fee structure; when Investor Class performance exceeds that of the fund's benchmark, other share classes may not. See page 3 for returns for all share classes. |
5
In the outperforming information technology sector, an overweight position in Murata Manufacturing, a Japan-based manufacturer of electronic components for smart phone manufacturers, was a leading contributor to fund performance. The company’s stock performed well after Murata reported better-than-expected results early in the quarter, driven by strength in the smart phone market. The company also raised guidance based on strength in the radio frequency module business driven by expanded end-market use and market share gains. The improved guidance led to upward earnings revisions.
Within the outperforming consumer discretionary sector, an overweight position in Denmark-based Pandora drove the fund’s performance and was among the fund’s top overall performers. The jewelry and charm maker and retailer advanced on continued strong earnings growth and weak gold and silver prices. In addition, the company benefited from the timely release of new collections and the expansion of its retail network and online offerings.
Industrials Sector was Main Laggard
Stock selection in the industrials, consumer staples, and health care sectors detracted from relative performance. Regionally, stock selection in Switzerland and portfolio-only positions in India and Mexico weighed on relative results.
A portfolio-only position in Cemex, a Mexico-based building materials provider, was a main detractor. Volatility in currency exchange rates put pressure on the company’s stock price. The weakening peso weighed on earnings as the company has a large amount of U.S. dollar-denominated debt. We exited the position.
An overweight position in Bankia, a Spain-based commercial bank, was also a main detractor. The stock struggled early in the period due to weakness in European banks and concerns that continued quantitative easing (QE) would put pressure on banks’ net interest margins. Ultimately, Bankia’s net interest income declined and we became increasingly concerned about capital levels. We exited the position.
A portfolio-only position in ICICI Bank, an India-based bank, also detracted from relative performance. The stock suffered early in the period due to weaker-than-expected first-quarter 2015 results driven by sluggish loan growth and an increase in non-performing loans. The stock experienced additional losses in the third quarter of 2015 after reporting some deterioration in the quality of its loan portfolio. We exited the position.
Outlook
We will continue to focus on companies we believe demonstrate accelerating, sustainable earnings growth. As global growth has slowed and growth has become scarce, we have migrated the portfolio toward companies whose earnings are driven by structural or secular trends. In Europe, unemployment levels are lower, and expansion in money supply and credit growth suggest ECB policies are gaining traction. We expect weak oil prices and any additional QE from the ECB to support Europe’s recovery at the macroeconomic and company levels, but growth may remain modest. We also believe a weaker euro should continue to act as a tailwind, helping European manufacturers and exporters by making their goods more competitive in foreign markets. Similarly, QE has weakened the yen, and Japan-based manufacturers and exporters have benefited, but we expect this benefit to lessen in the future. We have begun to see improvements in the domestic economy, specifically in the consumer industries. We continue to have low exposure to emerging markets, as we believe those areas remain plagued by slowing growth and weakening currencies and commodity prices. We are searching for signs of bottoming in earnings trends.
6
| Fund Characteristics |
| NOVEMBER 30, 2015 | |
Top Ten Holdings | % of net assets |
| Roche Holding AG | 3.6% |
| Novartis AG | 2.7% |
| Nestle SA | 2.5% |
| Reckitt Benckiser Group plc | 2.4% |
| Pandora A/S | 2.3% |
| Intesa Sanpaolo SpA | 2.3% |
| AIA Group Ltd. | 2.0% |
| Bayer AG | 1.7% |
| Total SA | 1.7% |
| Murata Manufacturing Co. Ltd. | 1.6% |
Types of Investments in Portfolio | % of net assets |
| Common Stocks | 98.7% |
| Rights | —* |
| Total Equity Exposure | 98.7% |
| Temporary Cash Investments | 1.2% |
| Other Assets and Liabilities | 0.1% |
| *Category is less than 0.05% of total net assets. | |
Investments by Country | % of net assets |
| United Kingdom | 23.7% |
| Japan | 18.0% |
| France | 10.4% |
| Switzerland | 9.6% |
| Germany | 8.1% |
| Belgium | 3.7% |
| Ireland | 3.5% |
| Italy | 2.5% |
| Denmark | 2.3% |
| Netherlands | 2.3% |
| Sweden | 2.2% |
| Hong Kong | 2.1% |
| Spain | 2.0% |
| China | 2.0% |
| Other Countries | 6.3% |
| Cash and Equivalents** | 1.3% |
**Includes temporary cash investments and other assets and liabilities.
7
| Shareholder Fee Example |
Fund shareholders may incur two types of costs: (1) transaction costs, including sales charges (loads) on purchase payments and redemption/exchange fees; and (2) ongoing costs, including management fees; distribution and service (12b-1) fees; and other fund expenses. This example is intended to help you understand your ongoing costs (in dollars) of investing in your fund and to compare these costs with the ongoing cost of investing in other mutual funds.
The example is based on an investment of $1,000 made at the beginning of the period and held for the entire period from June 1, 2015 to November 30, 2015.
Actual Expenses
The table provides information about actual account values and actual expenses for each class. You may use the information, together with the amount you invested, to estimate the expenses that you paid over the period. First, identify the share class you own. Then simply divide your account value by $1,000 (for example, an $8,600 account value divided by $1,000 = 8.6), then multiply the result by the number under the heading “Expenses Paid During Period” to estimate the expenses you paid on your account during this period.
If you hold Investor Class shares of any American Century Investments fund, or Institutional Class shares of the American Century Diversified Bond Fund, in an American Century Investments account (i.e., not a financial intermediary or retirement plan account), American Century Investments may charge you a $12.50 semiannual account maintenance fee if the value of those shares is less than $10,000. We will redeem shares automatically in one of your accounts to pay the $12.50 fee. In determining your total eligible investment amount, we will include your investments in all personal accounts (including American Century Investments Brokerage accounts) registered under your Social Security number. Personal accounts include individual accounts, joint accounts, UGMA/UTMA accounts, personal trusts, Coverdell Education Savings Accounts and IRAs (including traditional, Roth, Rollover, SEP-, SARSEP- and SIMPLE-IRAs), and certain other retirement accounts. If you have only business, business retirement, employer-sponsored or American Century Investments Brokerage accounts, you are currently not subject to this fee. If you are subject to the Account Maintenance Fee, your account value could be reduced by the fee amount.
Hypothetical Example for Comparison Purposes
The table also provides information about hypothetical account values and hypothetical expenses based on the actual expense ratio of each class of your fund and an assumed rate of return of 5% per year before expenses, which is not the actual return of a fund’s share class. The hypothetical account values and expenses may not be used to estimate the actual ending account balance or expenses you paid for the period. You may use this information to compare the ongoing costs of investing in your fund and other funds. To do so, compare this 5% hypothetical example with the 5% hypothetical examples that appear in the shareholder reports of the other funds.
Please note that the expenses shown in the table are meant to highlight your ongoing costs only and do not reflect any transactional costs, such as sales charges (loads) or redemption/exchange fees. Therefore, the table is useful in comparing ongoing costs only, and will not help you determine the relative total costs of owning different funds. In addition, if these transactional costs were included, your costs would have been higher.
8
| Beginning Account Value 6/1/15 | Ending Account Value 11/30/15 | Expenses Paid During Period(1)6/1/15 - 11/30/15 | Annualized Expense Ratio(1) | |
Actual | ||||
| Investor Class | $1,000 | $938.00 | $5.73 | 1.18% |
| Institutional Class | $1,000 | $939.10 | $4.76 | 0.98% |
| A Class | $1,000 | $936.20 | $6.94 | 1.43% |
| C Class | $1,000 | $933.30 | $10.57 | 2.18% |
| R Class | $1,000 | $935.30 | $8.15 | 1.68% |
| R6 Class | $1,000 | $939.90 | $4.04 | 0.83% |
Hypothetical | ||||
| Investor Class | $1,000 | $1,019.15 | $5.97 | 1.18% |
| Institutional Class | $1,000 | $1,020.16 | $4.96 | 0.98% |
| A Class | $1,000 | $1,017.90 | $7.23 | 1.43% |
| C Class | $1,000 | $1,014.14 | $11.01 | 2.18% |
| R Class | $1,000 | $1,016.65 | $8.49 | 1.68% |
| R6 Class | $1,000 | $1,020.91 | $4.20 | 0.83% |
| (1) | Expenses are equal to the class's annualized expense ratio listed in the table above, multiplied by the average account value over the period, multiplied by 183, the number of days in the most recent fiscal half-year, divided by 365, to reflect the one-half year period. |
9
| Schedule of Investments |
NOVEMBER 30, 2015
| Shares | Value | |||
| COMMON STOCKS — 98.7% | ||||
| Australia — 0.8% | ||||
| Qantas Airways Ltd. | 5,009,302 | $ | 13,186,730 | |
| Austria — 1.0% | ||||
Erste Group Bank AG(1) | 559,780 | 17,175,284 | ||
| Belgium — 3.7% | ||||
| Anheuser-Busch InBev NV | 162,462 | 20,932,617 | ||
| KBC Groep NV | 430,210 | 25,681,411 | ||
| UCB SA | 192,590 | 17,198,207 | ||
| 63,812,235 | ||||
| Canada — 1.0% | ||||
| Alimentation Couche-Tard, Inc., B Shares | 374,620 | 17,078,038 | ||
| China — 2.0% | ||||
Baidu, Inc. ADR(1) | 62,378 | 13,596,533 | ||
| Tencent Holdings Ltd. | 1,024,200 | 20,382,418 | ||
| 33,978,951 | ||||
| Denmark — 2.3% | ||||
| Pandora A/S | 337,572 | 40,014,978 | ||
| France — 10.4% | ||||
| Accor SA | 317,560 | 13,400,586 | ||
| Arkema SA | 98,950 | 7,128,964 | ||
| Carrefour SA | 535,427 | 16,507,279 | ||
Criteo SA ADR(1) | 213,480 | 8,701,445 | ||
| Essilor International SA | 137,455 | 17,942,924 | ||
| Iliad SA | 29,870 | 6,662,134 | ||
| Ingenico Group SA | 58,070 | 7,310,310 | ||
| Legrand SA | 284,130 | 16,714,995 | ||
| LVMH Moet Hennessy Louis Vuitton SE | 104,950 | 17,602,977 | ||
| Pernod-Ricard SA | 123,490 | 14,051,977 | ||
Peugeot SA(1) | 294,960 | 5,269,831 | ||
| Total SA | 587,397 | 29,168,864 | ||
| Valeo SA | 104,348 | 16,156,969 | ||
| 176,619,255 | ||||
| Germany — 8.1% | ||||
| adidas AG | 119,560 | 11,569,748 | ||
| Bayer AG | 220,345 | 29,403,328 | ||
| Continental AG | 52,611 | 12,712,549 | ||
| Fresenius Medical Care AG & Co. KGaA | 308,200 | 25,464,158 | ||
| Symrise AG | 231,160 | 15,645,504 | ||
| Wirecard AG | 354,162 | 17,349,308 | ||
Zalando SE(1) | 777,452 | 26,367,476 | ||
| 138,512,071 | ||||
10
| Shares | Value | |||
| Hong Kong — 2.1% | ||||
| AIA Group Ltd. | 5,589,200 | $ | 33,376,105 | |
| Sands China Ltd. | 952,800 | 3,219,645 | ||
| 36,595,750 | ||||
| Indonesia — 0.3% | ||||
| PT Bank Mandiri (Persero) Tbk | 8,046,700 | 4,943,762 | ||
| Ireland — 3.5% | ||||
Bank of Ireland(1) | 49,410,422 | 18,428,212 | ||
| CRH plc | 345,460 | 10,165,129 | ||
| Ryanair Holdings plc ADR | 229,681 | 17,662,469 | ||
| Smurfit Kappa Group plc | 509,510 | 13,921,024 | ||
| 60,176,834 | ||||
| Israel — 0.5% | ||||
Mobileye NV(1) | 195,060 | 8,504,616 | ||
| Italy — 2.5% | ||||
| Intesa Sanpaolo SpA | 11,442,150 | 39,265,723 | ||
| Luxottica Group SpA | 50,271 | 3,362,104 | ||
| 42,627,827 | ||||
| Japan — 18.0% | ||||
| Calbee, Inc. | 133,500 | 5,520,024 | ||
| Daito Trust Construction Co. Ltd. | 101,200 | 10,514,606 | ||
| Fuji Heavy Industries Ltd. | 570,900 | 23,596,582 | ||
| Isuzu Motors Ltd. | 787,100 | 8,855,674 | ||
| Keyence Corp. | 25,500 | 13,820,959 | ||
| Kubota Corp. | 1,615,000 | 26,940,719 | ||
| Minebea Co. Ltd. | 503,000 | 5,520,333 | ||
| Mizuho Financial Group, Inc. | 6,560,300 | 13,243,173 | ||
| Murata Manufacturing Co. Ltd. | 179,300 | 27,819,902 | ||
| Nidec Corp. | 238,000 | 18,401,982 | ||
| Nintendo Co. Ltd. | 46,000 | 7,064,419 | ||
| Nitori Holdings Co. Ltd. | 210,300 | 17,322,843 | ||
| Olympus Corp. | 235,000 | 9,373,274 | ||
| Ono Pharmaceutical Co. Ltd. | 104,000 | 16,651,828 | ||
| ORIX Corp. | 1,487,600 | 21,468,086 | ||
| Ryohin Keikaku Co. Ltd. | 100,200 | 21,619,106 | ||
| Seven & i Holdings Co. Ltd. | 518,500 | 23,250,366 | ||
| Suzuki Motor Corp. | 674,100 | 20,726,795 | ||
| Unicharm Corp. | 709,900 | 14,970,759 | ||
| 306,681,430 | ||||
| Netherlands — 2.3% | ||||
| Akzo Nobel NV | 212,515 | 15,115,539 | ||
| ING Groep NV CVA | 424,492 | 5,828,217 | ||
NXP Semiconductors NV(1) | 192,400 | 17,981,704 | ||
| 38,925,460 | ||||
| Norway — 1.0% | ||||
| Statoil ASA | 1,147,529 | 17,746,621 | ||
11
| Shares | Value | |||
| Portugal — 1.2% | ||||
| Jeronimo Martins SGPS SA | 1,506,541 | $ | 20,907,445 | |
| South Korea — 0.5% | ||||
| Amorepacific Corp. | 23,590 | 8,219,477 | ||
| Spain — 2.0% | ||||
Cellnex Telecom SAU(1) | 517,000 | 9,392,532 | ||
| Industria de Diseno Textil SA | 699,350 | 25,166,867 | ||
| 34,559,399 | ||||
| Sweden — 2.2% | ||||
| Electrolux AB | 234,357 | 6,878,785 | ||
| Hexagon AB, B Shares | 192,670 | 6,991,682 | ||
Lundin Petroleum AB(1) | 511,030 | 8,173,621 | ||
| Svenska Cellulosa AB, B Shares | 508,252 | 14,661,676 | ||
| 36,705,764 | ||||
| Switzerland — 9.6% | ||||
| Actelion Ltd. | 58,740 | 8,249,920 | ||
| Credit Suisse Group AG | 213,300 | 4,585,893 | ||
| Nestle SA | 573,274 | 42,542,130 | ||
| Novartis AG | 536,538 | 45,865,303 | ||
| Roche Holding AG | 232,174 | 62,170,323 | ||
| 163,413,569 | ||||
| United Kingdom — 23.7% | ||||
| Admiral Group plc | 352,990 | 8,617,850 | ||
| ARM Holdings plc | 1,010,970 | 17,114,258 | ||
| Ashtead Group plc | 1,297,845 | 21,403,779 | ||
| Associated British Foods plc | 268,455 | 14,337,180 | ||
| Aviva plc | 2,107,740 | 16,237,389 | ||
| BAE Systems plc | 1,235,070 | 9,607,611 | ||
| Barclays plc | 4,996,940 | 16,797,778 | ||
| Bunzl plc | 631,290 | 18,255,076 | ||
| Carnival plc | 415,010 | 21,657,848 | ||
| Compass Group plc | 217,840 | 3,786,142 | ||
| Croda International plc | 239,650 | 10,351,662 | ||
| Inmarsat plc | 531,810 | 8,930,687 | ||
International Consolidated Airlines Group SA(1) | 2,147,667 | 18,340,176 | ||
| Johnson Matthey plc | 470,103 | 20,037,012 | ||
Liberty Global plc, Class A(1) | 334,500 | 14,186,145 | ||
| London Stock Exchange Group plc | 447,360 | 17,854,863 | ||
| Prudential plc | 918,170 | 21,289,051 | ||
| Reckitt Benckiser Group plc | 432,966 | 40,625,184 | ||
| Rio Tinto plc | 543,780 | 18,087,317 | ||
| Shire plc | 230,220 | 16,109,266 | ||
| St. James's Place plc | 1,242,631 | 19,014,697 | ||
| Whitbread plc | 149,424 | 10,235,153 | ||
| Wolseley plc | 389,680 | 22,618,996 | ||
Worldpay Group plc(1) | 4,036,306 | 18,176,438 | ||
| 403,671,558 | ||||
TOTAL COMMON STOCKS (Cost $1,468,118,548) | 1,684,057,054 | |||
12
| Shares | Value | |||
RIGHTS† | ||||
Switzerland† | ||||
Credit Suisse Group AG(1) (Cost $—) | 213,300 | $ | 130,611 | |
| TEMPORARY CASH INVESTMENTS — 1.2% | ||||
| Repurchase Agreement, Credit Suisse First Boston, Inc., (collateralized by various U.S. Treasury obligations, 0.625%, 8/31/17, valued at $6,924,733), in a joint trading account at 0.01%, dated 11/30/15, due 12/1/15 (Delivery value $6,790,841) | 6,790,839 | |||
| Repurchase Agreement, Fixed Income Clearing Corp., (collateralized by various U.S. Treasury obligations, 3.00%, 11/15/44, valued at $11,550,544), at 0.01%, dated 11/30/15, due 12/1/15 (Delivery value $11,321,003) | 11,321,000 | |||
| State Street Institutional Liquid Reserves Fund, Premier Class | 2,300,329 | 2,300,329 | ||
TOTAL TEMPORARY CASH INVESTMENTS (Cost $20,412,168) | 20,412,168 | |||
TOTAL INVESTMENT SECURITIES — 99.9% (Cost $1,488,530,716) | 1,704,599,833 | |||
| OTHER ASSETS AND LIABILITIES — 0.1% | 2,383,213 | |||
| TOTAL NET ASSETS — 100.0% | $ | 1,706,983,046 | ||
| MARKET SECTOR DIVERSIFICATION | ||
| (as a % of net assets) | ||
| Consumer Discretionary | 19.0 | % |
| Financials | 17.2 | % |
| Consumer Staples | 14.9 | % |
| Health Care | 14.5 | % |
| Industrials | 11.2 | % |
| Information Technology | 10.8 | % |
| Materials | 6.5 | % |
| Energy | 3.2 | % |
| Telecommunication Services | 1.4 | % |
| Cash and Equivalents* | 1.3 | % |
*Includes temporary cash investments and other assets and liabilities.
| NOTES TO SCHEDULE OF INVESTMENTS | ||
| ADR | - | American Depositary Receipt |
| CVA | - | Certificaten Van Aandelen |
| † | Category is less than 0.05% of total net assets. |
| (1) | Non-income producing. |
See Notes to Financial Statements.
13
| Statement of Assets and Liabilities |
| NOVEMBER 30, 2015 | |||
| Assets | |||
| Investment securities, at value (cost of $1,488,530,716) | $ | 1,704,599,833 | |
| Cash | 362,813 | ||
| Foreign currency holdings, at value (cost of $869,732) | 842,106 | ||
| Receivable for investments sold | 2,789,618 | ||
| Receivable for capital shares sold | 286,235 | ||
| Dividends and interest receivable | 3,741,122 | ||
| Other assets | 407,101 | ||
| 1,713,028,828 | |||
| Liabilities | |||
| Payable for investments purchased | 2,983,743 | ||
| Payable for capital shares redeemed | 1,410,080 | ||
| Accrued management fees | 1,613,043 | ||
| Distribution and service fees payable | 38,916 | ||
| 6,045,782 | |||
| Net Assets | $ | 1,706,983,046 | |
| Net Assets Consist of: | |||
| Capital (par value and paid-in surplus) | $ | 1,422,875,945 | |
| Distributions in excess of net investment income | (6,403,309 | ) | |
| Undistributed net realized gain | 74,771,088 | ||
| Net unrealized appreciation | 215,739,322 | ||
| $ | 1,706,983,046 | ||
| Net Assets | Shares Outstanding | Net Asset Value Per Share | ||||
| Investor Class, $0.01 Par Value | $1,432,784,304 | 116,979,188 | $12.25 | |||
| Institutional Class, $0.01 Par Value | $70,421,931 | 5,777,289 | $12.19 | |||
| A Class, $0.01 Par Value | $141,175,428 | 11,456,168 | $12.32* | |||
| C Class, $0.01 Par Value | $10,401,627 | 863,869 | $12.04 | |||
| R Class, $0.01 Par Value | $3,312,849 | 266,577 | $12.43 | |||
| R6 Class, $0.01 Par Value | $48,886,907 | 4,007,671 | $12.20 | |||
See Notes to Financial Statements.
14
| Statement of Operations |
| YEAR ENDED NOVEMBER 30, 2015 | |||
| Investment Income (Loss) | |||
| Income: | |||
| Dividends (net of foreign taxes withheld of $3,072,900) | $ | 32,608,676 | |
| Interest | 4,868 | ||
| 32,613,544 | |||
| Expenses: | |||
| Management fees | 20,956,682 | ||
| Distribution and service fees: | |||
| A Class | 575,979 | ||
| C Class | 104,962 | ||
| R Class | 13,809 | ||
| Directors' fees and expenses | 64,976 | ||
| Other expenses | 110,451 | ||
| 21,826,859 | |||
| Net investment income (loss) | 10,786,685 | ||
| Realized and Unrealized Gain (Loss) | |||
| Net realized gain (loss) on: | |||
| Investment transactions (net of foreign tax expenses paid (refunded) of $715) | 87,971,439 | ||
| Foreign currency transactions | (614,569 | ) | |
| 87,356,870 | |||
| Change in net unrealized appreciation (depreciation) on: | |||
| Investments (includes (increase) decrease in accrued foreign taxes of $99,015) | (129,802,882 | ) | |
| Translation of assets and liabilities in foreign currencies | 32,119 | ||
| (129,770,763 | ) | ||
| Net realized and unrealized gain (loss) | (42,413,893 | ) | |
| Net Increase (Decrease) in Net Assets Resulting from Operations | $ | (31,627,208 | ) |
See Notes to Financial Statements.
15
| Statement of Changes in Net Assets |
| YEARS ENDED NOVEMBER 30, 2015 AND NOVEMBER 30, 2014 | ||||||
| Increase (Decrease) in Net Assets | November 30, 2015 | November 30, 2014 | ||||
| Operations | ||||||
| Net investment income (loss) | $ | 10,786,685 | $ | 14,612,903 | ||
| Net realized gain (loss) | 87,356,870 | 130,838,637 | ||||
| Change in net unrealized appreciation (depreciation) | (129,770,763 | ) | (133,807,372 | ) | ||
| Net increase (decrease) in net assets resulting from operations | (31,627,208 | ) | 11,644,168 | |||
| Distributions to Shareholders | ||||||
| From net investment income: | ||||||
| Investor Class | (9,233,796 | ) | (21,533,562 | ) | ||
| Institutional Class | (974,176 | ) | (3,156,132 | ) | ||
| A Class | (1,277,492 | ) | (3,096,954 | ) | ||
| C Class | — | (18,143 | ) | |||
| R Class | (5,076 | ) | (18,382 | ) | ||
| R6 Class | (72,931 | ) | (93,071 | ) | ||
| From net realized gains: | ||||||
| Investor Class | (90,129,091 | ) | (30,554,844 | ) | ||
| Institutional Class | (7,644,959 | ) | (3,774,435 | ) | ||
| A Class | (17,916,622 | ) | (5,446,175 | ) | ||
| C Class | (608,755 | ) | (105,404 | ) | ||
| R Class | (127,609 | ) | (45,597 | ) | ||
| R6 Class | (499,554 | ) | (103,783 | ) | ||
| Decrease in net assets from distributions | (128,490,061 | ) | (67,946,482 | ) | ||
| Capital Share Transactions | ||||||
| Net increase (decrease) in net assets from capital share transactions (Note 5) | (115,044,232 | ) | 73,104,964 | |||
| Redemption Fees | ||||||
| Increase in net assets from redemption fees | 63,558 | 145,637 | ||||
| Net increase (decrease) in net assets | (275,097,943 | ) | 16,948,287 | |||
| Net Assets | ||||||
| Beginning of period | 1,982,080,989 | 1,965,132,702 | ||||
| End of period | $ | 1,706,983,046 | $ | 1,982,080,989 | ||
| Distributions in excess of net investment income | $ | (6,403,309 | ) | $ | (4,073,477 | ) |
See Notes to Financial Statements.
16
| Notes to Financial Statements |
NOVEMBER 30, 2015
1. Organization
American Century World Mutual Funds, Inc. (the corporation) is registered under the Investment Company Act of 1940, as amended (the 1940 Act), as an open-end management investment company and is organized as a Maryland corporation. International Growth Fund (the fund) is one fund in a series issued by the corporation. The fund is diversified as defined under the 1940 Act. The fund's investment objective is to seek capital growth.
The fund offers the Investor Class, the Institutional Class, the A Class, the C Class, the R Class and the R6 Class. The A Class may incur an initial sales charge. The A Class and C Class may be subject to a contingent deferred sales charge. The share classes differ principally in their respective sales charges and distribution and shareholder servicing expenses and arrangements. The Institutional Class and R6 Class shareholders do not require the same level of shareholder and administrative services from American Century Investment Management, Inc. (ACIM) (the investment advisor) as shareholders of other classes. In addition, financial intermediaries do not receive any service, distribution or administrative fees for the R6 Class. As a result, the Institutional Class and R6 Class are charged lower unified management fees.
2. Significant Accounting Policies
The following is a summary of significant accounting policies consistently followed by the fund in preparation of its financial statements. The fund is an investment company and follows accounting and reporting guidance in accordance with accounting principles generally accepted in the United States of America. This may require management to make certain estimates and assumptions at the date of the financial statements. Actual results could differ from these estimates. Management evaluated the impact of events or transactions occurring through the date the financial statements were issued that would merit recognition or disclosure.
Investment Valuations — The fund determines the fair value of its investments and computes its net asset value per share at the close of regular trading (usually 4 p.m. Eastern time) on the New York Stock Exchange (NYSE) on each day the NYSE is open. The Board of Directors has adopted valuation policies and procedures to guide the investment advisor in the fund’s investment valuation process and to provide methodologies for the oversight of the fund’s pricing function.
Equity securities that are listed or traded on a domestic securities exchange are valued at the last reported sales price or at the official closing price as provided by the exchange. Equity securities traded on foreign securities exchanges are generally valued at the closing price of such securities on the exchange where primarily traded or at the close of the NYSE, if that is earlier. If no last sales price is reported, or if local convention or regulation so provides, the mean of the latest bid and asked prices may be used. Securities traded over-the-counter are valued at the mean of the latest bid and asked prices, the last sales price, or the official closing price. Equity securities initially expressed in local currencies are translated into U.S. dollars at the mean of the appropriate currency exchange rate at the close of the NYSE as provided by an independent pricing service.
Open-end management investment companies are valued at the reported net asset value per share. Repurchase agreements are valued at cost, which approximates fair value.
If the fund determines that the market price for an investment is not readily available or the valuation methods mentioned above do not reflect an investment’s fair value, such investment is valued as determined in good faith by the Board of Directors or its delegate, in accordance with policies and procedures adopted by the Board of Directors. In its determination of fair value, the fund may review several factors including, but not limited to, market information regarding the specific investment or comparable investments and correlation with other investment types, futures indices or general market indicators. Circumstances that may cause the fund to use these procedures to value an investment include, but are not limited to: an investment has been declared in default or is distressed; trading in a security has been suspended during the trading day or a security is not actively trading on its principal exchange; prices received from a regular pricing source are deemed unreliable; or there is a foreign market holiday and no trading occurred.
17
The fund monitors for significant events occurring after the close of an investment’s primary exchange but before the fund’s net asset value per share is determined. Significant events may include, but are not limited to: corporate announcements and transactions; governmental action and political unrest that could impact a specific investment or an investment sector; or armed conflicts, natural disasters and similar events that could affect investments in a specific country or region. The fund also monitors for significant fluctuations between domestic and foreign markets, as evidenced by the U.S. market or such other indicators that the Board of Directors, or its delegate, deems appropriate. If significant fluctuations in foreign markets are identified, the fund may apply a model-derived factor to the closing price of equity securities traded on foreign securities exchanges. The factor is based on observable market data as provided by an independent pricing service.
Security Transactions — Security transactions are accounted for as of the trade date. Net realized gains and losses are determined on the identified cost basis, which is also used for federal income tax purposes. Certain countries impose taxes on realized gains on the sale of securities registered in their country. The fund records the foreign tax expense, if any, on an accrual basis. The foreign tax expense on realized gains and unrealized appreciation reduces the net realized gain (loss) on investment transactions and net unrealized appreciation (depreciation) on investments, respectively.
Investment Income — Dividend income less foreign taxes withheld, if any, is recorded as of the ex-dividend date. Distributions received on securities that represent a return of capital or long-term capital gain are recorded as a reduction of cost of investments and/or as a realized gain. The fund may estimate the components of distributions received that may be considered nontaxable distributions or long-term capital gain distributions for income tax purposes. Interest income is recorded on the accrual basis and includes accretion of discounts and amortization of premiums.
Foreign Currency Translations — All assets and liabilities initially expressed in foreign currencies are translated into U.S. dollars at prevailing exchange rates at period end. The fund may enter into spot foreign currency exchange contracts to facilitate transactions denominated in a foreign currency. Purchases and sales of investment securities, dividend and interest income, spot foreign currency exchange contracts, and expenses are translated at the rates of exchange prevailing on the respective dates of such transactions. Net realized and unrealized foreign currency exchange gains or losses related to investment securities are a component of net realized gain (loss) on investment transactions and change in net unrealized appreciation (depreciation) on investments, respectively.
Repurchase Agreements — The fund may enter into repurchase agreements with institutions that ACIM has determined are creditworthy pursuant to criteria adopted by the Board of Directors. The fund requires that the collateral, represented by securities, received in a repurchase transaction be transferred to the custodian in a manner sufficient to enable the fund to obtain those securities in the event of a default under the repurchase agreement. ACIM monitors, on a daily basis, the securities transferred to ensure the value, including accrued interest, of the securities under each repurchase agreement is equal to or greater than amounts owed to the fund under each repurchase agreement.
Joint Trading Account — Pursuant to an Exemptive Order issued by the Securities and Exchange Commission, the fund, along with certain other funds in the American Century Investments family of funds, may transfer uninvested cash balances into a joint trading account. These balances are invested in one or more repurchase agreements that are collateralized by U.S. Treasury or Agency obligations.
Income Tax Status — It is the fund’s policy to distribute substantially all net investment income and net realized gains to shareholders and to otherwise qualify as a regulated investment company under provisions of the Internal Revenue Code. Accordingly, no provision has been made for income taxes. The fund files U.S. federal, state, local and non-U.S. tax returns as applicable. The fund's tax returns are subject to examination by the relevant taxing authority until expiration of the applicable statute of limitations, which is generally three years from the date of filing but can be longer in certain jurisdictions. At this time, management believes there are no uncertain tax positions which, based on their technical merit, would not be sustained upon examination and for which it is reasonably possible that the total amounts of unrecognized tax benefits will significantly change in the next twelve months.
Multiple Class — All shares of the fund represent an equal pro rata interest in the net assets of the class to which such shares belong, and have identical voting, dividend, liquidation and other rights and the same terms and conditions, except for class specific expenses and exclusive rights to vote on matters affecting only individual classes. Income, non-class specific expenses, and realized and unrealized capital gains and losses of the fund are allocated to each class of shares based on their relative net assets.
18
Distributions to Shareholders — Distributions from net investment income and net realized gains, if any, are generally declared and paid annually. The fund may make distributions on a more frequent basis to comply with the distribution requirements of the Internal Revenue Code, in all events in a manner consistent with provisions of the 1940 Act. The fund may elect to treat a portion of its payment to a redeeming shareholder, which represents the pro rata share of undistributed net investment income and net realized gains, as a distribution for federal income tax purposes (tax equalization).
Redemption Fees — The fund may impose a 2.00% redemption fee on shares held less than 60 days. The fee may not be applicable to all classes. The redemption fee is retained by the fund and helps cover transaction costs that long-term investors may bear when the fund sells securities to meet investor redemptions.
Indemnifications — Under the corporation’s organizational documents, its officers and directors are indemnified against certain liabilities arising out of the performance of their duties to the fund. In addition, in the normal course of business, the fund enters into contracts that provide general indemnifications. The maximum exposure under these arrangements is unknown as this would involve future claims that may be made against a fund. The risk of material loss from such claims is considered by management to be remote.
3. Fees and Transactions with Related Parties
Certain officers and directors of the corporation are also officers and/or directors of American Century Companies, Inc. (ACC). The corporation’s investment advisor, ACIM, the corporation's distributor, American Century Investment Services, Inc. (ACIS), and the corporation’s transfer agent, American Century Services, LLC, are wholly owned, directly or indirectly, by ACC. Various funds issued by American Century Asset Allocation Portfolios, Inc. and American Century Strategic Asset Allocations, Inc. own, in aggregate, 16% of the shares of the fund.
Management Fees — The corporation has entered into a management agreement with ACIM, under which ACIM provides the fund with investment advisory and management services in exchange for a single, unified management fee (the fee) per class. The agreement provides that all expenses of managing and operating the fund, except distribution and service fees, brokerage expenses, taxes, interest, fees and expenses of the independent directors (including legal counsel fees), and extraordinary expenses, will be paid by ACIM. The fee is computed and accrued daily based on each class’s daily net assets and paid monthly in arrears. The rate of the fee is determined by applying a fee rate calculation formula. This formula takes into account the fund’s assets as well as certain assets, if any, of other clients of the investment advisor outside the American Century Investments family of funds (such as subadvised funds and separate accounts) that have very similar investment teams and investment strategies (strategy assets). The strategy assets of the fund also include the assets of NT International Growth Fund, one fund in a series issued by the corporation. The annual management fee schedule ranges from 1.050% to 1.500% for the Investor Class, A Class, C Class and R Class. The annual management fee schedule ranges from 0.850% to 1.300% for the Institutional Class and 0.700% to 1.150% for the R6 Class. The effective annual management fee for each class for the year ended November 30, 2015 was 1.16% for the Investor Class, A Class, C Class and R Class, 0.96% for the Institutional Class and 0.81% for the R6 Class.
Distribution and Service Fees — The Board of Directors has adopted a separate Master Distribution and Individual Shareholder Services Plan for each of the A Class, C Class and R Class (collectively the plans), pursuant to Rule 12b-1 of the 1940 Act. The plans provide that the A Class will pay ACIS an annual distribution and service fee of 0.25%. The plans provide that the C Class will pay ACIS an annual distribution and service fee of 1.00%, of which 0.25% is paid for individual shareholder services and 0.75% is paid for distribution services. The plans provide that the R Class will pay ACIS an annual distribution and service fee of 0.50%. The fees are computed and accrued daily based on each class’s daily net assets and paid monthly in arrears. The fees are used to pay financial intermediaries for distribution and individual shareholder services. Fees incurred under the plans during the year ended November 30, 2015 are detailed in the Statement of Operations.
Directors' Fees and Expenses — The Board of Directors is responsible for overseeing the investment advisor’s management and operations of the fund. The directors receive detailed information about the fund and its investment advisor regularly throughout the year, and meet at least quarterly with management of the investment advisor to review reports about fund operations. The fund’s officers do not receive compensation from the fund.
19
4. Investment Transactions
Purchases and sales of investment securities, excluding short-term investments, for the year ended November 30, 2015 were $1,120,490,800 and $1,346,351,375, respectively.
5. Capital Share Transactions
Transactions in shares of the fund were as follows:
| Year ended November 30, 2015 | Year ended November 30, 2014 | |||||||||
| Shares | Amount | Shares | Amount | |||||||
| Investor Class/Shares Authorized | 840,000,000 | 550,000,000 | ||||||||
| Sold | 21,692,103 | $ | 276,534,085 | 15,958,940 | $ | 214,636,628 | ||||
| Issued in reinvestment of distributions | 8,081,634 | 96,692,769 | 3,844,330 | 50,247,092 | ||||||
| Redeemed | (26,388,283 | ) | (331,250,886 | ) | (15,010,781 | ) | (201,716,361 | ) | ||
| 3,385,454 | 41,975,968 | 4,792,489 | 63,167,359 | |||||||
| Institutional Class/Shares Authorized | 70,000,000 | 150,000,000 | ||||||||
| Sold | 1,172,500 | 14,465,900 | 5,817,010 | 77,728,868 | ||||||
| Issued in reinvestment of distributions | 719,790 | 8,553,736 | 529,316 | 6,878,135 | ||||||
| Redeemed | (6,506,504 | ) | (81,525,313 | ) | (9,456,471 | ) | (124,255,176 | ) | ||
| (4,614,214 | ) | (58,505,677 | ) | (3,110,145 | ) | (39,648,173 | ) | |||
| A Class/Shares Authorized | 200,000,000 | 150,000,000 | ||||||||
| Sold | 3,435,801 | 43,328,728 | 6,088,353 | 82,628,637 | ||||||
| Issued in reinvestment of distributions | 1,574,958 | 19,000,956 | 637,839 | 8,406,322 | ||||||
| Redeemed | (15,900,104 | ) | (205,207,226 | ) | (3,720,450 | ) | (50,381,712 | ) | ||
| (10,889,345 | ) | (142,877,542 | ) | 3,005,742 | 40,653,247 | |||||
| C Class/Shares Authorized | 30,000,000 | 10,000,000 | ||||||||
| Sold | 281,983 | 3,505,108 | 530,078 | 7,096,533 | ||||||
| Issued in reinvestment of distributions | 38,595 | 458,326 | 7,339 | 95,427 | ||||||
| Redeemed | (222,720 | ) | (2,723,550 | ) | (129,287 | ) | (1,686,417 | ) | ||
| 97,858 | 1,239,884 | 408,130 | 5,505,543 | |||||||
| R Class/Shares Authorized | 25,000,000 | 5,000,000 | ||||||||
| Sold | 168,277 | 2,106,267 | 54,480 | 746,769 | ||||||
| Issued in reinvestment of distributions | 9,545 | 116,453 | 4,285 | 57,002 | ||||||
| Redeemed | (72,723 | ) | (935,167 | ) | (59,850 | ) | (810,122 | ) | ||
| 105,099 | 1,287,553 | (1,085 | ) | (6,351 | ) | |||||
| R6 Class/Shares Authorized | 30,000,000 | 50,000,000 | ||||||||
| Sold | 5,097,139 | 63,522,566 | 299,887 | 3,963,299 | ||||||
| Issued in reinvestment of distributions | 48,186 | 572,156 | 15,166 | 196,854 | ||||||
| Redeemed | (1,768,379 | ) | (22,259,140 | ) | (53,864 | ) | (726,814 | ) | ||
| 3,376,946 | 41,835,582 | 261,189 | 3,433,339 | |||||||
| Net increase (decrease) | (8,538,202 | ) | $ | (115,044,232 | ) | 5,356,320 | $ | 73,104,964 | ||
20
6. Fair Value Measurements
The fund’s investments valuation process is based on several considerations and may use multiple inputs to determine the fair value of the investments held by the fund. In conformity with accounting principles generally accepted in the United States of America, the inputs used to determine a valuation are classified into three broad levels.
| • | Level 1 valuation inputs consist of unadjusted quoted prices in an active market for identical investments. |
| • | Level 2 valuation inputs consist of direct or indirect observable market data (including quoted prices for comparable investments, evaluations of subsequent market events, interest rates, prepayment speeds, credit risk, etc.). These inputs also consist of quoted prices for identical investments initially expressed in local currencies that are adjusted through translation into U.S. dollars. |
| • | Level 3 valuation inputs consist of unobservable data (including a fund’s own assumptions). |
The level classification is based on the lowest level input that is significant to the fair valuation measurement. The valuation inputs are not necessarily an indication of the risks associated with investing in these securities or other financial instruments. There were no significant transfers between levels during the period.
The following is a summary of the level classifications as of period end. The Schedule of Investments provides additional information on the fund’s portfolio holdings.
| Level 1 | Level 2 | Level 3 | ||||||
| Assets | ||||||||
| Investment Securities | ||||||||
| Common Stocks | $ | 80,632,912 | $ | 1,603,424,142 | — | |||
| Rights | — | 130,611 | — | |||||
| Temporary Cash Investments | 2,300,329 | 18,111,839 | — | |||||
| $ | 82,933,241 | $ | 1,621,666,592 | — | ||||
7. Risk Factors
There are certain risks involved in investing in foreign securities. These risks include those resulting from future adverse political, social and economic developments, fluctuations in currency exchange rates, the possible imposition of exchange controls, and other foreign laws or restrictions. Investing in emerging markets may accentuate these risks.
8. Federal Tax Information
On December 22, 2015, the fund declared and paid a per-share distribution from net realized gains to shareholders of record on December 21, 2015 of $0.6204 for the Investor Class, Institutional Class, A Class, C Class, R Class and R6 Class.
On December 22, 2015, the fund declared and paid the following per-share distributions from net investment income to shareholders of record on December 21, 2015:
Investor Class | Institutional Class | A Class | C Class | R Class | R6 Class |
| $0.0618 | $0.0807 | $0.0382 | -— | $0.0145 | $0.0948 |
The tax character of distributions paid during the years ended November 30, 2015 and November 30, 2014 were as follows:
| 2015 | 2014 | |||||
| Distributions Paid From | ||||||
| Ordinary income | $ | 11,563,471 | $ | 27,916,244 | ||
| Long-term capital gains | $ | 116,926,590 | $ | 40,030,238 | ||
21
The book-basis character of distributions made during the year from net investment income or net realized gains may differ from their ultimate characterization for federal income tax purposes. These differences reflect the differing character of certain income items and net realized gains and losses for financial statement and tax purposes, and may result in reclassification among certain capital accounts on the financial statements.
As of November 30, 2015, the federal tax cost of investments and the components of distributable earnings on a tax-basis were as follows:
| Federal tax cost of investments | $ | 1,505,883,656 | |
| Gross tax appreciation of investments | $ | 244,127,751 | |
| Gross tax depreciation of investments | (45,411,574 | ) | |
| Net tax appreciation (depreciation) of investments | 198,716,177 | ||
Net tax appreciation (depreciation) on translation of assets and liabilities in foreign currencies | (330,246 | ) | |
| Net tax appreciation (depreciation) | $ | 198,385,931 | |
| Undistributed ordinary income | $ | 5,640,029 | |
Accumulated long-term gains | $ | 80,081,141 | |
The difference between book-basis and tax-basis unrealized appreciation (depreciation) is attributable primarily to the realization to ordinary income for tax purposes of unrealized gains on investments in passive foreign investment companies.
22
| Financial Highlights |
| For a Share Outstanding Throughout the Years Ended November 30 (except as noted) | |||||||||||||||
| Per-Share Data | Ratios and Supplemental Data | ||||||||||||||
| Income From Investment Operations: | Distributions From: | Ratio to Average Net Assets of: | |||||||||||||
Net Asset Value, Beginning of Period | Net Investment Income (Loss)(1) | Net Realized and Unrealized Gain (Loss) | Total From Investment Operations | Net Investment Income | Net Realized Gains | Total Distributions | Net Asset Value, End of Period | Total Return(2) | Operating Expenses | Net Investment Income (Loss) | Portfolio Turnover Rate | Net Assets, End of Period (in thousands) | |||
| Investor Class | |||||||||||||||
| 2015 | $13.40 | 0.07 | (0.34) | (0.27) | (0.08) | (0.80) | (0.88) | $12.25 | (1.86)% | 1.17% | 0.62% | 62% | $1,432,784 | ||
| 2014 | $13.78 | 0.10 | —(3) | 0.10 | (0.20) | (0.28) | (0.48) | $13.40 | 0.80% | 1.18% | 0.74% | 75% | $1,521,655 | ||
| 2013 | $11.27 | 0.11 | 2.58 | 2.69 | (0.18) | — | (0.18) | $13.78 | 24.22% | 1.22% | 0.84% | 110% | $1,499,623 | ||
| 2012 | $9.90 | 0.15 | 1.33 | 1.48 | (0.11) | — | (0.11) | $11.27 | 15.10% | 1.29% | 1.41% | 106% | $1,268,251 | ||
| 2011 | $10.30 | 0.10 | (0.35) | (0.25) | (0.15) | — | (0.15) | $9.90 | (2.57)% | 1.32% | 0.95% | 125% | $1,189,245 | ||
| Institutional Class | |||||||||||||||
| 2015 | $13.33 | 0.10 | (0.34) | (0.24) | (0.10) | (0.80) | (0.90) | $12.19 | (1.63)% | 0.97% | 0.82% | 62% | $70,422 | ||
| 2014 | $13.73 | 0.14 | (0.03) | 0.11 | (0.23) | (0.28) | (0.51) | $13.33 | 0.91% | 0.98% | 0.94% | 75% | $138,527 | ||
| 2013 | $11.24 | 0.13 | 2.58 | 2.71 | (0.22) | — | (0.22) | $13.73 | 24.54% | 1.02% | 1.04% | 110% | $185,325 | ||
| 2012 | $9.89 | 0.17 | 1.33 | 1.50 | (0.15) | — | (0.15) | $11.24 | 15.28% | 1.09% | 1.61% | 106% | $140,446 | ||
| 2011 | $10.30 | 0.12 | (0.33) | (0.21) | (0.20) | — | (0.20) | $9.89 | (2.27)% | 1.12% | 1.15% | 125% | $113,741 | ||
| A Class | |||||||||||||||
| 2015 | $13.48 | 0.07 | (0.37) | (0.30) | (0.06) | (0.80) | (0.86) | $12.32 | (2.13)% | 1.42% | 0.37% | 62% | $141,175 | ||
| 2014 | $13.86 | 0.07 | (0.01) | 0.06 | (0.16) | (0.28) | (0.44) | $13.48 | 0.49% | 1.43% | 0.49% | 75% | $301,164 | ||
| 2013 | $11.33 | 0.07 | 2.61 | 2.68 | (0.15) | — | (0.15) | $13.86 | 23.98% | 1.47% | 0.59% | 110% | $267,979 | ||
| 2012 | $9.92 | 0.12 | 1.35 | 1.47 | (0.06) | — | (0.06) | $11.33 | 14.80% | 1.54% | 1.16% | 106% | $198,434 | ||
| 2011 | $10.29 | 0.08 | (0.35) | (0.27) | (0.10) | — | (0.10) | $9.92 | (2.76)% | 1.57% | 0.70% | 125% | $172,901 | ||
23
| For a Share Outstanding Throughout the Years Ended November 30 (except as noted) | |||||||||||||||
| Per-Share Data | Ratios and Supplemental Data | ||||||||||||||
| Income From Investment Operations: | Distributions From: | Ratio to Average Net Assets of: | |||||||||||||
Net Asset Value, Beginning of Period | Net Investment Income (Loss)(1) | Net Realized and Unrealized Gain (Loss) | Total From Investment Operations | Net Investment Income | Net Realized Gains | Total Distributions | Net Asset Value, End of Period | Total Return(2) | Operating Expenses | Net Investment Income (Loss) | Portfolio Turnover Rate | Net Assets, End of Period (in thousands) | |||
| C Class | |||||||||||||||
| 2015 | $13.22 | (0.05) | (0.33) | (0.38) | — | (0.80) | (0.80) | $12.04 | (2.81)% | 2.17% | (0.38)% | 62% | $10,402 | ||
| 2014 | $13.58 | (0.03) | (0.02) | (0.05) | (0.03) | (0.28) | (0.31) | $13.22 | (0.29)% | 2.18% | (0.26)% | 75% | $10,129 | ||
| 2013 | $11.14 | (0.03) | 2.57 | 2.54 | (0.10) | — | (0.10) | $13.58 | 23.00% | 2.22% | (0.16)% | 110% | $4,859 | ||
| 2012 | $9.77 | 0.04 | 1.33 | 1.37 | — | — | — | $11.14 | 14.02% | 2.29% | 0.41% | 106% | $2,497 | ||
| 2011 | $10.13 | —(3) | (0.36) | (0.36) | — | — | — | $9.77 | (3.55)% | 2.32% | (0.05)% | 125% | $2,725 | ||
| R Class | |||||||||||||||
| 2015 | $13.59 | 0.02 | (0.35) | (0.33) | (0.03) | (0.80) | (0.83) | $12.43 | (2.31)% | 1.67% | 0.12% | 62% | $3,313 | ||
| 2014 | $13.96 | 0.03 | (0.01) | 0.02 | (0.11) | (0.28) | (0.39) | $13.59 | 0.25% | 1.68% | 0.24% | 75% | $2,195 | ||
| 2013 | $11.41 | 0.05 | 2.62 | 2.67 | (0.12) | — | (0.12) | $13.96 | 23.59% | 1.72% | 0.34% | 110% | $2,270 | ||
| 2012 | $9.97 | 0.10 | 1.35 | 1.45 | (0.01) | — | (0.01) | $11.41 | 14.56% | 1.79% | 0.91% | 106% | $2,262 | ||
| 2011 | $10.32 | 0.05 | (0.36) | (0.31) | (0.04) | — | (0.04) | $9.97 | (3.05)% | 1.82% | 0.45% | 125% | $3,222 | ||
| R6 Class | |||||||||||||||
| 2015 | $13.34 | 0.11 | (0.33) | (0.22) | (0.12) | (0.80) | (0.92) | $12.20 | (1.50)% | 0.82% | 0.97% | 62% | $48,887 | ||
| 2014 | $13.74 | 0.13 | —(3) | 0.13 | (0.25) | (0.28) | (0.53) | $13.34 | 1.10% | 0.83% | 1.09% | 75% | $8,411 | ||
2013(4) | $12.56 | 0.01 | 1.17 | 1.18 | — | — | — | $13.74 | 9.39% | 0.85%(5) | 0.20%(5) | 110%(6) | $5,076 | ||
24
| Notes to Financial Highlights | |
| (1) | Computed using average shares outstanding throughout the period. |
| (2) | Total returns are calculated based on the net asset value of the last business day and do not reflect applicable sales charges, if any. Total returns for periods less than one year are not annualized. |
| (3) | Per-share amount was less than $0.005. |
| (4) | July 26, 2013 (commencement of sale) through November 30, 2013. |
| (5) | Annualized. |
| (6) | Portfolio turnover is calculated at the fund level. Percentage indicated was calculated for the year ended November 30, 2013. |
See Notes to Financial Statements.
| Report of Independent Registered Public Accounting Firm |
To the Board of Directors and Shareholders of American Century World Mutual Funds, Inc.:
We have audited the accompanying statement of assets and liabilities, including the schedule of investments, of International Growth Fund (the “Fund”), one of the funds constituting American Century World Mutual Funds, Inc., as of November 30, 2015, and the related statement of operations for the year then ended, the statements of changes in net assets for each of the two years in the period then ended, and the financial highlights for each of the periods presented. These financial statements and financial highlights are the responsibility of the Fund’s management. Our responsibility is to express an opinion on these financial statements and financial highlights based on our audits.
We conducted our audits in accordance with the standards of the Public Company Accounting Oversight Board (United States). Those standards require that we plan and perform the audit to obtain reasonable assurance about whether the financial statements and financial highlights are free of material misstatement. The Fund is not required to have, nor were we engaged to perform, an audit of its internal control over financial reporting. Our audits included consideration of internal control over financial reporting as a basis for designing audit procedures that are appropriate in the circumstances, but not for the purpose of expressing an opinion on the effectiveness of the Fund’s internal control over financial reporting. Accordingly, we express no such opinion. An audit also includes examining, on a test basis, evidence supporting the amounts and disclosures in the financial statements, assessing the accounting principles used and significant estimates made by management, as well as evaluating the overall financial statement presentation. Our procedures included confirmation of securities owned as of November 30, 2015, by correspondence with the custodian and brokers; when replies were not received from brokers, we performed other auditing procedures. We believe that our audits provide a reasonable basis for our opinion.
In our opinion, the financial statements and financial highlights referred to above present fairly, in all material respects, the financial position of International Growth Fund of American Century World Mutual Funds, Inc. as of November 30, 2015, the results of its operations for the year then ended, the changes in its net assets for each of the two years in the period then ended, and the financial highlights for each of the periods presented, in conformity with accounting principles generally accepted in the United States of America.
DELOITTE & TOUCHE LLP
Kansas City, Missouri
January 19, 2016
25
| Management |
The Board of Directors
The individuals listed below serve as directors of the funds. Each director will continue to serve in this capacity until death, retirement, resignation or removal from office. The board has adopted a mandatory retirement age for directors who are not “interested persons,” as that term is defined in the Investment Company Act (independent directors). Independent directors shall retire by December 31 of the year in which they reach their 75th birthday.
Mr. Thomas is an “interested person” because he currently serves as President and Chief Executive Officer of American Century Companies, Inc. (ACC), the parent company of American Century Investment Management, Inc. (ACIM or the advisor). Mr. Fink is treated as an “interested person” because of his recent employment with ACC and American Century Services, LLC (ACS). The other directors (more than three-fourths of the total number) are independent. They are not employees, directors or officers of, and have no financial interest in, ACC or any of its wholly owned, direct or indirect, subsidiaries, including ACIM, American Century Investment Services, Inc. (ACIS) and ACS, and they do not have any other affiliations, positions or relationships that would cause them to be considered “interested persons” under the Investment Company Act. The directors serve in this capacity for seven (in the case of Mr. Thomas, 15) registered investment companies in the American Century Investments family of funds.
The following table presents additional information about the directors. The mailing address for each director is 4500 Main Street, Kansas City, Missouri 64111.
Name (Year of Birth) | Position(s) Held with Funds | Length of Time Served | Principal Occupation(s) During Past 5 Years | Number of American Century Portfolios Overseen by Director | Other Directorships Held During Past 5 Years |
| Independent Directors | |||||
Thomas A. Brown(1) (1940) | Director | Since 1980 | Managing Member, Associated Investments, LLC (real estate investment company) | 80 | None |
| Andrea C. Hall (1945) | Director | Since 1997 | Retired | 80 | None |
| Jan M. Lewis (1957) | Director | Since 2011 | Retired; President and Chief Executive Officer, Catholic Charities of Northeast Kansas (human services organization) (2006 to 2013) | 80 | None |
| James A. Olson (1942) | Director and Chairman of the Board | Since 2007 (Chairman since 2014) | Member, Plaza Belmont LLC (private equity fund manager) | 80 | Saia, Inc. (2002 to 2012) and EPR Properties (2003 to 2013) |
| M. Jeannine Strandjord (1945) | Director | Since 1994 | Retired | 80 | Euronet Worldwide Inc.; MGP Ingredients, Inc.; Charming Shoppes, Inc. (2006 to 2010); and DST Systems Inc. (1996 to 2012) |
| John R. Whitten (1946) | Director | Since 2008 | Retired | 80 | Rudolph Technologies, Inc. |
26
| Name (Year of Birth) | Position(s) Held with Funds | Length of Time Served | Principal Occupation(s) During Past 5 Years | Number of American Century Portfolios Overseen by Director | Other Directorships Held During Past 5 Years |
| Independent Directors | |||||
| Stephen E. Yates (1948) | Director | Since 2012 | Retired; Executive Vice President, Technology & Operations, KeyCorp. (computer services) (2004 to 2010) | 80 | Applied Industrial Technologies, Inc. (2001 to 2010) |
| Interested Directors | |||||
| Barry Fink (1955) | Director | Since 2012 | Retired; Executive Vice President, ACC (September 2007 to February 2013); President, ACS (October 2007 to February 2013); Chief Operating Officer, ACC (September 2007 to November 2012) | 80 | None |
| Jonathan S. Thomas (1963) | Director and President | Since 2007 | President and Chief Executive Officer, ACC (March 2007 to present). Also serves as Chief Executive Officer, ACS; Executive Vice President, ACIM; Director, ACC, ACIM and other ACC subsidiaries | 125 | BioMed Valley Discoveries, Inc. |
(1) Thomas A. Brown retired as Director of the Board effective December 31, 2015.
The Statement of Additional Information has additional information about the fund's directors and is available without charge, upon request, by calling 1-800-345-2021.
27
Officers
The following table presents certain information about the executive officers of the funds. Each officer serves as an officer for each of the 15 investment companies in the American Century family of funds, unless otherwise noted. No officer is compensated for his or her service as an officer of the funds. The listed officers are interested persons of the funds and are appointed or re-appointed on an annual basis. The mailing address for each officer listed below is 4500 Main Street, Kansas City, Missouri 64111.
Name (Year of Birth) | Offices with the Funds | Principal Occupation(s) During the Past Five Years |
| Jonathan S. Thomas (1963) | Director and President since 2007 | President and Chief Executive Officer, ACC (March 2007 to present). Also serves as Chief Executive Officer, ACS; Executive Vice President, ACIM; Director, ACC, ACIM and other ACC subsidiaries |
| Amy D. Shelton (1964) | Chief Compliance Officer and Vice President since 2014 | Chief Compliance Officer, American Century funds, (March 2014 to present); Chief Compliance Officer, ACIM (February 2014 to present); Chief Compliance Officer, ACIS (October 2009 to present); Vice President, Client Interactions and Marketing, ACIS (February 2013 to January 2014); Director, Client Interactions and Marketing, ACIS (June 2007 to January 2013). Also serves as Vice President, ACIS |
| Charles A. Etherington (1957) | General Counsel since 2007 and Senior Vice President since 2006 | Attorney, ACC (February 1994 to present); Vice President, ACC (November 2005 to present); General Counsel, ACC (March 2007 to present). Also serves as General Counsel, ACIM, ACS, ACIS and other ACC subsidiaries; and Senior Vice President, ACIM and ACS |
| C. Jean Wade (1964) | Vice President, Treasurer and Chief Financial Officer since 2012 | Vice President, ACS (February 2000 to present) |
| Robert J. Leach (1966) | Vice President since 2006 and Assistant Treasurer since 2012 | Vice President, ACS (February 2000 to present) |
| David H. Reinmiller (1963) | Vice President since 2000 | Attorney, ACC (January 1994 to present); Associate General Counsel, ACC (January 2001 to present). Also serves as Vice President, ACIM and ACS |
| Ward D. Stauffer (1960) | Secretary since 2005 | Attorney, ACC (June 2003 to present) |
28
| Approval of Management Agreement |
At a meeting held on June 30, 2015, the Fund’s Board of Directors unanimously approved the renewal of the management agreement pursuant to which American Century Investment Management, Inc. (the “Advisor”) acts as the investment advisor for the Fund. Under Section 15(c) of the Investment Company Act, contracts for investment advisory services are required to be reviewed, evaluated, and approved by a majority of a fund’s directors (the “Directors”), including a majority of the independent Directors, each year.
Prior to its consideration of the renewal of the management agreement, the Directors requested and reviewed extensive data and information compiled by the Advisor and certain independent providers of evaluation data concerning the Fund and the services provided to the Fund by the Advisor. This review was in addition to the oversight and evaluation undertaken by the Board and its committees on a continuous basis and the information received was supplemental to the extensive information that the Board and its committees receive and consider throughout the year.
In connection with its consideration of the renewal of the management agreement, the Board’s review and evaluation of the services provided by the Advisor included, but was not limited to, the following:
| • | the nature, extent, and quality of investment management, shareholder services, and other services provided by the Advisor to the Fund; |
| • | the wide range of other programs and services the Advisor provides to the Fund and its shareholders on a routine and non-routine basis; |
| • | the Fund’s investment performance compared to appropriate benchmarks and/or a peer group of other mutual funds with similar investment objectives and strategies; |
| • | the cost of owning the Fund compared to the cost of owning similar funds; |
| • | the compliance policies, procedures, and regulatory experience of the Fund's service providers; |
| • | financial data showing the cost of services provided to the Fund, the profitability of the Fund to the Advisor, and the overall profitability of the Advisor; |
| • | possible economies of scale associated with the Advisor’s management of the Fund and other accounts under its management; |
| • | data comparing services provided and charges to the Advisor's other investment management clients; |
| • | acquired fund fees and expenses; |
| • | payments by the Fund and the Advisor to financial intermediaries; and |
| • | any collateral benefits derived by the Advisor from the management of the Fund. |
In keeping with their practice, the Directors held two in-person meetings and one telephonic meeting to review and discuss the information provided. The independent Directors also had the benefit of the advice of their independent counsel throughout the process.
Factors Considered
The Directors considered all of the information provided by the Advisor, the independent data providers, and independent counsel in connection with the approval. They determined that the information was sufficient for them to evaluate the management agreement for the Fund. In connection with their review, the Directors did not identify any single factor as being all-important or controlling, and each Director may have attributed different levels of importance to different factors. In deciding to renew the management agreement, the Board based its decision on a number of factors, including the following:
29
Nature, Extent and Quality of Services - Generally. Under the management agreement, the Advisor is responsible for providing or arranging for all services necessary for the operation of the
Fund. The Board noted that under the management agreement, the Advisor provides or arranges at its own expense a wide variety of services including:
| • | constructing and designing the Fund |
| • | portfolio research and security selection |
| • | initial capitalization/funding |
| • | securities trading |
| • | Fund administration |
| • | custody of Fund assets |
| • | daily valuation of the Fund’s portfolio |
| • | shareholder servicing and transfer agency, including shareholder confirmations, recordkeeping, and communications |
| • | legal services (except the independent Directors’ counsel) |
| • | regulatory and portfolio compliance |
| • | financial reporting |
| • | marketing and distribution (except Rule 12b-1 plans) |
The Board noted that many of these services have expanded over time both in terms of quantity and complexity in response to shareholder demands, competition in the industry, changing distribution channels, and the changing regulatory environment.
Investment Management Services. The nature of the investment management services provided to the Fund is quite complex and allows Fund shareholders access to professional money management, instant diversification of their investments within an asset class, the opportunity to easily diversify among asset classes by investing in or exchanging among various American Century Investments funds, and liquidity. In evaluating investment performance, the Board expects the Advisor to manage the Fund in accordance with its investment objectives and approved strategies. Further, the Directors recognize that the Advisor has an obligation to monitor trading activities, and in particular to seek the best execution of fund trades, and to evaluate the use of and payment for research. In providing these services, the Advisor utilizes teams of investment professionals (portfolio managers, analysts, research assistants, and securities traders) who require extensive information technology, research, training, compliance and other systems to conduct their business. The Board, directly and through its Fund Performance Review Committee, regularly reviews investment performance information for the Fund, together with comparative information for appropriate benchmarks and/or peer groups of similarly-managed funds, over different time horizons. The Directors also review detailed performance information during the management agreement approval process. If performance concerns are identified, the Fund receives special reviews until performance improves, during which the Board discusses with the Advisor the reasons for such results (e.g., market conditions, security selection) and any efforts being undertaken to improve performance. The Fund’s performance was above its benchmark for the one-, three-, five-, and ten-year periods reviewed by the Board. The Board found the investment management services provided by the Advisor to the Fund to be satisfactory and consistent with the management agreement.
Shareholder and Other Services. Under the management agreement, the Advisor provides the Fund with a comprehensive package of transfer agency, shareholder, and other services. The Board, directly and through various committees of the Board, regularly reviews reports and evaluations of such services at its regular meetings. These reports include, but are not limited to, information regarding the operational efficiency and accuracy of the shareholder and transfer agency services provided, staffing levels, shareholder satisfaction (as measured by external as well as internal sources), technology support, new products and services offered to Fund shareholders, securities trading activities, portfolio valuation services, auditing services, and legal and operational compliance activities. The Board particularly noted the Advisor’s continual efforts to maintain effective business continuity plans and to address cybersecurity threats. Certain aspects of shareholder and transfer agency service level efficiency and the quality of securities trading
30
activities are measured by independent third party providers and are presented in comparison to other fund groups not managed by the Advisor. The Board found the services provided by the Advisor to the Fund under the management agreement to be competitive and of high quality.
Costs of Services and Profitability. The Advisor provides detailed information concerning its cost of providing various services to the Fund, its profitability in managing the Fund (pre- and post-distribution), its overall profitability, and its financial condition. The Directors have reviewed with the Advisor the methodology used to prepare this financial information. This information is considered in evaluating the Advisor’s financial condition, its ability to continue to provide services under the management agreement, and the reasonableness of the current management fee. The Board concluded that the Advisor’s profits were reasonable in light of the services provided to the Fund.
Ethics. The Board generally considers the Advisor’s commitment to providing quality services to shareholders and to conducting its business ethically. They noted that the Advisor’s practices generally meet or exceed industry best practices.
Economies of Scale. The Board also reviewed information provided by the Advisor regarding the possible existence of economies of scale in connection with the management of the Fund. The Board concluded that economies of scale are difficult to measure and predict with precision, especially on a fund-by-fund basis. The Board concluded that the Advisor is appropriately sharing economies of scale through its competitive fee structure, offering competitive fees from fund inception, and through reinvestment in its business to provide shareholders additional content and services. The Board also noted that economies of scale are shared with the Fund and its shareholders through management fee breakpoints that serve to reduce the effective management fee as the assets of the Fund grow.
Comparison to Other Funds’ Fees. The management agreement provides that the Fund pays the Advisor a single, all-inclusive (or unified) management fee for providing all services necessary for the management and operation of the Fund, other than brokerage expenses, taxes, interest, extraordinary expenses, and the fees and expenses of the Fund’s independent Directors (including their independent legal counsel) and expenses incurred in connection with the provision of shareholder services and distribution services under a plan adopted pursuant to Rule 12b-1 under the 1940 Act. Under the unified fee structure, the Advisor is responsible for providing all investment advisory, custody, audit, administrative, compliance, recordkeeping, marketing and shareholder services, or arranging and supervising third parties to provide such services. By contrast, most other funds are charged a variety of fees, including an investment advisory fee, a transfer agency fee, an administrative fee, distribution charges, and other expenses. Other than their investment advisory fees and any applicable Rule 12b-1 distribution fees, all other components of the total fees charged by these other funds may be increased without shareholder approval. The Board believes the unified fee structure is a benefit to Fund shareholders because it clearly discloses to shareholders the cost of owning Fund shares, and, since the unified fee cannot be increased without a vote of Fund shareholders, it shifts to the Advisor the risk of increased costs of operating the Fund and provides a direct incentive to minimize administrative inefficiencies. Part of the Board’s analysis of fee levels involves reviewing certain evaluative data compiled by an independent provider comparing the Fund’s unified fee to the total expense ratios of its peers. The unified fee charged to shareholders of the Fund was above the median of the total expense ratios of the Fund’s peer expense universe and was within the range of its peer expense group. The Board concluded that the management fee paid by the Fund to the Advisor under the management agreement is reasonable in light of the services provided to the Fund.
31
Comparison to Fees and Services Provided to Other Clients of the Advisor. The Directors also requested and received information from the Advisor concerning the nature of the services, fees, costs and profitability of its advisory services to advisory clients other than the Fund. They observed that these varying types of client accounts require different services and involve different regulatory and entrepreneurial risks than the management of the Fund. The Board analyzed this information and concluded that the fees charged and services provided to the Fund were reasonable by comparison.
Payments to Intermediaries. The Directors also requested and received a description of payments made to intermediaries by the Fund and the Advisor. These payments include various payments made by the Fund or the Advisor to different types of intermediaries and recordkeepers for distribution and service activities provided for the Fund. The Board reviewed such information and found the payments to be reasonable in scope and purpose.
Collateral or “Fall-Out” Benefits Derived by the Advisor. The Board considered the existence of collateral benefits the Advisor may receive as a result of its relationship with the Fund. They concluded that the Advisor’s primary business is managing mutual funds and it generally does not use fund or shareholder information to generate profits in other lines of business, and therefore does not derive any significant collateral benefits from them. The Board noted that additional assets from other clients may offer the Advisor some benefit from increased leverage with service providers and counterparties. Additionally, the Advisor receives proprietary research from broker-dealers that execute fund portfolio transactions, which the Board concluded is likely to benefit other clients of the Advisor as well as Fund shareholders. The Board also determined that the Advisor is able to provide investment management services to certain clients other than the Fund, at least in part, due to its existing infrastructure built to serve the fund complex. The Board concluded that appropriate allocation methodologies had been employed to assign resources and the cost of those resources to these other clients and, where expressly provided, these other client assets may be included with the assets of the Fund to determine breakpoints in the management fee schedule.
Existing Relationship. The Board also considered whether there was any reason for not continuing the existing arrangement with the Advisor. In this regard, the Board was mindful of the potential disruptions of the Fund’s operations and various risks, uncertainties, and other effects that could occur as a result of a decision not to continue such relationship. In particular, the Board recognized that most shareholders have invested in the Fund on the strength of the Advisor’s industry standing and reputation and in the expectation that the Advisor will have a continuing role in providing advisory services to the Fund.
Conclusion of the Directors. As a result of this process, the Board, including all of the independent Directors, taking into account all of the factors discussed above and the information provided by the Advisor and others in connection with its review and throughout the year, determined that the management fee is fair and reasonable in light of the services provided and that the investment management agreement between the Fund and the Advisor should be renewed.
32
| Additional Information |
Retirement Account Information
As required by law, distributions you receive from certain IRAs are subject to federal income tax withholding, unless you elect not to have withholding apply. Tax will be withheld on the total amount withdrawn even though you may be receiving amounts that are not subject to withholding, such as nondeductible contributions. In such case, excess amounts of withholding could occur. You may adjust your withholding election so that a greater or lesser amount will be withheld.
If you don’t want us to withhold on this amount, you must notify us to not withhold the federal income tax. You may notify us in writing or in certain situations by telephone or through other electronic means. For systematic withdrawals, your withholding election will remain in effect until revoked or changed by filing a new election. You have the right to revoke your election at any time.
Remember, even if you elect not to have income tax withheld, you are liable for paying income tax on the taxable portion of your withdrawal. If you elect not to have income tax withheld or you don’t have enough income tax withheld, you may be responsible for payment of estimated tax. You may incur penalties under the estimated tax rules if your withholding and estimated tax payments are not sufficient. You can reduce or defer the income tax on a distribution by directly or indirectly rolling such distribution over to another IRA or eligible plan. You should consult your tax advisor for additional information.
State tax will be withheld if, at the time of your distribution, your address is within one of the mandatory withholding states and you have federal income tax withheld (or as otherwise required by state law). State taxes will be withheld from your distribution in accordance with the respective state rules.
Distributions you receive from 403(b), 457 and qualified plans are subject to special tax and withholding rules. Your plan administrator or plan sponsor is required to provide you with a special tax notice explaining those rules at the time you request a distribution. If applicable, federal and/or state taxes may be withheld from your distribution amount.
Proxy Voting Policies
A description of the policies that the fund's investment advisor uses in exercising the voting rights associated with the securities purchased and/or held by the fund is available without charge, upon request, by calling 1-800-345-2021. It is also available on the "About Us" page of American Century Investments’ website at americancentury.com and on the Securities and Exchange Commission’s website at sec.gov. Information regarding how the investment advisor voted proxies relating to portfolio securities during the most recent 12-month period ended June 30 is available on the "About Us" page at americancentury.com. It is also available at sec.gov.
Quarterly Portfolio Disclosure
The fund files its complete schedule of portfolio holdings with the Securities and Exchange Commission (SEC) for the first and third quarters of each fiscal year on Form N-Q. The fund’s Forms N-Q are available on the SEC’s website at sec.gov, and may be reviewed and copied at the SEC’s Public Reference Room in Washington, DC. Information on the operation of the Public Reference Room may be obtained by calling 1-800-SEC-0330. The fund also makes its complete schedule of portfolio holdings for the most recent quarter of its fiscal year available on its
website at americancentury.com and, upon request, by calling 1-800-345-2021.
33
Other Tax Information
The following information is provided pursuant to provisions of the Internal Revenue Code.
The fund hereby designates up to the maximum amount allowable as qualified dividend income for the fiscal year ended November 30, 2015.
The fund hereby designates $122,403,523, or up to the maximum amount allowable, as long-term capital gain distributions for the fiscal year ended November 30, 2015.
For the fiscal year ended November 30, 2015, the fund intends to pass through to shareholders foreign source income of $35,256,534 and foreign taxes paid of $2,647,914, or up to the maximum amount allowable, as a foreign tax credit. Foreign source income and foreign tax expense per outstanding share on November 30, 2015 are $0.2530 and $0.0190, respectively.
The fund utilized earnings and profits of $6,414,695 distributed to shareholders on redemption of shares as part of the dividends paid deduction (tax equalization).
34
| Notes |
35
| ||
| Contact Us | americancentury.com | |
| Automated Information Line | 1-800-345-8765 | |
| Investor Services Representative | 1-800-345-2021 or 816-531-5575 | |
| Investors Using Advisors | 1-800-378-9878 | |
| Business, Not-For-Profit, Employer-Sponsored Retirement Plans | 1-800-345-3533 | |
| Banks and Trust Companies, Broker-Dealers, Financial Professionals, Insurance Companies | 1-800-345-6488 | |
| Telecommunications Relay Service for the Deaf | 711 | |
| American Century World Mutual Funds, Inc. | ||
Investment Advisor: American Century Investment Management, Inc. Kansas City, Missouri | ||
| This report and the statements it contains are submitted for the general information of our shareholders. The report is not authorized for distribution to prospective investors unless preceded or accompanied by an effective prospectus. | ||
| ©2016 American Century Proprietary Holdings, Inc. All rights reserved. CL-ANN-87750 1601 | ||
| ANNUAL REPORT | NOVEMBER 30, 2015 |
International Opportunities Fund
| Table of Contents |
| President’s Letter | 2 | |
| Performance | 3 | |
| Portfolio Commentary | ||
| Fund Characteristics | ||
| Shareholder Fee Example | ||
| Schedule of Investments | ||
| Statement of Assets and Liabilities | ||
| Statement of Operations | ||
| Statement of Changes in Net Assets | ||
| Notes to Financial Statements | ||
| Financial Highlights | ||
| Report of Independent Registered Public Accounting Firm | ||
| Management | ||
| Approval of Management Agreement | ||
| Additional Information | ||
Any opinions expressed in this report reflect those of the author as of the date of the report, and do not necessarily represent the opinions of American Century Investments® or any other person in the American Century Investments organization. Any such opinions are subject to change at any time based upon market or other conditions and American Century Investments disclaims any responsibility to update such opinions. These opinions may not be relied upon as investment advice and, because investment decisions made by American Century Investments funds are based on numerous factors, may not be relied upon as an indication of trading intent on behalf of any American Century Investments fund. Security examples are used for representational purposes only and are not intended as recommendations to purchase or sell securities. Performance information for comparative indices and securities is provided to American Century Investments by third party vendors. To the best of American Century Investments’ knowledge, such information is accurate at the time of printing.
| President’s Letter |
| Dear Investor: Thank you for reviewing this annual report for the 12 months ended November 30, 2015. It provides investment performance and portfolio information for the reporting period, plus longer-term historical performance data. Annual reports remain important vehicles for conveying information about fund performance, including market and economic factors that affected returns during the reporting period. For additional, updated investment and market insights, we encourage you to visit our website, americancentury.com. |
| Jonathan Thomas | |
Divergence in Economic Growth and Monetary Policies, Combined With China Turmoil, Triggered Market Volatility
Divergence between the U.S. and the rest of the world—along with China’s struggles, plunging commodity prices, capital market volatility, and risk-off trading—were dominant themes during the reporting period. Global divergence described not only the relatively stronger economic growth enjoyed by the U.S. compared with most of the world, but also the related contrast between the U.S. Federal Reserve’s (the Fed’s) unwinding of monetary stimulus versus the continuation and expansion of stimulus by other major central banks.
In 2014, the Fed ended its latest massive bond-buying program (quantitative easing, QE), leading to expectations that interest rates would soar in 2015. But while QE was halted in the U.S., other major central banks were starting or increasing QE as their economies faltered, particularly the European Central Bank, the Bank of Japan, and the People’s Bank of China. This monetary policy divergence helped fuel increased demand for the U.S. dollar and U.S. dollar-denominated assets, and put downward pressure on commodity prices, most notably crude oil, which declined approximately 40% for the reporting period. Low inflation also prevailed after oil prices plunged amid a supply glut and muted demand for commodities in general, especially as China’s economy slowed. In this environment, the U.S. dollar, U.S. growth stocks, and U.S. municipal bonds generally benefited from “flight to quality” capital flows, while emerging market and commodity-related investments suffered significant declines.
We expect continued economic and monetary policy divergence between the U.S. and non-U.S. economies in 2016, accompanied by further market volatility. This could present both challenges and opportunities for active investment managers. In this environment, we continue to believe in a disciplined, diversified, long-term investment approach, using professionally managed stock and bond portfolios to meet financial goals. We appreciate your continued trust in us in the coming year.
Sincerely,
Jonathan Thomas
President and Chief Executive Officer
American Century Investments
2
| Performance |
| Total Returns as of November 30, 2015 | ||||||
Average Annual Returns | ||||||
Ticker Symbol | 1 year | 5 years | 10 years | Since Inception | Inception Date | |
Investor Class | AIOIX | 6.67%(1) | 8.98%(1) | 6.87%(1) | 11.90%(1) | 6/1/01 |
MSCI ACWI ex-U.S. Small Cap Growth Index | — | 4.80% | 4.96% | 5.58% | 7.29% | — |
| Institutional Class | ACIOX | 6.82%(1) | 9.18%(1) | 7.08%(1) | 14.05%(1) | 1/9/03 |
| A Class | AIVOX | 3/1/10 | ||||
| No sales charge* | 6.48%(1) | 8.72%(1) | — | 10.17%(1) | ||
| With sales charge* | 0.37%(1) | 7.45%(1) | — | 9.02%(1) | ||
| C Class | AIOCX | 5.59%(1) | 7.91%(1) | — | 9.36%(1) | 3/1/10 |
| R Class | AIORX | 6.09%(1) | 8.44%(1) | — | 9.90%(1) | 3/1/10 |
* Sales charges include initial sales charges and contingent deferred sales charges (CDSCs), as applicable. A Class shares have a 5.75% maximum initial sales charge and may be subject to a maximum CDSC of 1.00%. C Class shares redeemed within 12 months of purchase are subject to a maximum CDSC of 1.00%. The SEC requires that mutual funds provide performance information net of maximum sales charges in all cases where charges could be applied.
| (1) | Returns would have been lower if a portion of the management fee had not been waived. |
Data presented reflect past performance. Past performance is no guarantee of future results. Current performance may be higher or lower than the performance shown. Investment return and principal value will fluctuate, and redemption value may be more or less than original cost. Data assumes reinvestment of dividends and capital gains, and none of the charts reflect the deduction of taxes that a shareholder would pay on fund distributions or the redemption of fund shares. To obtain performance data current to the most recent month end, please call 1-800-345-2021 or visit americancentury.com. For additional information about the fund, please consult the prospectus.
3
| Growth of $10,000 Over 10 Years |
| $10,000 investment made November 30, 2005 |
| Performance for other share classes will vary due to differences in fee structure. |
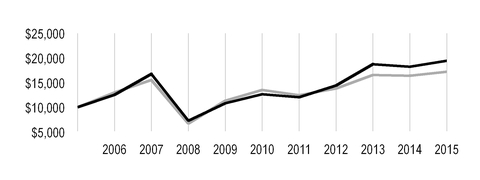
| Value on November 30, 2015 | |
| Investor Class — $19,446* | |
| MSCI ACWI ex-U.S. Small Cap Growth Index — $17,216 | |
*Ending value would have been lower if a portion of the management fee had not been waived.
Total Annual Fund Operating Expenses | ||||
Investor Class | Institutional Class | A Class | C Class | R Class |
| 1.75% | 1.55% | 2.00% | 2.75% | 2.25% |
The total annual fund operating expenses shown is as stated in the fund’s prospectus current as of the date of this report. The prospectus may vary from the expense ratio shown elsewhere in this report because it is based on a different time period, includes acquired fund fees and expenses, and, if applicable, does not include fee waivers or expense reimbursements.
Data presented reflect past performance. Past performance is no guarantee of future results. Current performance may be higher or lower than the performance shown. Investment return and principal value will fluctuate, and redemption value may be more or less than original cost. Data assumes reinvestment of dividends and capital gains, and none of the charts reflect the deduction of taxes that a shareholder would pay on fund distributions or the redemption of fund shares. To obtain performance data current to the most recent month end, please call 1-800-345-2021 or visit americancentury.com. For additional information about the fund, please consult the prospectus.
4
| Portfolio Commentary |
Portfolio Managers: Trevor Gurwich and Federico Laffan
Performance Summary
International Opportunities advanced 6.67%* for the 12 months ended November 30, 2015. The portfolio’s benchmark, the MSCI ACWI ex-U.S. Small Cap Growth Index, gained 4.80% for the same period.
Non-U.S. stocks generally posted modest gains in local currency terms during the 12-month period, but the ongoing relative strength of the U.S. dollar reduced returns for U.S.-based investors. Throughout the period, global divergence of economic growth and central bank policy remained a prominent theme. As the U.S. continued to set itself apart from the rest of the developed world, with better relative economic growth and fewer central bank stimulus efforts in play, the U.S. dollar gained strength versus other currencies, where central bank stimulus plans remained in full force.
Stock performance during the period was choppy. Early on, non-U.S. stocks rallied and outpaced U.S. stocks, as investors largely overlooked sluggish growth data, geopolitical concerns, and continued weakness among commodity prices to focus instead on supportive central bank policies from the European Central Bank (ECB) and the Bank of Japan. But those positive influences quickly faded, as renewed concerns about growth, commodities prices, a strong U.S. dollar, and a potential rate hike from the U.S. Federal Reserve (Fed) worried investors. Furthermore, in late July, Greece defaulted on its debt payment to the International Monetary Fund, sparking a sharp sell-off among global stocks. The sell-off intensified in the third quarter of 2015, as evidence emerged that China’s economy was cooling more than previously believed. In addition, oil and commodities prices dropped to new lows, due in part to falling demand from China. Anxiety about U.S. interest rate policy also remained a key theme, which persisted even after the Fed decided in September 2015 to leave rates unchanged due to concerns about the state of the global economy. Stocks rallied again in October, after the ECB pledged to take additional steps to jump-start the region’s lackluster economy and China’s central bank cut interest rates for the sixth time in 12 months, but they tumbled to close out the period in November.
Overall, among non-U.S. stocks, developed market stocks outpaced their emerging market counterparts, and small-cap stocks outperformed mid- and large-cap stocks. Among non-U.S. small-cap stocks, growth stocks significantly outperformed value stocks. Within the fund, stock selection primarily accounted for the outperformance versus the benchmark, particularly within the consumer discretionary, energy, and materials sectors. An overweight position relative to the benchmark in the consumer discretionary sector and an underweight position in energy also contributed. From a regional perspective, stock selection in Japan, Canada, and Australia, along with an overweight position in Japan and an underweight position in Australia, aided relative performance.
Media Company Was a Top Contributor
An overweight position in Germany-based Stroeer was a main contributor to fund performance. The advertising/media company reported strong first-quarter 2015 results and upgraded guidance driven by stronger margin expansion and an increase in growth expectations. The company also reported strong second-quarter 2015 revenue and profit gains and raised its guidance for 2016.
| * | All fund returns referenced in this commentary are for Investor Class shares. Returns would have been lower if a portion of the management fee had not been waived. Performance for other share classes will vary due to differences in fee structure; when Investor Class performance exceeds that of the fund's benchmark, other share classes may not. See page 3 for returns for all share classes. |
5
An overweight position in Hanssem also was a top contributor to fund performance. The South Korea-based maker of kitchen furnishings benefited from improving sales growth and market share expansion in the furniture industry. In addition, stronger apartment transaction volume growth in South Korea and the company’s entry into new product lines supported stock gains. We took profits and exited the position.
In addition, an overweight position in Ryohin Keikaku, a Japan-based specialty retailer, was a prominent contributor. The company continued to experience strong growth in its Muji store chain, largely due to travelers, especially those from China, who appreciate the chain’s selection of lower-end gift options.
Heath Care Sector Was a Main Detractor
Stock selection and an underweight position in the health care sector and an underweight position in the consumer staples sector were main detractors from fund performance. Our stock selection efforts in China, the U.K., and Denmark, along with an overweight position in China and an underweight position in the U.K., detracted from relative performance.
The portfolio’s overweight position in GAEC Educacao was a main detractor for the period. The Brazil-based private education firm suffered amid concerns about more-stringent requirements to the government’s post-secondary education funding guidelines. The potential effects for GAEC’s future revenues prompted us to exit the position.
An overweight position in Concordia Healthcare, a Canada-based specialty pharmaceuticals company, also was among the fund’s leading detractors. The company’s stock price declined along with shares of other pharmaceuticals companies due to U.S. political wrangling regarding prescription drug prices, which triggered “panic selling.” Nevertheless, we believe the sell-off was unwarranted, particularly because Concordia expects to derive less than 10% of its revenues from U.S. government reimbursements in 2016. We believe acquisitions and solid cost controls should continue to drive Concordia’s earnings growth.
In addition, an overweight position in Ozner Water International Holding, a China-based water purification services provider, was a main detractor. The company’s stock declined early in the period after a short seller accused Ozner of accounting irregularities. Ozner denied the accusations, but we exited the position.
Outlook
We will continue to focus on companies we believe demonstrate improving, sustainable earnings growth, particularly those in the consumer, asset management, and real estate industries. We expect select companies in these industries to benefit from weak energy and commodity prices, a strong U.S. dollar, and ongoing central bank accommodations (especially in Europe and Japan). In Europe, unemployment levels are lower, and expansion in money supply and credit growth suggest ECB policies are gaining traction. We expect any additional quantitative easing (QE) to support Europe’s recovery at the macroeconomic and company levels, but growth may remain modest. A weaker euro should continue to act as a tailwind, helping European manufacturers and exporters by making their goods more competitive in foreign markets. Similarly, QE has weakened the yen, and Japan-based manufacturers and exporters have benefited, though certain domestically focused sectors of the economy remain challenged. We continue to underweight emerging markets, but we have increased the fund’s China exposure due to stabilizing economic data and central bank stimulus measures there.
6
| Fund Characteristics |
| NOVEMBER 30, 2015 | |
Top Ten Holdings | % of net assets |
| Teleperformance | 2.1% |
| Bellway plc | 2.0% |
| Stroeer SE | 1.9% |
| Aristocrat Leisure Ltd. | 1.7% |
| FinecoBank Banca Fineco SpA | 1.5% |
| Element Financial Corp. | 1.5% |
| Rubis SCA | 1.5% |
| Straumann Holding AG | 1.5% |
| CCL Industries, Inc., Class B | 1.4% |
| Leonteq AG | 1.3% |
Types of Investments in Portfolio | % of net assets |
| Foreign Common Stocks | 98.2% |
| Exchange-Traded Funds | 0.5% |
| Total Equity Exposure | 98.7% |
| Temporary Cash Investments | 1.4% |
| Other Assets and Liabilities | (0.1)% |
Investments by Country | % of net assets |
| Japan | 23.4% |
| United Kingdom | 8.9% |
| Germany | 8.9% |
| Canada | 8.6% |
| France | 8.3% |
| China | 6.3% |
| Australia | 4.4% |
| Switzerland | 4.3% |
| Sweden | 3.8% |
| Italy | 3.5% |
| South Korea | 2.6% |
| Taiwan | 2.4% |
| Spain | 2.2% |
| Denmark | 2.1% |
| Other Countries | 8.5% |
| Exchange-Traded Funds* | 0.5% |
| Cash and Equivalents** | 1.3% |
*Category may increase exposure to the countries indicated. The Schedule of Investments provides additional information on the fund's portfolio holdings. | |
| **Includes temporary cash investments and other assets and liabilities. | |
7
| Shareholder Fee Example |
Fund shareholders may incur two types of costs: (1) transaction costs, including sales charges (loads) on purchase payments and redemption/exchange fees; and (2) ongoing costs, including management fees; distribution and service (12b-1) fees; and other fund expenses. This example is intended to help you understand your ongoing costs (in dollars) of investing in your fund and to compare these costs with the ongoing cost of investing in other mutual funds.
The example is based on an investment of $1,000 made at the beginning of the period and held for the entire period from June 1, 2015 to November 30, 2015.
Actual Expenses
The table provides information about actual account values and actual expenses for each class. You may use the information, together with the amount you invested, to estimate the expenses that you paid over the period. First, identify the share class you own. Then simply divide your account value by $1,000 (for example, an $8,600 account value divided by $1,000 = 8.6), then multiply the result by the number under the heading “Expenses Paid During Period” to estimate the expenses you paid on your account during this period.
If you hold Investor Class shares of any American Century Investments fund, or Institutional Class shares of the American Century Diversified Bond Fund, in an American Century Investments account (i.e., not a financial intermediary or retirement plan account), American Century Investments may charge you a $12.50 semiannual account maintenance fee if the value of those shares is less than $10,000. We will redeem shares automatically in one of your accounts to pay the $12.50 fee. In determining your total eligible investment amount, we will include your investments in all personal accounts (including American Century Investments Brokerage accounts) registered under your Social Security number. Personal accounts include individual accounts, joint accounts, UGMA/UTMA accounts, personal trusts, Coverdell Education Savings Accounts and IRAs (including traditional, Roth, Rollover, SEP-, SARSEP- and SIMPLE-IRAs), and certain other retirement accounts. If you have only business, business retirement, employer-sponsored or American Century Investments Brokerage accounts, you are currently not subject to this fee. If you are subject to the Account Maintenance Fee, your account value could be reduced by the fee amount.
Hypothetical Example for Comparison Purposes
The table also provides information about hypothetical account values and hypothetical expenses based on the actual expense ratio of each class of your fund and an assumed rate of return of 5% per year before expenses, which is not the actual return of a fund’s share class. The hypothetical account values and expenses may not be used to estimate the actual ending account balance or expenses you paid for the period. You may use this information to compare the ongoing costs of investing in your fund and other funds. To do so, compare this 5% hypothetical example with the 5% hypothetical examples that appear in the shareholder reports of the other funds.
Please note that the expenses shown in the table are meant to highlight your ongoing costs only and do not reflect any transactional costs, such as sales charges (loads) or redemption/exchange fees. Therefore, the table is useful in comparing ongoing costs only, and will not help you determine the relative total costs of owning different funds. In addition, if these transactional costs were included, your costs would have been higher.
8
| Beginning Account Value 6/1/15 | Ending Account Value 11/30/15 | Expenses Paid During Period(1)6/1/15 - 11/30/15 | Annualized Expense Ratio(1) | |
Actual | ||||
| Investor Class (after waiver) | $1,000 | $978.40 | $7.44 | 1.50% |
| Investor Class (before waiver) | $1,000 | $978.40(2) | $8.43 | 1.70% |
| Institutional Class (after waiver) | $1,000 | $980.80 | $6.46 | 1.30% |
| Institutional Class (before waiver) | $1,000 | $980.80(2) | $7.45 | 1.50% |
| A Class (after waiver) | $1,000 | $978.30 | $8.68 | 1.75% |
| A Class (before waiver) | $1,000 | $978.30(2) | $9.67 | 1.95% |
| C Class (after waiver) | $1,000 | $974.60 | $12.38 | 2.50% |
| C Class (before waiver) | $1,000 | $974.60(2) | $13.37 | 2.70% |
| R Class (after waiver) | $1,000 | $977.10 | $9.91 | 2.00% |
| R Class (before waiver) | $1,000 | $977.10(2) | $10.90 | 2.20% |
| Hypothetical | ||||
| Investor Class (after waiver) | $1,000 | $1,017.55 | $7.59 | 1.50% |
| Investor Class (before waiver) | $1,000 | $1,016.55 | $8.59 | 1.70% |
| Institutional Class (after waiver) | $1,000 | $1,018.55 | $6.58 | 1.30% |
| Institutional Class (before waiver) | $1,000 | $1,017.55 | $7.59 | 1.50% |
| A Class (after waiver) | $1,000 | $1,016.30 | $8.85 | 1.75% |
| A Class (before waiver) | $1,000 | $1,015.29 | $9.85 | 1.95% |
| C Class (after waiver) | $1,000 | $1,012.53 | $12.61 | 2.50% |
| C Class (before waiver) | $1,000 | $1,011.53 | $13.62 | 2.70% |
| R Class (after waiver) | $1,000 | $1,015.04 | $10.10 | 2.00% |
| R Class (before waiver) | $1,000 | $1,014.04 | $11.11 | 2.20% |
| (1) | Expenses are equal to the class's annualized expense ratio listed in the table above, multiplied by the average account value over the period, multiplied by 183, the number of days in the most recent fiscal half-year, divided by 365, to reflect the one-half year period. |
| (2) | Ending account value assumes the return earned after waiver and would have been lower if a portion of the management fee had not been waived. |
9
| Schedule of Investments |
NOVEMBER 30, 2015
| Shares | Value | |||
| COMMON STOCKS — 98.2% | ||||
| Australia — 4.4% | ||||
| Aristocrat Leisure Ltd. | 381,160 | $ | 2,615,966 | |
| Bellamy's Australia Ltd. | 133,620 | 1,116,123 | ||
| Blackmores Ltd. | 7,170 | 952,288 | ||
| OzForex Group Ltd. | 378,390 | 941,362 | ||
| Regis Resources Ltd. | 517,290 | 727,633 | ||
| Sandfire Resources NL | 166,850 | 634,703 | ||
| 6,988,075 | ||||
| Canada — 8.6% | ||||
| CCL Industries, Inc., Class B | 13,640 | 2,265,213 | ||
| Concordia Healthcare Corp. | 43,360 | 1,669,853 | ||
Descartes Systems Group, Inc. (The)(1) | 74,870 | 1,495,214 | ||
Element Financial Corp.(1) | 182,070 | 2,331,347 | ||
| FirstService Corp. | 37,260 | 1,517,240 | ||
| Norbord, Inc. | 70,480 | 1,468,234 | ||
Raging River Exploration, Inc.(1) | 232,650 | 1,506,925 | ||
| Whitecap Resources, Inc. | 147,140 | 1,261,562 | ||
| 13,515,588 | ||||
| China — 6.3% | ||||
Cheetah Mobile, Inc. ADR(1) | 58,110 | 1,121,523 | ||
Chinasoft International Ltd.(1) | 1,956,000 | 895,576 | ||
| Cosmo Lady China Holdings Co. Ltd. | 1,230,000 | 1,197,725 | ||
| CT Environmental Group Ltd. | 4,098,000 | 1,347,774 | ||
| PAX Global Technology Ltd. | 954,000 | 1,179,973 | ||
| Shenzhen Investment Ltd. | 2,360,000 | 1,019,675 | ||
| Wasion Group Holdings Ltd. | 1,054,000 | 1,201,705 | ||
| Xinyi Solar Holdings Ltd. | 3,874,000 | 1,568,896 | ||
| XTEP International Holdings Ltd. | 642,000 | 382,545 | ||
| 9,915,392 | ||||
| Denmark — 2.1% | ||||
| Chr Hansen Holding A/S | 26,600 | 1,669,222 | ||
Genmab A/S(1) | 7,190 | 926,618 | ||
| Sydbank A/S | 23,860 | 782,938 | ||
| 3,378,778 | ||||
| Finland — 0.5% | ||||
| Cramo Oyj | 42,660 | 863,137 | ||
| France — 8.3% | ||||
APERAM SA(1) | 24,290 | 826,111 | ||
Criteo SA ADR(1) | 10,120 | 412,491 | ||
| Eurofins Scientific | 4,660 | 1,753,758 | ||
| Nexity SA | 34,210 | 1,460,060 | ||
| Rubis SCA | 29,180 | 2,319,967 | ||
10
| Shares | Value | |||
| Sopra Steria Group | 12,620 | $ | 1,440,035 | |
| Teleperformance | 38,870 | 3,231,237 | ||
Worldline SA(1) | 59,120 | 1,521,292 | ||
| 12,964,951 | ||||
| Germany — 8.9% | ||||
| AURELIUS SE & Co. KGaA | 26,890 | 1,190,547 | ||
| CTS Eventim AG & Co. KGaA | 37,919 | 1,341,720 | ||
| Drillisch AG | 24,740 | 1,106,988 | ||
| Gerresheimer AG | 15,100 | 1,178,993 | ||
| Jungheinrich AG Preference Shares | 16,900 | 1,311,501 | ||
Nordex SE(1) | 41,060 | 1,379,545 | ||
| NORMA Group | 26,490 | 1,447,819 | ||
| Sartorius AG Preference Shares | 5,070 | 1,193,207 | ||
| Stroeer SE | 50,130 | 2,978,743 | ||
| Wirecard AG | 17,310 | 847,964 | ||
| 13,977,027 | ||||
| Hong Kong — 1.7% | ||||
| Melco International Development Ltd. | 1,022,000 | 1,399,847 | ||
Regina Miracle International Holdings Ltd.(1) | 1,110,000 | 1,221,172 | ||
| 2,621,019 | ||||
| India — 0.8% | ||||
| Indiabulls Housing Finance Ltd. | 125,370 | 1,291,600 | ||
| Ireland — 0.8% | ||||
Dalata Hotel Group plc(1) | 220,560 | 1,200,118 | ||
| Israel — 1.2% | ||||
| Frutarom Industries Ltd. | 38,980 | 1,899,892 | ||
| Italy — 3.5% | ||||
| Davide Campari-Milano SpA | 172,670 | 1,516,942 | ||
| FinecoBank Banca Fineco SpA | 309,990 | 2,420,372 | ||
OVS SpA(1) | 233,630 | 1,589,661 | ||
| 5,526,975 | ||||
| Japan — 23.4% | ||||
Anicom Holdings, Inc.(1) | 62,300 | 1,415,035 | ||
| Asahi Intecc Co. Ltd. | 17,100 | 743,176 | ||
| Dip Corp. | 83,500 | 1,901,982 | ||
| Ezaki Glico Co. Ltd. | 39,000 | 1,961,089 | ||
| Gulliver International Co. Ltd. | 135,600 | 1,266,775 | ||
| Haseko Corp. | 71,300 | 796,985 | ||
| Hoshizaki Electric Co. Ltd. | 17,300 | 1,215,638 | ||
| Invincible Investment Corp. | 2,150 | 1,294,192 | ||
| Jamco Corp. | 36,500 | 1,292,770 | ||
| Japan Aviation Electronics Industry Ltd. | 41,000 | 716,418 | ||
| Kose Corp. | 11,700 | 1,224,175 | ||
| Kyoritsu Maintenance Co. Ltd. | 16,400 | 1,320,260 | ||
| MISUMI Group, Inc. | 91,000 | 1,235,264 | ||
| Mitsubishi Pencil Co. Ltd. | 22,500 | 1,061,941 | ||
| Nifco, Inc. | 38,400 | 1,634,573 | ||
11
| Shares | Value | |||
| Nihon M&A Center, Inc. | 18,600 | $ | 831,032 | |
| Nipro Corp. | 102,900 | 1,129,309 | ||
| NS Solutions Corp. | 37,000 | 1,713,241 | ||
| Penta-Ocean Construction Co. Ltd. | 277,200 | 1,101,144 | ||
| Pigeon Corp. | 53,100 | 1,522,689 | ||
| Resorttrust, Inc. | 42,400 | 1,131,470 | ||
| Ryohin Keikaku Co. Ltd. | 7,800 | 1,682,924 | ||
| Sohgo Security Services Co. Ltd. | 31,400 | 1,510,057 | ||
| Takeuchi Manufacturing Co. Ltd. | 59,100 | 1,265,537 | ||
| Temp Holdings Co. Ltd. | 103,200 | 1,666,625 | ||
| Topcon Corp. | 62,400 | 1,097,449 | ||
| Tsuruha Holdings, Inc. | 21,200 | 1,894,395 | ||
| Zenkoku Hosho Co. Ltd. | 35,000 | 1,147,238 | ||
| 36,773,383 | ||||
| Malaysia — 1.0% | ||||
| My EG Services Bhd | 1,925,100 | 1,539,538 | ||
| Mexico — 0.4% | ||||
| Alsea SAB de CV | 114,530 | 408,427 | ||
| Banregio Grupo Financiero SAB de CV | 28,549 | 151,009 | ||
| 559,436 | ||||
| Netherlands — 1.2% | ||||
| TKH Group NV | 28,100 | 1,047,430 | ||
| USG People NV | 54,770 | 842,257 | ||
| 1,889,687 | ||||
| Norway — 0.4% | ||||
| Hoegh LNG Holdings Ltd. | 51,610 | 632,465 | ||
| Philippines — 0.5% | ||||
| D&L Industries, Inc. | 3,770,600 | 750,926 | ||
| South Korea — 2.6% | ||||
| Byucksan Corp. | 107,780 | 795,751 | ||
| Cosmax, Inc. | 4,390 | 693,727 | ||
| Cuckoo Electronics Co. Ltd. | 4,210 | 870,683 | ||
| NongShim Co. Ltd. | 4,840 | 1,736,557 | ||
| 4,096,718 | ||||
| Spain — 2.2% | ||||
Cellnex Telecom SAU(1) | 66,550 | 1,209,038 | ||
| Melia Hotels International SA | 140,170 | 1,783,083 | ||
| Merlin Properties Socimi SA | 31,910 | 397,494 | ||
| 3,389,615 | ||||
| Sweden — 3.8% | ||||
| Avanza Bank Holding AB | 22,390 | 965,241 | ||
| Indutrade AB | 16,120 | 881,796 | ||
| Inwido AB | 88,100 | 1,080,821 | ||
| Nobia AB | 116,310 | 1,428,237 | ||
| Saab AB, B Shares | 54,530 | 1,689,956 | ||
| 6,046,051 | ||||
| Switzerland — 4.3% | ||||
| Leonteq AG | 13,990 | 2,107,644 | ||
12
| Shares | Value | |||
| Straumann Holding AG | 7,760 | $ | 2,296,661 | |
| U-Blox AG | 5,860 | 1,213,180 | ||
| Ypsomed Holding AG | 7,490 | 1,072,340 | ||
| 6,689,825 | ||||
| Taiwan — 2.4% | ||||
| Eclat Textile Co. Ltd. | 54,000 | 726,242 | ||
| Hota Industrial Manufacturing Co. Ltd. | 438,000 | 1,690,705 | ||
| St. Shine Optical Co. Ltd. | 68,000 | 1,302,004 | ||
| 3,718,951 | ||||
| United Kingdom — 8.9% | ||||
Auto Trader Group plc(1) | 333,320 | 2,039,678 | ||
| Bellway plc | 81,360 | 3,205,547 | ||
| Domino's Pizza Group plc | 96,650 | 1,529,882 | ||
| Hikma Pharmaceuticals plc | 55,050 | 1,795,018 | ||
| Redrow plc | 224,600 | 1,536,422 | ||
| Rightmove plc | 26,840 | 1,617,352 | ||
| RPC Group plc | 37,790 | 435,403 | ||
| Sophos Group plc | 94,280 | 402,698 | ||
Telit Communications plc(1) | 94,140 | 320,432 | ||
| Virgin Money Holdings UK plc | 212,530 | 1,139,205 | ||
| 14,021,637 | ||||
TOTAL COMMON STOCKS (Cost $132,101,360) | 154,250,784 | |||
| EXCHANGE-TRADED FUNDS — 0.5% | ||||
iShares MSCI Indonesia ETF (Cost $762,374) | 36,010 | 735,324 | ||
| TEMPORARY CASH INVESTMENTS — 1.4% | ||||
| Repurchase Agreement, Credit Suisse First Boston, Inc., (collateralized by various U.S. Treasury obligations, 0.625%, 8/31/17, valued at $723,570), in a joint trading account at 0.01%, dated 11/30/15, due 12/1/15 (Delivery value $709,579) | 709,579 | |||
| Repurchase Agreement, Fixed Income Clearing Corp., (collateralized by various U.S. Treasury obligations, 3.00%, 11/15/44, valued at $1,208,488), at 0.01%, dated 11/30/15, due 12/1/15 (Delivery value $1,182,000) | 1,182,000 | |||
| State Street Institutional Liquid Reserves Fund, Premier Class | 279,217 | 279,217 | ||
TOTAL TEMPORARY CASH INVESTMENTS (Cost $2,170,796) | 2,170,796 | |||
TOTAL INVESTMENT SECURITIES — 100.1% (Cost $135,034,530) | 157,156,904 | |||
| OTHER ASSETS AND LIABILITIES — (0.1)% | (92,436) | |||
| TOTAL NET ASSETS — 100.0% | $ | 157,064,468 | ||
13
| MARKET SECTOR DIVERSIFICATION | ||
(as a % of net assets) | ||
| Consumer Discretionary | 23.4 | % |
| Industrials | 16.4 | % |
| Information Technology | 14.5 | % |
| Financials | 13.6 | % |
| Health Care | 9.6 | % |
| Consumer Staples | 8.0 | % |
| Materials | 6.6 | % |
| Utilities | 2.4 | % |
| Energy | 2.2 | % |
| Telecommunication Services | 1.5 | % |
| Exchange-Traded Funds | 0.5 | % |
| Cash and Equivalents* | 1.3 | % |
*Includes temporary cash investments and other assets and liabilities.
| NOTES TO SCHEDULE OF INVESTMENTS | ||
| ADR | - | American Depositary Receipt |
| (1) | Non-income producing. |
See Notes to Financial Statements.
14
| Statement of Assets and Liabilities |
| NOVEMBER 30, 2015 | |||
| Assets | |||
| Investment securities, at value (cost of $135,034,530) | $ | 157,156,904 | |
| Foreign currency holdings, at value (cost of $39,577) | 36,612 | ||
| Receivable for investments sold | 226,204 | ||
| Receivable for capital shares sold | 137,009 | ||
| Dividends and interest receivable | 183,757 | ||
| Other assets | 30,127 | ||
| 157,770,613 | |||
| Liabilities | |||
| Payable for investments purchased | 396,242 | ||
| Payable for capital shares redeemed | 112,388 | ||
| Accrued management fees | 192,114 | ||
| Distribution and service fees payable | 5,401 | ||
| 706,145 | |||
| Net Assets | $ | 157,064,468 | |
| Net Assets Consist of: | |||
| Capital (par value and paid-in surplus) | $ | 134,294,428 | |
| Accumulated net investment loss | (426,288 | ) | |
| Undistributed net realized gain | 1,104,276 | ||
| Net unrealized appreciation | 22,092,052 | ||
| $ | 157,064,468 | ||
| Net Assets | Shares Outstanding | Net Asset Value Per Share | ||||
| Investor Class, $0.01 Par Value | $128,449,706 | 14,142,365 | $9.08 | |||
| Institutional Class, $0.01 Par Value | $6,685,432 | 728,558 | $9.18 | |||
| A Class, $0.01 Par Value | $19,795,904 | 2,192,336 | $9.03* | |||
| C Class, $0.01 Par Value | $1,479,178 | 167,881 | $8.81 | |||
| R Class, $0.01 Par Value | $654,248 | 72,943 | $8.97 | |||
*Maximum offering price $9.58 (net asset value divided by 0.9425).
See Notes to Financial Statements.
15
| Statement of Operations |
| YEAR ENDED NOVEMBER 30, 2015 | |||
| Investment Income (Loss) | |||
| Income: | |||
| Dividends (net of foreign taxes withheld of $185,516) | $ | 1,729,352 | |
| Interest | 653 | ||
| 1,730,005 | |||
| Expenses: | |||
| Management fees | 2,490,326 | ||
| Distribution and service fees: | |||
| A Class | 41,801 | ||
| C Class | 10,314 | ||
| R Class | 3,102 | ||
| Directors' fees and expenses | 5,136 | ||
| Other expenses | 4,153 | ||
| 2,554,832 | |||
| Fees waived | (292,960 | ) | |
| 2,261,872 | |||
| Net investment income (loss) | (531,867 | ) | |
| Realized and Unrealized Gain (Loss) | |||
| Net realized gain (loss) on: | |||
| Investment transactions (net of foreign tax expenses paid (refunded) of $68,213) | 3,622,685 | ||
| Foreign currency transactions | (87,458 | ) | |
| 3,535,227 | |||
| Change in net unrealized appreciation (depreciation) on: | |||
| Investments (includes (increase) decrease in accrued foreign taxes of $142,183) | 5,262,771 | ||
| Translation of assets and liabilities in foreign currencies | (627 | ) | |
| 5,262,144 | |||
| Net realized and unrealized gain (loss) | 8,797,371 | ||
| Net Increase (Decrease) in Net Assets Resulting from Operations | $ | 8,265,504 | |
See Notes to Financial Statements.
16
| Statement of Changes in Net Assets |
| YEARS ENDED NOVEMBER 30, 2015 AND NOVEMBER 30, 2014 | ||||||
| Increase (Decrease) in Net Assets | November 30, 2015 | November 30, 2014 | ||||
| Operations | ||||||
| Net investment income (loss) | $ | (531,867 | ) | $ | 144,525 | |
| Net realized gain (loss) | 3,535,227 | 9,579,587 | ||||
| Change in net unrealized appreciation (depreciation) | 5,262,144 | (14,469,947 | ) | |||
| Net increase (decrease) in net assets resulting from operations | 8,265,504 | (4,745,835 | ) | |||
| Distributions to Shareholders | ||||||
| From net investment income: | ||||||
| Investor Class | (310,451 | ) | (420,466 | ) | ||
| Institutional Class | (10,868 | ) | (13,066 | ) | ||
| A Class | (28,281 | ) | (24,247 | ) | ||
| C Class | (75 | ) | — | |||
| R Class | (690 | ) | (931 | ) | ||
| From net realized gains: | ||||||
| Investor Class | (5,094,004 | ) | — | |||
| Institutional Class | (186,683 | ) | — | |||
| A Class | (623,812 | ) | — | |||
| C Class | (30,823 | ) | — | |||
| R Class | (24,603 | ) | — | |||
| Decrease in net assets from distributions | (6,310,290 | ) | (458,710 | ) | ||
| Capital Share Transactions | ||||||
| Net increase (decrease) in net assets from capital share transactions (Note 5) | 10,796,697 | 1,336,793 | ||||
| Redemption Fees | ||||||
| Increase in net assets from redemption fees | 9,050 | 15,927 | ||||
| Net increase (decrease) in net assets | 12,760,961 | (3,851,825 | ) | |||
| Net Assets | ||||||
| Beginning of period | 144,303,507 | 148,155,332 | ||||
| End of period | $ | 157,064,468 | $ | 144,303,507 | ||
Accumulated (distributions in excess of) net investment income (loss) | $ | (426,288 | ) | $ | (51,024 | ) |
See Notes to Financial Statements.
17
| Notes to Financial Statements |
NOVEMBER 30, 2015
1. Organization
American Century World Mutual Funds, Inc. (the corporation) is registered under the Investment Company Act of 1940, as amended (the 1940 Act), as an open-end management investment company and is organized as a Maryland corporation. International Opportunities Fund (the fund) is one fund in a series issued by the corporation. The fund is diversified as defined under the 1940 Act. The fund's investment objective is to seek capital growth.
The fund offers the Investor Class, the Institutional Class, the A Class, the C Class and the R Class. The A Class may incur an initial sales charge. The A Class and C Class may be subject to a contingent deferred sales charge. The share classes differ principally in their respective sales charges and distribution and shareholder servicing expenses and arrangements. The Institutional Class is made available to institutional shareholders or through financial intermediaries whose clients do not require the same level of shareholder and administrative services as shareholders of other classes. As a result, the Institutional Class is charged a lower unified management fee.
2. Significant Accounting Policies
The following is a summary of significant accounting policies consistently followed by the fund in preparation of its financial statements. The fund is an investment company and follows accounting and reporting guidance in accordance with accounting principles generally accepted in the United States of America. This may require management to make certain estimates and assumptions at the date of the financial statements. Actual results could differ from these estimates. Management evaluated the impact of events or transactions occurring through the date the financial statements were issued that would merit recognition or disclosure.
Investment Valuations — The fund determines the fair value of its investments and computes its net asset value per share at the close of regular trading (usually 4 p.m. Eastern time) on the New York Stock Exchange (NYSE) on each day the NYSE is open. The Board of Directors has adopted valuation policies and procedures to guide the investment advisor in the fund’s investment valuation process and to provide methodologies for the oversight of the fund’s pricing function.
Equity securities that are listed or traded on a domestic securities exchange are valued at the last reported sales price or at the official closing price as provided by the exchange. Equity securities traded on foreign securities exchanges are generally valued at the closing price of such securities on the exchange where primarily traded or at the close of the NYSE, if that is earlier. If no last sales price is reported, or if local convention or regulation so provides, the mean of the latest bid and asked prices may be used. Securities traded over-the-counter are valued at the mean of the latest bid and asked prices, the last sales price, or the official closing price. Equity securities initially expressed in local currencies are translated into U.S. dollars at the mean of the appropriate currency exchange rate at the close of the NYSE as provided by an independent pricing service.
Open-end management investment companies are valued at the reported net asset value per share. Repurchase agreements are valued at cost, which approximates fair value.
If the fund determines that the market price for an investment is not readily available or the valuation methods mentioned above do not reflect an investment’s fair value, such investment is valued as determined in good faith by the Board of Directors or its delegate, in accordance with policies and procedures adopted by the Board of Directors. In its determination of fair value, the fund may review several factors including, but not limited to, market information regarding the specific investment or comparable investments and correlation with other investment types, futures indices or general market indicators. Circumstances that may cause the fund to use these procedures to value an investment include, but are not limited to: an investment has been declared in default or is distressed; trading in a security has been suspended during the trading day or a security is not actively trading on its principal exchange; prices received from a regular pricing source are deemed unreliable; or there is a foreign market holiday and no trading occurred.
The fund monitors for significant events occurring after the close of an investment’s primary exchange but before the fund’s net asset value per share is determined. Significant events may include, but are not limited to: corporate announcements and transactions; governmental action and political unrest that could impact a
18
specific investment or an investment sector; or armed conflicts, natural disasters and similar events that could affect investments in a specific country or region. The fund also monitors for significant fluctuations between domestic and foreign markets, as evidenced by the U.S. market or such other indicators that the Board of Directors, or its delegate, deems appropriate. If significant fluctuations in foreign markets are identified, the fund may apply a model-derived factor to the closing price of equity securities traded on foreign securities exchanges. The factor is based on observable market data as provided by an independent pricing service.
Security Transactions — Security transactions are accounted for as of the trade date. Net realized gains and losses are determined on the identified cost basis, which is also used for federal income tax purposes. Certain countries impose taxes on realized gains on the sale of securities registered in their country. The fund records the foreign tax expense, if any, on an accrual basis. The foreign tax expense on realized gains and unrealized appreciation reduces the net realized gain (loss) on investment transactions and net unrealized appreciation (depreciation) on investments, respectively.
Investment Income — Dividend income less foreign taxes withheld, if any, is recorded as of the ex-dividend date. Distributions received on securities that represent a return of capital or long-term capital gain are recorded as a reduction of cost of investments and/or as a realized gain. The fund may estimate the components of distributions received that may be considered nontaxable distributions or long-term capital gain distributions for income tax purposes. Interest income is recorded on the accrual basis and includes accretion of discounts and amortization of premiums.
Foreign Currency Translations — All assets and liabilities initially expressed in foreign currencies are translated into U.S. dollars at prevailing exchange rates at period end. The fund may enter into spot foreign currency exchange contracts to facilitate transactions denominated in a foreign currency. Purchases and sales of investment securities, dividend and interest income, spot foreign currency exchange contracts, and expenses are translated at the rates of exchange prevailing on the respective dates of such transactions. Net realized and unrealized foreign currency exchange gains or losses related to investment securities are a component of net realized gain (loss) on investment transactions and change in net unrealized appreciation (depreciation) on investments, respectively.
Repurchase Agreements — The fund may enter into repurchase agreements with institutions that American Century Investment Management, Inc. (ACIM) (the investment advisor) has determined are creditworthy pursuant to criteria adopted by the Board of Directors. The fund requires that the collateral, represented by securities, received in a repurchase transaction be transferred to the custodian in a manner sufficient to enable the fund to obtain those securities in the event of a default under the repurchase agreement. ACIM monitors, on a daily basis, the securities transferred to ensure the value, including accrued interest, of the securities under each repurchase agreement is equal to or greater than amounts owed to the fund under each repurchase agreement.
Joint Trading Account — Pursuant to an Exemptive Order issued by the Securities and Exchange Commission, the fund, along with certain other funds in the American Century Investments family of funds, may transfer uninvested cash balances into a joint trading account. These balances are invested in one or more repurchase agreements that are collateralized by U.S. Treasury or Agency obligations.
Income Tax Status — It is the fund’s policy to distribute substantially all net investment income and net realized gains to shareholders and to otherwise qualify as a regulated investment company under provisions of the Internal Revenue Code. Accordingly, no provision has been made for income taxes. The fund files U.S. federal, state, local and non-U.S. tax returns as applicable. The fund's tax returns are subject to examination by the relevant taxing authority until expiration of the applicable statute of limitations, which is generally three years from the date of filing but can be longer in certain jurisdictions. At this time, management believes there are no uncertain tax positions which, based on their technical merit, would not be sustained upon examination and for which it is reasonably possible that the total amounts of unrecognized tax benefits will significantly change in the next twelve months.
Multiple Class — All shares of the fund represent an equal pro rata interest in the net assets of the class to which such shares belong, and have identical voting, dividend, liquidation and other rights and the same terms and conditions, except for class specific expenses and exclusive rights to vote on matters affecting only individual classes. Income, non-class specific expenses, and realized and unrealized capital gains and losses of the fund are allocated to each class of shares based on their relative net assets.
Distributions to Shareholders — Distributions from net investment income and net realized gains, if any, are generally declared and paid annually. The fund may make distributions on a more frequent basis to comply
19
with the distribution requirements of the Internal Revenue Code, in all events in a manner consistent with provisions of the 1940 Act.
Redemption Fees — The fund may impose a 2.00% redemption fee on shares held less than 60 days. The fee may not be applicable to all classes. The redemption fee is retained by the fund and helps cover transaction costs that long-term investors may bear when the fund sells securities to meet investor redemptions.
Indemnifications — Under the corporation’s organizational documents, its officers and directors are indemnified against certain liabilities arising out of the performance of their duties to the fund. In addition, in the normal course of business, the fund enters into contracts that provide general indemnifications. The maximum exposure under these arrangements is unknown as this would involve future claims that may be made against a fund. The risk of material loss from such claims is considered by management to be remote.
3. Fees and Transactions with Related Parties
Certain officers and directors of the corporation are also officers and/or directors of American Century Companies, Inc. (ACC). The corporation’s investment advisor, ACIM, the corporation's distributor, American Century Investment Services, Inc. (ACIS), and the corporation’s transfer agent, American Century Services, LLC, are wholly owned, directly or indirectly, by ACC.
Management Fees — The corporation has entered into a management agreement with ACIM, under which ACIM provides the fund with investment advisory and management services in exchange for a single, unified management fee (the fee) per class. The agreement provides that all expenses of managing and operating the fund, except distribution and service fees, brokerage expenses, taxes, interest, fees and expenses of the independent directors (including legal counsel fees), and extraordinary expenses, will be paid by ACIM. The fee is computed and accrued daily based on each class’s daily net assets and paid monthly in arrears. The rate of the fee is determined by applying a fee rate calculation formula. This formula takes into account the fund’s assets as well as certain assets, if any, of other clients of the investment advisor outside the American Century Investments family of funds (such as subadvised funds and separate accounts) that have very similar investment teams and investment strategies (strategy assets). The annual management fee schedule ranges from 1.400% to 2.000% for the Investor Class, A Class, C Class and R Class. The annual management fee schedule ranges from 1.200% to 1.800% for the Institutional Class. During the year ended November 30, 2015, the investment advisor voluntarily agreed to waive 0.200% of the funds management fee. The investment advisor expects this waiver to continue until March 31, 2016, and cannot terminate it prior to such date without the approval of the Board of Directors. The total amount of the waiver for each class for the year ended November 30, 2015 was $246,785, $9,430, $33,441, $2,063 and $1,241 for the Investor Class, Institutional Class, A Class, C Class, and R Class, respectively. The effective annual management fee before waiver for each class for the year ended November 30, 2015 was 1.71% for the Investor Class, A Class, C Class and R Class and 1.51% for the Institutional Class. The effective annual management fee after waiver for each class for the year ended November 30, 2015 was 1.51% for the Investor Class, A Class, C Class and R Class and 1.31% for the Institutional Class.
Distribution and Service Fees — The Board of Directors has adopted a separate Master Distribution and Individual Shareholder Services Plan for each of the A Class, C Class and R Class (collectively the plans), pursuant to Rule 12b-1 of the 1940 Act. The plans provide that the A Class will pay ACIS an annual distribution and service fee of 0.25%. The plans provide that the C Class will pay ACIS an annual distribution and service fee of 1.00%, of which 0.25% is paid for individual shareholder services and 0.75% is paid for distribution services. The plans provide that the R Class will pay ACIS an annual distribution and service fee of 0.50%. The fees are computed and accrued daily based on each class’s daily net assets and paid monthly in arrears. The fees are used to pay financial intermediaries for distribution and individual shareholder services. Fees incurred under the plans during the year ended November 30, 2015 are detailed in the Statement of Operations.
Directors' Fees and Expenses — The Board of Directors is responsible for overseeing the investment advisor’s management and operations of the fund. The directors receive detailed information about the fund and its investment advisor regularly throughout the year, and meet at least quarterly with management of the investment advisor to review reports about fund operations. The fund’s officers do not receive compensation from the fund.
20
4. Investment Transactions
Purchases and sales of investment securities, excluding short-term investments, for the year ended November 30, 2015 were $222,395,960 and $219,851,043, respectively.
5. Capital Share Transactions
Transactions in shares of the fund were as follows:
Year ended November 30, 2015 | Year ended November 30, 2014 | |||||||||
| Shares | Amount | Shares | Amount | |||||||
| Investor Class/Shares Authorized | 110,000,000 | 100,000,000 | ||||||||
| Sold | 2,966,146 | $ | 26,732,584 | 2,685,760 | $ | 25,258,750 | ||||
| Issued in reinvestment of distributions | 628,862 | 5,205,836 | 40,854 | 398,738 | ||||||
| Redeemed | (3,331,759 | ) | (28,971,648 | ) | (3,766,046 | ) | (34,806,024 | ) | ||
| 263,249 | 2,966,772 | (1,039,432 | ) | (9,148,536 | ) | |||||
| Institutional Class/Shares Authorized | 40,000,000 | 10,000,000 | ||||||||
| Sold | 736,174 | 6,598,320 | 262,432 | 2,466,869 | ||||||
| Issued in reinvestment of distributions | 23,676 | 197,551 | 1,325 | 13,066 | ||||||
| Redeemed | (529,250 | ) | (4,527,913 | ) | (99,633 | ) | (949,489 | ) | ||
| 230,600 | 2,267,958 | 164,124 | 1,530,446 | |||||||
| A Class/Shares Authorized | 30,000,000 | 10,000,000 | ||||||||
| Sold | 1,261,101 | 11,178,064 | 1,319,086 | 12,391,569 | ||||||
| Issued in reinvestment of distributions | 79,078 | 652,093 | 2,490 | 24,247 | ||||||
| Redeemed | (800,417 | ) | (7,101,223 | ) | (403,650 | ) | (3,771,629 | ) | ||
| 539,762 | 4,728,934 | 917,926 | 8,644,187 | |||||||
| C Class/Shares Authorized | 20,000,000 | 10,000,000 | ||||||||
| Sold | 92,172 | 824,061 | 50,814 | 476,323 | ||||||
| Issued in reinvestment of distributions | 3,828 | 30,898 | — | — | ||||||
| Redeemed | (9,757 | ) | (83,153 | ) | (16,090 | ) | (145,611 | ) | ||
| 86,243 | 771,806 | 34,724 | 330,712 | |||||||
| R Class/Shares Authorized | 20,000,000 | 10,000,000 | ||||||||
| Sold | 5,465 | 48,213 | 4,899 | 45,517 | ||||||
| Issued in reinvestment of distributions | 3,084 | 25,293 | 96 | 931 | ||||||
| Redeemed | (1,482 | ) | (12,279 | ) | (7,210 | ) | (66,464 | ) | ||
| 7,067 | 61,227 | (2,215 | ) | (20,016 | ) | |||||
| Net increase (decrease) | 1,126,921 | $ | 10,796,697 | 75,127 | $ | 1,336,793 | ||||
6. Fair Value Measurements
The fund’s investments valuation process is based on several considerations and may use multiple inputs to determine the fair value of the investments held by the fund. In conformity with accounting principles generally accepted in the United States of America, the inputs used to determine a valuation are classified into three broad levels.
| • | Level 1 valuation inputs consist of unadjusted quoted prices in an active market for identical investments. |
| • | Level 2 valuation inputs consist of direct or indirect observable market data (including quoted prices for comparable investments, evaluations of subsequent market events, interest rates, prepayment speeds, credit risk, etc.). These inputs also consist of quoted prices for identical investments initially expressed in local currencies that are adjusted through translation into U.S. dollars. |
| • | Level 3 valuation inputs consist of unobservable data (including a fund’s own assumptions). |
21
The level classification is based on the lowest level input that is significant to the fair valuation measurement. The valuation inputs are not necessarily an indication of the risks associated with investing in these securities or other financial instruments. There were no significant transfers between levels during the period.
The following is a summary of the level classifications as of period end. The Schedule of Investments provides additional information on the fund’s portfolio holdings.
| Level 1 | Level 2 | Level 3 | ||||||
| Assets | ||||||||
| Investment Securities | ||||||||
| Common Stocks | $ | 1,534,014 | $ | 152,716,770 | — | |||
| Exchange-Traded Funds | 735,324 | — | — | |||||
| Temporary Cash Investments | 279,217 | 1,891,579 | — | |||||
| $ | 2,548,555 | $ | 154,608,349 | — | ||||
7. Risk Factors
There are certain risks involved in investing in foreign securities. These risks include those resulting from future adverse political, social and economic developments, fluctuations in currency exchange rates, the possible imposition of exchange controls, and other foreign laws or restrictions. Investing in emerging markets may accentuate these risks.
The fund invests in common stocks of small companies. Because of this, the fund may be subject to greater risk and market fluctuations than a fund investing in larger, more established companies.
The fund’s investment process may result in high portfolio turnover, which could mean high transaction costs, affecting both performance and capital gains tax liabilities to investors.
8. Federal Tax Information
On December 22, 2015, the fund declared and paid a per-share distribution from net realized gains to shareholders of record on December 21, 2015 of $0.1436 for the Investor Class, Institutional Class, A Class, C Class and R Class.
On December 22, 2015, the fund declared and paid the following per-share distributions from net investment income to shareholders of record on December 21, 2015:
| Investor Class | Institutional Class | A Class | C Class | R Class |
| $0.0796 | $0.0939 | $0.0617 | $0.0082 | $0.0439 |
The tax character of distributions paid during the years ended November 30, 2015 and November 30, 2014 were as follows:
| 2015 | 2014 | |||||
| Distributions Paid From | ||||||
| Ordinary income | $ | 350,365 | $ | 458,710 | ||
| Long-term capital gains | $ | 5,959,925 | — | |||
The book-basis character of distributions made during the year from net investment income or net realized gains may differ from their ultimate characterization for federal income tax purposes. These differences reflect the differing character of certain income items and net realized gains and losses for financial statement and tax purposes, and may result in reclassification among certain capital accounts on the financial statements.
22
As of November 30, 2015, the federal tax cost of investments and the components of distributable earnings on a tax-basis were as follows:
| Federal tax cost of investments | $ | 137,603,052 | |
| Gross tax appreciation of investments | $ | 22,938,273 | |
| Gross tax depreciation of investments | (3,384,421 | ) | |
| Net tax appreciation (depreciation) of investments | 19,553,852 | ||
Net tax appreciation (depreciation) on translation of assets and liabilities in foreign currencies | (30,322 | ) | |
Net tax appreciation (depreciation) | $ | 19,523,530 | |
| Undistributed ordinary income | $ | 925,642 | |
Accumulated long-term gains | $ | 2,320,868 | |
The difference between book-basis and tax-basis unrealized appreciation (depreciation) is attributable primarily to the realization to ordinary income for tax purposes of unrealized gains on investments in passive foreign investment companies.
23
| Financial Highlights |
| For a Share Outstanding Throughout the Years Ended November 30 (except as noted) | |||||||||||||||||
| Per-Share Data | Ratios and Supplemental Data | ||||||||||||||||
| Income From Investment Operations: | Distributions From: | Ratio to Average Net Assets of: | |||||||||||||||
Net Asset Value, Beginning of Period | Net Investment Income (Loss)(1) | Net Realized and Unrealized Gain (Loss) | Total From Investment Operations | Net Investment Income | Net Realized Gains | Total Distributions | Net Asset Value, End of Period | Total Return(2) | Operating Expenses | Operating Expenses (before expense waiver) | Net Investment Income (Loss) | Net Investment Income (Loss) (before expense waiver) | Portfolio Turnover Rate | Net Assets, End of Period (in thousands) | |||
| Investor Class | |||||||||||||||||
| 2015 | $8.92 | (0.03) | 0.58 | 0.55 | (0.02) | (0.37) | (0.39) | $9.08 | 6.67% | 1.51% | 1.71% | (0.33)% | (0.53)% | 152% | $128,450 | ||
| 2014 | $9.20 | 0.01 | (0.26) | (0.25) | (0.03) | — | (0.03) | $8.92 | (2.77)% | 1.55% | 1.75% | 0.11% | (0.09)% | 128% | $123,835 | ||
| 2013 | $7.14 | —(3) | 2.14 | 2.14 | (0.08) | — | (0.08) | $9.20 | 30.13% | 1.72% | 1.79% | (0.04)% | (0.11)% | 123% | $137,264 | ||
| 2012 | $5.98 | —(3) | 1.16 | 1.16 | — | — | — | $7.14 | 19.40% | 1.87% | 1.87% | (0.04)% | (0.04)% | 127% | $99,445 | ||
| 2011 | $6.29 | (0.01) | (0.27) | (0.28) | (0.03) | — | (0.03) | $5.98 | (4.57)% | 1.83% | 1.83% | (0.17)% | (0.17)% | 146% | $89,708 | ||
| Institutional Class | |||||||||||||||||
| 2015 | $9.02 | (0.01) | 0.58 | 0.57 | (0.04) | (0.37) | (0.41) | $9.18 | 6.82% | 1.31% | 1.51% | (0.13)% | (0.33)% | 152% | $6,685 | ||
| 2014 | $9.29 | 0.03 | (0.27) | (0.24) | (0.03) | — | (0.03) | $9.02 | (2.58)% | 1.35% | 1.55% | 0.31% | 0.11% | 128% | $4,491 | ||
| 2013 | $7.21 | (0.04) | 2.21 | 2.17 | (0.09) | — | (0.09) | $9.29 | 30.38% | 1.52% | 1.59% | 0.16% | 0.09% | 123% | $3,100 | ||
| 2012 | $6.03 | 0.01 | 1.17 | 1.18 | — | — | — | $7.21 | 19.57% | 1.67% | 1.67% | 0.16% | 0.16% | 127% | $45 | ||
| 2011 | $6.34 | —(3) | (0.27) | (0.27) | (0.04) | — | (0.04) | $6.03 | (4.35)% | 1.63% | 1.63% | 0.03% | 0.03% | 146% | $37 | ||
24
| For a Share Outstanding Throughout the Years Ended November 30 (except as noted) | |||||||||||||||||
| Per-Share Data | Ratios and Supplemental Data | ||||||||||||||||
| Income From Investment Operations: | Distributions From: | Ratio to Average Net Assets of: | |||||||||||||||
Net Asset Value, Beginning of Period | Net Investment Income (Loss)(1) | Net Realized and Unrealized Gain (Loss) | Total From Investment Operations | Net Investment Income | Net Realized Gains | Total Distributions | Net Asset Value, End of Period | Total Return(2) | Operating Expenses | Operating Expenses (before expense waiver) | Net Investment Income (Loss) | Net Investment Income (Loss) (before expense waiver) | Portfolio Turnover Rate | Net Assets, End of Period (in thousands) | |||
| A Class | |||||||||||||||||
| 2015 | $8.88 | (0.05) | 0.58 | 0.53 | (0.01) | (0.37) | (0.38) | $9.03 | 6.48% | 1.76% | 1.96% | (0.58)% | (0.78)% | 152% | $19,796 | ||
| 2014 | $9.18 | (0.01) | (0.27) | (0.28) | (0.02) | — | (0.02) | $8.88 | (3.06)% | 1.80% | 2.00% | (0.14)% | (0.34)% | 128% | $14,683 | ||
| 2013 | $7.12 | (0.03) | 2.15 | 2.12 | (0.06) | — | (0.06) | $9.18 | 29.89% | 1.97% | 2.04% | (0.29)% | (0.36)% | 123% | $6,743 | ||
| 2012 | $5.98 | (0.04) | 1.18 | 1.14 | — | — | — | $7.12 | 19.06% | 2.12% | 2.12% | (0.29)% | (0.29)% | 127% | $1,931 | ||
| 2011 | $6.29 | (0.04) | (0.26) | (0.30) | (0.01) | — | (0.01) | $5.98 | (4.81)% | 2.10% | 2.10% | (0.44)% | (0.44)% | 146% | $5,147 | ||
| C Class | |||||||||||||||||
| 2015 | $8.73 | (0.12) | 0.57 | 0.45 | —(3) | (0.37) | (0.37) | $8.81 | 5.59% | 2.51% | 2.71% | (1.33)% | (1.53)% | 152% | $1,479 | ||
| 2014 | $9.07 | (0.08) | (0.26) | (0.34) | — | — | — | $8.73 | (3.75)% | 2.55% | 2.75% | (0.89)% | (1.09)% | 128% | $713 | ||
| 2013 | $7.04 | (0.09) | 2.12 | 2.03 | — | — | — | $9.07 | 29.02% | 2.72% | 2.79% | (1.04)% | (1.11)% | 123% | $425 | ||
| 2012 | $5.95 | (0.06) | 1.15 | 1.09 | — | — | — | $7.04 | 18.15% | 2.87% | 2.87% | (1.04)% | (1.04)% | 127% | $123 | ||
| 2011 | $6.30 | (0.06) | (0.29) | (0.35) | — | — | — | $5.95 | (5.56)% | 2.83% | 2.83% | (1.17)% | (1.17)% | 146% | $103 | ||
| R Class | |||||||||||||||||
| 2015 | $8.85 | (0.07) | 0.57 | 0.50 | (0.01) | (0.37) | (0.38) | $8.97 | 6.09% | 2.01% | 2.21% | (0.83)% | (1.03)% | 152% | $654 | ||
| 2014 | $9.15 | (0.04) | (0.25) | (0.29) | (0.01) | — | (0.01) | $8.85 | (3.15)% | 2.05% | 2.25% | (0.39)% | (0.59)% | 128% | $583 | ||
| 2013 | $7.10 | (0.03) | 2.12 | 2.09 | (0.04) | — | (0.04) | $9.15 | 29.50% | 2.22% | 2.29% | (0.54)% | (0.61)% | 123% | $623 | ||
| 2012 | $5.98 | (0.03) | 1.15 | 1.12 | — | — | — | $7.10 | 18.73% | 2.37% | 2.37% | (0.54)% | (0.54)% | 127% | $109 | ||
| 2011 | $6.30 | (0.04) | (0.28) | (0.32) | — | — | — | $5.98 | (5.08)% | 2.33% | 2.33% | (0.67)% | (0.67)% | 146% | $61 | ||
25
| Notes to Financial Highlights | |
| (1) | Computed using average shares outstanding throughout the period. |
| (2) | Total returns are calculated based on the net asset value of the last business day and do not reflect applicable sales charges, if any. Total returns for periods less than one year are not annualized. |
| (3) | Per-share amount was less than $0.005. |
See Notes to Financial Statements.
26
| Report of Independent Registered Public Accounting Firm |
To the Board of Directors and Shareholders of American Century World Mutual Funds, Inc.:
We have audited the accompanying statement of assets and liabilities, including the schedule of investments, of International Opportunities Fund (the “Fund”), one of the funds constituting American Century World Mutual Funds, Inc., as of November 30, 2015, and the related statement of operations for the year then ended, the statements of changes in net assets for each of the two years in the period then ended, and the financial highlights for each of the periods presented. These financial statements and financial highlights are the responsibility of the Fund’s management. Our responsibility is to express an opinion on these financial statements and financial highlights based on our audits.
We conducted our audits in accordance with the standards of the Public Company Accounting Oversight Board (United States). Those standards require that we plan and perform the audit to obtain reasonable assurance about whether the financial statements and financial highlights are free of material misstatement. The Fund is not required to have, nor were we engaged to perform, an audit of its internal control over financial reporting. Our audits included consideration of internal control over financial reporting as a basis for designing audit procedures that are appropriate in the circumstances, but not for the purpose of expressing an opinion on the effectiveness of the Fund’s internal control over financial reporting. Accordingly, we express no such opinion. An audit also includes examining, on a test basis, evidence supporting the amounts and disclosures in the financial statements, assessing the accounting principles used and significant estimates made by management, as well as evaluating the overall financial statement presentation. Our procedures included confirmation of securities owned as of November 30, 2015, by correspondence with the custodian and brokers; when replies were not received from brokers, we performed other auditing procedures. We believe that our audits provide a reasonable basis for our opinion.
In our opinion, the financial statements and financial highlights referred to above present fairly, in all material respects, the financial position of International Opportunities Fund of American Century World Mutual Funds, Inc. as of November 30, 2015, the results of its operations for the year then ended, the changes in its net assets for each of the two years in the period then ended, and the financial highlights for each of the periods presented, in conformity with accounting principles generally accepted in the United States of America.
DELOITTE & TOUCHE LLP
Kansas City, Missouri
January 19, 2016
27
| Management |
The Board of Directors
The individuals listed below serve as directors of the funds. Each director will continue to serve in this capacity until death, retirement, resignation or removal from office. The board has adopted a mandatory retirement age for directors who are not “interested persons,” as that term is defined in the Investment Company Act (independent directors). Independent directors shall retire by December 31 of the year in which they reach their 75th birthday.
Mr. Thomas is an “interested person” because he currently serves as President and Chief Executive Officer of American Century Companies, Inc. (ACC), the parent company of American Century Investment Management, Inc. (ACIM or the advisor). Mr. Fink is treated as an “interested person” because of his recent employment with ACC and American Century Services, LLC (ACS). The other directors (more than three-fourths of the total number) are independent. They are not employees, directors or officers of, and have no financial interest in, ACC or any of its wholly owned, direct or indirect, subsidiaries, including ACIM, American Century Investment Services, Inc. (ACIS) and ACS, and they do not have any other affiliations, positions or relationships that would cause them to be considered “interested persons” under the Investment Company Act. The directors serve in this capacity for seven (in the case of Mr. Thomas, 15) registered investment companies in the American Century Investments family of funds.
The following table presents additional information about the directors. The mailing address for each director is 4500 Main Street, Kansas City, Missouri 64111.
Name (Year of Birth) | Position(s) Held with Funds | Length of Time Served | Principal Occupation(s) During Past 5 Years | Number of American Century Portfolios Overseen by Director | Other Directorships Held During Past 5 Years |
| Independent Directors | |||||
Thomas A. Brown(1) (1940) | Director | Since 1980 | Managing Member, Associated Investments, LLC (real estate investment company) | 80 | None |
| Andrea C. Hall (1945) | Director | Since 1997 | Retired | 80 | None |
| Jan M. Lewis (1957) | Director | Since 2011 | Retired; President and Chief Executive Officer, Catholic Charities of Northeast Kansas (human services organization) (2006 to 2013) | 80 | None |
| James A. Olson (1942) | Director and Chairman of the Board | Since 2007 (Chairman since 2014) | Member, Plaza Belmont LLC (private equity fund manager) | 80 | Saia, Inc. (2002 to 2012) and EPR Properties (2003 to 2013) |
| M. Jeannine Strandjord (1945) | Director | Since 1994 | Retired | 80 | Euronet Worldwide Inc.; MGP Ingredients, Inc.; Charming Shoppes, Inc. (2006 to 2010); and DST Systems Inc. (1996 to 2012) |
| John R. Whitten (1946) | Director | Since 2008 | Retired | 80 | Rudolph Technologies, Inc. |
28
| Name (Year of Birth) | Position(s) Held with Funds | Length of Time Served | Principal Occupation(s) During Past 5 Years | Number of American Century Portfolios Overseen by Director | Other Directorships Held During Past 5 Years |
| Independent Directors | |||||
| Stephen E. Yates (1948) | Director | Since 2012 | Retired; Executive Vice President, Technology & Operations, KeyCorp. (computer services) (2004 to 2010) | 80 | Applied Industrial Technologies, Inc. (2001 to 2010) |
| Interested Directors | |||||
| Barry Fink (1955) | Director | Since 2012 | Retired; Executive Vice President, ACC (September 2007 to February 2013); President, ACS (October 2007 to February 2013); Chief Operating Officer, ACC (September 2007 to November 2012) | 80 | None |
| Jonathan S. Thomas (1963) | Director and President | Since 2007 | President and Chief Executive Officer, ACC (March 2007 to present). Also serves as Chief Executive Officer, ACS; Executive Vice President, ACIM; Director, ACC, ACIM and other ACC subsidiaries | 125 | BioMed Valley Discoveries, Inc. |
(1) Thomas A. Brown retired as Director of the Board effective December 31, 2015.
The Statement of Additional Information has additional information about the fund's directors and is available without charge, upon request, by calling 1-800-345-2021.
29
Officers
The following table presents certain information about the executive officers of the funds. Each officer serves as an officer for each of the 15 investment companies in the American Century family of funds, unless otherwise noted. No officer is compensated for his or her service as an officer of the funds. The listed officers are interested persons of the funds and are appointed or re-appointed on an annual basis. The mailing address for each officer listed below is 4500 Main Street, Kansas City, Missouri 64111.
Name (Year of Birth) | Offices with the Funds | Principal Occupation(s) During the Past Five Years |
| Jonathan S. Thomas (1963) | Director and President since 2007 | President and Chief Executive Officer, ACC (March 2007 to present). Also serves as Chief Executive Officer, ACS; Executive Vice President, ACIM; Director, ACC, ACIM and other ACC subsidiaries |
| Amy D. Shelton (1964) | Chief Compliance Officer and Vice President since 2014 | Chief Compliance Officer, American Century funds, (March 2014 to present); Chief Compliance Officer, ACIM (February 2014 to present); Chief Compliance Officer, ACIS (October 2009 to present); Vice President, Client Interactions and Marketing, ACIS (February 2013 to January 2014); Director, Client Interactions and Marketing, ACIS (June 2007 to January 2013). Also serves as Vice President, ACIS |
| Charles A. Etherington (1957) | General Counsel since 2007 and Senior Vice President since 2006 | Attorney, ACC (February 1994 to present); Vice President, ACC (November 2005 to present); General Counsel, ACC (March 2007 to present). Also serves as General Counsel, ACIM, ACS, ACIS and other ACC subsidiaries; and Senior Vice President, ACIM and ACS |
| C. Jean Wade (1964) | Vice President, Treasurer and Chief Financial Officer since 2012 | Vice President, ACS (February 2000 to present) |
| Robert J. Leach (1966) | Vice President since 2006 and Assistant Treasurer since 2012 | Vice President, ACS (February 2000 to present) |
| David H. Reinmiller (1963) | Vice President since 2000 | Attorney, ACC (January 1994 to present); Associate General Counsel, ACC (January 2001 to present). Also serves as Vice President, ACIM and ACS |
| Ward D. Stauffer (1960) | Secretary since 2005 | Attorney, ACC (June 2003 to present) |
30
| Approval of Management Agreement |
At a meeting held on June 30, 2015, the Fund’s Board of Directors unanimously approved the renewal of the management agreement pursuant to which American Century Investment Management, Inc. (the “Advisor”) acts as the investment advisor for the Fund. Under Section 15(c) of the Investment Company Act, contracts for investment advisory services are required to be reviewed, evaluated, and approved by a majority of a fund’s directors (the “Directors”), including a majority of the independent Directors, each year.
Prior to its consideration of the renewal of the management agreement, the Directors requested and reviewed extensive data and information compiled by the Advisor and certain independent providers of evaluation data concerning the Fund and the services provided to the Fund by the Advisor. This review was in addition to the oversight and evaluation undertaken by the Board and its committees on a continuous basis and the information received was supplemental to the extensive information that the Board and its committees receive and consider throughout the year.
In connection with its consideration of the renewal of the management agreement, the Board’s review and evaluation of the services provided by the Advisor included, but was not limited to, the following:
| • | the nature, extent, and quality of investment management, shareholder services, and other services provided by the Advisor to the Fund; |
| • | the wide range of other programs and services the Advisor provides to the Fund and its shareholders on a routine and non-routine basis; |
| • | the Fund’s investment performance compared to appropriate benchmarks and/or a peer group of other mutual funds with similar investment objectives and strategies; |
| • | the cost of owning the Fund compared to the cost of owning similar funds; |
| • | the compliance policies, procedures, and regulatory experience of the Fund's service providers; |
| • | financial data showing the cost of services provided to the Fund, the profitability of the Fund to the Advisor, and the overall profitability of the Advisor; |
| • | possible economies of scale associated with the Advisor’s management of the Fund and other accounts under its management; |
| • | data comparing services provided and charges to the Advisor's other investment management clients; |
| • | acquired fund fees and expenses; |
| • | payments by the Fund and the Advisor to financial intermediaries; and |
| • | any collateral benefits derived by the Advisor from the management of the Fund. |
In keeping with their practice, the Directors held two in-person meetings and one telephonic meeting to review and discuss the information provided. The independent Directors also had the benefit of the advice of their independent counsel throughout the process.
Factors Considered
The Directors considered all of the information provided by the Advisor, the independent data providers, and independent counsel in connection with the approval. They determined that the information was sufficient for them to evaluate the management agreement for the Fund. In connection with their review, the Directors did not identify any single factor as being all-important or controlling, and each Director may have attributed different levels of importance to different factors. In deciding to renew the management agreement, the Board based its decision on a number of factors, including the following:
31
Nature, Extent and Quality of Services - Generally. Under the management agreement, the Advisor is responsible for providing or arranging for all services necessary for the operation of the
Fund. The Board noted that under the management agreement, the Advisor provides or arranges at its own expense a wide variety of services including:
| • | constructing and designing the Fund |
| • | portfolio research and security selection |
| • | initial capitalization/funding |
| • | securities trading |
| • | Fund administration |
| • | custody of Fund assets |
| • | daily valuation of the Fund’s portfolio |
| • | shareholder servicing and transfer agency, including shareholder confirmations, recordkeeping, and communications |
| • | legal services (except the independent Directors’ counsel) |
| • | regulatory and portfolio compliance |
| • | financial reporting |
| • | marketing and distribution (except Rule 12b-1 plans) |
The Board noted that many of these services have expanded over time both in terms of quantity and complexity in response to shareholder demands, competition in the industry, changing distribution channels, and the changing regulatory environment.
Investment Management Services. The nature of the investment management services provided to the Fund is quite complex and allows Fund shareholders access to professional money management, instant diversification of their investments within an asset class, the opportunity to easily diversify among asset classes by investing in or exchanging among various American Century Investments funds, and liquidity. In evaluating investment performance, the Board expects the Advisor to manage the Fund in accordance with its investment objectives and approved strategies. Further, the Directors recognize that the Advisor has an obligation to monitor trading activities, and in particular to seek the best execution of fund trades, and to evaluate the use of and payment for research. In providing these services, the Advisor utilizes teams of investment professionals (portfolio managers, analysts, research assistants, and securities traders) who require extensive information technology, research, training, compliance and other systems to conduct their business. The Board, directly and through its Fund Performance Review Committee, regularly reviews investment performance information for the Fund, together with comparative information for appropriate benchmarks and/or peer groups of similarly-managed funds, over different time horizons. The Directors also review detailed performance information during the management agreement approval process. If performance concerns are identified, the Fund receives special reviews until performance improves, during which the Board discusses with the Advisor the reasons for such results (e.g., market conditions, security selection) and any efforts being undertaken to improve performance. The Fund’s performance was above its benchmark for the three-, five-, and ten-year periods and below its benchmark for the one-year period reviewed by the Board. The Board discussed the Fund's performance with the Advisor and was satisfied with the efforts being undertaken by the Advisor. The Board found the investment management services provided by the Advisor to the Fund to be satisfactory and consistent with the management agreement.
Shareholder and Other Services. Under the management agreement, the Advisor provides the Fund with a comprehensive package of transfer agency, shareholder, and other services. The Board, directly and through various committees of the Board, regularly reviews reports and evaluations of such services at its regular meetings. These reports include, but are not limited to, information regarding the operational efficiency and accuracy of the shareholder and transfer agency services provided, staffing levels, shareholder satisfaction (as measured by external as well as internal sources), technology support, new products and services offered to Fund shareholders, securities trading activities, portfolio valuation services, auditing services, and legal and operational compliance activities. The Board particularly noted the Advisor’s continual efforts to maintain
32
effective business continuity plans and to address cybersecurity threats. Certain aspects of shareholder and transfer agency service level efficiency and the quality of securities trading activities are measured by independent third party providers and are presented in comparison to other fund groups not managed by the Advisor. The Board found the services provided by the Advisor to the Fund under the management agreement to be competitive and of high quality.
Costs of Services and Profitability. The Advisor provides detailed information concerning its cost of providing various services to the Fund, its profitability in managing the Fund (pre- and post-distribution), its overall profitability, and its financial condition. The Directors have reviewed with the Advisor the methodology used to prepare this financial information. This information is considered in evaluating the Advisor’s financial condition, its ability to continue to provide services under the management agreement, and the reasonableness of the current management fee. The Board concluded that the Advisor’s profits were reasonable in light of the services provided to the Fund.
Ethics. The Board generally considers the Advisor’s commitment to providing quality services to shareholders and to conducting its business ethically. They noted that the Advisor’s practices generally meet or exceed industry best practices.
Economies of Scale. The Board also reviewed information provided by the Advisor regarding the possible existence of economies of scale in connection with the management of the Fund. The Board concluded that economies of scale are difficult to measure and predict with precision, especially on a fund-by-fund basis. The Board concluded that the Advisor is appropriately sharing economies of scale through its competitive fee structure, offering competitive fees from fund inception, and through reinvestment in its business to provide shareholders additional content and services. The Board also noted that economies of scale are shared with the Fund and its shareholders through management fee breakpoints that serve to reduce the effective management fee as the assets of the Fund grow.
Comparison to Other Funds’ Fees. The management agreement provides that the Fund pays the Advisor a single, all-inclusive (or unified) management fee for providing all services necessary for the management and operation of the Fund, other than brokerage expenses, taxes, interest, extraordinary expenses, and the fees and expenses of the Fund’s independent Directors (including their independent legal counsel) and expenses incurred in connection with the provision of shareholder services and distribution services under a plan adopted pursuant to Rule 12b-1 under the 1940 Act. Under the unified fee structure, the Advisor is responsible for providing all investment advisory, custody, audit, administrative, compliance, recordkeeping, marketing and shareholder services, or arranging and supervising third parties to provide such services. By contrast, most other funds are charged a variety of fees, including an investment advisory fee, a transfer agency fee, an administrative fee, distribution charges, and other expenses. Other than their investment advisory fees and any applicable Rule 12b-1 distribution fees, all other components of the total fees charged by these other funds may be increased without shareholder approval. The Board believes the unified fee structure is a benefit to Fund shareholders because it clearly discloses to shareholders the cost of owning Fund shares, and, since the unified fee cannot be increased without a vote of Fund shareholders, it shifts to the Advisor the risk of increased costs of operating the Fund and provides a direct incentive to minimize administrative inefficiencies. Part of the Board’s analysis of fee levels involves reviewing certain evaluative data compiled by an independent provider comparing the Fund’s unified fee to the total expense ratios of its peers. The unified fee charged to shareholders of the Fund was above the median of the total expense ratios of the Fund’s peer expense universe and was within the range of its peer expense group. The Board concluded that the management fee paid by the Fund to the Advisor under the management agreement is reasonable in light of the services provided to the Fund.
33
Comparison to Fees and Services Provided to Other Clients of the Advisor. The Directors also requested and received information from the Advisor concerning the nature of the services, fees, costs and profitability of its advisory services to advisory clients other than the Fund. They observed that these varying types of client accounts require different services and involve different regulatory and entrepreneurial risks than the management of the Fund. The Board analyzed this information and concluded that the fees charged and services provided to the Fund were reasonable by comparison.
Payments to Intermediaries. The Directors also requested and received a description of payments made to intermediaries by the Fund and the Advisor. These payments include various payments made by the Fund or the Advisor to different types of intermediaries and recordkeepers for distribution and service activities provided for the Fund. The Board reviewed such information and found the payments to be reasonable in scope and purpose.
Collateral or “Fall-Out” Benefits Derived by the Advisor. The Board considered the existence of collateral benefits the Advisor may receive as a result of its relationship with the Fund. They concluded that the Advisor’s primary business is managing mutual funds and it generally does not use fund or shareholder information to generate profits in other lines of business, and therefore does not derive any significant collateral benefits from them. The Board noted that additional assets from other clients may offer the Advisor some benefit from increased leverage with service providers and counterparties. Additionally, the Advisor receives proprietary research from broker-dealers that execute fund portfolio transactions, which the Board concluded is likely to benefit other clients of the Advisor as well as Fund shareholders. The Board also determined that the Advisor is able to provide investment management services to certain clients other than the Fund, at least in part, due to its existing infrastructure built to serve the fund complex. The Board concluded that appropriate allocation methodologies had been employed to assign resources and the cost of those resources to these other clients and, where expressly provided, these other client assets may be included with the assets of the Fund to determine breakpoints in the management fee schedule.
Existing Relationship. The Board also considered whether there was any reason for not continuing the existing arrangement with the Advisor. In this regard, the Board was mindful of the potential disruptions of the Fund’s operations and various risks, uncertainties, and other effects that could occur as a result of a decision not to continue such relationship. In particular, the Board recognized that most shareholders have invested in the Fund on the strength of the Advisor’s industry standing and reputation and in the expectation that the Advisor will have a continuing role in providing advisory services to the Fund.
Conclusion of the Directors. As a result of this process, the Board, including all of the independent Directors, taking into account all of the factors discussed above and the information provided by the Advisor and others in connection with its review and throughout the year, determined that the management fee is fair and reasonable in light of the services provided and that the investment management agreement between the Fund and the Advisor should be renewed.
34
| Additional Information |
Retirement Account Information
As required by law, distributions you receive from certain IRAs are subject to federal income tax withholding, unless you elect not to have withholding apply. Tax will be withheld on the total amount withdrawn even though you may be receiving amounts that are not subject to withholding, such as nondeductible contributions. In such case, excess amounts of withholding could occur. You may adjust your withholding election so that a greater or lesser amount will be withheld.
If you don’t want us to withhold on this amount, you must notify us to not withhold the federal income tax. You may notify us in writing or in certain situations by telephone or through other electronic means. For systematic withdrawals, your withholding election will remain in effect until revoked or changed by filing a new election. You have the right to revoke your election at any time.
Remember, even if you elect not to have income tax withheld, you are liable for paying income tax on the taxable portion of your withdrawal. If you elect not to have income tax withheld or you don’t have enough income tax withheld, you may be responsible for payment of estimated tax. You may incur penalties under the estimated tax rules if your withholding and estimated tax payments are not sufficient. You can reduce or defer the income tax on a distribution by directly or indirectly rolling such distribution over to another IRA or eligible plan. You should consult your tax advisor for additional information.
State tax will be withheld if, at the time of your distribution, your address is within one of the mandatory withholding states and you have federal income tax withheld (or as otherwise required by state law). State taxes will be withheld from your distribution in accordance with the respective state rules.
Distributions you receive from 403(b), 457 and qualified plans are subject to special tax and withholding rules. Your plan administrator or plan sponsor is required to provide you with a special tax notice explaining those rules at the time you request a distribution. If applicable, federal and/or state taxes may be withheld from your distribution amount.
Proxy Voting Policies
A description of the policies that the fund's investment advisor uses in exercising the voting rights associated with the securities purchased and/or held by the fund is available without charge, upon request, by calling 1-800-345-2021. It is also available on the "About Us" page of American Century Investments’ website at americancentury.com and on the Securities and Exchange Commission’s website at sec.gov. Information regarding how the investment advisor voted proxies relating to portfolio securities during the most recent 12-month period ended June 30 is available on the "About Us" page at americancentury.com. It is also available at sec.gov.
Quarterly Portfolio Disclosure
The fund files its complete schedule of portfolio holdings with the Securities and Exchange Commission (SEC) for the first and third quarters of each fiscal year on Form N-Q. The fund’s Forms N-Q are available on the SEC’s website at sec.gov, and may be reviewed and copied at the SEC’s Public Reference Room in Washington, DC. Information on the operation of the Public Reference Room may be obtained by calling 1-800-SEC-0330. The fund also makes its complete schedule of portfolio holdings for the most recent quarter of its fiscal year available on its website at americancentury.com and, upon request, by calling 1-800-345-2021.
35
Other Tax Information
The following information is provided pursuant to provisions of the Internal Revenue Code.
The fund hereby designates up to the maximum amount allowable as qualified dividend income for the fiscal year ended November 30, 2015.
The fund hereby designates $5,959,925, or up to the maximum amount allowable, as long-term capital gain distributions for the fiscal year ended November 30, 2015.
For the fiscal year ended November 30, 2015, the fund intends to pass through to shareholders foreign source income of $1,910,506 and foreign taxes paid of $185,516, or up to the maximum amount allowable, as a foreign tax credit. Foreign source income and foreign tax expense per outstanding share on November 30, 2015 are $0.1104 and $0.0107, respectively.
36
| ||
| Contact Us | americancentury.com | |
| Automated Information Line | 1-800-345-8765 | |
| Investor Services Representative | 1-800-345-2021 or 816-531-5575 | |
| Investors Using Advisors | 1-800-378-9878 | |
| Business, Not-For-Profit, Employer-Sponsored Retirement Plans | 1-800-345-3533 | |
| Banks and Trust Companies, Broker-Dealers, Financial Professionals, Insurance Companies | 1-800-345-6488 | |
| Telecommunications Relay Service for the Deaf | 711 | |
| American Century World Mutual Funds, Inc. | ||
Investment Advisor: American Century Investment Management, Inc. Kansas City, Missouri | ||
| This report and the statements it contains are submitted for the general information of our shareholders. The report is not authorized for distribution to prospective investors unless preceded or accompanied by an effective prospectus. | ||
| ©2016 American Century Proprietary Holdings, Inc. All rights reserved. CL-ANN-87755 1601 | ||
| ANNUAL REPORT | NOVEMBER 30, 2015 |
International Value Fund
| Table of Contents |
| President’s Letter | 2 | |
| Performance | 3 | |
| Portfolio Commentary | ||
| Fund Characteristics | ||
| Shareholder Fee Example | ||
| Schedule of Investments | ||
| Statement of Assets and Liabilities | ||
| Statement of Operations | ||
| Statement of Changes in Net Assets | ||
| Notes to Financial Statements | ||
| Financial Highlights | ||
| Report of Independent Registered Public Accounting Firm | ||
| Management | ||
| Approval of Management Agreement | ||
| Additional Information | ||
Any opinions expressed in this report reflect those of the author as of the date of the report, and do not necessarily represent the opinions of American Century Investments® or any other person in the American Century Investments organization. Any such opinions are subject to change at any time based upon market or other conditions and American Century Investments disclaims any responsibility to update such opinions. These opinions may not be relied upon as investment advice and, because investment decisions made by American Century Investments funds are based on numerous factors, may not be relied upon as an indication of trading intent on behalf of any American Century Investments fund. Security examples are used for representational purposes only and are not intended as recommendations to purchase or sell securities. Performance information for comparative indices and securities is provided to American Century Investments by third party vendors. To the best of American Century Investments’ knowledge, such information is accurate at the time of printing.
| President’s Letter |
| Dear Investor: Thank you for reviewing this annual report for the 12 months ended November 30, 2015. It provides investment performance and portfolio information for the reporting period, plus longer-term historical performance data. Annual reports remain important vehicles for conveying information about fund performance, including market and economic factors that affected returns during the reporting period. For additional, updated investment and market insights, we encourage you to visit our website, americancentury.com. |
| Jonathan Thomas | |
Divergence in Economic Growth and Monetary Policies, Combined With China Turmoil, Triggered Market Volatility
Divergence between the U.S. and the rest of the world—along with China’s struggles, plunging commodity prices, capital market volatility, and risk-off trading—were dominant themes during the reporting period. Global divergence described not only the relatively stronger economic growth enjoyed by the U.S. compared with most of the world, but also the related contrast between the U.S. Federal Reserve’s (the Fed’s) unwinding of monetary stimulus versus the continuation and expansion of stimulus by other major central banks.
In 2014, the Fed ended its latest massive bond-buying program (quantitative easing, QE), leading to expectations that interest rates would soar in 2015. But while QE was halted in the U.S., other major central banks were starting or increasing QE as their economies faltered, particularly the European Central Bank, the Bank of Japan, and the People’s Bank of China. This monetary policy divergence helped fuel increased demand for the U.S. dollar and U.S. dollar-denominated assets, and put downward pressure on commodity prices, most notably crude oil, which declined approximately 40% for the reporting period. Low inflation also prevailed after oil prices plunged amid a supply glut and muted demand for commodities in general, especially as China’s economy slowed. In this environment, the U.S. dollar, U.S. growth stocks, and U.S. municipal bonds generally benefited from “flight to quality” capital flows, while emerging market and commodity-related investments suffered significant declines.
We expect continued economic and monetary policy divergence between the U.S. and non-U.S. economies in 2016, accompanied by further market volatility. This could present both challenges and opportunities for active investment managers. In this environment, we continue to believe in a disciplined, diversified, long-term investment approach, using professionally managed stock and bond portfolios to meet financial goals. We appreciate your continued trust in us in the coming year.
Sincerely,
Jonathan Thomas
President and Chief Executive Officer
American Century Investments
2
| Performance |
| Total Returns as of November 30, 2015 | ||||||
Average Annual Returns | ||||||
Ticker Symbol | 1 year | 5 years | 10 years | Since Inception | Inception Date | |
| A Class | MEQAX | 3/31/97 | ||||
| No sales charge* | -8.77% | 4.88% | 3.49%(1) | 3.70%(1) | ||
| With sales charge* | -13.98% | 3.66% | 2.89%(1) | 3.37%(1) | ||
MSCI EAFE Value Index | — | -7.14% | 4.61% | 2.56% | 5.09% | — |
| Investor Class | ACEVX | -8.56% | 5.13% | — | 2.37% | 4/3/06 |
| Institutional Class | ACVUX | -8.37% | 5.37% | — | 2.57% | 4/3/06 |
| C Class | ACCOX | -9.39% | 4.12% | — | 1.35% | 4/3/06 |
| R Class | ACVRX | -8.95% | 4.62% | — | 1.85% | 4/3/06 |
| R6 Class | ACVDX | -8.22% | — | — | 0.85% | 7/26/13 |
| * | Sales charges include initial sales charges and contingent deferred sales charges (CDSCs), as applicable. A Class shares have a 5.75% maximum initial sales charge and may be subject to a maximum CDSC of 1.00%. C Class shares redeemed within 12 months of purchase are subject to a maximum CDSC of 1.00%. The SEC requires that mutual funds provide performance information net of maximum sales charges in all cases where charges could be applied. |
International Value acquired all the net assets of the Mason Street International Equity Fund on March 31, 2006, pursuant to a plan of reorganization approved by the acquired fund’s shareholders on March 15, 2006. Performance information prior to April 1, 2006, is that of the Mason Street International Equity Fund.
| (1) | Returns would have been lower if a portion of the fees had not been waived. |
Data presented reflect past performance. Past performance is no guarantee of future results. Current performance may be higher or lower than the performance shown. Investment return and principal value will fluctuate, and redemption value may be more or less than original cost. Data assumes reinvestment of dividends and capital gains, and none of the charts reflect the deduction of taxes that a shareholder would pay on fund distributions or the redemption of fund shares. To obtain performance data current to the most recent month end, please call 1-800-345-2021 or visit americancentury.com. For additional information about the fund, please consult the prospectus.
3
| Growth of $10,000 Over 10 Years |
| $10,000 investment made November 30, 2005* |
| Performance for other share classes will vary due to differences in fee structure. |
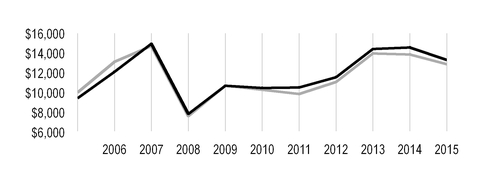
| Value on November 30, 2015 | |
| A Class — $13,291** | |
| MSCI EAFE Value Index — $12,875 | |
* The A Class’s initial investment is $9,425 to reflect the maximum 5.75% initial sales charge.
** Ending value would have been lower if a portion of the fees had not been waived.
Total Annual Fund Operating Expenses | |||||
| Investor Class | Institutional Class | A Class | C Class | R Class | R6 Class |
| 1.31% | 1.11% | 1.56% | 2.31% | 1.81% | 0.96% |
The total annual fund operating expenses shown is as stated in the fund’s prospectus current as of the date of this report. The prospectus may vary from the expense ratio shown elsewhere in this report because it is based on a different time period, includes acquired fund fees and expenses, and, if applicable, does not include fee waivers or expense reimbursements.
Data presented reflect past performance. Past performance is no guarantee of future results. Current performance may be higher or lower than the performance shown. Investment return and principal value will fluctuate, and redemption value may be more or less than original cost. Data assumes reinvestment of dividends and capital gains, and none of the charts reflect the deduction of taxes that a shareholder would pay on fund distributions or the redemption of fund shares. To obtain performance data current to the most recent month end, please call 1-800-345-2021 or visit americancentury.com. For additional information about the fund, please consult the prospectus.
4
| Portfolio Commentary |
Portfolio Managers: Elizabeth Xie, Yulin Long, and Vinod Chandrashekaran
Performance Summary
International Value declined -8.56%* for the fiscal year ended November 30, 2015, compared with the -7.14% return of its benchmark, the MSCI EAFE Value Index. Fund results reflect operating expenses, while benchmark returns do not.
During a period of disappointing global growth, falling oil and commodity prices, and geopolitical instability, most international equity markets declined. Notable benchmark exceptions included Japanese equities, which outperformed due largely to the weak yen and subsequent exporter-led rally.
The fund’s stock selection process incorporates factors of valuation, quality, and sentiment while striving to minimize unintended risks along industries and other risk characteristics. Valuation insights, particularly during the second half of the period, were most difficult, while factors of quality and sentiment proved effective, contributing to fund results. Difficult stock selection among utilities, health care, and financials led to underperformance. Conversely, telecommunication services and industrials holdings, as well as positioning in the materials sector, contributed favorably to relative returns. From a geographical perspective, Pacific region investments, particularly in Japan, weighed on the fund’s results, while stock selection in several European countries, including the U.K. and Denmark, was beneficial.
Japan-Based Holdings Detracted from Performance
Having limited exposure in a number of Japan-based companies that appreciated strongly, due in part to yen weakness versus the U.S. dollar, hurt the fund’s relative returns. An underweight position, relative to the benchmark, to Mizuho Financial Group pressured relative returns as the financial service company gained on strong fee income and bullish company guidance. Not holding the security during the first part of the year was detrimental, but justified given the company’s weak profiles across all measures. Improving factors of sentiment, and to a lesser extent valuation, caused us to add the security in July 2015.
Overweight exposure to Germany-based utility companies RWE and E.ON negatively impacted performance as electricity rates fell to their lowest levels in more than a decade and government regulations called for a transition from nuclear power plants to renewable energy sources by 2022. We exited our investment in RWE on deterioration across quality and sentiment, but maintain exposure to E.ON based on strong factors of valuation and quality as the company moves its focus to renewable energy sources. France-based utility Engie faced similar headwinds, and lowered its profit outlook following delays in reopening two Belgian power plants. We retain the overweight position based on a solid valuation profile. Elsewhere in the fund, a portfolio-only position in U.K.-based Vedanta Resources was detrimental as the metals and mining holding declined steadily over the course of the period amid multi-year lows for metals prices, weakening sales, and overcapacity due to subdued demand. The holding was ultimately exited.
| * | All fund returns referenced in this commentary are for Investor Class shares. Performance for other share classes will vary due to differences in fee structure; when Investor Class performance exceeds that of the fund's benchmark, other share classes may not. See page 3 for returns for all share classes. |
5
Stock Selection in Europe Benefited Results
Security selection in a number of European markets, particularly in the U.K. and Denmark, helped to somewhat limit the fund’s losses. Not owning several U.K.-based metals and mining companies, including Glencore and Anglo American, benefited results as the price of commodities and metals declined steadily over the course of the 12-month period. An overweight position in Direct Line Insurance Group, another U.K.-based holding, also proved beneficial. Shares of Britain’s largest auto insurer reached record highs after the company beat first-half profit expectations and issued a substantial cash dividend to shareholders.
Outside of the U.K., contribution stemmed from a portfolio-only position in Denmark-based Vestas Wind Systems. The wind turbine manufacturer produced several consecutive quarters of increasing earnings and revenues and upgraded its full-year outlook based on growing demand and rising orders for renewable power generation. In telecommunication services, among the best relative and absolute performing sectors in the fund, Nippon Telegraph and Telephone bolstered results. Japan’s largest fixed-line telephone company produced its strongest quarterly profits in nearly seven years and announced a share buy-back program.
A Look Ahead
As we approach 2016, economic activity in most global markets continues to lag that of the U.S. We believe that divergence in monetary policy between the U.S. and much of the rest of the world will continue as the U.S. Federal Reserve (Fed) raises interest rates, while central banks elsewhere maintain aggressive monetary stimulus. Investor sentiment in financial markets is therefore likely to be driven by the pace and magnitude of Fed rate moves, as well as by the trajectory of global economic growth, particularly in China. In such an environment, we believe that our disciplined investment approach is particularly beneficial during periods of likely volatility, and we adhere to our process regardless of the market environment. We believe that this allows us to take advantage of opportunities presented by market inefficiencies.
We believe that stock selection—rather than regional and sector allocation or market timing via the use of cash—is the most efficient means of generating superior risk-adjusted returns. As a result of this approach, the fund’s country and sector weightings are primarily a result of identifying what we believe to be superior individual securities. The fund's largest, but modest, overweights are in consumer discretionary and telecommunication services, while the underweights are led by the utilities and health care sectors. Geographically, the fund’s greatest underweight is in Asia, while exposure to Europe is greater than that of the benchmark.
6
| Fund Characteristics |
| NOVEMBER 30, 2015 | |
Top Ten Holdings | % of net assets |
| AstraZeneca plc | 2.4% |
| HSBC Holdings plc | 2.1% |
| Royal Dutch Shell plc, B Shares | 1.8% |
| Sumitomo Mitsui Financial Group, Inc. | 1.8% |
| AXA SA | 1.8% |
| ING Groep NV CVA | 1.7% |
| Zurich Insurance Group AG | 1.7% |
| Eni SpA | 1.6% |
| Sanofi | 1.6% |
| Allianz SE | 1.5% |
Types of Investments in Portfolio | % of net assets |
| Common Stocks | 98.6% |
| Exchange-Traded Funds | 0.9% |
| Total Equity Exposure | 99.5% |
| Temporary Cash Investments | 0.1% |
| Other Assets and Liabilities | 0.4% |
Investments by Country | % of net assets |
| United Kingdom | 23.8% |
| Japan | 22.9% |
| France | 10.9% |
| Germany | 7.3% |
| Switzerland | 5.7% |
| Australia | 5.2% |
| Italy | 3.8% |
| Hong Kong | 3.7% |
| Sweden | 3.3% |
| Netherlands | 2.8% |
| Spain | 2.3% |
| Other Countries | 6.9% |
| Exchange-Traded Funds* | 0.9% |
| Cash and Equivalents** | 0.5% |
*Category may increase exposure to the countries indicated. The Schedule of Investments provides additional information on the fund's portfolio holdings. | |
| **Includes temporary cash investments and other assets and liabilities. | |
7
| Shareholder Fee Example |
Fund shareholders may incur two types of costs: (1) transaction costs, including sales charges (loads) on purchase payments and redemption/exchange fees; and (2) ongoing costs, including management fees; distribution and service (12b-1) fees; and other fund expenses. This example is intended to help you understand your ongoing costs (in dollars) of investing in your fund and to compare these costs with the ongoing cost of investing in other mutual funds.
The example is based on an investment of $1,000 made at the beginning of the period and held for the entire period from June 1, 2015 to November 30, 2015.
Actual Expenses
The table provides information about actual account values and actual expenses for each class. You may use the information, together with the amount you invested, to estimate the expenses that you paid over the period. First, identify the share class you own. Then simply divide your account value by $1,000 (for example, an $8,600 account value divided by $1,000 = 8.6), then multiply the result by the number under the heading “Expenses Paid During Period” to estimate the expenses you paid on your account during this period.
If you hold Investor Class shares of any American Century Investments fund, or Institutional Class shares of the American Century Diversified Bond Fund, in an American Century Investments account (i.e., not a financial intermediary or retirement plan account), American Century Investments may charge you a $12.50 semiannual account maintenance fee if the value of those shares is less than $10,000. We will redeem shares automatically in one of your accounts to pay the $12.50 fee. In determining your total eligible investment amount, we will include your investments in all personal accounts (including American Century Investments Brokerage accounts) registered under your Social Security number. Personal accounts include individual accounts, joint accounts, UGMA/UTMA accounts, personal trusts, Coverdell Education Savings Accounts and IRAs (including traditional, Roth, Rollover, SEP-, SARSEP- and SIMPLE-IRAs), and certain other retirement accounts. If you have only business, business retirement, employer-sponsored or American Century Investments Brokerage accounts, you are currently not subject to this fee. If you are subject to the Account Maintenance Fee, your account value could be reduced by the fee amount.
Hypothetical Example for Comparison Purposes
The table also provides information about hypothetical account values and hypothetical expenses based on the actual expense ratio of each class of your fund and an assumed rate of return of 5% per year before expenses, which is not the actual return of a fund’s share class. The hypothetical account values and expenses may not be used to estimate the actual ending account balance or expenses you paid for the period. You may use this information to compare the ongoing costs of investing in your fund and other funds. To do so, compare this 5% hypothetical example with the 5% hypothetical examples that appear in the shareholder reports of the other funds.
Please note that the expenses shown in the table are meant to highlight your ongoing costs only and do not reflect any transactional costs, such as sales charges (loads) or redemption/exchange fees. Therefore, the table is useful in comparing ongoing costs only, and will not help you determine the relative total costs of owning different funds. In addition, if these transactional costs were included, your costs would have been higher.
8
| Beginning Account Value 6/1/15 | Ending Account Value 11/30/15 | Expenses Paid During Period(1)6/1/15 - 11/30/15 | Annualized Expense Ratio(1) | |
Actual | ||||
| Investor Class | $1,000 | $896.90 | $6.23 | 1.31% |
| Institutional Class | $1,000 | $898.10 | $5.28 | 1.11% |
| A Class | $1,000 | $896.10 | $7.42 | 1.56% |
| C Class | $1,000 | $893.20 | $10.96 | 2.31% |
| R Class | $1,000 | $895.50 | $8.60 | 1.81% |
| R6 Class | $1,000 | $899.20 | $4.57 | 0.96% |
Hypothetical | ||||
| Investor Class | $1,000 | $1,018.50 | $6.63 | 1.31% |
| Institutional Class | $1,000 | $1,019.50 | $5.62 | 1.11% |
| A Class | $1,000 | $1,017.25 | $7.89 | 1.56% |
| C Class | $1,000 | $1,013.49 | $11.66 | 2.31% |
| R Class | $1,000 | $1,015.99 | $9.15 | 1.81% |
| R6 Class | $1,000 | $1,020.26 | $4.86 | 0.96% |
| (1) | Expenses are equal to the class's annualized expense ratio listed in the table above, multiplied by the average account value over the period, multiplied by 183, the number of days in the most recent fiscal half-year, divided by 365, to reflect the one-half year period. |
9
| Schedule of Investments |
NOVEMBER 30, 2015
| Shares | Value | ||||
| COMMON STOCKS — 98.6% | |||||
| Australia — 5.2% | |||||
| Australia & New Zealand Banking Group Ltd. | 33,082 | $ | 649,561 | ||
| BHP Billiton Ltd. | 16,552 | 216,545 | |||
| CIMIC Group Ltd. | 27,785 | 503,358 | |||
| Commonwealth Bank of Australia | 569 | 32,685 | |||
| Downer EDI Ltd. | 48,311 | 126,128 | |||
| National Australia Bank Ltd. | 5,630 | 119,665 | |||
Qantas Airways Ltd.(1) | 214,079 | 563,552 | |||
| Telstra Corp. Ltd. | 122,567 | 475,113 | |||
| Westpac Banking Corp. | 44,168 | 1,026,945 | |||
| Woodside Petroleum Ltd. | 17,553 | 382,226 | |||
| 4,095,778 | |||||
| Belgium — 1.3% | |||||
| bpost SA | 7,555 | 183,591 | |||
| KBC Groep NV | 13,755 | 821,106 | |||
| 1,004,697 | |||||
| China — 0.1% | |||||
| China Merchants Bank Co. Ltd., H Shares | 48,000 | 112,796 | |||
| Denmark — 1.1% | |||||
| Vestas Wind Systems A/S | 13,157 | 858,432 | |||
| Finland — 0.3% | |||||
| UPM-Kymmene Oyj | 12,363 | 236,033 | |||
| France — 10.9% | |||||
| AXA SA | 51,527 | 1,394,230 | |||
| BNP Paribas SA | 11,275 | 668,416 | |||
| Engie SA | 41,244 | 718,574 | |||
| Eutelsat Communications SA | 7,668 | 228,871 | |||
| Faurecia | 13,551 | 508,694 | |||
Innate Pharma SA(1) | 5,386 | 78,928 | |||
| Metropole Television SA | 6,483 | 120,416 | |||
Nexans SA(1) | 2,954 | 112,982 | |||
| Orange SA | 50,731 | 876,893 | |||
Peugeot SA(1) | 49,767 | 889,150 | |||
| Sanofi | 14,308 | 1,275,582 | |||
| Societe Generale SA | 3,303 | 157,669 | |||
| Suez Environnement Co. | 13,058 | 247,577 | |||
| Technicolor SA | 40,013 | 300,073 | |||
| Total SA | 13,678 | 679,220 | |||
UbiSoft Entertainment SA(1) | 3,963 | 110,958 | |||
| Valeo SA | 1,320 | 204,385 | |||
| 8,572,618 | |||||
| Germany — 7.3% | |||||
| Allianz SE | 6,814 | 1,206,968 | |||
10
| Shares | Value | ||||
| Aurubis AG | 6,505 | $ | 405,292 | ||
| BASF SE | 2,678 | 221,658 | |||
| Deutsche Bank AG | 17,438 | 447,798 | |||
| Deutsche Telekom AG | 45,977 | 847,911 | |||
Dialog Semiconductor plc(1) | 1,063 | 39,691 | |||
| E.ON SE | 48,922 | 464,990 | |||
| Grand City Properties SA | 5,306 | 109,318 | |||
| Hannover Rueck SE | 2,747 | 321,434 | |||
| Metro AG | 19,527 | 651,122 | |||
| ProSiebenSat.1 Media SE | 13,771 | 723,123 | |||
| Siemens AG | 3,047 | 315,943 | |||
| 5,755,248 | |||||
| Hong Kong — 3.7% | |||||
| BOC Hong Kong Holdings Ltd. | 27,500 | 84,237 | |||
| CK Hutchison Holdings Ltd. | 26,000 | 341,035 | |||
| Dah Sing Banking Group Ltd. | 61,200 | 119,346 | |||
| Hang Seng Bank Ltd. | 54,400 | 985,780 | |||
| Link REIT | 129,500 | 787,511 | |||
| New World Development Co. Ltd. | 326,000 | 324,594 | |||
WH Group Ltd.(1) | 528,500 | 272,653 | |||
| 2,915,156 | |||||
| Israel — 1.4% | |||||
| Bank Hapoalim BM | 153,528 | 793,902 | |||
| Bezeq The Israeli Telecommunication Corp. Ltd. | 36,778 | 79,226 | |||
| Mizrahi Tefahot Bank Ltd. | 5,089 | 60,215 | |||
| Teva Pharmaceutical Industries Ltd. | 2,553 | 156,350 | |||
| 1,089,693 | |||||
| Italy — 3.8% | |||||
| A2A SpA | 219,798 | 308,863 | |||
| Enel SpA | 91,153 | 401,988 | |||
| Eni SpA | 78,614 | 1,280,779 | |||
| EXOR SpA | 6,534 | 292,846 | |||
Fiat Chrysler Automobiles NV(1) | 29,922 | 427,422 | |||
| UnipolSai SpA | 99,099 | 255,685 | |||
| 2,967,583 | |||||
| Japan — 22.9% | |||||
| Bank of Yokohama Ltd. (The) | 31,000 | 182,449 | |||
| Canon, Inc. | 36,500 | 1,101,820 | |||
| Central Japan Railway Co. | 4,800 | 857,254 | |||
| Chiba Bank Ltd. (The) | 24,000 | 165,524 | |||
| Daiichikosho Co., Ltd. | 1,400 | 45,890 | |||
| Daiwa Securities Group, Inc. | 13,000 | 84,093 | |||
| Fuji Heavy Industries Ltd. | 5,800 | 239,727 | |||
| FUJIFILM Holdings Corp. | 15,000 | 607,555 | |||
| Honda Motor Co., Ltd. | 7,600 | 247,077 | |||
| Iida Group Holdings Co. Ltd. | 19,700 | 383,118 | |||
| ITOCHU Corp. | 36,600 | 446,574 | |||
11
| Shares | Value | ||||
| Jafco Co. Ltd. | 6,800 | $ | 270,122 | ||
| Japan Airlines Co. Ltd. | 22,500 | 769,496 | |||
| JX Holdings, Inc. | 231,300 | 938,165 | |||
| Kawasaki Kisen Kaisha Ltd. | 193,000 | 396,661 | |||
| KDDI Corp. | 13,300 | 330,393 | |||
| Medipal Holdings Corp. | 17,700 | 310,145 | |||
| Mitsubishi Chemical Holdings Corp. | 107,800 | 706,436 | |||
| Mitsubishi Motors Corp. | 5,900 | 52,530 | |||
| Mitsubishi UFJ Financial Group, Inc. | 164,300 | 1,054,403 | |||
| Mitsui Mining & Smelting Co. Ltd. | 91,000 | 175,199 | |||
| Mixi, Inc. | 3,500 | 143,298 | |||
| Mizuho Financial Group, Inc. | 20,700 | 41,787 | |||
| MS&AD Insurance Group Holdings, Inc. | 21,900 | 617,683 | |||
| Nippon Telegraph & Telephone Corp. | 24,600 | 912,258 | |||
| NTT Data Corp. | 4,900 | 238,830 | |||
| NTT DoCoMo, Inc. | 16,500 | 312,039 | |||
| OKUMA Corp. | 5,000 | 45,451 | |||
| ORIX Corp. | 21,600 | 311,717 | |||
| Panasonic Corp. | 27,700 | 314,466 | |||
| Sankyu, Inc. | 48,000 | 239,415 | |||
| SBI Holdings, Inc. | 39,300 | 445,358 | |||
| Seven Bank Ltd. | 113,500 | 496,966 | |||
| Sony Corp. | 30,100 | 776,829 | |||
| Sumitomo Chemical Co. Ltd. | 115,000 | 659,545 | |||
| Sumitomo Mitsui Financial Group, Inc. | 36,800 | 1,404,140 | |||
| Takeda Pharmaceutical Co., Ltd. | 3,600 | 174,970 | |||
| Teijin Ltd. | 107,000 | 380,715 | |||
Tokyo Electric Power Co., Inc.(1) | 104,500 | 640,073 | |||
| Toyota Motor Corp. | 8,900 | 553,593 | |||
| 18,073,764 | |||||
| Netherlands — 2.8% | |||||
| Boskalis Westminster NV | 1,010 | 44,947 | |||
| ING Groep NV CVA | 95,844 | 1,315,925 | |||
| Koninklijke Ahold NV | 39,931 | 868,673 | |||
| 2,229,545 | |||||
| New Zealand — 0.2% | |||||
| Meridian Energy Ltd. | 64,205 | 98,050 | |||
| Mighty River Power Ltd. | 45,212 | 86,306 | |||
| 184,356 | |||||
| Norway — 1.0% | |||||
| TGS Nopec Geophysical Co. ASA | 41,758 | 802,914 | |||
| Portugal — 1.0% | |||||
| EDP - Energias de Portugal SA | 230,110 | 767,052 | |||
| Singapore — 0.5% | |||||
| Oversea-Chinese Banking Corp. Ltd. | 37,700 | 231,724 | |||
| United Overseas Bank Ltd. | 9,300 | 127,842 | |||
| 359,566 | |||||
12
| Shares | Value | ||||
| Spain — 2.3% | |||||
| Banco Santander SA | 100,893 | $ | 550,901 | ||
| Endesa SA | 25,089 | 519,022 | |||
| Mapfre SA | 57,509 | 157,797 | |||
| Telefonica SA | 46,233 | 570,294 | |||
| 1,798,014 | |||||
| Sweden — 3.3% | |||||
| Axfood AB | 3,798 | 68,977 | |||
| Boliden AB | 3,691 | 67,838 | |||
| Electrolux AB | 3,022 | 88,701 | |||
| Investment AB Kinnevik, B Shares | 7,581 | 233,207 | |||
| Investor AB, B Shares | 21,135 | 805,484 | |||
| Peab AB | 29,279 | 223,576 | |||
| Skanska AB, B Shares | 25,284 | 503,256 | |||
| SKF AB, B Shares | 37,570 | 655,185 | |||
| 2,646,224 | |||||
| Switzerland — 5.7% | |||||
| Nestle SA | 12,562 | 932,214 | |||
| Novartis AG | 2,977 | 254,485 | |||
| Roche Holding AG | 3,070 | 822,069 | |||
| Swiss Reinsurance Co. | 10,872 | 1,036,108 | |||
| Transocean Ltd. | 11,199 | 161,642 | |||
| Zurich Insurance Group AG | 4,982 | 1,311,779 | |||
| 4,518,297 | |||||
| United Kingdom — 23.8% | |||||
| AstraZeneca plc | 27,372 | 1,856,154 | |||
| Aviva plc | 62,478 | 481,311 | |||
| Barclays plc | 48,618 | 163,435 | |||
| Berkeley Group Holdings plc | 8,518 | 411,938 | |||
| BHP Billiton plc | 41,394 | 496,815 | |||
| BP plc | 106,384 | 617,266 | |||
| British Land Co. plc (The) | 18,328 | 230,216 | |||
| BT Group plc | 89,354 | 668,102 | |||
| Centrica plc | 57,977 | 190,443 | |||
| Debenhams plc | 86,227 | 108,568 | |||
| Direct Line Insurance Group plc | 117,603 | 729,387 | |||
| GlaxoSmithKline plc | 24,171 | 493,455 | |||
| Go-Ahead Group plc | 5,367 | 212,427 | |||
| HSBC Holdings plc | 211,006 | 1,682,729 | |||
| Imperial Tobacco Group plc | 10,059 | 543,577 | |||
| Investec plc | 93,397 | 794,758 | |||
| Land Securities Group plc | 18,156 | 336,614 | |||
| Legal & General Group plc | 202,135 | 826,542 | |||
| Lloyds Banking Group plc | 615,224 | 676,039 | |||
| Man Group plc | 269,539 | 662,514 | |||
| Marks & Spencer Group plc | 80,073 | 606,004 | |||
| Moneysupermarket.com Group plc | 9,000 | 44,189 | |||
| Petrofac Ltd. | 19,014 | 236,255 | |||
| Rio Tinto plc | 33,656 | 1,119,472 | |||
13
| Shares | Value | ||||
| Royal Dutch Shell plc, B Shares | 57,077 | $ | 1,420,119 | ||
| Royal Mail plc | 77,758 | 569,278 | |||
| Segro plc | 50,649 | 336,558 | |||
| Sky plc | 50,762 | 845,566 | |||
| Standard Chartered plc | 20,360 | 170,861 | |||
Thomas Cook Group plc(1) | 47,394 | 85,585 | |||
| Vodafone Group plc | 130,443 | 440,562 | |||
| WM Morrison Supermarkets plc | 329,703 | 757,262 | |||
| 18,814,001 | |||||
TOTAL COMMON STOCKS (Cost $81,030,214) | 77,801,767 | ||||
| EXCHANGE-TRADED FUNDS — 0.9% | |||||
| iShares MSCI EAFE Value ETF | 7,439 | 359,601 | |||
| iShares MSCI Japan ETF | 26,700 | 330,813 | |||
TOTAL EXCHANGE-TRADED FUNDS (Cost $760,877) | 690,414 | ||||
| TEMPORARY CASH INVESTMENTS — 0.1% | |||||
| Repurchase Agreement, Credit Suisse First Boston, Inc., (collateralized by various U.S. Treasury obligations, 0.625%, 8/31/17, valued at $35,867), in a joint trading account at 0.01%, dated 11/30/15, due 12/1/15 (Delivery value $35,173) | 35,173 | ||||
| State Street Institutional Liquid Reserves Fund, Premier Class | 72,432 | 72,432 | |||
TOTAL TEMPORARY CASH INVESTMENTS (Cost $107,605) | 107,605 | ||||
TOTAL INVESTMENT SECURITIES — 99.6% (Cost $81,898,696) | 78,599,786 | ||||
| OTHER ASSETS AND LIABILITIES — 0.4% | 289,359 | ||||
| TOTAL NET ASSETS — 100.0% | $ | 78,889,145 | |||
| MARKET SECTOR DIVERSIFICATION | ||
| (as a % of net assets) | ||
| Financials | 36.3 | % |
| Consumer Discretionary | 10.5 | % |
| Industrials | 10.1 | % |
| Energy | 8.3 | % |
| Telecommunication Services | 6.9 | % |
| Health Care | 6.8 | % |
| Materials | 5.9 | % |
| Utilities | 5.6 | % |
| Consumer Staples | 5.2 | % |
| Information Technology | 3.0 | % |
| Exchange-Traded Funds | 0.9 | % |
| Cash and Equivalents* | 0.5 | % |
*Includes temporary cash investments and other assets and liabilities.
| NOTES TO SCHEDULE OF INVESTMENTS | ||
| CVA | - | Certificaten Van Aandelen |
| (1) | Non-income producing. |
See Notes to Financial Statements.
14
| Statement of Assets and Liabilities |
| NOVEMBER 30, 2015 | |||
| Assets | |||
| Investment securities, at value (cost of $81,898,696) | $ | 78,599,786 | |
| Foreign currency holdings, at value (cost of $30,793) | 30,809 | ||
| Receivable for capital shares sold | 76,170 | ||
| Dividends and interest receivable | 383,554 | ||
| Other assets | 138 | ||
| 79,090,457 | |||
| Liabilities | |||
| Payable for capital shares redeemed | 120,369 | ||
| Accrued management fees | 74,826 | ||
| Distribution and service fees payable | 6,117 | ||
| 201,312 | |||
| Net Assets | $ | 78,889,145 | |
| Net Assets Consist of: | |||
| Capital (par value and paid-in surplus) | $ | 86,603,877 | |
| Undistributed net investment income | 1,719,770 | ||
| Accumulated net realized loss | (6,127,064 | ) | |
| Net unrealized depreciation | (3,307,438 | ) | |
| $ | 78,889,145 | ||
| Net Assets | Shares Outstanding | Net Asset Value Per Share | ||||
| Investor Class, $0.01 Par Value | $20,945,205 | 2,674,539 | $7.83 | |||
| Institutional Class, $0.01 Par Value | $7,798,461 | 994,840 | $7.84 | |||
| A Class, $0.01 Par Value | $14,838,249 | 1,889,960 | $7.85* | |||
| C Class, $0.01 Par Value | $3,502,191 | 450,436 | $7.78 | |||
| R Class, $0.01 Par Value | $387,306 | 49,636 | $7.80 | |||
| R6 Class, $0.01 Par Value | $31,417,733 | 4,003,978 | $7.85 | |||
*Maximum offering price $8.33 (net asset value divided by 0.9425).
See Notes to Financial Statements.
15
| Statement of Operations |
| YEAR ENDED NOVEMBER 30, 2015 | |||
| Investment Income (Loss) | |||
| Income: | |||
| Dividends (net of foreign taxes withheld of $196,236) | $ | 2,761,910 | |
| Interest | 313 | ||
| 2,762,223 | |||
| Expenses: | |||
| Management fees | 812,902 | ||
| Distribution and service fees: | |||
| A Class | 40,292 | ||
| C Class | 28,363 | ||
| R Class | 2,385 | ||
| Directors' fees and expenses | 2,321 | ||
| Other expenses | 5,676 | ||
| 891,939 | |||
| Net investment income (loss) | 1,870,284 | ||
| Realized and Unrealized Gain (Loss) | |||
| Net realized gain (loss) on: | |||
| Investment transactions (net of foreign tax expenses paid (refunded) of $5,524) | (3,432,774 | ) | |
| Foreign currency transactions | (65,660 | ) | |
| (3,498,434 | ) | ||
| Change in net unrealized appreciation (depreciation) on: | |||
| Investments (includes (increase) decrease in accrued foreign taxes of $8,663) | (6,223,998 | ) | |
| Translation of assets and liabilities in foreign currencies | (3,013 | ) | |
| (6,227,011 | ) | ||
| Net realized and unrealized gain (loss) | (9,725,445 | ) | |
| Net Increase (Decrease) in Net Assets Resulting from Operations | $ | (7,855,161 | ) |
See Notes to Financial Statements.
16
| Statement of Changes in Net Assets |
| YEARS ENDED NOVEMBER 30, 2015 AND NOVEMBER 30, 2014 | ||||||
| Increase (Decrease) in Net Assets | November 30, 2015 | November 30, 2014 | ||||
| Operations | ||||||
| Net investment income (loss) | $ | 1,870,284 | $ | 1,296,535 | ||
| Net realized gain (loss) | (3,498,434 | ) | 1,859,752 | |||
| Change in net unrealized appreciation (depreciation) | (6,227,011 | ) | (2,844,163 | ) | ||
| Net increase (decrease) in net assets resulting from operations | (7,855,161 | ) | 312,124 | |||
| Distributions to Shareholders | ||||||
| From net investment income: | ||||||
| Investor Class | (717,239 | ) | (338,923 | ) | ||
| Institutional Class | (39,683 | ) | (42,388 | ) | ||
| A Class | (541,676 | ) | (303,879 | ) | ||
| C Class | (67,359 | ) | (35,907 | ) | ||
| R Class | (15,630 | ) | (6,548 | ) | ||
| R6 Class | (84,394 | ) | (593 | ) | ||
| Decrease in net assets from distributions | (1,465,981 | ) | (728,238 | ) | ||
| Capital Share Transactions | ||||||
| Net increase (decrease) in net assets from capital share transactions (Note 5) | 49,861,719 | 2,180,068 | ||||
| Redemption Fees | ||||||
| Increase in net assets from redemption fees | 1,235 | 8,266 | ||||
| Net increase (decrease) in net assets | 40,541,812 | 1,772,220 | ||||
| Net Assets | ||||||
| Beginning of period | 38,347,333 | 36,575,113 | ||||
| End of period | $ | 78,889,145 | $ | 38,347,333 | ||
| Undistributed net investment income | $ | 1,719,770 | $ | 1,269,512 | ||
See Notes to Financial Statements.
17
| Notes to Financial Statements |
NOVEMBER 30, 2015
1. Organization
American Century World Mutual Funds, Inc. (the corporation) is registered under the Investment Company Act of 1940, as amended (the 1940 Act), as an open-end management investment company and is organized as a Maryland corporation. International Value Fund (the fund) is one fund in a series issued by the corporation. The fund is diversified as defined under the 1940 Act. The fund's investment objective is to seek long-term capital growth.
The fund offers the Investor Class, the Institutional Class, the A Class, the C Class, the R Class and the R6 Class. The A Class may incur an initial sales charge. The A Class and C Class may be subject to a contingent deferred sales charge. The share classes differ principally in their respective sales charges and distribution and shareholder servicing expenses and arrangements. The Institutional Class and R6 Class shareholders do not require the same level of shareholder and administrative services from American Century Investment Management, Inc. (ACIM) (the investment advisor) as shareholders of other classes. In addition, financial intermediaries do not receive any service, distribution or administrative fees for the R6 Class. As a result, the Institutional Class and R6 Class are charged lower unified management fees.
2. Significant Accounting Policies
The following is a summary of significant accounting policies consistently followed by the fund in preparation of its financial statements. The fund is an investment company and follows accounting and reporting guidance in accordance with accounting principles generally accepted in the United States of America. This may require management to make certain estimates and assumptions at the date of the financial statements. Actual results could differ from these estimates. Management evaluated the impact of events or transactions occurring through the date the financial statements were issued that would merit recognition or disclosure.
Investment Valuations — The fund determines the fair value of its investments and computes its net asset value per share at the close of regular trading (usually 4 p.m. Eastern time) on the New York Stock Exchange (NYSE) on each day the NYSE is open. The Board of Directors has adopted valuation policies and procedures to guide the investment advisor in the fund’s investment valuation process and to provide methodologies for the oversight of the fund’s pricing function.
Equity securities that are listed or traded on a domestic securities exchange are valued at the last reported sales price or at the official closing price as provided by the exchange. Equity securities traded on foreign securities exchanges are generally valued at the closing price of such securities on the exchange where primarily traded or at the close of the NYSE, if that is earlier. If no last sales price is reported, or if local convention or regulation so provides, the mean of the latest bid and asked prices may be used. Securities traded over-the-counter are valued at the mean of the latest bid and asked prices, the last sales price, or the official closing price. Equity securities initially expressed in local currencies are translated into U.S. dollars at the mean of the appropriate currency exchange rate at the close of the NYSE as provided by an independent pricing service.
Open-end management investment companies are valued at the reported net asset value per share. Repurchase agreements are valued at cost, which approximates fair value.
If the fund determines that the market price for an investment is not readily available or the valuation methods mentioned above do not reflect an investment’s fair value, such investment is valued as determined in good faith by the Board of Directors or its delegate, in accordance with policies and procedures adopted by the Board of Directors. In its determination of fair value, the fund may review several factors including, but not limited to, market information regarding the specific investment or comparable investments and correlation with other investment types, futures indices or general market indicators. Circumstances that may cause the fund to use these procedures to value an investment include, but are not limited to: an investment has been declared in default or is distressed; trading in a security has been suspended during the trading day or a security is not actively trading on its principal exchange; prices received from a regular pricing source are deemed unreliable; or there is a foreign market holiday and no trading occurred.
18
The fund monitors for significant events occurring after the close of an investment’s primary exchange but before the fund’s net asset value per share is determined. Significant events may include, but are not limited to: corporate announcements and transactions; governmental action and political unrest that could impact a specific investment or an investment sector; or armed conflicts, natural disasters and similar events that could affect investments in a specific country or region. The fund also monitors for significant fluctuations between domestic and foreign markets, as evidenced by the U.S. market or such other indicators that the Board of Directors, or its delegate, deems appropriate. If significant fluctuations in foreign markets are identified, the fund may apply a model-derived factor to the closing price of equity securities traded on foreign securities exchanges. The factor is based on observable market data as provided by an independent pricing service.
Security Transactions — Security transactions are accounted for as of the trade date. Net realized gains and losses are determined on the identified cost basis, which is also used for federal income tax purposes. Certain countries impose taxes on realized gains on the sale of securities registered in their country. The fund records the foreign tax expense, if any, on an accrual basis. The foreign tax expense on realized gains and unrealized appreciation reduces the net realized gain (loss) on investment transactions and net unrealized appreciation (depreciation) on investments, respectively.
Investment Income — Dividend income less foreign taxes withheld, if any, is recorded as of the ex-dividend date. Distributions received on securities that represent a return of capital or long-term capital gain are recorded as a reduction of cost of investments and/or as a realized gain. The fund may estimate the components of distributions received that may be considered nontaxable distributions or long-term capital gain distributions for income tax purposes. Interest income is recorded on the accrual basis and includes accretion of discounts and amortization of premiums.
Foreign Currency Translations — All assets and liabilities initially expressed in foreign currencies are translated into U.S. dollars at prevailing exchange rates at period end. The fund may enter into spot foreign currency exchange contracts to facilitate transactions denominated in a foreign currency. Purchases and sales of investment securities, dividend and interest income, spot foreign currency exchange contracts, and expenses are translated at the rates of exchange prevailing on the respective dates of such transactions. Net realized and unrealized foreign currency exchange gains or losses related to investment securities are a component of net realized gain (loss) on investment transactions and change in net unrealized appreciation (depreciation) on investments, respectively.
Repurchase Agreements — The fund may enter into repurchase agreements with institutions that ACIM has determined are creditworthy pursuant to criteria adopted by the Board of Directors. The fund requires that the collateral, represented by securities, received in a repurchase transaction be transferred to the custodian in a manner sufficient to enable the fund to obtain those securities in the event of a default under the repurchase agreement. ACIM monitors, on a daily basis, the securities transferred to ensure the value, including accrued interest, of the securities under each repurchase agreement is equal to or greater than amounts owed to the fund under each repurchase agreement.
Joint Trading Account — Pursuant to an Exemptive Order issued by the Securities and Exchange Commission, the fund, along with certain other funds in the American Century Investments family of funds, may transfer uninvested cash balances into a joint trading account. These balances are invested in one or more repurchase agreements that are collateralized by U.S. Treasury or Agency obligations.
Income Tax Status — It is the fund’s policy to distribute substantially all net investment income and net realized gains to shareholders and to otherwise qualify as a regulated investment company under provisions of the Internal Revenue Code. Accordingly, no provision has been made for income taxes. The fund files U.S. federal, state, local and non-U.S. tax returns as applicable. The fund's tax returns are subject to examination by the relevant taxing authority until expiration of the applicable statute of limitations, which is generally three years from the date of filing but can be longer in certain jurisdictions. At this time, management believes there are no uncertain tax positions which, based on their technical merit, would not be sustained upon examination and for which it is reasonably possible that the total amounts of unrecognized tax benefits will significantly change in the next twelve months.
Multiple Class — All shares of the fund represent an equal pro rata interest in the net assets of the class to which such shares belong, and have identical voting, dividend, liquidation and other rights and the same terms and conditions, except for class specific expenses and exclusive rights to vote on matters affecting only individual classes. Income, non-class specific expenses, and realized and unrealized capital gains and losses of the fund are allocated to each class of shares based on their relative net assets.
19
Distributions to Shareholders — Distributions from net investment income and net realized gains, if any, are generally declared and paid annually. The fund may make distributions on a more frequent basis to comply with the distribution requirements of the Internal Revenue Code, in all events in a manner consistent with provisions of the 1940 Act.
Redemption Fees — The fund may impose a 2.00% redemption fee on shares held less than 60 days. The fee may not be applicable to all classes. The redemption fee is retained by the fund and helps cover transaction costs that long-term investors may bear when the fund sells securities to meet investor redemptions.
Indemnifications — Under the corporation’s organizational documents, its officers and directors are indemnified against certain liabilities arising out of the performance of their duties to the fund. In addition, in the normal course of business, the fund enters into contracts that provide general indemnifications. The maximum exposure under these arrangements is unknown as this would involve future claims that may be made against a fund. The risk of material loss from such claims is considered by management to be remote.
3. Fees and Transactions with Related Parties
Certain officers and directors of the corporation are also officers and/or directors of American Century Companies, Inc. (ACC). The corporation’s investment advisor, ACIM, the corporation's distributor, American Century Investment Services, Inc. (ACIS), and the corporation’s transfer agent, American Century Services, LLC, are wholly owned, directly or indirectly, by ACC.
Management Fees — The corporation has entered into a management agreement with ACIM, under which ACIM provides the fund with investment advisory and management services in exchange for a single, unified management fee (the fee) per class. The agreement provides that all expenses of managing and operating the fund, except distribution and service fees, brokerage expenses, taxes, interest, fees and expenses of the independent directors (including legal counsel fees), and extraordinary expenses, will be paid by ACIM. The fee is computed and accrued daily based on each class’s daily net assets and paid monthly in arrears. The rate of the fee is determined by applying a fee rate calculation formula. This formula takes into account the fund’s assets as well as certain assets, if any, of other clients of the investment advisor outside the American Century Investments family of funds (such as subadvised funds and separate accounts) that have very similar investment teams and investment strategies (strategy assets). The strategy assets of the fund also include the assets of NT International Value Fund, one fund in a series issued by the corporation. The annual management fee schedule ranges from 1.100% to 1.300% for the Investor Class, A Class, C Class and R Class. The annual management fee schedule ranges from 0.900% to 1.100% for the Institutional Class and 0.750% to 0.950% for the R6 Class. The effective annual management fee for each class for the year ended November 30, 2015 was 1.30% for the Investor Class, A Class, C Class and R Class, 1.10% for the Institutional Class and 0.95% for the R6 Class.
Distribution and Service Fees — The Board of Directors has adopted a separate Master Distribution and Individual Shareholder Services Plan for each of the A Class, C Class and R Class (collectively the plans), pursuant to Rule 12b-1 of the 1940 Act. The plans provide that the A Class will pay ACIS an annual distribution and service fee of 0.25%. The plans provide that the C Class will pay ACIS an annual distribution and service fee of 1.00%, of which 0.25% is paid for individual shareholder services and 0.75% is paid for distribution services. The plans provide that the R Class will pay ACIS an annual distribution and service fee of 0.50%. The fees are computed and accrued daily based on each class’s daily net assets and paid monthly in arrears. The fees are used to pay financial intermediaries for distribution and individual shareholder services. Fees incurred under the plans during the year ended November 30, 2015 are detailed in the Statement of Operations.
Directors' Fees and Expenses — The Board of Directors is responsible for overseeing the investment advisor’s management and operations of the fund. The directors receive detailed information about the fund and its investment advisor regularly throughout the year, and meet at least quarterly with management of the investment advisor to review reports about fund operations. The fund’s officers do not receive compensation from the fund.
Acquired Fund Fees and Expenses — The fund may invest in mutual funds, exchange-traded funds, and
business development companies (the acquired funds). The fund will indirectly realize its pro rata share of the
fees and expenses of the acquired funds in which it invests. These indirect fees and expenses are not paid
out of the fund's assets but are reflected in the return realized by the fund on its investment in the acquired
funds.
20
4. Investment Transactions
Purchases and sales of investment securities, excluding short-term investments, for the year ended November 30, 2015 were $101,479,733 and $50,893,516, respectively.
5. Capital Share Transactions
Transactions in shares of the fund were as follows:
| Year ended November 30, 2015 | Year ended November 30, 2014 | |||||||||
| Shares | Amount | Shares | Amount | |||||||
| Investor Class/Shares Authorized | 40,000,000 | 20,000,000 | ||||||||
| Sold | 1,194,072 | $ | 10,050,047 | 986,098 | $ | 9,072,889 | ||||
| Issued in reinvestment of distributions | 85,418 | 699,499 | 36,672 | 328,583 | ||||||
| Redeemed | (745,377 | ) | (6,071,118 | ) | (880,533 | ) | (7,966,252 | ) | ||
| 534,113 | 4,678,428 | 142,237 | 1,435,220 | |||||||
| Institutional Class/Shares Authorized | 40,000,000 | 5,000,000 | ||||||||
| Sold | 2,680,128 | 23,061,474 | 201,824 | 1,819,795 | ||||||
| Issued in reinvestment of distributions | 4,791 | 39,683 | 4,736 | 42,388 | ||||||
| Redeemed | (1,747,655 | ) | (14,212,748 | ) | (234,722 | ) | (2,156,272 | ) | ||
| 937,264 | 8,888,409 | (28,162 | ) | (294,089 | ) | |||||
| A Class/Shares Authorized | 30,000,000 | 25,000,000 | ||||||||
| Sold | 591,514 | 5,007,397 | 301,668 | 2,766,714 | ||||||
| Issued in reinvestment of distributions | 65,172 | 536,132 | 33,692 | 303,228 | ||||||
| Redeemed | (493,915 | ) | (4,062,546 | ) | (335,290 | ) | (3,076,292 | ) | ||
| 162,771 | 1,480,983 | 70 | (6,350 | ) | ||||||
| C Class/Shares Authorized | 30,000,000 | 10,000,000 | ||||||||
| Sold | 214,569 | 1,747,541 | 88,235 | 798,160 | ||||||
| Issued in reinvestment of distributions | 8,092 | 66,273 | 3,916 | 35,093 | ||||||
| Redeemed | (32,269 | ) | (262,759 | ) | (56,011 | ) | (523,901 | ) | ||
| 190,392 | 1,551,055 | 36,140 | 309,352 | |||||||
| R Class/Shares Authorized | 20,000,000 | 5,000,000 | ||||||||
| Sold | 14,753 | 122,942 | 22,582 | 204,058 | ||||||
| Issued in reinvestment of distributions | 1,903 | 15,570 | 731 | 6,548 | ||||||
| Redeemed | (20,984 | ) | (160,604 | ) | (2,479 | ) | (21,738 | ) | ||
| (4,328 | ) | (22,092 | ) | 20,834 | 188,868 | |||||
| R6 Class/Shares Authorized | 30,000,000 | 50,000,000 | ||||||||
| Sold | 4,631,460 | 38,859,690 | 150,184 | 1,387,273 | ||||||
| Issued in reinvestment of distributions | 10,298 | 84,394 | 66 | 593 | ||||||
| Redeemed | (700,758 | ) | (5,659,148 | ) | (90,317 | ) | (840,799 | ) | ||
| 3,941,000 | 33,284,936 | 59,933 | 547,067 | |||||||
| Net increase (decrease) | 5,761,212 | $ | 49,861,719 | 231,052 | $ | 2,180,068 | ||||
21
6. Fair Value Measurements
The fund’s investments valuation process is based on several considerations and may use multiple inputs to determine the fair value of the investments held by the fund. In conformity with accounting principles generally accepted in the United States of America, the inputs used to determine a valuation are classified into three broad levels.
| • | Level 1 valuation inputs consist of unadjusted quoted prices in an active market for identical investments. |
| • | Level 2 valuation inputs consist of direct or indirect observable market data (including quoted prices for comparable investments, evaluations of subsequent market events, interest rates, prepayment speeds, credit risk, etc.). These inputs also consist of quoted prices for identical investments initially expressed in local currencies that are adjusted through translation into U.S. dollars. |
| • | Level 3 valuation inputs consist of unobservable data (including a fund’s own assumptions). |
The level classification is based on the lowest level input that is significant to the fair valuation measurement. The valuation inputs are not necessarily an indication of the risks associated with investing in these securities or other financial instruments. There were no significant transfers between levels during the period.
The following is a summary of the level classifications as of period end. The Schedule of Investments provides additional information on the fund’s portfolio holdings.
| Level 1 | Level 2 | Level 3 | ||||||
| Assets | ||||||||
| Investment Securities | ||||||||
| Common Stocks | — | $ | 77,801,767 | — | ||||
| Exchange-Traded Funds | $ | 690,414 | — | — | ||||
| Temporary Cash Investments | 72,432 | 35,173 | — | |||||
| $ | 762,846 | $ | 77,836,940 | — | ||||
7. Risk Factors
There are certain risks involved in investing in foreign securities. These risks include those resulting from future adverse political, social and economic developments, fluctuations in currency exchange rates, the possible imposition of exchange controls, and other foreign laws or restrictions. Investing in emerging markets may accentuate these risks.
8. Federal Tax Information
On December 22, 2015, the fund declared and paid the following per-share distributions from net investment income to shareholders of record on December 21, 2015:
Investor Class | Institutional Class | A Class | C Class | R Class | R6 Class |
| $0.1844 | $0.1963 | $0.1694 | $0.1245 | $0.1544 | $0.2053 |
The tax character of distributions paid during the years ended November 30, 2015 and November 30, 2014 were as follows:
| 2015 | 2014 | |||||
| Distributions Paid From | ||||||
| Ordinary income | $ | 1,465,981 | $ | 728,238 | ||
| Long-term capital gains | — | — | ||||
The book-basis character of distributions made during the year from net investment income or net realized gains may differ from their ultimate characterization for federal income tax purposes. These differences reflect the differing character of certain income items and net realized gains and losses for financial statement and tax purposes, and may result in reclassification among certain capital accounts on the financial statements.
22
As of November 30, 2015, the federal tax cost of investments and the components of distributable earnings on a tax-basis were as follows:
| Federal tax cost of investments | $ | 82,143,111 | |
| Gross tax appreciation of investments | $ | 3,394,929 | |
| Gross tax depreciation of investments | (6,938,254 | ) | |
| Net tax appreciation (depreciation) of investments | (3,543,325 | ) | |
| Net tax appreciation (depreciation) on translation of assets and liabilities in foreign currencies | (8,528 | ) | |
| Net tax appreciation (depreciation) | $ | (3,551,853 | ) |
| Undistributed ordinary income | $ | 1,824,764 | |
| Accumulated short-term capital losses | $ | (5,597,827 | ) |
| Post-October capital loss deferral | $ | (389,816 | ) |
The difference between book-basis and tax-basis unrealized appreciation (depreciation) is attributable primarily to the tax deferral of losses on wash sales.
Accumulated capital losses represent net capital loss carryovers that may be used to offset future realized capital gains for federal income tax purposes. Any unlimited losses will be required to be utilized prior to the losses which carry an expiration date. Future capital loss carryover utilization in any given year may be subject to Internal Revenue Code limitations. Capital loss carryovers of $(2,258,267) expire in 2017 and the remaining losses are unlimited.
Loss deferrals represent certain qualified losses that the fund has elected to treat as having been incurred in the following fiscal year for federal income tax purposes.
23
| Financial Highlights |
For a Share Outstanding Throughout the Years Ended November 30 (except as noted) | |||||||||||||
Per-Share Data | Ratios and Supplemental Data | ||||||||||||
Income From Investment Operations: | Ratio to Average Net Assets of: | ||||||||||||
Net Asset Value, Beginning of Period | Net Investment Income (Loss)(1) | Net Realized and Unrealized Gain (Loss) | Total From Investment Operations | Distributions From Net Investment Income | Net Asset Value, End of Period | Total Return(2) | Operating Expenses | Net Investment Income (Loss) | Portfolio Turnover Rate | Net Assets, End of Period (in thousands) | |||
| Investor Class | |||||||||||||
| 2015 | $8.91 | 0.22 | (0.97) | (0.75) | (0.33) | $7.83 | (8.56)% | 1.31% | 2.70% | 77% | $20,945 | ||
| 2014 | $8.97 | 0.32 | (0.19) | 0.13 | (0.19) | $8.91 | 1.38% | 1.30% | 3.55% | 89% | $19,068 | ||
| 2013 | $7.40 | 0.21 | 1.60 | 1.81 | (0.24) | $8.97 | 24.96% | 1.31% | 2.63% | 83% | $17,920 | ||
| 2012 | $6.84 | 0.20 | 0.49 | 0.69 | (0.13) | $7.40 | 10.25% | 1.31% | 2.95% | 125% | $10,423 | ||
| 2011 | $6.91 | 0.14 | (0.09) | 0.05 | (0.12) | $6.84 | 0.57% | 1.31% | 1.85% | 30% | $9,391 | ||
Institutional Class | |||||||||||||
| 2015 | $8.92 | 0.28 | (1.01) | (0.73) | (0.35) | $7.84 | (8.37)% | 1.11% | 2.90% | 77% | $7,798 | ||
| 2014 | $8.96 | 0.38 | (0.23) | 0.15 | (0.19) | $8.92 | 1.67% | 1.10% | 3.75% | 89% | $513 | ||
| 2013 | $7.39 | 0.23 | 1.59 | 1.82 | (0.25) | $8.96 | 25.24% | 1.11% | 2.83% | 83% | $769 | ||
| 2012 | $6.84 | 0.23 | 0.47 | 0.70 | (0.15) | $7.39 | 10.33% | 1.11% | 3.15% | 125% | $235 | ||
| 2011 | $6.90 | 0.15 | (0.07) | 0.08 | (0.14) | $6.84 | 0.92% | 1.11% | 2.05% | 30% | $244 | ||
A Class | |||||||||||||
| 2015 | $8.93 | 0.20 | (0.97) | (0.77) | (0.31) | $7.85 | (8.77)% | 1.56% | 2.45% | 77% | $14,838 | ||
| 2014 | $9.01 | 0.30 | (0.20) | 0.10 | (0.18) | $8.93 | 1.08% | 1.55% | 3.30% | 89% | $15,423 | ||
| 2013 | $7.43 | 0.20 | 1.60 | 1.80 | (0.22) | $9.01 | 24.67% | 1.56% | 2.38% | 83% | $15,554 | ||
| 2012 | $6.87 | 0.19 | 0.48 | 0.67 | (0.11) | $7.43 | 9.91% | 1.56% | 2.70% | 125% | $14,155 | ||
| 2011 | $6.93 | 0.12 | (0.08) | 0.04 | (0.10) | $6.87 | 0.45% | 1.56% | 1.60% | 30% | $13,981 | ||
24
For a Share Outstanding Throughout the Years Ended November 30 (except as noted) | |||||||||||||
Per-Share Data | Ratios and Supplemental Data | ||||||||||||
Income From Investment Operations: | Ratio to Average Net Assets of: | ||||||||||||
Net Asset Value, Beginning of Period | Net Investment Income (Loss)(1) | Net Realized and Unrealized Gain (Loss) | Total From Investment Operations | Distributions From Net Investment Income | Net Asset Value, End of Period | Total Return(2) | Operating Expenses | Net Investment Income (Loss) | Portfolio Turnover Rate | Net Assets, End of Period (in thousands) | |||
C Class | |||||||||||||
| 2015 | $8.85 | 0.13 | (0.95) | (0.82) | (0.25) | $7.78 | (9.39)% | 2.31% | 1.70% | 77% | $3,502 | ||
| 2014 | $8.97 | 0.23 | (0.19) | 0.04 | (0.16) | $8.85 | 0.41% | 2.30% | 2.55% | 89% | $2,301 | ||
| 2013 | $7.40 | 0.14 | 1.59 | 1.73 | (0.16) | $8.97 | 23.68% | 2.31% | 1.63% | 83% | $2,009 | ||
| 2012 | $6.84 | 0.13 | 0.49 | 0.62 | (0.06) | $7.40 | 9.10% | 2.31% | 1.95% | 125% | $1,412 | ||
| 2011 | $6.90 | 0.06 | (0.08) | (0.02) | (0.04) | $6.84 | (0.31)% | 2.31% | 0.85% | 30% | $1,137 | ||
R Class | |||||||||||||
| 2015 | $8.87 | 0.18 | (0.96) | (0.78) | (0.29) | $7.80 | (8.95)% | 1.81% | 2.20% | 77% | $387 | ||
| 2014 | $8.97 | 0.28 | (0.21) | 0.07 | (0.17) | $8.87 | 0.78% | 1.80% | 3.05% | 89% | $479 | ||
| 2013 | $7.40 | 0.18 | 1.59 | 1.77 | (0.20) | $8.97 | 24.32% | 1.81% | 2.13% | 83% | $297 | ||
| 2012 | $6.84 | 0.17 | 0.49 | 0.66 | (0.10) | $7.40 | 9.67% | 1.81% | 2.45% | 125% | $283 | ||
| 2011 | $6.90 | 0.10 | (0.08) | 0.02 | (0.08) | $6.84 | 0.20% | 1.81% | 1.35% | 30% | $234 | ||
| R6 Class | |||||||||||||
| 2015 | $8.93 | 0.23 | (0.95) | (0.72) | (0.36) | $7.85 | (8.22)% | 0.96% | 3.05% | 77% | $31,418 | ||
| 2014 | $8.96 | 0.33 | (0.17) | 0.16 | (0.19) | $8.93 | 1.83% | 0.95% | 3.90% | 89% | $562 | ||
2013(3) | $8.21 | 0.06 | 0.69 | 0.75 | – | $8.96 | 9.14% | 0.96%(4) | 2.02%(4) | 83%(5) | $27 | ||
25
| Notes to Financial Highlights |
| (1) | Computed using average shares outstanding throughout the period. |
| (2) | Total returns are calculated based on the net asset value of the last business day and do not reflect applicable sales charges, if any. Total returns for periods less than one year are not annualized. |
| (3) | July 26, 2013 (commencement of sale) through November 30, 2013. |
| (4) | Annualized. |
| (5) | Portfolio turnover is calculated at the fund level. Percentage indicated was calculated for the year ended November 30, 2013. |
See Notes to Financial Statements.
26
| Report of Independent Registered Public Accounting Firm |
To the Board of Directors and Shareholders of American Century World Mutual Funds, Inc.:
We have audited the accompanying statement of assets and liabilities, including the schedule of investments, of International Value Fund (the “Fund”), one of the funds constituting American Century World Mutual Funds, Inc., as of November 30, 2015, and the related statement of operations for the year then ended, the statements of changes in net assets for each of the two years in the period then ended, and the financial highlights for each of the periods presented. These financial statements and financial highlights are the responsibility of the Fund’s management. Our responsibility is to express an opinion on these financial statements and financial highlights based on our audits.
We conducted our audits in accordance with the standards of the Public Company Accounting Oversight Board (United States). Those standards require that we plan and perform the audit to obtain reasonable assurance about whether the financial statements and financial highlights are free of material misstatement. The Fund is not required to have, nor were we engaged to perform, an audit of its internal control over financial reporting. Our audits included consideration of internal control over financial reporting as a basis for designing audit procedures that are appropriate in the circumstances, but not for the purpose of expressing an opinion on the effectiveness of the Fund’s internal control over financial reporting. Accordingly, we express no such opinion. An audit also includes examining, on a test basis, evidence supporting the amounts and disclosures in the financial statements, assessing the accounting principles used and significant estimates made by management, as well as evaluating the overall financial statement presentation. Our procedures included confirmation of securities owned as of November 30, 2015, by correspondence with the custodian and brokers; when replies were not received from brokers, we performed other auditing procedures. We believe that our audits provide a reasonable basis for our opinion.
In our opinion, the financial statements and financial highlights referred to above present fairly, in all material respects, the financial position of International Value Fund of American Century World Mutual Funds, Inc. as of November 30, 2015, the results of its operations for the year then ended, the changes in its net assets for each of the two years in the period then ended, and the financial highlights for each of the periods presented, in conformity with accounting principles generally accepted in the United States of America.
DELOITTE & TOUCHE LLP
Kansas City, Missouri
January 19, 2016
27
| Management |
The Board of Directors
The individuals listed below serve as directors of the funds. Each director will continue to serve in this capacity until death, retirement, resignation or removal from office. The board has adopted a mandatory retirement age for directors who are not “interested persons,” as that term is defined in the Investment Company Act (independent directors). Independent directors shall retire by December 31 of the year in which they reach their 75th birthday.
Mr. Thomas is an “interested person” because he currently serves as President and Chief Executive Officer of American Century Companies, Inc. (ACC), the parent company of American Century Investment Management, Inc. (ACIM or the advisor). Mr. Fink is treated as an “interested person” because of his recent employment with ACC and American Century Services, LLC (ACS). The other directors (more than three-fourths of the total number) are independent. They are not employees, directors or officers of, and have no financial interest in, ACC or any of its wholly owned, direct or indirect, subsidiaries, including ACIM, American Century Investment Services, Inc. (ACIS) and ACS, and they do not have any other affiliations, positions or relationships that would cause them to be considered “interested persons” under the Investment Company Act. The directors serve in this capacity for seven (in the case of Mr. Thomas, 15) registered investment companies in the American Century Investments family of funds.
The following table presents additional information about the directors. The mailing address for each director is 4500 Main Street, Kansas City, Missouri 64111.
Name (Year of Birth) | Position(s) Held with Funds | Length of Time Served | Principal Occupation(s) During Past 5 Years | Number of American Century Portfolios Overseen by Director | Other Directorships Held During Past 5 Years |
| Independent Directors | |||||
Thomas A. Brown(1) (1940) | Director | Since 1980 | Managing Member, Associated Investments, LLC (real estate investment company) | 80 | None |
| Andrea C. Hall (1945) | Director | Since 1997 | Retired | 80 | None |
| Jan M. Lewis (1957) | Director | Since 2011 | Retired; President and Chief Executive Officer, Catholic Charities of Northeast Kansas (human services organization) (2006 to 2013) | 80 | None |
| James A. Olson (1942) | Director and Chairman of the Board | Since 2007 (Chairman since 2014) | Member, Plaza Belmont LLC (private equity fund manager) | 80 | Saia, Inc. (2002 to 2012) and EPR Properties (2003 to 2013) |
| M. Jeannine Strandjord (1945) | Director | Since 1994 | Retired | 80 | Euronet Worldwide Inc.; MGP Ingredients, Inc.; Charming Shoppes, Inc. (2006 to 2010); and DST Systems Inc. (1996 to 2012) |
| John R. Whitten (1946) | Director | Since 2008 | Retired | 80 | Rudolph Technologies, Inc. |
28
| Name (Year of Birth) | Position(s) Held with Funds | Length of Time Served | Principal Occupation(s) During Past 5 Years | Number of American Century Portfolios Overseen by Director | Other Directorships Held During Past 5 Years |
| Independent Directors | |||||
| Stephen E. Yates (1948) | Director | Since 2012 | Retired; Executive Vice President, Technology & Operations, KeyCorp. (computer services) (2004 to 2010) | 80 | Applied Industrial Technologies, Inc. (2001 to 2010) |
| Interested Directors | |||||
| Barry Fink (1955) | Director | Since 2012 | Retired; Executive Vice President, ACC (September 2007 to February 2013); President, ACS (October 2007 to February 2013); Chief Operating Officer, ACC (September 2007 to November 2012) | 80 | None |
| Jonathan S. Thomas (1963) | Director and President | Since 2007 | President and Chief Executive Officer, ACC (March 2007 to present). Also serves as Chief Executive Officer, ACS; Executive Vice President, ACIM; Director, ACC, ACIM and other ACC subsidiaries | 125 | BioMed Valley Discoveries, Inc. |
(1) Thomas A. Brown retired as Director of the Board effective December 31, 2015.
The Statement of Additional Information has additional information about the fund's directors and is available without charge, upon request, by calling 1-800-345-2021.
29
Officers
The following table presents certain information about the executive officers of the funds. Each officer serves as an officer for each of the 15 investment companies in the American Century family of funds, unless otherwise noted. No officer is compensated for his or her service as an officer of the funds. The listed officers are interested persons of the funds and are appointed or re-appointed on an annual basis. The mailing address for each officer listed below is 4500 Main Street, Kansas City, Missouri 64111.
Name (Year of Birth) | Offices with the Funds | Principal Occupation(s) During the Past Five Years |
| Jonathan S. Thomas (1963) | Director and President since 2007 | President and Chief Executive Officer, ACC (March 2007 to present). Also serves as Chief Executive Officer, ACS; Executive Vice President, ACIM; Director, ACC, ACIM and other ACC subsidiaries |
| Amy D. Shelton (1964) | Chief Compliance Officer and Vice President since 2014 | Chief Compliance Officer, American Century funds, (March 2014 to present); Chief Compliance Officer, ACIM (February 2014 to present); Chief Compliance Officer, ACIS (October 2009 to present); Vice President, Client Interactions and Marketing, ACIS (February 2013 to January 2014); Director, Client Interactions and Marketing, ACIS (June 2007 to January 2013). Also serves as Vice President, ACIS |
| Charles A. Etherington (1957) | General Counsel since 2007 and Senior Vice President since 2006 | Attorney, ACC (February 1994 to present); Vice President, ACC (November 2005 to present); General Counsel, ACC (March 2007 to present). Also serves as General Counsel, ACIM, ACS, ACIS and other ACC subsidiaries; and Senior Vice President, ACIM and ACS |
| C. Jean Wade (1964) | Vice President, Treasurer and Chief Financial Officer since 2012 | Vice President, ACS (February 2000 to present) |
| Robert J. Leach (1966) | Vice President since 2006 and Assistant Treasurer since 2012 | Vice President, ACS (February 2000 to present) |
| David H. Reinmiller (1963) | Vice President since 2000 | Attorney, ACC (January 1994 to present); Associate General Counsel, ACC (January 2001 to present). Also serves as Vice President, ACIM and ACS |
| Ward D. Stauffer (1960) | Secretary since 2005 | Attorney, ACC (June 2003 to present) |
30
| Approval of Management Agreement |
At a meeting held on June 30, 2015, the Fund’s Board of Directors unanimously approved the renewal of the management agreement pursuant to which American Century Investment Management, Inc. (the “Advisor”) acts as the investment advisor for the Fund. Under Section 15(c) of the Investment Company Act, contracts for investment advisory services are required to be reviewed, evaluated, and approved by a majority of a fund’s directors (the “Directors”), including a majority of the independent Directors, each year.
Prior to its consideration of the renewal of the management agreement, the Directors requested and reviewed extensive data and information compiled by the Advisor and certain independent providers of evaluation data concerning the Fund and the services provided to the Fund by the Advisor. This review was in addition to the oversight and evaluation undertaken by the Board and its committees on a continuous basis and the information received was supplemental to the extensive information that the Board and its committees receive and consider throughout the year.
In connection with its consideration of the renewal of the management agreement, the Board’s review and evaluation of the services provided by the Advisor included, but was not limited to, the following:
| • | the nature, extent, and quality of investment management, shareholder services, and other services provided by the Advisor to the Fund; |
| • | the wide range of other programs and services the Advisor provides to the Fund and its shareholders on a routine and non-routine basis; |
| • | the Fund’s investment performance compared to appropriate benchmarks and/or a peer group of other mutual funds with similar investment objectives and strategies; |
| • | the cost of owning the Fund compared to the cost of owning similar funds; |
| • | the compliance policies, procedures, and regulatory experience of the Fund's service providers; |
| • | financial data showing the cost of services provided to the Fund, the profitability of the Fund to the Advisor, and the overall profitability of the Advisor; |
| • | possible economies of scale associated with the Advisor’s management of the Fund and other accounts under its management; |
| • | data comparing services provided and charges to the Advisor's other investment management clients; |
| • | acquired fund fees and expenses; |
| • | payments by the Fund and the Advisor to financial intermediaries; and |
| • | any collateral benefits derived by the Advisor from the management of the Fund. |
In keeping with their practice, the Directors held two in-person meetings and one telephonic meeting to review and discuss the information provided. The independent Directors also had the benefit of the advice of their independent counsel throughout the process.
Factors Considered
The Directors considered all of the information provided by the Advisor, the independent data providers, and independent counsel in connection with the approval. They determined that the information was sufficient for them to evaluate the management agreement for the Fund. In connection with their review, the Directors did not identify any single factor as being all-important or controlling, and each Director may have attributed different levels of importance to different factors. In deciding to renew the management agreement, the Board based its decision on a number of factors, including the following:
31
Nature, Extent and Quality of Services - Generally. Under the management agreement, the Advisor is responsible for providing or arranging for all services necessary for the operation of the
Fund. The Board noted that under the management agreement, the Advisor provides or arranges at its own expense a wide variety of services including:
| • | constructing and designing the Fund |
| • | portfolio research and security selection |
| • | initial capitalization/funding |
| • | securities trading |
| • | Fund administration |
| • | custody of Fund assets |
| • | daily valuation of the Fund’s portfolio |
| • | shareholder servicing and transfer agency, including shareholder confirmations, recordkeeping, and communications |
| • | legal services (except the independent Directors’ counsel) |
| • | regulatory and portfolio compliance |
| • | financial reporting |
| • | marketing and distribution (except Rule 12b-1 plans) |
The Board noted that many of these services have expanded over time both in terms of quantity and complexity in response to shareholder demands, competition in the industry, changing distribution channels, and the changing regulatory environment.
Investment Management Services. The nature of the investment management services provided to the Fund is quite complex and allows Fund shareholders access to professional money management, instant diversification of their investments within an asset class, the opportunity to easily diversify among asset classes by investing in or exchanging among various American Century Investments funds, and liquidity. In evaluating investment performance, the Board expects the Advisor to manage the Fund in accordance with its investment objectives and approved strategies. Further, the Directors recognize that the Advisor has an obligation to monitor trading activities, and in particular to seek the best execution of fund trades, and to evaluate the use of and payment for research. In providing these services, the Advisor utilizes teams of investment professionals (portfolio managers, analysts, research assistants, and securities traders) who require extensive information technology, research, training, compliance and other systems to conduct their business. The Board, directly and through its Fund Performance Review Committee, regularly reviews investment performance information for the Fund, together with comparative information for appropriate benchmarks and/or peer groups of similarly-managed funds, over different time horizons. The Directors also review detailed performance information during the management agreement approval process. If performance concerns are identified, the Fund receives special reviews until performance improves, during which the Board discusses with the Advisor the reasons for such results (e.g., market conditions, security selection) and any efforts being undertaken to improve performance. The Fund’s performance was above its benchmark for the one-, three-, five-, and ten-year periods reviewed by the Board. The Board found the investment management services provided by the Advisor to the Fund to be satisfactory and consistent with the management agreement.
Shareholder and Other Services. Under the management agreement, the Advisor provides the Fund with a comprehensive package of transfer agency, shareholder, and other services. The Board, directly and through various committees of the Board, regularly reviews reports and evaluations of such services at its regular meetings. These reports include, but are not limited to, information regarding the operational efficiency and accuracy of the shareholder and transfer agency services provided, staffing levels, shareholder satisfaction (as measured by external as well as internal sources), technology support, new products and services offered to Fund shareholders, securities trading activities, portfolio valuation services, auditing services, and legal and operational compliance activities. The Board particularly noted the Advisor’s continual efforts to maintain effective business continuity plans and to address cybersecurity threats. Certain aspects of shareholder and transfer agency service level efficiency and the quality of securities trading
32
activities are measured by independent third party providers and are presented in comparison to other fund groups not managed by the Advisor. The Board found the services provided by the Advisor to the Fund under the management agreement to be competitive and of high quality.
Costs of Services and Profitability. The Advisor provides detailed information concerning its cost of providing various services to the Fund, its profitability in managing the Fund (pre- and post-distribution), its overall profitability, and its financial condition. The Directors have reviewed with the Advisor the methodology used to prepare this financial information. This information is considered in evaluating the Advisor’s financial condition, its ability to continue to provide services under the management agreement, and the reasonableness of the current management fee. The Board concluded that the Advisor’s profits were reasonable in light of the services provided to the Fund.
Ethics. The Board generally considers the Advisor’s commitment to providing quality services to shareholders and to conducting its business ethically. They noted that the Advisor’s practices generally meet or exceed industry best practices.
Economies of Scale. The Board also reviewed information provided by the Advisor regarding the possible existence of economies of scale in connection with the management of the Fund. The Board concluded that economies of scale are difficult to measure and predict with precision, especially on a fund-by-fund basis. The Board concluded that the Advisor is appropriately sharing economies of scale through its competitive fee structure, offering competitive fees from fund inception, and through reinvestment in its business to provide shareholders additional content and services. The Board also noted that economies of scale are shared with the Fund and its shareholders through management fee breakpoints that serve to reduce the effective management fee as the assets of the Fund grow.
Comparison to Other Funds’ Fees. The management agreement provides that the Fund pays the Advisor a single, all-inclusive (or unified) management fee for providing all services necessary for the management and operation of the Fund, other than brokerage expenses, taxes, interest, extraordinary expenses, and the fees and expenses of the Fund’s independent Directors (including their independent legal counsel) and expenses incurred in connection with the provision of shareholder services and distribution services under a plan adopted pursuant to Rule 12b-1 under the 1940 Act. Under the unified fee structure, the Advisor is responsible for providing all investment advisory, custody, audit, administrative, compliance, recordkeeping, marketing and shareholder services, or arranging and supervising third parties to provide such services. By contrast, most other funds are charged a variety of fees, including an investment advisory fee, a transfer agency fee, an administrative fee, distribution charges, and other expenses. Other than their investment advisory fees and any applicable Rule 12b-1 distribution fees, all other components of the total fees charged by these other funds may be increased without shareholder approval. The Board believes the unified fee structure is a benefit to Fund shareholders because it clearly discloses to shareholders the cost of owning Fund shares, and, since the unified fee cannot be increased without a vote of Fund shareholders, it shifts to the Advisor the risk of increased costs of operating the Fund and provides a direct incentive to minimize administrative inefficiencies. Part of the Board’s analysis of fee levels involves reviewing certain evaluative data compiled by an independent provider comparing the Fund’s unified fee to the total expense ratios of its peers. The unified fee charged to shareholders of the Fund was below the median of the total expense ratios of the Fund’s peer expense universe and was within the range of its peer expense group. The Board concluded that the management fee paid by the Fund to the Advisor under the management agreement is reasonable in light of the services provided to the Fund.
33
Comparison to Fees and Services Provided to Other Clients of the Advisor. The Directors also requested and received information from the Advisor concerning the nature of the services, fees, costs and profitability of its advisory services to advisory clients other than the Fund. They observed that these varying types of client accounts require different services and involve different regulatory and entrepreneurial risks than the management of the Fund. The Board analyzed this information and concluded that the fees charged and services provided to the Fund were reasonable by comparison.
Payments to Intermediaries. The Directors also requested and received a description of payments made to intermediaries by the Fund and the Advisor. These payments include various payments made by the Fund or the Advisor to different types of intermediaries and recordkeepers for distribution and service activities provided for the Fund. The Board reviewed such information and found the payments to be reasonable in scope and purpose.
Collateral or “Fall-Out” Benefits Derived by the Advisor. The Board considered the existence of collateral benefits the Advisor may receive as a result of its relationship with the Fund. They concluded that the Advisor’s primary business is managing mutual funds and it generally does not use fund or shareholder information to generate profits in other lines of business, and therefore does not derive any significant collateral benefits from them. The Board noted that additional assets from other clients may offer the Advisor some benefit from increased leverage with service providers and counterparties. Additionally, the Advisor receives proprietary research from broker-dealers that execute fund portfolio transactions, which the Board concluded is likely to benefit other clients of the Advisor as well as Fund shareholders. The Board also determined that the Advisor is able to provide investment management services to certain clients other than the Fund, at least in part, due to its existing infrastructure built to serve the fund complex. The Board concluded that appropriate allocation methodologies had been employed to assign resources and the cost of those resources to these other clients and, where expressly provided, these other client assets may be included with the assets of the Fund to determine breakpoints in the management fee schedule.
Existing Relationship. The Board also considered whether there was any reason for not continuing the existing arrangement with the Advisor. In this regard, the Board was mindful of the potential disruptions of the Fund’s operations and various risks, uncertainties, and other effects that could occur as a result of a decision not to continue such relationship. In particular, the Board recognized that most shareholders have invested in the Fund on the strength of the Advisor’s industry standing and reputation and in the expectation that the Advisor will have a continuing role in providing advisory services to the Fund.
Conclusion of the Directors. As a result of this process, the Board, including all of the independent Directors, taking into account all of the factors discussed above and the information provided by the Advisor and others in connection with its review and throughout the year, determined that the management fee is fair and reasonable in light of the services provided and that the investment management agreement between the Fund and the Advisor should be renewed.
34
| Additional Information |
Retirement Account Information
As required by law, distributions you receive from certain IRAs are subject to federal income tax withholding, unless you elect not to have withholding apply. Tax will be withheld on the total amount withdrawn even though you may be receiving amounts that are not subject to withholding, such as nondeductible contributions. In such case, excess amounts of withholding could occur. You may adjust your withholding election so that a greater or lesser amount will be withheld.
If you don’t want us to withhold on this amount, you must notify us to not withhold the federal income tax. You may notify us in writing or in certain situations by telephone or through other electronic means. For systematic withdrawals, your withholding election will remain in effect until revoked or changed by filing a new election. You have the right to revoke your election at any time.
Remember, even if you elect not to have income tax withheld, you are liable for paying income tax on the taxable portion of your withdrawal. If you elect not to have income tax withheld or you don’t have enough income tax withheld, you may be responsible for payment of estimated tax. You may incur penalties under the estimated tax rules if your withholding and estimated tax payments are not sufficient. You can reduce or defer the income tax on a distribution by directly or indirectly rolling such distribution over to another IRA or eligible plan. You should consult your tax advisor for additional information.
State tax will be withheld if, at the time of your distribution, your address is within one of the mandatory withholding states and you have federal income tax withheld (or as otherwise required by state law). State taxes will be withheld from your distribution in accordance with the respective state rules.
Distributions you receive from 403(b), 457 and qualified plans are subject to special tax and withholding rules. Your plan administrator or plan sponsor is required to provide you with a special tax notice explaining those rules at the time you request a distribution. If applicable, federal and/or state taxes may be withheld from your distribution amount.
Proxy Voting Policies
A description of the policies that the fund's investment advisor uses in exercising the voting rights associated with the securities purchased and/or held by the fund is available without charge, upon request, by calling 1-800-345-2021. It is also available on the "About Us" page of American Century Investments’ website at americancentury.com and on the Securities and Exchange Commission’s website at sec.gov. Information regarding how the investment advisor voted proxies relating to portfolio securities during the most recent 12-month period ended June 30 is available on the "About Us" page at americancentury.com. It is also available at sec.gov.
Quarterly Portfolio Disclosure
The fund files its complete schedule of portfolio holdings with the Securities and Exchange Commission (SEC) for the first and third quarters of each fiscal year on Form N-Q. The fund’s Forms N-Q are available on the SEC’s website at sec.gov, and may be reviewed and copied at the SEC’s Public Reference Room in Washington, DC. Information on the operation of the Public Reference Room may be obtained by calling 1-800-SEC-0330. The fund also makes its complete schedule of portfolio holdings for the most recent quarter of its fiscal year available on its
website at americancentury.com and, upon request, by calling 1-800-345-2021.
35
Other Tax Information
The following information is provided pursuant to provisions of the Internal Revenue Code.
The fund hereby designates up to the maximum amount allowable as qualified dividend income for the fiscal year ended November 30, 2015.
For the fiscal year ended November 30, 2015, the fund intends to pass through to shareholders foreign source income of $2,919,533 and foreign taxes paid of $194,656, or up to the maximum amount allowable, as a foreign tax credit. Foreign source income and foreign tax expense per outstanding share on November 30, 2015 are $0.2901 and $0.0193, respectively.
36
| ||
| Contact Us | americancentury.com | |
| Automated Information Line | 1-800-345-8765 | |
| Investor Services Representative | 1-800-345-2021 or 816-531-5575 | |
| Investors Using Advisors | 1-800-378-9878 | |
| Business, Not-For-Profit, Employer-Sponsored Retirement Plans | 1-800-345-3533 | |
| Banks and Trust Companies, Broker-Dealers, Financial Professionals, Insurance Companies | 1-800-345-6488 | |
| Telecommunications Relay Service for the Deaf | 711 | |
| American Century World Mutual Funds, Inc. | ||
Investment Advisor: American Century Investment Management, Inc. Kansas City, Missouri | ||
| This report and the statements it contains are submitted for the general information of our shareholders. The report is not authorized for distribution to prospective investors unless preceded or accompanied by an effective prospectus. | ||
| ©2016 American Century Proprietary Holdings, Inc. All rights reserved. CL-ANN-87752 1601 | ||
| ANNUAL REPORT | NOVEMBER 30, 2015 |
NT Emerging Markets Fund
| Table of Contents |
| Performance | 2 | |
| Portfolio Commentary | ||
| Fund Characteristics | ||
| Shareholder Fee Example | ||
| Schedule of Investments | ||
| Statement of Assets and Liabilities | ||
| Statement of Operations | ||
| Statement of Changes in Net Assets | ||
| Notes to Financial Statements | ||
| Financial Highlights | ||
| Report of Independent Registered Public Accounting Firm | ||
| Management | ||
| Approval of Management Agreement | ||
| Additional Information | ||
Any opinions expressed in this report reflect those of the author as of the date of the report, and do not necessarily represent the opinions of American Century Investments® or any other person in the American Century Investments organization. Any such opinions are subject to change at any time based upon market or other conditions and American Century Investments disclaims any responsibility to update such opinions. These opinions may not be relied upon as investment advice and, because investment decisions made by American Century Investments funds are based on numerous factors, may not be relied upon as an indication of trading intent on behalf of any American Century Investments fund. Security examples are used for representational purposes only and are not intended as recommendations to purchase or sell securities. Performance information for comparative indices and securities is provided to American Century Investments by third party vendors. To the best of American Century Investments’ knowledge, such information is accurate at the time of printing.
| Performance |
| Total Returns as of November 30, 2015 | |||||
Average Annual Returns | |||||
Ticker Symbol | 1 year | 5 years | Since Inception | Inception Date | |
| Institutional Class | ACLKX | -9.88%(1) | -0.75%(1) | 2.01%(1) | 5/12/06 |
MSCI Emerging Markets Index | — | -16.99% | -3.05% | 1.86% | — |
| R6 Class | ACKDX | -9.74%(1) | — | -0.25%(1) | 7/26/13 |
| (1) | Returns would have been lower if a portion of the management fee had not been waived. |
| Growth of $10,000 Over Life of Class |
| $10,000 investment made May 12, 2006 |
| Performance for other share classes will vary due to differences in fee structure. |
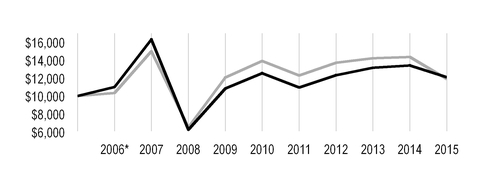
| Value on November 30, 2015 | |
Institutional Class — $12,100** | |
MSCI Emerging Markets Index — $11,922 | |
*From May 12, 2006, the Institutional Class’s inception date. Not annualized.
**Ending value would have been lower if a portion of the management fee had not been waived.
Total Annual Fund Operating Expenses | |
| Institutional Class | R6 Class |
| 1.51% | 1.36% |
The total annual fund operating expenses shown is as stated in the fund’s prospectus current as of the date of this report. The prospectus may vary from the expense ratio shown elsewhere in this report because it is based on a different time period, includes acquired fund fees and expenses, and, if applicable, does not include fee waivers or expense reimbursements.
Data presented reflect past performance. Past performance is no guarantee of future results. Current performance may be higher or lower than the performance shown. Investment return and principal value will fluctuate, and redemption value may be more or less than original cost. Data assumes reinvestment of dividends and capital gains, and none of the charts reflect the deduction of taxes that a shareholder would pay on fund distributions or the redemption of fund shares. To obtain performance data current to the most recent month end, please call 1-800-345-2021 or visit americancentury.com. For additional information about the fund, please consult the prospectus.
2
| Portfolio Commentary |
Portfolio Managers: Patricia Ribeiro and Anthony Han
Performance Summary
NT Emerging Markets declined -9.88%* for the 12 months ended November 30, 2015. The portfolio’s benchmark, the MSCI Emerging Markets Index, declined -16.99% for the same period.
Emerging markets stocks faced significant pressures during the 12-month period. Early on, emerging markets stocks, though volatile, generally advanced, despite ongoing concerns about slowing global growth, declining commodities prices, and a rallying U.S. dollar. Strong performance from China’s stock market largely offset weaker results from Latin America and drove the broad emerging markets benchmark higher. Although China faced lower growth forecasts and subdued economic data, various stimulus measures, including rate cuts, reforms, and liquidity efforts aimed at stabilizing China’s decelerating economy, fueled the broad market gains.
But those positive influences quickly faded as renewed concerns about growth, commodities prices, a strong U.S. dollar, and a potential rate hike from the U.S. Federal Reserve (Fed) worried investors. Evidence emerged that China’s economy was cooling more than previously believed, and in response the People’s Bank of China unexpectedly devalued the nation’s currency, raising uncertainty about China’s central bank policy and fueling a broad sell-off in the global equity markets. Oil and commodities prices dropped to new lows, due in part to falling demand from China. Anxiety about U.S. interest rate policy remained a key theme, persisting even after the Fed decided in September 2015 to leave rates unchanged due to concerns about the state of the global economy. Emerging markets stocks rallied in October as China’s central bank cut interest rates for the sixth time in 12 months, but manufacturing in China fell to a three-year low in November and emerging markets stocks ended the period on a negative note.
The fund outperformed its benchmark during the period, primarily due to stock selection in the consumer discretionary, financials, and energy sectors. An overweight position relative to the benchmark in the consumer discretionary sector and underweight positions in financials and energy also contributed to the fund’s outperformance. Regionally, stock selection in China, Taiwan, and South Africa and an overweight position in China also helped.
Automobile Parts Company was a Top Contributor
Within the top-performing consumer discretionary sector, the automobile components industry was a leading contributor. A portfolio-only position in Hota Industrial Manufacturing, a Taiwan-based automotive transmission system parts manufacturer, was a top contributor. The company experienced strong growth from clients, including Tesla, and reported historically high sales in May 2015. Accumulated January-May sales were up 25% year over year. Analysts responded by revising earnings forecasts higher to incorporate better-than-expected sales and margin outlooks.
In addition, a portfolio-only position in Ctrip.com International, a China-based online travel agency, was a main contributor to performance. After making aggressive investments in 2014, the company reported strong, consensus-beating revenues in early 2015, driven by air revenues and a strong rebound in package tour revenues. As the industry leader in China, we believe Ctrip.com should gain market share as the company leverages the shift from offline travel bookings to online and mobile.
| * | All fund returns referenced in this commentary are for Institutional Class shares. Returns would have been lower if a portion of the management fee had not been waived. Performance for other share classes will vary due to differences in fee structure; when Institutional Class performance exceeds that of the fund's benchmark, other share classes may not. See page 2 for returns for all share classes. |
3
Also in China, an overweight position in Shenzhou International, a textile and fabric manufacturer, was a main contributor. The company's stock advanced on high order visibility and strong relationships with core clients. We believe the shift from casual wear toward sportswear is likely to support the company's profit margins.
Stock Selection in Mexico Was a Main Detractor
Stock selection in Mexico and overweight positions in Peru and Indonesia weighed on relative performance, as did stock selection in the health care sector.
In terms of individual holdings, an overweight position in Itau Unibanco, a Brazil-based bank, detracted from relative performance. The company struggled amid uncertainty surrounding the weakening global economic climate and the negative effects in emerging markets of a rallying U.S. dollar.
An overweight position in Mexico-based Cemex, a building materials provider, was another main detractor. Volatility in currency exchange rates drove down the company’s stock price, as a stronger U.S. dollar weighed on the company’s revenue estimates. Plunging oil prices also pressured Cemex’s business in Mexico, where the government relies on oil for a meaningful portion of its fiscal revenue, which, in turn, finances public spending and infrastructure investments, a key driver of Cemex’s business.
An overweight position in Sinotrans, also was a main detractor. The share price of the China-based logistics company dropped sharply over the three trading days following Sinotrans’s announcement of fiscal 2014 results. The company’s core business missed analyst expectations, and management slightly revised downward its 2015 guidance. Also, neither the chairman nor the CEO attended the analyst briefing, which they had done in the past, adding to investor concerns, and we exited the position.
Outlook
The macroeconomic environment remains volatile as market participants grapple with uneven global growth, China's deceleration, the collapse in oil prices, and persistent uncertainty regarding U.S. monetary policy. Nevertheless, we continue to uncover emerging markets opportunities stemming from changes in discretionary spending patterns as incomes rise. In particular, e-commerce continues to take market share, domestic and international travel is increasing, and demand for health care and beauty products is rising. In addition, we will seek to capture opportunities arising from growing access to banking and insurance, increasing public investment in infrastructure, and improving economic recoveries in the U.S. and Europe.
We remain active in China, as the nation influences much of the growth prospects in the emerging markets. China’s economy is a significant importer of commodities as well as a source of goods, which will now be more competitive as China’s currency weakens. However, as China’s risk premium falls, we believe there are also reasons to be optimistic. Within China, housing, employment, and Purchasing Managers Index (PMI) data have recently trended positively.
Although we believe emerging markets valuations are attractive and currently stand at historically low levels, we also believe earnings growth must return to sustain a broad, long-term rally. We continue to implement our bottom-up investment process, which is uncovering several interesting opportunities in the emerging markets.
4
| Fund Characteristics |
| NOVEMBER 30, 2015 | |
Top Ten Holdings | % of net assets |
| Tencent Holdings Ltd. | 4.4% |
| Taiwan Semiconductor Manufacturing Co. Ltd. | 3.9% |
| Samsung Electronics Co. Ltd. | 3.8% |
| China Mobile Ltd. | 2.4% |
| Industrial & Commercial Bank of China Ltd., H Shares | 2.4% |
| HDFC Bank Ltd. | 2.3% |
| Ping An Insurance Group Co., H Shares | 2.2% |
| Naspers Ltd., N Shares | 1.9% |
| LG Chem Ltd. | 1.8% |
| China Overseas Land & Investment Ltd. | 1.8% |
Types of Investments in Portfolio | % of net assets |
| Common Stocks | 95.2% |
| Exchange-Traded Funds | 1.8% |
| Total Equity Exposure | 97.0% |
| Temporary Cash Investments | 3.0% |
| Other Assets and Liabilities | —* |
| *Category is less than 0.05% of total net assets. | |
Investments by Country | % of net assets |
| China | 25.6% |
| South Korea | 14.0% |
| Taiwan | 12.6% |
| Mexico | 6.4% |
| India | 6.0% |
| South Africa | 5.8% |
| Brazil | 4.2% |
| Thailand | 4.1% |
| Indonesia | 3.3% |
| Russia | 3.2% |
| Turkey | 2.4% |
| Other Countries | 7.6% |
| Exchange-Traded Funds** | 1.8% |
| Cash and Equivalents*** | 3.0% |
**Category may increase exposure to the countries indicated. The Schedule of Investments provides additional information on the fund's portfolio holdings. | |
| ***Includes temporary cash investments and other assets and liabilities. | |
5
| Shareholder Fee Example |
Fund shareholders may incur two types of costs: (1) transaction costs, including sales charges (loads) on purchase payments and redemption/exchange fees; and (2) ongoing costs, including management fees; distribution and service (12b-1) fees; and other fund expenses. This example is intended to help you understand your ongoing costs (in dollars) of investing in your fund and to compare these costs with the ongoing cost of investing in other mutual funds.
The example is based on an investment of $1,000 made at the beginning of the period and held for the entire period from June 1, 2015 to November 30, 2015.
Actual Expenses
The table provides information about actual account values and actual expenses for each class. You may use the information, together with the amount you invested, to estimate the expenses that you paid over the period. First, identify the share class you own. Then simply divide your account value by $1,000 (for example, an $8,600 account value divided by $1,000 = 8.6), then multiply the result by the number under the heading “Expenses Paid During Period” to estimate the expenses you paid on your account during this period.
Hypothetical Example for Comparison Purposes
The table also provides information about hypothetical account values and hypothetical expenses based on the actual expense ratio of each class of your fund and an assumed rate of return of 5% per year before expenses, which is not the actual return of a fund’s share class. The hypothetical account values and expenses may not be used to estimate the actual ending account balance or expenses you paid for the period. You may use this information to compare the ongoing costs of investing in your fund and other funds. To do so, compare this 5% hypothetical example with the 5% hypothetical examples that appear in the shareholder reports of the other funds.
Please note that the expenses shown in the table are meant to highlight your ongoing costs only and do not reflect any transactional costs, such as sales charges (loads) or redemption/exchange fees. Therefore, the table is useful in comparing ongoing costs only, and will not help you determine the relative total costs of owning different funds. In addition, if these transactional costs were included, your costs would have been higher.
| Beginning Account Value 6/1/15 | Ending Account Value 11/30/15 | Expenses Paid During Period(1) 6/1/15 - 11/30/15 | Annualized Expense Ratio(1) | |
Actual | ||||
| Institutional Class (after waiver) | $1,000 | $863.60 | $5.75 | 1.23% |
| Institutional Class (before waiver) | $1,000 | $863.60(2) | $6.91 | 1.48% |
| R6 Class (after waiver) | $1,000 | $864.40 | $5.05 | 1.08% |
| R6 Class (before waiver) | $1,000 | $864.40(2) | $6.22 | 1.33% |
| Hypothetical | ||||
| Institutional Class (after waiver) | $1,000 | $1,018.90 | $6.23 | 1.23% |
| Institutional Class (before waiver) | $1,000 | $1,017.65 | $7.49 | 1.48% |
| R6 Class (after waiver) | $1,000 | $1,019.65 | $5.47 | 1.08% |
| R6 Class (before waiver) | $1,000 | $1,018.40 | $6.73 | 1.33% |
| (1) | Expenses are equal to the class's annualized expense ratio listed in the table above, multiplied by the average account value over the period, multiplied by 183, the number of days in the most recent fiscal half-year, divided by 365, to reflect the one-half year period. |
| (2) | Ending account value assumes the return earned after waiver and would have been lower if a portion of the management fee had not been waived. |
6
| Schedule of Investments |
NOVEMBER 30, 2015
| Shares | Value | ||||
| COMMON STOCKS — 95.2% | |||||
| Brazil — 4.2% | |||||
| BB Seguridade Participacoes SA | 331,800 | $ | 2,227,151 | ||
| BRF SA ADR | 136,679 | 1,946,309 | |||
| Cielo SA | 316,580 | 2,872,867 | |||
| Itau Unibanco Holding SA ADR | 288,545 | 2,042,899 | |||
| Raia Drogasil SA | 362,900 | 3,719,045 | |||
| Ultrapar Participacoes SA | 236,900 | 3,840,976 | |||
| 16,649,247 | |||||
| Chile — 0.7% | |||||
| SACI Falabella | 464,477 | 2,795,751 | |||
| China — 25.6% | |||||
Alibaba Group Holding Ltd. ADR(1) | 47,737 | 4,013,727 | |||
| Beijing Enterprises Water Group Ltd. | 7,512,000 | 5,871,286 | |||
| China Gas Holdings Ltd. | 2,506,000 | 3,561,785 | |||
| China Mobile Ltd. | 829,500 | 9,425,346 | |||
| China Overseas Land & Investment Ltd. | 2,112,000 | 7,000,548 | |||
| China Railway Construction Corp. Ltd., H Shares | 3,025,500 | 4,019,198 | |||
| CNOOC Ltd. | 2,985,000 | 3,303,213 | |||
Ctrip.com International Ltd. ADR(1) | 61,757 | 6,608,617 | |||
| Great Wall Motor Co. Ltd., H Shares | 2,657,500 | 3,259,559 | |||
| Industrial & Commercial Bank of China Ltd., H Shares | 15,579,095 | 9,423,670 | |||
| KWG Property Holding Ltd. | 5,767,000 | 4,120,640 | |||
| PAX Global Technology Ltd. | 2,868,000 | 3,547,340 | |||
| Ping An Insurance Group Co., H Shares | 1,565,000 | 8,568,347 | |||
| Shenzhou International Group Holdings Ltd. | 1,236,000 | 6,488,105 | |||
| Tencent Holdings Ltd. | 871,800 | 17,349,533 | |||
| Xinyi Solar Holdings Ltd. | 11,288,000 | 4,571,426 | |||
| 101,132,340 | |||||
| Egypt — 0.8% | |||||
| Commercial International Bank Egypt S.A.E. | 551,179 | 3,062,086 | |||
| Greece — 0.3% | |||||
| Titan Cement Co. SA | 77,997 | 1,400,931 | |||
| Hungary — 1.2% | |||||
| Richter Gedeon Nyrt | 243,275 | 4,621,750 | |||
| India — 6.0% | |||||
| Bharti Infratel Ltd. | 676,460 | 3,903,181 | |||
| HCL Technologies Ltd. | 296,544 | 3,874,803 | |||
| HDFC Bank Ltd. | 476,872 | 9,163,269 | |||
| ICICI Bank Ltd. ADR | 402,353 | 3,343,553 | |||
| Larsen & Toubro Ltd. | 163,576 | 3,373,364 | |||
| 23,658,170 | |||||
| Indonesia — 3.3% | |||||
| PT Astra International Tbk | 5,485,900 | 2,349,400 | |||
| PT Bank Rakyat Indonesia (Persero) Tbk | 3,887,700 | 3,027,826 | |||
| PT Matahari Department Store Tbk | 2,793,600 | 3,160,090 | |||
| PT Siloam International Hospitals Tbk | 2,985,100 | 2,017,397 | |||
7
| Shares | Value | ||||
| PT Wijaya Karya Persero Tbk | 12,897,500 | $ | 2,624,247 | ||
| 13,178,960 | |||||
| Mexico — 6.4% | |||||
| Alsea SAB de CV | 1,294,203 | 4,615,281 | |||
Cemex SAB de CV ADR(1) | 389,034 | 2,450,914 | |||
| Corp. Inmobiliaria Vesta SAB de CV | 1,631,581 | 2,493,886 | |||
| Fomento Economico Mexicano SAB de CV ADR | 57,814 | 5,572,113 | |||
| Grupo Aeroportuario del Centro Norte Sab de CV | 837,723 | 4,258,285 | |||
| Grupo Mexico SAB de CV | 1,060,374 | 2,314,776 | |||
| Infraestructura Energetica Nova SAB de CV | 845,564 | 3,704,451 | |||
| 25,409,706 | |||||
| Peru — 1.3% | |||||
| Credicorp Ltd. | 47,863 | 5,054,811 | |||
| Philippines — 1.9% | |||||
| Ayala Land, Inc. | 4,790,800 | 3,435,569 | |||
| Universal Robina Corp. | 923,290 | 3,949,482 | |||
| 7,385,051 | |||||
| Poland — 1.0% | |||||
Alior Bank SA(1) | 120,793 | 2,185,665 | |||
| Powszechny Zaklad Ubezpieczen SA | 188,130 | 1,797,013 | |||
| 3,982,678 | |||||
| Qatar — 0.4% | |||||
| Qatar National Bank SAQ | 40,444 | 1,776,806 | |||
| Russia — 3.2% | |||||
| Magnit PJSC GDR | 40,661 | 1,960,673 | |||
| NovaTek OAO GDR | 54,127 | 5,066,287 | |||
X5 Retail Group NV GDR(1) | 245,918 | 5,557,747 | |||
| 12,584,707 | |||||
| South Africa — 5.8% | |||||
| Aspen Pharmacare Holdings Ltd. | 123,107 | 2,662,180 | |||
| Capitec Bank Holdings Ltd. | 111,918 | 4,645,186 | |||
| Discovery Holdings Ltd. | 521,036 | 5,198,826 | |||
| Mr Price Group Ltd. | 197,333 | 2,743,906 | |||
| Naspers Ltd., N Shares | 50,226 | 7,486,787 | |||
| 22,736,885 | |||||
| South Korea — 14.0% | |||||
| Amorepacific Corp. | 15,865 | 5,527,851 | |||
Boryung Medience Co. Ltd.(1) | 90,512 | 1,801,564 | |||
| CJ CheilJedang Corp. | 6,340 | 1,973,637 | |||
CJ Korea Express Co. Ltd.(1) | 27,393 | 4,553,476 | |||
| Coway Co. Ltd. | 30,696 | 2,239,810 | |||
| Hana Tour Service, Inc. | 15,934 | 1,582,324 | |||
| LG Chem Ltd. | 26,175 | 7,187,643 | |||
| LG Household & Health Care Ltd. | 7,010 | 6,101,705 | |||
| Medy-Tox, Inc. | 11,783 | 4,782,186 | |||
| Samsung Electronics Co. Ltd. | 13,431 | 14,891,761 | |||
| Samsung Fire & Marine Insurance Co. Ltd. | 17,038 | 4,509,431 | |||
| 55,151,388 | |||||
| Taiwan — 12.6% | |||||
| Delta Electronics, Inc. | 566,000 | 2,713,651 | |||
| Eclat Textile Co. Ltd. | 424,000 | 5,702,347 | |||
8
| Shares | Value | ||||
| Ginko International Co. Ltd. | 378,000 | $ | 4,817,352 | ||
| Hota Industrial Manufacturing Co. Ltd. | 866,000 | 3,342,810 | |||
| PChome Online, Inc. | 222,810 | 2,095,542 | |||
| President Chain Store Corp. | 901,000 | 5,768,917 | |||
| Taiwan Paiho Ltd. | 1,510,000 | 3,390,815 | |||
| Taiwan Semiconductor Manufacturing Co. Ltd. | 3,659,774 | 15,584,480 | |||
| Tung Thih Electronic Co. Ltd. | 453,000 | 3,975,997 | |||
| Uni-President Enterprises Corp. | 1,544,000 | 2,544,795 | |||
| 49,936,706 | |||||
| Thailand — 4.1% | |||||
| Airports of Thailand PCL | 516,500 | 4,481,906 | |||
| CP ALL PCL | 4,341,200 | 5,692,980 | |||
| Kasikornbank PCL | 417,800 | 1,975,923 | |||
| Siam Cement PCL (The) | 203,650 | 2,545,625 | |||
| Thaicom PCL | 2,155,400 | 1,497,474 | |||
| 16,193,908 | |||||
| Turkey — 2.4% | |||||
| TAV Havalimanlari Holding AS | 492,428 | 3,556,401 | |||
| Tofas Turk Otomobil Fabrikasi AS | 582,884 | 3,847,545 | |||
| Ulker Biskuvi Sanayi AS | 306,687 | 1,980,188 | |||
| 9,384,134 | |||||
TOTAL COMMON STOCKS (Cost $358,469,191) | 376,096,015 | ||||
| EXCHANGE-TRADED FUNDS — 1.8% | |||||
| iShares MSCI Malaysia ETF | 280,568 | 2,974,021 | |||
| iShares MSCI South Korea Capped ETF | 75,701 | 3,998,527 | |||
TOTAL EXCHANGE-TRADED FUNDS (Cost $6,851,237) | 6,972,548 | ||||
| TEMPORARY CASH INVESTMENTS — 3.0% | |||||
| Repurchase Agreement, Credit Suisse First Boston, Inc., (collateralized by various U.S. Treasury obligations, 0.625%, 8/31/17, valued at $3,929,565), in a joint trading account at 0.01%, dated 11/30/15, due 12/1/15 (Delivery value $3,853,586) | 3,853,585 | ||||
| Repurchase Agreement, Fixed Income Clearing Corp., (collateralized by various U.S. Treasury obligations, 3.00%, 11/15/44, valued at $6,556,794), at 0.01%, dated 11/30/15, due 12/1/15 (Delivery value $6,424,002) | 6,424,000 | ||||
| State Street Institutional Liquid Reserves Fund, Premier Class | 1,473,628 | 1,473,628 | |||
TOTAL TEMPORARY CASH INVESTMENTS (Cost $11,751,213) | 11,751,213 | ||||
TOTAL INVESTMENT SECURITIES — 100.0% (Cost $377,071,641) | 394,819,776 | ||||
OTHER ASSETS AND LIABILITIES† | 76,674 | ||||
| TOTAL NET ASSETS — 100.0% | $ | 394,896,450 | |||
9
| MARKET SECTOR DIVERSIFICATION | ||
(as a % of net assets) | ||
| Financials | 21.5 | % |
| Information Technology | 18.2 | % |
| Consumer Discretionary | 16.1 | % |
| Consumer Staples | 13.6 | % |
| Industrials | 6.8 | % |
| Health Care | 4.8 | % |
| Materials | 4.0 | % |
| Telecommunication Services | 3.8 | % |
| Utilities | 3.3 | % |
| Energy | 3.1 | % |
| Exchange-Traded Funds | 1.8 | % |
| Cash and Equivalents* | 3.0 | % |
*Includes temporary cash investments and other assets and liabilities.
| NOTES TO SCHEDULE OF INVESTMENTS | ||
| ADR | - | American Depositary Receipt |
| GDR | - | Global Depositary Receipt |
| PJSC | - | Public Joint Stock Company |
| † | Category is less than 0.05% of total net assets. |
| (1) | Non-income producing. |
See Notes to Financial Statements.
10
| Statement of Assets and Liabilities |
| NOVEMBER 30, 2015 | |||
| Assets | |||
| Investment securities, at value (cost of $377,071,641) | $ | 394,819,776 | |
| Foreign currency holdings, at value (cost of $158,203) | 160,652 | ||
| Receivable for capital shares sold | 423,475 | ||
| Dividends and interest receivable | 17,896 | ||
| Other assets | 10,786 | ||
| 395,432,585 | |||
| Liabilities | |||
| Accrued management fees | 395,385 | ||
| Accrued foreign taxes | 140,750 | ||
| 536,135 | |||
| Net Assets | $ | 394,896,450 | |
| Net Assets Consist of: | |||
| Capital (par value and paid-in surplus) | $ | 387,837,535 | |
| Undistributed net investment income | 1,320,696 | ||
| Accumulated net realized loss | (11,863,863 | ) | |
| Net unrealized appreciation | 17,602,082 | ||
| $ | 394,896,450 | ||
| Net Assets | Shares Outstanding | Net Asset Value Per Share | ||||
| Institutional Class, $0.01 Par Value | $372,801,896 | 38,245,603 | $9.75 | |||
| R6 Class, $0.01 Par Value | $22,094,554 | 2,265,312 | $9.75 | |||
See Notes to Financial Statements.
11
| Statement of Operations |
| YEAR ENDED NOVEMBER 30, 2015 | |||
| Investment Income (Loss) | |||
| Income: | |||
| Dividends (net of foreign taxes withheld of $743,451) | $ | 6,484,304 | |
| Interest | 2,716 | ||
| 6,487,020 | |||
| Expenses: | |||
| Management fees | 5,516,971 | ||
| Directors' fees and expenses | 13,069 | ||
| Other expenses | 9,952 | ||
| 5,539,992 | |||
| Fees waived | (936,380 | ) | |
| 4,603,612 | |||
| Net investment income (loss) | 1,883,408 | ||
| Realized and Unrealized Gain (Loss) | |||
| Net realized gain (loss) on: | |||
| Investment transactions (net of foreign tax expenses paid (refunded) of $56,129) | (5,013,944 | ) | |
| Foreign currency transactions | (506,223 | ) | |
| (5,520,167 | ) | ||
| Change in net unrealized appreciation (depreciation) on: | |||
| Investments (includes (increase) decrease in accrued foreign taxes of $96,363) | (34,256,484 | ) | |
| Translation of assets and liabilities in foreign currencies | (147 | ) | |
| (34,256,631 | ) | ||
| Net realized and unrealized gain (loss) | (39,776,798 | ) | |
| Net Increase (Decrease) in Net Assets Resulting from Operations | $ | (37,893,390 | ) |
See Notes to Financial Statements.
12
| Statement of Changes in Net Assets |
| YEARS ENDED NOVEMBER 30, 2015 AND NOVEMBER 30, 2014 | ||||||
| Increase (Decrease) in Net Assets | November 30, 2015 | November 30, 2014 | ||||
| Operations | ||||||
| Net investment income (loss) | $ | 1,883,408 | $ | 1,351,764 | ||
| Net realized gain (loss) | (5,520,167 | ) | 6,094,888 | |||
| Change in net unrealized appreciation (depreciation) | (34,256,631 | ) | 1,021,389 | |||
| Net increase (decrease) in net assets resulting from operations | (37,893,390 | ) | 8,468,041 | |||
| Distributions to Shareholders | ||||||
| From net investment income: | ||||||
| Institutional Class | (700,610 | ) | (1,117,830 | ) | ||
| R6 Class | (53,663 | ) | (15,761 | ) | ||
| Decrease in net assets from distributions | (754,273 | ) | (1,133,591 | ) | ||
| Capital Share Transactions | ||||||
| Net increase (decrease) in net assets from capital share transactions (Note 5) | 99,909,755 | 54,902,713 | ||||
| Net increase (decrease) in net assets | 61,262,092 | 62,237,163 | ||||
| Net Assets | ||||||
| Beginning of period | 333,634,358 | 271,397,195 | ||||
| End of period | $ | 394,896,450 | $ | 333,634,358 | ||
| Undistributed net investment income | $ | 1,320,696 | $ | 730,914 | ||
See Notes to Financial Statements.
13
| Notes to Financial Statements |
NOVEMBER 30, 2015
1. Organization
American Century World Mutual Funds, Inc. (the corporation) is registered under the Investment Company Act of 1940, as amended (the 1940 Act), as an open-end management investment company and is organized as a Maryland corporation. NT Emerging Markets Fund (the fund) is one fund in a series issued by the corporation. The fund is diversified as defined under the 1940 Act. The fund’s investment objective is to seek capital growth. The fund is not permitted to invest in securities issued by companies assigned the Global Industry Classification Standard for the tobacco industry.
The fund offers the Institutional Class and the R6 Class, which have different fees and expenses. The difference in the fee structures between the classes is not the result of any difference in advisory or custodial fees or other expenses related to management of the fund’s assets, which do not vary by class. The fund’s R6 Class shares are available for purchase exclusively by certain American Century Investments funds of funds that are offered only through employer-sponsored retirement plans where a financial intermediary provides retirement recordkeeping services to plan participants. Because financial intermediaries do not receive any service, distribution or administrative fees for offering such funds of funds, American Century Investment Management, Inc. (ACIM) (the investment advisor) is able to charge the R6 Class a lower unified management fee.
2. Significant Accounting Policies
The following is a summary of significant accounting policies consistently followed by the fund in preparation of its financial statements. The fund is an investment company and follows accounting and reporting guidance in accordance with accounting principles generally accepted in the United States of America. This may require management to make certain estimates and assumptions at the date of the financial statements. Actual results could differ from these estimates. Management evaluated the impact of events or transactions occurring through the date the financial statements were issued that would merit recognition or disclosure.
Investment Valuations — The fund determines the fair value of its investments and computes its net asset value per share at the close of regular trading (usually 4 p.m. Eastern time) on the New York Stock Exchange (NYSE) on each day the NYSE is open. The Board of Directors has adopted valuation policies and procedures to guide the investment advisor in the fund’s investment valuation process and to provide methodologies for the oversight of the fund’s pricing function.
Equity securities that are listed or traded on a domestic securities exchange are valued at the last reported sales price or at the official closing price as provided by the exchange. Equity securities traded on foreign securities exchanges are generally valued at the closing price of such securities on the exchange where primarily traded or at the close of the NYSE, if that is earlier. If no last sales price is reported, or if local convention or regulation so provides, the mean of the latest bid and asked prices may be used. Securities traded over-the-counter are valued at the mean of the latest bid and asked prices, the last sales price, or the official closing price. Equity securities initially expressed in local currencies are translated into U.S. dollars at the mean of the appropriate currency exchange rate at the close of the NYSE as provided by an independent pricing service.
Open-end management investment companies are valued at the reported net asset value per share. Repurchase agreements are valued at cost, which approximates fair value.
If the fund determines that the market price for an investment is not readily available or the valuation methods mentioned above do not reflect an investment’s fair value, such investment is valued as determined in good faith by the Board of Directors or its delegate, in accordance with policies and procedures adopted by the Board of Directors. In its determination of fair value, the fund may review several factors including, but not limited to, market information regarding the specific investment or comparable investments and correlation with other investment types, futures indices or general market indicators. Circumstances that may cause the fund to use these procedures to value an investment include, but are not limited to: an investment has been declared in default or is distressed; trading in a security has been suspended during the trading day or a security is not actively trading on its principal exchange; prices received from a regular pricing source are deemed unreliable; or there is a foreign market holiday and no trading occurred.
14
The fund monitors for significant events occurring after the close of an investment’s primary exchange but before the fund’s net asset value per share is determined. Significant events may include, but are not limited to: corporate announcements and transactions; governmental action and political unrest that could impact a specific investment or an investment sector; or armed conflicts, natural disasters and similar events that could affect investments in a specific country or region. The fund also monitors for significant fluctuations between domestic and foreign markets, as evidenced by the U.S. market or such other indicators that the Board of Directors, or its delegate, deems appropriate. If significant fluctuations in foreign markets are identified, the fund may apply a model-derived factor to the closing price of equity securities traded on foreign securities exchanges. The factor is based on observable market data as provided by an independent pricing service.
Security Transactions — Security transactions are accounted for as of the trade date. Net realized gains and losses are determined on the identified cost basis, which is also used for federal income tax purposes. Certain countries impose taxes on realized gains on the sale of securities registered in their country. The fund records the foreign tax expense, if any, on an accrual basis. The foreign tax expense on realized gains and unrealized appreciation reduces the net realized gain (loss) on investment transactions and net unrealized appreciation (depreciation) on investments, respectively.
Investment Income — Dividend income less foreign taxes withheld, if any, is recorded as of the ex-dividend date. Distributions received on securities that represent a return of capital or long-term capital gain are recorded as a reduction of cost of investments and/or as a realized gain. The fund may estimate the components of distributions received that may be considered nontaxable distributions or long-term capital gain distributions for income tax purposes. Interest income is recorded on the accrual basis and includes accretion of discounts and amortization of premiums.
Foreign Currency Translations — All assets and liabilities initially expressed in foreign currencies are translated into U.S. dollars at prevailing exchange rates at period end. The fund may enter into spot foreign currency exchange contracts to facilitate transactions denominated in a foreign currency. Purchases and sales of investment securities, dividend and interest income, spot foreign currency exchange contracts, and expenses are translated at the rates of exchange prevailing on the respective dates of such transactions. Net realized and unrealized foreign currency exchange gains or losses related to investment securities are a component of net realized gain (loss) on investment transactions and change in net unrealized appreciation (depreciation) on investments, respectively.
Repurchase Agreements — The fund may enter into repurchase agreements with institutions that ACIM has determined are creditworthy pursuant to criteria adopted by the Board of Directors. The fund requires that the collateral, represented by securities, received in a repurchase transaction be transferred to the custodian in a manner sufficient to enable the fund to obtain those securities in the event of a default under the repurchase agreement. ACIM monitors, on a daily basis, the securities transferred to ensure the value, including accrued interest, of the securities under each repurchase agreement is equal to or greater than amounts owed to the fund under each repurchase agreement.
Joint Trading Account — Pursuant to an Exemptive Order issued by the Securities and Exchange Commission, the fund, along with certain other funds in the American Century Investments family of funds, may transfer uninvested cash balances into a joint trading account. These balances are invested in one or more repurchase agreements that are collateralized by U.S. Treasury or Agency obligations.
Income Tax Status — It is the fund’s policy to distribute substantially all net investment income and net realized gains to shareholders and to otherwise qualify as a regulated investment company under provisions of the Internal Revenue Code. Accordingly, no provision has been made for income taxes. The fund files U.S. federal, state, local and non-U.S. tax returns as applicable. The fund's tax returns are subject to examination by the relevant taxing authority until expiration of the applicable statute of limitations, which is generally three years from the date of filing but can be longer in certain jurisdictions. At this time, management believes there are no uncertain tax positions which, based on their technical merit, would not be sustained upon examination and for which it is reasonably possible that the total amounts of unrecognized tax benefits will significantly change in the next twelve months.
Multiple Class — All shares of the fund represent an equal pro rata interest in the net assets of the class to which such shares belong, and have identical voting, dividend, liquidation and other rights and the same terms and conditions, except for class specific expenses and exclusive rights to vote on matters affecting only individual classes. Income, non-class specific expenses, and realized and unrealized capital gains and losses of the fund are allocated to each class of shares based on their relative net assets.
15
Distributions to Shareholders — Distributions from net investment income and net realized gains, if any, are generally declared and paid annually. The fund may make distributions on a more frequent basis to comply with the distribution requirements of the Internal Revenue Code, in all events in a manner consistent with provisions of the 1940 Act.
Indemnifications — Under the corporation’s organizational documents, its officers and directors are indemnified against certain liabilities arising out of the performance of their duties to the fund. In addition, in the normal course of business, the fund enters into contracts that provide general indemnifications. The maximum exposure under these arrangements is unknown as this would involve future claims that may be made against a fund. The risk of material loss from such claims is considered by management to be remote.
3. Fees and Transactions with Related Parties
Certain officers and directors of the corporation are also officers and/or directors of American Century Companies, Inc. (ACC). The corporation’s investment advisor, ACIM, the corporation's distributor, American Century Investment Services, Inc., and the corporation’s transfer agent, American Century Services, LLC, are wholly owned, directly or indirectly, by ACC. Various funds issued by American Century Asset Allocation Portfolios, Inc. own, in aggregate, 100% of the shares of the fund. Related parties do not invest in the fund for the purpose of exercising management or control.
Management Fees — The corporation has entered into a management agreement with ACIM, under which ACIM provides the fund with investment advisory and management services in exchange for a single, unified management fee (the fee) per class. The agreement provides that all expenses of managing and operating the fund, except distribution and service fees, brokerage expenses, taxes, interest, fees and expenses of the independent directors (including legal counsel fees), and extraordinary expenses, will be paid by ACIM. The fee is computed and accrued daily based on each class’s daily net assets and paid monthly in arrears. The rate of the fee is determined by applying a fee rate calculation formula. This formula takes into account the fund’s assets as well as certain assets, if any, of other clients of the investment advisor outside the American Century Investments family of funds (such as subadvised funds and separate accounts) that have very similar investment teams and investment strategies (strategy assets). The strategy assets of the fund also include the assets of Emerging Markets Fund, one fund in a series issued by the corporation. The annual management fee schedule ranges from 1.050% to 1.650% for the Institutional Class and 0.900% to 1.500% for the R6 Class. During the year ended November 30, 2015, the investment advisor voluntarily agreed to waive 0.250% of the fund's management fee. The investment advisor expects this waiver to continue until March 31, 2016 and cannot terminate it prior to such date without the approval of the Board of Directors. The total amount of the waiver for each class for the year ended November 30, 2015 was $893,494 and $42,886 for the Institutional Class and R6 Class, respectively. The effective annual management fee before waiver for each class for the year ended November 30, 2015 was 1.48% for the Institutional Class and 1.33% for the R6 Class. The effective annual management fee after waiver for each class for the year ended November 30, 2015 was 1.23% for the Institutional Class and 1.08% for the R6 Class.
Directors' Fees and Expenses — The Board of Directors is responsible for overseeing the investment advisor’s management and operations of the fund. The directors receive detailed information about the fund and its investment advisor regularly throughout the year, and meet at least quarterly with management of the investment advisor to review reports about fund operations. The fund’s officers do not receive compensation from the fund.
4. Investment Transactions
Purchases and sales of investment securities, excluding short-term investments, for the year ended November 30, 2015 were $319,498,132 and $224,569,840, respectively.
16
5. Capital Share Transactions
Transactions in shares of the fund were as follows:
Year ended November 30, 2015 | Year ended November 30, 2014 | |||||||||
| Shares | Amount | Shares | Amount | |||||||
| Institutional Class/Shares Authorized | 300,000,000 | 100,000,000 | ||||||||
| Sold | 11,739,797 | $ | 121,732,892 | 7,570,217 | $ | 79,221,462 | ||||
| Issued in reinvestment of distributions | 67,044 | 700,610 | 108,942 | 1,117,830 | ||||||
| Redeemed | (3,424,560 | ) | (36,763,331 | ) | (3,027,271 | ) | (32,862,933 | ) | ||
| 8,382,281 | 85,670,171 | 4,651,888 | 47,476,359 | |||||||
| R6 Class/Shares Authorized | 40,000,000 | 50,000,000 | ||||||||
| Sold | 1,656,279 | 17,340,728 | 781,648 | 8,202,595 | ||||||
| Issued in reinvestment of distributions | 5,140 | 53,663 | 1,539 | 15,761 | ||||||
| Redeemed | (317,714 | ) | (3,154,807 | ) | (74,953 | ) | (792,002 | ) | ||
| 1,343,705 | 14,239,584 | 708,234 | 7,426,354 | |||||||
| Net increase (decrease) | 9,725,986 | $ | 99,909,755 | 5,360,122 | $ | 54,902,713 | ||||
6. Fair Value Measurements
The fund’s investments valuation process is based on several considerations and may use multiple inputs to determine the fair value of the investments held by the fund. In conformity with accounting principles generally accepted in the United States of America, the inputs used to determine a valuation are classified into three broad levels.
| • | Level 1 valuation inputs consist of unadjusted quoted prices in an active market for identical investments. |
| • | Level 2 valuation inputs consist of direct or indirect observable market data (including quoted prices for comparable investments, evaluations of subsequent market events, interest rates, prepayment speeds, credit risk, etc.). These inputs also consist of quoted prices for identical investments initially expressed in local currencies that are adjusted through translation into U.S. dollars. |
| • | Level 3 valuation inputs consist of unobservable data (including a fund’s own assumptions). |
The level classification is based on the lowest level input that is significant to the fair valuation measurement. The valuation inputs are not necessarily an indication of the risks associated with investing in these securities or other financial instruments. There were no significant transfers between levels during the period.
The following is a summary of the level classifications as of period end. The Schedule of Investments provides additional information on the fund’s portfolio holdings.
| Level 1 | Level 2 | Level 3 | ||||||
| Assets | ||||||||
| Investment Securities | ||||||||
| Common Stocks | ||||||||
| Brazil | $ | 3,989,208 | $ | 12,660,039 | — | |||
| China | 10,622,344 | 90,509,996 | — | |||||
| India | 3,343,553 | 20,314,617 | — | |||||
| Mexico | 8,023,027 | 17,386,679 | — | |||||
| Peru | 5,054,811 | — | — | |||||
| Other Countries | — | 204,191,741 | — | |||||
| Exchange-Traded Funds | 6,972,548 | — | — | |||||
| Temporary Cash Investments | 1,473,628 | 10,277,585 | — | |||||
| $ | 39,479,119 | $ | 355,340,657 | — | ||||
17
7. Risk Factors
There are certain risks involved in investing in foreign securities. These risks include those resulting from future adverse political, social and economic developments, fluctuations in currency exchange rates, the possible imposition of exchange controls, and other foreign laws or restrictions. Investing in emerging markets may accentuate these risks.
8. Federal Tax Information
On December 22, 2015, the fund declared and paid the following per-share distributions from net investment income to shareholders of record on December 21, 2015:
| Institutional Class | R6 Class |
| $0.0312 | $0.0455 |
The tax character of distributions paid during the years ended November 30, 2015 and November 30, 2014 were as follows:
| 2015 | 2014 | |||||
| Distributions Paid From | ||||||
| Ordinary income | $ | 754,273 | $ | 1,133,591 | ||
| Long-term capital gains | — | — | ||||
The book-basis character of distributions made during the year from net investment income or net realized gains may differ from their ultimate characterization for federal income tax purposes. These differences reflect the differing character of certain income items and net realized gains and losses for financial statement and tax purposes, and may result in reclassification among certain capital accounts on the financial statements.
As of November 30, 2015, the federal tax cost of investments and the components of distributable earnings on a tax-basis were as follows:
| Federal tax cost of investments | $ | 378,754,620 | |
| Gross tax appreciation of investments | $ | 47,971,702 | |
| Gross tax depreciation of investments | (31,906,546 | ) | |
| Net tax appreciation (depreciation) of investments | 16,065,156 | ||
| Net tax appreciation (depreciation) on translation of assets and liabilities in foreign currencies | (146,052 | ) | |
| Net tax appreciation (depreciation) | $ | 15,919,104 | |
| Undistributed ordinary income | $ | 1,320,696 | |
| Accumulated short-term capital losses | $ | (9,140,455 | ) |
| Post-October capital loss deferral | $ | (1,040,430 | ) |
The difference between book-basis and tax-basis unrealized appreciation (depreciation) is attributable primarily to the tax deferral of losses on wash sales.
Accumulated capital losses represent net capital loss carryovers that may be used to offset future realized capital gains for federal income tax purposes. Any unlimited losses will be required to be utilized prior to the losses which carry an expiration date. Future capital loss carryover utilization in any given year may be subject to Internal Revenue Code limitations. Capital loss carryovers of $(1,146,451) expire in 2017 and the remaining losses are unlimited.
Loss deferrals represent certain qualified losses that the fund has elected to treat as having been incurred in the following fiscal year for federal income tax purposes.
18
| Financial Highlights |
| For a Share Outstanding Throughout the Years Ended November 30 (except as noted) | |||||||||||||||
| Per-Share Data | Ratios and Supplemental Data | ||||||||||||||
| Income From Investment Operations: | Ratio to Average Net Assets of: | ||||||||||||||
Net Asset Value, Beginning of Period | Net Investment Income (Loss)(1) | Net Realized and Unrealized Gain (Loss) | Total From Investment Operations | Distributions From Net Investment Income | Net Asset Value, End of Period | Total Return(2) | Operating Expenses | Operating Expenses (before expense waiver) | Net Investment Income (Loss) | Net Investment Income (Loss) (before expense waiver) | Portfolio Turnover Rate | Net Assets, End of Period (in thousands) | |||
| Institutional Class | |||||||||||||||
| 2015 | $10.84 | 0.05 | (1.12) | (1.07) | (0.02) | $9.75 | (9.88)% | 1.24% | 1.49% | 0.49% | 0.24% | 61% | $372,802 | ||
| 2014 | $10.67 | 0.05 | 0.16 | 0.21 | (0.04) | $10.84 | 2.02% | 1.25% | 1.50% | 0.45% | 0.20% | 84% | $323,641 | ||
| 2013 | $10.05 | 0.04 | 0.63 | 0.67 | (0.05) | $10.67 | 6.66% | 1.42% | 1.52% | 0.38% | 0.28% | 76% | $269,117 | ||
| 2012 | $8.94 | 0.05 | 1.07 | 1.12 | (0.01) | $10.05 | 12.51% | 1.54% | 1.54% | 0.50% | 0.50% | 101% | $169,277 | ||
| 2011 | $10.24 | 0.04 | (1.34) | (1.30) | — | $8.94 | (12.70)% | 1.52% | 1.52% | 0.37% | 0.37% | 87% | $119,682 | ||
| R6 Class | |||||||||||||||
| 2015 | $10.84 | 0.07 | (1.12) | (1.05) | (0.04) | $9.75 | (9.74)% | 1.09% | 1.34% | 0.64% | 0.39% | 61% | $22,095 | ||
| 2014 | $10.68 | 0.06 | 0.16 | 0.22 | (0.06) | $10.84 | 2.11% | 1.10% | 1.35% | 0.60% | 0.35% | 84% | $9,993 | ||
2013(3) | $9.90 | (0.01) | 0.79 | 0.78 | – | $10.68 | 7.88% | 1.12%(4) | 1.37%(4) | (0.37)%(4) | (0.62)%(4) | 76%(5) | $2,280 | ||
| Notes to Financial Highlights |
| (1) | Computed using average shares outstanding throughout the period. |
| (2) | Total returns are calculated based on the net asset value of the last business day. Total returns for periods less than one year are not annualized. |
| (3) | July 26, 2013 (commencement of sale) through November 30, 2013. |
| (4) | Annualized. |
| (5) | Portfolio turnover is calculated at the fund level. Percentage indicated was calculated for the year ended November 30, 2013. |
See Notes to Financial Statements.
19
| Report of Independent Registered Public Accounting Firm |
To the Board of Directors and Shareholders of American Century World Mutual Funds, Inc.:
We have audited the accompanying statement of assets and liabilities, including the schedule of investments, of NT Emerging Markets Fund (the “Fund”), one of the funds constituting American Century World Mutual Funds, Inc., as of November 30, 2015, and the related statement of operations for the year then ended, the statements of changes in net assets for each of the two years in the period then ended, and the financial highlights for each of the periods presented. These financial statements and financial highlights are the responsibility of the Fund’s management. Our responsibility is to express an opinion on these financial statements and financial highlights based on our audits.
We conducted our audits in accordance with the standards of the Public Company Accounting Oversight Board (United States). Those standards require that we plan and perform the audit to obtain reasonable assurance about whether the financial statements and financial highlights are free of material misstatement. The Fund is not required to have, nor were we engaged to perform, an audit of its internal control over financial reporting. Our audits included consideration of internal control over financial reporting as a basis for designing audit procedures that are appropriate in the circumstances, but not for the purpose of expressing an opinion on the effectiveness of the Fund’s internal control over financial reporting. Accordingly, we express no such opinion. An audit also includes examining, on a test basis, evidence supporting the amounts and disclosures in the financial statements, assessing the accounting principles used and significant estimates made by management, as well as evaluating the overall financial statement presentation. Our procedures included confirmation of securities owned as of November 30, 2015, by correspondence with the custodian and brokers; when replies were not received from brokers, we performed other auditing procedures. We believe that our audits provide a reasonable basis for our opinion.
In our opinion, the financial statements and financial highlights referred to above present fairly, in all material respects, the financial position of NT Emerging Markets Fund of American Century World Mutual Funds, Inc. as of November 30, 2015, the results of its operations for the year then ended, the changes in its net assets for each of the two years in the period then ended, and the financial highlights for each of the periods presented, in conformity with accounting principles generally accepted in the United States of America.
DELOITTE & TOUCHE LLP
Kansas City, Missouri
January 19, 2016
20
| Management |
The Board of Directors
The individuals listed below serve as directors of the funds. Each director will continue to serve in this capacity until death, retirement, resignation or removal from office. The board has adopted a mandatory retirement age for directors who are not “interested persons,” as that term is defined in the Investment Company Act (independent directors). Independent directors shall retire by December 31 of the year in which they reach their 75th birthday.
Mr. Thomas is an “interested person” because he currently serves as President and Chief Executive Officer of American Century Companies, Inc. (ACC), the parent company of American Century Investment Management, Inc. (ACIM or the advisor). Mr. Fink is treated as an “interested person” because of his recent employment with ACC and American Century Services, LLC (ACS). The other directors (more than three-fourths of the total number) are independent. They are not employees, directors or officers of, and have no financial interest in, ACC or any of its wholly owned, direct or indirect, subsidiaries, including ACIM, American Century Investment Services, Inc. (ACIS) and ACS, and they do not have any other affiliations, positions or relationships that would cause them to be considered “interested persons” under the Investment Company Act. The directors serve in this capacity for seven (in the case of Mr. Thomas, 15) registered investment companies in the American Century Investments family of funds.
The following table presents additional information about the directors. The mailing address for each director is 4500 Main Street, Kansas City, Missouri 64111.
Name (Year of Birth) | Position(s) Held with Funds | Length of Time Served | Principal Occupation(s) During Past 5 Years | Number of American Century Portfolios Overseen by Director | Other Directorships Held During Past 5 Years |
| Independent Directors | |||||
Thomas A. Brown(1) (1940) | Director | Since 1980 | Managing Member, Associated Investments, LLC (real estate investment company) | 80 | None |
| Andrea C. Hall (1945) | Director | Since 1997 | Retired | 80 | None |
| Jan M. Lewis (1957) | Director | Since 2011 | Retired; President and Chief Executive Officer, Catholic Charities of Northeast Kansas (human services organization) (2006 to 2013) | 80 | None |
| James A. Olson (1942) | Director and Chairman of the Board | Since 2007 (Chairman since 2014) | Member, Plaza Belmont LLC (private equity fund manager) | 80 | Saia, Inc. (2002 to 2012) and EPR Properties (2003 to 2013) |
| M. Jeannine Strandjord (1945) | Director | Since 1994 | Retired | 80 | Euronet Worldwide Inc.; MGP Ingredients, Inc.; Charming Shoppes, Inc. (2006 to 2010); and DST Systems Inc. (1996 to 2012) |
| John R. Whitten (1946) | Director | Since 2008 | Retired | 80 | Rudolph Technologies, Inc. |
21
| Name (Year of Birth) | Position(s) Held with Funds | Length of Time Served | Principal Occupation(s) During Past 5 Years | Number of American Century Portfolios Overseen by Director | Other Directorships Held During Past 5 Years |
| Independent Directors | |||||
| Stephen E. Yates (1948) | Director | Since 2012 | Retired; Executive Vice President, Technology & Operations, KeyCorp. (computer services) (2004 to 2010) | 80 | Applied Industrial Technologies, Inc. (2001 to 2010) |
| Interested Directors | |||||
| Barry Fink (1955) | Director | Since 2012 | Retired; Executive Vice President, ACC (September 2007 to February 2013); President, ACS (October 2007 to February 2013); Chief Operating Officer, ACC (September 2007 to November 2012) | 80 | None |
| Jonathan S. Thomas (1963) | Director and President | Since 2007 | President and Chief Executive Officer, ACC (March 2007 to present). Also serves as Chief Executive Officer, ACS; Executive Vice President, ACIM; Director, ACC, ACIM and other ACC subsidiaries | 125 | BioMed Valley Discoveries, Inc. |
(1) Thomas A. Brown retired as Director of the Board effective December 31, 2015.
The Statement of Additional Information has additional information about the fund's directors and is available without charge, upon request, by calling 1-800-345-2021.
22
Officers
The following table presents certain information about the executive officers of the funds. Each officer serves as an officer for each of the 15 investment companies in the American Century family of funds, unless otherwise noted. No officer is compensated for his or her service as an officer of the funds. The listed officers are interested persons of the funds and are appointed or re-appointed on an annual basis. The mailing address for each officer listed below is 4500 Main Street, Kansas City, Missouri 64111.
Name (Year of Birth) | Offices with the Funds | Principal Occupation(s) During the Past Five Years |
| Jonathan S. Thomas (1963) | Director and President since 2007 | President and Chief Executive Officer, ACC (March 2007 to present). Also serves as Chief Executive Officer, ACS; Executive Vice President, ACIM; Director, ACC, ACIM and other ACC subsidiaries |
| Amy D. Shelton (1964) | Chief Compliance Officer and Vice President since 2014 | Chief Compliance Officer, American Century funds, (March 2014 to present); Chief Compliance Officer, ACIM (February 2014 to present); Chief Compliance Officer, ACIS (October 2009 to present); Vice President, Client Interactions and Marketing, ACIS (February 2013 to January 2014); Director, Client Interactions and Marketing, ACIS (June 2007 to January 2013). Also serves as Vice President, ACIS |
| Charles A. Etherington (1957) | General Counsel since 2007 and Senior Vice President since 2006 | Attorney, ACC (February 1994 to present); Vice President, ACC (November 2005 to present); General Counsel, ACC (March 2007 to present). Also serves as General Counsel, ACIM, ACS, ACIS and other ACC subsidiaries; and Senior Vice President, ACIM and ACS |
| C. Jean Wade (1964) | Vice President, Treasurer and Chief Financial Officer since 2012 | Vice President, ACS (February 2000 to present) |
| Robert J. Leach (1966) | Vice President since 2006 and Assistant Treasurer since 2012 | Vice President, ACS (February 2000 to present) |
| David H. Reinmiller (1963) | Vice President since 2000 | Attorney, ACC (January 1994 to present); Associate General Counsel, ACC (January 2001 to present). Also serves as Vice President, ACIM and ACS |
| Ward D. Stauffer (1960) | Secretary since 2005 | Attorney, ACC (June 2003 to present) |
23
| Approval of Management Agreement |
At a meeting held on June 30, 2015, the Fund’s Board of Directors unanimously approved the renewal of the management agreement pursuant to which American Century Investment Management, Inc. (the “Advisor”) acts as the investment advisor for the Fund. Under Section 15(c) of the Investment Company Act, contracts for investment advisory services are required to be reviewed, evaluated, and approved by a majority of a fund’s directors (the “Directors”), including a majority of the independent Directors, each year.
Prior to its consideration of the renewal of the management agreement, the Directors requested and reviewed extensive data and information compiled by the Advisor and certain independent providers of evaluation data concerning the Fund and the services provided to the Fund by the Advisor. This review was in addition to the oversight and evaluation undertaken by the Board and its committees on a continuous basis and the information received was supplemental to the extensive information that the Board and its committees receive and consider throughout the year.
In connection with its consideration of the renewal of the management agreement, the Board’s review and evaluation of the services provided by the Advisor included, but was not limited to, the following:
| • | the nature, extent, and quality of investment management, shareholder services, and other services provided by the Advisor to the Fund; |
| • | the wide range of other programs and services the Advisor provides to the Fund and its shareholders on a routine and non-routine basis; |
| • | the Fund’s investment performance compared to appropriate benchmarks and/or a peer group of other mutual funds with similar investment objectives and strategies; |
| • | the cost of owning the Fund compared to the cost of owning similar funds; |
| • | the compliance policies, procedures, and regulatory experience of the Fund's service providers; |
| • | financial data showing the cost of services provided to the Fund, the profitability of the Fund to the Advisor, and the overall profitability of the Advisor; |
| • | possible economies of scale associated with the Advisor’s management of the Fund and other accounts under its management; |
| • | data comparing services provided and charges to the Advisor's other investment management clients; |
| • | acquired fund fees and expenses; |
| • | payments by the Fund and the Advisor to financial intermediaries; and |
| • | any collateral benefits derived by the Advisor from the management of the Fund. |
In keeping with their practice, the Directors held two in-person meetings and one telephonic meeting to review and discuss the information provided. The independent Directors also had the benefit of the advice of their independent counsel throughout the process.
Factors Considered
The Directors considered all of the information provided by the Advisor, the independent data providers, and independent counsel in connection with the approval. They determined that the information was sufficient for them to evaluate the management agreement for the Fund. In connection with their review, the Directors did not identify any single factor as being all-important or controlling, and each Director may have attributed different levels of importance to different factors. In deciding to renew the management agreement, the Board based its decision on a number of factors, including the following:
24
Nature, Extent and Quality of Services - Generally. Under the management agreement, the Advisor is responsible for providing or arranging for all services necessary for the operation of the
Fund. The Board noted that under the management agreement, the Advisor provides or arranges at its own expense a wide variety of services including:
| • | constructing and designing the Fund |
| • | portfolio research and security selection |
| • | initial capitalization/funding |
| • | securities trading |
| • | Fund administration |
| • | custody of Fund assets |
| • | daily valuation of the Fund’s portfolio |
| • | shareholder servicing and transfer agency, including shareholder confirmations, recordkeeping, and communications |
| • | legal services (except the independent Directors’ counsel) |
| • | regulatory and portfolio compliance |
| • | financial reporting |
| • | marketing and distribution (except Rule 12b-1 plans) |
The Board noted that many of these services have expanded over time both in terms of quantity and complexity in response to shareholder demands, competition in the industry, changing distribution channels, and the changing regulatory environment.
Investment Management Services. The nature of the investment management services provided to the Fund is quite complex and allows Fund shareholders access to professional money management, instant diversification of their investments within an asset class, the opportunity to easily diversify among asset classes by investing in or exchanging among various American Century Investments funds, and liquidity. In evaluating investment performance, the Board expects the Advisor to manage the Fund in accordance with its investment objectives and approved strategies. Further, the Directors recognize that the Advisor has an obligation to monitor trading activities, and in particular to seek the best execution of fund trades, and to evaluate the use of and payment for research. In providing these services, the Advisor utilizes teams of investment professionals (portfolio managers, analysts, research assistants, and securities traders) who require extensive information technology, research, training, compliance and other systems to conduct their business. The Board, directly and through its Fund Performance Review Committee, regularly reviews investment performance information for the Fund, together with comparative information for appropriate benchmarks and/or peer groups of similarly-managed funds, over different time horizons. The Directors also review detailed performance information during the management agreement approval process. If performance concerns are identified, the Fund receives special reviews until performance improves, during which the Board discusses with the Advisor the reasons for such results (e.g., market conditions, security selection) and any efforts being undertaken to improve performance. The Fund’s performance was above its benchmark for the one-, three-, and five-year periods reviewed by the Board. The Board found the investment management services provided by the Advisor to the Fund to be satisfactory and consistent with the management agreement.
Shareholder and Other Services. Under the management agreement, the Advisor provides the Fund with a comprehensive package of transfer agency, shareholder, and other services. The Board, directly and through various committees of the Board, regularly reviews reports and evaluations of such services at its regular meetings. These reports include, but are not limited to, information regarding the operational efficiency and accuracy of the shareholder and transfer agency services provided, staffing levels, shareholder satisfaction (as measured by external as well as internal sources), technology support, new products and services offered to Fund shareholders, securities trading activities, portfolio valuation services, auditing services, and legal and operational compliance activities. The Board particularly noted the Advisor’s continual efforts to maintain effective business continuity plans and to address cybersecurity threats. Certain aspects of shareholder and transfer agency service level efficiency and the quality of securities trading
25
activities are measured by independent third party providers and are presented in comparison to other fund groups not managed by the Advisor. The Board found the services provided by the Advisor to the Fund under the management agreement to be competitive and of high quality.
Costs of Services and Profitability. The Advisor provides detailed information concerning its cost of providing various services to the Fund, its profitability in managing the Fund (pre- and post-distribution), its overall profitability, and its financial condition. The Directors have reviewed with the Advisor the methodology used to prepare this financial information. This information is considered in evaluating the Advisor’s financial condition, its ability to continue to provide services under the management agreement, and the reasonableness of the current management fee. The Board concluded that the Advisor’s profits were reasonable in light of the services provided to the Fund.
Ethics. The Board generally considers the Advisor’s commitment to providing quality services to shareholders and to conducting its business ethically. They noted that the Advisor’s practices generally meet or exceed industry best practices.
Economies of Scale. The Board also reviewed information provided by the Advisor regarding the possible existence of economies of scale in connection with the management of the Fund. The Board concluded that economies of scale are difficult to measure and predict with precision, especially on a fund-by-fund basis. The Board concluded that the Advisor is appropriately sharing economies of scale through its competitive fee structure, offering competitive fees from fund inception, and through reinvestment in its business to provide shareholders additional content and services. The Board also noted that economies of scale are shared with the Fund and its shareholders through management fee breakpoints that serve to reduce the effective management fee as the assets of the Fund grow.
Comparison to Other Funds’ Fees. The management agreement provides that the Fund pays the Advisor a single, all-inclusive (or unified) management fee for providing all services necessary for the management and operation of the Fund, other than brokerage expenses, taxes, interest, extraordinary expenses, and the fees and expenses of the Fund’s independent Directors (including their independent legal counsel) and expenses incurred in connection with the provision of shareholder services and distribution services under a plan adopted pursuant to Rule 12b-1 under the 1940 Act. Under the unified fee structure, the Advisor is responsible for providing all investment advisory, custody, audit, administrative, compliance, recordkeeping, marketing and shareholder services, or arranging and supervising third parties to provide such services. By contrast, most other funds are charged a variety of fees, including an investment advisory fee, a transfer agency fee, an administrative fee, distribution charges, and other expenses. Other than their investment advisory fees and any applicable Rule 12b-1 distribution fees, all other components of the total fees charged by these other funds may be increased without shareholder approval. The Board believes the unified fee structure is a benefit to Fund shareholders because it clearly discloses to shareholders the cost of owning Fund shares, and, since the unified fee cannot be increased without a vote of Fund shareholders, it shifts to the Advisor the risk of increased costs of operating the Fund and provides a direct incentive to minimize administrative inefficiencies. Part of the Board’s analysis of fee levels involves reviewing certain evaluative data compiled by an independent provider comparing the Fund’s unified fee to the total expense ratios of its peers. The unified fee charged to shareholders of the Fund was above the median of the total expense ratios of the Fund’s peer expense universe and was within the range of its peer expense group. The Board concluded that the management fee paid by the Fund to the Advisor under the management agreement is reasonable in light of the services provided to the Fund.
26
Comparison to Fees and Services Provided to Other Clients of the Advisor. The Directors also requested and received information from the Advisor concerning the nature of the services, fees, costs and profitability of its advisory services to advisory clients other than the Fund. They observed that these varying types of client accounts require different services and involve different regulatory and entrepreneurial risks than the management of the Fund. The Board analyzed this information and concluded that the fees charged and services provided to the Fund were reasonable by comparison.
Payments to Intermediaries. The Directors also requested and received a description of payments made to intermediaries by the Fund and the Advisor. These payments include various payments made by the Fund or the Advisor to different types of intermediaries and recordkeepers for distribution and service activities provided for the Fund. The Board reviewed such information and found the payments to be reasonable in scope and purpose.
Collateral or “Fall-Out” Benefits Derived by the Advisor. The Board considered the existence of collateral benefits the Advisor may receive as a result of its relationship with the Fund. They concluded that the Advisor’s primary business is managing mutual funds and it generally does not use fund or shareholder information to generate profits in other lines of business, and therefore does not derive any significant collateral benefits from them. The Board noted that additional assets from other clients may offer the Advisor some benefit from increased leverage with service providers and counterparties. Additionally, the Advisor receives proprietary research from broker-dealers that execute fund portfolio transactions, which the Board concluded is likely to benefit other clients of the Advisor as well as Fund shareholders. The Board also determined that the Advisor is able to provide investment management services to certain clients other than the Fund, at least in part, due to its existing infrastructure built to serve the fund complex. The Board concluded that appropriate allocation methodologies had been employed to assign resources and the cost of those resources to these other clients and, where expressly provided, these other client assets may be included with the assets of the Fund to determine breakpoints in the management fee schedule.
Existing Relationship. The Board also considered whether there was any reason for not continuing the existing arrangement with the Advisor. In this regard, the Board was mindful of the potential disruptions of the Fund’s operations and various risks, uncertainties, and other effects that could occur as a result of a decision not to continue such relationship. In particular, the Board recognized that most shareholders have invested in the Fund on the strength of the Advisor’s industry standing and reputation and in the expectation that the Advisor will have a continuing role in providing advisory services to the Fund.
Conclusion of the Directors. As a result of this process, the Board, including all of the independent Directors, taking into account all of the factors discussed above and the information provided by the Advisor and others in connection with its review and throughout the year, determined that the management fee is fair and reasonable in light of the services provided and that the investment management agreement between the Fund and the Advisor should be renewed.
27
| Additional Information |
Retirement Account Information
As required by law, distributions you receive from certain IRAs are subject to federal income tax withholding, unless you elect not to have withholding apply. Tax will be withheld on the total amount withdrawn even though you may be receiving amounts that are not subject to withholding, such as nondeductible contributions. In such case, excess amounts of withholding could occur. You may adjust your withholding election so that a greater or lesser amount will be withheld.
If you don’t want us to withhold on this amount, you must notify us to not withhold the federal income tax. You may notify us in writing or in certain situations by telephone or through other electronic means. For systematic withdrawals, your withholding election will remain in effect until revoked or changed by filing a new election. You have the right to revoke your election at any time.
Remember, even if you elect not to have income tax withheld, you are liable for paying income tax on the taxable portion of your withdrawal. If you elect not to have income tax withheld or you don’t have enough income tax withheld, you may be responsible for payment of estimated tax. You may incur penalties under the estimated tax rules if your withholding and estimated tax payments are not sufficient. You can reduce or defer the income tax on a distribution by directly or indirectly rolling such distribution over to another IRA or eligible plan. You should consult your tax advisor for additional information.
State tax will be withheld if, at the time of your distribution, your address is within one of the mandatory withholding states and you have federal income tax withheld (or as otherwise required by state law). State taxes will be withheld from your distribution in accordance with the respective state rules.
Distributions you receive from 403(b), 457 and qualified plans are subject to special tax and withholding rules. Your plan administrator or plan sponsor is required to provide you with a special tax notice explaining those rules at the time you request a distribution. If applicable, federal and/or state taxes may be withheld from your distribution amount.
Proxy Voting Policies
A description of the policies that the fund's investment advisor uses in exercising the voting rights associated with the securities purchased and/or held by the fund is available without charge, upon request, by calling 1-800-345-2021. It is also available on the "About Us" page of American Century Investments’ website at americancentury.com and on the Securities and Exchange Commission’s website at sec.gov. Information regarding how the investment advisor voted proxies relating to portfolio securities during the most recent 12-month period ended June 30 is available on the "About Us" page at americancentury.com. It is also available at sec.gov.
Quarterly Portfolio Disclosure
The fund files its complete schedule of portfolio holdings with the Securities and Exchange Commission (SEC) for the first and third quarters of each fiscal year on Form N-Q. The fund’s Forms N-Q are available on the SEC’s website at sec.gov, and may be reviewed and copied at the SEC’s Public Reference Room in Washington, DC. Information on the operation of the Public Reference Room may be obtained by calling 1-800-SEC-0330. The fund also makes its complete schedule of portfolio holdings for the most recent quarter of its fiscal year available on its
website at americancentury.com and, upon request, by calling 1-800-345-2021.
28
Other Tax Information
The following information is provided pursuant to provisions of the Internal Revenue Code.
The fund hereby designates up to the maximum amount allowable as qualified dividend income for the fiscal year ended November 30, 2015.
For the fiscal year ended November 30, 2015, the fund intends to pass through to shareholders foreign source income of $7,227,528 and foreign taxes paid of $735,815, or up to the maximum amount allowable, as a foreign tax credit. Foreign source income and foreign tax expense per outstanding share on November 30, 2015 are $0.1784 and $0.0182, respectively.
29
| Notes |
30
| Notes |
31
| Notes |
32
| ||
| Contact Us | americancentury.com | |
| Automated Information Line | 1-800-345-8765 | |
| Investor Services Representative | 1-800-345-2021 or 816-531-5575 | |
| Investors Using Advisors | 1-800-378-9878 | |
| Business, Not-For-Profit, Employer-Sponsored Retirement Plans | 1-800-345-3533 | |
| Banks and Trust Companies, Broker-Dealers, Financial Professionals, Insurance Companies | 1-800-345-6488 | |
| Telecommunications Relay Service for the Deaf | 711 | |
| American Century World Mutual Funds, Inc. | ||
Investment Advisor: American Century Investment Management, Inc. Kansas City, Missouri | ||
| This report and the statements it contains are submitted for the general information of our shareholders. The report is not authorized for distribution to prospective investors unless preceded or accompanied by an effective prospectus. | ||
| ©2016 American Century Proprietary Holdings, Inc. All rights reserved. CL-ANN-87746 1601 | ||
| ANNUAL REPORT | NOVEMBER 30, 2015 |
NT International Growth Fund
| Table of Contents |
| Performance | 2 | |
| Portfolio Commentary | ||
| Fund Characteristics | ||
| Shareholder Fee Example | ||
| Schedule of Investments | ||
| Statement of Assets and Liabilities | ||
| Statement of Operations | ||
| Statement of Changes in Net Assets | ||
| Notes to Financial Statements | ||
| Financial Highlights | ||
| Report of Independent Registered Public Accounting Firm | ||
| Management | ||
| Approval of Management Agreement | ||
| Additional Information | ||
Any opinions expressed in this report reflect those of the author as of the date of the report, and do not necessarily represent the opinions of American Century Investments® or any other person in the American Century Investments organization. Any such opinions are subject to change at any time based upon market or other conditions and American Century Investments disclaims any responsibility to update such opinions. These opinions may not be relied upon as investment advice and, because investment decisions made by American Century Investments funds are based on numerous factors, may not be relied upon as an indication of trading intent on behalf of any American Century Investments fund. Security examples are used for representational purposes only and are not intended as recommendations to purchase or sell securities. Performance information for comparative indices and securities is provided to American Century Investments by third party vendors. To the best of American Century Investments’ knowledge, such information is accurate at the time of printing.
| Performance |
| Total Returns as of November 30, 2015 | |||||
Average Annual Returns | |||||
Ticker Symbol | 1 year | 5 years | Since Inception | Inception Date | |
Institutional Class | ACLNX | -1.44% | 6.63% | 3.14% | 5/12/06 |
MSCI EAFE Index | — | -2.94% | 5.51% | 1.66% | — |
MSCI EAFE Growth Index | — | 1.25% | 6.36% | 2.68% | — |
| R6 Class | ACDNX | -1.37% | — | 3.93% | 7/26/13 |
| Growth of $10,000 Over Life of Class |
| $10,000 investment made May 12, 2006 |
| Performance for other share classes will vary due to differences in fee structure. |
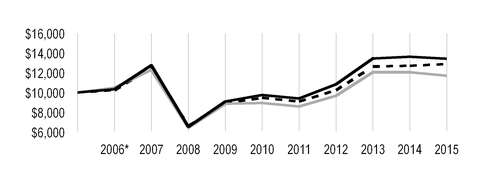
| Value on November 30, 2015 | |
| Institutional Class — $13,434 | |
MSCI EAFE Index — $11,708 | |
MSCI EAFE Growth Index — $12,876 | |
*From May 12, 2006, the Institutional Class’s inception date. Not annualized.
Total Annual Fund Operating Expenses | |
| Institutional Class | R6 Class |
| 0.98% | 0.83% |
The total annual fund operating expenses shown is as stated in the fund’s prospectus current as of the date of this report. The prospectus may vary from the expense ratio shown elsewhere in this report because it is based on a different time period, includes acquired fund fees and expenses, and, if applicable, does not include fee waivers or expense reimbursements.
Data presented reflect past performance. Past performance is no guarantee of future results. Current performance may be higher or lower than the performance shown. Investment return and principal value will fluctuate, and redemption value may be more or less than original cost. Data assumes reinvestment of dividends and capital gains, and none of the charts reflect the deduction of taxes that a shareholder would pay on fund distributions or the redemption of fund shares. To obtain performance data current to the most recent month end, please call 1-800-345-2021 or visit americancentury.com. For additional information about the fund, please consult the prospectus.
2
| Portfolio Commentary |
Portfolio Manager: Raj Gandhi and James Gendelman
In February 2015, portfolio manager James Gendelman joined NT International Growth’s management team.
Performance Summary
NT International Growth declined -1.44%* for the 12 months ended November 30, 2015. The portfolio’s benchmark, the MSCI EAFE Index, declined -2.94% for the same period.
Non-U.S. developed market stocks declined during the 12-month period, largely due to the ongoing relative strength of the U.S. dollar, which reduced returns for U.S.-based investors. In local currency terms, non-U.S. developed market stocks generally advanced for the period. Global divergence of economic growth and central bank policy remained a prominent theme. As the U.S. continued to set itself apart from the rest of the developed world, with better relative economic growth and fewer central bank stimulus efforts in play, the U.S. dollar gained strength versus other currencies, where central bank stimulus plans remained in full force.
Meanwhile, stocks generated choppy performance. Early on, non-U.S. developed market stocks rallied and outpaced U.S. stocks as investors largely overlooked sluggish growth data, geopolitical concerns, and continued weakness among commodity prices to focus instead on supportive central bank policies from the European Central Bank (ECB) and Bank of Japan. In addition, lower oil prices and a weaker euro remained positive factors for Europe’s economic recovery. But those positive influences faded in late July, when Greece defaulted on its debt payment to the International Monetary Fund, sparking a sharp sell-off among global stocks. The sell-off intensified in the third quarter of 2015, as evidence emerged that China’s economy was cooling more than previously believed. In addition, oil and commodities prices dropped to new lows, due in part to falling demand from China. Anxiety about U.S. interest rate policy also remained a key theme, persisting even after the Fed decided in September 2015 to leave rates unchanged due to concerns about the state of the global economy. Stocks rallied again in October, after the ECB pledged to take additional steps to support the region’s economic recovery and China’s central bank cut interest rates for the sixth time in 12 months, but tumbled to close out the period in November.
Overall, the fund outperformed its benchmark primarily due to positioning in the consumer discretionary, energy, and information technology sectors. Regionally, stock selection in the U.K., Australia, and Germany, along with an underweight position relative to the benchmark in Australia, also contributed to the fund’s outperformance.
Drug Company was a Top Contributor
Among individual contributors to performance, an overweight position in Ono Pharmaceutical was a main contributor. The Japan-based pharmaceutical company posted strong results based on its cancer-fighting antibody treatment developed jointly with Bristol-Myers Squibb.
| * | All fund returns referenced in this commentary are for Institutional Class shares. Performance for other share classes will vary due to differences in fee structure; when Institutional Class performance exceeds that of the fund's benchmark, other share classes may not. See page 2 for returns for all share classes. |
3
In the outperforming information technology sector, an overweight position in Murata Manufacturing, a Japan-based manufacturer of electronic components for smart phone manufacturers, was a leading contributor to fund performance. The company’s stock performed well after Murata reported better-than-expected results early in the quarter, driven by strength in the smart phone market. The company also raised guidance based on strength in the radio frequency module business driven by expanded end-market use and market share gains. The improved guidance led to upward earnings revisions.
Within the outperforming consumer discretionary sector, an overweight position in Denmark-based Pandora drove the fund’s performance and was among the fund’s top overall performers. The jewelry and charm maker and retailer advanced on continued strong earnings growth and weak gold and silver prices. In addition, the company benefited from the timely release of new collections and the expansion of its retail network and online offerings.
Industrials Sector was Main Laggard
Stock selection in the industrials and consumer staples sectors and an underweight position in the telecommunication services sector detracted from relative performance. Regionally, portfolio-only positions in India and Mexico and stock selection in Switzerland weighed on relative results.
A portfolio-only position in Cemex, a Mexico-based building materials provider, was a main detractor. Volatility in currency exchange rates put pressure on the company’s stock price. The weakening peso weighed on earnings as the company has a large amount of U.S. dollar-denominated debt. We exited the position.
An overweight position in Bankia, a Spain-based commercial bank, was also a main detractor. The stock struggled early in the period due to weakness in European banks and concerns that continued quantitative easing (QE) would put pressure on banks’ net interest margins. Ultimately, Bankia’s net interest income declined and we became increasingly concerned about capital levels. We exited the position.
A portfolio-only position in ICICI Bank, an India-based bank, also detracted from relative performance. The stock suffered early in the period due to weaker-than-expected first-quarter 2015 results driven by sluggish loan growth and an increase in non-performing loans. The stock experienced additional losses in the third quarter of 2015, after reporting some deterioration in the quality of its loan portfolio. We exited the position.
Outlook
We will continue to focus on companies we believe demonstrate accelerating, sustainable earnings growth. As global growth has slowed and growth has become scarce, we have migrated the portfolio toward companies whose earnings are driven by structural or secular trends. In Europe, unemployment levels are lower, and expansion in money supply and credit growth suggest ECB policies are gaining traction. We expect weak oil prices and any additional QE from the ECB to support Europe’s recovery at the macroeconomic and company levels, but growth may remain modest. We also believe a weaker euro should continue to act as a tailwind, helping European manufacturers and exporters by making their goods more competitive in foreign markets. Similarly, QE has weakened the yen, and Japan-based manufacturers and exporters have benefited, but we expect this benefit to lessen in the future. We have begun to see improvements in the domestic economy, specifically in the consumer industries. We continue to have low exposure to emerging markets, as we believe those areas remain plagued by slowing growth and weakening currencies and commodity prices. We are searching for signs of bottoming in earnings trends.
4
| Fund Characteristics |
| NOVEMBER 30, 2015 | |
Top Ten Holdings | % of net assets |
| Roche Holding AG | 3.5% |
| Novartis AG | 2.5% |
| Nestle SA | 2.4% |
| Reckitt Benckiser Group plc | 2.3% |
| Pandora A/S | 2.2% |
| Intesa Sanpaolo SpA | 2.2% |
| AIA Group Ltd. | 1.9% |
| Total SA | 1.6% |
| Bayer AG | 1.6% |
| Murata Manufacturing Co. Ltd. | 1.6% |
Types of Investments in Portfolio | % of net assets |
| Common Stocks | 94.9% |
| Exchange-Traded Funds | 0.4% |
| Rights | —* |
| Total Equity Exposure | 95.3% |
| Temporary Cash Investments | 4.5% |
| Other Assets and Liabilities | 0.2% |
| *Category is less than 0.05% of total net assets. | |
Investments by Country | % of net assets |
| United Kingdom | 22.5% |
| Japan | 17.1% |
| France | 10.0% |
| Switzerland | 9.8% |
| Germany | 7.9% |
| Belgium | 3.5% |
| Ireland | 3.3% |
| Italy | 2.4% |
| Denmark | 2.2% |
| Netherlands | 2.2% |
| Sweden | 2.1% |
| Hong Kong | 2.1% |
| Other Countries | 9.8% |
| Exchange-Traded Funds | 0.4% |
| Cash and Equivalents** | 4.7% |
**Includes temporary cash investments and other assets and liabilities.
5
| Shareholder Fee Example |
Fund shareholders may incur two types of costs: (1) transaction costs, including sales charges (loads) on purchase payments and redemption/exchange fees; and (2) ongoing costs, including management fees; distribution and service (12b-1) fees; and other fund expenses. This example is intended to help you understand your ongoing costs (in dollars) of investing in your fund and to compare these costs with the ongoing cost of investing in other mutual funds.
The example is based on an investment of $1,000 made at the beginning of the period and held for the entire period from June 1, 2015 to November 30, 2015.
Actual Expenses
The table provides information about actual account values and actual expenses for each class. You may use the information, together with the amount you invested, to estimate the expenses that you paid over the period. First, identify the share class you own. Then simply divide your account value by $1,000 (for example, an $8,600 account value divided by $1,000 = 8.6), then multiply the result by the number under the heading “Expenses Paid During Period” to estimate the expenses you paid on your account during this period.
Hypothetical Example for Comparison Purposes
The table also provides information about hypothetical account values and hypothetical expenses based on the actual expense ratio of each class of your fund and an assumed rate of return of 5% per year before expenses, which is not the actual return of a fund’s share class. The hypothetical account values and expenses may not be used to estimate the actual ending account balance or expenses you paid for the period. You may use this information to compare the ongoing costs of investing in your fund and other funds. To do so, compare this 5% hypothetical example with the 5% hypothetical examples that appear in the shareholder reports of the other funds.
Please note that the expenses shown in the table are meant to highlight your ongoing costs only and do not reflect any transactional costs, such as sales charges (loads) or redemption/exchange fees. Therefore, the table is useful in comparing ongoing costs only, and will not help you determine the relative total costs of owning different funds. In addition, if these transactional costs were included, your costs would have been higher.
| Beginning Account Value 6/1/15 | Ending Account Value 11/30/15 | Expenses Paid During Period(1)6/1/15 - 11/30/15 | Annualized Expense Ratio(1) | |
Actual | ||||
| Institutional Class | $1,000 | $941.50 | $4.72 | 0.97% |
| R6 Class | $1,000 | $941.50 | $3.99 | 0.82% |
Hypothetical | ||||
| Institutional Class | $1,000 | $1,020.21 | $4.91 | 0.97% |
| R6 Class | $1,000 | $1,020.96 | $4.15 | 0.82% |
| (1) | Expenses are equal to the class's annualized expense ratio listed in the table above, multiplied by the average account value over the period, multiplied by 183, the number of days in the most recent fiscal half-year, divided by 365, to reflect the one-half year period. |
6
| Schedule of Investments |
NOVEMBER 30, 2015
| Shares | Value | |||
| COMMON STOCKS — 94.9% | ||||
| Australia — 0.7% | ||||
Qantas Airways Ltd.(1) | 2,226,218 | $ | 5,860,405 | |
| Austria — 1.0% | ||||
Erste Group Bank AG(1) | 269,410 | 8,266,092 | ||
| Belgium — 3.5% | ||||
| Anheuser-Busch InBev NV | 75,258 | 9,696,710 | ||
| KBC Groep NV | 201,450 | 12,025,570 | ||
| UCB SA | 85,870 | 7,668,155 | ||
| 29,390,435 | ||||
| Canada — 0.9% | ||||
| Alimentation Couche-Tard, Inc., B Shares | 170,540 | 7,774,514 | ||
| China — 1.8% | ||||
Baidu, Inc. ADR(1) | 27,770 | 6,053,027 | ||
| Tencent Holdings Ltd. | 479,500 | 9,542,442 | ||
| 15,595,469 | ||||
| Denmark — 2.2% | ||||
| Pandora A/S | 158,070 | 18,737,240 | ||
| France — 10.0% | ||||
| Accor SA | 154,280 | 6,510,399 | ||
| Arkema SA | 47,020 | 3,387,609 | ||
| Carrefour SA | 254,396 | 7,843,059 | ||
Criteo SA ADR(1) | 98,450 | 4,012,822 | ||
| Essilor International SA | 64,361 | 8,401,474 | ||
| Iliad SA | 14,510 | 3,236,276 | ||
| Ingenico Group SA | 28,190 | 3,548,780 | ||
| Legrand SA | 136,370 | 8,022,468 | ||
| LVMH Moet Hennessy Louis Vuitton SE | 49,140 | 8,242,118 | ||
| Pernod-Ricard SA | 58,670 | 6,676,083 | ||
Peugeot SA(1) | 143,620 | 2,565,952 | ||
| Total SA | 279,140 | 13,861,489 | ||
| Valeo SA | 49,770 | 7,706,255 | ||
| 84,014,784 | ||||
| Germany — 7.9% | ||||
| adidas AG | 58,090 | 5,621,334 | ||
| Bayer AG | 102,080 | 13,621,783 | ||
| Continental AG | 23,951 | 5,787,350 | ||
| Fresenius Medical Care AG & Co. KGaA | 144,320 | 11,924,034 | ||
| Symrise AG | 138,200 | 9,353,732 | ||
| Wirecard AG | 164,586 | 8,062,562 | ||
Zalando SE(1) | 367,462 | 12,462,564 | ||
| 66,833,359 | ||||
7
| Shares | Value | |||
| Hong Kong — 2.1% | ||||
| AIA Group Ltd. | 2,657,200 | $ | 15,867,564 | |
| Sands China Ltd. | 452,400 | 1,528,723 | ||
| 17,396,287 | ||||
| Indonesia — 0.3% | ||||
| PT Bank Mandiri (Persero) Tbk | 3,663,200 | 2,250,611 | ||
| Ireland — 3.3% | ||||
Bank of Ireland(1) | 23,136,856 | 8,629,169 | ||
| CRH plc | 168,210 | 4,949,564 | ||
| Ryanair Holdings plc ADR | 104,564 | 8,040,971 | ||
| Smurfit Kappa Group plc | 236,180 | 6,452,999 | ||
| 28,072,703 | ||||
| Israel — 0.5% | ||||
Mobileye NV(1) | 90,420 | 3,942,312 | ||
| Italy — 2.4% | ||||
| Intesa Sanpaolo SpA | 5,357,890 | 18,386,529 | ||
| Luxottica Group SpA | 24,524 | 1,640,155 | ||
| 20,026,684 | ||||
| Japan — 17.1% | ||||
| Calbee, Inc. | 65,000 | 2,687,652 | ||
| Daito Trust Construction Co. Ltd. | 44,100 | 4,581,958 | ||
| Fuji Heavy Industries Ltd. | 267,300 | 11,048,110 | ||
| Isuzu Motors Ltd. | 368,500 | 4,145,999 | ||
| Keyence Corp. | 12,200 | 6,612,380 | ||
| Kubota Corp. | 756,000 | 12,611,259 | ||
| Minebea Co. Ltd. | 247,000 | 2,710,780 | ||
| Mizuho Financial Group, Inc. | 2,899,600 | 5,853,376 | ||
| Murata Manufacturing Co. Ltd. | 87,100 | 13,514,297 | ||
| Nidec Corp. | 111,400 | 8,613,365 | ||
| Nintendo Co. Ltd. | 21,900 | 3,363,278 | ||
| Nitori Holdings Co. Ltd. | 98,400 | 8,105,410 | ||
| Olympus Corp. | 114,100 | 4,551,024 | ||
| Ono Pharmaceutical Co. Ltd. | 48,700 | 7,797,539 | ||
| ORIX Corp. | 696,500 | 10,051,440 | ||
| Ryohin Keikaku Co. Ltd. | 47,500 | 10,248,578 | ||
| Seven & i Holdings Co. Ltd. | 246,900 | 11,071,389 | ||
| Suzuki Motor Corp. | 315,600 | 9,703,867 | ||
| Unicharm Corp. | 332,400 | 7,009,833 | ||
| 144,281,534 | ||||
| Netherlands — 2.2% | ||||
| Akzo Nobel NV | 99,511 | 7,077,912 | ||
| ING Groep NV CVA | 205,380 | 2,819,839 | ||
NXP Semiconductors NV(1) | 93,350 | 8,724,491 | ||
| 18,622,242 | ||||
| Norway — 1.0% | ||||
| Statoil ASA | 537,340 | 8,310,003 | ||
8
| Shares | Value | |||
| Portugal — 1.2% | ||||
| Jeronimo Martins SGPS SA | 728,760 | $ | 10,113,571 | |
| South Korea — 0.5% | ||||
| Amorepacific Corp. | 11,550 | 4,024,373 | ||
| Spain — 1.9% | ||||
Cellnex Telecom SAU(1) | 243,940 | 4,431,749 | ||
| Industria de Diseno Textil SA | 327,475 | 11,784,542 | ||
| 16,216,291 | ||||
| Sweden — 2.1% | ||||
| Electrolux AB | 102,985 | 3,022,789 | ||
| Hexagon AB, B Shares | 93,480 | 3,392,238 | ||
Lundin Petroleum AB(1) | 249,310 | 3,987,565 | ||
| Svenska Cellulosa AB, B Shares | 242,734 | 7,002,210 | ||
| 17,404,802 | ||||
| Switzerland — 9.8% | ||||
| Actelion Ltd. | 27,910 | 3,919,906 | ||
| Chocoladefabriken Lindt & Spruengli AG | 920 | 5,548,525 | ||
| Credit Suisse Group AG | 103,110 | 2,216,837 | ||
| Nestle SA | 268,440 | 19,920,682 | ||
| Novartis AG | 251,236 | 21,476,606 | ||
| Roche Holding AG | 108,714 | 29,110,859 | ||
| 82,193,415 | ||||
| United Kingdom — 22.5% | ||||
| Admiral Group plc | 170,640 | 4,165,982 | ||
| ARM Holdings plc | 449,990 | 7,617,679 | ||
| Ashtead Group plc | 607,723 | 10,022,436 | ||
| Associated British Foods plc | 125,703 | 6,713,328 | ||
| Aviva plc | 1,022,450 | 7,876,644 | ||
| BAE Systems plc | 538,450 | 4,188,603 | ||
| Barclays plc | 2,339,860 | 7,865,703 | ||
| Bunzl plc | 292,460 | 8,457,095 | ||
| Carnival plc | 194,330 | 10,141,369 | ||
| Compass Group plc | 105,500 | 1,833,630 | ||
| Croda International plc | 106,630 | 4,605,874 | ||
| Inmarsat plc | 258,370 | 4,338,808 | ||
International Consolidated Airlines Group SA(1) | 1,005,662 | 8,587,932 | ||
| Johnson Matthey plc | 220,128 | 9,382,428 | ||
Liberty Global plc, Class A(1) | 162,880 | 6,907,741 | ||
| London Stock Exchange Group plc | 216,270 | 8,631,687 | ||
| Prudential plc | 429,940 | 9,968,758 | ||
| Reckitt Benckiser Group plc | 202,740 | 19,023,087 | ||
| Rio Tinto plc | 258,386 | 8,594,486 | ||
| Shire plc | 109,660 | 7,673,278 | ||
| St. James's Place plc | 565,700 | 8,656,322 | ||
| Whitbread plc | 72,728 | 4,981,678 | ||
| Wolseley plc | 184,070 | 10,684,353 | ||
Worldpay Group plc(1) | 1,951,247 | 8,786,926 | ||
| 189,705,827 | ||||
TOTAL COMMON STOCKS (Cost $702,653,472) | 799,032,953 | |||
9
| Shares | Value | |||
| EXCHANGE-TRADED FUNDS — 0.4% | ||||
iShares MSCI EAFE ETF (Cost $3,619,056) | 59,280 | $ | 3,595,332 | |
RIGHTS† | ||||
Switzerland† | ||||
Credit Suisse Group AG(1) (Cost $—) | 103,110 | 63,138 | ||
| TEMPORARY CASH INVESTMENTS — 4.5% | ||||
| Repurchase Agreement, Credit Suisse First Boston, Inc., (collateralized by various U.S. Treasury obligations, 0.625%, 8/31/17, valued at $12,802,445), in a joint trading account at 0.01%, dated 11/30/15, due 12/1/15 (Delivery value $12,554,906) | 12,554,903 | |||
| Repurchase Agreement, Fixed Income Clearing Corp., (collateralized by various U.S. Treasury obligations, 3.00%, 11/15/44, valued at $21,353,275), at 0.01%, dated 11/30/15, due 12/1/15 (Delivery value $20,930,006) | 20,930,000 | |||
| State Street Institutional Liquid Reserves Fund, Premier Class | 4,758,792 | 4,758,792 | ||
TOTAL TEMPORARY CASH INVESTMENTS (Cost $38,243,695) | 38,243,695 | |||
TOTAL INVESTMENT SECURITIES — 99.8% (Cost $744,516,223) | 840,935,118 | |||
| OTHER ASSETS AND LIABILITIES — 0.2% | 1,399,452 | |||
| TOTAL NET ASSETS — 100.0% | $ | 842,334,570 | ||
| MARKET SECTOR DIVERSIFICATION | ||
(as a % of net assets) | ||
| Consumer Discretionary | 18.3 | % |
| Financials | 16.4 | % |
| Consumer Staples | 14.9 | % |
| Health Care | 13.6 | % |
| Industrials | 10.4 | % |
| Information Technology | 10.3 | % |
| Materials | 6.5 | % |
| Energy | 3.1 | % |
| Telecommunication Services | 1.4 | % |
| Exchange-Traded Funds | 0.4 | % |
| Cash and Equivalents* | 4.7 | % |
*Includes temporary cash investments and other assets and liabilities.
| NOTES TO SCHEDULE OF INVESTMENTS | ||
| ADR | - | American Depositary Receipt |
| CVA | - | Certificaten Van Aandelen |
| † | Category is less than 0.05% of total net assets. |
| (1) | Non-income producing. |
See Notes to Financial Statements.
10
| Statement of Assets and Liabilities |
| NOVEMBER 30, 2015 | |||
| Assets | |||
| Investment securities, at value (cost of $744,516,223) | $ | 840,935,118 | |
| Cash | 165,174 | ||
| Foreign currency holdings, at value (cost of $393,171) | 380,222 | ||
| Receivable for investments sold | 1,249,145 | ||
| Receivable for capital shares sold | 1,419 | ||
| Dividends and interest receivable | 1,875,483 | ||
| Other assets | 34,007 | ||
| 844,640,568 | |||
| Liabilities | |||
| Payable for investments purchased | 1,460,730 | ||
| Payable for capital shares redeemed | 191,643 | ||
| Accrued management fees | 653,625 | ||
| 2,305,998 | |||
| Net Assets | $ | 842,334,570 | |
| Net Assets Consist of: | |||
| Capital (par value and paid-in surplus) | $ | 721,997,689 | |
| Undistributed net investment income | 2,418,163 | ||
| Undistributed net realized gain | 21,636,450 | ||
| Net unrealized appreciation | 96,282,268 | ||
| $ | 842,334,570 | ||
| Net Assets | Shares Outstanding | Net Asset Value Per Share | ||||
| Institutional Class, $0.01 Par Value | $795,985,233 | 72,718,974 | $10.95 | |||
| R6 Class, $0.01 Par Value | $46,349,337 | 4,231,122 | $10.95 | |||
See Notes to Financial Statements.
11
| Statement of Operations |
| YEAR ENDED NOVEMBER 30, 2015 | |||
| Investment Income (Loss) | |||
| Income: | |||
| Dividends (net of foreign taxes withheld of $1,392,559) | $ | 14,356,473 | |
| Interest | 6,344 | ||
| 14,362,817 | |||
| Expenses: | |||
| Management fees | 8,272,268 | ||
| Directors' fees and expenses | 30,606 | ||
| Other expenses | 26,273 | ||
| 8,329,147 | |||
| Net investment income (loss) | 6,033,670 | ||
| Realized and Unrealized Gain (Loss) | |||
| Net realized gain (loss) on: | |||
| Investment transactions (net of foreign tax expenses paid (refunded) of $1,628) | 24,984,577 | ||
| Futures contract transactions | 769,125 | ||
| Foreign currency transactions | (210,557 | ) | |
| 25,543,145 | |||
| Change in net unrealized appreciation (depreciation) on: | |||
| Investments (includes (increase) decrease in accrued foreign taxes of $72,650) | (36,282,064 | ) | |
| Translation of assets and liabilities in foreign currencies | (24,882 | ) | |
| (36,306,946 | ) | ||
| Net realized and unrealized gain (loss) | (10,763,801 | ) | |
| Net Increase (Decrease) in Net Assets Resulting from Operations | $ | (4,730,131 | ) |
See Notes to Financial Statements.
12
| Statement of Changes in Net Assets |
| YEARS ENDED NOVEMBER 30, 2015 AND NOVEMBER 30, 2014 | ||||||
| Increase (Decrease) in Net Assets | November 30, 2015 | November 30, 2014 | ||||
| Operations | ||||||
| Net investment income (loss) | $ | 6,033,670 | $ | 7,511,178 | ||
| Net realized gain (loss) | 25,543,145 | 33,716,076 | ||||
| Change in net unrealized appreciation (depreciation) | (36,306,946 | ) | (29,305,556 | ) | ||
| Net increase (decrease) in net assets resulting from operations | (4,730,131 | ) | 11,921,698 | |||
| Distributions to Shareholders | ||||||
| From net investment income: | ||||||
| Institutional Class | (4,445,815 | ) | (10,834,636 | ) | ||
| R6 Class | (177,103 | ) | (101,158 | ) | ||
| From net realized gains: | ||||||
| Institutional Class | (32,506,946 | ) | (34,990,441 | ) | ||
| R6 Class | (994,137 | ) | (295,487 | ) | ||
| Decrease in net assets from distributions | (38,124,001 | ) | (46,221,722 | ) | ||
| Capital Share Transactions | ||||||
| Net increase (decrease) in net assets from capital share transactions (Note 5) | (81,703,913 | ) | 223,587,166 | |||
| Net increase (decrease) in net assets | (124,558,045 | ) | 189,287,142 | |||
| Net Assets | ||||||
| Beginning of period | 966,892,615 | 777,605,473 | ||||
| End of period | $ | 842,334,570 | $ | 966,892,615 | ||
| Undistributed net investment income | $ | 2,418,163 | $ | 1,241,949 | ||
See Notes to Financial Statements.
13
| Notes to Financial Statements |
NOVEMBER 30, 2015
1. Organization
American Century World Mutual Funds, Inc. (the corporation) is registered under the Investment Company Act of 1940, as amended (the 1940 Act), as an open-end management investment company and is organized as a Maryland corporation. NT International Growth Fund (the fund) is one fund in a series issued by the corporation. The fund is diversified as defined under the 1940 Act. The fund’s investment objective is to seek capital growth. The fund is not permitted to invest in securities issued by companies assigned the Global Industry Classification Standard for the tobacco industry.
The fund offers the Institutional Class and the R6 Class, which have different fees and expenses. The difference in the fee structures between the classes is not the result of any difference in advisory or custodial fees or other expenses related to management of the fund’s assets, which do not vary by class. The fund’s R6 Class shares are available for purchase exclusively by certain American Century Investments funds of funds that are offered only through employer-sponsored retirement plans where a financial intermediary provides retirement recordkeeping services to plan participants. Because financial intermediaries do not receive any service, distribution or administrative fees for offering such funds of funds, American Century Investment Management, Inc. (ACIM) (the investment advisor) is able to charge the R6 Class a lower unified management fee.
2. Significant Accounting Policies
The following is a summary of significant accounting policies consistently followed by the fund in preparation of its financial statements. The fund is an investment company and follows accounting and reporting guidance in accordance with accounting principles generally accepted in the United States of America. This may require management to make certain estimates and assumptions at the date of the financial statements. Actual results could differ from these estimates. Management evaluated the impact of events or transactions occurring through the date the financial statements were issued that would merit recognition or disclosure.
Investment Valuations — The fund determines the fair value of its investments and computes its net asset value per share at the close of regular trading (usually 4 p.m. Eastern time) on the New York Stock Exchange (NYSE) on each day the NYSE is open. The Board of Directors has adopted valuation policies and procedures to guide the investment advisor in the fund’s investment valuation process and to provide methodologies for the oversight of the fund’s pricing function.
Equity securities that are listed or traded on a domestic securities exchange are valued at the last reported sales price or at the official closing price as provided by the exchange. Equity securities traded on foreign securities exchanges are generally valued at the closing price of such securities on the exchange where primarily traded or at the close of the NYSE, if that is earlier. If no last sales price is reported, or if local convention or regulation so provides, the mean of the latest bid and asked prices may be used. Securities traded over-the-counter are valued at the mean of the latest bid and asked prices, the last sales price, or the official closing price. Equity securities initially expressed in local currencies are translated into U.S. dollars at the mean of the appropriate currency exchange rate at the close of the NYSE as provided by an independent pricing service.
Open-end management investment companies are valued at the reported net asset value per share. Repurchase agreements are valued at cost, which approximates fair value. Exchange-traded futures contracts are valued at the settlement price as provided by the appropriate clearing corporation.
If the fund determines that the market price for an investment is not readily available or the valuation methods mentioned above do not reflect an investment’s fair value, such investment is valued as determined in good faith by the Board of Directors or its delegate, in accordance with policies and procedures adopted by the Board of Directors. In its determination of fair value, the fund may review several factors including, but not limited to, market information regarding the specific investment or comparable investments and correlation with other investment types, futures indices or general market indicators. Circumstances that may cause the fund to use these procedures to value an investment include, but are not limited to: an investment has been declared in default or is distressed; trading in a security has been suspended during the trading day or a
14
security is not actively trading on its principal exchange; prices received from a regular pricing source are deemed unreliable; or there is a foreign market holiday and no trading occurred.
The fund monitors for significant events occurring after the close of an investment’s primary exchange but before the fund’s net asset value per share is determined. Significant events may include, but are not limited to: corporate announcements and transactions; governmental action and political unrest that could impact a specific investment or an investment sector; or armed conflicts, natural disasters and similar events that could affect investments in a specific country or region. The fund also monitors for significant fluctuations between domestic and foreign markets, as evidenced by the U.S. market or such other indicators that the Board of Directors, or its delegate, deems appropriate. If significant fluctuations in foreign markets are identified, the fund may apply a model-derived factor to the closing price of equity securities traded on foreign securities exchanges. The factor is based on observable market data as provided by an independent pricing service.
Security Transactions — Security transactions are accounted for as of the trade date. Net realized gains and losses are determined on the identified cost basis, which is also used for federal income tax purposes. Certain countries impose taxes on realized gains on the sale of securities registered in their country. The fund records the foreign tax expense, if any, on an accrual basis. The foreign tax expense on realized gains and unrealized appreciation reduces the net realized gain (loss) on investment transactions and net unrealized appreciation (depreciation) on investments, respectively.
Investment Income — Dividend income less foreign taxes withheld, if any, is recorded as of the ex-dividend date. Distributions received on securities that represent a return of capital or long-term capital gain are recorded as a reduction of cost of investments and/or as a realized gain. The fund may estimate the components of distributions received that may be considered nontaxable distributions or long-term capital gain distributions for income tax purposes. Interest income is recorded on the accrual basis and includes accretion of discounts and amortization of premiums.
Foreign Currency Translations — All assets and liabilities initially expressed in foreign currencies are translated into U.S. dollars at prevailing exchange rates at period end. The fund may enter into spot foreign currency exchange contracts to facilitate transactions denominated in a foreign currency. Purchases and sales of investment securities, dividend and interest income, spot foreign currency exchange contracts, and expenses are translated at the rates of exchange prevailing on the respective dates of such transactions. Net realized and unrealized foreign currency exchange gains or losses related to investment securities are a component of net realized gain (loss) on investment transactions and change in net unrealized appreciation (depreciation) on investments, respectively.
Repurchase Agreements — The fund may enter into repurchase agreements with institutions that ACIM has determined are creditworthy pursuant to criteria adopted by the Board of Directors. The fund requires that the collateral, represented by securities, received in a repurchase transaction be transferred to the custodian in a manner sufficient to enable the fund to obtain those securities in the event of a default under the repurchase agreement. ACIM monitors, on a daily basis, the securities transferred to ensure the value, including accrued interest, of the securities under each repurchase agreement is equal to or greater than amounts owed to the fund under each repurchase agreement.
Joint Trading Account — Pursuant to an Exemptive Order issued by the Securities and Exchange Commission, the fund, along with certain other funds in the American Century Investments family of funds, may transfer uninvested cash balances into a joint trading account. These balances are invested in one or more repurchase agreements that are collateralized by U.S. Treasury or Agency obligations.
Segregated Assets — In accordance with the 1940 Act, the fund segregates assets on its books and records to cover futures contracts. ACIM monitors, on a daily basis, the securities segregated to ensure the fund designates a sufficient amount of liquid assets, marked-to-market daily. The fund may also receive assets or be required to pledge assets at the custodian bank or with a broker for margin requirements on futures contracts.
Income Tax Status — It is the fund’s policy to distribute substantially all net investment income and net realized gains to shareholders and to otherwise qualify as a regulated investment company under provisions of the Internal Revenue Code. Accordingly, no provision has been made for income taxes. The fund files U.S. federal, state, local and non-U.S. tax returns as applicable. The fund's tax returns are subject to examination by the relevant taxing authority until expiration of the applicable statute of limitations, which is generally three years from the date of filing but can be longer in certain jurisdictions. At this time, management believes there are no uncertain tax positions which, based on their technical merit, would not be sustained upon examination
15
and for which it is reasonably possible that the total amounts of unrecognized tax benefits will significantly change in the next twelve months.
Multiple Class — All shares of the fund represent an equal pro rata interest in the net assets of the class to which such shares belong, and have identical voting, dividend, liquidation and other rights and the same terms and conditions, except for class specific expenses and exclusive rights to vote on matters affecting only individual classes. Income, non-class specific expenses, and realized and unrealized capital gains and losses of the fund are allocated to each class of shares based on their relative net assets.
Distributions to Shareholders — Distributions from net investment income and net realized gains, if any, are generally declared and paid annually. The fund may make distributions on a more frequent basis to comply with the distribution requirements of the Internal Revenue Code, in all events in a manner consistent with provisions of the 1940 Act. The fund may elect to treat a portion of its payment to a redeeming shareholder, which represents the pro rata share of undistributed net investment income and net realized gains, as a distribution for federal income tax purposes (tax equalization).
Indemnifications — Under the corporation’s organizational documents, its officers and directors are indemnified against certain liabilities arising out of the performance of their duties to the fund. In addition, in the normal course of business, the fund enters into contracts that provide general indemnifications. The maximum exposure under these arrangements is unknown as this would involve future claims that may be made against a fund. The risk of material loss from such claims is considered by management to be remote.
3. Fees and Transactions with Related Parties
Certain officers and directors of the corporation are also officers and/or directors of American Century Companies, Inc. (ACC). The corporation’s investment advisor, ACIM, the corporation's distributor, American Century Investment Services, Inc., and the corporation’s transfer agent, American Century Services, LLC, are wholly owned, directly or indirectly, by ACC. Various funds issued by American Century Asset Allocation Portfolios, Inc. own, in aggregate, 100% of the shares of the fund. Related parties do not invest in the fund for the purpose of exercising management or control.
Management Fees —The corporation has entered into a management agreement with ACIM, under which ACIM provides the fund with investment advisory and management services in exchange for a single, unified management fee (the fee) per class. The agreement provides that all expenses of managing and operating the fund, except distribution and service fees, brokerage expenses, taxes, interest, fees and expenses of the independent directors (including legal counsel fees), and extraordinary expenses, will be paid by ACIM. The fee is computed and accrued daily based on each class’s daily net assets and paid monthly in arrears. The rate of the fee is determined by applying a fee rate calculation formula. This formula takes into account the fund’s assets as well as certain assets, if any, of other clients of the investment advisor outside the American Century Investments family of funds (such as subadvised funds and separate accounts) that have very similar investment teams and investment strategies (strategy assets). The strategy assets of the fund also include the assets of International Growth Fund, one fund in a series issued by the corporation. The annual management fee schedule ranges from 0.850% to 1.300% for the Institutional Class and 0.700% to 1.150% for the R6 Class. The effective annual management fee for each class for the year ended November 30, 2015 was 0.96% for the Institutional Class and 0.81% for the R6 Class.
Directors' Fees and Expenses — The Board of Directors is responsible for overseeing the investment advisor’s management and operations of the fund. The directors receive detailed information about the fund and its investment advisor regularly throughout the year, and meet at least quarterly with management of the investment advisor to review reports about fund operations. The fund’s officers do not receive compensation from the fund.
Acquired Fund Fees and Expenses — The fund may invest in mutual funds, exchange-traded funds, and
business development companies (the acquired funds). The fund will indirectly realize its pro rata share of the
fees and expenses of the acquired funds in which it invests. These indirect fees and expenses are not paid
out of the fund's assets but are reflected in the return realized by the fund on its investment in the acquired
funds.
4. Investment Transactions
Purchases and sales of investment securities, excluding short-term investments, for the year ended November 30, 2015 were $694,915,254 and $820,260,990, respectively.
16
5. Capital Share Transactions
Transactions in shares of the fund were as follows:
Year ended November 30, 2015 | Year ended November 30, 2014 | |||||||||
| Shares | Amount | Shares | Amount | |||||||
| Institutional Class/Shares Authorized | 520,000,000 | 250,000,000 | ||||||||
| Sold | 20,052,758 | $ | 221,419,288 | 17,236,169 | $ | 198,956,960 | ||||
| Issued in reinvestment of distributions | 3,473,004 | 36,952,761 | 4,106,190 | 45,825,077 | ||||||
| Redeemed | (31,869,055 | ) | (359,661,904 | ) | (3,650,915 | ) | (42,916,826 | ) | ||
| (8,343,293 | ) | (101,289,855 | ) | 17,691,444 | 201,865,211 | |||||
| R6 Class/Shares Authorized | 40,000,000 | 50,000,000 | ||||||||
| Sold | 3,382,368 | 37,379,941 | 2,044,961 | 23,470,447 | ||||||
| Issued in reinvestment of distributions | 110,183 | 1,171,240 | 35,574 | 396,645 | ||||||
| Redeemed | (1,696,365 | ) | (18,965,239 | ) | (184,284 | ) | (2,145,137 | ) | ||
| 1,796,186 | 19,585,942 | 1,896,251 | 21,721,955 | |||||||
| Net increase (decrease) | (6,547,107 | ) | $ | (81,703,913 | ) | 19,587,695 | $ | 223,587,166 | ||
6. Fair Value Measurements
The fund’s investments valuation process is based on several considerations and may use multiple inputs to determine the fair value of the investments held by the fund. In conformity with accounting principles generally accepted in the United States of America, the inputs used to determine a valuation are classified into three broad levels.
| • | Level 1 valuation inputs consist of unadjusted quoted prices in an active market for identical investments. |
| • | Level 2 valuation inputs consist of direct or indirect observable market data (including quoted prices for comparable investments, evaluations of subsequent market events, interest rates, prepayment speeds, credit risk, etc.). These inputs also consist of quoted prices for identical investments initially expressed in local currencies that are adjusted through translation into U.S. dollars. |
| • | Level 3 valuation inputs consist of unobservable data (including a fund’s own assumptions). |
The level classification is based on the lowest level input that is significant to the fair valuation measurement. The valuation inputs are not necessarily an indication of the risks associated with investing in these securities or other financial instruments. There were no significant transfers between levels during the period.
The following is a summary of the level classifications as of period end. The Schedule of Investments provides additional information on the fund’s portfolio holdings.
| Level 1 | Level 2 | Level 3 | ||||||
| Assets | ||||||||
| Investment Securities | ||||||||
| Common Stocks | $ | 37,681,364 | $ | 761,351,589 | — | |||
| Exchange-Traded Funds | 3,595,332 | — | — | |||||
| Rights | — | 63,138 | — | |||||
| Temporary Cash Investments | 4,758,792 | 33,484,903 | — | |||||
| $ | 46,035,488 | $ | 794,899,630 | — | ||||
7. Derivative Instruments
Equity Price Risk — The fund is subject to equity price risk in the normal course of pursuing its investment objectives. A fund may enter into futures contracts based on an equity index in order to manage its exposure to changes in market conditions. A fund may purchase futures contracts to gain exposure to increases in market value or sell futures contracts to protect against a decline in market value. Upon entering into a futures contract, a fund is required to deposit either cash or securities in an amount equal to a certain percentage of the contract value (initial margin). Subsequent payments (variation margin) are made or received daily, in cash, by a fund. The variation margin is equal to the daily change in the contract value and is recorded as
17
unrealized gains and losses. A fund recognizes a realized gain or loss when the contract is closed or expires. Net realized and unrealized gains or losses occurring during the holding period of futures contracts are a component of net realized gain (loss) on futures contract transactions and change in net unrealized appreciation (depreciation) on futures contracts, respectively. One of the risks of entering into futures contracts is the possibility that the change in value of the contract may not correlate with the changes in value of the underlying securities. During the period, the fund participated in equity price risk derivative instruments for temporary investment purposes.
At period end, the fund did not have any derivative instruments disclosed on the Statement of Assets and Liabilities. For the year ended November 30, 2015, the effect of equity price risk derivative instruments on the Statement of Operations was $769,125 in net realized gain (loss) on futures contract transactions.
8. Risk Factors
There are certain risks involved in investing in foreign securities. These risks include those resulting from future adverse political, social and economic developments, fluctuations in currency exchange rates, the possible imposition of exchange controls, and other foreign laws or restrictions. Investing in emerging markets may accentuate these risks.
9. Federal Tax Information
On December 22, 2015, the fund declared and paid a per-share distribution from net realized gains to shareholders of record on December 21, 2015 of $0.3360 for the Institutional Class and R6 Class.
On December 22, 2015, the fund declared and paid the following per-share distributions from net investment income to shareholders of record on December 21, 2015:
| Institutional Class | R6 Class |
| $0.0800 | $0.0960 |
The tax character of distributions paid during the years ended November 30, 2015 and November 30, 2014 were as follows:
| 2015 | 2014 | |||||
| Distributions Paid From | ||||||
| Ordinary income | $ | 4,622,918 | $ | 10,935,794 | ||
| Long-term capital gains | $ | 33,501,083 | $ | 35,285,928 | ||
The book-basis character of distributions made during the year from net investment income or net realized gains may differ from their ultimate characterization for federal income tax purposes. These differences reflect the differing character of certain income items and net realized gains and losses for financial statement and tax purposes, and may result in reclassification among certain capital accounts on the financial statements.
As of November 30, 2015, the federal tax cost of investments and the components of distributable earnings on a tax-basis were as follows:
| Federal tax cost of investments | $ | 751,624,416 | |
| Gross tax appreciation of investments | $ | 108,120,205 | |
| Gross tax depreciation of investments | (18,809,503 | ) | |
| Net tax appreciation (depreciation) of investments | 89,310,702 | ||
| Net tax appreciation (depreciation) on derivatives and translation of assets and liabilities in foreign currencies | (136,723 | ) | |
| Net tax appreciation (depreciation) | $ | 89,173,979 | |
| Undistributed ordinary income | $ | 6,022,669 | |
Accumulated long-term gains | $ | 25,140,233 | |
The difference between book-basis and tax-basis unrealized appreciation (depreciation) is attributable primarily to the tax deferral of losses on wash sales and the realization for tax purposes of unrealized gains (losses) on investments in passive foreign investment companies.
18
| Financial Highlights |
| For a Share Outstanding Throughout the Years Ended November 30 (except as noted) | |||||||||||||||
| Per-Share Data | Ratios and Supplemental Data | ||||||||||||||
| Income From Investment Operations: | Distributions From: | Ratio to Average Net Assets of: | |||||||||||||
Net Asset Value, Beginning of Period | Net Investment Income (Loss)(1) | Net Realized and Unrealized Gain (Loss) | Total From Investment Operations | Net Investment Income | Net Realized Gains | Total Distributions | Net Asset Value, End of Period | Total Return(2) | Operating Expenses | Net Investment Income (Loss) | Portfolio Turnover Rate | Net Assets, End of Period (in thousands) | |||
| Institutional Class | |||||||||||||||
| 2015 | $11.58 | 0.08 | (0.26) | (0.18) | (0.05) | (0.40) | (0.45) | $10.95 | (1.44)% | 0.97% | 0.69% | 83% | $795,985 | ||
| 2014 | $12.17 | 0.10 | 0.03 | 0.13 | (0.17) | (0.55) | (0.72) | $11.58 | 1.26% | 0.98% | 0.86% | 67% | $938,672 | ||
| 2013 | $9.94 | 0.11 | 2.27 | 2.38 | (0.15) | — | (0.15) | $12.17 | 24.27% | 1.02% | 1.01% | 89% | $771,045 | ||
| 2012 | $8.71 | 0.13 | 1.17 | 1.30 | (0.07) | — | (0.07) | $9.94 | 15.13% | 1.08% | 1.47% | 93% | $487,964 | ||
| 2011 | $9.11 | 0.10 | (0.41) | (0.31) | (0.09) | — | (0.09) | $8.71 | (3.47)% | 1.12% | 1.04% | 77% | $345,234 | ||
| R6 Class | |||||||||||||||
| 2015 | $11.59 | 0.10 | (0.27) | (0.17) | (0.07) | (0.40) | (0.47) | $10.95 | (1.37)% | 0.82% | 0.84% | 83% | $46,349 | ||
| 2014 | $12.18 | 0.11 | 0.04 | 0.15 | (0.19) | (0.55) | (0.74) | $11.59 | 1.43% | 0.83% | 1.01% | 67% | $28,220 | ||
2013(3) | $11.13 | (0.01) | 1.06 | 1.05 | — | — | — | $12.18 | 9.43% | 0.85%(4) | (0.34)%(4) | 89%(5) | $6,561 | ||
| Notes to Financial Highlights |
| (1) | Computed using average shares outstanding throughout the period. |
| (2) | Total returns are calculated based on the net asset value of the last business day. Total returns for periods less than one year are not annualized. |
| (3) | July 26, 2013 (commencement of sale) through November 30, 2013. |
| (4) | Annualized. |
| (5) | Portfolio turnover is calculated at the fund level. Percentage indicated was calculated for the year ended November 30, 2013. |
See Notes to Financial Statements.
19
| Report of Independent Registered Public Accounting Firm |
To the Board of Directors and Shareholders of American Century World Mutual Funds, Inc.:
We have audited the accompanying statement of assets and liabilities, including the schedule of investments, of NT International Growth Fund (the “Fund”), one of the funds constituting American Century World Mutual Funds, Inc., as of November 30, 2015, and the related statement of operations for the year then ended, the statements of changes in net assets for each of the two years in the period then ended, and the financial highlights for each of the periods presented. These financial statements and financial highlights are the responsibility of the Fund’s management. Our responsibility is to express an opinion on these financial statements and financial highlights based on our audits.
We conducted our audits in accordance with the standards of the Public Company Accounting Oversight Board (United States). Those standards require that we plan and perform the audit to obtain reasonable assurance about whether the financial statements and financial highlights are free of material misstatement. The Fund is not required to have, nor were we engaged to perform, an audit of its internal control over financial reporting. Our audits included consideration of internal control over financial reporting as a basis for designing audit procedures that are appropriate in the circumstances, but not for the purpose of expressing an opinion on the effectiveness of the Fund’s internal control over financial reporting. Accordingly, we express no such opinion. An audit also includes examining, on a test basis, evidence supporting the amounts and disclosures in the financial statements, assessing the accounting principles used and significant estimates made by management, as well as evaluating the overall financial statement presentation. Our procedures included confirmation of securities owned as of November 30, 2015, by correspondence with the custodian and brokers; when replies were not received from brokers, we performed other auditing procedures. We believe that our audits provide a reasonable basis for our opinion.
In our opinion, the financial statements and financial highlights referred to above present fairly, in all material respects, the financial position of NT International Growth Fund of American Century World Mutual Funds, Inc. as of November 30, 2015, the results of its operations for the year then ended, the changes in its net assets for each of the two years in the period then ended, and the financial highlights for each of the periods presented, in conformity with accounting principles generally accepted in the United States of America.
DELOITTE & TOUCHE LLP
Kansas City, Missouri
January 19, 2016
20
| Management |
The Board of Directors
The individuals listed below serve as directors of the funds. Each director will continue to serve in this capacity until death, retirement, resignation or removal from office. The board has adopted a mandatory retirement age for directors who are not “interested persons,” as that term is defined in the Investment Company Act (independent directors). Independent directors shall retire by December 31 of the year in which they reach their 75th birthday.
Mr. Thomas is an “interested person” because he currently serves as President and Chief Executive Officer of American Century Companies, Inc. (ACC), the parent company of American Century Investment Management, Inc. (ACIM or the advisor). Mr. Fink is treated as an “interested person” because of his recent employment with ACC and American Century Services, LLC (ACS). The other directors (more than three-fourths of the total number) are independent. They are not employees, directors or officers of, and have no financial interest in, ACC or any of its wholly owned, direct or indirect, subsidiaries, including ACIM, American Century Investment Services, Inc. (ACIS) and ACS, and they do not have any other affiliations, positions or relationships that would cause them to be considered “interested persons” under the Investment Company Act. The directors serve in this capacity for seven (in the case of Mr. Thomas, 15) registered investment companies in the American Century Investments family of funds.
The following table presents additional information about the directors. The mailing address for each director is 4500 Main Street, Kansas City, Missouri 64111.
Name (Year of Birth) | Position(s) Held with Funds | Length of Time Served | Principal Occupation(s) During Past 5 Years | Number of American Century Portfolios Overseen by Director | Other Directorships Held During Past 5 Years |
| Independent Directors | |||||
Thomas A. Brown(1) (1940) | Director | Since 1980 | Managing Member, Associated Investments, LLC (real estate investment company) | 80 | None |
| Andrea C. Hall (1945) | Director | Since 1997 | Retired | 80 | None |
| Jan M. Lewis (1957) | Director | Since 2011 | Retired; President and Chief Executive Officer, Catholic Charities of Northeast Kansas (human services organization) (2006 to 2013) | 80 | None |
| James A. Olson (1942) | Director and Chairman of the Board | Since 2007 (Chairman since 2014) | Member, Plaza Belmont LLC (private equity fund manager) | 80 | Saia, Inc. (2002 to 2012) and EPR Properties (2003 to 2013) |
| M. Jeannine Strandjord (1945) | Director | Since 1994 | Retired | 80 | Euronet Worldwide Inc.; MGP Ingredients, Inc.; Charming Shoppes, Inc. (2006 to 2010); and DST Systems Inc. (1996 to 2012) |
| John R. Whitten (1946) | Director | Since 2008 | Retired | 80 | Rudolph Technologies, Inc. |
21
| Name (Year of Birth) | Position(s) Held with Funds | Length of Time Served | Principal Occupation(s) During Past 5 Years | Number of American Century Portfolios Overseen by Director | Other Directorships Held During Past 5 Years |
| Independent Directors | |||||
| Stephen E. Yates (1948) | Director | Since 2012 | Retired; Executive Vice President, Technology & Operations, KeyCorp. (computer services) (2004 to 2010) | 80 | Applied Industrial Technologies, Inc. (2001 to 2010) |
| Interested Directors | |||||
| Barry Fink (1955) | Director | Since 2012 | Retired; Executive Vice President, ACC (September 2007 to February 2013); President, ACS (October 2007 to February 2013); Chief Operating Officer, ACC (September 2007 to November 2012) | 80 | None |
| Jonathan S. Thomas (1963) | Director and President | Since 2007 | President and Chief Executive Officer, ACC (March 2007 to present). Also serves as Chief Executive Officer, ACS; Executive Vice President, ACIM; Director, ACC, ACIM and other ACC subsidiaries | 125 | BioMed Valley Discoveries, Inc. |
(1) Thomas A. Brown retired as Director of the Board effective December 31, 2015.
The Statement of Additional Information has additional information about the fund's directors and is available without charge, upon request, by calling 1-800-345-2021.
22
Officers
The following table presents certain information about the executive officers of the funds. Each officer serves as an officer for each of the 15 investment companies in the American Century family of funds, unless otherwise noted. No officer is compensated for his or her service as an officer of the funds. The listed officers are interested persons of the funds and are appointed or re-appointed on an annual basis. The mailing address for each officer listed below is 4500 Main Street, Kansas City, Missouri 64111.
Name (Year of Birth) | Offices with the Funds | Principal Occupation(s) During the Past Five Years |
| Jonathan S. Thomas (1963) | Director and President since 2007 | President and Chief Executive Officer, ACC (March 2007 to present). Also serves as Chief Executive Officer, ACS; Executive Vice President, ACIM; Director, ACC, ACIM and other ACC subsidiaries |
| Amy D. Shelton (1964) | Chief Compliance Officer and Vice President since 2014 | Chief Compliance Officer, American Century funds, (March 2014 to present); Chief Compliance Officer, ACIM (February 2014 to present); Chief Compliance Officer, ACIS (October 2009 to present); Vice President, Client Interactions and Marketing, ACIS (February 2013 to January 2014); Director, Client Interactions and Marketing, ACIS (June 2007 to January 2013). Also serves as Vice President, ACIS |
| Charles A. Etherington (1957) | General Counsel since 2007 and Senior Vice President since 2006 | Attorney, ACC (February 1994 to present); Vice President, ACC (November 2005 to present); General Counsel, ACC (March 2007 to present). Also serves as General Counsel, ACIM, ACS, ACIS and other ACC subsidiaries; and Senior Vice President, ACIM and ACS |
| C. Jean Wade (1964) | Vice President, Treasurer and Chief Financial Officer since 2012 | Vice President, ACS (February 2000 to present) |
| Robert J. Leach (1966) | Vice President since 2006 and Assistant Treasurer since 2012 | Vice President, ACS (February 2000 to present) |
| David H. Reinmiller (1963) | Vice President since 2000 | Attorney, ACC (January 1994 to present); Associate General Counsel, ACC (January 2001 to present). Also serves as Vice President, ACIM and ACS |
| Ward D. Stauffer (1960) | Secretary since 2005 | Attorney, ACC (June 2003 to present) |
23
| Approval of Management Agreement |
At a meeting held on June 30, 2015, the Fund’s Board of Directors unanimously approved the renewal of the management agreement pursuant to which American Century Investment Management, Inc. (the “Advisor”) acts as the investment advisor for the Fund. Under Section 15(c) of the Investment Company Act, contracts for investment advisory services are required to be reviewed, evaluated, and approved by a majority of a fund’s directors (the “Directors”), including a majority of the independent Directors, each year.
Prior to its consideration of the renewal of the management agreement, the Directors requested and reviewed extensive data and information compiled by the Advisor and certain independent providers of evaluation data concerning the Fund and the services provided to the Fund by the Advisor. This review was in addition to the oversight and evaluation undertaken by the Board and its committees on a continuous basis and the information received was supplemental to the extensive information that the Board and its committees receive and consider throughout the year.
In connection with its consideration of the renewal of the management agreement, the Board’s review and evaluation of the services provided by the Advisor included, but was not limited to, the following:
| • | the nature, extent, and quality of investment management, shareholder services, and other services provided by the Advisor to the Fund; |
| • | the wide range of other programs and services the Advisor provides to the Fund and its shareholders on a routine and non-routine basis; |
| • | the Fund’s investment performance compared to appropriate benchmarks and/or a peer group of other mutual funds with similar investment objectives and strategies; |
| • | the cost of owning the Fund compared to the cost of owning similar funds; |
| • | the compliance policies, procedures, and regulatory experience of the Fund's service providers; |
| • | financial data showing the cost of services provided to the Fund, the profitability of the Fund to the Advisor, and the overall profitability of the Advisor; |
| • | possible economies of scale associated with the Advisor’s management of the Fund and other accounts under its management; |
| • | data comparing services provided and charges to the Advisor's other investment management clients; |
| • | acquired fund fees and expenses; |
| • | payments by the Fund and the Advisor to financial intermediaries; and |
| • | any collateral benefits derived by the Advisor from the management of the Fund. |
In keeping with their practice, the Directors held two in-person meetings and one telephonic meeting to review and discuss the information provided. The independent Directors also had the benefit of the advice of their independent counsel throughout the process.
Factors Considered
The Directors considered all of the information provided by the Advisor, the independent data providers, and independent counsel in connection with the approval. They determined that the information was sufficient for them to evaluate the management agreement for the Fund. In connection with their review, the Directors did not identify any single factor as being all-important or controlling, and each Director may have attributed different levels of importance to different factors. In deciding to renew the management agreement, the Board based its decision on a number of factors, including the following:
24
Nature, Extent and Quality of Services - Generally. Under the management agreement, the Advisor is responsible for providing or arranging for all services necessary for the operation of the
Fund. The Board noted that under the management agreement, the Advisor provides or arranges at its own expense a wide variety of services including:
| • | constructing and designing the Fund |
| • | portfolio research and security selection |
| • | initial capitalization/funding |
| • | securities trading |
| • | Fund administration |
| • | custody of Fund assets |
| • | daily valuation of the Fund’s portfolio |
| • | shareholder servicing and transfer agency, including shareholder confirmations, recordkeeping, and communications |
| • | legal services (except the independent Directors’ counsel) |
| • | regulatory and portfolio compliance |
| • | financial reporting |
| • | marketing and distribution (except Rule 12b-1 plans) |
The Board noted that many of these services have expanded over time both in terms of quantity and complexity in response to shareholder demands, competition in the industry, changing distribution channels, and the changing regulatory environment.
Investment Management Services. The nature of the investment management services provided to the Fund is quite complex and allows Fund shareholders access to professional money management, instant diversification of their investments within an asset class, the opportunity to easily diversify among asset classes by investing in or exchanging among various American Century Investments funds, and liquidity. In evaluating investment performance, the Board expects the Advisor to manage the Fund in accordance with its investment objectives and approved strategies. Further, the Directors recognize that the Advisor has an obligation to monitor trading activities, and in particular to seek the best execution of fund trades, and to evaluate the use of and payment for research. In providing these services, the Advisor utilizes teams of investment professionals (portfolio managers, analysts, research assistants, and securities traders) who require extensive information technology, research, training, compliance and other systems to conduct their business. The Board, directly and through its Fund Performance Review Committee, regularly reviews investment performance information for the Fund, together with comparative information for appropriate benchmarks and/or peer groups of similarly-managed funds, over different time horizons. The Directors also review detailed performance information during the management agreement approval process. If performance concerns are identified, the Fund receives special reviews until performance improves, during which the Board discusses with the Advisor the reasons for such results (e.g., market conditions, security selection) and any efforts being undertaken to improve performance. The Fund’s performance was above its benchmark for the one-, three-, and five-year periods reviewed by the Board. The Board found the investment management services provided by the Advisor to the Fund to be satisfactory and consistent with the management agreement.
Shareholder and Other Services. Under the management agreement, the Advisor provides the Fund with a comprehensive package of transfer agency, shareholder, and other services. The Board, directly and through various committees of the Board, regularly reviews reports and evaluations of such services at its regular meetings. These reports include, but are not limited to, information regarding the operational efficiency and accuracy of the shareholder and transfer agency services provided, staffing levels, shareholder satisfaction (as measured by external as well as internal sources), technology support, new products and services offered to Fund shareholders, securities trading activities, portfolio valuation services, auditing services, and legal and operational compliance activities. The Board particularly noted the Advisor’s continual efforts to maintain effective business continuity plans and to address cybersecurity threats. Certain aspects of shareholder and transfer agency service level efficiency and the quality of securities trading
25
activities are measured by independent third party providers and are presented in comparison to other fund groups not managed by the Advisor. The Board found the services provided by the Advisor to the Fund under the management agreement to be competitive and of high quality.
Costs of Services and Profitability. The Advisor provides detailed information concerning its cost of providing various services to the Fund, its profitability in managing the Fund (pre- and post-distribution), its overall profitability, and its financial condition. The Directors have reviewed with the Advisor the methodology used to prepare this financial information. This information is considered in evaluating the Advisor’s financial condition, its ability to continue to provide services under the management agreement, and the reasonableness of the current management fee. The Board concluded that the Advisor’s profits were reasonable in light of the services provided to the Fund.
Ethics. The Board generally considers the Advisor’s commitment to providing quality services to shareholders and to conducting its business ethically. They noted that the Advisor’s practices generally meet or exceed industry best practices.
Economies of Scale. The Board also reviewed information provided by the Advisor regarding the possible existence of economies of scale in connection with the management of the Fund. The Board concluded that economies of scale are difficult to measure and predict with precision, especially on a fund-by-fund basis. The Board concluded that the Advisor is appropriately sharing economies of scale through its competitive fee structure, offering competitive fees from fund inception, and through reinvestment in its business to provide shareholders additional content and services. The Board also noted that economies of scale are shared with the Fund and its shareholders through management fee breakpoints that serve to reduce the effective management fee as the assets of the Fund grow.
Comparison to Other Funds’ Fees. The management agreement provides that the Fund pays the Advisor a single, all-inclusive (or unified) management fee for providing all services necessary for the management and operation of the Fund, other than brokerage expenses, taxes, interest, extraordinary expenses, and the fees and expenses of the Fund’s independent Directors (including their independent legal counsel) and expenses incurred in connection with the provision of shareholder services and distribution services under a plan adopted pursuant to Rule 12b-1 under the 1940 Act. Under the unified fee structure, the Advisor is responsible for providing all investment advisory, custody, audit, administrative, compliance, recordkeeping, marketing and shareholder services, or arranging and supervising third parties to provide such services. By contrast, most other funds are charged a variety of fees, including an investment advisory fee, a transfer agency fee, an administrative fee, distribution charges, and other expenses. Other than their investment advisory fees and any applicable Rule 12b-1 distribution fees, all other components of the total fees charged by these other funds may be increased without shareholder approval. The Board believes the unified fee structure is a benefit to Fund shareholders because it clearly discloses to shareholders the cost of owning Fund shares, and, since the unified fee cannot be increased without a vote of Fund shareholders, it shifts to the Advisor the risk of increased costs of operating the Fund and provides a direct incentive to minimize administrative inefficiencies. Part of the Board’s analysis of fee levels involves reviewing certain evaluative data compiled by an independent provider comparing the Fund’s unified fee to the total expense ratios of its peers. The unified fee charged to shareholders of the Fund was above the median of the total expense ratios of the Fund’s peer expense universe and was within the range of its peer expense group. The Board concluded that the management fee paid by the Fund to the Advisor under the management agreement is reasonable in light of the services provided to the Fund.
26
Comparison to Fees and Services Provided to Other Clients of the Advisor. The Directors also requested and received information from the Advisor concerning the nature of the services, fees, costs and profitability of its advisory services to advisory clients other than the Fund. They observed that these varying types of client accounts require different services and involve different regulatory and entrepreneurial risks than the management of the Fund. The Board analyzed this information and concluded that the fees charged and services provided to the Fund were reasonable by comparison.
Payments to Intermediaries. The Directors also requested and received a description of payments made to intermediaries by the Fund and the Advisor. These payments include various payments made by the Fund or the Advisor to different types of intermediaries and recordkeepers for distribution and service activities provided for the Fund. The Board reviewed such information and found the payments to be reasonable in scope and purpose.
Collateral or “Fall-Out” Benefits Derived by the Advisor. The Board considered the existence of collateral benefits the Advisor may receive as a result of its relationship with the Fund. They concluded that the Advisor’s primary business is managing mutual funds and it generally does not use fund or shareholder information to generate profits in other lines of business, and therefore does not derive any significant collateral benefits from them. The Board noted that additional assets from other clients may offer the Advisor some benefit from increased leverage with service providers and counterparties. Additionally, the Advisor receives proprietary research from broker-dealers that execute fund portfolio transactions, which the Board concluded is likely to benefit other clients of the Advisor as well as Fund shareholders. The Board also determined that the Advisor is able to provide investment management services to certain clients other than the Fund, at least in part, due to its existing infrastructure built to serve the fund complex. The Board concluded that appropriate allocation methodologies had been employed to assign resources and the cost of those resources to these other clients and, where expressly provided, these other client assets may be included with the assets of the Fund to determine breakpoints in the management fee schedule.
Existing Relationship. The Board also considered whether there was any reason for not continuing the existing arrangement with the Advisor. In this regard, the Board was mindful of the potential disruptions of the Fund’s operations and various risks, uncertainties, and other effects that could occur as a result of a decision not to continue such relationship. In particular, the Board recognized that most shareholders have invested in the Fund on the strength of the Advisor’s industry standing and reputation and in the expectation that the Advisor will have a continuing role in providing advisory services to the Fund.
Conclusion of the Directors. As a result of this process, the Board, including all of the independent Directors, taking into account all of the factors discussed above and the information provided by the Advisor and others in connection with its review and throughout the year, determined that the management fee is fair and reasonable in light of the services provided and that the investment management agreement between the Fund and the Advisor should be renewed.
27
| Additional Information |
Retirement Account Information
As required by law, distributions you receive from certain IRAs are subject to federal income tax withholding, unless you elect not to have withholding apply. Tax will be withheld on the total amount withdrawn even though you may be receiving amounts that are not subject to withholding, such as nondeductible contributions. In such case, excess amounts of withholding could occur. You may adjust your withholding election so that a greater or lesser amount will be withheld.
If you don’t want us to withhold on this amount, you must notify us to not withhold the federal income tax. You may notify us in writing or in certain situations by telephone or through other electronic means. For systematic withdrawals, your withholding election will remain in effect until revoked or changed by filing a new election. You have the right to revoke your election at any time.
Remember, even if you elect not to have income tax withheld, you are liable for paying income tax on the taxable portion of your withdrawal. If you elect not to have income tax withheld or you don’t have enough income tax withheld, you may be responsible for payment of estimated tax. You may incur penalties under the estimated tax rules if your withholding and estimated tax payments are not sufficient. You can reduce or defer the income tax on a distribution by directly or indirectly rolling such distribution over to another IRA or eligible plan. You should consult your tax advisor for additional information.
State tax will be withheld if, at the time of your distribution, your address is within one of the mandatory withholding states and you have federal income tax withheld (or as otherwise required by state law). State taxes will be withheld from your distribution in accordance with the respective state rules.
Distributions you receive from 403(b), 457 and qualified plans are subject to special tax and withholding rules. Your plan administrator or plan sponsor is required to provide you with a special tax notice explaining those rules at the time you request a distribution. If applicable, federal and/or state taxes may be withheld from your distribution amount.
Proxy Voting Policies
A description of the policies that the fund's investment advisor uses in exercising the voting rights associated with the securities purchased and/or held by the fund is available without charge, upon request, by calling 1-800-345-2021. It is also available on the "About Us" page of American Century Investments’ website at americancentury.com and on the Securities and Exchange Commission’s website at sec.gov. Information regarding how the investment advisor voted proxies relating to portfolio securities during the most recent 12-month period ended June 30 is available on the "About Us" page at americancentury.com. It is also available at sec.gov.
Quarterly Portfolio Disclosure
The fund files its complete schedule of portfolio holdings with the Securities and Exchange Commission (SEC) for the first and third quarters of each fiscal year on Form N-Q. The fund’s Forms N-Q are available on the SEC’s website at sec.gov, and may be reviewed and copied at the SEC’s Public Reference Room in Washington, DC. Information on the operation of the Public Reference Room may be obtained by calling 1-800-SEC-0330. The fund also makes its complete schedule of portfolio holdings for the most recent quarter of its fiscal year available on its
website at americancentury.com and, upon request, by calling 1-800-345-2021.
28
Other Tax Information
The following information is provided pursuant to provisions of the Internal Revenue Code.
The fund hereby designates up to the maximum amount allowable as qualified dividend income for the fiscal year ended November 30, 2015.
The fund hereby designates $33,905,695, or up to the maximum amount allowable, as long-term capital gain distributions for the fiscal year ended November 30, 2015.
For the fiscal year ended November 30, 2015, the fund intends to pass through to shareholders foreign source income of $15,633,145 and foreign taxes paid of $1,342,165, or up to the maximum amount allowable, as a foreign tax credit. Foreign source income and foreign tax expense per outstanding share on November 30, 2015 are $0.2032 and $0.0174, respectively.
The fund utilized earnings and profits of $526,559 distributed to shareholders on redemption of shares as part of the dividends paid deduction (tax equalization).
29
| Notes |
30
| Notes |
31
| Notes |
32
| ||
| Contact Us | americancentury.com | |
| Automated Information Line | 1-800-345-8765 | |
| Investor Services Representative | 1-800-345-2021 or 816-531-5575 | |
| Investors Using Advisors | 1-800-378-9878 | |
| Business, Not-For-Profit, Employer-Sponsored Retirement Plans | 1-800-345-3533 | |
| Banks and Trust Companies, Broker-Dealers, Financial Professionals, Insurance Companies | 1-800-345-6488 | |
| Telecommunications Relay Service for the Deaf | 711 | |
| American Century World Mutual Funds, Inc. | ||
Investment Advisor: American Century Investment Management, Inc. Kansas City, Missouri | ||
| This report and the statements it contains are submitted for the general information of our shareholders. The report is not authorized for distribution to prospective investors unless preceded or accompanied by an effective prospectus. | ||
| ©2016 American Century Proprietary Holdings, Inc. All rights reserved. CL-ANN-87747 1601 | ||
| ANNUAL REPORT | NOVEMBER 30, 2015 |
NT International Small-Mid Cap Fund
| Table of Contents |
| Performance | 2 | |
| Portfolio Commentary | ||
| Fund Characteristics | ||
| Shareholder Fee Example | ||
| Schedule of Investments | ||
| Statement of Assets and Liabilities | ||
| Statement of Operations | ||
| Statement of Changes in Net Assets | ||
| Notes to Financial Statements | ||
| Financial Highlights | ||
| Report of Independent Registered Public Accounting Firm | ||
| Management | ||
| Additional Information | ||
Any opinions expressed in this report reflect those of the author as of the date of the report, and do not necessarily represent the opinions of American Century Investments® or any other person in the American Century Investments organization. Any such opinions are subject to change at any time based upon market or other conditions and American Century Investments disclaims any responsibility to update such opinions. These opinions may not be relied upon as investment advice and, because investment decisions made by American Century Investments funds are based on numerous factors, may not be relied upon as an indication of trading intent on behalf of any American Century Investments fund. Security examples are used for representational purposes only and are not intended as recommendations to purchase or sell securities. Performance information for comparative indices and securities is provided to American Century Investments by third party vendors. To the best of American Century Investments’ knowledge, such information is accurate at the time of printing.
| Performance |
| Total Returns as of November 30, 2015 | |||
Ticker Symbol | Since Inception(1) | Inception Date | |
Investor Class | ANTSX | 2.70% | 3/19/15 |
| MSCI EAFE Small Cap Index | — | 3.99% | — |
| Institutional Class | ANTMX | 2.80% | 3/19/15 |
| R6 Class | ANTFX | 2.90% | 3/19/15 |
(1) Total returns for periods less than one year are not annualized.
| Growth of $10,000 Over Life of Class |
| $10,000 investment made March 19, 2015 |
| Performance for other share classes will vary due to differences in fee structure. |
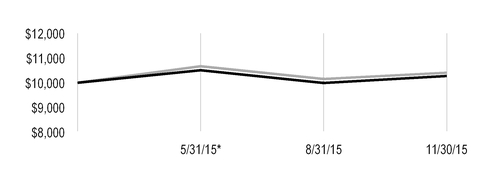
| Value on November 30, 2015 | |
| Investor Class — $10,270 | |
| MSCI EAFE Small Cap Index — $10,399 | |
*From March 19, 2015, the Investor Class’s inception date. Not annualized.
Total Annual Fund Operating Expenses | ||
| Investor Class | Institutional Class | R6 Class |
| 1.48% | 1.28% | 1.13% |
The total annual fund operating expenses shown is as stated in the fund’s prospectus current as of the date of this report. The prospectus may vary from the expense ratio shown elsewhere in this report because it is based on a different time period, includes acquired fund fees and expenses, and, if applicable, does not include fee waivers or expense reimbursements.
Data presented reflect past performance. Past performance is no guarantee of future results. Current performance may be higher or lower than the performance shown. Investment return and principal value will fluctuate, and redemption value may be more or less than original cost. Data assumes reinvestment of dividends and capital gains, and none of the charts reflect the deduction of taxes that a shareholder would pay on fund distributions or the redemption of fund shares. To obtain performance data current to the most recent month end, please call 1-800-345-2021 or visit americancentury.com. For additional information about the fund, please consult the prospectus.
2
| Portfolio Commentary |
Portfolio Managers: Brian Brady and Pratik Patel
Performance Summary
NT International Small-Mid Cap advanced 2.80%* from its inception March 19, 2015, through its November 30, 2015, fiscal year-end. The portfolio’s benchmark, the MSCI EAFE Small Cap Index, advanced 3.99% for the same period.
Non-U.S. stocks generally posted modest gains in local currency terms during the period, but the ongoing relative strength of the U.S. dollar reduced returns for U.S.-based investors. Throughout the period, global divergence of economic growth and central bank policy remained a prominent theme. As the U.S. continued to set itself apart from the rest of the developed world, with better relative economic growth and fewer central bank stimulus efforts in play, the U.S. dollar gained strength versus other currencies, where central bank stimulus plans remained in full force.
Stock performance during the period was choppy. Early on, non-U.S. stocks rallied and outpaced U.S. stocks, as investors largely overlooked sluggish growth data, geopolitical concerns, and continued weakness among commodity prices to focus instead on supportive central bank policies from the European Central Bank (ECB) and Bank of Japan. But those positive influences quickly faded, as renewed concerns about growth, commodities prices, a strong U.S. dollar, and a potential rate hike from the U.S. Federal Reserve (Fed) worried investors. Furthermore, in late July, Greece defaulted on its debt payment to the International Monetary Fund, sparking a sharp sell-off among global stocks. The sell-off intensified in the third quarter of 2015, as evidence emerged that China’s economy was cooling more than previously believed. In addition, oil and commodities prices dropped to new lows, due in part to falling demand from China. Anxiety about U.S. interest rate policy also remained a key theme, which persisted even after the Fed decided in September 2015 to leave rates unchanged due to concerns about the state of the global economy. Stocks rallied again in October, after the ECB pledged to take additional steps to jump-start the region’s lackluster economy and China’s central bank cut interest rates for the sixth time in 12 months, but they tumbled to close out the period in November.
Overall, developed market stocks outpaced their emerging market counterparts, and small- and mid-cap stocks outperformed large-cap stocks. Among non-U.S. small- and mid-cap stocks, growth stocks significantly outperformed value stocks. Within the fund, stock selection primarily accounted for the underperformance versus the benchmark, particularly within the information technology, materials, and financials sectors. An overweight position relative to the benchmark in information technology sector also detracted. From a regional perspective, a portfolio-only position in Canada along with stock selection in Japan and Israel detracted from relative performance.
Canada-based Health Care Company Detracted
A portfolio-only position in Concordia Healthcare, a Canada-based specialty pharmaceuticals company, was among the fund’s leading detractors. The company’s stock price declined along with shares of other pharmaceuticals companies due to U.S. political wrangling regarding prescription drug prices, which triggered “panic selling.” Nevertheless, we believe the sell-off was unwarranted, particularly because Concordia expects to derive less than 10% of its revenues from U.S. government reimbursements in 2016. We believe acquisitions and solid cost controls should continue to drive Concordia’s earnings growth.
*All fund returns referenced in this commentary are for Institutional Class shares. Total returns for periods less than one year are not annualized. Performance for other share classes will vary due to differences in fee structure; when Institutional Class performance exceeds that of the fund's benchmark, other share classes may not. See page 2 for returns for all share classes.
3
In addition, a portfolio-only position in Caesarstone, an Israel-based manufacturer of kitchen materials and countertops, was a main detractor. Delays in production facilities and lack of pricing power in the U.S. and Australia drove down the stock price, and we exited the position.
An overweight position in Topcon, a Japan-based maker of optical equipment for the ophthalmology and surveying industries, also was a main detractor for the period. The stock sold off sharply in July, as the company lowered its full-year guidance on weaker-than-expected sales due to the lagging recovery in the precision agriculture industry. We exited the position.
Denmark-based Jewelry Company Was a Top Contributor
From a sector standpoint, stock selection in telecommunication services, an overweight position in consumer discretionary, and an underweight position in energy were among the top contributors to relative performance. Regionally, stock selection and an overweight position in Denmark, a portfolio-only position in the U.S., and stock selection and an underweight position in Hong Kong contributed to relative performance.
A portfolio-only position in Denmark-based Pandora drove the fund’s performance in the consumer discretionary sector and was among the fund’s top overall performers. The jewelry and charm maker and retailer advanced on continued strong earnings growth and weak gold and silver prices. In addition, the company benefited from the timely release of new collections and the expansion of its retail network and online offerings.
In addition, a portfolio-only position in Ono Pharmaceutical was among the largest contributors to performance. The Japan-based pharmaceutical company posted strong results based on its cancer-fighting antibody treatment developed jointly with Bristol-Myers Squibb.
An overweight position in Genmab, a Denmark-based biotechnology company specializing in cancer treatments, also was a top contributor in the fund. The company’s stock advanced after Genmab’s blood cancer drug received U.S. Food and Drug Administration approval. The approval prompted the company to raise its full-year revenue guidance.
Outlook
We will continue to focus on companies we believe demonstrate improving, sustainable earnings growth, particularly those in the consumer, asset management, and real estate industries. We expect select companies in these industries to benefit from weak energy and commodity prices, a strong U.S. dollar, and ongoing central bank accommodations (especially in Europe and Japan). In Europe, unemployment levels are lower, and expansion in money supply and credit growth suggest ECB policies are gaining traction. We expect any additional quantitative easing (QE) to support Europe’s recovery at the macroeconomic and company levels, but growth may remain modest. A weaker euro should continue to act as a tailwind, helping European manufacturers and exporters by making their goods more competitive in foreign markets. Similarly, QE has weakened the yen, and Japan-based manufacturers and exporters have benefited, though certain domestically focused sectors of the economy remain challenged. We continue to underweight emerging markets, but we have increased the fund’s China exposure due to stabilizing economic data and central bank stimulus measures there.
4
| Fund Characteristics |
| NOVEMBER 30, 2015 | |
Top Ten Holdings | % of net assets |
| Qantas Airways Ltd. | 2.7% |
| Pandora A/S | 2.4% |
| DCC plc | 2.0% |
| Element Financial Corp. | 1.9% |
| DSV A/S | 1.9% |
| Zalando SE | 1.9% |
| Temp Holdings Co. Ltd. | 1.8% |
| Stroeer SE | 1.8% |
| Ono Pharmaceutical Co. Ltd. | 1.7% |
| Genmab A/S | 1.7% |
Types of Investments in Portfolio | % of net assets |
| Common Stocks | 97.2% |
| Temporary Cash Investments | 2.9% |
| Other Assets and Liabilities | (0.1)% |
Investments by Country | % of net assets |
| Japan | 24.7% |
| United Kingdom | 12.4% |
| France | 9.8% |
| Germany | 9.1% |
| Australia | 7.8% |
| Denmark | 6.9% |
| Canada | 5.6% |
| Sweden | 4.5% |
| Spain | 4.5% |
| Italy | 2.7% |
| Switzerland | 2.7% |
| Other Countries | 6.5% |
| Cash and Equivalents* | 2.8% |
| *Includes temporary cash investments and other assets and liabilities. | |
5
| Shareholder Fee Example |
Fund shareholders may incur two types of costs: (1) transaction costs, including sales charges (loads) on purchase payments and redemption/exchange fees; and (2) ongoing costs, including management fees; distribution and service (12b-1) fees; and other fund expenses. This example is intended to help you understand your ongoing costs (in dollars) of investing in your fund and to compare these costs with the ongoing cost of investing in other mutual funds.
The example is based on an investment of $1,000 made at the beginning of the period and held for the entire period from June 1, 2015 to November 30, 2015.
Actual Expenses
The table provides information about actual account values and actual expenses for each class. You may use the information, together with the amount you invested, to estimate the expenses that you paid over the period. First, identify the share class you own. Then simply divide your account value by $1,000 (for example, an $8,600 account value divided by $1,000 = 8.6), then multiply the result by the number under the heading “Expenses Paid During Period” to estimate the expenses you paid on your account during this period.
Hypothetical Example for Comparison Purposes
The table also provides information about hypothetical account values and hypothetical expenses based on the actual expense ratio of each class of your fund and an assumed rate of return of 5% per year before expenses, which is not the actual return of a fund’s share class. The hypothetical account values and expenses may not be used to estimate the actual ending account balance or expenses you paid for the period. You may use this information to compare the ongoing costs of investing in your fund and other funds. To do so, compare this 5% hypothetical example with the 5% hypothetical examples that appear in the shareholder reports of the other funds.
Please note that the expenses shown in the table are meant to highlight your ongoing costs only and do not reflect any transactional costs, such as sales charges (loads) or redemption/exchange fees. Therefore, the table is useful in comparing ongoing costs only, and will not help you determine the relative total costs of owning different funds. In addition, if these transactional costs were included, your costs would have been higher.
| Beginning Account Value 6/1/15 | Ending Account Value 11/30/15 | Expenses Paid During Period(1) 6/1/15 - 11/30/15 | Annualized Expense Ratio(1) | |
Actual | ||||
| Investor Class | $1,000 | $978.10 | $7.29 | 1.47% |
| Institutional Class | $1,000 | $978.10 | $6.30 | 1.27% |
| R6 Class | $1,000 | $979.10 | $5.56 | 1.12% |
| Hypothetical | ||||
| Investor Class | $1,000 | $1,017.70 | $7.44 | 1.47% |
| Institutional Class | $1,000 | $1,018.70 | $6.43 | 1.27% |
| R6 Class | $1,000 | $1,019.45 | $5.67 | 1.12% |
| (1) | Expenses are equal to the class's annualized expense ratio listed in the table above, multiplied by the average account value over the period, multiplied by 183, the number of days in the most recent fiscal half-year, divided by 365, to reflect the one-half year period. |
6
| Schedule of Investments |
NOVEMBER 30, 2015
| Shares | Value | |||
| COMMON STOCKS — 97.2% | ||||
| Australia — 7.8% | ||||
| APN Outdoor Group Ltd. | 135,228 | $ | 527,125 | |
| Aristocrat Leisure Ltd. | 384,567 | 2,639,349 | ||
| Magellan Financial Group Ltd. | 123,716 | 2,319,100 | ||
Qantas Airways Ltd.(1) | 2,149,868 | 5,659,417 | ||
| Star Entertainment Grp Ltd. (The) | 624,525 | 2,176,985 | ||
| Sydney Airport | 202,368 | 965,927 | ||
| Treasury Wine Estates Ltd. | 352,171 | 1,928,004 | ||
| 16,215,907 | ||||
| Austria — 0.8% | ||||
Erste Group Bank AG(1) | 57,203 | 1,755,114 | ||
| Canada — 5.6% | ||||
| Cineplex, Inc. | 26,277 | 985,203 | ||
| Concordia Healthcare Corp. | 56,532 | 2,177,124 | ||
Element Financial Corp.(1) | 309,742 | 3,966,145 | ||
| Gildan Activewear, Inc. | 41,571 | 1,289,668 | ||
Lundin Mining Corp.(1) | 189,724 | 518,546 | ||
| PrairieSky Royalty Ltd. | 37,771 | 725,468 | ||
Shopify, Inc., Class A(1) | 41,469 | 1,092,294 | ||
| Silver Wheaton Corp. | 57,402 | 753,114 | ||
| 11,507,562 | ||||
| China — 0.3% | ||||
| Beijing Enterprises Water Group Ltd. | 656,000 | 512,721 | ||
| Denmark — 6.9% | ||||
| Ambu A/S, B Shares | 31,020 | 904,982 | ||
| Chr Hansen Holding A/S | 16,691 | 1,047,405 | ||
| DSV A/S | 101,434 | 3,944,707 | ||
Genmab A/S(1) | 27,188 | 3,503,881 | ||
| Pandora A/S | 41,304 | 4,896,078 | ||
| 14,297,053 | ||||
| Finland — 0.9% | ||||
| Amer Sports Oyj | 66,966 | 1,950,658 | ||
| France — 9.8% | ||||
| Eurofins Scientific | 6,401 | 2,408,972 | ||
| Euronext NV | 68,286 | 3,397,068 | ||
| Ingenico Group SA | 14,019 | 1,764,822 | ||
| Korian SA | 26,889 | 923,595 | ||
Nexans SA(1) | 46,595 | 1,782,124 | ||
| Nexity SA | 24,434 | 1,042,827 | ||
| Plastic Omnium SA | 45,273 | 1,323,783 | ||
| Rubis SCA | 35,525 | 2,824,428 | ||
| Societe BIC SA | 11,673 | 1,920,264 | ||
7
| Shares | Value | |||
| Technip SA | 14,094 | $ | 738,743 | |
| Teleperformance | 26,277 | 2,184,389 | ||
| 20,311,015 | ||||
| Germany — 9.1% | ||||
| Drillisch AG | 41,698 | 1,865,772 | ||
| Grand City Properties SA | 94,202 | 1,940,817 | ||
| KION Group AG | 32,189 | 1,593,335 | ||
| LANXESS AG | 39,528 | 2,012,991 | ||
| ProSiebenSat.1 Media SE | 29,576 | 1,553,051 | ||
| Stroeer SE | 61,678 | 3,664,929 | ||
| Symrise AG | 33,579 | 2,272,713 | ||
Zalando SE(1) | 114,295 | 3,876,343 | ||
| 18,779,951 | ||||
| Hong Kong — 0.9% | ||||
Regina Miracle International Holdings Ltd.(1) | 1,674,000 | 1,841,660 | ||
| Ireland — 0.8% | ||||
| Smurfit Kappa Group plc | 61,138 | 1,670,435 | ||
| Israel — 0.5% | ||||
Partner Communications Co. Ltd.(1) | 235,377 | 1,066,980 | ||
| Italy — 2.7% | ||||
| De' Longhi | 109,543 | 3,010,336 | ||
| FinecoBank Banca Fineco SpA | 132,370 | 1,033,532 | ||
Finmeccanica SpA(1) | 110,182 | 1,596,019 | ||
| 5,639,887 | ||||
| Japan — 24.7% | ||||
Anicom Holdings, Inc.(1) | 78,200 | 1,776,175 | ||
| Asahi Intecc Co. Ltd. | 32,000 | 1,390,739 | ||
| DeNA Co. Ltd. | 40,500 | 637,604 | ||
| Dip Corp. | 73,100 | 1,665,089 | ||
| Ezaki Glico Co. Ltd. | 38,400 | 1,930,918 | ||
| Financial Products Group Co. Ltd. | 203,900 | 1,393,013 | ||
| Gulliver International Co. Ltd. | 209,600 | 1,958,083 | ||
| Haseko Corp. | 199,200 | 2,226,638 | ||
| HIS Co. Ltd. | 49,500 | 1,606,438 | ||
| Hoshizaki Electric Co. Ltd. | 21,800 | 1,531,844 | ||
| Ichigo, Inc. | 532,600 | 1,488,338 | ||
| Japan Airport Terminal Co. Ltd. | 25,800 | 1,301,527 | ||
| Japan Exchange Group, Inc. | 112,900 | 1,770,081 | ||
| Japan Hotel REIT Investment Corp. | 991 | 722,118 | ||
| Juroku Bank Ltd. (The) | 65,000 | 260,317 | ||
Laox Co. Ltd.(1) | 559,000 | 1,380,471 | ||
| Nipro Corp. | 84,300 | 925,177 | ||
| Ono Pharmaceutical Co. Ltd. | 22,300 | 3,570,536 | ||
| Open House Co. Ltd. | 80,900 | 1,702,120 | ||
| Pigeon Corp. | 33,400 | 957,774 | ||
| Skylark Co. Ltd. | 148,300 | 2,023,916 | ||
| Sundrug Co. Ltd. | 36,500 | 2,351,300 | ||
8
| Shares | Value | |||
| Suruga Bank Ltd. | 102,700 | $ | 2,079,028 | |
| Sysmex Corp. | 35,000 | 2,186,434 | ||
| TDK Corp. | 27,500 | 1,977,051 | ||
| Teijin Ltd. | 642,000 | 2,284,289 | ||
| Temp Holdings Co. Ltd. | 228,000 | 3,682,080 | ||
| Tosoh Corp. | 278,000 | 1,558,245 | ||
| TOTO Ltd. | 55,500 | 1,916,125 | ||
| Zenkoku Hosho Co. Ltd. | 29,000 | 950,569 | ||
| 51,204,037 | ||||
| Netherlands — 0.8% | ||||
| USG People NV | 101,814 | 1,565,704 | ||
| Portugal — 0.4% | ||||
| Jeronimo Martins SGPS SA | 56,249 | 780,611 | ||
| Spain — 4.5% | ||||
| Cellnex Telecom SAU | 110,313 | 2,004,098 | ||
| Gamesa Corp. Tecnologica SA | 198,821 | 3,480,765 | ||
Inmobiliaria Colonial SA(1) | 1,951,759 | 1,365,130 | ||
| Melia Hotels International SA | 65,383 | 831,728 | ||
| Merlin Properties Socimi SA | 130,544 | 1,626,150 | ||
| 9,307,871 | ||||
| Sweden — 4.5% | ||||
Attendo AB(1) | 192,032 | 1,541,223 | ||
| Boliden AB | 103,416 | 1,900,707 | ||
Fingerprint Cards AB, B Shares(1) | 10,377 | 737,662 | ||
Lundin Petroleum AB(1) | 55,494 | 887,594 | ||
RaySearch Laboratories AB(1) | 161,646 | 2,024,791 | ||
| Saab AB B Shares | 42,256 | 1,309,569 | ||
| Thule Group AB (The) | 73,757 | 987,311 | ||
| 9,388,857 | ||||
| Switzerland — 2.7% | ||||
| dorma+kaba Holding AG | 4,539 | 2,916,148 | ||
| Lonza Group AG | 16,908 | 2,672,149 | ||
| 5,588,297 | ||||
| United Kingdom — 12.4% | ||||
| Ashtead Group plc | 133,005 | 2,193,490 | ||
| Auto Trader Group plc | 169,844 | 1,039,323 | ||
| DCC plc | 45,409 | 4,082,910 | ||
| Direct Line Insurance Group plc | 310,067 | 1,923,071 | ||
| easyJet plc | 66,435 | 1,653,953 | ||
| Howden Joinery Group plc | 309,949 | 2,427,432 | ||
| Persimmon plc | 75,364 | 2,173,633 | ||
| Provident Financial plc | 44,672 | 2,403,258 | ||
| Rightmove plc | 27,026 | 1,628,560 | ||
| Sophos Group plc | 240,242 | 1,026,145 | ||
| St. James's Place plc | 73,716 | 1,128,000 | ||
| Virgin Money Holdings UK plc | 322,138 | 1,726,726 | ||
Worldpay Group plc(1) | 366,679 | 1,651,242 | ||
9
| Shares | Value | |||
| Zoopla Property Group plc | 152,876 | $ | 538,777 | |
| 25,596,520 | ||||
| United States — 1.1% | ||||
IMAX Corp.(1) | 59,533 | 2,255,110 | ||
TOTAL COMMON STOCKS (Cost $187,497,405) | 201,235,950 | |||
| TEMPORARY CASH INVESTMENTS — 2.9% | ||||
| Repurchase Agreement, Credit Suisse First Boston, Inc., (collateralized by various U.S. Treasury obligations, 0.625%, 8/31/17, valued at $2,009,889), in a joint trading account at 0.01%, dated 11/30/15, due 12/1/15 (Delivery value $1,971,027) | 1,971,026 | |||
| Repurchase Agreement, Fixed Income Clearing Corp., (collateralized by various U.S. Treasury obligations, 3.00%, 11/15/44, valued at $3,350,806), at 0.01%, dated 11/30/15, due 12/1/15 (Delivery value $3,285,001) | 3,285,000 | |||
| State Street Institutional Liquid Reserves Fund, Premier Class | 773,880 | 773,880 | ||
TOTAL TEMPORARY CASH INVESTMENTS (Cost $6,029,906) | 6,029,906 | |||
TOTAL INVESTMENT SECURITIES — 100.1% (Cost $193,527,311) | 207,265,856 | |||
| OTHER ASSETS AND LIABILITIES — (0.1)% | (150,172) | |||
| TOTAL NET ASSETS — 100.0% | $ | 207,115,684 | ||
| MARKET SECTOR DIVERSIFICATION | ||
(as a % of net assets) | ||
| Consumer Discretionary | 23.8 | % |
| Industrials | 22.0 | % |
| Financials | 18.0 | % |
| Health Care | 11.7 | % |
| Materials | 6.8 | % |
| Information Technology | 5.9 | % |
| Consumer Staples | 3.8 | % |
| Telecommunication Services | 2.4 | % |
| Utilities | 1.7 | % |
| Energy | 1.1 | % |
| Cash and Equivalents* | 2.8 | % |
*Includes temporary cash investments and other assets and liabilities.
| NOTES TO SCHEDULE OF INVESTMENTS | ||
| (1) | Non-income producing. |
See Notes to Financial Statements.
10
| Statement of Assets and Liabilities |
| NOVEMBER 30, 2015 | |||
| Assets | |||
| Investment securities, at value (cost of $193,527,311) | $ | 207,265,856 | |
| Foreign currency holdings, at value (cost of $51,911) | 51,807 | ||
| Receivable for investments sold | 1,111,867 | ||
| Dividends and interest receivable | 298,207 | ||
| 208,727,737 | |||
| Liabilities | |||
| Payable for investments purchased | 1,328,338 | ||
| Payable for capital shares redeemed | 62,709 | ||
| Accrued management fees | 221,006 | ||
| 1,612,053 | |||
| Net Assets | $ | 207,115,684 | |
| Net Assets Consist of: | |||
| Capital (par value and paid-in surplus) | $ | 200,952,834 | |
| Undistributed net investment income | 1,002,127 | ||
| Accumulated net realized loss | (8,570,812 | ) | |
| Net unrealized appreciation | 13,731,535 | ||
| $ | 207,115,684 | ||
| Net Assets | Shares Outstanding | Net Asset Value Per Share | ||||
| Investor Class, $0.01 Par Value | $65,427,831 | 6,360,218 | $10.29 | |||
| Institutional Class, $0.01 Par Value | $133,255,021 | 12,935,695 | $10.30 | |||
| R6 Class, $0.01 Par Value | $8,432,832 | 817,798 | $10.31 | |||
See Notes to Financial Statements.
11
| Statement of Operations |
FOR THE PERIOD ENDED NOVEMBER 30, 2015(1) | |||
| Investment Income (Loss) | |||
| Income: | |||
| Dividends (net of foreign taxes withheld of $156,949) | $ | 2,533,039 | |
| Interest | 1,988 | ||
| 2,535,027 | |||
| Expenses: | |||
| Management fees | 1,880,103 | ||
| Directors' fees and expenses | 4,680 | ||
| Other expenses | 384 | ||
| 1,885,167 | |||
| Net investment income (loss) | 649,860 | ||
| Realized and Unrealized Gain (Loss) | |||
| Net realized gain (loss) on: | |||
| Investment transactions | (8,106,847 | ) | |
| Foreign currency transactions | (111,698 | ) | |
| (8,218,545 | ) | ||
| Change in net unrealized appreciation (depreciation) on: | |||
| Investments | 13,738,545 | ||
| Translation of assets and liabilities in foreign currencies | (7,010 | ) | |
| 13,731,535 | |||
| Net realized and unrealized gain (loss) | 5,512,990 | ||
| Net Increase (Decrease) in Net Assets Resulting from Operations | $ | 6,162,850 | |
| (1) | March 19, 2015 (fund inception) through November 30, 2015. |
See Notes to Financial Statements.
12
| Statement of Changes in Net Assets |
PERIOD ENDED NOVEMBER 30, 2015(1) | |||
| Increase (Decrease) in Net Assets | |||
| Operations | |||
| Net investment income (loss) | $ | 649,860 | |
| Net realized gain (loss) | (8,218,545 | ) | |
| Change in net unrealized appreciation (depreciation) | 13,731,535 | ||
| Net increase (decrease) in net assets resulting from operations | 6,162,850 | ||
| Capital Share Transactions | |||
| Net increase (decrease) in net assets from capital share transactions (Note 5) | 200,952,834 | ||
| Net increase (decrease) in net assets | 207,115,684 | ||
| Net Assets | |||
| End of period | $ | 207,115,684 | |
| Undistributed net investment income | $ | 1,002,127 | |
| (1) | March 19, 2015 (fund inception) through November 30, 2015. |
See Notes to Financial Statements.
13
| Notes to Financial Statements |
NOVEMBER 30, 2015
1. Organization
American Century World Mutual Funds, Inc. (the corporation) is registered under the Investment Company Act of 1940, as amended (the 1940 Act), as an open-end management investment company and is organized as a Maryland corporation. NT International Small-Mid Cap Fund (the fund) is one fund in a series issued by the corporation. The fund is diversified as defined under the 1940 Act. The fund’s investment objective is to seek capital growth. The fund is not permitted to invest in securities issued by companies assigned the Global Industry Classification Standard for the tobacco industry.
The fund offers the Investor Class, the Institutional Class and the R6 Class, which have different fees and expenses. The difference in the fee structures between the classes is the result of their separate arrangements for shareholder and distribution services. It is not the result of any difference in advisory or custodial fees or other expenses related to the management of the fund’s assets, which do not vary by class. The fund’s shares are available for purchase exclusively by certain American Century Investments funds of funds and the fund’s arrangements for shareholder and distribution services take into account the varying levels of services required by shareholders of different classes of the funds of funds. The Institutional Class and R6 Class shareholders do not require the same level of shareholder and administrative services from American Century Investment Management, Inc. (ACIM) (the investment advisor) as shareholders of the Investor Class. In addition, financial intermediaries do not receive any service, distribution or administrative fees for the R6 Class. As a result, the Institutional Class and R6 Class are charged lower unified management fees. All classes of the fund commenced sale on March 19, 2015, the fund’s inception date.
2. Significant Accounting Policies
The following is a summary of significant accounting policies consistently followed by the fund in preparation of its financial statements. The fund is an investment company and follows accounting and reporting guidance in accordance with accounting principles generally accepted in the United States of America. This may require management to make certain estimates and assumptions at the date of the financial statements. Actual results could differ from these estimates. Management evaluated the impact of events or transactions occurring through the date the financial statements were issued that would merit recognition or disclosure.
Investment Valuations — The fund determines the fair value of its investments and computes its net asset value per share at the close of regular trading (usually 4 p.m. Eastern time) on the New York Stock Exchange (NYSE) on each day the NYSE is open. The Board of Directors has adopted valuation policies and procedures to guide the investment advisor in the fund’s investment valuation process and to provide methodologies for the oversight of the fund’s pricing function.
Equity securities that are listed or traded on a domestic securities exchange are valued at the last reported sales price or at the official closing price as provided by the exchange. Equity securities traded on foreign securities exchanges are generally valued at the closing price of such securities on the exchange where primarily traded or at the close of the NYSE, if that is earlier. If no last sales price is reported, or if local convention or regulation so provides, the mean of the latest bid and asked prices may be used. Securities traded over-the-counter are valued at the mean of the latest bid and asked prices, the last sales price, or the official closing price. Equity securities initially expressed in local currencies are translated into U.S. dollars at the mean of the appropriate currency exchange rate at the close of the NYSE as provided by an independent pricing service.
Open-end management investment companies are valued at the reported net asset value per share. Repurchase agreements are valued at cost, which approximates fair value.
If the fund determines that the market price for an investment is not readily available or the valuation methods mentioned above do not reflect an investment’s fair value, such investment is valued as determined in good faith by the Board of Directors or its delegate, in accordance with policies and procedures adopted by the Board of Directors. In its determination of fair value, the fund may review several factors including, but not limited to, market information regarding the specific investment or comparable investments and correlation with other investment types, futures indices or general market indicators. Circumstances that may cause the fund to use these procedures to value an investment include, but are not limited to: an investment has been declared in default or is distressed; trading in a security has been suspended during the trading day or a security is not actively trading on its principal exchange; prices received from a regular pricing source are deemed unreliable; or there is a foreign market holiday and no trading occurred.
14
The fund monitors for significant events occurring after the close of an investment’s primary exchange but before the fund’s net asset value per share is determined. Significant events may include, but are not limited to: corporate announcements and transactions; governmental action and political unrest that could impact a specific investment or an investment sector; or armed conflicts, natural disasters and similar events that could affect investments in a specific country or region. The fund also monitors for significant fluctuations between domestic and foreign markets, as evidenced by the U.S. market or such other indicators that the Board of Directors, or its delegate, deems appropriate. If significant fluctuations in foreign markets are identified, the fund may apply a model-derived factor to the closing price of equity securities traded on foreign securities exchanges. The factor is based on observable market data as provided by an independent pricing service.
Security Transactions — Security transactions are accounted for as of the trade date. Net realized gains and losses are determined on the identified cost basis, which is also used for federal income tax purposes.
Investment Income — Dividend income less foreign taxes withheld, if any, is recorded as of the ex-dividend date. Distributions received on securities that represent a return of capital or long-term capital gain are recorded as a reduction of cost of investments and/or as a realized gain. The fund may estimate the components of distributions received that may be considered nontaxable distributions or long-term capital gain distributions for income tax purposes. Interest income is recorded on the accrual basis and includes accretion of discounts and amortization of premiums.
Foreign Currency Translations — All assets and liabilities initially expressed in foreign currencies are translated into U.S. dollars at prevailing exchange rates at period end. The fund may enter into spot foreign currency exchange contracts to facilitate transactions denominated in a foreign currency. Purchases and sales of investment securities, dividend and interest income, spot foreign currency exchange contracts, and expenses are translated at the rates of exchange prevailing on the respective dates of such transactions. Net realized and unrealized foreign currency exchange gains or losses related to investment securities are a component of net realized gain (loss) on investment transactions and change in net unrealized appreciation (depreciation) on investments, respectively.
Repurchase Agreements — The fund may enter into repurchase agreements with institutions that ACIM has determined are creditworthy pursuant to criteria adopted by the Board of Directors. The fund requires that the collateral, represented by securities, received in a repurchase transaction be transferred to the custodian in a manner sufficient to enable the fund to obtain those securities in the event of a default under the repurchase agreement. ACIM monitors, on a daily basis, the securities transferred to ensure the value, including accrued interest, of the securities under each repurchase agreement is equal to or greater than amounts owed to the fund under each repurchase agreement.
Joint Trading Account — Pursuant to an Exemptive Order issued by the Securities and Exchange Commission, the fund, along with certain other funds in the American Century Investments family of funds, may transfer uninvested cash balances into a joint trading account. These balances are invested in one or more repurchase agreements that are collateralized by U.S. Treasury or Agency obligations.
Income Tax Status — It is the fund’s policy to distribute substantially all net investment income and net realized gains to shareholders and to otherwise qualify as a regulated investment company under provisions of the Internal Revenue Code. Accordingly, no provision has been made for income taxes. The fund files U.S. federal, state, local and non-U.S. tax returns as applicable. The fund's tax returns are subject to examination by the relevant taxing authority until expiration of the applicable statute of limitations, which is generally three years from the date of filing but can be longer in certain jurisdictions. At this time, management believes there are no uncertain tax positions which, based on their technical merit, would not be sustained upon examination and for which it is reasonably possible that the total amounts of unrecognized tax benefits will significantly change in the next twelve months.
Multiple Class — All shares of the fund represent an equal pro rata interest in the net assets of the class to which such shares belong, and have identical voting, dividend, liquidation and other rights and the same terms and conditions, except for class specific expenses and exclusive rights to vote on matters affecting only individual classes. Income, non-class specific expenses, and realized and unrealized capital gains and losses of the fund are allocated to each class of shares based on their relative net assets.
Distributions to Shareholders — Distributions from net investment income and net realized gains, if any, are generally declared and paid annually. The fund may make distributions on a more frequent basis to comply with the distribution requirements of the Internal Revenue Code, in all events in a manner consistent with provisions of the 1940 Act.
15
Indemnifications — Under the corporation’s organizational documents, its officers and directors are indemnified against certain liabilities arising out of the performance of their duties to the fund. In addition, in the normal course of business, the fund enters into contracts that provide general indemnifications. The maximum exposure under these arrangements is unknown as this would involve future claims that may be made against a fund. The risk of material loss from such claims is considered by management to be remote.
3. Fees and Transactions with Related Parties
Certain officers and directors of the corporation are also officers and/or directors of American Century Companies, Inc. (ACC). The corporation’s investment advisor, ACIM, the corporation's distributor, American Century Investment Services, Inc., and the corporation’s transfer agent, American Century Services, LLC, are wholly owned, directly or indirectly, by ACC. Various funds issued by American Century Asset Allocation Portfolios, Inc. and American Century Strategic Asset Allocations, Inc. own, in aggregate, 100% of the shares of the fund. Related parties do not invest in the fund for the purpose of exercising management or control.
Management Fees — The corporation has entered into a management agreement with ACIM, under which ACIM provides the fund with investment advisory and management services in exchange for a single, unified management fee (the fee) per class. The agreement provides that all expenses of managing and operating the fund, except distribution and service fees, brokerage expenses, taxes, interest, fees and expenses of the independent directors (including legal counsel fees), and extraordinary expenses, will be paid by ACIM. The fee is computed and accrued daily based on each class’s daily net assets and paid monthly in arrears. The annual management fee is 1.47% for the Investor Class, 1.27% for the Institutional Class and 1.12% for the R6 Class.
Directors' Fees and Expenses — The Board of Directors is responsible for overseeing the investment advisor’s management and operations of the fund. The directors receive detailed information about the fund and its investment advisor regularly throughout the year, and meet at least quarterly with management of the investment advisor to review reports about fund operations. The fund’s officers do not receive compensation from the fund.
4. Investment Transactions
Purchases and sales of investment securities, excluding short-term investments, for the period March 19, 2015 (fund inception) through November 30, 2015 were $428,756,297 and $233,041,829, respectively.
5. Capital Share Transactions
Transactions in shares of the fund were as follows:
Period ended November 30, 2015(1) | |||||
| Shares | Amount | ||||
| Investor Class/Shares Authorized | 100,000,000 | ||||
| Sold | 6,624,685 | $ | 66,247,282 | ||
| Redeemed | (264,467 | ) | (2,771,716 | ) | |
| 6,360,218 | 63,475,566 | ||||
| Institutional Class/Shares Authorized | 150,000,000 | ||||
| Sold | 13,245,884 | 132,504,598 | |||
| Redeemed | (310,189 | ) | (3,259,552 | ) | |
| 12,935,695 | 129,245,046 | ||||
| R6 Class/Shares Authorized | 40,000,000 | ||||
| Sold | 910,428 | 9,164,580 | |||
| Redeemed | (92,630 | ) | (932,358 | ) | |
| 817,798 | 8,232,222 | ||||
| Net increase (decrease) | 20,113,711 | $ | 200,952,834 | ||
| (1) | March 19, 2015 (fund inception) through November 30, 2015. |
16
6. Fair Value Measurements
The fund’s investments valuation process is based on several considerations and may use multiple inputs to determine the fair value of the investments held by the fund. In conformity with accounting principles generally accepted in the United States of America, the inputs used to determine a valuation are classified into three broad levels.
| • | Level 1 valuation inputs consist of unadjusted quoted prices in an active market for identical investments. |
| • | Level 2 valuation inputs consist of direct or indirect observable market data (including quoted prices for comparable investments, evaluations of subsequent market events, interest rates, prepayment speeds, credit risk, etc.). These inputs also consist of quoted prices for identical investments initially expressed in local currencies that are adjusted through translation into U.S. dollars. |
| • | Level 3 valuation inputs consist of unobservable data (including a fund’s own assumptions). |
The level classification is based on the lowest level input that is significant to the fair valuation measurement. The valuation inputs are not necessarily an indication of the risks associated with investing in these securities or other financial instruments. There were no significant transfers between levels during the period.
The following is a summary of the level classifications as of period end. The Schedule of Investments provides additional information on the fund’s portfolio holdings.
| Level 1 | Level 2 | Level 3 | ||||||
| Assets | ||||||||
| Investment Securities | ||||||||
| Common Stocks | $ | 4,100,518 | $ | 197,135,432 | — | |||
| Temporary Cash Investments | 773,880 | 5,256,026 | — | |||||
| $ | 4,874,398 | $ | 202,391,458 | — | ||||
7. Risk Factors
There are certain risks involved in investing in foreign securities. These risks include those resulting from future adverse political, social and economic developments, fluctuations in currency exchange rates, the possible imposition of exchange controls, and other foreign laws or restrictions.
The fund invests in common stocks of small companies. Because of this, the fund may be subject to greater risk and market fluctuations than a fund investing in larger, more established companies.
The fund’s investment process may result in high portfolio turnover, which could mean high transaction costs, affecting both performance and capital gains tax liabilities to investors.
8. Federal Tax Information
On December 22, 2015, the fund declared and paid the following per-share distributions from net investment income to shareholders of record on December 21, 2015:
| Investor Class | Institutional Class | R6 Class |
| $0.0714 | $0.0874 | $0.0994 |
The book-basis character of distributions made during the year from net investment income or net realized gains may differ from their ultimate characterization for federal income tax purposes. These differences reflect the differing character of certain income items and net realized gains and losses for financial statement and tax purposes, and may result in reclassification among certain capital accounts on the financial statements. There were no distributions paid by the fund during the period March 19, 2015 (fund inception) through November 30, 2015.
17
As of November 30, 2015, the federal tax cost of investments and the components of distributable earnings on a tax-basis were as follows:
| Federal tax cost of investments | $ | 195,146,884 | |
| Gross tax appreciation of investments | $ | 18,096,170 | |
| Gross tax depreciation of investments | (5,977,198 | ) | |
| Net tax appreciation (depreciation) of investments | 12,118,972 | ||
| Net tax appreciation (depreciation) on translation of assets and liabilities in foreign currencies | (7,010 | ) | |
| Net tax appreciation (depreciation) | $ | 12,111,962 | |
| Undistributed ordinary income | $ | 1,607,501 | |
Accumulated short-term capital losses | $ | (7,556,613 | ) |
The difference between book-basis and tax-basis unrealized appreciation (depreciation) is attributable primarily to the tax deferral of losses on wash sales.
Accumulated capital losses represent net capital loss carryovers that may be used to offset future realized capital gains for federal income tax purposes. The capital loss carryovers may be carried forward for an unlimited period. Future capital loss carryover utilization in any given year may be subject to Internal Revenue Code limitations.
18
| Financial Highlights |
| For a Share Outstanding Throughout the Period Indicated | ||||||||||||
| Per-Share Data | Ratios and Supplemental Data | |||||||||||
| Income From Investment Operations: | Ratio to Average Net Assets of: | |||||||||||
Net Asset Value, Beginning of Period | Net Investment Income (Loss)(1) | Net Realized and Unrealized Gain (Loss) | Total From Investment Operations | Net Asset Value, End of Period | Total Return(2) | Operating Expenses | Net Investment Income (Loss) | Portfolio Turnover Rate | Net Assets, End of Period (in thousands) | |||
| Investor Class | ||||||||||||
2015(3) | $10.00 | 0.02 | 0.27 | 0.29 | $10.29 | 2.70% | 1.47%(4) | 0.32%(4) | 118% | $65,428 | ||
| Institutional Class | ||||||||||||
2015(3) | $10.00 | 0.04 | 0.26 | 0.30 | $10.30 | 2.80% | 1.27%(4) | 0.52%(4) | 118% | $133,255 | ||
| R6 Class | ||||||||||||
2015(3) | $10.00 | 0.05 | 0.26 | 0.31 | $10.31 | 2.90% | 1.12%(4) | 0.67%(4) | 118% | $8,433 | ||
| Notes to Financial Highlights |
| (1) | Computed using average shares outstanding throughout the period. |
| (2) | Total returns are calculated based on the net asset value of the last business day. Total returns for periods less than one year are not annualized. |
| (3) | March 19, 2015 (fund inception) through November 30, 2015. |
| (4) | Annualized. |
See Notes to Financial Statements.
19
| Report of Independent Registered Public Accounting Firm |
To the Board of Directors and Shareholders of American Century World Mutual Funds, Inc.:
We have audited the accompanying statement of assets and liabilities, including the schedule of investments, of NT International Small-Mid Cap Fund (the “Fund”), one of the funds constituting American Century World Mutual Funds, Inc., as of November 30, 2015, and the related statements of operations, changes in net assets, and the financial highlights for the period from March 19, 2015 (commencement date) through November 30, 2015. These financial statements and financial highlights are the responsibility of the Fund’s management. Our responsibility is to express an opinion on these financial statements and financial highlights based on our audit.
We conducted our audit in accordance with the standards of the Public Company Accounting Oversight Board (United States). Those standards require that we plan and perform the audit to obtain reasonable assurance about whether the financial statements and financial highlights are free of material misstatement. The Fund is not required to have, nor were we engaged to perform, an audit of its internal control over financial reporting. Our audit included consideration of internal control over financial reporting as a basis for designing audit procedures that are appropriate in the circumstances, but not for the purpose of expressing an opinion on the effectiveness of the Fund’s internal control over financial reporting. Accordingly, we express no such opinion. An audit also includes examining, on a test basis, evidence supporting the amounts and disclosures in the financial statements, assessing the accounting principles used and significant estimates made by management, as well as evaluating the overall financial statement presentation. Our procedures included confirmation of securities owned as of November 30, 2015, by correspondence with the custodian and brokers; when replies were not received from brokers, we performed other auditing procedures. We believe that our audit provides a reasonable basis for our opinion.
In our opinion, the financial statements and financial highlights referred to above present fairly, in all material respects, the financial position of NT International Small-Mid Cap Fund of American Century World Mutual Funds, Inc. as of November 30, 2015, and the results of its operations, the changes in its net assets, and the financial highlights for the period from March 19, 2015 (commencement date) through November 30, 2015, in conformity with accounting principles generally accepted in the United States of America.
DELOITTE & TOUCHE LLP
Kansas City, Missouri
January 19, 2016
20
| Management |
The Board of Directors
The individuals listed below serve as directors of the funds. Each director will continue to serve in this capacity until death, retirement, resignation or removal from office. The board has adopted a mandatory retirement age for directors who are not “interested persons,” as that term is defined in the Investment Company Act (independent directors). Independent directors shall retire by December 31 of the year in which they reach their 75th birthday.
Mr. Thomas is an “interested person” because he currently serves as President and Chief Executive Officer of American Century Companies, Inc. (ACC), the parent company of American Century Investment Management, Inc. (ACIM or the advisor). Mr. Fink is treated as an “interested person” because of his recent employment with ACC and American Century Services, LLC (ACS). The other directors (more than three-fourths of the total number) are independent. They are not employees, directors or officers of, and have no financial interest in, ACC or any of its wholly owned, direct or indirect, subsidiaries, including ACIM, American Century Investment Services, Inc. (ACIS) and ACS, and they do not have any other affiliations, positions or relationships that would cause them to be considered “interested persons” under the Investment Company Act. The directors serve in this capacity for seven (in the case of Mr. Thomas, 15) registered investment companies in the American Century Investments family of funds.
The following table presents additional information about the directors. The mailing address for each director is 4500 Main Street, Kansas City, Missouri 64111.
Name (Year of Birth) | Position(s) Held with Funds | Length of Time Served | Principal Occupation(s) During Past 5 Years | Number of American Century Portfolios Overseen by Director | Other Directorships Held During Past 5 Years |
| Independent Directors | |||||
Thomas A. Brown(1) (1940) | Director | Since 1980 | Managing Member, Associated Investments, LLC (real estate investment company) | 80 | None |
| Andrea C. Hall (1945) | Director | Since 1997 | Retired | 80 | None |
| Jan M. Lewis (1957) | Director | Since 2011 | Retired; President and Chief Executive Officer, Catholic Charities of Northeast Kansas (human services organization) (2006 to 2013) | 80 | None |
| James A. Olson (1942) | Director and Chairman of the Board | Since 2007 (Chairman since 2014) | Member, Plaza Belmont LLC (private equity fund manager) | 80 | Saia, Inc. (2002 to 2012) and EPR Properties (2003 to 2013) |
| M. Jeannine Strandjord (1945) | Director | Since 1994 | Retired | 80 | Euronet Worldwide Inc.; MGP Ingredients, Inc.; Charming Shoppes, Inc. (2006 to 2010); and DST Systems Inc. (1996 to 2012) |
| John R. Whitten (1946) | Director | Since 2008 | Retired | 80 | Rudolph Technologies, Inc. |
21
| Name (Year of Birth) | Position(s) Held with Funds | Length of Time Served | Principal Occupation(s) During Past 5 Years | Number of American Century Portfolios Overseen by Director | Other Directorships Held During Past 5 Years |
| Independent Directors | |||||
| Stephen E. Yates (1948) | Director | Since 2012 | Retired; Executive Vice President, Technology & Operations, KeyCorp. (computer services) (2004 to 2010) | 80 | Applied Industrial Technologies, Inc. (2001 to 2010) |
| Interested Directors | |||||
| Barry Fink (1955) | Director | Since 2012 | Retired; Executive Vice President, ACC (September 2007 to February 2013); President, ACS (October 2007 to February 2013); Chief Operating Officer, ACC (September 2007 to November 2012) | 80 | None |
| Jonathan S. Thomas (1963) | Director and President | Since 2007 | President and Chief Executive Officer, ACC (March 2007 to present). Also serves as Chief Executive Officer, ACS; Executive Vice President, ACIM; Director, ACC, ACIM and other ACC subsidiaries | 125 | BioMed Valley Discoveries, Inc. |
(1) Thomas A. Brown retired as Director of the Board effective December 31, 2015.
The Statement of Additional Information has additional information about the fund's directors and is available without charge, upon request, by calling 1-800-345-2021.
22
Officers
The following table presents certain information about the executive officers of the funds. Each officer serves as an officer for each of the 15 investment companies in the American Century family of funds, unless otherwise noted. No officer is compensated for his or her service as an officer of the funds. The listed officers are interested persons of the funds and are appointed or re-appointed on an annual basis. The mailing address for each officer listed below is 4500 Main Street, Kansas City, Missouri 64111.
Name (Year of Birth) | Offices with the Funds | Principal Occupation(s) During the Past Five Years |
| Jonathan S. Thomas (1963) | Director and President since 2007 | President and Chief Executive Officer, ACC (March 2007 to present). Also serves as Chief Executive Officer, ACS; Executive Vice President, ACIM; Director, ACC, ACIM and other ACC subsidiaries |
| Amy D. Shelton (1964) | Chief Compliance Officer and Vice President since 2014 | Chief Compliance Officer, American Century funds, (March 2014 to present); Chief Compliance Officer, ACIM (February 2014 to present); Chief Compliance Officer, ACIS (October 2009 to present); Vice President, Client Interactions and Marketing, ACIS (February 2013 to January 2014); Director, Client Interactions and Marketing, ACIS (June 2007 to January 2013). Also serves as Vice President, ACIS |
| Charles A. Etherington (1957) | General Counsel since 2007 and Senior Vice President since 2006 | Attorney, ACC (February 1994 to present); Vice President, ACC (November 2005 to present); General Counsel, ACC (March 2007 to present). Also serves as General Counsel, ACIM, ACS, ACIS and other ACC subsidiaries; and Senior Vice President, ACIM and ACS |
| C. Jean Wade (1964) | Vice President, Treasurer and Chief Financial Officer since 2012 | Vice President, ACS (February 2000 to present) |
| Robert J. Leach (1966) | Vice President since 2006 and Assistant Treasurer since 2012 | Vice President, ACS (February 2000 to present) |
| David H. Reinmiller (1963) | Vice President since 2000 | Attorney, ACC (January 1994 to present); Associate General Counsel, ACC (January 2001 to present). Also serves as Vice President, ACIM and ACS |
| Ward D. Stauffer (1960) | Secretary since 2005 | Attorney, ACC (June 2003 to present) |
23
| Additional Information |
Retirement Account Information
As required by law, distributions you receive from certain IRAs are subject to federal income tax withholding, unless you elect not to have withholding apply. Tax will be withheld on the total amount withdrawn even though you may be receiving amounts that are not subject to withholding, such as nondeductible contributions. In such case, excess amounts of withholding could occur. You may adjust your withholding election so that a greater or lesser amount will be withheld.
If you don’t want us to withhold on this amount, you must notify us to not withhold the federal income tax. You may notify us in writing or in certain situations by telephone or through other electronic means. For systematic withdrawals, your withholding election will remain in effect until revoked or changed by filing a new election. You have the right to revoke your election at any time.
Remember, even if you elect not to have income tax withheld, you are liable for paying income tax on the taxable portion of your withdrawal. If you elect not to have income tax withheld or you don’t have enough income tax withheld, you may be responsible for payment of estimated tax. You may incur penalties under the estimated tax rules if your withholding and estimated tax payments are not sufficient. You can reduce or defer the income tax on a distribution by directly or indirectly rolling such distribution over to another IRA or eligible plan. You should consult your tax advisor for additional information.
State tax will be withheld if, at the time of your distribution, your address is within one of the mandatory withholding states and you have federal income tax withheld (or as otherwise required by state law). State taxes will be withheld from your distribution in accordance with the respective state rules.
Distributions you receive from 403(b), 457 and qualified plans are subject to special tax and withholding rules. Your plan administrator or plan sponsor is required to provide you with a special tax notice explaining those rules at the time you request a distribution. If applicable, federal and/or state taxes may be withheld from your distribution amount.
Proxy Voting Policies
A description of the policies that the fund's investment advisor uses in exercising the voting rights associated with the securities purchased and/or held by the fund is available without charge, upon request, by calling 1-800-345-2021. It is also available on the "About Us" page of American Century Investments’ website at americancentury.com and on the Securities and Exchange Commission’s website at sec.gov. Information regarding how the investment advisor voted proxies relating to portfolio securities during the most recent 12-month period ended June 30 is available on the "About Us" page at americancentury.com. It is also available at sec.gov.
Quarterly Portfolio Disclosure
The fund files its complete schedule of portfolio holdings with the Securities and Exchange Commission (SEC) for the first and third quarters of each fiscal year on Form N-Q. The fund’s Forms N-Q are available on the SEC’s website at sec.gov, and may be reviewed and copied at the SEC’s Public Reference Room in Washington, DC. Information on the operation of the Public Reference Room may be obtained by calling 1-800-SEC-0330. The fund also makes its complete schedule of portfolio holdings for the most recent quarter of its fiscal year available on its
website at americancentury.com and, upon request, by calling 1-800-345-2021.
24
Other Tax Information
The following information is provided pursuant to provisions of the Internal Revenue Code.
For the fiscal year ended November 30, 2015, the fund intends to pass through to shareholders foreign source income of $2,689,765 and foreign taxes paid of $156,949, or up to the maximum amount allowable, as a foreign tax credit. Foreign source income and foreign tax expense per outstanding share on November 30, 2015 are $0.1337 and $0.0078, respectively.
25
| Notes |
26
| Notes |
27
| Notes |
28
| ||
| Contact Us | americancentury.com | |
| Automated Information Line | 1-800-345-8765 | |
| Investor Services Representative | 1-800-345-2021 or 816-531-5575 | |
| Investors Using Advisors | 1-800-378-9878 | |
| Business, Not-For-Profit, Employer-Sponsored Retirement Plans | 1-800-345-3533 | |
| Banks and Trust Companies, Broker-Dealers, Financial Professionals, Insurance Companies | 1-800-345-6488 | |
| Telecommunications Relay Service for the Deaf | 711 | |
| American Century World Mutual Funds, Inc. | ||
Investment Advisor: American Century Investment Management, Inc. Kansas City, Missouri | ||
| This report and the statements it contains are submitted for the general information of our shareholders. The report is not authorized for distribution to prospective investors unless preceded or accompanied by an effective prospectus. | ||
| ©2016 American Century Proprietary Holdings, Inc. All rights reserved. CL-ANN-87748 1601 | ||
| ANNUAL REPORT | NOVEMBER 30, 2015 |
NT International Value Fund
| Table of Contents |
| Performance | 2 | |
| Portfolio Commentary | ||
| Fund Characteristics | ||
| Shareholder Fee Example | ||
| Schedule of Investments | ||
| Statement of Assets and Liabilities | ||
| Statement of Operations | ||
| Statement of Changes in Net Assets | ||
| Notes to Financial Statements | ||
| Financial Highlights | ||
| Report of Independent Registered Public Accounting Firm | ||
| Management | ||
| Additional Information | ||
Any opinions expressed in this report reflect those of the author as of the date of the report, and do not necessarily represent the opinions of American Century Investments® or any other person in the American Century Investments organization. Any such opinions are subject to change at any time based upon market or other conditions and American Century Investments disclaims any responsibility to update such opinions. These opinions may not be relied upon as investment advice and, because investment decisions made by American Century Investments funds are based on numerous factors, may not be relied upon as an indication of trading intent on behalf of any American Century Investments fund. Security examples are used for representational purposes only and are not intended as recommendations to purchase or sell securities. Performance information for comparative indices and securities is provided to American Century Investments by third party vendors. To the best of American Century Investments’ knowledge, such information is accurate at the time of printing.
| Performance |
| Total Returns as of November 30, 2015 | |||
Ticker Symbol | Since Inception(1) | Inception Date | |
| Investor Class | ANTVX | -7.60% | 3/19/15 |
| MSCI EAFE Value Index | — | -7.13% | — |
| Institutional Class | ANTYX | -7.50% | 3/19/15 |
| R6 Class | ANTWX | -7.40% | 3/19/15 |
(1) Total returns for periods less than one year are not annualized.
| Growth of $10,000 Over Life of Class |
| $10,000 investment made March 19, 2015 |
| Performance for other share classes will vary due to differences in fee structure. |
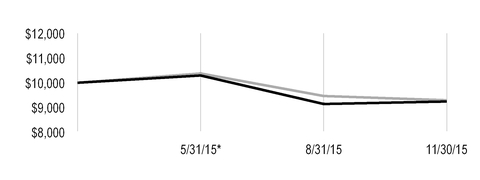
| Value on November 30, 2015 | |
| Investor Class — $9,240 | |
| MSCI EAFE Value Index — $9,287 | |
*From March 19, 2015, the Investor Class’s inception date. Not annualized.
Total Annual Fund Operating Expenses | ||
| Investor Class | Institutional Class | R6 Class |
| 1.31% | 1.11% | 0.96% |
The total annual fund operating expenses shown is as stated in the fund’s prospectus current as of the date of this report. The prospectus may vary from the expense ratio shown elsewhere in this report because it is based on a different time period, includes acquired fund fees and expenses, and, if applicable, does not include fee waivers or expense reimbursements.
Data presented reflect past performance. Past performance is no guarantee of future results. Current performance may be higher or lower than the performance shown. Investment return and principal value will fluctuate, and redemption value may be more or less than original cost. Data assumes reinvestment of dividends and capital gains, and none of the charts reflect the deduction of taxes that a shareholder would pay on fund distributions or the redemption of fund shares. To obtain performance data current to the most recent month end, please call 1-800-345-2021 or visit americancentury.com. For additional information about the fund, please consult the prospectus.
2
| Portfolio Commentary |
Portfolio Managers: Elizabeth Xie, Yulin Long, and Vinod Chandrashekaran
Performance Summary
NT International Value declined -7.50%* for the reporting period (March 19, 2015 - November 30, 2015), compared with the -7.13% return of its benchmark, the MSCI EAFE Value Index. Fund results reflect operating expenses, while benchmark returns do not.
During a period of disappointing global growth, falling oil and commodity prices, and geopolitical instability, most international equity markets declined.
The fund’s stock selection process incorporates factors of valuation, quality, and sentiment while striving to minimize unintended risks along industries and other risk characteristics. Valuation insights, particularly during the second half of the period, were most difficult, while factors of quality and sentiment proved effective, contributing to fund results. Difficult stock selection among utilities led to underperformance. Conversely, consumer discretionary holdings and positioning in the materials sector contributed favorably to relative returns. From a geographical perspective, investments in Japan weighed on the fund’s results, while stock selection in several European countries, including Germany, the U.K., and Denmark, was beneficial.
Japan-Based Holdings Detracted from Performance
Overweight exposure to a number of Japan-based companies whose stock prices declined strongly hurt the fund’s relative returns. An overweight position, relative to the benchmark, in Asahi Kasei pressured relative returns as the conglomerate’s shares slumped mid-year following an analyst downgrade, and we exited our investment in the company. Industrials sector holding Sumitomo Heavy Industries was another key detractor from total portfolio returns. The heavy equipment manufacturer declined with the broad market during the summer on concerns about slowing growth in China and the effect on demand for its equipment. The holding was subsequently liquidated following severe deterioration in quality and sentiment.
Having no exposure to a number of tobacco holdings represented in the benchmark pressured results. As is often the case in a down market, the share prices of these defensive consumer staples stocks advanced significantly. Key detraction in the sector came from not owning U.K.-based Imperial Tobacco Group and Japan-based Japan Tobacco. Overweight exposure to Germany-based utility company E.ON negatively impacted performance as electricity rates fell to their lowest levels in more than a decade and government regulations called for a transition from nuclear power plants to renewable energy sources by 2022. We maintain exposure to E.ON based on strong factors of valuation and quality as the company moves its focus to renewable energy sources.
A portfolio-only investment in U.K.-based Evraz was detrimental as the steel and coal producer faced headwinds of falling metals and commodity prices and demand, as well as pressures from its distressed South African unit, which caused a sharp decline in the steel and coal producer’s share price. We ultimately sold our stake in the holding on an unattractive sentiment profile.
| * | All fund returns referenced in this commentary are for Institutional Class shares. Total returns for periods less than one year are not annualized. Performance for other share classes will vary due to differences in fee structure; when Institutional Class performance exceeds that of the fund's benchmark, other share classes may not. See page 2 for returns for all share classes. |
3
Stock Selection in Europe Benefited Results
Security selection in a number of European markets, particularly in Germany and Denmark, helped to somewhat limit the fund’s losses. Key contribution stemmed from a portfolio-only position in Denmark-based Vestas Wind Systems. The wind turbine manufacturer produced several consecutive quarters of increasing earnings and revenues and upgraded its full-year outlook based on growing demand and rising orders for renewable power generation. In Germany, not owning Volkswagen helped relative performance as the automaker’s stock prices fell sharply following admission of emissions testing results fabrication.
Not owning several U.K.-based metals and mining companies, including Glencore and Anglo American, benefited results as the price of commodities and metals declined steadily over the course of the period. An overweight position in Direct Line Insurance Group, another U.K.-based holding, also proved beneficial. Shares of Britain’s largest auto insurer reached record highs after the company beat first-half profit expectations and issued a substantial cash dividend to shareholders.
A Look Ahead
As we approach 2016, economic activity in most global markets continues to lag that of the U.S. We believe that divergence in monetary policy between the U.S. and much of the rest of the world will continue as the U.S. Federal Reserve (Fed) raises interest rates, while central banks elsewhere maintain aggressive monetary stimulus. Investor sentiment in financial markets is therefore likely to be driven by the pace and magnitude of Fed rate moves, as well as by the trajectory of global economic growth, particularly in China. In such an environment, we believe that our disciplined investment approach is particularly beneficial during periods of likely volatility, and we adhere to our process regardless of the market environment. We believe that this allows us to take advantage of opportunities presented by market inefficiencies.
We believe that stock selection—rather than regional and sector allocation or market timing via the use of cash—is the most efficient means of generating superior risk-adjusted returns. As a result of this approach, the fund’s country and sector weightings are primarily a result of identifying what we believe to be superior individual securities. The fund's largest, but modest, overweights are in consumer discretionary and telecommunication services, while the underweights are led by the utilities and consumer staples sectors. Geographically, the fund’s greatest underweight is in Asia, while exposure to Europe is greater than that of the benchmark.
4
| Fund Characteristics |
| NOVEMBER 30, 2015 | |
Top Ten Holdings | % of net assets |
| AstraZeneca plc | 2.3% |
| HSBC Holdings plc | 2.1% |
| Royal Dutch Shell plc, B Shares | 1.8% |
| AXA SA | 1.7% |
| Sumitomo Mitsui Financial Group, Inc. | 1.7% |
| Zurich Insurance Group AG | 1.7% |
| ING Groep NV CVA | 1.6% |
| Sanofi | 1.6% |
| Eni SpA | 1.6% |
| Allianz SE | 1.5% |
Types of Investments in Portfolio | % of net assets |
| Common Stocks | 97.2% |
| Exchange-Traded Funds | 0.5% |
| Total Equity Exposure | 97.7% |
| Temporary Cash Investments | 1.9% |
| Other Assets and Liabilities | 0.4% |
Investments by Country | % of net assets |
| United Kingdom | 23.3% |
| Japan | 22.6% |
| France | 10.6% |
| Germany | 7.2% |
| Switzerland | 5.6% |
| Australia | 5.2% |
| Italy | 3.8% |
| Hong Kong | 3.7% |
| Sweden | 3.3% |
| Netherlands | 2.7% |
| Spain | 2.3% |
| Other Countries | 6.9% |
| Exchange-Traded Funds* | 0.5% |
| Cash and Equivalents** | 2.3% |
*Category may increase exposure to the countries indicated. The Schedule of Investments provides additional information on the fund's portfolio holdings. | |
| **Includes temporary cash investments and other assets and liabilities. | |
5
| Shareholder Fee Example |
Fund shareholders may incur two types of costs: (1) transaction costs, including sales charges (loads) on purchase payments and redemption/exchange fees; and (2) ongoing costs, including management fees; distribution and service (12b-1) fees; and other fund expenses. This example is intended to help you understand your ongoing costs (in dollars) of investing in your fund and to compare these costs with the ongoing cost of investing in other mutual funds.
The example is based on an investment of $1,000 made at the beginning of the period and held for the entire period from June 1, 2015 to November 30, 2015.
Actual Expenses
The table provides information about actual account values and actual expenses for each class. You may use the information, together with the amount you invested, to estimate the expenses that you paid over the period. First, identify the share class you own. Then simply divide your account value by $1,000 (for example, an $8,600 account value divided by $1,000 = 8.6), then multiply the result by the number under the heading “Expenses Paid During Period” to estimate the expenses you paid on your account during this period.
Hypothetical Example for Comparison Purposes
The table also provides information about hypothetical account values and hypothetical expenses based on the actual expense ratio of each class of your fund and an assumed rate of return of 5% per year before expenses, which is not the actual return of a fund’s share class. The hypothetical account values and expenses may not be used to estimate the actual ending account balance or expenses you paid for the period. You may use this information to compare the ongoing costs of investing in your fund and other funds. To do so, compare this 5% hypothetical example with the 5% hypothetical examples that appear in the shareholder reports of the other funds.
Please note that the expenses shown in the table are meant to highlight your ongoing costs only and do not reflect any transactional costs, such as sales charges (loads) or redemption/exchange fees. Therefore, the table is useful in comparing ongoing costs only, and will not help you determine the relative total costs of owning different funds. In addition, if these transactional costs were included, your costs would have been higher.
| Beginning Account Value 6/1/15 | Ending Account Value 11/30/15 | Expenses Paid During Period(1)6/1/15 - 11/30/15 | Annualized Expense Ratio(1) | |
Actual | ||||
| Investor Class | $1,000 | $898.00 | $6.23 | 1.31% |
| Institutional Class | $1,000 | $898.10 | $5.28 | 1.11% |
| R6 Class | $1,000 | $899.00 | $4.57 | 0.96% |
| Hypothetical | ||||
| Investor Class | $1,000 | $1,018.50 | $6.63 | 1.31% |
| Institutional Class | $1,000 | $1,019.50 | $5.62 | 1.11% |
| R6 Class | $1,000 | $1,020.26 | $4.86 | 0.96% |
| (1) | Expenses are equal to the class's annualized expense ratio listed in the table above, multiplied by the average account value over the period, multiplied by 183, the number of days in the most recent fiscal half-year, divided by 365, to reflect the one-half year period. |
6
| Schedule of Investments |
NOVEMBER 30, 2015
| Shares | Value | |||
| COMMON STOCKS — 97.2% | ||||
| Australia — 5.2% | ||||
| Australia & New Zealand Banking Group Ltd. | 339,333 | $ | 6,662,765 | |
| BHP Billiton Ltd. | 158,813 | 2,077,702 | ||
| CIMIC Group Ltd. | 264,394 | 4,789,805 | ||
| Commonwealth Bank of Australia | 9,117 | 523,715 | ||
| Downer EDI Ltd. | 455,030 | 1,187,971 | ||
| National Australia Bank Ltd. | 54,000 | 1,147,762 | ||
| Qantas Airways Ltd. | 1,997,599 | 5,258,577 | ||
| Telstra Corp. Ltd. | 1,099,720 | 4,262,903 | ||
| Westpac Banking Corp. | 427,112 | 9,930,732 | ||
| Woodside Petroleum Ltd. | 175,241 | 3,815,971 | ||
| 39,657,903 | ||||
| Belgium — 1.3% | ||||
| bpost SA | 88,384 | 2,147,788 | ||
| KBC Groep NV | 128,989 | 7,700,006 | ||
| 9,847,794 | ||||
| China — 0.1% | ||||
| China Merchants Bank Co. Ltd., H Shares | 450,000 | 1,057,465 | ||
| Denmark — 1.1% | ||||
| Vestas Wind Systems A/S | 126,688 | 8,265,791 | ||
| Finland — 0.3% | ||||
| UPM-Kymmene Oyj | 126,936 | 2,423,443 | ||
| France — 10.6% | ||||
| AXA SA | 498,362 | 13,484,798 | ||
| BNP Paribas SA | 100,300 | 5,946,085 | ||
| Engie SA | 401,996 | 7,003,777 | ||
| Eutelsat Communications SA | 85,187 | 2,542,622 | ||
| Faurecia | 126,097 | 4,733,582 | ||
Innate Pharma SA(1) | 50,305 | 737,187 | ||
| Metropole Television SA | 56,965 | 1,058,076 | ||
Nexans SA(1) | 25,875 | 989,644 | ||
| Orange SA | 484,877 | 8,381,173 | ||
Peugeot SA(1) | 480,766 | 8,589,488 | ||
| Sanofi | 139,292 | 12,418,114 | ||
| Societe Generale SA | 26,775 | 1,278,102 | ||
| Suez Environnement Co. | 130,465 | 2,473,588 | ||
| Technicolor SA | 378,547 | 2,838,872 | ||
| Total SA | 129,376 | 6,424,532 | ||
UbiSoft Entertainment SA(1) | 37,279 | 1,043,759 | ||
| Valeo SA | 13,783 | 2,134,123 | ||
| 82,077,522 | ||||
| Germany — 7.2% | ||||
| Allianz SE | 63,495 | 11,246,905 | ||
7
| Shares | Value | |||
| Aurubis AG | 59,965 | $ | 3,736,103 | |
| BASF SE | 29,714 | 2,459,431 | ||
| Deutsche Bank AG | 157,912 | 4,055,092 | ||
| Deutsche Telekom AG | 457,072 | 8,429,356 | ||
Dialog Semiconductor plc(1) | 15,582 | 581,808 | ||
| E.ON SE | 458,401 | 4,356,974 | ||
| Grand City Properties SA | 67,852 | 1,397,936 | ||
| Hannover Rueck SE | 23,110 | 2,704,168 | ||
| Metro AG | 196,037 | 6,536,797 | ||
| ProSiebenSat.1 Media SE | 136,700 | 7,178,188 | ||
| Siemens AG | 29,846 | 3,094,725 | ||
| 55,777,483 | ||||
| Hong Kong — 3.7% | ||||
| BOC Hong Kong Holdings Ltd. | 313,500 | 960,298 | ||
| CK Hutchison Holdings Ltd. | 248,500 | 3,259,510 | ||
| Dah Sing Banking Group Ltd. | 558,800 | 1,089,716 | ||
| Hang Seng Bank Ltd. | 513,000 | 9,296,055 | ||
| Link REIT | 1,265,500 | 7,695,713 | ||
| New World Development Co. Ltd. | 3,089,000 | 3,075,674 | ||
WH Group Ltd.(1) | 5,284,000 | 2,726,012 | ||
| 28,102,978 | ||||
| Israel — 1.4% | ||||
| Bank Hapoalim BM | 1,503,021 | 7,772,205 | ||
| Bezeq The Israeli Telecommunication Corp. Ltd. | 518,889 | 1,117,779 | ||
| Mizrahi Tefahot Bank Ltd. | 31,802 | 376,296 | ||
| Teva Pharmaceutical Industries Ltd. | 27,945 | 1,711,397 | ||
| 10,977,677 | ||||
| Italy — 3.8% | ||||
| A2A SpA | 2,196,240 | 3,086,181 | ||
| Enel SpA | 820,688 | 3,619,266 | ||
| Eni SpA | 758,206 | 12,352,689 | ||
| EXOR SpA | 66,997 | 3,002,728 | ||
Fiat Chrysler Automobiles NV(1) | 302,112 | 4,315,535 | ||
| UnipolSai SpA | 1,052,671 | 2,715,990 | ||
| 29,092,389 | ||||
| Japan — 22.6% | ||||
| Bank of Yokohama Ltd. (The) | 268,000 | 1,577,303 | ||
| Canon, Inc. | 347,800 | 10,498,983 | ||
| Central Japan Railway Co. | 47,900 | 8,554,683 | ||
| Chiba Bank Ltd. (The) | 236,000 | 1,627,652 | ||
| Daiichikosho Co., Ltd. | 14,800 | 485,118 | ||
| Daiwa Securities Group, Inc. | 91,000 | 588,654 | ||
| Fuji Heavy Industries Ltd. | 57,300 | 2,368,338 | ||
| FUJIFILM Holdings Corp. | 157,700 | 6,387,427 | ||
| Honda Motor Co., Ltd. | 63,300 | 2,057,893 | ||
| Iida Group Holdings Co. Ltd. | 185,800 | 3,613,365 | ||
| ITOCHU Corp. | 336,000 | 4,099,691 | ||
8
| Shares | Value | |||
| Jafco Co. Ltd. | 62,800 | $ | 2,494,655 | |
| Japan Airlines Co. Ltd. | 218,800 | 7,482,925 | ||
| JX Holdings, Inc. | 2,223,600 | 9,019,037 | ||
| Kawasaki Kisen Kaisha Ltd. | 1,849,000 | 3,800,138 | ||
| KDDI Corp. | 118,700 | 2,948,697 | ||
| Medipal Holdings Corp. | 182,600 | 3,199,579 | ||
| Mitsubishi Chemical Holdings Corp. | 1,036,400 | 6,791,746 | ||
| Mitsubishi Motors Corp. | 95,300 | 848,487 | ||
| Mitsubishi UFJ Financial Group, Inc. | 1,524,400 | 9,782,908 | ||
| Mitsui Mining & Smelting Co. Ltd. | 830,000 | 1,597,969 | ||
| Mixi, Inc. | 31,900 | 1,306,060 | ||
| Mizuho Financial Group, Inc. | 377,400 | 761,851 | ||
| MS&AD Insurance Group Holdings, Inc. | 208,400 | 5,877,862 | ||
| Nippon Telegraph & Telephone Corp. | 239,500 | 8,881,539 | ||
| NTT Data Corp. | 46,700 | 2,276,198 | ||
| NTT DoCoMo, Inc. | 158,700 | 3,001,248 | ||
| OKUMA Corp. | 46,000 | 418,148 | ||
| ORIX Corp. | 195,700 | 2,824,217 | ||
| Panasonic Corp. | 267,100 | 3,032,269 | ||
| Sankyu, Inc. | 492,000 | 2,454,005 | ||
| SBI Holdings, Inc. | 389,500 | 4,413,912 | ||
| Seven Bank Ltd. | 1,149,800 | 5,034,461 | ||
| Sony Corp. | 294,000 | 7,587,636 | ||
| Sumitomo Chemical Co. Ltd. | 1,107,000 | 6,348,838 | ||
| Sumitomo Mitsui Financial Group, Inc. | 353,400 | 13,484,320 | ||
| Takeda Pharmaceutical Co., Ltd. | 43,400 | 2,109,360 | ||
| Teijin Ltd. | 983,000 | 3,497,595 | ||
Tokyo Electric Power Co., Inc.(1) | 997,500 | 6,109,789 | ||
| Toyota Motor Corp. | 78,200 | 4,864,154 | ||
| 174,108,710 | ||||
| Netherlands — 2.7% | ||||
| Boskalis Westminster NV | 9,100 | 404,967 | ||
| ING Groep NV CVA | 907,042 | 12,453,563 | ||
| Koninklijke Ahold NV | 379,742 | 8,261,043 | ||
| 21,119,573 | ||||
| New Zealand — 0.2% | ||||
| Meridian Energy Ltd. | 627,817 | 958,764 | ||
| Mighty River Power Ltd. | 434,600 | 829,619 | ||
| 1,788,383 | ||||
| Norway — 1.0% | ||||
| TGS Nopec Geophysical Co. ASA | 395,009 | 7,595,147 | ||
| Portugal — 0.9% | ||||
| EDP - Energias de Portugal SA | 2,166,420 | 7,221,575 | ||
| Singapore — 0.6% | ||||
| Oversea-Chinese Banking Corp. Ltd. | 409,000 | 2,513,934 | ||
| United Overseas Bank Ltd. | 130,500 | 1,793,907 | ||
| 4,307,841 | ||||
9
| Shares | Value | |||
| Spain — 2.3% | ||||
| Banco Santander SA | 1,002,041 | $ | 5,471,393 | |
| Endesa SA | 247,396 | 5,117,941 | ||
| Mapfre SA | 570,684 | 1,565,877 | ||
| Telefonica SA | 433,427 | 5,346,417 | ||
| 17,501,628 | ||||
| Sweden — 3.3% | ||||
| Axfood AB | 46,460 | 843,778 | ||
| Boliden AB | 41,748 | 767,296 | ||
| Electrolux AB | 35,225 | 1,033,915 | ||
| Investment AB Kinnevik, B Shares | 74,610 | 2,295,153 | ||
| Investor AB, B Shares | 197,629 | 7,531,918 | ||
| Peab AB | 274,244 | 2,094,138 | ||
| Skanska AB, B Shares | 249,860 | 4,973,250 | ||
| SKF AB, B Shares | 350,586 | 6,113,890 | ||
| 25,653,338 | ||||
| Switzerland — 5.6% | ||||
| Nestle SA | 123,021 | 9,129,274 | ||
| Novartis AG | 26,481 | 2,263,696 | ||
| Roche Holding AG | 28,924 | 7,745,116 | ||
| Swiss Reinsurance Co. | 106,386 | 10,138,647 | ||
| Transocean Ltd. | 100,563 | 1,451,485 | ||
| Zurich Insurance Group AG | 48,434 | 12,752,851 | ||
| 43,481,069 | ||||
| United Kingdom — 23.3% | ||||
| AstraZeneca plc | 262,374 | 17,792,133 | ||
| Aviva plc | 683,438 | 5,264,999 | ||
| Barclays plc | 444,351 | 1,493,736 | ||
| Berkeley Group Holdings plc | 84,809 | 4,101,434 | ||
| BHP Billiton plc | 398,270 | 4,780,077 | ||
| BP plc | 1,069,181 | 6,203,651 | ||
| British Land Co. plc (The) | 197,006 | 2,474,566 | ||
| BT Group plc | 949,765 | 7,101,420 | ||
| Centrica plc | 551,558 | 1,811,759 | ||
| Debenhams plc | 873,100 | 1,099,319 | ||
| Direct Line Insurance Group plc | 1,209,143 | 7,499,244 | ||
| GlaxoSmithKline plc | 228,571 | 4,666,316 | ||
| Go-Ahead Group plc | 58,360 | 2,309,905 | ||
| HSBC Holdings plc | 2,064,829 | 16,466,586 | ||
| Investec plc | 908,642 | 7,732,052 | ||
| Land Securities Group plc | 172,928 | 3,206,099 | ||
| Legal & General Group plc | 2,008,768 | 8,213,970 | ||
| Lloyds Banking Group plc | 5,874,496 | 6,455,189 | ||
| Man Group plc | 2,571,216 | 6,319,929 | ||
| Marks & Spencer Group plc | 763,999 | 5,782,057 | ||
| Moneysupermarket.com Group plc | 107,166 | 526,172 | ||
| Petrofac Ltd. | 180,377 | 2,241,241 | ||
| Rio Tinto plc | 325,413 | 10,823,951 | ||
| Royal Dutch Shell plc, B Shares | 554,000 | 13,783,938 | ||
| Royal Mail plc | 746,049 | 5,461,934 | ||
10
| Shares | Value | |||
| Segro plc | 505,740 | $ | 3,360,596 | |
| Sky plc | 496,139 | 8,264,413 | ||
| Standard Chartered plc | 205,799 | 1,727,062 | ||
Thomas Cook Group plc(1) | 456,545 | 824,435 | ||
| Vodafone Group plc | 1,415,524 | 4,780,829 | ||
| WM Morrison Supermarkets plc | 3,269,168 | 7,508,628 | ||
| 180,077,640 | ||||
TOTAL COMMON STOCKS (Cost $792,741,796) | 750,135,349 | |||
| EXCHANGE-TRADED FUNDS — 0.5% | ||||
iShares MSCI Japan ETF (Cost $3,620,662) | 304,650 | 3,774,613 | ||
| TEMPORARY CASH INVESTMENTS — 1.9% | ||||
| Repurchase Agreement, Credit Suisse First Boston, Inc., (collateralized by various U.S. Treasury obligations, 0.625%, 8/31/17, valued at $5,018,185), in a joint trading account at 0.01%, dated 11/30/15, due 12/1/15 (Delivery value $4,921,157) | 4,921,156 | |||
| Repurchase Agreement, Fixed Income Clearing Corp., (collateralized by various U.S. Treasury obligations, 3.00%, 11/15/44, valued at $8,369,525), at 0.01%, dated 11/30/15, due 12/1/15 (Delivery value $8,204,002) | 8,204,000 | |||
| State Street Institutional Liquid Reserves Fund, Premier Class | 1,930,000 | 1,930,000 | ||
TOTAL TEMPORARY CASH INVESTMENTS (Cost $15,055,156) | 15,055,156 | |||
TOTAL INVESTMENT SECURITIES — 99.6% (Cost $811,417,614) | 768,965,118 | |||
| OTHER ASSETS AND LIABILITIES — 0.4% | 2,891,795 | |||
| TOTAL NET ASSETS — 100.0% | $ | 771,856,913 | ||
| MARKET SECTOR DIVERSIFICATION | ||
(as a % of net assets) | ||
| Financials | 36.1 | % |
| Consumer Discretionary | 10.4 | % |
| Industrials | 10.1 | % |
| Energy | 8.2 | % |
| Telecommunication Services | 6.9 | % |
| Health Care | 6.8 | % |
| Materials | 5.8 | % |
| Utilities | 5.5 | % |
| Consumer Staples | 4.5 | % |
| Information Technology | 2.9 | % |
| Exchange-Traded Funds | 0.5 | % |
| Cash and Equivalents* | 2.3 | % |
*Includes temporary cash investments and other assets and liabilities.
| NOTES TO SCHEDULE OF INVESTMENTS | ||
| CVA | - | Certificaten Van Aandelen |
| (1) | Non-income producing. |
See Notes to Financial Statements.
11
| Statement of Assets and Liabilities |
| NOVEMBER 30, 2015 | |||
| Assets | |||
| Investment securities, at value (cost of $811,417,614) | $ | 768,965,118 | |
| Foreign currency holdings, at value (cost of $152,663) | 151,450 | ||
| Receivable for capital shares sold | 24,514 | ||
| Dividends and interest receivable | 3,814,308 | ||
| Other assets | 1,274 | ||
| 772,956,664 | |||
| Liabilities | |||
| Payable for capital shares redeemed | 373,790 | ||
| Accrued management fees | 725,961 | ||
| 1,099,751 | |||
| Net Assets | $ | 771,856,913 | |
| Net Assets Consist of: | |||
| Capital (par value and paid-in surplus) | $ | 831,570,970 | |
| Undistributed net investment income | 16,633,942 | ||
| Accumulated net realized loss | (33,829,560 | ) | |
| Net unrealized depreciation | (42,518,439 | ) | |
| $ | 771,856,913 | ||
| Net Assets | Shares Outstanding | Net Asset Value Per Share | ||||
| Investor Class, $0.01 Par Value | $194,181,385 | 21,026,065 | $9.24 | |||
| Institutional Class, $0.01 Par Value | $544,368,811 | 58,860,580 | $9.25 | |||
| R6 Class, $0.01 Par Value | $33,306,717 | 3,597,333 | $9.26 | |||
See Notes to Financial Statements.
12
| Statement of Operations |
FOR THE PERIOD ENDED NOVEMBER 30, 2015(1) | |||
| Investment Income (Loss) | |||
| Income: | |||
| Dividends (net of foreign taxes withheld of $1,869,325) | $ | 22,934,057 | |
| Interest | 4,435 | ||
| 22,938,492 | |||
| Expenses: | |||
| Management fees | 6,205,703 | ||
| Directors' fees and expenses | 17,926 | ||
| Other expenses | 2,484 | ||
| 6,226,113 | |||
| Net investment income (loss) | 16,712,379 | ||
| Realized and Unrealized Gain (Loss) | |||
| Net realized gain (loss) on: | |||
| Investment transactions | (33,685,657 | ) | |
| Foreign currency transactions | (222,340 | ) | |
| (33,907,997 | ) | ||
| Change in net unrealized appreciation (depreciation) on: | |||
| Investments | (42,452,496 | ) | |
| Translation of assets and liabilities in foreign currencies | (65,943 | ) | |
| (42,518,439 | ) | ||
| Net realized and unrealized gain (loss) | (76,426,436 | ) | |
| Net Increase (Decrease) in Net Assets Resulting from Operations | $ | (59,714,057 | ) |
| (1) | March 19, 2015 (fund inception) through November 30, 2015. |
See Notes to Financial Statements.
13
| Statement of Changes in Net Assets |
PERIOD ENDED NOVEMBER 30, 2015(1) | |||
| Increase (Decrease) in Net Assets | |||
| Operations | |||
| Net investment income (loss) | $ | 16,712,379 | |
| Net realized gain (loss) | (33,907,997 | ) | |
| Change in net unrealized appreciation (depreciation) | (42,518,439 | ) | |
| Net increase (decrease) in net assets resulting from operations | (59,714,057 | ) | |
| Capital Share Transactions | |||
| Net increase (decrease) in net assets from capital share transactions (Note 5) | 831,570,970 | ||
| Net increase (decrease) in net assets | 771,856,913 | ||
| Net Assets | |||
| End of period | $ | 771,856,913 | |
| Undistributed net investment income | $ | 16,633,942 | |
| (1) | March 19, 2015 (fund inception) through November 30, 2015. |
See Notes to Financial Statements.
14
| Notes to Financial Statements |
NOVEMBER 30, 2015
1. Organization
American Century World Mutual Funds, Inc. (the corporation) is registered under the Investment Company Act of 1940, as amended (the 1940 Act), as an open-end management investment company and is organized as a Maryland corporation. NT International Value Fund (the fund) is one fund in a series issued by the corporation. The fund is diversified as defined under the 1940 Act. The fund's investment objective is to seek long-term capital growth. The fund is not permitted to invest in securities issued by companies assigned the Global Industry Classification Standard for the tobacco industry.
The fund offers the Investor Class, the Institutional Class and the R6 Class, which have different fees and expenses. The difference in the fee structures between the classes is the result of their separate arrangements for shareholder and distribution services. It is not the result of any difference in advisory or custodial fees or other expenses related to the management of the fund’s assets, which do not vary by class. The fund’s shares are available for purchase exclusively by certain American Century Investments funds of funds and the fund’s arrangements for shareholder and distribution services take into account the varying levels of services required by shareholders of different classes of the funds of funds. The Institutional Class and R6 Class shareholders do not require the same level of shareholder and administrative services from American Century Investment Management, Inc. (ACIM) (the investment advisor) as shareholders of the Investor Class. In addition, financial intermediaries do not receive any service, distribution or administrative fees for the R6 Class. As a result, the Institutional Class and R6 Class are charged lower unified management fees. All classes of the fund commenced sale on March 19, 2015, the fund’s inception date.
2. Significant Accounting Policies
The following is a summary of significant accounting policies consistently followed by the fund in preparation of its financial statements. The fund is an investment company and follows accounting and reporting guidance in accordance with accounting principles generally accepted in the United States of America. This may require management to make certain estimates and assumptions at the date of the financial statements. Actual results could differ from these estimates. Management evaluated the impact of events or transactions occurring through the date the financial statements were issued that would merit recognition or disclosure.
Investment Valuations — The fund determines the fair value of its investments and computes its net asset value per share at the close of regular trading (usually 4 p.m. Eastern time) on the New York Stock Exchange (NYSE) on each day the NYSE is open. The Board of Directors has adopted valuation policies and procedures to guide the investment advisor in the fund’s investment valuation process and to provide methodologies for the oversight of the fund’s pricing function.
Equity securities that are listed or traded on a domestic securities exchange are valued at the last reported sales price or at the official closing price as provided by the exchange. Equity securities traded on foreign securities exchanges are generally valued at the closing price of such securities on the exchange where primarily traded or at the close of the NYSE, if that is earlier. If no last sales price is reported, or if local convention or regulation so provides, the mean of the latest bid and asked prices may be used. Securities traded over-the-counter are valued at the mean of the latest bid and asked prices, the last sales price, or the official closing price. Equity securities initially expressed in local currencies are translated into U.S. dollars at the mean of the appropriate currency exchange rate at the close of the NYSE as provided by an independent pricing service.
Open-end management investment companies are valued at the reported net asset value per share. Repurchase agreements are valued at cost, which approximates fair value.
If the fund determines that the market price for an investment is not readily available or the valuation methods mentioned above do not reflect an investment’s fair value, such investment is valued as determined in good faith by the Board of Directors or its delegate, in accordance with policies and procedures adopted by the Board of Directors. In its determination of fair value, the fund may review several factors including, but not limited to, market information regarding the specific investment or comparable investments and correlation with other investment types, futures indices or general market indicators. Circumstances that may cause the fund to use these procedures to value an investment include, but are not limited to: an investment has been
15
declared in default or is distressed; trading in a security has been suspended during the trading day or a security is not actively trading on its principal exchange; prices received from a regular pricing source are deemed unreliable; or there is a foreign market holiday and no trading occurred.
The fund monitors for significant events occurring after the close of an investment’s primary exchange but before the fund’s net asset value per share is determined. Significant events may include, but are not limited to: corporate announcements and transactions; governmental action and political unrest that could impact a specific investment or an investment sector; or armed conflicts, natural disasters and similar events that could affect investments in a specific country or region. The fund also monitors for significant fluctuations between domestic and foreign markets, as evidenced by the U.S. market or such other indicators that the Board of Directors, or its delegate, deems appropriate. If significant fluctuations in foreign markets are identified, the fund may apply a model-derived factor to the closing price of equity securities traded on foreign securities exchanges. The factor is based on observable market data as provided by an independent pricing service.
Security Transactions — Security transactions are accounted for as of the trade date. Net realized gains and losses are determined on the identified cost basis, which is also used for federal income tax purposes.
Investment Income — Dividend income less foreign taxes withheld, if any, is recorded as of the ex-dividend date. Distributions received on securities that represent a return of capital or long-term capital gain are recorded as a reduction of cost of investments and/or as a realized gain. The fund may estimate the components of distributions received that may be considered nontaxable distributions or long-term capital gain distributions for income tax purposes. Interest income is recorded on the accrual basis and includes accretion of discounts and amortization of premiums.
Foreign Currency Translations — All assets and liabilities initially expressed in foreign currencies are translated into U.S. dollars at prevailing exchange rates at period end. The fund may enter into spot foreign currency exchange contracts to facilitate transactions denominated in a foreign currency. Purchases and sales of investment securities, dividend and interest income, spot foreign currency exchange contracts, and expenses are translated at the rates of exchange prevailing on the respective dates of such transactions. Net realized and unrealized foreign currency exchange gains or losses related to investment securities are a component of net realized gain (loss) on investment transactions and change in net unrealized appreciation (depreciation) on investments, respectively.
Repurchase Agreements — The fund may enter into repurchase agreements with institutions that ACIM has determined are creditworthy pursuant to criteria adopted by the Board of Directors. The fund requires that the collateral, represented by securities, received in a repurchase transaction be transferred to the custodian in a manner sufficient to enable the fund to obtain those securities in the event of a default under the repurchase agreement. ACIM monitors, on a daily basis, the securities transferred to ensure the value, including accrued interest, of the securities under each repurchase agreement is equal to or greater than amounts owed to the fund under each repurchase agreement.
Joint Trading Account — Pursuant to an Exemptive Order issued by the Securities and Exchange Commission, the fund, along with certain other funds in the American Century Investments family of funds, may transfer uninvested cash balances into a joint trading account. These balances are invested in one or more repurchase agreements that are collateralized by U.S. Treasury or Agency obligations.
Income Tax Status — It is the fund’s policy to distribute substantially all net investment income and net realized gains to shareholders and to otherwise qualify as a regulated investment company under provisions of the Internal Revenue Code. Accordingly, no provision has been made for income taxes. The fund files U.S. federal, state, local and non-U.S. tax returns as applicable. The fund's tax returns are subject to examination by the relevant taxing authority until expiration of the applicable statute of limitations, which is generally three years from the date of filing but can be longer in certain jurisdictions. At this time, management believes there are no uncertain tax positions which, based on their technical merit, would not be sustained upon examination and for which it is reasonably possible that the total amounts of unrecognized tax benefits will significantly change in the next twelve months.
Multiple Class — All shares of the fund represent an equal pro rata interest in the net assets of the class to which such shares belong, and have identical voting, dividend, liquidation and other rights and the same terms and conditions, except for class specific expenses and exclusive rights to vote on matters affecting only individual classes. Income, non-class specific expenses, and realized and unrealized capital gains and losses of the fund are allocated to each class of shares based on their relative net assets.
16
Distributions to Shareholders — Distributions from net investment income and net realized gains, if any, are generally declared and paid annually. The fund may make distributions on a more frequent basis to comply with the distribution requirements of the Internal Revenue Code, in all events in a manner consistent with provisions of the 1940 Act.
Indemnifications — Under the corporation’s organizational documents, its officers and directors are indemnified against certain liabilities arising out of the performance of their duties to the fund. In addition, in the normal course of business, the fund enters into contracts that provide general indemnifications. The maximum exposure under these arrangements is unknown as this would involve future claims that may be made against a fund. The risk of material loss from such claims is considered by management to be remote.
3. Fees and Transactions with Related Parties
Certain officers and directors of the corporation are also officers and/or directors of American Century Companies, Inc. (ACC). The corporation’s investment advisor, ACIM, the corporation's distributor, American Century Investment Services, Inc., and the corporation’s transfer agent, American Century Services, LLC, are wholly owned, directly or indirectly, by ACC. Various funds issued by American Century Asset Allocation Portfolios, Inc. and American Century Strategic Asset Allocations, Inc. own, in aggregate, 100% of the shares of the fund. Related parties do not invest in the fund for the purpose of exercising management or control.
Management Fees — The corporation has entered into a management agreement with ACIM, under which ACIM provides the fund with investment advisory and management services in exchange for a single, unified management fee (the fee) per class. The agreement provides that all expenses of managing and operating the fund, except distribution and service fees, brokerage expenses, taxes, interest, fees and expenses of the independent directors (including legal counsel fees), and extraordinary expenses, will be paid by ACIM. The fee is computed and accrued daily based on each class’s daily net assets and paid monthly in arrears. The rate of the fee is determined by applying a fee rate calculation formula. This formula takes into account the fund’s assets as well as certain assets, if any, of other clients of the investment advisor outside the American Century Investments family of funds (such as subadvised funds and separate accounts) that have very similar investment teams and investment strategies (strategy assets). The strategy assets of the fund also include the assets of International Value Fund, one fund in a series issued by the corporation. The annual management fee schedule ranges from 1.100% to 1.300% for the Investor Class, 0.900% to 1.100% for the Institutional Class and 0.750% to 0.950% for the R6 Class. The effective annual management fee for each class for the period March 19, 2015 (fund inception) through November 30, 2015 was 1.30% for the Investor Class, 1.10% for the Institutional Class and 0.95% for the R6 Class.
Directors' Fees and Expenses — The Board of Directors is responsible for overseeing the investment advisor’s management and operations of the fund. The directors receive detailed information about the fund and its investment advisor regularly throughout the year, and meet at least quarterly with management of the investment advisor to review reports about fund operations. The fund’s officers do not receive compensation from the fund.
4. Investment Transactions
Purchases and sales of investment securities, excluding short-term investments, for the period March 19, 2015 (fund inception) through November 30, 2015 were $1,246,733,010 and $412,599,105, respectively.
17
5. Capital Share Transactions
Transactions in shares of the fund were as follows:
Period ended November 30, 2015(1) | |||||
| Shares | Amount | ||||
| Investor Class/Shares Authorized | 200,000,000 | ||||
| Sold | 22,561,269 | $ | 225,871,525 | ||
| Redeemed | (1,535,204 | ) | (14,572,591 | ) | |
| 21,026,065 | 211,298,934 | ||||
| Institutional Class/Shares Authorized | 420,000,000 | ||||
| Sold | 62,418,999 | 619,721,716 | |||
| Redeemed | (3,558,419 | ) | (35,213,173 | ) | |
| 58,860,580 | 584,508,543 | ||||
| R6 Class/Shares Authorized | 40,000,000 | ||||
| Sold | 4,132,581 | 40,891,450 | |||
| Redeemed | (535,248 | ) | (5,127,957 | ) | |
| 3,597,333 | 35,763,493 | ||||
| Net increase (decrease) | 83,483,978 | $ | 831,570,970 | ||
| (1) | March 19, 2015 (fund inception) through November 30, 2015. |
6. Fair Value Measurements
The fund’s investments valuation process is based on several considerations and may use multiple inputs to determine the fair value of the investments held by the fund. In conformity with accounting principles generally accepted in the United States of America, the inputs used to determine a valuation are classified into three broad levels.
| • | Level 1 valuation inputs consist of unadjusted quoted prices in an active market for identical investments. |
| • | Level 2 valuation inputs consist of direct or indirect observable market data (including quoted prices for comparable investments, evaluations of subsequent market events, interest rates, prepayment speeds, credit risk, etc.). These inputs also consist of quoted prices for identical investments initially expressed in local currencies that are adjusted through translation into U.S. dollars. |
| • | Level 3 valuation inputs consist of unobservable data (including a fund’s own assumptions). |
The level classification is based on the lowest level input that is significant to the fair valuation measurement. The valuation inputs are not necessarily an indication of the risks associated with investing in these securities or other financial instruments. There were no significant transfers between levels during the period.
The following is a summary of the level classifications as of period end. The Schedule of Investments provides additional information on the fund’s portfolio holdings.
| Level 1 | Level 2 | Level 3 | ||||||
| Assets | ||||||||
| Investment Securities | ||||||||
| Common Stocks | — | $ | 750,135,349 | — | ||||
| Exchange-Traded Funds | $ | 3,774,613 | — | — | ||||
| Temporary Cash Investments | 1,930,000 | 13,125,156 | — | |||||
| $ | 5,704,613 | $ | 763,260,505 | — | ||||
18
7. Risk Factors
There are certain risks involved in investing in foreign securities. These risks include those resulting from future adverse political, social and economic developments, fluctuations in currency exchange rates, the possible imposition of exchange controls, and other foreign laws or restrictions. Investing in emerging markets may accentuate these risks.
8. Federal Tax Information
On December 22, 2015, the fund declared and paid the following per-share distributions from net investment income to shareholders of record on December 21, 2015:
| Investor Class | Institutional Class | R6 Class |
| $0.1950 | $0.2090 | $0.2195 |
The book-basis character of distributions made during the year from net investment income or net realized gains may differ from their ultimate characterization for federal income tax purposes. These differences reflect the differing character of certain income items and net realized gains and losses for financial statement and tax purposes, and may result in reclassification among certain capital accounts on the financial statements. There were no distributions paid by the fund during the period March 19, 2015 (fund inception) through November 30, 2015.
As of November 30, 2015, the federal tax cost of investments and the components of distributable earnings on a tax-basis were as follows:
| Federal tax cost of investments | $ | 812,300,845 | |
| Gross tax appreciation of investments | $ | 16,477,061 | |
| Gross tax depreciation of investments | (59,812,788 | ) | |
| Net tax appreciation (depreciation) of investments | (43,335,727 | ) | |
| Net tax appreciation (depreciation) on translation of assets and liabilities in foreign currencies | (65,944 | ) | |
| Net tax appreciation (depreciation) | $ | (43,401,671 | ) |
| Undistributed ordinary income | $ | 16,820,816 | |
| Accumulated short-term capital losses | $ | (33,133,202 | ) |
The difference between book-basis and tax-basis unrealized appreciation (depreciation) is attributable primarily to the tax deferral of losses on wash sales.
Accumulated capital losses represent net capital loss carryovers that may be used to offset future realized capital gains for federal income tax purposes. The capital loss carryovers may be carried forward for an unlimited period. Future capital loss carryover utilization in any given year may be subject to Internal Revenue Code limitations.
19
| Financial Highlights |
| For a Share Outstanding Throughout the Period Indicated | ||||||||||||
| Per-Share Data | Ratios and Supplemental Data | |||||||||||
| Income From Investment Operations: | Ratio to Average Net Assets of: | |||||||||||
| Net Asset Value, Beginning of Period | Net Investment Income (Loss)(1) | Net Realized and Unrealized Gain (Loss) | Total From Investment Operations | Net Asset Value, End of Period | Total Return(2) | Operating Expenses | Net Investment Income (Loss) | Portfolio Turnover Rate | Net Assets, End of Period (in thousands) | |||
| Investor Class | ||||||||||||
2015(3) | $10.00 | 0.20 | (0.96) | (0.76) | $9.24 | (7.60)% | 1.30%(4) | 2.95%(4) | 55% | $194,181 | ||
| Institutional Class | ||||||||||||
2015(3) | $10.00 | 0.21 | (0.96) | (0.75) | $9.25 | (7.50)% | 1.10%(4) | 3.15%(4) | 55% | $544,369 | ||
| R6 Class | ||||||||||||
2015(3) | $10.00 | 0.22 | (0.96) | (0.74) | $9.26 | (7.40)% | 0.95%(4) | 3.30%(4) | 55% | $33,307 | ||
| Notes to Financial Highlights |
| (1) | Computed using average shares outstanding throughout the period. |
| (2) | Total returns are calculated based on the net asset value of the last business day. Total returns for periods less than one year are not annualized. |
| (3) | March 19, 2015 (fund inception) through November 30, 2015. |
| (4) | Annualized. |
See Notes to Financial Statements.
20
| Report of Independent Registered Public Accounting Firm |
To the Board of Directors and Shareholders of American Century World Mutual Funds, Inc.:
We have audited the accompanying statement of assets and liabilities, including the schedule of investments, of NT International Value Fund (the “Fund”), one of the funds constituting American Century World Mutual Funds, Inc., as of November 30, 2015, and the related statements of operations, changes in net assets, and the financial highlights for the period from March 19, 2015 (commencement date) through November 30, 2015. These financial statements and financial highlights are the responsibility of the Fund’s management. Our responsibility is to express an opinion on these financial statements and financial highlights based on our audit.
We conducted our audit in accordance with the standards of the Public Company Accounting Oversight Board (United States). Those standards require that we plan and perform the audit to obtain reasonable assurance about whether the financial statements and financial highlights are free of material misstatement. The Fund is not required to have, nor were we engaged to perform, an audit of its internal control over financial reporting. Our audit included consideration of internal control over financial reporting as a basis for designing audit procedures that are appropriate in the circumstances, but not for the purpose of expressing an opinion on the effectiveness of the Fund’s internal control over financial reporting. Accordingly, we express no such opinion. An audit also includes examining, on a test basis, evidence supporting the amounts and disclosures in the financial statements, assessing the accounting principles used and significant estimates made by management, as well as evaluating the overall financial statement presentation. Our procedures included confirmation of securities owned as of November 30, 2015, by correspondence with the custodian and brokers; when replies were not received from brokers, we performed other auditing procedures. We believe that our audit provides a reasonable basis for our opinion.
In our opinion, the financial statements and financial highlights referred to above present fairly, in all material respects, the financial position of NT International Value Fund of American Century World Mutual Funds, Inc. as of November 30, 2015, and the results of its operations, the changes in its net assets, and the financial highlights for the period from March 19, 2015 (commencement date) through November 30, 2015, in conformity with accounting principles generally accepted in the United States of America.
DELOITTE & TOUCHE LLP
Kansas City, Missouri
January 19, 2016
21
| Management |
The Board of Directors
The individuals listed below serve as directors of the funds. Each director will continue to serve in this capacity until death, retirement, resignation or removal from office. The board has adopted a mandatory retirement age for directors who are not “interested persons,” as that term is defined in the Investment Company Act (independent directors). Independent directors shall retire by December 31 of the year in which they reach their 75th birthday.
Mr. Thomas is an “interested person” because he currently serves as President and Chief Executive Officer of American Century Companies, Inc. (ACC), the parent company of American Century Investment Management, Inc. (ACIM or the advisor). Mr. Fink is treated as an “interested person” because of his recent employment with ACC and American Century Services, LLC (ACS). The other directors (more than three-fourths of the total number) are independent. They are not employees, directors or officers of, and have no financial interest in, ACC or any of its wholly owned, direct or indirect, subsidiaries, including ACIM, American Century Investment Services, Inc. (ACIS) and ACS, and they do not have any other affiliations, positions or relationships that would cause them to be considered “interested persons” under the Investment Company Act. The directors serve in this capacity for seven (in the case of Mr. Thomas, 15) registered investment companies in the American Century Investments family of funds.
The following table presents additional information about the directors. The mailing address for each director is 4500 Main Street, Kansas City, Missouri 64111.
Name (Year of Birth) | Position(s) Held with Funds | Length of Time Served | Principal Occupation(s) During Past 5 Years | Number of American Century Portfolios Overseen by Director | Other Directorships Held During Past 5 Years |
| Independent Directors | |||||
Thomas A. Brown(1) (1940) | Director | Since 1980 | Managing Member, Associated Investments, LLC (real estate investment company) | 80 | None |
| Andrea C. Hall (1945) | Director | Since 1997 | Retired | 80 | None |
| Jan M. Lewis (1957) | Director | Since 2011 | Retired; President and Chief Executive Officer, Catholic Charities of Northeast Kansas (human services organization) (2006 to 2013) | 80 | None |
| James A. Olson (1942) | Director and Chairman of the Board | Since 2007 (Chairman since 2014) | Member, Plaza Belmont LLC (private equity fund manager) | 80 | Saia, Inc. (2002 to 2012) and EPR Properties (2003 to 2013) |
| M. Jeannine Strandjord (1945) | Director | Since 1994 | Retired | 80 | Euronet Worldwide Inc.; MGP Ingredients, Inc.; Charming Shoppes, Inc. (2006 to 2010); and DST Systems Inc. (1996 to 2012) |
| John R. Whitten (1946) | Director | Since 2008 | Retired | 80 | Rudolph Technologies, Inc. |
22
| Name (Year of Birth) | Position(s) Held with Funds | Length of Time Served | Principal Occupation(s) During Past 5 Years | Number of American Century Portfolios Overseen by Director | Other Directorships Held During Past 5 Years |
| Independent Directors | |||||
| Stephen E. Yates (1948) | Director | Since 2012 | Retired; Executive Vice President, Technology & Operations, KeyCorp. (computer services) (2004 to 2010) | 80 | Applied Industrial Technologies, Inc. (2001 to 2010) |
| Interested Directors | |||||
| Barry Fink (1955) | Director | Since 2012 | Retired; Executive Vice President, ACC (September 2007 to February 2013); President, ACS (October 2007 to February 2013); Chief Operating Officer, ACC (September 2007 to November 2012) | 80 | None |
| Jonathan S. Thomas (1963) | Director and President | Since 2007 | President and Chief Executive Officer, ACC (March 2007 to present). Also serves as Chief Executive Officer, ACS; Executive Vice President, ACIM; Director, ACC, ACIM and other ACC subsidiaries | 125 | BioMed Valley Discoveries, Inc. |
(1) Thomas A. Brown retired as Director of the Board effective December 31, 2015.
The Statement of Additional Information has additional information about the fund's directors and is available without charge, upon request, by calling 1-800-345-2021.
23
Officers
The following table presents certain information about the executive officers of the funds. Each officer serves as an officer for each of the 15 investment companies in the American Century family of funds, unless otherwise noted. No officer is compensated for his or her service as an officer of the funds. The listed officers are interested persons of the funds and are appointed or re-appointed on an annual basis. The mailing address for each officer listed below is 4500 Main Street, Kansas City, Missouri 64111.
Name (Year of Birth) | Offices with the Funds | Principal Occupation(s) During the Past Five Years |
| Jonathan S. Thomas (1963) | Director and President since 2007 | President and Chief Executive Officer, ACC (March 2007 to present). Also serves as Chief Executive Officer, ACS; Executive Vice President, ACIM; Director, ACC, ACIM and other ACC subsidiaries |
| Amy D. Shelton (1964) | Chief Compliance Officer and Vice President since 2014 | Chief Compliance Officer, American Century funds, (March 2014 to present); Chief Compliance Officer, ACIM (February 2014 to present); Chief Compliance Officer, ACIS (October 2009 to present); Vice President, Client Interactions and Marketing, ACIS (February 2013 to January 2014); Director, Client Interactions and Marketing, ACIS (June 2007 to January 2013). Also serves as Vice President, ACIS |
| Charles A. Etherington (1957) | General Counsel since 2007 and Senior Vice President since 2006 | Attorney, ACC (February 1994 to present); Vice President, ACC (November 2005 to present); General Counsel, ACC (March 2007 to present). Also serves as General Counsel, ACIM, ACS, ACIS and other ACC subsidiaries; and Senior Vice President, ACIM and ACS |
| C. Jean Wade (1964) | Vice President, Treasurer and Chief Financial Officer since 2012 | Vice President, ACS (February 2000 to present) |
| Robert J. Leach (1966) | Vice President since 2006 and Assistant Treasurer since 2012 | Vice President, ACS (February 2000 to present) |
| David H. Reinmiller (1963) | Vice President since 2000 | Attorney, ACC (January 1994 to present); Associate General Counsel, ACC (January 2001 to present). Also serves as Vice President, ACIM and ACS |
| Ward D. Stauffer (1960) | Secretary since 2005 | Attorney, ACC (June 2003 to present) |
24
| Additional Information |
Retirement Account Information
As required by law, distributions you receive from certain IRAs are subject to federal income tax withholding, unless you elect not to have withholding apply. Tax will be withheld on the total amount withdrawn even though you may be receiving amounts that are not subject to withholding, such as nondeductible contributions. In such case, excess amounts of withholding could occur. You may adjust your withholding election so that a greater or lesser amount will be withheld.
If you don’t want us to withhold on this amount, you must notify us to not withhold the federal income tax. You may notify us in writing or in certain situations by telephone or through other electronic means. For systematic withdrawals, your withholding election will remain in effect until revoked or changed by filing a new election. You have the right to revoke your election at any time.
Remember, even if you elect not to have income tax withheld, you are liable for paying income tax on the taxable portion of your withdrawal. If you elect not to have income tax withheld or you don’t have enough income tax withheld, you may be responsible for payment of estimated tax. You may incur penalties under the estimated tax rules if your withholding and estimated tax payments are not sufficient. You can reduce or defer the income tax on a distribution by directly or indirectly rolling such distribution over to another IRA or eligible plan. You should consult your tax advisor for additional information.
State tax will be withheld if, at the time of your distribution, your address is within one of the mandatory withholding states and you have federal income tax withheld (or as otherwise required by state law). State taxes will be withheld from your distribution in accordance with the respective state rules.
Distributions you receive from 403(b), 457 and qualified plans are subject to special tax and withholding rules. Your plan administrator or plan sponsor is required to provide you with a special tax notice explaining those rules at the time you request a distribution. If applicable, federal and/or state taxes may be withheld from your distribution amount.
Proxy Voting Policies
A description of the policies that the fund's investment advisor uses in exercising the voting rights associated with the securities purchased and/or held by the fund is available without charge, upon request, by calling 1-800-345-2021. It is also available on the "About Us" page of American Century Investments’ website at americancentury.com and on the Securities and Exchange Commission’s website at sec.gov. Information regarding how the investment advisor voted proxies relating to portfolio securities during the most recent 12-month period ended June 30 is available on the "About Us" page at americancentury.com. It is also available at sec.gov.
Quarterly Portfolio Disclosure
The fund files its complete schedule of portfolio holdings with the Securities and Exchange Commission (SEC) for the first and third quarters of each fiscal year on Form N-Q. The fund’s Forms N-Q are available on the SEC’s website at sec.gov, and may be reviewed and copied at the SEC’s Public Reference Room in Washington, DC. Information on the operation of the Public Reference Room may be obtained by calling 1-800-SEC-0330. The fund also makes its complete schedule of portfolio holdings for the most recent quarter of its fiscal year available on its
website at americancentury.com and, upon request, by calling 1-800-345-2021.
25
Other Tax Information
The following information is provided pursuant to provisions of the Internal Revenue Code.
For the fiscal year ended November 30, 2015, the fund intends to pass through to shareholders foreign source income of $24,803,382 and foreign taxes paid of $1,855,174, or up to the maximum amount allowable, as a foreign tax credit. Foreign source income and foreign tax expense per outstanding shares on November 30, 2015 are $0.2971 and $0.0222, respectively.
26
| Notes |
27
| Notes |
28
| ||
| Contact Us | americancentury.com | |
| Automated Information Line | 1-800-345-8765 | |
| Investor Services Representative | 1-800-345-2021 or 816-531-5575 | |
| Investors Using Advisors | 1-800-378-9878 | |
| Business, Not-For-Profit, Employer-Sponsored Retirement Plans | 1-800-345-3533 | |
| Banks and Trust Companies, Broker-Dealers, Financial Professionals, Insurance Companies | 1-800-345-6488 | |
| Telecommunications Relay Service for the Deaf | 711 | |
| American Century World Mutual Funds, Inc. | ||
Investment Advisor: American Century Investment Management, Inc. Kansas City, Missouri | ||
| This report and the statements it contains are submitted for the general information of our shareholders. The report is not authorized for distribution to prospective investors unless preceded or accompanied by an effective prospectus. | ||
| ©2016 American Century Proprietary Holdings, Inc. All rights reserved. CL-ANN-87749 1601 | ||
ITEM 2. CODE OF ETHICS.
| (a) | The registrant has adopted a Code of Ethics for Senior Financial Officers that applies to the registrant’s principal executive officer, principal financial officer, principal accounting officer, and persons performing similar functions. |
| (b) | No response required. |
| (c) | None. |
| (d) | None. |
| (e) | Not applicable. |
| (f) | The registrant’s Code of Ethics for Senior Financial Officers was filed as Exhibit 12 (a)(1) to American Century Asset Allocation Portfolios, Inc.’s Annual Certified Shareholder Report on Form N-CSR, File No. 811-21591, on September 29, 2005, and is incorporated herein by reference. |
ITEM 3. AUDIT COMMITTEE FINANCIAL EXPERT.
| (a)(1) | The registrant’s board has determined that the registrant has at least one audit committee financial expert serving on its audit committee. |
| (a)(2) | M. Jeannine Strandjord, Stephen E. Yates and John R. Whitten are the registrant’s designated audit committee financial experts. They are “independent” as defined in Item 3 of Form N-CSR. |
| (a)(3) | Not applicable. |
| (b) | No response required. |
| (c) | No response required. |
| (d) | No response required. |
ITEM 4. PRINCIPAL ACCOUNTANT FEES AND SERVICES.
| (a) | Audit Fees. |
The aggregate fees billed for each of the last two fiscal years for professional services rendered by the principal accountant for the audit of the registrant’s annual financial statements or services that are normally provided by the accountant in connection with statutory and regulatory filings or engagements for those fiscal years were as follows:
FY 2014: $208,287
FY 2015: $245,006
| (b) | Audit-Related Fees. |
The aggregate fees billed in each of the last two fiscal years for assurance and related services by the principal accountant that are reasonably related to the performance of the audit of the registrant’s financial statements and are not reported under paragraph (a) of this Item were as follows:
For services rendered to the registrant:
FY 2014: $0
FY 2015: $0
Fees required to be approved pursuant to paragraph (c)(7)(ii) of Rule 2-01 of Regulation S-X (relating to certain engagements for non-audit services with the registrant’s investment adviser and its affiliates):
FY 2014: $0
FY 2015: $0
| (c) | Tax Fees. |
The aggregate fees billed in each of the last two fiscal years for professional services rendered by the principal accountant for tax compliance, tax advice, and tax planning were as follows:
For services rendered to the registrant:
FY 2014: $0
FY 2015: $0
Fees required to be approved pursuant to paragraph (c)(7)(ii) of Rule 2-01 of Regulation S-X (relating to certain engagements for non-audit services with the registrant’s investment adviser and its affiliates):
FY 2014: $0
FY 2015: $0
| (d) | All Other Fees. |
The aggregate fees billed in each of the last two fiscal years for products and services provided by the principal accountant, other than the services reported in paragraphs (a) through (c) of this Item were as follows:
For services rendered to the registrant:
FY 2014: $0
FY 2015: $0
Fees required to be approved pursuant to paragraph (c)(7)(ii) of Rule 2-01 of Regulation S-X (relating to certain engagements for non-audit services with the registrant’s investment adviser and its affiliates):
FY 2014: $0
FY 2015: $0
| (e)(1) | In accordance with paragraph (c)(7)(i)(A) of Rule 2-01 of Regulation S-X, before the accountant is engaged by the registrant to render audit or non-audit services, the engagement is approved by the registrant’s audit committee. Pursuant to paragraph (c)(7)(ii) of Rule 2-01 of Regulation S-X, the registrant’s audit committee also pre-approves its accountant’s engagements for non-audit services with the registrant’s investment adviser, its parent company, and any entity controlled by, or under common control with the investment adviser that provides ongoing services to the registrant, if the engagement relates directly to the operations and financial reporting of the registrant. |
| (e)(2) | All services described in each of paragraphs (b) through (d) of this Item were pre-approved before the engagement by the registrant’s audit committee pursuant to paragraph (c)(7)(i)(A) of Rule 2-01 of Regulation S-X. Consequently, none of such services were required to be approved by the audit committee pursuant to paragraph (c)(7)(i)(C). |
| (f) | The percentage of hours expended on the principal accountant’s engagement to audit the registrant’s financial statements for the most recent fiscal year that were attributed to work performed by persons other than the principal accountant’s full-time, permanent employees was less than 50%. |
| (g) | The aggregate non-audit fees billed by the registrant’s accountant for services rendered to the registrant, and rendered to the registrant’s investment adviser (not including any sub-adviser whose role is primarily portfolio management and is subcontracted with or overseen by another investment adviser), and any entity controlling, controlled by, or under common control with the adviser that provides ongoing services to the registrant for each of the last two fiscal years of the registrant were as follows: |
FY 2014: $91,808
FY 2015: $86,000
| (h) | The registrant’s investment adviser and accountant have notified the registrant’s audit committee of all non-audit services that were rendered by the registrant’s accountant to the registrant’s investment adviser, its parent company, and any entity controlled by, or under common control with the investment adviser that provides services to the registrant, which services were not required to be pre-approved pursuant to paragraph (c)(7)(ii) of Rule 2-01 of Regulation S-X. The notification provided to the registrant’s audit committee included sufficient details regarding such services to allow the registrant’s audit committee to consider the continuing independence of its principal accountant. |
ITEM 5. AUDIT COMMITTEE OF LISTED REGISTRANTS.
Not applicable.
ITEM 6. INVESTMENTS.
| (a) | The schedule of investments is included as part of the report to stockholders filed under Item 1 of this Form. |
| (b) | Not applicable. |
ITEM 7. DISCLOSURE OF PROXY VOTING POLICIES AND PROCEDURES FOR CLOSED-END MANAGEMENT INVESTMENT COMPANIES.
Not applicable.
ITEM 8. PORTFOLIO MANAGERS OF CLOSED-END MANAGEMENT INVESTMENT COMPANIES.
Not applicable.
ITEM 9. PURCHASES OF EQUITY SECURITIES BY CLOSED-END MANAGEMENT INVESTMENT COMPANY AND AFFILIATED PURCHASERS.
Not applicable.
ITEM 10. SUBMISSION OF MATTERS TO A VOTE OF SECURITY HOLDERS.
During the reporting period, there were no material changes to the procedures by which shareholders may recommend nominees to the registrant’s board.
ITEM 11. CONTROLS AND PROCEDURES.
| (a) | The registrant's principal executive officer and principal financial officer have concluded that the registrant's disclosure controls and procedures (as defined in Rule 30a-3(c) under the Investment Company Act of 1940) are effective based on their evaluation of these controls and procedures as of a date within 90 days of the filing date of this report. |
| (b) | There were no changes in the registrant's internal control over financial reporting (as defined in Rule 30a-3(d) under the Investment Company Act of 1940) that occurred during the registrant's second fiscal quarter of the period covered by this report that have materially affected, or are reasonably likely to materially affect, the registrant's internal control over financial reporting. |
ITEM 12. EXHIBITS.
| (a)(1) | Registrant’s Code of Ethics for Senior Financial Officers, which is the subject of the disclosure required by Item 2 of Form N-CSR, was filed as Exhibit 12(a)(1) to American Century Asset Allocation Portfolios, Inc.’s Certified Shareholder Report on Form N-CSR, File No. 811-21591, on September 29, 2005. |
| (a)(2) | Separate certifications by the registrant’s principal executive officer and principal financial officer, pursuant to Section 302 of the Sarbanes-Oxley Act of 2002 and Rule 30a-2(a) under the Investment Company Act of 1940, are filed and attached hereto as EX-99.CERT. |
| (a)(3) | Not applicable. |
| (b) | A certification by the registrant’s chief executive officer and chief financial officer, pursuant to Section 906 of the Sarbanes-Oxley Act of 2002, is furnished and attached hereto as EX-99.906CERT. |
SIGNATURES
Pursuant to the requirements of the Securities Exchange Act of 1934 and the Investment Company Act of 1940, the registrant has duly caused this report to be signed on its behalf by the undersigned, thereunto duly authorized.
| Registrant: | American Century World Mutual Funds, Inc. | |||
| By: | /s/ Jonathan S. Thomas | |||
| Name: | Jonathan S. Thomas | |||
| Title: | President | |||
| Date: | January 28, 2016 | |||
Pursuant to the requirements of the Securities Exchange Act of 1934 and the Investment Company Act of 1940, this report has been signed below by the following persons on behalf of the registrant and in the capacities and on the dates indicated.
| By: | /s/ Jonathan S. Thomas | ||
| Name: | Jonathan S. Thomas | ||
| Title: | President | ||
| (principal executive officer) | |||
| Date: | January 28, 2016 | ||
| By: | /s/ C. Jean Wade | ||
| Name: | C. Jean Wade | ||
| Title: | Vice President, Treasurer, and | ||
| Chief Financial Officer | |||
| (principal financial officer) | |||
| Date: | January 28, 2016 | ||