UNITED STATES
SECURITIES AND EXCHANGE COMMISSION
Washington, D.C. 20549
FORM N-CSR
CERTIFIED SHAREHOLDER REPORT OF REGISTERED
MANAGEMENT INVESTMENT COMPANIES
Investment Company Act file number | 811-06247 | |||||
AMERICAN CENTURY WORLD MUTUAL FUNDS, INC. | ||||||
(Exact name of registrant as specified in charter) | ||||||
4500 MAIN STREET, KANSAS CITY, MISSOURI | 64111 | |||||
(Address of principal executive offices) | (Zip Code) | |||||
CHARLES A. ETHERINGTON 4500 MAIN STREET, KANSAS CITY, MISSOURI 64111 | ||||||
(Name and address of agent for service) | ||||||
Registrant’s telephone number, including area code: | 816-531-5575 | |||||
Date of fiscal year end: | 11-30 | |||||
Date of reporting period: | 11-30-2013 | |||||
ITEM 1. REPORTS TO STOCKHOLDERS.
ANNUAL REPORT | NOVEMBER 30, 2013 |


Emerging Markets Fund
Table of Contents |
President’s Letter | 2 |
Market Perspective | 3 |
Performance | 4 |
Portfolio Commentary | 6 |
Fund Characteristics | 8 |
Shareholder Fee Example | 9 |
Schedule of Investments | 11 |
Statement of Assets and Liabilities | 14 |
Statement of Operations | 15 |
Statement of Changes in Net Assets | 16 |
Notes to Financial Statements | 17 |
Financial Highlights | 23 |
Report of Independent Registered Public Accounting Firm | 26 |
Management | 27 |
Approval of Management Agreement | 30 |
Additional Information | 35 |
Any opinions expressed in this report reflect those of the author as of the date of the report, and do not necessarily represent the opinions of American Century Investments® or any other person in the American Century Investments organization. Any such opinions are subject to change at any time based upon market or other conditions and American Century Investments disclaims any responsibility to update such opinions. These opinions may not be relied upon as investment advice and, because investment decisions made by American Century Investments funds are based on numerous factors, may not be relied upon as an indication of trading intent on behalf of any American Century Investments fund. Security examples are used for representational purposes only and are not intended as recommendations to purchase or sell securities. Performance information for comparative indices and securities is provided to American Century Investments by third party vendors. To the best of American Century Investments’ knowledge, such information is accurate at the time of printing.
President’s Letter |

Jonathan Thomas
Dear Investor:
Thank you for reviewing this annual report for the 12 months ended November 30, 2013. It provides investment performance, market analysis, and portfolio information, presented with the expert perspective of our portfolio management team.
Annual reports remain important vehicles for conveying information about fund returns, including key factors that affected fund performance. For additional, updated investment and market insights, we encourage you to visit our website, americancentury.com.
Monetary Policy-Driven, “Risk-On” Results in Developed Countries
Stimulative monetary policies by central banks and slowly improving global economic conditions played a major part in financial market returns during the reporting period. The combination of an improving global economic outlook, mostly low costs of capital in the money markets, and central bank purchases of longer-maturity fixed income securities (a market liquidity-building strategy known as quantitative easing, QE) helped persuade investors to seek risk and yield, particularly in developed markets such as the U.S., Japan, and Europe. Broad stock index returns were stellar in these markets, particularly at the smaller capitalization end of the company size spectrum. Representing the broad markets, the S&P 500 and MSCI EAFE Indices returned 30.30% and 24.84%, respectively, for the reporting period, and their smaller capitalization counterparts performed even better.
At the same time, hints that QE might be tapered soon in the U.S. hampered government bond returns and emerging market stock indices. Broad emerging market stock indices posted positive single-digit returns, but government bond total returns dipped into negative territory, despite low inflation. Corporate bonds, especially high-yield corporates, generally performed better than government bonds because of their higher yields, declining spreads (yield differences between corporate and similar-maturity Treasury securities), and relatively low default rates, compared with historical averages.
As we enter 2014, there’s less uncertainty about the U.S. fiscal picture and global economic strength than a year ago, but headwinds continue. A full economic recovery from 2008 remains elusive—economic growth is still subpar compared with past recoveries. In this environment, we continue to believe in a disciplined, diversified, long-term investment approach, using professionally managed stock and bond portfolios—as appropriate—for meeting financial goals. We appreciate your continued trust in us.
Sincerely,

Jonathan Thomas
President and Chief Executive Officer
American Century Investments
Market Perspective |

By Mark Kopinski, Chief Investment Officer, Global and Non-U.S. Equity
Global Stocks Rallied to Post Double-Digit Gains
Stock market performance remained robust during the 12-month period ended November 30, 2013, with most major market indices posting double-digit gains. Despite persistent concerns about weak global growth and a slowdown in China, investors largely focused on central bank stimulus measures, marginally improving U.S. and European economic data, and relatively healthy corporate earnings, which fueled stock market optimism.
Prior to the reporting period, the U.S. Federal Reserve (the Fed) announced its third quantitative easing program (QE3). This effort, combined with similar large-scale stimulus measures from the European Central Bank (ECB) and the Bank of Japan as well as favorable corporate earnings reports, generally helped keep stocks in favor. Additionally, housing market gains in the U.S., U.K., and Australia aided the global investment landscape.
Europe, Japan were Performance Leaders
Assurances by the ECB that it would keep interest rates at historic lows for an extended period, followed by the cutting of its key lending rate to 0.25% late in the period, helped drive stock market gains in Europe. In addition, economic conditions throughout Europe improved, led by an expanding manufacturing sector, improving business and consumer sentiment, and a slowdown of the economic contraction in the peripheral countries. In the second calendar quarter of 2013, the 17-member eurozone emerged from its longest-ever recession (six consecutive quarters). Investors generally focused on these positive factors, pushing stocks higher despite the structural issues and high unemployment still plaguing the region.
In Japan, the central bank’s efforts to pull the nation out of its decades-long deflationary spiral and spark economic growth appeared to be working. Japan’s economy grew, and consumer prices increased. Late in the period, government officials announced the country’s inflation rate rose at a five-year high, suggesting their deflation-focused initiatives were gaining traction.
Overall, developed market stocks sharply outperformed their emerging market counterparts. Much of the lagging performance was due to a slower-growth environment in China. In addition, rising inflation and currency weakness weighed on many developing nations.
International Equity Total Returns | ||||
For the 12 months ended November 30, 2013 (in U.S. dollars) | ||||
MSCI EAFE Index | 24.84% | MSCI Europe Index | 25.94% | |
MSCI EAFE Growth Index | 23.45% | MSCI World Index | 26.38% | |
MSCI EAFE Value Index | 26.20% | MSCI Japan Index | 32.84% | |
MSCI Emerging Markets Index | 3.66% | |||
Performance |
Total Returns as of November 30, 2013 | ||||||
Average Annual Returns | ||||||
Ticker Symbol | 1 year | 5 years | 10 years | Since Inception | Inception Date | |
Investor Class | TWMIX | 6.48%(1) | 16.47% | 10.66% | 7.06% | 9/30/97 |
MSCI Emerging | — | 5.51% | 17.67% | 11.07% | N/A(2) | — |
MSCI Emerging | — | 3.66% | 16.86% | 12.10% | N/A(2) | — |
Institutional Class | AMKIX | 6.77%(1) | 16.73% | 10.88% | 10.79% | 1/28/99 |
A Class(4) No sales charge* With sales charge* | AEMMX
| 6.30%(1) 0.23%(1) | 16.24%(1) 14.86%(1) | 10.40% 9.74% | 8.50% 8.06% | 5/12/99
|
C Class | ACECX | 5.48%(1) | 15.35% | 9.57% | 9.79% | 12/18/01 |
R Class | AEMRX | 5.95%(1) | 15.94% | — | -3.34% | 9/28/07 |
R6 Class | AEDMX | — | — | — | 7.45%(1)(5) | 7/26/13 |
* | Sales charges include initial sales charges and contingent deferred sales charges (CDSCs), as applicable. A Class shares have a 5.75% maximum initial sales charge and may be subject to a maximum CDSC of 1.00%. C Class shares redeemed within 12 months of purchase are subject to a maximum CDSC of 1.00%. The SEC requires that mutual funds provide performance information net of maximum sales charges in all cases where charges could be applied. |
(1) | Returns would have been lower if a portion of the management fee had not been waived. |
(2) | Benchmark data first available January 2001. |
(3) | Effective January 2014, the fund’s benchmark changed from the MSCI Emerging Markets Growth Index to the MSCI Emerging Markets Index in order to simplify performance comparisons. The fund’s investment process did not change. |
(4) | Prior to September 4, 2007, the A Class was referred to as the Advisor Class and did not have a front-end sales charge. Performance prior to that date has been adjusted to reflect this charge. |
(5) | Total returns for periods less than one year are not annualized. |
Data presented reflect past performance. Past performance is no guarantee of future results. Current performance may be higher or lower than the performance shown. Investment return and principal value will fluctuate, and redemption value may be more or less than original cost. To obtain performance data current to the most recent month end, please call 1-800-345-2021 or visit americancentury.com. International investing involves special risks, such as political instability and currency fluctuations. Investing in emerging markets may accentuate these risks.
Unless otherwise indicated, performance reflects Investor Class shares; performance for other share classes will vary due to differences in fee structure. For information about other share classes available, please consult the prospectus. Data assumes reinvestment of dividends and capital gains, and none of the charts reflect the deduction of taxes that a shareholder would pay on fund distributions or the redemption of fund shares. Returns for the indices are provided for comparison. The fund’s total returns include operating expenses (such as transaction costs and management fees) that reduce returns, while the total returns of the indices do not.
Growth of $10,000 Over 10 Years |
$10,000 investment made November 30, 2003 |
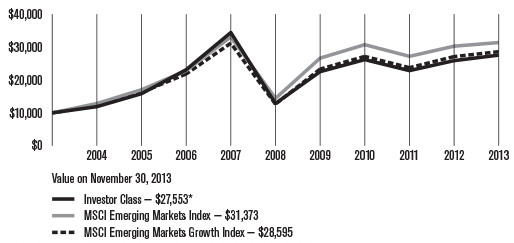
* | Ending value would have been lower if a portion of the management fee had not been waived. |
Total Annual Fund Operating Expenses | |||||
Investor Class | Institutional Class | A Class | C Class | R Class | R6 Class |
1.75% | 1.55% | 2.00% | 2.75% | 2.25% | 1.40% |
The total annual fund operating expenses shown is as stated in the fund’s prospectus current as of the date of this report. The prospectus may vary from the expense ratio shown elsewhere in this report because it is based on a different time period, includes acquired fund fees and expenses, and, if applicable, does not include fee waivers or expense reimbursements.
Data presented reflect past performance. Past performance is no guarantee of future results. Current performance may be higher or lower than the performance shown. Investment return and principal value will fluctuate, and redemption value may be more or less than original cost. To obtain performance data current to the most recent month end, please call 1-800-345-2021 or visit americancentury.com. International investing involves special risks, such as political instability and currency fluctuations. Investing in emerging markets may accentuate these risks.
Unless otherwise indicated, performance reflects Investor Class shares; performance for other share classes will vary due to differences in fee structure. For information about other share classes available, please consult the prospectus. Data assumes reinvestment of dividends and capital gains, and none of the charts reflect the deduction of taxes that a shareholder would pay on fund distributions or the redemption of fund shares. Returns for the indices are provided for comparison. The fund’s total returns include operating expenses (such as transaction costs and management fees) that reduce returns, while the total returns of the indices do not.
Portfolio Commentary |
Portfolio Managers: Patricia Ribeiro and Anthony Han
Performance Summary
Emerging Markets gained 6.48%* for the 12 months ended November 30, 2013, compared with its benchmark, the MSCI Emerging Markets Growth Index, which advanced 5.51%.
Emerging market growth stocks generally demonstrated modest performance during the 12-month period, as key countries, including China and Brazil, experienced slowdowns in their economic growth rates. In addition, commodities prices largely declined during the period, further pressuring many markets. Speculation about the timing and magnitude of the U.S. Federal Reserve’s tapering of quantitative easing dominated investor sentiment throughout the second half of the period and led to fears of higher interest rates. These concerns weighed heavily on many emerging market currencies. In the final months of the period, signs of stabilization in China, firming economic data in Europe, and improving growth in the U.S. aided emerging market economies and companies with exposure to global growth.
The portfolio outperformed its benchmark for the period, primarily due to stock selection in the consumer discretionary, health care, and utilities sectors.
Russian Retailer was a Top Contributor
In terms of the portfolio’s favorable regional exposure, Russia was a leading contributor for the 12-month period, driven by strong stock selection. Among the portfolio’s top individual contributors was an overweight position in Russia’s Magnit OJSC, a consumer goods retailer that operates convenience stores, hypermarkets, and cosmetics stores. The company has been aggressively growing its footprint while maintaining same-store sales growth and steadily improving its operating margins due to moderating costs and a better negotiating position with suppliers.
Within the top-contributing consumer discretionary sector, the textiles industry offered standout performance, led by an overweight position in Eclat Textile. The Taiwan-based company, which primarily manufactures and distributes fabrics and garments, reported growing profits stemming from order adjustments, improved capacity utilization, and a growing customer base. In addition, the company said its new apparel factories, scheduled to open in late 2013 and early 2014 in Cambodia and Vietnam, would further increase monthly capacity.
Stock selection in Hong Kong also contributed favorably to portfolio performance, with a portfolio-only position in industrial glass manufacturer Xinyi Glass Holdings among the leading performance contributors. The company’s stock benefited from order gains due to improving conditions in the construction and automobile industries, two of the company’s key markets.
* | All fund returns referenced in this commentary are for Investor Class shares. Returns would have been lower if a portion of the management fee had not been waived. |
Brazil-Based Bank was a Main Detractor
The financials sector was among the largest detractors to relative performance, primarily due to exposure in the commercial banking industry. In particular, an underweight position in Brazil’s Itau Unibanco Holding, a provider of diversified financial products and services, was the top individual detractor. The company reported much higher-than-expected third-quarter earnings stemming from its efforts to avoid riskier loans and streamline costs. These results drove Itau Unibanco’s share price higher, and the portfolio’s underweight position detracted from relative results.
Another prominent detractor included an overweight position in South Korea-based Hyundai Glovis, an integrated logistics and distribution company. The company’s stock price declined as expectations for increased logistics business did not materialize.
Exposure to the materials sector weighed on relative performance, primarily due to weak relative results in the metals and mining industry. An overweight position in Grupo Mexico, a Mexico-based copper mining company, was among the portfolio’s largest detractors. The company’s share price struggled in the face of falling copper prices throughout much of the period.
Outlook
Looking ahead, we believe emerging markets will generally remain challenged, as long as investors’ concerns about currency weakness and current account deficits linger. Nevertheless, we believe domestic fundamentals will remain strong in many emerging market countries. Additionally, we believe improving conditions in the U.S., Europe, and China will help export-related businesses headquartered in emerging markets. Against this expected backdrop, we are seeking more attractive opportunities in export-related companies that appear positioned to benefit from the broader global recovery.
Fund Characteristics |
NOVEMBER 30, 2013 | |
Top Ten Holdings | % of net assets |
Samsung Electronics Co. Ltd. | 7.1% |
Tencent Holdings Ltd. | 4.2% |
Taiwan Semiconductor Manufacturing Co. Ltd. | 4.0% |
Itau Unibanco Holding SA ADR | 2.8% |
Naspers Ltd. N Shares | 2.7% |
CNOOC Ltd. | 2.3% |
MediaTek, Inc. | 2.3% |
China Overseas Land & Investment Ltd. | 2.1% |
Sberbank of Russia | 1.9% |
Magnit OJSC GDR | 1.8% |
Types of Investments in Portfolio | % of net assets |
Foreign Common Stocks | 99.7% |
Temporary Cash Investments | 0.8% |
Other Assets and Liabilities | (0.5)% |
Investments by Country | % of net assets |
China | 21.6% |
South Korea | 14.9% |
Taiwan | 11.3% |
Russia | 8.5% |
Brazil | 8.1% |
South Africa | 6.1% |
Mexico | 5.6% |
India | 4.8% |
Thailand | 3.1% |
Turkey | 2.7% |
Malaysia | 2.2% |
Indonesia | 2.0% |
Other Countries | 8.8% |
Cash and Equivalents* | 0.3% |
* | Includes temporary cash investments and other assets and liabilities. |
Shareholder Fee Example |
Fund shareholders may incur two types of costs: (1) transaction costs, including sales charges (loads) on purchase payments and redemption/exchange fees; and (2) ongoing costs, including management fees; distribution and service (12b-1) fees; and other fund expenses. This example is intended to help you understand your ongoing costs (in dollars) of investing in your fund and to compare these costs with the ongoing cost of investing in other mutual funds.
The example is based on an investment of $1,000 made at the beginning of the period and held for the entire period from June 1, 2013 to November 30, 2013 (except as noted).
Actual Expenses
The table provides information about actual account values and actual expenses for each class. You may use the information, together with the amount you invested, to estimate the expenses that you paid over the period. First, identify the share class you own. Then simply divide your account value by $1,000 (for example, an $8,600 account value divided by $1,000 = 8.6), then multiply the result by the number under the heading “Expenses Paid During Period” to estimate the expenses you paid on your account during this period.
If you hold Investor Class shares of any American Century Investments fund, or Institutional Class shares of the American Century Diversified Bond Fund, in an American Century Investments account (i.e., not a financial intermediary or retirement plan account), American Century Investments may charge you a $12.50 semiannual account maintenance fee if the value of those shares is less than $10,000. We will redeem shares automatically in one of your accounts to pay the $12.50 fee. In determining your total eligible investment amount, we will include your investments in all personal accounts (including American Century Investments Brokerage accounts) registered under your Social Security number. Personal accounts include individual accounts, joint accounts, UGMA/UTMA accounts, personal trusts, Coverdell Education Savings Accounts and IRAs (including traditional, Roth, Rollover, SEP-, SARSEP- and SIMPLE-IRAs), and certain other retirement accounts. If you have only business, business retirement, employer-sponsored or American Century Investments Brokerage accounts, you are currently not subject to this fee. If you are subject to the Account Maintenance Fee, your account value could be reduced by the fee amount.
Hypothetical Example for Comparison Purposes
The table also provides information about hypothetical account values and hypothetical expenses based on the actual expense ratio of each class of your fund and an assumed rate of return of 5% per year before expenses, which is not the actual return of a fund’s share class. The hypothetical account values and expenses may not be used to estimate the actual ending account balance or expenses you paid for the period. You may use this information to compare the ongoing costs of investing in your fund and other funds. To do so, compare this 5% hypothetical example with the 5% hypothetical examples that appear in the shareholder reports of the other funds.
Please note that the expenses shown in the table are meant to highlight your ongoing costs only and do not reflect any transactional costs, such as sales charges (loads) or redemption/exchange fees. Therefore, the table is useful in comparing ongoing costs only, and will not help you determine the relative total costs of owning different funds. In addition, if these transactional costs were included, your costs would have been higher.
Beginning 6/1/13 | Ending 11/30/13 | Expenses Paid During Period(1) 6/1/13 – 11/30/13 | Annualized | ||
Actual | |||||
Investor Class (after waiver) | $1,000 | $1,017.20 | $7.84 | 1.55% | |
Investor Class (before waiver) | $1,000 | $1,017.20(2) | $8.70 | 1.72% | |
Institutional Class (after waiver) | $1,000 | $1,019.10 | $6.83 | 1.35% | |
Institutional Class (before waiver) | $1,000 | $1,019.10(2) | $7.69 | 1.52% | |
A Class (after waiver) | $1,000 | $1,016.60 | $9.10 | 1.80% | |
A Class (before waiver) | $1,000 | $1,016.60(2) | $9.96 | 1.97% | |
C Class (after waiver) | $1,000 | $1,012.50 | $12.86 | 2.55% | |
C Class (before waiver) | $1,000 | $1,012.50(2) | $13.72 | 2.72% | |
R Class (after waiver) | $1,000 | $1,015.10 | $10.36 | 2.05% | |
R Class (before waiver) | $1,000 | $1,015.10(2) | $11.21 | 2.22% | |
R6 Class (after waiver) | $1,000 | $1,074.50(3) | $4.07(4) | 1.12% | |
R6 Class (before waiver) | $1,000 | $1,074.50(2)(3) | $4.98(4) | 1.37% | |
Hypothetical | |||||
Investor Class (after waiver) | $1,000 | $1,017.30 | $7.84 | 1.55% | |
Investor Class (before waiver) | $1,000 | $1,016.45 | $8.69 | 1.72% | |
Institutional Class (after waiver) | $1,000 | $1,018.30 | $6.83 | 1.35% | |
Institutional Class (before waiver) | $1,000 | $1,017.45 | $7.69 | 1.52% | |
A Class (after waiver) | $1,000 | $1,016.04 | $9.10 | 1.80% | |
A Class (before waiver) | $1,000 | $1,015.19 | $9.95 | 1.97% | |
C Class (after waiver) | $1,000 | $1,012.28 | $12.86 | 2.55% | |
C Class (before waiver) | $1,000 | $1,011.43 | $13.72 | 2.72% | |
R Class (after waiver) | $1,000 | $1,014.79 | $10.35 | 2.05% | |
R Class (before waiver) | $1,000 | $1,013.94 | $11.21 | 2.22% | |
R6 Class (after waiver) | $1,000 | $1,019.45(5) | $5.67(5) | 1.12% | |
R6 Class (before waiver) | $1,000 | $1,018.20(5) | $6.93(5) | 1.37% | |
(1) | Expenses are equal to the class’s annualized expense ratio listed in the table above, multiplied by the average account value over the period, multiplied by 183, the number of days in the most recent fiscal half-year, divided by 365, to reflect the one-half year period. |
(2) | Ending account value assumes the return earned after waiver and would have been lower if a portion of the management fee had not been waived. |
(3) | Ending account value based on actual return from July 26, 2013 (commencement of sale) through November 30, 2013. |
(4) | Expenses are equal to the class’s annualized expense ratio listed in the table above, multiplied by the average account value over the period, multiplied by 128, the number of days in the period from July 26, 2013 (commencement of sale) through November 30, 2013, divided by 365, to reflect the period. Had the class been available for the full period, the expenses paid during the period would have been higher. |
(5) | Ending account value and expenses paid during the period assumes the class had been available throughout the entire period and are calculated using the class’s annualized expense ratio listed in the table above. |
Schedule of Investments |
NOVEMBER 30, 2013
Shares | Value | |
Common Stocks — 99.7% | ||
BRAZIL — 8.1% | ||
Anhanguera Educacional Participacoes SA | 783,300 | $ 5,221,441 |
BRF SA ADR | 187,790 | 4,168,938 |
Cia Brasileira de Distribuicao Grupo Pao de Acucar ADR | 135,600 | 6,384,048 |
Hypermarcas SA | 683,600 | 5,529,128 |
Itau Unibanco Holding SA ADR | 950,615 | 13,375,153 |
Ultrapar Participacoes SA | 127,600 | 3,154,127 |
37,832,835 | ||
CANADA — 0.9% | ||
Pacific Rubiales Energy Corp. | 217,370 | 4,040,335 |
CHILE — 0.6% | ||
SACI Falabella | 329,941 | 3,026,134 |
CHINA — 21.6% | ||
Brilliance China Automotive Holdings Ltd. | 3,992,000 | 6,982,415 |
China Communications Services Corp. Ltd. H Shares | 5,434,000 | 3,560,728 |
China Oilfield Services Ltd. H Shares | 2,030,000 | 6,127,274 |
China Overseas Land & Investment Ltd. | 3,112,000 | 9,674,133 |
China Railway Construction Corp. Ltd. H Shares | 4,896,000 | 5,488,032 |
CNOOC Ltd. | 5,317,000 | 10,891,121 |
ENN Energy Holdings Ltd. | 1,028,000 | 7,240,043 |
Great Wall Motor Co. Ltd. H Shares | 1,083,500 | 6,617,658 |
Haier Electronics Group Co. Ltd. | 1,400,000 | 3,297,496 |
Hengan International Group Co. Ltd. | 275,500 | 3,471,935 |
Industrial & Commercial Bank of China Ltd. H Shares | 8,708,645 | 6,256,929 |
Ping An Insurance Group Co. H Shares | 906,000 | 8,449,323 |
Shenzhou International Group Holdings Ltd. | 942,000 | 3,560,196 |
Tencent Holdings Ltd. | 341,800 | 19,769,382 |
101,386,665 | ||
COLOMBIA — 0.7% | ||
Cemex Latam Holdings SA(1) | 420,540 | 3,117,046 |
HONG KONG — 1.5% | ||
Xinyi Glass Holdings Ltd. | 6,638,000 | 7,021,122 |
INDIA — 4.8% | ||
HCL Technologies Ltd. | 179,050 | 3,111,671 |
HDFC Bank Ltd. | 300,659 | 3,181,722 |
ITC Ltd. | 1,374,924 | 7,049,538 |
Tata Global Beverages Ltd. | 1,001,074 | 2,385,340 |
Tata Motors Ltd. | 1,069,965 | 6,826,613 |
22,554,884 | ||
INDONESIA — 2.0% | ||
PT AKR Corporindo Tbk | 5,010,500 | 1,958,126 |
PT Bank Rakyat Indonesia (Persero) Tbk | 4,258,500 | 2,652,107 |
PT Matahari Department Store Tbk(1) | 2,821,500 | 2,724,207 |
PT Semen Gresik (Persero) Tbk | 1,965,000 | 2,102,570 |
9,437,010 | ||
MALAYSIA — 2.2% | ||
Axiata Group Bhd | 2,821,200 | 5,882,241 |
Sapurakencana Petroleum Bhd(1) | 3,505,100 | 4,665,492 |
10,547,733 | ||
MEXICO — 5.6% | ||
Alfa SAB de CV, Series A | 1,391,055 | 4,080,456 |
Alsea SAB de CV | 1,045,817 | 3,146,657 |
Cemex SAB de CV ADR(1) | 354,982 | 3,879,953 |
Gruma SAB de CV B Shares(1) | 557,700 | 3,910,254 |
Grupo Financiero Banorte SAB de CV | 748,796 | 5,106,867 |
Grupo Mexico SAB de CV | 1,043,910 | 3,096,367 |
Promotora y Operadora de Infraestructura SAB de CV(1) | 280,375 | 3,301,295 |
26,521,849 | ||
PANAMA — 1.0% | ||
Copa Holdings SA Class A | 30,793 | 4,662,676 |
PERU — 0.9% | ||
Credicorp Ltd. | 33,944 | 4,361,804 |
PHILIPPINES — 1.4% | ||
SM Investments Corp. | 209,623 | 3,615,428 |
Universal Robina Corp. | 1,109,660 | 3,054,575 |
6,670,003 | ||
POLAND — 1.1% | ||
Powszechny Zaklad Ubezpieczen SA | 33,749 | 5,127,867 |
RUSSIA — 8.5% | ||
Eurasia Drilling Co. Ltd. GDR | 102,475 | 4,467,910 |
Magnit OJSC GDR | 128,861 | 8,491,940 |
Mail.ru Group Ltd. GDR | 101,465 | 4,195,578 |
MegaFon OAO GDR | 83,350 | 2,688,871 |
Shares | Value |
NovaTek OAO GDR | 50,972 | $ 6,702,818 |
Sberbank of Russia | 2,912,672 | 9,075,708 |
Yandex NV A Shares(1) | 107,049 | 4,255,198 |
39,878,023 | ||
SOUTH AFRICA — 6.1% | ||
Aspen Pharmacare Holdings Ltd. | 246,502 | 6,354,263 |
Discovery Holdings Ltd. | 369,636 | 2,956,508 |
Mr Price Group Ltd. | 263,540 | 4,009,393 |
MTN Group Ltd. | 128,360 | 2,498,095 |
Naspers Ltd. N Shares | 135,283 | 12,918,227 |
28,736,486 | ||
SOUTH KOREA — 14.9% | ||
GS Retail Co. Ltd. | 147,580 | 3,946,437 |
Hankook Tire Co. Ltd. | 51,020 | 3,013,087 |
Hotel Shilla Co. Ltd. | 47,020 | 3,052,324 |
Hyundai Motor Co. | 5,910 | 1,407,276 |
Hyundai Wia Corp. | 13,010 | 2,335,727 |
LG Chem Ltd. | 15,200 | 4,172,352 |
NAVER Corp. | 8,830 | 5,773,750 |
Orion Corp. | 3,140 | 2,676,254 |
Samsung Electronics Co. Ltd. | 23,522 | 33,205,960 |
Seoul Semiconductor Co. Ltd. | 124,430 | 4,914,650 |
SK Hynix, Inc.(1) | 72,310 | 2,418,760 |
Sung Kwang Bend Co. Ltd. | 113,210 | 2,957,816 |
69,874,393 | ||
TAIWAN — 11.3% | ||
Chailease Holding Co. Ltd. | 1,529,001 | 4,066,107 |
Eclat Textile Co. Ltd. | 642,200 | 8,181,030 |
Ginko International Co. Ltd. | 190,000 | 4,057,579 |
MediaTek, Inc. | 735,000 | 10,828,547 |
Merida Industry Co. Ltd. | 755,000 | 5,612,624 |
Merry Electronics Co. Ltd. | 377,000 | 1,630,601 |
Taiwan Semiconductor Manufacturing Co. Ltd. | 5,290,939 | 18,772,339 |
53,148,827 | ||
THAILAND — 3.1% | ||
Kasikornbank PCL NVDR | 790,800 | 4,162,105 |
Minor International PCL | 4,795,300 | 3,628,956 |
Shin Corp. PCL NVDR | 1,202,000 | 2,901,121 |
Siam Cement PCL NVDR | 325,700 | 3,996,444 |
14,688,626 | ||
TURKEY — 2.7% | ||
BIM Birlesik Magazalar AS | 131,190 | 2,959,978 |
Pegasus Hava Tasimaciligi AS(1) | 248,732 | 5,205,890 |
TAV Havalimanlari Holding AS | 389,223 | 2,898,398 |
Tofas Turk Otomobil Fabrikasi | 265,539 | $ 1,740,873 |
12,805,139 | ||
TURKMENISTAN — 0.7% | ||
Dragon Oil plc | 377,660 | 3,516,220 |
TOTAL COMMON STOCKS (Cost $347,036,260) | 468,955,677 | |
Temporary Cash Investments — 0.8% | ||
Repurchase Agreement, Bank of America Merrill Lynch, (collateralized by various U.S. Treasury obligations, 0.375%, 6/30/15, valued at $589,790), in a joint trading account at 0.06%, dated 11/29/13, due 12/2/13 (Delivery value $577,943) | 577,940 | |
Repurchase Agreement, Credit Suisse First Boston, Inc., (collateralized by various U.S. Treasury obligations, 2.75%, 11/15/42, valued at $705,324), in a joint trading account at 0.03%, dated 11/29/13, due 12/2/13 (Delivery value $693,530) | 693,528 | |
Repurchase Agreement, Goldman Sachs & Co., (collateralized by various U.S. Treasury obligations, 0.00%, 5/29/14, valued at $590,066), in a joint trading account at 0.04%, dated 11/29/13, due 12/2/13 (Delivery value $578,511) | 578,509 | |
SSgA U.S. Government Money Market Fund | 1,784,654 | 1,784,654 |
TOTAL TEMPORARY CASH INVESTMENTS (Cost $3,634,631) | 3,634,631 | |
TOTAL INVESTMENT SECURITIES — 100.5% (Cost $350,670,891) | 472,590,308 | |
OTHER ASSETS AND LIABILITIES — (0.5)% | (2,558,820) | |
TOTAL NET ASSETS — 100.0% | $470,031,488 | |
Market Sector Diversification | |
(as a % of net assets) | |
Information Technology | 22.9% |
Consumer Discretionary | 19.8% |
Financials | 17.3% |
Consumer Staples | 11.4% |
Energy | 9.3% |
Industrials | 7.3% |
Materials | 4.2% |
Telecommunication Services | 3.7% |
Health Care | 2.3% |
Utilities | 1.5% |
Cash and Equivalents* | 0.3% |
* Includes temporary cash investments and other assets and liabilities.
Notes to Schedule of Investments
ADR = American Depositary Receipt
GDR = Global Depositary Receipt
NVDR = Non-Voting Depositary Receipt
OJSC = Open Joint Stock Company
(1) | Non-income producing. |
See Notes to Financial Statements.
Statement of Assets and Liabilities |
NOVEMBER 30, 2013 | |||
Assets | |||
Investment securities, at value (cost of $350,670,891) | $472,590,308 | ||
Foreign currency holdings, at value (cost of $76,211) | 76,494 | ||
Receivable for capital shares sold | 35,945 | ||
Dividends and interest receivable | 101,641 | ||
| 472,804,388 | |||
Liabilities | |||
Disbursements in excess of demand deposit cash | 1,781,622 | ||
Payable for investments purchased | 44 | ||
Payable for capital shares redeemed | 436,078 | ||
Accrued management fees | 549,430 | ||
Distribution and service fees payable | 5,726 | ||
| 2,772,900 | |||
Net Assets | $470,031,488 | ||
Net Assets Consist of: | |||
Capital (par value and paid-in surplus) | $444,852,212 | ||
Undistributed net investment income | 101,931 | ||
Accumulated net realized loss | (96,830,736 | ) | |
Net unrealized appreciation | 121,908,081 | ||
| $470,031,488 | |||
Net assets | Shares outstanding | Net asset value per share | |
Investor Class, $0.01 Par Value | $421,274,219 | 47,485,628 | $8.87 |
Institutional Class, $0.01 Par Value | $32,451,768 | 3,570,656 | $9.09 |
A Class, $0.01 Par Value | $11,574,816 | 1,347,552 | $8.59* |
C Class, $0.01 Par Value | $3,570,508 | 441,231 | $8.09 |
R Class, $0.01 Par Value | $1,133,314 | 129,929 | $8.72 |
R6 Class, $0.01 Par Value | $26,863 | 2,955 | $9.09 |
* Maximum offering price $9.11 (net asset value divided by 0.9425).
See Notes to Financial Statements.
Statement of Operations |
YEAR ENDED NOVEMBER 30, 2013 | |||
Investment Income (Loss) | |||
Income: | |||
Dividends (net of foreign taxes withheld of $865,551) | $8,793,436 | ||
Interest | 1,644 | ||
| 8,795,080 | |||
Expenses: | |||
Management fees | 8,287,900 | ||
Distribution and service fees: | |||
A Class | 33,572 | ||
C Class | 35,383 | ||
R Class | 5,293 | ||
Directors’ fees and expenses | 17,868 | ||
Other expenses | 11,750 | ||
| 8,391,766 | |||
Fees waived | (402,589 | ) | |
| 7,989,177 | |||
Net investment income (loss) | 805,903 | ||
Realized and Unrealized Gain (Loss) | |||
Net realized gain (loss) on: | |||
Investment transactions | 37,370,430 | ||
Foreign currency transactions | (766,909 | ) | |
| 36,603,521 | |||
Change in net unrealized appreciation (depreciation) on: | |||
Investments | (6,385,182 | ) | |
Translation of assets and liabilities in foreign currencies | (8,021 | ) | |
| (6,393,203 | ) | ||
Net realized and unrealized gain (loss) | 30,210,318 | ||
Net Increase (Decrease) in Net Assets Resulting from Operations | $31,016,221 | ||
See Notes to Financial Statements.
Statement of Changes in Net Assets |
YEARS ENDED NOVEMBER 30, 2013 AND NOVEMBER 30, 2012 | ||||||
Increase (Decrease) in Net Assets | November 30, 2013 | November 30, 2012 | ||||
Operations | ||||||
Net investment income (loss) | $805,903 | $1,397,488 | ||||
Net realized gain (loss) | 36,603,521 | 13,533,591 | ||||
Change in net unrealized appreciation (depreciation) | (6,393,203 | ) | 46,234,036 | |||
Net increase (decrease) in net assets resulting from operations | 31,016,221 | 61,165,115 | ||||
Distributions to Shareholders | ||||||
From net investment income: | ||||||
Investor Class | (1,646,742 | ) | — | |||
Institutional Class | (181,997 | ) | (51,371 | ) | ||
A Class | (15,732 | ) | — | |||
Decrease in net assets from distributions | (1,844,471 | ) | (51,371 | ) | ||
Capital Share Transactions | ||||||
Net increase (decrease) in net assets from capital share transactions | (57,978,517 | ) | (46,952,076 | ) | ||
Redemption Fees | ||||||
Increase in net assets from redemption fees | 24,913 | 11,993 | ||||
Net increase (decrease) in net assets | (28,781,854 | ) | 14,173,661 | |||
Net Assets | ||||||
Beginning of period | 498,813,342 | 484,639,681 | ||||
End of period | $470,031,488 | $498,813,342 | ||||
Undistributed net investment income | $101,931 | $757,588 | ||||
See Notes to Financial Statements.
Notes to Financial Statements |
NOVEMBER 30, 2013
1. Organization
American Century World Mutual Funds, Inc. (the corporation) is registered under the Investment Company Act of 1940, as amended (the 1940 Act), as an open-end management investment company and is organized as a Maryland corporation. Emerging Markets Fund (the fund) is one fund in a series issued by the corporation. The fund is diversified as defined under the 1940 Act. The fund’s investment objective is to seek capital growth.
The fund offers the Investor Class, the Institutional Class, the A Class, the C Class, the R Class and the R6 Class. The A Class may incur an initial sales charge. The A Class and C Class may be subject to a contingent deferred sales charge. The share classes differ principally in their respective sales charges and distribution and shareholder servicing expenses and arrangements. The Institutional Class and R6 Class shareholders do not require the same level of shareholder and administrative services from American Century Investment Management, Inc. (ACIM) (the investment advisor) as shareholders of other classes. In addition, financial intermediaries do not receive any service, distribution or administrative fees for the R6 Class. As a result, the Institutional Class and R6 Class are charged lower unified management fees. Sale of the R6 Class commenced on July 26, 2013.
2. Significant Accounting Policies
The following is a summary of significant accounting policies consistently followed by the fund in preparation of its financial statements. The financial statements are prepared in conformity with accounting principles generally accepted in the United States of America, which may require management to make certain estimates and assumptions at the date of the financial statements. Actual results could differ from these estimates.
Investment Valuations — The fund determines the fair value of its investments and computes its net asset value per share at the close of regular trading (usually 4 p.m. Eastern time) on the New York Stock Exchange (NYSE) on each day the NYSE is open. The Board of Directors has adopted valuation policies and procedures to guide the investment advisor in the fund’s investment valuation process and to provide methodologies for the oversight of the fund’s pricing function.
Equity securities that are listed or traded on a domestic securities exchange are valued at the last reported sales price or at the official closing price as provided by the exchange. Equity securities traded on foreign securities exchanges are generally valued at the closing price of such securities on the exchange where primarily traded or at the close of the NYSE, if that is earlier. If no last sales price is reported, or if local convention or regulation so provides, the mean of the latest bid and asked prices may be used. Securities traded over-the-counter are valued at the mean of the latest bid and asked prices, the last sales price, or the official closing price. Equity securities initially expressed in local currencies are translated into U.S. dollars at the mean of the appropriate currency exchange rate at the close of the NYSE as provided by an independent pricing service.
Fixed income securities maturing within 60 days at the time of purchase may be valued at cost, plus or minus any amortized discount or premium or at the evaluated mean as provided by an independent pricing service. Evaluated mean prices are commonly derived through utilization of market models, which may consider, among other factors: trade data, quotations from dealers and active market makers, relevant yield curve and spread data, related sector levels, creditworthiness, trade data or market information on comparable securities, and other relevant security specific information.
Open-end management investment companies are valued at the reported net asset value per share. Repurchase agreements are valued at cost, which approximates fair value.
If the fund determines that the market price for an investment is not readily available or the valuation methods mentioned above do not reflect an investment’s fair value, such investment is valued as determined in good faith by the Board of Directors or its delegate, in accordance with policies and procedures adopted by the Board of Directors. In its determination of fair value, the fund may review several factors including, but not limited
to, market information regarding the specific investment or comparable investments and correlation with other investment types, futures indices or general market indicators. Circumstances that may cause the fund to use these procedures to value an investment include, but are not limited to: an investment has been declared in default or is distressed; trading in a security has been suspended during the trading day or a security is not actively trading on its principal exchange; prices received from a regular pricing source are deemed unreliable; or there is a foreign market holiday and no trading occurred.
The fund monitors for significant events occurring after the close of an investment’s primary exchange but before the fund’s net asset value per share is determined. Significant events may include, but are not limited to: corporate announcements and transactions; governmental action and political unrest that could impact a specific investment or an investment sector; or armed conflicts, natural disasters and similar events that could affect investments in a specific country or region. The fund also monitors for significant fluctuations in domestic and foreign markets, as evidenced by the U.S. market or such other indicators that the Board of Directors, or its delegate, deems appropriate. If significant fluctuations in foreign markets are identified, the fund may apply a model-derived factor to the closing price of equity securities traded on foreign securities exchanges. The factor is based on observable market data as provided by an independent pricing service.
Security Transactions — Security transactions are accounted for as of the trade date. Net realized gains and losses are determined on the identified cost basis, which is also used for federal income tax purposes.
Investment Income — Dividend income less foreign taxes withheld, if any, is recorded as of the ex-dividend date. Distributions received on securities that represent a return of capital or long-term capital gain are recorded as a reduction of cost of investments and/or as a realized gain. The fund may estimate the components of distributions received that may be considered nontaxable distributions or long-term capital gain distributions for income tax purposes. Interest income is recorded on the accrual basis and includes accretion of discounts and amortization of premiums.
Foreign Currency Translations — All assets and liabilities initially expressed in foreign currencies are translated into U.S. dollars at prevailing exchange rates at period end. The fund may enter into spot foreign currency exchange contracts to facilitate transactions denominated in a foreign currency. Purchases and sales of investment securities, dividend and interest income, spot foreign currency exchange contracts, and expenses are translated at the rates of exchange prevailing on the respective dates of such transactions. Net realized and unrealized foreign currency exchange gains or losses related to investment securities are a component of net realized gain (loss) on investment transactions and change in net unrealized appreciation (depreciation) on investments, respectively.
Repurchase Agreements — The fund may enter into repurchase agreements with institutions that ACIM has determined are creditworthy pursuant to criteria adopted by the Board of Directors. The fund requires that the collateral, represented by securities, received in a repurchase transaction be transferred to the custodian in a manner sufficient to enable the fund to obtain those securities in the event of a default under the repurchase agreement. ACIM monitors, on a daily basis, the securities transferred to ensure the value, including accrued interest, of the securities under each repurchase agreement is equal to or greater than amounts owed to the fund under each repurchase agreement.
Joint Trading Account — Pursuant to an Exemptive Order issued by the Securities and Exchange Commission, the fund, along with certain other funds in the American Century Investments family of funds, may transfer uninvested cash balances into a joint trading account. These balances are invested in one or more repurchase agreements that are collateralized by U.S. Treasury or Agency obligations.
Income Tax Status — It is the fund’s policy to distribute substantially all net investment income and net realized gains to shareholders and to otherwise qualify as a regulated investment company under provisions of the Internal Revenue Code. Accordingly, no provision has been made for income taxes. The fund files U.S. federal, state, local and non-U.S. tax returns as applicable. The fund’s tax returns are subject to examination by the relevant taxing authority until expiration of the applicable statute of limitations, which is
generally three years from the date of filing but can be longer in certain jurisdictions. At this time, management believes there are no uncertain tax positions which, based on their technical merit, would not be sustained upon examination and for which it is reasonably possible that the total amounts of unrecognized tax benefits will significantly change in the next twelve months.
Multiple Class — All shares of the fund represent an equal pro rata interest in the net assets of the class to which such shares belong, and have identical voting, dividend, liquidation and other rights and the same terms and conditions, except for class specific expenses and exclusive rights to vote on matters affecting only individual classes. Income, non-class specific expenses, and realized and unrealized capital gains and losses of the fund are allocated to each class of shares based on their relative net assets.
Distributions to Shareholders — Distributions from net investment income and net realized gains, if any, are generally declared and paid annually. The fund may make distributions on a more frequent basis to comply with the distribution requirements of the Internal Revenue Code, in all events in a manner consistent with provisions of the 1940 Act.
Redemption — The fund may impose a 2.00% redemption fee on shares held less than 60 days. The fee may not be applicable to all classes. The redemption fee is retained by the fund and helps cover transaction costs that long-term investors may bear when the fund sells securities to meet investor redemptions.
Indemnifications — Under the corporation’s organizational documents, its officers and directors are indemnified against certain liabilities arising out of the performance of their duties to the fund. In addition, in the normal course of business, the fund enters into contracts that provide general indemnifications. The maximum exposure under these arrangements is unknown as this would involve future claims that may be made against a fund. The risk of material loss from such claims is considered by management to be remote.
3. Fees and Transactions with Related Parties
Management Fees — The corporation has entered into a management agreement with ACIM, under which ACIM provides the fund with investment advisory and management services in exchange for a single, unified management fee (the fee) per class. The agreement provides that all expenses of managing and operating the fund, except distribution and service fees, brokerage expenses, taxes, interest, fees and expenses of the independent directors (including legal counsel fees), and extraordinary expenses, will be paid by ACIM. The fee is computed and accrued daily based on each class’s daily net assets and paid monthly in arrears. The rate of the fee is determined by applying a fee rate calculation formula. This formula takes into account the fund’s assets as well as certain assets, if any, of other clients of the investment advisor outside the American Century Investments family of funds (such as subadvised funds and separate accounts) that have very similar investment teams and investment strategies (strategy assets). The strategy assets of the fund include the assets of NT Emerging Markets Fund, one fund in a series issued by the corporation. The annual management fee schedule ranges from 1.250% to 1.850% for the Investor Class, A Class, C Class and R Class. The annual management fee schedule ranges from 1.050% to 1.650% for the Institutional Class and 0.900% to 1.500% for the R6 Class. Effective July 26, 2013, the investment advisor voluntarily agreed to waive 0.250% of its management fee. The investment advisor expects the fee waiver to continue through March 31, 2015, and cannot terminate it without the approval of the Board of Directors. The total amount of the waiver for each class for the period ended November 30, 2013 was $359,579, $27,689, $11,309, $3,009, $981 and $22 for the Investor Class, Institutional Class, A Class, C Class, R Class and R6 Class, respectively. The effective annual management fee before waiver for each class for the period ended November 30, 2013 was 1.71% for the Investor Class, A Class, C Class and R Class, 1.51% for the Institutional Class and 1.36% for the R6 Class. The effective annual management fee after waiver for each class for the period ended November 30, 2013 was 1.62% for the Investor Class, A Class, C Class and R Class, 1.42% for the Institutional Class and 1.11% for the R6 Class.
Distribution and Service Fees — The Board of Directors has adopted a separate Master Distribution and Individual Shareholder Services Plan for each of the A Class, C Class and R Class (collectively the plans), pursuant to Rule 12b-1 of the 1940 Act. The plans
provide that the A Class will pay American Century Investment Services, Inc. (ACIS) an annual distribution and service fee of 0.25%. The plans provide that the C Class will pay ACIS an annual distribution and service fee of 1.00%, of which 0.25% is paid for individual shareholder services and 0.75% is paid for distribution services. The plans provide that the R Class will pay ACIS an annual distribution and service fee of 0.50%. The fees are computed and accrued daily based on each class’s daily net assets and paid monthly in arrears. The fees are used to pay financial intermediaries for distribution and individual shareholder services. Fees incurred under the plans during the year ended November 30, 2013 are detailed in the Statement of Operations.
Related Parties — Certain officers and directors of the corporation are also officers and/or directors of American Century Companies, Inc. (ACC). The corporation’s investment advisor, ACIM, the corporation’s distributor, ACIS, and the corporation’s transfer agent, American Century Services, LLC, are wholly owned, directly or indirectly, by ACC. Various funds issued by American Century Asset Allocation Portfolios, Inc. and American Century Strategic Asset Allocations, Inc. own, in aggregate, 28% of the shares of the fund. Related parties do not invest in the fund for the purpose of exercising management or control.
4. Investment Transactions
Purchases and sales of investment securities, excluding short-term investments, for the year ended November 30, 2013 were $325,896,546 and $378,859,969, respectively.
5. Capital Share Transactions
Transactions in shares of the fund were as follows:
Year ended November 30, 2013(1) | Year ended November 30, 2012 | |||||||||||
Shares | Amount | Shares | Amount | |||||||||
Investor Class/Shares Authorized | 400,000,000 | 235,000,000 | ||||||||||
Sold | 7,313,071 | $62,218,485 | 6,929,950 | $53,455,116 | ||||||||
Issued in reinvestment of distributions | 186,256 | 1,607,394 | — | — | ||||||||
Redeemed | (14,123,267 | ) | (121,216,351 | ) | (11,776,977 | ) | (91,432,663 | ) | ||||
| (6,623,940 | ) | (57,390,472 | ) | (4,847,027 | ) | (37,977,547 | ) | |||||
Institutional Class/Shares Authorized | 40,000,000 | 40,000,000 | ||||||||||
Sold | 967,833 | 8,551,403 | 765,815 | 6,099,475 | ||||||||
Issued in reinvestment of distributions | 20,606 | 181,954 | 6,334 | 51,366 | ||||||||
Redeemed | (750,390 | ) | (6,606,195 | ) | (1,368,338 | ) | (10,963,145 | ) | ||||
| 238,049 | 2,127,162 | (596,189 | ) | (4,812,304 | ) | |||||||
A Class/Shares Authorized | 40,000,000 | 40,000,000 | ||||||||||
Sold | 756,334 | 6,291,182 | 275,763 | 2,115,216 | ||||||||
Issued in reinvestment of distributions | 1,779 | 14,890 | — | — | ||||||||
Redeemed | (1,109,049 | ) | (9,338,269 | ) | (718,945 | ) | (5,450,958 | ) | ||||
| (350,936 | ) | (3,032,197 | ) | (443,182 | ) | (3,335,742 | ) | |||||
C Class/Shares Authorized | 5,000,000 | 5,000,000 | ||||||||||
Sold | 134,704 | 1,071,648 | 48,215 | 346,043 | ||||||||
Redeemed | (133,416 | ) | (1,038,723 | ) | (177,535 | ) | (1,274,469 | ) | ||||
| 1,288 | 32,925 | (129,320 | ) | (928,426 | ) | |||||||
R Class/Shares Authorized | 10,000,000 | 10,000,000 | ||||||||||
Sold | 68,244 | 581,011 | 36,789 | 282,556 | ||||||||
Redeemed | (38,453 | ) | (321,946 | ) | (23,118 | ) | (180,613 | ) | ||||
| 29,791 | 259,065 | 13,671 | 101,943 | |||||||||
R6 Class/Shares Authorized | 50,000,000 | N/A | ||||||||||
Sold | 2,955 | 25,000 | ||||||||||
Net increase (decrease) | (6,702,793 | ) | $(57,978,517 | ) | (6,002,047 | ) | $(46,952,076 | ) | ||||
(1) | July 26, 2013 (commencement of sale) through November 30, 2013 for the R6 Class. |
6. Fair Value Measurements
The fund’s investments valuation process is based on several considerations and may use multiple inputs to determine the fair value of the investments held by the fund. In conformity with accounting principles generally accepted in the United States of America, the inputs used to determine a valuation are classified into three broad levels.
• | Level 1 valuation inputs consist of unadjusted quoted prices in an active market for identical investments. |
• | Level 2 valuation inputs consist of direct or indirect observable market data (including quoted prices for comparable investments, evaluations of subsequent market events, interest rates, prepayment speeds, credit risk, etc.). These inputs also consist of quoted prices for identical investments initially expressed in local currencies that are adjusted through translation into U.S. dollars. |
• | Level 3 valuation inputs consist of unobservable data (including a fund’s own assumptions). |
The level classification is based on the lowest level input that is significant to the fair valuation measurement. The valuation inputs are not necessarily an indication of the risks associated with investing in these securities or other financial instruments.
The following is a summary of the level classifications as of period end. The Schedule of Investments provides additional information on the fund’s portfolio holdings.
Level 1 | Level 2 | Level 3 | |
Assets | |||
Investment Securities | |||
Common Stocks | $41,087,770 | $427,867,907 | — |
Temporary Cash Investments | 1,784,654 | 1,849,977 | — |
Total Value of Investment Securities | $42,872,424 | $429,717,884 | — |
7. Risk Factors
There are certain risks involved in investing in foreign securities. These risks include those resulting from future adverse political, social and economic developments, fluctuations in currency exchange rates, the possible imposition of exchange controls, and other foreign laws or restrictions. Investing in emerging markets may accentuate these risks.
8. Federal Tax Information
The tax character of distributions paid during the years ended November 30, 2013 and November 30, 2012 were as follows:
2013 | 2012 | |
Distributions Paid From | ||
Ordinary income | $1,844,471 | $51,371 |
Long-term capital gains | — | — |
The book-basis character of distributions made during the year from net investment income or net realized gains may differ from their ultimate characterization for federal income tax purposes. These differences reflect the differing character of certain income items and net realized gains and losses for financial statement and tax purposes, and may result in reclassification among certain capital accounts on the financial statements.
As of November 30, 2013, the federal tax cost of investments and the components of distributable earnings on a tax-basis were as follows:
Federal tax cost of investments | $352,311,128 |
Gross tax appreciation of investments | $126,941,381 |
Gross tax depreciation of investments | (6,662,201) |
Net tax appreciation (depreciation) of investments | $120,279,180 |
Net tax appreciation (depreciation) on translation of assets and liabilities in foreign currencies | $ (11,336) |
Net tax appreciation (depreciation) | $120,267,844 |
Undistributed ordinary income | $1,555,506 |
Accumulated short-term capital losses | $(96,644,074) |
The difference between book-basis and tax-basis unrealized appreciation (depreciation) is attributable primarily to the realization to ordinary income for tax purposes of unrealized gains on investments in passive foreign investment companies.
Accumulated capital losses represent net capital loss carryovers that may be used to offset future realized capital gains for federal income tax purposes. Future capital loss carryover utilization in any given year may be subject to Internal Revenue Code limitations. Capital loss carryovers expire in 2017.
Financial Highlights |
For a Share Outstanding Throughout the Years Ended November 30 (except as noted) | |||||||||||||
Per-Share Data | Ratios and Supplemental Data | ||||||||||||
Income From Investment Operations: | Ratio to Average Net Assets of: | ||||||||||||
Net Asset Value, Beginning | Net Income | Net | Total From Investment Operations | Distributions From Net Investment Income | Net Asset Value, | Total | Operating Expenses | Operating Expenses (before waiver) | Net Income | Net Income waiver) | Portfolio Turnover | Net Assets, (in thousands) | |
Investor Class | |||||||||||||
2013 | $8.36 | 0.01 | 0.53 | 0.54 | (0.03) | $8.87 | 6.48% | 1.63% | 1.72% | 0.17% | 0.08% | 68% | $421,274 |
2012 | $7.38 | 0.02 | 0.96 | 0.98 | — | $8.36 | 13.28% | 1.74% | 1.74% | 0.29% | 0.29% | 85% | $452,331 |
2011 | $8.46 | 0.01 | (1.09) | (1.08) | — | $7.38 | (12.77)% | 1.71% | 1.71% | 0.17% | 0.17% | 71% | $435,079 |
2010 | $7.28 | —(3) | 1.18 | 1.18 | — | $8.46 | 16.21% | 1.72% | 1.72% | (0.02)% | (0.02)% | 87% | $583,978 |
2009 | $4.17 | 0.01 | 3.13 | 3.14 | (0.03) | $7.28 | 75.36% | 1.78% | 1.78% | 0.11% | 0.11% | 126% | $567,248 |
Institutional Class | |||||||||||||
2013 | $8.56 | 0.03 | 0.55 | 0.58 | (0.05) | $9.09 | 6.77% | 1.43% | 1.52% | 0.37% | 0.28% | 68% | $32,452 |
2012 | $7.56 | 0.04 | 0.97 | 1.01 | (0.01) | $8.56 | 13.43% | 1.54% | 1.54% | 0.49% | 0.49% | 85% | $28,536 |
2011 | $8.65 | 0.03 | (1.12) | (1.09) | — | $7.56 | (12.60)% | 1.51% | 1.51% | 0.37% | 0.37% | 71% | $29,695 |
2010 | $7.43 | 0.02 | 1.20 | 1.22 | — | $8.65 | 16.42% | 1.52% | 1.52% | 0.18% | 0.18% | 87% | $40,969 |
2009 | $4.26 | 0.02 | 3.18 | 3.20 | (0.03) | $7.43 | 75.92% | 1.58% | 1.58% | 0.31% | 0.31% | 126% | $27,787 |
For a Share Outstanding Throughout the Years Ended November 30 (except as noted) | |||||||||||||
Per-Share Data | Ratios and Supplemental Data | ||||||||||||
Income From Investment Operations: | Ratio to Average Net Assets of: | ||||||||||||
Net Asset Value, Beginning | Net Income | Net | Total From Investment Operations | Distributions From Net Investment Income | Net Asset Value, | Total | Operating Expenses | Operating Expenses (before waiver) | Net Income | Net Income waiver) | Portfolio Turnover | Net Assets, (in thousands) | |
A Class | |||||||||||||
2013 | $8.09 | (0.01) | 0.52 | 0.51 | (0.01) | $8.59 | 6.30% | 1.88% | 1.97% | (0.08)% | (0.17)% | 68% | $11,575 |
2012 | $7.16 | —(3) | 0.93 | 0.93 | — | $8.09 | 12.99% | 1.99% | 1.99% | 0.04% | 0.04% | 85% | $13,745 |
2011 | $8.23 | (0.01) | (1.06) | (1.07) | — | $7.16 | (13.00)% | 1.96% | 1.96% | (0.08)% | (0.08)% | 71% | $15,339 |
2010 | $7.10 | (0.02) | 1.15 | 1.13 | — | $8.23 | 15.92% | 1.97% | 1.97% | (0.27)% | (0.27)% | 87% | $29,572 |
2009 | $4.07 | (0.01) | 3.06 | 3.05 | (0.02) | $7.10 | 75.24% | 2.03% | 2.03% | (0.14)% | (0.14)% | 126% | $23,260 |
C Class | |||||||||||||
2013 | $7.67 | (0.06) | 0.48 | 0.42 | — | $8.09 | 5.48% | 2.63% | 2.72% | (0.83)% | (0.92)% | 68% | $3,571 |
2012 | $6.84 | (0.05) | 0.88 | 0.83 | — | $7.67 | 12.13% | 2.74% | 2.74% | (0.71)% | (0.71)% | 85% | $3,376 |
2011 | $7.93 | (0.07) | (1.02) | (1.09) | — | $6.84 | (13.75)% | 2.71% | 2.71% | (0.83)% | (0.83)% | 71% | $3,896 |
2010 | $6.89 | (0.07) | 1.11 | 1.04 | — | $7.93 | 15.09% | 2.72% | 2.72% | (1.02)% | (1.02)% | 87% | $5,257 |
2009 | $3.96 | (0.05) | 2.98 | 2.93 | — | $6.89 | 73.99% | 2.78% | 2.78% | (0.89)% | (0.89)% | 126% | $5,372 |
R Class | |||||||||||||
2013 | $8.23 | (0.02) | 0.51 | 0.49 | — | $8.72 | 5.95% | 2.13% | 2.22% | (0.33)% | (0.42)% | 68% | $1,133 |
2012 | $7.30 | (0.02) | 0.95 | 0.93 | — | $8.23 | 12.74% | 2.24% | 2.24% | (0.21)% | (0.21)% | 85% | $824 |
2011 | $8.42 | (0.03) | (1.09) | (1.12) | — | $7.30 | (13.30)% | 2.21% | 2.21% | (0.33)% | (0.33)% | 71% | $631 |
2010 | $7.28 | (0.04) | 1.18 | 1.14 | — | $8.42 | 15.66% | 2.22% | 2.22% | (0.52)% | (0.52)% | 87% | $828 |
2009 | $4.17 | (0.02) | 3.14 | 3.12 | (0.01) | $7.28 | 74.94% | 2.28% | 2.28% | (0.39)% | (0.39)% | 126% | $516 |
R6 Class | |||||||||||||
2013(4) | $8.46 | —(3) | 0.63 | 0.63 | — | $9.09 | 7.45% | 1.12%(5) | 1.37%(5) | 0.14%(5) | (0.11)%(5) | 68%(6) | $27 |
Notes to Financial Highlights
(1) | Computed using average shares outstanding throughout the period. |
(2) | Total returns are calculated based on the net asset value of the last business day and do not reflect applicable sales charges, if any. Total returns for periods less than one year are not annualized. |
(3) | Per-share amount was less than $0.005. |
(4) | July 26, 2013 (commencement of sale) through November 30, 2013. |
(5) | Annualized. |
(6) | Portfolio turnover is calculated at the fund level. Percentage indicated was calculated for the year ended November 30, 2013. |
See Notes to Financial Statements.
Report of Independent Registered Public Accounting Firm |
To the Board of Directors and Shareholders of
American Century World Mutual Funds, Inc.:
We have audited the accompanying statement of assets and liabilities, including the schedule of investments, of Emerging Markets Fund (the “Fund”), one of the funds constituting American Century World Mutual Funds, Inc., as of November 30, 2013, and the related statement of operations for the year then ended, the statements of changes in net assets for each of the two years in the period then ended, and the financial highlights for each of the periods presented. These financial statements and financial highlights are the responsibility of the Fund’s management. Our responsibility is to express an opinion on these financial statements and financial highlights based on our audits.
We conducted our audits in accordance with the standards of the Public Company Accounting Oversight Board (United States). Those standards require that we plan and perform the audit to obtain reasonable assurance about whether the financial statements and financial highlights are free of material misstatement. The Fund is not required to have, nor were we engaged to perform, an audit of its internal control over financial reporting. Our audits included consideration of internal control over financial reporting as a basis for designing audit procedures that are appropriate in the circumstances, but not for the purpose of expressing an opinion on the effectiveness of the Fund’s internal control over financial reporting. Accordingly, we express no such opinion. An audit also includes examining, on a test basis, evidence supporting the amounts and disclosures in the financial statements, assessing the accounting principles used and significant estimates made by management, as well as evaluating the overall financial statement presentation. Our procedures included confirmation of securities owned as of November 30, 2013, by correspondence with the custodian and brokers; where replies were not received from brokers, we performed other auditing procedures. We believe that our audits provide a reasonable basis for our opinion.
In our opinion, the financial statements and financial highlights referred to above present fairly, in all material respects, the financial position of Emerging Markets Fund of American Century World Mutual Funds, Inc. as of November 30, 2013, the results of its operations for the year then ended, the changes in its net assets for each of the two years in the period then ended, and the financial highlights for each of the periods presented, in conformity with accounting principles generally accepted in the United States of America.
Deloitte & Touche LLP
Kansas City, Missouri
January 17, 2014
Management |
The Board of Directors
The individuals listed below serve as directors of the funds. Each director will continue to serve in this capacity until death, retirement, resignation or removal from office. The board has adopted a mandatory retirement age for directors who are not “interested persons,” as that term is defined in the Investment Company Act (independent directors). Independent directors shall retire by December 31 of the year in which they reach their 75th birthday. Mr. Pratt may serve until December 31 of the year in which he reaches his 76th birthday based on an extension granted under previous retirement guidelines.
Mr. Thomas is an “interested person” because he currently serves as President and Chief Executive Officer of American Century Companies, Inc. (ACC), the parent company of American Century Investment Management, Inc. (ACIM or the advisor). Mr. Fink is treated as an “interested person” because of his recent employment with ACC and American Century Services, LLC (ACS). The other directors (more than three-fourths of the total number) are independent. They
are not employees, directors or officers of, and have no financial interest in, ACC or any of its wholly owned, direct or indirect, subsidiaries, including ACIM, American Century Investment Services, Inc. (ACIS) and ACS, and do not have any other affiliations, positions, or relationships that would cause them to be considered “interested persons” under the Investment Company Act. The directors serve in this capacity for seven (in the case of Mr. Thomas, 15) registered investment companies in the American Century Investments family of funds.
The following table presents additional information about the directors. The mailing address for each director is 4500 Main Street, Kansas City, Missouri 64111.
Name | Position(s) Held with Funds | Length Served | Principal Occupation(s) During Past 5 Years | Number of American Century Portfolios Overseen | Other Directorships Held During Past 5 Years | |
Independent Directors | ||||||
Thomas A. Brown (1940) | Director | Since 1980 | Managing Member, Associated Investments, LLC (real estate investment company); Brown Cascade Properties, LLC (real estate investment company) (2001 to 2009) | 75 | None | |
Andrea C. Hall (1945) | Director | Since 1997 | Retired | 75 | None | |
Jan M. Lewis (1957) | Director | Since 2011 | President and Chief Executive Officer, Catholic Charities of Northeast Kansas (human services organization) | 75 | None | |
James A. Olson (1942) | Director | Since 2007 | Member, Plaza Belmont LLC (private equity fund manager) | 75 | Saia, Inc. (2002 to 2012) and EPR Properties (2003 to 2013) | |
Donald H. Pratt(1) (1937) | Director and Chairman of the Board | Since 1995 (Chairman since 2005) | Chairman and Chief Executive Officer, Western Investments, Inc. (real estate company) | 75 | None | |
Name | Position(s) Held with Funds | Length Served | Principal Occupation(s) During Past 5 Years | Number of American Century Portfolios Overseen | Other Directorships Held During Past 5 Years | |
Independent Directors | ||||||
M. Jeannine Strandjord | Director | Since 1994 | Retired | 75 | Euronet Worldwide Inc.; Charming Shoppes, Inc. (2006 to 2010); and DST Systems Inc. (1996 to 2012) | |
John R. Whitten (1946) | Director | Since 2008 | Retired | 75 | Rudolph Technologies, Inc. | |
Stephen E. Yates (1948) | Director | Since 2012 | Retired; Executive Vice President, Technology & Operations, KeyCorp. (computer services) (2004 to 2010) | 75 | Applied Industrial Technologies, Inc. (2001 to 2010) | |
Interested Directors | ||||||
Barry Fink | Director | Since 2012 | Retired; Executive Vice President, ACC (September 2007 to February 2013); President, ACS (October 2007 to February 2013); Chief Operating Officer, ACC (September 2007 to November 2012) | 75 | None | |
Jonathan S. Thomas | Director and President | Since 2007 | President and Chief Executive Officer, ACC (March 2007 to present). Also serves as Chief Executive Officer and Manager, ACS; Executive Vice President, ACIM; Director, ACC, ACIM and other ACC subsidiaries | 117 | None | |
(1) | Donald H. Pratt will retire as Director and Chairman of the Board effective December 31, 2013. |
Officers
The following table presents certain information about the executive officers of the funds. Each officer serves as an officer for each of the 15 investment companies in the American Century family of funds, unless otherwise noted. No officer is compensated for his or her service as an officer of the funds. The listed officers are interested persons of the funds and are appointed or re-appointed on an annual basis. The mailing address for each officer listed below is 4500 Main Street, Kansas City, Missouri 64111.
Name | Offices with the Funds | Principal Occupation(s) During the Past Five Years |
Jonathan S. Thomas | Director and President since 2007 | President and Chief Executive Officer, ACC (March 2007 to present). Also serves as Chief Executive Officer and Manager, ACS; Executive Vice President, ACIM; Director, ACC, ACIM and other ACC subsidiaries |
Maryanne L. Roepke | Chief Compliance Officer since 2006 and Senior Vice President since 2000 | Chief Compliance Officer, American Century funds, ACIM and ACS (August 2006 to present). Also serves as Senior Vice President, ACS |
Charles A. Etherington (1957) | General Counsel since 2007 and Senior Vice President since 2006 | Attorney, ACC (February 1994 to present); Vice President, ACC (November 2005 to present); General Counsel, ACC (March 2007 to present). Also serves as General Counsel, ACIM, ACS, ACIS and other ACC subsidiaries; and Senior Vice President, ACIM and ACS |
C. Jean Wade (1964) | Vice President, Treasurer and Chief Financial Officer since 2012 | Vice President, ACS (February 2000 to present) |
Robert J. Leach (1966) | Vice President since 2006 and Assistant Treasurer since 2012 | Vice President, ACS (February 2000 to present) |
David H. Reinmiller (1963) | Vice President since 2000 | Attorney, ACC (January 1994 to present); Associate General Counsel, ACC (January 2001 to present). Also serves as Vice President, ACIM and ACS |
Ward D. Stauffer (1960) | Secretary since 2005 | Attorney, ACC (June 2003 to present) |
The Statement of Additional Information has additional information about the fund’s directors and is available without charge, upon request, by calling 1-800-345-2021.
Approval of Management Agreement |
At a meeting held on June 20, 2013, the Fund’s Board of Directors unanimously approved the renewal of the management agreement pursuant to which American Century Investment Management, Inc. (the “Advisor”) acts as the investment advisor for the Fund. Under Section 15(c) of the Investment Company Act, contracts for investment advisory services are required to be reviewed, evaluated, and approved by a majority of a fund’s directors (the “Directors”), including a majority of the independent Directors, each year.
Prior to its consideration of the renewal of the management agreement, the Board requested and reviewed extensive data and information compiled by the Advisor and certain independent providers of evaluation data concerning the Fund and the services provided to the Fund by the Advisor. This review was in addition to the oversight and evaluation undertaken by the Board and its committees on a continuous basis throughout the year.
In connection with its consideration of the renewal of the management agreement, the Board’s review and evaluation of the services provided by the Advisor included, but was not limited to, the following:
• | the nature, extent, and quality of investment management, shareholder services, and other services provided by the Advisor to the Fund; |
• | the wide range of other programs and services the Advisor provides to the Fund and its shareholders on a routine and non-routine basis; |
• | the investment performance of the Fund, including data comparing the Fund’s performance to appropriate benchmarks and/or a peer group of other mutual funds with similar investment objectives and strategies; |
• | data comparing the cost of owning the Fund to the cost of owning similar funds; |
• | the Advisor’s compliance policies, procedures, and regulatory experience; |
• | financial data showing the cost of services provided to the Fund, the profitability of the Fund to the Advisor, and the overall profitability of the Advisor; |
• | possible economies of scale associated with the Advisor’s management of the Fund and other accounts under its management; |
• | data comparing services provided and charges to other investment management clients of the Advisor; and |
• | consideration of collateral benefits derived by the Advisor from the management of the Fund. |
In keeping with its practice, the Board held two in-person meetings and one telephonic meeting to review and discuss the information provided. The Directors also had the benefit of the advice of independent counsel throughout the period.
Factors Considered
The Directors considered all of the information provided by the Advisor, the independent data providers, and independent counsel, and evaluated such information for the Fund. In connection with their review, the Directors did not identify any single factor as being all-important or controlling, and each Director may have attributed different levels of importance to different factors. In deciding to renew the management agreement, the Board based its decision on a number of factors, including the following:
Nature, Extent and Quality of Services — Generally. Under the management agreement, the Advisor is responsible for providing or arranging for all services necessary for the operation of the Fund. The Board noted that under the management agreement, the Advisor provides or arranges at its own expense a wide variety of services including:
• | constructing and designing the Fund |
• | portfolio research and security selection |
• | initial capitalization/funding |
• | securities trading |
• | Fund administration |
• | custody of Fund assets |
• | daily valuation of the Fund’s portfolio |
• | shareholder servicing and transfer agency, including shareholder confirmations, recordkeeping, and communications |
• | legal services |
• | regulatory and portfolio compliance |
• | financial reporting |
• | marketing and distribution |
The Board noted that many of these services have expanded over time both in terms of quantity and complexity in response to shareholder demands, competition in the industry, changing distribution channels, and the changing regulatory environment.
Investment Management Services. The nature of the investment management services provided to the Fund is quite complex and allows Fund shareholders access to professional money management, instant diversification of their investments within an asset class, the opportunity to easily diversify among asset classes by investing in or exchanging among various American Century Investments funds, and liquidity. In evaluating investment performance, the Board expects the Advisor to manage the Fund in accordance with its investment objectives and approved strategies. Further, the Directors recognize that the Advisor has
an obligation to monitor trading activities, and in particular to seek the best execution of fund trades, and to evaluate the use of and payment for research. In providing these services, the Advisor utilizes teams of investment professionals (portfolio managers, analysts, research assistants, and securities traders) who require extensive information technology, research, training, compliance and other systems to conduct their business. The Board, directly and through its Fund Performance Review Committee, regularly reviews investment performance information for the Fund, together with comparative information for appropriate benchmarks and/or peer groups of similarly-managed funds, over different time horizons. The Directors also review detailed performance information during the management agreement approval process. If performance concerns are identified, the Fund receives special reviews until performance improves, during which the Board discusses with the Advisor the reasons for such results (e.g., market conditions, security selection) and any efforts being undertaken to improve performance. Taking all these factors into consideration, the Board found the investment management services provided by the Advisor to the Fund to meet or exceed industry standards. More detailed information about the Fund’s performance can be found in the Performance and Portfolio Commentary sections of this report.
Shareholder and Other Services. Under the management agreement, the Advisor provides the Fund with a comprehensive package of transfer agency, shareholder, and other services. The Board, directly and through various committees of the Board, regularly reviews reports and evaluations of such services at its regular meetings. These reports include, but are not limited to, information regarding the operational efficiency and accuracy of the shareholder and transfer agency services provided, staffing levels, shareholder satisfaction (as measured by external as well as internal sources), technology support, new products and services offered to Fund shareholders, securities trading activities, portfolio valuation services, auditing services, and legal and operational compliance activities. Certain aspects of shareholder and transfer agency service level efficiency and the quality of securities trading activities are measured by independent third party providers and are presented in comparison to other fund groups not managed by the Advisor. The Board found the services provided by the Advisor to the Fund under the management agreement to be competitive and of high quality.
Costs of Services and Profitability. The Advisor provides detailed information concerning its cost of providing various services to the Fund, its profitability in managing the Fund, its overall profitability, and its financial condition. The Directors have reviewed with the Advisor the methodology used to prepare this financial information. The financial information regarding the Advisor is considered in evaluating the Advisor’s financial condition, its ability to continue to provide services under the management agreement, and the reasonableness of the current management fee. The Board concluded that the Advisor’s profits were reasonable in light of the services provided to the Fund.
Ethics. The Board generally considers the Advisor’s commitment to providing quality services to shareholders and to conducting its business ethically. They noted that the Advisor’s practices generally meet or exceed industry best practices.
Economies of Scale. The Board also reviewed information provided by the Advisor regarding the possible existence of economies of scale in connection with the management of the Fund. The Board concluded that economies of scale are difficult to measure and predict with precision, especially on a fund-by-fund basis. The Board concluded that the Advisor is appropriately sharing economies of scale through its competitive fee structure, offering competitive fees from fund inception, and through reinvestment in its business to provide shareholders additional content and services.
Comparison to Other Funds’ Fees. The management agreement provides that the Fund pay the Advisor a single, all-inclusive (or unified) management fee for providing all services necessary for the management and operation of the Fund, other than brokerage expenses, taxes, interest, extraordinary expenses, and the fees and expenses of the Fund’s independent directors (including their independent legal counsel) and expenses incurred in connection with the provision of shareholder services and distribution services under a plan adopted pursuant to Rule 12b-1 under the 1940 Act. Under the unified fee structure, the Advisor is responsible for providing all investment advisory, custody, audit, administrative, compliance, recordkeeping, marketing and shareholder services, or arranging and supervising third parties to provide such services. By contrast, most other funds are charged a variety of fees, including an investment advisory fee, a transfer agency fee, an administrative fee, distribution charges and other expenses. Other than their investment advisory fees and any applicable Rule 12b-1 distribution fees, all other components of the total fees charged by these other funds may be increased without shareholder approval. The Board believes the unified fee structure is a benefit to Fund shareholders because it clearly discloses to shareholders the cost of owning Fund shares, and, since the unified fee cannot be increased without a vote of Fund shareholders, it shifts to the Advisor the risk of increased costs of operating the Fund and provides a direct incentive to minimize administrative inefficiencies. Part of the Board’s analysis of fee levels involves reviewing certain evaluative data compiled by an independent provider and comparing the Fund’s unified fee to the total expense ratio of other funds in the Fund’s peer group. The Board concluded that the management fee paid by the Fund to the Advisor under the management agreement is reasonable in light of the services provided to the Fund.
Comparison to Fees and Services Provided to Other Clients of the Advisor. The Board also requested and received information from the Advisor concerning the nature of the services, fees, costs and profitability of its advisory services to advisory clients other than the Fund. They observed that these varying types of client accounts require different services and involve different regulatory and entrepreneurial risks than the management of the Fund. The Board analyzed this information and concluded that the fees charged and services provided to the Fund were reasonable by comparison.
Collateral or “Fall-Out” Benefits Derived by the Advisor. The Board considered the existence of collateral benefits the Advisor may receive as a result of its relationship with the Fund. They concluded that the Advisor’s primary business is managing mutual funds and it generally does not use fund or shareholder information to generate profits in other lines of business, and therefore does not derive any significant collateral benefits from them. The Board noted that the Advisor receives proprietary research from broker-dealers that execute fund portfolio transactions and concluded that this research is likely to benefit Fund
shareholders. The Board also determined that the Advisor is able to provide investment management services to certain clients other than the Fund, at least in part, due to its existing infrastructure built to serve the fund complex. The Board concluded, however, that the assets of those other clients are not material to the analysis and, where applicable, may be included with the assets of the Fund to determine breakpoints in the management fee schedule.
Existing Relationship. The Board also considered whether there was any reason for not continuing the existing arrangement with the Advisor. In this regard, the Board was mindful of the potential disruptions of the Fund’s operations and various risks, uncertainties, and other effects that could occur as a result of a decision not to continue such relationship. In particular, the Board recognized that most shareholders have invested in the Fund on the strength of the Advisor’s industry standing and reputation and in the expectation that the Advisor will have a continuing role in providing advisory services to the Fund.
Conclusion of the Directors. As a result of this process, the Board, including all of the independent directors, taking into account all of the factors discussed above and the information provided by the Advisor and others, concluded that the management agreement between the Fund and the Advisor is fair and reasonable in light of the services provided and should be renewed.
Additional Information |
Retirement Account Information
As required by law, distributions you receive from certain IRAs are subject to federal income tax withholding, unless you elect not to have withholding apply. Tax will be withheld on the total amount withdrawn even though you may be receiving amounts that are not subject to withholding, such as nondeductible contributions. In such case, excess amounts of withholding could occur. You may adjust your withholding election so that a greater or lesser amount will be withheld.
If you don’t want us to withhold on this amount, you must notify us to not withhold the federal income tax. You may notify us in writing or in certain situations by telephone or through other electronic means. For systematic withdrawals, your withholding election will remain in effect until revoked or changed by filing a new election. You have the right to revoke your election at any time.
Remember, even if you elect not to have income tax withheld, you are liable for paying income tax on the taxable portion of your withdrawal. If you elect not to have income tax withheld or you don’t have enough income tax withheld, you may be responsible for payment of estimated tax. You may incur penalties under the estimated tax rules if your withholding and estimated tax payments are not sufficient. You can reduce or defer the income tax on a distribution by directly or indirectly rolling such distribution over to another IRA or eligible plan. You should consult your tax advisor for additional information.
State tax will be withheld if, at the time of your distribution, your address is within one of the mandatory withholding states and you have federal income tax withheld (or as otherwise required by state law). State taxes will be withheld from your distribution in accordance with the respective state rules.
Distributions you receive from 403(b), 457 and qualified plans are subject to special tax and withholding rules. Your plan administrator or plan sponsor is required to provide you with a special tax notice explaining those rules at the time you request a distribution. If applicable, federal and/or state taxes may be withheld from your distribution amount.
Proxy Voting Policies
A description of the policies that the fund’s investment advisor uses in exercising the voting rights associated with the securities purchased and/or held by the fund is available without charge, upon request, by calling 1-800-345-2021. It is also available on the “About Us” page of American Century Investments’ website at americancentury.com and on the Securities and Exchange Commission’s website at sec.gov. Information regarding how the investment advisor voted proxies relating to portfolio securities during the most recent 12-month period ended June 30 is available on the “About Us” page at americancentury.com. It is also available at sec.gov.
Quarterly Portfolio Disclosure
The fund files its complete schedule of portfolio holdings with the Securities and Exchange Commission (SEC) for the first and third quarters of each fiscal year on Form N-Q. The fund’s Forms N-Q are available on the SEC’s website at sec.gov, and may be reviewed and copied at the SEC’s Public Reference Room in Washington, DC. Information on the operation of the Public Reference Room may be obtained by calling 1-800-SEC-0330. The fund also makes its complete schedule of portfolio holdings for the most recent quarter of its fiscal year available on its website at americancentury.com and, upon request, by calling 1-800-345-2021.
Other Tax Information
The following information is provided pursuant to provisions of the Internal Revenue Code.
The fund hereby designates up to the maximum amount allowable as qualified dividend income for the fiscal year ended November 30, 2013.
For the fiscal year ended November 30, 2013, the fund intends to pass through to shareholders $865,551, or up to the maximum amount allowable, as a foreign tax credit which represents taxes paid on income derived from sources within foreign countries or possessions of the United States. During the fiscal year ended November 30, 2013, the fund earned $9,518,956 from income derived from foreign sources. Foreign source income and foreign tax expense per outstanding share on November 30, 2013 are $0.1797 and $0.0163, respectively.
![]()
Contact Us | americancentury.com |
Automated Information Line | 1-800-345-8765 |
Investor Services Representative | 1-800-345-2021 |
Investors Using Advisors | 1-800-378-9878 |
Business, Not-For-Profit, Employer-Sponsored Retirement Plans | 1-800-345-3533 |
Banks and Trust Companies, Broker-Dealers, Financial Professionals, Insurance Companies | 1-800-345-6488 |
Telecommunications Relay Service for the Deaf | 711 |
American Century World Mutual Funds, Inc.
Investment Advisor:
American Century Investment Management, Inc.
Kansas City, Missouri
This report and the statements it contains are submitted for the general information of our shareholders. The report is not authorized for distribution to prospective investors unless preceded or accompanied by an effective prospectus.
©2014 American Century Proprietary Holdings, Inc. All rights reserved.
CL-ANN-80787 1401
ANNUAL REPORT | NOVEMBER 30, 2013 |
Global Growth Fund
Table of Contents |
President’s Letter | 2 |
Market Perspective | 3 |
Performance | 4 |
Portfolio Commentary | 6 |
Fund Characteristics | 8 |
Shareholder Fee Example | 9 |
Schedule of Investments | 11 |
Statement of Assets and Liabilities | 14 |
Statement of Operations | 15 |
Statement of Changes in Net Assets | 16 |
Notes to Financial Statements | 17 |
Financial Highlights | 23 |
Report of Independent Registered Public Accounting Firm | 26 |
Management | 27 |
Approval of Management Agreement | 30 |
Additional Information | 35 |
Any opinions expressed in this report reflect those of the author as of the date of the report, and do not necessarily represent the opinions of American Century Investments® or any other person in the American Century Investments organization. Any such opinions are subject to change at any time based upon market or other conditions and American Century Investments disclaims any responsibility to update such opinions. These opinions may not be relied upon as investment advice and, because investment decisions made by American Century Investments funds are based on numerous factors, may not be relied upon as an indication of trading intent on behalf of any American Century Investments fund. Security examples are used for representational purposes only and are not intended as recommendations to purchase or sell securities. Performance information for comparative indices and securities is provided to American Century Investments by third party vendors. To the best of American Century Investments’ knowledge, such information is accurate at the time of printing.
President’s Letter |
Jonathan Thomas
Dear Investor:
Thank you for reviewing this annual report for the 12 months ended November 30, 2013. It provides investment performance, market analysis, and portfolio information, presented with the expert perspective of our portfolio management team.
Annual reports remain important vehicles for conveying information about fund returns, including key factors that affected fund performance. For additional, updated investment and market insights, we encourage you to visit our website, americancentury.com.
Monetary Policy-Driven, “Risk-On” Results in Developed Countries
Stimulative monetary policies by central banks and slowly improving global economic conditions played a major part in financial market returns during the reporting period. The combination of an improving global economic outlook, mostly low costs of capital in the money markets, and central bank purchases of longer-maturity fixed income securities (a market liquidity-building strategy known as quantitative easing, QE) helped persuade investors to seek risk and yield, particularly in developed markets such as the U.S., Japan, and Europe. Broad stock index returns were stellar in these markets, particularly at the smaller capitalization end of the company size spectrum. Representing the broad markets, the S&P 500 and MSCI EAFE Indices returned 30.30% and 24.84%, respectively, for the reporting period, and their smaller capitalization counterparts performed even better.
At the same time, hints that QE might be tapered soon in the U.S. hampered government bond returns and emerging market stock indices. Broad emerging market stock indices posted positive single-digit returns, but government bond total returns dipped into negative territory, despite low inflation. Corporate bonds, especially high-yield corporates, generally performed better than government bonds because of their higher yields, declining spreads (yield differences between corporate and similar-maturity Treasury securities), and relatively low default rates, compared with historical averages.
As we enter 2014, there’s less uncertainty about the U.S. fiscal picture and global economic strength than a year ago, but headwinds continue. A full economic recovery from 2008 remains elusive—economic growth is still subpar compared with past recoveries. In this environment, we continue to believe in a disciplined, diversified, long-term investment approach, using professionally managed stock and bond portfolios—as appropriate—for meeting financial goals. We appreciate your continued trust in us.
Sincerely,
Jonathan Thomas
President and Chief Executive Officer
American Century Investments
Market Perspective |
By Mark Kopinski, Chief Investment Officer, Global and Non-U.S. Equity
Global Stocks Rallied to Post Double-Digit Gains
Stock market performance remained robust during the 12-month period ended November 30, 2013, with most major market indices posting double-digit gains. Despite persistent concerns about weak global growth and a slowdown in China, investors largely focused on central bank stimulus measures, marginally improving U.S. and European economic data, and relatively healthy corporate earnings, which fueled stock market optimism.
Prior to the reporting period, the U.S. Federal Reserve (the Fed) announced its third quantitative easing program (QE3). This effort, combined with similar large-scale stimulus measures from the European Central Bank (ECB) and the Bank of Japan as well as favorable corporate earnings reports, generally helped keep stocks in favor. Additionally, housing market gains in the U.S., U.K., and Australia aided the global investment landscape.
Europe, Japan were Performance Leaders
Assurances by the ECB that it would keep interest rates at historic lows for an extended period, followed by the cutting of its key lending rate to 0.25% late in the period, helped drive stock market gains in Europe. In addition, economic conditions throughout Europe improved, led by an expanding manufacturing sector, improving business and consumer sentiment, and a slowdown of the economic contraction in the peripheral countries. In the second calendar quarter of 2013, the 17-member eurozone emerged from its longest-ever recession (six consecutive quarters). Investors generally focused on these positive factors, pushing stocks higher despite the structural issues and high unemployment still plaguing the region.
In Japan, the central bank’s efforts to pull the nation out of its decades-long deflationary spiral and spark economic growth appeared to be working. Japan’s economy grew, and consumer prices increased. Late in the period, government officials announced the country’s inflation rate rose at a five-year high, suggesting their deflation-focused initiatives were gaining traction.
Overall, developed market stocks sharply outperformed their emerging market counterparts. Much of the lagging performance was due to a slower-growth environment in China. In addition, rising inflation and currency weakness weighed on many developing nations.
International Equity Total Returns | ||||
For the 12 months ended November 30, 2013 (in U.S. dollars) | ||||
MSCI EAFE Index | 24.84% | MSCI Europe Index | 25.94% | |
MSCI EAFE Growth Index | 23.45% | MSCI World Index | 26.38% | |
MSCI EAFE Value Index | 26.20% | MSCI Japan Index | 32.84% | |
MSCI Emerging Markets Index | 3.66% | |||
Performance |
Total Returns as of November 30, 2013 | ||||||
Average Annual Returns | ||||||
Ticker Symbol | 1 year | 5 years | 10 years | Since Inception | Inception Date | |
Investor Class | TWGGX | 29.15% | 16.44% | 9.28% | 8.77% | 12/1/98 |
MSCI World Index | — | 26.38% | 15.26% | 7.40% | 4.51%(1) | — |
Institutional Class | AGGIX | 29.42% | 16.68% | 9.51% | 4.49% | 8/1/00 |
A Class(2) No sales charge* With sales charge* | AGGRX | 28.83% 21.41% | 16.16% 14.81% | 9.01% 8.37% | 7.81% 7.38% | 2/5/99
|
C Class | AGLCX | 27.97% | 15.31% | 8.21% | 7.28% | 3/1/02 |
R Class | AGORX | 28.51% | 15.89% | — | 7.29% | 7/29/05 |
R6 Class | AGGDX | — | — | — | 11.68%(3) | 7/26/13 |
* | Sales charges include initial sales charges and contingent deferred sales charges (CDSCs), as applicable. A Class shares have a 5.75% maximum initial sales charge and may be subject to a maximum CDSC of 1.00%. C Class shares redeemed within 12 months of purchase are subject to a maximum CDSC of 1.00%. The SEC requires that mutual funds provide performance information net of maximum sales charges in all cases where charges could be applied. |
(1) | Since 11/30/98, the date nearest the Investor Class’s inception for which data are available. |
(2) | Prior to September 4, 2007, the A Class was referred to as the Advisor Class and did not have a front-end sales charge. Performance prior to that date has been adjusted to reflect this charge. |
(3) | Total returns for periods less than one year are not annualized. |
Data presented reflect past performance. Past performance is no guarantee of future results. Current performance may be higher or lower than the performance shown. Investment return and principal value will fluctuate, and redemption value may be more or less than original cost. To obtain performance data current to the most recent month end, please call 1-800-345-2021 or visit americancentury.com. International investing involves special risks, such as political instability and currency fluctuations. Investing in emerging markets may accentuate these risks.
Unless otherwise indicated, performance reflects Investor Class shares; performance for other share classes will vary due to differences in fee structure. For information about other share classes available, please consult the prospectus. Data assumes reinvestment of dividends and capital gains, and none of the charts reflect the deduction of taxes that a shareholder would pay on fund distributions or the redemption of fund shares. Returns for the index are provided for comparison. The fund’s total returns include operating expenses (such as transaction costs and management fees) that reduce returns, while the total returns of the index do not.
Growth of $10,000 Over 10 Years |
$10,000 investment made November 30, 2003 |
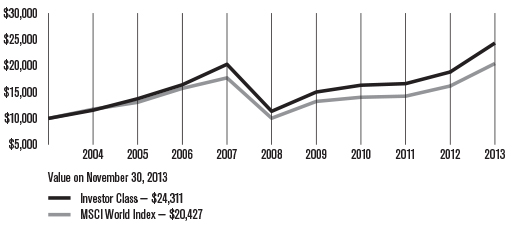
Total Annual Fund Operating Expenses | |||||
Investor Class | Institutional Class | A Class | C Class | R Class | R6 Class |
1.10% | 0.90% | 1.35% | 2.10% | 1.60% | 0.75% |
The total annual fund operating expenses shown is as stated in the fund’s prospectus current as of the date of this report. The prospectus may vary from the expense ratio shown elsewhere in this report because it is based on a different time period, includes acquired fund fees and expenses, and, if applicable, does not include fee waivers or expense reimbursements.
Data presented reflect past performance. Past performance is no guarantee of future results. Current performance may be higher or lower than the performance shown. Investment return and principal value will fluctuate, and redemption value may be more or less than original cost. To obtain performance data current to the most recent month end, please call 1-800-345-2021 or visit americancentury.com. International investing involves special risks, such as political instability and currency fluctuations. Investing in emerging markets may accentuate these risks.
Unless otherwise indicated, performance reflects Investor Class shares; performance for other share classes will vary due to differences in fee structure. For information about other share classes available, please consult the prospectus. Data assumes reinvestment of dividends and capital gains, and none of the charts reflect the deduction of taxes that a shareholder would pay on fund distributions or the redemption of fund shares. Returns for the index are provided for comparison. The fund’s total returns include operating expenses (such as transaction costs and management fees) that reduce returns, while the total returns of the index do not.
Portfolio Commentary |
Portfolio Managers: Keith Creveling and Brent Puff
Performance Summary
Global Growth returned 29.15%* for the 12 months ended November 30, 2013, compared with its benchmark, the MSCI World Index, which returned 26.38%.
Global equity markets posted robust returns during the 12-month period, despite ongoing weakness in global economic recovery. Continued stimulus by central banks around the world, combined with improving economic and corporate data, led most markets to finish the period with double-digit gains. Developed markets largely outperformed emerging markets, and small- and mid-cap stocks generally outpaced large-cap holdings. Meanwhile, global stocks in the growth style slightly underperformed global value stocks.
Overall, strong stock selection in the United States and Canada contributed favorably to the portfolio’s performance. Stock selection in Italy as well as positioning in emerging markets, particularly in Brazil, were detrimental to the portfolio’s relative results. Among sectors, security selection and positioning in consumer discretionary holdings drove outperformance. Stock choices in the industrials sector also contributed favorably to results. Conversely, holdings in the information technology and financials sectors were among the top relative detractors.
Internet Holdings Lead Contributors
The portfolio’s overweight positions in several internet retailers led the consumer discretionary sector to be among the top contributors to relative performance. U.S.-based online travel site priceline.com helped to bolster results as the company’s stock climbed steadily over the 12-month period, driven by increases in European penetration and market share gains from its Booking.com unit. The company’s earnings and revenues consistently surprised on the upside, further boosting its stock price. Japan-based internet shopping site Rakuten also added to relative gains, appreciating over 80% during the period as the company’s core online commerce site continued to deliver strong revenue trends.
Elsewhere in Japan, an overweight position in financial services group ORIX was another key relative contributor, benefiting from the gradual but steady improvement in Japan’s economy. The company’s share price also received a boost following its acquisition of Netherlands-based asset management company Robeco, which is expected to increase its global reach.
Among industrials holdings, B/E Aerospace, a U.S.-based manufacturer of cabin interiors for the commercial aviation industry, was a top contributor. The company benefited from increasing aircraft production by airliner manufacturers as commercial air carriers began to update aging fleets.
* All fund returns referenced in this commentary are for Investor Class shares.
Technology Companies Main Detractors
Technology sector holdings were among the main relative detractors during the period. Prominent individual detractors included U.S.-based personal technology developer Apple, whose stock appreciated as the company negotiated a distribution deal with China Mobile. Although not holding Apple for most of the fiscal year was detrimental to returns, we stand by our decision. We believe that the trajectory of its growth rate has started to decelerate and will level off, putting margins under pressure. Therefore, it does not meet our earnings acceleration criteria.
An overweight position in U.S.-based Equinix, a data center operator, was also among the portfolio’s top detractors. The company’s stock declined in reaction to a rival’s announcement of lower-than-expected quarterly profits and lowered guidance for fiscal 2013. We believe that the market reaction to these events was overdone, and that the company, whose fundamentals remain strong, is positioned to continue to grow its revenues and profits.
U.S.-based data warehousing and cloud computing provider Teradata also saw weak relative performance. We sold the holding after management warned that disappointing demand, particularly in Asia, Africa, and the Middle East, would negatively impact the company’s earnings outlook. Elsewhere, underperformance of Italian holdings was attributed primarily to oilfield services company Saipem, which tumbled after its new management team dramatically cut 2013 earnings expectations. Consequently, we exited the portfolio’s position in the holding.
Outlook
We continue to adhere to our strict bottom-up stock picking process while remaining aware of the macroeconomic environment. As global economies continue to show modest signs of recovery, the portfolio maintains an overweight position in the U.S., where growth and employment trends have seen steady improvements. We maintain an underweight to Japan, where we continue to focus on opportunities in companies that we believe can benefit from a weakening yen, while closely monitoring the government’s stimulative economic policies to determine if these trends are sustainable. We are likewise underweight in Europe as we monitor the strength of the region’s economic recovery, relative to that of the U.S.
We remain focused on companies that we believe are likely to achieve higher margins via accelerating revenue growth and cost savings. We continue to invest in businesses that we believe will be beneficiaries of durable, long-lasting trends that will persist regardless of the macroeconomic backdrop. From a sector perspective, we believe that holdings in the consumer discretionary, information technology, and industrials sectors appear poised to benefit from increased global growth, which is reflected in the portfolio’s overweight positioning relative to the benchmark. Conversely, we see fewer opportunities in financials and telecommunication services leading to underweight positions, relative to the benchmark, in those sectors.
Fund Characteristics |
NOVEMBER 30, 2013 | |
Top Ten Holdings | % of net assets |
Google, Inc., Class A | 3.1% |
priceline.com, Inc. | 2.2% |
Precision Castparts Corp. | 1.9% |
Facebook, Inc., Class A | 1.8% |
Home Depot, Inc. (The) | 1.8% |
Monsanto Co. | 1.7% |
Roche Holding AG | 1.7% |
IntercontinentalExchange Group, Inc. | 1.6% |
FedEx Corp. | 1.5% |
Toyota Motor Corp. | 1.4% |
Types of Investments in Portfolio | % of net assets |
Domestic Common Stocks | 59.2% |
Foreign Common Stocks | 38.1% |
Total Common Stocks | 97.3% |
Temporary Cash Investments | 3.8% |
Other Assets and Liabilities | (1.1)% |
Investments by Country | % of net assets |
United States | 59.2% |
United Kingdom | 8.0% |
Japan | 7.1% |
Switzerland | 3.3% |
France | 2.9% |
Hong Kong | 2.4% |
Sweden | 2.2% |
Netherlands | 2.1% |
Other Countries | 10.1% |
Cash and Equivalents* | 2.7% |
* Includes temporary cash investments and other assets and liabilities.
Shareholder Fee Example |
Fund shareholders may incur two types of costs: (1) transaction costs, including sales charges (loads) on purchase payments and redemption/exchange fees; and (2) ongoing costs, including management fees; distribution and service (12b-1) fees; and other fund expenses. This example is intended to help you understand your ongoing costs (in dollars) of investing in your fund and to compare these costs with the ongoing cost of investing in other mutual funds.
The example is based on an investment of $1,000 made at the beginning of the period and held for the entire period from June 1, 2013 to November 30, 2013 (except as noted).
Actual Expenses
The table provides information about actual account values and actual expenses for each class. You may use the information, together with the amount you invested, to estimate the expenses that you paid over the period. First, identify the share class you own. Then simply divide your account value by $1,000 (for example, an $8,600 account value divided by $1,000 = 8.6), then multiply the result by the number under the heading “Expenses Paid During Period” to estimate the expenses you paid on your account during this period.
If you hold Investor Class shares of any American Century Investments fund, or Institutional Class shares of the American Century Diversified Bond Fund, in an American Century Investments account (i.e., not a financial intermediary or retirement plan account), American Century Investments may charge you a $12.50 semiannual account maintenance fee if the value of those shares is less than $10,000. We will redeem shares automatically in one of your accounts to pay the $12.50 fee. In determining your total eligible investment amount, we will include your investments in all personal accounts (including American Century Investments Brokerage accounts) registered under your Social Security number. Personal accounts include individual accounts, joint accounts, UGMA/UTMA accounts, personal trusts, Coverdell Education Savings Accounts and IRAs (including traditional, Roth, Rollover, SEP-, SARSEP- and SIMPLE-IRAs), and certain other retirement accounts. If you have only business, business retirement, employer-sponsored or American Century Investments Brokerage accounts, you are currently not subject to this fee. If you are subject to the Account Maintenance Fee, your account value could be reduced by the fee amount.
Hypothetical Example for Comparison Purposes
The table also provides information about hypothetical account values and hypothetical expenses based on the actual expense ratio of each class of your fund and an assumed rate of return of 5% per year before expenses, which is not the actual return of a fund’s share class. The hypothetical account values and expenses may not be used to estimate the actual ending account balance or expenses you paid for the period. You may use this information to compare the ongoing costs of investing in your fund and other funds. To do so, compare this 5% hypothetical example with the 5% hypothetical examples that appear in the shareholder reports of the other funds.
Please note that the expenses shown in the table are meant to highlight your ongoing costs only and do not reflect any transactional costs, such as sales charges (loads) or redemption/exchange fees. Therefore, the table is useful in comparing ongoing costs only, and will not help you determine the relative total costs of owning different funds. In addition, if these transactional costs were included, your costs would have been higher.
Beginning 6/1/13 | Ending 11/30/13 | Expenses Paid During Period(1) 6/1/13 – 11/30/13 | Annualized | |
Actual | ||||
Investor Class | $1,000 | $1,155.80 | $5.89 | 1.09% |
Institutional Class | $1,000 | $1,157.10 | $4.81 | 0.89% |
A Class | $1,000 | $1,154.10 | $7.24 | 1.34% |
C Class | $1,000 | $1,149.50 | $11.26 | 2.09% |
R Class | $1,000 | $1,152.50 | $8.58 | 1.59% |
R6 Class | $1,000 | $1,116.80(2) | $2.75(3) | 0.74% |
Hypothetical | ||||
Investor Class | $1,000 | $1,019.60 | $5.52 | 1.09% |
Institutional Class | $1,000 | $1,020.61 | $4.51 | 0.89% |
A Class | $1,000 | $1,018.35 | $6.78 | 1.34% |
C Class | $1,000 | $1,014.59 | $10.56 | 2.09% |
R Class | $1,000 | $1,017.10 | $8.04 | 1.59% |
R6 Class | $1,000 | $1,021.36(4) | $3.75(4) | 0.74% |
(1) | Expenses are equal to the class’s annualized expense ratio listed in the table above, multiplied by the average account value over the period, multiplied by 183, the number of days in the most recent fiscal half-year, divided by 365, to reflect the one-half year period. |
(2) | Ending account value based on actual return from July 26, 2013 (commencement of sale) through November 30, 2013. |
(3) | Expenses are equal to the class’s annualized expense ratio listed in the table above, multiplied by the average account value over the period, multiplied by 128, the number of days in the period from July 26, 2013 (commencement of sale) through November 30, 2013, divided by 365, to reflect the period. Had the class been available for the full period, the expenses paid during the period would have been higher. |
(4) | Ending account value and expenses paid during the period assumes the class had been available throughout the entire period and are calculated using the class’s annualized expense ratio listed in the table above. |
Schedule of Investments |
NOVEMBER 30, 2013
Shares | Value | |
Common Stocks — 97.3% | ||
AUSTRALIA — 0.6% | ||
CSL Ltd. | 51,783 | $ 3,239,622 |
AUSTRIA — 0.7% | ||
Erste Group Bank AG | 118,110 | 4,158,243 |
BRAZIL — 0.9% | ||
Itau Unibanco Holding SA ADR | 384,170 | 5,405,272 |
CANADA — 1.3% | ||
Canadian Pacific Railway Ltd. | 48,900 | 7,450,399 |
CHINA — 1.1% | ||
Ctrip.com International Ltd. ADR(1) | 32,140 | 1,535,649 |
ENN Energy Holdings Ltd. | 684,000 | 4,817,306 |
6,352,955 | ||
DENMARK — 1.7% | ||
Novo Nordisk A/S B Shares | 30,144 | 5,400,409 |
Pandora A/S | 83,567 | 4,335,370 |
9,735,779 | ||
FRANCE — 2.9% | ||
Carrefour SA | 189,420 | 7,453,843 |
Rexel SA | 148,260 | 3,758,158 |
Sanofi | 52,471 | 5,549,808 |
16,761,809 | ||
HONG KONG — 2.4% | ||
BOC Hong Kong Holdings Ltd. | 446,000 | 1,507,272 |
Hang Seng Bank Ltd. | 276,200 | 4,506,814 |
Sands China Ltd. | 1,062,000 | 8,034,298 |
14,048,384 | ||
INDIA — 0.5% | ||
Tata Motors Ltd. ADR | 90,074 | 2,924,703 |
ITALY — 0.6% | ||
Prada SpA | 331,900 | 3,204,457 |
JAPAN — 7.1% | ||
Daikin Industries Ltd. | 101,800 | 6,459,076 |
Keyence Corp. | 13,800 | 5,543,170 |
ORIX Corp. | 394,900 | 7,189,111 |
Rakuten, Inc. | 436,583 | 6,707,810 |
Toyota Motor Corp. | 132,800 | 8,270,428 |
Unicharm Corp. | 111,400 | 7,046,435 |
41,216,030 | ||
NETHERLANDS — 2.1% | ||
ASML Holding NV | 43,949 | 4,113,969 |
ASML Holding NV New York Shares | 45,734 | 4,270,641 |
Koninklijke DSM NV | 47,040 | 3,692,542 |
12,077,152 | ||
PERU — 0.6% | ||
Credicorp Ltd. | 26,024 | 3,344,084 |
RUSSIA — 1.2% | ||
Magnit OJSC GDR | 64,080 | 4,222,872 |
Sberbank of Russia ADR | 220,491 | 2,747,318 |
6,970,190 | ||
SPAIN — 0.9% | ||
Grifols SA | 112,953 | 5,165,391 |
SWEDEN — 2.2% | ||
SKF AB B Shares | 244,564 | 6,670,249 |
Svenska Cellulosa AB B Shares | 217,231 | 6,342,052 |
13,012,301 | ||
SWITZERLAND — 3.3% | ||
Adecco SA | 74,572 | 5,742,636 |
Roche Holding AG | 36,241 | 10,103,818 |
Syngenta AG | 8,791 | 3,452,776 |
19,299,230 | ||
UNITED KINGDOM — 8.0% | ||
BG Group plc | 377,147 | 7,704,812 |
Capita Group plc (The) | 373,133 | 6,087,257 |
Compass Group plc | 241,170 | 3,634,509 |
Johnson Matthey plc | 108,600 | 5,633,158 |
Lloyds Banking Group plc(1) | 6,493,021 | 8,223,385 |
Rio Tinto plc | 75,387 | 4,023,247 |
Standard Chartered plc | 228,286 | 5,410,789 |
Whitbread plc | 95,600 | 5,579,867 |
46,297,024 | ||
UNITED STATES — 59.2% | ||
Alexion Pharmaceuticals, Inc.(1) | 22,534 | 2,805,483 |
Alliance Data Systems Corp.(1) | 21,332 | 5,167,890 |
American Tower Corp. | 101,730 | 7,911,542 |
B/E Aerospace, Inc.(1) | 86,590 | 7,533,330 |
Berkshire Hathaway, Inc., Class B(1) | 59,040 | 6,879,931 |
Biogen Idec, Inc.(1) | 23,766 | 6,915,193 |
BorgWarner, Inc. | 57,311 | 6,142,020 |
Shares | Value |
Celgene Corp.(1) | 37,119 | $ 6,004,741 |
Cerner Corp.(1) | 95,396 | 5,482,408 |
Charles Schwab Corp. (The) | 263,834 | 6,458,656 |
CIT Group, Inc. | 143,291 | 7,233,330 |
Cognizant Technology Solutions Corp., Class A(1) | 74,920 | 7,034,239 |
Colgate-Palmolive Co. | 102,996 | 6,778,167 |
Continental Resources, Inc.(1) | 60,564 | 6,511,236 |
Costco Wholesale Corp. | 50,957 | 6,391,536 |
eBay, Inc.(1) | 129,992 | 6,567,196 |
EQT Corp. | 72,610 | 6,179,837 |
Equinix, Inc.(1) | 30,989 | 4,979,932 |
Estee Lauder Cos., Inc. (The), Class A | 84,145 | 6,307,509 |
Facebook, Inc., Class A(1) | 227,021 | 10,672,257 |
FedEx Corp. | 64,281 | 8,915,775 |
Fortune Brands Home & Security, Inc. | 132,146 | 5,761,566 |
Gilead Sciences, Inc.(1) | 98,300 | 7,353,823 |
Google, Inc., Class A(1) | 17,235 | 18,262,034 |
Halliburton Co. | 140,730 | 7,413,656 |
Harley-Davidson, Inc. | 88,491 | 5,930,667 |
Home Depot, Inc. (The) | 130,224 | 10,505,170 |
Ingersoll-Rand plc | 90,240 | 6,444,941 |
IntercontinentalExchange Group, Inc.(1) | 44,145 | 9,415,687 |
Liberty Global plc Class A(1) | 89,510 | 7,680,853 |
MasterCard, Inc., Class A | 10,199 | 7,759,501 |
Michael Kors Holdings Ltd.(1) | 92,583 | 7,550,144 |
Mondelez International, Inc. Class A | 219,000 | 7,343,070 |
Monsanto Co. | 89,481 | 10,140,882 |
Oceaneering International, Inc. | 91,410 | 7,055,938 |
Pentair Ltd. | 39,140 | 2,767,981 |
Precision Castparts Corp. | 41,556 | 10,740,148 |
priceline.com, Inc.(1) | 10,660 | 12,710,238 |
Realogy Holdings Corp.(1) | 163,140 | 7,731,204 |
Schlumberger Ltd. | 90,044 | 7,961,690 |
Starbucks Corp. | 57,713 | 4,701,301 |
Towers Watson & Co., Class A | 31,480 | 3,544,648 |
Tractor Supply Co. | 81,153 | 5,941,211 |
Twenty-First Century Fox, Inc. | 168,420 | 5,640,386 |
Union Pacific Corp. | 35,536 | 5,758,253 |
United Rentals, Inc.(1) | 85,012 | 5,842,875 |
Visa, Inc., Class A | 35,463 | 7,215,302 |
Zoetis, Inc. | 180,900 | 5,635,035 |
343,680,412 | ||
TOTAL COMMON STOCKS (Cost $391,118,173) | 564,343,437 | |
Temporary Cash Investments — 3.8% | ||
Repurchase Agreement, Bank of America Merrill Lynch, (collateralized by various U.S. Treasury obligations, 0.375%, 6/30/15, valued at $3,510,257), in a joint trading account at 0.06%, dated 11/29/13, due 12/2/13 (Delivery value $3,439,748) | 3,439,731 | |
Repurchase Agreement, Credit Suisse First Boston, Inc., (collateralized by various U.S. Treasury obligations, 2.75%, 11/15/42, valued at $4,197,884), in a joint trading account at 0.03%, dated 11/29/13, due 12/2/13 (Delivery value $4,127,687) | 4,127,677 | |
Repurchase Agreement, Goldman Sachs & Co., (collateralized by various U.S. Treasury obligations, 0.00%, 5/29/14, valued at $3,511,899), in a joint trading account at 0.04%, dated 11/29/13, due 12/2/13 (Delivery value $3,443,126) | 3,443,115 | |
SSgA U.S. Government Money Market Fund | 10,988,863 | 10,988,863 |
TOTAL TEMPORARY CASH INVESTMENTS (Cost $21,999,386) | 21,999,386 | |
TOTAL INVESTMENT SECURITIES — 101.1% (Cost $413,117,559) | 586,342,823 | |
OTHER ASSETS AND LIABILITIES — (1.1)% | (6,291,948) | |
TOTAL NET ASSETS — 100.0% | $580,050,875 | |
Market Sector Diversification | |
(as a % of net assets) | |
Consumer Discretionary | 19.3% |
Industrials | 16.1% |
Financials | 15.0% |
Information Technology | 14.9% |
Health Care | 10.1% |
Consumer Staples | 7.9% |
Energy | 7.4% |
Materials | 5.8% |
Utilities | 0.8% |
Cash and Equivalents* | 2.7% |
* Includes temporary cash investments and other assets and liabilities.
Notes to Schedule of Investments
ADR = American Depositary Receipt
GDR = Global Depositary Receipt
OJSC = Open Joint Stock Company
(1) | Non-income producing. |
See Notes to Financial Statements.
Statement of Assets and Liabilities |
NOVEMBER 30, 2013 | ||
Assets | ||
Investment securities, at value (cost of $413,117,559) | $586,342,823 | |
Foreign currency holdings, at value (cost of $119,075) | 117,146 | |
Receivable for investments sold | 5,527,532 | |
Receivable for capital shares sold | 701,724 | |
Dividends and interest receivable | 714,561 | |
Other assets | 16,572 | |
| 593,420,358 | ||
Liabilities | ||
Disbursements in excess of demand deposit cash | 10,983,754 | |
Payable for investments purchased | 1,787,015 | |
Payable for capital shares redeemed | 101,429 | |
Accrued management fees | 480,775 | |
Distribution and service fees payable | 16,510 | |
| 13,369,483 | ||
Net Assets | $580,050,875 | |
Net Assets Consist of: | ||
Capital (par value and paid-in surplus) | $395,921,572 | |
Distributions in excess of net investment income | (913,005 | ) |
Undistributed net realized gain | 11,787,918 | |
Net unrealized appreciation | 173,254,390 | |
| $580,050,875 | ||
Net assets | Shares outstanding | Net asset value per share | |
Investor Class, $0.01 Par Value | $437,599,455 | 35,308,523 | $12.39 |
Institutional Class, $0.01 Par Value | $80,967,739 | 6,467,541 | $12.52 |
A Class, $0.01 Par Value | $51,351,310 | 4,205,659 | $12.21* |
C Class, $0.01 Par Value | $5,615,114 | 496,922 | $11.30 |
R Class, $0.01 Par Value | $4,489,347 | 368,734 | $12.18 |
R6 Class, $0.01 Par Value | $27,910 | 2,228 | $12.53 |
* Maximum offering price $12.95 (net asset value divided by 0.9425).
See Notes to Financial Statements.
Statement of Operations |
YEAR ENDED NOVEMBER 30, 2013 | ||
Investment Income (Loss) | ||
Income: | ||
Dividends (net of foreign taxes withheld of $357,364) | $6,033,091 | |
Interest | 2,002 | |
| 6,035,093 | ||
Expenses: | ||
Management fees | 5,343,935 | |
Distribution and service fees: | ||
A Class | 105,875 | |
C Class | 46,239 | |
R Class | 18,091 | |
Directors’ fees and expenses | 19,193 | |
Other expenses | 3,538 | |
| 5,536,871 | ||
Net investment income (loss) | 498,222 | |
Realized and Unrealized Gain (Loss) | ||
Net realized gain (loss) on: | ||
Investment transactions (net of foreign tax expenses paid (refunded) of $(588)) | 56,771,265 | |
Foreign currency transactions | (62,842 | ) |
| 56,708,423 | ||
Change in net unrealized appreciation (depreciation) on: | ||
Investments | 71,715,122 | |
Translation of assets and liabilities in foreign currencies | (208 | ) |
| 71,714,914 | ||
Net realized and unrealized gain (loss) | 128,423,337 | |
Net Increase (Decrease) in Net Assets Resulting from Operations | $128,921,559 | |
See Notes to Financial Statements.
Statement of Changes in Net Assets |
YEARS ENDED NOVEMBER 30, 2013 AND NOVEMBER 30, 2012 | ||||||
Increase (Decrease) in Net Assets | November 30, 2013 | November 30, 2012 | ||||
Operations | ||||||
Net investment income (loss) | $498,222 | $1,144,672 | ||||
Net realized gain (loss) | 56,708,423 | 18,739,607 | ||||
Change in net unrealized appreciation (depreciation) | 71,714,914 | 32,933,266 | ||||
Net increase (decrease) in net assets resulting from operations | 128,921,559 | 52,817,545 | ||||
Distributions to Shareholders | ||||||
From net investment income: | ||||||
Investor Class | (1,492,644 | ) | (1,027,964 | ) | ||
Institutional Class | (273,982 | ) | (195,280 | ) | ||
A Class | (52,005 | ) | (13,556 | ) | ||
Decrease in net assets from distributions | (1,818,631 | ) | (1,236,800 | ) | ||
Capital Share Transactions | ||||||
Net increase (decrease) in net assets from capital share transactions | (7,786,769 | ) | 19,357,020 | |||
Redemption Fees | ||||||
Increase in net assets from redemption fees | 21,725 | 10,829 | ||||
Net increase (decrease) in net assets | 119,337,884 | 70,948,594 | ||||
Net Assets | ||||||
Beginning of period | 460,712,991 | 389,764,397 | ||||
End of period | $580,050,875 | $460,712,991 | ||||
Undistributed (distributions in excess of) net investment income | $(913,005 | ) | $124,526 | |||
See Notes to Financial Statements.
Notes to Financial Statements |
NOVEMBER 30, 2013
1. Organization
American Century World Mutual Funds, Inc. (the corporation) is registered under the Investment Company Act of 1940, as amended (the 1940 Act), as an open-end management investment company and is organized as a Maryland corporation. Global Growth Fund (the fund) is one fund in a series issued by the corporation. The fund is diversified as defined under the 1940 Act. The fund’s investment objective is to seek capital growth.
The fund offers the Investor Class, the Institutional Class, the A Class, the C Class, the R Class and the R6 Class. The A Class may incur an initial sales charge. The A Class and C Class may be subject to a contingent deferred sales charge. The share classes differ principally in their respective sales charges and distribution and shareholder servicing expenses and arrangements. The Institutional Class and R6 Class shareholders do not require the same level of shareholder and administrative services from American Century Investment Management, Inc. (ACIM) (the investment advisor) as shareholders of other classes. In addition, financial intermediaries do not receive any service, distribution or administrative fees for the R6 Class. As a result, the Institutional Class and R6 Class are charged lower unified management fees. Sale of the R6 Class commenced on July 26, 2013.
2. Significant Accounting Policies
The following is a summary of significant accounting policies consistently followed by the fund in preparation of its financial statements. The financial statements are prepared in conformity with accounting principles generally accepted in the United States of America, which may require management to make certain estimates and assumptions at the date of the financial statements. Actual results could differ from these estimates.
Investment Valuations — The fund determines the fair value of its investments and computes its net asset value per share at the close of regular trading (usually 4 p.m. Eastern time) on the New York Stock Exchange (NYSE) on each day the NYSE is open. The Board of Directors has adopted valuation policies and procedures to guide the investment advisor in the fund’s investment valuation process and to provide methodologies for the oversight of the fund’s pricing function.
Equity securities that are listed or traded on a domestic securities exchange are valued at the last reported sales price or at the official closing price as provided by the exchange. Equity securities traded on foreign securities exchanges are generally valued at the closing price of such securities on the exchange where primarily traded or at the close of the NYSE, if that is earlier. If no last sales price is reported, or if local convention or regulation so provides, the mean of the latest bid and asked prices may be used. Securities traded over-the-counter are valued at the mean of the latest bid and asked prices, the last sales price, or the official closing price. Equity securities initially expressed in local currencies are translated into U.S. dollars at the mean of the appropriate currency exchange rate at the close of the NYSE as provided by an independent pricing service.
Fixed income securities maturing within 60 days at the time of purchase may be valued at cost, plus or minus any amortized discount or premium or at the evaluated mean as provided by an independent pricing service. Evaluated mean prices are commonly derived through utilization of market models, which may consider, among other factors: trade data, quotations from dealers and active market makers, relevant yield curve and spread data, related sector levels, creditworthiness, trade data or market information on comparable securities, and other relevant security specific information.
Open-end management investment companies are valued at the reported net asset value per share. Repurchase agreements are valued at cost, which approximates fair value.
If the fund determines that the market price for an investment is not readily available or the valuation methods mentioned above do not reflect an investment’s fair value, such investment is valued as determined in good faith by the Board of Directors or its delegate, in accordance with policies and procedures adopted by the Board of Directors. In its
determination of fair value, the fund may review several factors including, but not limited to, market information regarding the specific investment or comparable investments and correlation with other investment types, futures indices or general market indicators. Circumstances that may cause the fund to use these procedures to value an investment include, but are not limited to: an investment has been declared in default or is distressed; trading in a security has been suspended during the trading day or a security is not actively trading on its principal exchange; prices received from a regular pricing source are deemed unreliable; or there is a foreign market holiday and no trading occurred.
The fund monitors for significant events occurring after the close of an investment’s primary exchange but before the fund’s net asset value per share is determined. Significant events may include, but are not limited to: corporate announcements and transactions; governmental action and political unrest that could impact a specific investment or an investment sector; or armed conflicts, natural disasters and similar events that could affect investments in a specific country or region. The fund also monitors for significant fluctuations in domestic and foreign markets, as evidenced by the U.S. market or such other indicators that the Board of Directors, or its delegate, deems appropriate. If significant fluctuations in foreign markets are identified, the fund may apply a model-derived factor to the closing price of equity securities traded on foreign securities exchanges. The factor is based on observable market data as provided by an independent pricing service.
Security Transactions — Security transactions are accounted for as of the trade date. Net realized gains and losses are determined on the identified cost basis, which is also used for federal income tax purposes. Certain countries impose taxes on realized gains on the sale of securities registered in their country. The fund records the foreign tax expense, if any, on an accrual basis. The foreign tax expense on realized gains and unrealized appreciation reduces the net realized gain (loss) on investment transactions and net unrealized appreciation (depreciation) on investments, respectively.
Investment Income — Dividend income less foreign taxes withheld, if any, is recorded as of the ex-dividend date. Distributions received on securities that represent a return of capital or long-term capital gain are recorded as a reduction of cost of investments and/or as a realized gain. The fund may estimate the components of distributions received that may be considered nontaxable distributions or long-term capital gain distributions for income tax purposes. Interest income is recorded on the accrual basis and includes accretion of discounts and amortization of premiums.
Foreign Currency Translations — All assets and liabilities initially expressed in foreign currencies are translated into U.S. dollars at prevailing exchange rates at period end. The fund may enter into spot foreign currency exchange contracts to facilitate transactions denominated in a foreign currency. Purchases and sales of investment securities, dividend and interest income, spot foreign currency exchange contracts, and expenses are translated at the rates of exchange prevailing on the respective dates of such transactions. Net realized and unrealized foreign currency exchange gains or losses related to investment securities are a component of net realized gain (loss) on investment transactions and change in net unrealized appreciation (depreciation) on investments, respectively.
Repurchase Agreements — The fund may enter into repurchase agreements with institutions that ACIM has determined are creditworthy pursuant to criteria adopted by the Board of Directors. The fund requires that the collateral, represented by securities, received in a repurchase transaction be transferred to the custodian in a manner sufficient to enable the fund to obtain those securities in the event of a default under the repurchase agreement. ACIM monitors, on a daily basis, the securities transferred to ensure the value, including accrued interest, of the securities under each repurchase agreement is equal to or greater than amounts owed to the fund under each repurchase agreement.
Joint Trading Account — Pursuant to an Exemptive Order issued by the Securities and Exchange Commission, the fund, along with certain other funds in the American Century Investments family of funds, may transfer uninvested cash balances into a joint trading account. These balances are invested in one or more repurchase agreements that are collateralized by U.S. Treasury or Agency obligations.
Income Tax Status — It is the fund’s policy to distribute substantially all net investment income and net realized gains to shareholders and to otherwise qualify as a regulated investment company under provisions of the Internal Revenue Code. Accordingly, no provision has been made for income taxes. The fund files U.S. federal, state, local and non-U.S. tax returns as applicable. The fund’s tax returns are subject to examination by the relevant taxing authority until expiration of the applicable statute of limitations, which is generally three years from the date of filing but can be longer in certain jurisdictions. At this time, management believes there are no uncertain tax positions which, based on their technical merit, would not be sustained upon examination and for which it is reasonably possible that the total amounts of unrecognized tax benefits will significantly change in the next twelve months.
Multiple Class — All shares of the fund represent an equal pro rata interest in the net assets of the class to which such shares belong, and have identical voting, dividend, liquidation and other rights and the same terms and conditions, except for class specific expenses and exclusive rights to vote on matters affecting only individual classes. Income, non-class specific expenses, and realized and unrealized capital gains and losses of the fund are allocated to each class of shares based on their relative net assets.
Distributions to Shareholders — Distributions from net investment income and net realized gains, if any, are generally declared and paid annually. The fund may make distributions on a more frequent basis to comply with the distribution requirements of the Internal Revenue Code, in all events in a manner consistent with provisions of the 1940 Act.
Redemption — The fund may impose a 2.00% redemption fee on shares held less than 60 days. The fee may not be applicable to all classes. The redemption fee is retained by the fund and helps cover transaction costs that long-term investors may bear when the fund sells securities to meet investor redemptions.
Indemnifications — Under the corporation’s organizational documents, its officers and directors are indemnified against certain liabilities arising out of the performance of their duties to the fund. In addition, in the normal course of business, the fund enters into contracts that provide general indemnifications. The maximum exposure under these arrangements is unknown as this would involve future claims that may be made against a fund. The risk of material loss from such claims is considered by management to be remote.
3. Fees and Transactions with Related Parties
Management Fees — The corporation has entered into a management agreement with ACIM, under which ACIM provides the fund with investment advisory and management services in exchange for a single, unified management fee (the fee) per class. The agreement provides that all expenses of managing and operating the fund, except distribution and service fees, brokerage expenses, taxes, interest, fees and expenses of the independent directors (including legal counsel fees), and extraordinary expenses, will be paid by ACIM. The fee is computed and accrued daily based on each class’s daily net assets and paid monthly in arrears. The rate of the fee is determined by applying a fee rate calculation formula. This formula takes into account the fund’s assets as well as certain assets, if any, of other clients of the investment advisor outside the American Century Investments family of funds (such as subadvised funds and separate accounts) that have very similar investment teams and investment strategies (strategy assets). The annual management fee schedule ranges from 1.050% to 1.300% for the Investor Class, A Class, C Class and R Class. The annual management fee schedule ranges from 0.850% to 1.100% for the Institutional Class and 0.700% to 0.950% for the R6 Class. The effective annual management fee for each class for the period ended November 30, 2013 was 1.08% for the Investor Class, A Class, C Class and R Class, 0.88% for the Institutional Class and 0.73% for the R6 Class.
Distribution and Service Fees — The Board of Directors has adopted a separate Master Distribution and Individual Shareholder Services Plan for each of the A Class, C Class and R Class (collectively the plans), pursuant to Rule 12b-1 of the 1940 Act. The plans provide that the A Class will pay American Century Investment Services, Inc. (ACIS) an annual distribution and service fee of 0.25%. The plans provide that the C Class will pay ACIS
an annual distribution and service fee of 1.00%, of which 0.25% is paid for individual shareholder services and 0.75% is paid for distribution services. The plans provide that the R Class will pay ACIS an annual distribution and service fee of 0.50%. The fees are computed and accrued daily based on each class’s daily net assets and paid monthly in arrears. The fees are used to pay financial intermediaries for distribution and individual shareholder services. Fees incurred under the plans during the year ended November 30, 2013 are detailed in the Statement of Operations.
Related Parties — Certain officers and directors of the corporation are also officers and/or directors of American Century Companies, Inc. (ACC). The corporation’s investment advisor, ACIM, the corporation’s distributor, ACIS, and the corporation’s transfer agent, American Century Services, LLC, are wholly owned, directly or indirectly, by ACC.
4. Investment Transactions
Purchases and sales of investment securities, excluding short-term investments, for the year ended November 30, 2013 were $317,430,880 and $330,844,701, respectively.
5. Capital Share Transactions
Transactions in shares of the fund were as follows:
Year ended November 30, 2013(1) | Year ended November 30, 2012 | |||||||||||
Shares | Amount | Shares | Amount | |||||||||
Investor Class/Shares Authorized | 200,000,000 | 200,000,000 | ||||||||||
Sold | 3,867,396 | $41,349,199 | 6,257,701 | $57,448,175 | ||||||||
Issued in reinvestment of distributions | 142,377 | 1,459,360 | 109,431 | 1,003,479 | ||||||||
Redeemed | (7,522,825 | ) | (80,330,603 | ) | (5,428,463 | ) | (50,102,555 | ) | ||||
| (3,513,052 | ) | (37,522,044 | ) | 938,669 | 8,349,099 | |||||||
Institutional Class/Shares Authorized | 35,000,000 | 35,000,000 | ||||||||||
Sold | 2,715,772 | 32,463,147 | 1,641,641 | 15,564,429 | ||||||||
Issued in reinvestment of distributions | 26,496 | 273,969 | 21,111 | 195,280 | ||||||||
Redeemed | (1,126,926 | ) | (12,038,152 | ) | (993,715 | ) | (9,123,617 | ) | ||||
| 1,615,342 | 20,698,964 | 669,037 | 6,636,092 | |||||||||
A Class/Shares Authorized | 35,000,000 | 35,000,000 | ||||||||||
Sold | 1,659,451 | 17,366,675 | 1,228,876 | 11,260,861 | ||||||||
Issued in reinvestment of distributions | 5,001 | 50,611 | 1,453 | 13,148 | ||||||||
Redeemed | (1,035,690 | ) | (10,762,776 | ) | (859,903 | ) | (7,847,244 | ) | ||||
| 628,762 | 6,654,510 | 370,426 | 3,426,765 | |||||||||
C Class/Shares Authorized | 10,000,000 | 10,000,000 | ||||||||||
Sold | 107,127 | 1,077,402 | 108,361 | 931,312 | ||||||||
Redeemed | (74,025 | ) | (714,493 | ) | (96,573 | ) | (823,539 | ) | ||||
| 33,102 | 362,909 | 11,788 | 107,773 | |||||||||
R Class/Shares Authorized | 5,000,000 | 5,000,000 | ||||||||||
Sold | 276,036 | 2,772,191 | 138,905 | 1,261,029 | ||||||||
Redeemed | (74,809 | ) | (778,299 | ) | (47,198 | ) | (423,738 | ) | ||||
| 201,227 | 1,993,892 | 91,707 | 837,291 | |||||||||
R6 Class/Shares Authorized | 50,000,000 | N/A | ||||||||||
Sold | 2,228 | 25,000 | ||||||||||
Net increase (decrease) | (1,032,391 | ) | $ (7,786,769 | ) | 2,081,627 | $19,357,020 | ||||||
(1) | July 26, 2013 (commencement of sale) through November 30, 2013 for the R6 Class. |
6. Fair Value Measurements
The fund’s investments valuation process is based on several considerations and may use multiple inputs to determine the fair value of the investments held by the fund. In conformity with accounting principles generally accepted in the United States of America, the inputs used to determine a valuation are classified into three broad levels.
• | Level 1 valuation inputs consist of unadjusted quoted prices in an active market for identical investments. |
• | Level 2 valuation inputs consist of direct or indirect observable market data (including quoted prices for comparable investments, evaluations of subsequent market events, interest rates, prepayment speeds, credit risk, etc.). These inputs also consist of quoted prices for identical investments initially expressed in local currencies that are adjusted through translation into U.S. dollars. |
• | Level 3 valuation inputs consist of unobservable data (including a fund’s own assumptions). |
The level classification is based on the lowest level input that is significant to the fair valuation measurement. The valuation inputs are not necessarily an indication of the risks associated with investing in these securities or other financial instruments.
The following is a summary of the level classifications as of period end. The Schedule of Investments provides additional information on the fund’s portfolio holdings.
Level 1 | Level 2 | Level 3 | |
Assets | |||
Investment Securities | |||
Domestic Common Stocks | $343,680,412 | — | — |
Foreign Common Stocks | 17,480,349 | $203,182,676 | — |
Temporary Cash Investments | 10,988,863 | 11,010,523 | — |
Total Value of Investment Securities | $372,149,624 | $214,193,199 | — |
7. Risk Factors
There are certain risks involved in investing in foreign securities. These risks include those resulting from future adverse political, social and economic developments, fluctuations in currency exchange rates, the possible imposition of exchange controls, and other foreign laws or restrictions. Investing in emerging markets may accentuate these risks.
8. Federal Tax Information
On December 17, 2013, the fund declared and paid a per-share distribution from net realized gains to shareholders of record on December 16, 2013 of $0.2780 for the Investor Class, Institutional Class, A Class, C Class, R Class and R6 Class.
The tax character of distributions paid during the years ended November 30, 2013 and November 30, 2012 were as follows:
2013 | 2012 | |
Distributions Paid From | ||
Ordinary income | $1,818,631 | $1,236,800 |
Long-term capital gains | — | — |
The book-basis character of distributions made during the year from net investment income or net realized gains may differ from their ultimate characterization for federal income tax purposes. These differences reflect the differing character of certain income items and net realized gains and losses for financial statement and tax purposes, and may result in reclassification among certain capital accounts on the financial statements.
As of November 30, 2013, the federal tax cost of investments and the components of distributable earnings on a tax-basis were as follows:
Federal tax cost of investments | $418,969,336 |
Gross tax appreciation of investments | $168,896,161 |
Gross tax depreciation of investments | (1,522,674) |
Net tax appreciation (depreciation) of investments | $167,373,487 |
Net tax appreciation (depreciation) on translation of assets and liabilities in foreign currencies | $29,126 |
Net tax appreciation (depreciation) | $167,402,613 |
Undistributed ordinary income | $3,771,929 |
Accumulated long-term gains | $12,954,761 |
The difference between book-basis and tax-basis unrealized appreciation (depreciation) is attributable primarily to the realization to ordinary income for tax purposes of unrealized gains on investments in passive foreign investment companies.
Financial Highlights |
For a Share Outstanding Throughout the Years Ended November 30 (except as noted) | |||||||||||
Per-Share Data | Ratios and Supplemental Data | ||||||||||
Income From Investment Operations: | Ratio to Average Net Assets of: | ||||||||||
Net Asset Period | Net Investment Income (Loss)(1) | Net Realized Gain (Loss) | Total From Investment Operations | Distributions From Net Investment Income | Net Asset Value, End of Period | Total Return(2) | Operating Expenses | Net Investment Income (Loss) | Portfolio Turnover Rate | Net Assets, | |
Investor Class | |||||||||||
2013 | $9.63 | 0.01 | 2.79 | 2.80 | (0.04) | $12.39 | 29.15% | 1.09% | 0.11% | 64% | $437,599 |
2012 | $8.52 | 0.03 | 1.11 | 1.14 | (0.03) | $9.63 | 13.37% | 1.10% | 0.28% | 54% | $373,887 |
2011 | $8.41 | 0.03 | 0.13 | 0.16 | (0.05) | $8.52 | 1.82% | 1.11% | 0.28% | 53% | $322,672 |
2010 | $7.80 | 0.03 | 0.64 | 0.67 | (0.06) | $8.41 | 8.61% | 1.16% | 0.33% | 100% | $344,950 |
2009 | $5.90 | 0.04 | 1.86 | 1.90 | —(3) | $7.80 | 32.24% | 1.22% | 0.62% | 103% | $346,590 |
Institutional Class | |||||||||||
2013 | $9.73 | 0.03 | 2.82 | 2.85 | (0.06) | $12.52 | 29.42% | 0.89% | 0.31% | 64% | $80,968 |
2012 | $8.60 | 0.05 | 1.13 | 1.18 | (0.05) | $9.73 | 13.71% | 0.90% | 0.48% | 54% | $47,203 |
2011 | $8.49 | 0.04 | 0.13 | 0.17 | (0.06) | $8.60 | 2.00% | 0.91% | 0.48% | 53% | $35,991 |
2010 | $7.90 | 0.04 | 0.64 | 0.68 | (0.09) | $8.49 | 8.68% | 0.96% | 0.53% | 100% | $45,459 |
2009 | $5.97 | 0.05 | 1.89 | 1.94 | (0.01) | $7.90 | 32.61% | 1.02% | 0.82% | 103% | $44,752 |
A Class | |||||||||||
2013 | $9.49 | (0.02) | 2.75 | 2.73 | (0.01) | $12.21 | 28.83% | 1.34% | (0.14)% | 64% | $51,351 |
2012 | $8.39 | —(3) | 1.10 | 1.10 | —(3) | $9.49 | 13.16% | 1.35% | 0.03% | 54% | $33,938 |
2011 | $8.28 | —(3) | 0.13 | 0.13 | (0.02) | $8.39 | 1.58% | 1.36% | 0.03% | 53% | $26,908 |
2010 | $7.67 | 0.01 | 0.62 | 0.63 | (0.02) | $8.28 | 8.20% | 1.41% | 0.08% | 100% | $33,641 |
2009 | $5.81 | 0.02 | 1.84 | 1.86 | — | $7.67 | 32.01% | 1.47% | 0.37% | 103% | $34,744 |
For a Share Outstanding Throughout the Years Ended November 30 (except as noted) | |||||||||||
Per-Share Data | Ratios and Supplemental Data | ||||||||||
Income From Investment Operations: | Ratio to Average Net Assets of: | ||||||||||
Net Asset Period | Net Investment Income (Loss)(1) | Net Realized Gain (Loss) | Total From Investment Operations | Distributions From Net Investment Income | Net Asset Value, End of Period | Total Return(2) | Operating Expenses | Net Investment Income (Loss) | Portfolio Turnover Rate | Net Assets, | |
C Class | |||||||||||
2013 | $8.84 | (0.09) | 2.55 | 2.46 | — | $11.30 | 27.97% | 2.09% | (0.89)% | 64% | $5,615 |
2012 | $7.87 | (0.06) | 1.03 | 0.97 | — | $8.84 | 12.20% | 2.10% | (0.72)% | 54% | $4,098 |
2011 | $7.81 | (0.06) | 0.12 | 0.06 | — | $7.87 | 0.77% | 2.11% | (0.72)% | 53% | $3,557 |
2010 | $7.27 | (0.05) | 0.59 | 0.54 | — | $7.81 | 7.43% | 2.16% | (0.67)% | 100% | $4,579 |
2009 | $5.54 | (0.02) | 1.75 | 1.73 | — | $7.27 | 31.23% | 2.22% | (0.38)% | 103% | $3,535 |
R Class | |||||||||||
2013 | $9.47 | (0.04) | 2.75 | 2.71 | — | $12.18 | 28.51% | 1.59% | (0.39)% | 64% | $4,489 |
2012 | $8.39 | (0.02) | 1.10 | 1.08 | — | $9.47 | 12.87% | 1.60% | (0.22)% | 54% | $1,587 |
2011 | $8.29 | (0.02) | 0.12 | 0.10 | — | $8.39 | 1.21% | 1.61% | (0.22)% | 53% | $636 |
2010 | $7.67 | (0.01) | 0.63 | 0.62 | — | $8.29 | 8.08% | 1.66% | (0.17)% | 100% | $490 |
2009 | $5.82 | —(3) | 1.85 | 1.85 | — | $7.67 | 31.79% | 1.72% | 0.12% | 103% | $442 |
R6 Class | |||||||||||
2013(4) | $11.22 | —(3) | 1.31 | 1.31 | — | $12.53 | 11.68% | 0.74%(5) | 0.00%(5)(6) | 64%(7) | $28 |
Notes to Financial Highlights
(1) | Computed using average shares outstanding throughout the period. |
(2) | Total returns are calculated based on the net asset value of the last business day and do not reflect applicable sales charges, if any. Total returns for periods less than one year are not annualized. |
(3) | Per-share amount was less than $0.005. |
(4) | July 26, 2013 (commencement of sale) through November 30, 2013. |
(5) | Annualized. |
(6) | Ratio was less than 0.005%. |
(7) | Portfolio turnover is calculated at the fund level. Percentage indicated was calculated for the year ended November 30, 2013. |
See Notes to Financial Statements.
Report of Independent Registered Public Accounting Firm |
To the Board of Directors and Shareholders of
American Century World Mutual Funds, Inc.:
We have audited the accompanying statement of assets and liabilities, including the schedule of investments, of Global Growth Fund (the “Fund”), one of the funds constituting American Century World Mutual Funds, Inc., as of November 30, 2013, and the related statement of operations for the year then ended, the statements of changes in net assets for each of the two years in the period then ended, and the financial highlights for each of the periods presented. These financial statements and financial highlights are the responsibility of the Fund’s management. Our responsibility is to express an opinion on these financial statements and financial highlights based on our audits.
We conducted our audits in accordance with the standards of the Public Company Accounting Oversight Board (United States). Those standards require that we plan and perform the audit to obtain reasonable assurance about whether the financial statements and financial highlights are free of material misstatement. The Fund is not required to have, nor were we engaged to perform, an audit of its internal control over financial reporting. Our audits included consideration of internal control over financial reporting as a basis for designing audit procedures that are appropriate in the circumstances, but not for the purpose of expressing an opinion on the effectiveness of the Fund’s internal control over financial reporting. Accordingly, we express no such opinion. An audit also includes examining, on a test basis, evidence supporting the amounts and disclosures in the financial statements, assessing the accounting principles used and significant estimates made by management, as well as evaluating the overall financial statement presentation. Our procedures included confirmation of securities owned as of November 30, 2013, by correspondence with the custodian and brokers; where replies were not received from brokers, we performed other auditing procedures. We believe that our audits provide a reasonable basis for our opinion.
In our opinion, the financial statements and financial highlights referred to above present fairly, in all material respects, the financial position of Global Growth Fund of American Century World Mutual Funds, Inc. as of November 30, 2013, the results of its operations for the year then ended, the changes in its net assets for each of the two years in the period then ended, and the financial highlights for each of the periods presented, in conformity with accounting principles generally accepted in the United States of America.
Deloitte & Touche LLP
Kansas City, Missouri
January 17, 2014
Management |
The Board of Directors
The individuals listed below serve as directors of the funds. Each director will continue to serve in this capacity until death, retirement, resignation or removal from office. The board has adopted a mandatory retirement age for directors who are not “interested persons,” as that term is defined in the Investment Company Act (independent directors). Independent directors shall retire by December 31 of the year in which they reach their 75th birthday. Mr. Pratt may serve until December 31 of the year in which he reaches his 76th birthday based on an extension granted under previous retirement guidelines.
Mr. Thomas is an “interested person” because he currently serves as President and Chief Executive Officer of American Century Companies, Inc. (ACC), the parent company of American Century Investment Management, Inc. (ACIM or the advisor). Mr. Fink is treated as an “interested person” because of his recent employment with ACC and American Century Services, LLC (ACS). The other directors (more than three-fourths of the total number) are independent. They are not employees, directors or officers of, and have no financial interest in, ACC or any of its wholly owned, direct or indirect, subsidiaries, including ACIM, American Century Investment Services, Inc. (ACIS) and ACS, and do not have any other affiliations, positions, or relationships that would cause them to be considered “interested persons” under the Investment Company Act. The directors serve in this capacity for seven (in the case of Mr. Thomas, 15) registered investment companies in the American Century Investments family of funds.
The following table presents additional information about the directors. The mailing address for each director is 4500 Main Street, Kansas City, Missouri 64111.
Name | Position(s) Held with Funds | Length of Time Served | Principal Occupation(s) During Past 5 Years | Number of American Century Portfolios Overseen by Director | Other Directorships Held During Past 5 Years | |
Independent Directors | ||||||
Thomas A. Brown (1940) | Director | Since 1980 | Managing Member, Associated Investments, LLC (real estate investment company); Brown Cascade Properties, LLC (real estate investment company) (2001 to 2009) | 75 | None | |
Andrea C. Hall (1945) | Director | Since 1997 | Retired | 75 | None | |
Jan M. Lewis (1957) | Director | Since 2011 | President and Chief Executive Officer, Catholic Charities of Northeast Kansas (human services organization) | 75 | None | |
James A. Olson (1942) | Director | Since 2007 | Member, Plaza Belmont LLC (private equity fund manager) | 75 | Saia, Inc. (2002 to 2012) and EPR Properties (2003 to 2013) | |
Donald H. Pratt(1) (1937) | Director and Chairman of the Board | Since 1995 (Chairman since 2005) | Chairman and Chief Executive Officer, Western Investments, Inc. (real estate company) | 75 | None | |
Name | Position(s) Held with Funds | Length of Time Served | Principal Occupation(s) During Past 5 Years | Number of American Century Portfolios Overseen by Director | Other Directorships Held During Past 5 Years | |
Independent Directors | ||||||
M. Jeannine Strandjord | Director | Since 1994 | Retired | 75 | Euronet Worldwide Inc.; Charming Shoppes, Inc. (2006 to 2010); and DST Systems Inc. (1996 to 2012) | |
John R. Whitten (1946) | Director | Since 2008 | Retired | 75 | Rudolph Technologies, Inc. | |
Stephen E. Yates (1948) | Director | Since 2012 | Retired; Executive Vice President, Technology & Operations, KeyCorp. (computer services)(2004 to 2010) | 75 | Applied Industrial Technologies, Inc. (2001 to 2010) | |
Interested Directors | ||||||
Barry Fink | Director | Since 2012 | Retired; Executive Vice President, ACC (September 2007 to February 2013); President, ACS (October 2007 to February 2013); Chief Operating Officer, ACC (September 2007 to November 2012) | 75 | None | |
Jonathan S. Thomas | Director and President | Since 2007 | President and Chief Executive Officer, ACC (March 2007 to present). Also serves as Chief Executive Officer and Manager, ACS; Executive Vice President, ACIM; Director, ACC, ACIM and other ACC subsidiaries | 117 | None | |
(1) | Donald H. Pratt will retire as Director and Chairman of the Board effective December 31, 2013. |
Officers
The following table presents certain information about the executive officers of the funds. Each officer serves as an officer for each of the 15 investment companies in the American Century family of funds, unless otherwise noted. No officer is compensated for his or her service as an officer of the funds. The listed officers are interested persons of the funds and are appointed or re-appointed on an annual basis. The mailing address for each officer listed below is 4500 Main Street, Kansas City, Missouri 64111.
Name | Offices with the Funds | Principal Occupation(s) During the Past Five Years |
Jonathan S. Thomas | Director and President since 2007 | President and Chief Executive Officer, ACC (March 2007 to present). Also serves as Chief Executive Officer and Manager, ACS; Executive Vice President, ACIM; Director, ACC, ACIM and other ACC subsidiaries |
Maryanne L. Roepke | Chief Compliance Officer since 2006 and Senior Vice President since 2000 | Chief Compliance Officer, American Century funds, ACIM and ACS (August 2006 to present). Also serves as Senior Vice President, ACS |
Charles A. Etherington (1957) | General Counsel since 2007 and Senior Vice President since 2006 | Attorney, ACC (February 1994 to present); Vice President, ACC (November 2005 to present); General Counsel, ACC (March 2007 to present). Also serves as General Counsel, ACIM, ACS, ACIS and other ACC subsidiaries; and Senior Vice President, ACIM and ACS |
C. Jean Wade (1964) | Vice President, Treasurer and Chief Financial Officer since 2012 | Vice President, ACS (February 2000 to present) |
Robert J. Leach (1966) | Vice President since 2006 and Assistant Treasurer since 2012 | Vice President, ACS (February 2000 to present) |
David H. Reinmiller (1963) | Vice President since 2000 | Attorney, ACC (January 1994 to present); Associate General Counsel, ACC (January 2001 to present). Also serves as Vice President, ACIM and ACS |
Ward D. Stauffer (1960) | Secretary since 2005 | Attorney, ACC (June 2003 to present) |
The Statement of Additional Information has additional information about the fund’s directors and is available without charge, upon request, by calling 1-800-345-2021.
Approval of Management Agreement |
At a meeting held on June 20, 2013, the Fund’s Board of Directors unanimously approved the renewal of the management agreement pursuant to which American Century Investment Management, Inc. (the “Advisor”) acts as the investment advisor for the Fund. Under Section 15(c) of the Investment Company Act, contracts for investment advisory services are required to be reviewed, evaluated, and approved by a majority of a fund’s directors (the “Directors”), including a majority of the independent Directors, each year.
Prior to its consideration of the renewal of the management agreement, the Board requested and reviewed extensive data and information compiled by the Advisor and certain independent providers of evaluation data concerning the Fund and the services provided to the Fund by the Advisor. This review was in addition to the oversight and evaluation undertaken by the Board and its committees on a continuous basis throughout the year.
In connection with its consideration of the renewal of the management agreement, the Board’s review and evaluation of the services provided by the Advisor included, but was not limited to, the following:
• | the nature, extent, and quality of investment management, shareholder services, and other services provided by the Advisor to the Fund; |
• | the wide range of other programs and services the Advisor provides to the Fund and its shareholders on a routine and non-routine basis; |
• | the investment performance of the Fund, including data comparing the Fund’s performance to appropriate benchmarks and/or a peer group of other mutual funds with similar investment objectives and strategies; |
• | data comparing the cost of owning the Fund to the cost of owning |
• | the Advisor’s compliance policies, procedures, and regulatory experience; |
• | financial data showing the cost of services provided to the Fund, the profitability of the Fund to the Advisor, and the overall profitability of the Advisor; |
• | possible economies of scale associated with the Advisor’s management of the Fund and other accounts under its management; |
• | data comparing services provided and charges to other investment management clients of the Advisor; and |
• | consideration of collateral benefits derived by the Advisor from the management of the Fund. |
In keeping with its practice, the Board held two in-person meetings and one telephonic meeting to review and discuss the information provided. The Directors also had the benefit of the advice of independent counsel throughout the period.
Factors Considered
The Directors considered all of the information provided by the Advisor, the independent data providers, and independent counsel, and evaluated such information for the Fund. In connection with their review, the Directors did not identify any single factor as being all-important or controlling, and each Director may have attributed different levels of importance to different factors. In deciding to renew the management agreement, the Board based its decision on a number of factors, including the following:
Nature, Extent and Quality of Services - Generally. Under the management agreement, the Advisor is responsible for providing or arranging for all services necessary for the operation of the Fund. The Board noted that under the management agreement, the Advisor provides or arranges at its own expense a wide variety of services including:
• | constructing and designing the Fund |
• | portfolio research and security selection |
• | initial capitalization/funding |
• | securities trading |
• | Fund administration |
• | custody of Fund assets |
• | daily valuation of the Fund’s portfolio |
• | shareholder servicing and transfer agency, including shareholder confirmations, recordkeeping, and communications |
• | legal services |
• | regulatory and portfolio compliance |
• | financial reporting |
• | marketing and distribution |
The Board noted that many of these services have expanded over time both in terms of quantity and complexity in response to shareholder demands, competition in the industry, changing distribution channels, and the changing regulatory environment.
Investment Management Services. The nature of the investment management services provided to the Fund is quite complex and allows Fund shareholders access to professional money management, instant diversification of their investments within an asset class, the opportunity to easily diversify among asset classes by investing in or exchanging among various American Century Investments
funds, and liquidity. In evaluating investment performance, the Board expects the Advisor to manage the Fund in accordance with its investment objectives and approved strategies. Further, the Directors recognize that the Advisor has an obligation to monitor trading activities, and in particular to seek the best execution of fund trades, and to evaluate the use of and payment for research. In providing these services, the Advisor utilizes teams of investment professionals (portfolio managers, analysts, research assistants, and securities traders) who require extensive information technology, research, training, compliance and other systems to conduct their business. The Board, directly and through its Fund Performance Review Committee, regularly reviews investment performance information for the Fund, together with comparative information for appropriate benchmarks and/or peer groups of similarly-managed funds, over different time horizons. The Directors also review detailed performance information during the management agreement approval process. If performance concerns are identified, the Fund receives special reviews until performance improves, during which the Board discusses with the Advisor the reasons for such results (e.g., market conditions, security selection) and any efforts being undertaken to improve performance. Taking all these factors into consideration, the Board found the investment management services provided by the Advisor to the Fund to meet or exceed industry standards. More detailed information about the Fund’s performance can be found in the Performance and Portfolio Commentary sections of this report.
Shareholder and Other Services. Under the management agreement, the Advisor provides the Fund with a comprehensive package of transfer agency, shareholder, and other services. The Board, directly and through various committees of the Board, regularly reviews reports and evaluations of such services at its regular meetings. These reports include, but are not limited to, information regarding the operational efficiency and accuracy of the shareholder and transfer agency services provided, staffing levels, shareholder satisfaction (as measured by external as well as internal sources), technology support, new products and services offered to Fund shareholders, securities trading activities, portfolio valuation services, auditing services, and legal and operational compliance activities. Certain aspects of shareholder and transfer agency service level efficiency and the quality of securities trading activities are measured by independent third party providers and are presented in comparison to other fund groups not managed by the Advisor. The Board found the services provided by the Advisor to the Fund under the management agreement to be competitive and of high quality.
Costs of Services and Profitability. The Advisor provides detailed information concerning its cost of providing various services to the Fund, its profitability in managing the Fund, its overall profitability, and its financial condition. The Directors have reviewed with the Advisor the methodology used to prepare this financial information. The financial information regarding the Advisor is considered in evaluating the Advisor’s financial condition, its ability to continue to provide services under the management agreement, and the reasonableness of the current management fee. The Board concluded that the Advisor’s profits were reasonable in light of the services provided to the Fund.
Ethics. The Board generally considers the Advisor’s commitment to providing quality services to shareholders and to conducting its business ethically. They noted that the Advisor’s practices generally meet or exceed industry best practices.
Economies of Scale. The Board also reviewed information provided by the Advisor regarding the possible existence of economies of scale in connection with the management of the Fund. The Board concluded that economies of scale are difficult to measure and predict with precision, especially on a fund-by-fund basis. The Board concluded that the Advisor is appropriately sharing economies of scale through its competitive fee structure, offering competitive fees from fund inception, and through reinvestment in its business to provide shareholders additional content and services.
Comparison to Other Funds’ Fees. The management agreement provides that the Fund pay the Advisor a single, all-inclusive (or unified) management fee for providing all services necessary for the management and operation of the Fund, other than brokerage expenses, taxes, interest, extraordinary expenses, and the fees and expenses of the Fund’s independent directors (including their independent legal counsel) and expenses incurred in connection with the provision of shareholder services and distribution services under a plan adopted pursuant to Rule 12b-1 under the 1940 Act. Under the unified fee structure, the Advisor is responsible for providing all investment advisory, custody, audit, administrative, compliance, recordkeeping, marketing and shareholder services, or arranging and supervising third parties to provide such services. By contrast, most other funds are charged a variety of fees, including an investment advisory fee, a transfer agency fee, an administrative fee, distribution charges and other expenses. Other than their investment advisory fees and any applicable Rule 12b-1 distribution fees, all other components of the total fees charged by these other funds may be increased without shareholder approval. The Board believes the unified fee structure is a benefit to Fund shareholders because it clearly discloses to shareholders the cost of owning Fund shares, and, since the unified fee cannot be increased without a vote of Fund shareholders, it shifts to the Advisor the risk of increased costs of operating the Fund and provides a direct incentive to minimize administrative inefficiencies. Part of the Board’s analysis of fee levels involves reviewing certain evaluative data compiled by an independent provider and comparing the Fund’s unified fee to the total expense ratio of other funds in the Fund’s peer group. The Board concluded that the management fee paid by the Fund to the Advisor under the management agreement is reasonable in light of the services provided to the Fund.
Comparison to Fees and Services Provided to Other Clients of the Advisor. The Board also requested and received information from the Advisor concerning the nature of the services, fees, costs and profitability of its advisory services to advisory clients other than the Fund. They observed that these varying types of client accounts require different services and involve different regulatory and entrepreneurial risks than the management of the Fund. The Board analyzed this information and concluded that the fees charged and services provided to the Fund were reasonable by comparison.
Collateral or “Fall-Out” Benefits Derived by the Advisor. The Board considered the existence of collateral benefits the Advisor may receive as a result of its relationship with the Fund. They concluded that the Advisor’s primary business is managing mutual funds and it generally does not use fund or shareholder information to generate profits in other lines of business, and therefore does not
derive any significant collateral benefits from them. The Board noted that the Advisor receives proprietary research from broker-dealers that execute fund portfolio transactions and concluded that this research is likely to benefit Fund shareholders. The Board also determined that the Advisor is able to provide investment management services to certain clients other than the Fund, at least in part, due to its existing infrastructure built to serve the fund complex. The Board concluded, however, that the assets of those other clients are not material to the analysis and, where applicable, may be included with the assets of the Fund to determine breakpoints in the management fee schedule.
Existing Relationship. The Board also considered whether there was any reason for not continuing the existing arrangement with the Advisor. In this regard, the Board was mindful of the potential disruptions of the Fund’s operations and various risks, uncertainties, and other effects that could occur as a result of a decision not to continue such relationship. In particular, the Board recognized that most shareholders have invested in the Fund on the strength of the Advisor’s industry standing and reputation and in the expectation that the Advisor will have a continuing role in providing advisory services to the Fund.
Conclusion of the Directors. As a result of this process, the Board, including all of the independent directors, taking into account all of the factors discussed above and the information provided by the Advisor and others, concluded that the management agreement between the Fund and the Advisor is fair and reasonable in light of the services provided and should be renewed.
Additional Information |
Retirement Account Information
As required by law, distributions you receive from certain IRAs are subject to federal income tax withholding, unless you elect not to have withholding apply. Tax will be withheld on the total amount withdrawn even though you may be receiving amounts that are not subject to withholding, such as nondeductible contributions. In such case, excess amounts of withholding could occur. You may adjust your withholding election so that a greater or lesser amount will be withheld.
If you don’t want us to withhold on this amount, you must notify us to not withhold the federal income tax. You may notify us in writing or in certain situations by telephone or through other electronic means. For systematic withdrawals, your withholding election will remain in effect until revoked or changed by filing a new election. You have the right to revoke your election at any time.
Remember, even if you elect not to have income tax withheld, you are liable for paying income tax on the taxable portion of your withdrawal. If you elect not to have income tax withheld or you don’t have enough income tax withheld, you may be responsible for payment of estimated tax. You may incur penalties under the estimated tax rules if your withholding and estimated tax payments are not sufficient. You can reduce or defer the income tax on a distribution by directly or indirectly rolling such distribution over to another IRA or eligible plan. You should consult your tax advisor for additional information.
State tax will be withheld if, at the time of your distribution, your address is within one of the mandatory withholding states and you have federal income tax withheld (or as otherwise required by state law). State taxes will be withheld from your distribution in accordance with the respective state rules.
Distributions you receive from 403(b), 457 and qualified plans are subject to special tax and withholding rules. Your plan administrator or plan sponsor is required to provide you with a special tax notice explaining those rules at the time you request a distribution. If applicable, federal and/or state taxes may be withheld from your distribution amount.
Proxy Voting Policies
A description of the policies that the fund’s investment advisor uses in exercising the voting rights associated with the securities purchased and/or held by the fund is available without charge, upon request, by calling 1-800-345-2021. It is also available on the “About Us” page of American Century Investments’ website at americancentury.com and on the Securities and Exchange Commission’s website at sec.gov. Information regarding how the investment advisor voted proxies relating to portfolio securities during the most recent 12-month period ended June 30 is available on the “About Us” page at americancentury.com. It is also available at sec.gov.
Quarterly Portfolio Disclosure
The fund files its complete schedule of portfolio holdings with the Securities and Exchange Commission (SEC) for the first and third quarters of each fiscal year on Form N-Q. The fund’s Forms N-Q are available on the SEC’s website at sec.gov, and may be reviewed and copied at the SEC’s Public Reference Room in Washington, DC. Information on the operation of the Public Reference Room may be obtained by calling 1-800-SEC-0330. The fund also makes its complete schedule of portfolio holdings for the most recent quarter of its fiscal year available on its website at americancentury.com and, upon request, by calling 1-800-345-2021.
Other Tax Information
The following information is provided pursuant to provisions of the Internal Revenue Code.
The fund hereby designates up to the maximum amount allowable as qualified dividend income for the fiscal year ended November 30, 2013.
For corporate taxpayers, the fund hereby designates $1,818,631, or up to the maximum amount allowable, of ordinary income distributions paid during the fiscal year ended November 30, 2013 as qualified for the corporate dividends received deduction.
![]()
Contact Us | americancentury.com |
Automated Information Line | 1-800-345-8765 |
Investor Services Representative | 1-800-345-2021 |
Investors Using Advisors | 1-800-378-9878 |
Business, Not-For-Profit, Employer-Sponsored Retirement Plans | 1-800-345-3533 |
Banks and Trust Companies, Broker-Dealers, Financial Professionals, Insurance Companies | 1-800-345-6488 |
Telecommunications Relay Service for the Deaf | 711 |
American Century World Mutual Funds, Inc.
Investment Advisor:
American Century Investment Management, Inc.
Kansas City, Missouri
This report and the statements it contains are submitted for the general information of our shareholders. The report is not authorized for distribution to prospective investors unless preceded or accompanied by an effective prospectus.
©2014 American Century Proprietary Holdings, Inc. All rights reserved.
CL-ANN-80785 1401
ANNUAL REPORT | NOVEMBER 30, 2013 |
International Discovery Fund
Table of Contents |
President’s Letter | 2 |
Market Perspective | 3 |
Performance | 4 |
Portfolio Commentary | 6 |
Fund Characteristics | 8 |
Shareholder Fee Example | 9 |
Schedule of Investments | 11 |
Statement of Assets and Liabilities | 14 |
Statement of Operations | 15 |
Statement of Changes in Net Assets | 16 |
Notes to Financial Statements | 17 |
Financial Highlights | 23 |
Report of Independent Registered Public Accounting Firm | 25 |
Management | 26 |
Approval of Management Agreement | 29 |
Additional Information | 34 |
Any opinions expressed in this report reflect those of the author as of the date of the report, and do not necessarily represent the opinions of American Century Investments® or any other person in the American Century Investments organization. Any such opinions are subject to change at any time based upon market or other conditions and American Century Investments disclaims any responsibility to update such opinions. These opinions may not be relied upon as investment advice and, because investment decisions made by American Century Investments funds are based on numerous factors, may not be relied upon as an indication of trading intent on behalf of any American Century Investments fund. Security examples are used for representational purposes only and are not intended as recommendations to purchase or sell securities. Performance information for comparative indices and securities is provided to American Century Investments by third party vendors. To the best of American Century Investments’ knowledge, such information is accurate at the time of printing.
President’s Letter |
Jonathan Thomas
Dear Investor:
Thank you for reviewing this annual report for the 12 months ended November 30, 2013. It provides investment performance, market analysis, and portfolio information, presented with the expert perspective of our portfolio management team.
Annual reports remain important vehicles for conveying information about fund returns, including key factors that affected fund performance. For additional, updated investment and market insights, we encourage you to visit our website, americancentury.com.
Monetary Policy-Driven, “Risk-On” Results in Developed Countries
Stimulative monetary policies by central banks and slowly improving global economic conditions played a major part in financial market returns during the reporting period. The combination of an improving global economic outlook, mostly low costs of capital in the money markets, and central bank purchases of longer-maturity fixed income securities (a market liquidity-building strategy known as quantitative easing, QE) helped persuade investors to seek risk and yield, particularly in developed markets such as the U.S., Japan, and Europe. Broad stock index returns were stellar in these markets, particularly at the smaller capitalization end of the company size spectrum. Representing the broad markets, the S&P 500 and MSCI EAFE Indices returned 30.30% and 24.84%, respectively, for the reporting period, and their smaller capitalization counterparts performed even better.
At the same time, hints that QE might be tapered soon in the U.S. hampered government bond returns and emerging market stock indices. Broad emerging market stock indices posted positive single-digit returns, but government bond total returns dipped into negative territory, despite low inflation. Corporate bonds, especially high-yield corporates, generally performed better than government bonds because of their higher yields, declining spreads (yield differences between corporate and similar-maturity Treasury securities), and relatively low default rates, compared with historical averages.
As we enter 2014, there’s less uncertainty about the U.S. fiscal picture and global economic strength than a year ago, but headwinds continue. A full economic recovery from 2008 remains elusive—economic growth is still subpar compared with past recoveries. In this environment, we continue to believe in a disciplined, diversified, long-term investment approach, using professionally managed stock and bond portfolios—as appropriate—for meeting financial goals. We appreciate your continued trust in us.
Sincerely,
Jonathan Thomas
President and Chief Executive Officer
American Century Investments
Market Perspective |
By Mark Kopinski, Chief Investment Officer, Global and Non-U.S. Equity
Global Stocks Rallied to Post Double-Digit Gains
Stock market performance remained robust during the 12-month period ended November 30, 2013, with most major market indices posting double-digit gains. Despite persistent concerns about weak global growth and a slowdown in China, investors largely focused on central bank stimulus measures, marginally improving U.S. and European economic data, and relatively healthy corporate earnings, which fueled stock market optimism.
Prior to the reporting period, the U.S. Federal Reserve (the Fed) announced its third quantitative easing program (QE3). This effort, combined with similar large-scale stimulus measures from the European Central Bank (ECB) and the Bank of Japan as well as favorable corporate earnings reports, generally helped keep stocks in favor. Additionally, housing market gains in the U.S., U.K., and Australia aided the global investment landscape.
Europe, Japan were Performance Leaders
Assurances by the ECB that it would keep interest rates at historic lows for an extended period, followed by the cutting of its key lending rate to 0.25% late in the period, helped drive stock market gains in Europe. In addition, economic conditions throughout Europe improved, led by an expanding manufacturing sector, improving business and consumer sentiment, and a slowdown of the economic contraction in the peripheral countries. In the second calendar quarter of 2013, the 17-member eurozone emerged from its longest-ever recession (six consecutive quarters). Investors generally focused on these positive factors, pushing stocks higher despite the structural issues and high unemployment still plaguing the region.
In Japan, the central bank’s efforts to pull the nation out of its decades-long deflationary spiral and spark economic growth appeared to be working. Japan’s economy grew, and consumer prices increased. Late in the period, government officials announced the country’s inflation rate rose at a five-year high, suggesting their deflation-focused initiatives were gaining traction.
Overall, developed market stocks sharply outperformed their emerging market counterparts. Much of the lagging performance was due to a slower-growth environment in China. In addition, rising inflation and currency weakness weighed on many developing nations.
International Equity Total Returns | ||||
For the 12 months ended November 30, 2013 (in U.S. dollars) | ||||
MSCI EAFE Index | 24.84% | MSCI Europe Index | 25.94% | |
MSCI EAFE Growth Index | 23.45% | MSCI World Index | 26.38% | |
MSCI EAFE Value Index | 26.20% | MSCI Japan Index | 32.84% | |
MSCI Emerging Markets Index | 3.66% | |||
Performance |
Total Returns as of November 30, 2013 | ||||||
Average Annual Returns | ||||||
Ticker Symbol | 1 year | 5 years | 10 years | Since Inception | Inception Date | |
Investor Class | TWEGX | 27.97% | 15.85% | 9.47% | 11.41% | 4/1/94 |
MSCI All Country | — | 16.00% | 15.19% | 8.17% | N/A(1) | — |
Institutional Class | TIDIX | 28.16% | 16.07% | 9.68% | 10.24% | 1/2/98 |
A Class(2) No sales charge* With sales charge* | ACIDX
| 27.69% 20.33% | 15.55% 14.21% | 9.19% 8.55% | 8.50% 8.09% | 4/28/98
|
C Class | TWECX | 26.75% | — | — | 10.73% | 3/1/10 |
R Class | TWERX | 27.35% | — | — | 11.25% | 3/1/10 |
* | Sales charges include initial sales charges and contingent deferred sales charges (CDSCs), as applicable. A Class shares have a 5.75% maximum initial sales charge and may be subject to a maximum CDSC of 1.00%. C Class shares redeemed within 12 months of purchase are subject to a maximum CDSC of 1.00%. The SEC requires that mutual funds provide performance information net of maximum sales charges in all cases where charges could be applied. |
(1) | Benchmark data first available June 1994. |
(2) | Prior to March 1, 2010, the A Class was referred to as the Advisor Class and did not have a front-end sales charge. Performance prior to that date has been adjusted to reflect this charge. |
Data presented reflect past performance. Past performance is no guarantee of future results. Current performance may be higher or lower than the performance shown. Investment return and principal value will fluctuate, and redemption value may be more or less than original cost. To obtain performance data current to the most recent month end, please call 1-800-345-2021 or visit americancentury.com. Historically, small company stocks have been more volatile than the stocks of larger, more established companies. International investing involves special risks, such as political instability and currency fluctuations. Investing in emerging markets may accentuate these risks. The fund’s investment process may result in high portfolio turnover, which could mean high transaction costs, affecting both performance and capital gains tax liabilities to investors.
Unless otherwise indicated, performance reflects Investor Class shares; performance for other share classes will vary due to differences in fee structure. For information about other share classes available, please consult the prospectus. Data assumes reinvestment of dividends and capital gains, and none of the charts reflect the deduction of taxes that a shareholder would pay on fund distributions or the redemption of fund shares. Returns for the index are provided for comparison. The fund’s total returns include operating expenses (such as transaction costs and management fees) that reduce returns, while the total returns of the index do not.
Growth of $10,000 Over 10 Years |
$10,000 investment made November 30, 2003 |
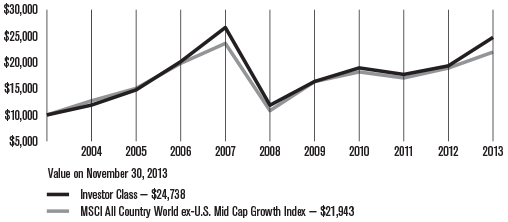
Total Annual Fund Operating Expenses | ||||
Investor Class | Institutional Class | A Class | C Class | R Class |
1.50% | 1.30% | 1.75% | 2.50% | 2.00% |
The total annual fund operating expenses shown is as stated in the fund’s prospectus current as of the date of this report. The prospectus may vary from the expense ratio shown elsewhere in this report because it is based on a different time period, includes acquired fund fees and expenses, and, if applicable, does not include fee waivers or expense reimbursements.
Data presented reflect past performance. Past performance is no guarantee of future results. Current performance may be higher or lower than the performance shown. Investment return and principal value will fluctuate, and redemption value may be more or less than original cost. To obtain performance data current to the most recent month end, please call 1-800-345-2021 or visit americancentury.com. Historically, small company stocks have been more volatile than the stocks of larger, more established companies. International investing involves special risks, such as political instability and currency fluctuations. Investing in emerging markets may accentuate these risks. The fund’s investment process may result in high portfolio turnover, which could mean high transaction costs, affecting both performance and capital gains tax liabilities to investors.
Unless otherwise indicated, performance reflects Investor Class shares; performance for other share classes will vary due to differences in fee structure. For information about other share classes available, please consult the prospectus. Data assumes reinvestment of dividends and capital gains, and none of the charts reflect the deduction of taxes that a shareholder would pay on fund distributions or the redemption of fund shares. Returns for the index are provided for comparison. The fund’s total returns include operating expenses (such as transaction costs and management fees) that reduce returns, while the total returns of the index do not.
Portfolio Commentary |
Portfolio Managers: Mark Kopinski and Brian Brady
Performance Summary
International Discovery advanced 27.97%* for the 12 months ended November 30, 2013, compared with its benchmark, the MSCI All Country World ex-U.S. Mid Cap Growth Index, which gained 16.00%.
Non-U.S. developed markets generally demonstrated robust performance during the 12-month period, primarily due to ongoing central bank stimulus measures, improving economic conditions in Europe, Japan, the U.K., and the U.S., and generally favorable corporate earnings. Overall, developed market stocks sharply outperformed their emerging market counterparts, and within the non-U.S. mid-cap universe, value stocks outpaced growth stocks.
Earnings growth, which is an important component of the portfolio’s investment process, generally performed well during the 12-month period. Overall, stock selection contributed strongly to performance on a relative basis, with the largest influence coming from the consumer discretionary, industrials, and materials sectors and from exposure in the U.K., Canada, and Japan. Sector allocation also had an overall positive influence on relative performance.
Construction Equipment Company was a Top Contributor
Strong performance in the industrials sector largely was due to a portfolio-only position in Ashtead Group, which was among the portfolio’s top contributors for the period. The stock price of the U.K.-based construction equipment rental company advanced on solid earnings growth. Ashtead benefited from the housing market recoveries in the U.S. and U.K., its two key markets, and the preference among construction companies to rent rather than purchase equipment needed to grow the business.
Another portfolio-only position—Pandora, a Denmark-based jewelry and charm retailer—also was a prominent contributor to portfolio performance. The company’s stock price advanced throughout the period, benefiting from lower silver and gold prices, an increase in luxury goods spending, and management’s recommitment to the company’s core business model. Late in the period, Pandora reported stronger-than-expected third-quarter profits attributed to growing demand and more frequent new-product launches. Management also reiterated its full-year forecasts, which it had increased in October.
In addition, an overweight position in Germany’s Sky Deutschland, a pay-TV company, was a leading contributor. The company benefited from strong earnings reports amid industry consolidation and increased pricing power. The company also benefited from superior content versus its peers. Furthermore, penetration of the pay-TV market remains low in Europe, which we believe positions Sky Deutschland for sustainable growth.
* All fund returns referenced in this commentary are for Investor Class shares.
Technology Company Led Detractors
None of the portfolio’s sectors detracted from relative performance. From a regional perspective, exposure in the Netherlands, Israel, and Norway hindered the portfolio’s relative results.
In terms of individual detractors, an overweight position in Gemalto, a France-based maker of secure chips for credit cards and smartphones, was among the main performance detractors. Slower-than-expected adoption of the company’s secure mobile payments technology drove down shares, and we exited the position. Nevertheless, over the entire holding period, the stock generated a handsome gain.
A portfolio-only position in Canada’s Yamana Gold, a gold exploration and production company, also was among the main detractors. The company’s stock price declined due to disappointing earnings news stemming from falling gold prices. We exited the position in May.
Norway-based Petroleum Geo-Services, another portfolio-only position, also was a primary detractor. The provider of marine seismic survey and data processing experienced waning demand for its services amid a pullback in surveying and infrastructure budgets worldwide. We exited the position.
Outlook
Our near-term growth outlook favors Europe, Japan, and North America. The European economy appears to be stabilizing, and we remain focused on European companies we believe will offer accelerating earnings growth. In Japan, where government policies have boosted economic activity and weakened the yen, we believe exporters and industrial firms remain attractive. The key issue is whether these economic trends are sustainable, and we will monitor the market closely. We believe the U.S. economic recovery will continue, and we will seek non-U.S. companies with exposure to improving U.S. markets.
Meanwhile, we expect many emerging markets to continue to face pressures from currency weakness and rising-rate fears. We will focus on emerging market companies we believe are positioned to benefit from consumer activity in China or overall global growth.
Fund Characteristics |
NOVEMBER 30, 2013 | |
Top Ten Holdings | % of net assets |
Pandora A/S | 3.0% |
Zodiac Aerospace | 2.3% |
Ashtead Group plc | 2.3% |
Modern Times Group AB B Shares | 2.1% |
Smurfit Kappa Group plc | 2.0% |
Ageas | 2.0% |
GKN plc | 2.0% |
GN Store Nord A/S | 1.9% |
Valeo SA | 1.7% |
Xinyi Glass Holdings Ltd. | 1.6% |
Types of Investments in Portfolio | % of net assets |
Foreign Common Stocks | 98.5% |
Temporary Cash Investments | 2.5% |
Other Assets and Liabilities | (1.0)% |
Investments by Country | % of net assets |
Japan | 13.6% |
United Kingdom | 13.0% |
France | 8.2% |
Germany | 7.5% |
China | 6.8% |
Canada | 6.6% |
Switzerland | 6.4% |
Denmark | 5.6% |
Sweden | 4.7% |
Taiwan | 3.5% |
Spain | 3.2% |
Ireland | 3.0% |
Australia | 3.0% |
South Korea | 3.0% |
Hong Kong | 2.5% |
Belgium | 2.0% |
Other Countries | 5.9% |
Cash and Equivalents* | 1.5% |
* Includes temporary cash investments and other assets and liabilities.
Shareholder Fee Example |
Fund shareholders may incur two types of costs: (1) transaction costs, including sales charges (loads) on purchase payments and redemption/exchange fees; and (2) ongoing costs, including management fees; distribution and service (12b-1) fees; and other fund expenses. This example is intended to help you understand your ongoing costs (in dollars) of investing in your fund and to compare these costs with the ongoing cost of investing in other mutual funds.
The example is based on an investment of $1,000 made at the beginning of the period and held for the entire period from June 1, 2013 to November 30, 2013.
Actual Expenses
The table provides information about actual account values and actual expenses for each class. You may use the information, together with the amount you invested, to estimate the expenses that you paid over the period. First, identify the share class you own. Then simply divide your account value by $1,000 (for example, an $8,600 account value divided by $1,000 = 8.6), then multiply the result by the number under the heading “Expenses Paid During Period” to estimate the expenses you paid on your account during this period.
If you hold Investor Class shares of any American Century Investments fund, or Institutional Class shares of the American Century Diversified Bond Fund, in an American Century Investments account (i.e., not a financial intermediary or retirement plan account), American Century Investments may charge you a $12.50 semiannual account maintenance fee if the value of those shares is less than $10,000. We will redeem shares automatically in one of your accounts to pay the $12.50 fee. In determining your total eligible investment amount, we will include your investments in all personal accounts (including American Century Investments Brokerage accounts) registered under your Social Security number. Personal accounts include individual accounts, joint accounts, UGMA/UTMA accounts, personal trusts, Coverdell Education Savings Accounts and IRAs (including traditional, Roth, Rollover, SEP-, SARSEP- and SIMPLE-IRAs), and certain other retirement accounts. If you have only business, business retirement, employer-sponsored or American Century Investments Brokerage accounts, you are currently not subject to this fee. If you are subject to the Account Maintenance Fee, your account value could be reduced by the fee amount.
Hypothetical Example for Comparison Purposes
The table also provides information about hypothetical account values and hypothetical expenses based on the actual expense ratio of each class of your fund and an assumed rate of return of 5% per year before expenses, which is not the actual return of a fund’s share class. The hypothetical account values and expenses may not be used to estimate the actual ending account balance or expenses you paid for the period. You may use this information to compare the ongoing costs of investing in your fund and other funds. To do so, compare this 5% hypothetical example with the 5% hypothetical examples that appear in the shareholder reports of the other funds.
Please note that the expenses shown in the table are meant to highlight your ongoing costs only and do not reflect any transactional costs, such as sales charges (loads) or redemption/exchange fees. Therefore, the table is useful in comparing ongoing costs only, and will not help you determine the relative total costs of owning different funds. In addition, if these transactional costs were included, your costs would have been higher.
Beginning 6/1/13 | Ending 11/30/13 | Expenses Paid During Period(1) 6/1/13 - 11/30/13 | Annualized | |
Actual | ||||
Investor Class | $1,000 | $1,153.50 | $8.37 | 1.55% |
Institutional Class | $1,000 | $1,154.40 | $7.29 | 1.35% |
A Class | $1,000 | $1,151.90 | $9.71 | 1.80% |
C Class | $1,000 | $1,148.30 | $13.73 | 2.55% |
R Class | $1,000 | $1,151.40 | $11.06 | 2.05% |
Hypothetical | ||||
Investor Class | $1,000 | $1,017.30 | $7.84 | 1.55% |
Institutional Class | $1,000 | $1,018.30 | $6.83 | 1.35% |
A Class | $1,000 | $1,016.04 | $9.10 | 1.80% |
C Class | $1,000 | $1,012.28 | $12.86 | 2.55% |
R Class | $1,000 | $1,014.79 | $10.35 | 2.05% |
(1) | Expenses are equal to the class’s annualized expense ratio listed in the table above, multiplied by the average account value over the period, multiplied by 183, the number of days in the most recent fiscal half-year, divided by 365, to reflect the one-half year period. |
Schedule of Investments |
NOVEMBER 30, 2013
Shares | Value | |
Common Stocks — 98.5% | ||
AUSTRALIA — 3.0% | ||
Flight Centre Travel Group Ltd. | 142,580 | $6,319,158 |
Iluka Resources Ltd. | 157,650 | 1,258,503 |
James Hardie Industries SE | 345,600 | 3,944,864 |
Ramsay Health Care Ltd. | 118,110 | 4,164,924 |
Super Retail Group Ltd. | 307,620 | 3,833,353 |
19,520,802 | ||
BELGIUM — 2.0% | ||
Ageas | 303,820 | 12,818,399 |
BRAZIL — 0.4% | ||
Anhanguera Educacional Participacoes SA | 394,300 | 2,628,385 |
CANADA — 6.6% | ||
Africa Oil Corp.(1) | 718,890 | 7,049,865 |
Agnico-Eagle Mines Ltd. New York Shares | 118,620 | 3,266,795 |
Alimentation Couche Tard, Inc. B Shares | 129,180 | 9,434,255 |
Capstone Mining Corp.(1) | 1,346,680 | 3,409,317 |
Dollarama, Inc. | 51,505 | 4,154,137 |
Element Financial Corp.(1) | 717,630 | 9,860,616 |
West Fraser Timber Co. Ltd. | 68,330 | 6,032,049 |
43,207,034 | ||
CHINA — 6.8% | ||
China Gas Holdings Ltd. | 4,490,000 | 6,081,225 |
China State Construction International Holdings Ltd. | 2,812,000 | 4,940,238 |
Haier Electronics Group Co. Ltd. | 3,105,000 | 7,313,374 |
Shenzhou International Group Holdings Ltd. | 2,428,000 | 9,176,387 |
Sina Corp.(1) | 32,110 | 2,474,718 |
SouFun Holdings Ltd. ADR | 28,340 | 1,840,683 |
Vipshop Holdings Ltd. ADR(1) | 52,610 | 4,372,417 |
YY, Inc. ADR(1) | 167,860 | 8,456,787 |
44,655,829 | ||
DENMARK — 5.6% | ||
GN Store Nord A/S | 511,240 | 12,208,967 |
Jyske Bank A/S(1) | 93,930 | 5,078,315 |
Pandora A/S | 376,179 | 19,515,780 |
36,803,062 | ||
FRANCE — 8.2% | ||
Iliad SA | 41,520 | 9,827,913 |
JCDecaux SA | 99,260 | 3,906,642 |
Publicis Groupe SA | 36,880 | 3,260,324 |
Valeo SA | 105,900 | 11,261,380 |
Vallourec SA | 170,300 | 9,674,993 |
Zodiac Aerospace | 90,040 | 15,274,952 |
53,206,204 | ||
GERMANY — 7.5% | ||
Duerr AG | 55,260 | 4,820,607 |
ElringKlinger AG | 36,270 | 1,512,270 |
GEA Group AG | 156,150 | 7,278,724 |
Leoni AG | 67,890 | 5,072,772 |
OSRAM Licht AG(1) | 66,830 | 3,958,350 |
Sky Deutschland AG(1) | 590,490 | 6,057,805 |
Stada Arzneimittel AG | 99,250 | 5,129,438 |
United Internet AG | 242,870 | 9,756,804 |
Wirecard AG | 150,690 | 5,640,051 |
49,226,821 | ||
HONG KONG — 2.5% | ||
Techtronic Industries Co. | 2,098,000 | 5,642,440 |
Xinyi Glass Holdings Ltd. | 10,088,000 | 10,670,244 |
16,312,684 | ||
INDIA — 0.5% | ||
Zee Entertainment Enterprises Ltd. | 801,930 | 3,326,296 |
IRELAND — 3.0% | ||
Bank of Ireland(1) | 17,574,030 | 6,829,568 |
Smurfit Kappa Group plc | 542,870 | 12,908,914 |
19,738,482 | ||
ISRAEL — 0.2% | ||
Given Imaging Ltd.(1) | 56,380 | 1,319,292 |
ITALY — 1.1% | ||
Banca Generali SpA | 250,460 | 7,146,831 |
JAPAN — 13.6% | ||
Aeon Credit Service Co. Ltd. | 213,300 | 5,925,636 |
Daifuku Co. Ltd. | 373,000 | 4,773,322 |
Digital Garage, Inc. | 132,300 | 3,178,196 |
Dwango Co. Ltd. | 218,300 | 5,862,105 |
Ebara Corp. | 1,312,000 | 8,042,716 |
Jafco Co. Ltd. | 112,200 | 6,242,764 |
Japan Airport Terminal Co. Ltd. | 198,500 | 4,437,161 |
JGC Corp. | 134,000 | 4,990,092 |
Kakaku.com, Inc. | 290,400 | 5,312,212 |
Mabuchi Motor Co. Ltd. | 68,000 | 4,088,828 |
Mazda Motor Corp.(1) | 1,689,000 | 7,765,328 |
NTN Corp.(1) | 1,676,000 | 7,607,399 |
Ono Pharmaceutical Co. Ltd. | 40,100 | 3,037,493 |
Shares | Value |
Rinnai Corp. | 41,900 | $3,165,660 |
THK Co. Ltd. | 136,900 | 3,318,100 |
Tokyo Tatemono Co. Ltd. | 146,000 | 1,442,257 |
Tokyu Fudosan Holdings Corp.(1) | 580,100 | 5,311,473 |
Yaskawa Electric Corp. | 288,000 | 3,857,055 |
88,357,797 | ||
NETHERLANDS — 1.5% | ||
Reed Elsevier NV | 448,820 | 9,586,952 |
PHILIPPINES — 0.6% | ||
Universal Robina Corp. | 1,389,970 | 3,826,188 |
SINGAPORE — 1.0% | ||
Ezion Holdings Ltd. | 3,914,400 | 6,550,775 |
SOUTH KOREA — 3.0% | ||
Daewoo International Corp. | 94,050 | 3,457,002 |
Hankook Tire Co. Ltd. | 83,870 | 4,953,109 |
Hotel Shilla Co. Ltd. | 50,500 | 3,278,229 |
Seoul Semiconductor Co. Ltd. | 193,820 | 7,655,368 |
19,343,708 | ||
SPAIN — 3.2% | ||
Bankinter SA | 1,144,160 | 7,232,398 |
Grifols SA | 218,300 | 9,982,956 |
Indra Sistemas SA | 236,280 | 3,605,475 |
20,820,829 | ||
SWEDEN — 4.7% | ||
Intrum Justitia AB | 101,390 | 2,581,373 |
Kinnevik Investment AB B Shares | 120,720 | 4,746,459 |
Modern Times Group AB B Shares | 268,380 | 13,534,894 |
Trelleborg AB B Shares | 499,300 | 9,705,344 |
30,568,070 | ||
SWITZERLAND — 6.4% | ||
AMS AG | 35,960 | 3,842,372 |
Baloise Holding AG | 69,080 | 8,154,854 |
Cembra Money Bank AG(1) | 65,670 | 4,111,620 |
Clariant AG | 165,640 | 2,901,990 |
Lindt & Spruengli AG | 1,960 | 8,459,312 |
Lonza Group AG | 110,280 | 10,274,874 |
OC Oerlikon Corp. AG | 294,680 | 4,275,201 |
42,020,223 | ||
TAIWAN — 3.5% | ||
Advanced Semiconductor Engineering, Inc. | 4,525,000 | 4,495,337 |
Eclat Textile Co. Ltd. | 588,020 | 7,490,827 |
Hermes Microvision, Inc. | 113,041 | 3,517,969 |
St. Shine Optical Co. Ltd. | 238,000 | 7,165,574 |
22,669,707 | ||
THAILAND — 0.6% | ||
Airports of Thailand PCL | 649,500 | 3,792,627 |
UNITED KINGDOM — 13.0% | ||
Ashtead Group plc | 1,328,090 | 15,114,281 |
Babcock International Group plc | 389,210 | 8,342,921 |
Countrywide plc | 471,240 | 4,113,764 |
Genel Energy plc(1) | 199,280 | 3,466,249 |
GKN plc | 2,058,870 | 12,771,607 |
Hays plc | 3,183,370 | 6,459,095 |
London Stock Exchange Group plc | 308,450 | 8,211,740 |
Merlin Entertainments plc(1)(2) | 636,630 | 3,661,637 |
Schroders plc | 59,790 | 2,412,595 |
St. James’s Place plc | 570,800 | 5,977,599 |
Taylor Wimpey plc | 2,797,630 | 4,870,738 |
Travis Perkins plc | 319,210 | 9,380,925 |
84,783,151 | ||
TOTAL COMMON STOCKS (Cost $515,629,782) | 642,230,148 | |
Temporary Cash Investments — 2.5% | ||
Repurchase Agreement, Bank of America Merrill Lynch, (collateralized by various U.S. Treasury obligations, 0.375%, 6/30/15, valued at $2,617,137), in a joint trading account at 0.06%, dated 11/29/13, due 12/2/13 (Delivery value $2,564,568) | 2,564,555 | |
Repurchase Agreement, Credit Suisse First Boston, Inc., (collateralized by various U.S. Treasury obligations, 2.75%, 11/15/42, valued at $3,129,810), in a joint trading account at 0.03%, dated 11/29/13, due 12/2/13 (Delivery value $3,077,473) | 3,077,465 | |
Repurchase Agreement, Goldman Sachs & Co., (collateralized by various U.S. Treasury obligations, 0.00%, 5/29/14, valued at $2,618,361), in a joint trading account at 0.04%, dated 11/29/13, due 12/2/13 (Delivery value $2,567,087) | 2,567,078 | |
SSgA U.S. Government Money Market Fund | 8,202,881 | 8,202,881 |
TOTAL TEMPORARY CASH INVESTMENTS (Cost $16,411,979) | 16,411,979 | |
TOTAL INVESTMENT SECURITIES — 101.0% (Cost $532,041,761) | 658,642,127 | |
OTHER ASSETS AND LIABILITIES — (1.0)% | (6,627,506) | |
TOTAL NET ASSETS — 100.0% | $652,014,621 | |
Market Sector Diversification | |
(as a % of net assets) | |
Consumer Discretionary | 26.8% |
Industrials | 22.4% |
Financials | 16.9% |
Information Technology | 10.8% |
Health Care | 8.1% |
Materials | 5.1% |
Consumer Staples | 3.4% |
Energy | 2.6% |
Telecommunication Services | 1.5% |
Utilities | 0.9% |
Cash and Equivalents* | 1.5% |
* Includes temporary cash investments and other assets and liabilities.
Notes to Schedule of Investments
ADR = American Depositary Receipt
(1) | Non-income producing. |
(2) | Security was purchased pursuant to Rule 144A under the Securities Act of 1933 and may be sold in transactions exempt from registration only to qualified institutional investors. The aggregate value of these securities at the period end was $3,661,637, which represented 0.6% of total net assets. |
See Notes to Financial Statements.
Statement of Assets and Liabilities |
NOVEMBER 30, 2013 | |||
Assets | |||
Investment securities, at value (cost of $532,041,761) | $658,642,127 | ||
Foreign currency holdings, at value (cost of $55,445) | 53,603 | ||
Receivable for investments sold | 3,703,745 | ||
Receivable for capital shares sold | 120,358 | ||
Dividends and interest receivable | 228,587 | ||
Other assets | 121,190 | ||
| 662,869,610 | |||
Liabilities | |||
Disbursements in excess of demand deposit cash | 8,151,871 | ||
Payable for investments purchased | 1,657,261 | ||
Payable for capital shares redeemed | 240,827 | ||
Accrued management fees | 803,900 | ||
Distribution and service fees payable | 1,130 | ||
| 10,854,989 | |||
Net Assets | $652,014,621 | ||
Net Assets Consist of: | |||
Capital (par value and paid-in surplus) | $737,116,748 | ||
Undistributed net investment income | 2,027,726 | ||
Accumulated net realized loss | (213,670,390 | ) | |
Net unrealized appreciation | 126,540,537 | ||
| $652,014,621 | |||
Net assets | Shares outstanding | Net asset value per share | |
Investor Class, $0.01 Par Value | $620,359,395 | 48,844,449 | $12.70 |
Institutional Class, $0.01 Par Value | $27,340,597 | 2,125,756 | $12.86 |
A Class, $0.01 Par Value | $3,585,305 | 289,972 | $12.36* |
C Class, $0.01 Par Value | $341,587 | 27,575 | $12.39 |
R Class, $0.01 Par Value | $387,737 | 30,897 | $12.55 |
* Maximum offering price $13.11 (net asset value divided by 0.9425).
See Notes to Financial Statements.
Statement of Operations |
YEAR ENDED NOVEMBER 30, 2013 | ||
Investment Income (Loss) | ||
Income: | ||
Dividends (net of foreign taxes withheld of $809,938) | $9,856,876 | |
Interest | 3,552 | |
| 9,860,428 | ||
Expenses: | ||
Management fees | 9,566,704 | |
Distribution and service fees: | ||
A Class | 7,974 | |
C Class | 1,709 | |
R Class | 1,663 | |
Directors’ fees and expenses | 21,680 | |
Other expenses | 11,131 | |
| 9,610,861 | ||
Net investment income (loss) | 249,567 | |
Realized and Unrealized Gain (Loss) | ||
Net realized gain (loss) on: | ||
Investment transactions (net of foreign tax expenses paid (refunded) of $(1,177)) | 129,160,721 | |
Foreign currency transactions | (806,890 | ) |
| 128,353,831 | ||
Change in net unrealized appreciation (depreciation) on: | ||
Investments | 25,997,105 | |
Translation of assets and liabilities in foreign currencies | 2,771 | |
| 25,999,876 | ||
Net realized and unrealized gain (loss) | 154,353,707 | |
Net Increase (Decrease) in Net Assets Resulting from Operations | $154,603,274 | |
See Notes to Financial Statements.
Statement of Assets and Liabilities |
YEARS ENDED NOVEMBER 30, 2013 AND NOVEMBER 30, 2012 | ||||||
Increase (Decrease) in Net Assets | November 30, 2013 | November 30, 2012 | ||||
Operations | ||||||
Net investment income (loss) | $249,567 | $2,990,571 | ||||
Net realized gain (loss) | 128,353,831 | 10,749,994 | ||||
Change in net unrealized appreciation (depreciation) | 25,999,876 | 44,357,383 | ||||
Net increase (decrease) in net assets resulting from operations | 154,603,274 | 58,097,948 | ||||
Distributions to Shareholders | ||||||
From net investment income: | ||||||
Investor Class | (8,871,910 | ) | (127,731 | ) | ||
Institutional Class | (778,029 | ) | (157,604 | ) | ||
A Class | (41,551 | ) | — | |||
C Class | (566 | ) | — | |||
R Class | (3,285 | ) | — | |||
Decrease in net assets from distributions | (9,695,341 | ) | (285,335 | ) | ||
Capital Share Transactions | ||||||
Net increase (decrease) in net assets from capital share transactions | (127,252,463 | ) | (184,810,428 | ) | ||
Redemption Fees | ||||||
Increase in net assets from redemption fees | 12,796 | 14,035 | ||||
Net increase (decrease) in net assets | 17,668,266 | (126,983,780 | ) | |||
Net Assets | ||||||
Beginning of period | 634,346,355 | 761,330,135 | ||||
End of period | $652,014,621 | $634,346,355 | ||||
Undistributed net investment income | $2,027,726 | $3,383,141 | ||||
See Notes to Financial Statements.
Notes to Financial Statements |
November 30, 2013
1. Organization
American Century World Mutual Funds, Inc. (the corporation) is registered under the Investment Company Act of 1940, as amended (the 1940 Act), as an open-end management investment company and is organized as a Maryland corporation. International Discovery Fund (the fund) is one fund in a series issued by the corporation. The fund is diversified as defined under the 1940 Act. The fund’s investment objective is to seek capital growth.
The fund offers the Investor Class, the Institutional Class, the A Class, the C Class and the R Class. The A Class may incur an initial sales charge. The A Class and C Class may be subject to a contingent deferred sales charge. The share classes differ principally in their respective sales charges and distribution and shareholder servicing expenses and arrangements. The Institutional Class is made available to institutional shareholders or through financial intermediaries whose clients do not require the same level of shareholder and administrative services as shareholders of other classes. As a result, the Institutional Class is charged a lower unified management fee.
2. Significant Accounting Policies
The following is a summary of significant accounting policies consistently followed by the fund in preparation of its financial statements. The financial statements are prepared in conformity with accounting principles generally accepted in the United States of America, which may require management to make certain estimates and assumptions at the date of the financial statements. Actual results could differ from these estimates.
Investment Valuations — The fund determines the fair value of its investments and computes its net asset value per share at the close of regular trading (usually 4 p.m. Eastern time) on the New York Stock Exchange (NYSE) on each day the NYSE is open. The Board of Directors has adopted valuation policies and procedures to guide the investment advisor in the fund’s investment valuation process and to provide methodologies for the oversight of the fund’s pricing function.
Equity securities that are listed or traded on a domestic securities exchange are valued at the last reported sales price or at the official closing price as provided by the exchange. Equity securities traded on foreign securities exchanges are generally valued at the closing price of such securities on the exchange where primarily traded or at the close of the NYSE, if that is earlier. If no last sales price is reported, or if local convention or regulation so provides, the mean of the latest bid and asked prices may be used. Securities traded over-the-counter are valued at the mean of the latest bid and asked prices, the last sales price, or the official closing price. Equity securities initially expressed in local currencies are translated into U.S. dollars at the mean of the appropriate currency exchange rate at the close of the NYSE as provided by an independent pricing service.
Fixed income securities maturing within 60 days at the time of purchase may be valued at cost, plus or minus any amortized discount or premium or at the evaluated mean as provided by an independent pricing service. Evaluated mean prices are commonly derived through utilization of market models, which may consider, among other factors: trade data, quotations from dealers and active market makers, relevant yield curve and spread data, related sector levels, creditworthiness, trade data or market information on comparable securities, and other relevant security specific information.
Open-end management investment companies are valued at the reported net asset value per share. Repurchase agreements are valued at cost, which approximates fair value.
If the fund determines that the market price for an investment is not readily available or the valuation methods mentioned above do not reflect an investment’s fair value, such investment is valued as determined in good faith by the Board of Directors or its delegate, in accordance with policies and procedures adopted by the Board of Directors. In its determination of fair value, the fund may review several factors including, but not limited to, market information regarding the specific investment or comparable investments and
correlation with other investment types, futures indices or general market indicators. Circumstances that may cause the fund to use these procedures to value an investment include, but are not limited to: an investment has been declared in default or is distressed; trading in a security has been suspended during the trading day or a security is not actively trading on its principal exchange; prices received from a regular pricing source are deemed unreliable; or there is a foreign market holiday and no trading occurred.
The fund monitors for significant events occurring after the close of an investment’s primary exchange but before the fund’s net asset value per share is determined. Significant events may include, but are not limited to: corporate announcements and transactions; governmental action and political unrest that could impact a specific investment or an investment sector; or armed conflicts, natural disasters and similar events that could affect investments in a specific country or region. The fund also monitors for significant fluctuations in domestic and foreign markets, as evidenced by the U.S. market or such other indicators that the Board of Directors, or its delegate, deems appropriate. If significant fluctuations in foreign markets are identified, the fund may apply a model-derived factor to the closing price of equity securities traded on foreign securities exchanges. The factor is based on observable market data as provided by an independent pricing service.
Security Transactions — Security transactions are accounted for as of the trade date. Net realized gains and losses are determined on the identified cost basis, which is also used for federal income tax purposes. Certain countries impose taxes on realized gains on the sale of securities registered in their country. The fund records the foreign tax expense, if any, on an accrual basis. The foreign tax expense on realized gains and unrealized appreciation reduces the net realized gain (loss) on investment transactions and net unrealized appreciation (depreciation) on investments, respectively.
Investment Income — Dividend income less foreign taxes withheld, if any, is recorded as of the ex-dividend date. Distributions received on securities that represent a return of capital or long-term capital gain are recorded as a reduction of cost of investments and/or as a realized gain. The fund may estimate the components of distributions received that may be considered nontaxable distributions or long-term capital gain distributions for income tax purposes. Interest income is recorded on the accrual basis and includes accretion of discounts and amortization of premiums.
Foreign Currency Translations — All assets and liabilities initially expressed in foreign currencies are translated into U.S. dollars at prevailing exchange rates at period end. The fund may enter into spot foreign currency exchange contracts to facilitate transactions denominated in a foreign currency. Purchases and sales of investment securities, dividend and interest income, spot foreign currency exchange contracts, and expenses are translated at the rates of exchange prevailing on the respective dates of such transactions. Net realized and unrealized foreign currency exchange gains or losses related to investment securities are a component of net realized gain (loss) on investment transactions and change in net unrealized appreciation (depreciation) on investments, respectively.
Repurchase Agreements — The fund may enter into repurchase agreements with institutions that American Century Investment Management, Inc. (ACIM) (the investment advisor) has determined are creditworthy pursuant to criteria adopted by the Board of Directors. The fund requires that the collateral, represented by securities, received in a repurchase transaction be transferred to the custodian in a manner sufficient to enable the fund to obtain those securities in the event of a default under the repurchase agreement. ACIM monitors, on a daily basis, the securities transferred to ensure the value, including accrued interest, of the securities under each repurchase agreement is equal to or greater than amounts owed to the fund under each repurchase agreement.
Joint Trading Account — Pursuant to an Exemptive Order issued by the Securities and Exchange Commission, the fund, along with certain other funds in the American Century Investments family of funds, may transfer uninvested cash balances into a joint trading account. These balances are invested in one or more repurchase agreements that are collateralized by U.S. Treasury or Agency obligations.
Income Tax Status — It is the fund’s policy to distribute substantially all net investment income and net realized gains to shareholders and to otherwise qualify as a regulated investment company under provisions of the Internal Revenue Code. Accordingly, no provision has been made for income taxes. The fund files U.S. federal, state, local and non-U.S. tax returns as applicable. The fund’s tax returns are subject to examination by the relevant taxing authority until expiration of the applicable statute of limitations, which is generally three years from the date of filing but can be longer in certain jurisdictions. At this time, management believes there are no uncertain tax positions which, based on their technical merit, would not be sustained upon examination and for which it is reasonably possible that the total amounts of unrecognized tax benefits will significantly change in the next twelve months.
Multiple Class — All shares of the fund represent an equal pro rata interest in the net assets of the class to which such shares belong, and have identical voting, dividend, liquidation and other rights and the same terms and conditions, except for class specific expenses and exclusive rights to vote on matters affecting only individual classes. Income, non-class specific expenses, and realized and unrealized capital gains and losses of the fund are allocated to each class of shares based on their relative net assets.
Distributions to Shareholders — Distributions from net investment income and net realized gains, if any, are generally declared and paid annually. The fund may make distributions on a more frequent basis to comply with the distribution requirements of the Internal Revenue Code, in all events in a manner consistent with provisions of the 1940 Act.
Redemption — The fund may impose a 2.00% redemption fee on shares held less than 60 days. The fee may not be applicable to all classes. The redemption fee is retained by the fund and helps cover transaction costs that long-term investors may bear when the fund sells securities to meet investor redemptions.
Indemnifications — Under the corporation’s organizational documents, its officers and directors are indemnified against certain liabilities arising out of the performance of their duties to the fund. In addition, in the normal course of business, the fund enters into contracts that provide general indemnifications. The maximum exposure under these arrangements is unknown as this would involve future claims that may be made against a fund. The risk of material loss from such claims is considered by management to be remote.
3. Fees and Transactions with Related Parties
Management Fees — The corporation has entered into a management agreement with ACIM, under which ACIM provides the fund with investment advisory and management services in exchange for a single, unified management fee (the fee) per class. The agreement provides that all expenses of managing and operating the fund, except distribution and service fees, brokerage expenses, taxes, interest, fees and expenses of the independent directors (including legal counsel fees), and extraordinary expenses, will be paid by ACIM. The fee is computed and accrued daily based on each class’s daily net assets and paid monthly in arrears. The rate of the fee is determined by applying a fee rate calculation formula. This formula takes into account the fund’s assets as well as certain assets, if any, of other clients of the investment advisor outside the American Century Investments family of funds (such as subadvised funds and separate accounts) that have very similar investment teams and investment strategies (strategy assets). The annual management fee schedule ranges from 1.200% to 1.750% for the Investor Class, A Class, C Class and R Class. The Institutional Class is 0.200% less at each point within the range. The effective annual management fee for each class for the year ended November 30, 2013 was 1.55% for the Investor Class, A Class, C Class and R Class and 1.35% for the Institutional Class.
Distribution and Service Fees — The Board of Directors has adopted a separate Master Distribution and Individual Shareholder Services Plan for each of the A Class, C Class and R Class (collectively the plans), pursuant to Rule 12b-1 of the 1940 Act. The plans provide that the A Class will pay American Century Investment Services, Inc. (ACIS) an annual distribution and service fee of 0.25%. The plans provide that the C Class will pay ACIS an annual distribution and service fee of 1.00%, of which 0.25% is paid for individual shareholder services and 0.75% is paid for distribution services. The plans provide that the R Class will pay ACIS an annual distribution and service fee of 0.50%. The fees are
computed and accrued daily based on each class’s daily net assets and paid monthly in arrears. The fees are used to pay financial intermediaries for distribution and individual shareholder services. Fees incurred under the plans during the year ended November 30, 2013 are detailed in the Statement of Operations.
Related Parties — Certain officers and directors of the corporation are also officers and/or directors of American Century Companies, Inc. (ACC). The corporation’s investment advisor, ACIM, the corporation’s distributor, ACIS, and the corporation’s transfer agent, American Century Services, LLC, are wholly owned, directly or indirectly, by ACC.
4. Investment Transactions
Purchases and sales of investment securities, excluding short-term investments, for the year ended November 30, 2013 were $954,459,814 and $1,091,266,727, respectively.
5. Capital Share Transactions
Transactions in shares of the fund were as follows:
Year ended November 30, 2013 | Year ended November 30, 2012 | |||||||||||
Shares | Amount | Shares | Amount | |||||||||
Investor Class/Shares Authorized | 400,000,000 | 400,000,000 | ||||||||||
Sold | 1,547,181 | $17,131,175 | 1,827,340 | $17,168,755 | ||||||||
Issued in reinvestment of distributions | 795,041 | 8,371,778 | 13,080 | 121,513 | ||||||||
Redeemed | (11,283,868 | ) | (122,824,641 | ) | (15,736,044 | ) | (147,750,250 | ) | ||||
| (8,941,646 | ) | (97,321,688 | ) | (13,895,624 | ) | (130,459,982 | ) | |||||
Institutional Class/Shares Authorized | 70,000,000 | 70,000,000 | ||||||||||
Sold | 264,674 | 2,892,178 | 486,509 | 4,595,111 | ||||||||
Issued in reinvestment of distributions | 73,013 | 777,585 | 16,519 | 155,111 | ||||||||
Redeemed | (2,993,465 | ) | (33,838,869 | ) | (6,115,536 | ) | (58,743,683 | ) | ||||
| (2,655,778 | ) | (30,169,106 | ) | (5,612,508 | ) | (53,993,461 | ) | |||||
A Class/Shares Authorized | 10,000,000 | 10,000,000 | ||||||||||
Sold | 145,076 | 1,601,685 | 85,362 | 792,185 | ||||||||
Issued in reinvestment of distributions | 3,872 | 39,768 | — | — | ||||||||
Redeemed | (148,232 | ) | (1,628,334 | ) | (149,671 | ) | (1,381,498 | ) | ||||
| 716 | 13,119 | (64,309 | ) | (589,313 | ) | |||||||
C Class/Shares Authorized | 10,000,000 | 10,000,000 | ||||||||||
Sold | 27,306 | 303,661 | 3,359 | 30,564 | ||||||||
Issued in reinvestment of distributions | 55 | 566 | — | — | ||||||||
Redeemed | (9,219 | ) | (97,824 | ) | (3,562 | ) | (32,134 | ) | ||||
| 18,142 | 206,403 | (203 | ) | (1,570 | ) | |||||||
R Class/Shares Authorized | 10,000,000 | 10,000,000 | ||||||||||
Sold | 2,569 | 28,230 | 34,192 | 304,860 | ||||||||
Issued in reinvestment of distributions | 315 | 3,285 | — | — | ||||||||
Redeemed | (1,158 | ) | (12,706 | ) | (7,962 | ) | (70,962 | ) | ||||
| 1,726 | 18,809 | 26,230 | 233,898 | |||||||||
Net increase (decrease) | (11,576,840 | ) | $(127,252,463 | ) | (19,546,414 | ) | $(184,810,428 | ) | ||||
6. Fair Value Measurements
The fund’s investments valuation process is based on several considerations and may use multiple inputs to determine the fair value of the investments held by the fund. In conformity with accounting principles generally accepted in the United States of America, the inputs used to determine a valuation are classified into three broad levels.
• | Level 1 valuation inputs consist of unadjusted quoted prices in an active market for identical investments. |
• | Level 2 valuation inputs consist of direct or indirect observable market data (including quoted prices for comparable investments, evaluations of subsequent market events, interest rates, prepayment speeds, credit risk, etc.). These inputs also consist of quoted prices for identical investments initially expressed in local currencies that are adjusted through translation into U.S. dollars. |
• | Level 3 valuation inputs consist of unobservable data (including a fund’s own assumptions). |
The level classification is based on the lowest level input that is significant to the fair valuation measurement. The valuation inputs are not necessarily an indication of the risks associated with investing in these securities or other financial instruments.
The following is a summary of the level classifications as of period end. The Schedule of Investments provides additional information on the fund’s portfolio holdings.
Level 1 | Level 2 | Level 3 | |
Assets | |||
Investment Securities | |||
Common Stocks | $21,730,692 | $620,499,456 | — |
Temporary Cash Investments | 8,202,881 | 8,209,098 | — |
Total Value of Investment Securities | $29,933,573 | $628,708,554 | — |
7. Risk Factors
There are certain risks involved in investing in foreign securities. These risks include those resulting from future adverse political, social and economic developments, fluctuations in currency exchange rates, the possible imposition of exchange controls, and other foreign laws or restrictions. Investing in emerging markets may accentuate these risks.
The fund invests in common stocks of small companies. Because of this, it may be subject to greater risk and market fluctuations than a fund investing in larger, more established companies.
The fund’s investment process may result in high portfolio turnover, which could mean high transaction costs, affecting both performance and capital gains tax liabilities to investors.
8. Federal Tax Information
On December 17, 2013, the fund declared and paid the following per-share distributions from net investment income to shareholders of record on December 16, 2013:
Investor Class | Institutional Class | A Class | C Class | R Class |
$0.0633 | $0.0883 | $0.0321 | — | $0.0009 |
The tax character of distributions paid during the years ended November 30, 2013 and November 30, 2012 were as follows:
2013 | 2012 | |
Distributions Paid From | ||
Ordinary income | $9,695,341 | $285,335 |
Long-term capital gains | — | — |
The book-basis character of distributions made during the year from net investment income or net realized gains may differ from their ultimate characterization for federal income tax purposes. These differences reflect the differing character of certain income items and net realized gains and losses for financial statement and tax purposes, and may result in reclassification among certain capital accounts on the financial statements.
The reclassifications, which are primarily due to gains on investments in passive foreign investment companies, were made to undistributed net investment income $8,090,359, and accumulated net realized loss $(8,090,359).
As of November 30, 2013, the federal tax cost of investments and the components of distributable earnings on a tax-basis were as follows:
Federal tax cost of investments | $539,422,555 |
Gross tax appreciation of investments | $122,520,914 |
Gross tax depreciation of investments | (3,301,342) |
Net tax appreciation (depreciation) of investments | $119,219,572 |
Net tax appreciation (depreciation) on translation of assets and liabilties in foreign currencies | $(61,503) |
Net tax appreciation (depreciation) | $119,158,069 |
Undistributed ordinary income | $7,188,890 |
Accumulated short-term capital losses | $(211,449,086) |
The difference between book-basis and tax-basis unrealized appreciation (depreciation) is attributable primarily to the realization to ordinary income for tax purposes of unrealized gains on investments in passive foreign investment companies.
Accumulated capital losses represent net capital loss carryovers that may be used to offset future realized capital gains for federal income tax purposes. Future capital loss carryover utilization in any given year may be subject to Internal Revenue Code limitations. Capital loss carryovers expire in 2017.
Financial Highlights |
For a Share Outstanding Throughout the Years Ended November 30 (except as noted) | |||||||||||
Per-Share Data | Ratios and Supplemental Data | ||||||||||
Income From Investment Operations: | Ratio to Average Net Assets of: | ||||||||||
Net Asset | Net Income | Net | Total From Operations | Distributions Investment Income | Net | Total | Operating | Net | Portfolio | Net Assets, | |
Investor Class | |||||||||||
2013 | $10.08 | —(3) | 2.79 | 2.79 | (0.17) | $12.70 | 27.97% | 1.56% | 0.03% | 157% | $620,359 |
2012 | $9.22 | 0.04 | 0.82 | 0.86 | —(3) | $10.08 | 9.23% | 1.50% | 0.42% | 154% | $582,331 |
2011 | $9.88 | 0.02 | (0.68) | (0.66) | — | $9.22 | (6.58)% | 1.42% | 0.14% | 167% | $660,971 |
2010 | $8.55 | —(3) | 1.35 | 1.35 | (0.02) | $9.88 | 15.80% | 1.43% | 0.00%(4) | 199% | $878,530 |
2009 | $6.26 | 0.01 | 2.34 | 2.35 | (0.06) | $8.55 | 38.06% | 1.48% | 0.13% | 207% | $872,865 |
Institutional Class | |||||||||||
2013 | $10.20 | 0.05 | 2.80 | 2.85 | (0.19) | $12.86 | 28.16% | 1.36% | 0.23% | 157% | $27,341 |
2012 | $9.34 | 0.05 | 0.83 | 0.88 | (0.02) | $10.20 | 9.44% | 1.30% | 0.62% | 154% | $48,794 |
2011 | $9.99 | 0.03 | (0.68) | (0.65) | — | $9.34 | (6.41)% | 1.22% | 0.34% | 167% | $97,063 |
2010 | $8.66 | 0.02 | 1.36 | 1.38 | (0.05) | $9.99 | 16.06% | 1.23% | 0.20% | 199% | $97,167 |
2009 | $6.34 | 0.02 | 2.37 | 2.39 | (0.07) | $8.66 | 38.32% | 1.28% | 0.33% | 207% | $79,830 |
A Class(5) | |||||||||||
2013 | $9.81 | (0.03) | 2.72 | 2.69 | (0.14) | $12.36 | 27.69% | 1.81% | (0.22)% | 157% | $3,585 |
2012 | $9.00 | 0.01 | 0.80 | 0.81 | — | $9.81 | 8.88% | 1.75% | 0.17% | 154% | $2,838 |
2011 | $9.67 | (0.02) | (0.65) | (0.67) | — | $9.00 | (6.83)% | 1.67% | (0.11)% | 167% | $3,182 |
2010 | $8.37 | (0.02) | 1.32 | 1.30 | — | $9.67 | 15.53% | 1.68% | (0.25)% | 199% | $4,814 |
2009 | $6.13 | —(3) | 2.29 | 2.29 | (0.05) | $8.37 | 37.71% | 1.73% | (0.12)% | 207% | $6,342 |
For a Share Outstanding Throughout the Years Ended November 30 (except as noted) | |||||||||||
Per-Share Data | Ratios and Supplemental Data | ||||||||||
Income From Investment Operations: | Ratio to Average Net Assets of: | ||||||||||
Net Asset | Net Income | Net | Total From Operations | Distributions Investment Income | Net | Total | Operating | Net | Portfolio | Net Assets, | |
C Class | |||||||||||
2013 | $9.83 | (0.14) | 2.76 | 2.62 | (0.06) | $12.39 | 26.75% | 2.56% | (0.97)% | 157% | $342 |
2012 | $9.08 | (0.05) | 0.80 | 0.75 | — | $9.83 | 8.14% | 2.50% | (0.58)% | 154% | $93 |
2011 | $9.82 | (0.07) | (0.67) | (0.74) | — | $9.08 | (7.43)% | 2.42% | (0.86)% | 167% | $87 |
2010(6) | $8.50 | (0.05) | 1.37 | 1.32 | — | $9.82 | 15.53% | 2.43%(7) | (0.77)%(7) | 199%(8) | $77 |
R Class | |||||||||||
2013 | $9.96 | (0.06) | 2.76 | 2.70 | (0.11) | $12.55 | 27.35% | 2.06% | (0.47)% | 157% | $388 |
2012 | $9.15 | —(3) | 0.81 | 0.81 | — | $9.96 | 8.73% | 2.00% | (0.08)% | 154% | $290 |
2011 | $9.86 | (0.04) | (0.67) | (0.71) | — | $9.15 | (7.10)% | 1.92% | (0.36)% | 167% | $27 |
2010(6) | $8.50 | (0.01) | 1.37 | 1.36 | — | $9.86 | 16.00% | 1.93%(7) | (0.16)%(7) | 199%(8) | $29 |
Notes to Financial Highlights
(1) | Computed using average shares outstanding throughout the period. |
(2) | Total returns are calculated based on the net asset value of the last business day and do not reflect applicable sales charges, if any. Total returns for periods less than one year are not annualized. |
(3) | Per-share amount was less than $0.005. |
(4) | Ratio was less than 0.005%. |
(5) | Prior to March 1, 2010, the A Class was referred to as the Advisor Class. |
(6) | March 1, 2010 (commencement of sale) through November 30, 2010. |
(7) | Annualized. |
(8) | Portfolio turnover is calculated at the fund level. Percentage indicated was calculated for the year ended November 30, 2010. |
See Notes to Financial Statements.
Report of Independent Registered Public Accounting Firm |
To the Board of Directors and Shareholders of
American Century World Mutual Funds, Inc.:
We have audited the accompanying statement of assets and liabilities, including the schedule of investments, of International Discovery Fund (the “Fund”), one of the funds constituting American Century World Mutual Funds, Inc., as of November 30, 2013, and the related statement of operations for the year then ended, the statements of changes in net assets for each of the two years in the period then ended, and the financial highlights for each of the periods presented. These financial statements and financial highlights are the responsibility of the Fund’s management. Our responsibility is to express an opinion on these financial statements and financial highlights based on our audits.
We conducted our audits in accordance with the standards of the Public Company Accounting Oversight Board (United States). Those standards require that we plan and perform the audit to obtain reasonable assurance about whether the financial statements and financial highlights are free of material misstatement. The Fund is not required to have, nor were we engaged to perform, an audit of its internal control over financial reporting. Our audits included consideration of internal control over financial reporting as a basis for designing audit procedures that are appropriate in the circumstances, but not for the purpose of expressing an opinion on the effectiveness of the Fund’s internal control over financial reporting. Accordingly, we express no such opinion. An audit also includes examining, on a test basis, evidence supporting the amounts and disclosures in the financial statements, assessing the accounting principles used and significant estimates made by management, as well as evaluating the overall financial statement presentation. Our procedures included confirmation of securities owned as of November 30, 2013, by correspondence with the custodian and brokers; where replies were not received from brokers, we performed other auditing procedures. We believe that our audits provide a reasonable basis for our opinion.
In our opinion, the financial statements and financial highlights referred to above present fairly, in all material respects, the financial position of International Discovery Fund of American Century World Mutual Funds, Inc. as of November 30, 2013, the results of its operations for the year then ended, the changes in its net assets for each of the two years in the period then ended, and the financial highlights for each of the periods presented, in conformity with accounting principles generally accepted in the United States of America.
Deloitte & Touche LLP
Kansas City, Missouri
January 17, 2014
Management |
The Board of Directors
The individuals listed below serve as directors of the funds. Each director will continue to serve in this capacity until death, retirement, resignation or removal from office. The board has adopted a mandatory retirement age for directors who are not “interested persons,” as that term is defined in the Investment Company Act (independent directors). Independent directors shall retire by December 31 of the year in which they reach their 75th birthday. Mr. Pratt may serve until December 31 of the year in which he reaches his 76th birthday based on an extension granted under previous retirement guidelines.
Mr. Thomas is an “interested person” because he currently serves as President and Chief Executive Officer of American Century Companies, Inc. (ACC), the parent company of American Century Investment Management, Inc. (ACIM or the advisor). Mr. Fink is treated as an “interested person” because of his recent employment with ACC and American Century Services, LLC (ACS). The other directors (more than three-fourths of the total number) are independent. They are not employees, directors or officers of, and have no financial interest in, ACC or any of its wholly owned, direct or indirect, subsidiaries, including ACIM, American Century Investment Services, Inc. (ACIS) and ACS, and do not have any other affiliations, positions, or relationships that would cause them to be considered “interested persons” under the Investment Company Act. The directors serve in this capacity for seven (in the case of Mr. Thomas, 15) registered investment companies in the American Century Investments family of funds.
The following table presents additional information about the directors. The mailing address for each director is 4500 Main Street, Kansas City, Missouri 64111.
Name | Position(s) Held with Funds | Length of Time Served | Principal Occupation(s) During Past 5 Years | Number of American Century Portfolios Overseen by Director | Other Directorships Held During Past 5 Years | |
Independent Directors | ||||||
Thomas A. Brown | Director | Since 1980 | Managing Member, Associated Investments, LLC (real estate investment company); Brown Cascade Properties, LLC (real estate investment company) (2001 to 2009) | 75 | None | |
Andrea C. Hall | Director | Since 1997 | Retired | 75 | None | |
Jan M. Lewis (1957) | Director | Since 2011 | President and Chief Executive Officer, Catholic Charities of Northeast Kansas (human services organization) | 75 | None | |
James A. Olson (1942) | Director | Since 2007 | Member, Plaza Belmont LLC (private equity fund manager) | 75 | Saia, Inc. (2002 to 2012) and EPR Properties (2003 to 2013) | |
Donald H. Pratt(1) (1937) | Director and Chairman of the Board | Since 1995 (Chairman since 2005) | Chairman and Chief Executive Officer, Western Investments, Inc. (real estate company) | 75 | None | |
Name | Position(s) Held with Funds | Length of Time Served | Principal Occupation(s) During Past 5 Years | Number of American Century Portfolios Overseen by Director | Other Directorships Held During Past 5 Years | |
Independent Directors | ||||||
M. Jeannine Strandjord | Director | Since 1994 | Retired | 75 | Euronet Worldwide Inc.; Charming Shoppes, Inc. (2006 to 2010); and DST Systems Inc. (1996 to 2012) | |
John R. Whitten | Director | Since 2008 | Retired | 75 | Rudolph Technologies, Inc. | |
Stephen E. Yates | Director | Since 2012 | Retired; Executive Vice President, Technology & Operations, KeyCorp. (computer services) (2004 to 2010) | 75 | Applied Industrial Technologies, Inc. (2001 to 2010) | |
Interested Directors | ||||||
Barry Fink | Director | Since 2012 | Retired; Executive Vice President, ACC (September 2007 to February 2013); President, ACS (October 2007 to February 2013); Chief Operating Officer, ACC (September 2007 to | 75 | None | |
Jonathan S. Thomas | Director and President | Since 2007 | President and Chief Executive Officer, ACC (March 2007 to present). Also serves as Chief Executive Officer and Manager, ACS; Executive Vice President, ACIM; Director, ACC, ACIM and other ACC subsidiaries | 117 | None | |
(1) | Donald H. Pratt will retire as Director and Chairman of the Board effective December 31, 2013. |
Officers
The following table presents certain information about the executive officers of the funds. Each officer serves as an officer for each of the 15 investment companies in the American Century family of funds, unless otherwise noted. No officer is compensated for his or her service as an officer of the funds. The listed officers are interested persons of the funds and are appointed or re-appointed on an annual basis. The mailing address for each officer listed below is 4500 Main Street, Kansas City, Missouri 64111.
Name | Offices with the Funds | Principal Occupation(s) During the Past Five Years |
Jonathan S. Thomas | Director and President since 2007 | President and Chief Executive Officer, ACC (March 2007 to present). Also serves as Chief Executive Officer and Manager, ACS; Executive Vice President, ACIM; Director, ACC, ACIM and other ACC subsidiaries |
Maryanne L. Roepke | Chief Compliance Officer since 2006 and Senior Vice President since 2000 | Chief Compliance Officer, American Century funds, ACIM and ACS (August 2006 to present). Also serves as Senior Vice President, ACS |
Charles A. Etherington | General Counsel since 2007 and Senior Vice President since 2006 | Attorney, ACC (February 1994 to present); Vice President, ACC (November 2005 to present); General Counsel, ACC (March 2007 to present). Also serves as General Counsel, ACIM, ACS, ACIS and other ACC subsidiaries; and Senior Vice President, ACIM and ACS |
C. Jean Wade | Vice President, Treasurer and Chief Financial Officer since 2012 | Vice President, ACS (February 2000 to present) |
Robert J. Leach | Vice President since 2006 and Assistant Treasurer since 2012 | Vice President, ACS (February 2000 to present) |
David H. Reinmiller | Vice President since 2000 | Attorney, ACC (January 1994 to present); Associate General Counsel, ACC (January 2001 to present). Also serves as Vice President, ACIM and ACS |
Ward D. Stauffer | Secretary since 2005 | Attorney, ACC (June 2003 to present) |
The Statement of Additional Information has additional information about the fund’s directors and is available without charge, upon request, by calling 1-800-345-2021.
Approval of Management Agreement |
At a meeting held on June 20, 2013, the Fund’s Board of Directors unanimously approved the renewal of the management agreement pursuant to which American Century Investment Management, Inc. (the “Advisor”) acts as the investment advisor for the Fund. Under Section 15(c) of the Investment Company Act, contracts for investment advisory services are required to be reviewed, evaluated, and approved by a majority of a fund’s directors (the “Directors”), including a majority of the independent Directors, each year.
Prior to its consideration of the renewal of the management agreement, the Board requested and reviewed extensive data and information compiled by the Advisor and certain independent providers of evaluation data concerning the Fund and the services provided to the Fund by the Advisor. This review was in addition to the oversight and evaluation undertaken by the Board and its committees on a continuous basis throughout the year.
In connection with its consideration of the renewal of the management agreement, the Board’s review and evaluation of the services provided by the Advisor included, but was not limited to, the following:
• | the nature, extent, and quality of investment management, shareholder services, and other services provided by the Advisor to the Fund; |
• | the wide range of other programs and services the Advisor provides to the Fund and its shareholders on a routine and non-routine basis; |
• | the investment performance of the Fund, including data comparing the Fund’s performance to appropriate benchmarks and/or a peer group of other mutual funds with similar investment objectives and strategies; |
• | data comparing the cost of owning the Fund to the cost of owning similar funds; |
• | the Advisor’s compliance policies, procedures, and regulatory experience; |
• | financial data showing the cost of services provided to the Fund, the profitability of the Fund to the Advisor, and the overall profitability of the Advisor; |
• | possible economies of scale associated with the Advisor’s management of the Fund and other accounts under its management; |
• | data comparing services provided and charges to other investment management clients of the Advisor; and |
• | consideration of collateral benefits derived by the Advisor from the management of the Fund. |
In keeping with its practice, the Board held two in-person meetings and one telephonic meeting to review and discuss the information provided. The Directors also had the benefit of the advice of independent counsel throughout the period.
Factors Considered
The Directors considered all of the information provided by the Advisor, the independent data providers, and independent counsel, and evaluated such information for the Fund. In connection with their review, the Directors did not identify any single factor as being all-important or controlling, and each Director may have attributed different levels of importance to different factors. In deciding to renew the management agreement, the Board based its decision on a number of factors, including the following:
Nature, Extent and Quality of Services - Generally. Under the management agreement, the Advisor is responsible for providing or arranging for all services necessary for the operation of the Fund. The Board noted that under the management agreement, the Advisor provides or arranges at its own expense a wide variety of services including:
• | constructing and designing the Fund |
• | portfolio research and security selection |
• | initial capitalization/funding |
• | securities trading |
• | Fund administration |
• | custody of Fund assets |
• | daily valuation of the Fund’s portfolio |
• | shareholder servicing and transfer agency, including shareholder confirmations, recordkeeping, and communications |
• | legal services |
• | regulatory and portfolio compliance |
• | financial reporting |
• | marketing and distribution |
The Board noted that many of these services have expanded over time both in terms of quantity and complexity in response to shareholder demands, competition in the industry, changing distribution channels, and the changing regulatory environment.
Investment Management Services. The nature of the investment management services provided to the Fund is quite complex and allows Fund shareholders access to professional money management, instant diversification of their investments within an asset class, the opportunity to easily diversify among asset classes by investing in or exchanging among various American Century Investments funds, and liquidity. In evaluating investment performance, the Board expects
the Advisor to manage the Fund in accordance with its investment objectives and approved strategies. Further, the Directors recognize that the Advisor has an obligation to monitor trading activities, and in particular to seek the best execution of fund trades, and to evaluate the use of and payment for research. In providing these services, the Advisor utilizes teams of investment professionals (portfolio managers, analysts, research assistants, and securities traders) who require extensive information technology, research, training, compliance and other systems to conduct their business. The Board, directly and through its Fund Performance Review Committee, regularly reviews investment performance information for the Fund, together with comparative information for appropriate benchmarks and/or peer groups of similarly-managed funds, over different time horizons. The Directors also review detailed performance information during the management agreement approval process. If performance concerns are identified, the Fund receives special reviews until performance improves, during which the Board discusses with the Advisor the reasons for such results (e.g., market conditions, security selection) and any efforts being undertaken to improve performance. Taking all these factors into consideration, the Board found the investment management services provided by the Advisor to the Fund to meet or exceed industry standards. More detailed information about the Fund’s performance can be found in the Performance and Portfolio Commentary sections of this report.
Shareholder and Other Services. Under the management agreement, the Advisor provides the Fund with a comprehensive package of transfer agency, shareholder, and other services. The Board, directly and through various committees of the Board, regularly reviews reports and evaluations of such services at its regular meetings. These reports include, but are not limited to, information regarding the operational efficiency and accuracy of the shareholder and transfer agency services provided, staffing levels, shareholder satisfaction (as measured by external as well as internal sources), technology support, new products and services offered to Fund shareholders, securities trading activities, portfolio valuation services, auditing services, and legal and operational compliance activities. Certain aspects of shareholder and transfer agency service level efficiency and the quality of securities trading activities are measured by independent third party providers and are presented in comparison to other fund groups not managed by the Advisor. The Board found the services provided by the Advisor to the Fund under the management agreement to be competitive and of high quality.
Costs of Services and Profitability. The Advisor provides detailed information concerning its cost of providing various services to the Fund, its profitability in managing the Fund, its overall profitability, and its financial condition. The Directors have reviewed with the Advisor the methodology used to prepare this financial information. The financial information regarding the Advisor is considered in evaluating the Advisor’s financial condition, its ability to continue to provide services under the management agreement, and the reasonableness of the current management fee. The Board concluded that the Advisor’s profits were reasonable in light of the services provided to the Fund.
Ethics. The Board generally considers the Advisor’s commitment to providing quality services to shareholders and to conducting its business ethically. They noted that the Advisor’s practices generally meet or exceed industry best practices.
Economies of Scale. The Board also reviewed information provided by the Advisor regarding the possible existence of economies of scale in connection with the management of the Fund. The Board concluded that economies of scale are difficult to measure and predict with precision, especially on a fund-by-fund basis. The Board concluded that the Advisor is appropriately sharing economies of scale through its competitive fee structure, offering competitive fees from fund inception, and through reinvestment in its business to provide shareholders additional content and services.
Comparison to Other Funds’ Fees. The management agreement provides that the Fund pay the Advisor a single, all-inclusive (or unified) management fee for providing all services necessary for the management and operation of the Fund, other than brokerage expenses, taxes, interest, extraordinary expenses, and the fees and expenses of the Fund’s independent directors (including their independent legal counsel) and expenses incurred in connection with the provision of shareholder services and distribution services under a plan adopted pursuant to Rule 12b-1 under the 1940 Act. Under the unified fee structure, the Advisor is responsible for providing all investment advisory, custody, audit, administrative, compliance, recordkeeping, marketing and shareholder services, or arranging and supervising third parties to provide such services. By contrast, most other funds are charged a variety of fees, including an investment advisory fee, a transfer agency fee, an administrative fee, distribution charges and other expenses. Other than their investment advisory fees and any applicable Rule 12b-1 distribution fees, all other components of the total fees charged by these other funds may be increased without shareholder approval. The Board believes the unified fee structure is a benefit to Fund shareholders because it clearly discloses to shareholders the cost of owning Fund shares, and, since the unified fee cannot be increased without a vote of Fund shareholders, it shifts to the Advisor the risk of increased costs of operating the Fund and provides a direct incentive to minimize administrative inefficiencies. Part of the Board’s analysis of fee levels involves reviewing certain evaluative data compiled by an independent provider and comparing the Fund’s unified fee to the total expense ratio of other funds in the Fund’s peer group. The Board concluded that the management fee paid by the Fund to the Advisor under the management agreement is reasonable in light of the services provided to the Fund.
Comparison to Fees and Services Provided to Other Clients of the Advisor. The Board also requested and received information from the Advisor concerning the nature of the services, fees, costs and profitability of its advisory services to advisory clients other than the Fund. They observed that these varying types of client accounts require different services and involve different regulatory and entrepreneurial risks than the management of the Fund. The Board analyzed this information and concluded that the fees charged and services provided to the Fund were reasonable by comparison.
Collateral or “Fall-Out” Benefits Derived by the Advisor. The Board considered the existence of collateral benefits the Advisor may receive as a result of its relationship with the Fund. They concluded that the Advisor’s primary business is managing mutual funds and it generally does not use fund or shareholder information to generate profits in other lines of business, and therefore does not derive any significant collateral benefits from them. The Board noted that the Advisor receives proprietary research from broker-dealers that execute fund
portfolio transactions and concluded that this research is likely to benefit Fund shareholders. The Board also determined that the Advisor is able to provide investment management services to certain clients other than the Fund, at least in part, due to its existing infrastructure built to serve the fund complex. The Board concluded, however, that the assets of those other clients are not material to the analysis and, where applicable, may be included with the assets of the Fund to determine breakpoints in the management fee schedule.
Existing Relationship. The Board also considered whether there was any reason for not continuing the existing arrangement with the Advisor. In this regard, the Board was mindful of the potential disruptions of the Fund’s operations and various risks, uncertainties, and other effects that could occur as a result of a decision not to continue such relationship. In particular, the Board recognized that most shareholders have invested in the Fund on the strength of the Advisor’s industry standing and reputation and in the expectation that the Advisor will have a continuing role in providing advisory services to the Fund.
Conclusion of the Directors. As a result of this process, the Board, including all of the independent directors, taking into account all of the factors discussed above and the information provided by the Advisor and others, concluded that the management agreement between the Fund and the Advisor is fair and reasonable in light of the services provided and should be renewed.
Additional Information |
Retirement Account Information
As required by law, distributions you receive from certain IRAs are subject to federal income tax withholding, unless you elect not to have withholding apply. Tax will be withheld on the total amount withdrawn even though you may be receiving amounts that are not subject to withholding, such as nondeductible contributions. In such case, excess amounts of withholding could occur. You may adjust your withholding election so that a greater or lesser amount will be withheld.
If you don’t want us to withhold on this amount, you must notify us to not withhold the federal income tax. You may notify us in writing or in certain situations by telephone or through other electronic means. For systematic withdrawals, your withholding election will remain in effect until revoked or changed by filing a new election. You have the right to revoke your election at any time.
Remember, even if you elect not to have income tax withheld, you are liable for paying income tax on the taxable portion of your withdrawal. If you elect not to have income tax withheld or you don’t have enough income tax withheld, you may be responsible for payment of estimated tax. You may incur penalties under the estimated tax rules if your withholding and estimated tax payments are not sufficient. You can reduce or defer the income tax on a distribution by directly or indirectly rolling such distribution over to another IRA or eligible plan. You should consult your tax advisor for additional information.
State tax will be withheld if, at the time of your distribution, your address is within one of the mandatory withholding states and you have federal income tax withheld (or as otherwise required by state law). State taxes will be withheld from your distribution in accordance with the respective state rules.
Distributions you receive from 403(b), 457 and qualified plans are subject to special tax and withholding rules. Your plan administrator or plan sponsor is required to provide you with a special tax notice explaining those rules at the time you request a distribution. If applicable, federal and/or state taxes may be withheld from your distribution amount.
Proxy Voting Policies
A description of the policies that the fund’s investment advisor uses in exercising the voting rights associated with the securities purchased and/or held by the fund is available without charge, upon request, by calling 1-800-345-2021. It is also available on the “About Us” page of American Century Investments’ website at americancentury.com and on the Securities and Exchange Commission’s website at sec.gov. Information regarding how the investment advisor voted proxies relating to portfolio securities during the most recent 12-month period ended June 30 is available on the “About Us” page at americancentury.com. It is also available at sec.gov.
Quarterly Portfolio Disclosure
The fund files its complete schedule of portfolio holdings with the Securities and Exchange Commission (SEC) for the first and third quarters of each fiscal year on Form N-Q. The fund’s Forms N-Q are available on the SEC’s website at sec.gov, and may be reviewed and copied at the SEC’s Public Reference Room in Washington, DC. Information on the operation of the Public Reference Room may be obtained by calling 1-800-SEC-0330. The fund also makes its complete schedule of portfolio holdings for the most recent quarter of its fiscal year available on its website at americancentury.com and, upon request, by calling 1-800-345-2021.
Other Tax Information
The following information is provided pursuant to provisions of the Internal Revenue Code.
The fund hereby designates up to the maximum amount allowable as qualified dividend income for the fiscal year ended November 30, 2013.
For the fiscal year ended November 30, 2013, the fund intends to pass through to shareholders $809,938, or up to the maximum amount allowable, as a foreign tax credit which represents taxes paid on income derived from sources within foreign countries or possessions of the United States. During the fiscal year ended November 30, 2013, the fund earned $10,627,428 from income derived from foreign sources. Foreign source income and foreign tax expense per outstanding share on November 30, 2013 are $0.2071 and $0.0158, respectively.
Notes |
![]()
Contact Us | americancentury.com |
Automated Information Line | 1-800-345-8765 |
Investor Services Representative | 1-800-345-2021 |
Investors Using Advisors | 1-800-378-9878 |
Business, Not-For-Profit, Employer-Sponsored Retirement Plans | 1-800-345-3533 |
Banks and Trust Companies, Broker-Dealers, Financial Professionals, Insurance Companies | 1-800-345-6488 |
Telecommunications Relay Service for the Deaf | 711 |
American Century World Mutual Funds, Inc.
Investment Advisor:
American Century Investment Management, Inc.
Kansas City, Missouri
This report and the statements it contains are submitted for the general information of our shareholders. The report is not authorized for distribution to prospective investors unless preceded or accompanied by an effective prospectus.
©2014 American Century Proprietary Holdings, Inc. All rights reserved.
CL-ANN-80788 1401
ANNUAL REPORT | NOVEMBER 30, 2013 |
International Growth Fund
Table of Contents |
President’s Letter | 2 |
Market Perspective | 3 |
Performance | 4 |
Portfolio Commentary | 6 |
Fund Characteristics | 8 |
Shareholder Fee Example | 9 |
Schedule of Investments | 11 |
Statement of Assets and Liabilities | 14 |
Statement of Operations | 15 |
Statement of Changes in Net Assets | 16 |
Notes to Financial Statements | 17 |
Financial Highlights | 23 |
Report of Independent Registered Public Accounting Firm | 25 |
Management | 26 |
Approval of Management Agreement | 29 |
Additional Information | 34 |
Any opinions expressed in this report reflect those of the author as of the date of the report, and do not necessarily represent the opinions of American Century Investments® or any other person in the American Century Investments organization. Any such opinions are subject to change at any time based upon market or other conditions and American Century Investments disclaims any responsibility to update such opinions. These opinions may not be relied upon as investment advice and, because investment decisions made by American Century Investments funds are based on numerous factors, may not be relied upon as an indication of trading intent on behalf of any American Century Investments fund. Security examples are used for representational purposes only and are not intended as recommendations to purchase or sell securities. Performance information for comparative indices and securities is provided to American Century Investments by third party vendors. To the best of American Century Investments’ knowledge, such information is accurate at the time of printing.
President’s Letter |
Jonathan Thomas
Dear Investor:
Thank you for reviewing this annual report for the 12 months ended November 30, 2013. It provides investment performance, market analysis, and portfolio information, presented with the expert perspective of our portfolio management team.
Annual reports remain important vehicles for conveying information about fund returns, including key factors that affected fund performance. For additional, updated investment and market insights, we encourage you to visit our website, americancentury.com.
Monetary Policy-Driven, “Risk-On” Results in Developed Countries
Stimulative monetary policies by central banks and slowly improving global economic conditions played a major part in financial market returns during the reporting period. The combination of an improving global economic outlook, mostly low costs of capital in the money markets, and central bank purchases of longer-maturity fixed income securities (a market liquidity-building strategy known as quantitative easing, QE) helped persuade investors to seek risk and yield, particularly in developed markets such as the U.S., Japan, and Europe. Broad stock index returns were stellar in these markets, particularly at the smaller capitalization end of the company size spectrum. Representing the broad markets, the S&P 500 and MSCI EAFE Indices returned 30.30% and 24.84%, respectively, for the reporting period, and their smaller capitalization counterparts performed even better.
At the same time, hints that QE might be tapered soon in the U.S. hampered government bond returns and emerging market stock indices. Broad emerging market stock indices posted positive single-digit returns, but government bond total returns dipped into negative territory, despite low inflation. Corporate bonds, especially high-yield corporates, generally performed better than government bonds because of their higher yields, declining spreads (yield differences between corporate and similar-maturity Treasury securities), and relatively low default rates, compared with historical averages.
As we enter 2014, there’s less uncertainty about the U.S. fiscal picture and global economic strength than a year ago, but headwinds continue. A full economic recovery from 2008 remains elusive—economic growth is still subpar compared with past recoveries. In this environment, we continue to believe in a disciplined, diversified, long-term investment approach, using professionally managed stock and bond portfolios—as appropriate—for meeting financial goals. We appreciate your continued trust in us.
Sincerely,
Jonathan Thomas
President and Chief Executive Officer
American Century Investments
Market Perspective |
By Mark Kopinski, Chief Investment Officer, Global and Non-U.S. Equity
Global Stocks Rallied to Post Double-Digit Gains
Stock market performance remained robust during the 12-month period ended November 30, 2013, with most major market indices posting double-digit gains. Despite persistent concerns about weak global growth and a slowdown in China, investors largely focused on central bank stimulus measures, marginally improving U.S. and European economic data, and relatively healthy corporate earnings, which fueled stock market optimism.
Prior to the reporting period, the U.S. Federal Reserve (the Fed) announced its third quantitative easing program (QE3). This effort, combined with similar large-scale stimulus measures from the European Central Bank (ECB) and the Bank of Japan as well as favorable corporate earnings reports, generally helped keep stocks in favor. Additionally, housing market gains in the U.S., U.K., and Australia aided the global investment landscape.
Europe, Japan were Performance Leaders
Assurances by the ECB that it would keep interest rates at historic lows for an extended period, followed by the cutting of its key lending rate to 0.25% late in the period, helped drive stock market gains in Europe. In addition, economic conditions throughout Europe improved, led by an expanding manufacturing sector, improving business and consumer sentiment, and a slowdown of the economic contraction in the peripheral countries. In the second calendar quarter of 2013, the 17-member eurozone emerged from its longest-ever recession (six consecutive quarters). Investors generally focused on these positive factors, pushing stocks higher despite the structural issues and high unemployment still plaguing the region.
In Japan, the central bank’s efforts to pull the nation out of its decades-long deflationary spiral and spark economic growth appeared to be working. Japan’s economy grew, and consumer prices increased. Late in the period, government officials announced the country’s inflation rate rose at a five-year high, suggesting their deflation-focused initiatives were gaining traction.
Overall, developed market stocks sharply outperformed their emerging market counterparts. Much of the lagging performance was due to a slower-growth environment in China. In addition, rising inflation and currency weakness weighed on many developing nations.
International Equity Total Returns | ||||
For the 12 months ended November 30, 2013 (in U.S. dollars) | ||||
MSCI EAFE Index | 24.84% | MSCI Europe Index | 25.94% | |
MSCI EAFE Growth Index | 23.45% | MSCI World Index | 26.38% | |
MSCI EAFE Value Index | 26.20% | MSCI Japan Index | 32.84% | |
MSCI Emerging Markets Index | 3.66% | |||
Performance |
Total Returns as of November 30, 2013 | ||||||
Average Annual Returns | ||||||
Ticker Symbol | 1 year | 5 years | 10 years | Since Inception | Inception Date | |
Investor Class | TWIEX | 24.22% | 15.68% | 8.15% | 8.35% | 5/9/91 |
MSCI EAFE Index | — | 24.84% | 13.41% | 7.55% | 5.81%(1) | — |
MSCI EAFE Growth Index | — | 23.45% | 13.84% | 7.51% | 4.52%(1) | — |
Institutional Class | TGRIX | 24.54% | 15.92% | 8.37% | 6.41% | 11/20/97 |
A Class(2) No sales charge* With sales charge* | TWGAX
| 23.98% 16.86% | 15.40% 14.06% | 7.87% 7.24% | 6.80% 6.43% | 10/2/96
|
C Class | AIWCX | 23.00% | 14.54% | 7.06% | 3.89% | 6/4/01 |
R Class | ATGRX | 23.59% | 15.11% | 7.62% | 8.16% | 8/29/03 |
R6 Class | ATGDX | — | — | — | 9.39%(3) | 7/26/13 |
* | Sales charges include initial sales charges and contingent deferred sales charges (CDSCs), as applicable. A Class shares have a 5.75% maximum initial sales charge and may be subject to a maximum CDSC of 1.00%. C Class shares redeemed within 12 months of purchase are subject to a maximum CDSC of 1.00%. The SEC requires that mutual funds provide performance information net of maximum sales charges in all cases where charges could be applied. |
(1) | Since 4/30/91, the date nearest the Investor Class’s inception for which data are available. |
(2) | Prior to December 3, 2007, the A Class was referred to as the Advisor Class and did not have a front-end sales charge. Performance prior to that date has been adjusted to reflect this charge. |
(3) | Total returns for periods less than one year are not annualized. |
Data presented reflect past performance. Past performance is no guarantee of future results. Current performance may be higher or lower than the performance shown. Investment return and principal value will fluctuate, and redemption value may be more or less than original cost. To obtain performance data current to the most recent month end, please call 1-800-345-2021 or visit americancentury.com. International investing involves special risks, such as political instability and currency fluctuations. Investing in emerging markets may accentuate these risks. The fund’s investment process may result in high portfolio turnover, which could mean high transaction costs, affecting both performance and capital gains tax liabilities to investors.
Unless otherwise indicated, performance reflects Investor Class shares; performance for other share classes will vary due to differences in fee structure. For information about other share classes available, please consult the prospectus. Data assumes reinvestment of dividends and capital gains, and none of the charts reflect the deduction of taxes that a shareholder would pay on fund distributions or the redemption of fund shares. Returns for the indices are provided for comparison. The fund’s total returns include operating expenses (such as transaction costs and management fees) that reduce returns, while the total returns of the indices do not.
Growth of $10,000 Over 10 Years |
$10,000 investment made November 30, 2003 |
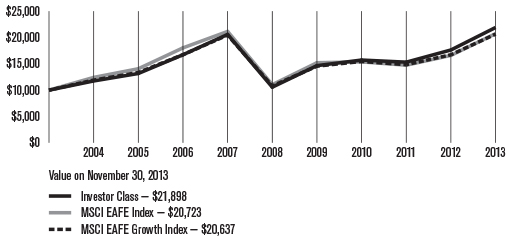
Total Annual Fund Operating Expenses | |||||
Investor Class | Institutional Class | A Class | C Class | R Class | R6 Class |
1.29% | 1.09% | 1.54% | 2.29% | 1.79% | 0.94% |
The total annual fund operating expenses shown is as stated in the fund’s prospectus current as of the date of this report. The prospectus may vary from the expense ratio shown elsewhere in this report because it is based on a different time period, includes acquired fund fees and expenses, and, if applicable, does not include fee waivers or expense reimbursements.
Data presented reflect past performance. Past performance is no guarantee of future results. Current performance may be higher or lower than the performance shown. Investment return and principal value will fluctuate, and redemption value may be more or less than original cost. To obtain performance data current to the most recent month end, please call 1-800-345-2021 or visit americancentury.com. International investing involves special risks, such as political instability and currency fluctuations. Investing in emerging markets may accentuate these risks. The fund’s investment process may result in high portfolio turnover, which could mean high transaction costs, affecting both performance and capital gains tax liabilities to investors.
Unless otherwise indicated, performance reflects Investor Class shares; performance for other share classes will vary due to differences in fee structure. For information about other share classes available, please consult the prospectus. Data assumes reinvestment of dividends and capital gains, and none of the charts reflect the deduction of taxes that a shareholder would pay on fund distributions or the redemption of fund shares. Returns for the indices are provided for comparison. The fund’s total returns include operating expenses (such as transaction costs and management fees) that reduce returns, while the total returns of the indices do not.
Portfolio Commentary |
Portfolio Managers: Alex Tedder and Raj Gandhi
Performance Summary
International Growth advanced 24.22%* for the 12 months ended November 30, 2013, compared with its benchmark, the MSCI EAFE Index, which gained 24.84%.
Developed non-U.S. stocks generally demonstrated robust performance during the 12-month period, primarily due to ongoing central bank stimulus measures, improving economic conditions in Europe, Japan, the U.K., and the U.S., and generally favorable corporate earnings. Within the developed markets, value stocks generally outperformed growth stocks, and small-cap stocks outpaced large-cap stocks.
Overall, stock selection, particularly in the energy, information technology, and materials sectors, detracted slightly from relative performance. Stock selection had a favorable influence on performance in the consumer discretionary, industrials, and consumer staples sectors. Our sector allocations were positive overall, particularly the portfolio’s overweight positions in the consumer discretionary and industrials sectors.
From a regional perspective, stock selection in Italy, along with a portfolio-only position in Taiwan and an overweight position in Norway, detracted from relative performance. At the opposite end of the spectrum, stock selection and an underweight position in the U.K., along with stock selection in Japan and Germany, contributed the most to the portfolio’s performance.
Oilfield Services Company Led Detractors
Among the portfolio’s largest performance detractors for the period was an overweight position in Saipem, an Italy-based oilfield services company. The company’s stock price declined early in the period after management announced a 30% decline in fourth-quarter 2012 net profits and later cut its 2013 earnings estimates.
Another prominent detractor included an overweight position in Treasury Wine Estates, an Australia-based wine maker and distributor. The company’s stock price suffered on weaker demand, particularly in the U.S. and in the high-end wine market in China, which led to disappointing earnings. Poor inventory management also hurt results.
An overweight position in Netherlands-based Koninklijke Vopak, a storage provider for the oil, gas, and chemicals industries, also detracted from performance. The company faced declining demand for fuel storage in the Netherlands. Waning demand stemmed from pricing irregularities, whereby near-term deliveries were costing more than future deliveries, reducing the financial incentive for companies to keep supplies in storage.
* All fund returns referenced in this commentary are for Investor Class shares.
Credit Company Led Contributors
An overweight position in ORIX, a Japan-based financial services provider, was among the leading contributors to the portfolio’s relative performance. The company’s acquisition of a Netherlands-based asset manager helped push its stock price higher. In addition, the company continued to take steps to stabilize its earnings by reducing price fluctuation risk associated with its real estate holdings and other assets.
A portfolio-only position in Russia’s Magnit OJSC, a consumer goods retailer that operates convenience stores, hypermarkets, and cosmetics stores, also was a top contributor. The company has been aggressively growing its footprint while maintaining same-store sales growth and steadily improving its operating margins due to moderating costs and a better negotiating position with suppliers.
In addition, an overweight position in Japan’s Daikin Industries, a manufacturer of air conditioning systems and chemical products, was a leading contributor to performance. Investors reacted favorably to the company’s raising of its revenue and profit forecasts for 2014 due to increased orders and decreased costs. In addition, the company announced a mid-year 2014 dividend payment.
Outlook
Looking ahead, we expect to maintain the portfolio’s overweight position in the consumer discretionary sector, where we are finding companies we believe are well positioned to benefit from improving consumer activity in the U.S., Europe, and Japan. From a regional perspective, we have added to the portfolio’s European exposure, where we are finding more companies we believe are positioned to benefit from the stabilization of growth in the U.K. and on the continent. Specifically, we have added companies in the consumer discretionary and financial sectors. We also have reduced the portfolio’s emerging market exposure due to slowing growth trends in many developing nations.
Fund Characteristics |
NOVEMBER 30, 2013 | |
Top Ten Holdings | % of net assets |
Roche Holding AG | 2.4% |
Bayer AG | 1.9% |
Novartis AG | 1.8% |
Toyota Motor Corp. | 1.8% |
BNP Paribas | 1.8% |
ORIX Corp. | 1.6% |
Whitbread plc | 1.5% |
European Aeronautic Defence and Space Co. NV | 1.5% |
Continental AG | 1.5% |
ASML Holding NV | 1.5% |
Types of Investments in Portfolio | % of net assets |
Foreign Common Stocks | 99.5% |
Temporary Cash Investments | 0.1% |
Other Assets and Liabilities | 0.4% |
Investments by Country | % of net assets |
United Kingdom | 20.7% |
Japan | 18.5% |
France | 15.0% |
Switzerland | 7.9% |
Germany | 7.7% |
Netherlands | 4.6% |
Australia | 3.6% |
Sweden | 2.5% |
Denmark | 2.1% |
India | 2.1% |
China | 2.1% |
Other Countries | 12.7% |
Cash and Equivalents* | 0.5% |
* Includes temporary cash investments and other assets and liabilities.
Shareholder Fee Example |
Fund shareholders may incur two types of costs: (1) transaction costs, including sales charges (loads) on purchase payments and redemption/exchange fees; and (2) ongoing costs, including management fees; distribution and service (12b-1) fees; and other fund expenses. This example is intended to help you understand your ongoing costs (in dollars) of investing in your fund and to compare these costs with the ongoing cost of investing in other mutual funds.
The example is based on an investment of $1,000 made at the beginning of the period and held for the entire period from June 1, 2013 to November 30, 2013 (except as noted).
Actual Expenses
The table provides information about actual account values and actual expenses for each class. You may use the information, together with the amount you invested, to estimate the expenses that you paid over the period. First, identify the share class you own. Then simply divide your account value by $1,000 (for example, an $8,600 account value divided by $1,000 = 8.6), then multiply the result by the number under the heading “Expenses Paid During Period” to estimate the expenses you paid on your account during this period.
If you hold Investor Class shares of any American Century Investments fund, or Institutional Class shares of the American Century Diversified Bond Fund, in an American Century Investments account (i.e., not a financial intermediary or retirement plan account), American Century Investments may charge you a $12.50 semiannual account maintenance fee if the value of those shares is less than $10,000. We will redeem shares automatically in one of your accounts to pay the $12.50 fee. In determining your total eligible investment amount, we will include your investments in all personal accounts (including American Century Investments Brokerage accounts) registered under your Social Security number. Personal accounts include individual accounts, joint accounts, UGMA/UTMA accounts, personal trusts, Coverdell Education Savings Accounts and IRAs (including traditional, Roth, Rollover, SEP-, SARSEP- and SIMPLE-IRAs), and certain other retirement accounts. If you have only business, business retirement, employer-sponsored or American Century Investments Brokerage accounts, you are currently not subject to this fee. If you are subject to the Account Maintenance Fee, your account value could be reduced by the fee amount.
Hypothetical Example for Comparison Purposes
The table also provides information about hypothetical account values and hypothetical expenses based on the actual expense ratio of each class of your fund and an assumed rate of return of 5% per year before expenses, which is not the actual return of a fund’s share class. The hypothetical account values and expenses may not be used to estimate the actual ending account balance or expenses you paid for the period. You may use this information to compare the ongoing costs of investing in your fund and other funds. To do so, compare this 5% hypothetical example with the 5% hypothetical examples that appear in the shareholder reports of the other funds.
Please note that the expenses shown in the table are meant to highlight your ongoing costs only and do not reflect any transactional costs, such as sales charges (loads) or redemption/exchange fees. Therefore, the table is useful in comparing ongoing costs only, and will not help you determine the relative total costs of owning different funds. In addition, if these transactional costs were included, your costs would have been higher.
Beginning 6/1/13 | Ending 11/30/13 | Expenses Paid During Period(1) 6/1/13 – 11/30/13 | Annualized | |
Actual | ||||
Investor Class | $1,000 | $1,122.10 | $6.44 | 1.21% |
Institutional Class | $1,000 | $1,123.60 | $5.38 | 1.01% |
A Class | $1,000 | $1,121.40 | $7.76 | 1.46% |
C Class | $1,000 | $1,116.80 | $11.73 | 2.21% |
R Class | $1,000 | $1,119.50 | $9.09 | 1.71% |
R6 Class | $1,000 | $1,093.90(2) | $3.12(3) | 0.85% |
Hypothetical | ||||
Investor Class | $1,000 | $1,019.00 | $6.12 | 1.21% |
Institutional Class | $1,000 | $1,020.01 | $5.11 | 1.01% |
A Class | $1,000 | $1,017.75 | $7.39 | 1.46% |
C Class | $1,000 | $1,013.99 | $11.16 | 2.21% |
R Class | $1,000 | $1,016.50 | $8.64 | 1.71% |
R6 Class | $1,000 | $1,020.81(4) | $4.31(4) | 0.85% |
(1) | Expenses are equal to the class’s annualized expense ratio listed in the table above, multiplied by the average account value over the period, multiplied by 183, the number of days in the most recent fiscal half-year, divided by 365, to reflect the one-half year period. |
(2) | Ending account value based on actual return from July 26, 2013 (commencement of sale) through November 30, 2013. |
(3) | Expenses are equal to the class’s annualized expense ratio listed in the table above, multiplied by the average account value over the period, multiplied by 128, the number of days in the period from July 26, 2013 (commencement of sale) through November 30, 2013, divided by 365, to reflect the period. Had the class been available for the full period, the expenses paid during the period would have been higher. |
(4) | Ending account value and expenses paid during the period assumes the class had been available throughout the entire period and are calculated using the class’s annualized expense ratio listed in the table above. |
Schedule of Investments |
NOVEMBER 30, 2013
Shares | Value | |
Common Stocks — 99.5% | ||
AUSTRALIA — 3.6% | ||
BHP Billiton Ltd. | 643,949 | $ 21,916,325 |
Commonwealth Bank of Australia | 268,155 | 18,994,940 |
CSL Ltd. | 384,648 | 24,064,156 |
James Hardie Industries SE | 518,840 | 5,922,319 |
70,897,740 | ||
AUSTRIA — 0.6% | ||
Erste Group Bank AG | 318,581 | 11,216,132 |
BELGIUM — 0.9% | ||
Anheuser-Busch InBev NV | 180,469 | 18,428,391 |
BRAZIL — 0.5% | ||
Itau Unibanco Holding SA Preference Shares | 663,000 | 9,324,747 |
CANADA — 0.7% | ||
Canadian Pacific Railway Ltd. | 95,026 | 14,478,151 |
CHINA — 2.1% | ||
Baidu, Inc. ADR(1) | 50,400 | 8,395,128 |
ENN Energy Holdings Ltd. | 691,475 | 4,869,951 |
Haier Electronics Group Co. Ltd. | 3,806,000 | 8,964,477 |
Tencent Holdings Ltd. | 328,400 | 18,994,339 |
41,223,895 | ||
DENMARK — 2.1% | ||
GN Store Nord A/S | 609,480 | 14,555,044 |
Novo Nordisk A/S B Shares | 82,962 | 14,862,948 |
Pandora A/S | 236,150 | 12,251,220 |
41,669,212 | ||
FINLAND — 0.6% | ||
Sampo A Shares | 271,720 | 12,671,403 |
FRANCE — 15.0% | ||
Accor SA | 274,140 | 12,028,079 |
Air Liquide SA | 63,350 | 8,831,812 |
AXA SA | 694,580 | 18,201,104 |
BNP Paribas | 470,520 | 35,323,700 |
Carrefour SA | 660,726 | 26,000,145 |
Cie Generale d’Optique Essilor International SA | 56,798 | 5,958,850 |
Danone SA | 235,810 | 17,135,999 |
Dassault Systemes SA | 25,065 | 2,876,908 |
European Aeronautic Defence and Space Co. NV | 409,825 | 29,102,056 |
Iliad SA | 27,980 | 6,622,953 |
L’Oreal SA | 93,616 | 15,665,358 |
Publicis Groupe SA | 256,670 | 22,690,548 |
Rexel SA | 510,060 | 12,929,221 |
Sanofi | 221,762 | 23,455,559 |
Schneider Electric SA | 194,674 | 16,482,441 |
Total SA | 312,900 | 18,960,403 |
Valeo SA | 151,300 | 16,089,205 |
Zodiac Aerospace | 40,520 | 6,874,068 |
295,228,409 | ||
GERMANY — 7.7% | ||
adidas AG | 132,824 | 16,156,692 |
Bayer AG | 272,920 | 36,416,874 |
Brenntag AG | 28,430 | 5,049,034 |
Continental AG | 136,881 | 28,587,281 |
Daimler AG | 266,870 | 22,120,015 |
Henkel AG & Co. KGaA Preference Shares | 145,808 | 16,533,451 |
Siemens AG | 36,700 | 4,847,169 |
Sky Deutschland AG(1) | 2,160,822 | 22,167,758 |
151,878,274 | ||
HONG KONG — 1.7% | ||
AIA Group Ltd. | 3,062,600 | 15,525,238 |
Sands China Ltd. | 2,287,600 | 17,306,272 |
32,831,510 | ||
INDIA — 2.1% | ||
Idea Cellular Ltd. | 3,522,499 | 9,889,942 |
Tata Consultancy Services Ltd. | 489,020 | 15,685,185 |
Tata Motors Ltd. ADR | 489,120 | 15,881,726 |
41,456,853 | ||
IRELAND — 0.5% | ||
Bank of Ireland(1) | 26,858,516 | 10,437,677 |
ITALY — 1.9% | ||
Luxottica Group SpA | 224,712 | 11,902,109 |
Prada SpA | 865,800 | 8,359,202 |
UniCredit SpA | 2,236,450 | 16,227,674 |
36,488,985 | ||
JAPAN — 18.5% | ||
Bridgestone Corp. | 526,200 | 19,261,555 |
Daikin Industries Ltd. | 398,600 | 25,290,644 |
FANUC Corp. | 54,500 | 9,171,556 |
Fuji Heavy Industries Ltd. | 558,000 | 15,752,218 |
Japan Tobacco, Inc. | 560,629 | 18,934,807 |
KDDI Corp. | 378,306 | 23,744,522 |
Keyence Corp. | 52,400 | 21,047,977 |
Kubota Corp. | 1,249,000 | 21,348,031 |
Mitsubishi Corp. | 248,200 | 4,881,868 |
Mitsubishi Estate Co. Ltd. | 670,000 | 18,600,029 |
Mizuho Financial Group, Inc. | 7,210,500 | 15,132,583 |
Murata Manufacturing Co. Ltd. | 195,500 | 16,812,485 |
Shares | Value |
Nidec Corp. | 132,400 | $ 12,781,844 |
Omron Corp. | 121,100 | 4,982,542 |
Oriental Land Co. Ltd. | 54,900 | 8,086,690 |
ORIX Corp. | 1,705,200 | 31,042,979 |
Panasonic Corp. | 169,000 | 1,938,357 |
Rakuten, Inc. | 1,605,704 | 24,670,585 |
Shin-Etsu Chemical Co. Ltd. | 166,000 | 9,592,660 |
Toshiba Corp. | 1,949,000 | 8,408,981 |
Toyota Motor Corp. | 574,100 | 35,753,409 |
Unicharm Corp. | 257,800 | 16,306,740 |
363,543,062 | ||
MEXICO — 0.6% | ||
Cemex SAB de CV ADR(1) | 1,016,060 | 11,105,536 |
NETHERLANDS — 4.6% | ||
Akzo Nobel NV | 235,836 | 17,762,774 |
ASML Holding NV | 305,095 | 28,559,270 |
ING Groep NV CVA(1) | 1,654,434 | 21,486,827 |
Koninklijke DSM NV | 205,916 | 16,163,979 |
Koninklijke Philips Electronics NV | 164,830 | 5,900,520 |
89,873,370 | ||
NORWAY — 1.1% | ||
DNB ASA | 717,888 | 12,701,316 |
Schibsted ASA | 128,810 | 8,321,242 |
21,022,558 | ||
RUSSIA — 1.2% | ||
Magnit OJSC GDR | 227,847 | 15,015,117 |
Yandex NV A Shares(1) | 235,340 | 9,354,765 |
24,369,882 | ||
SPAIN — 1.6% | ||
Amadeus IT Holding SA A Shares | 104,910 | 3,929,441 |
Banco Popular Espanol SA(1) | 1,754,610 | 10,197,076 |
Inditex SA | 107,459 | 17,134,905 |
31,261,422 | ||
SWEDEN — 2.5% | ||
SKF AB B Shares | 319,342 | 8,709,748 |
Svenska Cellulosa AB B Shares | 879,318 | 25,671,659 |
Telefonaktiebolaget LM Ericsson B Shares | 1,173,996 | 14,622,710 |
49,004,117 | ||
SWITZERLAND — 7.9% | ||
Adecco SA | 232,741 | 17,922,906 |
Cie Financiere Richemont SA | 122,283 | 12,425,269 |
Givaudan SA | 4,790 | 6,759,058 |
Novartis AG | 458,872 | 36,273,366 |
Roche Holding AG | 171,091 | 47,699,355 |
Sika AG | 3,551 | 11,662,982 |
Syngenta AG | 23,682 | 9,301,403 |
UBS AG | 724,384 | 13,809,969 |
155,854,308 | ||
TAIWAN — 0.8% | ||
Taiwan Semiconductor Manufacturing Co. Ltd. ADR | 882,249 | 15,642,275 |
UNITED KINGDOM — 20.7% | ||
Aberdeen Asset Management plc | 1,498,810 | 12,073,669 |
ARM Holdings plc | 383,430 | 6,386,997 |
Ashtead Group plc | 1,469,998 | 16,729,260 |
Associated British Foods plc | 545,489 | 20,466,939 |
BG Group plc | 1,139,005 | 23,268,963 |
British American Tobacco plc | 239,574 | 12,783,605 |
BT Group plc | 3,112,600 | 18,982,156 |
Burberry Group plc | 512,695 | 12,810,349 |
Capita Group plc (The) | 1,380,137 | 22,515,428 |
Compass Group plc | 883,411 | 13,313,286 |
Diageo plc | 457,630 | 14,572,034 |
Experian plc | 316,054 | 5,828,383 |
HSBC Holdings plc | 1,691,360 | 18,872,072 |
International Consolidated Airlines Group SA(1) | 1,913,080 | 11,466,553 |
ITV plc | 3,231,720 | 10,047,319 |
J Sainsbury plc | 1,480,720 | 9,870,901 |
Johnson Matthey plc | 319,018 | 16,547,687 |
Kingfisher plc | 602,560 | 3,706,256 |
Lloyds Banking Group plc(1) | 22,133,630 | 28,032,153 |
Next plc | 99,690 | 8,963,593 |
Reckitt Benckiser Group plc | 223,170 | 17,926,342 |
Rio Tinto plc | 477,838 | 25,501,217 |
Rolls-Royce Holdings plc | 647,973 | 13,094,433 |
Shire plc | 174,360 | 7,908,660 |
Standard Chartered plc | 673,400 | 15,960,793 |
Travis Perkins plc | 281,064 | 8,259,893 |
Whitbread plc | 512,687 | 29,923,904 |
405,812,845 | ||
TOTAL COMMON STOCKS (Cost $1,476,487,798) | 1,955,720,754 | |
Shares | Value |
Temporary Cash Investments — 0.1% | ||
Repurchase Agreement, Bank of America Merrill Lynch, (collateralized by various U.S. Treasury obligations, 0.375%, 6/30/15, valued at $371,759), in a joint trading account at 0.06%, dated 11/29/13, due 12/2/13 (Delivery value $364,292) | $ 364,290 | |
Repurchase Agreement, Credit Suisse First Boston, Inc., (collateralized by various U.S. Treasury obligations, 2.75%, 11/15/42, valued at $444,583), in a joint trading account at 0.03%, dated 11/29/13, due 12/2/13 (Delivery value $437,149) | 437,148 | |
Repurchase Agreement, Goldman Sachs & Co., (collateralized by various U.S. Treasury obligations, 0.00%, 5/29/14, valued at $371,933), in a joint trading account at 0.04%, dated 11/29/13, due 12/2/13 (Delivery value $364,649) | 364,648 | |
SSgA U.S. Government Money Market Fund | 982,065 | 982,065 |
TOTAL TEMPORARY CASH INVESTMENTS (Cost $2,148,151) | 2,148,151 | |
TOTAL INVESTMENT SECURITIES — 99.6% (Cost $1,478,635,949) | 1,957,868,905 | |
OTHER ASSETS AND LIABILITIES — 0.4% | 7,263,797 | |
TOTAL NET ASSETS — 100.0% | $1,965,132,702 | |
Market Sector Diversification | |
(as a % of net assets) | |
Consumer Discretionary | 22.3% |
Financials | 17.7% |
Industrials | 13.9% |
Consumer Staples | 11.0% |
Health Care | 10.8% |
Materials | 9.4% |
Information Technology | 9.0% |
Telecommunication Services | 3.0% |
Energy | 2.2% |
Utilities | 0.2% |
Cash and Equivalents* | 0.5% |
* Includes temporary cash investments and other assets and liabilities.
Notes to Schedule of Investments
ADR = American Depositary Receipt
CVA = Certificaten Van Aandelen
GDR = Global Depositary Receipt
OJSC = Open Joint Stock Company
(1) | Non-income producing. |
See Notes to Financial Statements.
Statement of Assets and Liabilities |
NOVEMBER 30, 2013 | ||
Assets | ||
Investment securities, at value (cost of $1,478,635,949) | $1,957,868,905 | |
Foreign currency holdings, at value (cost of $1,091,412) | 1,080,796 | |
Receivable for investments sold | 34,761,522 | |
Receivable for capital shares sold | 841,842 | |
Dividends and interest receivable | 5,902,346 | |
Other assets | 1,125,667 | |
| 2,001,581,078 | ||
Liabilities | ||
Disbursements in excess of demand deposit cash | 998,752 | |
Payable for investments purchased | 32,417,603 | |
Payable for capital shares redeemed | 823,489 | |
Accrued management fees | 1,863,675 | |
Distribution and service fees payable | 57,924 | |
Accrued foreign taxes | 286,933 | |
| 36,448,376 | ||
Net Assets | $1,965,132,702 | |
Net Assets Consist of: | ||
Capital (par value and paid-in surplus) | $1,456,373,167 | |
Undistributed net investment income | 8,304,100 | |
Undistributed net realized gain | 21,137,978 | |
Net unrealized appreciation | 479,317,457 | |
| $1,965,132,702 | ||
Net assets | Shares outstanding | Net asset value per share | |
Investor Class, $0.01 Par Value | $1,499,623,091 | 108,801,245 | $13.78 |
Institutional Class, $0.01 Par Value | $185,325,280 | 13,501,648 | $13.73 |
A Class, $0.01 Par Value | $267,979,331 | 19,339,771 | $13.86* |
C Class, $0.01 Par Value | $4,859,138 | 357,881 | $13.58 |
R Class, $0.01 Par Value | $2,269,611 | 162,563 | $13.96 |
R6 Class, $0.01 Par Value | $5,076,251 | 369,536 | $13.74 |
* Maximum offering price $14.71 (net asset value divided by 0.9425).
See Notes to Financial Statements.
Statement of Operations |
YEAR ENDED NOVEMBER 30, 2013 | ||
Investment Income (Loss) | ||
Income: | ||
Dividends (net of foreign taxes withheld of $3,839,028) | $36,668,176 | |
Interest | 1,135 | |
| 36,669,311 | ||
Expenses: | ||
Management fees | 21,256,750 | |
Distribution and service fees: | ||
A Class | 572,469 | |
C Class | 29,484 | |
R Class | 11,598 | |
Directors’ fees and expenses | 69,559 | |
Other expenses | 27,730 | |
| 21,967,590 | ||
Net investment income (loss) | 14,701,721 | |
Realized and Unrealized Gain (Loss) | ||
Net realized gain (loss) on: | ||
Investment transactions (net of foreign tax expenses paid (refunded) of $78,413) | 240,298,230 | |
Foreign currency transactions | (1,054,809 | ) |
| 239,243,421 | ||
Change in net unrealized appreciation (depreciation) on: | ||
Investments (includes (increase) decrease in accrued foreign taxes of $(286,933)) | 131,161,182 | |
Translation of assets and liabilities in foreign currencies | 125,968 | |
| 131,287,150 | ||
Net realized and unrealized gain (loss) | 370,530,571 | |
Net Increase (Decrease) in Net Assets Resulting from Operations | $385,232,292 | |
See Notes to Financial Statements.
Statement of Changes in Net Assets |
YEARS ENDED NOVEMBER 30, 2013 AND NOVEMBER 30, 2012 | |||||
Increase (Decrease) in Net Assets | November 30, 2013 | November 30, 2012 | |||
Operations | |||||
Net investment income (loss) | $14,701,721 | $21,299,200 | |||
Net realized gain (loss) | 239,243,421 | 73,341,568 | |||
Change in net unrealized appreciation (depreciation) | 131,287,150 | 124,258,698 | |||
Net increase (decrease) in net assets resulting from operations | 385,232,292 | 218,899,466 | |||
Distributions to Shareholders | |||||
From net investment income: | |||||
Investor Class | (20,623,148 | ) | (13,149,175 | ) | |
Institutional Class | (2,775,151 | ) | (1,737,113 | ) | |
A Class | (2,541,575 | ) | (1,045,144 | ) | |
C Class | (22,786 | ) | — | ||
R Class | (23,701 | ) | (2,865 | ) | |
Decrease in net assets from distributions | (25,986,361 | ) | (15,934,297 | ) | |
Capital Share Transactions | |||||
Net increase (decrease) in net assets from capital share transactions | (6,050,779 | ) | (72,934,859 | ) | |
Redemption Fees | |||||
Increase in net assets from redemption fees | 47,633 | 25,535 | |||
Net increase (decrease) in net assets | 353,242,785 | 130,055,845 | |||
Net Assets | |||||
Beginning of period | 1,611,889,917 | 1,481,834,072 | |||
End of period | $1,965,132,702 | $1,611,889,917 | |||
Undistributed net investment income | $8,304,100 | $17,202,739 | |||
See Notes to Financial Statements.
Notes to Financial Statements |
NOVEMBER 30, 2013
1. Organization
American Century World Mutual Funds, Inc. (the corporation) is registered under the Investment Company Act of 1940, as amended (the 1940 Act), as an open-end management investment company and is organized as a Maryland corporation. International Growth Fund (the fund) is one fund in a series issued by the corporation. The fund is diversified as defined under the 1940 Act. The fund’s investment objective is to seek capital growth.
The fund offers the Investor Class, the Institutional Class, the A Class, the C Class, the R Class and the R6 Class. The A Class may incur an initial sales charge. The A Class and C Class may be subject to a contingent deferred sales charge. The share classes differ principally in their respective sales charges and distribution and shareholder servicing expenses and arrangements. The Institutional Class and R6 Class shareholders do not require the same level of shareholder and administrative services from American Century Investment Management, Inc. (ACIM) (the investment advisor) as shareholders of other classes. In addition, financial intermediaries do not receive any service, distribution or administrative fees for the R6 Class. As a result, the Institutional Class and R6 Class are charged lower unified management fees. Sale of the R6 Class commenced on July 26, 2013.
2. Significant Accounting Policies
The following is a summary of significant accounting policies consistently followed by the fund in preparation of its financial statements. The financial statements are prepared in conformity with accounting principles generally accepted in the United States of America, which may require management to make certain estimates and assumptions at the date of the financial statements. Actual results could differ from these estimates.
Investment Valuations — The fund determines the fair value of its investments and computes its net asset value per share at the close of regular trading (usually 4 p.m. Eastern time) on the New York Stock Exchange (NYSE) on each day the NYSE is open. The Board of Directors has adopted valuation policies and procedures to guide the investment advisor in the fund’s investment valuation process and to provide methodologies for the oversight of the fund’s pricing function.
Equity securities that are listed or traded on a domestic securities exchange are valued at the last reported sales price or at the official closing price as provided by the exchange. Equity securities traded on foreign securities exchanges are generally valued at the closing price of such securities on the exchange where primarily traded or at the close of the NYSE, if that is earlier. If no last sales price is reported, or if local convention or regulation so provides, the mean of the latest bid and asked prices may be used. Securities traded over-the-counter are valued at the mean of the latest bid and asked prices, the last sales price, or the official closing price. Equity securities initially expressed in local currencies are translated into U.S. dollars at the mean of the appropriate currency exchange rate at the close of the NYSE as provided by an independent pricing service.
Fixed income securities maturing within 60 days at the time of purchase may be valued at cost, plus or minus any amortized discount or premium or at the evaluated mean as provided by an independent pricing service. Evaluated mean prices are commonly derived through utilization of market models, which may consider, among other factors: trade data, quotations from dealers and active market makers, relevant yield curve and spread data, related sector levels, creditworthiness, trade data or market information on comparable securities, and other relevant security specific information.
Open-end management investment companies are valued at the reported net asset value per share. Repurchase agreements are valued at cost, which approximates fair value.
If the fund determines that the market price for an investment is not readily available or the valuation methods mentioned above do not reflect an investment’s fair value, such investment is valued as determined in good faith by the Board of Directors or its delegate, in accordance with policies and procedures adopted by the Board of Directors. In its determination of fair value, the fund may review several factors including, but not limited
to, market information regarding the specific investment or comparable investments and correlation with other investment types, futures indices or general market indicators. Circumstances that may cause the fund to use these procedures to value an investment include, but are not limited to: an investment has been declared in default or is distressed; trading in a security has been suspended during the trading day or a security is not actively trading on its principal exchange; prices received from a regular pricing source are deemed unreliable; or there is a foreign market holiday and no trading occurred.
The fund monitors for significant events occurring after the close of an investment’s primary exchange but before the fund’s net asset value per share is determined. Significant events may include, but are not limited to: corporate announcements and transactions; governmental action and political unrest that could impact a specific investment or an investment sector; or armed conflicts, natural disasters and similar events that could affect investments in a specific country or region. The fund also monitors for significant fluctuations in domestic and foreign markets, as evidenced by the U.S. market or such other indicators that the Board of Directors, or its delegate, deems appropriate. If significant fluctuations in foreign markets are identified, the fund may apply a model-derived factor to the closing price of equity securities traded on foreign securities exchanges. The factor is based on observable market data as provided by an independent pricing service.
Security Transactions — Security transactions are accounted for as of the trade date. Net realized gains and losses are determined on the identified cost basis, which is also used for federal income tax purposes. Certain countries impose taxes on realized gains on the sale of securities registered in their country. The fund records the foreign tax expense, if any, on an accrual basis. The foreign tax expense on realized gains and unrealized appreciation reduces the net realized gain (loss) on investment transactions and net unrealized appreciation (depreciation) on investments, respectively.
Investment Income — Dividend income less foreign taxes withheld, if any, is recorded as of the ex-dividend date. Distributions received on securities that represent a return of capital or long-term capital gain are recorded as a reduction of cost of investments and/or as a realized gain. The fund may estimate the components of distributions received that may be considered nontaxable distributions or long-term capital gain distributions for income tax purposes. Interest income is recorded on the accrual basis and includes accretion of discounts and amortization of premiums.
Foreign Currency Translations — All assets and liabilities initially expressed in foreign currencies are translated into U.S. dollars at prevailing exchange rates at period end. The fund may enter into spot foreign currency exchange contracts to facilitate transactions denominated in a foreign currency. Purchases and sales of investment securities, dividend and interest income, spot foreign currency exchange contracts, and expenses are translated at the rates of exchange prevailing on the respective dates of such transactions. Net realized and unrealized foreign currency exchange gains or losses related to investment securities are a component of net realized gain (loss) on investment transactions and change in net unrealized appreciation (depreciation) on investments, respectively.
Repurchase Agreements — The fund may enter into repurchase agreements with institutions that ACIM has determined are creditworthy pursuant to criteria adopted by the Board of Directors. The fund requires that the collateral, represented by securities, received in a repurchase transaction be transferred to the custodian in a manner sufficient to enable the fund to obtain those securities in the event of a default under the repurchase agreement. ACIM monitors, on a daily basis, the securities transferred to ensure the value, including accrued interest, of the securities under each repurchase agreement is equal to or greater than amounts owed to the fund under each repurchase agreement.
Joint Trading Account — Pursuant to an Exemptive Order issued by the Securities and Exchange Commission, the fund, along with certain other funds in the American Century Investments family of funds, may transfer uninvested cash balances into a joint trading account. These balances are invested in one or more repurchase agreements that are collateralized by U.S. Treasury or Agency obligations.
Income Tax Status — It is the fund’s policy to distribute substantially all net investment income and net realized gains to shareholders and to otherwise qualify as a regulated
investment company under provisions of the Internal Revenue Code. Accordingly, no provision has been made for income taxes. The fund files U.S. federal, state, local and non-U.S. tax returns as applicable. The fund’s tax returns are subject to examination by the relevant taxing authority until expiration of the applicable statute of limitations, which is generally three years from the date of filing but can be longer in certain jurisdictions. At this time, management believes there are no uncertain tax positions which, based on their technical merit, would not be sustained upon examination and for which it is reasonably possible that the total amounts of unrecognized tax benefits will significantly change in the next twelve months.
Multiple Class — All shares of the fund represent an equal pro rata interest in the net assets of the class to which such shares belong, and have identical voting, dividend, liquidation and other rights and the same terms and conditions, except for class specific expenses and exclusive rights to vote on matters affecting only individual classes. Income, non-class specific expenses, and realized and unrealized capital gains and losses of the fund are allocated to each class of shares based on their relative net assets.
Distributions to Shareholders — Distributions from net investment income and net realized gains, if any, are generally declared and paid annually. The fund may make distributions on a more frequent basis to comply with the distribution requirements of the Internal Revenue Code, in all events in a manner consistent with provisions of the 1940 Act.
Redemption — The fund may impose a 2.00% redemption fee on shares held less than 60 days. The fee may not be applicable to all classes. The redemption fee is retained by the fund and helps cover transaction costs that long-term investors may bear when the fund sells securities to meet investor redemptions.
Indemnifications — Under the corporation’s organizational documents, its officers and directors are indemnified against certain liabilities arising out of the performance of their duties to the fund. In addition, in the normal course of business, the fund enters into contracts that provide general indemnifications. The maximum exposure under these arrangements is unknown as this would involve future claims that may be made against a fund. The risk of material loss from such claims is considered by management to be remote.
3. Fees and Transactions with Related Parties
Management Fees — The corporation has entered into a management agreement with ACIM, under which ACIM provides the fund with investment advisory and management services in exchange for a single, unified management fee (the fee) per class. The agreement provides that all expenses of managing and operating the fund, except distribution and service fees, brokerage expenses, taxes, interest, fees and expenses of the independent directors (including legal counsel fees), and extraordinary expenses, will be paid by ACIM. The fee is computed and accrued daily based on each class’s daily net assets and paid monthly in arrears. The rate of the fee is determined by applying a fee rate calculation formula. This formula takes into account the fund’s assets as well as certain assets, if any, of other clients of the investment advisor outside the American Century Investments family of funds (such as subadvised funds and separate accounts) that have very similar investment teams and investment strategies (strategy assets). The strategy assets of the fund include the assets of NT International Growth Fund, one fund in a series issued by the corporation. The annual management fee schedule ranges from 1.050% to 1.500% for the Investor Class, A Class, C Class and R Class. The annual management fee schedule ranges from 0.850% to 1.300% for the Institutional Class and 0.700% to 1.150% for the R6 Class. The effective annual management fee for each class for the period ended November 30, 2013 was 1.22% for the Investor Class, A Class, C Class and R Class, 1.02% for the Institutional Class and 0.85% for the R6 Class.
Distribution and Service Fees — The Board of Directors has adopted a separate Master Distribution and Individual Shareholder Services Plan for each of the A Class, C Class and R Class (collectively the plans), pursuant to Rule 12b-1 of the 1940 Act. The plans provide that the A Class will pay American Century Investment Services, Inc. (ACIS) an annual distribution and service fee of 0.25%. The plans provide that the C Class will pay ACIS an annual distribution and service fee of 1.00%, of which 0.25% is paid for individual shareholder services and 0.75% is paid for distribution services. The plans provide that the R Class will pay ACIS an annual distribution and service fee of 0.50%. The fees are
computed and accrued daily based on each class’s daily net assets and paid monthly in arrears. The fees are used to pay financial intermediaries for distribution and individual shareholder services. Fees incurred under the plans during the year ended November 30, 2013 are detailed in the Statement of Operations.
Related Parties — Certain officers and directors of the corporation are also officers and/or directors of American Century Companies, Inc. (ACC). The corporation’s investment advisor, ACIM, the corporation’s distributor, ACIS, and the corporation’s transfer agent, American Century Services, LLC, are wholly owned, directly or indirectly, by ACC. Various funds issued by American Century Asset Allocation Portfolios, Inc. and American Century Strategic Asset Allocations, Inc. own, in aggregate, 17% of the shares of the fund.
4. Investment Transactions
Purchases and sales of investment securities, excluding short-term investments, for the year ended November 30, 2013 were $1,927,860,924 and $1,938,346,603, respectively.
5. Capital Share Transactions
Transactions in shares of the fund were as follows:
Year ended November 30, 2013(1) | Year ended November 30, 2012 | |||||||||||
Shares | Amount | Shares | Amount | |||||||||
Investor Class/Shares Authorized | 550,000,000 | 1,050,000,000 | ||||||||||
Sold | 9,610,155 | $118,472,050 | 9,540,301 | $99,145,757 | ||||||||
Issued in reinvestment of distributions | 1,715,577 | 19,900,407 | 1,289,908 | 12,769,602 | ||||||||
Redeemed | (15,013,406 | ) | (184,392,231 | ) | (18,475,303 | ) | (191,498,787 | ) | ||||
| (3,687,674 | ) | (46,019,774 | ) | (7,645,094 | ) | (79,583,428 | ) | |||||
Institutional Class/Shares Authorized | 150,000,000 | 150,000,000 | ||||||||||
Sold | 3,140,110 | 38,258,142 | 3,648,208 | 37,988,069 | ||||||||
Issued in reinvestment of distributions | 237,368 | 2,753,024 | 174,599 | 1,721,641 | ||||||||
Redeemed | (2,376,498 | ) | (29,848,228 | ) | (2,828,496 | ) | (29,753,415 | ) | ||||
| 1,000,980 | 11,162,938 | 994,311 | 9,956,295 | |||||||||
A Class/Shares Authorized | 150,000,000 | 125,000,000 | ||||||||||
Sold | 5,245,205 | 65,703,449 | 3,603,895 | 36,787,526 | ||||||||
Issued in reinvestment of distributions | 215,947 | 2,503,930 | 102,434 | 1,020,551 | ||||||||
Redeemed | (3,642,714 | ) | (45,205,498 | ) | (3,616,301 | ) | (39,295,456 | ) | ||||
| 1,818,438 | 23,001,881 | 90,028 | (1,487,379 | ) | ||||||||
C Class/Shares Authorized | 10,000,000 | 10,000,000 | ||||||||||
Sold | 163,034 | 2,125,390 | 11,788 | 123,154 | ||||||||
Issued in reinvestment of distributions | 1,715 | 19,472 | — | — | ||||||||
Redeemed | (31,039 | ) | (379,874 | ) | (66,460 | ) | (667,358 | ) | ||||
| 133,710 | 1,764,988 | (54,672 | ) | (544,204 | ) | |||||||
R Class/Shares Authorized | 5,000,000 | 5,000,000 | ||||||||||
Sold | 34,725 | 433,114 | 41,567 | 440,298 | ||||||||
Issued in reinvestment of distributions | 1,862 | 21,632 | 250 | 2,536 | ||||||||
Redeemed | (72,251 | ) | (914,494 | ) | (166,772 | ) | (1,718,977 | ) | ||||
| (35,664 | ) | (459,748 | ) | (124,955 | ) | (1,276,143 | ) | |||||
R6 Class/Shares Authorized | 50,000,000 | N/A | ||||||||||
Sold | 384,473 | 4,698,936 | ||||||||||
Redeemed | (14,937 | ) | (200,000 | ) | ||||||||
| 369,536 | 4,498,936 | |||||||||||
Net increase (decrease) | (400,674 | ) | $(6,050,779 | ) | (6,740,382 | ) | $(72,934,859 | ) | ||||
(1) | July 26, 2013 (commencement of sale) through November 30, 2013 for the R6 Class. |
6. Fair Value Measurements
The fund’s investments valuation process is based on several considerations and may use multiple inputs to determine the fair value of the investments held by the fund. In conformity with accounting principles generally accepted in the United States of America, the inputs used to determine a valuation are classified into three broad levels.
• | Level 1 valuation inputs consist of unadjusted quoted prices in an active market for identical investments. |
• | Level 2 valuation inputs consist of direct or indirect observable market data (including quoted prices for comparable investments, evaluations of subsequent market events, interest rates, prepayment speeds, credit risk, etc.). These inputs also consist of quoted prices for identical investments initially expressed in local currencies that are adjusted through translation into U.S. dollars. |
• | Level 3 valuation inputs consist of unobservable data (including a fund’s own assumptions). |
The level classification is based on the lowest level input that is significant to the fair valuation measurement. The valuation inputs are not necessarily an indication of the risks associated with investing in these securities or other financial instruments.
The following is a summary of the level classifications as of period end. The Schedule of Investments provides additional information on the fund’s portfolio holdings.
Level 1 | Level 2 | Level 3 | |
Assets | |||
Investment Securities | |||
Common Stocks | $60,379,430 | $1,895,341,324 | — |
Temporary Cash Investments | 982,065 | 1,166,086 | — |
Total Value of Investment Securities | $61,361,495 | $1,896,507,410 | — |
7. Risk Factors
There are certain risks involved in investing in foreign securities. These risks include those resulting from future adverse political, social and economic developments, fluctuations in currency exchange rates, the possible imposition of exchange controls, and other foreign laws or restrictions. Investing in emerging markets may accentuate these risks.
The fund’s investment process may result in high portfolio turnover, which could mean high transaction costs, affecting both performance and capital gains tax liabilities to investors.
8. Federal Tax Information
On December 17, 2013, the fund declared and paid a per-share distribution from net realized gains to shareholders of record on December 16, 2013 of $0.2786 for the Investor Class, Institutional Class, A Class, C Class, R Class and R6 Class.
On December 17, 2013, the fund declared and paid the following per-share distributions from net investment income to shareholders of record on December 16, 2013:
Investor | Institutional | A Class | C Class | R Class | R6 Class |
$0.1450 | $0.1720 | $0.1113 | $0.0101 | $0.0776 | $0.1922 |
The tax character of distributions paid during the years ended November 30, 2013 and November 30, 2012 were as follows:
2013 | 2012 | |
Distributions Paid From | ||
Ordinary income | $25,986,361 | $15,934,297 |
Long-term capital gains | — | — |
The book-basis character of distributions made during the year from net investment income or net realized gains may differ from their ultimate characterization for federal income tax purposes. These differences reflect the differing character of certain income items and net realized gains and losses for financial statement and tax purposes, and may result in reclassification among certain capital accounts on the financial statements.
As of November 30, 2013, the federal tax cost of investments and the components of distributable earnings on a tax-basis were as follows:
Federal tax cost of investments | $1,515,081,276 |
Gross tax appreciation of investments | $449,585,136 |
Gross tax depreciation of investments | (6,797,507) |
Net tax appreciation (depreciation) of investments | $442,787,629 |
Net tax appreciation (depreciation) on translation of assets and liabilities in foreign currencies | $ 86,037 |
Net tax appreciation (depreciation) | $442,873,666 |
Undistributed ordinary income | $27,903,528 |
Accumulated long-term gains | $40,027,282 |
Accumulated short-term capital losses | $(2,044,941) |
The difference between book-basis and tax-basis unrealized appreciation (depreciation) is attributable primarily to the realization to ordinary income for tax purposes of unrealized gains on investments in passive foreign investment companies.
Accumulated capital losses represent net capital loss carryovers that may be used to offset future realized capital gains for federal income tax purposes. As a result of a shift in ownership, the utilization of current capital loss carryovers are limited. Any remaining accumulated gains after application of this limitation will be distributed to shareholders. Future capital loss carryover utilization in any given year may be subject to Internal Revenue Code limitations. Capital loss carryovers expire in 2016.
Financial Highlights |
For a Share Outstanding Throughout the Years Ended November 30 (except as noted) | |||||||||||
Per-Share Data | Ratios and Supplemental Data | ||||||||||
Income From Investment Operations: | Ratio to Average Net Assets of: | ||||||||||
Net Asset | Net Income | Net Realized Gain (Loss) | Total From Investment Operations | Distributions Investment Income | Net Asset | Total | Operating | Net | Portfolio | Net Assets, | |
Investor Class | |||||||||||
2013 | $11.27 | 0.11 | 2.58 | 2.69 | (0.18) | $13.78 | 24.22% | 1.22% | 0.84% | 110% | $1,499,623 |
2012 | $9.90 | 0.15 | 1.33 | 1.48 | (0.11) | $11.27 | 15.10% | 1.29% | 1.41% | 106% | $1,268,251 |
2011 | $10.30 | 0.10 | (0.35) | (0.25) | (0.15) | $9.90 | (2.57)% | 1.32% | 0.95% | 125% | $1,189,245 |
2010 | $9.75 | 0.09 | 0.61 | 0.70 | (0.15) | $10.30 | 7.28% | 1.35% | 0.87% | 130% | $1,320,906 |
2009 | $7.15 | 0.09 | 2.64 | 2.73 | (0.13) | $9.75 | 38.66% | 1.38% | 1.18% | 151% | $1,279,615 |
Institutional Class | |||||||||||
2013 | $11.24 | 0.13 | 2.58 | 2.71 | (0.22) | $13.73 | 24.54% | 1.02% | 1.04% | 110% | $185,325 |
2012 | $9.89 | 0.17 | 1.33 | 1.50 | (0.15) | $11.24 | 15.28% | 1.09% | 1.61% | 106% | $140,446 |
2011 | $10.30 | 0.12 | (0.33) | (0.21) | (0.20) | $9.89 | (2.27)% | 1.12% | 1.15% | 125% | $113,741 |
2010 | $9.78 | 0.10 | 0.61 | 0.71 | (0.19) | $10.30 | 7.38% | 1.15% | 1.07% | 130% | $98,610 |
2009 | $7.17 | 0.11 | 2.64 | 2.75 | (0.14) | $9.78 | 38.96% | 1.18% | 1.38% | 151% | $66,920 |
A Class | |||||||||||
2013 | $11.33 | 0.07 | 2.61 | 2.68 | (0.15) | $13.86 | 23.98% | 1.47% | 0.59% | 110% | $267,979 |
2012 | $9.92 | 0.12 | 1.35 | 1.47 | (0.06) | $11.33 | 14.80% | 1.54% | 1.16% | 106% | $198,434 |
2011 | $10.29 | 0.08 | (0.35) | (0.27) | (0.10) | $9.92 | (2.76)% | 1.57% | 0.70% | 125% | $172,901 |
2010 | $9.72 | 0.06 | 0.61 | 0.67 | (0.10) | $10.29 | 6.98% | 1.60% | 0.62% | 130% | $183,990 |
2009 | $7.13 | 0.07 | 2.63 | 2.70 | (0.11) | $9.72 | 38.30% | 1.63% | 0.93% | 151% | $177,804 |
For a Share Outstanding Throughout the Years Ended November 30 (except as noted) | |||||||||||
Per-Share Data | Ratios and Supplemental Data | ||||||||||
Income From Investment Operations: | Ratio to Average Net Assets of: | ||||||||||
Net Asset | Net Income | Net Realized Gain (Loss) | Total From Investment Operations | Distributions Investment Income | Net Asset | Total | Operating | Net | Portfolio | Net Assets, | |
C Class | |||||||||||
2013 | $11.14 | (0.03) | 2.57 | 2.54 | (0.10) | $13.58 | 23.00% | 2.22% | (0.16)% | 110% | $4,859 |
2012 | $9.77 | 0.04 | 1.33 | 1.37 | — | $11.14 | 14.02% | 2.29% | 0.41% | 106% | $2,497 |
2011 | $10.13 | —(3) | (0.36) | (0.36) | — | $9.77 | (3.55)% | 2.32% | (0.05)% | 125% | $2,725 |
2010 | $9.54 | (0.01) | 0.60 | 0.59 | — | $10.13 | 6.18% | 2.35% | (0.13)% | 130% | $2,691 |
2009 | $7.00 | 0.01 | 2.59 | 2.60 | (0.06) | $9.54 | 37.29% | 2.38% | 0.18% | 151% | $3,051 |
R Class | |||||||||||
2013 | $11.41 | 0.05 | 2.62 | 2.67 | (0.12) | $13.96 | 23.59% | 1.72% | 0.34% | 110% | $2,270 |
2012 | $9.97 | 0.10 | 1.35 | 1.45 | (0.01) | $11.41 | 14.56% | 1.79% | 0.91% | 106% | $2,262 |
2011 | $10.32 | 0.05 | (0.36) | (0.31) | (0.04) | $9.97 | (3.05)% | 1.82% | 0.45% | 125% | $3,222 |
2010 | $9.72 | 0.03 | 0.62 | 0.65 | (0.05) | $10.32 | 6.75% | 1.85% | 0.37% | 130% | $4,381 |
2009 | $7.13 | 0.06 | 2.62 | 2.68 | (0.09) | $9.72 | 37.97% | 1.88% | 0.68% | 151% | $5,436 |
R6 Class | |||||||||||
2013(4) | $12.56 | 0.01 | 1.17 | 1.18 | — | $13.74 | 9.39% | 0.85%(5) | 0.20%(5) | 110%(6) | $5,076 |
Notes to Financial Highlights
(1) | Computed using average shares outstanding throughout the period. |
(2) | Total returns are calculated based on the net asset value of the last business day and do not reflect applicable sales charges, if any. Total returns for periods less than one year are not annualized. |
(3) | Per-share amount was less than $0.005. |
(4) | July 26, 2013 (commencement of sale) through November 30, 2013. |
(5) | Annualized. |
(6) | Portfolio turnover is calculated at the fund level. Percentage indicated was calculated for the year ended November 30, 2013. |
See Notes to Financial Statements.
Report of Independent Registered Public Accounting Firm |
To the Board of Directors and Shareholders of
American Century World Mutual Funds, Inc.:
We have audited the accompanying statement of assets and liabilities, including the schedule of investments, of International Growth Fund (the “Fund”), one of the funds constituting American Century World Mutual Funds, Inc., as of November 30, 2013, and the related statement of operations for the year then ended, the statements of changes in net assets for each of the two years in the period then ended, and the financial highlights for each of the periods presented. These financial statements and financial highlights are the responsibility of the Fund’s management. Our responsibility is to express an opinion on these financial statements and financial highlights based on our audits.
We conducted our audits in accordance with the standards of the Public Company Accounting Oversight Board (United States). Those standards require that we plan and perform the audit to obtain reasonable assurance about whether the financial statements and financial highlights are free of material misstatement. The Fund is not required to have, nor were we engaged to perform, an audit of its internal control over financial reporting. Our audits included consideration of internal control over financial reporting as a basis for designing audit procedures that are appropriate in the circumstances, but not for the purpose of expressing an opinion on the effectiveness of the Fund’s internal control over financial reporting. Accordingly, we express no such opinion. An audit also includes examining, on a test basis, evidence supporting the amounts and disclosures in the financial statements, assessing the accounting principles used and significant estimates made by management, as well as evaluating the overall financial statement presentation. Our procedures included confirmation of securities owned as of November 30, 2013, by correspondence with the custodian and brokers; where replies were not received from brokers, we performed other auditing procedures. We believe that our audits provide a reasonable basis for our opinion.
In our opinion, the financial statements and financial highlights referred to above present fairly, in all material respects, the financial position of International Growth Fund of American Century World Mutual Funds, Inc. as of November 30, 2013, the results of its operations for the year then ended, the changes in its net assets for each of the two years in the period then ended, and the financial highlights for each of the periods presented, in conformity with accounting principles generally accepted in the United States of America.
Deloitte & Touche LLP
Kansas City, Missouri
January 17, 2014
Management |
The Board of Directors
The individuals listed below serve as directors of the funds. Each director will continue to serve in this capacity until death, retirement, resignation or removal from office. The board has adopted a mandatory retirement age for directors who are not “interested persons,” as that term is defined in the Investment Company Act (independent directors). Independent directors shall retire by December 31 of the year in which they reach their 75th birthday. Mr. Pratt may serve until December 31 of the year in which he reaches his 76th birthday based on an extension granted under previous retirement guidelines.
Mr. Thomas is an “interested person” because he currently serves as President and Chief Executive Officer of American Century Companies, Inc. (ACC), the parent company of American Century Investment Management, Inc. (ACIM or the advisor). Mr. Fink is treated as an “interested person” because of his recent employment with ACC and American Century Services, LLC (ACS). The other directors (more than three-fourths of the total number) are independent. They are not employees, directors or officers of, and have no financial interest in, ACC or any of its wholly owned, direct or indirect, subsidiaries, including ACIM, American Century Investment Services, Inc. (ACIS) and ACS, and do not have any other affiliations, positions, or relationships that would cause them to be considered “interested persons” under the Investment Company Act. The directors serve in this capacity for seven (in the case of Mr. Thomas, 15) registered investment companies in the American Century Investments family of funds.
The following table presents additional information about the directors. The mailing address for each director is 4500 Main Street, Kansas City, Missouri 64111.
Name | Position(s) Held with Funds | Length of Time Served | Principal Occupation(s) During Past 5 Years | Number of American Century Portfolios Overseen by Director | Other Directorships Held During Past 5 Years | |
Independent Directors | ||||||
Thomas A. Brown (1940) | Director | Since 1980 | Managing Member, Associated Investments, LLC (real estate investment company); Brown Cascade Properties, LLC (real estate investment company) (2001 to 2009) | 75 | None | |
Andrea C. Hall (1945) | Director | Since 1997 | Retired | 75 | None | |
Jan M. Lewis (1957) | Director | Since 2011 | President and Chief Executive Officer, Catholic Charities of Northeast Kansas (human services organization) | 75 | None | |
James A. Olson (1942) | Director | Since 2007 | Member, Plaza Belmont LLC (private equity fund manager) | 75 | Saia, Inc. (2002 to 2012) and EPR Properties (2003 to 2013) | |
Donald H. Pratt(1) (1937) | Director and Chairman of the Board | Since 1995 (Chairman since 2005) | Chairman and Chief Executive Officer, Western Investments, Inc. (real estate company) | 75 | None | |
Name | Position(s) Held with Funds | Length of Time Served | Principal Occupation(s) During Past 5 Years | Number of American Century Portfolios Overseen by Director | Other Directorships Held During Past 5 Years | |
Independent Directors | ||||||
M. Jeannine Strandjord | Director | Since 1994 | Retired | 75 | Euronet Worldwide Inc.; Charming Shoppes, Inc. (2006 to 2010); and DST Systems Inc. (1996 to 2012) | |
John R. Whitten (1946) | Director | Since 2008 | Retired | 75 | Rudolph Technologies, Inc. | |
Stephen E. Yates (1948) | Director | Since 2012 | Retired; Executive Vice President, Technology & Operations, KeyCorp. (computer services)(2004 to 2010) | 75 | Applied Industrial Technologies, Inc. (2001 to 2010) | |
Interested Directors | ||||||
Barry Fink | Director | Since 2012 | Retired; Executive Vice President, ACC (September 2007 to February 2013); President, ACS (October 2007 to February 2013); Chief Operating Officer, ACC (September 2007 to November 2012) | 75 | None | |
Jonathan S. Thomas | Director and President | Since 2007 | President and Chief Executive Officer, ACC (March 2007 to present). Also serves as Chief Executive Officer and Manager, ACS; Executive Vice President, ACIM; Director, ACC, ACIM and other ACC subsidiaries | 117 | None | |
(1) | Donald H. Pratt will retire as Director and Chairman of the Board effective December 31, 2013. |
Officers
The following table presents certain information about the executive officers of the funds. Each officer serves as an officer for each of the 15 investment companies in the American Century family of funds, unless otherwise noted. No officer is compensated for his or her service as an officer of the funds. The listed officers are interested persons of the funds and are appointed or re-appointed on an annual basis. The mailing address for each officer listed below is 4500 Main Street, Kansas City, Missouri 64111.
Name | Offices with the Funds | Principal Occupation(s) During the Past Five Years |
Jonathan S. Thomas | Director and President since 2007 | President and Chief Executive Officer, ACC (March 2007 to present). Also serves as Chief Executive Officer and Manager, ACS; Executive Vice President, ACIM; Director, ACC, ACIM and other ACC subsidiaries |
Maryanne L. Roepke | Chief Compliance Officer since 2006 and Senior Vice President since 2000 | Chief Compliance Officer, American Century funds, ACIM and ACS (August 2006 to present). Also serves as Senior Vice President, ACS |
Charles A. Etherington (1957) | General Counsel since 2007 and Senior Vice President since 2006 | Attorney, ACC (February 1994 to present); Vice President, ACC (November 2005 to present); General Counsel, ACC (March 2007 to present). Also serves as General Counsel, ACIM, ACS, ACIS and other ACC subsidiaries; and Senior Vice President, ACIM and ACS |
C. Jean Wade (1964) | Vice President, Treasurer and Chief Financial Officer since 2012 | Vice President, ACS (February 2000 to present) |
Robert J. Leach (1966) | Vice President since 2006 and Assistant Treasurer since 2012 | Vice President, ACS (February 2000 to present) |
David H. Reinmiller (1963) | Vice President since 2000 | Attorney, ACC (January 1994 to present); Associate General Counsel, ACC (January 2001 to present). Also serves as Vice President, ACIM and ACS |
Ward D. Stauffer (1960) | Secretary since 2005 | Attorney, ACC (June 2003 to present) |
The Statement of Additional Information has additional information about the fund’s directors and is available without charge, upon request, by calling 1-800-345-2021.
Approval of Management Agreement |
At a meeting held on June 20, 2013, the Fund’s Board of Directors unanimously approved the renewal of the management agreement pursuant to which American Century Investment Management, Inc. (the “Advisor”) acts as the investment advisor for the Fund. Under Section 15(c) of the Investment Company Act, contracts for investment advisory services are required to be reviewed, evaluated, and approved by a majority of a fund’s directors (the “Directors”), including a majority of the independent Directors, each year.
Prior to its consideration of the renewal of the management agreement, the Board requested and reviewed extensive data and information compiled by the Advisor and certain independent providers of evaluation data concerning the Fund and the services provided to the Fund by the Advisor. This review was in addition to the oversight and evaluation undertaken by the Board and its committees on a continuous basis throughout the year.
In connection with its consideration of the renewal of the management agreement, the Board’s review and evaluation of the services provided by the Advisor included, but was not limited to, the following:
• | the nature, extent, and quality of investment management, shareholder services, and other services provided by the Advisor to the Fund; |
• | the wide range of other programs and services the Advisor provides to the Fund and its shareholders on a routine and non-routine basis; |
• | the investment performance of the Fund, including data comparing the Fund’s performance to appropriate benchmarks and/or a peer group of other mutual funds with similar investment objectives and strategies; |
• | data comparing the cost of owning the Fund to the cost of owning similar funds; |
• | the Advisor’s compliance policies, procedures, and regulatory experience; |
• | financial data showing the cost of services provided to the Fund, the profitability of the Fund to the Advisor, and the overall profitability of the Advisor; |
• | possible economies of scale associated with the Advisor’s management of the Fund and other accounts under its management; |
• | data comparing services provided and charges to other investment management clients of the Advisor; and |
• | consideration of collateral benefits derived by the Advisor from the management of the Fund. |
In keeping with its practice, the Board held two in-person meetings and one telephonic meeting to review and discuss the information provided. The Directors also had the benefit of the advice of independent counsel throughout the period.
Factors Considered
The Directors considered all of the information provided by the Advisor, the independent data providers, and independent counsel, and evaluated such information for the Fund. In connection with their review, the Directors did not identify any single factor as being all-important or controlling, and each Director may have attributed different levels of importance to different factors. In deciding to renew the management agreement, the Board based its decision on a number of factors, including the following:
Nature, Extent and Quality of Services — Generally. Under the management agreement, the Advisor is responsible for providing or arranging for all services necessary for the operation of the Fund. The Board noted that under the management agreement, the Advisor provides or arranges at its own expense a wide variety of services including:
• | constructing and designing the Fund |
• | portfolio research and security selection |
• | initial capitalization/funding |
• | securities trading |
• | Fund administration |
• | custody of Fund assets |
• | daily valuation of the Fund’s portfolio |
• | shareholder servicing and transfer agency, including shareholder confirmations, recordkeeping, and communications |
• | legal services |
• | regulatory and portfolio compliance |
• | financial reporting |
• | marketing and distribution |
The Board noted that many of these services have expanded over time both in terms of quantity and complexity in response to shareholder demands, competition in the industry, changing distribution channels, and the changing regulatory environment.
Investment Management Services. The nature of the investment management services provided to the Fund is quite complex and allows Fund shareholders access to professional money management, instant diversification of their investments within an asset class, the opportunity to easily diversify among asset classes by investing in or exchanging among various American Century Investments funds, and liquidity. In evaluating investment performance, the Board expects the Advisor to manage the Fund in accordance with its investment objectives and approved strategies. Further, the Directors recognize that the Advisor has
an obligation to monitor trading activities, and in particular to seek the best execution of fund trades, and to evaluate the use of and payment for research. In providing these services, the Advisor utilizes teams of investment professionals (portfolio managers, analysts, research assistants, and securities traders) who require extensive information technology, research, training, compliance and other systems to conduct their business. The Board, directly and through its Fund Performance Review Committee, regularly reviews investment performance information for the Fund, together with comparative information for appropriate benchmarks and/or peer groups of similarly-managed funds, over different time horizons. The Directors also review detailed performance information during the management agreement approval process. If performance concerns are identified, the Fund receives special reviews until performance improves, during which the Board discusses with the Advisor the reasons for such results (e.g., market conditions, security selection) and any efforts being undertaken to improve performance. Taking all these factors into consideration, the Board found the investment management services provided by the Advisor to the Fund to meet or exceed industry standards. More detailed information about the Fund’s performance can be found in the Performance and Portfolio Commentary sections of this report.
Shareholder and Other Services. Under the management agreement, the Advisor provides the Fund with a comprehensive package of transfer agency, shareholder, and other services. The Board, directly and through various committees of the Board, regularly reviews reports and evaluations of such services at its regular meetings. These reports include, but are not limited to, information regarding the operational efficiency and accuracy of the shareholder and transfer agency services provided, staffing levels, shareholder satisfaction (as measured by external as well as internal sources), technology support, new products and services offered to Fund shareholders, securities trading activities, portfolio valuation services, auditing services, and legal and operational compliance activities. Certain aspects of shareholder and transfer agency service level efficiency and the quality of securities trading activities are measured by independent third party providers and are presented in comparison to other fund groups not managed by the Advisor. The Board found the services provided by the Advisor to the Fund under the management agreement to be competitive and of high quality.
Costs of Services and Profitability. The Advisor provides detailed information concerning its cost of providing various services to the Fund, its profitability in managing the Fund, its overall profitability, and its financial condition. The Directors have reviewed with the Advisor the methodology used to prepare this financial information. The financial information regarding the Advisor is considered in evaluating the Advisor’s financial condition, its ability to continue to provide services under the management agreement, and the reasonableness of the current management fee. The Board concluded that the Advisor’s profits were reasonable in light of the services provided to the Fund.
Ethics. The Board generally considers the Advisor’s commitment to providing quality services to shareholders and to conducting its business ethically. They noted that the Advisor’s practices generally meet or exceed industry best practices.
Economies of Scale. The Board also reviewed information provided by the Advisor regarding the possible existence of economies of scale in connection with the management of the Fund. The Board concluded that economies of scale are difficult to measure and predict with precision, especially on a fund-by-fund basis. The Board concluded that the Advisor is appropriately sharing economies of scale through its competitive fee structure, offering competitive fees from fund inception, and through reinvestment in its business to provide shareholders additional content and services.
Comparison to Other Funds’ Fees. The management agreement provides that the Fund pay the Advisor a single, all-inclusive (or unified) management fee for providing all services necessary for the management and operation of the Fund, other than brokerage expenses, taxes, interest, extraordinary expenses, and the fees and expenses of the Fund’s independent directors (including their independent legal counsel) and expenses incurred in connection with the provision of shareholder services and distribution services under a plan adopted pursuant to Rule 12b-1 under the 1940 Act. Under the unified fee structure, the Advisor is responsible for providing all investment advisory, custody, audit, administrative, compliance, recordkeeping, marketing and shareholder services, or arranging and supervising third parties to provide such services. By contrast, most other funds are charged a variety of fees, including an investment advisory fee, a transfer agency fee, an administrative fee, distribution charges and other expenses. Other than their investment advisory fees and any applicable Rule 12b-1 distribution fees, all other components of the total fees charged by these other funds may be increased without shareholder approval. The Board believes the unified fee structure is a benefit to Fund shareholders because it clearly discloses to shareholders the cost of owning Fund shares, and, since the unified fee cannot be increased without a vote of Fund shareholders, it shifts to the Advisor the risk of increased costs of operating the Fund and provides a direct incentive to minimize administrative inefficiencies. Part of the Board’s analysis of fee levels involves reviewing certain evaluative data compiled by an independent provider and comparing the Fund’s unified fee to the total expense ratio of other funds in the Fund’s peer group. The Board concluded that the management fee paid by the Fund to the Advisor under the management agreement is reasonable in light of the services provided to the Fund.
Comparison to Fees and Services Provided to Other Clients of the Advisor. The Board also requested and received information from the Advisor concerning the nature of the services, fees, costs and profitability of its advisory services to advisory clients other than the Fund. They observed that these varying types of client accounts require different services and involve different regulatory and entrepreneurial risks than the management of the Fund. The Board analyzed this information and concluded that the fees charged and services provided to the Fund were reasonable by comparison.
Collateral or “Fall-Out” Benefits Derived by the Advisor. The Board considered the existence of collateral benefits the Advisor may receive as a result of its relationship with the Fund. They concluded that the Advisor’s primary business is managing mutual funds and it generally does not use fund or shareholder information to generate profits in other lines of business, and therefore does not derive any significant collateral benefits from them. The Board noted that the Advisor receives proprietary research from broker-dealers that execute fund portfolio transactions and concluded that this research is likely to benefit Fund
shareholders. The Board also determined that the Advisor is able to provide investment management services to certain clients other than the Fund, at least in part, due to its existing infrastructure built to serve the fund complex. The Board concluded, however, that the assets of those other clients are not material to the analysis and, where applicable, may be included with the assets of the Fund to determine breakpoints in the management fee schedule.
Existing Relationship. The Board also considered whether there was any reason for not continuing the existing arrangement with the Advisor. In this regard, the Board was mindful of the potential disruptions of the Fund’s operations and various risks, uncertainties, and other effects that could occur as a result of a decision not to continue such relationship. In particular, the Board recognized that most shareholders have invested in the Fund on the strength of the Advisor’s industry standing and reputation and in the expectation that the Advisor will have a continuing role in providing advisory services to the Fund.
Conclusion of the Directors. As a result of this process, the Board, including all of the independent directors, taking into account all of the factors discussed above and the information provided by the Advisor and others, concluded that the management agreement between the Fund and the Advisor is fair and reasonable in light of the services provided and should be renewed.
Additional Information |
Retirement Account Information
As required by law, distributions you receive from certain IRAs are subject to federal income tax withholding, unless you elect not to have withholding apply. Tax will be withheld on the total amount withdrawn even though you may be receiving amounts that are not subject to withholding, such as nondeductible contributions. In such case, excess amounts of withholding could occur. You may adjust your withholding election so that a greater or lesser amount will be withheld.
If you don’t want us to withhold on this amount, you must notify us to not withhold the federal income tax. You may notify us in writing or in certain situations by telephone or through other electronic means. For systematic withdrawals, your withholding election will remain in effect until revoked or changed by filing a new election. You have the right to revoke your election at any time.
Remember, even if you elect not to have income tax withheld, you are liable for paying income tax on the taxable portion of your withdrawal. If you elect not to have income tax withheld or you don’t have enough income tax withheld, you may be responsible for payment of estimated tax. You may incur penalties under the estimated tax rules if your withholding and estimated tax payments are not sufficient. You can reduce or defer the income tax on a distribution by directly or indirectly rolling such distribution over to another IRA or eligible plan. You should consult your tax advisor for additional information.
State tax will be withheld if, at the time of your distribution, your address is within one of the mandatory withholding states and you have federal income tax withheld (or as otherwise required by state law). State taxes will be withheld from your distribution in accordance with the respective state rules.
Distributions you receive from 403(b), 457 and qualified plans are subject to special tax and withholding rules. Your plan administrator or plan sponsor is required to provide you with a special tax notice explaining those rules at the time you request a distribution. If applicable, federal and/or state taxes may be withheld from your distribution amount.
Proxy Voting Policies
A description of the policies that the fund’s investment advisor uses in exercising the voting rights associated with the securities purchased and/or held by the fund is available without charge, upon request, by calling 1-800-345-2021. It is also available on the “About Us” page of American Century Investments’ website at americancentury.com and on the Securities and Exchange Commission’s website at sec.gov. Information regarding how the investment advisor voted proxies relating to portfolio securities during the most recent 12-month period ended June 30 is available on the “About Us” page at americancentury.com. It is also available at sec.gov.
Quarterly Portfolio Disclosure
The fund files its complete schedule of portfolio holdings with the Securities and Exchange Commission (SEC) for the first and third quarters of each fiscal year on Form N-Q. The fund’s Forms N-Q are available on the SEC’s website at sec.gov, and may be reviewed and copied at the SEC’s Public Reference Room in Washington, DC. Information on the operation of the Public Reference Room may be obtained by calling 1-800-SEC-0330. The fund also makes its complete schedule of portfolio holdings for the most recent quarter of its fiscal year available on its website at americancentury.com and, upon request, by calling 1-800-345-2021.
Other Tax Information
The following information is provided pursuant to provisions of the Internal Revenue Code.
The fund hereby designates up to the maximum amount allowable as qualified dividend income for the fiscal year ended November 30, 2013.
For the fiscal year ended November 30, 2013, the fund intends to pass through to shareholders $3,839,028, or up to the maximum amount allowable, as a foreign tax credit which represents taxes paid on income derived from sources within foreign countries or possessions of the United States. During the fiscal year ended November 30, 2013, the fund earned $40,507,204 from income derived from foreign sources. Foreign source income and foreign tax expense per outstanding share on November 30, 2013 are $0.2842 and $0.0269, respectively.
Notes |
![]()
Contact Us | americancentury.com |
Automated Information Line | 1-800-345-8765 |
Investor Services Representative | 1-800-345-2021 |
Investors Using Advisors | 1-800-378-9878 |
Business, Not-For-Profit, Employer-Sponsored Retirement Plans | 1-800-345-3533 |
Banks and Trust Companies, Broker-Dealers, Financial Professionals, Insurance Companies | 1-800-345-6488 |
Telecommunications Relay Service for the Deaf | 711 |
American Century World Mutual Funds, Inc.
Investment Advisor:
American Century Investment Management, Inc.
Kansas City, Missouri
This report and the statements it contains are submitted for the general information of our shareholders. The report is not authorized for distribution to prospective investors unless preceded or accompanied by an effective prospectus.
©2014 American Century Proprietary Holdings, Inc. All rights reserved.
CL-ANN-80784 1401
ANNUAL REPORT | NOVEMBER 30, 2013 |
International Opportunities Fund
Table of Contents |
President’s Letter | 2 |
Market Perspective | 3 |
Performance | 4 |
Portfolio Commentary | 6 |
Fund Characteristics | 8 |
Shareholder Fee Example | 9 |
Schedule of Investments | 11 |
Statement of Assets and Liabilities | 14 |
Statement of Operations | 15 |
Statement of Changes in Net Assets | 16 |
Notes to Financial Statements | 17 |
Financial Highlights | 23 |
Report of Independent Registered Public Accounting Firm | 25 |
Management | 26 |
Approval of Management Agreement | 29 |
Additional Information | 34 |
Any opinions expressed in this report reflect those of the author as of the date of the report, and do not necessarily represent the opinions of American Century Investments® or any other person in the American Century Investments organization. Any such opinions are subject to change at any time based upon market or other conditions and American Century Investments disclaims any responsibility to update such opinions. These opinions may not be relied upon as investment advice and, because investment decisions made by American Century Investments funds are based on numerous factors, may not be relied upon as an indication of trading intent on behalf of any American Century Investments fund. Security examples are used for representational purposes only and are not intended as recommendations to purchase or sell securities. Performance information for comparative indices and securities is provided to American Century Investments by third party vendors. To the best of American Century Investments’ knowledge, such information is accurate at the time of printing.
President’s Letter |
Jonathan Thomas
Dear Investor:
Thank you for reviewing this annual report for the 12 months ended November 30, 2013. It provides investment performance, market analysis, and portfolio information, presented with the expert perspective of our portfolio management team.
Annual reports remain important vehicles for conveying information about fund returns, including key factors that affected fund performance. For additional, updated investment and market insights, we encourage you to visit our website, americancentury.com.
Monetary Policy-Driven, “Risk-On” Results in Developed Countries
Stimulative monetary policies by central banks and slowly improving global economic conditions played a major part in financial market returns during the reporting period. The combination of an improving global economic outlook, mostly low costs of capital in the money markets, and central bank purchases of longer-maturity fixed income securities (a market liquidity-building strategy known as quantitative easing, QE) helped persuade investors to seek risk and yield, particularly in developed markets such as the U.S., Japan, and Europe. Broad stock index returns were stellar in these markets, particularly at the smaller capitalization end of the company size spectrum. Representing the broad markets, the S&P 500 and MSCI EAFE Indices returned 30.30% and 24.84%, respectively, for the reporting period, and their smaller capitalization counterparts performed even better.
At the same time, hints that QE might be tapered soon in the U.S. hampered government bond returns and emerging market stock indices. Broad emerging market stock indices posted positive single-digit returns, but government bond total returns dipped into negative territory, despite low inflation. Corporate bonds, especially high-yield corporates, generally performed better than government bonds because of their higher yields, declining spreads (yield differences between corporate and similar-maturity Treasury securities), and relatively low default rates, compared with historical averages.
As we enter 2014, there’s less uncertainty about the U.S. fiscal picture and global economic strength than a year ago, but headwinds continue. A full economic recovery from 2008 remains elusive—economic growth is still subpar compared with past recoveries. In this environment, we continue to believe in a disciplined, diversified, long-term investment approach, using professionally managed stock and bond portfolios—as appropriate—for meeting financial goals. We appreciate your continued trust in us.
Sincerely,
Jonathan Thomas
President and Chief Executive Officer
American Century Investments
Market Perspective |
By Mark Kopinski, Chief Investment Officer, Global and Non-U.S. Equity
Global Stocks Rallied to Post Double-Digit Gains
Stock market performance remained robust during the 12-month period ended November 30, 2013, with most major market indices posting double-digit gains. Despite persistent concerns about weak global growth and a slowdown in China, investors largely focused on central bank stimulus measures, marginally improving U.S. and European economic data, and relatively healthy corporate earnings, which fueled stock market optimism.
Prior to the reporting period, the U.S. Federal Reserve (the Fed) announced its third quantitative easing program (QE3). This effort, combined with similar large-scale stimulus measures from the European Central Bank (ECB) and the Bank of Japan as well as favorable corporate earnings reports, generally helped keep stocks in favor. Additionally, housing market gains in the U.S., U.K., and Australia aided the global investment landscape.
Europe, Japan were Performance Leaders
Assurances by the ECB that it would keep interest rates at historic lows for an extended period, followed by the cutting of its key lending rate to 0.25% late in the period, helped drive stock market gains in Europe. In addition, economic conditions throughout Europe improved, led by an expanding manufacturing sector, improving business and consumer sentiment, and a slowdown of the economic contraction in the peripheral countries. In the second calendar quarter of 2013, the 17-member eurozone emerged from its longest-ever recession (six consecutive quarters). Investors generally focused on these positive factors, pushing stocks higher despite the structural issues and high unemployment still plaguing the region.
In Japan, the central bank’s efforts to pull the nation out of its decades-long deflationary spiral and spark economic growth appeared to be working. Japan’s economy grew, and consumer prices increased. Late in the period, government officials announced the country’s inflation rate rose at a five-year high, suggesting their deflation-focused initiatives were gaining traction.
Overall, developed market stocks sharply outperformed their emerging market counterparts. Much of the lagging performance was due to a slower-growth environment in China. In addition, rising inflation and currency weakness weighed on many developing nations.
International Equity Total Returns | ||||
For the 12 months ended November 30, 2013 (in U.S. dollars) | ||||
MSCI EAFE Index | 24.84% | MSCI Europe Index | 25.94% | |
MSCI EAFE Growth Index | 23.45% | MSCI World Index | 26.38% | |
MSCI EAFE Value Index | 26.20% | MSCI Japan Index | 32.84% | |
MSCI Emerging Markets Index | 3.66% | |||
Performance |
Total Returns as of November 30, 2013 | ||||||
Average Annual Returns | ||||||
Ticker Symbol | 1 year | 5 years | 10 years | Since Inception | Inception Date | |
Investor Class | AIOIX | 30.13%(1)(2) | 20.75% | 12.41% | 13.60% | 6/1/01 |
MSCI All Country World ex-U.S. Small Cap | — | 19.81% | 19.67% | 9.62% | 8.17% | — |
Institutional Class | ACIOX | 30.38%(1)(2) | 21.04% | 12.65% | 16.40% | 1/9/03 |
A Class No sales charge* With sales charge* | AIVOX
| 29.89%(1) 22.49%(1) | — — | — — | 15.02% 13.20% | 3/1/10
|
C Class | AIOCX | 29.02%(1) | — | — | 14.20% | 3/1/10 |
R Class | AIORX | 29.50%(1) | — | — | 14.73% | 3/1/10 |
* | Sales charges include initial sales charges and contingent deferred sales charges (CDSCs), as applicable. A Class shares have a 5.75% maximum initial sales charge and may be subject to a maximum CDSC of 1.00%. C Class shares redeemed within 12 months of purchase are subject to a maximum CDSC of 1.00%. The SEC requires that mutual funds provide performance information net of maximum sales charges in all cases where charges could be applied. |
(1) | Returns would have been lower if a portion of the management fee had not been waived. |
(2) | Extraordinary performance is attributable in part to unusually favorable market conditions and may not be repeated or consistently achieved in the future. |
Data presented reflect past performance. Past performance is no guarantee of future results. Current performance may be higher or lower than the performance shown. Investment return and principal value will fluctuate, and redemption value may be more or less than original cost. To obtain performance data current to the most recent month end, please call 1-800-345-2021 or visit americancentury.com. Historically, small company stocks have been more volatile than the stocks of larger, more established companies. The fund’s investment process may result in high portfolio turnover, which could mean high transaction costs, affecting both performance and capital gains tax liabilities to investors. International investing involves special risks, such as political instability and currency fluctuations. Investing in emerging markets may accentuate these risks.
Unless otherwise indicated, performance reflects Investor Class shares; performance for other share classes will vary due to differences in fee structure. For information about other share classes available, please consult the prospectus. Data assumes reinvestment of dividends and capital gains, and none of the charts reflect the deduction of taxes that a shareholder would pay on fund distributions or the redemption of fund shares. Returns for the index are provided for comparison. The fund’s total returns include operating expenses (such as transaction costs and management fees) that reduce returns, while the total returns of the index do not.
Growth of $10,000 Over 10 Years |
$10,000 investment made November 30, 2003 |
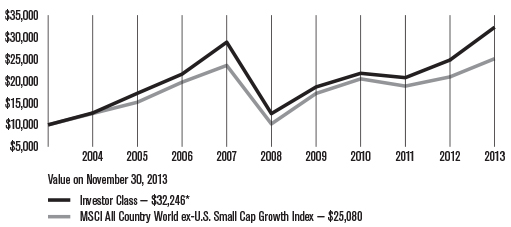
* Ending value would have been lower if a portion of the management fee had not been waived.
Total Annual Fund Operating Expenses | ||||
Investor Class | Institutional Class | A Class | C Class | R Class |
1.87% | 1.67% | 2.12% | 2.87% | 2.37% |
The total annual fund operating expenses shown is as stated in the fund’s prospectus current as of the date of this report. The prospectus may vary from the expense ratio shown elsewhere in this report because it is based on a different time period, includes acquired fund fees and expenses, and, if applicable, does not include fee waivers or expense reimbursements.
Data presented reflect past performance. Past performance is no guarantee of future results. Current performance may be higher or lower than the performance shown. Investment return and principal value will fluctuate, and redemption value may be more or less than original cost. To obtain performance data current to the most recent month end, please call 1-800-345-2021 or visit americancentury.com. Historically, small company stocks have been more volatile than the stocks of larger, more established companies. The fund’s investment process may result in high portfolio turnover, which could mean high transaction costs, affecting both performance and capital gains tax liabilities to investors. International investing involves special risks, such as political instability and currency fluctuations. Investing in emerging markets may accentuate these risks.
Unless otherwise indicated, performance reflects Investor Class shares; performance for other share classes will vary due to differences in fee structure. For information about other share classes available, please consult the prospectus. Data assumes reinvestment of dividends and capital gains, and none of the charts reflect the deduction of taxes that a shareholder would pay on fund distributions or the redemption of fund shares. Returns for the index are provided for comparison. The fund’s total returns include operating expenses (such as transaction costs and management fees) that reduce returns, while the total returns of the index do not.
Portfolio Commentary |
Portfolio Managers: Mark Kopinski, Trevor Gurwich, and Indraneel Das
Performance Summary
International Opportunities advanced 30.13%* for the 12 months ended November 30, 2013, compared with its benchmark, the MSCI All Country World ex-U.S. Small Cap Growth Index, which gained 19.81%.
Non-U.S. developed markets generally demonstrated robust performance during the 12-month period, primarily due to ongoing central bank stimulus measures, improving economic conditions in Europe, Japan, the U.K., and the U.S., and generally favorable corporate earnings. Overall, developed market stocks sharply outperformed their emerging market counterparts, and within the non-U.S. small-cap universe, value stocks outpaced growth stocks.
The portfolio’s outperformance compared with the benchmark primarily was due to favorable stock selection within several sectors, including consumer discretionary, materials, and industrials. Overall, our sector allocations also contributed positively to relative performance. On a regional basis, exposure in Australia, Canada, and Denmark contributed the most to relative results.
Jewelry Company was a Top Contributor
Robust performance in the textiles, apparel, and luxury goods industry—stemming primarily from improving spending trends for higher-end goods—helped drive results in the consumer discretionary sector. An overweight position in jewelry and charm retailer Pandora was among the portfolio’s top contributors. The stock price of the Denmark-based company advanced throughout the period, benefiting from lower silver and gold prices, an increase in luxury goods spending, and management’s recommitment to the company’s core business model. Late in the period, Pandora reported stronger-than-expected third-quarter profits attributed to growing demand and more frequent new-product launches. Management also reiterated its full-year forecasts, which it had increased in October.
Strong performance in the industrials sector largely was due to an overweight position in Ashtead Group, which also was among the portfolio’s top contributors for the period. The stock price of the U.K.-based construction equipment rental company advanced on solid earnings growth. Ashtead benefited from the housing market recoveries in the U.S. and U.K., its two key markets, and the preference among construction companies to rent rather than purchase equipment needed to grow the business.
In addition, an overweight position in Italy’s Banca Generali, an asset manager, was a top contributor to portfolio performance. The company reported a 6.3% gain in net profits during the first half of 2013, making it the best first half in Banca Generali history. The company also reported strong net inflows, which as of the first eight months of 2013 had already topped total inflows for all of 2012.
* | All fund returns referenced in this commentary are for Investor Class shares. Returns would have been lower if a portion of the management fee had not been waived. |
Semiconductor Company was a Main Detractor
Stock selection detracted from portfolio performance in the information technology and telecommunication services sectors. Regionally, exposure in Switzerland, China, and Norway weighed on relative results. In the technology sector, the semiconductor industry was among the weakest, and an overweight position in ams AG, a Switzerland-based supplier of semiconductors and sensor technology to handset makers, was a primary detractor. The company’s stock price suffered due to waning demand for handsets in general and from weaker demand specifically tied to the slowdown in China’s economic growth rate.
In addition, an overweight position in Australia-based Regis Resources, a mineral exploration and production company engaged in gold, nickel, and copper mining, was among the largest detractors. The company’s stock price suffered amid declining demand resulting from falling metals prices.
Norway-based Petroleum Geo-Services, a portfolio-only position, also was a primary detractor. The provider of marine seismic survey and data processing experienced waning demand for its services amid a pullback in surveying and infrastructure budgets worldwide. We sold the position in June.
Outlook
Our near-term growth outlook favors Europe, Japan, and North America. The European economy appears to be stabilizing, and we remain focused on European companies we believe will offer accelerating earnings growth. In Japan, where government policies have boosted economic activity and weakened the yen, we believe companies in the industrial- and consumer-led sectors remain attractive. Increasing real wages, tied to increasing corporate profits, may help fuel additional consumer activity in Japan. We also believe the U.S. economic recovery will continue, and we will seek non-U.S. companies with exposure to improving U.S. markets.
Meanwhile, we expect many emerging markets to continue to face pressures from currency weakness and rising-rate fears. We will focus on emerging market companies we believe are positioned to benefit from consumer activity in China or overall global growth.
Fund Characteristics |
NOVEMBER 30, 2013 | |
Top Ten Holdings | % of net assets |
Aareal Bank AG | 2.2% |
Royal UNIBREW A/S | 2.0% |
Dixons Retail plc | 1.8% |
Plastic Omnium SA | 1.5% |
Bellway plc | 1.5% |
Countrywide plc | 1.5% |
Techtronic Industries Co. | 1.5% |
AarhusKarlshamn AB | 1.5% |
Element Financial Corp. | 1.5% |
Hotel Shilla Co. Ltd. | 1.5% |
Types of Investments in Portfolio | % of net assets |
Foreign Common Stocks | 99.4% |
Temporary Cash Investments | 1.3% |
Other Assets and Liabilities | (0.7)% |
Investments by Country | % of net assets |
Japan | 19.2% |
United Kingdom | 13.3% |
Germany | 8.2% |
Hong Kong | 7.8% |
Taiwan | 5.0% |
Canada | 5.0% |
Denmark | 5.0% |
Sweden | 4.5% |
France | 4.3% |
South Korea | 3.9% |
China | 3.6% |
Italy | 2.3% |
Singapore | 2.2% |
Other Countries | 15.1% |
Cash and Equivalents* | 0.6% |
* Includes temporary cash investments and other assets and liabilities.
Shareholder Fee Example |
Fund shareholders may incur two types of costs: (1) transaction costs, including sales charges (loads) on purchase payments and redemption/exchange fees; and (2) ongoing costs, including management fees; distribution and service (12b-1) fees; and other fund expenses. This example is intended to help you understand your ongoing costs (in dollars) of investing in your fund and to compare these costs with the ongoing cost of investing in other mutual funds.
The example is based on an investment of $1,000 made at the beginning of the period and held for the entire period from June 1, 2013 to November 30, 2013.
Actual Expenses
The table provides information about actual account values and actual expenses for each class. You may use the information, together with the amount you invested, to estimate the expenses that you paid over the period. First, identify the share class you own. Then simply divide your account value by $1,000 (for example, an $8,600 account value divided by $1,000 = 8.6), then multiply the result by the number under the heading “Expenses Paid During Period” to estimate the expenses you paid on your account during this period.
If you hold Investor Class shares of any American Century Investments fund, or Institutional Class shares of the American Century Diversified Bond Fund, in an American Century Investments account (i.e., not a financial intermediary or retirement plan account), American Century Investments may charge you a $12.50 semiannual account maintenance fee if the value of those shares is less than $10,000. We will redeem shares automatically in one of your accounts to pay the $12.50 fee. In determining your total eligible investment amount, we will include your investments in all personal accounts (including American Century Investments Brokerage accounts) registered under your Social Security number. Personal accounts include individual accounts, joint accounts, UGMA/UTMA accounts, personal trusts, Coverdell Education Savings Accounts and IRAs (including traditional, Roth, Rollover, SEP-, SARSEP- and SIMPLE-IRAs), and certain other retirement accounts. If you have only business, business retirement, employer-sponsored or American Century Investments Brokerage accounts, you are currently not subject to this fee. If you are subject to the Account Maintenance Fee, your account value could be reduced by the fee amount.
Hypothetical Example for Comparison Purposes
The table also provides information about hypothetical account values and hypothetical expenses based on the actual expense ratio of each class of your fund and an assumed rate of return of 5% per year before expenses, which is not the actual return of a fund’s share class. The hypothetical account values and expenses may not be used to estimate the actual ending account balance or expenses you paid for the period. You may use this information to compare the ongoing costs of investing in your fund and other funds. To do so, compare this 5% hypothetical example with the 5% hypothetical examples that appear in the shareholder reports of the other funds.
Please note that the expenses shown in the table are meant to highlight your ongoing costs only and do not reflect any transactional costs, such as sales charges (loads) or redemption/exchange fees. Therefore, the table is useful in comparing ongoing costs only, and will not help you determine the relative total costs of owning different funds. In addition, if these transactional costs were included, your costs would have been higher.
Beginning 6/1/13 | Ending 11/30/13 | Expenses Paid During Period(1) 6/1/13 – 11/30/13 | Annualized | |
Actual | ||||
Investor Class (after waiver) | $1,000 | $1,124.70 | $8.79 | 1.65% |
Investor Class (before waiver) | $1,000 | $1,124.70(2) | $9.48 | 1.78% |
Institutional Class (after waiver) | $1,000 | $1,126.10 | $7.73 | 1.45% |
Institutional Class (before waiver) | $1,000 | $1,126.10(2) | $8.42 | 1.58% |
A Class (after waiver) | $1,000 | $1,123.60 | $10.11 | 1.90% |
A Class (before waiver) | $1,000 | $1,123.60(2) | $10.81 | 2.03% |
C Class (after waiver) | $1,000 | $1,119.80 | $14.08 | 2.65% |
C Class (before waiver) | $1,000 | $1,119.80(2) | $14.77 | 2.78% |
R Class (after waiver) | $1,000 | $1,121.30 | $11.43 | 2.15% |
R Class (before waiver) | $1,000 | $1,121.30(2) | $12.12 | 2.28% |
Hypothetical | ||||
Investor Class (after waiver) | $1,000 | $1,016.80 | $8.34 | 1.65% |
Investor Class (before waiver) | $1,000 | $1,016.14 | $9.00 | 1.78% |
Institutional Class (after waiver) | $1,000 | $1,017.80 | $7.33 | 1.45% |
Institutional Class (before waiver) | $1,000 | $1,017.15 | $7.99 | 1.58% |
A Class (after waiver) | $1,000 | $1,015.54 | $9.60 | 1.90% |
A Class (before waiver) | $1,000 | $1,014.89 | $10.25 | 2.03% |
C Class (after waiver) | $1,000 | $1,011.78 | $13.36 | 2.65% |
C Class (before waiver) | $1,000 | $1,011.13 | $14.02 | 2.78% |
R Class (after waiver) | $1,000 | $1,014.29 | $10.86 | 2.15% |
R Class (before waiver) | $1,000 | $1,013.64 | $11.51 | 2.28% |
(1) | Expenses are equal to the class’s annualized expense ratio listed in the table above, multiplied by the average account value over the period, multiplied by 183, the number of days in the most recent fiscal half-year, divided by 365, to reflect the one-half year period. |
(2) | Ending account value assumes the return earned after waiver and would have been lower if a portion of the management fee had not been waived. |
Schedule of Investments |
NOVEMBER 30, 2013
Shares | Value | |
Common Stocks — 99.4% | ||
AUSTRALIA — 1.2% | ||
Flight Centre Travel Group Ltd. | 39,620 | $ 1,755,962 |
BRAZIL — 0.9% | ||
Estacio Participacoes SA | 148,100 | 1,279,716 |
CAMBODIA — 0.5% | ||
NagaCorp Ltd. | 854,000 | 787,625 |
CANADA — 5.0% | ||
Africa Oil Corp.(1) | 82,170 | 792,343 |
ATS Automation Tooling Systems, Inc.(1) | 109,960 | 1,350,504 |
CCL Industries, Inc. Class B | 15,380 | 1,258,857 |
Element Financial Corp.(1) | 159,790 | 2,195,599 |
Stantec, Inc. | 11,050 | 714,654 |
West Fraser Timber Co. Ltd. | 12,490 | 1,102,595 |
7,414,552 | ||
CHINA — 3.6% | ||
CIMC Enric Holdings Ltd. | 486,000 | 822,480 |
E-Commerce China Dangdang, Inc. A Shares ADR(1) | 76,250 | 709,888 |
Ju Teng International Holdings Ltd. | 1,296,000 | 869,288 |
Minth Group Ltd. | 775,658 | 1,624,844 |
YY, Inc. ADR(1) | 26,430 | 1,331,544 |
5,358,044 | ||
DENMARK — 5.0% | ||
Auriga Industries B Shares(1) | 20,690 | 704,780 |
Jyske Bank A/S(1) | 38,580 | 2,085,823 |
Pandora A/S | 11,890 | 616,841 |
Royal UNIBREW A/S | 20,990 | 2,924,996 |
SimCorp A/S | 29,520 | 1,035,138 |
7,367,578 | ||
FINLAND — 1.5% | ||
Caverion Corp.(1) | 93,205 | 1,099,296 |
Cramo Oyj | 51,520 | 1,168,391 |
2,267,687 | ||
FRANCE — 4.3% | ||
Criteo SA ADR(1) | 23,980 | 865,678 |
Eurofins Scientific | 5,910 | 1,513,350 |
Havas SA | 122,920 | 1,001,141 |
Ingenico | 10,190 | 761,955 |
Plastic Omnium SA | 75,100 | 2,296,034 |
6,438,158 | ||
GERMANY — 8.2% | ||
Aareal Bank AG(1) | 87,640 | 3,220,067 |
Aurelius AG | 41,920 | 1,629,083 |
DMG MORI SEIKI AG | 31,910 | 984,907 |
Duerr AG | 16,850 | 1,469,910 |
Morphosys AG(1) | 4,890 | 375,017 |
NORMA Group | 33,580 | 1,698,066 |
Stada Arzneimittel AG | 13,950 | 720,964 |
Wirecard AG | 54,460 | 2,038,338 |
12,136,352 | ||
GREECE — 0.6% | ||
Hellenic Exchanges SA Holding Clearing Settlement and Registry | 75,827 | 829,422 |
HONG KONG — 7.8% | ||
21Vianet Group, Inc. ADR(1) | 56,480 | 1,008,168 |
Dah Sing Banking Group Ltd. | 396,000 | 729,422 |
Hilong Holding Ltd. | 1,823,000 | 1,441,460 |
Man Wah Holdings Ltd. | 894,400 | 1,472,102 |
Melco International Development Ltd. | 593,000 | 2,092,028 |
Pacific Basin Shipping Ltd. | 1,425,000 | 1,021,986 |
Techtronic Industries Co. | 834,500 | 2,244,336 |
Xinyi Glass Holdings Ltd. | 1,414,000 | 1,495,611 |
11,505,113 | ||
INDIA — 1.7% | ||
Bank of India | 241,800 | 840,244 |
Bharat Forge Ltd. | 216,930 | 1,035,182 |
WNS Holdings Ltd. ADR(1) | 31,940 | 639,439 |
2,514,865 | ||
IRELAND — 0.7% | ||
Smurfit Kappa Group plc | 45,530 | 1,082,659 |
ITALY — 2.3% | ||
Banca Generali SpA | 56,750 | 1,619,351 |
Ei Towers SpA | 16,040 | 730,792 |
Interpump Group SpA | 93,710 | 1,068,962 |
3,419,105 | ||
JAPAN — 19.2% | ||
Aica Kogyo Co. Ltd. | 69,300 | 1,429,361 |
Aida Engineering Ltd. | 147,500 | 1,524,745 |
Avex Group Holdings, Inc. | 15,500 | 339,216 |
Calbee, Inc. | 46,000 | 1,166,558 |
Daifuku Co. Ltd. | 117,000 | 1,497,262 |
Digital Garage, Inc. | 34,000 | 816,770 |
Don Quijote Co. Ltd. | 19,200 | 1,175,109 |
Dwango Co. Ltd. | 38,000 | 1,020,430 |
Shares | Value |
Enigmo, Inc.(1) | 11,400 | $ 774,503 |
Japan Aviation Electronics Industry Ltd. | 91,000 | 1,022,412 |
Kanamoto Co. Ltd. | 45,000 | 1,122,310 |
M3, Inc. | 310 | 808,854 |
NTN Corp.(1) | 325,000 | 1,475,182 |
Oisix, Inc.(1) | 21,000 | 947,045 |
Pigeon Corp. | 30,200 | 1,445,956 |
Ryohin Keikaku Co. Ltd. | 13,900 | 1,445,019 |
Sanwa Holdings Corp. | 226,000 | 1,458,207 |
Seiko Epson Corp. | 16,100 | 389,122 |
Seria Co. Ltd. | 28,000 | 1,080,970 |
Ship Healthcare Holdings, Inc. | 25,100 | 1,070,692 |
Sundrug Co. Ltd. | 27,700 | 1,247,845 |
Tadano Ltd. | 105,000 | 1,396,993 |
THK Co. Ltd. | 34,100 | 826,495 |
Toshiba Plant Systems & Services Corp. | 64,000 | 972,698 |
Yaskawa Electric Corp. | 93,000 | 1,245,507 |
Zeon Corp. | 64,000 | 716,560 |
28,415,821 | ||
MALAYSIA — 0.7% | ||
Malaysia Airports Holdings Bhd | 406,400 | 1,091,971 |
MEXICO — 0.9% | ||
Compartamos SAB de CV | 713,130 | 1,346,749 |
NORWAY — 1.0% | ||
Opera Software ASA | 123,070 | 1,501,503 |
PHILIPPINES — 0.5% | ||
Puregold Price Club, Inc. | 750,800 | 722,929 |
RUSSIA — 0.6% | ||
QIWI plc ADR | 19,720 | 922,502 |
SINGAPORE — 2.2% | ||
Ezion Holdings Ltd. | 1,056,200 | 1,767,558 |
KrisEnergy Ltd.(1) | 668,000 | 662,756 |
OSIM International Ltd. | 447,000 | 808,615 |
3,238,929 | ||
SOUTH KOREA — 3.9% | ||
Hotel Shilla Co. Ltd. | 33,220 | 2,156,491 |
Kolao Holdings | 38,362 | 1,072,961 |
Samchuly Bicycle Co. Ltd. | 20,080 | 378,528 |
Seoul Semiconductor Co. Ltd. | 35,250 | 1,392,280 |
Sung Kwang Bend Co. Ltd. | 27,790 | 726,064 |
5,726,324 | ||
SPAIN — 1.8% | ||
Indra Sistemas SA | 43,450 | 663,018 |
Melia Hotels International SA | 167,990 | 2,029,275 |
2,692,293 | ||
SWEDEN — 4.5% | ||
AarhusKarlshamn AB | 35,970 | 2,209,961 |
Fingerprint Cards AB B Shares(1) | 54,340 | 542,626 |
Hexpol AB | 17,470 | 1,245,127 |
Indutrade AB | 22,650 | 913,341 |
Intrum Justitia AB | 29,340 | 746,992 |
Loomis AB B Shares | 40,440 | 961,778 |
6,619,825 | ||
SWITZERLAND — 1.5% | ||
Cembra Money Bank AG(1) | 23,080 | 1,445,046 |
Tecan Group AG | 6,690 | 741,037 |
2,186,083 | ||
TAIWAN — 5.0% | ||
AirTAC International Group | 224,210 | 1,787,983 |
Eclat Textile Co. Ltd. | 115,460 | 1,470,853 |
Everlight Electronics Co. Ltd. | 628,000 | 1,173,495 |
Makalot Industrial Co. Ltd. | 280,000 | 1,570,588 |
Teco Electric and Machinery Co. Ltd. | 1,329,000 | 1,459,502 |
7,462,421 | ||
THAILAND — 0.4% | ||
Minor International PCL | 855,800 | 647,647 |
TURKEY — 0.6% | ||
Pegasus Hava Tasimaciligi AS(1) | 44,780 | 937,233 |
UNITED KINGDOM — 13.3% | ||
Bellway plc | 96,850 | 2,285,218 |
Bodycote plc | 112,800 | 1,110,216 |
Close Brothers Group plc | 84,520 | 1,864,285 |
Countrywide plc | 259,030 | 2,261,243 |
Dixons Retail plc(1) | 3,197,040 | 2,688,896 |
Fenner plc | 102,020 | 747,369 |
Grafton Group plc | 170,650 | 1,738,235 |
Halma plc | 94,500 | 907,680 |
Howden Joinery Group plc | 239,856 | 1,263,774 |
Keller Group plc | 62,700 | 1,086,492 |
Regus plc | 265,000 | 862,903 |
Restaurant Group plc (The) | 135,190 | 1,275,283 |
Spectris plc | 20,550 | 818,120 |
Spirax-Sarco | 15,010 | 719,879 |
19,629,593 | ||
TOTAL COMMON STOCKS (Cost $115,978,433) | 147,298,661 | |
Shares | Value |
Temporary Cash Investments — 1.3% | ||
Repurchase Agreement, Bank of America Merrill Lynch, (collateralized by various U.S. Treasury obligations, 0.375%, 6/30/15, valued at $320,639), in a joint trading account at 0.06%, dated 11/29/13, due 12/2/13 (Delivery value $314,199) | $ 314,197 | |
Repurchase Agreement, Credit Suisse First Boston, Inc., (collateralized by various U.S. Treasury obligations, 2.75%, 11/15/42, valued at $383,450), in a joint trading account at 0.03%, dated 11/29/13, due 12/2/13 (Delivery value $377,038) | 377,037 | |
Repurchase Agreement, Goldman Sachs & Co., (collateralized by various U.S. Treasury obligations, 0.00%, 5/29/14, valued at $320,789), in a joint trading account at 0.04%, dated 11/29/13, due 12/2/13 (Delivery value $314,507) | 314,506 | |
SSgA U.S. Government Money Market Fund | 875,999 | 875,999 |
TOTAL TEMPORARY CASH INVESTMENTS (Cost $1,881,739) | 1,881,739 | |
TOTAL INVESTMENT SECURITIES — 100.7% (Cost $117,860,172) | 149,180,400 | |
OTHER ASSETS AND LIABILITIES — (0.7)% | (1,025,068) | |
TOTAL NET ASSETS — 100.0% | $148,155,332 | |
Market Sector Diversification | |
(as a % of net assets) | |
Consumer Discretionary | 27.6% |
Industrials | 25.6% |
Information Technology | 15.2% |
Financials | 13.7% |
Consumer Staples | 6.6% |
Materials | 4.1% |
Health Care | 3.4% |
Energy | 3.2% |
Cash and Equivalents* | 0.6% |
* Includes temporary cash investments and other assets and liabilities.
Notes to Schedule of Investments
ADR = American Depositary Receipt
(1) | Non-income producing. |
See Notes to Financial Statements.
Statement of Assets and Liabilities |
NOVEMBER 30, 2013 | |||
Assets | |||
Investment securities, at value (cost of $117,860,172) | $149,180,400 | ||
Foreign currency holdings, at value (cost of $58,515) | 58,593 | ||
Receivable for investments sold | 277,383 | ||
Receivable for capital shares sold | 169,015 | ||
Dividends and interest receivable | 143,736 | ||
Other assets | 31,882 | ||
| 149,861,009 | |||
Liabilities | |||
Disbursements in excess of demand deposit cash | 870,920 | ||
Payable for investments purchased | 603,061 | ||
Payable for capital shares redeemed | 38,168 | ||
Accrued management fees | 186,169 | ||
Distribution and service fees payable | 1,866 | ||
Accrued foreign taxes | 5,493 | ||
| 1,705,677 | |||
Net Assets | $148,155,332 | ||
Net Assets Consist of: | |||
Capital (par value and paid-in surplus) | $122,135,961 | ||
Distributions in excess of net investment income | (200,398 | ) | |
Accumulated net realized loss | (5,080,086 | ) | |
Net unrealized appreciation | 31,299,855 | ||
| $148,155,332 | |||
Net assets | Shares outstanding | Net asset value per share | |
Investor Class, $0.01 Par Value | $137,263,902 | 14,918,548 | $9.20 |
Institutional Class, $0.01 Par Value | $3,100,166 | 333,834 | $9.29 |
A Class, $0.01 Par Value | $6,742,626 | 734,648 | $9.18* |
C Class, $0.01 Par Value | $425,353 | 46,914 | $9.07 |
R Class, $0.01 Par Value | $623,285 | 68,091 | $9.15 |
* Maximum offering price $9.74 (net asset value divided by 0.9425).
See Notes to Financial Statements.
Statement of Operations |
YEAR ENDED NOVEMBER 30, 2013 | |||
Investment Income (Loss) | |||
Income: | |||
Dividends (net of foreign taxes withheld of $171,544) | $2,104,930 | ||
Interest (net of foreign taxes withheld of $598) | 1,833 | ||
| 2,106,763 | |||
Expenses: | |||
Management fees | 2,241,593 | ||
Distribution and service fees: | |||
A Class | 8,397 | ||
C Class | 2,381 | ||
R Class | 2,239 | ||
Directors’ fees and expenses | 4,453 | ||
Other expenses | 522 | ||
| 2,259,585 | |||
Fees waived | (91,866 | ) | |
| 2,167,719 | |||
Net investment income (loss) | (60,956 | ) | |
Realized and Unrealized Gain (Loss) | |||
Net realized gain (loss) on: | |||
Investment transactions | 19,827,296 | ||
Foreign currency transactions | (149,383 | ) | |
| 19,677,913 | |||
Change in net unrealized appreciation (depreciation) on: | |||
Investments (includes (increase) decrease in accrued foreign taxes of $42,242) | 12,872,171 | ||
Translation of assets and liabilities in foreign currencies | (6,793 | ) | |
| 12,865,378 | |||
Net realized and unrealized gain (loss) | 32,543,291 | ||
Net Increase (Decrease) in Net Assets Resulting from Operations | $32,482,335 | ||
See Notes to Financial Statements.
Statement of Changes in Net Assets |
YEARS ENDED NOVEMBER 30, 2013 AND NOVEMBER 30, 2012 | ||||||
Increase (Decrease) in Net Assets | November 30, 2013 | November 30, 2012 | ||||
Operations | ||||||
Net investment income (loss) | $(60,956 | ) | $(45,624 | ) | ||
Net realized gain (loss) | 19,677,913 | 2,514,219 | ||||
Change in net unrealized appreciation (depreciation) | 12,865,378 | 14,114,699 | ||||
Net increase (decrease) in net assets resulting from operations | 32,482,335 | 16,583,294 | ||||
Distributions to Shareholders | ||||||
From net investment income: | ||||||
Investor Class | (1,124,548 | ) | — | |||
Institutional Class | (576 | ) | — | |||
A Class | (18,389 | ) | — | |||
R Class | (2,420 | ) | — | |||
Decrease in net assets from distributions | (1,145,933 | ) | — | |||
Capital Share Transactions | ||||||
Net increase (decrease) in net assets from capital share transactions | 15,147,764 | (9,996,725 | ) | |||
Redemption Fees | ||||||
Increase in net assets from redemption fees | 18,160 | 10,012 | ||||
Net increase (decrease) in net assets | 46,502,326 | 6,596,581 | ||||
Net Assets | ||||||
Beginning of period | 101,653,006 | 95,056,425 | ||||
End of period | $148,155,332 | $101,653,006 | ||||
Undistributed (distributions in excess of) net investment income | $(200,398 | ) | $115,564 | |||
See Notes to Financial Statements.
Notes to Financial Statements |
NOVEMBER 30, 2013
1. Organization
American Century World Mutual Funds, Inc. (the corporation) is registered under the Investment Company Act of 1940, as amended (the 1940 Act), as an open-end management investment company and is organized as a Maryland corporation. International Opportunities Fund (the fund) is one fund in a series issued by the corporation. The fund is diversified as defined under the 1940 Act. The fund’s investment objective is to seek capital growth.
The fund offers the Investor Class, the Institutional Class, the A Class, the C Class and the R Class. The A Class may incur an initial sales charge. The A Class and C Class may be subject to a contingent deferred sales charge. The share classes differ principally in their respective sales charges and distribution and shareholder servicing expenses and arrangements. The Institutional Class is made available to institutional shareholders or through financial intermediaries whose clients do not require the same level of shareholder and administrative services as shareholders of other classes. As a result, the Institutional Class is charged a lower unified management fee.
2. Significant Accounting Policies
The following is a summary of significant accounting policies consistently followed by the fund in preparation of its financial statements. The financial statements are prepared in conformity with accounting principles generally accepted in the United States of America, which may require management to make certain estimates and assumptions at the date of the financial statements. Actual results could differ from these estimates.
Investment Valuations — The fund determines the fair value of its investments and computes its net asset value per share at the close of regular trading (usually 4 p.m. Eastern time) on the New York Stock Exchange (NYSE) on each day the NYSE is open. The Board of Directors has adopted valuation policies and procedures to guide the investment advisor in the fund’s investment valuation process and to provide methodologies for the oversight of the fund’s pricing function.
Equity securities that are listed or traded on a domestic securities exchange are valued at the last reported sales price or at the official closing price as provided by the exchange. Equity securities traded on foreign securities exchanges are generally valued at the closing price of such securities on the exchange where primarily traded or at the close of the NYSE, if that is earlier. If no last sales price is reported, or if local convention or regulation so provides, the mean of the latest bid and asked prices may be used. Securities traded over-the-counter are valued at the mean of the latest bid and asked prices, the last sales price, or the official closing price. Equity securities initially expressed in local currencies are translated into U.S. dollars at the mean of the appropriate currency exchange rate at the close of the NYSE as provided by an independent pricing service.
Fixed income securities maturing within 60 days at the time of purchase may be valued at cost, plus or minus any amortized discount or premium or at the evaluated mean as provided by an independent pricing service. Evaluated mean prices are commonly derived through utilization of market models, which may consider, among other factors: trade data, quotations from dealers and active market makers, relevant yield curve and spread data, related sector levels, creditworthiness, trade data or market information on comparable securities, and other relevant security specific information.
Open-end management investment companies are valued at the reported net asset value per share. Repurchase agreements are valued at cost, which approximates fair value.
If the fund determines that the market price for an investment is not readily available or the valuation methods mentioned above do not reflect an investment’s fair value, such investment is valued as determined in good faith by the Board of Directors or its delegate, in accordance with policies and procedures adopted by the Board of Directors. In its determination of fair value, the fund may review several factors including, but not limited to, market information regarding the specific investment or comparable investments and correlation with other investment types, futures indices or general market indicators.
Circumstances that may cause the fund to use these procedures to value an investment include, but are not limited to: an investment has been declared in default or is distressed; trading in a security has been suspended during the trading day or a security is not actively trading on its principal exchange; prices received from a regular pricing source are deemed unreliable; or there is a foreign market holiday and no trading occurred.
The fund monitors for significant events occurring after the close of an investment’s primary exchange but before the fund’s net asset value per share is determined. Significant events may include, but are not limited to: corporate announcements and transactions; governmental action and political unrest that could impact a specific investment or an investment sector; or armed conflicts, natural disasters and similar events that could affect investments in a specific country or region. The fund also monitors for significant fluctuations in domestic and foreign markets, as evidenced by the U.S. market or such other indicators that the Board of Directors, or its delegate, deems appropriate. If significant fluctuations in foreign markets are identified, the fund may apply a model-derived factor to the closing price of equity securities traded on foreign securities exchanges. The factor is based on observable market data as provided by an independent pricing service.
Security Transactions — Security transactions are accounted for as of the trade date. Net realized gains and losses are determined on the identified cost basis, which is also used for federal income tax purposes. Certain countries impose taxes on realized gains on the sale of securities registered in their country. The fund records the foreign tax expense, if any, on an accrual basis. The foreign tax expense on realized gains and unrealized appreciation reduces the net realized gain (loss) on investment transactions and net unrealized appreciation (depreciation) on investments, respectively.
Investment Income — Dividend income less foreign taxes withheld, if any, is recorded as of the ex-dividend date. Distributions received on securities that represent a return of capital or long-term capital gain are recorded as a reduction of cost of investments and/or as a realized gain. The fund may estimate the components of distributions received that may be considered nontaxable distributions or long-term capital gain distributions for income tax purposes. Interest income less foreign tax withheld, if any, is recorded on the accrual basis and includes accretion of discounts and amortization of premiums.
Foreign Currency Translations — All assets and liabilities initially expressed in foreign currencies are translated into U.S. dollars at prevailing exchange rates at period end. The fund may enter into spot foreign currency exchange contracts to facilitate transactions denominated in a foreign currency. Purchases and sales of investment securities, dividend and interest income, spot foreign currency exchange contracts, and expenses are translated at the rates of exchange prevailing on the respective dates of such transactions. Net realized and unrealized foreign currency exchange gains or losses related to investment securities are a component of net realized gain (loss) on investment transactions and change in net unrealized appreciation (depreciation) on investments, respectively.
Repurchase Agreements — The fund may enter into repurchase agreements with institutions that American Century Investment Management, Inc. (ACIM) (the investment advisor) has determined are creditworthy pursuant to criteria adopted by the Board of Directors. The fund requires that the collateral, represented by securities, received in a repurchase transaction be transferred to the custodian in a manner sufficient to enable the fund to obtain those securities in the event of a default under the repurchase agreement. ACIM monitors, on a daily basis, the securities transferred to ensure the value, including accrued interest, of the securities under each repurchase agreement is equal to or greater than amounts owed to the fund under each repurchase agreement.
Joint Trading Account — Pursuant to an Exemptive Order issued by the Securities and Exchange Commission, the fund, along with certain other funds in the American Century Investments family of funds, may transfer uninvested cash balances into a joint trading account. These balances are invested in one or more repurchase agreements that are collateralized by U.S. Treasury or Agency obligations.
Income Tax Status — It is the fund’s policy to distribute substantially all net investment income and net realized gains to shareholders and to otherwise qualify as a regulated investment company under provisions of the Internal Revenue Code. Accordingly, no provision has been made for income taxes. The fund files U.S. federal, state, local and
non-U.S. tax returns as applicable. The fund’s tax returns are subject to examination by the relevant taxing authority until expiration of the applicable statute of limitations, which is generally three years from the date of filing but can be longer in certain jurisdictions. At this time, management believes there are no uncertain tax positions which, based on their technical merit, would not be sustained upon examination and for which it is reasonably possible that the total amounts of unrecognized tax benefits will significantly change in the next twelve months.
Multiple Class — All shares of the fund represent an equal pro rata interest in the net assets of the class to which such shares belong, and have identical voting, dividend, liquidation and other rights and the same terms and conditions, except for class specific expenses and exclusive rights to vote on matters affecting only individual classes. Income, non-class specific expenses, and realized and unrealized capital gains and losses of the fund are allocated to each class of shares based on their relative net assets.
Distributions to Shareholders — Distributions from net investment income and net realized gains, if any, are generally declared and paid annually. The fund may make distributions on a more frequent basis to comply with the distribution requirements of the Internal Revenue Code, in all events in a manner consistent with provisions of the 1940 Act.
Redemption — The fund may impose a 2.00% redemption fee on shares held less than 60 days. The fee may not be applicable to all classes. The redemption fee is retained by the fund and helps cover transaction costs that long-term investors may bear when the fund sells securities to meet investor redemptions.
Indemnifications — Under the corporation’s organizational documents, its officers and directors are indemnified against certain liabilities arising out of the performance of their duties to the fund. In addition, in the normal course of business, the fund enters into contracts that provide general indemnifications. The maximum exposure under these arrangements is unknown as this would involve future claims that may be made against a fund. The risk of material loss from such claims is considered by management to be remote.
3. Fees and Transactions with Related Parties
Management Fees — The corporation has entered into a management agreement with ACIM, under which ACIM provides the fund with investment advisory and management services in exchange for a single, unified management fee (the fee) per class. The agreement provides that all expenses of managing and operating the fund, except distribution and service fees, brokerage expenses, taxes, interest, fees and expenses of the independent directors (including legal counsel fees), and extraordinary expenses, will be paid by ACIM. The fee is computed and accrued daily based on each class’s daily net assets and paid monthly in arrears. The rate of the fee is determined by applying a fee rate calculation formula. This formula takes into account the fund’s assets as well as certain assets, if any, of other clients of the investment advisor outside the American Century Investments family of funds (such as subadvised funds and separate accounts) that have very similar investment teams and investment strategies (strategy assets). The annual management fee schedule ranges from 1.400% to 2.000% for the Investor Class, A Class, C Class and R Class. The Institutional Class is 0.200% less at each point within the range. Effective August 1, 2013, the investment advisor voluntarily agreed to waive 0.200% of its management fee. The investment advisor expects the fee waiver to continue through March 31, 2015, and cannot terminate it without the approval of the Board of Directors. The total amount of the waiver for each class for the year ended November 30, 2013 was $87,810, $160, $3,271, $235 and $390 for the Investor Class, Institutional Class, A Class, C Class, and R Class, respectively. The effective annual management fee before waiver for each class for the year ended November 30, 2013 was 1.79% for the Investor Class, A Class, C Class and R Class and 1.59% for the Institutional Class. The effective annual management fee after waiver for each class for the year ended November 30, 2013 was 1.72% for the Investor Class, A Class, C Class and R Class and 1.52% for the Institutional Class.
Distribution and Service Fees — The Board of Directors has adopted a separate Master Distribution and Individual Shareholder Services Plan for each of the A Class, C Class and R Class (collectively the plans), pursuant to Rule 12b-1 of the 1940 Act. The plans provide that the A Class will pay American Century Investment Services, Inc. (ACIS) an annual distribution and service fee of 0.25%. The plans provide that the C Class will pay ACIS an annual distribution and service fee of 1.00%, of which 0.25% is paid for individual shareholder services and 0.75% is paid for distribution services. The plans provide that the R Class will pay ACIS an annual distribution and service fee of 0.50%. The fees are computed and accrued daily based on each class’s daily net assets and paid monthly in arrears. The fees are used to pay financial intermediaries for distribution and individual shareholder services. Fees incurred under the plans during the year ended November 30, 2013 are detailed in the Statement of Operations.
Related Parties — Certain officers and directors of the corporation are also officers and/or directors of American Century Companies, Inc. (ACC). The corporation’s investment advisor, ACIM, the corporation’s distributor, ACIS, and the corporation’s transfer agent, American Century Services, LLC, are wholly owned, directly or indirectly, by ACC.
4. Investment Transactions
Purchases and sales of investment securities, excluding short-term investments, for the year ended November 30, 2013 were $165,853,723 and $150,801,397, respectively.
5. Capital Share Transactions
Transactions in shares of the fund were as follows:
Year ended November 30, 2013 | Year ended November 30, 2012 | |||||||||||
Shares | Amount | Shares | Amount | |||||||||
Investor Class/Shares Authorized | 100,000,000 | 100,000,000 | ||||||||||
Sold | 4,740,316 | $37,564,336 | 2,109,432 | $14,203,067 | ||||||||
Issued in reinvestment of distributions | 141,042 | 1,093,076 | — | — | ||||||||
Redeemed | (3,886,304 | ) | (31,104,411 | ) | (3,181,158 | ) | (20,189,831 | ) | ||||
| 995,054 | 7,553,001 | (1,071,726 | ) | (5,986,764 | ) | |||||||
Institutional Class/Shares Authorized | 10,000,000 | 10,000,000 | ||||||||||
Sold | 327,546 | 2,997,896 | — | — | ||||||||
Issued in reinvestment of distributions | 74 | 576 | — | — | ||||||||
| 327,620 | 2,998,472 | — | — | |||||||||
A Class/Shares Authorized | 10,000,000 | 10,000,000 | ||||||||||
Sold | 533,481 | 4,521,661 | 1,026,155 | 6,432,614 | ||||||||
Issued in reinvestment of distributions | 2,339 | 18,101 | — | — | ||||||||
Redeemed | (72,269 | ) | (585,413 | ) | (1,615,573 | ) | (10,475,816 | ) | ||||
| 463,551 | 3,954,349 | (589,418 | ) | (4,043,202 | ) | |||||||
C Class/Shares Authorized | 10,000,000 | 10,000,000 | ||||||||||
Sold | 35,314 | 284,970 | 7,856 | 49,388 | ||||||||
Redeemed | (5,813 | ) | (45,657 | ) | (7,789 | ) | (47,347 | ) | ||||
| 29,501 | 239,313 | 67 | 2,041 | |||||||||
R Class/Shares Authorized | 10,000,000 | 10,000,000 | ||||||||||
Sold | 59,917 | 458,537 | 11,475 | 75,424 | ||||||||
Issued in reinvestment of distributions | 313 | 2,420 | — | — | ||||||||
Redeemed | (7,521 | ) | (58,328 | ) | (6,319 | ) | (44,224 | ) | ||||
| 52,709 | 402,629 | 5,156 | 31,200 | |||||||||
Net increase (decrease) | 1,868,435 | $15,147,764 | (1,655,921 | ) | $(9,996,725 | ) | ||||||
6. Fair Value Measurements
The fund’s investments valuation process is based on several considerations and may use multiple inputs to determine the fair value of the investments held by the fund. In conformity with accounting principles generally accepted in the United States of America, the inputs used to determine a valuation are classified into three broad levels.
• | Level 1 valuation inputs consist of unadjusted quoted prices in an active market for identical investments. |
• | Level 2 valuation inputs consist of direct or indirect observable market data (including quoted prices for comparable investments, evaluations of subsequent market events, interest rates, prepayment speeds, credit risk, etc.). These inputs also consist of quoted prices for identical investments initially expressed in local currencies that are adjusted through translation into U.S. dollars. |
• | Level 3 valuation inputs consist of unobservable data (including a fund’s own assumptions). |
The level classification is based on the lowest level input that is significant to the fair valuation measurement. The valuation inputs are not necessarily an indication of the risks associated with investing in these securities or other financial instruments.
The following is a summary of the level classifications as of period end. The Schedule of Investments provides additional information on the fund’s portfolio holdings.
Level 1 | Level 2 | Level 3 | |
Assets | |||
Investment Securities | |||
Common Stocks | $5,477,219 | $141,821,442 | — |
Temporary Cash Investments | 875,999 | 1,005,740 | — |
Total Value of Investment Securities | $6,353,218 | $142,827,182 | — |
7. Risk Factors
There are certain risks involved in investing in foreign securities. These risks include those resulting from future adverse political, social and economic developments, fluctuations in currency exchange rates, the possible imposition of exchange controls, and other foreign laws or restrictions. Investing in emerging markets may accentuate these risks.
The fund concentrates its investments in common stocks of small companies. Because of this, the fund may be subject to greater risk and market fluctuations than a fund investing in larger, more established companies.
The fund’s investment process may result in high portfolio turnover, which could mean high transaction costs, affecting both performance and capital gains tax liabilities to investors.
8. Federal Tax Information
The tax character of distributions paid during the years ended November 30, 2013 and November 30, 2012 were as follows:
2013 | 2012 | |
Distributions Paid From | ||
Ordinary income | $1,145,933 | — |
Long-term capital gains | — | — |
The book-basis character of distributions made during the year from net investment income or net realized gains may differ from their ultimate characterization for federal income tax purposes. These differences reflect the differing character of certain income items and net realized gains and losses for financial statement and tax purposes, and may result in reclassification among certain capital accounts on the financial statements.
As of November 30, 2013, the federal tax cost of investments and the components of distributable earnings on a tax-basis were as follows:
Federal tax cost of investments | $118,622,943 |
Gross tax appreciation of investments | $31,433,552 |
Gross tax depreciation of investments | (876,095) |
Net tax appreciation (depreciation) of investments | $30,557,457 |
Net tax appreciation (depreciation) on translation of assets and liabilities in foreign currencies | $ (20,373) |
Net tax appreciation (depreciation) | $30,537,084 |
Undistributed ordinary income | $457,570 |
Accumulated short-term capital losses | $(4,975,283) |
The difference between book-basis and tax-basis unrealized appreciation (depreciation) is attributable primarily to the realization to ordinary income for tax purposes of unrealized gains on investments in passive foreign investment companies.
Accumulated capital losses represent net capital loss carryovers that may be used to offset future realized capital gains for federal income tax purposes. Future capital loss carryover utilization in any given year may be subject to Internal Revenue Code limitations. Capital loss carryovers expire in 2017.
Financial Highlights |
For a Share Outstanding Throughout the Years Ended November 30 (except as noted) | |||||||||||||
Per-Share Data | Ratios and Supplemental Data | ||||||||||||
Income From Investment Operations: | Ratio to Average Net Assets of: | ||||||||||||
Net Asset Value, Beginning | Net Income | Net | Total From Investment Operations | Distributions From Net Investment Income | Net Asset Value, End of Period | Total | Operating Expenses | Operating Expenses (before waiver) | Net Income | Net Income (Loss) waiver) | Portfolio Turnover | Net Assets, (in thousands) | |
Investor Class | |||||||||||||
2013 | $7.14 | —(3) | 2.14 | 2.14 | (0.08) | $9.20 | 30.13% | 1.72% | 1.79% | (0.04)% | (0.11)% | 123% | $137,264 |
2012 | $5.98 | —(3) | 1.16 | 1.16 | — | $7.14 | 19.40% | 1.87% | 1.87% | (0.04)% | (0.04)% | 127% | $99,445 |
2011 | $6.29 | (0.01) | (0.27) | (0.28) | (0.03) | $5.98 | (4.57)% | 1.83% | 1.83% | (0.17)% | (0.17)% | 146% | $89,708 |
2010 | $5.49 | (0.03) | 0.94 | 0.91 | (0.11) | $6.29 | 16.72% | 1.89% | 1.89% | (0.52)% | (0.52)% | 209% | $102,739 |
2009 | $3.70 | (0.02) | 1.81 | 1.79 | — | $5.49 | 48.38% | 1.95% | 1.95% | (0.52)% | (0.52)% | 244% | $92,968 |
Institutional Class | |||||||||||||
2013 | $7.21 | (0.04) | 2.21 | 2.17 | (0.09) | $9.29 | 30.38% | 1.52% | 1.59% | 0.16% | 0.09% | 123% | $3,100 |
2012 | $6.03 | 0.01 | 1.17 | 1.18 | — | $7.21 | 19.57% | 1.67% | 1.67% | 0.16% | 0.16% | 127% | $45 |
2011 | $6.34 | —(3) | (0.27) | (0.27) | (0.04) | $6.03 | (4.35)% | 1.63% | 1.63% | 0.03% | 0.03% | 146% | $37 |
2010 | $5.54 | (0.02) | 0.95 | 0.93 | (0.13) | $6.34 | 17.04% | 1.69% | 1.69% | (0.32)% | (0.32)% | 209% | $39 |
2009 | $3.72 | (0.04) | 1.86 | 1.82 | — | $5.54 | 48.92% | 1.75% | 1.75% | (0.32)% | (0.32)% | 244% | $33 |
A Class | |||||||||||||
2013 | $7.12 | (0.03) | 2.15 | 2.12 | (0.06) | $9.18 | 29.89% | 1.97% | 2.04% | (0.29)% | (0.36)% | 123% | $6,743 |
2012 | $5.98 | (0.04) | 1.18 | 1.14 | — | $7.12 | 19.06% | 2.12% | 2.12% | (0.29)% | (0.29)% | 127% | $1,931 |
2011 | $6.29 | (0.04) | (0.26) | (0.30) | (0.01) | $5.98 | (4.81)% | 2.10% | 2.10% | (0.44)% | (0.44)% | 146% | $5,147 |
2010(4) | $5.51 | (0.02) | 0.84 | 0.82 | (0.04) | $6.29 | 14.87% | 2.14%(5) | 2.14%(5) | (0.45)%(5) | (0.45)%(5) | 209%(6) | $92 |
For a Share Outstanding Throughout the Years Ended November 30 (except as noted) | |||||||||||||
Per-Share Data | Ratios and Supplemental Data | ||||||||||||
Income From Investment Operations: | Ratio to Average Net Assets of: | ||||||||||||
Net Asset Value, Beginning | Net Income | Net | Total From Investment Operations | Distributions From Net Investment Income | Net Asset Value, End of Period | Total | Operating Expenses | Operating Expenses (before waiver) | Net Income | Net Income (Loss) waiver) | Portfolio Turnover | Net Assets, (in thousands) | |
C Class | |||||||||||||
2013 | $7.04 | (0.09) | 2.12 | 2.03 | — | $9.07 | 29.02% | 2.72% | 2.79% | (1.04)% | (1.11)% | 123% | $425 |
2012 | $5.95 | (0.06) | 1.15 | 1.09 | — | $7.04 | 18.15% | 2.87% | 2.87% | (1.04)% | (1.04)% | 127% | $123 |
2011 | $6.30 | (0.06) | (0.29) | (0.35) | — | $5.95 | (5.56)% | 2.83% | 2.83% | (1.17)% | (1.17)% | 146% | $103 |
2010(4) | $5.51 | (0.05) | 0.84 | 0.79 | — | $6.30 | 14.34% | 2.89%(5) | 2.89%(5) | (1.19)%(5) | (1.19)%(5) | 209%(6) | $44 |
R Class | |||||||||||||
2013 | $7.10 | (0.03) | 2.12 | 2.09 | (0.04) | $9.15 | 29.50% | 2.22% | 2.29% | (0.54)% | (0.61)% | 123% | $623 |
2012 | $5.98 | (0.03) | 1.15 | 1.12 | — | $7.10 | 18.73% | 2.37% | 2.37% | (0.54)% | (0.54)% | 127% | $109 |
2011 | $6.30 | (0.04) | (0.28) | (0.32) | — | $5.98 | (5.08)% | 2.33% | 2.33% | (0.67)% | (0.67)% | 146% | $61 |
2010(4) | $5.51 | (0.03) | 0.84 | 0.81 | (0.02) | $6.30 | 14.77% | 2.39%(5) | 2.39%(5) | (0.69)%(5) | (0.69)%(5) | 209%(6) | $51 |
Notes to Financial Highlights
(1) | Computed using average shares outstanding throughout the period. |
(2) | Total returns are calculated based on the net asset value of the last business day and do not reflect applicable sales charges, if any. Total returns for periods less than one year are not annualized. |
(3) | Per-share amount was less than $0.005. |
(4) | March 1, 2010 (commencement of sale) through November 30, 2010. |
(5) | Annualized. |
(6) | Portfolio turnover is calculated at the fund level. Percentage indicated was calculated for the year ended November 30, 2010. |
See Notes to Financial Statements.
Report of Independent Registered Public Accounting Firm |
To the Board of Directors and Shareholders of
American Century World Mutual Funds, Inc.:
We have audited the accompanying statement of assets and liabilities, including the schedule of investments, of International Opportunities Fund (the “Fund”), one of the funds constituting American Century World Mutual Funds, Inc., as of November 30, 2013, and the related statement of operations for the year then ended, the statements of changes in net assets for each of the two years in the period then ended, and the financial highlights for each of the periods presented. These financial statements and financial highlights are the responsibility of the Fund’s management. Our responsibility is to express an opinion on these financial statements and financial highlights based on our audits.
We conducted our audits in accordance with the standards of the Public Company Accounting Oversight Board (United States). Those standards require that we plan and perform the audit to obtain reasonable assurance about whether the financial statements and financial highlights are free of material misstatement. The Fund is not required to have, nor were we engaged to perform, an audit of its internal control over financial reporting. Our audits included consideration of internal control over financial reporting as a basis for designing audit procedures that are appropriate in the circumstances, but not for the purpose of expressing an opinion on the effectiveness of the Fund’s internal control over financial reporting. Accordingly, we express no such opinion. An audit also includes examining, on a test basis, evidence supporting the amounts and disclosures in the financial statements, assessing the accounting principles used and significant estimates made by management, as well as evaluating the overall financial statement presentation. Our procedures included confirmation of securities owned as of November 30, 2013, by correspondence with the custodian and brokers; where replies were not received from brokers, we performed other auditing procedures. We believe that our audits provide a reasonable basis for our opinion.
In our opinion, the financial statements and financial highlights referred to above present fairly, in all material respects, the financial position of International Opportunities Fund of American Century World Mutual Funds, Inc. as of November 30, 2013, the results of its operations for the year then ended, the changes in its net assets for each of the two years in the period then ended, and the financial highlights for each of the periods presented, in conformity with accounting principles generally accepted in the United States of America.
Deloitte & Touche LLP
Kansas City, Missouri
January 17, 2014
Management |
The Board of Directors
The individuals listed below serve as directors of the funds. Each director will continue to serve in this capacity until death, retirement, resignation or removal from office. The board has adopted a mandatory retirement age for directors who are not “interested persons,” as that term is defined in the Investment Company Act (independent directors). Independent directors shall retire by December 31 of the year in which they reach their 75th birthday. Mr. Pratt may serve until December 31 of the year in which he reaches his 76th birthday based on an extension granted under previous retirement guidelines.
Mr. Thomas is an “interested person” because he currently serves as President and Chief Executive Officer of American Century Companies, Inc. (ACC), the parent company of American Century Investment Management, Inc. (ACIM or the advisor). Mr. Fink is treated as an “interested person” because of his recent employment with ACC and American Century Services, LLC (ACS). The other directors (more than three-fourths of the total number) are independent. They are not employees, directors or officers of, and have no financial interest in, ACC or any of its wholly owned, direct or indirect, subsidiaries, including ACIM, American Century Investment Services, Inc. (ACIS) and ACS, and do not have any other affiliations, positions, or relationships that would cause them to be considered “interested persons” under the Investment Company Act. The directors serve in this capacity for seven (in the case of Mr. Thomas, 15) registered investment companies in the American Century Investments family of funds.
The following table presents additional information about the directors. The mailing address for each director is 4500 Main Street, Kansas City, Missouri 64111.
Name | Position(s) Held with Funds | Length Served | Principal Occupation(s) During Past 5 Years | Number of American Century Portfolios Overseen | Other Directorships Held During Past 5 Years | |
Independent Directors | ||||||
Thomas A. Brown (1940) | Director | Since 1980 | Managing Member, Associated Investments, LLC (real estate investment company); Brown Cascade Properties, LLC (real estate investment company) (2001 to 2009) | 75 | None | |
Andrea C. Hall (1945) | Director | Since 1997 | Retired | 75 | None | |
Jan M. Lewis (1957) | Director | Since 2011 | President and Chief Executive Officer, Catholic Charities of Northeast Kansas (human services organization) | 75 | None | |
James A. Olson (1942) | Director | Since 2007 | Member, Plaza Belmont LLC (private equity fund manager) | 75 | Saia, Inc. (2002 to 2012) and EPR Properties (2003 to 2013) | |
Donald H. Pratt(1) (1937) | Director and Chairman of the Board | Since 1995 (Chairman since 2005) | Chairman and Chief Executive Officer, Western Investments, Inc. (real estate company) | 75 | None | |
Name | Position(s) Held with Funds | Length Served | Principal Occupation(s) During Past 5 Years | Number of American Century Portfolios Overseen | Other Directorships Held During Past 5 Years | |
Independent Directors | ||||||
M. Jeannine Strandjord | Director | Since 1994 | Retired | 75 | Euronet Worldwide Inc.; Charming Shoppes, Inc. (2006 to 2010); and DST Systems Inc. (1996 to 2012) | |
John R. Whitten (1946)
| Director | Since 2008 | Retired | 75 | Rudolph Technologies, Inc. | |
Stephen E. Yates (1948) | Director | Since 2012 | Retired; Executive Vice President, Technology & Operations, KeyCorp. (computer services) (2004 to 2010) | 75 | Applied Industrial Technologies, Inc. (2001 to 2010) | |
Interested Directors | ||||||
Barry Fink | Director | Since 2012 | Retired; Executive Vice President, ACC (September 2007 to February 2013); President, ACS (October 2007 to February 2013); Chief Operating Officer, ACC (September 2007 to November 2012) | 75 | None | |
Jonathan S. Thomas | Director and President | Since 2007 | President and Chief Executive Officer, ACC (March 2007 to present). Also serves as Chief Executive Officer and Manager, ACS; Executive Vice President, ACIM; Director, ACC, ACIM and other ACC subsidiaries | 117 | None | |
(1) | Donald H. Pratt will retire as Director and Chairman of the Board effective December 31, 2013. |
Officers
The following table presents certain information about the executive officers of the funds. Each officer serves as an officer for each of the 15 investment companies in the American Century family of funds, unless otherwise noted. No officer is compensated for his or her service as an officer of the funds. The listed officers are interested persons of the funds and are appointed or re-appointed on an annual basis. The mailing address for each officer listed below is 4500 Main Street, Kansas City, Missouri 64111.
Name | Offices with the Funds | Principal Occupation(s) During the Past Five Years |
Jonathan S. Thomas | Director and President since 2007 | President and Chief Executive Officer, ACC (March 2007 to present). Also serves as Chief Executive Officer and Manager, ACS; Executive Vice President, ACIM; Director, ACC, ACIM and other ACC subsidiaries |
Maryanne L. Roepke | Chief Compliance Officer since 2006 and Senior Vice President since 2000 | Chief Compliance Officer, American Century funds, ACIM and ACS (August 2006 to present). Also serves as Senior Vice President, ACS |
Charles A. Etherington (1957) | General Counsel since 2007 and Senior Vice President since 2006 | Attorney, ACC (February 1994 to present); Vice President, ACC (November 2005 to present); General Counsel, ACC (March 2007 to present). Also serves as General Counsel, ACIM, ACS, ACIS and other ACC subsidiaries; and Senior Vice President, ACIM and ACS |
C. Jean Wade (1964) | Vice President, Treasurer and Chief Financial Officer since 2012 | Vice President, ACS (February 2000 to present) |
Robert J. Leach (1966) | Vice President since 2006 and Assistant Treasurer since 2012 | Vice President, ACS (February 2000 to present) |
David H. Reinmiller (1963) | Vice President since 2000 | Attorney, ACC (January 1994 to present); Associate General Counsel, ACC (January 2001 to present). Also serves as Vice President, ACIM and ACS |
Ward D. Stauffer (1960) | Secretary since 2005 | Attorney, ACC (June 2003 to present) |
The Statement of Additional Information has additional information about the fund’s directors and is available without charge, upon request, by calling 1-800-345-2021.
Approval of Management Agreement |
At a meeting held on June 20, 2013, the Fund’s Board of Directors unanimously approved the renewal of the management agreement pursuant to which American Century Investment Management, Inc. (the “Advisor”) acts as the investment advisor for the Fund. Under Section 15(c) of the Investment Company Act, contracts for investment advisory services are required to be reviewed, evaluated, and approved by a majority of a fund’s directors (the “Directors”), including a majority of the independent Directors, each year.
Prior to its consideration of the renewal of the management agreement, the Board requested and reviewed extensive data and information compiled by the Advisor and certain independent providers of evaluation data concerning the Fund and the services provided to the Fund by the Advisor. This review was in addition to the oversight and evaluation undertaken by the Board and its committees on a continuous basis throughout the year.
In connection with its consideration of the renewal of the management agreement, the Board’s review and evaluation of the services provided by the Advisor included, but was not limited to, the following:
• | the nature, extent, and quality of investment management, shareholder services, and other services provided by the Advisor to the Fund; |
• | the wide range of other programs and services the Advisor provides to the Fund and its shareholders on a routine and non-routine basis; |
• | the investment performance of the Fund, including data comparing the Fund’s performance to appropriate benchmarks and/or a peer group of other mutual funds with similar investment objectives and strategies; |
• | data comparing the cost of owning the Fund to the cost of owning similar funds; |
• | the Advisor’s compliance policies, procedures, and regulatory experience; |
• | financial data showing the cost of services provided to the Fund, the profitability of the Fund to the Advisor, and the overall profitability of the Advisor; |
• | possible economies of scale associated with the Advisor’s management of the Fund and other accounts under its management; |
• | data comparing services provided and charges to other investment management clients of the Advisor; and |
• | consideration of collateral benefits derived by the Advisor from the management of the Fund. |
In keeping with its practice, the Board held two in-person meetings and one telephonic meeting to review and discuss the information provided. The Directors also had the benefit of the advice of independent counsel throughout the period.
Factors Considered
The Directors considered all of the information provided by the Advisor, the independent data providers, and independent counsel, and evaluated such information for the Fund. In connection with their review, the Directors did not identify any single factor as being all-important or controlling, and each Director may have attributed different levels of importance to different factors. In deciding to renew the management agreement, the Board based its decision on a number of factors, including the following:
Nature, Extent and Quality of Services — Generally. Under the management agreement, the Advisor is responsible for providing or arranging for all services necessary for the operation of the Fund. The Board noted that under the management agreement, the Advisor provides or arranges at its own expense a wide variety of services including:
• | constructing and designing the Fund |
• | portfolio research and security selection |
• | initial capitalization/funding |
• | securities trading |
• | Fund administration |
• | custody of Fund assets |
• | daily valuation of the Fund’s portfolio |
• | shareholder servicing and transfer agency, including shareholder confirmations, recordkeeping, and communications |
• | legal services |
• | regulatory and portfolio compliance |
• | financial reporting |
• | marketing and distribution |
The Board noted that many of these services have expanded over time both in terms of quantity and complexity in response to shareholder demands, competition in the industry, changing distribution channels, and the changing regulatory environment.
Investment Management Services. The nature of the investment management services provided to the Fund is quite complex and allows Fund shareholders access to professional money management, instant diversification of their investments within an asset class, the opportunity to easily diversify among asset classes by investing in or exchanging among various American Century Investments funds, and liquidity. In evaluating investment performance, the Board expects the Advisor to manage the Fund in accordance with its investment objectives and approved strategies. Further, the Directors recognize that the Advisor has
an obligation to monitor trading activities, and in particular to seek the best execution of fund trades, and to evaluate the use of and payment for research. In providing these services, the Advisor utilizes teams of investment professionals (portfolio managers, analysts, research assistants, and securities traders) who require extensive information technology, research, training, compliance and other systems to conduct their business. The Board, directly and through its Fund Performance Review Committee, regularly reviews investment performance information for the Fund, together with comparative information for appropriate benchmarks and/or peer groups of similarly-managed funds, over different time horizons. The Directors also review detailed performance information during the management agreement approval process. If performance concerns are identified, the Fund receives special reviews until performance improves, during which the Board discusses with the Advisor the reasons for such results (e.g., market conditions, security selection) and any efforts being undertaken to improve performance. Taking all these factors into consideration, the Board found the investment management services provided by the Advisor to the Fund to meet or exceed industry standards. More detailed information about the Fund’s performance can be found in the Performance and Portfolio Commentary sections of this report.
Shareholder and Other Services. Under the management agreement, the Advisor provides the Fund with a comprehensive package of transfer agency, shareholder, and other services. The Board, directly and through various committees of the Board, regularly reviews reports and evaluations of such services at its regular meetings. These reports include, but are not limited to, information regarding the operational efficiency and accuracy of the shareholder and transfer agency services provided, staffing levels, shareholder satisfaction (as measured by external as well as internal sources), technology support, new products and services offered to Fund shareholders, securities trading activities, portfolio valuation services, auditing services, and legal and operational compliance activities. Certain aspects of shareholder and transfer agency service level efficiency and the quality of securities trading activities are measured by independent third party providers and are presented in comparison to other fund groups not managed by the Advisor. The Board found the services provided by the Advisor to the Fund under the management agreement to be competitive and of high quality.
Costs of Services and Profitability. The Advisor provides detailed information concerning its cost of providing various services to the Fund, its profitability in managing the Fund, its overall profitability, and its financial condition. The Directors have reviewed with the Advisor the methodology used to prepare this financial information. The financial information regarding the Advisor is considered in evaluating the Advisor’s financial condition, its ability to continue to provide services under the management agreement, and the reasonableness of the current management fee. The Board concluded that the Advisor’s profits were reasonable in light of the services provided to the Fund.
Ethics. The Board generally considers the Advisor’s commitment to providing quality services to shareholders and to conducting its business ethically. They noted that the Advisor’s practices generally meet or exceed industry best practices.
Economies of Scale. The Board also reviewed information provided by the Advisor regarding the possible existence of economies of scale in connection with the management of the Fund. The Board concluded that economies of scale are difficult to measure and predict with precision, especially on a fund-by-fund basis. The Board concluded that the Advisor is appropriately sharing economies of scale through its competitive fee structure, offering competitive fees from fund inception, and through reinvestment in its business to provide shareholders additional content and services.
Comparison to Other Funds’ Fees. The management agreement provides that the Fund pay the Advisor a single, all-inclusive (or unified) management fee for providing all services necessary for the management and operation of the Fund, other than brokerage expenses, taxes, interest, extraordinary expenses, and the fees and expenses of the Fund’s independent directors (including their independent legal counsel) and expenses incurred in connection with the provision of shareholder services and distribution services under a plan adopted pursuant to Rule 12b-1 under the 1940 Act. Under the unified fee structure, the Advisor is responsible for providing all investment advisory, custody, audit, administrative, compliance, recordkeeping, marketing and shareholder services, or arranging and supervising third parties to provide such services. By contrast, most other funds are charged a variety of fees, including an investment advisory fee, a transfer agency fee, an administrative fee, distribution charges and other expenses. Other than their investment advisory fees and any applicable Rule 12b-1 distribution fees, all other components of the total fees charged by these other funds may be increased without shareholder approval. The Board believes the unified fee structure is a benefit to Fund shareholders because it clearly discloses to shareholders the cost of owning Fund shares, and, since the unified fee cannot be increased without a vote of Fund shareholders, it shifts to the Advisor the risk of increased costs of operating the Fund and provides a direct incentive to minimize administrative inefficiencies. Part of the Board’s analysis of fee levels involves reviewing certain evaluative data compiled by an independent provider and comparing the Fund’s unified fee to the total expense ratio of other funds in the Fund’s peer group. The Board concluded that the management fee paid by the Fund to the Advisor under the management agreement is reasonable in light of the services provided to the Fund.
Comparison to Fees and Services Provided to Other Clients of the Advisor. The Board also requested and received information from the Advisor concerning the nature of the services, fees, costs and profitability of its advisory services to advisory clients other than the Fund. They observed that these varying types of client accounts require different services and involve different regulatory and entrepreneurial risks than the management of the Fund. The Board analyzed this information and concluded that the fees charged and services provided to the Fund were reasonable by comparison.
Collateral or “Fall-Out” Benefits Derived by the Advisor. The Board considered the existence of collateral benefits the Advisor may receive as a result of its relationship with the Fund. They concluded that the Advisor’s primary business is managing mutual funds and it generally does not use fund or shareholder information to generate profits in other lines of business, and therefore does not derive any significant collateral benefits from them. The Board noted that the Advisor receives proprietary research from broker-dealers that execute fund portfolio transactions and concluded that this research is likely to benefit Fund
shareholders. The Board also determined that the Advisor is able to provide investment management services to certain clients other than the Fund, at least in part, due to its existing infrastructure built to serve the fund complex. The Board concluded, however, that the assets of those other clients are not material to the analysis and, where applicable, may be included with the assets of the Fund to determine breakpoints in the management fee schedule.
Existing Relationship. The Board also considered whether there was any reason for not continuing the existing arrangement with the Advisor. In this regard, the Board was mindful of the potential disruptions of the Fund’s operations and various risks, uncertainties, and other effects that could occur as a result of a decision not to continue such relationship. In particular, the Board recognized that most shareholders have invested in the Fund on the strength of the Advisor’s industry standing and reputation and in the expectation that the Advisor will have a continuing role in providing advisory services to the Fund.
Conclusion of the Directors. As a result of this process, the Board, including all of the independent directors, taking into account all of the factors discussed above and the information provided by the Advisor and others, concluded that the management agreement between the Fund and the Advisor is fair and reasonable in light of the services provided and should be renewed.
Additional Information |
Retirement Account Information
As required by law, distributions you receive from certain IRAs are subject to federal income tax withholding, unless you elect not to have withholding apply. Tax will be withheld on the total amount withdrawn even though you may be receiving amounts that are not subject to withholding, such as nondeductible contributions. In such case, excess amounts of withholding could occur. You may adjust your withholding election so that a greater or lesser amount will be withheld.
If you don’t want us to withhold on this amount, you must notify us to not withhold the federal income tax. You may notify us in writing or in certain situations by telephone or through other electronic means. For systematic withdrawals, your withholding election will remain in effect until revoked or changed by filing a new election. You have the right to revoke your election at any time.
Remember, even if you elect not to have income tax withheld, you are liable for paying income tax on the taxable portion of your withdrawal. If you elect not to have income tax withheld or you don’t have enough income tax withheld, you may be responsible for payment of estimated tax. You may incur penalties under the estimated tax rules if your withholding and estimated tax payments are not sufficient. You can reduce or defer the income tax on a distribution by directly or indirectly rolling such distribution over to another IRA or eligible plan. You should consult your tax advisor for additional information.
State tax will be withheld if, at the time of your distribution, your address is within one of the mandatory withholding states and you have federal income tax withheld (or as otherwise required by state law). State taxes will be withheld from your distribution in accordance with the respective state rules.
Distributions you receive from 403(b), 457 and qualified plans are subject to special tax and withholding rules. Your plan administrator or plan sponsor is required to provide you with a special tax notice explaining those rules at the time you request a distribution. If applicable, federal and/or state taxes may be withheld from your distribution amount.
Proxy Voting Policies
A description of the policies that the fund’s investment advisor uses in exercising the voting rights associated with the securities purchased and/or held by the fund is available without charge, upon request, by calling 1-800-345-2021. It is also available on the “About Us” page of American Century Investments’ website at americancentury.com and on the Securities and Exchange Commission’s website at sec.gov. Information regarding how the investment advisor voted proxies relating to portfolio securities during the most recent 12-month period ended June 30 is available on the “About Us” page at americancentury.com. It is also available at sec.gov.
Quarterly Portfolio Disclosure
The fund files its complete schedule of portfolio holdings with the Securities and Exchange Commission (SEC) for the first and third quarters of each fiscal year on Form N-Q. The fund’s Forms N-Q are available on the SEC’s website at sec.gov, and may be reviewed and copied at the SEC’s Public Reference Room in Washington, DC. Information on the operation of the Public Reference Room may be obtained by calling 1-800-SEC-0330. The fund also makes its complete schedule of portfolio holdings for the most recent quarter of its fiscal year available on its website at americancentury.com and, upon request, by calling 1-800-345-2021.
Other Tax Information
The following information is provided pursuant to provisions of the Internal Revenue Code.
The fund hereby designates up to the maximum amount allowable as qualified dividend income for the fiscal year ended November 30, 2013.
For the fiscal year ended November 30, 2013, the fund intends to pass through to shareholders $171,832, or up to the maximum amount allowable, as a foreign tax credit which represents taxes paid on income derived from sources within foreign countries or possessions of the United States. During the fiscal year ended November 30, 2013, the fund earned $2,230,828 from income derived from foreign sources. Foreign source income and foreign tax expense per outstanding share on November 30, 2013 are $0.1385 and $0.0107, respectively.
Notes |
![]()
Contact Us | americancentury.com |
Automated Information Line | 1-800-345-8765 |
Investor Services Representative | 1-800-345-2021 |
Investors Using Advisors | 1-800-378-9878 |
Business, Not-For-Profit, Employer-Sponsored Retirement Plans | 1-800-345-3533 |
Banks and Trust Companies, Broker-Dealers, Financial Professionals, Insurance Companies | 1-800-345-6488 |
Telecommunications Relay Service for the Deaf | 711 |
American Century World Mutual Funds, Inc.
Investment Advisor:
American Century Investment Management, Inc.
Kansas City, Missouri
This report and the statements it contains are submitted for the general information of our shareholders. The report is not authorized for distribution to prospective investors unless preceded or accompanied by an effective prospectus.
©2014 American Century Proprietary Holdings, Inc. All rights reserved.
CL-ANN-80789 1401
ANNUAL REPORT | NOVEMBER 30, 2013 |
International Value Fund
Table of Contents |
President’s Letter | 2 |
Market Perspective | 3 |
Performance | 4 |
Portfolio Commentary | 6 |
Fund Characteristics | 8 |
Shareholder Fee Example | 9 |
Schedule of Investments | 11 |
Statement of Assets and Liabilities | 14 |
Statement of Operations | 15 |
Statement of Changes in Net Assets | 16 |
Notes to Financial Statements | 17 |
Financial Highlights | 23 |
Report of Independent Registered Public Accounting Firm | 25 |
Management | 26 |
Approval of Management Agreement | 29 |
Additional Information | 34 |
Any opinions expressed in this report reflect those of the author as of the date of the report, and do not necessarily represent the opinions of American Century Investments® or any other person in the American Century Investments organization. Any such opinions are subject to change at any time based upon market or other conditions and American Century Investments disclaims any responsibility to update such opinions. These opinions may not be relied upon as investment advice and, because investment decisions made by American Century Investments funds are based on numerous factors, may not be relied upon as an indication of trading intent on behalf of any American Century Investments fund. Security examples are used for representational purposes only and are not intended as recommendations to purchase or sell securities. Performance information for comparative indices and securities is provided to American Century Investments by third party vendors. To the best of American Century Investments’ knowledge, such information is accurate at the time of printing.
President’s Letter |
Jonathan Thomas
Dear Investor:
Thank you for reviewing this annual report for the 12 months ended November 30, 2013. It provides investment performance, market analysis, and portfolio information, presented with the expert perspective of our portfolio management team.
Annual reports remain important vehicles for conveying information about fund returns, including key factors that affected fund performance. For additional, updated investment and market insights, we encourage you to visit our website, americancentury.com.
Monetary Policy-Driven, “Risk-On” Results in Developed Countries
Stimulative monetary policies by central banks and slowly improving global economic conditions played a major part in financial market returns during the reporting period. The combination of an improving global economic outlook, mostly low costs of capital in the money markets, and central bank purchases of longer-maturity fixed income securities (a market liquidity-building strategy known as quantitative easing, QE) helped persuade investors to seek risk and yield, particularly in developed markets such as the U.S., Japan, and Europe. Broad stock index returns were stellar in these markets, particularly at the smaller capitalization end of the company size spectrum. Representing the broad markets, the S&P 500 and MSCI EAFE Indices returned 30.30% and 24.84%, respectively, for the reporting period, and their smaller capitalization counterparts performed even better.
At the same time, hints that QE might be tapered soon in the U.S. hampered government bond returns and emerging market stock indices. Broad emerging market stock indices posted positive single-digit returns, but government bond total returns dipped into negative territory, despite low inflation. Corporate bonds, especially high-yield corporates, generally performed better than government bonds because of their higher yields, declining spreads (yield differences between corporate and similar-maturity Treasury securities), and relatively low default rates, compared with historical averages.
As we enter 2014, there’s less uncertainty about the U.S. fiscal picture and global economic strength than a year ago, but headwinds continue. A full economic recovery from 2008 remains elusive—economic growth is still subpar compared with past recoveries. In this environment, we continue to believe in a disciplined, diversified, long-term investment approach, using professionally managed stock and bond portfolios—as appropriate—for meeting financial goals. We appreciate your continued trust in us.
Sincerely,
Jonathan Thomas
President and Chief Executive Officer
American Century Investments
Market Perspective |
By Mark Kopinski, Chief Investment Officer, Global and Non-U.S. Equity
Global Stocks Rallied to Post Double-Digit Gains
Stock market performance remained robust during the 12-month period ended November 30, 2013, with most major market indices posting double-digit gains. Despite persistent concerns about weak global growth and a slowdown in China, investors largely focused on central bank stimulus measures, marginally improving U.S. and European economic data, and relatively healthy corporate earnings, which fueled stock market optimism.
Prior to the reporting period, the U.S. Federal Reserve (the Fed) announced its third quantitative easing program (QE3). This effort, combined with similar large-scale stimulus measures from the European Central Bank (ECB) and the Bank of Japan as well as favorable corporate earnings reports, generally helped keep stocks in favor. Additionally, housing market gains in the U.S., U.K., and Australia aided the global investment landscape.
Europe, Japan were Performance Leaders
Assurances by the ECB that it would keep interest rates at historic lows for an extended period, followed by the cutting of its key lending rate to 0.25% late in the period, helped drive stock market gains in Europe. In addition, economic conditions throughout Europe improved, led by an expanding manufacturing sector, improving business and consumer sentiment, and a slowdown of the economic contraction in the peripheral countries. In the second calendar quarter of 2013, the 17-member eurozone emerged from its longest-ever recession (six consecutive quarters). Investors generally focused on these positive factors, pushing stocks higher despite the structural issues and high unemployment still plaguing the region.
In Japan, the central bank’s efforts to pull the nation out of its decades-long deflationary spiral and spark economic growth appeared to be working. Japan’s economy grew, and consumer prices increased. Late in the period, government officials announced the country’s inflation rate rose at a five-year high, suggesting their deflation-focused initiatives were gaining traction.
Overall, developed market stocks sharply outperformed their emerging market counterparts. Much of the lagging performance was due to a slower-growth environment in China. In addition, rising inflation and currency weakness weighed on many developing nations.
International Equity Total Returns | ||||
For the 12 months ended November 30, 2013 (in U.S. dollars) | ||||
MSCI EAFE Index | 24.84% | MSCI Europe Index | 25.94% | |
MSCI EAFE Growth Index | 23.45% | MSCI World Index | 26.38% | |
MSCI EAFE Value Index | 26.20% | MSCI Japan Index | 32.84% | |
MSCI Emerging Markets Index | 3.66% | |||
Performance |
Total Returns as of November 30, 2013 | ||||||
Average Annual Returns | ||||||
Ticker Symbol | 1 year | 5 years | 10 years | Since Inception | Inception Date | |
A Class No sales charge* With sales charge* | MEQAX
| 24.67% 17.55% | 12.95% 11.64% | 7.46%(1) 6.83%(1) | 4.66%(1) 4.29%(1) | 3/31/97
|
MSCI EAFE Value Index | — | 26.20% | 12.91% | 7.51% | 6.24% | — |
Investor Class | ACEVX | 24.96% | 13.25% | — | 4.02% | 4/3/06 |
Institutional Class | ACVUX | 25.24% | 13.46% | — | 4.21% | 4/3/06 |
C Class | ACCOX | 23.68% | 12.09% | — | 2.97% | 4/3/06 |
R Class | ACVRX | 24.32% | 12.65% | — | 3.49% | 4/3/06 |
R6 Class | ACVDX | — | — | — | 9.14%(2) | 7/26/13 |
* | Sales charges include initial sales charges and contingent deferred sales charges (CDSCs), as applicable. A Class shares have a 5.75% maximum initial sales charge and may be subject to a maximum CDSC of 1.00%. C Class shares redeemed within 12 months of purchase are subject to a maximum CDSC of 1.00%. The SEC requires that mutual funds provide performance information net of maximum sales charges in all cases where charges could be applied. |
International Value acquired all the net assets of the Mason Street International Equity Fund on March 31, 2006, pursuant to a plan of reorganization approved by the acquired fund’s shareholders on March 15, 2006. Performance information prior to April 1, 2006, is that of the Mason Street International Equity Fund.
(1) | Returns would have been lower if a portion of the fees had not been waived. |
(2) | Total returns for periods less than one year are not annualized. |
Data presented reflect past performance. Past performance is no guarantee of future results. Current performance may be higher or lower than the performance shown. Investment return and principal value will fluctuate, and redemption value may be more or less than original cost. To obtain performance data current to the most recent month end, please call 1-800-345-2021 or visit americancentury.com. International investing involves special risks, such as political instability and currency fluctuations. Investing in emerging markets may accentuate these risks.
Unless otherwise indicated, performance reflects A Class shares; performance for other share classes will vary due to differences in fee structure. For information about other share classes available, please consult the prospectus. Data assumes reinvestment of dividends and capital gains, and none of the charts reflect the deduction of taxes that a shareholder would pay on fund distributions or the redemption of fund shares. Returns for the index are provided for comparison. The fund’s total returns include operating expenses (such as transaction costs and management fees) that reduce returns, while the total returns of the index do not.
Growth of $10,000 Over 10 Years |
$10,000 investment made November 30, 2003* |
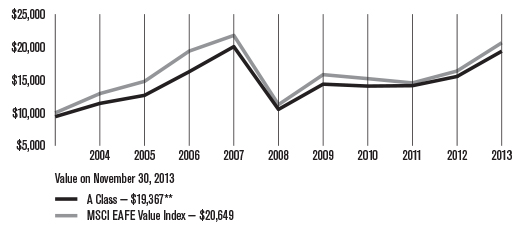
* | The A Class’s initial investment is $9,425 to reflect the maximum 5.75% initial sales charge. |
** | Ending value would have been lower if a portion of the fees had not been waived. |
Total Annual Fund Operating Expenses | |||||
Investor Class | Institutional Class | A Class | C Class | R Class | R6 Class |
1.31% | 1.11% | 1.56% | 2.31% | 1.81% | 0.96% |
The total annual fund operating expenses shown is as stated in the fund’s prospectus current as of the date of this report. The prospectus may vary from the expense ratio shown elsewhere in this report because it is based on a different time period, includes acquired fund fees and expenses, and, if applicable, does not include fee waivers or expense reimbursements.
Data presented reflect past performance. Past performance is no guarantee of future results. Current performance may be higher or lower than the performance shown. Investment return and principal value will fluctuate, and redemption value may be more or less than original cost. To obtain performance data current to the most recent month end, please call 1-800-345-2021 or visit americancentury.com. International investing involves special risks, such as political instability and currency fluctuations. Investing in emerging markets may accentuate these risks.
Unless otherwise indicated, performance reflects A Class shares; performance for other share classes will vary due to differences in fee structure. For information about other share classes available, please consult the prospectus. Data assumes reinvestment of dividends and capital gains, and none of the charts reflect the deduction of taxes that a shareholder would pay on fund distributions or the redemption of fund shares. Returns for the index are provided for comparison. The fund’s total returns include operating expenses (such as transaction costs and management fees) that reduce returns, while the total returns of the index do not.
Portfolio Commentary |
Portfolio Managers: Elizabeth Xie, Yulin Long, and Vinod Chandrashekaran
Performance Summary
International Value returned 24.67%* for the fiscal year ended November 30, 2013, compared with the 26.20% return of its benchmark, the MSCI EAFE Value Index. Fund results reflect management fees, while benchmark returns do not.
International equity markets posted robust returns during the 12-month period, despite ongoing weakness in the global economic recovery. Continued stimulus by central banks around the world, combined with improving economic and corporate data, led most markets to finish the fiscal year with double-digit gains.
The fund’s stock selection process incorporates factors of value, quality, and momentum while striving to minimize unintended bets along industries and other risk characteristics. Stock selection insights based on value, and to a lesser extent quality, were detrimental to relative returns, while momentum measures were generally advantageous.
From a geographical perspective, positioning in Japan and Italy negatively impacted returns, while holdings in Hong Kong and Germany contributed favorably to performance versus the benchmark. On a sector level, financials and information technology holdings were among the top detractors, while consumer discretionary stocks bolstered returns.
Financials Detracted from Relative Results
The fund’s financials stocks, particularly holdings among Japanese commercial banks, produced the lion’s share of the underperformance in this sector, and were among the largest detractors from the fund’s relative results. Underweights to Sumitomo Mitsui Trust Holdings and Sumitomo Mitsui Financial Group were detrimental as the stock of both companies saw significant appreciation during the first half of the period on news of share repurchases and acquisitions.
The information technology sector was another area of underperformance, especially among communications equipment holdings. Here, not owning Finland-based mobile communications company Nokia led the sector’s underperformance. The company’s stock surged after Microsoft announced its intention to buy the company’s devices and services unit.
Among individual detractors U.K.-based global metals and mining company Evraz also impacted relative gains. Greater-than-index exposure to the company was detrimental after its shares tumbled on slumping commodity and metals prices, which ultimately led the company to be removed from London’s FTSE 100 Index. However, we believe that the holding appears very attractive on value, and we remain committed to owning it in the fund. A smaller-than-index weighting in Daimler, a German auto manufacturer, was also detrimental after the company’s stock rose over 70% on robust sales of its Mercedes-Benz brand.
* | All fund returns referenced in this commentary are for A Class shares and are not reduced by sales charges. A Class shares are subject to a maximum sales charge of 5.75%. Had the sales charge been applied, returns would have been lower than those shown. |
Consumer Discretionary Bolstered Performance
On the positive side, International Value’s holdings in the consumer discretionary and industrials sectors outperformed their counterparts in the MSCI EAFE Value Index for the 12-month period. Within the consumer sector, media names had the biggest relative impact on performance, with hotels, restaurants and leisure holdings also helping to add value. A significant contribution in the sector came from overweight exposure to Germany’s ProSiebenSat.1 Media AG. The broadcaster’s shares climbed on higher-than-expected revenues and upward revisions to its earning outlook thanks to strength in digital revenue growth. Hong Kong casino developer MGM China Holdings, a non-index position, bolstered results after its stock nearly doubled in value during the year due to solid revenue and earnings growth. The firm benefited from growth in the Macau gaming market thanks to increasing disposable incomes of Chinese consumers from the mainland. Japan’s Fuji Heavy Industries, manufacturer of Subaru cars, was another top sector and portfolio contributor thanks to strong sales growth as well as a weakening currency.
Among industrials, commercial services and supplies companies added the most value. Here, rising earnings, improving operating margins, and announcement of a share buyback program by Sweden-based Intrum Justitia, a provider of credit management services, drove its stock to appreciate steadily during the year. Elsewhere in the fund, top individual performers included Japan-based wireless telecommunication services provider KDDI Corporation, which appreciated over 70%.
A Look Ahead
As we move into 2014, uncertainty surrounding the global economic recovery and potential monetary policy changes implemented by central banks around the world remain the key factors likely to impact international equity markets in the near term. We believe that our disciplined investment approach is particularly beneficial during periods of likely volatility, and we adhere to our process regardless of the market environment. We believe that this allows us to take advantage of opportunities presented by market inefficiencies.
We believe that stock selection—rather than sector allocation or market timing via the use of cash—is the most efficient means of generating superior risk-adjusted returns. As a result of this approach, the fund’s sector and industry selection are primarily a result of identifying what we believe to be superior individual securities. As of November 30, 2013, the portfolio’s largest underweight position was in the consumer staples sector. In part, this reflected the reduction of a stake in Switzerland-based global food and beverage manufacturer Nestle, which appears weak based on our momentum insights. Exposure to the health care sector was also reduced, primarily through a partial liquidation of France-based pharmaceutical company Sanofi, whose quality and momentum measures appear unappealing to the team. The fund’s top overweights include telecommunication services, reflected in part by an additional investment in Germany-based Deutsche Telekom, as well as industrials, where we initiated a position in German airline Deutsche Lufthansa. We believe that both holdings are compelling across all factors.
Fund Characteristics |
NOVEMBER 30, 2013 | |
Top Ten Holdings | % of net assets |
HSBC Holdings plc | 4.0% |
Total SA | 2.5% |
Royal Dutch Shell plc B Shares | 2.2% |
AstraZeneca plc | 2.0% |
Westpac Banking Corp. | 2.0% |
Vodafone Group plc | 1.9% |
Allianz SE | 1.9% |
Commonwealth Bank of Australia | 1.8% |
Australia & New Zealand Banking Group Ltd. | 1.8% |
Banco Santander SA | 1.7% |
Types of Investments in Portfolio | % of net assets |
Foreign Common Stocks | 97.7% |
Exchange-Traded Funds | 1.5% |
Total Equity Exposure | 99.2% |
Temporary Cash Investments | 1.1% |
Other Assets and Liabilities | (0.3)% |
Investments by Country | % of net assets |
United Kingdom | 23.2% |
Japan | 18.9% |
Germany | 9.9% |
France | 9.8% |
Australia | 7.8% |
Spain | 4.2% |
Switzerland | 4.0% |
Hong Kong | 3.4% |
Singapore | 2.2% |
Italy | 2.0% |
Other Countries | 12.3% |
Exchange-Traded Funds | 1.5% |
Cash and Equivalents* | 0.8% |
* | Includes temporary cash investments and other assets and liabilities. |
Shareholder Fee Example |
Fund shareholders may incur two types of costs: (1) transaction costs, including sales charges (loads) on purchase payments and redemption/exchange fees; and (2) ongoing costs, including management fees; distribution and service (12b-1) fees; and other fund expenses. This example is intended to help you understand your ongoing costs (in dollars) of investing in your fund and to compare these costs with the ongoing cost of investing in other mutual funds.
The example is based on an investment of $1,000 made at the beginning of the period and held for the entire period from June 1, 2013 to November 30, 2013 (except as noted).
Actual Expenses
The table provides information about actual account values and actual expenses for each class. You may use the information, together with the amount you invested, to estimate the expenses that you paid over the period. First, identify the share class you own. Then simply divide your account value by $1,000 (for example, an $8,600 account value divided by $1,000 = 8.6), then multiply the result by the number under the heading “Expenses Paid During Period” to estimate the expenses you paid on your account during this period.
If you hold Investor Class shares of any American Century Investments fund, or Institutional Class shares of the American Century Diversified Bond Fund, in an American Century Investments account (i.e., not a financial intermediary or retirement plan account), American Century Investments may charge you a $12.50 semiannual account maintenance fee if the value of those shares is less than $10,000. We will redeem shares automatically in one of your accounts to pay the $12.50 fee. In determining your total eligible investment amount, we will include your investments in all personal accounts (including American Century Investments Brokerage accounts) registered under your Social Security number. Personal accounts include individual accounts, joint accounts, UGMA/UTMA accounts, personal trusts, Coverdell Education Savings Accounts and IRAs (including traditional, Roth, Rollover, SEP-, SARSEP- and SIMPLE-IRAs), and certain other retirement accounts. If you have only business, business retirement, employer-sponsored or American Century Investments Brokerage accounts, you are currently not subject to this fee. If you are subject to the Account Maintenance Fee, your account value could be reduced by the fee amount.
Hypothetical Example for Comparison Purposes
The table also provides information about hypothetical account values and hypothetical expenses based on the actual expense ratio of each class of your fund and an assumed rate of return of 5% per year before expenses, which is not the actual return of a fund’s share class. The hypothetical account values and expenses may not be used to estimate the actual ending account balance or expenses you paid for the period. You may use this information to compare the ongoing costs of investing in your fund and other funds. To do so, compare this 5% hypothetical example with the 5% hypothetical examples that appear in the shareholder reports of the other funds.
Please note that the expenses shown in the table are meant to highlight your ongoing costs only and do not reflect any transactional costs, such as sales charges (loads) or redemption/exchange fees. Therefore, the table is useful in comparing ongoing costs only, and will not help you determine the relative total costs of owning different funds. In addition, if these transactional costs were included, your costs would have been higher.
Beginning 6/1/13 | Ending 11/30/13 | Expenses Paid During Period(1) 6/1/13 – 11/30/13 | Annualized | |
Actual | ||||
Investor Class | $1,000 | $1,136.90 | $7.02 | 1.31% |
Institutional Class | $1,000 | $1,137.10 | $5.95 | 1.11% |
A Class | $1,000 | $1,134.80 | $8.35 | 1.56% |
C Class | $1,000 | $1,129.70 | $12.33 | 2.31% |
R Class | $1,000 | $1,134.00 | $9.68 | 1.81% |
R6 Class | $1,000 | $1,091.40(2) | $3.52(3) | 0.96% |
Hypothetical | ||||
Investor Class | $1,000 | $1,018.50 | $6.63 | 1.31% |
Institutional Class | $1,000 | $1,019.50 | $5.62 | 1.11% |
A Class | $1,000 | $1,017.25 | $7.89 | 1.56% |
C Class | $1,000 | $1,013.49 | $11.66 | 2.31% |
R Class | $1,000 | $1,015.99 | $9.15 | 1.81% |
R6 Class | $1,000 | $1,020.26(4) | $4.86(4) | 0.96% |
(1) | Expenses are equal to the class’s annualized expense ratio listed in the table above, multiplied by the average account value over the period, multiplied by 183, the number of days in the most recent fiscal half-year, divided by 365, to reflect the one-half year period. |
(2) | Ending account value based on actual return from July 26, 2013 (commencement of sale) through November 30, 2013. |
(3) | Expenses are equal to the class’s annualized expense ratio listed in the table above, multiplied by the average account value over the period, multiplied by 128, the number of days in the period from July 26, 2013 (commencement of sale) through November 30, 2013, divided by 365, to reflect the period. Had the class been available for the full period, the expenses paid during the period would have been higher. |
(4) | Ending account value and expenses paid during the period assumes the class had been available throughout the entire period and are calculated using the class’s annualized expense ratio listed in the table above. |
Schedule of Investments |
NOVEMBER 30, 2013
Shares | Value | |
Common Stocks — 97.7% | ||
AUSTRALIA — 7.8% | ||
Australia & New Zealand Banking Group Ltd. | 22,500 | $ 653,332 |
Commonwealth Bank of Australia | 9,400 | 665,855 |
National Australia Bank Ltd. | 15,005 | 472,304 |
Telstra Corp. Ltd. | 75,447 | 347,499 |
Westpac Banking Corp. | 24,097 | 721,200 |
2,860,190 | ||
AUSTRIA — 1.1% | ||
OMV AG | 7,881 | 386,049 |
BELGIUM — 1.3% | ||
Delhaize Group SA | 4,652 | 271,145 |
KBC Groep NV | 3,812 | 217,550 |
488,695 | ||
DENMARK — 1.1% | ||
AP Moeller – Maersk A/S B Shares | 11 | 111,609 |
Tryg A/S | 931 | 84,134 |
Vestas Wind Systems A/S(1) | 7,001 | 199,584 |
395,327 | ||
FINLAND — 0.8% | ||
UPM-Kymmene Oyj | 16,929 | 281,328 |
FRANCE — 9.8% | ||
BNP Paribas | 1,800 | 135,133 |
Bouygues SA | 7,211 | 272,001 |
Cie Generale des Etablissements Michelin Class B | 442 | 48,017 |
CNP Assurances | 19,643 | 375,408 |
Derichebourg SA(1) | 35,861 | 116,265 |
GDF Suez | 16,200 | 375,755 |
Metropole Television SA | 9,525 | 207,793 |
Orange SA | 7,598 | 99,267 |
Plastic Omnium SA | 2,395 | 73,222 |
Sanofi | 3,710 | 392,403 |
Technicolor SA(1) | 11,700 | 59,299 |
Total SA | 15,330 | 928,933 |
UbiSoft Entertainment SA(1) | 18,851 | 248,207 |
Vinci SA | 4,179 | 268,732 |
3,600,435 | ||
GERMANY — 9.9% | ||
Allianz SE | 4,000 | 694,891 |
BASF SE | 3,014 | 321,901 |
Daimler AG | 1,500 | 124,330 |
Deutsche Lufthansa AG(1) | 18,793 | 408,192 |
Deutsche Telekom AG | 37,649 | 597,775 |
E.ON AG | 5,753 | 110,691 |
Hannover Rueck SE | 4,831 | 402,330 |
Metro AG | 5,900 | 295,744 |
ProSiebenSat.1 Media AG | 6,560 | 295,178 |
Rheinmetall AG | 1,641 | 101,144 |
Siemens AG | 2,180 | 287,925 |
3,640,101 | ||
HONG KONG — 3.4% | ||
BOC Hong Kong Holdings Ltd. | 132,000 | 446,098 |
Dah Sing Banking Group Ltd. | 44,400 | 81,784 |
FIH Mobile Ltd.(1) | 120,000 | 60,213 |
Hang Seng Bank Ltd. | 15,500 | 252,917 |
Link Real Estate Investment Trust (The) | 27,500 | 134,794 |
Wharf Holdings Ltd. | 33,000 | 274,342 |
1,250,148 | ||
IRELAND — 0.8% | ||
Smurfit Kappa Group plc | 12,655 | 300,923 |
ISRAEL — 0.8% | ||
Bank Hapoalim BM | 54,045 | 301,035 |
ITALY — 2.0% | ||
Enel SpA | 49,460 | 225,006 |
ENI SpA | 18,689 | 449,739 |
Prysmian SpA | 1,573 | 41,081 |
715,826 | ||
JAPAN — 18.9% | ||
Aeon Co. Ltd. | 12,100 | 162,759 |
Aisin Seiki Co. Ltd. | 3,900 | 156,845 |
Asahi Kasei Corp. | 30,000 | 236,615 |
Bridgestone Corp. | 7,100 | 259,896 |
Central Japan Railway Co. | 3,300 | 396,857 |
Daihatsu Motor Co. Ltd. | 6,300 | 115,244 |
Daikyo, Inc. | 12,000 | 32,798 |
Dowa Holdings Co. Ltd. | 4,000 | 40,568 |
Fuji Heavy Industries Ltd. | 13,500 | 381,102 |
Fukuoka Financial Group, Inc. | 68,000 | 304,671 |
GungHo Online Entertainment, Inc.(1) | 56 | 36,679 |
Hino Motors Ltd. | 14,000 | 216,877 |
Japan Airlines Co. Ltd. | 6,400 | 325,482 |
JGC Corp. | 3,000 | 111,718 |
KDDI Corp. | 7,600 | 477,017 |
Konica Minolta Holdings, Inc. | 7,500 | 75,626 |
Mitsubishi Chemical Holdings Corp. | 13,000 | 60,403 |
Mitsubishi Motors Corp.(1) | 8,600 | 93,182 |
Shares | Value |
Mitsubishi UFJ Financial Group, Inc. | 12,100 | $ 77,836 |
Mitsui Engineering & Shipbuilding Co. Ltd. | 87,000 | 178,340 |
Nippon Paint Co. Ltd. | 4,000 | 64,815 |
Nippon Telegraph & Telephone Corp. | 8,800 | 441,525 |
Nomura Research Institute Ltd. | 2,100 | 68,876 |
NTT Data Corp. | 5,800 | 208,629 |
Panasonic Corp. | 6,100 | 69,964 |
Resona Holdings, Inc. | 33,900 | 168,102 |
Resorttrust, Inc. | 1,100 | 40,641 |
Seiko Epson Corp. | 11,700 | 282,778 |
Shiseido Co. Ltd. | 4,600 | 78,669 |
Showa Shell Sekiyu KK | 34,500 | 383,240 |
Sony Corp. | 15,600 | 284,301 |
Sumitomo Metal Mining Co. Ltd. | 5,000 | 66,524 |
Sumitomo Mitsui Financial Group, Inc. | 600 | 29,694 |
Sumitomo Mitsui Trust Holdings, Inc. | 81,000 | 397,706 |
T&D Holdings, Inc. | 15,400 | 203,539 |
Tokai Rika Co. Ltd. | 8,100 | 164,222 |
Tosoh Corp. | 20,000 | 89,804 |
Toyoda Gosei Co. Ltd. | 1,700 | 41,784 |
Toyota Motor Corp. | 400 | 24,911 |
TS Tech Co. Ltd. | 1,900 | 66,582 |
6,916,821 | ||
NETHERLANDS — 1.7% | ||
ING Groep NV CVA(1) | 40,923 | 531,484 |
Koninklijke Ahold NV | 4,505 | 82,027 |
613,511 | ||
NEW ZEALAND — 0.7% | ||
Telecom Corp. of New Zealand Ltd. | 140,088 | 262,128 |
NORWAY — 1.9% | ||
Statoil ASA | 1,551 | 35,035 |
TGS Nopec Geophysical Co. ASA | 13,754 | 362,996 |
Yara International ASA | 6,422 | 280,177 |
678,208 | ||
PORTUGAL — 0.5% | ||
EDP – Energias de Portugal SA | 51,908 | 196,433 |
SINGAPORE — 2.2% | ||
Oversea-Chinese Banking Corp. Ltd. | 47,000 | 391,027 |
United Overseas Bank Ltd. | 24,000 | 400,111 |
791,138 | ||
SPAIN — 4.2% | ||
Banco Santander SA | 69,558 | 618,415 |
Endesa SA(1) | 11,600 | 348,421 |
Gamesa Corp. Tecnologica SA(1) | 17,906 | 176,665 |
Gas Natural SDG SA | 5,000 | 124,466 |
Mapfre SA | 65,282 | 259,286 |
1,527,253 | ||
SWEDEN — 1.6% | ||
Axfood AB | 2,000 | 100,986 |
Industrivarden AB C Shares | 6,864 | 123,690 |
Intrum Justitia AB | 11,100 | 282,604 |
Telefonaktiebolaget LM Ericsson B Shares | 6,627 | 82,542 |
589,822 | ||
SWITZERLAND — 4.0% | ||
Nestle SA | 1,241 | 90,638 |
Novartis AG | 2,423 | 191,536 |
Roche Holding AG | 1,073 | 299,147 |
Swiss Life Holding AG | 1,384 | 286,450 |
Swiss Reinsurance Co. | 1,000 | 88,978 |
Zurich Financial Services AG | 1,800 | 502,229 |
1,458,978 | ||
UNITED KINGDOM — 23.2% | ||
Afren plc(1) | 88,975 | 237,166 |
Antofagasta plc | 24,516 | 318,517 |
AstraZeneca plc | 12,988 | 746,698 |
BAE Systems plc | 8,991 | 62,879 |
Berendsen plc | 9,784 | 147,448 |
BHP Billiton plc | 3,948 | 120,093 |
BP plc | 70,353 | 554,872 |
BT Group plc | 62,114 | 378,801 |
Cable & Wireless Communications plc | 161,800 | 126,261 |
Catlin Group Ltd. | 17,965 | 161,826 |
Centrica plc | 76,543 | 423,712 |
Dixons Retail plc(1) | 49,058 | 41,261 |
Evraz plc(1) | 84,483 | 147,778 |
GlaxoSmithKline plc | 19,830 | 525,168 |
Homeserve plc | 22,726 | 95,421 |
HSBC Holdings plc | 129,795 | 1,448,243 |
Investec plc | 21,976 | 155,236 |
Lloyds Banking Group plc(1) | 293,261 | 371,414 |
Marks & Spencer Group plc | 33,712 | 268,643 |
Mondi plc | 7,649 | 125,786 |
Pace plc | 8,414 | 43,479 |
Rio Tinto plc | 2,081 | 111,059 |
Royal Dutch Shell plc B Shares | 23,425 | 821,994 |
Shares | Value |
Soco International plc | 6,000 | $ 39,271 |
Standard Chartered plc | 10,682 | 253,183 |
Vedanta Resources plc | 3,124 | 45,239 |
Vodafone Group plc | 189,007 | 701,429 |
8,472,877 | ||
TOTAL COMMON STOCKS (Cost $30,018,022) | 35,727,226 | |
Exchange-Traded Funds — 1.5% | ||
iShares MSCI EAFE Value Index (Cost $504,497) | 9,671 | 549,603 |
Temporary Cash Investments — 1.1% | ||
Repurchase Agreement, Bank of America Merrill Lynch, (collateralized by various U.S. Treasury obligations, 0.375%, 6/30/15, valued at $69,001), in a joint trading account at 0.06%, dated 11/29/13, due 12/2/13 (Delivery value $67,615) | 67,615 | |
Repurchase Agreement, Credit Suisse First Boston, Inc., (collateralized by various U.S. Treasury obligations, 2.75%, 11/15/42, valued at $82,518), in a joint trading account at 0.03%, dated 11/29/13, due 12/2/13 (Delivery value $81,138) | 81,138 | |
Repurchase Agreement, Goldman Sachs & Co., (collateralized by various U.S. Treasury obligations, 0.00%, 5/29/14, valued at $69,033), in a joint trading account at 0.04%, dated 11/29/13, due 12/2/13 (Delivery value $67,681) | 67,681 | |
SSgA U.S. Government Money Market Fund | 178,401 | 178,401 |
TOTAL TEMPORARY CASH INVESTMENTS (Cost $394,835) | 394,835 | |
TOTAL INVESTMENT SECURITIES — 100.3% (Cost $30,917,354) | 36,671,664 | |
OTHER ASSETS AND LIABILITIES — (0.3)% | (96,551) | |
TOTAL NET ASSETS — 100.0% | $36,575,113 | |
Market Sector Diversification | |
(as a % of net assets) | |
Financials | 34.8% |
Energy | 11.6% |
Industrials | 10.5% |
Telecommunication Services | 9.3% |
Consumer Discretionary | 7.6% |
Materials | 7.2% |
Health Care | 5.8% |
Utilities | 4.9% |
Information Technology | 3.1% |
Consumer Staples | 2.9% |
Exchange-Traded Funds | 1.5% |
Cash and Equivalents* | 0.8% |
* Includes temporary cash investments and other assets and liabilities.
Notes to Schedule of Investments
CVA = Certificaten Van Aandelen
(1) | Non-income producing. |
See Notes to Financial Statements.
Statement of Assets and Liabilities |
NOVEMBER 30, 2013 | ||
Assets | ||
Investment securities, at value (cost of $30,917,354) | $36,671,664 | |
Foreign currency holdings, at value (cost of $14,605) | 14,493 | |
Receivable for investments sold | 322,610 | |
Receivable for capital shares sold | 44,247 | |
Dividends and interest receivable | 249,178 | |
| 37,302,192 | ||
Liabilities | ||
Disbursements in excess of demand deposit cash | 178,775 | |
Payable for investments purchased | 455,800 | |
Payable for capital shares redeemed | 49,116 | |
Accrued management fees | 38,504 | |
Distribution and service fees payable | 4,884 | |
| 727,079 | ||
Net Assets | $36,575,113 | |
Net Assets Consist of: | ||
Capital (par value and paid-in surplus) | $34,552,525 | |
Undistributed net investment income | 711,666 | |
Accumulated net realized loss | (4,452,814 | ) |
Net unrealized appreciation | 5,763,736 | |
| $36,575,113 | ||
Net assets | Shares outstanding | Net asset value per share | |
Investor Class, $0.01 Par Value | $17,919,743 | 1,998,189 | $8.97 |
Institutional Class, $0.01 Par Value | $768,601 | 85,738 | $8.96 |
A Class, $0.01 Par Value | $15,553,627 | 1,727,119 | $9.01* |
C Class, $0.01 Par Value | $2,008,768 | 223,904 | $8.97 |
R Class, $0.01 Par Value | $297,076 | 33,130 | $8.97 |
R6 Class, $0.01 Par Value | $27,298 | 3,045 | $8.96 |
* Maximum offering price $9.56 (net asset value divided by 0.9425).
See Notes to Financial Statements.
Statement of Operations |
YEAR ENDED NOVEMBER 30, 2013 | ||
Investment Income (Loss) | ||
Income: | ||
Dividends (net of foreign taxes withheld of $77,901) | $1,184,460 | |
Interest | 75 | |
| 1,184,535 | ||
Expenses: | ||
Management fees | 389,398 | |
Distribution and service fees: | ||
A Class | 35,358 | |
C Class | 16,864 | |
R Class | 1,552 | |
Directors’ fees and expenses | 1,642 | |
Other expenses | 598 | |
| 445,412 | ||
Net investment income (loss) | 739,123 | |
Realized and Unrealized Gain (Loss) | ||
Net realized gain (loss) on: | ||
Investment transactions | 2,770,791 | |
Foreign currency transactions | (10,381 | ) |
| 2,760,410 | ||
Change in net unrealized appreciation (depreciation) on: | ||
Investments | 3,208,028 | |
Translation of assets and liabilities in foreign currencies | 1,347 | |
| 3,209,375 | ||
Net realized and unrealized gain (loss) | 5,969,785 | |
Net Increase (Decrease) in Net Assets Resulting from Operations | $6,708,908 | |
See Notes to Financial Statements.
Statement of Changes in Net Assets |
YEARS ENDED NOVEMBER 30, 2013 AND NOVEMBER 30, 2012 | |||||
Increase (Decrease) in Net Assets | November 30, 2013 | November 30, 2012 | |||
Operations | |||||
Net investment income (loss) | $739,123 | $710,604 | |||
Net realized gain (loss) | 2,760,410 | (700,970 | ) | ||
Change in net unrealized appreciation (depreciation) | 3,209,375 | 2,251,767 | |||
Net increase (decrease) in net assets resulting from operations | 6,708,908 | 2,261,401 | |||
Distributions to Shareholders | |||||
From net investment income: | |||||
Investor Class | (355,003 | ) | (189,634 | ) | |
Institutional Class | (8,858 | ) | (5,151 | ) | |
A Class | (376,552 | ) | (231,826 | ) | |
C Class | (32,740 | ) | (10,018 | ) | |
R Class | (7,869 | ) | (3,397 | ) | |
Decrease in net assets from distributions | (781,022 | ) | (440,026 | ) | |
Capital Share Transactions | |||||
Net increase (decrease) in net assets from capital share transactions | 4,132,134 | (300,716 | ) | ||
Redemption Fees | |||||
Increase in net assets from redemption fees | 7,206 | 1,578 | |||
Net increase (decrease) in net assets | 10,067,226 | 1,522,237 | |||
Net Assets | |||||
Beginning of period | 26,507,887 | 24,985,650 | |||
End of period | $36,575,113 | $26,507,887 | |||
Undistributed net investment income | $711,666 | $755,142 | |||
See Notes to Financial Statements.
Notes to Financial Statements |
NOVEMBER 30, 2013
1. Organization
American Century World Mutual Funds, Inc. (the corporation) is registered under the Investment Company Act of 1940, as amended (the 1940 Act), as an open-end management investment company and is organized as a Maryland corporation. International Value Fund (the fund) is one fund in a series issued by the corporation. The fund is diversified as defined under the 1940 Act. The fund’s investment objective is to seek long-term capital growth.
The fund offers the Investor Class, the Institutional Class, the A Class, the C Class, the R Class and the R6 Class. The A Class may incur an initial sales charge. The A Class and C Class may be subject to a contingent deferred sales charge. The share classes differ principally in their respective sales charges and distribution and shareholder servicing expenses and arrangements. The Institutional Class and R6 Class shareholders do not require the same level of shareholder and administrative services from American Century Investment Management, Inc. (ACIM) (the investment advisor) as shareholders of other classes. In addition, financial intermediaries do not receive any service, distribution or administrative fees for the R6 Class. As a result, the Institutional Class and R6 Class are charged lower unified management fees. Sale of the R6 Class commenced on July 26, 2013.
2. Significant Accounting Policies
The following is a summary of significant accounting policies consistently followed by the fund in preparation of its financial statements. The financial statements are prepared in conformity with accounting principles generally accepted in the United States of America, which may require management to make certain estimates and assumptions at the date of the financial statements. Actual results could differ from these estimates.
Investment Valuations — The fund determines the fair value of its investments and computes its net asset value per share at the close of regular trading (usually 4 p.m. Eastern time) on the New York Stock Exchange (NYSE) on each day the NYSE is open. The Board of Directors has adopted valuation policies and procedures to guide the investment advisor in the fund’s investment valuation process and to provide methodologies for the oversight of the fund’s pricing function.
Equity securities that are listed or traded on a domestic securities exchange are valued at the last reported sales price or at the official closing price as provided by the exchange. Equity securities traded on foreign securities exchanges are generally valued at the closing price of such securities on the exchange where primarily traded or at the close of the NYSE, if that is earlier. If no last sales price is reported, or if local convention or regulation so provides, the mean of the latest bid and asked prices may be used. Securities traded over-the-counter are valued at the mean of the latest bid and asked prices, the last sales price, or the official closing price. Equity securities initially expressed in local currencies are translated into U.S. dollars at the mean of the appropriate currency exchange rate at the close of the NYSE as provided by an independent pricing service.
Fixed income securities maturing within 60 days at the time of purchase may be valued at cost, plus or minus any amortized discount or premium or at the evaluated mean as provided by an independent pricing service. Evaluated mean prices are commonly derived through utilization of market models, which may consider, among other factors: trade data, quotations from dealers and active market makers, relevant yield curve and spread data, related sector levels, creditworthiness, trade data or market information on comparable securities, and other relevant security specific information.
Open-end management investment companies are valued at the reported net asset value per share. Repurchase agreements are valued at cost, which approximates fair value.
If the fund determines that the market price for an investment is not readily available or the valuation methods mentioned above do not reflect an investment’s fair value, such investment is valued as determined in good faith by the Board of Directors or its delegate, in accordance with policies and procedures adopted by the Board of Directors. In its determination of fair value, the fund may review several factors including, but not limited
to, market information regarding the specific investment or comparable investments and correlation with other investment types, futures indices or general market indicators. Circumstances that may cause the fund to use these procedures to value an investment include, but are not limited to: an investment has been declared in default or is distressed; trading in a security has been suspended during the trading day or a security is not actively trading on its principal exchange; prices received from a regular pricing source are deemed unreliable; or there is a foreign market holiday and no trading occurred.
The fund monitors for significant events occurring after the close of an investment’s primary exchange but before the fund’s net asset value per share is determined. Significant events may include, but are not limited to: corporate announcements and transactions; governmental action and political unrest that could impact a specific investment or an investment sector; or armed conflicts, natural disasters and similar events that could affect investments in a specific country or region. The fund also monitors for significant fluctuations in domestic and foreign markets, as evidenced by the U.S. market or such other indicators that the Board of Directors, or its delegate, deems appropriate. If significant fluctuations in foreign markets are identified, the fund may apply a model-derived factor to the closing price of equity securities traded on foreign securities exchanges. The factor is based on observable market data as provided by an independent pricing service.
Security Transactions — Security transactions are accounted for as of the trade date. Net realized gains and losses are determined on the identified cost basis, which is also used for federal income tax purposes.
Investment Income — Dividend income less foreign taxes withheld, if any, is recorded as of the ex-dividend date. Distributions received on securities that represent a return of capital or long-term capital gain are recorded as a reduction of cost of investments and/or as a realized gain. The fund may estimate the components of distributions received that may be considered nontaxable distributions or long-term capital gain distributions for income tax purposes. Interest income is recorded on the accrual basis and includes accretion of discounts and amortization of premiums.
Foreign Currency Translations — All assets and liabilities initially expressed in foreign currencies are translated into U.S. dollars at prevailing exchange rates at period end. The fund may enter into spot foreign currency exchange contracts to facilitate transactions denominated in a foreign currency. Purchases and sales of investment securities, dividend and interest income, spot foreign currency exchange contracts, and expenses are translated at the rates of exchange prevailing on the respective dates of such transactions. Net realized and unrealized foreign currency exchange gains or losses related to investment securities are a component of net realized gain (loss) on investment transactions and change in net unrealized appreciation (depreciation) on investments, respectively.
Repurchase Agreements — The fund may enter into repurchase agreements with institutions that ACIM has determined are creditworthy pursuant to criteria adopted by the Board of Directors. The fund requires that the collateral, represented by securities, received in a repurchase transaction be transferred to the custodian in a manner sufficient to enable the fund to obtain those securities in the event of a default under the repurchase agreement. ACIM monitors, on a daily basis, the securities transferred to ensure the value, including accrued interest, of the securities under each repurchase agreement is equal to or greater than amounts owed to the fund under each repurchase agreement.
Joint Trading Account — Pursuant to an Exemptive Order issued by the Securities and Exchange Commission, the fund, along with certain other funds in the American Century Investments family of funds, may transfer uninvested cash balances into a joint trading account. These balances are invested in one or more repurchase agreements that are collateralized by U.S. Treasury or Agency obligations.
Income Tax Status — It is the fund’s policy to distribute substantially all net investment income and net realized gains to shareholders and to otherwise qualify as a regulated investment company under provisions of the Internal Revenue Code. Accordingly, no provision has been made for income taxes. The fund files U.S. federal, state, local and non-U.S. tax returns as applicable. The fund’s tax returns are subject to examination by the relevant taxing authority until expiration of the applicable statute of limitations, which is
generally three years from the date of filing but can be longer in certain jurisdictions. At this time, management believes there are no uncertain tax positions which, based on their technical merit, would not be sustained upon examination and for which it is reasonably possible that the total amounts of unrecognized tax benefits will significantly change in the next twelve months.
Multiple Class — All shares of the fund represent an equal pro rata interest in the net assets of the class to which such shares belong, and have identical voting, dividend, liquidation and other rights and the same terms and conditions, except for class specific expenses and exclusive rights to vote on matters affecting only individual classes. Income, non-class specific expenses, and realized and unrealized capital gains and losses of the fund are allocated to each class of shares based on their relative net assets.
Distributions to Shareholders — Distributions from net investment income and net realized gains, if any, are generally declared and paid annually. The fund may make distributions on a more frequent basis to comply with the distribution requirements of the Internal Revenue Code, in all events in a manner consistent with provisions of the 1940 Act.
Redemption — The fund may impose a 2.00% redemption fee on shares held less than 60 days. The fee may not be applicable to all classes. The redemption fee is retained by the fund and helps cover transaction costs that long-term investors may bear when the fund sells securities to meet investor redemptions.
Indemnifications — Under the corporation’s organizational documents, its officers and directors are indemnified against certain liabilities arising out of the performance of their duties to the fund. In addition, in the normal course of business, the fund enters into contracts that provide general indemnifications. The maximum exposure under these arrangements is unknown as this would involve future claims that may be made against a fund. The risk of material loss from such claims is considered by management to be remote.
3. Fees and Transactions with Related Parties
Management Fees — The corporation has entered into a management agreement with ACIM, under which ACIM provides the fund with investment advisory and management services in exchange for a single, unified management fee (the fee) per class. The agreement provides that all expenses of managing and operating the fund, except distribution and service fees, brokerage expenses, taxes, interest, fees and expenses of the independent directors (including legal counsel fees), and extraordinary expenses, will be paid by ACIM. The fee is computed and accrued daily based on each class’s daily net assets and paid monthly in arrears. The rate of the fee is determined by applying a fee rate calculation formula. This formula takes into account the fund’s assets as well as certain assets, if any, of other clients of the investment advisor outside the American Century Investments family of funds (such as subadvised funds and separate accounts) that have very similar investment teams and investment strategies (strategy assets). The annual management fee schedule ranges from 1.100% to 1.300% for the Investor Class, A Class, C Class and R Class. The annual management fee schedule ranges from 0.900% to 1.100% for the Institutional Class and 0.750% to 0.950% for the R6 Class. The effective annual management fee for each class for the period ended November 30, 2013 was 1.30% for the Investor Class, A Class, C Class and R Class, 1.10% for the Institutional Class and 0.95% for the R6 Class.
Distribution and Service Fees — The Board of Directors has adopted a separate Master Distribution and Individual Shareholder Services Plan for each of the A Class, C Class and R Class (collectively the plans), pursuant to Rule 12b-1 of the 1940 Act. The plans provide that the A Class will pay American Century Investment Services, Inc. (ACIS) an annual distribution and service fee of 0.25%. The plans provide that the C Class will pay ACIS an annual distribution and service fee of 1.00%, of which 0.25% is paid for individual shareholder services and 0.75% is paid for distribution services. The plans provide that the R Class will pay ACIS an annual distribution and service fee of 0.50%. The fees are computed and accrued daily based on each class’s daily net assets and paid monthly in arrears. The fees are used to pay financial intermediaries for distribution and individual shareholder services. Fees incurred under the plans during the year ended November 30, 2013 are detailed in the Statement of Operations.
Acquired Fund Fees and Expenses — The fund may invest in mutual funds, exchange-traded funds, and business development companies (the acquired funds). The fund will indirectly realize its pro rata share of the fees and expenses of the acquired funds in which it invests. These indirect fees and expenses are not paid out of the fund’s assets but are reflected in the return realized by the fund on its investment in the acquired funds.
Related Parties — Certain officers and directors of the corporation are also officers and/or directors of American Century Companies, Inc. (ACC). The corporation’s investment advisor, ACIM, the corporation’s distributor, ACIS, and the corporation’s transfer agent, American Century Services, LLC, are wholly owned, directly or indirectly, by ACC.
4. Investment Transactions
Purchases and sales of investment securities, excluding short-term investments, for the year ended November 30, 2013 were $28,677,273 and $24,573,643, respectively.
5. Capital Share Transactions
Transactions in shares of the fund were as follows:
Year ended November 30, 2013(1) | Year ended November 30, 2012 | |||||||||||||||
Shares | Amount | Shares | Amount | |||||||||||||
Investor Class/Shares Authorized | 20,000,000 | 55,000,000 | ||||||||||||||
Sold | 966,244 | $ 7,876,534 | 436,979 | $ 3,041,176 | ||||||||||||
Issued in reinvestment of distributions | 43,565 | 336,754 | 26,559 | 184,322 | ||||||||||||
Redeemed | (420,477 | ) | (3,411,416 | ) | (426,926 | ) | (2,919,238 | ) | ||||||||
| 589,332 | 4,801,872 | 36,612 | 306,260 | |||||||||||||
Institutional Class/Shares Authorized | 5,000,000 | 55,000,000 | ||||||||||||||
Sold | 52,897 | 452,810 | 23,213 | 160,070 | ||||||||||||
Issued in reinvestment of distributions | 1,147 | 8,858 | 744 | 5,151 | ||||||||||||
Redeemed | (60 | ) | (487 | ) | (27,852 | ) | (184,191 | ) | ||||||||
| 53,984 | 461,181 | (3,895 | ) | (18,970 | ) | |||||||||||
A Class/Shares Authorized | 25,000,000 | 45,000,000 | ||||||||||||||
Sold | 354,167 | 2,849,895 | 433,036 | 3,041,411 | ||||||||||||
Issued in reinvestment of distributions | 47,564 | 370,051 | 32,778 | 228,789 | ||||||||||||
Redeemed | (580,391 | ) | (4,601,535 | ) | (595,050 | ) | (4,063,386 | ) | ||||||||
| (178,660 | ) | (1,381,589 | ) | (129,236 | ) | (793,186 | ) | |||||||||
C Class/Shares Authorized | 10,000,000 | 10,000,000 | ||||||||||||||
Sold | 65,495 | 533,407 | 53,195 | 372,895 | ||||||||||||
Issued in reinvestment of distributions | 4,183 | 32,584 | 1,418 | 9,913 | ||||||||||||
Redeemed | (36,560 | ) | (295,562 | ) | (29,947 | ) | (208,734 | ) | ||||||||
| 33,118 | 270,429 | 24,666 | 174,074 | |||||||||||||
R Class/Shares Authorized | 5,000,000 | 5,000,000 | ||||||||||||||
Sold | 4,680 | 37,488 | 13,662 | 96,454 | ||||||||||||
Issued in reinvestment of distributions | 1,014 | 7,869 | 488 | 3,397 | ||||||||||||
Redeemed | (10,888 | ) | (90,116 | ) | (9,996 | ) | (68,745 | ) | ||||||||
| (5,194 | ) | (44,759 | ) | 4,154 | 31,106 | |||||||||||
R6 Class/Shares Authorized | 50,000,000 | N/A | ||||||||||||||
Sold | 3,045 | 25,000 | ||||||||||||||
Net increase (decrease) | 495,625 | $ 4,132,134 | (67,699 | ) | $ (300,716 | ) | ||||||||||
(1) | July 26, 2013 (commencement of sale) through November 30, 2013 for the R6 Class. |
6. Fair Value Measurements
The fund’s investments valuation process is based on several considerations and may use multiple inputs to determine the fair value of the investments held by the fund. In conformity with accounting principles generally accepted in the United States of America, the inputs used to determine a valuation are classified into three broad levels.
• | Level 1 valuation inputs consist of unadjusted quoted prices in an active market for identical investments. |
• | Level 2 valuation inputs consist of direct or indirect observable market data (including quoted prices for comparable investments, evaluations of subsequent market events, interest rates, prepayment speeds, credit risk, etc.). These inputs also consist of quoted prices for identical investments initially expressed in local currencies that are adjusted through translation into U.S. dollars. |
• | Level 3 valuation inputs consist of unobservable data (including a fund’s own assumptions). |
The level classification is based on the lowest level input that is significant to the fair valuation measurement. The valuation inputs are not necessarily an indication of the risks associated with investing in these securities or other financial instruments.
The following is a summary of the level classifications as of period end. The Schedule of Investments provides additional information on the fund’s portfolio holdings.
Level 1 | Level 2 | Level 3 | |
Assets | |||
Investment Securities | |||
Common Stocks | — | $35,727,226 | — |
Exchange-Traded Funds | $549,603 | — | — |
Temporary Cash Investments | 178,401 | 216,434 | — |
Total Value of Investment Securities | $728,004 | $35,943,660 | — |
7. Risk Factors
There are certain risks involved in investing in foreign securities. These risks include those resulting from future adverse political, social and economic developments, fluctuations in currency exchange rates, the possible imposition of exchange controls, and other foreign laws or restrictions. Investing in emerging markets may accentuate these risks.
8. Federal Tax Information
The tax character of distributions paid during the years ended November 30, 2013 and November 30, 2012 were as follows:
2013 | 2012 | |
Distributions Paid From | ||
Ordinary income | $781,022 | $440,026 |
Long-term capital gains | — | — |
The book-basis character of distributions made during the year from net investment income or net realized gains may differ from their ultimate characterization for federal income tax purposes. These differences reflect the differing character of certain income items and net realized gains and losses for financial statement and tax purposes, and may result in reclassification among certain capital accounts on the financial statements.
As of November 30, 2013, the federal tax cost of investments and the components of distributable earnings on a tax-basis were as follows:
Federal tax cost of investments | $31,058,474 |
Gross tax appreciation of investments | $6,048,641 |
Gross tax depreciation of investments | (435,451) |
Net tax appreciation (depreciation) of investments | $5,613,190 |
Net tax appreciation (depreciation) on translation of assets and liabilities in foreign currencies | $ 9,393 |
Net tax appreciation (depreciation) | $5,622,583 |
Undistributed ordinary income | $727,919 |
Accumulated short-term capital losses | $(4,327,914) |
The difference between book-basis and tax-basis unrealized appreciation (depreciation) is attributable primarily to the tax deferral of losses on wash sales.
Accumulated capital losses represent net capital loss carryovers that may be used to offset future realized capital gains for federal income tax purposes. Future capital loss carryover utilization in any given year may be subject to Internal Revenue Code limitations. Capital loss carryovers expire in 2017.
Financial Highlights |
For a Share Outstanding Throughout the Years Ended November 30 (except as noted) | |||||||||||
Per-Share Data | Ratios and Supplemental Data | ||||||||||
Income From Investment Operations: | Ratio to Average Net Assets of: | ||||||||||
Net Asset | Net Income | Net | Total From Investment Operations | Distributions Investment Income | Net Asset | Total | Operating Expenses | Net Income | Portfolio | Net Assets, | |
Investor Class | |||||||||||
2013 | $7.40 | 0.21 | 1.60 | 1.81 | (0.24) | $8.97 | 24.96% | 1.31% | 2.63% | 83% | $17,920 |
2012 | $6.84 | 0.20 | 0.49 | 0.69 | (0.13) | $7.40 | 10.25% | 1.31% | 2.95% | 125% | $10,423 |
2011 | $6.91 | 0.14 | (0.09) | 0.05 | (0.12) | $6.84 | 0.57% | 1.31% | 1.85% | 30% | $9,391 |
2010 | $7.33 | 0.11 | (0.24) | (0.13) | (0.29) | $6.91 | (1.82)% | 1.32% | 1.66% | 26% | $7,272 |
2009 | $5.47 | 0.11 | 1.88 | 1.99 | (0.13) | $7.33 | 36.98% | 1.31% | 2.34% | 16% | $7,062 |
Institutional Class | |||||||||||
2013 | $7.39 | 0.23 | 1.59 | 1.82 | (0.25) | $8.96 | 25.24% | 1.11% | 2.83% | 83% | $769 |
2012 | $6.84 | 0.23 | 0.47 | 0.70 | (0.15) | $7.39 | 10.33% | 1.11% | 3.15% | 125% | $235 |
2011 | $6.90 | 0.15 | (0.07) | 0.08 | (0.14) | $6.84 | 0.92% | 1.11% | 2.05% | 30% | $244 |
2010 | $7.34 | 0.13 | (0.25) | (0.12) | (0.32) | $6.90 | (1.69)% | 1.12% | 1.86% | 26% | $1,456 |
2009 | $5.48 | 0.18 | 1.82 | 2.00 | (0.14) | $7.34 | 37.18% | 1.11% | 2.54% | 16% | $1,627 |
A Class | |||||||||||
2013 | $7.43 | 0.20 | 1.60 | 1.80 | (0.22) | $9.01 | 24.67% | 1.56% | 2.38% | 83% | $15,554 |
2012 | $6.87 | 0.19 | 0.48 | 0.67 | (0.11) | $7.43 | 9.91% | 1.56% | 2.70% | 125% | $14,155 |
2011 | $6.93 | 0.12 | (0.08) | 0.04 | (0.10) | $6.87 | 0.45% | 1.56% | 1.60% | 30% | $13,981 |
2010 | $7.33 | 0.10 | (0.24) | (0.14) | (0.26) | $6.93 | (2.04)% | 1.57% | 1.41% | 26% | $15,783 |
2009 | $5.48 | 0.10 | 1.86 | 1.96 | (0.11) | $7.33 | 36.40% | 1.56% | 2.09% | 16% | $18,644 |
For a Share Outstanding Throughout the Years Ended November 30 (except as noted) | |||||||||||
Per-Share Data | Ratios and Supplemental Data | ||||||||||
Income From Investment Operations: | Ratio to Average Net Assets of: | ||||||||||
Net Asset | Net Income | Net | Total From Investment Operations | Distributions Investment Income | Net Asset | Total | Operating Expenses | Net Income | Portfolio | Net Assets, | |
C Class | |||||||||||
2013 | $7.40 | 0.14 | 1.59 | 1.73 | (0.16) | $8.97 | 23.68% | 2.31% | 1.63% | 83% | $2,009 |
2012 | $6.84 | 0.13 | 0.49 | 0.62 | (0.06) | $7.40 | 9.10% | 2.31% | 1.95% | 125% | $1,412 |
2011 | $6.90 | 0.06 | (0.08) | (0.02) | (0.04) | $6.84 | (0.31)% | 2.31% | 0.85% | 30% | $1,137 |
2010 | $7.25 | 0.05 | (0.25) | (0.20) | (0.15) | $6.90 | (2.85)% | 2.32% | 0.66% | 26% | $1,039 |
2009 | $5.42 | 0.05 | 1.85 | 1.90 | (0.07) | $7.25 | 35.44% | 2.31% | 1.34% | 16% | $869 |
R Class | |||||||||||
2013 | $7.40 | 0.18 | 1.59 | 1.77 | (0.20) | $8.97 | 24.32% | 1.81% | 2.13% | 83% | $297 |
2012 | $6.84 | 0.17 | 0.49 | 0.66 | (0.10) | $7.40 | 9.67% | 1.81% | 2.45% | 125% | $283 |
2011 | $6.90 | 0.10 | (0.08) | 0.02 | (0.08) | $6.84 | 0.20% | 1.81% | 1.35% | 30% | $234 |
2010 | $7.28 | 0.09 | (0.25) | (0.16) | (0.22) | $6.90 | (2.27)% | 1.82% | 1.16% | 26% | $273 |
2009 | $5.45 | 0.09 | 1.84 | 1.93 | (0.10) | $7.28 | 35.90% | 1.81% | 1.84% | 16% | $123 |
R6 Class | |||||||||||
2013(3) | $8.21 | 0.06 | 0.69 | 0.75 | — | $8.96 | 9.14% | 0.96%(4) | 2.02%(4) | 83%(5) | $27 |
Notes to Financial Highlights
(1) | Computed using average shares outstanding throughout the period. |
(2) | Total returns are calculated based on the net asset value of the last business day and do not reflect applicable sales charges, if any. Total returns for periods less than one year are not annualized. |
(3) | July 26, 2013 (commencement of sale) through November 30, 2013. |
(4) | Annualized. |
(5) | Portfolio turnover is calculated at the fund level. Percentage indicated was calculated for the year ended November 30, 2013. |
See Notes to Financial Statements.
Report of Independent Registered Public Accounting Firm |
To the Board of Directors and Shareholders of
American Century World Mutual Funds, Inc.:
We have audited the accompanying statement of assets and liabilities, including the schedule of investments, of International Value Fund (the “Fund”), one of the funds constituting American Century World Mutual Funds, Inc., as of November 30, 2013, and the related statement of operations for the year then ended, the statements of changes in net assets for each of the two years in the period then ended, and the financial highlights for each of the periods presented. These financial statements and financial highlights are the responsibility of the Fund’s management. Our responsibility is to express an opinion on these financial statements and financial highlights based on our audits.
We conducted our audits in accordance with the standards of the Public Company Accounting Oversight Board (United States). Those standards require that we plan and perform the audit to obtain reasonable assurance about whether the financial statements and financial highlights are free of material misstatement. The Fund is not required to have, nor were we engaged to perform, an audit of its internal control over financial reporting. Our audits included consideration of internal control over financial reporting as a basis for designing audit procedures that are appropriate in the circumstances, but not for the purpose of expressing an opinion on the effectiveness of the Fund’s internal control over financial reporting. Accordingly, we express no such opinion. An audit also includes examining, on a test basis, evidence supporting the amounts and disclosures in the financial statements, assessing the accounting principles used and significant estimates made by management, as well as evaluating the overall financial statement presentation. Our procedures included confirmation of securities owned as of November 30, 2013, by correspondence with the custodian and brokers; where replies were not received from brokers, we performed other auditing procedures. We believe that our audits provide a reasonable basis for our opinion.
In our opinion, the financial statements and financial highlights referred to above present fairly, in all material respects, the financial position of International Value Fund of American Century World Mutual Funds, Inc. as of November 30, 2013, the results of its operations for the year then ended, the changes in its net assets for each of the two years in the period then ended, and the financial highlights for each of the periods presented, in conformity with accounting principles generally accepted in the United States of America.
Deloitte & Touche LLP
Kansas City, Missouri
January 17, 2014
Management |
The Board of Directors
The individuals listed below serve as directors of the funds. Each director will continue to serve in this capacity until death, retirement, resignation or removal from office. The board has adopted a mandatory retirement age for directors who are not “interested persons,” as that term is defined in the Investment Company Act (independent directors). Independent directors shall retire by December 31 of the year in which they reach their 75th birthday. Mr. Pratt may serve until December 31 of the year in which he reaches his 76th birthday based on an extension granted under previous retirement guidelines.
Mr. Thomas is an “interested person” because he currently serves as President and Chief Executive Officer of American Century Companies, Inc. (ACC), the parent company of American Century Investment Management, Inc. (ACIM or the advisor). Mr. Fink is treated as an “interested person” because of his recent employment with ACC and American Century Services, LLC (ACS). The other directors (more than three-fourths of the total number) are independent. They are not employees, directors or officers of, and have no financial interest in, ACC or any of its wholly owned, direct or indirect, subsidiaries, including ACIM, American Century Investment Services, Inc. (ACIS) and ACS, and do not have any other affiliations, positions, or relationships that would cause them to be considered “interested persons” under the Investment Company Act. The directors serve in this capacity for seven (in the case of Mr. Thomas, 15) registered investment companies in the American Century Investments family of funds.
The following table presents additional information about the directors. The mailing address for each director is 4500 Main Street, Kansas City, Missouri 64111.
Name | Position(s) Held with Funds | Length Served | Principal Occupation(s) During Past 5 Years | Number of American Century Portfolios Overseen | Other Directorships Held During Past 5 Years | |
Independent Directors | ||||||
Thomas A. Brown (1940) | Director | Since 1980 | Managing Member, Associated Investments, LLC (real estate investment company); Brown Cascade Properties, LLC (real estate investment company) (2001 to 2009) | 75 | None | |
Andrea C. Hall (1945) | Director | Since 1997 | Retired | 75 | None | |
Jan M. Lewis (1957) | Director | Since 2011 | President and Chief Executive Officer, Catholic Charities of Northeast Kansas (human services organization) | 75 | None | |
James A. Olson (1942) | Director | Since 2007 | Member, Plaza Belmont LLC (private equity fund manager) | 75 | Saia, Inc. (2002 to 2012) and EPR Properties (2003 to 2013) | |
Donald H. Pratt(1) (1937) | Director and Chairman of the Board | Since 1995 (Chairman since 2005) | Chairman and Chief Executive Officer, Western Investments, Inc. (real estate company) | 75 | None | |
Name | Position(s) Held with Funds | Length Served | Principal Occupation(s) During Past 5 Years | Number of American Century Portfolios Overseen | Other Directorships Held During Past 5 Years | |
Independent Directors | ||||||
M. Jeannine Strandjord | Director | Since 1994 | Retired | 75 | Euronet Worldwide Inc.; Charming Shoppes, Inc. (2006 to 2010); and DST Systems Inc. (1996 to 2012) | |
John R. Whitten (1946) | Director | Since 2008 | Retired | 75 | Rudolph Technologies, Inc. | |
Stephen E. Yates (1948) | Director | Since 2012 | Retired; Executive Vice President, Technology & Operations, KeyCorp. (computer services) (2004 to 2010) | 75 | Applied Industrial Technologies, Inc. (2001 to 2010) | |
Interested Directors | ||||||
Barry Fink | Director | Since 2012 | Retired; Executive Vice President, ACC (September 2007 to February 2013); President, ACS (October 2007 to February 2013); Chief Operating Officer, ACC (September 2007 to November 2012) | 75 | None | |
Jonathan S. Thomas | Director and President | Since 2007 | President and Chief Executive Officer, ACC (March 2007 to present). Also serves as Chief Executive Officer and Manager, ACS; Executive Vice President, ACIM; Director, ACC, ACIM and other ACC subsidiaries | 117 | None | |
(1) | Donald H. Pratt will retire as Director and Chairman of the Board effective December 31, 2013. |
Officers
The following table presents certain information about the executive officers of the funds. Each officer serves as an officer for each of the 15 investment companies in the American Century family of funds, unless otherwise noted. No officer is compensated for his or her service as an officer of the funds. The listed officers are interested persons of the funds and are appointed or re-appointed on an annual basis. The mailing address for each officer listed below is 4500 Main Street, Kansas City, Missouri 64111.
Name | Offices with the Funds | Principal Occupation(s) During the Past Five Years |
Jonathan S. Thomas | Director and President since 2007 | President and Chief Executive Officer, ACC (March 2007 to present). Also serves as Chief Executive Officer and Manager, ACS; Executive Vice President, ACIM; Director, ACC, ACIM and other ACC subsidiaries |
Maryanne L. Roepke | Chief Compliance Officer since 2006 and Senior Vice President since 2000 | Chief Compliance Officer, American Century funds, ACIM and ACS (August 2006 to present). Also serves as Senior Vice President, ACS |
Charles A. Etherington (1957) | General Counsel since 2007 and Senior Vice President since 2006 | Attorney, ACC (February 1994 to present); Vice President, ACC (November 2005 to present); General Counsel, ACC (March 2007 to present). Also serves as General Counsel, ACIM, ACS, ACIS and other ACC subsidiaries; and Senior Vice President, ACIM and ACS |
C. Jean Wade (1964) | Vice President, Treasurer and Chief Financial Officer since 2012 | Vice President, ACS (February 2000 to present) |
Robert J. Leach (1966) | Vice President since 2006 and Assistant Treasurer since 2012 | Vice President, ACS (February 2000 to present) |
David H. Reinmiller (1963) | Vice President since 2000 | Attorney, ACC (January 1994 to present); Associate General Counsel, ACC (January 2001 to present). Also serves as Vice President, ACIM and ACS |
Ward D. Stauffer (1960) | Secretary since 2005 | Attorney, ACC (June 2003 to present) |
The Statement of Additional Information has additional information about the fund’s directors and is available without charge, upon request, by calling 1-800-345-2021.
Approval of Management Agreement |
At a meeting held on June 20, 2013, the Fund’s Board of Directors unanimously approved the renewal of the management agreement pursuant to which American Century Investment Management, Inc. (the “Advisor”) acts as the investment advisor for the Fund. Under Section 15(c) of the Investment Company Act, contracts for investment advisory services are required to be reviewed, evaluated, and approved by a majority of a fund’s directors (the “Directors”), including a majority of the independent Directors, each year.
Prior to its consideration of the renewal of the management agreement, the Board requested and reviewed extensive data and information compiled by the Advisor and certain independent providers of evaluation data concerning the Fund and the services provided to the Fund by the Advisor. This review was in addition to the oversight and evaluation undertaken by the Board and its committees on a continuous basis throughout the year.
In connection with its consideration of the renewal of the management agreement, the Board’s review and evaluation of the services provided by the Advisor included, but was not limited to, the following:
• | the nature, extent, and quality of investment management, shareholder services, and other services provided by the Advisor to the Fund; |
• | the wide range of other programs and services the Advisor provides to the Fund and its shareholders on a routine and non-routine basis; |
• | the investment performance of the Fund, including data comparing the Fund’s performance to appropriate benchmarks and/or a peer group of other mutual funds with similar investment objectives and strategies; |
• | data comparing the cost of owning the Fund to the cost of owning similar funds; |
• | the Advisor’s compliance policies, procedures, and regulatory experience; |
• | financial data showing the cost of services provided to the Fund, the profitability of the Fund to the Advisor, and the overall profitability of the Advisor; |
• | possible economies of scale associated with the Advisor’s management of the Fund and other accounts under its management; |
• | data comparing services provided and charges to other investment management clients of the Advisor; and |
• | consideration of collateral benefits derived by the Advisor from the management of the Fund. |
In keeping with its practice, the Board held two in-person meetings and one telephonic meeting to review and discuss the information provided. The Directors also had the benefit of the advice of independent counsel throughout the period.
Factors Considered
The Directors considered all of the information provided by the Advisor, the independent data providers, and independent counsel, and evaluated such information for the Fund. In connection with their review, the Directors did not identify any single factor as being all-important or controlling, and each Director may have attributed different levels of importance to different factors. In deciding to renew the management agreement, the Board based its decision on a number of factors, including the following:
Nature, Extent and Quality of Services — Generally. Under the management agreement, the Advisor is responsible for providing or arranging for all services necessary for the operation of the Fund. The Board noted that under the management agreement, the Advisor provides or arranges at its own expense a wide variety of services including:
• | constructing and designing the Fund |
• | portfolio research and security selection |
• | initial capitalization/funding |
• | securities trading |
• | Fund administration |
• | custody of Fund assets |
• | daily valuation of the Fund’s portfolio |
• | shareholder servicing and transfer agency, including shareholder confirmations, recordkeeping, and communications |
• | legal services |
• | regulatory and portfolio compliance |
• | financial reporting |
• | marketing and distribution |
The Board noted that many of these services have expanded over time both in terms of quantity and complexity in response to shareholder demands, competition in the industry, changing distribution channels, and the changing regulatory environment.
Investment Management Services. The nature of the investment management services provided to the Fund is quite complex and allows Fund shareholders access to professional money management, instant diversification of their investments within an asset class, the opportunity to easily diversify among asset classes by investing in or exchanging among various American Century Investments funds, and liquidity. In evaluating investment performance, the Board expects the Advisor to manage the Fund in accordance with its investment objectives and approved strategies. Further, the Directors recognize that the Advisor has
an obligation to monitor trading activities, and in particular to seek the best execution of fund trades, and to evaluate the use of and payment for research. In providing these services, the Advisor utilizes teams of investment professionals (portfolio managers, analysts, research assistants, and securities traders) who require extensive information technology, research, training, compliance and other systems to conduct their business. The Board, directly and through its Fund Performance Review Committee, regularly reviews investment performance information for the Fund, together with comparative information for appropriate benchmarks and/or peer groups of similarly-managed funds, over different time horizons. The Directors also review detailed performance information during the management agreement approval process. If performance concerns are identified, the Fund receives special reviews until performance improves, during which the Board discusses with the Advisor the reasons for such results (e.g., market conditions, security selection) and any efforts being undertaken to improve performance. Taking all these factors into consideration, the Board found the investment management services provided by the Advisor to the Fund to meet or exceed industry standards. More detailed information about the Fund’s performance can be found in the Performance and Portfolio Commentary sections of this report.
Shareholder and Other Services. Under the management agreement, the Advisor provides the Fund with a comprehensive package of transfer agency, shareholder, and other services. The Board, directly and through various committees of the Board, regularly reviews reports and evaluations of such services at its regular meetings. These reports include, but are not limited to, information regarding the operational efficiency and accuracy of the shareholder and transfer agency services provided, staffing levels, shareholder satisfaction (as measured by external as well as internal sources), technology support, new products and services offered to Fund shareholders, securities trading activities, portfolio valuation services, auditing services, and legal and operational compliance activities. Certain aspects of shareholder and transfer agency service level efficiency and the quality of securities trading activities are measured by independent third party providers and are presented in comparison to other fund groups not managed by the Advisor. The Board found the services provided by the Advisor to the Fund under the management agreement to be competitive and of high quality.
Costs of Services and Profitability. The Advisor provides detailed information concerning its cost of providing various services to the Fund, its profitability in managing the Fund, its overall profitability, and its financial condition. The Directors have reviewed with the Advisor the methodology used to prepare this financial information. The financial information regarding the Advisor is considered in evaluating the Advisor’s financial condition, its ability to continue to provide services under the management agreement, and the reasonableness of the current management fee. The Board concluded that the Advisor’s profits were reasonable in light of the services provided to the Fund.
Ethics. The Board generally considers the Advisor’s commitment to providing quality services to shareholders and to conducting its business ethically. They noted that the Advisor’s practices generally meet or exceed industry best practices.
Economies of Scale. The Board also reviewed information provided by the Advisor regarding the possible existence of economies of scale in connection with the management of the Fund. The Board concluded that economies of scale are difficult to measure and predict with precision, especially on a fund-by-fund basis. The Board concluded that the Advisor is appropriately sharing economies of scale through its competitive fee structure, offering competitive fees from fund inception, and through reinvestment in its business to provide shareholders additional content and services.
Comparison to Other Funds’ Fees. The management agreement provides that the Fund pay the Advisor a single, all-inclusive (or unified) management fee for providing all services necessary for the management and operation of the Fund, other than brokerage expenses, taxes, interest, extraordinary expenses, and the fees and expenses of the Fund’s independent directors (including their independent legal counsel) and expenses incurred in connection with the provision of shareholder services and distribution services under a plan adopted pursuant to Rule 12b-1 under the 1940 Act. Under the unified fee structure, the Advisor is responsible for providing all investment advisory, custody, audit, administrative, compliance, recordkeeping, marketing and shareholder services, or arranging and supervising third parties to provide such services. By contrast, most other funds are charged a variety of fees, including an investment advisory fee, a transfer agency fee, an administrative fee, distribution charges and other expenses. Other than their investment advisory fees and any applicable Rule 12b-1 distribution fees, all other components of the total fees charged by these other funds may be increased without shareholder approval. The Board believes the unified fee structure is a benefit to Fund shareholders because it clearly discloses to shareholders the cost of owning Fund shares, and, since the unified fee cannot be increased without a vote of Fund shareholders, it shifts to the Advisor the risk of increased costs of operating the Fund and provides a direct incentive to minimize administrative inefficiencies. Part of the Board’s analysis of fee levels involves reviewing certain evaluative data compiled by an independent provider and comparing the Fund’s unified fee to the total expense ratio of other funds in the Fund’s peer group. The Board concluded that the management fee paid by the Fund to the Advisor under the management agreement is reasonable in light of the services provided to the Fund.
Comparison to Fees and Services Provided to Other Clients of the Advisor. The Board also requested and received information from the Advisor concerning the nature of the services, fees, costs and profitability of its advisory services to advisory clients other than the Fund. They observed that these varying types of client accounts require different services and involve different regulatory and entrepreneurial risks than the management of the Fund. The Board analyzed this information and concluded that the fees charged and services provided to the Fund were reasonable by comparison.
Collateral or “Fall-Out” Benefits Derived by the Advisor. The Board considered the existence of collateral benefits the Advisor may receive as a result of its relationship with the Fund. They concluded that the Advisor’s primary business is managing mutual funds and it generally does not use fund or shareholder information to generate profits in other lines of business, and therefore does not derive any significant collateral benefits from them. The Board noted that the Advisor receives proprietary research from broker-dealers that execute fund portfolio transactions and concluded that this research is likely to benefit Fund
shareholders. The Board also determined that the Advisor is able to provide investment management services to certain clients other than the Fund, at least in part, due to its existing infrastructure built to serve the fund complex. The Board concluded, however, that the assets of those other clients are not material to the analysis and, where applicable, may be included with the assets of the Fund to determine breakpoints in the management fee schedule.
Existing Relationship. The Board also considered whether there was any reason for not continuing the existing arrangement with the Advisor. In this regard, the Board was mindful of the potential disruptions of the Fund’s operations and various risks, uncertainties, and other effects that could occur as a result of a decision not to continue such relationship. In particular, the Board recognized that most shareholders have invested in the Fund on the strength of the Advisor’s industry standing and reputation and in the expectation that the Advisor will have a continuing role in providing advisory services to the Fund.
Conclusion of the Directors. As a result of this process, the Board, including all of the independent directors, taking into account all of the factors discussed above and the information provided by the Advisor and others, concluded that the management agreement between the Fund and the Advisor is fair and reasonable in light of the services provided and should be renewed.
Additional Information |
Retirement Account Information
As required by law, distributions you receive from certain IRAs are subject to federal income tax withholding, unless you elect not to have withholding apply. Tax will be withheld on the total amount withdrawn even though you may be receiving amounts that are not subject to withholding, such as nondeductible contributions. In such case, excess amounts of withholding could occur. You may adjust your withholding election so that a greater or lesser amount will be withheld.
If you don’t want us to withhold on this amount, you must notify us to not withhold the federal income tax. You may notify us in writing or in certain situations by telephone or through other electronic means. For systematic withdrawals, your withholding election will remain in effect until revoked or changed by filing a new election. You have the right to revoke your election at any time.
Remember, even if you elect not to have income tax withheld, you are liable for paying income tax on the taxable portion of your withdrawal. If you elect not to have income tax withheld or you don’t have enough income tax withheld, you may be responsible for payment of estimated tax. You may incur penalties under the estimated tax rules if your withholding and estimated tax payments are not sufficient. You can reduce or defer the income tax on a distribution by directly or indirectly rolling such distribution over to another IRA or eligible plan. You should consult your tax advisor for additional information.
State tax will be withheld if, at the time of your distribution, your address is within one of the mandatory withholding states and you have federal income tax withheld (or as otherwise required by state law). State taxes will be withheld from your distribution in accordance with the respective state rules.
Distributions you receive from 403(b), 457 and qualified plans are subject to special tax and withholding rules. Your plan administrator or plan sponsor is required to provide you with a special tax notice explaining those rules at the time you request a distribution. If applicable, federal and/or state taxes may be withheld from your distribution amount.
Proxy Voting Policies
A description of the policies that the fund’s investment advisor uses in exercising the voting rights associated with the securities purchased and/or held by the fund is available without charge, upon request, by calling 1-800-345-2021. It is also available on the “About Us” page of American Century Investments’ website at americancentury.com and on the Securities and Exchange Commission’s website at sec.gov. Information regarding how the investment advisor voted proxies relating to portfolio securities during the most recent 12-month period ended June 30 is available on the “About Us” page at americancentury.com. It is also available at sec.gov.
Quarterly Portfolio Disclosure
The fund files its complete schedule of portfolio holdings with the Securities and Exchange Commission (SEC) for the first and third quarters of each fiscal year on Form N-Q. The fund’s Forms N-Q are available on the SEC’s website at sec.gov, and may be reviewed and copied at the SEC’s Public Reference Room in Washington, DC. Information on the operation of the Public Reference Room may be obtained by calling 1-800-SEC-0330. The fund also makes its complete schedule of portfolio holdings for the most recent quarter of its fiscal year available on its website at americancentury.com and, upon request, by calling 1-800-345-2021.
Other Tax Information
The following information is provided pursuant to provisions of the Internal Revenue Code.
The fund hereby designates up to the maximum amount allowable as qualified dividend income for the fiscal year ended November 30, 2013.
For the fiscal year ended November 30, 2013, the fund intends to pass through to shareholders $77,698, or up to the maximum amount allowable, as a foreign tax credit which represents taxes paid on income derived from sources within foreign countries or possessions of the United States. During the fiscal year ended November 30, 2013, the fund earned $1,258,615 from income derived from foreign sources. Foreign source income and foreign tax expense per outstanding share on November 30, 2013 are $0.3092 and $0.0191, respectively.
Notes |
![]()
Contact Us | americancentury.com |
Automated Information Line | 1-800-345-8765 |
Investor Services Representative | 1-800-345-2021 |
Investors Using Advisors | 1-800-378-9878 |
Business, Not-For-Profit, Employer-Sponsored Retirement Plans | 1-800-345-3533 |
Banks and Trust Companies, Broker-Dealers, Financial Professionals, Insurance Companies | 1-800-345-6488 |
Telecommunications Relay Service for the Deaf | 711 |
American Century World Mutual Funds, Inc.
Investment Advisor:
American Century Investment Management, Inc.
Kansas City, Missouri
This report and the statements it contains are submitted for the general information of our shareholders. The report is not authorized for distribution to prospective investors unless preceded or accompanied by an effective prospectus.
©2014 American Century Proprietary Holdings, Inc. All rights reserved.
CL-ANN-80786 1401
ANNUAL REPORT | NOVEMBER 30, 2013 |
NT International Growth Fund
Table of Contents |
President’s Letter | 2 |
Market Perspective | 3 |
Performance | 4 |
Portfolio Commentary | 5 |
Fund Characteristics | 7 |
Shareholder Fee Example | 8 |
Schedule of Investments | 10 |
Statement of Assets and Liabilities | 13 |
Statement of Operations | 14 |
Statement of Changes in Net Assets | 15 |
Notes to Financial Statements | 16 |
Financial Highlights | 21 |
Report of Independent Registered Public Accounting Firm | 22 |
Management | 23 |
Approval of Management Agreement | 26 |
Additional Information | 31 |
Any opinions expressed in this report reflect those of the author as of the date of the report, and do not necessarily represent the opinions of American Century Investments® or any other person in the American Century Investments organization. Any such opinions are subject to change at any time based upon market or other conditions and American Century Investments disclaims any responsibility to update such opinions. These opinions may not be relied upon as investment advice and, because investment decisions made by American Century Investments funds are based on numerous factors, may not be relied upon as an indication of trading intent on behalf of any American Century Investments fund. Security examples are used for representational purposes only and are not intended as recommendations to purchase or sell securities. Performance information for comparative indices and securities is provided to American Century Investments by third party vendors. To the best of American Century Investments’ knowledge, such information is accurate at the time of printing.
President’s Letter |
Jonathan Thomas
Dear Investor:
Thank you for reviewing this annual report for the 12 months ended November 30, 2013. It provides investment performance, market analysis, and portfolio information, presented with the expert perspective of our portfolio management team.
Annual reports remain important vehicles for conveying information about fund returns, including key factors that affected fund performance. For additional, updated investment and market insights, we encourage you to visit our website, americancentury.com.
Monetary Policy-Driven, “Risk-On” Results in Developed Countries
Stimulative monetary policies by central banks and slowly improving global economic conditions played a major part in financial market returns during the reporting period. The combination of an improving global economic outlook, mostly low costs of capital in the money markets, and central bank purchases of longer-maturity fixed income securities (a market liquidity-building strategy known as quantitative easing, QE) helped persuade investors to seek risk and yield, particularly in developed markets such as the U.S., Japan, and Europe. Broad stock index returns were stellar in these markets, particularly at the smaller capitalization end of the company size spectrum. Representing the broad markets, the S&P 500 and MSCI EAFE Indices returned 30.30% and 24.84%, respectively, for the reporting period, and their smaller capitalization counterparts performed even better.
At the same time, hints that QE might be tapered soon in the U.S. hampered government bond returns and emerging market stock indices. Broad emerging market stock indices posted positive single-digit returns, but government bond total returns dipped into negative territory, despite low inflation. Corporate bonds, especially high-yield corporates, generally performed better than government bonds because of their higher yields, declining spreads (yield differences between corporate and similar-maturity Treasury securities), and relatively low default rates, compared with historical averages.
As we enter 2014, there’s less uncertainty about the U.S. fiscal picture and global economic strength than a year ago, but headwinds continue. A full economic recovery from 2008 remains elusive—economic growth is still subpar compared with past recoveries. In this environment, we continue to believe in a disciplined, diversified, long-term investment approach, using professionally managed stock and bond portfolios—as appropriate—for meeting financial goals. We appreciate your continued trust in us.
Sincerely,
Jonathan Thomas
President and Chief Executive Officer
American Century Investments
Market Perspective |
By Mark Kopinski, Chief Investment Officer, Global and Non-U.S. Equity
Global Stocks Rallied to Post Double-Digit Gains
Stock market performance remained robust during the 12-month period ended November 30, 2013, with most major market indices posting double-digit gains. Despite persistent concerns about weak global growth and a slowdown in China, investors largely focused on central bank stimulus measures, marginally improving U.S. and European economic data, and relatively healthy corporate earnings, which fueled stock market optimism.
Prior to the reporting period, the U.S. Federal Reserve (the Fed) announced its third quantitative easing program (QE3). This effort, combined with similar large-scale stimulus measures from the European Central Bank (ECB) and the Bank of Japan as well as favorable corporate earnings reports, generally helped keep stocks in favor. Additionally, housing market gains in the U.S., U.K., and Australia aided the global investment landscape.
Europe, Japan were Performance Leaders
Assurances by the ECB that it would keep interest rates at historic lows for an extended period, followed by the cutting of its key lending rate to 0.25% late in the period, helped drive stock market gains in Europe. In addition, economic conditions throughout Europe improved, led by an expanding manufacturing sector, improving business and consumer sentiment, and a slowdown of the economic contraction in the peripheral countries. In the second calendar quarter of 2013, the 17-member eurozone emerged from its longest-ever recession (six consecutive quarters). Investors generally focused on these positive factors, pushing stocks higher despite the structural issues and high unemployment still plaguing the region.
In Japan, the central bank’s efforts to pull the nation out of its decades-long deflationary spiral and spark economic growth appeared to be working. Japan’s economy grew, and consumer prices increased. Late in the period, government officials announced the country’s inflation rate rose at a five-year high, suggesting their deflation-focused initiatives were gaining traction.
Overall, developed market stocks sharply outperformed their emerging market counterparts. Much of the lagging performance was due to a slower-growth environment in China. In addition, rising inflation and currency weakness weighed on many developing nations.
International Equity Total Returns | ||||
For the 12 months ended November 30, 2013 (in U.S. dollars) | ||||
MSCI EAFE Index | 24.84% | MSCI Europe Index | 25.94% | |
MSCI EAFE Growth Index | 23.45% | MSCI World Index | 26.38% | |
MSCI EAFE Value Index | 26.20% | MSCI Japan Index | 32.84% | |
MSCI Emerging Markets Index | 3.66% | |||
Performance |
Total Returns as of November 30, 2013 | |||||
Average Annual Returns | |||||
Ticker Symbol | 1 year | 5 years | Since Inception | Inception Date | |
Institutional Class | ACLNX | 24.27% | 15.55% | 4.01% | 5/12/06 |
MSCI EAFE Index | — | 24.84% | 13.41% | 2.51% | — |
MSCI EAFE Growth Index | — | 23.45% | 13.84% | 3.14% | — |
R6 Class | ACDNX | — | — | 9.43%(1) | 7/26/13 |
(1) | Total returns for periods less than one year are not annualized. |
Growth of $10,000 Over Life of Class |
$10,000 investment made May 12, 2006 |
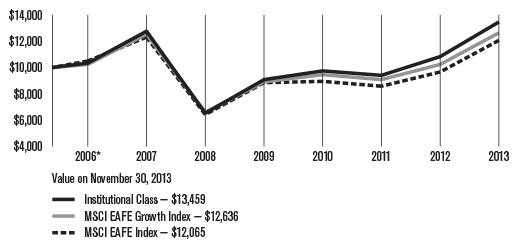
* From 5/12/06, the Institutional Class’s inception date. Not annualized.
Total Annual Fund Operating Expenses | |
Institutional Class | R6 Class |
1.09% | 0.94% |
The total annual fund operating expenses shown is as stated in the fund’s prospectus current as of the date of this report. The prospectus may vary from the expense ratio shown elsewhere in this report because it is based on a different time period, includes acquired fund fees and expenses, and, if applicable, does not include fee waivers or expense reimbursements.
Data presented reflect past performance. Past performance is no guarantee of future results. Current performance may be higher or lower than the performance shown. Investment return and principal value will fluctuate, and redemption value may be more or less than original cost. To obtain performance data current to the most recent month end, please call 1-800-345-2021 or visit americancentury.com. International investing involves special risks, such as political instability and currency fluctuations. Investing in emerging markets may accentuate these risks.
Unless otherwise indicated, performance reflects Institutional Class shares; performance for other share classes will vary due to differences in fee structure. For information about other share classes available, please consult the prospectus. Data assumes reinvestment of dividends and capital gains, and none of the charts reflect the deduction of taxes that a shareholder would pay on fund distributions or the redemption of fund shares. Returns for the indices are provided for comparison. The fund’s total returns include operating expenses (such as transaction costs and management fees) that reduce returns, while the total returns of the indices do not.
Portfolio Commentary |
Portfolio Managers: Alex Tedder and Raj Gandhi
Performance Summary
NT International Growth advanced 24.27%* for the 12 months ended November 30, 2013, compared with its benchmark, the MSCI EAFE Index, which gained 24.84%.
Developed non-U.S. stocks generally demonstrated robust performance during the 12-month period, primarily due to ongoing central bank stimulus measures, improving economic conditions in Europe, Japan, the U.K., and the U.S., and generally favorable corporate earnings. Within the developed markets, value stocks generally outperformed growth stocks, and small-cap stocks outpaced large-cap stocks.
Overall, stock selection, particularly in the energy, information technology, and materials sectors, detracted slightly from relative performance. Stock selection had a favorable influence on performance in the consumer discretionary, consumer staples, and industrials sectors. Our sector allocations were positive overall, particularly the portfolio’s overweight positions in the consumer discretionary and industrials sectors.
From a regional perspective, stock selection in Italy, along with a portfolio-only position in Taiwan and an overweight position in Norway, detracted from relative performance. At the opposite end of the spectrum, stock selection and an underweight position in the U.K., along with stock selection in Japan and Germany, contributed the most to the portfolio’s performance.
Oilfield Services Company Led Detractors
Among the portfolio’s largest performance detractors for the period was an overweight position in Saipem, an Italy-based oilfield services company. The company’s stock price declined early in the period after management announced a 30% decline in fourth-quarter 2012 net profits and later cut its 2013 earnings estimates.
Another prominent detractor included an overweight position in Treasury Wine Estates, an Australia-based wine maker and distributor. The company’s stock price suffered on weaker demand, particularly in the U.S. and in the high-end wine market in China, which led to disappointing earnings. Poor inventory management also hurt results.
An overweight position in Netherlands-based Koninklijke Vopak, a storage provider for the oil, gas, and chemicals industries, also detracted from performance. The company faced declining demand for fuel storage in the Netherlands. Waning demand stemmed from pricing irregularities, whereby near-term deliveries were costing more than future deliveries, reducing the financial incentive for companies to keep supplies in storage.
* All fund returns referenced in this commentary are for Institutional Class shares.
Credit Company Led Contributors
An overweight position in ORIX, a Japan-based financial services provider, was among the leading contributors to the portfolio’s relative performance. The company’s acquisition of a Netherlands-based asset manager helped push its stock price higher. In addition, the company continued to take steps to stabilize its earnings by reducing price fluctuation risk associated with its real estate holdings and other assets.
A portfolio-only position in Russia’s Magnit OJSC, a consumer goods retailer that operates convenience stores, hypermarkets, and cosmetics stores, also was a top contributor. The company has been aggressively growing its footprint while maintaining same-store sales growth and steadily improving its operating margins due to moderating costs and a better negotiating position with suppliers.
In addition, an overweight position in Bank of Ireland, an Ireland-based financial services provider, was a leading contributor to performance. Shares continued to appreciate as the company demonstrated rising net interest margins at the same time as home prices in Ireland (and thus Bank of Ireland’s collateral) stabilized. Investors grew more comfortable owning peripheral banks, as the eurozone economy showed signs of stabilization.
Outlook
Looking ahead, we expect to maintain the portfolio’s overweight position in the consumer discretionary sector, where we are finding companies we believe are well positioned to benefit from improving consumer activity in the U.S., Europe, and Japan. From a regional perspective, we have added to the portfolio’s European exposure, where we are finding more companies we believe are positioned to benefit from the stabilization of growth in the U.K. and on the continent. Specifically, we have added companies in the consumer discretionary and financial sectors. We also have reduced the portfolio’s emerging market exposure due to slowing growth trends in many developing nations.
Fund Characteristics |
NOVEMBER 30, 2013 | |
Top Ten Holdings | % of net assets |
Roche Holding AG | 2.3% |
BNP Paribas | 1.8% |
Toyota Motor Corp. | 1.8% |
Novartis AG | 1.7% |
Bayer AG | 1.6% |
Whitbread plc | 1.6% |
Sanofi | 1.5% |
ORIX Corp. | 1.5% |
European Aeronautic Defence and Space Co. NV | 1.4% |
ASML Holding NV | 1.4% |
Types of Investments in Portfolio | % of net assets |
Foreign Common Stocks | 98.9% |
Temporary Cash Investments | 0.9% |
Other Assets and Liabilities | 0.2% |
Investments by Country | % of net assets |
United Kingdom | 20.0% |
Japan | 16.8% |
France | 15.8% |
Switzerland | 8.3% |
Germany | 8.0% |
Netherlands | 4.7% |
Australia | 3.5% |
Sweden | 2.6% |
Denmark | 2.2% |
China | 2.1% |
India | 2.0% |
Other Countries | 12.9% |
Cash and Equivalents* | 1.1% |
* Includes temporary cash investments and other assets and liabilities. |
Shareholder Fee Example |
Fund shareholders may incur two types of costs: (1) transaction costs, including sales charges (loads) on purchase payments and redemption/exchange fees; and (2) ongoing costs, including management fees; distribution and service (12b-1) fees; and other fund expenses. This example is intended to help you understand your ongoing costs (in dollars) of investing in your fund and to compare these costs with the ongoing cost of investing in other mutual funds.
The example is based on an investment of $1,000 made at the beginning of the period and held for the entire period from June 1, 2013 to November 30, 2013 (except as noted).
Actual Expenses
The table provides information about actual account values and actual expenses for each class. You may use the information, together with the amount you invested, to estimate the expenses that you paid over the period. First, identify the share class you own. Then simply divide your account value by $1,000 (for example, an $8,600 account value divided by $1,000 = 8.6), then multiply the result by the number under the heading “Expenses Paid During Period” to estimate the expenses you paid on your account during this period.
If you hold Investor Class shares of any American Century Investments fund, or Institutional Class shares of the American Century Diversified Bond Fund, in an American Century Investments account (i.e., not a financial intermediary or retirement plan account), American Century Investments may charge you a $12.50 semiannual account maintenance fee if the value of those shares is less than $10,000. We will redeem shares automatically in one of your accounts to pay the $12.50 fee. In determining your total eligible investment amount, we will include your investments in all personal accounts (including American Century Investments Brokerage accounts) registered under your Social Security number. Personal accounts include individual accounts, joint accounts, UGMA/UTMA accounts, personal trusts, Coverdell Education Savings Accounts and IRAs (including traditional, Roth, Rollover, SEP-, SARSEP- and SIMPLE-IRAs), and certain other retirement accounts. If you have only business, business retirement, employer-sponsored or American Century Investments Brokerage accounts, you are currently not subject to this fee. If you are subject to the Account Maintenance Fee, your account value could be reduced by the fee amount.
Hypothetical Example for Comparison Purposes
The table also provides information about hypothetical account values and hypothetical expenses based on the actual expense ratio of each class of your fund and an assumed rate of return of 5% per year before expenses, which is not the actual return of a fund’s share class. The hypothetical account values and expenses may not be used to estimate the actual ending account balance or expenses you paid for the period. You may use this information to compare the ongoing costs of investing in your fund and other funds. To do so, compare this 5% hypothetical example with the 5% hypothetical examples that appear in the shareholder reports of the other funds.
Please note that the expenses shown in the table are meant to highlight your ongoing costs only and do not reflect any transactional costs, such as sales charges (loads) or redemption/exchange fees. Therefore, the table is useful in comparing ongoing costs only, and will not help you determine the relative total costs of owning different funds. In addition, if these transactional costs were included, your costs would have been higher.
Beginning 6/1/13 | Ending 11/30/13 | Expenses Paid During Period(1) 6/1/13 – 11/30/13 | Annualized | |
Actual | ||||
Institutional Class | $1,000 | $1,122.70 | $5.37 | 1.01% |
R6 Class | $1,000 | $1,094.30(2) | $3.12(3) | 0.85% |
Hypothetical | ||||
Institutional Class | $1,000 | $1,020.01 | $5.11 | 1.01% |
R6 Class | $1,000 | $1,020.81(4) | $4.31(4) | 0.85% |
(1) | Expenses are equal to the class’s annualized expense ratio listed in the table above, multiplied by the average account value over the period, multiplied by 183, the number of days in the most recent fiscal half-year, divided by 365, to reflect the one-half year period. |
(2) | Ending account value based on actual return from July 26, 2013 (commencement of sale) through November 30, 2013. |
(3) | Expenses are equal to the class’s annualized expense ratio listed in the table above, multiplied by the average account value over the period, multiplied by 128, the number of days in the period from July 26, 2013 (commencement of sale) through November 30, 2013, divided by 365, to reflect the period. Had the class been available for the full period, the expenses paid during the period would have been higher. |
(4) | Ending account value and expenses paid during the period assumes the class had been available throughout the entire period and are calculated using the class’s annualized expense ratio listed in the table above. |
Schedule of Investments |
NOVEMBER 30, 2013
Shares | Value | |
Common Stocks — 98.9% | ||
AUSTRALIA — 3.5% | ||
BHP Billiton Ltd. | 252,060 | $ 8,578,675 |
Commonwealth Bank of Australia | 104,728 | 7,418,478 |
CSL Ltd. | 147,825 | 9,248,154 |
James Hardie Industries SE | 205,120 | 2,341,350 |
27,586,657 | ||
AUSTRIA — 0.7% | ||
Erste Group Bank AG | 153,573 | 5,406,773 |
BELGIUM — 0.9% | ||
Anheuser-Busch InBev NV | 69,168 | 7,063,013 |
BRAZIL — 0.5% | ||
Itau Unibanco Holding SA Preference Shares | 260,700 | 3,666,609 |
CANADA — 0.8% | ||
Canadian Pacific Railway Ltd. | 41,551 | 6,330,706 |
CHINA — 2.1% | ||
Baidu, Inc. ADR(1) | 19,880 | 3,311,412 |
ENN Energy Holdings Ltd. | 273,632 | 1,927,147 |
Haier Electronics Group Co. Ltd. | 1,672,000 | 3,938,152 |
Tencent Holdings Ltd. | 122,900 | 7,108,417 |
16,285,128 | ||
DENMARK — 2.2% | ||
GN Store Nord A/S | 257,650 | 6,152,962 |
Novo Nordisk A/S B Shares | 32,292 | 5,785,231 |
Pandora A/S | 93,210 | 4,835,639 |
16,773,832 | ||
FINLAND — 0.7% | ||
Sampo A Shares | 120,168 | 5,603,920 |
FRANCE — 15.8% | ||
Accor SA | 120,440 | 5,284,387 |
Air Liquide SA | 33,130 | 4,618,752 |
AXA SA | 273,450 | 7,165,614 |
BNP Paribas | 185,199 | 13,903,583 |
Carrefour SA | 269,786 | 10,616,315 |
Cie Generale d’Optique Essilor International SA | 27,701 | 2,906,195 |
Danone SA | 89,410 | 6,497,306 |
Dassault Systemes SA | 15,658 | 1,797,193 |
European Aeronautic Defence and Space Co. NV | 157,971 | 11,217,668 |
Iliad SA | 11,060 | 2,617,936 |
L’Oreal SA | 45,034 | 7,535,824 |
Publicis Groupe SA | 91,542 | 8,092,641 |
Rexel SA | 204,600 | 5,186,289 |
Sanofi | 113,309 | 11,984,587 |
Schneider Electric SA | 83,238 | 7,047,502 |
Total SA | 119,210 | 7,223,616 |
Valeo SA | 59,650 | 6,343,167 |
Zodiac Aerospace | 15,990 | 2,712,644 |
122,751,219 | ||
GERMANY — 8.0% | ||
adidas AG | 55,628 | 6,766,582 |
Bayer AG | 95,800 | 12,783,001 |
Brenntag AG | 16,110 | 2,861,060 |
Continental AG | 50,071 | 10,457,213 |
Daimler AG | 98,670 | 8,178,446 |
Henkel AG & Co. KGaA Preference Shares | 53,671 | 6,085,858 |
Siemens AG | 14,510 | 1,916,415 |
Sky Deutschland AG(1) | 806,626 | 8,275,133 |
Symrise AG | 117,130 | 5,188,497 |
62,512,205 | ||
HONG KONG — 1.4% | ||
AIA Group Ltd. | 1,132,500 | 5,740,982 |
Sands China Ltd. | 706,800 | 5,347,121 |
11,088,103 | ||
INDIA — 2.0% | ||
Idea Cellular Ltd. | 1,670,856 | 4,691,178 |
Tata Consultancy Services Ltd. | 152,430 | 4,889,151 |
Tata Motors Ltd. ADR | 184,673 | 5,996,332 |
15,576,661 | ||
IRELAND — 0.6% | ||
Bank of Ireland(1) | 12,259,491 | 4,764,247 |
ITALY — 1.7% | ||
Luxottica Group SpA | 72,984 | 3,865,675 |
Prada SpA | 341,800 | 3,300,040 |
UniCredit SpA | 880,480 | 6,388,760 |
13,554,475 | ||
JAPAN — 16.8% | ||
Bridgestone Corp. | 196,800 | 7,203,866 |
Daikin Industries Ltd. | 147,300 | 9,345,991 |
FANUC Corp. | 24,400 | 4,106,164 |
Fuji Heavy Industries Ltd. | 207,000 | 5,843,565 |
KDDI Corp. | 142,072 | 8,917,204 |
Keyence Corp. | 19,900 | 7,993,411 |
Kubota Corp. | 422,000 | 7,212,865 |
Mitsubishi Corp. | 98,200 | 1,931,505 |
Mitsubishi Estate Co. Ltd. | 253,000 | 7,023,593 |
Mizuho Financial Group, Inc. | 2,540,200 | 5,331,085 |
Murata Manufacturing Co. Ltd. | 74,700 | 6,424,003 |
Shares | Value |
Nidec Corp. | 52,300 | $ 5,049,021 |
Omron Corp. | 47,800 | 1,966,685 |
Oriental Land Co. Ltd. | 20,400 | 3,004,890 |
ORIX Corp. | 638,400 | 11,622,002 |
Rakuten, Inc. | 599,527 | 9,211,338 |
Seven & I Holdings Co. Ltd. | 47,600 | 1,751,691 |
Shin-Etsu Chemical Co. Ltd. | 66,000 | 3,813,949 |
Toshiba Corp. | 625,000 | 2,696,569 |
Toyota Motor Corp. | 220,600 | 13,738,377 |
Unicharm Corp. | 100,800 | 6,375,948 |
130,563,722 | ||
MEXICO — 0.7% | ||
Cemex SAB de CV ADR(1) | 473,397 | 5,174,229 |
NETHERLANDS — 4.7% | ||
Akzo Nobel NV | 105,331 | 7,933,355 |
ASML Holding NV | 113,914 | 10,663,238 |
ING Groep NV CVA(1) | 647,560 | 8,410,133 |
Koninklijke DSM NV | 81,178 | 6,372,305 |
Koninklijke Philips Electronics NV | 83,840 | 3,001,272 |
36,380,303 | ||
NORWAY — 1.2% | ||
DNB ASA | 346,043 | 6,122,405 |
Schibsted ASA | 44,440 | 2,870,864 |
8,993,269 | ||
RUSSIA — 1.4% | ||
Magnit OJSC GDR | 93,360 | 6,152,424 |
Yandex NV A Shares(1) | 124,480 | 4,948,080 |
11,100,504 | ||
SPAIN — 1.6% | ||
Amadeus IT Holding SA A Shares | 61,860 | 2,316,988 |
Banco Popular Espanol SA(1) | 787,780 | 4,578,255 |
Inditex SA | 35,423 | 5,648,385 |
12,543,628 | ||
SWEDEN — 2.6% | ||
SKF AB B Shares | 163,450 | 4,457,942 |
Svenska Cellulosa AB B Shares | 341,025 | 9,956,213 |
Telefonaktiebolaget LM Ericsson B Shares | 459,503 | 5,723,341 |
20,137,496 | ||
SWITZERLAND — 8.3% | ||
Adecco SA | 98,824 | 7,610,233 |
Cie Financiere Richemont SA | 46,960 | 4,771,642 |
Givaudan SA | 1,790 | 2,525,828 |
Lindt & Spruengli AG | 760 | 3,280,141 |
Novartis AG | 167,386 | $ 13,231,693 |
Roche Holding AG | 63,354 | 17,662,793 |
Sika AG | 1,311 | 4,305,877 |
Syngenta AG | 10,994 | 4,318,032 |
UBS AG | 338,895 | 6,460,840 |
64,167,079 | ||
TAIWAN — 0.7% | ||
Taiwan Semiconductor Manufacturing Co. Ltd. ADR | 306,871 | 5,440,823 |
UNITED KINGDOM — 20.0% | ||
Aberdeen Asset Management plc | 591,410 | 4,764,105 |
ARM Holdings plc | 151,620 | 2,525,615 |
Ashtead Group plc | 576,983 | 6,566,334 |
Associated British Foods plc | 209,073 | 7,844,492 |
BG Group plc | 437,433 | 8,936,407 |
BT Group plc | 1,072,080 | 6,538,068 |
Burberry Group plc | 228,144 | 5,700,473 |
Capita Group plc (The) | 551,049 | 8,989,763 |
Compass Group plc | 349,258 | 5,263,430 |
Diageo plc | 180,930 | 5,761,244 |
Experian plc | 159,924 | 2,949,174 |
HSBC Holdings plc | 703,070 | 7,844,804 |
International Consolidated Airlines Group SA(1) | 755,140 | 4,526,132 |
ITV plc | 1,529,580 | 4,755,417 |
J Sainsbury plc | 526,450 | 3,509,466 |
Johnson Matthey plc | 125,868 | 6,528,861 |
Kingfisher plc | 238,280 | 1,465,625 |
Lloyds Banking Group plc(1) | 8,263,917 | 10,466,217 |
Next plc | 33,390 | 3,002,251 |
Reckitt Benckiser Group plc | 88,090 | 7,075,913 |
Rio Tinto plc | 188,956 | 10,084,188 |
Rolls-Royce Holdings plc | 236,958 | 4,788,519 |
Shire plc | 65,780 | 2,983,664 |
Standard Chartered plc | 260,466 | 6,173,513 |
Unilever plc | 103,588 | 4,184,980 |
Whitbread plc | 209,929 | 12,252,886 |
155,481,541 | ||
TOTAL COMMON STOCKS (Cost $606,889,173) | 768,946,142 | |
Temporary Cash Investments — 0.9% | ||
Repurchase Agreement, Bank of America Merrill Lynch, (collateralized by various U.S. Treasury obligations, 0.375%, 6/30/15, valued at $1,096,288), in a joint trading account at 0.06%, dated 11/29/13, due 12/2/13 (Delivery value $1,074,267) | 1,074,262 | |
Shares | Value |
Repurchase Agreement, Credit Suisse First Boston, Inc., (collateralized by various U.S. Treasury obligations, 2.75%, 11/15/42, valued at $1,311,041), in a joint trading account at 0.03%, dated 11/29/13, due 12/2/13 (Delivery value $1,289,117) | $ 1,289,114 | |
Repurchase Agreement, Goldman Sachs & Co., (collateralized by various U.S. Treasury obligations, 0.00%, 5/29/14, valued at $1,096,801), in a joint trading account at 0.04%, dated 11/29/13, due 12/2/13 (Delivery value $1,075,323) | 1,075,319 | |
SSgA U.S. Government Money Market Fund | 3,413,645 | 3,413,645 |
TOTAL TEMPORARY CASH INVESTMENTS (Cost $6,852,340) | 6,852,340 | |
TOTAL INVESTMENT SECURITIES — 99.8% (Cost $613,741,513) | 775,798,482 | |
OTHER ASSETS AND LIABILITIES — 0.2% | 1,806,991 | |
TOTAL NET ASSETS — 100.0% | $777,605,473 | |
Market Sector Diversification | |
(as a % of net assets) | |
Consumer Discretionary | 21.3% |
Financials | 17.8% |
Industrials | 14.1% |
Consumer Staples | 10.7% |
Health Care | 10.7% |
Materials | 10.6% |
Information Technology | 8.5% |
Telecommunication Services | 2.8% |
Energy | 2.1% |
Utilities | 0.3% |
Cash and Equivalents* | 1.1% |
* Includes temporary cash investments and other assets and liabilities.
Notes to Schedule of Investments
ADR = American Depositary Receipt
CVA = Certificaten Van Aandelen
GDR = Global Depositary Receipt
OJSC = Open Joint Stock Company
(1) | Non-income producing. |
See Notes to Financial Statements.
Statement of Assets and Liabilities |
NOVEMBER 30, 2013 | ||
Assets | ||
Investment securities, at value (cost of $613,741,513) | $775,798,482 | |
Foreign currency holdings, at value (cost of $335,179) | 330,953 | |
Receivable for investments sold | 14,888,020 | |
Receivable for capital shares sold | 8,325 | |
Dividends and interest receivable | 1,361,023 | |
Other assets | 12,193 | |
| 792,398,996 | ||
Liabilities | ||
Disbursements in excess of demand deposit cash | 3,413,641 | |
Payable for investments purchased | 10,554,004 | |
Payable for capital shares redeemed | 6,317 | |
Accrued management fees | 618,312 | |
Accrued foreign taxes | 201,249 | |
| 14,793,523 | ||
Net Assets | $777,605,473 | |
Net Assets Consist of: | ||
Capital (par value and paid-in surplus) | $579,587,877 | |
Undistributed net investment income | 4,793,999 | |
Undistributed net realized gain | 31,328,827 | |
Net unrealized appreciation | 161,894,770 | |
| $777,605,473 | ||
Net assets | Shares outstanding | Net asset value per share | |
Institutional Class, $0.01 Par Value | $771,044,544 | 63,370,823 | $12.17 |
R6 Class, $0.01 Par Value | $6,560,929 | 538,685 | $12.18 |
See Notes to Financial Statements.
Statement of Operations |
YEAR ENDED NOVEMBER 30, 2013 | ||
Investment Income (Loss) | ||
Income: | ||
Dividends (net of foreign taxes withheld of $1,365,238) | $ 12,793,361 | |
Interest | 3,128 | |
| 12,796,489 | ||
Expenses: | ||
Management fees | 6,404,180 | |
Directors’ fees and expenses | 21,565 | |
Other expenses | 1,630 | |
| 6,427,375 | ||
Net investment income (loss) | 6,369,114 | |
Realized and Unrealized Gain (Loss) | ||
Net realized gain (loss) on: | ||
Investment transactions (net of foreign tax expenses paid (refunded) of $1,848) | 51,772,717 | |
Foreign currency transactions | (484,312 | ) |
| 51,288,405 | ||
Change in net unrealized appreciation (depreciation) on: | ||
Investments (includes (increase) decrease in accrued foreign taxes of $(201,249)) | 79,303,584 | |
Translation of assets and liabilities in foreign currencies | 31,589 | |
| 79,335,173 | ||
Net realized and unrealized gain (loss) | 130,623,578 | |
Net Increase (Decrease) in Net Assets Resulting from Operations | $136,992,692 | |
See Notes to Financial Statements.
Statement of Changes in Net Assets |
YEARS ENDED NOVEMBER 30, 2013 AND NOVEMBER 30, 2012 | |||||
Increase (Decrease) in Net Assets | November 30, 2013 | November 30, 2012 | |||
Operations | |||||
Net investment income (loss) | $ 6,369,114 | $ 6,286,503 | |||
Net realized gain (loss) | 51,288,405 | (637,474 | ) | ||
Change in net unrealized appreciation (depreciation) | 79,335,173 | 56,958,632 | |||
Net increase (decrease) in net assets resulting from operations | 136,992,692 | 62,607,661 | |||
Distributions to Shareholders | |||||
From net investment income: | |||||
Institutional Class | (7,491,880 | ) | (3,008,478 | ) | |
Capital Share Transactions | |||||
Net increase (decrease) in net assets from capital share transactions | 160,140,262 | 83,130,819 | |||
Net increase (decrease) in net assets | 289,641,074 | 142,730,002 | |||
Net Assets | |||||
Beginning of period | 487,964,399 | 345,234,397 | |||
End of period | $777,605,473 | $487,964,399 | |||
Undistributed net investment income | $4,793,999 | $5,464,358 | |||
See Notes to Financial Statements.
Notes to Financial Statements |
November 30, 2013
1. Organization
American Century World Mutual Funds, Inc. (the corporation) is registered under the Investment Company Act of 1940, as amended (the 1940 Act), as an open-end management investment company and is organized as a Maryland corporation. NT International Growth Fund (the fund) is one fund in a series issued by the corporation. The fund is diversified as defined under the 1940 Act. The fund’s investment objective is to seek capital growth. The fund is not permitted to invest in securities issued by companies assigned the Global Industry Classification Standard for the tobacco industry.
The fund offers the Institutional Class and the R6 Class, which have different fees and expenses. The difference in the fee structures between the classes is not the result of any difference in advisory or custodial fees or other expenses related to management of the fund’s assets, which do not vary by class. The fund’s R6 Class shares are available for purchase exclusively by certain American Century Investments funds of funds that are offered only through employer-sponsored retirement plans where a financial intermediary provides retirement recordkeeping services to plan participants. Because financial intermediaries do not receive any service, distribution or administrative fees for offering such funds of funds, American Century Investment Management, Inc. (ACIM) (the investment advisor) is able to charge the R6 Class a lower unified management fee. Sale of the R6 Class commenced on July 26, 2013.
2. Significant Accounting Policies
The following is a summary of significant accounting policies consistently followed by the fund in preparation of its financial statements. The financial statements are prepared in conformity with accounting principles generally accepted in the United States of America, which may require management to make certain estimates and assumptions at the date of the financial statements. Actual results could differ from these estimates.
Investment Valuations — The fund determines the fair value of its investments and computes its net asset value per share at the close of regular trading (usually 4 p.m. Eastern time) on the New York Stock Exchange (NYSE) on each day the NYSE is open. The Board of Directors has adopted valuation policies and procedures to guide the investment advisor in the fund’s investment valuation process and to provide methodologies for the oversight of the fund’s pricing function.
Equity securities that are listed or traded on a domestic securities exchange are valued at the last reported sales price or at the official closing price as provided by the exchange. Equity securities traded on foreign securities exchanges are generally valued at the closing price of such securities on the exchange where primarily traded or at the close of the NYSE, if that is earlier. If no last sales price is reported, or if local convention or regulation so provides, the mean of the latest bid and asked prices may be used. Securities traded over-the-counter are valued at the mean of the latest bid and asked prices, the last sales price, or the official closing price. Equity securities initially expressed in local currencies are translated into U.S. dollars at the mean of the appropriate currency exchange rate at the close of the NYSE as provided by an independent pricing service.
Fixed income securities maturing within 60 days at the time of purchase may be valued at cost, plus or minus any amortized discount or premium or at the evaluated mean as provided by an independent pricing service. Evaluated mean prices are commonly derived through utilization of market models, which may consider, among other factors: trade data, quotations from dealers and active market makers, relevant yield curve and spread data, related sector levels, creditworthiness, trade data or market information on comparable securities, and other relevant security specific information.
Open-end management investment companies are valued at the reported net asset value per share. Repurchase agreements are valued at cost, which approximates fair value.
If the fund determines that the market price for an investment is not readily available or the valuation methods mentioned above do not reflect an investment’s fair value, such investment is valued as determined in good faith by the Board of Directors or its delegate,
in accordance with policies and procedures adopted by the Board of Directors. In its determination of fair value, the fund may review several factors including, but not limited to, market information regarding the specific investment or comparable investments and correlation with other investment types, futures indices or general market indicators. Circumstances that may cause the fund to use these procedures to value an investment include, but are not limited to: an investment has been declared in default or is distressed; trading in a security has been suspended during the trading day or a security is not actively trading on its principal exchange; prices received from a regular pricing source are deemed unreliable; or there is a foreign market holiday and no trading occurred.
The fund monitors for significant events occurring after the close of an investment’s primary exchange but before the fund’s net asset value per share is determined. Significant events may include, but are not limited to: corporate announcements and transactions; governmental action and political unrest that could impact a specific investment or an investment sector; or armed conflicts, natural disasters and similar events that could affect investments in a specific country or region. The fund also monitors for significant fluctuations in domestic and foreign markets, as evidenced by the U.S. market or such other indicators that the Board of Directors, or its delegate, deems appropriate. If significant fluctuations in foreign markets are identified, the fund may apply a model-derived factor to the closing price of equity securities traded on foreign securities exchanges. The factor is based on observable market data as provided by an independent pricing service.
Security Transactions — Security transactions are accounted for as of the trade date. Net realized gains and losses are determined on the identified cost basis, which is also used for federal income tax purposes. Certain countries impose taxes on realized gains on the sale of securities registered in their country. The fund records the foreign tax expense, if any, on an accrual basis. The foreign tax expense on realized gains and unrealized appreciation reduces the net realized gain (loss) on investment transactions and net unrealized appreciation (depreciation) on investments, respectively.
Investment Income — Dividend income less foreign taxes withheld, if any, is recorded as of the ex-dividend date. Distributions received on securities that represent a return of capital or long-term capital gain are recorded as a reduction of cost of investments and/or as a realized gain. The fund may estimate the components of distributions received that may be considered nontaxable distributions or long-term capital gain distributions for income tax purposes. Interest income is recorded on the accrual basis and includes accretion of discounts and amortization of premiums.
Foreign Currency Translations — All assets and liabilities initially expressed in foreign currencies are translated into U.S. dollars at prevailing exchange rates at period end. The fund may enter into spot foreign currency exchange contracts to facilitate transactions denominated in a foreign currency. Purchases and sales of investment securities, dividend and interest income, spot foreign currency exchange contracts, and expenses are translated at the rates of exchange prevailing on the respective dates of such transactions. Net realized and unrealized foreign currency exchange gains or losses related to investment securities are a component of net realized gain (loss) on investment transactions and change in net unrealized appreciation (depreciation) on investments, respectively.
Repurchase Agreements — The fund may enter into repurchase agreements with institutions that ACIM has determined are creditworthy pursuant to criteria adopted by the Board of Directors. The fund requires that the collateral, represented by securities, received in a repurchase transaction be transferred to the custodian in a manner sufficient to enable the fund to obtain those securities in the event of a default under the repurchase agreement. ACIM monitors, on a daily basis, the securities transferred to ensure the value, including accrued interest, of the securities under each repurchase agreement is equal to or greater than amounts owed to the fund under each repurchase agreement.
Joint Trading Account — Pursuant to an Exemptive Order issued by the Securities and Exchange Commission, the fund, along with certain other funds in the American Century Investments family of funds, may transfer uninvested cash balances into a joint trading account. These balances are invested in one or more repurchase agreements that are collateralized by U.S. Treasury or Agency obligations.
Income Tax Status — It is the fund’s policy to distribute substantially all net investment income and net realized gains to shareholders and to otherwise qualify as a regulated investment company under provisions of the Internal Revenue Code. Accordingly, no provision has been made for income taxes. The fund files U.S. federal, state, local and non-U.S. tax returns as applicable. The fund’s tax returns are subject to examination by the relevant taxing authority until expiration of the applicable statute of limitations, which is generally three years from the date of filing but can be longer in certain jurisdictions. At this time, management believes there are no uncertain tax positions which, based on their technical merit, would not be sustained upon examination and for which it is reasonably possible that the total amounts of unrecognized tax benefits will significantly change in the next twelve months.
Multiple Class — All shares of the fund represent an equal pro rata interest in the net assets of the class to which such shares belong, and have identical voting, dividend, liquidation and other rights and the same terms and conditions, except for class specific expenses and exclusive rights to vote on matters affecting only individual classes. Income, non-class specific expenses, and realized and unrealized capital gains and losses of the fund are allocated to each class of shares based on their relative net assets.
Distributions to Shareholders — Distributions from net investment income and net realized gains, if any, are generally declared and paid annually. The fund may make distributions on a more frequent basis to comply with the distribution requirements of the Internal Revenue Code, in all events in a manner consistent with provisions of the 1940 Act.
Indemnifications — Under the corporation’s organizational documents, its officers and directors are indemnified against certain liabilities arising out of the performance of their duties to the fund. In addition, in the normal course of business, the fund enters into contracts that provide general indemnifications. The maximum exposure under these arrangements is unknown as this would involve future claims that may be made against a fund. The risk of material loss from such claims is considered by management to be remote.
3. Fees and Transactions with Related Parties
Management Fees —The corporation has entered into a management agreement with ACIM, under which ACIM provides the fund with investment advisory and management services in exchange for a single, unified management fee (the fee) per class. The agreement provides that all expenses of managing and operating the fund, except distribution and service fees, brokerage expenses, taxes, interest, fees and expenses of the independent directors (including legal counsel fees), and extraordinary expenses, will be paid by ACIM. The fee is computed and accrued daily based on each class’s daily net assets and paid monthly in arrears. The rate of the fee is determined by applying a fee rate calculation formula. This formula takes into account the fund’s assets as well as certain assets, if any, of other clients of the investment advisor outside the American Century Investments family of funds (such as subadvised funds and separate accounts) that have very similar investment teams and investment strategies (strategy assets). The strategy assets of the fund include the assets of International Growth Fund, one fund in a series issued by the corporation. The annual management fee schedule ranges from 0.850% to 1.300% for the Institutional Class and 0.700% to 1.150% for the R6 Class. The effective annual management fee for each class for the period ended November 30, 2013 was 1.02% for the Institutional Class and 0.85% for the R6 Class.
Related Parties — Certain officers and directors of the corporation are also officers and/or directors of American Century Companies, Inc. (ACC). The corporation’s investment advisor, ACIM, the corporation’s distributor, American Century Investment Services, Inc., and the corporation’s transfer agent, American Century Services, LLC, are wholly owned, directly or indirectly, by ACC. Various funds issued by American Century Asset Allocation Portfolios, Inc. own, in aggregate, 100% of the shares of the fund. Related parties do not invest in the fund for the purpose of exercising management or control.
4. Investment Transactions
Purchases and sales of investment securities, excluding short-term investments, for the year ended November 30, 2013 were $698,861,802 and $552,379,487, respectively.
5. Capital Share Transactions
Transactions in shares of the fund were as follows:
Year ended November 30, 2013(1) | Year ended November 30, 2012 | |||||||||||
Shares | Amount | Shares | Amount | |||||||||
Institutional Class/Shares Authorized | 250,000,000 | 100,000,000 | ||||||||||
Sold | 16,389,161 | $178,466,964 | 18,127,301 | $163,598,680 | ||||||||
Issued in reinvestment of distributions | 741,776 | 7,491,880 | 361,162 | 3,008,478 | ||||||||
Redeemed | (2,826,607 | ) | (32,253,447 | ) | (9,060,882 | ) | (83,476,339 | ) | ||||
| 14,304,330 | 153,705,397 | 9,427,581 | 83,130,819 | |||||||||
R6 Class/Shares Authorized | 50,000,000 | N/A | ||||||||||
Sold | 559,698 | 6,686,823 | ||||||||||
Redeemed | (21,013 | ) | (251,958 | ) | ||||||||
| 538,685 | 6,434,865 | |||||||||||
Net increase (decrease) | 14,843,015 | $160,140,262 | 9,427,581 | $ 83,130,819 | ||||||||
(1) | July 26, 2013 (commencement of sale) through November 30, 2013 for the R6 Class. |
6. Fair Value Measurements
The fund’s investments valuation process is based on several considerations and may use multiple inputs to determine the fair value of the investments held by the fund. In conformity with accounting principles generally accepted in the United States of America, the inputs used to determine a valuation are classified into three broad levels.
• | Level 1 valuation inputs consist of unadjusted quoted prices in an active market for identical investments. |
• | Level 2 valuation inputs consist of direct or indirect observable market data (including quoted prices for comparable investments, evaluations of subsequent market events, interest rates, prepayment speeds, credit risk, etc.). These inputs also consist of quoted prices for identical investments initially expressed in local currencies that are adjusted through translation into U.S. dollars. |
• | Level 3 valuation inputs consist of unobservable data (including a fund’s own assumptions). |
The level classification is based on the lowest level input that is significant to the fair valuation measurement. The valuation inputs are not necessarily an indication of the risks associated with investing in these securities or other financial instruments.
The following is a summary of the level classifications as of period end. The Schedule of Investments provides additional information on the fund’s portfolio holdings.
Level 1 | Level 2 | Level 3 | |
Assets | |||
Investment Securities | |||
Common Stocks | $24,870,876 | $744,075,266 | — |
Temporary Cash Investments | 3,413,645 | 3,438,695 | — |
Total Value of Investment Securities | $28,284,521 | $747,513,961 | — |
7. Risk Factors
There are certain risks involved in investing in foreign securities. These risks include those resulting from future adverse political, social and economic developments, fluctuations in currency exchange rates, the possible imposition of exchange controls, and other foreign laws or restrictions. Investing in emerging markets may accentuate these risks.
8. Federal Tax Information
On December 17, 2013, the fund declared and paid a per-share distribution from net realized gains to shareholders of record on December 16, 2013 of $0.5474 for the Institutional Class and R6 Class.
On December 17, 2013, the fund declared and paid the following per-share distributions from net investment income to shareholders of record on December 16, 2013:
Institutional Class | R6 Class |
$0.1695 | $0.1874 |
The tax character of distributions paid during the years ended November 30, 2013 and November 30, 2012 were as follows:
2013 | 2012 | |
Distributions Paid From | ||
Ordinary income | $7,491,880 | $3,008,478 |
Long-term capital gains | — | — |
The book-basis character of distributions made during the year from net investment income or net realized gains may differ from their ultimate characterization for federal income tax purposes. These differences reflect the differing character of certain income items and net realized gains and losses for financial statement and tax purposes, and may result in reclassification among certain capital accounts on the financial statements.
As of November 30, 2013, the federal tax cost of investments and the components of distributable earnings on a tax-basis were as follows:
Federal tax cost of investments | $623,833,965 |
Gross tax appreciation of investments | $153,679,527 |
Gross tax depreciation of investments | (1,715,010) |
Net tax appreciation (depreciation) of investments | $151,964,517 |
Net tax appreciation (depreciation) on translation of assets and liabilities in foreign currencies | $(161,360) |
Net tax appreciation (depreciation) | $151,803,157 |
Undistributed ordinary income | $10,933,873 |
Accumulated long-term gains | $35,280,566 |
The difference between book-basis and tax-basis unrealized appreciation (depreciation) is attributable primarily to the realization to ordinary income for tax purposes of unrealized gains on investments in passive foreign investment companies.
Financial Highlights |
For a Share Outstanding Throughout the Years Ended November 30 (except as noted) | |||||||||||
Per-Share Data | Ratios and Supplemental Data | ||||||||||
Income From Investment Operations: | Ratio to Average Net Assets of: | ||||||||||
Net Asset | Net Investment Income (Loss)(1) | Net Realized Gain (Loss) | Total From Investment Operations | Distributions Investment Income | Net Asset Value, End of Period | Total Return(2) | Operating Expenses | Net Investment Income (Loss) | Portfolio | Net Assets, | |
Institutional Class | |||||||||||
2013 | $9.94 | 0.11 | 2.27 | 2.38 | (0.15) | $12.17 | 24.27% | 1.02% | 1.01% | 89% | $771,045 |
2012 | $8.71 | 0.13 | 1.17 | 1.30 | (0.07) | $9.94 | 15.13% | 1.08% | 1.47% | 93% | $487,964 |
2011 | $9.11 | 0.10 | (0.41) | (0.31) | (0.09) | $8.71 | (3.47)% | 1.12% | 1.04% | 77% | $345,234 |
2010 | $8.61 | 0.08 | 0.54 | 0.62 | (0.12) | $9.11 | 7.28% | 1.14% | 0.95% | 85% | $250,218 |
2009 | $6.29 | 0.10 | 2.33 | 2.43 | (0.11) | $8.61 | 39.09% | 1.18% | 1.41% | 132% | $163,476 |
R6 Class | |||||||||||
2013(3) | $11.13 | (0.01) | 1.06 | 1.05 | — | $12.18 | 9.43% | 0.85%(4) | (0.34)%(4) | 89%(5) | $6,561 |
Notes to Financial Highlights
(1) | Computed using average shares outstanding throughout the period. |
(2) | Total returns are calculated based on the net asset value of the last business day. Total returns for periods less than one year are not annualized. |
(3) | July 26, 2013 (commencement of sale) through November 30, 2013. |
(4) | Annualized. |
(5) | Portfolio turnover is calculated at the fund level. Percentage indicated was calculated for the year ended November 30, 2013. |
See Notes to Financial Statements.
Report of Independent Registered Public Accounting Firm |
To the Board of Directors and Shareholders of
American Century World Mutual Funds, Inc.:
We have audited the accompanying statement of assets and liabilities, including the schedule of investments, of NT International Growth Fund (the “Fund”), one of the funds constituting American Century World Mutual Funds, Inc., as of November 30, 2013, and the related statement of operations for the year then ended, the statements of changes in net assets for each of the two years in the period then ended, and the financial highlights for each of the periods presented. These financial statements and financial highlights are the responsibility of the Fund’s management. Our responsibility is to express an opinion on these financial statements and financial highlights based on our audits.
We conducted our audits in accordance with the standards of the Public Company Accounting Oversight Board (United States). Those standards require that we plan and perform the audit to obtain reasonable assurance about whether the financial statements and financial highlights are free of material misstatement. The Fund is not required to have, nor were we engaged to perform, an audit of its internal control over financial reporting. Our audits included consideration of internal control over financial reporting as a basis for designing audit procedures that are appropriate in the circumstances, but not for the purpose of expressing an opinion on the effectiveness of the Fund’s internal control over financial reporting. Accordingly, we express no such opinion. An audit also includes examining, on a test basis, evidence supporting the amounts and disclosures in the financial statements, assessing the accounting principles used and significant estimates made by management, as well as evaluating the overall financial statement presentation. Our procedures included confirmation of securities owned as of November 30, 2013, by correspondence with the custodian and brokers; where replies were not received from brokers, we performed other auditing procedures. We believe that our audits provide a reasonable basis for our opinion.
In our opinion, the financial statements and financial highlights referred to above present fairly, in all material respects, the financial position of NT International Growth Fund of American Century World Mutual Funds, Inc. as of November 30, 2013, the results of its operations for the year then ended, the changes in its net assets for each of the two years in the period then ended, and the financial highlights for each of the periods presented, in conformity with accounting principles generally accepted in the United States of America.
Deloitte & Touche LLP
Kansas City, Missouri
January 17, 2014
Management |
The Board of Directors
The individuals listed below serve as directors of the funds. Each director will continue to serve in this capacity until death, retirement, resignation or removal from office. The board has adopted a mandatory retirement age for directors who are not “interested persons,” as that term is defined in the Investment Company Act (independent directors). Independent directors shall retire by December 31 of the year in which they reach their 75th birthday. Mr. Pratt may serve until December 31 of the year in which he reaches his 76th birthday based on an extension granted under previous retirement guidelines.
Mr. Thomas is an “interested person” because he currently serves as President and Chief Executive Officer of American Century Companies, Inc. (ACC), the parent company of American Century Investment Management, Inc. (ACIM or the advisor). Mr. Fink is treated as an “interested person” because of his recent employment with ACC and American Century Services, LLC (ACS). The other directors (more than three-fourths of the total number) are independent. They are not employees, directors or officers of, and have no financial interest in, ACC or any of its wholly owned, direct or indirect, subsidiaries, including ACIM, American Century Investment Services, Inc. (ACIS) and ACS, and do not have any other affiliations, positions, or relationships that would cause them to be considered “interested persons” under the Investment Company Act. The directors serve in this capacity for seven (in the case of Mr. Thomas, 15) registered investment companies in the American Century Investments family of funds.
The following table presents additional information about the directors. The mailing address for each director is 4500 Main Street, Kansas City, Missouri 64111.
Name | Position(s) Held with Funds | Length of Time Served | Principal Occupation(s) During Past 5 Years | Number of American Century Portfolios Overseen by Director | Other Directorships Held During Past 5 Years | |
Independent Directors | ||||||
Thomas A. Brown (1940) | Director | Since 1980 | Managing Member, Associated Investments, LLC (real estate investment company); Brown Cascade Properties, LLC (real estate investment company) (2001 to 2009) | 75 | None | |
Andrea C. Hall (1945) | Director | Since 1997 | Retired | 75 | None | |
Jan M. Lewis (1957) | Director | Since 2011 | President and Chief Executive Officer, Catholic Charities of Northeast Kansas (human services organization) | 75 | None | |
James A. Olson (1942) | Director | Since 2007 | Member, Plaza Belmont LLC (private equity fund manager) | 75 | Saia, Inc. (2002 to 2012) and EPR Properties (2003 to 2013) | |
Donald H. Pratt(1) (1937) | Director and Chairman of the Board | Since 1995 (Chairman since 2005) | Chairman and Chief Executive Officer, Western Investments, Inc. (real estate company) | 75 | None | |
Name | Position(s) Held with Funds | Length of Time Served | Principal Occupation(s) During Past 5 Years | Number of American Century Portfolios Overseen by Director | Other Directorships Held During Past 5 Years | |
Independent Directors | ||||||
M. Jeannine Strandjord | Director | Since 1994 | Retired | 75 | Euronet Worldwide Inc.; Charming Shoppes, Inc. (2006 to 2010); and DST Systems Inc. (1996 to 2012) | |
John R. Whitten (1946) | Director | Since 2008 | Retired | 75 | Rudolph Technologies, Inc. | |
Stephen E. Yates (1948) | Director | Since 2012 | Retired; Executive Vice President, Technology & Operations, KeyCorp. (computer services)(2004 to 2010) | 75 | Applied Industrial Technologies, Inc. (2001 to 2010) | |
Interested Directors | ||||||
Barry Fink | Director | Since 2012 | Retired; Executive Vice President, ACC (September 2007 to February 2013); President, ACS (October 2007 to February 2013); Chief Operating Officer, ACC (September 2007 to November 2012) | 75 | None | |
Jonathan S. Thomas | Director and President | Since 2007 | President and Chief Executive Officer, ACC (March 2007 to present). Also serves as Chief Executive Officer and Manager, ACS; Executive Vice President, ACIM; Director, ACC, ACIM and other ACC subsidiaries | 117 | None | |
(1) | Donald H. Pratt will retire as Director and Chairman of the Board effective December 31, 2013. |
Officers
The following table presents certain information about the executive officers of the funds. Each officer serves as an officer for each of the 15 investment companies in the American Century family of funds, unless otherwise noted. No officer is compensated for his or her service as an officer of the funds. The listed officers are interested persons of the funds and are appointed or re-appointed on an annual basis. The mailing address for each officer listed below is 4500 Main Street, Kansas City, Missouri 64111.
Name | Offices with the Funds | Principal Occupation(s) During the Past Five Years |
Jonathan S. Thomas | Director and President since 2007 | President and Chief Executive Officer, ACC (March 2007 to present). Also serves as Chief Executive Officer and Manager, ACS; Executive Vice President, ACIM; Director, ACC, ACIM and other ACC subsidiaries |
Maryanne L. Roepke | Chief Compliance Officer since 2006 and Senior Vice President since 2000 | Chief Compliance Officer, American Century funds, ACIM and ACS (August 2006 to present). Also serves as Senior Vice President, ACS |
Charles A. Etherington (1957) | General Counsel since 2007 and Senior Vice President since 2006 | Attorney, ACC (February 1994 to present); Vice President, ACC (November 2005 to present); General Counsel, ACC (March 2007 to present). Also serves as General Counsel, ACIM, ACS, ACIS and other ACC subsidiaries; and Senior Vice President, ACIM and ACS |
C. Jean Wade (1964) | Vice President, Treasurer and Chief Financial Officer since 2012 | Vice President, ACS (February 2000 to present) |
Robert J. Leach (1966) | Vice President since 2006 and Assistant Treasurer since 2012 | Vice President, ACS (February 2000 to present) |
David H. Reinmiller (1963) | Vice President since 2000 | Attorney, ACC (January 1994 to present); Associate General Counsel, ACC (January 2001 to present). Also serves as Vice President, ACIM and ACS |
Ward D. Stauffer (1960) | Secretary since 2005 | Attorney, ACC (June 2003 to present) |
The Statement of Additional Information has additional information about the fund’s directors and is available without charge, upon request, by calling 1-800-345-2021.
Approval of Management Agreement |
At a meeting held on June 20, 2013, the Fund’s Board of Directors unanimously approved the renewal of the management agreement pursuant to which American Century Investment Management, Inc. (the “Advisor”) acts as the investment advisor for the Fund. Under Section 15(c) of the Investment Company Act, contracts for investment advisory services are required to be reviewed, evaluated, and approved by a majority of a fund’s directors (the “Directors”), including a majority of the independent Directors, each year.
Prior to its consideration of the renewal of the management agreement, the Board requested and reviewed extensive data and information compiled by the Advisor and certain independent providers of evaluation data concerning the Fund and the services provided to the Fund by the Advisor. This review was in addition to the oversight and evaluation undertaken by the Board and its committees on a continuous basis throughout the year.
In connection with its consideration of the renewal of the management agreement, the Board’s review and evaluation of the services provided by the Advisor included, but was not limited to, the following:
• | the nature, extent, and quality of investment management, shareholder services, and other services provided by the Advisor to the Fund; |
• | the wide range of other programs and services the Advisor provides to the Fund and its shareholders on a routine and non-routine basis; |
• | the investment performance of the Fund, including data comparing the Fund’s performance to appropriate benchmarks and/or a peer group of other mutual funds with similar investment objectives and strategies; |
• | data comparing the cost of owning the Fund to the cost of owning similar funds; |
• | the Advisor’s compliance policies, procedures, and regulatory experience; |
• | financial data showing the cost of services provided to the Fund, the profitability of the Fund to the Advisor, and the overall profitability of the Advisor; |
• | possible economies of scale associated with the Advisor’s management of the Fund and other accounts under its management; |
• | data comparing services provided and charges to other investment management clients of the Advisor; and |
• | consideration of collateral benefits derived by the Advisor from the management of the Fund. |
In keeping with its practice, the Board held two in-person meetings and one telephonic meeting to review and discuss the information provided. The Directors also had the benefit of the advice of independent counsel throughout the period.
Factors Considered
The Directors considered all of the information provided by the Advisor, the independent data providers, and independent counsel, and evaluated such information for the Fund. In connection with their review, the Directors did not identify any single factor as being all-important or controlling, and each Director may have attributed different levels of importance to different factors. In deciding to renew the management agreement, the Board based its decision on a number of factors, including the following:
Nature, Extent and Quality of Services - Generally. Under the management agreement, the Advisor is responsible for providing or arranging for all services necessary for the operation of the Fund. The Board noted that under the management agreement, the Advisor provides or arranges at its own expense a wide variety of services including:
• | constructing and designing the Fund |
• | portfolio research and security selection |
• | initial capitalization/funding |
• | securities trading |
• | Fund administration |
• | custody of Fund assets |
• | daily valuation of the Fund’s portfolio |
• | shareholder servicing and transfer agency, including shareholder confirmations, recordkeeping, and communications |
• | legal services |
• | regulatory and portfolio compliance |
• | financial reporting |
• | marketing and distribution |
The Board noted that many of these services have expanded over time both in terms of quantity and complexity in response to shareholder demands, competition in the industry, changing distribution channels, and the changing regulatory environment.
Investment Management Services. The nature of the investment management services provided to the Fund is quite complex and allows Fund shareholders access to professional money management, instant diversification of their investments within an asset class, the opportunity to easily diversify among asset classes by investing in or exchanging among various American Century Investments
funds, and liquidity. In evaluating investment performance, the Board expects the Advisor to manage the Fund in accordance with its investment objectives and approved strategies. Further, the Directors recognize that the Advisor has an obligation to monitor trading activities, and in particular to seek the best execution of fund trades, and to evaluate the use of and payment for research. In providing these services, the Advisor utilizes teams of investment professionals (portfolio managers, analysts, research assistants, and securities traders) who require extensive information technology, research, training, compliance and other systems to conduct their business. The Board, directly and through its Fund Performance Review Committee, regularly reviews investment performance information for the Fund, together with comparative information for appropriate benchmarks and/or peer groups of similarly-managed funds, over different time horizons. The Directors also review detailed performance information during the management agreement approval process. If performance concerns are identified, the Fund receives special reviews until performance improves, during which the Board discusses with the Advisor the reasons for such results (e.g., market conditions, security selection) and any efforts being undertaken to improve performance. Taking all these factors into consideration, the Board found the investment management services provided by the Advisor to the Fund to meet or exceed industry standards. More detailed information about the Fund’s performance can be found in the Performance and Portfolio Commentary sections of this report.
Shareholder and Other Services. Under the management agreement, the Advisor provides the Fund with a comprehensive package of transfer agency, shareholder, and other services. The Board, directly and through various committees of the Board, regularly reviews reports and evaluations of such services at its regular meetings. These reports include, but are not limited to, information regarding the operational efficiency and accuracy of the shareholder and transfer agency services provided, staffing levels, shareholder satisfaction (as measured by external as well as internal sources), technology support, new products and services offered to Fund shareholders, securities trading activities, portfolio valuation services, auditing services, and legal and operational compliance activities. Certain aspects of shareholder and transfer agency service level efficiency and the quality of securities trading activities are measured by independent third party providers and are presented in comparison to other fund groups not managed by the Advisor. The Board found the services provided by the Advisor to the Fund under the management agreement to be competitive and of high quality.
Costs of Services and Profitability. The Advisor provides detailed information concerning its cost of providing various services to the Fund, its profitability in managing the Fund, its overall profitability, and its financial condition. The Directors have reviewed with the Advisor the methodology used to prepare this financial information. The financial information regarding the Advisor is considered in evaluating the Advisor’s financial condition, its ability to continue to provide services under the management agreement, and the reasonableness of the current management fee. The Board concluded that the Advisor’s profits were reasonable in light of the services provided to the Fund.
Ethics. The Board generally considers the Advisor’s commitment to providing quality services to shareholders and to conducting its business ethically. They noted that the Advisor’s practices generally meet or exceed industry best practices.
Economies of Scale. The Board also reviewed information provided by the Advisor regarding the possible existence of economies of scale in connection with the management of the Fund. The Board concluded that economies of scale are difficult to measure and predict with precision, especially on a fund-by-fund basis. The Board concluded that the Advisor is appropriately sharing economies of scale through its competitive fee structure, offering competitive fees from fund inception, and through reinvestment in its business to provide shareholders additional content and services.
Comparison to Other Funds’ Fees. The management agreement provides that the Fund pay the Advisor a single, all-inclusive (or unified) management fee for providing all services necessary for the management and operation of the Fund, other than brokerage expenses, taxes, interest, extraordinary expenses, and the fees and expenses of the Fund’s independent directors (including their independent legal counsel) and expenses incurred in connection with the provision of shareholder services and distribution services under a plan adopted pursuant to Rule 12b-1 under the 1940 Act. Under the unified fee structure, the Advisor is responsible for providing all investment advisory, custody, audit, administrative, compliance, recordkeeping, marketing and shareholder services, or arranging and supervising third parties to provide such services. By contrast, most other funds are charged a variety of fees, including an investment advisory fee, a transfer agency fee, an administrative fee, distribution charges and other expenses. Other than their investment advisory fees and any applicable Rule 12b-1 distribution fees, all other components of the total fees charged by these other funds may be increased without shareholder approval. The Board believes the unified fee structure is a benefit to Fund shareholders because it clearly discloses to shareholders the cost of owning Fund shares, and, since the unified fee cannot be increased without a vote of Fund shareholders, it shifts to the Advisor the risk of increased costs of operating the Fund and provides a direct incentive to minimize administrative inefficiencies. Part of the Board’s analysis of fee levels involves reviewing certain evaluative data compiled by an independent provider and comparing the Fund’s unified fee to the total expense ratio of other funds in the Fund’s peer group. The Board concluded that the management fee paid by the Fund to the Advisor under the management agreement is reasonable in light of the services provided to the Fund.
Comparison to Fees and Services Provided to Other Clients of the Advisor. The Board also requested and received information from the Advisor concerning the nature of the services, fees, costs and profitability of its advisory services to advisory clients other than the Fund. They observed that these varying types of client accounts require different services and involve different regulatory and entrepreneurial risks than the management of the Fund. The Board analyzed this information and concluded that the fees charged and services provided to the Fund were reasonable by comparison.
Collateral or “Fall-Out” Benefits Derived by the Advisor. The Board considered the existence of collateral benefits the Advisor may receive as a result of its relationship with the Fund. They concluded that the Advisor’s primary business is managing mutual funds and it generally does not use fund or shareholder information to generate profits in other lines of business, and therefore does not derive any significant collateral benefits from them. The Board noted that the
Advisor receives proprietary research from broker-dealers that execute fund portfolio transactions and concluded that this research is likely to benefit Fund shareholders. The Board also determined that the Advisor is able to provide investment management services to certain clients other than the Fund, at least in part, due to its existing infrastructure built to serve the fund complex. The Board concluded, however, that the assets of those other clients are not material to the analysis and, where applicable, may be included with the assets of the Fund to determine breakpoints in the management fee schedule.
Existing Relationship. The Board also considered whether there was any reason for not continuing the existing arrangement with the Advisor. In this regard, the Board was mindful of the potential disruptions of the Fund’s operations and various risks, uncertainties, and other effects that could occur as a result of a decision not to continue such relationship. In particular, the Board recognized that most shareholders have invested in the Fund on the strength of the Advisor’s industry standing and reputation and in the expectation that the Advisor will have a continuing role in providing advisory services to the Fund.
Conclusion of the Directors. As a result of this process, the Board, including all of the independent directors, taking into account all of the factors discussed above and the information provided by the Advisor and others, concluded that the management agreement between the Fund and the Advisor is fair and reasonable in light of the services provided and should be renewed.
Additional Information |
Retirement Account Information
As required by law, distributions you receive from certain IRAs are subject to federal income tax withholding, unless you elect not to have withholding apply. Tax will be withheld on the total amount withdrawn even though you may be receiving amounts that are not subject to withholding, such as nondeductible contributions. In such case, excess amounts of withholding could occur. You may adjust your withholding election so that a greater or lesser amount will be withheld.
If you don’t want us to withhold on this amount, you must notify us to not withhold the federal income tax. You may notify us in writing or in certain situations by telephone or through other electronic means. For systematic withdrawals, your withholding election will remain in effect until revoked or changed by filing a new election. You have the right to revoke your election at any time.
Remember, even if you elect not to have income tax withheld, you are liable for paying income tax on the taxable portion of your withdrawal. If you elect not to have income tax withheld or you don’t have enough income tax withheld, you may be responsible for payment of estimated tax. You may incur penalties under the estimated tax rules if your withholding and estimated tax payments are not sufficient. You can reduce or defer the income tax on a distribution by directly or indirectly rolling such distribution over to another IRA or eligible plan. You should consult your tax advisor for additional information.
State tax will be withheld if, at the time of your distribution, your address is within one of the mandatory withholding states and you have federal income tax withheld (or as otherwise required by state law). State taxes will be withheld from your distribution in accordance with the respective state rules.
Distributions you receive from 403(b), 457 and qualified plans are subject to special tax and withholding rules. Your plan administrator or plan sponsor is required to provide you with a special tax notice explaining those rules at the time you request a distribution. If applicable, federal and/or state taxes may be withheld from your distribution amount.
Proxy Voting Policies
A description of the policies that the fund’s investment advisor uses in exercising the voting rights associated with the securities purchased and/or held by the fund is available without charge, upon request, by calling 1-800-345-2021. It is also available on the “About Us” page of American Century Investments’ website at americancentury.com and on the Securities and Exchange Commission’s website at sec.gov. Information regarding how the investment advisor voted proxies relating to portfolio securities during the most recent 12-month period ended June 30 is available on the “About Us” page at americancentury.com. It is also available at sec.gov.
Quarterly Portfolio Disclosure
The fund files its complete schedule of portfolio holdings with the Securities and Exchange Commission (SEC) for the first and third quarters of each fiscal year on Form N-Q. The fund’s Forms N-Q are available on the SEC’s website at sec.gov, and may be reviewed and copied at the SEC’s Public Reference Room in Washington, DC. Information on the operation of the Public Reference Room may be obtained by calling 1-800-SEC-0330. The fund also makes its complete schedule of portfolio holdings for the most recent quarter of its fiscal year available upon request by calling 1-800-345-2021.
Other Tax Information
The following information is provided pursuant to provisions of the Internal Revenue Code.
The fund hereby designates up to the maximum amount allowable as qualified dividend income for the fiscal year ended November 30, 2013.
For the fiscal year ended November 30, 2013, the fund intends to pass through to shareholders $1,365,212, or up to the maximum amount allowable, as a foreign tax credit which represents taxes paid on income derived from sources within foreign countries or possessions of the United States. During the fiscal year ended November 30, 2013, the fund earned $14,158,599 from income derived from foreign sources. Foreign source income and foreign tax expense per outstanding share on November 30, 2013 are $0.2215 and $0.0214, respectively.
![]()
Contact Us | americancentury.com |
Automated Information Line | 1-800-345-8765 |
Investor Services Representative | 1-800-345-2021 |
Investors Using Advisors | 1-800-378-9878 |
Business, Not-For-Profit, Employer-Sponsored Retirement Plans | 1-800-345-3533 |
Banks and Trust Companies, Broker-Dealers, Financial Professionals, Insurance Companies | 1-800-345-6488 |
Telecommunications Relay Service for the Deaf | 711 |
American Century World Mutual Funds, Inc.
Investment Advisor:
American Century Investment Management, Inc.
Kansas City, Missouri
This report and the statements it contains are submitted for the general information of our shareholders. The report is not authorized for distribution to prospective investors unless preceded or accompanied by an effective prospectus.
©2014 American Century Proprietary Holdings, Inc. All rights reserved.
CL-ANN-80799 1401
ANNUAL REPORT | NOVEMBER 30, 2013 |
NT Emerging Markets Fund
Table of Contents |
President’s Letter | 2 |
Market Perspective | 3 |
Performance | 4 |
Portfolio Commentary | 6 |
Fund Characteristics | 8 |
Shareholder Fee Example | 9 |
Schedule of Investments | 11 |
Statement of Assets and Liabilities | 14 |
Statement of Operations | 15 |
Statement of Changes in Net Assets | 16 |
Notes to Financial Statements | 17 |
Financial Highlights | 23 |
Report of Independent Registered Public Accounting Firm | 24 |
Management | 25 |
Approval of Management Agreement | 28 |
Additional Information | 33 |
Any opinions expressed in this report reflect those of the author as of the date of the report, and do not necessarily represent the opinions of American Century Investments® or any other person in the American Century Investments organization. Any such opinions are subject to change at any time based upon market or other conditions and American Century Investments disclaims any responsibility to update such opinions. These opinions may not be relied upon as investment advice and, because investment decisions made by American Century Investments funds are based on numerous factors, may not be relied upon as an indication of trading intent on behalf of any American Century Investments fund. Security examples are used for representational purposes only and are not intended as recommendations to purchase or sell securities. Performance information for comparative indices and securities is provided to American Century Investments by third party vendors. To the best of American Century Investments’ knowledge, such information is accurate at the time of printing.
President’s Letter |
Jonathan Thomas
Dear Investor:
Thank you for reviewing this annual report for the 12 months ended November 30, 2013. It provides investment performance, market analysis, and portfolio information, presented with the expert perspective of our portfolio management team.
Annual reports remain important vehicles for conveying information about fund returns, including key factors that affected fund performance. For additional, updated investment and market insights, we encourage you to visit our website, americancentury.com.
Monetary Policy-Driven, “Risk-On” Results in Developed Countries
Stimulative monetary policies by central banks and slowly improving global economic conditions played a major part in financial market returns during the reporting period. The combination of an improving global economic outlook, mostly low costs of capital in the money markets, and central bank purchases of longer-maturity fixed income securities (a market liquidity-building strategy known as quantitative easing, QE) helped persuade investors to seek risk and yield, particularly in developed markets such as the U.S., Japan, and Europe. Broad stock index returns were stellar in these markets, particularly at the smaller capitalization end of the company size spectrum. Representing the broad markets, the S&P 500 and MSCI EAFE Indices returned 30.30% and 24.84%, respectively, for the reporting period, and their smaller capitalization counterparts performed even better.
At the same time, hints that QE might be tapered soon in the U.S. hampered government bond returns and emerging market stock indices. Broad emerging market stock indices posted positive single-digit returns, but government bond total returns dipped into negative territory, despite low inflation. Corporate bonds, especially high-yield corporates, generally performed better than government bonds because of their higher yields, declining spreads (yield differences between corporate and similar-maturity Treasury securities), and relatively low default rates, compared with historical averages.
As we enter 2014, there’s less uncertainty about the U.S. fiscal picture and global economic strength than a year ago, but headwinds continue. A full economic recovery from 2008 remains elusive—economic growth is still subpar compared with past recoveries. In this environment, we continue to believe in a disciplined, diversified, long-term investment approach, using professionally managed stock and bond portfolios—as appropriate—for meeting financial goals. We appreciate your continued trust in us.
Sincerely,
Jonathan Thomas
President and Chief Executive Officer
American Century Investments
Market Perspective |
By Mark Kopinski, Chief Investment Officer, Global and Non-U.S. Equity
Global Stocks Rallied to Post Double-Digit Gains
Stock market performance remained robust during the 12-month period ended November 30, 2013, with most major market indices posting double-digit gains. Despite persistent concerns about weak global growth and a slowdown in China, investors largely focused on central bank stimulus measures, marginally improving U.S. and European economic data, and relatively healthy corporate earnings, which fueled stock market optimism.
Prior to the reporting period, the U.S. Federal Reserve (the Fed) announced its third quantitative easing program (QE3). This effort, combined with similar large-scale stimulus measures from the European Central Bank (ECB) and the Bank of Japan as well as favorable corporate earnings reports, generally helped keep stocks in favor. Additionally, housing market gains in the U.S., U.K., and Australia aided the global investment landscape.
Europe, Japan were Performance Leaders
Assurances by the ECB that it would keep interest rates at historic lows for an extended period, followed by the cutting of its key lending rate to 0.25% late in the period, helped drive stock market gains in Europe. In addition, economic conditions throughout Europe improved, led by an expanding manufacturing sector, improving business and consumer sentiment, and a slowdown of the economic contraction in the peripheral countries. In the second calendar quarter of 2013, the 17-member eurozone emerged from its longest-ever recession (six consecutive quarters). Investors generally focused on these positive factors, pushing stocks higher despite the structural issues and high unemployment still plaguing the region.
In Japan, the central bank’s efforts to pull the nation out of its decades-long deflationary spiral and spark economic growth appeared to be working. Japan’s economy grew, and consumer prices increased. Late in the period, government officials announced the country’s inflation rate rose at a five-year high, suggesting their deflation-focused initiatives were gaining traction.
Overall, developed market stocks sharply outperformed their emerging market counterparts. Much of the lagging performance was due to a slower-growth environment in China. In addition, rising inflation and currency weakness weighed on many developing nations.
International Equity Total Returns | ||||
For the 12 months ended November 30, 2013 (in U.S. dollars) | ||||
MSCI EAFE Index | 24.84% | MSCI Europe Index | 25.94% | |
MSCI EAFE Growth Index | 23.45% | MSCI World Index | 26.38% | |
MSCI EAFE Value Index | 26.20% | MSCI Japan Index | 32.84% | |
MSCI Emerging Markets Index | 3.66% | |||
Performance |
Total Returns as of November 30, 2013 | |||||
Average Annual Returns | |||||
Ticker Symbol | 1 year | 5 years | Since Inception | Inception Date | |
Institutional Class | ACLKX | 6.66%(1) | 16.08% | 3.70% | 5/12/06 |
MSCI Emerging Markets Growth Index | — | 5.51% | 17.67% | 4.28% | — |
MSCI Emerging | — | 3.66% | 16.86% | 4.76% | — |
R6 Class | ACKDX | — | — | 7.88%(1)(3) | 7/26/13 |
(1) | Returns would have been lower if a portion of the management fee had not been waived. |
(2) | Effective January 2014, the fund’s benchmark changed from the MSCI Emerging Markets Growth Index to the MSCI Emerging Markets Index in order to simplify performance comparisons. The fund’s investment process did not change. |
(3) | Total returns for periods less than one year are not annualized. |
Data presented reflect past performance. Past performance is no guarantee of future results. Current performance may be higher or lower than the performance shown. Investment return and principal value will fluctuate, and redemption value may be more or less than original cost. To obtain performance data current to the most recent month end, please call 1-800-345-2021 or visit americancentury.com. International investing involves special risks, such as political instability and currency fluctuations. Investing in emerging markets may accentuate these risks.
Unless otherwise indicated, performance reflects Institutional Class shares; performance for other share classes will vary due to differences in fee structure. For information about other share classes available, please consult the prospectus. Data assumes reinvestment of dividends and capital gains, and none of the charts reflect the deduction of taxes that a shareholder would pay on fund distributions or the redemption of fund shares. Returns for the indices are provided for comparison. The fund’s total returns include operating expenses (such as transaction costs and management fees) that reduce returns, while the total returns of the indices do not.
Growth of $10,000 Over Life of Class |
$10,000 investment made May 12, 2006 |
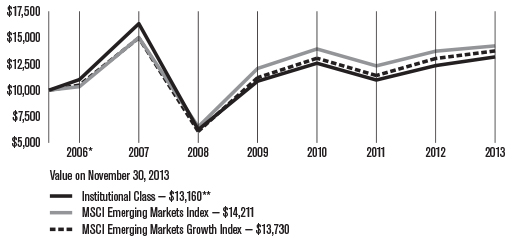
* | From 5/12/06, the Institutional Class’s inception date. Not annualized. |
** | Ending value would have been lower if a portion of the management fee had not been waived. |
Total Annual Fund Operating Expenses | |
Institutional Class | R6 Class |
1.55% | 1.40% |
The total annual fund operating expenses shown is as stated in the fund’s prospectus current as of the date of this report. The prospectus may vary from the expense ratio shown elsewhere in this report because it is based on a different time period, includes acquired fund fees and expenses, and, if applicable, does not include fee waivers or expense reimbursements.
Data presented reflect past performance. Past performance is no guarantee of future results. Current performance may be higher or lower than the performance shown. Investment return and principal value will fluctuate, and redemption value may be more or less than original cost. To obtain performance data current to the most recent month end, please call 1-800-345-2021 or visit americancentury.com. International investing involves special risks, such as political instability and currency fluctuations. Investing in emerging markets may accentuate these risks.
Unless otherwise indicated, performance reflects Institutional Class shares; performance for other share classes will vary due to differences in fee structure. For information about other share classes available, please consult the prospectus. Data assumes reinvestment of dividends and capital gains, and none of the charts reflect the deduction of taxes that a shareholder would pay on fund distributions or the redemption of fund shares. Returns for the indices are provided for comparison. The fund’s total returns include operating expenses (such as transaction costs and management fees) that reduce returns, while the total returns of the indices do not.
Portfolio Commentary |
Portfolio Managers: Patricia Ribeiro and Anthony Han
Performance Summary
NT Emerging Markets gained 6.66%* for the 12 months ended November 30, 2013, compared with its benchmark, the MSCI Emerging Markets Growth Index, which advanced 5.51%.
Emerging market growth stocks generally demonstrated modest performance during the 12-month period, as key countries, including China and Brazil, experienced slowdowns in their economic growth rates. In addition, commodities prices largely declined during the period, further pressuring many markets. Speculation about the timing and magnitude of the U.S. Federal Reserve’s tapering of quantitative easing dominated investor sentiment throughout the second half of the period and led to fears of higher interest rates. These concerns weighed heavily on many emerging market currencies. In the final months of the period, signs of stabilization in China, firming economic data in Europe, and improving growth in the U.S. aided emerging market economies and companies with exposure to global growth.
The portfolio outperformed its benchmark for the period, primarily due to stock selection in the consumer discretionary, health care, and utilities sectors.
Russian Retailer was a Top Contributor
In terms of the portfolio’s favorable regional exposure, Russia was a leading contributor for the 12-month period, driven by strong stock selection. Among the portfolio’s top individual contributors was an overweight position in Russia’s Magnit OJSC, a consumer goods retailer that operates convenience stores, hypermarkets, and cosmetics stores. The company has been aggressively growing its footprint while maintaining same-store sales growth and steadily improving its operating margins due to moderating costs and a better negotiating position with suppliers.
Within the top-contributing consumer discretionary sector, the textiles industry offered standout performance, led by an overweight position in Eclat Textile. The Taiwan-based company, which primarily manufactures and distributes fabrics and garments, reported growing profits stemming from order adjustments, improved capacity utilization, and a growing customer base. In addition, the company said its new apparel factories, scheduled to open in late 2013 and early 2014 in Cambodia and Vietnam, would further increase monthly capacity.
Stock selection in Hong Kong also contributed favorably to portfolio performance, with a portfolio-only position in industrial glass manufacturer Xinyi Glass Holdings among the leading performance contributors. The company’s stock benefited from order gains due to improving conditions in the construction and automobile industries, two of the company’s key markets.
* | All fund returns referenced in this commentary are for Institutional Class shares. Returns would have been lower if a portion of the management fee had not been waived. |
Brazil-Based Bank was a Main Detractor
The financials sector was among the largest detractors to relative performance, primarily due to exposure in the commercial banking industry. In particular, an underweight position in Brazil’s Itau Unibanco Holding, a provider of diversified financial products and services, was the top individual detractor. The company reported much higher-than-expected third-quarter earnings stemming from its efforts to avoid riskier loans and streamline costs. These results drove Itau Unibanco’s share price higher, and the portfolio’s underweight position detracted from relative results.
Another prominent detractor included an overweight position in South Korea-based Hyundai Glovis, an integrated logistics and distribution company. The company’s stock price declined as expectations for increased logistics business did not materialize.
Exposure to the materials sector weighed on relative performance, primarily due to weak relative results in the metals and mining industry. An overweight position in Grupo Mexico, a Mexico-based copper mining company, was among the portfolio’s largest detractors. The company’s share price struggled in the face of falling copper prices throughout much of the period.
Outlook
Looking ahead, we believe emerging markets will generally remain challenged, as long as investors’ concerns about currency weakness and current account deficits linger. Nevertheless, we believe domestic fundamentals will remain strong in many emerging market countries. Additionally, we believe improving conditions in the U.S., Europe, and China will help export-related businesses headquartered in emerging markets. Against this expected backdrop, we are seeking more attractive opportunities in export-related companies that appear positioned to benefit from the broader global recovery.
Fund Characteristics |
NOVEMBER 30, 2013 | |
Top Ten Holdings | % of net assets |
Samsung Electronics Co. Ltd. | 7.0% |
Tencent Holdings Ltd. | 4.2% |
Taiwan Semiconductor Manufacturing Co. Ltd. | 3.9% |
Itau Unibanco Holding SA ADR | 2.9% |
Naspers Ltd. N Shares | 2.7% |
CNOOC Ltd. | 2.3% |
MediaTek, Inc. | 2.3% |
China Overseas Land & Investment Ltd. | 2.0% |
Sberbank of Russia | 1.9% |
Ping An Insurance Group Co. H Shares | 1.8% |
Types of Investments in Portfolio | % of net assets |
Foreign Common Stocks | 97.8% |
Exchange-Traded Funds | 1.4% |
Total Equity Exposure | 99.2% |
Temporary Cash Investments | 1.7% |
Other Assets and Liabilities | (0.9)% |
Investments by Country | % of net assets |
China | 21.4% |
South Korea | 15.1% |
Taiwan | 11.1% |
Russia | 8.4% |
Brazil | 8.0% |
South Africa | 6.1% |
Mexico | 5.6% |
India | 3.3% |
Thailand | 3.1% |
Turkey | 2.7% |
Malaysia | 2.2% |
Indonesia | 2.0% |
Other Countries | 8.8% |
Exchange-Traded Funds | 1.4% |
Cash and Equivalents* | 0.8% |
* Includes temporary cash investments and other assets and liabilities. | |
Shareholder Fee Example |
Fund shareholders may incur two types of costs: (1) transaction costs, including sales charges (loads) on purchase payments and redemption/exchange fees; and (2) ongoing costs, including management fees; distribution and service (12b-1) fees; and other fund expenses. This example is intended to help you understand your ongoing costs (in dollars) of investing in your fund and to compare these costs with the ongoing cost of investing in other mutual funds.
The example is based on an investment of $1,000 made at the beginning of the period and held for the entire period from June 1, 2013 to November 30, 2013 (except as noted).
Actual Expenses
The table provides information about actual account values and actual expenses for each class. You may use the information, together with the amount you invested, to estimate the expenses that you paid over the period. First, identify the share class you own. Then simply divide your account value by $1,000 (for example, an $8,600 account value divided by $1,000 = 8.6), then multiply the result by the number under the heading “Expenses Paid During Period” to estimate the expenses you paid on your account during this period.
If you hold Investor Class shares of any American Century Investments fund, or Institutional Class shares of the American Century Diversified Bond Fund, in an American Century Investments account (i.e., not a financial intermediary or retirement plan account), American Century Investments may charge you a $12.50 semiannual account maintenance fee if the value of those shares is less than $10,000. We will redeem shares automatically in one of your accounts to pay the $12.50 fee. In determining your total eligible investment amount, we will include your investments in all personal accounts (including American Century Investments Brokerage accounts) registered under your Social Security number. Personal accounts include individual accounts, joint accounts, UGMA/UTMA accounts, personal trusts, Coverdell Education Savings Accounts and IRAs (including traditional, Roth, Rollover, SEP-, SARSEP- and SIMPLE-IRAs), and certain other retirement accounts. If you have only business, business retirement, employer-sponsored or American Century Investments Brokerage accounts, you are currently not subject to this fee. If you are subject to the Account Maintenance Fee, your account value could be reduced by the fee amount.
Hypothetical Example for Comparison Purposes
The table also provides information about hypothetical account values and hypothetical expenses based on the actual expense ratio of each class of your fund and an assumed rate of return of 5% per year before expenses, which is not the actual return of a fund’s share class. The hypothetical account values and expenses may not be used to estimate the actual ending account balance or expenses you paid for the period. You may use this information to compare the ongoing costs of investing in your fund and other funds. To do so, compare this 5% hypothetical example with the 5% hypothetical examples that appear in the shareholder reports of the other funds.
Please note that the expenses shown in the table are meant to highlight your ongoing costs only and do not reflect any transactional costs, such as sales charges (loads) or redemption/exchange fees. Therefore, the table is useful in comparing ongoing costs only, and will not help you determine the relative total costs of owning different funds. In addition, if these transactional costs were included, your costs would have been higher.
Beginning 6/1/13 | Ending 11/30/13 | Expenses Paid During Period(1) 6/1/13 - 11/30/13 | Annualized | |
Actual | ||||
Institutional Class | $1,000 | $1,022.00 | $6.79 | 1.34% |
Institutional Class | $1,000 | $1,022.00(2) | $7.70 | 1.52% |
R6 Class (after waiver) | $1,000 | $1,078.80(3) | $4.08(4) | 1.12% |
R6 Class (before waiver) | $1,000 | $1,078.80(2)(3) | $4.99(4) | 1.37% |
Hypothetical | ||||
Institutional Class | $1,000 | $1,018.35 | $6.78 | 1.34% |
Institutional Class | $1,000 | $1,017.45 | $7.69 | 1.52% |
R6 Class (after waiver) | $1,000 | $1,019.45(5) | $5.67(5) | 1.12% |
R6 Class (before waiver) | $1,000 | $1,018.20(5) | $6.93(5) | 1.37% |
(1) | Expenses are equal to the class’s annualized expense ratio listed in the table above, multiplied by the average account value over the period, multiplied by 183, the number of days in the most recent fiscal half-year, divided by 365, to reflect the one-half year period. |
(2) | Ending account value assumes the return earned after waiver and would have been lower if a portion of the management fee had not been waived. |
(3) | Ending account value based on actual return from July 26, 2013 (commencement of sale) through November 30, 2013. |
(4) | Expenses are equal to the class’s annualized expense ratio listed in the table above, multiplied by the average account value over the period, multiplied by 128, the number of days in the period from July 26, 2013 (commencement of sale) through November 30, 2013, divided by 365, to reflect the period. Had the class been available for the full period, the expenses paid during the period would have been higher. |
(5) | Ending account value and expenses paid during the period assumes the class had been available throughout the entire period and are calculated using the class’s annualized expense ratio listed in the table above. |
Schedule of Investments |
NOVEMBER 30, 2013
Shares | Value | |
Common Stocks — 97.8% | ||
BRAZIL — 8.0% | ||
Anhanguera Educacional Participacoes SA | 453,400 | $3,022,343 |
BRF SA ADR | 109,600 | 2,433,120 |
Cia Brasileira de Distribuicao Grupo Pao de Acucar ADR | 75,430 | 3,551,245 |
Hypermarcas SA | 395,500 | 3,198,903 |
Itau Unibanco Holding SA ADR | 550,474 | 7,745,169 |
Ultrapar Participacoes SA | 74,400 | 1,839,083 |
21,789,863 | ||
CANADA — 0.9% | ||
Pacific Rubiales Energy Corp. | 125,890 | 2,339,963 |
CHILE — 0.6% | ||
SACI Falabella | 189,938 | 1,742,063 |
CHINA — 21.4% | ||
Brilliance China Automotive Holdings Ltd. | 2,274,000 | 3,977,458 |
China Communications Services Corp. Ltd. H Shares | 3,108,000 | 2,036,574 |
China Oilfield Services Ltd. H Shares | 1,200,000 | 3,622,034 |
China Overseas Land & Investment Ltd. | 1,784,000 | 5,545,840 |
China Railway Construction Corp. Ltd. H Shares | 2,721,500 | 3,050,588 |
CNOOC Ltd. | 3,044,000 | 6,235,203 |
ENN Energy Holdings Ltd. | 574,000 | 4,042,592 |
Great Wall Motor Co. Ltd. H Shares | 621,500 | 3,795,915 |
Haier Electronics Group Co. Ltd. | 789,000 | 1,858,374 |
Hengan International Group Co. Ltd. | 156,500 | 1,972,261 |
Industrial & Commercial Bank of China Ltd. H Shares | 4,920,095 | 3,534,957 |
Ping An Insurance Group Co. H Shares | 536,000 | 4,998,717 |
Shenzhou International Group Holdings Ltd. | 539,000 | 2,037,097 |
Tencent Holdings Ltd. | 196,300 | 11,353,802 |
58,061,412 | ||
COLOMBIA — 0.7% | ||
Cemex Latam Holdings SA(1) | 239,990 | 1,778,808 |
HONG KONG — 1.5% | ||
Xinyi Glass Holdings Ltd. | 3,834,000 | 4,055,285 |
INDIA — 3.3% | ||
HCL Technologies Ltd. | 102,680 | 1,784,453 |
HDFC Bank Ltd. | 172,092 | 1,821,163 |
Tata Global Beverages Ltd. | 581,024 | 1,384,453 |
Tata Motors Ltd. | 609,656 | 3,889,740 |
8,879,809 | ||
INDONESIA — 2.0% | ||
PT AKR Corporindo Tbk | 2,703,000 | 1,056,345 |
PT Bank Rakyat Indonesia (Persero) Tbk | 2,525,000 | 1,572,518 |
PT Matahari Department Store Tbk(1) | 1,617,500 | 1,561,724 |
PT Semen Gresik (Persero) Tbk | 1,127,000 | 1,205,902 |
5,396,489 | ||
MALAYSIA — 2.2% | ||
Axiata Group Bhd | 1,634,700 | 3,408,372 |
Sapurakencana Petroleum Bhd(1) | 2,021,800 | 2,691,133 |
6,099,505 | ||
MEXICO — 5.6% | ||
Alfa SAB de CV, Series A | 804,334 | 2,359,396 |
Alsea SAB de CV | 591,019 | 1,778,259 |
Cemex SAB de CV ADR(1) | 205,559 | 2,246,760 |
Gruma SAB de CV B Shares(1) | 330,850 | 2,319,720 |
Grupo Financiero Banorte SAB de CV | 433,634 | 2,957,429 |
Grupo Mexico SAB de CV | 599,230 | 1,777,391 |
Promotora y Operadora de Infraestructura SAB de CV(1) | 161,601 | 1,902,782 |
15,341,737 | ||
PANAMA — 1.0% | ||
Copa Holdings SA Class A | 17,643 | 2,671,503 |
PERU — 0.9% | ||
Credicorp Ltd. | 18,754 | 2,409,889 |
PHILIPPINES — 1.4% | ||
SM Investments Corp. | 120,165 | 2,072,520 |
Universal Robina Corp. | 647,750 | 1,783,070 |
3,855,590 | ||
POLAND — 1.1% | ||
Powszechny Zaklad Ubezpieczen SA | 19,548 | 2,970,148 |
RUSSIA — 8.4% | ||
Eurasia Drilling Co. Ltd. GDR | 59,258 | 2,583,649 |
Magnit OJSC GDR | 72,852 | 4,800,947 |
Mail.ru Group Ltd. GDR | 57,337 | 2,370,885 |
Shares | Value |
MegaFon OAO GDR | 48,110 | $1,552,029 |
NovaTek OAO GDR | 29,259 | 3,847,558 |
Sberbank of Russia | 1,646,050 | 5,128,991 |
Yandex NV A Shares(1) | 60,505 | 2,405,074 |
22,689,133 | ||
SOUTH AFRICA — 6.1% | ||
Aspen Pharmacare Holdings Ltd. | 143,406 | 3,696,682 |
Discovery Holdings Ltd. | 213,728 | 1,709,489 |
Mr Price Group Ltd. | 151,010 | 2,297,406 |
MTN Group Ltd. | 75,380 | 1,467,018 |
Naspers Ltd. N Shares | 76,482 | 7,303,296 |
16,473,891 | ||
SOUTH KOREA — 15.1% | ||
GS Retail Co. Ltd. | 85,160 | 2,277,263 |
Hankook Tire Co. Ltd. | 29,920 | 1,766,985 |
Hotel Shilla Co. Ltd. | 27,440 | 1,781,279 |
Hyundai Motor Co. | 5,690 | 1,354,890 |
Hyundai Wia Corp. | 7,950 | 1,427,289 |
LG Chem Ltd. | 8,710 | 2,390,867 |
NAVER Corp. | 5,070 | 3,315,166 |
Orion Corp. | 1,820 | 1,551,205 |
Samsung Electronics Co. Ltd. | 13,521 | 19,087,569 |
Seoul Semiconductor Co. Ltd. | 70,700 | 2,792,460 |
SK Hynix, Inc.(1) | 42,230 | 1,412,588 |
Sung Kwang Bend Co. Ltd. | 67,080 | 1,752,586 |
40,910,147 | ||
TAIWAN — 11.1% | ||
Chailease Holding Co. Ltd. | 890,001 | 2,366,800 |
Eclat Textile Co. Ltd. | 365,820 | 4,660,206 |
Ginko International Co. Ltd. | 106,000 | 2,263,702 |
MediaTek, Inc. | 416,000 | 6,128,810 |
Merida Industry Co. Ltd. | 431,000 | 3,204,028 |
Merry Electronics Co. Ltd. | 222,000 | 960,195 |
Taiwan Semiconductor Manufacturing Co. Ltd. | 2,985,774 | 10,593,575 |
30,177,316 | ||
THAILAND — 3.1% | ||
Kasikornbank PCL NVDR | 445,600 | 2,345,263 |
Minor International PCL | 2,711,100 | 2,051,689 |
Shin Corp. PCL NVDR | 688,600 | 1,661,990 |
Siam Cement PCL NVDR | 183,700 | 2,254,058 |
8,313,000 | ||
TURKEY — 2.7% | ||
BIM Birlesik Magazalar AS | 77,006 | $1,737,450 |
Pegasus Hava Tasimaciligi AS(1) | 145,595 | 3,047,262 |
TAV Havalimanlari Holding AS | 224,528 | 1,671,975 |
Tofas Turk Otomobil Fabrikasi | 153,232 | 1,004,589 |
7,461,276 | ||
TURKMENISTAN — 0.7% | ||
Dragon Oil plc | 209,013 | 1,946,025 |
TOTAL COMMON STOCKS (Cost $214,645,262) | 265,362,852 | |
Exchange-Traded Funds — 1.4% | ||
iShares MSCI Emerging Markets Index Fund (Cost $3,820,069) | 94,460 | 4,000,381 |
Temporary Cash Investments — 1.7% | ||
Repurchase Agreement, Bank of America Merrill Lynch, (collateralized by various U.S. Treasury obligations, 0.375%, 6/30/15, valued at $738,397), in a joint trading account at 0.06%, dated 11/29/13, due 12/2/13 (Delivery value $723,565) | 723,561 | |
Repurchase Agreement, Credit Suisse First Boston, Inc., (collateralized by various U.S. Treasury obligations, 2.75%, 11/15/42, valued at $883,042), in a joint trading account at 0.03%, dated 11/29/13, due 12/2/13 (Delivery value $868,275) | 868,273 | |
Repurchase Agreement, Goldman Sachs & Co., (collateralized by various U.S. Treasury obligations, 0.00%, 5/29/14, valued at $738,742), in a joint trading account at 0.04%, dated 11/29/13, due 12/2/13 (Delivery value $724,275) | 724,273 | |
SSgA U.S. Government Money Market Fund | 2,278,946 | 2,278,946 |
TOTAL TEMPORARY CASH INVESTMENTS (Cost $4,595,053) | 4,595,053 | |
TOTAL INVESTMENT SECURITIES — 100.9% (Cost $223,060,384) | 273,958,286 | |
OTHER ASSETS AND LIABILITIES — (0.9)% | (2,561,091) | |
TOTAL NET ASSETS — 100.0% | $271,397,195 | |
Market Sector Diversification | |
(as a % of net assets) | |
Information Technology | 22.6% |
Consumer Discretionary | 20.0% |
Financials | 17.3% |
Consumer Staples | 9.8% |
Energy | 9.2% |
Industrials | 7.3% |
Materials | 4.2% |
Telecommunication Services | 3.7% |
Health Care | 2.2% |
Utilities | 1.5% |
Exchange-Traded Funds | 1.4% |
Cash and Equivalents* | 0.8% |
* Includes temporary cash investments and other assets and liabilities.
Notes to Schedule of Investments
ADR = American Depositary Receipt
GDR = Global Depositary Receipt
NVDR = Non-Voting Depositary Receipt
OJSC = Open Joint Stock Company
(1) | Non-income producing. |
See Notes to Financial Statements.
Statement of Assets and Liabilities |
NOVEMBER 30, 2013 | ||
Assets | ||
Investment securities, at value (cost of $223,060,384) | $273,958,286 | |
Foreign currency holdings, at value (cost of $72,073) | 72,141 | |
Receivable for capital shares sold | 12,062 | |
Dividends and interest receivable | 31,246 | |
Other assets | 12,478 | |
| 274,086,213 | ||
Liabilities | ||
Disbursements in excess of demand deposit cash | 2,363,788 | |
Payable for investments purchased | 24 | |
Payable for capital shares redeemed | 198 | |
Accrued management fees | 270,988 | |
Accrued foreign taxes | 54,020 | |
| 2,689,018 | ||
Net Assets | $271,397,195 | |
Net Assets Consist of: | ||
Capital (par value and paid-in surplus) | $233,025,067 | |
Undistributed net investment income | 379,863 | |
Accumulated net realized loss | (12,845,059 | ) |
Net unrealized appreciation | 50,837,324 | |
| $271,397,195 | ||
Net assets | Shares outstanding | Net asset value per share | |
Institutional Class, $0.01 Par Value | $269,117,351 | 25,211,434 | $10.67 |
R6 Class, $0.01 Par Value | $2,279,844 | 213,373 | $10.68 |
See Notes to Financial Statements.
Statement of Operations |
YEAR ENDED NOVEMBER 30, 2013 | ||
Investment Income (Loss) | ||
Income: | ||
Dividends (net of foreign taxes withheld of $388,071) | $3,961,025 | |
Interest | 1,848 | |
| 3,962,873 | ||
Expenses: | ||
Management fees | 3,319,620 | |
Directors’ fees and expenses | 7,521 | |
Other expenses | 4,280 | |
| 3,331,421 | ||
Fees waived | (215,907 | ) |
| 3,115,514 | ||
Net investment income (loss) | 847,359 | |
Realized and Unrealized Gain (Loss) | ||
Net realized gain (loss) on: | ||
Investment transactions | (159,446 | ) |
Foreign currency transactions | (349,564 | ) |
| (509,010 | ) | |
Change in net unrealized appreciation (depreciation) on: | ||
Investments (includes (increase) decrease in accrued foreign taxes of $(30,293)) | 14,905,936 | |
Translation of assets and liabilities in foreign currencies | (2,905 | ) |
| 14,903,031 | ||
Net realized and unrealized gain (loss) | 14,394,021 | |
Net Increase (Decrease) in Net Assets Resulting from Operations | $15,241,380 | |
See Notes to Financial Statements.
Statement of Changes in Net Assets |
YEARS ENDED NOVEMBER 30, 2013 AND NOVEMBER 30, 2012 | |||||
Increase (Decrease) in Net Assets | November 30, 2013 | November 30, 2012 | |||
Operations | |||||
Net investment income (loss) | $847,359 | $747,069 | |||
Net realized gain (loss) | (509,010 | ) | (6,733,807 | ) | |
Change in net unrealized appreciation (depreciation) | 14,903,031 | 24,065,421 | |||
Net increase (decrease) in net assets resulting from operations | 15,241,380 | 18,078,683 | |||
Distributions to Shareholders | |||||
From net investment income: | |||||
Institutional Class | (935,022 | ) | (117,035 | ) | |
Capital Share Transactions | |||||
Net increase (decrease) in net assets from capital share transactions | 87,813,658 | 31,634,007 | |||
Net increase (decrease) in net assets | 102,120,016 | 49,595,655 | |||
Net Assets | |||||
Beginning of period | 169,277,179 | 119,681,524 | |||
End of period | $271,397,195 | $169,277,179 | |||
Undistributed net investment income | $379,863 | $559,625 | |||
See Notes to Financial Statements.
Notes to Financial Statements |
November 30, 2013
1. Organization
American Century World Mutual Funds, Inc. (the corporation) is registered under the Investment Company Act of 1940, as amended (the 1940 Act), as an open-end management investment company and is organized as a Maryland corporation. NT Emerging Markets Fund (the fund) is one fund in a series issued by the corporation. The fund is diversified as defined under the 1940 Act. The fund’s investment objective is to seek capital growth. The fund is not permitted to invest in securities issued by companies assigned the Global Industry Classification Standard for the tobacco industry.
The fund offers the Institutional Class and the R6 Class, which have different fees and expenses. The difference in the fee structures between the classes is not the result of any difference in advisory or custodial fees or other expenses related to management of the fund’s assets, which do not vary by class. The fund’s R6 Class shares are available for purchase exclusively by certain American Century Investments funds of funds that are offered only through employer-sponsored retirement plans where a financial intermediary provides retirement recordkeeping services to plan participants. Because financial intermediaries do not receive any service, distribution or administrative fees for offering such funds of funds, American Century Investment Management, Inc. (ACIM) (the investment advisor) is able to charge the R6 Class a lower unified management fee. Sale of the R6 Class commenced on July 26, 2013.
2. Significant Accounting Policies
The following is a summary of significant accounting policies consistently followed by the fund in preparation of its financial statements. The financial statements are prepared in conformity with accounting principles generally accepted in the United States of America, which may require management to make certain estimates and assumptions at the date of the financial statements. Actual results could differ from these estimates.
Investment Valuations — The fund determines the fair value of its investments and computes its net asset value per share at the close of regular trading (usually 4 p.m. Eastern time) on the New York Stock Exchange (NYSE) on each day the NYSE is open. The Board of Directors has adopted valuation policies and procedures to guide the investment advisor in the fund’s investment valuation process and to provide methodologies for the oversight of the fund’s pricing function.
Equity securities that are listed or traded on a domestic securities exchange are valued at the last reported sales price or at the official closing price as provided by the exchange. Equity securities traded on foreign securities exchanges are generally valued at the closing price of such securities on the exchange where primarily traded or at the close of the NYSE, if that is earlier. If no last sales price is reported, or if local convention or regulation so provides, the mean of the latest bid and asked prices may be used. Securities traded over-the-counter are valued at the mean of the latest bid and asked prices, the last sales price, or the official closing price. Equity securities initially expressed in local currencies are translated into U.S. dollars at the mean of the appropriate currency exchange rate at the close of the NYSE as provided by an independent pricing service.
Fixed income securities maturing within 60 days at the time of purchase may be valued at cost, plus or minus any amortized discount or premium or at the evaluated mean as provided by an independent pricing service. Evaluated mean prices are commonly derived through utilization of market models, which may consider, among other factors: trade data, quotations from dealers and active market makers, relevant yield curve and spread data, related sector levels, creditworthiness, trade data or market information on comparable securities, and other relevant security specific information.
Open-end management investment companies are valued at the reported net asset value per share. Repurchase agreements are valued at cost, which approximates fair value.
If the fund determines that the market price for an investment is not readily available or the valuation methods mentioned above do not reflect an investment’s fair value, such investment is valued as determined in good faith by the Board of Directors or its delegate, in accordance with policies and procedures adopted by the Board of Directors. In its determination of fair value, the fund may review several factors including, but not limited to, market information regarding the specific investment or comparable investments and correlation with other investment types, futures indices or general market indicators. Circumstances that may cause the fund to use these procedures to value an investment include, but are not limited to: an investment has been declared in default or is distressed; trading in a security has been suspended during the trading day or a security is not actively trading on its principal exchange; prices received from a regular pricing source are deemed unreliable; or there is a foreign market holiday and no trading occurred.
The fund monitors for significant events occurring after the close of an investment’s primary exchange but before the fund’s net asset value per share is determined. Significant events may include, but are not limited to: corporate announcements and transactions; governmental action and political unrest that could impact a specific investment or an investment sector; or armed conflicts, natural disasters and similar events that could affect investments in a specific country or region. The fund also monitors for significant fluctuations in domestic and foreign markets, as evidenced by the U.S. market or such other indicators that the Board of Directors, or its delegate, deems appropriate. If significant fluctuations in foreign markets are identified, the fund may apply a model-derived factor to the closing price of equity securities traded on foreign securities exchanges. The factor is based on observable market data as provided by an independent pricing service.
Security Transactions — Security transactions are accounted for as of the trade date. Net realized gains and losses are determined on the identified cost basis, which is also used for federal income tax purposes. Certain countries impose taxes on realized gains on the sale of securities registered in their country. The fund records the foreign tax expense, if any, on an accrual basis. The foreign tax expense on realized gains and unrealized appreciation reduces the net realized gain (loss) on investment transactions and net unrealized appreciation (depreciation) on investments, respectively.
Investment Income — Dividend income less foreign taxes withheld, if any, is recorded as of the ex-dividend date. Distributions received on securities that represent a return of capital or long-term capital gain are recorded as a reduction of cost of investments and/or as a realized gain. The fund may estimate the components of distributions received that may be considered nontaxable distributions or long-term capital gain distributions for income tax purposes. Interest income is recorded on the accrual basis and includes accretion of discounts and amortization of premiums.
Foreign Currency Translations — All assets and liabilities initially expressed in foreign currencies are translated into U.S. dollars at prevailing exchange rates at period end. The fund may enter into spot foreign currency exchange contracts to facilitate transactions denominated in a foreign currency. Purchases and sales of investment securities, dividend and interest income, spot foreign currency exchange contracts, and expenses are translated at the rates of exchange prevailing on the respective dates of such transactions. Net realized and unrealized foreign currency exchange gains or losses related to investment securities are a component of net realized gain (loss) on investment transactions and change in net unrealized appreciation (depreciation) on investments, respectively.
Repurchase Agreements — The fund may enter into repurchase agreements with institutions that ACIM has determined are creditworthy pursuant to criteria adopted by the Board of Directors. The fund requires that the collateral, represented by securities, received in a repurchase transaction be transferred to the custodian in a manner sufficient to enable the fund to obtain those securities in the event of a default under the repurchase agreement. ACIM monitors, on a daily basis, the securities transferred to ensure the value, including accrued interest, of the securities under each repurchase agreement is equal to or greater than amounts owed to the fund under each repurchase agreement.
Joint Trading Account — Pursuant to an Exemptive Order issued by the Securities and Exchange Commission, the fund, along with certain other funds in the American Century Investments family of funds, may transfer uninvested cash balances into a joint trading account. These balances are invested in one or more repurchase agreements that are collateralized by U.S. Treasury or Agency obligations.
Income Tax Status — It is the fund’s policy to distribute substantially all net investment income and net realized gains to shareholders and to otherwise qualify as a regulated investment company under provisions of the Internal Revenue Code. Accordingly, no provision has been made for income taxes. The fund files U.S. federal, state, local and non-U.S. tax returns as applicable. The fund’s tax returns are subject to examination by the relevant taxing authority until expiration of the applicable statute of limitations, which is generally three years from the date of filing but can be longer in certain jurisdictions. At this time, management believes there are no uncertain tax positions which, based on their technical merit, would not be sustained upon examination and for which it is reasonably possible that the total amounts of unrecognized tax benefits will significantly change in the next twelve months.
Multiple Class — All shares of the fund represent an equal pro rata interest in the net assets of the class to which such shares belong, and have identical voting, dividend, liquidation and other rights and the same terms and conditions, except for class specific expenses and exclusive rights to vote on matters affecting only individual classes. Income, non-class specific expenses, and realized and unrealized capital gains and losses of the fund are allocated to each class of shares based on their relative net assets.
Distributions to Shareholders — Distributions from net investment income and net realized gains, if any, are generally declared and paid annually. The fund may make distributions on a more frequent basis to comply with the distribution requirements of the Internal Revenue Code, in all events in a manner consistent with provisions of the 1940 Act.
Indemnifications — Under the corporation’s organizational documents, its officers and directors are indemnified against certain liabilities arising out of the performance of their duties to the fund. In addition, in the normal course of business, the fund enters into contracts that provide general indemnifications. The maximum exposure under these arrangements is unknown as this would involve future claims that may be made against a fund. The risk of material loss from such claims is considered by management to be remote.
3. Fees and Transactions with Related Parties
Management Fees — The corporation has entered into a management agreement with ACIM, under which ACIM provides the fund with investment advisory and management services in exchange for a single, unified management fee (the fee) per class. The agreement provides that all expenses of managing and operating the fund, except distribution and service fees, brokerage expenses, taxes, interest, fees and expenses of the independent directors (including legal counsel fees), and extraordinary expenses, will be paid by ACIM. The fee is computed and accrued daily based on each class’s daily net assets and paid monthly in arrears. The rate of the fee is determined by applying a fee rate calculation formula. This formula takes into account the fund’s assets as well as certain assets, if any, of other clients of the investment advisor outside the American Century Investments family of funds (such as subadvised funds and separate accounts) that have very similar investment teams and investment strategies (strategy assets). The strategy assets of the fund include the assets of Emerging Markets Fund, one fund in a series issued by the corporation. The annual management fee schedule ranges from 1.050% to 1.650% for the Institutional Class and 0.900% to 1.500% for the R6 Class. Effective July 26, 2013, the investment advisor voluntarily agreed to waive 0.250% of its management fee. The investment advisor expects the fee waiver to continue through March 31, 2015, and cannot terminate it without the approval of the Board of Directors. The total amount of the waiver for each class for the period ended November 30, 2013 was $215,281 and $626 for the Institutional Class and R6 Class, respectively. The effective annual management fee before waiver for each class for the period ended November 30, 2013 was 1.51% for the Institutional Class and 1.36% for the R6 Class. The effective annual management fee after waiver for each class for the period ended November 30, 2013, 2013 was 1.41% for the Institutional Class and 1.11% for the R6 Class.
Acquired Fund Fees and Expenses — The fund may invest in mutual funds, exchange-traded funds, and business development companies (the acquired funds). The fund will indirectly realize its pro rata share of the fees and expenses of the acquired funds in which it invests. These indirect fees and expenses are not paid out of the fund’s assets but are reflected in the return realized by the fund on its investment in the acquired funds.
Related Parties — Certain officers and directors of the corporation are also officers and/or directors of American Century Companies, Inc. (ACC). The corporation’s investment advisor, ACIM, the corporation’s distributor, American Century Investment Services, Inc., and the corporation’s transfer agent, American Century Services, LLC, are wholly owned, directly or indirectly, by ACC. Various funds in a series issued by American Century Asset Allocation Portfolios, Inc. own, in aggregate, 100% of the shares of the fund. Related parties do not invest in the fund for the purpose of exercising management or control.
4. Investment Transactions
Purchases and sales of investment securities, excluding short-term investments, for the year ended November 30, 2013 were $249,952,730 and $165,155,585, respectively.
5. Capital Share Transactions
Transactions in shares of the fund were as follows:
Year ended November 30, 2013(1) | Year ended November 30, 2012 | |||||||||||
Shares | Amount | Shares | Amount | |||||||||
Institutional Class/Shares Authorized | 100,000,000 | 100,000,000 | ||||||||||
Sold | 9,378,494 | $96,078,378 | 5,791,249 | $53,518,080 | ||||||||
Issued in reinvestment of distributions | 90,253 | 935,022 | 12,216 | 117,035 | ||||||||
Redeemed | (1,106,676 | ) | (11,438,585 | ) | (2,338,214 | ) | (22,001,108 | ) | ||||
| 8,362,071 | 85,574,815 | 3,465,251 | 31,634,007 | |||||||||
R6 Class/Shares Authorized | 50,000,000 | N/A | ||||||||||
Sold | 223,318 | 2,344,206 | ||||||||||
Redeemed | (9,945 | ) | (105,363 | ) | ||||||||
| 213,373 | 2,238,843 | |||||||||||
Net increase (decrease) | 8,575,444 | $87,813,658 | 3,465,251 | $31,634,007 | ||||||||
(1) | July 26, 2013 (commencement of sale) through November 30, 2013 for the R6 Class. |
6. Fair Value Measurements
The fund’s investments valuation process is based on several considerations and may use multiple inputs to determine the fair value of the investments held by the fund. In conformity with accounting principles generally accepted in the United States of America, the inputs used to determine a valuation are classified into three broad levels.
• | Level 1 valuation inputs consist of unadjusted quoted prices in an active market for identical investments. |
• | Level 2 valuation inputs consist of direct or indirect observable market data (including quoted prices for comparable investments, evaluations of subsequent market events, interest rates, prepayment speeds, credit risk, etc.). These inputs also consist of quoted prices for identical investments initially expressed in local currencies that are adjusted through translation into U.S. dollars. |
• | Level 3 valuation inputs consist of unobservable data (including a fund’s own assumptions). |
The level classification is based on the lowest level input that is significant to the fair valuation measurement. The valuation inputs are not necessarily an indication of the risks associated with investing in these securities or other financial instruments.
The following is a summary of the level classifications as of period end. The Schedule of Investments provides additional information on the fund’s portfolio holdings.
Level 1 | Level 2 | Level 3 | |
Assets | |||
Investment Securities | |||
Common Stocks | $23,462,760 | $241,900,092 | — |
Exchange-Traded Funds | 4,000,381 | — | — |
Temporary Cash Investments | 2,278,946 | 2,316,107 | — |
Total Value of Investment Securities | $29,742,087 | $244,216,199 | — |
7. Risk Factors
There are certain risks involved in investing in foreign securities. These risks include those resulting from future adverse political, social and economic developments, fluctuations in currency exchange rates, the possible imposition of exchange controls, and other foreign laws or restrictions. Investing in emerging markets may accentuate these risks.
8. Federal Tax Information
On December 17, 2013, the fund declared and paid the following per-share distributions from net investment income to shareholders of record on December 16, 2013:
Institutional Class | R6 Class |
$0.0264 | $0.0421 |
The tax character of distributions paid during the years ended November 30, 2013 and November 30, 2012 were as follows:
2013 | 2012 | |
Distributions Paid From | ||
Ordinary income | $935,022 | $117,035 |
Long-term capital gains | — | — |
The book-basis character of distributions made during the year from net investment income or net realized gains may differ from their ultimate characterization for federal income tax purposes. These differences reflect the differing character of certain income items and net realized gains and losses for financial statement and tax purposes, and may result in reclassification among certain capital accounts on the financial statements.
As of November 30, 2013, the federal tax cost of investments and the components of distributable earnings on a tax-basis were as follows:
Federal tax cost of investments | $225,424,283 |
Gross tax appreciation of investments | $51,928,616 |
Gross tax depreciation of investments | (3,394,613) |
Net tax appreciation (depreciation) of investments | $48,534,003 |
Net tax appreciation (depreciation) on translation of assets and liabilities in foreign currencies | $(60,578) |
Net tax appreciation (depreciation) | $48,473,425 |
Undistributed ordinary income | $1,131,085 |
Accumulated short-term capital losses | $(11,232,382) |
The difference between book-basis and tax-basis unrealized appreciation (depreciation) is attributable primarily to the tax deferral of losses on wash sales.
Accumulated capital losses represent net capital loss carryovers that may be used to offset future realized capital gains for federal income tax purposes. Any unlimited losses will be required to be utilized prior to the losses which carry an expiration date. Future capital loss carryover utilization in any given year may be subject to Internal Revenue Code limitations. Capital loss carryovers of $(1,146,451) expire in 2017 and the remaining losses are unlimited.
Financial Highlights |
For a Share Outstanding Throughout the Years Ended November 30 (except as noted) | |||||||||||||
Per-Share Data | Ratios and Supplemental Data | ||||||||||||
Income From Investment Operations: | Ratio to Average Net Assets of: | ||||||||||||
Net Beginning | Net | Net | Total From | Distributions | Net | Total | Operating | Operating | Net | Net Income (Loss) waiver) | Portfolio | Net | |
Institutional Class | |||||||||||||
2013 | $10.05 | 0.04 | 0.63 | 0.67 | (0.05) | $10.67 | 6.66% | 1.42% | 1.52% | 0.38% | 0.28% | 76% | $269,117 |
2012 | $8.94 | 0.05 | 1.07 | 1.12 | (0.01) | $10.05 | 12.51% | 1.54% | 1.54% | 0.50% | 0.50% | 101% | $169,277 |
2011 | $10.24 | 0.04 | (1.34) | (1.30) | — | $8.94 | (12.70)% | 1.52% | 1.52% | 0.37% | 0.37% | 87% | $119,682 |
2010 | $8.86 | 0.02 | 1.37 | 1.39 | (0.01) | $10.24 | 15.73% | 1.52% | 1.52% | 0.19% | 0.19% | 94% | $91,110 |
2009 | $5.12 | 0.02 | 3.74 | 3.76 | (0.02) | $8.86 | 73.87% | 1.57% | 1.57% | 0.36% | 0.36% | 158% | $60,311 |
R6 Class | |||||||||||||
2013(3) | $9.90 | (0.01) | 0.79 | 0.78 | — | $10.68 | 7.88% | 1.12%(4) | 1.37%(4) | (0.37)%(4) | (0.62)%(4) | 76%(5) | $2,280 |
Notes to Financial Highlights
(1) | Computed using average shares outstanding throughout the period. |
(2) | Total returns are calculated based on the net asset value of the last business day. Total returns for periods less than one year are not annualized. |
(3) | July 26, 2013 (commencement of sale) through November 30, 2013. |
(4) | Annualized. |
(5) | Portfolio turnover is calculated at the fund level. Percentage indicated was calculated for the year ended November 30, 2013. |
See Notes to Financial Statements.
Report of Independent Registered Public Accounting Firm |
To the Board of Directors and Shareholders of
American Century World Mutual Funds, Inc.:
We have audited the accompanying statement of assets and liabilities, including the schedule of investments, of NT Emerging Markets Fund (the “Fund”), one of the funds constituting American Century World Mutual Funds, Inc., as of November 30, 2013, and the related statement of operations for the year then ended, the statements of changes in net assets for each of the two years in the period then ended, and the financial highlights for each of the periods presented. These financial statements and financial highlights are the responsibility of the Fund’s management. Our responsibility is to express an opinion on these financial statements and financial highlights based on our audits.
We conducted our audits in accordance with the standards of the Public Company Accounting Oversight Board (United States). Those standards require that we plan and perform the audit to obtain reasonable assurance about whether the financial statements and financial highlights are free of material misstatement. The Fund is not required to have, nor were we engaged to perform, an audit of its internal control over financial reporting. Our audits included consideration of internal control over financial reporting as a basis for designing audit procedures that are appropriate in the circumstances, but not for the purpose of expressing an opinion on the effectiveness of the Fund’s internal control over financial reporting. Accordingly, we express no such opinion. An audit also includes examining, on a test basis, evidence supporting the amounts and disclosures in the financial statements, assessing the accounting principles used and significant estimates made by management, as well as evaluating the overall financial statement presentation. Our procedures included confirmation of securities owned as of November 30, 2013, by correspondence with the custodian and brokers; where replies were not received from brokers, we performed other auditing procedures. We believe that our audits provide a reasonable basis for our opinion.
In our opinion, the financial statements and financial highlights referred to above present fairly, in all material respects, the financial position of NT Emerging Markets Fund of American Century World Mutual Funds, Inc. as of November 30, 2013, the results of its operations for the year then ended, the changes in its net assets for each of the two years in the period then ended, and the financial highlights for each of the periods presented, in conformity with accounting principles generally accepted in the United States of America.
Deloitte & Touche LLP
Kansas City, Missouri
January 17, 2014
Management |
The Board of Directors
The individuals listed below serve as directors of the funds. Each director will continue to serve in this capacity until death, retirement, resignation or removal from office. The board has adopted a mandatory retirement age for directors who are not “interested persons,” as that term is defined in the Investment Company Act (independent directors). Independent directors shall retire by December 31 of the year in which they reach their 75th birthday. Mr. Pratt may serve until December 31 of the year in which he reaches his 76th birthday based on an extension granted under previous retirement guidelines.
Mr. Thomas is an “interested person” because he currently serves as President and Chief Executive Officer of American Century Companies, Inc. (ACC), the parent company of American Century Investment Management, Inc. (ACIM or the advisor). Mr. Fink is treated as an “interested person” because of his recent employment with ACC and American Century Services, LLC (ACS). The other directors (more than three-fourths of the total number) are independent. They are not employees, directors or officers of, and have no financial interest in, ACC or any of its wholly owned, direct or indirect, subsidiaries, including ACIM, American Century Investment Services, Inc. (ACIS) and ACS, and do not have any other affiliations, positions, or relationships that would cause them to be considered “interested persons” under the Investment Company Act. The directors serve in this capacity for seven (in the case of Mr. Thomas, 15) registered investment companies in the American Century Investments family of funds.
The following table presents additional information about the directors. The mailing address for each director is 4500 Main Street, Kansas City, Missouri 64111.
Name | Position(s) Held with Funds | Length of Time Served | Principal Occupation(s) During Past 5 Years | Number of American Century Portfolios Overseen by Director | Other Directorships Held During Past 5 Years | |
Independent Directors | ||||||
Thomas A. Brown | Director | Since 1980 | Managing Member, Associated Investments, LLC (real estate investment company); Brown Cascade Properties, LLC (real estate investment company) (2001 to 2009) | 75 | None | |
Andrea C. Hall | Director | Since 1997 | Retired | 75 | None | |
Jan M. Lewis (1957) | Director | Since 2011 | President and Chief Executive Officer, Catholic Charities of Northeast Kansas (human services organization) | 75 | None | |
James A. Olson (1942) | Director | Since 2007 | Member, Plaza Belmont LLC (private equity fund manager) | 75 | Saia, Inc. (2002 to 2012) and EPR Properties (2003 to 2013) | |
Donald H. Pratt(1) (1937) | Director and Chairman of the Board | Since 1995 (Chairman since 2005) | Chairman and Chief Executive Officer, Western Investments, Inc. (real estate company) | 75 | None | |
Name | Position(s) Held with Funds | Length of Time Served | Principal Occupation(s) During Past 5 Years | Number of American Century Portfolios Overseen by Director | Other Directorships Held During Past 5 Years | |
Independent Directors | ||||||
M. Jeannine Strandjord | Director | Since 1994 | Retired | 75 | Euronet Worldwide Inc.; Charming Shoppes, Inc. (2006 to 2010); and DST Systems Inc. (1996 to 2012) | |
John R. Whitten | Director | Since 2008 | Retired | 75 | Rudolph Technologies, Inc. | |
Stephen E. Yates | Director | Since 2012 | Retired; Executive Vice President, Technology & Operations, KeyCorp. (computer services) (2004 to 2010) | 75 | Applied Industrial Technologies, Inc. (2001 to 2010) | |
Interested Directors | ||||||
Barry Fink | Director | Since 2012 | Retired; Executive Vice President, ACC (September 2007 to February 2013); President, ACS (October 2007 to February 2013); Chief Operating Officer, ACC (September 2007 to November 2012) | 75 | None | |
Jonathan S. Thomas | Director and President | Since 2007 | President and Chief Executive Officer, ACC (March 2007 to present). Also serves as Chief Executive Officer and Manager, ACS; Executive Vice President, ACIM; Director, ACC, ACIM and other ACC subsidiaries | 117 | None | |
(1) | Donald H. Pratt will retire as Director and Chairman of the Board effective December 31, 2013. |
Officers
The following table presents certain information about the executive officers of the funds. Each officer serves as an officer for each of the 15 investment companies in the American Century family of funds, unless otherwise noted. No officer is compensated for his or her service as an officer of the funds. The listed officers are interested persons of the funds and are appointed or re-appointed on an annual basis. The mailing address for each officer listed below is 4500 Main Street, Kansas City, Missouri 64111.
Name (Year of Birth) | Offices with the Funds | Principal Occupation(s) During the Past Five Years |
Jonathan S. Thomas | Director and President since 2007 | President and Chief Executive Officer, ACC (March 2007 to present). Also serves as Chief Executive Officer and Manager, ACS; Executive Vice President, ACIM; Director, ACC, ACIM and other ACC subsidiaries |
Maryanne L. Roepke | Chief Compliance Officer since 2006 and Senior Vice President since 2000 | Chief Compliance Officer, American Century funds, ACIM and ACS (August 2006 to present). Also serves as Senior Vice President, ACS |
Charles A. Etherington | General Counsel since 2007 and Senior Vice President since 2006 | Attorney, ACC (February 1994 to present); Vice President, ACC (November 2005 to present); General Counsel, ACC (March 2007 to present). Also serves as General Counsel, ACIM, ACS, ACIS and other ACC subsidiaries; and Senior Vice President, ACIM and ACS |
C. Jean Wade | Vice President, Treasurer and Chief Financial Officer since 2012 | Vice President, ACS (February 2000 to present) |
Robert J. Leach | Vice President since 2006 and Assistant Treasurer since 2012 | Vice President, ACS (February 2000 to present) |
David H. Reinmiller | Vice President since 2000 | Attorney, ACC (January 1994 to present); Associate General Counsel, ACC (January 2001 to present). Also serves as Vice President, ACIM and ACS |
Ward D. Stauffer | Secretary since 2005 | Attorney, ACC (June 2003 to present) |
The Statement of Additional Information has additional information about the fund’s directors and is available without charge, upon request, by calling 1-800-345-2021.
Approval of Management Agreement |
At a meeting held on June 20, 2013, the Fund’s Board of Directors unanimously approved the renewal of the management agreement pursuant to which American Century Investment Management, Inc. (the “Advisor”) acts as the investment advisor for the Fund. Under Section 15(c) of the Investment Company Act, contracts for investment advisory services are required to be reviewed, evaluated, and approved by a majority of a fund’s directors (the “Directors”), including a majority of the independent Directors, each year.
Prior to its consideration of the renewal of the management agreement, the Board requested and reviewed extensive data and information compiled by the Advisor and certain independent providers of evaluation data concerning the Fund and the services provided to the Fund by the Advisor. This review was in addition to the oversight and evaluation undertaken by the Board and its committees on a continuous basis throughout the year.
In connection with its consideration of the renewal of the management agreement, the Board’s review and evaluation of the services provided by the Advisor included, but was not limited to, the following:
• | the nature, extent, and quality of investment management, shareholder services, and other services provided by the Advisor to the Fund; |
• | the wide range of other programs and services the Advisor provides to the Fund and its shareholders on a routine and non-routine basis; |
• | the investment performance of the Fund, including data comparing the Fund’s performance to appropriate benchmarks and/or a peer group of other mutual funds with similar investment objectives and strategies; |
• | data comparing the cost of owning the Fund to the cost of owning similar funds; |
• | the Advisor’s compliance policies, procedures, and regulatory experience; |
• | financial data showing the cost of services provided to the Fund, the profitability of the Fund to the Advisor, and the overall profitability of the Advisor; |
• | possible economies of scale associated with the Advisor’s management of the Fund and other accounts under its management; |
• | data comparing services provided and charges to other investment management clients of the Advisor; and |
• | consideration of collateral benefits derived by the Advisor from the management of the Fund. |
In keeping with its practice, the Board held two in-person meetings and one telephonic meeting to review and discuss the information provided. The Directors also had the benefit of the advice of independent counsel throughout the period.
Factors Considered
The Directors considered all of the information provided by the Advisor, the independent data providers, and independent counsel, and evaluated such information for the Fund. In connection with their review, the Directors did not identify any single factor as being all-important or controlling, and each Director may have attributed different levels of importance to different factors. In deciding to renew the management agreement, the Board based its decision on a number of factors, including the following:
Nature, Extent and Quality of Services - Generally. Under the management agreement, the Advisor is responsible for providing or arranging for all services necessary for the operation of the Fund. The Board noted that under the management agreement, the Advisor provides or arranges at its own expense a wide variety of services including:
• | constructing and designing the Fund |
• | portfolio research and security selection |
• | initial capitalization/funding |
• | securities trading |
• | Fund administration |
• | custody of Fund assets |
• | daily valuation of the Fund’s portfolio |
• | shareholder servicing and transfer agency, including shareholder confirmations, recordkeeping, and communications |
• | legal services |
• | regulatory and portfolio compliance |
• | financial reporting |
• | marketing and distribution |
The Board noted that many of these services have expanded over time both in terms of quantity and complexity in response to shareholder demands, competition in the industry, changing distribution channels, and the changing regulatory environment.
Investment Management Services. The nature of the investment management services provided to the Fund is quite complex and allows Fund shareholders access to professional money management, instant diversification of their investments within an asset class, the opportunity to easily diversify among asset classes by investing in or exchanging among various American Century Investments funds, and liquidity. In evaluating investment performance, the Board expects
the Advisor to manage the Fund in accordance with its investment objectives and approved strategies. Further, the Directors recognize that the Advisor has an obligation to monitor trading activities, and in particular to seek the best execution of fund trades, and to evaluate the use of and payment for research. In providing these services, the Advisor utilizes teams of investment professionals (portfolio managers, analysts, research assistants, and securities traders) who require extensive information technology, research, training, compliance and other systems to conduct their business. The Board, directly and through its Fund Performance Review Committee, regularly reviews investment performance information for the Fund, together with comparative information for appropriate benchmarks and/or peer groups of similarly-managed funds, over different time horizons. The Directors also review detailed performance information during the management agreement approval process. If performance concerns are identified, the Fund receives special reviews until performance improves, during which the Board discusses with the Advisor the reasons for such results (e.g., market conditions, security selection) and any efforts being undertaken to improve performance. Taking all these factors into consideration, the Board found the investment management services provided by the Advisor to the Fund to meet or exceed industry standards. More detailed information about the Fund’s performance can be found in the Performance and Portfolio Commentary sections of this report.
Shareholder and Other Services. Under the management agreement, the Advisor provides the Fund with a comprehensive package of transfer agency, shareholder, and other services. The Board, directly and through various committees of the Board, regularly reviews reports and evaluations of such services at its regular meetings. These reports include, but are not limited to, information regarding the operational efficiency and accuracy of the shareholder and transfer agency services provided, staffing levels, shareholder satisfaction (as measured by external as well as internal sources), technology support, new products and services offered to Fund shareholders, securities trading activities, portfolio valuation services, auditing services, and legal and operational compliance activities. Certain aspects of shareholder and transfer agency service level efficiency and the quality of securities trading activities are measured by independent third party providers and are presented in comparison to other fund groups not managed by the Advisor. The Board found the services provided by the Advisor to the Fund under the management agreement to be competitive and of high quality.
Costs of Services and Profitability. The Advisor provides detailed information concerning its cost of providing various services to the Fund, its profitability in managing the Fund, its overall profitability, and its financial condition. The Directors have reviewed with the Advisor the methodology used to prepare this financial information. The financial information regarding the Advisor is considered in evaluating the Advisor’s financial condition, its ability to continue to provide services under the management agreement, and the reasonableness of the current management fee. The Board concluded that the Advisor’s profits were reasonable in light of the services provided to the Fund.
Ethics. The Board generally considers the Advisor’s commitment to providing quality services to shareholders and to conducting its business ethically. They noted that the Advisor’s practices generally meet or exceed industry best practices.
Economies of Scale. The Board also reviewed information provided by the Advisor regarding the possible existence of economies of scale in connection with the management of the Fund. The Board concluded that economies of scale are difficult to measure and predict with precision, especially on a fund-by-fund basis. The Board concluded that the Advisor is appropriately sharing economies of scale through its competitive fee structure, offering competitive fees from fund inception, and through reinvestment in its business to provide shareholders additional content and services.
Comparison to Other Funds’ Fees. The management agreement provides that the Fund pay the Advisor a single, all-inclusive (or unified) management fee for providing all services necessary for the management and operation of the Fund, other than brokerage expenses, taxes, interest, extraordinary expenses, and the fees and expenses of the Fund’s independent directors (including their independent legal counsel) and expenses incurred in connection with the provision of shareholder services and distribution services under a plan adopted pursuant to Rule 12b-1 under the 1940 Act. Under the unified fee structure, the Advisor is responsible for providing all investment advisory, custody, audit, administrative, compliance, recordkeeping, marketing and shareholder services, or arranging and supervising third parties to provide such services. By contrast, most other funds are charged a variety of fees, including an investment advisory fee, a transfer agency fee, an administrative fee, distribution charges and other expenses. Other than their investment advisory fees and any applicable Rule 12b-1 distribution fees, all other components of the total fees charged by these other funds may be increased without shareholder approval. The Board believes the unified fee structure is a benefit to Fund shareholders because it clearly discloses to shareholders the cost of owning Fund shares, and, since the unified fee cannot be increased without a vote of Fund shareholders, it shifts to the Advisor the risk of increased costs of operating the Fund and provides a direct incentive to minimize administrative inefficiencies. Part of the Board’s analysis of fee levels involves reviewing certain evaluative data compiled by an independent provider and comparing the Fund’s unified fee to the total expense ratio of other funds in the Fund’s peer group. The Board concluded that the management fee paid by the Fund to the Advisor under the management agreement is reasonable in light of the services provided to the Fund.
Comparison to Fees and Services Provided to Other Clients of the Advisor. The Board also requested and received information from the Advisor concerning the nature of the services, fees, costs and profitability of its advisory services to advisory clients other than the Fund. They observed that these varying types of client accounts require different services and involve different regulatory and entrepreneurial risks than the management of the Fund. The Board analyzed this information and concluded that the fees charged and services provided to the Fund were reasonable by comparison.
Collateral or “Fall-Out” Benefits Derived by the Advisor. The Board considered the existence of collateral benefits the Advisor may receive as a result of its relationship with the Fund. They concluded that the Advisor’s primary business is managing mutual funds and it generally does not use fund or shareholder information to generate profits in other lines of business, and therefore does not derive any significant collateral benefits from them. The Board noted that the Advisor receives proprietary research from broker-dealers that execute fund
portfolio transactions and concluded that this research is likely to benefit Fund shareholders. The Board also determined that the Advisor is able to provide investment management services to certain clients other than the Fund, at least in part, due to its existing infrastructure built to serve the fund complex. The Board concluded, however, that the assets of those other clients are not material to the analysis and, where applicable, may be included with the assets of the Fund to determine breakpoints in the management fee schedule.
Existing Relationship. The Board also considered whether there was any reason for not continuing the existing arrangement with the Advisor. In this regard, the Board was mindful of the potential disruptions of the Fund’s operations and various risks, uncertainties, and other effects that could occur as a result of a decision not to continue such relationship. In particular, the Board recognized that most shareholders have invested in the Fund on the strength of the Advisor’s industry standing and reputation and in the expectation that the Advisor will have a continuing role in providing advisory services to the Fund.
Conclusion of the Directors. As a result of this process, the Board, including all of the independent directors, taking into account all of the factors discussed above and the information provided by the Advisor and others, concluded that the management agreement between the Fund and the Advisor is fair and reasonable in light of the services provided and should be renewed.
Additional Information |
Retirement Account Information
As required by law, distributions you receive from certain IRAs are subject to federal income tax withholding, unless you elect not to have withholding apply. Tax will be withheld on the total amount withdrawn even though you may be receiving amounts that are not subject to withholding, such as nondeductible contributions. In such case, excess amounts of withholding could occur. You may adjust your withholding election so that a greater or lesser amount will be withheld.
If you don’t want us to withhold on this amount, you must notify us to not withhold the federal income tax. You may notify us in writing or in certain situations by telephone or through other electronic means. For systematic withdrawals, your withholding election will remain in effect until revoked or changed by filing a new election. You have the right to revoke your election at any time.
Remember, even if you elect not to have income tax withheld, you are liable for paying income tax on the taxable portion of your withdrawal. If you elect not to have income tax withheld or you don’t have enough income tax withheld, you may be responsible for payment of estimated tax. You may incur penalties under the estimated tax rules if your withholding and estimated tax payments are not sufficient. You can reduce or defer the income tax on a distribution by directly or indirectly rolling such distribution over to another IRA or eligible plan. You should consult your tax advisor for additional information.
State tax will be withheld if, at the time of your distribution, your address is within one of the mandatory withholding states and you have federal income tax withheld (or as otherwise required by state law). State taxes will be withheld from your distribution in accordance with the respective state rules.
Distributions you receive from 403(b), 457 and qualified plans are subject to special tax and withholding rules. Your plan administrator or plan sponsor is required to provide you with a special tax notice explaining those rules at the time you request a distribution. If applicable, federal and/or state taxes may be withheld from your distribution amount.
Proxy Voting Policies
A description of the policies that the fund’s investment advisor uses in exercising the voting rights associated with the securities purchased and/or held by the fund is available without charge, upon request, by calling 1-800-345-2021. It is also available on the “About Us” page of American Century Investments’ website at americancentury.com and on the Securities and Exchange Commission’s website at sec.gov. Information regarding how the investment advisor voted proxies relating to portfolio securities during the most recent 12-month period ended June 30 is available on the “About Us” page at americancentury.com. It is also available at sec.gov.
Quarterly Portfolio Disclosure
The fund files its complete schedule of portfolio holdings with the Securities and Exchange Commission (SEC) for the first and third quarters of each fiscal year on Form N-Q. The fund’s Forms N-Q are available on the SEC’s website at sec.gov, and may be reviewed and copied at the SEC’s Public Reference Room in Washington, DC. Information on the operation of the Public Reference Room may be obtained by calling 1-800-SEC-0330. The fund also makes its complete schedule of portfolio holdings for the most recent quarter of its fiscal year available upon request by calling 1-800-345-2021.
Other Tax Information
The following information is provided pursuant to provisions of the Internal Revenue Code.
The fund hereby designates up to the maximum amount allowable as qualified dividend income for the fiscal year ended November 30, 2013.
For the fiscal year ended November 30, 2013, the fund intends to pass through to shareholders $387,297, or up to the maximum amount allowable, as a foreign tax credit which represents taxes paid on income derived from sources within foreign countries or possessions of the United States. During the fiscal year ended November 30, 2013, the fund earned $4,198,895 from income derived from foreign sources. Foreign source income and foreign tax expense per outstanding share on November 30, 2013 are $0.1651 and $0.0152, respectively.
Notes |
Notes |
![]()
Contact Us | americancentury.com |
Automated Information Line | 1-800-345-8765 |
Investor Services Representative | 1-800-345-2021 |
Investors Using Advisors | 1-800-378-9878 |
Business, Not-For-Profit, Employer-Sponsored Retirement Plans | 1-800-345-3533 |
Banks and Trust Companies, Broker-Dealers, Financial Professionals, Insurance Companies | 1-800-345-6488 |
Telecommunications Relay Service for the Deaf | 711 |
American Century World Mutual Funds, Inc.
Investment Advisor:
American Century Investment Management, Inc.
Kansas City, Missouri
This report and the statements it contains are submitted for the general information of our shareholders. The report is not authorized for distribution to prospective investors unless preceded or accompanied by an effective prospectus.
©2014 American Century Proprietary Holdings, Inc. All rights reserved.
CL-ANN-80798 1401
ITEM 2. CODE OF ETHICS.
(a) | The registrant has adopted a Code of Ethics for Senior Financial Officers that applies to the registrant’s principal executive officer, principal financial officer, principal accounting officer, and persons performing similar functions. |
(b) | No response required. |
(c) | None. |
(d) | None. |
(e) | Not applicable. |
(f) | The registrant’s Code of Ethics for Senior Financial Officers was filed as Exhibit 12 (a)(1) to American Century Asset Allocation Portfolios, Inc.’s Annual Certified Shareholder Report on Form N-CSR, File No. 811-21591, on September 29, 2005, and is incorporated herein by reference. |
ITEM 3. AUDIT COMMITTEE FINANCIAL EXPERT.
(a)(1) | The registrant’s board has determined that the registrant has at least one audit committee financial expert serving on its audit committee. |
(a)(2) | M. Jeannine Strandjord and Stephen E. Yates are the registrant’s designated audit committee financial experts. They are “independent” as defined in Item 3 of Form N-CSR. |
(a)(3) | Not applicable. |
(b) | No response required. |
(c) | No response required. |
(d) | No response required. |
ITEM 4. PRINCIPAL ACCOUNTANT FEES AND SERVICES.
(a) | Audit Fees. |
The aggregate fees billed for each of the last two fiscal years for professional services rendered by the principal accountant for the audit of the registrant’s annual financial statements or services that are normally provided by the accountant in connection with statutory and regulatory filings or engagements for those fiscal years were as follows:
FY 2012: $195,444
FY 2013: $211,026
(b) | Audit-Related Fees. |
The aggregate fees billed in each of the last two fiscal years for assurance and related services by the principal accountant that are reasonably related to the performance of the audit of the registrant’s financial statements and are not reported under paragraph (a) of this Item were as follows:
For services rendered to the registrant:
FY 2012: $0 FY 2013: $0 |
Fees required to be approved pursuant to paragraph (c)(7)(ii) of Rule 2-01 of Regulation S-X (relating to certain engagements for non-audit services with the registrant’s investment adviser and its affiliates):
FY 2012: $0 FY 2013: $0 |
(c) | Tax Fees. |
The aggregate fees billed in each of the last two fiscal years for professional services rendered by the principal accountant for tax compliance, tax advice, and tax planning were as follows:
For services rendered to the registrant:
FY 2012: $0
FY 2013: $0
Fees required to be approved pursuant to paragraph (c)(7)(ii) of Rule 2-01 of Regulation S-X (relating to certain engagements for non-audit services with the registrant’s investment adviser and its affiliates):
FY 2012: $0
FY 2013: $0
(d) | All Other Fees. |
The aggregate fees billed in each of the last two fiscal years for products and services provided by the principal accountant, other than the services reported in paragraphs (a) through (c) of this Item were as follows:
For services rendered to the registrant:
FY 2012: $0 FY 2013: $0 |
Fees required to be approved pursuant to paragraph (c)(7)(ii) of Rule 2-01 of Regulation S-X (relating to certain engagements for non-audit services with the registrant’s investment adviser and its affiliates):
FY 2012: $0 FY 2013: $0 |
(e)(1) | In accordance with paragraph (c)(7)(i)(A) of Rule 2-01 of Regulation S-X, before the accountant is engaged by the registrant to render audit or non-audit services, the engagement is approved by the registrant’s audit committee. Pursuant to paragraph (c)(7)(ii) of Rule 2-01 of Regulation S-X, the registrant’s audit committee also pre-approves its accountant’s engagements for non-audit services with the registrant’s investment adviser, its parent company, and any entity controlled by, or under common control with the investment adviser that provides ongoing services to the registrant, if the engagement relates directly to the operations and financial reporting of the registrant. |
(e)(2) | All services described in each of paragraphs (b) through (d) of this Item were pre-approved before the engagement by the registrant’s audit committee pursuant to paragraph (c)(7)(i)(A) of Rule 2-01 of Regulation S-X. Consequently, none of such services were required to be approved by the audit committee pursuant to paragraph (c)(7)(i)(C). |
(f) | The percentage of hours expended on the principal accountant’s engagement to audit the registrant’s financial statements for the most recent fiscal year that were attributed to work performed by persons other than the principal accountant’s full-time, permanent employees was less than 50%. |
(g) | The aggregate non-audit fees billed by the registrant’s accountant for services rendered to the registrant, and rendered to the registrant’s investment adviser (not including any sub-adviser whose role is primarily portfolio management and is subcontracted with or overseen by another investment adviser), and any entity controlling, controlled by, or under common control with the adviser that provides ongoing services to the registrant for each of the last two fiscal years of the registrant were as follows: |
FY 2012: $ 68,768
FY 2013: $101,621
(h) | The registrant’s investment adviser and accountant have notified the registrant’s audit committee of all non-audit services that were rendered by the registrant’s accountant to the registrant’s investment adviser, its parent company, and any entity controlled by, or under common control with the investment adviser that provides services to the registrant, which services were not required to be pre-approved pursuant to paragraph (c)(7)(ii) of Rule 2-01 of Regulation S-X. The notification provided to the registrant’s audit committee included sufficient details regarding such services to allow the registrant’s audit committee to consider the continuing independence of its principal accountant. |
ITEM 5. AUDIT COMMITTEE OF LISTED REGISTRANTS.
Not applicable.
ITEM 6. INVESTMENTS.
(a) | The schedule of investments is included as part of the report to stockholders filed under Item 1 of this Form. |
(b) | Not applicable. |
ITEM 7. DISCLOSURE OF PROXY VOTING POLICIES AND PROCEDURES FOR CLOSED-END MANAGEMENT INVESTMENT COMPANIES.
Not applicable.
ITEM 8. PORTFOLIO MANAGERS OF CLOSED-END MANAGEMENT INVESTMENT COMPANIES.
Not applicable.
ITEM 9. PURCHASES OF EQUITY SECURITIES BY CLOSED-END MANAGEMENT INVESTMENT COMPANY AND AFFILIATED PURCHASERS.
Not applicable.
ITEM 10. SUBMISSION OF MATTERS TO A VOTE OF SECURITY HOLDERS.
During the reporting period, there were no material changes to the procedures by which shareholders may recommend nominees to the registrant’s board.
ITEM 11. CONTROLS AND PROCEDURES.
(a) | The registrant's principal executive officer and principal financial officer have concluded that the registrant's disclosure controls and procedures (as defined in Rule 30a-3(c) under the Investment Company Act of 1940) are effective based on their evaluation of these controls and procedures as of a date within 90 days of the filing date of this report. |
(b) | There were no changes in the registrant's internal control over financial reporting (as defined in Rule 30a-3(d) under the Investment Company Act of 1940) that occurred during the registrant's second fiscal quarter of the period covered by this report that have materially affected, or are reasonably likely to materially affect, the registrant's internal control over financial reporting. |
ITEM 12. EXHIBITS.
(a)(1) | Registrant’s Code of Ethics for Senior Financial Officers, which is the subject of the disclosure required by Item 2 of Form N-CSR, was filed as Exhibit 12(a)(1) to American Century Asset Allocation Portfolios, Inc.’s Certified Shareholder Report on Form N-CSR, File No. 811-21591, on September 29, 2005. |
(a)(2) | Separate certifications by the registrant’s principal executive officer and principal financial officer, pursuant to Section 302 of the Sarbanes-Oxley Act of 2002 and Rule 30a-2(a) under the Investment Company Act of 1940, are filed and attached hereto as EX-99.CERT. |
(a)(3) | Not applicable. |
(b) | A certification by the registrant’s chief executive officer and chief financial officer, pursuant to Section 906 of the Sarbanes-Oxley Act of 2002, is furnished and attached hereto as EX-99.906CERT. |
SIGNATURES
Pursuant to the requirements of the Securities Exchange Act of 1934 and the Investment Company Act of 1940, the registrant has duly caused this report to be signed on its behalf by the undersigned, thereunto duly authorized.
Registrant: | American Century World Mutual Funds, Inc. | |||
By: | /s/ Jonathan S. Thomas | |||
Name: | Jonathan S. Thomas | |||
Title: | President | |||
Date: | January 29, 2014 | |||
Pursuant to the requirements of the Securities Exchange Act of 1934 and the Investment Company Act of 1940, this report has been signed below by the following persons on behalf of the registrant and in the capacities and on the dates indicated.
By: | /s/ Jonathan S. Thomas | ||
Name: | Jonathan S. Thomas | ||
Title: | President | ||
(principal executive officer) | |||
Date: | January 29, 2014 | ||
By: | /s/ C. Jean Wade | ||
Name: | C. Jean Wade | ||
Title: | Vice President, Treasurer, and | ||
Chief Financial Officer | |||
(principal financial officer) | |||
Date: | January 29, 2014 | ||