| UNITED STATES | ||
| SECURITIES AND EXCHANGE COMMISSION | ||
| Washington, D.C. 20549 | ||
| FORM N-CSR | ||
| CERTIFIED SHAREHOLDER REPORT OF REGISTERED | ||
| MANAGEMENT INVESTMENT COMPANIES | ||
| Investment Company Act file number | 811-06247 | |
| AMERICAN CENTURY WORLD MUTUAL FUNDS, INC. | ||
| (Exact name of registrant as specified in charter) | ||
| 4500 MAIN STREET, KANSAS CITY, MISSOURI | 64111 | |
| (Address of principal executive offices) | (Zip Code) | |
| CHARLES A. ETHERINGTON | ||
| 4500 MAIN STREET, KANSAS CITY, MISSOURI 64111 | ||
| (Name and address of agent for service) | ||
| Registrant’s telephone number, including area code: | 816-531-5575 | |
| Date of fiscal year end: | 11-30 | |
| Date of reporting period: | 11-30-2009 | |
| ITEM 1. REPORTS TO STOCKHOLDERS. | |
| Annual Report | |
| November 30, 2009 | |
![]()
| American Century Investments |
International Growth Fund
Global Growth Fund
Emerging Markets Fund
International Value Fund
| Table of Contents |
| President’s Letter | 2 |
| Independent Chairman’s Letter | 3 |
| Market Perspective | 4 |
| International Equity Total Returns | 4 |
| International Growth | |
| Performance | 5 |
| Portfolio Commentary | 7 |
| Top Ten Holdings, Types of Investments in Portfolio | |
| and Investments by Country | 9 |
| Global Growth | |
| Performance | 10 |
| Portfolio Commentary | 12 |
| Top Ten Holdings, Types of Investments in Portfolio | |
| and Investments by Country | 14 |
| Emerging Markets | |
| Performance | 15 |
| Portfolio Commentary | 17 |
| Top Ten Holdings, Types of Investments in Portfolio | |
| and Investments by Country | 19 |
| International Value | |
| Performance | 20 |
| Portfolio Commentary | 22 |
| Top Ten Holdings, Types of Investments in Portfolio | |
| and Investments by Country | 24 |
| Shareholder Fee Examples | 25 |
| Financial Statements | |
| Schedule of Investments | 28 |
| Statement of Assets and Liabilities | 41 |
| Statement of Operations | 43 |
| Statement of Changes in Net Assets | 44 |
| Notes to Financial Statements | 46 |
| Financial Highlights | 59 |
| Report of Independent Registered Public Accounting Firm | 83 |
| Other Information | |
| Management | 84 |
| Approval of Management Agreements | 87 |
| Additional Information | 93 |
| Index Definitions | 94 |
The opinions expressed in the Market Perspective and each of the Portfolio Commentaries reflect those of the portfolio management team as of the date of the report, and do not necessarily represent the opinions of American Century Investments or any other person in the American Century Investments organization. Any such opinions are subject to change at any time based upon market or other conditions and American Century Investments disclaims any responsibility to update such opinions. These opinions may not be relied upon as investment advice and, because investment decisions made by American Century Investments funds are based on numerous factors, may not be relied upon as an indication of trading intent on behalf of any American Century Investments fund. Security examples are used for representational purposes only and are not intended as recommendations to purchase or sell securities. Performance information for com parative indices and securities is provided to American Century Investments by third party vendors. To the best of American Century Investments’ knowledge, such information is accurate at the time of printing.
| President’s Letter |

Dear Investor:
Thank you for taking time to review the following pages, which provide the performance of your investment along with the perspectives of our experienced portfolio management team for the financial reporting period ended November 30, 2009. We appreciate your trust in American Century Investments® at this volatile, transitional time in the economy and investment markets.
As the upheavals associated with the “Great Recession” gradually subside, our senior management team has put considerable thought into how the investment environment has changed and what new challenges and opportunities await us. Critical factors that we are anticipating in 2010 include marked shifts in investment and spending behavior, along with consolidation in our industry.
Most importantly, we think the U.S. economic recovery will be slow and extended. The economy and capital markets have come a long way since Lehman Brothers collapsed in the third quarter of 2008, but 2010 will likely bring continuing challenges. The U.S. stock market’s rebound since last March and the second-half economic surge in 2009 were fueled largely by corporate cost-cutting and unprecedented monetary and fiscal stimulus, including some key programs that have since expired or been scaled back.
Meanwhile, the resilient but struggling consumer sector still faces double-digit unemployment, heavy debt burdens, tight credit conditions, and a housing market that is starting to stabilize, but remains vulnerable. Much of our investment positioning in 2009 cautiously reflected these still unstable economic fundamentals, leading to underperformance, in some cases, versus market benchmarks buoyed by the rally of riskier assets. We still support our fundamentally based positioning because we believe strongly that some markets—driven more by technical factors than fundamentals—have advanced further than underlying economic conditions warrant, and remain susceptible to the possibility of more volatility ahead.
Thank you for your continued confidence in us.
Sincerely,

Jonathan Thomas
President and Chief Executive Officer
American Century Investments
2
| Independent Chairman’s Letter |

In my first letter to shareholders of the American Century Investments funds, I invited you to contact me with your questions. I have been gratified with your response. Most shareholder inquiries to date have related to specific fund performance issues. As I noted in my individual responses, your board through the Fund Performance Committee continues to stress improved performance in our quarterly meetings with chief investment officers and fund managers.
An important part of our fund performance review process is a face-to-face meeting with portfolio managers. The board traveled during the second quarter to the American Century Investments office in Mountain View, California to meet with the fund of funds and asset allocation portfolio management teams. These meetings validated the importance of thorough reviews of investment opportunities by the credit management personnel resident in that office. As a result of their efforts, American Century Investments funds were able to avoid the “toxic assets” that plagued many other fund families in 2008.
From April through June 2009, the board conducted its annual review of the advisory contracts between American Century Investments and each fund. Our efforts involved a review of fund information, including assets under management; total expense ratio compared to peers; economies of scale; fee breakpoints that reduce shareholder costs as assets increase; performance compared to peers and benchmarks; and the quality of services provided to fund shareholders. A detailed discussion of board considerations in connection with advisory contract renewal is included annually in each fund’s shareholder reports. During this review, the board focuses on a detailed comparison of the competitive position of each fund and has negotiated more than 60 breakpoints or fee reductions in the past five years.
The board looks forward to another year of work on your behalf and your comments are appreciated. You are invited to email me at dhpratt@fundboardchair.com.

3
| Market Perspective |

By Mark Kopinski, Chief Investment Officer, Global and Non-U.S. Equity
Stocks Shook Off Early Declines
The near-collapse of the global financial system in the fall of 2008 fueled the worldwide recession and credit crisis and sent investors fleeing stocks and other risky assets. In this environment, international equity markets plunged to multi-year lows on sharp double-digit losses.
By mid-March, investor confidence and stock market performance showed an abrupt and surprising turnaround, triggered by a belief that the global financial system was no longer on the verge of collapse. Optimistic investors focused on early signs suggesting the global recession was easing, favoring lower-quality stocks that had been battered the most in the prior months. By the third quarter of 2009, gross domestic product returned to positive territory in Germany, France, and Japan, while industrial production and global trade levels improved in China. Meanwhile, consumer confidence improved throughout Europe, and in the United Kingdom the troubled housing market showed signs of stabilizing.
After bottoming on March 9, global stock markets rallied sharply to finish the 12-month period with strong gains. With renewed confidence in equities, investors shifted funds toward riskier assets, which, combined with rising commodity prices, bolstered performance among emerging markets.
Recovery’s Sustainability Remained in Question
Despite improving conditions, central bankers worldwide voiced concerns about the overall stability and sustainability of the economic recovery. The Bank of Japan stated downside risks remain, and European Central Bank officials stressed a recovery likely would be uneven. At the same time, officials mulled plans to reduce market liquidity, as the massive and widespread government stimulus efforts neared expiration. Meanwhile, rising unemployment dampened consumer spending, pricing data failed to support inflationary or deflationary expectations, and the Chinese government repeated concerns about overcapacity in the materials sector.
If, in the coming months, consumers worldwide do not increase spending, either due to prolonged unemployment or the need to repair their net worth, additional stimulus packages may become necessary. We expect continued easy monetary and fiscal policies globally, as most central banks seek to avoid fostering a “double dip” recession.
| International Equity Total Returns | ||||
| For the 12 months ended November 30, 2009 (in U.S. dollars) | ||||
| MSCI EAFE Index | 37.72% | MSCI Europe Index | 40.83% | |
| MSCI EAFE Growth Index | 34.93% | MSCI World Free Index | 31.79% | |
| MSCI EAFE Value Index | 40.54% | MSCI Japan Index | 14.01% | |
| MSCI EM Growth Index | 83.97% | |||
4
| Performance |
| International Growth | ||||||
| Total Returns as of November 30, 2009 | ||||||
| Average Annual Returns | ||||||
| Since | Inception | |||||
| 1 year | 5 years | 10 years | Inception | Date | ||
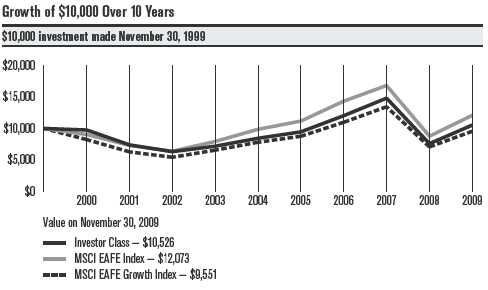
| Investor Class | 38.66% | 4.52% | 0.51% | 7.88% | 5/9/91 | |
| MSCI EAFE Index | 37.72% | 4.13% | 1.90% | 5.34%(1) | — | |
| MSCI EAFE Growth Index | 34.93% | 4.10% | -0.46% | 3.55%(1) | — | |
| Institutional Class | 38.96% | 4.72% | 0.72% | 4.99% | 11/20/97 | |
| A Class(2) | 10/2/96 | |||||
| No sales charge* | 38.30% | 4.26% | 0.26% | 5.76% | ||
| With sales charge* | 30.43% | 3.04% | -0.33% | 5.28% | ||
| B Class | 1/31/03 | |||||
| No sales charge* | 37.36% | 3.49% | — | 8.01% | ||
| With sales charge* | 33.36% | 3.32% | — | 8.01% | ||
| C Class | 37.29% | 3.47% | — | 1.36% | 6/4/01 | |
| R Class | 37.97% | 4.01% | — | 6.99% | 8/29/03 | |
| * Sales charges include initial sales charges and contingent deferred sales charges (CDSCs), as applicable. A Class shares have a 5.75% | ||||||
| maximum initial sales charge for equity funds and may be subject to a maximum CDSC of 1.00%. B Class shares redeemed within six | ||||||
| years of purchase are subject to a CDSC that declines from 5.00% during the first year after purchase to 0.00% the sixth year after | ||||||
| purchase. C Class shares redeemed within 12 months of purchase are subject to a maximum CDSC of 1.00%. The SEC requires that | ||||||
| mutual funds provide performance information net of maximum sales charges in all cases where charges could be applied. | ||||||
| (1) | Since 4/30/91, the date nearest the Investor Class’s inception for which data are available. | |||||
| (2) | Prior to December 3, 2007, the A Class was referred to as the Advisor Class. Performance, with sales charge, prior to that date has been adjusted | |||||
| to reflect the A Class’s current sales charge. | ||||||
Data presented reflect past performance. Past performance is no guarantee of future results. Current performance may be higher or lower than the performance shown. Investment return and principal value will fluctuate, and redemption value may be more or less than original cost. To obtain performance data current to the most recent month end, please call 1-800-345-2021 or visit americancentury.com. International investing involves special risks, such as political instability and currency fluctuations. Investing in emerging markets may accentuate these risks.
Unless otherwise indicated, performance reflects Investor Class shares; performance for other share classes will vary due to differences in fee structure. For information about other share classes available, please consult the prospectus. Data assumes reinvestment of dividends and capital gains, and none of the charts reflect the deduction of taxes that a shareholder would pay on fund distributions or the redemption of fund shares. Returns for the indices are provided for comparison. The fund’s total returns include operating expenses (such as transaction costs and management fees) that reduce returns, while the total returns of the indices do not.
5
International Growth
| One-Year Returns Over 10 Years | ||||||||||
| Periods ended November 30 | ||||||||||
| 2000 | 2001 | 2002 | 2003 | 2004 | 2005 | 2006 | 2007 | 2008 | 2009 | |
| Investor Class | -2.47% | -24.18% | -14.54% | 13.70% | 17.45% | 12.09% | 27.03% | 23.09% | -48.67% | 38.66% |
| MSCI EAFE Index | -9.67% | -19.13% | -12.50% | 24.22% | 24.19% | 13.25% | 28.20% | 17.30% | -47.79% | 37.72% |
| MSCI EAFE | ||||||||||
| Growth Index | -17.66% | -23.61% | -13.53% | 20.63% | 19.07% | 12.14% | 25.29% | 22.32% | -47.28% | 34.93% |
| Total Annual Fund Operating Expenses | |||||
| Institutional | |||||
| Investor Class | Class | A Class | B Class | C Class | R Class |
| 1.41% | 1.21% | 1.66% | 2.41% | 2.41% | 1.91% |
The total annual fund operating expenses shown is as stated in the fund’s prospectus current as of the date of this report. The prospectus may vary from the expense ratio shown elsewhere in this report because it is based on a different time period, includes acquired fund fees and expenses, and, if applicable, does not include fee waivers or expense reimbursements.
Data presented reflect past performance. Past performance is no guarantee of future results. Current performance may be higher or lower than the performance shown. Investment return chart and principal value will fluctuate, and redemption value may be more or less than original cost. To obtain performance data current to the most recent month end, please call 1-800-345-2021 or visit americancentury.com. International investing involves special risks, such as political instability and currency fluctuations. Investing in emerging markets may accentuate these risks.
Unless otherwise indicated, performance reflects Investor Class shares; performance for other share classes will vary due to differences in fee structure. For information about other share classes available, please consult the prospectus. Data assumes reinvestment of dividends and capital gains, and none of the charts reflect the deduction of taxes that a shareholder would pay on fund distributions or the redemption of fund shares. Returns for the indices are provided for comparison. The fund’s total returns include operating expenses (such as transaction costs and management fees) that reduce returns, while the total returns of the indices do not.
6
| Portfolio Commentary |
International Growth
Portfolio Managers: Alex Tedder and Raj Gandhi
Performance Summary
The International Growth portfolio advanced 38.66%* for the 12 months ended November 30, 2009, outperforming its benchmark, the MSCI EAFE Index, which gained 37.72%.
Despite the severe global recession, credit-market meltdown, and financial-sector crisis, international stocks finished the 12-month period with sharp gains. Initially, stocks plunged, as rising unemployment, shrinking industrial output, and negative economic growth rates sent investor confidence tumbling. But, by mid-March, market sentiment and stock performance reversed course quickly, as massive stimulus efforts from global central banks and governments generated optimism among investors.
On an absolute basis, all sectors and nearly every country represented in the portfolio and benchmark posted positive returns for the 12-month period. Stock selection, primarily in the information technology and financial sectors, accounted for the portfolio’s outperformance relative to the benchmark.
Japan, South Korea Were Top Countries
From a regional perspective, the portfolio’s holdings in Japan contributed the most to relative performance, due to favorable stock selection combined with an underweight position. South Korea, a non-benchmark country, also contributed strongly to portfolio results, as the country’s economy benefited from low interest rates and government stimulus efforts at home and abroad. In particular, Hyundai Motor Co. was among the portfolio’s leading contributors, benefiting from the United States’ “cash for clunkers” incentive program, which helped boost sales figures for the automaker.
At the opposite end of the spectrum, an underweight position in Australia and poor stock selection in Germany hurt the portfolio’s performance.
Technology, Utilities Drove Sector Results
Information technology was the portfolio’s top-performing sector, with stock selection driving the solid results. Our stock selection was particularly effective in the communications equipment segment, where Canadian-based Research In Motion (RIM) was the top-contributing stock. The portfolio’s out-of-benchmark position in RIM, the developer of the BlackBerry wireless device, was among the leading contributors for the period. Sales of the company’s touch-screen Storm device, RIM’s answer to Apple’s iPhone, gained traction after RIM resolved several software issues that emerged after the product’s initial launch.
The portfolio’s utilities sector, which ended the period as the smallest weighting in the fund, also contributed strongly to relative performance, driven primarily by our underweight position. In addition, the portfolio’s consumer discretionary sector, among the largest-weighted segments in
*All fund returns referenced in this commentary are for Investor Class shares.
7
International Growth
the fund, contributed positively, with stock selection and an overweight helping performance. In addition to the positive contribution from Hyundai Motor Co., an overweight to specialty retailers boosted results. In the challenging economic environment, consumers “traded down” for value. Portfolio holdings such as the U.K.’s Kingfisher (home improvement) and Japan’s FAST RETAILING (lower-priced clothing) and Nitori (the “Japanese IKEA”) benefited from these consumer spending trends.
Industrials, Health Care Sectors Lagged
The industrials sector represented the portfolio’s largest performance detractor. Our underweight in industrial conglomerates combined with negative stock selection in the building products, commercial services and supplies, and transportation infrastructure industries accounted for the bulk of the sector’s underperformance.
The portfolio’s health care sector also detracted from performance, primarily due to an overweight in the biotechnology industry and in the health care providers and services segment. In particular, our overweight positions in Switzerland-based Actelion Ltd., a biopharmaceutical company, and Germany’s Fresenius Medical Care, a provider of dialysis products and services, hurt results.
Outlook
Signs of improvement in corporate earnings have surfaced throughout the world. While most of the improvements have come from cost cutting and restructuring, we remain encouraged and believe any revenue growth may immediately affect the bottom line. We will closely monitor the upcoming corporate earnings reporting season, which could provide more clarity on the sustainability of recent improvements. International Growth continues to primarily invest in companies located in developed countries around the world (excluding the United States).
8
| International Growth | ||
| Top Ten Holdings as of November 30, 2009 | ||
| % of net assets | % of net assets | |
| as of 11/30/09 | as of 5/31/09 | |
| BHP Billiton Ltd. | 2.4% | 1.7% |
| HSBC Holdings plc (Hong Kong) | 2.1% | 1.2% |
| Banco Santander SA | 1.9% | 1.8% |
| Saipem SpA | 1.8% | 1.6% |
| BG Group plc | 1.8% | 1.8% |
| Roche Holding AG | 1.7% | 1.2% |
| Nestle SA | 1.7% | 1.8% |
| Vale SA Preference Shares | 1.7% | 1.5% |
| Telefonica SA | 1.7% | 1.1% |
| BNP Paribas | 1.6% | 1.2% |
| Types of Investments in Portfolio | ||
| % of net assets | % of net assets | |
| as of 11/30/09 | as of 5/31/09 | |
| Foreign Common Stocks | 99.7% | 99.5% |
| Temporary Cash Investments | 0.2% | 0.5% |
| Other Assets and Liabilities | 0.1% | —(1) |
| (1) Category is less than 0.05% of total net assets. | ||
| Investments by Country as of November 30, 2009 | ||
| % of net assets | % of net assets | |
| as of 11/30/09 | as of 5/31/09 | |
| United Kingdom | 18.8% | 17.6% |
| Japan | 15.2% | 14.2% |
| Switzerland | 8.1% | 9.9% |
| Germany | 6.3% | 6.9% |
| France | 6.0% | 6.1% |
| Australia | 4.6% | 4.8% |
| Brazil | 4.0% | 2.7% |
| People’s Republic of China | 3.8% | 3.3% |
| Spain | 3.6% | 3.4% |
| Sweden | 3.4% | 0.6% |
| Netherlands | 3.3% | 2.0% |
| South Korea | 3.1% | 2.9% |
| Italy | 2.9% | 5.1% |
| Other Countries | 16.6% | 20.0% |
| Cash and Equivalents(2) | 0.3% | 0.5% |
| (2) Includes temporary cash investments and other assets and liabilities. | ||
9
| Performance |
| Global Growth | ||||||
| Total Returns as of November 30, 2009 | ||||||
| Average Annual Returns | ||||||
| Since | Inception | |||||
| 1 year | 5 years | 10 years | Inception | Date | ||
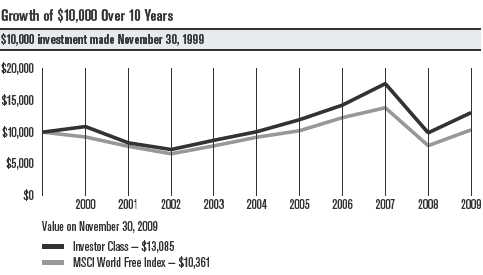
| Investor Class | 32.24% | 5.37% | 2.72% | 7.34% | 12/1/98 | |
| MSCI World Free Index | 31.79% | 2.41% | 0.36% | 2.09%(1) | — | |
| Institutional Class | 32.61% | 5.62% | — | 1.04% | 8/1/00 | |
| A Class(2) | 2/5/99 | |||||
| No sales charge* | 32.01% | 5.13% | 2.48% | 6.12% | ||
| With sales charge* | 24.51% | 3.89% | 1.87% | 5.55% | ||
| B Class | 12/1/05 | |||||
| No sales charge* | 31.06% | — | — | 0.84% | ||
| With sales charge* | 27.06% | — | — | 0.10% | ||
| C Class | 31.23% | 4.37% | — | 5.10% | 3/1/02 | |
| R Class | 31.79% | — | — | 2.94% | 7/29/05 | |
| * Sales charges include initial sales charges and contingent deferred sales charges (CDSCs), as applicable. A Class shares have a 5.75% | ||||||
| maximum initial sales charge for equity funds and may be subject to a maximum CDSC of 1.00%. B Class shares redeemed within six | ||||||
| years of purchase are subject to a CDSC that declines from 5.00% during the first year after purchase to 0.00% the sixth year after | ||||||
| purchase. C Class shares redeemed within 12 months of purchase are subject to a maximum CDSC of 1.00%. The SEC requires that | ||||||
| mutual funds provide performance information net of maximum sales charges in all cases where charges could be applied. | ||||||
| (1) | Since 11/30/98, the date nearest the Investor Class’s inception for which data are available. | |||||
| (2) | Prior to September 4, 2007, the A Class was referred to as the Advisor Class. Performance, with sales charge, prior to that date has been | |||||
| adjusted to reflect the A Class’s current sales charge. | ||||||
Data presented reflect past performance. Past performance is no guarantee of future results. Current performance may be higher or lower than the performance shown. Investment return and principal value will fluctuate, and redemption value may be more or less than original cost. To obtain performance data current to the most recent month end, please call 1-800-345-2021 or visit americancentury.com. International investing involves special risks, such as political instability and currency fluctuations. Investing in emerging markets may accentuate these risks.
Unless otherwise indicated, performance reflects Investor Class shares; performance for other share classes will vary due to differences in fee structure. For information about other share classes available, please consult the prospectus. Data assumes reinvestment of dividends and capital gains, and none of the charts reflect the deduction of taxes that a shareholder would pay on fund distributions or the redemption of fund shares. Returns for the index are provided for comparison. The fund’s total returns include operating expenses (such as transaction costs and management fees) that reduce returns, while the total returns of the index do not.
10
Global Growth
| One-Year Returns Over 10 Years | ||||||||||
| Periods ended November 30 | ||||||||||
| 2000 | 2001 | 2002 | 2003 | 2004 | 2005 | 2006 | 2007 | 2008 | 2009 | |
| Investor Class | 8.81% | -23.62% | -12.78% | 20.22% | 15.59% | 18.87% | 19.30% | 23.73% | -44.01% | 32.24% |
| MSCI World | ||||||||||
| Free Index | -7.64% | -16.01% | -15.27% | 19.17% | 17.43% | 11.20% | 20.28% | 12.71% | -43.30% | 31.79% |
| Total Annual Fund Operating Expenses | |||||
| Institutional | |||||
| Investor Class | Class | A Class | B Class | C Class | R Class |
| 1.26% | 1.06% | 1.51% | 2.26% | 2.26% | 1.76% |
The total annual fund operating expenses shown is as stated in the fund’s prospectus current as of the date of this report. The prospectus may vary from the expense ratio shown elsewhere in this report because it is based on a different time period, includes acquired fund fees and expenses, and, if applicable, does not include fee waivers or expense reimbursements.
Data presented reflect past performance. Past performance is no guarantee of future results. Current performance may be higher or lower than the performance shown. Investment return and principal value will fluctuate, and redemption value may be more or less than original cost. To obtain performance data current to the most recent month end, please call 1-800-345-2021 or visit americancentury.com. International investing involves special risks, such as political instability and currency fluctuations. Investing in emerging markets may accentuate these risks.
Unless otherwise indicated, performance reflects Investor Class shares; performance for other share classes will vary due to differences in fee structure. For information about other share classes available, please consult the prospectus. Data assumes reinvestment of dividends and capital gains, and none of the charts reflect the deduction of taxes that a shareholder would pay on fund distributions or the redemption of fund shares. Returns for the index are provided for comparison. The fund’s total returns include operating expenses (such as transaction costs and management fees) that reduce returns, while the total returns of the index do not.
11
| Portfolio Commentary |
Global Growth
Portfolio Managers: Keith Creveling and Brent Puff
Performance Summary
The Global Growth portfolio advanced 32.24%* for the 12 months ended November 30, 2009, outperforming its benchmark, the MSCI World Free Index, which gained 31.79%.
Despite the severe worldwide recession, credit-market meltdown, and financial-sector crisis, global stocks finished the 12-month period with sharp gains. Initially, stocks plunged, as rising unemployment, shrinking industrial output, and negative economic growth rates sent investor confidence tumbling. But, by mid-March, market sentiment and stock performance reversed course quickly, as massive stimulus efforts from global central banks and governments generated optimism among investors.
Overall, good stock selection combined with favorable sector allocations accounted for the portfolio’s outperformance relative to the benchmark. Our stock selection was particularly strong in the energy and financials sectors, while an overweight in the top-performing information technology segment and an underweight in the benchmark-trailing utilities sector contributed positively.
U.S. Was Top Contributor
The United States, which comprised approximately half the portfolio as of November 30, led all country contributors in the fund, followed by Japan and China. Performance in the United States was driven by an overweight position in American Express, the top-performing stock in the portfolio for the period. The credit card issuer reported firming fundamentals within its customer base, as delinquency and loan charge-off rates steadily improved.
Favorable stock selection combined with an underweight led to outperforming results for the portfolio in Japan. In China, our small, out-of-benchmark allocation generated favorable results, as China’s economy benefited from infrastructure spending and stimulus efforts designed to boost domestic consumption.
The largest laggards from a regional perspective included Canada and Spain, where underweights and negative stock selection detracted from results. Spain was home to one of the portfolio’s leading detractors, toll road operator Cintra Concesiones de Infraestructuras de Transporte. The company reported traffic declines on its roads in the U.S. and Spain and experienced funding and shareholder challenges when it explored a potential merger with its parent, Grupo Ferrovial of Spain.
*All fund returns referenced in this commentary are for Investor Class shares.
12
Global Growth
Technology Led All Sectors
Information technology stocks were among the benchmark leaders, and our overweight combined with good stock selection enhanced the portfolio’s performance. In particular, U.S.-based computer and electronic device maker Apple drove the portfolio’s results. Better-than-expected revenues and strong market enthusiasm for the company’s iPhone helped push the stock price higher. Tencent Holdings, China’s leading Internet service provider, also generated strong results for the portfolio.
A sharp upswing in oil prices throughout most of 2009 helped generate strong returns in the energy sector. Stock selection was key, as our overweight positions in Saipem, an Italian oil and gas services company, and Occidental Petroleum, U.S.-based oil and natural gas exploration companies, helped the portfolio’s outperformance.
Materials, Consumer Discretionary Stocks Lagged
The portfolio’s performance was negatively affected by stock selection and an underweight position in the materials sector, which was the top-performing sector in the benchmark.
In the consumer discretionary sector, our overweight had a positive influence on performance, but disappointing stock selection dragged down the sector’s overall contribution compared with the benchmark. U.S.-based Apollo Group, an educational services company, was the portfolio’s largest individual detractor. Apollo’s stock tumbled on concerns about potential regulatory and legal changes from the U.S. Department of Education.
Outlook
Global Growth continues to invest primarily in companies located in developed countries throughout the world, including the United States. Recently, corporate earnings have shown signs of improvement throughout the world. While most of the improvements have come from better cost management and restructuring, we remain encouraged by the progress and believe even a moderate improvement in underlying demand will drive sharply improved profit performance. We will closely monitor the upcoming corporate earnings reporting season, which should provide more clarity on the sustainability of earnings improvements.
13
| Global Growth | ||
| Top Ten Holdings as of November 30, 2009 | ||
| % of net assets | % of net assets | |
| as of 11/30/09 | as of 5/31/09 | |
| BHP Billiton Ltd. | 2.6% | 1.8% |
| Apple, Inc. | 2.4% | 2.0% |
| American Express Co. | 2.3% | 1.5% |
| Google, Inc., Class A | 2.2% | 1.5% |
| Colgate-Palmolive Co. | 2.1% | 1.8% |
| 3M Co. | 2.0% | 1.3% |
| MasterCard, Inc., Class A | 2.0% | 1.0% |
| Occidental Petroleum Corp. | 2.0% | 1.8% |
| priceline.com, Inc. | 1.9% | 1.0% |
| Banco Santander SA | 1.9% | — |
| Types of Investments in Portfolio | ||
| % of net assets | % of net assets | |
| as of 11/30/09 | as of 5/31/09 | |
| Domestic Common Stocks | 51.8% | 50.4% |
| Foreign Common Stocks | 47.3% | 48.5% |
| Total Equity Exposure | 99.1% | 98.9% |
| Temporary Cash Investments | 0.8% | 0.5% |
| Other Assets and Liabilities | 0.1% | 0.6% |
| Investments by Country as of November 30, 2009 | ||
| % of net assets | % of net assets | |
| as of 11/30/09 | as of 5/31/09 | |
| United States | 51.8% | 50.4% |
| United Kingdom | 8.7% | 9.7% |
| Japan | 8.0% | 6.3% |
| Switzerland | 5.6% | 4.5% |
| Australia | 4.3% | 3.3% |
| Ireland | 3.0% | 2.2% |
| Brazil | 2.7% | 1.5% |
| South Korea | 2.0% | 0.6% |
| Spain | 1.9% | — |
| Other Countries | 11.1% | 20.4% |
| Cash and Equivalents* | 0.9% | 1.1% |
| * Includes temporary cash investments and other assets and liabilities. | ||
14
| Performance |
| Emerging Markets | ||||||
| Total Returns as of November 30, 2009 | ||||||
| Average Annual Returns | ||||||
| Since | Inception | |||||
| 1 year | 5 years | 10 years | Inception | Date | ||
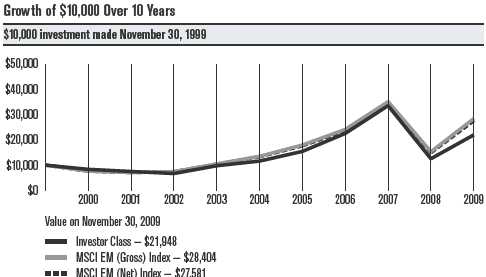
| Investor Class | 75.36% | 13.62% | 8.17% | 7.70% | 9/30/97 | |
| MSCI EM Growth Index(1)(2) | 83.97% | 13.90% | — | — | — | |
| MSCI EM (Net) Index(1)(2) | 85.12% | 15.70% | 10.68% | — | — | |
| MSCI EM (Gross) Index(2) | 85.68% | 16.07% | 11.00% | 8.11% | — | |
| Institutional Class | 75.92% | 13.86% | 8.38% | 12.87% | 1/28/99 | |
| A Class(3) | 5/12/99 | |||||
| No sales charge* | 75.24% | 13.37% | 7.92% | 9.89% | ||
| With sales charge* | 65.10% | 12.03% | 7.28% | 9.28% | ||
| B Class | 9/28/07 | |||||
| No sales charge* | 74.10% | — | — | -16.81% | ||
| With sales charge* | 70.10% | — | — | -18.54% | ||
| C Class | 73.99% | 12.49% | — | 12.77% | 12/18/01 | |
| R Class | 74.94% | — | — | -16.42% | 9/28/07 | |
| * Sales charges include initial sales charges and contingent deferred sales charges (CDSCs), as applicable. A Class shares have a 5.75% | ||||||
| maximum initial sales charge for equity funds and may be subject to a maximum CDSC of 1.00%. B Class shares redeemed within six | ||||||
| years of purchase are subject to a CDSC that declines from 5.00% during the first year after purchase to 0.00% the sixth year after | ||||||
| purchase. C Class shares redeemed within 12 months of purchase are subject to a maximum CDSC of 1.00%. The SEC requires that | ||||||
| mutual funds provide performance information net of maximum sales charges in all cases where charges could be applied. | ||||||
| (1) | MSCI EM Growth Index data first available 2/1/01. MSCI EM (Net) Index data first available 12/31/98. | |||||
| (2) | From September of 1997 through December 2008, the fund’s benchmark was the MSCI EM (Gross) Index. From January 2009 through | |||||
| March 2009, the fund’s benchmark was the MSCI EM (Net) Index. In April of 2009, the fund’s benchmark changed from the MSCI EM (Net) | ||||||
| Index to the MSCI EM Growth Index. The fund’s investment advisor believes this index better represents the fund’s portfolio composition. | ||||||
| (3) | Prior to September 4, 2007, the A Class was referred to as the Advisor Class. Performance, with sales charge, prior to that date has been | |||||
| adjusted to reflect the A Class’s current sales charge. | ||||||
Data presented reflect past performance. Past performance is no guarantee of future results. Current performance may be higher or lower than the performance shown. Investment return and principal value will fluctuate, and redemption value may be more or less than original cost. To obtain performance data current to the most recent month end, please call 1-800-345-2021 or visit americancentury.com. International investing involves special risks, such as political instability and currency fluctuations. Investing in emerging markets may accentuate these risks.
Unless otherwise indicated, performance reflects Investor Class shares; performance for other share classes will vary due to differences in fee structure. For information about other share classes available, please consult the prospectus. Data assumes reinvestment of dividends and capital gains, and none of the charts reflect the deduction of taxes that a shareholder would pay on fund distributions or the redemption of fund shares. Returns for the indices are provided for comparison. The fund’s total returns include operating expenses (such as transaction costs and management fees) that reduce returns, while the total returns of the indices do not.
15
Emerging Markets
| One-Year Returns Over 10 Years | ||||||||||
| Periods ended November 30 | ||||||||||
| 2000 | 2001 | 2002 | 2003 | 2004 | 2005 | 2006 | 2007 | 2008 | 2009 | |
| Investor Class | -16.73% | -10.28% | -10.86% | 46.26% | 18.94% | 33.10% | 46.10% | 48.81% | -62.66% | 75.36% |
| MSCI EM | ||||||||||
| Growth Index* | — | -25.19%** | 5.63% | 35.32% | 21.59% | 33.59% | 34.42% | 42.79% | -59.37% | 83.97% |
| MSCI EM | ||||||||||
| (Net) Index | -23.84% | -7.60% | 4.75% | 40.46% | 28.47% | 32.60% | 33.95% | 45.15% | -56.56% | 85.12% |
| MSCI EM | ||||||||||
| (Gross) Index | -23.63% | -7.37% | 4.95% | 40.87% | 28.88% | 33.13% | 34.38% | 45.57% | -56.42% | 85.68% |
| * Since benchmark data is only available from 2/1/01, it is not included in the line chart. One year data is listed for all periods available. | ||||||||||
| **Benchmark return from 2/1/01 to 11/30/01. Not annualized. | ||||||||||
| Total Annual Fund Operating Expenses | ||||||||||
| Institutional | ||||||||||
| Investor Class | Class | A Class | B Class | C Class | R Class | |||||
| 1.82% | 1.62% | 2.07% | 2.82% | 2.82% | 2.32% | |||||
The total annual fund operating expenses shown is as stated in the fund’s prospectus current as of the date of this report. The prospectus may vary from the expense ratio shown elsewhere in this report because it is based on a different time period, includes acquired fund fees and expenses, and, if applicable, does not include fee waivers or expense reimbursements.
Data presented reflect past performance. Past performance is no guarantee of future results. Current performance may be higher or lower than the performance shown. Investment return and principal value will fluctuate, and redemption value may be more or less than original cost. To obtain performance data current to the most recent month end, please call 1-800-345-2021 or visit americancentury.com. International investing involves special risks, such as political instability and currency fluctuations. Investing in emerging markets may accentuate these risks.
Unless otherwise indicated, performance reflects Investor Class shares; performance for other share classes will vary due to differences in fee structure. For information about other share classes available, please consult the prospectus. Data assumes reinvestment of dividends and capital gains, and none of the charts reflect the deduction of taxes that a shareholder would pay on fund distributions or the redemption of fund shares. Returns for the indices are provided for comparison. The fund’s total returns include operating expenses (such as transaction costs and management fees) that reduce returns, while the total returns of the indices do not.
16
| Portfolio Commentary |
Emerging Markets
Portfolio Managers: Patricia Ribeiro and Anthony Han
Performance Summary
The Emerging Markets portfolio advanced 75.36%* for the 12 months ended November 30, 2009, underperforming its benchmark, the MSCI EM Growth Index,** which gained 83.97%.
Emerging markets stocks surged in 2009, as investors seeking to recoup the losses of 2008 sought higher-yielding assets perceived to have fewer links with the battered developed economies that had been negatively affected by the global economic crisis and subprime market debacle. The fallout in global markets left few economies unscathed, but sound macroeconomic fundamentals and stimulus measures helped emerging market countries cope better than other nations. Furthermore, emerging markets remained shielded from the problems of the developed world due to years of conservative fiscal policy, which resulted in higher savings rates and employment growth and increases in business and infrastructure investment. Unlike consumers in the U.S. and other developed countries, consumers in emerging economies did not take on huge amounts of debt, and financial institutions did not have exposure to toxic assets such as subprime mortgages.
The portfolio’s underperformance relative to the benchmark primarily was due to sector allocations and the impact of currency exchange rates. Overall, our stock selection was a positive contributor, but it was not sufficient to offset the currency and allocation influences.
Israel Led Detractors; Mexico Led Contributors
From a regional perspective, the portfolio’s largest detractors to performance included Israel, India, and South Korea. In each country, our allocation decisions were effective, but stock selection primarily accounted for the poor relative performance. On the positive side, Mexico, Turkey, and Russia represented the portfolio’s leading country contributors, primarily due to positive stock selection.
All Sectors Showed Strong Returns
On an absolute basis, all of the portfolio’s 10 sectors posted strong gains for the 12-month period, with returns in the utilities and materials sectors topping 100%. Relative to the benchmark, the portfolio’s information technology, energy, and materials sectors detracted from results, while its telecommunication services, utilities and industrials sectors contributed positively to relative performance.
* All fund returns referenced in this commentary are for Investor Class shares.
**In April 2009, the fund’s benchmark changed from the MSCI EM (Net) Index to the MSCI EM Growth Index. The fund’s investment advisor believes
this index better represents the fund’s portfolio composition.
17
Emerging Markets
Our poor relative performance in the information technology sector was primarily due to portfolio-only holding Rolta India, the fund’s leading detractor for the period. Stock in the India-based geospatial mapping systems company plummeted in the wake of a financial scandal involving Indian technology outsourcing company Satyam. Subsequent rumors implicated Rolta, which denied any wrongdoing.
In the energy sector, our stock selection and overweight position generally were favorable, but currency exchange rates detracted from results. In the materials sector, our strategies in the chemicals and metals and mining industries accounted for the bulk of the lagging results. In particular, our underweight position in Brazilian iron ore miner Companhia Vale do Rio Doce detracted from performance.
The portfolio’s outperformance in the telecommunication services sector was largely due to stock selection and our underweight position in the wireless industry. Specifically, Mexico’s America Movil SAB, a wireless telecom services provider doing business in Mexico and Latin America, was a leading contributor. Stock selection drove the strong overall performance in the portfolio’s utilities sector. In particular, the portfolio benefited from our overweight position in India’s state-owned Power Grid Corp. In the industrials sector, our overweight position in China High Speed Transmission Equipment Group, a manufacturer of gear boxes for wind turbines, drove results. With an absolute total return of nearly 200%, the stock finished the 12-month period as the leading contributor to the portfolio’s performance.
Outlook
Emerging markets have been able to withstand the greatest economic crisis since the Great Depression, primarily because they have managed their economies well throughout the past several years. While challenges remain, we expect emerging markets may continue to offer above-average earnings growth in the short and long term. We believe the global economy should start growing again in 2010, and the emerging markets may accelerate at a much faster rate than the U.S. and Europe, due in part to continued frugality among Western consumers.
18
| Emerging Markets | ||
| Top Ten Holdings as of November 30, 2009 | ||
| % of net assets | % of net assets | |
| as of 11/30/09 | as of 5/31/09 | |
| Samsung Electronics Co. Ltd. | 5.3% | 3.5% |
| Vale SA Preference Shares | 5.0% | 4.3% |
| Petroleo Brasileiro SA-Petrobras ADR | 3.7% | 4.9% |
| Itau Unibanco Holding SA Preference Shares | 3.0% | 2.0% |
| Hon Hai Precision Industry Co. Ltd. | 2.8% | 1.9% |
| Taiwan Semiconductor Manufacturing Co. Ltd. | 2.7% | 2.4% |
| China Life Insurance Co. Ltd. H Shares | 2.5% | 1.8% |
| Infosys Technologies Ltd. | 2.3% | 0.8% |
| Sberbank of Russian Federation | 2.3% | 1.2% |
| America Movil SAB de CV, Series L ADR | 2.2% | 2.3% |
| Types of Investments in Portfolio | ||
| % of net assets | % of net assets | |
| as of 11/30/09 | as of 5/31/09 | |
| Foreign Common Stocks | 98.0% | 98.1% |
| Temporary Cash Investments | 2.2% | 0.8% |
| Other Assets and Liabilities | (0.2)% | 1.1% |
| Investments by Country as of November 30, 2009 | ||
| % of net assets | % of net assets | |
| as of 11/30/09 | as of 5/31/09 | |
| Brazil | 16.3% | 16.8% |
| People’s Republic of China | 14.0% | 13.7% |
| South Korea | 13.0% | 11.6% |
| Russian Federation | 9.4% | 6.7% |
| Taiwan (Republic of China) | 8.5% | 13.9% |
| India | 8.0% | 8.5% |
| Hong Kong | 5.9% | 5.2% |
| South Africa | 5.4% | 6.7% |
| Mexico | 4.1% | 2.9% |
| Indonesia | 3.3% | 2.3% |
| Turkey | 2.3% | 1.9% |
| Thailand | 2.0% | 0.9% |
| Other Countries | 5.8% | 7.0% |
| Cash and Equivalents* | 2.0% | 1.9% |
| * Includes temporary cash investments and other assets and liabilities. | ||
19
| Performance |
| International Value | |||||
| Total Returns as of November 30, 2009 | |||||
| Average Annual Returns | |||||
| Since | Inception | ||||
| 1 year | 5 years | 10 years | Inception | Date | |
| A Class | 3/31/97 | ||||
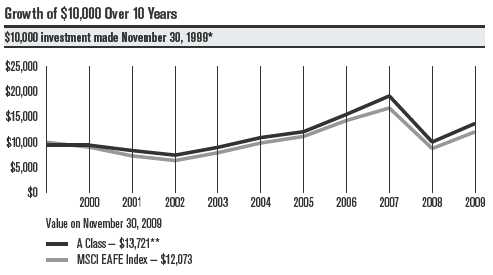
| No sales charge* | 36.40% | 4.65%(1) | 3.82%(1) | 3.70%(1) | |
| With sales charge* | 28.65% | 3.41%(1) | 3.21%(1) | 3.22%(1) | |
| MSCI EAFE Index | 37.72% | 4.13% | 1.90% | 4.49% | — |
| Investor Class | 36.98% | — | — | -0.16% | 4/3/06 |
| Institutional Class | 37.18% | — | — | 0.03% | 4/3/06 |
| B Class | 3/31/97 | ||||
| No sales charge* | 35.36% | 3.90%(1) | 3.11%(1) | 3.01%(1) | |
| With sales charge* | 31.36% | 3.73%(1) | 3.11%(1) | 3.01%(1) | |
| C Class | 35.44% | — | — | -1.17% | 4/3/06 |
| R Class | 35.90% | — | — | -0.70% | 4/3/06 |
| * Sales charges include initial sales charges and contingent deferred sales charges (CDSCs), as applicable. A Class shares have a 5.75% | |||||
| maximum initial sales charge for equity funds and may be subject to a maximum CDSC of 1.00%. B Class shares redeemed within six | |||||
| years of purchase are subject to a CDSC that declines from 5.00% during the first year after purchase to 0.00% the sixth year after | |||||
| purchase. C Class shares redeemed within 12 months of purchase are subject to a maximum CDSC of 1.00%. The SEC requires that | |||||
| mutual funds provide performance information net of maximum sales charges in all cases where charges could be applied. | |||||
International Value acquired all the net assets of the Mason Street International Equity Fund on March 31, 2006, pursuant to a plan of reorganization approved by the acquired fund’s shareholders on March 15, 2006. Performance information prior to April 1, 2006, is that of the Mason Street International Equity Fund.
(1) Class returns would have been lower if fees had not been waived.
Data presented reflect past performance. Past performance is no guarantee of future results. Current performance may be higher or lower than the performance shown. Investment return and principal value will fluctuate, and redemption value may be more or less than original cost. To obtain performance data current to the most recent month end, please call 1-800-345-2021 or visit americancentury.com. International investing involves special risks, such as political instability and currency fluctuations. Investing in emerging markets may accentuate these risks.
Unless otherwise indicated, performance reflects A Class shares; performance for other share classes will vary due to differences in fee structure. For information about other share classes available, please consult the prospectus. Data assumes reinvestment of dividends and capital gains, and none of the charts reflect the deduction of taxes that a shareholder would pay on fund distributions or the redemption of fund shares. Returns for the index are provided for comparison. The fund’s total returns include operating expenses (such as transaction costs and management fees) that reduce returns, while the total returns of the index do not.
20
International Value
| One-Year Returns Over 10 Years | ||||||||||
| Periods ended November 30 | ||||||||||
| 2000 | 2001 | 2002 | 2003 | 2004 | 2005 | 2006 | 2007 | 2008 | 2009 | |
| A Class | ||||||||||
| (no sales charge)** | 0.00% | -11.24% | -10.87% | 20.77% | 21.40% | 10.68% | 28.36% | 23.44% | -47.53% | 36.40% |
| MSCI EAFE Index | -9.67% | -19.13% | -12.50% | 24.22% | 24.19% | 13.25% | 28.20% | 17.30% | -47.79% | 37.72% |
| * International Value A Class’s initial investment is $9,425 to reflect the maximum 5.75% initial sales charge. | ||||||||||
| **Class returns would have been lower if fees had not been waived. | ||||||||||
| Total Annual Fund Operating Expenses | |||||
| Institutional | |||||
| Investor Class | Class | A Class | B Class | C Class | R Class |
| 1.31% | 1.11% | 1.56% | 2.31% | 2.31% | 1.81% |
The total annual fund operating expenses shown is as stated in the fund’s prospectus current as of the date of this report. The prospectus may vary from the expense ratio shown elsewhere in this report because it is based on a different time period, includes acquired fund fees and expenses, and, if applicable, does not include fee waivers or expense reimbursements.
Data presented reflect past performance. Past performance is no guarantee of future results. Current performance may be higher or lower than the performance shown. Investment return and principal value will fluctuate, and redemption value may be more or less than original cost. To obtain performance data current to the most recent month end, please call 1-800-345-2021 or visit americancentury.com. International investing involves special risks, such as political instability and currency fluctuations. Investing in emerging markets may accentuate these risks.
Unless otherwise indicated, performance reflects A Class shares; performance for other share classes will vary due to differences in fee structure. For information about other share classes available, please consult the prospectus. Data assumes reinvestment of dividends and capital gains, and none of the charts reflect the deduction of taxes that a shareholder would pay on fund distributions or the redemption of fund shares. Returns for the index are provided for comparison. The fund’s total returns include operating expenses (such as transaction costs and management fees) that reduce returns, while the total returns of the index do not.
21
| Portfolio Commentary |
International Value
Portfolio Managers: Gary Motyl and Guang Yang
Performance Summary
International Value returned 36.40%* for the 12 months ended November 30, 2009. By comparison, its benchmark, the MSCI EAFE Index, returned 37.72%. (Please see pages 20 and 21 for additional performance comparisons.)
The portfolio’s strong absolute return reflects the ongoing rebound of global financial markets from the depths of the credit crisis, as well as the decline in the value of the U.S. dollar. (A weaker greenback is beneficial because overseas investments are worth more when translated back into dollars.) No sector had negative results in dollar terms.
Relative to the benchmark, performance was led by some of the most economically sensitive segments of the market, including consumer discretionary, industrial, and information technology shares. Positioning in three sectors detracted from relative results: financials, materials, and health care.
Financials, Materials Detracted Most
The portfolio’s financial and materials shares were the leading detractors from relative performance because of negative currency effects and underweight positions. While these two sectors were the poorest-performing portions of the MSCI EAFE Index in 2008, they rebounded dramatically to become the two best-performing segments of the benchmark for the last 12 months.
The largest individual detractor in these sectors was global property and casualty insurer ACE Limited. We see it as a conservatively managed, high-quality company trading at very attractive valuations, but the stock did not participate in the recent rally, when traders favored higher-flying, riskier names. In addition, it hurt to be underrepresented in the commercial banks and capital markets stocks that rebounded sharply since March 2009, including HSBC Holdings, Banco Santander, Commonwealth Bank of Australia, and Deutsche Bank.
With respect to materials shares, it hurt to be underrepresented in metals and mining stocks in favor of paper and forest product companies. The portfolio had no exposure to natural resources giants BHP Billiton and Rio Tinto, which rallied sharply on signs of economic stabilization in 2009. At the same time, stakes in Finnish paper-products companies UPM-Kymmene and Stora Enso Oyj underperformed because of ongoing concern about excess capacity, high input costs, and poor demand.
In the health care sector, the primary source of weakness was an overweight position in the defensive-oriented pharmaceutical industry. These stocks lagged in the rally, making Merck KGaA (“German Merck,” as opposed to U.S.-based pharma giant Merck & Co.), Takeda Pharmaceutical, and Novartis notable detractors.
* All fund returns referenced in this commentary are for A Class shares and are not reduced by sales charges. A Class shares are subject to a
maximum sales charge of 5.75%. Had the sales charge been applied, returns would be lower than those shown.
22
International Value
Key Contributors
The leading contribution to the portfolio’s outperformance came from stock selection among consumer discretionary shares. One theme evident in this space was the portfolio’s effective positioning among auto makers and auto component companies. Among the leading contributors for the year were Korean car maker Hyundai Motor Co., Chinese battery and auto manufacturer BYD (an industrial conglomerate that’s actually categorized in the information technology sector), German automobile manufacturer Bayerische Motoren Werke (BMW), and France-based tire manufacturer Michelin. Hyundai’s relatively low-cost, fuel-efficient lineup saw it gain market share in the U.S. and, along with BYD, the company benefited from exposure to the growing Chinese market.
Industrials a Source of Strength
Stock picks among industrial shares proved another source of strength, led by positioning across a wide range of industries. For example, it helped to favor commercial services, electrical equipment, and airlines stocks, while avoiding poor-performing road and rail shares. Vestas Wind Systems was the leading contributor in the sector thanks to strong demand for alternative energy sources. British Airways benefited from a decline in 2008 record oil price levels, improvement in the global economy, and the prospect of better margins thanks to fee increases and cost cuts. Global business services provider Rentokil Initial and Shanghai Electric were other notable contributors in the sector.
Other Contributors
Stock picks in information technology (IT) and telecommunication services also helped relative results. The top contributors in the IT sector were Samsung Electronics, Compal Electronics, and Taiwan Semiconductor. Meanwhile, the number-one contributor to relative return was diversified telecommunication firm Telenor. The Norwegian-based telecom provider rebounded sharply beginning in late 2008 on the strength of cost cuts, stronger-than-expected margins, and exposure to desirable east European and Asian markets.
Outlook
“The portfolio’s positioning in terms of its sector and industry weightings, as well as country allocations, typically reflect where we are finding what we believe to be the most attractive securities at a given time,” said portfolio manager Guang Yang. “This follows from our value-oriented investment approach, which seeks to build a portfolio of high-quality companies trading at attractive valuations. As of November 30, 2009, we found opportunity in the telecommunication services sector. Information technology, energy, and consumer discretionary shares were other notable overweight positions,” he added. “And as we’ve been reporting to shareholders for some time now, we continue to hold underweight positions in the financials, consumer staples, and materials sectors.”
23
| International Value | ||
| Top Ten Holdings as of November 30, 2009 | ||
| % of net assets | % of net assets | |
| as of 11/30/09 | as of 5/31/09 | |
| Telefonica SA ADR | 3.9% | 1.8% |
| France Telecom SA | 2.9% | 1.7% |
| Vodafone Group plc | 2.9% | 1.2% |
| Telenor ASA | 2.9% | 1.1% |
| E.ON AG | 2.8% | 1.5% |
| Deutsche Post AG | 2.7% | 1.2% |
| Merck KGaA | 2.2% | 1.4% |
| AXA SA | 2.1% | 0.9% |
| Roche Holding AG | 2.1% | 0.8% |
| Cie Generale des Etablissements Michelin, Class B | 2.1% | 1.0% |
| Types of Investments in Portfolio | ||
| % of net assets | % of net assets | |
| as of 11/30/09 | as of 5/31/09 | |
| Foreign Common Stocks & Rights | 93.5% | 92.9% |
| Temporary Cash Investments | 5.3% | 6.4% |
| Other Assets and Liabilities | 1.2% | 0.7% |
| Investments by Country as of November 30, 2009 | ||
| % of net assets | % of net assets | |
| as of 11/30/09 | as of 5/31/09 | |
| United Kingdom | 17.7% | 16.5% |
| France | 13.2% | 9.0% |
| Germany | 12.2% | 8.2% |
| Switzerland | 8.7% | 7.9% |
| Spain | 6.9% | 4.5% |
| Netherlands | 5.5% | 5.4% |
| South Korea | 4.9% | 4.6% |
| Brazil | 3.9% | 3.2% |
| Japan | 3.0% | 6.8% |
| Norway | 2.9% | 1.1% |
| Hong Kong | 2.1% | 4.5% |
| Other Countries | 12.5% | 21.2% |
| Cash and Equivalents* | 6.5% | 7.1% |
| * Includes temporary cash investments and other assets and liabilities. | ||
24
| Shareholder Fee Examples (Unaudited) |
Fund shareholders may incur two types of costs: (1) transaction costs, including sales charges (loads) on purchase payments and redemption/ exchange fees; and (2) ongoing costs, including management fees; distribution and service (12b-1) fees; and other fund expenses. This example is intended to help you understand your ongoing costs (in dollars) of investing in your fund and to compare these costs with the ongoing cost of investing in other mutual funds.
The example is based on an investment of $1,000 made at the beginning of the period and held for the entire period from June 1, 2009 to November 30, 2009.
Actual Expenses
The table provides information about actual account values and actual expenses for each class. You may use the information, together with the amount you invested, to estimate the expenses that you paid over the period. First, identify the share class you own. Then simply divide your account value by $1,000 (for example, an $8,600 account value divided by $1,000 = 8.6), then multiply the result by the number under the heading “Expenses Paid During Period” to estimate the expenses you paid on your account during this period.
If you hold Investor Class shares of any American Century Investments fund, or Institutional Class shares of the American Century Diversified Bond Fund, in an American Century Investments account (i.e., not a financial intermediary or retirement plan account), American Century Investments may charge you a $12.50 semiannual account maintenance fee if the value of those shares is less than $10,000. We will redeem shares automatically in one of your accounts to pay the $12.50 fee. In determining your total eligible investment amount, we will include your investments in all personal accounts (including American Century Investments Brokerage accounts) registered under your Social Security number. Personal accounts include individual accounts, joint accounts, UGMA/UTMA accounts, personal trusts, Coverdell Education Savings Accounts and IRAs (including traditional, Roth, Rollover, SEP-, SARSEP- and SIMPLE-IRAs), and certain other retirement accounts. If you have only business, business retirement, employer-sponsored or American Century Investments Brokerage accounts, you are currently not subject to this fee. We will not charge the fee as long as you choose to manage your accounts exclusively online. If you are subject to the Account Maintenance Fee, your account value could be reduced by the fee amount.
Hypothetical Example for Comparison Purposes
The table also provides information about hypothetical account values and hypothetical expenses based on the actual expense ratio of each class of your fund and an assumed rate of return of 5% per year before expenses, which is not the actual return of a fund’s share class. The hypothetical account values and expenses may not be used to estimate the actual ending account balance or expenses you paid for the period. You may use this information to compare the ongoing costs of investing in your fund and other funds. To do so, compare this 5% hypothetical example with the 5% hypothetical examples that appear in the shareholder reports of the other funds.
25
Please note that the expenses shown in the table are meant to highlight your ongoing costs only and do not reflect any transactional costs, such as sales charges (loads) or redemption/exchange fees. Therefore, the table is useful in comparing ongoing costs only, and will not help you determine the relative total costs of owning different funds. In addition, if these transactional costs were included, your costs would have been higher.
| Beginning | Ending | Expenses Paid | ||
| Account Value | Account Value | During Period* | Annualized | |
| 6/1/09 | 11/30/09 | 6/1/09 – 11/30/09 | Expense Ratio* | |
| International Growth | ||||
| Actual | ||||
| Investor Class | $1,000 | $1,205.20 | $7.52 | 1.36% |
| Institutional Class | $1,000 | $1,207.40 | $6.42 | 1.16% |
| A Class | $1,000 | $1,204.50 | $8.90 | 1.61% |
| B Class | $1,000 | $1,200.00 | $13.03 | 2.36% |
| C Class | $1,000 | $1,200.00 | $13.03 | 2.36% |
| R Class | $1,000 | $1,201.50 | $10.27 | 1.86% |
| Hypothetical | ||||
| Investor Class | $1,000 | $1,018.25 | $6.88 | 1.36% |
| Institutional Class | $1,000 | $1,019.25 | $5.87 | 1.16% |
| A Class | $1,000 | $1,017.00 | $8.14 | 1.61% |
| B Class | $1,000 | $1,013.22 | $11.93 | 2.36% |
| C Class | $1,000 | $1,013.22 | $11.93 | 2.36% |
| R Class | $1,000 | $1,015.74 | $9.40 | 1.86% |
| Global Growth | ||||
| Actual | ||||
| Investor Class | $1,000 | $1,211.20 | $6.60 | 1.19% |
| Institutional Class | $1,000 | $1,213.50 | $5.49 | 0.99% |
| A Class | $1,000 | $1,209.80 | $7.98 | 1.44% |
| B Class | $1,000 | $1,205.50 | $12.11 | 2.19% |
| C Class | $1,000 | $1,205.60 | $12.11 | 2.19% |
| R Class | $1,000 | $1,207.90 | $9.35 | 1.69% |
| Hypothetical | ||||
| Investor Class | $1,000 | $1,019.10 | $6.02 | 1.19% |
| Institutional Class | $1,000 | $1,020.10 | $5.01 | 0.99% |
| A Class | $1,000 | $1,017.85 | $7.28 | 1.44% |
| B Class | $1,000 | $1,014.09 | $11.06 | 2.19% |
| C Class | $1,000 | $1,014.09 | $11.06 | 2.19% |
| R Class | $1,000 | $1,016.60 | $8.54 | 1.69% |
| * Expenses are equal to the class’s annualized expense ratio listed in the table above, multiplied by the average account value over the period | ||||
| multiplied by 183, the number of days in the most recent fiscal half-year, divided by 365, to reflect the one-half year period. | ||||
26
| Beginning | Ending | Expenses Paid | ||
| Account Value | Account Value | During Period* | Annualized | |
| 6/1/09 | 11/30/09 | 6/1/09 – 11/30/09 | Expense Ratio* | |
| Emerging Markets | ||||
| Actual | ||||
| Investor Class | $1,000 | $1,266.10 | $9.94 | 1.75% |
| Institutional Class | $1,000 | $1,267.90 | $8.81 | 1.55% |
| A Class | $1,000 | $1,263.30 | $11.35 | 2.00% |
| B Class | $1,000 | $1,260.40 | $15.58 | 2.75% |
| C Class | $1,000 | $1,259.60 | $15.58 | 2.75% |
| R Class | $1,000 | $1,263.90 | $12.77 | 2.25% |
| Hypothetical | ||||
| Investor Class | $1,000 | $1,016.29 | $8.85 | 1.75% |
| Institutional Class | $1,000 | $1,017.30 | $7.84 | 1.55% |
| A Class | $1,000 | $1,015.04 | $10.10 | 2.00% |
| B Class | $1,000 | $1,011.28 | $13.87 | 2.75% |
| C Class | $1,000 | $1,011.28 | $13.87 | 2.75% |
| R Class | $1,000 | $1,013.79 | $11.36 | 2.25% |
| International Value | ||||
| Actual | ||||
| Investor Class | $1,000 | $1,197.70 | $7.22 | 1.31% |
| Institutional Class | $1,000 | $1,199.30 | $6.12 | 1.11% |
| A Class | $1,000 | $1,195.80 | $8.59 | 1.56% |
| B Class | $1,000 | $1,193.00 | $12.70 | 2.31% |
| C Class | $1,000 | $1,192.40 | $12.70 | 2.31% |
| R Class | $1,000 | $1,193.40 | $9.95 | 1.81% |
| Hypothetical | ||||
| Investor Class | $1,000 | $1,018.50 | $6.63 | 1.31% |
| Institutional Class | $1,000 | $1,019.50 | $5.62 | 1.11% |
| A Class | $1,000 | $1,017.25 | $7.89 | 1.56% |
| B Class | $1,000 | $1,013.49 | $11.66 | 2.31% |
| C Class | $1,000 | $1,013.49 | $11.66 | 2.31% |
| R Class | $1,000 | $1,015.99 | $9.15 | 1.81% |
| * Expenses are equal to the class’s annualized expense ratio listed in the table above, multiplied by the average account value over the period | ||||
| multiplied by 183, the number of days in the most recent fiscal half-year, divided by 365, to reflect the one-half year period. | ||||
27
| Schedule of Investments |
| International Growth | ||||||
| NOVEMBER 30, 2009 | ||||||
| Shares | Value | Shares | Value | |||
| Common Stocks — 99.7% | LVMH Moet Hennessy | |||||
| Louis Vuitton SA | 90,980 | $ 9,475,340 | ||||
| AUSTRALIA — 4.6% | Pernod-Ricard SA | 110,747 | 9,443,732 | |||
| BHP Billiton Ltd. | 957,604 | $ 36,222,971 | Publicis Groupe SA | 196,300 | 7,557,499 | |
| Commonwealth Bank | Societe Television Francaise 1 | 263,074 | 4,684,922 | |||
| of Australia | 304,800 | 14,739,982 | ||||
| QBE Insurance Group Ltd. | 184,530 | 3,758,805 | Total SA | 248,796 | 15,395,217 | |
| Wesfarmers Ltd. | 602,879 | 16,443,827 | 92,812,518 | |||
| 71,165,585 | GERMANY — 6.3% | |||||
| BELGIUM — 1.1% | Allianz SE | 140,570 | 17,269,983 | |||
| Anheuser-Busch InBev NV | 226,597 | 11,309,801 | BASF SE | 243,700 | 14,695,658 | |
| KBC Groep NV(1) | 122,130 | 5,435,511 | Bayer AG | 154,740 | 11,847,519 | |
| 16,745,312 | Daimler AG | 245,500 | 12,430,221 | |||
| BERMUDA — 0.8% | Deutsche Boerse AG | 44,220 | 3,684,455 | |||
| Seadrill Ltd. | 537,600 | 12,428,087 | E.ON AG | 138,600 | 5,481,744 | |
| Fresenius Medical Care | ||||||
| BRAZIL — 4.0% | AG & Co. KGaA | 160,843 | 8,552,004 | |||
| Banco Santander | HeidelbergCement AG | 162,733 | 10,800,347 | |||
| Brasil SA ADR(1) | 406,810 | 5,552,956 | ||||
| Companhia Brasileira de | Metro AG | 83,380 | 5,239,588 | |||
| Meios de Pagamento | 689,459 | 6,460,610 | Muenchener | |||
| Rueckversicherungs- | ||||||
| Itau Unibanco Holding SA | Gesellschaft AG | 39,910 | 6,258,162 | |||
| Preference Shares | 526,290 | 11,377,218 | ||||
| Petroleo Brasileiro | 96,259,681 | |||||
| SA-Petrobras ADR | 231,460 | 11,869,269 | GREECE — 1.2% | |||
| Vale SA Preference Shares | 1,090,100 | 26,310,189 | National Bank of Greece SA(1) | 632,125 | 18,603,679 | |
| 61,570,242 | HONG KONG — 1.1% | |||||
| CANADA — 1.1% | Li & Fung Ltd. | 3,730,000 | 15,016,161 | |||
| Canadian National | Melco Crown | |||||
| Railway Co. | 178,870 | 9,372,286 | Entertainment Ltd. ADR(1) | 367,697 | 1,555,358 | |
| EnCana Corp. | 73,924 | 3,983,025 | 16,571,519 | |||
| Research In Motion Ltd.(1) | 51,510 | 2,981,914 | INDIA — 1.2% | |||
| 16,337,225 | Housing Development | |||||
| CZECH REPUBLIC — 0.5% | Finance Corp. Ltd. | 91,978 | 5,470,926 | |||
| CEZ AS | 157,570 | 7,884,073 | Infosys Technologies Ltd. | 82,530 | 4,221,601 | |
| Infrastructure Development | ||||||
| DENMARK — 1.7% | Finance Co. Ltd. | 450,170 | 1,605,572 | |||
| Novo Nordisk A/S B Shares | 263,979 | 17,709,920 | Larsen & Toubro Ltd. | 219,410 | 7,616,025 | |
| Vestas Wind Systems A/S(1) | 119,580 | 8,396,404 | 18,914,124 | |||
| 26,106,324 | INDONESIA — 0.1% | |||||
| FRANCE — 6.0% | PT Bank Rakyat Indonesia | 2,904,500 | 2,273,221 | |||
| BNP Paribas | 300,208 | 24,792,753 | IRELAND — 1.2% | |||
| Cie Generale des | CRH plc | 339,344 | 8,550,114 | |||
| Etablissements Michelin, | ||||||
| Class B | 59,780 | 4,533,014 | Experian plc | 510,380 | 4,811,058 | |
| Danone SA | 101,354 | 6,058,608 | Ryanair Holdings plc ADR(1) | 183,782 | 4,816,926 | |
| GDF Suez | 123,620 | 5,162,137 | 18,178,098 | |||
| Legrand SA | 207,831 | 5,709,296 | ||||
28
| International Growth | ||||||
| Shares | Value | Shares | Value | |||
| ITALY — 2.9% | NETHERLANDS — 3.3% | |||||
| ENI SpA | 285,819 | $ 7,081,330 | Akzo Nobel NV | 73,550 | $ 4,663,839 | |
| Luxottica Group SpA | 119,400 | 2,972,547 | ASML Holding NV | 496,050 | 15,239,506 | |
| Saipem SpA | 860,534 | 27,677,528 | Koninklijke KPN NV | 414,920 | 7,364,133 | |
| UniCredit SpA(1) | 1,789,280 | 6,112,227 | TNT NV | 486,870 | 14,124,073 | |
| 43,843,632 | Unilever NV CVA | 285,660 | 8,752,373 | |||
| JAPAN — 15.2% | 50,143,924 | |||||
| Asahi Glass Co. Ltd. | 474,000 | 4,140,097 | NORWAY — 0.3% | |||
| Canon, Inc. | 81,500 | 3,139,692 | Yara International ASA | 126,880 | 5,439,343 | |
| FAST RETAILING CO. LTD. | 79,200 | 14,366,682 | PEOPLE’S REPUBLIC OF CHINA — 3.8% | |||
| Hitachi Construction | Baidu, Inc. ADR(1) | 14,360 | 6,228,506 | |||
| Machinery Co. Ltd. | 586,600 | 13,708,144 | Ctrip.com International | |||
| Honda Motor Co. Ltd. | 734,100 | 22,930,009 | Ltd. ADR(1) | 158,821 | 11,649,520 | |
| HOYA Corp. | 577,700 | 14,736,563 | Industrial & Commercial | |||
| Ibiden Co., Ltd. | 278,000 | 9,391,023 | Bank of China Ltd. H Shares | 13,913,000 | 11,758,653 | |
| iShares MSCI Japan | Mindray Medical | |||||
| Index Fund | 335,270 | 3,201,828 | International Ltd. ADR | 160,020 | 4,845,406 | |
| JGC Corp. | 395,000 | 7,389,114 | Sino-Ocean Land | |||
| Kubota Corp. | 275,000 | 2,421,043 | Holdings Ltd. | 3,693,500 | 3,683,945 | |
| Mitsubishi Corp. | 887,400 | 20,018,857 | Tencent Holdings Ltd. | 749,800 | 13,863,955 | |
| Mitsubishi UFJ | ZTE Corp. H Shares | 1,142,800 | 6,473,367 | |||
| Financial Group, Inc. | 1,684,500 | 9,392,978 | 58,503,352 | |||
| Nidec Corp. | 200,000 | 17,561,314 | POLAND — 1.0% | |||
| Nitori Co. Ltd. | 180,000 | 15,076,354 | Powszechna Kasa | |||
| Nomura ETF - Nikkei 225 | 102,205 | 11,138,028 | Oszczednosci Bank Polski SA | 1,127,610 | 15,307,844 | |
| ORIX Corp. | 260,340 | 18,010,565 | RUSSIAN FEDERATION — 0.3% | |||
| Rakuten, Inc. | 21,620 | 17,458,075 | Mechel ADR | 7,675 | 149,279 | |
| SOFTBANK CORP. | 497,900 | 11,923,334 | Vimpel-Communications ADR | 230,470 | 4,399,672 | |
| Toshiba Corp.(1) | 1,599,000 | 8,472,258 | 4,548,951 | |||
| SINGAPORE — 0.4% | ||||||
| Unicharm Corp. | 79,400 | 8,101,666 | ||||
| United Overseas Bank Ltd. | 401,000 | 5,458,699 | ||||
| 232,577,624 | ||||||
| SOUTH KOREA — 3.1% | ||||||
| LUXEMBOURG — 0.6% | ||||||
| Hyundai Motor Co. | 160,432 | 13,659,071 | ||||
| Millicom International | ||||||
| Cellular SA(1) | 97,527 | 7,295,020 | POSCO | 37,730 | 18,105,727 | |
| SES SA Fiduciary | Samsung Electronics Co. Ltd. | 24,680 | 15,281,734 | |||
| Depositary Receipt | 70,220 | 1,493,541 | 47,046,532 | |||
| 8,788,561 | SPAIN — 3.6% | |||||
| MEXICO — 0.2% | Banco Santander SA | 1,686,864 | 28,900,510 | |||
| Grupo Financiero Banorte | Telefonica SA | 893,090 | 25,640,289 | |||
| SAB de CV, Series O | 1,000,960 | 3,444,580 | 54,540,799 | |||
| MULTI-NATIONAL — 1.4% | SWEDEN — 3.4% | |||||
| iShares MSCI EAFE | Atlas Copco AB A Shares | 1,207,060 | 17,106,315 | |||
| Growth Index Fund | 55,810 | 3,062,853 | Autoliv, Inc. | 66,008 | 2,680,585 | |
| iShares MSCI EAFE | Electrolux AB B Shares(1) | 416,180 | 10,184,293 | |||
| Index Fund | 140,250 | 7,772,655 | ||||
| iShares MSCI Emerging | Getinge AB B Shares | 238,760 | 4,852,908 | |||
| Markets Index Fund | 284,210 | 11,516,189 | H & M Hennes & Mauritz AB | |||
| 22,351,697 | B Shares | 118,780 | 7,024,692 | |||
| Volvo AB B Shares | 1,128,400 | 10,723,082 | ||||
| 52,571,875 | ||||||
29
| International Growth | ||||||
| Shares | Value | Shares | Value | |||
| SWITZERLAND — 8.1% | HSBC Holdings plc | |||||
| Adecco SA | 140,230 | $ 6,994,398 | (Hong Kong) | 2,730,751 | $ 31,958,389 | |
| Credit Suisse Group AG | 333,770 | 17,279,148 | Intercontinental | |||
| Julius Baer Group Ltd. | 108,840 | 3,592,061 | Hotels Group plc | 571,140 | 7,906,586 | |
| Nestle SA | 562,560 | 26,592,015 | Kingfisher plc | 2,875,426 | 11,220,422 | |
| Novartis AG | 442,000 | 24,532,331 | Man Group plc | 1,065,119 | 5,579,092 | |
| Roche Holding AG | 162,619 | 26,599,932 | Next plc | 284,900 | 9,261,295 | |
| Sonova Holding AG | 45,800 | 5,439,733 | Reckitt Benckiser Group plc | 265,113 | 13,520,259 | |
| Rolls-Royce Group plc(1) | 998,950 | 7,797,803 | ||||
| Syngenta AG | 49,812 | 13,206,168 | ||||
| 124,235,786 | Rolls-Royce Group plc | |||||
| C Shares(1) | 56,410,200 | 92,800 | ||||
| TAIWAN (REPUBLIC OF CHINA) — 1.5% | Smiths Group plc | 468,490 | 7,352,601 | |||
| Hon Hai Precision | ||||||
| Industry Co. Ltd. | 2,843,000 | 12,015,538 | Standard Chartered plc | 151,888 | 3,708,085 | |
| Taiwan Semiconductor | Tesco plc | 3,174,943 | 22,093,708 | |||
| Manufacturing Co. Ltd. ADR | 459,908 | 4,778,444 | Tullow Oil plc | 400,290 | 8,126,101 | |
| Wistron Corp. | 3,558,773 | 6,536,048 | Vodafone Group plc | 3,457,650 | 7,798,495 | |
| 23,330,030 | 288,194,980 | |||||
| TURKEY — 0.9% | TOTAL COMMON STOCKS | |||||
| Turkiye Garanti Bankasi AS | 3,958,540 | 13,557,044 | (Cost $1,163,149,920) | 1,529,734,941 | ||
| UNITED KINGDOM — 18.8% | Temporary Cash Investments — 0.2% | |||||
| Admiral Group plc | 550,657 | 9,611,449 | JPMorgan U.S. Treasury | |||
| Antofagasta plc | 776,150 | 11,497,984 | Plus Money Market Fund | |||
| ARM Holdings plc | 2,427,630 | 6,178,245 | Agency Shares | 21,645 | 21,645 | |
| Repurchase Agreement, Bank of America | ||||||
| AstraZeneca plc | 196,270 | 8,772,752 | Securities, LLC, (collateralized by various | |||
| Autonomy Corp. plc(1) | 97,680 | 2,289,881 | U.S. Treasury obligations, 4.125%-4.50%, | |||
| Barclays plc | 4,237,187 | 20,378,538 | 5/15/15-11/15/15, valued at $2,552,155), | |||
| BG Group plc | 1,508,799 | 27,377,842 | in a joint trading account at 0.12%, | |||
| dated 11/30/09, due 12/1/09 | ||||||
| BP plc | 1,266,710 | 11,973,886 | (Delivery value $2,500,008) | 2,500,000 | ||
| British Airways plc(1) | 1,745,240 | 5,607,247 | TOTAL TEMPORARY | |||
| British American Tobacco plc | 283,238 | 8,606,186 | CASH INVESTMENTS | |||
| British Sky Broadcasting | (Cost $2,521,645) | 2,521,645 | ||||
| Group plc | 681,960 | 5,940,420 | TOTAL INVESTMENT | |||
| Capita Group plc (The) | 449,037 | 5,259,621 | SECURITIES — 99.9% | |||
| (Cost $1,165,671,565) | 1,532,256,586 | |||||
| Carnival plc(1) | 330,400 | 11,077,366 | ||||
| OTHER ASSETS | ||||||
| Compass Group plc | 1,144,450 | 8,110,821 | AND LIABILITIES — 0.1% | 2,032,615 | ||
| GlaxoSmithKline plc | 439,922 | 9,097,106 | TOTAL NET ASSETS — 100.0% | $1,534,289,201 | ||
30
| International Growth | |||
| Market Sector Diversification | Notes to Schedule of Investments | ||
| (as a % of net assets) | ADR = American Depositary Receipt | ||
| Financials | 21.4% | CVA = Certificaten Van Aandelen | |
| Consumer Discretionary | 14.9% | EAFE = Europe, Australasia, and Far East | |
| Industrials | 10.6% | ETF = Exchange Traded Fund | |
| Information Technology | 10.2% | MSCI = Morgan Stanley Capital International | |
| Materials | 9.7% | (1) Non-income producing. | |
| Consumer Staples | 8.9% | ||
| Energy | 8.2% | Geographic classifications and market sector diversification | |
| Health Care | 8.0% | are unaudited. | |
| Telecommunication Services | 4.2% | ||
| Diversified | 2.4% | ||
| Utilities | 1.2% | See Notes to Financial Statements. | |
| Cash and Equivalents* | 0.3% | ||
| * Includes temporary cash investments and other assets and liabilities. | |||
31
| Global Growth | ||||||
| NOVEMBER 30, 2009 | ||||||
| Shares | Value | Shares | Value | |||
| Common Stocks — 99.1% | JAPAN — 8.0% | |||||
| Hitachi Construction | ||||||
| AUSTRALIA — 4.3% | Machinery Co. Ltd. | 137,300 | $ 3,208,538 | |||
| BHP Billiton Ltd. | 291,260 | $ 11,017,396 | Ibiden Co., Ltd. | 148,000 | 4,999,537 | |
| CSL Ltd. | 71,395 | 2,062,422 | Nidec Corp. | 88,100 | 7,735,759 | |
| National Australia Bank Ltd. | 81,830 | 2,145,015 | Nitori Co. Ltd. | 38,650 | 3,237,228 | |
| Wesfarmers Ltd. | 126,490 | 3,450,078 | ORIX Corp. | 45,290 | 3,133,204 | |
| 18,674,911 | Rakuten, Inc. | 9,012 | 7,277,159 | |||
| BRAZIL — 2.7% | Toyota Motor Corp. | 125,500 | 4,994,447 | |||
| Banco do Brasil SA | 95,700 | 1,684,494 | 34,585,872 | |||
| Banco Santander | NETHERLANDS — 1.3% | |||||
| Brasil SA ADR(1) | 274,690 | 3,749,519 | ||||
| ASML Holding NV | ||||||
| Itau Unibanco | New York Shares | 182,780 | 5,664,352 | |||
| Holding SA ADR | 67,070 | 1,492,308 | ||||
| Petroleo Brasileiro | PEOPLE’S REPUBLIC OF CHINA — 1.8% | |||||
| SA-Petrobras ADR | 92,840 | 4,760,835 | NetEase.com, Inc. ADR(1) | 53,970 | 2,063,813 | |
| 11,687,156 | Tencent Holdings Ltd. | 296,900 | 5,489,741 | |||
| DENMARK — 0.7% | 7,553,554 | |||||
| Vestas Wind Systems A/S(1) | 40,281 | 2,828,362 | POLAND — 0.7% | |||
| FRANCE — 0.7% | Powszechna Kasa | |||||
| Pernod-Ricard SA | 36,587 | 3,119,884 | Oszczednosci Bank Polski SA | 218,040 | 2,959,997 | |
| GERMANY — 0.9% | SOUTH KOREA — 2.0% | |||||
| BASF SE | 44,140 | 2,661,741 | Hyundai Motor Co. | 50,410 | 4,291,873 | |
| Samsung Electronics | ||||||
| Metro AG | 16,700 | 1,049,426 | Co. Ltd. | 6,910 | 4,278,638 | |
| 3,711,167 | 8,570,511 | |||||
| GREECE — 1.3% | SPAIN — 1.9% | |||||
| National Bank | Banco Santander SA | 484,870 | 8,307,125 | |||
| of Greece SA(1) | 191,276 | 5,629,325 | ||||
| HONG KONG — 0.3% | SWEDEN — 0.9% | |||||
| Melco Crown | Atlas Copco AB A Shares | 183,800 | 2,604,792 | |||
| Entertainment Ltd. ADR(1) | 345,880 | 1,463,072 | Getinge AB B Shares | 53,181 | 1,080,929 | |
| INDIA — 0.5% | 3,685,721 | |||||
| Bharat Heavy Electricals Ltd. | 43,970 | 2,120,987 | SWITZERLAND — 5.6% | |||
| IRELAND — 3.0% | Adecco SA | 111,730 | 5,572,874 | |||
| Accenture plc, Class A | 68,070 | 2,793,593 | Credit Suisse Group AG | 78,760 | 4,077,375 | |
| CRH plc | 220,072 | 5,564,763 | Julius Baer Group Ltd. | 73,250 | 2,417,480 | |
| Experian plc | 494,360 | 4,660,046 | Novartis AG | 72,850 | 4,043,394 | |
| 13,018,402 | Roche Holding AG | 42,270 | 6,914,193 | |||
| ISRAEL — 0.5% | Sonova Holding AG | 10,510 | 1,248,288 | |||
| Teva Pharmaceutical | 24,273,604 | |||||
| Industries Ltd. ADR | 39,940 | 2,108,433 | TAIWAN (REPUBLIC OF CHINA) — 0.2% | |||
| ITALY — 1.0% | Wistron Corp. | 514,518 | 944,965 | |||
| Saipem SpA | 129,690 | 4,171,246 | TURKEY — 0.3% | |||
| Turkiye Garanti Bankasi AS | 302,520 | 1,036,058 | ||||
32
| Global Growth | ||||||
| Shares | Value | Shares | Value | |||
| UNITED KINGDOM — 8.7% | Google, Inc., Class A(1) | 16,010 | $ 9,333,830 | |||
| Admiral Group plc | 125,070 | $ 2,183,036 | Hewlett-Packard Co. | 135,240 | 6,634,874 | |
| Antofagasta plc | 254,000 | 3,762,788 | Kohl’s Corp.(1) | 106,920 | 5,681,729 | |
| BG Group plc | 368,930 | 6,694,402 | MasterCard, Inc., Class A | 36,490 | 8,788,981 | |
| British Sky | Microsoft Corp. | 50,780 | 1,493,440 | |||
| Broadcasting Group plc | 349,430 | 3,043,816 | Occidental Petroleum Corp. | 105,040 | 8,486,182 | |
| Compass Group plc | 936,650 | 6,638,124 | PACCAR, Inc. | 66,610 | 2,469,899 | |
| HSBC Holdings plc | 563,410 | 6,552,941 | PepsiCo, Inc. | 86,740 | 5,396,963 | |
| Petrofac Ltd. | 107,060 | 1,713,690 | PNC Financial | |||
| Reckitt Benckiser Group plc | 132,665 | 6,765,663 | Services Group, Inc. | 39,620 | 2,258,736 | |
| 37,354,460 | priceline.com, Inc.(1) | 38,900 | 8,329,268 | |||
| UNITED STATES — 51.8% | QUALCOMM, Inc. | 51,010 | 2,295,450 | |||
| 3M Co. | 113,660 | 8,801,831 | Schlumberger Ltd. | 32,580 | 2,081,536 | |
| Abbott Laboratories | 139,720 | 7,613,343 | Southwestern Energy Co.(1) | 148,915 | 6,546,303 | |
| Air Products & | SYSCO Corp. | 80,110 | 2,166,174 | |||
| Chemicals, Inc. | 73,510 | 6,096,184 | Tiffany & Co. | 52,130 | 2,224,908 | |
| Allergan, Inc. | 85,910 | 4,993,948 | Union Pacific Corp. | 66,790 | 4,225,135 | |
| American Express Co. | 241,570 | 10,104,873 | United Parcel | |||
| American Tower Corp., | Service, Inc., Class B | 97,700 | 5,614,819 | |||
| Class A(1) | 172,280 | 7,049,698 | ||||
| Visa, Inc., Class A | 26,640 | 2,157,840 | ||||
| Apple, Inc.(1) | 51,460 | 10,287,369 | ||||
| XTO Energy, Inc. | 101,410 | 4,303,840 | ||||
| Avon Products, Inc. | 182,728 | 6,258,434 | 223,340,020 | |||
| Baxter International, Inc. | 39,880 | 2,175,454 | TOTAL COMMON STOCKS | |||
| Celgene Corp.(1) | 38,630 | 2,142,034 | (Cost $341,957,778) | 426,809,184 | ||
| Charles Schwab Corp. (The) | 157,020 | 2,878,177 | Temporary Cash Investments — 0.8% | |||
| Chevron Corp. | 63,530 | 4,957,881 | ||||
| JPMorgan U.S. Treasury Plus | ||||||
| Cisco Systems, Inc.(1) | 258,100 | 6,039,540 | Money Market Fund Agency | |||
| Coach, Inc. | 192,880 | 6,702,580 | Shares | 11,794 | 11,794 | |
| Colgate-Palmolive Co. | 107,160 | 9,021,800 | Repurchase Agreement, Bank of America | |||
| Costco Wholesale Corp. | 43,290 | 2,593,504 | Securities, LLC, (collateralized by various | |||
| U.S. Treasury obligations, 4.125%-4.50%, | ||||||
| Danaher Corp. | 92,270 | 6,543,788 | 5/15/15-11/15/15, valued at $3,675,104), | |||
| Discovery Communications, | in a joint trading account at 0.12%, | |||||
| Inc., Class A(1) | 191,230 | 6,109,799 | dated 11/30/09, due 12/1/09 | |||
| EMC Corp.(1) | 125,930 | 2,119,402 | (Delivery value $3,600,012) | 3,600,000 | ||
| Estee Lauder Cos., Inc. (The), | TOTAL TEMPORARY | |||||
| Class A | 20,530 | 961,420 | CASH INVESTMENTS | |||
| EXCO Resources, Inc. | 119,216 | 2,017,135 | (Cost $3,611,794) | 3,611,794 | ||
| Express Scripts, Inc.(1) | 25,450 | 2,183,610 | TOTAL INVESTMENT | |||
| SECURITIES — 99.9% | ||||||
| Fidelity National | (Cost $345,569,572) | 430,420,978 | ||||
| Financial, Inc., Class A | 185,578 | 2,577,679 | OTHER ASSETS | |||
| General Mills, Inc. | 69,580 | 4,731,440 | AND LIABILITIES — 0.1% | 491,009 | ||
| Goldman Sachs | TOTAL NET ASSETS — 100.0% | $430,911,987 | ||||
| Group, Inc. (The) | 46,500 | 7,889,190 | ||||
33
| Global Growth | |||
| Market Sector Diversification | Notes to Schedule of Investments | ||
| (as a % of net assets) | ADR = American Depositary Receipt | ||
| Information Technology | 19.3% | (1) Non-income producing. | |
| Financials | 16.5% | ||
| Consumer Discretionary | 13.9% | Geographic classifications and market sector diversification | |
| Industrials | 11.3% | are unaudited. | |
| Energy | 10.6% | ||
| Consumer Staples | 10.6% | ||
| Health Care | 8.5% | See Notes to Financial Statements. | |
| Materials | 6.8% | ||
| Telecommunication Services | 1.6% | ||
| Cash and Equivalents* | 0.9% | ||
| * Includes temporary cash investments and other assets and liabilities. | |||
34
| Emerging Markets | ||||||
| NOVEMBER 30, 2009 | ||||||
| Shares | Value | Shares | Value | |||
| Common Stocks — 98.0% | Sterlite Industries India Ltd. | 99,077 | $ 1,826,263 | |||
| Sterlite Industries India Ltd. | ||||||
| BRAZIL — 16.3% | ADR | 98,569 | 1,809,727 | |||
| Cia Brasileira de Distribuicao | 49,861,792 | |||||
| Grupo Pao de Acucar | ||||||
| Preference Shares | 154,000 | $ 4,851,154 | INDONESIA — 3.3% | |||
| Fibria Celulose SA(1) | 244,487 | 4,179,467 | PT Astra International Tbk | 1,306,000 | 4,468,440 | |
| Gerdau SA Preference Shares | 287,000 | 4,430,476 | PT Bank Rakyat Indonesia | 6,497,500 | 5,085,299 | |
| Itau Unibanco Holding SA | PT Perusahaan Gas Negara | 18,267,000 | 7,051,777 | |||
| Preference Shares | 855,718 | 18,498,717 | PT Semen Gresik Persero Tbk | 4,692,500 | 3,622,977 | |
| MRV Engenharia e | 20,228,493 | |||||
| Participacoes SA | 142,600 | 3,090,818 | ISRAEL — 0.7% | |||
| Natura Cosmeticos SA | 176,100 | 3,365,511 | Teva Pharmaceutical | |||
| PDG Realty SA | Industries Ltd. ADR | 80,559 | 4,252,709 | |||
| Empreendimentos e | MALAYSIA — 1.1% | |||||
| Participacoes | 380,100 | 3,897,351 | CIMB Group Holdings Bhd | 1,899,600 | 7,077,655 | |
| Petroleo Brasileiro | MEXICO — 4.1% | |||||
| SA-Petrobras ADR | 454,968 | 23,330,759 | ||||
| Vale SA Preference Shares | 1,304,900 | 31,494,510 | America Movil SAB de CV, | |||
| Series L ADR | 284,105 | 13,745,000 | ||||
| Vivo Particpacoes SA ADR | 158,088 | 4,821,684 | Cemex SAB de CV ADR(1) | 179,569 | 2,027,334 | |
| 101,960,447 | Grupo Financiero Banorte | |||||
| HONG KONG — 5.9% | SAB de CV, Series O | 957,874 | 3,296,309 | |||
| China Merchants Holdings | Wal-Mart de Mexico | |||||
| International Co. Ltd. | 732,000 | 2,276,269 | SAB de CV | 1,591,627 | 6,546,825 | |
| China Mobile Ltd. ADR | 178,634 | 8,372,576 | 25,615,468 | |||
| China Overseas Land | PEOPLE’S REPUBLIC OF CHINA — 14.0% | |||||
| & Investment Ltd. | 1,774,000 | 3,813,503 | Bank of China Ltd. H Shares | 5,228,000 | 2,947,898 | |
| China Resources Land Ltd. | 1,728,000 | 4,008,934 | ||||
| BYD Co. Ltd. H Shares(1) | 186,000 | 1,625,990 | ||||
| CNOOC Ltd. | 4,568,000 | 7,037,622 | ||||
| China High Speed | ||||||
| Fushan International | Transmission Equipment | |||||
| Energy Group Ltd. | 7,302,000 | 6,774,328 | Group Co. Ltd. | 1,778,000 | 4,198,347 | |
| Shimao Property | China Life Insurance Co. Ltd. | |||||
| Holdings Ltd. | 2,404,000 | 4,566,019 | H Shares | 3,092,000 | 15,479,849 | |
| 36,849,251 | China National Building | |||||
| HUNGARY — 1.1% | Material Co. Ltd. H Shares | 1,458,000 | 2,806,867 | |||
| OTP Bank plc(1) | 232,018 | 6,918,856 | China Shenhua Energy Co. | |||
| INDIA — 8.0% | Ltd. H Shares | 2,203,000 | 10,773,311 | |||
| Aban Offshore Ltd. | 83,505 | 2,266,744 | Ctrip.com International | |||
| Ltd. ADR(1) | 117,614 | 8,626,987 | ||||
| Ashok Leyland Ltd. | 3,053,281 | 3,426,449 | ||||
| Industrial & Commercial | ||||||
| Bharat Heavy Electricals Ltd. | 80,759 | 3,895,582 | Bank of China Ltd. H Shares | 12,111,000 | 10,235,682 | |
| HDFC Bank Ltd. | 111,962 | 4,251,379 | NetEase.com, Inc. ADR(1) | 106,227 | 4,062,120 | |
| ICICI Bank Ltd. | 172,046 | 3,209,935 | Ping An Insurance Group Co. | |||
| Infosys Technologies Ltd. | 284,936 | 14,575,136 | of China Ltd. H Shares | 484,500 | 4,519,887 | |
| JSW Steel Ltd. | 259,119 | 5,532,496 | Sino-Ocean Land | |||
| Maruti Suzuki India Ltd. | 149,391 | 5,001,700 | Holdings Ltd. | 2,475,500 | 2,469,096 | |
| Reliance Industries Ltd. | 177,854 | 4,066,381 | Sinopharm Group Co. | |||
| H Shares(1) | 1,108,800 | 3,905,812 | ||||
35
| Emerging Markets | ||||||
| Shares | Value | Shares | Value | |||
| Tencent Holdings Ltd. | 686,300 | $ 12,689,827 | TAIWAN (REPUBLIC OF CHINA) — 8.5% | |||
| Zhuzhou CSR Times Electric | Acer, Inc. | 1,379,000 | $ 3,432,608 | |||
| Co. Ltd. H Shares | 1,616,000 | 3,257,001 | Hon Hai Precision | |||
| 87,598,674 | Industry Co. Ltd. | 4,093,480 | 17,300,515 | |||
| PERU — 0.6% | MediaTek, Inc. | 316,036 | 4,979,342 | |||
| Credicorp Ltd. | 47,420 | 3,388,159 | Richtek Technology Corp. | 360,000 | 3,367,414 | |
| POLAND — 0.8% | Taiwan Semiconductor | |||||
| KGHM Polska Miedz SA | 128,404 | 4,997,635 | Manufacturing Co. Ltd. | 8,866,939 | 16,836,135 | |
| RUSSIAN FEDERATION — 9.4% | Wistron Corp. | 1,865,227 | 3,425,679 | |||
| CTC Media, Inc.(1) | 206,479 | 2,880,382 | Young Fast | |||
| Optoelectronics Co. Ltd. | 286,000 | 3,395,133 | ||||
| OAO Gazprom ADR | 430,808 | 9,787,958 | ||||
| 52,736,826 | ||||||
| OAO LUKOIL ADR | 60,441 | 3,511,622 | ||||
| THAILAND — 2.0% | ||||||
| Polyus Gold OJSC ADR(1) | 101,254 | 2,905,990 | ||||
| Banpu PCL | 312,000 | 5,086,600 | ||||
| Rosneft Oil Co. OJSC GDR | 444,457 | 3,577,879 | CP ALL PCL | 8,986,800 | 5,622,663 | |
| Sberbank of Russian | ||||||
| Federation | 6,025,094 | 14,285,498 | Kasikornbank PCL | 724,600 | 1,896,231 | |
| Vimpel-Communications ADR | 601,317 | 11,479,141 | 12,605,494 | |||
| Wimm-Bill-Dann Foods | TURKEY — 2.3% | |||||
| OJSC ADR(1) | 312,320 | 6,215,168 | Tofas Turk Otomobil | |||
| X5 Retail Group NV GDR(1) | 147,631 | 4,281,299 | Fabrikasi AS | 1,653,670 | 4,437,655 | |
| 58,924,937 | Turk Hava Yollari AO | 1,036,795 | 3,310,492 | |||
| SINGAPORE — 0.7% | Turkiye Garanti Bankasi AS | 1,975,518 | 6,765,672 | |||
| Wilmar International Ltd. | 940,000 | 4,278,902 | 14,513,819 | |||
| SOUTH AFRICA — 5.4% | UNITED KINGDOM — 0.8% | |||||
| Aspen Pharmacare | Antofagasta plc | 350,713 | 5,195,506 | |||
| Holdings Ltd.(1) | 664,655 | 6,103,517 | TOTAL COMMON STOCKS | |||
| Foschini Ltd. | 339,461 | 2,603,833 | (Cost $423,229,611) | 611,943,680 | ||
| Gold Fields Ltd. ADR | 177,404 | 2,622,031 | Temporary Cash Investments — 2.2% | |||
| Impala Platinum Holdings Ltd. | 96,612 | 2,240,798 | JPMorgan U.S. Treasury | |||
| Kumba Iron Ore Ltd. | 166,989 | 5,682,813 | Plus Money Market Fund | |||
| MTN Group Ltd. | 405,189 | 6,500,534 | Agency Shares | 21,895 | 21,895 | |
| Repurchase Agreement, Credit Suisse | ||||||
| Naspers Ltd. N Shares | 164,580 | 6,163,360 | First Boston, Inc., (collateralized by | |||
| Shoprite Holdings Ltd. | 214,446 | 1,794,338 | various U.S. Treasury obligations, | |||
| 33,711,224 | 4.125%, 8/15/10, valued at $13,671,992), | |||||
| SOUTH KOREA — 13.0% | in a joint trading account at 0.10%, | |||||
| dated 11/30/09, due 12/1/09 | ||||||
| Hankook Tire Co. Ltd. | 297,810 | 5,916,246 | (Delivery value $13,400,037) | 13,400,000 | ||
| Hyundai Mobis | 22,198 | 2,844,429 | TOTAL TEMPORARY | |||
| Hyundai Motor Co. | 52,490 | 4,468,963 | CASH INVESTMENTS | |||
| LG Chem Ltd. | 18,498 | 3,332,758 | (Cost $13,421,895) | 13,421,895 | ||
| LG Electronics, Inc. | 28,782 | 2,549,489 | TOTAL INVESTMENT | |||
| LG Household & | SECURITIES — 100.2% | |||||
| Health Care Ltd. | 23,087 | 5,668,506 | (Cost $436,651,506) | 625,365,575 | ||
| Lotte Shopping Co. Ltd. | 17,821 | 5,517,337 | OTHER ASSETS | |||
| AND LIABILITIES — (0.2)% | (940,870) | |||||
| POSCO | 11,925 | 5,722,523 | TOTAL NET ASSETS — 100.0% | $624,424,705 | ||
| Samsung Electronics Co. Ltd. | 53,000 | 32,817,338 | ||||
| Samsung Engineering Co. Ltd. | 59,168 | 5,520,922 | ||||
| Shinhan Financial | ||||||
| Group Co. Ltd.(1) | 175,360 | 6,869,322 | ||||
| 81,227,833 | ||||||
36
| Emerging Markets | |||
| Market Sector Diversification | Notes to Schedule of Investments | ||
| (as a % of net assets) | ADR = American Depositary Receipt | ||
| Financials | 20.8% | GDR = Global Depositary Receipt | |
| Information Technology | 19.0% | OJSC = Open Joint Stock Company | |
| Materials | 15.6% | (1) Non-income producing. | |
| Energy | 11.1% | ||
| Consumer Discretionary | 10.0% | Geographic classifications and market sector diversification | |
| Telecommunication Services | 7.2% | are unaudited. | |
| Consumer Staples | 6.8% | ||
| Industrials | 4.1% | ||
| Health Care | 2.3% | See Notes to Financial Statements. | |
| Utilities | 1.1% | ||
| Cash and Equivalents* | 2.0% | ||
| * Includes temporary cash investments and other assets and liabilities. | |||
37
| International Value | ||||||
| NOVEMBER 30, 2009 | ||||||
| Shares | Value | Shares | Value | |||
| Common Stocks & Rights — 93.5% | ISRAEL — 0.8% | |||||
| AUSTRALIA — 2.0% | Check Point Software | |||||
| Technologies(1) | 7,910 | $ 249,877 | ||||
| Australia & New Zealand | ITALY — 0.7% | |||||
| Banking Group Ltd. | 14,620 | $ 296,599 | ||||
| National Australia Bank Ltd. | 11,380 | 298,304 | ENI SpA | 8,670 | 214,804 | |
| 594,903 | JAPAN — 3.0% | |||||
| AUSTRIA — 1.0% | Mabuchi Motor Co. Ltd. | 2,800 | 137,344 | |||
| Mitsubishi UFJ Financial | ||||||
| Telekom Austria AG | 16,860 | 293,161 | Group, Inc. | 9,000 | 50,185 | |
| BRAZIL — 3.9% | Mitsubishi UFJ Financial | |||||
| Empresa Brasileira de | Group, Inc. ADR | 3,660 | 20,093 | |||
| Aeronautica SA ADR(1) | 7,620 | 154,915 | ||||
| Nintendo Co. Ltd. | 1,500 | 368,059 | ||||
| Petroleo Brasileiro | Sony Corp. | 5,100 | 137,176 | |||
| SA-Petrobras ADR | 11,580 | 593,822 | ||||
| Takeda Pharmaceutical | ||||||
| Vale SA Preference | Co. Ltd. | 4,400 | 183,249 | |||
| Shares ADR | 16,930 | 414,785 | ||||
| 1,163,522 | 896,106 | |||||
| FRANCE — 13.2% | NETHERLANDS — 5.5% | |||||
| Accor SA | 1,690 | 90,441 | Akzo Nobel NV | 4,950 | 313,882 | |
| ING Groep NV CVA(1) | 30,680 | 285,803 | ||||
| AXA SA | 26,237 | 625,223 | ||||
| Cie Generale des | ING Groep NV Rights(1) | 30,680 | 76,012 | |||
| Etablissements Michelin, | Koninklijke Philips | |||||
| Class B | 8,110 | 614,967 | Electronics NV | 9,497 | 259,750 | |
| Electricite de France SA | 2,710 | 156,339 | Reed Elsevier NV | 11,839 | 137,788 | |
| France Telecom SA | 33,620 | 874,603 | Royal Dutch Shell plc, Class B | 11,595 | 331,332 | |
| GDF Suez | 11,844 | 494,583 | SBM Offshore NV | 9,788 | 184,743 | |
| Sanofi-Aventis SA | 5,813 | 439,219 | Wolters Kluwer NV | 2,130 | 46,375 | |
| Suez Environnement Co. | 1,265 | 28,140 | 1,635,685 | |||
| Total SA | 3,880 | 240,090 | NORWAY — 2.9% | |||
| Vivendi | 12,620 | 363,642 | Telenor ASA(1) | 62,970 | 857,123 | |
| 3,927,247 | PEOPLE’S REPUBLIC OF CHINA — 1.8% | |||||
| GERMANY — 12.2% | China Shenhua Energy | |||||
| BASF SE | 3,500 | 211,058 | Co. Ltd. H Shares | 26,000 | 127,148 | |
| Bayerische Motoren | China Telecom Corp. Ltd. | |||||
| Werke AG | 6,110 | 288,307 | H Shares | 336,000 | 148,706 | |
| Deutsche Post AG | 42,330 | 792,601 | Shanghai Electric Group Co. | |||
| E.ON AG | 20,850 | 824,635 | Ltd. H Shares | 580,000 | 272,411 | |
| Merck KGaA | 6,980 | 658,300 | 548,265 | |||
| SAP AG | 11,810 | 564,274 | PORTUGAL — 0.6% | |||
| Siemens AG ADR | 3,040 | 299,805 | Portugal Telecom SGPS SA | 15,910 | 192,336 | |
| 3,638,980 | RUSSIAN FEDERATION — 1.3% | |||||
| HONG KONG — 2.1% | OAO Gazprom ADR | 16,680 | 378,970 | |||
| Cheung Kong Holdings Ltd. | 23,300 | 292,826 | SINGAPORE — 1.3% | |||
| China Mobile Ltd. | 18,000 | 168,618 | DBS Group Holdings Ltd. | 38,250 | 395,766 | |
| Hutchison Whampoa Ltd. | 23,900 | 161,594 | ||||
| 623,038 | ||||||
38
| International Value | ||||||
| Shares | Value | Shares | Value | |||
| SOUTH KOREA — 4.9% | Burberry Group plc | 30,150 | $ 282,719 | |||
| Hana Financial Group, Inc. | 4,710 | $ 136,302 | GlaxoSmithKline plc | 18,590 | 384,421 | |
| Hyundai Motor Co. | 4,200 | 357,585 | HSBC Holdings plc | |||
| KB Financial Group, Inc.(1) | 7,050 | 351,651 | (Hong Kong) | 36,400 | 425,995 | |
| Samsung Electronics Co. Ltd. | 790 | 489,164 | Kingfisher plc | 145,040 | 565,972 | |
| SK Telecom Co. Ltd. ADR | 6,710 | 111,185 | National Grid plc | 14,452 | 157,034 | |
| 1,445,887 | Pearson plc | 16,290 | 222,161 | |||
| SPAIN — 6.9% | Rentokil Initial plc(1) | 56,500 | 93,599 | |||
| Banco Santander SA | 8,470 | 145,114 | Rolls-Royce Group plc(1) | 40,420 | 315,518 | |
| Iberdrola SA | 28,170 | 267,327 | Rolls-Royce Group plc | |||
| C Shares(1) | 2,425,200 | 3,990 | ||||
| Repsol YPF SA | 17,380 | 477,574 | ||||
| Telefonica SA ADR | 13,460 | 1,166,040 | Unilever plc | 7,335 | 215,272 | |
| 2,056,055 | Vodafone Group plc | 386,223 | 871,100 | |||
| SWEDEN — 0.1% | 5,290,111 | |||||
| Loomis AB B Shares | 1,514 | 16,505 | TOTAL COMMON STOCKS & RIGHTS | |||
| (Cost $23,319,864) | 27,892,360 | |||||
| Niscayah Group AB B Shares | 7,540 | 17,953 | ||||
| 34,458 | Temporary Cash Investments — 5.3% | |||||
| SWITZERLAND — 8.7% | JPMorgan U.S. Treasury | |||||
| ACE Ltd.(1) | 11,760 | 572,829 | Plus Money Market Fund | |||
| Agency Shares | 61,072 | 61,072 | ||||
| Lonza Group AG | 2,680 | 207,447 | Repurchase Agreement, Bank of America | |||
| Nestle SA | 8,240 | 389,502 | Securities, LLC, (collateralized by | |||
| Novartis AG | 8,620 | 478,436 | various U.S. Treasury obligations, | |||
| Roche Holding AG | 3,770 | 616,667 | 4.125%-4.50%, 5/15/15-11/15/15, | |||
| valued at $1,429,207), in a joint | ||||||
| Swiss Reinsurance Co. Ltd. | 6,757 | 321,352 | trading account at 0.12%, dated | |||
| 2,586,233 | 11/30/09, due 12/1/09 | |||||
| TAIWAN (REPUBLIC OF CHINA) — 1.8% | (Delivery value $1,400,005) | 1,400,000 | ||||
| Compal Electronics, Inc. | 125,214 | 166,153 | Repurchase Agreement, Goldman Sachs | |||
| Group, Inc., (collateralized by various | ||||||
| Lite-On Technology Corp. | 61,783 | 82,751 | U.S. Treasury obligations, 5.25%, | |||
| Taiwan Semiconductor | 2/15/29, valued at $101,969), in a | |||||
| Manufacturing Co. Ltd. | 150,749 | 286,235 | joint trading account at 0.10%, | |||
| 535,139 | dated 11/30/09, due 12/1/09 | |||||
| TURKEY — 1.1% | (Delivery value $100,000) | 100,000 | ||||
| Turkcell Iletisim | TOTAL TEMPORARY CASH | |||||
| Hizmet AS ADR | 21,790 | 334,694 | INVESTMENTS | |||
| UNITED KINGDOM — 17.7% | (Cost $1,561,072) | 1,561,072 | ||||
| TOTAL INVESTMENT | ||||||
| Aviva plc | 69,640 | 424,348 | SECURITIES — 98.8% | |||
| BAE Systems plc | 37,660 | 203,272 | (Cost $24,880,936) | 29,453,432 | ||
| BP plc | 53,240 | 503,264 | OTHER ASSETS | |||
| British Airways plc(1) | 110,840 | 356,115 | AND LIABILITIES — 1.2% | 366,893 | ||
| British Sky | TOTAL NET ASSETS — 100.0% | $29,820,325 | ||||
| Broadcasting Group plc | 30,460 | 265,331 | ||||
39
| International Value | |||
| Market Sector Diversification | Notes to Schedule of Investments | ||
| (as a % of net assets) | ADR = American Depositary Receipt | ||
| Telecommunication Services | 16.8% | CVA = Certificaten Van Aandelen | |
| Financials | 15.8% | (1) Non-income producing. | |
| Consumer Discretionary | 11.3% | ||
| Energy | 10.2% | Geographic classifications and market sector diversification are unaudited. | |
| Health Care | 10.0% | ||
| Industrials | 9.9% | ||
| Information Technology | 7.9% | ||
| Utilities | 6.5% | See Notes to Financial Statements. | |
| Materials | 3.1% | ||
| Consumer Staples | 2.0% | ||
| Cash and Equivalents* | 6.5% | ||
| *Includes temporary cash investments and other assets and liabilities. | |||
40
| Statement of Assets and Liabilities |
| NOVEMBER 30, 2009 | ||||
| International | Global | Emerging | International | |
| Growth | Growth | Markets | Value | |
| Assets | ||||
| Investment securities, at value | ||||
| (cost of $1,165,671,565, | ||||
| $345,569,572, $436,651,506, | ||||
| and $24,880,936, respectively) | $1,532,256,586 | $430,420,978 | $625,365,575 | $29,453,432 |
| Cash | — | — | — | 13,134 |
| Foreign currency holdings, at value | ||||
| (cost of $126,933, $11,874, $93,392, | ||||
| and $137,537, respectively) | 126,932 | 12,048 | 93,477 | 145,540 |
| Receivable for investments sold | 14,299,620 | 520,642 | — | — |
| Receivable for capital shares sold | 955,283 | 142,494 | 540,074 | 149,436 |
| Dividends and interest receivable | 3,758,289 | 663,907 | 558,802 | 144,183 |
| Other assets | 207,486 | — | 252,344 | — |
| 1,551,604,196 | 431,760,069 | 626,810,272 | 29,905,725 | |
| Liabilities | ||||
| Disbursements in excess | ||||
| of demand deposit cash | 48,101 | 7,365 | — | — |
| Payable for investments purchased | 14,575,300 | 165,066 | — | 40,053 |
| Payable for capital shares redeemed | 955,496 | 187,595 | 640,452 | 8,241 |
| Accrued management fees | 1,693,274 | 407,093 | 876,980 | 31,259 |
| Distribution fees payable | 2,814 | 2,454 | 3,416 | 1,461 |
| Service fees (and distribution fees — | ||||
| A Class and R Class) payable | 40,010 | 8,142 | 6,133 | 4,386 |
| Accrued foreign taxes | — | 70,367 | 858,586 | — |
| 17,314,995 | 848,082 | 2,385,567 | 85,400 | |
| Net Assets | $1,534,289,201 | $430,911,987 | $624,424,705 | $29,820,325 |
| See Notes to Financial Statements. | ||||
41
| NOVEMBER 30, 2009 | ||||
| International | Global | Emerging | International | |
| Growth | Growth | Markets | Value | |
| Net Assets Consist of: | ||||
| Capital (par value and paid-in surplus) | $1,604,706,027 | $ 464,293,610 | $ 712,226,654 | $32,997,060 |
| Undistributed net investment income | 21,121,448 | 2,557,741 | — | 1,051,953 |
| Accumulated net realized loss | ||||
| on investment and foreign | ||||
| currency transactions | (458,336,972) | (120,735,324) | (275,657,627) | (8,817,409) |
| Net unrealized appreciation on | ||||
| investments and translation of assets | ||||
| and liabilities in foreign currencies | 366,798,698 | 84,795,960 | 187,855,678 | 4,588,721 |
| $1,534,289,201 | $ 430,911,987 | $ 624,424,705 | $29,820,325 | |
| Investor Class, $0.01 Par Value | ||||
| Net assets | $1,279,615,471 | $346,589,512 | $567,248,390 | $7,062,488 |
| Shares outstanding | 131,222,986 | 44,407,113 | 77,891,439 | 964,057 |
| Net asset value per share | $9.75 | $7.80 | $7.28 | $7.33 |
| Institutional Class, $0.01 Par Value | ||||
| Net assets | $66,919,885 | $44,751,924 | $27,787,144 | $1,626,631 |
| Shares outstanding | 6,844,953 | 5,665,688 | 3,740,136 | 221,721 |
| Net asset value per share | $9.78 | $7.90 | $7.43 | $7.34 |
| A Class, $0.01 Par Value | ||||
| Net assets | $177,803,964 | $34,743,710 | $23,259,930 | $18,643,855 |
| Shares outstanding | 18,290,376 | 4,529,412 | 3,274,792 | 2,542,245 |
| Net asset value per share | $9.72 | $7.67 | $7.10 | $7.33 |
| Maximum offering price | ||||
| (net asset value divided by 0.9425) | $10.31 | $8.14 | $7.53 | $7.78 |
| B Class, $0.01 Par Value | ||||
| Net assets | $1,462,502 | $850,268 | $241,319 | $1,495,363 |
| Shares outstanding | 152,377 | 113,152 | 33,262 | 210,347 |
| Net asset value per share | $9.60 | $7.51 | $7.26 | $7.11 |
| C Class, $0.01 Par Value | ||||
| Net assets | $3,051,404 | $3,534,911 | $5,371,785 | $868,956 |
| Shares outstanding | 319,906 | 486,403 | 779,765 | 119,859 |
| Net asset value per share | $9.54 | $7.27 | $6.89 | $7.25 |
| R Class, $0.01 Par Value | ||||
| Net assets | $5,435,975 | $441,662 | $516,137 | $123,032 |
| Shares outstanding | 559,072 | 57,554 | 70,906 | 16,889 |
| Net asset value per share | $9.72 | $7.67 | $7.28 | $7.28 |
| See Notes to Financial Statements. | ||||
42
| Statement of Operations |
| YEAR ENDED NOVEMBER 30, 2009 | ||||
| International | Global | Emerging | International | |
| Growth | Growth | Markets | Value | |
| Investment Income (Loss) | ||||
| Income: | ||||
| Dividends (net of foreign taxes | ||||
| withheld of $2,834,883, $322,158, | ||||
| $838,141, and $108,835, respectively) | $ 33,018,301 | $ 6,561,380 | $ 8,906,041 | $ 1,280,370 |
| Interest | 4,111 | 3,073 | 3,814 | 2,177 |
| Securities lending, net | 355,122 | 26,709 | — | — |
| 33,377,534 | 6,591,162 | 8,909,855 | 1,282,547 | |
| Expenses: | ||||
| Management fees | 17,836,177 | 4,291,269 | 8,260,830 | 428,560 |
| Distribution fees: | ||||
| B Class | 9,226 | 3,669 | 1,149 | 10,234 |
| C Class | 21,281 | 18,203 | 29,467 | 4,055 |
| Service fees: | ||||
| B Class | 3,075 | 1,223 | 383 | 3,411 |
| C Class | 7,094 | 6,068 | 9,823 | 1,352 |
| Distribution and service fees: | ||||
| A Class | 387,654 | 68,245 | 48,820 | 39,431 |
| R Class | 20,301 | 1,447 | 1,668 | 505 |
| Directors’ fees and expenses | 53,929 | 14,411 | 17,885 | 2,001 |
| Other expenses | 19,010 | 292 | 6,103 | 189 |
| 18,357,747 | 4,404,827 | 8,376,128 | 489,738 | |
| Net investment income (loss) | 15,019,787 | 2,186,335 | 533,727 | 792,809 |
| Realized and Unrealized Gain (Loss) | ||||
| Net realized gain (loss) on: | ||||
| Investment transactions (net of foreign tax | ||||
| expenses paid (refunded) of $(645), | ||||
| $—, $(10,541), and $—, respectively) | (152,578,690) | (54,313,150) | (53,940,252) | (7,458,196) |
| Foreign currency transactions | (19,433,324) | (7,100,962) | (28,228,788) | 770,168 |
| (172,012,014) | (61,414,112) | (82,169,040) | (6,688,028) | |
| Change in net unrealized | ||||
| appreciation (depreciation) on: | ||||
| Investments (net of deferred foreign | ||||
| taxes of $—, $70,367, $858,586, | ||||
| and $—, respectively) | 427,584,812 | 134,534,540 | 279,933,368 | 12,230,092 |
| Translation of assets and liabilities | ||||
| in foreign currencies | 166,077,526 | 29,800,162 | 67,391,082 | 3,288,491 |
| 593,662,338 | 164,334,702 | 347,324,450 | 15,518,583 | |
| Net realized and unrealized gain (loss) | 421,650,324 | 102,920,590 | 265,155,410 | 8,830,555 |
| Net Increase (Decrease) in Net Assets | ||||
| Resulting from Operations | $ 436,670,111 | $105,106,925 | $265,689,137 | $ 9,623,364 |
| See Notes to Financial Statements. | ||||
43
| Statement of Changes in Net Assets |
| YEARS ENDED NOVEMBER 30, 2009 AND NOVEMBER 30, 2008 | ||||
| International Growth | Global Growth | |||
| Increase (Decrease) in Net Assets | 2009 | 2008 | 2009 | 2008 |
| Operations | ||||
| Net investment income (loss) | $ 15,019,787 | $ 24,042,865 | $ 2,186,335 | $ 1,854,490 |
| Net realized gain (loss) | (172,012,014) | (277,888,882) | (61,414,112) | (59,581,994) |
| Change in net unrealized | ||||
| appreciation (depreciation) | 593,662,338 | (941,342,544) | 164,334,702 | (199,271,317) |
| Net increase (decrease) in net assets | ||||
| resulting from operations | 436,670,111 | (1,195,188,561) | 105,106,925 | (256,998,821) |
| Distributions to Shareholders | ||||
| From net investment income: | ||||
| Investor Class | (18,150,440) | (16,396,751) | (63,581) | — |
| Institutional Class | (723,098) | (741,676) | (59,013) | — |
| A Class | (2,178,683) | (1,249,007) | — | — |
| B Class | (9,776) | — | — | — |
| C Class | (24,583) | — | — | — |
| R Class | (35,665) | (7,882) | — | — |
| From net realized gains: | ||||
| Investor Class | — | (119,741,515) | — | (79,511,253) |
| Institutional Class | — | (4,054,455) | — | (2,837,675) |
| A Class | — | (14,778,847) | — | (3,126,404) |
| B Class | — | (175,930) | — | (115,751) |
| C Class | — | (399,617) | — | (473,318) |
| R Class | — | (233,277) | — | (56,481) |
| Decrease in net assets from distributions | (21,122,245) | (157,778,957) | (122,594) | (86,120,882) |
| Capital Share Transactions | ||||
| Net increase (decrease) in net assets | ||||
| from capital share transactions | (85,157,099) | (81,116,944)(1) | (2,669,083) | 151,986,102(1) |
| Redemption Fees | ||||
| Increase in net assets from redemption fees | 39,738 | —(1) | 12,362 | —(1) |
| Net increase (decrease) in net assets | 330,430,505 | (1,434,084,462) | 102,327,610 | (191,133,601) |
| Net Assets | ||||
| Beginning of period | 1,203,858,696 | 2,637,943,158 | 328,584,377 | 519,717,978 |
| End of period | $1,534,289,201 | $ 1,203,858,696 | $430,911,987 | $ 328,584,377 |
| Undistributed net investment income | $21,121,448 | $20,902,820 | $2,557,741 | $112,816 |
| (1) Capital share transactions for the year ended November 30, 2008 were net of redemption fees (Note 4). | ||||
| See Notes to Financial Statements. | ||||
44
| YEARS ENDED NOVEMBER 30, 2009 AND NOVEMBER 30, 2008 | ||||
| Emerging Markets | International Value | |||
| Increase (Decrease) in Net Assets | 2009 | 2008 | 2009 | 2008 |
| Operations | ||||
| Net investment income (loss) | $ 533,727 | $ 9,207,119 | $ 792,809 | $ 1,474,818 |
| Net realized gain (loss) | (82,169,040) | (194,735,483) | (6,688,028) | (1,349,802) |
| Change in net unrealized | ||||
| appreciation (depreciation) | 347,324,450 | (497,505,878) | 15,518,583 | (38,801,444) |
| Net increase (decrease) in net assets | ||||
| resulting from operations | 265,689,137 | (683,034,242) | 9,623,364 | (38,676,428) |
| Distributions to Shareholders | ||||
| From net investment income: | ||||
| Investor Class | (1,926,383) | (8,696,244) | (55,648) | (67,236) |
| Institutional Class | (220,437) | (738,636) | (609,469) | (1,019,740) |
| A Class | (68,022) | (227,182) | (312,916) | (452,102) |
| B Class | — | — | (20,569) | (44,990) |
| C Class | — | — | (4,827) | (2,646) |
| R Class | (418) | (93) | (1,437) | (3,223) |
| From net realized gains: | ||||
| Investor Class | — | (112,116,560) | — | (243,350) |
| Institutional Class | — | (7,840,573) | — | (3,150,452) |
| A Class | — | (4,290,167) | — | (1,754,896) |
| B Class | — | (18,131) | — | (284,309) |
| C Class | — | (1,035,923) | — | (20,803) |
| R Class | — | (3,805) | — | �� (14,258) |
| Decrease in net assets from distributions | (2,215,260) | (134,967,314) | (1,004,866) | (7,058,005) |
| Capital Share Transactions | ||||
| Net increase (decrease) in net assets | ||||
| from capital share transactions | (3,779,410) | (8,499,246)(1) | (22,114,533) | 11,701,641(1) |
| Redemption Fees | ||||
| Increase in net assets from redemption fees | 222,324 | —(1) | 2,341 | —(1) |
| Net increase (decrease) in net assets | 259,916,791 | (826,500,802) | (13,493,694) | (34,032,792) |
| Net Assets | ||||
| Beginning of period | 364,507,914 | 1,191,008,716 | 43,314,019 | 77,346,811 |
| End of period | $624,424,705 | $ 364,507,914 | $ 29,820,325 | $ 43,314,019 |
| Undistributed net investment income | — | $2,112,146 | $1,051,953 | $828,692 |
| (1) Capital share transactions for the year ended November 30, 2008 were net of redemption fees (Note 4). | ||||
| See Notes to Financial Statements. | ||||
45
| Notes to Financial Statements |
NOVEMBER 30, 2009
1. Organization and Summary of Significant Accounting Policies
Organization — American Century World Mutual Funds, Inc. (the corporation) is registered under the Investment Company Act of 1940 (the 1940 Act) as an open-end management investment company. International Growth Fund (International Growth), Global Growth Fund (Global Growth), Emerging Markets Fund (Emerging Markets) and International Value Fund (International Value) (collectively, the funds) are four funds in a series issued by the corporation. The funds are diversified under the 1940 Act. International Growth’s, Global Growth’s and Emerging Markets’ investment objective is to seek capital growth. International Value’s investment objective is to seek long-term capital growth. International Growth pursues its objective by investing primarily in equity securities of foreign companies in at least three developed countries (excluding the United States). Global Growth pursues its objective by investing primarily in equity securities of issuers in the United States and other developed countries. Emerging Markets invests at least 80% of its assets in securities of issuers in emerging market countries. International Value pursues its objective by investing primarily in equity securities of foreign companies. International Value may also invest a portion of its assets in U.S. companies. The following is a summary of the funds’ significant accounting policies.
Multiple Class — International Growth is authorized to issue the Investor Class, the Institutional Class, the A Class (formerly Advisor Class) (see Note 10), the B Class, the C Class and the R Class. Global Growth, Emerging Markets and International Value are authorized to issue the Investor Class, the Institutional Class, the A Class, the B Class, the C Class and the R Class. The A Class may incur an initial sales charge. The A Class, B Class and C Class may be subject to a contingent deferred sales charge. The share classes differ principally in their respective sales charges and distribution and shareholder servicing expenses and arrangements. All shares of the funds represent an equal pro rata interest in the net assets of the class to which such shares belong, and have identical voting, dividend, liquidation and other rights and the s ame terms and conditions, except for class specific expenses and exclusive rights to vote on matters affecting only individual classes. Income, non-class specific expenses, and realized and unrealized capital gains and losses of the funds are allocated to each class of shares based on their relative net assets.
Security Valuations — Securities traded primarily on a principal securities exchange are valued at the last reported sales price, or at the mean of the latest bid and asked prices where no last sales price is available. Depending on local convention or regulation, securities traded over-the-counter are valued at the mean of the latest bid and asked prices, the last sales price, or the official close price. Investments in open-end management investment companies are valued at the reported net asset value. Debt securities not traded on a principal securities exchange are valued through a commercial pricing service or at the mean of the most recent bid and asked prices. Discount notes may be valued through a commercial pricing service or at amortized cost, which approximates fair value. Securities traded on foreign securities exchanges and ov er-the-counter markets are normally completed before the close of business on days that the New York Stock Exchange (the Exchange) is open and may also take place on days when the Exchange is not open. If an event occurs after the value of a security was established but before the net asset value per share was determined that was likely to materially change the net asset value, that security would be valued as determined in accordance with procedures adopted by the Board of Directors. If the funds determine that the market price of a portfolio security is not readily available, or that the valuation methods mentioned above do not reflect the security’s fair value, such security is valued as determined by the Board of Directors or its designee, in accordance with procedures adopted by the Board of Directors, if such determination would materially impact a fund’s net asset value. Certain other circumstances may cause the funds to use alternative procedures to value a security such as: a security has been declared in default; trading in a security has been halted during the trading day; or there is a foreign market holiday and no trading will commence.
46
Security Transactions — For financial reporting purposes, security transactions are accounted for as of the trade date. Net realized gains and losses are determined on the identified cost basis, which is also used for federal income tax purposes. Certain countries impose taxes on realized gains on the sale of securities registered in their country. The funds record the foreign tax expense, if any, on an accrual basis. The foreign tax expense on realized gains and unrealized appreciation reduces the net realized gain (loss) on investment transactions and net unrealized appreciation (depreciation) on investments, respectively.
Investment Income — Dividend income less foreign taxes withheld, if any, is recorded as of the ex-dividend date. Interest income is recorded on the accrual basis and includes accretion of discounts and amortization of premiums.
Securities on Loan — International Growth, Global Growth and Emerging Markets may lend portfolio securities through their lending agent to certain approved borrowers in order to earn additional income. The income earned, net of any rebates or fees, is included in the Statement of Operations. International Growth, Global Growth and Emerging Markets continue to recognize any gain or loss in the market price of the securities loaned and record any interest earned or dividends declared.
Exchange Traded Funds — The funds may invest in exchange traded funds (ETFs). ETFs are a type of index fund bought and sold on a securities exchange. An ETF trades like common stock and represents a fixed portfolio of securities designed to track the performance and dividend yield of a particular domestic or foreign market index. A fund may purchase an ETF to temporarily gain exposure to a portion of the U.S. or a foreign market while awaiting purchase of underlying securities. The risks of owning an ETF generally reflect the risks of owning the underlying securities they are designed to track, although the lack of liquidity on an ETF could result in it being more volatile. Additionally, ETFs have fees and expenses that reduce their value.
Foreign Currency Translations — All assets and liabilities initially expressed in foreign currencies are translated into U.S. dollars at prevailing exchange rates at period end. The funds may enter into spot foreign currency exchange contracts to facilitate transactions denominated in a foreign currency. Purchases and sales of investment securities, dividend and interest income, spot foreign currency exchange contracts, and certain expenses are translated at the rates of exchange prevailing on the respective dates of such transactions. Realized and unrealized gains and losses from foreign currency translations arise from changes in currency exchange rates.
Net realized and unrealized foreign currency exchange gains or losses occurring during the holding period of investment securities are a component of net realized gain (loss) on foreign currency transactions and net unrealized appreciation (depreciation) on translation of assets and liabilities in foreign currencies, respectively. Certain countries may impose taxes on the contract amount of purchases and sales of foreign currency contracts in their currency. The funds record the foreign tax expense, if any, as a reduction to the net realized gain (loss) on foreign currency transactions.
Repurchase Agreements — The funds may enter into repurchase agreements with institutions that American Century Investment Management, Inc. (ACIM) has determined are creditworthy pursuant to criteria adopted by the Board of Directors. Each repurchase agreement is recorded at cost. Each fund requires that the collateral, represented by securities, received in a repurchase transaction be transferred to the custodian in a manner sufficient to enable each fund to obtain those securities in the event of a default under the repurchase agreement. ACIM monitors, on a daily basis, the securities transferred to ensure the value, including accrued interest, of the securities under each repurchase agreement is equal to or greater than amounts owed to each fund under each repurchase agreement.
Joint Trading Account — Pursuant to an Exemptive Order issued by the Securities and Exchange Commission, each fund, along with certain other funds in the American Century Investments family of funds, may transfer uninvested cash balances into a joint trading account. These balances are invested in one or more repurchase agreements that are collateralized by U.S. Treasury or Agency obligations.
47
Income Tax Status — It is each fund’s policy to distribute substantially all net investment income and net realized gains to shareholders and to otherwise qualify as a regulated investment company under provisions of the Internal Revenue Code. The funds are no longer subject to examination by tax authorities for years prior to 2006. Additionally, non-U.S. tax returns filed by the funds due to investments in certain foreign securities remain subject to examination by the relevant taxing authority for 7 years from the date of filing. At this time, management believes there are no uncertain tax positions which, based on their technical merit, would not be sustained upon examination and for which it is reasonably possible that the total amounts of unrecognized tax benefits will significantly change in the next twelve months. Accordin gly, no provision has been made for federal or state income taxes. Interest and penalties associated with any federal or state income tax obligations, if any, are recorded as interest expense.
Distributions to Shareholders — Distributions to shareholders are recorded on the ex-dividend date. Distributions from net investment income, if any, are generally declared and paid annually. Distributions from net realized gains, if any, are generally declared and paid twice per year. The funds may make distributions on a more frequent basis to comply with the distribution requirements of the Internal Revenue Code, in all events in a manner consistent with provisions of the 1940 Act.
Redemption — International Growth, Global Growth and International Value may impose a 2.00% redemption fee on shares held less than 60 days. Emerging Markets may impose a 2.00% redemption fee on shares held less than 180 days. The fee may not be applicable to all classes. The redemption fee is retained by a fund and helps cover transaction costs that long-term investors may bear when a fund sells securities to meet investor redemptions.
Indemnifications — Under the corporation’s organizational documents, its officers and directors are indemnified against certain liabilities arising out of the performance of their duties to the funds. In addition, in the normal course of business, the funds enter into contracts that provide general indemnifications. The maximum exposure under these arrangements is unknown as this would involve future claims that may be made against a fund. The risk of material loss from such claims is considered by management to be remote.
Use of Estimates — The financial statements are prepared in conformity with accounting principles generally accepted in the United States of America, which may require management to make certain estimates and assumptions at the date of the financial statements. Actual results could differ from these estimates.
Subsequent Events — Management has evaluated events or transactions that may have occurred since November 30, 2009, that would merit recognition or disclosure in the financial statements. This evaluation was completed through January 27, 2010, the date the financial statements were issued.
48
2. Fees and Transactions with Related Parties
Management Fees — The corporation has entered into a Management Agreement with American Century Global Investment Management, Inc. (ACGIM) (the investment advisor), under which ACGIM provides the funds with investment advisory and management services in exchange for a single, unified management fee (the fee) per class. The Agreement provides that all expenses of managing and operating the funds, except brokerage expenses, taxes, interest, fees and expenses of the independent directors (including legal counsel fees), and extraordinary expenses, will be paid by ACGIM. The fee is computed and accrued daily based on the daily net assets of each specific class of shares of each fund and paid monthly in arrears. For funds with a stepped fee schedule, the rate of the fee is determined by applying a fee rate calculation formula. This formula takes into account each fund’s assets as well as certain assets, if any, of other clients of the investment advisor outside the American Century Investments family of funds (such as subadvised funds and separate accounts) that have very similar investment teams and investment strategies (strategy assets).The strategy assets of International Growth includes the assets of NT International Growth Fund, one fund in a series issued by the corporation. The annual management fee schedule for International Growth ranges from 1.10% to 1.50% for the Investor Class, A Class, B Class, C Class and R Class. The annual management fee schedule for Global Growth ranges from 1.05% to 1.30% for the Investor Class, A Class, B Class, C Class and R Class. The strategy assets of Emerging Markets includes the assets of NT Emerging Markets Fund, one fund in a series issued by the corporation. The annual management fee schedule for Emerging Markets ranges from 1.25% to 1.85% for the Investor Class, A Class, B Class, C Class and R Cla ss. The annual management fee schedule for International Value ranges from 1.10% to 1.30% for the Investor Class, A Class, B Class, C Class and R Class. The Institutional Class of each fund is 0.20% less at each point within the range.
The effective annual management fee for each class of each fund for the year ended November 30, 2009 was as follows:
| Investor, A, B, C & R | Institutional | |
| International Growth | 1.38% | 1.18% |
| Global Growth | 1.22% | 1.02% |
| Emerging Markets | 1.77% | 1.57% |
| International Value | 1.30% | 1.10% |
ACGIM has entered into a Subadvisory Agreement with ACIM (the subadvisor) on behalf of the funds. The subadvisor makes investment decisions for the cash portion of the funds in accordance with their investment objectives, policies and restrictions under the supervision of ACGIM and the Board of Directors. ACGIM pays all costs associated with retaining ACIM as the subadvisor of the funds.
ACGIM has entered into a Subadvisory Agreement with Templeton Investment Counsel, LLC (Templeton) on behalf of International Value. Templeton makes investment decisions for International Value in accordance with its investment objectives, policies, and restrictions under the supervision of ACGIM and the Board of Directors. ACGIM pays all costs associated with retaining Templeton as the subadvisor of International Value. Templeton has entered into a Subadvisory Agreement with Franklin Templeton Investments (Asia) Limited on behalf of International Value.
49
Distribution and Service Fees — The Board of Directors has adopted a separate Master Distribution and Individual Shareholder Services Plan for each of the A Class, B Class, C Class and R Class (collectively the plans), pursuant to Rule 12b-1 of the 1940 Act. The plans provide that the A Class will pay American Century Investment Services, Inc. (ACIS) an annual distribution and service fee of 0.25%. The plans provide that the B Class and the C Class will each pay ACIS an annual distribution fee of 0.75% and service fee of 0.25%. The plans provide that the R Class will pay ACIS an annual distribution and service fee of 0.50%. The fees are computed and accrued daily based on each class’s daily net assets and paid monthly in arrears. The fees are used to pay financial intermediaries for distribution and individual shareholder services. Fe es incurred under the plans during the year ended November 30, 2009, are detailed in the Statement of Operations.
Acquired Fund Fees and Expenses — The funds may invest in mutual funds, exchange traded funds, and business development companies (the acquired funds). Each fund will indirectly realize its pro rata share of the fees and expenses of the acquired funds in which it invests. These indirect fees and expenses are not paid out of the fund’s assets but are reflected in the return realized by the fund on its investment in the acquired funds.
Related Parties — Certain officers and directors of the corporation are also officers and/ or directors, and, as a group, controlling stockholders of American Century Companies, Inc. (ACC), the parent of the corporation’s investment advisor, ACGIM, the corporation’s subadvisor, ACIM, the distributor of the corporation, ACIS, and the corporation’s transfer agent, American Century Services, LLC.
The funds are eligible to invest in a money market fund for temporary purposes, which is managed by J.P. Morgan Investment Management, Inc. (JPMIM). The funds have a Mutual Funds Services Agreement with J.P. Morgan Investor Services Co. (JPMIS). JPMorgan Chase Bank (JPMCB) is a custodian of the funds. International Growth, Global Growth, and Emerging Markets have a securities lending agreement with JPMCB. JPMIM, JPMIS and JPMCB are wholly owned subsidiaries of JPMorgan Chase & Co. (JPM). JPM is an equity investor in ACC.
3. Investment Transactions
Investment transactions, excluding short-term investments, for the year ended November 30, 2009, were as follows:
| International Growth | Global Growth | Emerging Markets | International Value | |
| Purchases | $1,958,471,230 | $367,391,945 | $583,645,436 | $5,174,655 |
| Sales | $2,045,187,691 | $367,369,214 | $595,045,333 | $25,590,533 |
50
| 4. Capital Share Transactions | |||||
| Transactions in shares of the funds were as follows: | |||||
| Year ended November 30, 2009 | Year ended November 30, 2008 | ||||
| Shares | Amount | Shares | Amount | ||
| International Growth | |||||
| Investor Class/Shares Authorized | 1,000,000,000 | 1,000,000,000 | |||
| Sold | 12,516,913 | $ 96,703,854 | 16,346,524 | $ 188,343,865 | |
| Issued in reinvestment of distributions | 2,043,214 | 15,589,724 | 9,115,075 | 121,417,039 | |
| Redeemed | (25,833,107) | (196,779,172) | (35,401,123) | (406,466,004)(1) | |
| (11,272,980) | (84,485,594) | (9,939,524) | (96,705,100) | ||
| Institutional Class/Shares Authorized | 150,000,000 | 150,000,000 | |||
| Sold | 3,533,605 | 25,915,890 | 2,270,167 | 28,658,822 | |
| Issued in reinvestment of distributions | 88,473 | 675,052 | 336,456 | 4,483,545 | |
| Redeemed | (1,961,908) | (14,985,413) | (2,816,175) | (33,255,557)(2) | |
| 1,660,170 | 11,605,529 | (209,552) | (113,190) | ||
| A Class/Shares Authorized | 125,000,000 | 125,000,000 | |||
| Sold | 5,639,882 | 42,702,246 | 7,835,854 | 89,842,720 | |
| Issued in connection with reclassification | |||||
| (Note 10) | — | — | 2,300,787 | 34,138,899 | |
| Issued in reinvestment of distributions | 210,171 | 1,601,500 | 994,597 | 13,237,814 | |
| Redeemed | (7,312,770) | (56,894,013) | (7,677,721) | (88,327,633) | |
| (1,462,717) | (12,590,267) | 3,453,517 | 48,891,800 | ||
| A Class (old)/Shares Authorized | N/A | N/A | |||
| Redeemed in connection with | |||||
| reclassification (Note 10) | (2,300,787) | (34,138,899) | |||
| B Class/Shares Authorized | 10,000,000 | 10,000,000 | |||
| Sold | 18,871 | 154,787 | 18,577 | 222,018 | |
| Issued in reinvestment of distributions | 971 | 7,361 | 8,548 | 113,065 | |
| Redeemed | (39,492) | (266,327) | (81,292) | (889,519) | |
| (19,650) | (104,179) | (54,167) | (554,436) | ||
| C Class/Shares Authorized | 10,000,000 | 10,000,000 | |||
| Sold | 36,318 | 302,120 | 90,230 | 1,157,701 | |
| Issued in reinvestment of distributions | 2,254 | 16,969 | 21,431 | 281,955 | |
| Redeemed | (177,382) | (1,285,116) | (154,191) | (1,633,948) | |
| (138,810) | (966,027) | (42,530) | (194,292) | ||
| R Class/Shares Authorized | 5,000,000 | 5,000,000 | |||
| Sold | 318,322 | 2,509,562 | 252,014 | 3,075,164 | |
| Issued in reinvestment of distributions | 4,389 | 33,532 | 16,313 | 217,298 | |
| Redeemed | (146,076) | (1,159,655) | (158,761) | (1,595,289)(3) | |
| 176,635 | 1,383,439 | 109,566 | 1,697,173 | ||
| Net increase (decrease) | (11,057,352) | $ (85,157,099) | (8,983,477) | $ (81,116,944) | |
| (1) | Net of redemption fees of $133,577. | ||||
| (2) | Net of redemption fees of $4,072. | ||||
| (3) | Net of redemption fees of $36. | ||||
51
| Year ended November 30, 2009 | Year ended November 30, 2008 | ||||
| Shares | Amount | Shares | Amount | ||
| Global Growth | |||||
| Investor Class/Shares Authorized | 200,000,000 | 150,000,000 | |||
| Sold | 5,400,539 | $ 34,671,769 | 12,903,489 | $ 117,137,528 | |
| Issued in reinvestment of distributions | 10,253 | 52,087 | 7,562,700 | 77,627,909 | |
| Redeemed | (7,583,471) | (47,853,604) | (11,832,280) | (100,451,544)(1) | |
| (2,172,679) | (13,129,748) | 8,633,909 | 94,313,893 | ||
| Institutional Class/Shares Authorized | 35,000,000 | 35,000,000 | |||
| Sold | 1,749,631 | 10,833,115 | 6,292,500 | 53,627,417 | |
| Issued in reinvestment of distributions | 11,450 | 58,854 | 274,954 | 2,837,675 | |
| Redeemed | (868,863) | (5,358,928) | (3,067,976) | (22,933,004)(2) | |
| 892,218 | 5,533,041 | 3,499,478 | 33,532,088 | ||
| A Class/Shares Authorized | 35,000,000 | 15,000,000 | |||
| Sold | 2,253,267 | 13,745,515 | 3,419,298 | 29,258,859 | |
| Issued in reinvestment of distributions | — | — | 295,381 | 2,989,742 | |
| Redeemed | (1,589,618) | (9,705,190) | (1,314,317) | (10,733,547) | |
| 663,649 | 4,040,325 | 2,400,362 | 21,515,054 | ||
| B Class/Shares Authorized | 10,000,000 | 10,000,000 | |||
| Sold | 59,034 | 406,476 | 42,324 | 388,905 | |
| Issued in reinvestment of distributions | — | — | 10,224 | 102,885 | |
| Redeemed | (20,190) | (111,170) | (29,348) | (240,661) | |
| 38,844 | 295,306 | 23,200 | 251,129 | ||
| C Class/Shares Authorized | 10,000,000 | 10,000,000 | |||
| Sold | 185,636 | 1,218,550 | 296,297 | 2,601,972 | |
| Issued in reinvestment of distributions | — | — | 30,561 | 297,645 | |
| Redeemed | (129,006) | (729,428) | (112,889) | (819,667) | |
| 56,630 | 489,122 | 213,969 | 2,079,950 | ||
| R Class/Shares Authorized | 5,000,000 | 5,000,000 | |||
| Sold | 26,932 | 176,194 | 26,269 | 272,639 | |
| Issued in reinvestment of distributions | — | — | 5,543 | 56,481 | |
| Redeemed | (12,873) | (73,323) | (4,313) | (35,132)(3) | |
| 14,059 | 102,871 | 27,499 | 293,988 | ||
| Net increase (decrease) | (507,279) | $ (2,669,083) | 14,798,417 | $ 151,986,102 | |
| (1) | Net of redemption fees of $38,958. | ||||
| (2) | Net of redemption fees of $10,749. | ||||
| (3) | Net of redemption fees of $14. | ||||
52
| Year ended November 30, 2009 | Year ended November 30, 2008 | ||||
| Shares | Amount | Shares | Amount | ||
| Emerging Markets | |||||
| Investor Class/Shares Authorized | 235,000,000 | 235,000,000 | |||
| Sold | 19,353,332 | $109,588,071 | 20,955,762 | $ 186,101,096 | |
| Issued in reinvestment of distributions | 411,216 | 1,603,788 | 10,190,892 | 109,760,155 | |
| Redeemed | (17,730,654) | (92,632,289) | (39,623,083) | (329,408,602)(1) | |
| 2,033,894 | 18,559,570 | (8,476,429) | (33,547,351) | ||
| Institutional Class/Shares Authorized | 40,000,000 | 40,000,000 | |||
| Sold | 1,317,412 | 7,262,735 | 1,154,823 | 11,251,167 | |
| Issued in reinvestment of distributions | 55,526 | 220,437 | 783,601 | 8,579,209 | |
| Redeemed | (4,026,999) | (25,605,195) | (1,342,517) | (10,979,038)(2) | |
| (2,654,061) | (18,122,023) | 595,907 | 8,851,338 | ||
| A Class/Shares Authorized | 40,000,000 | 40,000,000 | |||
| Sold | 1,737,602 | 8,969,379 | 3,262,064 | 29,194,767 | |
| Issued in reinvestment of distributions | 17,381 | 66,223 | 423,941 | 4,440,300 | |
| Redeemed | (2,684,625) | (13,476,300) | (2,449,683) | (19,187,483)(3) | |
| (929,642) | (4,440,698) | 1,236,322 | 14,447,584 | ||
| B Class/Shares Authorized | 10,000,000 | 10,000,000 | |||
| Sold | 20,988 | 121,866 | 29,032 | 308,820 | |
| Issued in reinvestment of distributions | — | — | 1,335 | 14,264 | |
| Redeemed | (14,744) | (73,057) | (7,598) | (83,381) | |
| 6,244 | 48,809 | 22,769 | 239,703 | ||
| C Class/Shares Authorized | 5,000,000 | 5,000,000 | |||
| Sold | 260,381 | 1,420,013 | 487,010 | 4,542,960 | |
| Issued in reinvestment of distributions | — | — | 96,421 | 990,913 | |
| Redeemed | (292,711) | (1,421,591) | (523,164) | (4,321,726) | |
| (32,330) | (1,578) | 60,267 | 1,212,147 | ||
| R Class/Shares Authorized | 10,000,000 | 10,000,000 | |||
| Sold | 59,323 | 312,438 | 41,643 | 357,176 | |
| Issued in reinvestment of distributions | 107 | 418 | 369 | 3,898 | |
| Redeemed | (22,963) | (136,346) | (9,693) | (63,741)(4) | |
| 36,467 | 176,510 | 32,319 | 297,333 | ||
| Net increase (decrease) | (1,539,428) | $ (3,779,410) | (6,528,845) | $ (8,499,246) | |
| (1) | Net of redemption fees of $790,067. | ||||
| (2) | Net of redemption fees of $30,813. | ||||
| (3) | Net of redemption fees of $1,714. | ||||
| (4) | Net of redemption fees of $13. | ||||
53
| Year ended November 30, 2009 | Year ended November 30, 2008 | ||||
| Shares | Amount | Shares | Amount | ||
| International Value | |||||
| Investor Class/Shares Authorized | 55,000,000 | 55,000,000 | |||
| Sold | 673,027 | $ 4,620,879 | 336,549 | $ 2,927,576 | |
| Issued in reinvestment of distributions | 9,439 | 54,649 | 30,784 | 306,033 | |
| Redeemed | (177,325) | (1,061,257) | (173,561) | (1,437,908)(1) | |
| 505,141 | 3,614,271 | 193,772 | 1,795,701 | ||
| Institutional Class/Shares Authorized | 55,000,000 | 55,000,000 | |||
| Sold | 110,391 | 687,461 | 60,908 | 582,254 | |
| Issued in reinvestment of distributions | 105,262 | 609,469 | 417,025 | 4,170,192 | |
| Redeemed | (4,343,332) | (26,020,480) | (64,385) | (530,218)(2) | |
| (4,127,679) | (24,723,550) | 413,548 | 4,222,228 | ||
| A Class/Shares Authorized | 55,000,000 | 55,000,000 | |||
| Sold | 573,706 | 3,482,243 | 1,272,162 | 11,190,952 | |
| Issued in reinvestment of distributions | 52,914 | 307,968 | 217,383 | 2,174,640 | |
| Redeemed | (823,600) | (4,757,711) | (888,351) | (7,481,603)(3) | |
| (196,980) | (967,500) | 601,194 | 5,883,989 | ||
| B Class/Shares Authorized | 5,000,000 | 5,000,000 | |||
| Sold | 22,588 | 137,394 | 21,765 | 194,567 | |
| Issued in reinvestment of distributions | 3,600 | 20,448 | 33,502 | 327,311 | |
| Redeemed | (102,821) | (558,503) | (131,957) | (1,128,036) | |
| (76,633) | (400,661) | (76,690) | (606,158) | ||
| C Class/Shares Authorized | 50,000,000 | 50,000,000 | |||
| Sold | 73,369 | 441,842 | 60,519 | 534,931 | |
| Issued in reinvestment of distributions | 808 | 4,679 | 2,136 | 20,888 | |
| Redeemed | (16,397) | (95,563) | (20,080) | (138,670) | |
| 57,780 | 350,958 | 42,575 | 417,149 | ||
| R Class/Shares Authorized | 5,000,000 | 5,000,000 | |||
| Sold | 5,090 | 29,371 | 11,311 | 96,932 | |
| Issued in reinvestment of distributions | 248 | 1,437 | 1,753 | 17,481 | |
| Redeemed | (2,852) | (18,859) | (16,329) | (125,681)(4) | |
| 2,486 | 11,949 | (3,265) | (11,268) | ||
| Net increase (decrease) | (3,835,885) | $(22,114,533) | 1,171,134 | $11,701,641 | |
| (1) | Net of redemption fees of $1,002. | ||||
| (2) | Net of redemption fees of $129. | ||||
| (3) | Net of redemption fees of $18. | ||||
| (4) | Net of redemption fees of $35. | ||||
54
5. Fair Value Measurements
The funds’ securities valuation process is based on several considerations and may use multiple inputs to determine the fair value of the positions held by the funds. In conformity with accounting principles generally accepted in the United States of America, the inputs used to determine a valuation are classified into three broad levels as follows:
• Level 1 valuation inputs consist of actual quoted prices in an active market for identical securities;
• Level 2 valuation inputs consist of significant direct or indirect observable market data (including quoted prices for similar securities, evaluations of subsequent market events, interest rates, prepayment speeds, credit risk, etc.); or
• Level 3 valuation inputs consist of significant unobservable inputs (including a fund’s own assumptions).
The level classification is based on the lowest level input that is significant to the fair valuation measurement. The valuation inputs are not an indication of the risks associated with investing in these securities or other financial instruments.
The following is a summary of the valuation inputs used to determine the fair value of the funds’ securities as of November 30, 2009:
| Level 1 | Level 2 | Level 3 | |
| International Growth | |||
| Investment Securities | |||
| Foreign Common Stocks | $98,339,406 | $1,431,395,535 | — |
| Temporary Cash Investments | 21,645 | 2,500,000 | — |
| Total Value of Investment Securities | $98,361,051 | $1,433,895,535 | — |
| Global Growth | |||
| Investment Securities | |||
| Domestic Common Stocks | $223,340,020 | — | — |
| Foreign Common Stocks | 24,095,925 | $179,373,239 | — |
| Temporary Cash Investments | 11,794 | 3,600,000 | — |
| Total Value of Investment Securities | $247,447,739 | $182,973,239 | —�� |
| Emerging Markets | |||
| Investment Securities | |||
| Foreign Common Stocks | $97,633,777 | $514,309,903 | — |
| Temporary Cash Investments | 21,895 | 13,400,000 | — |
| Total Value of Investment Securities | $97,655,672 | $527,709,903 | — |
| International Value | |||
| Investment Securities | |||
| Foreign Common Stocks & Rights | $3,918,045 | $23,974,315 | — |
| Temporary Cash Investments | 61,072 | 1,500,000 | — |
| Total Value of Investment Securities | $3,979,117 | $25,474,315 | — |
55
6. Bank Line of Credit
The funds, along with certain other funds in the American Century Investments family of funds, had a $500,000,000 unsecured bank line of credit agreement with Bank of America, N.A. The line expired December 10, 2008, and was not renewed. The agreement allowed the funds to borrow money for temporary or emergency purposes to fund shareholder redemptions. Borrowings under the agreement were subject to interest at the Federal Funds rate plus 0.40%. The funds did not borrow from the line during the year ended November 30, 2009.
7. Interfund Lending
The funds, along with certain other funds in the American Century Investments family of funds, may participate in an interfund lending program, pursuant to an Exemptive Order issued by the Securities and Exchange Commission (SEC). This program provides an alternative credit facility allowing the funds to borrow from or lend to other funds in the American Century Investments family of funds that permit such transactions. Interfund lending transactions are subject to each fund’s investment policies and borrowing and lending limits. The interfund loan rate earned/paid on interfund lending transactions is determined daily based on the average of certain current market rates. Interfund lending transactions normally extend only overnight, but can have a maximum duration of seven days. The program is subject to annual approval by the Board of Directors. During the year ended November 30, 2009, the funds did not utilize the progra m.
8. Risk Factors
There are certain risks involved in investing in foreign securities. These risks include those resulting from future adverse political, social, and economic developments, fluctuations in currency exchange rates, the possible imposition of exchange controls, and other foreign laws or restrictions. Investing in emerging markets may accentuate these risks.
9. Federal Tax Information
On December 15, 2009, International Growth, Global Growth and International Value declared and paid the following per-share distributions from net investment income to shareholders of record on December 14, 2009:
| Investor | Institutional | A | B | C | R | |
| International Growth | $0.0807 | $0.1006 | $0.0559 | — | — | $0.0310 |
| Global Growth | $0.0305 | $0.0464 | $0.0108 | — | — | — |
| International Value | $0.1471 | $0.1620 | $0.1286 | $0.0730 | $0.0730 | $0.1101 |
The tax character of distributions paid during the years ended November 30, 2009 and November 30, 2008 were as follows:
| International Growth | Global Growth | |||
| 2009 | 2008 | 2009 | 2008 | |
| Distributions Paid From | ||||
| Ordinary income | $21,122,245 | $18,406,727 | $122,594 | $25,787,587 |
| Long-term capital gains | — | $139,372,230 | — | $60,333,295 |
| Emerging Markets | International Value | |||
| 2009 | 2008 | 2009 | 2008 | |
| Distributions Paid From | ||||
| Ordinary income | $2,215,260 | $64,849,516 | $1,004,866 | $2,515,592 |
| Long-term capital gains | — | $70,117,798 | — | $4,542,413 |
56
The book-basis character of distributions made during the year from net investment income or net realized gains may differ from their ultimate characterization for federal income tax purposes. These differences reflect the differing character of certain income items and net realized gains and losses for financial statement and tax purposes, and may result in reclassification among certain capital accounts on the financial statements.
As of November 30, 2009, the federal tax cost of investments and the components of distributable earnings on a tax-basis were as follows:
| International Growth | Global Growth | Emerging Markets | International Value | |
| Federal tax cost of investments | $1,221,552,680 | $349,795,288 | $443,585,949 | $25,144,061 |
| Gross tax appreciation | ||||
| of investments | $316,900,275 | $84,529,610 | $188,689,274 | $6,564,779 |
| Gross tax depreciation | ||||
| of investments | (6,196,369) | (3,903,920) | (6,909,648) | (2,255,408) |
| Net tax appreciation | ||||
| (depreciation) of investments | $310,703,906 | $80,625,690 | $181,779,626 | $4,309,371 |
| Net tax appreciation (depreciation) | ||||
| on translation of assets and | ||||
| liabilities in foreign currencies | $206,454 | $(55,446) | $(858,391) | $16,225 |
| Net tax appreciation (depreciation) | $310,910,360 | $80,570,244 | $180,921,235 | $4,325,596 |
| Undistributed ordinary income | $23,122,855 | $3,141,144 | — | $1,051,953 |
| Accumulated capital losses | $(404,439,509) | $(116,425,124) | $(267,941,226) | $(8,554,284) |
| Capital loss deferrals | — | $(667,887) | $(781,958) | — |
| Currency loss deferrals | $(10,532) | — | — | — |
The difference between book-basis and tax-basis cost and unrealized appreciation (depreciation) is attributable primarily to the tax deferral of losses on wash sales and on investments in passive foreign investment companies.
The accumulated capital losses listed above represent net capital loss carryovers that may be used to offset future realized capital gains for federal income tax purposes. Future capital loss carryover utilization in any given year may be subject to Internal Revenue Code limitations. The capital loss carryovers expire as follows:
| 2016 | 2017 | |
| International Growth | $(131,447,878) | $(272,991,631) |
| Global Growth | $(40,260,034) | $(76,165,090) |
| Emerging Markets | $(150,745,366) | $(117,195,860) |
| International Value | $(1,370,503) | $(7,183,781) |
The capital and currency loss deferrals listed above represent net capital and foreign currency losses incurred in the one-month period ended November 30, 2009. The funds have elected to treat such losses as having been incurred in the following fiscal year for federal income tax purposes.
10. Corporate Event
On September 25, 2007, the A Class (old) shareholders of International Growth approved a reclassification of A Class (old) shares into Advisor Class shares. The change was approved by the Board of Directors on November 29, 2006 and March 7, 2007. The reclassification was effective on December 3, 2007. Subsequent to the reclassification, the Advisor Class was renamed A Class.
57
11. Recently Issued Accounting Standards
In March 2008, the Financial Accounting Standards Board (FASB) issued Accounting Standards Codification (ASC) Section 815-10 (formerly Statement of Financial Accounting Standards No. 161, “Disclosures about Derivative Instruments and Hedging Activities —an amendment of FASB Statement No. 133”). ASC Section 815-10 is effective for interim periods beginning after November 15, 2008 and has been adopted by the funds. ASC Section 815-10 amends and expands disclosures about derivative instruments and hedging activities. ASC Section 815-10 requires qualitative disclosures about the objectives and strategies of derivative instruments, quantitative disclosures about the fair value amounts of and gains and losses on derivative instruments, and disclosures of credit-risk-related contingent features in hedging activities.
12. Other Tax Information (Unaudited)
The following information is provided pursuant to provisions of the Internal Revenue Code.
The funds hereby designate up to the maximum amount allowable as qualified dividend income for the fiscal year ended November 30, 2009.
For corporate taxpayers, the funds hereby designate the following ordinary income distributions, or up to the maximum amount allowable, as qualified for the corporate dividends received deduction for the fiscal year ended November 30, 2009.
| International Growth | Global Growth | Emerging Markets | International Value |
| — | $122,594 | — | $20,940 |
For the fiscal year ended November 30, 2009, the funds intend to pass through to shareholders the following as a foreign tax credit, or up to the maximum amount allowable, which represents taxes paid on the following income derived from sources within foreign countries or possessions of the United States.
| International Growth | Global Growth | Emerging Markets | International Value | |
| Foreign source income | $35,301,107 | — | $9,624,101 | $1,389,205 |
| Foreign tax expense | $2,882,316 | — | $837,674 | $112,761 |
58
| Financial Highlights |
| International Growth | ||||||
| Investor Class | ||||||
| For a Share Outstanding Throughout the Years Ended November 30 | ||||||
| 2009 | 2008 | 2007 | 2006 | 2005 | ||
| Per-Share Data | ||||||
| Net Asset Value, Beginning of Period | $7.15 | $14.87 | $12.17 | $9.75 | $8.79 | |
| Income From Investment Operations | ||||||
| Net Investment Income (Loss)(1) | 0.09 | 0.14 | 0.13 | 0.06 | 0.11 | |
| Net Realized and Unrealized Gain (Loss) | 2.64 | (6.96) | 2.66 | 2.54 | 0.94 | |
| Total From Investment Operations | 2.73 | (6.82) | 2.79 | 2.60 | 1.05 | |
| Distributions | ||||||
| From Net Investment Income | (0.13) | (0.11) | (0.09) | (0.18) | (0.09) | |
| From Net Realized Gains | — | (0.79) | — | — | — | |
| Total Distributions | (0.13) | (0.90) | (0.09) | (0.18) | (0.09) | |
| Net Asset Value, End of Period | $9.75 | $7.15 | $14.87 | $12.17 | $9.75 | |
| Total Return(2) | 38.66% | (48.67)% | 23.09% | 27.03% | 12.09% | |
| Ratios/Supplemental Data | ||||||
| Ratio of Operating Expenses | ||||||
| to Average Net Assets | 1.38% | 1.31% | 1.27% | 1.26% | 1.23% | |
| Ratio of Net Investment Income (Loss) | ||||||
| to Average Net Assets | 1.18% | 1.18% | 0.94% | 0.52% | 1.22% | |
| Portfolio Turnover Rate | 151% | 144% | 133% | 95% | 89% | |
| Net Assets, End of Period (in thousands) | $1,279,615 | $1,018,753 | $2,267,093 | $2,352,967 | $2,249,430 | |
| (1) | Computed using average shares outstanding throughout the period. | |||||
| (2) | Total return assumes reinvestment of net investment income and capital gains distributions, if any. The total return of the classes may not | |||||
| precisely reflect the class expense differences because of the impact of calculating the net asset values to two decimal places. If net asset | ||||||
| values were calculated to three decimal places, the total return differences would more closely reflect the class expense differences. The | ||||||
| calculation of net asset values to two decimal places is made in accordance with SEC guidelines and does not result in any gain or loss of value | ||||||
| between one class and another. | ||||||
See Notes to Financial Statements.
59
| International Growth | ||||||
| Institutional Class | ||||||
| For a Share Outstanding Throughout the Years Ended November 30 | ||||||
| 2009 | 2008 | 2007 | 2006 | 2005 | ||
| Per-Share Data | ||||||
| Net Asset Value, Beginning of Period | $7.17 | $14.91 | $12.20 | $9.78 | $8.82 | |
| Income From Investment Operations | ||||||
| Net Investment Income (Loss)(1) | 0.11 | 0.15 | 0.17 | 0.07 | 0.13 | |
| Net Realized and Unrealized Gain (Loss) | 2.64 | (6.96) | 2.66 | 2.55 | 0.94 | |
| Total From Investment Operations | 2.75 | (6.81) | 2.83 | 2.62 | 1.07 | |
| Distributions | ||||||
| From Net Investment Income | (0.14) | (0.14) | (0.12) | (0.20) | (0.11) | |
| From Net Realized Gains | — | (0.79) | — | — | — | |
| Total Distributions | (0.14) | (0.93) | (0.12) | (0.20) | (0.11) | |
| Net Asset Value, End of Period | $9.78 | $7.17 | $14.91 | $12.20 | $9.78 | |
| Total Return(2) | 38.96% | (48.55)% | 23.36% | 27.19% | 12.28% | |
| Ratios/Supplemental Data | ||||||
| Ratio of Operating Expenses | ||||||
| to Average Net Assets | 1.18% | 1.11% | 1.07% | 1.06% | 1.03% | |
| Ratio of Net Investment Income (Loss) | ||||||
| to Average Net Assets | 1.38% | 1.38% | 1.14% | 0.72% | 1.42% | |
| Portfolio Turnover Rate | 151% | 144% | 133% | 95% | 89% | |
| Net Assets, End of Period (in thousands) | $66,920 | $37,160 | $80,452 | $125,814 | $247,077 | |
| (1) | Computed using average shares outstanding throughout the period. | |||||
| (2) | Total return assumes reinvestment of net investment income and capital gains distributions, if any. The total return of the classes may not | |||||
| precisely reflect the class expense differences because of the impact of calculating the net asset values to two decimal places. If net asset | ||||||
| values were calculated to three decimal places, the total return differences would more closely reflect the class expense differences. The | ||||||
| calculation of net asset values to two decimal places is made in accordance with SEC guidelines and does not result in any gain or loss of value | ||||||
| between one class and another. | ||||||
See Notes to Financial Statements.
60
| International Growth | ||||||
| A Class(1) | ||||||
| For a Share Outstanding Throughout the Years Ended November 30 | ||||||
| 2009 | 2008 | 2007 | 2006 | 2005 | ||
| Per-Share Data | ||||||
| Net Asset Value, Beginning of Period | $7.13 | $14.82 | $12.12 | $9.72 | $8.76 | |
| Income From Investment Operations | ||||||
| Net Investment Income (Loss)(2) | 0.07 | 0.11 | 0.08 | 0.03 | 0.09 | |
| Net Realized and Unrealized Gain (Loss) | 2.63 | (6.94) | 2.68 | 2.52 | 0.94 | |
| Total From Investment Operations | 2.70 | (6.83) | 2.76 | 2.55 | 1.03 | |
| Distributions | ||||||
| From Net Investment Income | (0.11) | (0.07) | (0.06) | (0.15) | (0.07) | |
| From Net Realized Gains | — | (0.79) | — | — | — | |
| Total Distributions | (0.11) | (0.86) | (0.06) | (0.15) | (0.07) | |
| Net Asset Value, End of Period | $9.72 | $7.13 | $14.82 | $12.12 | $9.72 | |
| Total Return(3) | 38.30% | (48.79)% | 22.87% | 26.57% | 11.85% | |
| Ratios/Supplemental Data | ||||||
| Ratio of Operating Expenses | ||||||
| to Average Net Assets | 1.63% | 1.56% | 1.52% | 1.51% | 1.48% | |
| Ratio of Net Investment Income (Loss) | ||||||
| to Average Net Assets | 0.93% | 0.93% | 0.69% | 0.27% | 0.97% | |
| Portfolio Turnover Rate | 151% | 144% | 133% | 95% | 89% | |
| Net Assets, End of Period (in thousands) | $177,804 | $140,798 | $241,579 | $336,497 | $259,651 | |
| (1) | Prior to December 3, 2007, the A Class was referred to as the Advisor Class. | |||||
| (2) | Computed using average shares outstanding throughout the period. | |||||
| (3) | Total return assumes reinvestment of net investment income and capital gains distributions, if any, and does not reflect applicable sales charges. | |||||
| The total return of the classes may not precisely reflect the class expense differences because of the impact of calculating the net asset values | ||||||
| to two decimal places. If net asset values were calculated to three decimal places, the total return differences would more closely reflect the | ||||||
| class expense differences. The calculation of net asset values to two decimal places is made in accordance with SEC guidelines and does not | ||||||
| result in any gain or loss of value between one class and another. | ||||||
See Notes to Financial Statements.
61
| International Growth | ||||||
| B Class | ||||||
| For a Share Outstanding Throughout the Years Ended November 30 | ||||||
| 2009 | 2008 | 2007 | 2006 | 2005 | ||
| Per-Share Data | ||||||
| Net Asset Value, Beginning of Period | $7.04 | $14.68 | $12.04 | $9.65 | $8.70 | |
| Income From Investment Operations | ||||||
| Net Investment Income (Loss)(1) | 0.01 | 0.02 | —(2) | (0.05) | 0.02 | |
| Net Realized and Unrealized Gain (Loss) | 2.61 | (6.87) | 2.64 | 2.52 | 0.93 | |
| Total From Investment Operations | 2.62 | (6.85) | 2.64 | 2.47 | 0.95 | |
| Distributions | ||||||
| From Net Investment Income | (0.06) | — | — | (0.08) | —(2) | |
| From Net Realized Gains | — | (0.79) | — | — | — | |
| Total Distributions | (0.06) | (0.79) | — | (0.08) | —(2) | |
| Net Asset Value, End of Period | $9.60 | $7.04 | $14.68 | $12.04 | $9.65 | |
| Total Return(3) | 37.36% | (49.18)% | 21.93% | 25.71% | 10.97% | |
| Ratios/Supplemental Data | ||||||
| Ratio of Operating Expenses | ||||||
| to Average Net Assets | 2.38% | 2.31% | 2.27% | 2.26% | 2.23% | |
| Ratio of Net Investment Income (Loss) | ||||||
| to Average Net Assets | 0.18% | 0.18% | (0.06)% | (0.48)% | 0.22% | |
| Portfolio Turnover Rate | 151% | 144% | 133% | 95% | 89% | |
| Net Assets, End of Period (in thousands) | $1,463 | $1,211 | $3,320 | $2,699 | $1,676 | |
| (1) | Computed using average shares outstanding throughout the period. | |||||
| (2) | Per-share amount was less than $0.005. | |||||
| (3) | Total return assumes reinvestment of net investment income and capital gains distributions, if any, and does not reflect applicable sales charges. | |||||
| The total return of the classes may not precisely reflect the class expense differences because of the impact of calculating the net asset values | ||||||
| to two decimal places. If net asset values were calculated to three decimal places, the total return differences would more closely reflect the | ||||||
| class expense differences. The calculation of net asset values to two decimal places is made in accordance with SEC guidelines and does not | ||||||
| result in any gain or loss of value between one class and another. | ||||||
See Notes to Financial Statements.
62
| International Growth | ||||||
| C Class | ||||||
| For a Share Outstanding Throughout the Years Ended November 30 | ||||||
| 2009 | 2008 | 2007 | 2006 | 2005 | ||
| Per-Share Data | ||||||
| Net Asset Value, Beginning of Period | $7.00 | $14.60 | $11.97 | $9.60 | $8.66 | |
| Income From Investment Operations | ||||||
| Net Investment Income (Loss)(1) | 0.01 | 0.02 | —(2) | (0.05) | 0.02 | |
| Net Realized and Unrealized Gain (Loss) | 2.59 | (6.83) | 2.63 | 2.50 | 0.92 | |
| Total From Investment Operations | 2.60 | (6.81) | 2.63 | 2.45 | 0.94 | |
| Distributions | ||||||
| From Net Investment Income | (0.06) | — | — | (0.08) | —(2) | |
| From Net Realized Gains | — | (0.79) | — | — | — | |
| Total Distributions | (0.06) | (0.79) | — | (0.08) | —(2) | |
| Net Asset Value, End of Period | $9.54 | $7.00 | $14.60 | $11.97 | $9.60 | |
| Total Return(3) | 37.29% | (49.18)% | 21.97% | 25.64% | 10.91% | |
| Ratios/Supplemental Data | ||||||
| Ratio of Operating Expenses | ||||||
| to Average Net Assets | 2.38% | 2.31% | 2.27% | 2.26% | 2.23% | |
| Ratio of Net Investment Income (Loss) | ||||||
| to Average Net Assets | 0.18% | 0.18% | (0.06)% | (0.48)% | 0.22% | |
| Portfolio Turnover Rate | 151% | 144% | 133% | 95% | 89% | |
| Net Assets, End of Period (in thousands) | $3,051 | $3,210 | $7,318 | $6,250 | $5,246 | |
| (1) | Computed using average shares outstanding throughout the period. | |||||
| (2) | Per-share amount was less than $0.005. | |||||
| (3) | Total return assumes reinvestment of net investment income and capital gains distributions, if any, and does not reflect applicable sales charges. | |||||
| The total return of the classes may not precisely reflect the class expense differences because of the impact of calculating the net asset values | ||||||
| to two decimal places. If net asset values were calculated to three decimal places, the total return differences would more closely reflect the | ||||||
| class expense differences. The calculation of net asset values to two decimal places is made in accordance with SEC guidelines and does not | ||||||
| result in any gain or loss of value between one class and another. | ||||||
See Notes to Financial Statements.
63
| International Growth | ||||||
| R Class | ||||||
| For a Share Outstanding Throughout the Years Ended November 30 | ||||||
| 2009 | 2008 | 2007 | 2006 | 2005 | ||
| Per-Share Data | ||||||
| Net Asset Value, Beginning of Period | $7.13 | $14.81 | $12.12 | $9.71 | $8.75 | |
| Income From Investment Operations | ||||||
| Net Investment Income (Loss)(1) | 0.06 | 0.09 | 0.07 | 0.01 | 0.07 | |
| Net Realized and Unrealized Gain (Loss) | 2.62 | (6.96) | 2.65 | 2.53 | 0.94 | |
| Total From Investment Operations | 2.68 | (6.87) | 2.72 | 2.54 | 1.01 | |
| Distributions | ||||||
| From Net Investment Income | (0.09) | (0.02) | (0.03) | (0.13) | (0.05) | |
| From Net Realized Gains | — | (0.79) | — | — | — | |
| Total Distributions | (0.09) | (0.81) | (0.03) | (0.13) | (0.05) | |
| Net Asset Value, End of Period | $9.72 | $7.13 | $14.81 | $12.12 | $9.71 | |
| Total Return(2) | 37.97% | (48.92)% | 22.48% | 26.39% | 11.58% | |
| Ratios/Supplemental Data | ||||||
| Ratio of Operating Expenses | ||||||
| to Average Net Assets | 1.88% | 1.81% | 1.77% | 1.76% | 1.69%(3) | |
| Ratio of Net Investment Income (Loss) | ||||||
| to Average Net Assets | 0.68% | 0.68% | 0.44% | 0.02% | 0.76%(3) | |
| Portfolio Turnover Rate | 151% | 144% | 133% | 95% | 89% | |
| Net Assets, End of Period (in thousands) | $5,436 | $2,727 | $4,042 | $2,106 | $1,809 | |
| (1) | Computed using average shares outstanding throughout the period. | |||||
| (2) | Total return assumes reinvestment of net investment income and capital gains distributions, if any. The total return of the classes may not | |||||
| precisely reflect the class expense differences because of the impact of calculating the net asset values to two decimal places. If net asset | ||||||
| values were calculated to three decimal places, the total return differences would more closely reflect the class expense differences. The | ||||||
| calculation of net asset values to two decimal places is made in accordance with SEC guidelines and does not result in any gain or loss of value | ||||||
| between one class and another. | ||||||
| (3) | During the year ended November 30, 2005, the class received a partial reimbursement of its distribution and service fees. Had fees not been | |||||
| reimbursed, the ratio of operating expenses to average net assets and the ratio of net investment income (loss) to average net assets would have | ||||||
| been 1.73% and 0.72%, respectively. | ||||||
See Notes to Financial Statements.
64
| Global Growth | ||||||
| Investor Class | ||||||
| For a Share Outstanding Throughout the Years Ended November 30 | ||||||
| 2009 | 2008 | 2007 | 2006 | 2005 | ||
| Per-Share Data | ||||||
| Net Asset Value, Beginning of Period | $5.90 | $12.69 | $10.52 | $8.88 | $7.49 | |
| Income From Investment Operations | ||||||
| Net Investment Income (Loss)(1) | 0.04 | 0.04 | 0.03 | —(2) | —(2) | |
| Net Realized and Unrealized Gain (Loss) | 1.86 | (4.75) | 2.41 | 1.70 | 1.41 | |
| Total From Investment Operations | 1.90 | (4.71) | 2.44 | 1.70 | 1.41 | |
| Distributions | ||||||
| From Net Investment Income | —(2) | — | (0.05) | (0.06) | (0.02) | |
| From Net Realized Gains | — | (2.08) | (0.22) | — | — | |
| Total Distributions | —(2) | (2.08) | (0.27) | (0.06) | (0.02) | |
| Net Asset Value, End of Period | $7.80 | $5.90 | $12.69 | $10.52 | $8.88 | |
| Total Return(3) | 32.24% | (44.01)% | 23.73% | 19.30% | 18.87% | |
| Ratios/Supplemental Data | ||||||
| Ratio of Operating Expenses | ||||||
| to Average Net Assets | 1.22% | 1.26% | 1.30% | 1.31% | 1.30% | |
| Ratio of Net Investment Income (Loss) | ||||||
| to Average Net Assets | 0.62% | 0.40% | 0.29% | (0.05)% | (0.01)% | |
| Portfolio Turnover Rate | 103% | 121% | 108% | 95% | 36% | |
| Net Assets, End of Period (in thousands) | $346,590 | $274,599 | $481,553 | $418,185 | $378,976 | |
| (1) | Computed using average shares outstanding throughout the period. | |||||
| (2) | Per-share amount was less than $0.005. | |||||
| (3) | Total return assumes reinvestment of net investment income and capital gains distributions, if any. The total return of the classes may not | |||||
| precisely reflect the class expense differences because of the impact of calculating the net asset values to two decimal places. If net asset | ||||||
| values were calculated to three decimal places, the total return differences would more closely reflect the class expense differences. The | ||||||
| calculation of net asset values to two decimal places is made in accordance with SEC guidelines and does not result in any gain or loss of value | ||||||
| between one class and another. | ||||||
See Notes to Financial Statements.
65
| Global Growth | ||||||
| Institutional Class | ||||||
| For a Share Outstanding Throughout the Years Ended November 30 | ||||||
| 2009 | 2008 | 2007 | 2006 | 2005 | ||
| Per-Share Data | ||||||
| Net Asset Value, Beginning of Period | $5.97 | $12.79 | $10.60 | $8.95 | $7.55 | |
| Income From Investment Operations | ||||||
| Net Investment Income (Loss)(1) | 0.05 | 0.07 | 0.06 | 0.01 | 0.01 | |
| Net Realized and Unrealized Gain (Loss) | 1.89 | (4.81) | 2.42 | 1.72 | 1.43 | |
| Total From Investment Operations | 1.94 | (4.74) | 2.48 | 1.73 | 1.44 | |
| Distributions | ||||||
| From Net Investment Income | (0.01) | — | (0.07) | (0.08) | (0.04) | |
| From Net Realized Gains | — | (2.08) | (0.22) | — | — | |
| Total Distributions | (0.01) | (2.08) | (0.29) | (0.08) | (0.04) | |
| Net Asset Value, End of Period | $7.90 | $5.97 | $12.79 | $10.60 | $8.95 | |
| Total Return(2) | 32.61% | (43.88)% | 23.99% | 19.50% | 19.22% | |
| Ratios/Supplemental Data | ||||||
| Ratio of Operating Expenses | ||||||
| to Average Net Assets | 1.02% | 1.05% | 1.10% | 1.11% | 1.10% | |
| Ratio of Net Investment Income (Loss) | ||||||
| to Average Net Assets | 0.82% | 0.61% | 0.49% | 0.15% | 0.19% | |
| Portfolio Turnover Rate | 103% | 121% | 108% | 95% | 36% | |
| Net Assets, End of Period (in thousands) | $44,752 | $28,477 | $16,298 | $8,540 | $8,669 | |
| (1) | Computed using average shares outstanding throughout the period. | |||||
| (2) | Total return assumes reinvestment of net investment income and capital gains distributions, if any. The total return of the classes may not | |||||
| precisely reflect the class expense differences because of the impact of calculating the net asset values to two decimal places. If net asset | ||||||
| values were calculated to three decimal places, the total return differences would more closely reflect the class expense differences. The | ||||||
| calculation of net asset values to two decimal places is made in accordance with SEC guidelines and does not result in any gain or loss of value | ||||||
| between one class and another. | ||||||
See Notes to Financial Statements.
66
| Global Growth | ||||||
| A Class(1) | ||||||
| For a Share Outstanding Throughout the Years Ended November 30 | ||||||
| 2009 | 2008 | 2007 | 2006 | 2005 | ||
| Per-Share Data | ||||||
| Net Asset Value, Beginning of Period | $5.81 | $12.56 | $10.41 | $8.79 | $7.41 | |
| Income From Investment Operations | ||||||
| Net Investment Income (Loss)(2) | 0.02 | 0.01 | 0.01 | (0.03) | (0.02) | |
| Net Realized and Unrealized Gain (Loss) | 1.84 | (4.68) | 2.38 | 1.69 | 1.40 | |
| Total From Investment Operations | 1.86 | (4.67) | 2.39 | 1.66 | 1.38 | |
| Distributions | ||||||
| From Net Investment Income | — | — | (0.02) | (0.04) | — | |
| From Net Realized Gains | — | (2.08) | (0.22) | — | — | |
| Total Distributions | — | (2.08) | (0.24) | (0.04) | — | |
| Net Asset Value, End of Period | $7.67 | $5.81 | $12.56 | $10.41 | $8.79 | |
| Total Return(3) | 32.01% | (44.17)% | 23.47% | 18.97% | 18.62% | |
| Ratios/Supplemental Data | ||||||
| Ratio of Operating Expenses | ||||||
| to Average Net Assets | 1.47% | 1.51% | 1.55% | 1.56% | 1.55% | |
| Ratio of Net Investment Income (Loss) | ||||||
| to Average Net Assets | 0.37% | 0.15% | 0.04% | (0.30)% | (0.26)% | |
| Portfolio Turnover Rate | 103% | 121% | 108% | 95% | 36% | |
| Net Assets, End of Period (in thousands) | $34,744 | $22,447 | $18,402 | $5,571 | $3,664 | |
| (1) | Prior to September 4, 2007, the A Class was referred to as the Advisor Class. | |||||
| (2) | Computed using average shares outstanding throughout the period. | |||||
| (3) | Total return assumes reinvestment of net investment income and capital gains distributions, if any, and does not reflect applicable sales charges. | |||||
| The total return of the classes may not precisely reflect the class expense differences because of the impact of calculating the net asset values | ||||||
| to two decimal places. If net asset values were calculated to three decimal places, the total return differences would more closely reflect the | ||||||
| class expense differences. The calculation of net asset values to two decimal places is made in accordance with SEC guidelines and does not | ||||||
| result in any gain or loss of value between one class and another. | ||||||
See Notes to Financial Statements.
67
| Global Growth | |||||
| B Class | |||||
| For a Share Outstanding Throughout the Years Ended November 30 | |||||
| 2009 | 2008 | 2007 | 2006 | ||
| Per-Share Data | |||||
| Net Asset Value, Beginning of Period | $5.73 | $12.50 | $10.42 | $9.02 | |
| Income From Investment Operations | |||||
| Net Investment Income (Loss)(1) | (0.03) | (0.05) | (0.08) | (0.11) | |
| Net Realized and Unrealized Gain (Loss) | 1.81 | (4.64) | 2.38 | 1.57 | |
| Total From Investment Operations | 1.78 | (4.69) | 2.30 | 1.46 | |
| Distributions | |||||
| From Net Investment Income | — | — | — | (0.06) | |
| From Net Realized Gains | — | (2.08) | (0.22) | — | |
| Total Distributions | — | (2.08) | (0.22) | (0.06) | |
| Net Asset Value, End of Period | $7.51 | $5.73 | $12.50 | $10.42 | |
| Total Return(2) | 31.06% | (44.62)% | 22.51% | 16.29% | |
| Ratios/Supplemental Data | |||||
| Ratio of Operating Expenses to Average Net Assets | 2.22% | 2.26% | 2.30% | 2.31% | |
| Ratio of Net Investment Income (Loss) to Average Net Assets | (0.38)% | (0.60)% | (0.71)% | (1.05)% | |
| Portfolio Turnover Rate | 103% | 121% | 108% | 95% | |
| Net Assets, End of Period (in thousands) | $850 | $426 | $639 | $352 | |
| (1) | Computed using average shares outstanding throughout the period. | ||||
| (2) | Total return assumes reinvestment of net investment income and capital gains distributions, if any, and does not reflect applicable sales charges. | ||||
| The total return of the classes may not precisely reflect the class expense differences because of the impact of calculating the net asset values | |||||
| to two decimal places. If net asset values were calculated to three decimal places, the total return differences would more closely reflect the | |||||
| class expense differences. The calculation of net asset values to two decimal places is made in accordance with SEC guidelines and does not | |||||
| result in any gain or loss of value between one class and another. | |||||
See Notes to Financial Statements.
68
| Global Growth | ||||||
| C Class | ||||||
| For a Share Outstanding Throughout the Years Ended November 30 | ||||||
| 2009 | 2008 | 2007 | 2006 | 2005 | ||
| Per-Share Data | ||||||
| Net Asset Value, Beginning of Period | $5.54 | $12.16 | $10.14 | $8.59 | $7.29 | |
| Income From Investment Operations | ||||||
| Net Investment Income (Loss)(1) | (0.02) | (0.05) | (0.07) | (0.10) | (0.08) | |
| Net Realized and Unrealized Gain (Loss) | 1.75 | (4.49) | 2.31 | 1.65 | 1.38 | |
| Total From Investment Operations | 1.73 | (4.54) | 2.24 | 1.55 | 1.30 | |
| Distributions | ||||||
| From Net Realized Gains | — | (2.08) | (0.22) | — | — | |
| Net Asset Value, End of Period | $7.27 | $5.54 | $12.16 | $10.14 | $8.59 | |
| Total Return(2) | 31.23% | (44.64)% | 22.54% | 18.04% | 17.83% | |
| Ratios/Supplemental Data | ||||||
| Ratio of Operating Expenses | ||||||
| to Average Net Assets | 2.22% | 2.26% | 2.30% | 2.31% | 2.30% | |
| Ratio of Net Investment Income (Loss) | ||||||
| to Average Net Assets | (0.38)% | (0.60)% | (0.71)% | (1.05)% | (1.01)% | |
| Portfolio Turnover Rate | 103% | 121% | 108% | 95% | 36% | |
| Net Assets, End of Period (in thousands) | $3,535 | $2,382 | $2,625 | $1,050 | $454 | |
| (1) | Computed using average shares outstanding throughout the period. | |||||
| (2) | Total return assumes reinvestment of net investment income and capital gains distributions, if any, and does not reflect applicable sales charges. | |||||
| The total return of the classes may not precisely reflect the class expense differences because of the impact of calculating the net asset values | ||||||
| to two decimal places. If net asset values were calculated to three decimal places, the total return differences would more closely reflect the | ||||||
| class expense differences. The calculation of net asset values to two decimal places is made in accordance with SEC guidelines and does not | ||||||
| result in any gain or loss of value between one class and another. | ||||||
See Notes to Financial Statements.
69
| Global Growth | ||||||
| R Class | ||||||
| For a Share Outstanding Throughout the Years Ended November 30 (except as noted) | ||||||
| 2009 | 2008 | 2007 | 2006 | 2005(1) | ||
| Per-Share Data | ||||||
| Net Asset Value, Beginning of Period | $5.82 | $12.62 | $10.47 | $8.86 | $8.37 | |
| Income From Investment Operations | ||||||
| Net Investment Income (Loss)(2) | —(3) | (0.01) | 0.02 | (0.05) | (0.02) | |
| Net Realized and Unrealized Gain (Loss) | 1.85 | (4.71) | 2.35 | 1.71 | 0.51 | |
| Total From Investment Operations | 1.85 | (4.72) | 2.37 | 1.66 | 0.49 | |
| Distributions | ||||||
| From Net Investment Income | — | — | — | (0.05) | — | |
| From Net Realized Gains | — | (2.08) | (0.22) | — | — | |
| Total Distributions | — | (2.08) | (0.22) | (0.05) | — | |
| Net Asset Value, End of Period | $7.67 | $5.82 | $12.62 | $10.47 | $8.86 | |
| Total Return(4) | 31.79% | (44.40)% | 23.08% | 18.79% | 5.85% | |
| Ratios/Supplemental Data | ||||||
| Ratio of Operating Expenses | ||||||
| to Average Net Assets | 1.72% | 1.76% | 1.80% | 1.81% | 1.80%(5) | |
| Ratio of Net Investment Income (Loss) | ||||||
| to Average Net Assets | 0.12% | (0.10)% | (0.21)% | (0.55)% | (0.71)%(5) | |
| Portfolio Turnover Rate | 103% | 121% | 108% | 95% | 36%(6) | |
| Net Assets, End of Period (in thousands) | $442 | $253 | $202 | $32 | $26 | |
| (1) | July 29, 2005 (commencement of sale) through November 30, 2005. | |||||
| (2) | Computed using average shares outstanding throughout the period. | |||||
| (3) | Per-share amount was less than $0.005. | |||||
| (4) | Total return assumes reinvestment of net investment income and capital gains distributions, if any. Total returns for periods less than one year | |||||
| are not annualized. The total return of the classes may not precisely reflect the class expense differences because of the impact of calculating | ||||||
| the net asset values to two decimal places. If net asset values were calculated to three decimal places, the total return differences would | ||||||
| more closely reflect the class expense differences. The calculation of net asset values to two decimal places is made in accordance with SEC | ||||||
| guidelines and does not result in any gain or loss of value between one class and another. | ||||||
| (5) | Annualized. | |||||
| (6) | Portfolio turnover is calculated at the fund level. Percentage indicated was calculated for the year ended November 30, 2005. | |||||
See Notes to Financial Statements.
70
| Emerging Markets | ||||||
| Investor Class | ||||||
| For a Share Outstanding Throughout the Years Ended November 30 | ||||||
| 2009 | 2008 | 2007 | 2006 | 2005 | ||
| Per-Share Data | ||||||
| Net Asset Value, Beginning of Period | $4.17 | $12.69 | $10.06 | $8.25 | $6.28 | |
| Income From Investment Operations | ||||||
| Net Investment Income (Loss)(1) | 0.01 | 0.09 | 0.10 | 0.11 | 0.01 | |
| Net Realized and Unrealized Gain (Loss) | 3.13 | (7.21) | 4.06 | 3.11 | 2.05 | |
| Total From Investment Operations | 3.14 | (7.12) | 4.16 | 3.22 | 2.06 | |
| Distributions | ||||||
| From Net Investment Income | (0.03) | (0.10) | (0.13) | (0.05) | — | |
| From Net Realized Gains | — | (1.31) | (1.42) | (1.37) | (0.09) | |
| Total Distributions | (0.03) | (1.41) | (1.55) | (1.42) | (0.09) | |
| Redemption Fees(1) | —(2) | 0.01 | 0.02 | 0.01 | —(2) | |
| Net Asset Value, End of Period | $7.28 | $4.17 | $12.69 | $10.06 | $8.25 | |
| Total Return(3) | 75.36% | (62.66)% | 48.81% | 46.10% | 33.10% | |
| Ratios/Supplemental Data | ||||||
| Ratio of Operating Expenses | ||||||
| to Average Net Assets | 1.78% | 1.66% | 1.66% | 1.80% | 1.94% | |
| Ratio of Net Investment Income (Loss) | ||||||
| to Average Net Assets | 0.11% | 1.06% | 0.96% | 1.31% | 0.17% | |
| Portfolio Turnover Rate | 126% | 121% | 85% | 115% | 153% | |
| Net Assets, End of Period (in thousands) | $567,248 | $316,695 | $1,070,138 | $523,813 | $220,720 | |
| (1) | Computed using average shares outstanding throughout the period. | |||||
| (2) | Per-share amount was less than $0.005. | |||||
| (3) | Total return assumes reinvestment of net investment income and capital gains distributions, if any. The total return of the classes may not | |||||
| precisely reflect the class expense differences because of the impact of calculating the net asset values to two decimal places. If net asset | ||||||
| values were calculated to three decimal places, the total return differences would more closely reflect the class expense differences. The | ||||||
| calculation of net asset values to two decimal places is made in accordance with SEC guidelines and does not result in any gain or loss of value | ||||||
| between one class and another. | ||||||
See Notes to Financial Statements.
71
| Emerging Markets | ||||||
| Institutional Class | ||||||
| For a Share Outstanding Throughout the Years Ended November 30 | ||||||
| 2009 | 2008 | 2007 | 2006 | 2005 | ||
| Per-Share Data | ||||||
| Net Asset Value, Beginning of Period | $4.26 | $12.92 | $10.21 | $8.36 | $6.35 | |
| Income From Investment Operations | ||||||
| Net Investment Income (Loss)(1) | 0.02 | 0.12 | 0.12 | 0.12 | 0.03 | |
| Net Realized and Unrealized Gain (Loss) | 3.18 | (7.35) | 4.14 | 3.16 | 2.07 | |
| Total From Investment Operations | 3.20 | (7.23) | 4.26 | 3.28 | 2.10 | |
| Distributions | ||||||
| From Net Investment Income | (0.03) | (0.13) | (0.15) | (0.07) | — | |
| From Net Realized Gains | — | (1.31) | (1.42) | (1.37) | (0.09) | |
| Total Distributions | (0.03) | (1.44) | (1.57) | (1.44) | (0.09) | |
| Redemption Fees(1) | —(2) | 0.01 | 0.02 | 0.01 | —(2) | |
| Net Asset Value, End of Period | $7.43 | $4.26 | $12.92 | $10.21 | $8.36 | |
| Total Return(3) | 75.92% | (62.63)% | 49.21% | 46.31% | 33.37% | |
| Ratios/Supplemental Data | ||||||
| Ratio of Operating Expenses | ||||||
| to Average Net Assets | 1.58% | 1.46% | 1.46% | 1.60% | 1.74% | |
| Ratio of Net Investment Income (Loss) | ||||||
| to Average Net Assets | 0.31% | 1.26% | 1.16% | 1.51% | 0.37% | |
| Portfolio Turnover Rate | 126% | 121% | 85% | 115% | 153% | |
| Net Assets, End of Period (in thousands) | $27,787 | $27,235 | $74,897 | $85,886 | $113,765 | |
| (1) | Computed using average shares outstanding throughout the period. | |||||
| (2) | Per-share amount was less than $0.005. | |||||
| (3) | Total return assumes reinvestment of net investment income and capital gains distributions, if any. The total return of the classes may not | |||||
| precisely reflect the class expense differences because of the impact of calculating the net asset values to two decimal places. If net asset | ||||||
| values were calculated to three decimal places, the total return differences would more closely reflect the class expense differences. The | ||||||
| calculation of net asset values to two decimal places is made in accordance with SEC guidelines and does not result in any gain or loss of value | ||||||
| between one class and another. | ||||||
See Notes to Financial Statements.
72
| Emerging Markets | ||||||
| A Class(1) | ||||||
| For a Share Outstanding Throughout the Years Ended November 30 | ||||||
| 2009 | 2008 | 2007 | 2006 | 2005 | ||
| Per-Share Data | ||||||
| Net Asset Value, Beginning of Period | $4.07 | $12.40 | $9.85 | $8.11 | $6.19 | |
| Income From Investment Operations | ||||||
| Net Investment Income (Loss)(2) | (0.01) | 0.07 | 0.07 | 0.11 | (0.01) | |
| Net Realized and Unrealized Gain (Loss) | 3.06 | (7.03) | 3.99 | 3.02 | 2.02 | |
| Total From Investment Operations | 3.05 | (6.96) | 4.06 | 3.13 | 2.01 | |
| Distributions | ||||||
| From Net Investment Income | (0.02) | (0.07) | (0.11) | (0.03) | — | |
| From Net Realized Gains | — | (1.31) | (1.42) | (1.37) | (0.09) | |
| Total Distributions | (0.02) | (1.38) | (1.53) | (1.40) | (0.09) | |
| Redemption Fees(2) | —(3) | 0.01 | 0.02 | 0.01 | —(3) | |
| Net Asset Value, End of Period | $7.10 | $4.07 | $12.40 | $9.85 | $8.11 | |
| Total Return(4) | 75.24% | (62.78)% | 48.61% | 45.59% | 32.77% | |
| Ratios/Supplemental Data | ||||||
| Ratio of Operating Expenses | ||||||
| to Average Net Assets | 2.03% | 1.91% | 1.91% | 2.05% | 2.19% | |
| Ratio of Net Investment Income (Loss) | ||||||
| to Average Net Assets | (0.14)% | 0.81% | 0.71% | 1.06% | (0.08)% | |
| Portfolio Turnover Rate | 126% | 121% | 85% | 115% | 153% | |
| Net Assets, End of Period (in thousands) | $23,260 | $17,105 | $36,795 | $9,905 | $1,773 | |
| (1) | Prior to September 4, 2007, the A Class was referred to as the Advisor Class. | |||||
| (2) | Computed using average shares outstanding throughout the period. | |||||
| (3) | Per-share amount was less than $0.005. | |||||
| (4) | Total return assumes reinvestment of net investment income and capital gains distributions, if any, and does not reflect applicable sales charges. | |||||
| The total return of the classes may not precisely reflect the class expense differences because of the impact of calculating the net asset values | ||||||
| to two decimal places. If net asset values were calculated to three decimal places, the total return differences would more closely reflect the | ||||||
| class expense differences. The calculation of net asset values to two decimal places is made in accordance with SEC guidelines and does not | ||||||
| result in any gain or loss of value between one class and another. | ||||||
See Notes to Financial Statements.
73
| Emerging Markets | ||||
| B Class | ||||
| For a Share Outstanding Throughout the Years Ended November 30 (except as noted) | ||||
| 2009 | 2008 | 2007(1) | ||
| Per-Share Data | ||||
| Net Asset Value, Beginning of Period | $4.17 | $12.67 | $12.15 | |
| Income From Investment Operations | ||||
| Net Investment Income (Loss)(2) | (0.06) | 0.02 | (0.03) | |
| Net Realized and Unrealized Gain (Loss) | 3.15 | (7.24) | 0.53 | |
| Total From Investment Operations | 3.09 | (7.22) | 0.50 | |
| Distributions | ||||
| From Net Realized Gains | — | (1.29) | — | |
| Redemption Fees(2) | —(3) | 0.01 | 0.02 | |
| Net Asset Value, End of Period | $7.26 | $4.17 | $12.67 | |
| Total Return(4) | 74.10% | (63.09)% | 4.28% | |
| Ratios/Supplemental Data | ||||
| Ratio of Operating Expenses to Average Net Assets | 2.78% | 2.67% | 2.58%(5) | |
| Ratio of Net Investment Income (Loss) to Average Net Assets | (0.89)% | 0.05% | (1.30)%(5) | |
| Portfolio Turnover Rate | 126% | 121% | 85%(6) | |
| Net Assets, End of Period (in thousands) | $241 | $113 | $54 | |
| (1) | September 28, 2007 (commencement of sale) through November 30, 2007. | |||
| (2) | Computed using average shares outstanding throughout the period. | |||
| (3) | Per-share amount was less than $0.005. | |||
| (4) | Total return assumes reinvestment of net investment income and capital gains distributions, if any, and does not reflect applicable sales charges. | |||
| Total returns for periods less than one year are not annualized. The total return of the classes may not precisely reflect the class expense | ||||
| differences because of the impact of calculating the net asset values to two decimal places. If net asset values were calculated to three decimal | ||||
| places, the total return differences would more closely reflect the class expense differences. The calculation of net asset values to two decimal | ||||
| places is made in accordance with SEC guidelines and does not result in any gain or loss of value between one class and another. | ||||
| (5) | Annualized. | |||
| (6) | Portfolio turnover is calculated at the fund level. Percentage indicated was calculated for the year ended November 30, 2007. | |||
See Notes to Financial Statements.
74
| Emerging Markets | ||||||
| C Class | ||||||
| For a Share Outstanding Throughout the Years Ended November 30 | ||||||
| 2009 | 2008 | 2007 | 2006 | 2005 | ||
| Per-Share Data | ||||||
| Net Asset Value, Beginning of Period | $3.96 | $12.10 | $9.64 | $7.95 | $6.12 | |
| Income From Investment Operations | ||||||
| Net Investment Income (Loss)(1) | (0.05) | 0.01 | (0.01) | 0.03 | (0.05) | |
| Net Realized and Unrealized Gain (Loss) | 2.98 | (6.87) | 3.90 | 2.99 | 1.97 | |
| Total From Investment Operations | 2.93 | (6.86) | 3.89 | 3.02 | 1.92 | |
| Distributions | ||||||
| From Net Investment Income | — | — | (0.03) | — | — | |
| From Net Realized Gains | — | (1.29) | (1.42) | (1.34) | (0.09) | |
| Total Distributions | — | (1.29) | (1.45) | (1.34) | (0.09) | |
| Redemption Fees(1) | —(2) | 0.01 | 0.02 | 0.01 | —(2) | |
| Net Asset Value, End of Period | $6.89 | $3.96 | $12.10 | $9.64 | $7.95 | |
| Total Return(3) | 73.99% | (63.09)% | 47.39% | 44.59% | 31.67% | |
| Ratios/Supplemental Data | ||||||
| Ratio of Operating Expenses | ||||||
| to Average Net Assets | 2.78% | 2.66% | 2.66% | 2.80% | 2.94% | |
| Ratio of Net Investment Income (Loss) | ||||||
| to Average Net Assets | (0.89)% | 0.06% | (0.04)% | 0.31% | (0.83)% | |
| Portfolio Turnover Rate | 126% | 121% | 85% | 115% | 153% | |
| Net Assets, End of Period (in thousands) | $5,372 | $3,217 | $9,098 | $2,581 | $733 | |
| (1) | Computed using average shares outstanding throughout the period. | |||||
| (2) | Per-share amount was less than $0.005. | |||||
| (3) | Total return assumes reinvestment of net investment income and capital gains distributions, if any, and does not reflect applicable sales charges. | |||||
| The total return of the classes may not precisely reflect the class expense differences because of the impact of calculating the net asset values | ||||||
| to two decimal places. If net asset values were calculated to three decimal places, the total return differences would more closely reflect the | ||||||
| class expense differences. The calculation of net asset values to two decimal places is made in accordance with SEC guidelines and does not | ||||||
| result in any gain or loss of value between one class and another. | ||||||
See Notes to Financial Statements.
75
| Emerging Markets | ||||
| R Class | ||||
| For a Share Outstanding Throughout the Years Ended November 30 (except as noted) | ||||
| 2009 | 2008 | 2007(1) | ||
| Per-Share Data | ||||
| Net Asset Value, Beginning of Period | $4.17 | $12.68 | $12.15 | |
| Income From Investment Operations | ||||
| Net Investment Income (Loss)(2) | (0.02) | 0.05 | (0.01) | |
| Net Realized and Unrealized Gain (Loss) | 3.14 | (7.22) | 0.52 | |
| Total From Investment Operations | 3.12 | (7.17) | 0.51 | |
| Distributions | ||||
| From Net Investment Income | (0.01) | (0.04) | — | |
| From Net Realized Gains | — | (1.31) | — | |
| Total Distributions | (0.01) | (1.35) | — | |
| Redemption Fees(2) | —(3) | 0.01 | 0.02 | |
| Net Asset Value, End of Period | $7.28 | $4.17 | $12.68 | |
| Total Return(4) | 74.94% | (62.92)% | 4.36% | |
| Ratios/Supplemental Data | ||||
| Ratio of Operating Expenses to Average Net Assets | 2.28% | 2.19% | 2.08%(5) | |
| Ratio of Net Investment Income (Loss) to Average Net Assets | (0.39)% | 0.53% | (0.68)%(5) | |
| Portfolio Turnover Rate | 126% | 121% | 85%(6) | |
| Net Assets, End of Period (in thousands) | $516 | $144 | $27 | |
| (1) | September 28, 2007 (commencement of sale) through November 30, 2007. | |||
| (2) | Computed using average shares outstanding throughout the period. | |||
| (3) | Per-share amount was less than $0.005. | |||
| (4) | Total return assumes reinvestment of net investment income and capital gains distributions, if any. Total returns for periods less than one year | |||
| are not annualized. The total return of the classes may not precisely reflect the class expense differences because of the impact of calculating | ||||
| the net asset values to two decimal places. If net asset values were calculated to three decimal places, the total return differences would | ||||
| more closely reflect the class expense differences. The calculation of net asset values to two decimal places is made in accordance with SEC | ||||
| guidelines and does not result in any gain or loss of value between one class and another. | ||||
| (5) | Annualized. | |||
| (6) | Portfolio turnover is calculated at the fund level. Percentage indicated was calculated for the year ended November 30, 2007. | |||
See Notes to Financial Statements.
76
| International Value | |||||
| Investor Class | |||||
| For a Share Outstanding Throughout the Years Ended November 30 (except as noted) | |||||
| 2009 | 2008 | 2007 | 2006(1) | ||
| Per-Share Data | |||||
| Net Asset Value, Beginning of Period | $5.47 | $11.48 | $14.36 | $12.85 | |
| Income From Investment Operations | |||||
| Net Investment Income (Loss)(2) | 0.11 | 0.19 | 0.22 | 0.15 | |
| Net Realized and Unrealized Gain (Loss) | 1.88 | (5.18) | 2.09 | 1.36 | |
| Total From Investment Operations | 1.99 | (4.99) | 2.31 | 1.51 | |
| Distributions | |||||
| From Net Investment Income | (0.13) | (0.24) | (0.47) | — | |
| From Net Realized Gains | — | (0.78) | (4.72) | — | |
| Total Distributions | (0.13) | (1.02) | (5.19) | — | |
| Net Asset Value, End of Period | $7.33 | $5.47 | $11.48 | $14.36 | |
| Total Return(3) | 36.98% | (47.43)% | 23.55% | 11.75% | |
| Ratios/Supplemental Data | |||||
| Ratio of Operating Expenses to Average Net Assets | 1.31% | 1.31% | 1.30% | 1.30%(4) | |
| Ratio of Net Investment Income (Loss) to Average Net Assets | 2.34% | 2.20% | 1.96% | 2.77%(4)(5) | |
| Portfolio Turnover Rate | 16% | 4% | 11% | 17% | |
| Net Assets, End of Period (in thousands) | $7,062 | $2,512 | $3,044 | $437 | |
| (1) | April 3, 2006 (commencement of sale) through November 30, 2006. | ||||
| (2) | Computed using average shares outstanding throughout the period. | ||||
| (3) | Total return assumes reinvestment of net investment income and capital gains distributions, if any. Total returns for periods less than one year | ||||
| are not annualized. The total return of the classes may not precisely reflect the class expense differences because of the impact of calculating | |||||
| the net asset values to two decimal places. If net asset values were calculated to three decimal places, the total return differences would | |||||
| more closely reflect the class expense differences. The calculation of net asset values to two decimal places is made in accordance with SEC | |||||
| guidelines and does not result in any gain or loss of value between one class and another. | |||||
| (4) | Annualized. | ||||
| (5) | Due to cyclical dividends and the eight-month period ended November 30, 2006, the annualized ratio of net investment income (loss) to average | ||||
| net assets is higher than expected. | |||||
See Notes to Financial Statements.
77
| International Value | |||||
| Institutional Class | |||||
| For a Share Outstanding Throughout the Years Ended November 30 (except as noted) | |||||
| 2009 | 2008 | 2007 | 2006(1) | ||
| Per-Share Data | |||||
| Net Asset Value, Beginning of Period | $5.48 | $11.50 | $14.38 | $12.85 | |
| Income From Investment Operations | |||||
| Net Investment Income (Loss)(2) | 0.18 | 0.21 | 0.23 | 0.25 | |
| Net Realized and Unrealized Gain (Loss) | 1.82 | (5.19) | 2.10 | 1.28 | |
| Total From Investment Operations | 2.00 | (4.98) | 2.33 | 1.53 | |
| Distributions | |||||
| From Net Investment Income | (0.14) | (0.26) | (0.49) | — | |
| From Net Realized Gains | — | (0.78) | (4.72) | — | |
| Total Distributions | (0.14) | (1.04) | (5.21) | — | |
| Net Asset Value, End of Period | $7.34 | $5.48 | $11.50 | $14.38 | |
| Total Return(3) | 37.18% | (47.32)% | 23.77% | 11.91% | |
| Ratios/Supplemental Data | |||||
| Ratio of Operating Expenses to Average Net Assets | 1.11% | 1.11% | 1.10% | 1.10%(4) | |
| Ratio of Net Investment Income (Loss) to Average Net Assets | 2.54% | 2.40% | 2.16% | 2.97%(4)(5) | |
| Portfolio Turnover Rate | 16% | 4% | 11% | 17% | |
| Net Assets, End of Period (in thousands) | $1,627 | $23,847 | $45,262 | $35,574 | |
| (1) | April 3, 2006 (commencement of sale) through November 30, 2006. | ||||
| (2) | Computed using average shares outstanding throughout the period. | ||||
| (3) | Total return assumes reinvestment of net investment income and capital gains distributions, if any. Total returns for periods less than one year | ||||
| are not annualized. The total return of the classes may not precisely reflect the class expense differences because of the impact of calculating | |||||
| the net asset values to two decimal places. If net asset values were calculated to three decimal places, the total return differences would | |||||
| more closely reflect the class expense differences. The calculation of net asset values to two decimal places is made in accordance with SEC | |||||
| guidelines and does not result in any gain or loss of value between one class and another. | |||||
| (4) | Annualized. | ||||
| (5) | Due to cyclical dividends and the eight-month period ended November 30, 2006, the annualized ratio of net investment income (loss) to average | ||||
| net assets is higher than expected. | |||||
See Notes to Financial Statements.
78
| International Value | |||||||
| A Class | |||||||
| For a Share Outstanding Throughout the Years Ended November 30 (except as noted) | |||||||
| 2009 | 2008 | 2007 | 2006(1) | 2006 | 2005 | ||
| Per-Share Data | |||||||
| Net Asset Value, | |||||||
| Beginning of Period | $5.48 | $11.49 | $14.35 | $12.70 | $10.91 | $9.64 | |
| Income From | |||||||
| Investment Operations | |||||||
| Net Investment | |||||||
| Income (Loss)(2) | 0.10 | 0.18 | 0.20 | 0.25 | 0.18 | 0.13 | |
| Net Realized and | |||||||
| Unrealized Gain (Loss) | 1.86 | (5.20) | 2.11 | 1.40 | 1.97 | 1.37 | |
| Total From | |||||||
| Investment Operations | 1.96 | (5.02) | 2.31 | 1.65 | 2.15 | 1.50 | |
| Distributions | |||||||
| From Net | |||||||
| Investment Income | (0.11) | (0.21) | (0.45) | — | (0.15) | (0.11) | |
| From Net Realized Gains | — | (0.78) | (4.72) | — | (0.21) | (0.12) | |
| Total Distributions | (0.11) | (0.99) | (5.17) | — | (0.36) | (0.23) | |
| Net Asset Value, | |||||||
| End of Period | $7.33 | $5.48 | $11.49 | $14.35 | $12.70 | $10.91 | |
| Total Return(3) | 36.40% | (47.53)% | 23.44% | 12.99% | 19.95% | 15.58% | |
| Ratios/Supplemental Data | |||||||
| Ratio of Operating | |||||||
| Expenses to Average | |||||||
| Net Assets | 1.56% | 1.51%(4) | 1.40%(4) | 1.40%(4)(5) | 1.35% | 1.41% | |
| Ratio of Operating | |||||||
| Expenses to Average | |||||||
| Net Assets (Before | |||||||
| Expense Waiver) | 1.56% | 1.56% | 1.55% | 1.55%(5) | 1.35% | 1.41% | |
| Ratio of Net Investment | |||||||
| Income (Loss) to Average | |||||||
| Net Assets | 2.09% | 2.00%(4) | 1.86%(4) | 2.67%(4)(5)(6) | 1.52% | 1.28% | |
| Ratio of Net Investment | |||||||
| Income (Loss) to Average | |||||||
| Net Assets (Before | |||||||
| Expense Waiver) | 2.09% | 1.95% | 1.71% | 2.52%(5)(6) | 1.52% | 1.28% | |
| Portfolio Turnover Rate | 16% | 4% | 11% | 17% | 7% | 18% | |
| Net Assets, End of Period | |||||||
| (in thousands) | $18,644 | $15,015 | $24,558 | $19,890 | $54,617 | $203,215 | |
| (1) | April 1, 2006 through November 30, 2006. The fund’s fiscal year end was changed from March 31 to November 30, resulting in an eight-month | ||||||
| annual reporting period. For the years before November 30, 2006, the fund’s fiscal year end was March 31. | |||||||
| (2) | Computed using average shares outstanding throughout the period. | ||||||
| (3) | Total return assumes reinvestment of net investment income and capital gains distributions, if any, and does not reflect applicable sales charges. | ||||||
| Total returns for periods less than one year are not annualized. The total return of the classes may not precisely reflect the class expense | |||||||
| differences because of the impact of calculating the net asset values to two decimal places. If net asset values were calculated to three decimal | |||||||
| places, the total return differences would more closely reflect the class expense differences. The calculation of net asset values to two decimal | |||||||
| places is made in accordance with SEC guidelines and does not result in any gain or loss of value between one class and another. | |||||||
| (4) | The distributor voluntarily waived a portion of its distribution and service fees from April 1, 2006 through March 31, 2008. | ||||||
| (5) | Annualized. | ||||||
| (6) | Due to cyclical dividends and the eight-month period ended November 30, 2006, the annualized ratio of net investment income (loss) to average | ||||||
| net assets is higher than expected. | |||||||
See Notes to Financial Statements.
79
| International Value | |||||||
| B Class | |||||||
| For a Share Outstanding Throughout the Years Ended November 30 (except as noted) | |||||||
| 2009 | 2008 | 2007 | 2006(1) | 2006 | 2005 | ||
| Per-Share Data | |||||||
| Net Asset Value, | |||||||
| Beginning of Period | $5.32 | $11.16 | $14.08 | $12.51 | $10.75 | $9.52 | |
| Income From | |||||||
| Investment Operations | |||||||
| Net Investment | |||||||
| Income (Loss)(2) | 0.05 | 0.11 | 0.12 | 0.17 | 0.10 | 0.06 | |
| Net Realized and | |||||||
| Unrealized Gain (Loss) | 1.81 | (5.05) | 2.05 | 1.40 | 1.93 | 1.34 | |
| Total From | |||||||
| Investment Operations | 1.86 | (4.94) | 2.17 | 1.57 | 2.03 | 1.40 | |
| Distributions | |||||||
| From Net | |||||||
| Investment Income | (0.07) | (0.12) | (0.37) | — | (0.06) | (0.05) | |
| From Net Realized Gains | — | (0.78) | (4.72) | — | (0.21) | (0.12) | |
| Total Distributions | (0.07) | (0.90) | (5.09) | — | (0.27) | (0.17) | |
| Net Asset Value, | |||||||
| End of Period | $7.11 | $5.32 | $11.16 | $14.08 | $12.51 | $10.75 | |
| Total Return(3) | 35.36% | (47.84)% | 22.51% | 12.55% | 19.07% | 14.69% | |
| Ratios/Supplemental Data | |||||||
| Ratio of Operating | |||||||
| Expenses to Average | |||||||
| Net Assets | 2.31% | 2.22%(4) | 2.09%(4) | 2.09%(4)(5) | 2.08% | 2.09% | |
| Ratio of Operating | |||||||
| Expenses to Average | |||||||
| Net Assets (Before | |||||||
| Expense Waiver) | 2.31% | 2.31% | 2.30% | 2.30%(5) | 2.08% | 2.09% | |
| Ratio of Net Investment | |||||||
| Income (Loss) to Average | |||||||
| Net Assets | 1.34% | 1.29%(4) | 1.17%(4) | 1.98%(4)(5)(6) | 0.90% | 0.61% | |
| Ratio of Net Investment | |||||||
| Income (Loss) to Average | |||||||
| Net Assets (Before | |||||||
| Expense Waiver) | 1.34% | 1.20% | 0.96% | 1.77%(5)(6) | 0.90% | 0.61% | |
| Portfolio Turnover Rate | 16% | 4% | 11% | 17% | 7% | 18% | |
| Net Assets, End of Period | |||||||
| (in thousands) | $1,495 | $1,526 | $4,059 | $4,313 | $4,917 | $5,165 | |
| (1) | April 1, 2006 through November 30, 2006. The fund’s fiscal year end was changed from March 31 to November 30, resulting in an eight-month | ||||||
| annual reporting period. For the years before November 30, 2006, the fund’s fiscal year end was March 31. | |||||||
| (2) | Computed using average shares outstanding throughout the period. | ||||||
| (3) | Total return assumes reinvestment of net investment income and capital gains distributions, if any, and does not reflect applicable sales charges. | ||||||
| Total returns for periods less than one year are not annualized. The total return of the classes may not precisely reflect the class expense | |||||||
| differences because of the impact of calculating the net asset values to two decimal places. If net asset values were calculated to three decimal | |||||||
| places, the total return differences would more closely reflect the class expense differences. The calculation of net asset values to two decimal | |||||||
| places is made in accordance with SEC guidelines and does not result in any gain or loss of value between one class and another. | |||||||
| (4) | The distributor voluntarily waived a portion of its distribution and service fees from April 1, 2006 through March 31, 2008. | ||||||
| (5) | Annualized. | ||||||
| (6) | Due to cyclical dividends and the eight-month period ended November 30, 2006, the annualized ratio of net investment income (loss) to average | ||||||
| net assets is higher than expected. | |||||||
See Notes to Financial Statements.
80
| International Value | |||||
| C Class | |||||
| For a Share Outstanding Throughout the Years Ended November 30 (except as noted) | |||||
| 2009 | 2008 | 2007 | 2006(1) | ||
| Per-Share Data | |||||
| Net Asset Value, Beginning of Period | $5.42 | $11.37 | $14.27 | $12.85 | |
| Income From Investment Operations | |||||
| Net Investment Income (Loss)(2) | 0.05 | 0.12 | 0.12 | 0.14 | |
| Net Realized and Unrealized Gain (Loss) | 1.85 | (5.17) | 2.07 | 1.28 | |
| Total From Investment Operations | 1.90 | (5.05) | 2.19 | 1.42 | |
| Distributions | |||||
| From Net Investment Income | (0.07) | (0.12) | (0.37) | — | |
| From Net Realized Gains | — | (0.78) | (4.72) | — | |
| Total Distributions | (0.07) | (0.90) | (5.09) | — | |
| Net Asset Value, End of Period | $7.25 | $5.42 | $11.37 | $14.27 | |
| Total Return(3) | 35.44% | (47.93)% | 22.28% | 11.05% | |
| Ratios/Supplemental Data | |||||
| Ratio of Operating Expenses to Average Net Assets | 2.31% | 2.31% | 2.30% | 2.30%(4) | |
| Ratio of Net Investment Income (Loss) to Average Net Assets | 1.34% | 1.20% | 0.96% | 1.77%(4)(5) | |
| Portfolio Turnover Rate | 16% | 4% | 11% | 17% | |
| Net Assets, End of Period (in thousands) | $869 | $337 | $222 | $41 | |
| (1) | April 3, 2006 (commencement of sale) through November 30, 2006. | ||||
| (2) | Computed using average shares outstanding throughout the period. | ||||
| (3) | Total return assumes reinvestment of net investment income and capital gains distributions, if any, and does not reflect applicable sales charges. | ||||
| Total returns for periods less than one year are not annualized. The total return of the classes may not precisely reflect the class expense | |||||
| differences because of the impact of calculating the net asset values to two decimal places. If net asset values were calculated to three decimal | |||||
| places, the total return differences would more closely reflect the class expense differences. The calculation of net asset values to two decimal | |||||
| places is made in accordance with SEC guidelines and does not result in any gain or loss of value between one class and another. | |||||
| (4) | Annualized. | ||||
| (5) | Due to cyclical dividends and the eight-month period ended November 30, 2006, the annualized ratio of net investment income (loss) to average | ||||
| net assets is higher than expected. | |||||
See Notes to Financial Statements.
81
| International Value | |||||
| R Class | |||||
| For a Share Outstanding Throughout the Years Ended November 30 (except as noted) | |||||
| 2009 | 2008 | 2007 | 2006(1) | ||
| Per-Share Data | |||||
| Net Asset Value, Beginning of Period | $5.45 | $11.42 | $14.31 | $12.85 | |
| Income From Investment Operations | |||||
| Net Investment Income (Loss)(2) | 0.09 | 0.13 | 0.11 | 0.19 | |
| Net Realized and Unrealized Gain (Loss) | 1.84 | (5.14) | 2.14 | 1.27 | |
| Total From Investment Operations | 1.93 | (5.01) | 2.25 | 1.46 | |
| Distributions | |||||
| From Net Investment Income | (0.10) | (0.18) | (0.42) | — | |
| From Net Realized Gains | — | (0.78) | (4.72) | — | |
| Total Distributions | (0.10) | (0.96) | (5.14) | — | |
| Net Asset Value, End of Period | $7.28 | $5.45 | $11.42 | $14.31 | |
| Total Return(3) | 35.90% | (47.61)% | 22.91% | 11.36% | |
| Ratios/Supplemental Data | |||||
| Ratio of Operating Expenses to Average Net Assets | 1.81% | 1.81% | 1.80% | 1.80%(4) | |
| Ratio of Net Investment Income (Loss) to Average Net Assets | 1.84% | 1.70% | 1.46% | 2.27%(4)(5) | |
| Portfolio Turnover Rate | 16% | 4% | 11% | 17% | |
| Net Assets, End of Period (in thousands) | $123 | $78 | $202 | $28 | |
| (1) | April 3, 2006 (commencement of sale) through November 30, 2006. | ||||
| (2) | Computed using average shares outstanding throughout the period. | ||||
| (3) | Total return assumes reinvestment of net investment income and capital gains distributions, if any. Total returns for periods less than one year | ||||
| are not annualized. The total return of the classes may not precisely reflect the class expense differences because of the impact of calculating | |||||
| the net asset values to two decimal places. If net asset values were calculated to three decimal places, the total return differences would | |||||
| more closely reflect the class expense differences. The calculation of net asset values to two decimal places is made in accordance with SEC | |||||
| guidelines and does not result in any gain or loss of value between one class and another. | |||||
| (4) | Annualized. | ||||
| (5) | Due to cyclical dividends and the eight-month period ended November 30, 2006, the annualized ratio of net investment income (loss) to average | ||||
| net assets is higher than expected. | |||||
See Notes to Financial Statements.
82
| Report of Independent Registered Public Accounting Firm |
The Board of Directors and Shareholders,
American Century World Mutual Funds, Inc.:
We have audited the accompanying statements of assets and liabilities, including the schedules of investments, of International Growth Fund, Global Growth Fund and Emerging Markets Fund, three of the funds constituting American Century World Mutual Funds, Inc. (the “Corporation”), as of November 30, 2009, and the related statements of operations for the year then ended, the statements of changes in net assets for each of the two years in the period then ended, and the financial highlights for each of the five years in the period then ended. We have also audited the accompanying statement of assets and liabilities, including the schedule of investments, of International Value Fund, one of the funds constituting the Corporation, as of November 30, 2009, and the related statement of operations for the year then ended, the statements of changes in net assets for each of the two years in the period then ended, and the fina ncial highlights for each of the three years in the period then ended and for the period April 1, 2006 through November 30, 2006. These financial statements and financial highlights are the responsibility of the Corporation’s management. Our responsibility is to express an opinion on these financial statements and financial highlights based on our audits. The financial highlights of International Value Fund for each of the periods ended March 31, 2006 and prior were audited by other auditors whose report, dated May 1, 2006, expressed an unqualified opinion on those financial highlights.
We conducted our audits in accordance with the standards of the Public Company Accounting Oversight Board (United States). Those standards require that we plan and perform the audit to obtain reasonable assurance about whether the financial statements and financial highlights are free of material misstatement. The Corporation is not required to have, nor were we engaged to perform, an audit of its internal control over financial reporting. Our audits included consideration of internal control over financial reporting as a basis for designing audit procedures that are appropriate in the circumstances, but not for the purpose of expressing an opinion on the effectiveness of the Corporation’s internal control over financial reporting. Accordingly, we express no such opinion. An audit also includes examining, on a test basis, evidence supporting the amounts and disclosures in the financial statements, assessing the accounting principles used and significant estimates made by management, as well as evaluating the overall financial statement presentation. Our procedures included confirmation of securities owned as of November 30, 2009, by correspondence with the custodian and brokers; where replies were not received from brokers, we performed other auditing procedures. We believe that our audits provide a reasonable basis for our opinion.
In our opinion, the financial statements and financial highlights referred to above present fairly, in all material respects, the respective financial positions of International Growth Fund, Global Growth Fund, Emerging Markets Fund and International Value Fund of American Century World Mutual Funds, Inc., as of November 30, 2009, the results of their operations for the year then ended, the changes in their net assets for each of the two years in the period then ended, and the financial highlights for each of the periods presented (other than as described above in reference to the report of other auditors), in conformity with accounting principles generally accepted in the United States of America.
Deloitte & Touche LLP
Kansas City, Missouri
January 27, 2010
83
| Management |
The individuals listed below serve as directors or officers of the funds. Each director serves until his or her successor is duly elected and qualified or until he or she retires. Mandatory retirement age for independent directors is 72. However, the mandatory retirement age of any director may be extended with the approval of the remaining independent directors. Those listed as interested directors are “interested” primarily by virtue of their engagement as directors and/or officers of, or ownership interest in, American Century Companies, Inc. (ACC) or its wholly owned, direct or indirect, subsidiaries, including the funds’ investment advisor, American Century Global Investment Management, Inc. (ACGIM) or American Century Investment Management, Inc. (ACIM); the funds’ principal underwriter, American Century Investment Services, Inc. (ACIS); and the funds’ transfer agent, American Century Services, LLC (ACS).
The other directors (more than three-fourths of the total number) are independent; that is, they have never been employees, directors or officers of, and have no financial interest in, ACC or any of its wholly owned, direct or indirect, subsidiaries, including ACGIM, ACIM, ACIS and ACS. The directors serve in this capacity for seven registered investment companies in the American Century Investments family of funds.
All persons named as officers of the funds also serve in similar capacities for the other 14 registered investment companies in the American Century Investments family of funds advised by ACGIM or ACIM, unless otherwise noted. Only officers with policy-making functions are listed. No officer is compensated for his or her service as an officer of the funds. The listed officers are interested persons of the funds and are appointed or re-appointed on an annual basis.
Interested Director
Jonathan S. Thomas, 4500 Main Street, Kansas City, MO 64111
Year of Birth: 1963
Position(s) Held with Funds: Director (since 2007) and President (since 2007)
Principal Occupation(s) During Past 5 Years: President and Chief Executive Officer, ACC
(March 2007 to present); Chief Administrative Officer, ACC (February 2006 to
February 2007); Executive Vice President, ACC (November 2005 to February 2007).
Also serves as: President, Chief Executive Officer and Director, ACS; Executive
Vice President, ACIM and ACGIM; Director, ACIM, ACGIM, ACIS and other ACC
subsidiaries. Managing Director, Morgan Stanley (March 2000 to November 2005)
Number of Portfolios in Fund Complex Overseen by Director: 103
Other Directorships Held by Director: None
Independent Directors
Thomas A. Brown, 4500 Main Street, Kansas City, MO 64111
Year of Birth: 1940
Position(s) Held with Funds: Director (since 1980)
Principal Occupation(s) During Past 5 Years: Managing Member, Associated Investments, LLC
(real estate investment company); Managing Member, Brown Cascade Properties,
LLC (real estate investment company); Retired, Area Vice President, Applied
Industrial Technologies (bearings and power transmission company)
Number of Portfolios in Fund Complex Overseen by Director: 63
Other Directorships Held by Director: None
84
Andrea C. Hall, Ph.D., 4500 Main Street, Kansas City, MO 64111
Year of Birth: 1945
Position(s) Held with Funds: Director (since 1997)
Principal Occupation(s) During Past 5 Years: Retired, Advisor to the President, Midwest
Research Institute (not-for-profit, contract research organization)
Number of Portfolios in Fund Complex Overseen by Director: 63
Other Directorships Held by Director: None
James A. Olson, 4500 Main Street, Kansas City, MO 64111
Year of Birth: 1942
Position(s) Held with Funds: Director (since 2007)
Principal Occupation(s) During Past 5 Years: Member, Plaza Belmont LLC (private equity
fund manager); Chief Financial Officer, Plaza Belmont LLC (September 1999 to
September 2006)
Number of Portfolios in Fund Complex Overseen by Director: 63
Other Directorships Held by Director: Saia, Inc.; Entertainment Properties Trust
Donald H. Pratt, 4500 Main Street, Kansas City, MO 64111
Year of Birth: 1937
Position(s) Held with Funds: Director (since 1995) and Chairman of the Board (since 2005)
Principal Occupation(s) During Past 5 Years: Chairman and Chief Executive Officer, Western
Investments, Inc. (real estate company); Retired Chairman of the Board, Butler
Manufacturing Company (metal buildings producer)
Number of Portfolios in Fund Complex Overseen by Director: 63
Other Directorships Held by Director: None
Gale E. Sayers, 4500 Main Street, Kansas City, MO 64111
Year of Birth: 1943
Position(s) Held with Funds: Director (since 2000)
Principal Occupation(s) During Past 5 Years: President, Chief Executive Officer and Founder,
Sayers40, Inc. (technology products and services provider)
Number of Portfolios in Fund Complex Overseen by Director: 63
Other Directorships Held by Director: None
M. Jeannine Strandjord, 4500 Main Street, Kansas City, MO 64111
Year of Birth: 1945
Position(s) Held with Funds: Director (since 1994)
Principal Occupation(s) During Past 5 Years: Retired, formerly Senior Vice President, Sprint
Corporation (telecommunications company)
Number of Portfolios in Fund Complex Overseen by Director: 63
Other Directorships Held by Director: DST Systems, Inc.; Euronet Worldwide, Inc.; Charming
Shoppes, Inc.
John R. Whitten, 4500 Main Street, Kansas City, MO 64111
Year of Birth: 1946
Position(s) Held with Funds: Director (since 2008)
Principal Occupation(s) During Past 5 Years: Project Consultant, Celanese Corp. (industrial
chemical company) (September 2004 to January 2005)
Number of Portfolios in Fund Complex Overseen by Director: 63
Other Directorships Held by Director: Rudolph Technologies, Inc.
85
Officers
Barry Fink, 4500 Main Street, Kansas City, MO 64111
Year of Birth: 1955
Position(s) Held with Funds: Executive Vice President (since 2007)
Principal Occupation(s) During Past 5 Years: Chief Operating Officer and Executive Vice
President, ACC (September 2007 to present); President, ACS (October 2007 to
present); Managing Director, Morgan Stanley (2000 to 2007); Global General
Counsel, Morgan Stanley (2000 to 2006). Also serves as: Director, ACC, ACS, ACIS
and other ACC subsidiaries
Maryanne Roepke, 4500 Main Street, Kansas City, MO 64111
Year of Birth: 1956
Position(s) Held with Funds: Chief Compliance Officer (since 2006) and Senior Vice
President (since 2000)
Principal Occupation(s) During Past 5 Years: Chief Compliance Officer, ACIM, ACGIM and ACS
(August 2006 to present); Assistant Treasurer, ACC (January 1995 to August 2006); and
Treasurer and Chief Financial Officer, various American Century Investments funds
(July 2000 to August 2006). Also serves as: Senior Vice President, ACS
Charles A. Etherington, 4500 Main Street, Kansas City, MO 64111
Year of Birth: 1957
Position(s) Held with Funds: General Counsel (since 2007) and Senior Vice President
(since 2006)
Principal Occupation(s) During Past 5 Years: Attorney, ACC (February 1994 to present); Vice
President, ACC (November 2005 to present); General Counsel, ACC (March 2007
to present). Also serves as: General Counsel, ACIM, ACGIM, ACS, ACIS and other
ACC subsidiaries; and Senior Vice President, ACIM, ACGIM and ACS
Robert Leach, 4500 Main Street, Kansas City, MO 64111
Year of Birth: 1966
Position(s) Held with Funds: Vice President, Treasurer and Chief Financial Officer
(all since 2006)
Principal Occupation(s) During Past 5 Years: Vice President, ACS (February 2000 to
present); and Controller, various American Century Investments funds (1997
to September 2006)
David H. Reinmiller, 4500 Main Street, Kansas City, MO 64111
Year of Birth: 1963
Position(s) Held with Funds: Vice President (since September 2000)
Principal Occupation(s) During Past 5 Years: Attorney, ACC (January 1994 to present);
Associate General Counsel, ACC (January 2001 to present); Chief Compliance
Officer, American Century Investments funds, ACIM and ACGIM (January 2001 to
February 2005). Also serves as: Associate General Counsel, ACIM, ACGIM, ACS,
ACIS and other ACC subsidiaries; and Vice President, ACIM, ACGIM and ACS
Ward Stauffer, 4500 Main Street, Kansas City, MO 64111
Year of Birth: 1960
Position(s) Held with Funds: Secretary (since February 2005)
Principal Occupation(s) During Past 5 Years: Attorney, ACC (June 2003 to present)
The SAI has additional information about the funds’ directors and is available without charge, upon request, by calling 1-800-345-2021.
86
| Approval of Management Agreements |
Under Section 15(c) of the Investment Company Act, contracts for investment advisory services (including subadvisory services) are required to be reviewed, evaluated and approved by a majority of a fund’s independent directors or trustees (the “Directors”) each year. At American Century Investments, this process is referred to as the “15(c) Process.” As a part of this process, the board reviews fund performance, shareholder services, audit and compliance information, and a variety of other reports from the advisor concerning fund operations. In addition to this annual review, the board of directors oversees and evaluates on a continuous basis at its quarterly meetings the nature and quality of significant services performed by the advisor and the subadvisor, fund performance, audit and compliance information, and a variety of other reports relating to fund operations. The board, or committees of the boa rd, also holds special meetings as needed.
Under a Securities and Exchange Commission rule, each fund is required to disclose in its annual or semiannual report, as appropriate, the material factors and conclusions that formed the basis for the board’s approval or renewal of any advisory agreements within the fund’s most recently completed fiscal half-year period.
Annual Contract Review Process
As part of the annual 15(c) Process undertaken during the most recent fiscal half-year period, the Directors reviewed extensive data and information compiled by the advisor and certain independent providers of evaluative data (the “15(c) Providers”) concerning International Growth, Global Growth, Emerging Markets and International Value (the “Funds”) and the services provided to the Funds under the management and subadvisory agreements. The information considered and the discussions held at the meetings included, but were not limited to:
• the nature, extent and quality of investment management, shareholder services and other services provided to the Funds;
• the wide range of programs and services the advisor provides to the Funds and their shareholders on a routine and non-routine basis;
• the compliance policies, procedures, and regulatory experience of both the advisor and the subadvisor;
• data comparing the cost of owning the Funds to the cost of owning a similar fund;
• data comparing the Funds’ performance to appropriate benchmarks and/or a peer group of other mutual funds with similar investment objectives and strategies;
• financial data showing the profitability of the Funds to the advisor and the overall profitability of the advisor;
• data comparing services provided and charges to other investment management clients of the advisor; and
87
• consideration of collateral benefits derived by the advisor from the management of the Funds and any potential economies of scale relating thereto.
In keeping with its practice, the Funds’ board of directors held two in-person meetings and one telephonic meeting to review and discuss the information provided. The board also had the benefit of the advice of its independent counsel throughout the period.
Factors Considered
The Directors considered all of the information provided by the advisor, the 15(c) Providers, and the board’s independent counsel, and evaluated such information for each fund for which the board has responsibility. In connection with their review of the Funds, the Directors did not identify any single factor as being all-important or controlling, and each Director may have attributed different levels of importance to different factors. In deciding to renew the management and subadvisory agreements under the terms ultimately determined by the board to be appropriate, the Directors’ decision was based on the following factors.
Nature, Extent and Quality of Services — Generally. Under the management agreement, the advisor is responsible for providing or arranging for all services necessary for the operation of the Funds. The board noted that under the management agreement, the advisor provides or arranges at its own expense a wide variety of services including:
• Fund construction and design
• portfolio security selection
• initial capitalization/funding
• securities trading
• Fund administration
• custody of Fund assets
• daily valuation of each Fund’s portfolio
• shareholder servicing and transfer agency, including shareholder
confirmations, recordkeeping and communications
• legal services
• regulatory and portfolio compliance
• financial reporting
• marketing and distribution
88
The Directors noted that many of the services provided by the advisor have expanded over time both in terms of quantity and complexity in response to shareholder demands, competition in the industry and the changing regulatory environment. They discussed with the advisor the challenges presented by these changes and the impact on the Funds. The directors specifically noted that with respect to the Funds, the advisor had retained subadvisors to provide the day-to-day cash management services and, with respect to International Value, security selection. Under the applicable subadvisory agreement, the subadvisor for International Value is responsible for managing the investment operations and composition of International Value, including the purchase, retention, and disposition of the investments contained in International Value. In performing their evaluation, the Directors considered information received in connection with th e annual review, as well as information provided on an ongoing basis at their regularly scheduled board and committee meetings.
Investment Management Services. The nature of the investment management services provided to the Funds is quite complex and allows Fund shareholders access to professional money management, instant diversification of their investments, and liquidity. In evaluating investment performance, the board expects the advisor and subadvisor to manage the Funds in accordance with its investment objectives and approved strategies. Further, the Directors recognize that the advisor and subadvisor have an obligation to monitor trading activities, and in particular to seek the best execution of fund trades, and to evaluate the use of and payment for research. In providing these services, the advisor and subadvisor utilize teams of investment professionals (portfolio managers, analysts, research assistants, and securities traders) who require extensive in formation technology, research, training, compliance and other systems to conduct their business. At each quarterly meeting the Directors review investment performance information for the Funds, together with comparative information for appropriate benchmarks and/or peer groups of funds managed similarly to the Funds. The Directors also review detailed performance information during the 15(c) Process comparing each Fund’s performance with that of similar funds not managed by the advisor. If performance concerns are identified, the Directors discuss with the advisor the reasons for such results (e.g., market conditions, security selection) and any efforts being undertaken to improve performance. International Growth’s performance for both the one- and three-year periods was above the median for its peer group. Performance for Global Growth, Emerging Markets and International Value was above the median for its respective peer group for the three-year period and below the median for the one-year perio d.
Shareholder and Other Services. The advisor provides the Funds with a comprehensive package of transfer agency, shareholder, and other services. The Directors review reports and evaluations of such services at their regular quarterly meetings, including the annual meeting concerning contract review, and reports to the board. These reports include, but are not limited to, information regarding the operational efficiency and accuracy of the shareholder and transfer agency services provided, staffing levels, shareholder satisfaction (as measured by external as well as internal sources), technology support, new products and services offered to Fund
89
shareholders, securities trading activities, portfolio valuation services, auditing services, and legal and operational compliance activities. Certain aspects of shareholder and transfer agency service level efficiency and the quality of securities trading activities are measured by independent third party providers and are presented in comparison to other fund groups not managed by the advisor.
Costs of Services Provided and Profitability. The advisor provides detailed information concerning its cost of providing various services to the Funds, its profitability in managing the Funds, its overall profitability, and its financial condition. The Directors have reviewed with the advisor the methodology used to prepare this financial information. This financial information regarding the advisor is considered in order to evaluate the advisor’s financial condition, its ability to continue to provide services under the management agreement, and the reasonableness of the current management fee. The board concluded that the advisor’s profits were reasonable in light of the services provided to the Funds. The board did not consider the profitability of the subadvisor because the subadvisor is paid from the unified fee of the advis or as a result of arm’s length negotiations.
Ethics. The Directors generally consider the advisor’s commitment to providing quality services to shareholders and to conducting its business ethically. They noted that the advisor’s practices generally meet or exceed industry best practices. With respect to the subadvisor, as part of its oversight responsibilities, the board approves the subadvisor’s code of ethics and any changes thereto. Further, through the advisor’s compliance group, the board stays abreast of any violations of the subadvisor’s code.
Economies of Scale. The Directors review information provided by the advisor regarding the possible existence of economies of scale in connection with the management of the Funds. The Directors concluded that economies of scale are difficult to measure and predict with precision, especially on a fund-by-fund basis. The analysis of economies of scale is further complicated by the additional services and content provided by the advisor and its reinvestment in its ability to provide and expand those services. Accordingly, the Directors seek to evaluate economies of scale by reviewing other information, such as year-over-year profitability of the advisor generally, the profitability of its management of the Funds specifically, the expenses incurred by the advisor in providing various functions to the Funds, and the fees of competitive funds no t managed by the advisor. The Directors believe the advisor is appropriately sharing economies of scale through its competitive fee structure, fee breakpoints as each Fund increases in size, and through reinvestment in its business to provide shareholders additional content and services.
90
Comparison to Other Funds’ Fees. The Funds pay the advisor a single, all-inclusive (or unified) management fee for providing all services necessary for the management and operation of the Funds, other than brokerage expenses, taxes, interest, extraordinary expenses, and the fees and expenses of each Fund’s independent directors (including their independent legal counsel). The Directors specifically noted that the subadvisory fees paid to the subadvisor under the subadvisory agreement were subject to arm’s length negotiation between the advisor and the subadvisor and are paid by the advisor out of its unified fee.
Under the unified fee structure, the advisor is responsible for providing all investment advisory, custody, audit, administrative, compliance, record-keeping, marketing and shareholder services, or arranging and supervising third parties to provide such services. By contrast, most other funds are charged a variety of fees, including an investment advisory fee, a transfer agency fee, an administrative fee, distribution charges and other expenses. Other than their investment advisory fees and Rule 12b-1 distribution fees, all other components of the total fees charged by these other funds may be increased without shareholder approval. The board believes the unified fee structure is a benefit to Fund shareholders because it clearly discloses to shareholders the cost of owning Fund shares, and, since the unified fee cannot be increased without a vote of Fund shareholders, it shifts to the advisor the risk of increased costs of o perating the Funds and provides a direct incentive to minimize administrative inefficiencies. Part of the Directors’ analysis of fee levels involves reviewing certain evaluative data compiled by a 15(c) Provider comparing each Fund’s unified fee to the total expense ratio of other funds in the Fund’s peer group and performing a regression analysis to evaluate the effect of fee breakpoints as assets under management increase. The unified fees charged to shareholders of International Growth, Emerging Markets and International Value were above the median of the total expense ratios of their respective peer groups. The unified fee charged to shareholders of Global Growth was equal to the median of the total expense ratios of its peer group. In addition, the Directors also reviewed updated fee level data provided by the advisor, but recognized that comparative data was particularly difficult to evaluate given the significant market developments during the past year. The board concluded that the man agement fee paid by each Fund to the advisor was reasonable in light of the services provided to the Funds.
Comparison to Fees and Services Provided to Other Clients of the Advisor. The Directors also requested and received information from the advisor concerning the nature of the services, fees, and profitability of its advisory services to advisory clients other than the Funds. They observed that these varying types of client accounts require different services and involve different regulatory and entrepreneurial risks than the management of the Funds. The Directors analyzed this information and concluded that the fees charged and services provided to the Funds were reasonable by comparison.
91
Collateral Benefits Derived by the Advisor. The Directors considered the existence of collateral benefits the advisor may receive as a result of its relationship with the Funds. They concluded that the advisor’s primary business is managing mutual funds and it generally does not use fund or shareholder information to generate profits in other lines of business, and therefore does not derive any significant collateral benefits from them. The Directors noted that the advisor receives proprietary research from broker-dealers that execute fund portfolio transactions and concluded that this research is likely to benefit fund shareholders. The Directors also determined that the advisor is able to provide investment management services to certain clients other than the Funds, at least in part, due to its existing infrastructure built to serv e the fund complex. The Directors concluded, however, that the assets of those other clients are not material to the analysis and, in any event, are included with the assets of the Funds to determine breakpoints in each Fund’s fee schedule, provided they are managed using the same investment team and strategy.
Conclusions of the Directors
As a result of this process, the board, including all of the independent directors, in the absence of particular circumstances and assisted by the advice of legal counsel that is independent of the advisor, taking into account all of the factors discussed above and the information provided by the advisor concluded that the investment management agreement between each Fund and the advisor is fair and reasonable in light of the services provided and should be renewed.
Additionally, the board, including all the independent directors, in the absence of particular circumstances and assisted by the advice of legal counsel that is independent of the advisor, taking into account all of the factors discussed above and the information provided by the advisor, concluded that the subadvisory agreement between the advisor and the subadvisor, on behalf of each Fund, is fair and reasonable in light of the services provided and should be renewed.
92
| Additional Information |
Retirement Account Information
As required by law, distributions you receive from certain IRAs, or 403(b), 457 and qualified plans are subject to federal income tax withholding, unless you elect not to have withholding apply. Tax will be withheld on the total amount withdrawn even though you may be receiving amounts that are not subject to withholding, such as nondeductible contributions. In such case, excess amounts of withholding could occur. You may adjust your withholding election so that a greater or lesser amount will be withheld.
If you don’t want us to withhold on this amount, you must notify us to not withhold the federal income tax. You may notify us in writing or in certain situations by telephone or through other electronic means. You have the right to revoke your withholding election at any time and any election you make may remain in effect until revoked by filing a new election.
Remember, even if you elect not to have income tax withheld, you are liable for paying income tax on the taxable portion of your withdrawal. If you elect not to have income tax withheld or you don’t have enough income tax withheld, you may be responsible for payment of estimated tax. You may incur penalties under the estimated tax rules if your withholding and estimated tax payments are not sufficient. You can reduce or defer the income tax on a distribution by directly or indirectly rolling such distribution over to another IRA or eligible plan. You should consult your tax advisor for additional information.
State tax will be withheld if, at the time of your distribution, your address is within one of the mandatory withholding states and you have federal income tax withheld. State taxes will be withheld from your distribution in accordance with the respective state rules.
Proxy Voting Guidelines
American Century Global Investment Management, Inc., the funds’ investment advisor, is responsible for exercising the voting rights associated with the securities purchased and/or held by the funds. A description of the policies and procedures the advisor uses in fulfilling this responsibility is available without charge, upon request, by calling 1-800-345-2021. It is also available on American Century Investments’ website at americancentury.com and on the Securities and Exchange Commission’s website at sec.gov. Information regarding how the investment advisor voted proxies relating to portfolio securities during the most recent 12-month period ended June 30 is available on the “About Us” page at americancentury.com. It is also available at sec.gov.
Quarterly Portfolio Disclosure
The funds file their complete schedule of portfolio holdings with the Securities and Exchange Commission (SEC) for the first and third quarters of each fiscal year on Form N-Q. The funds’ Forms N-Q are available on the SEC’s website at sec.gov, and may be reviewed and copied at the SEC’s Public Reference Room in Washington, DC. Information on the operation of the Public Reference Room may be obtained by calling 1-800-SEC-0330. The funds also make their complete schedule of portfolio holdings for the most recent quarter of their fiscal year available on their website at americancentury.com and, upon request, by calling 1-800-345-2021.
93
| Index Definitions |
The following indices are used to illustrate investment market, sector, or style performance or to serve as fund performance comparisons. They are not investment products available for purchase.
Morgan Stanley Capital International (MSCI) has developed several indices that measure the performance of foreign stock markets.
The MSCI EAFE (Europe, Australasia, Far East) Index is designed to measure developed market equity performance, excluding the U.S. and Canada.
The MSCI EAFE Growth Index is a capitalization-weighted index that monitors the performance of growth stocks from Europe, Australasia, and the Far East.
The MSCI EAFE Value Index is a capitalization-weighted index that monitors the performance of value stocks from Europe, Australasia, and the Far East.
The MSCI EM (Emerging Markets) Index represents the performance of stocks in global emerging market countries.
The MSCI EM Growth Index represents the performance of growth stocks in global emerging market countries.
The MSCI Europe Index is designed to measure equity market performance in Europe.
The MSCI Japan Index is designed to measure equity market performance in Japan.
The MSCI World Free Index represents the performance of stocks in developed countries (including the United States) that are available for purchase by global investors.
94
| Notes |
95
| Notes |
96

| Contact Us | |
| americancentury.com | |
| Automated Information Line | 1-800-345-8765 |
| Investor Services Representative | 1-800-345-2021 or |
| 816-531-5575 | |
| Investors Using Advisors | 1-800-378-9878 |
| Business, Not-For-Profit, Employer-Sponsored | |
| Retirement Plans | 1-800-345-3533 |
| Banks and Trust Companies, Broker-Dealers, | |
| Financial Professionals, Insurance Companies | 1-800-345-6488 |
| Telecommunications Device for the Deaf | 1-800-634-4113 |
| American Century World Mutual Funds, Inc. | |
| Investment Advisor: | |
| American Century Global Investment Management, Inc. | |
| New York, New York |
This report and the statements it contains are submitted for the general
information of our shareholders. The report is not authorized for distribution to
prospective investors unless preceded or accompanied by an effective prospectus.
American Century Investment Services, Inc., Distributor
©2010 American Century Proprietary Holdings, Inc. All rights reserved.
1001
CL-ANN-67330N
| Annual Report |
| November 30, 2009 |
![]()
| American Century Investments |
International Stock Fund
International Discovery Fund
International Opportunities Fund
| Table of Contents |
| President’s Letter | 2 |
| Independent Chairman’s Letter | 3 |
| Market Perspective | 4 |
| International Equity Total Returns | 4 |
| International Stock | |
| Performance | 5 |
| Portfolio Commentary | 7 |
| Top Ten Holdings, Types of Investments and | |
| Investments by Country | 9 |
| International Discovery | |
| Performance | 10 |
| Portfolio Commentary | 12 |
| Top Ten Holdings, Types of Investments and | |
| Investments by Country | 14 |
| International Opportunities | |
| Performance | 15 |
| Portfolio Commentary | 17 |
| Top Ten Holdings, Types of Investments and | |
| Investments by Country | 19 |
| Shareholder Fee Examples | 20 |
| Financial Statements | |
| Schedule of Investments | 22 |
| Statement of Assets and Liabilities | 32 |
| Statement of Operations | 33 |
| Statement of Changes in Net Assets | 34 |
| Notes to Financial Statements | 36 |
| Financial Highlights | 45 |
| Report of Independent Registered Public Accounting Firm | 51 |
| Other Information | |
| Management | 52 |
| Approval of Management Agreements | 55 |
| Additional Information | 61 |
| Index Definitions | 62 |
The opinions expressed in the Market Perspective and each of the Portfolio Commentaries reflect those of the portfolio management team as of the date of the report, and do not necessarily represent the opinions of American Century Investments or any other person in the American Century Investments organization. Any such opinions are subject to change at any time based upon market or other conditions and American Century Investments disclaims any responsibility to update such opinions. These opinions may not be relied upon as investment advice and, because investment decisions made by American Century Investments funds are based on numerous factors, may not be relied upon as an indication of trading intent on behalf of any American Century Investments fund. Security examples are used for representational purposes only and are not intended as recommendations to purchase or sell securities. Performance information for com parative indices and securities is provided to American Century Investments by third party vendors. To the best of American Century Investments’ knowledge, such information is accurate at the time of printing.
| President’s Letter |

Dear Investor:
Thank you for taking time to review the following pages, which provide the performance of your investment along with the perspectives of our experienced portfolio management team for the financial reporting period ended November 30, 2009. We appreciate your trust in American Century Investments® at this volatile, transitional time in the economy and investment markets.
As the upheavals associated with the “Great Recession” gradually subside, our senior management team has put considerable thought into how the investment environment has changed and what new challenges and opportunities await us. Critical factors that we are anticipating in 2010 include marked shifts in investment and spending behavior, along with consolidation in our industry.
Most importantly, we think the U.S. economic recovery will be slow and extended. The economy and capital markets have come a long way since Lehman Brothers collapsed in the third quarter of 2008, but 2010 will likely bring continuing challenges. The U.S. stock market’s rebound since last March and the second-half economic surge in 2009 were fueled largely by corporate cost-cutting and unprecedented monetary and fiscal stimulus, including some key programs that have since expired or been scaled back.
Meanwhile, the resilient but struggling consumer sector still faces double-digit unemployment, heavy debt burdens, tight credit conditions, and a housing market that is starting to stabilize, but remains vulnerable. Much of our investment positioning in 2009 cautiously reflected these still unstable economic fundamentals, leading to underperformance, in some cases, versus market benchmarks buoyed by the rally of riskier assets. We still support our fundamentally based positioning because we believe strongly that some markets—driven more by technical factors than fundamentals—have advanced further than underlying economic conditions warrant, and remain susceptible to the possibility of more volatility ahead.
Thank you for your continued confidence in us.
Sincerely,

Jonathan Thomas
President and Chief Executive Officer
American Century Investments
2
| Independent Chairman’s Letter |

In my first letter to shareholders of the American Century Investments funds, I invited you to contact me with your questions. I have been gratified with your response. Most shareholder inquiries to date have related to specific fund performance issues. As I noted in my individual responses, your board through the Fund Performance Committee continues to stress improved performance in our quarterly meetings with chief investment officers and fund managers.
An important part of our fund performance review process is a face-to-face meeting with portfolio managers. The board traveled during the second quarter to the American Century Investments office in Mountain View, California to meet with the fund of funds and asset allocation portfolio management teams. These meetings validated the importance of thorough reviews of investment opportunities by the credit management personnel resident in that office. As a result of their efforts, American Century Investments funds were able to avoid the “toxic assets” that plagued many other fund families in 2008.
From April through June 2009, the board conducted its annual review of the advisory contracts between American Century Investments and each fund. Our efforts involved a review of fund information, including assets under management; total expense ratio compared to peers; economies of scale; fee breakpoints that reduce shareholder costs as assets increase; performance compared to peers and benchmarks; and the quality of services provided to fund shareholders. A detailed discussion of board considerations in connection with advisory contract renewal is included annually in each fund’s shareholder reports. During this review, the board focuses on a detailed comparison of the competitive position of each fund and has negotiated more than 60 breakpoints or fee reductions in the past five years.
The board looks forward to another year of work on your behalf and your comments are appreciated. You are invited to email me at dhpratt@fundboardchair.com.

3
| Market Perspective |

By Mark Kopinski, Chief Investment Officer, Global and Non-U.S. Equity
Stocks Shook Off Early Declines
The near-collapse of the global financial system in the fall of 2008 fueled the worldwide recession and credit crisis and sent investors fleeing stocks and other risky assets. In this environment, international equity markets plunged to multi-year lows on sharp double-digit losses.
By mid-March, investor confidence and stock market performance showed an abrupt and surprising turnaround, triggered by a belief that the global financial system was no longer on the verge of collapse. Optimistic investors focused on early signs suggesting the global recession was easing, favoring lower-quality stocks that had been battered the most in prior months. By the third quarter of 2009, gross domestic product returned to positive territory in Germany, France, and Japan, while industrial production and global trade levels improved in China. Meanwhile, consumer confidence improved throughout Europe, and in the United Kingdom the troubled housing market showed signs of stabilizing.
After bottoming on March 9, global stock markets rallied sharply to finish the 12-month period with strong gains. With renewed confidence in equities, investors shifted funds toward riskier assets, which, combined with rising commodity prices, bolstered performance among emerging markets.
Recovery’s Sustainability Remained in Question
Despite improving conditions, central bankers worldwide voiced concerns about the overall stability and sustainability of the economic recovery. The Bank of Japan stated downside risks remain, and European Central Bank officials stressed a recovery likely would be uneven. At the same time, officials mulled plans to reduce market liquidity, as the massive and widespread government stimulus efforts neared expiration. Meanwhile, rising unemployment dampened consumer spending, pricing data failed to support inflationary or deflationary expectations, and the Chinese government repeated concerns about overcapacity in the materials sector.
If, in the coming months, consumers worldwide do not increase spending, either due to prolonged unemployment or the need to repair their net worth, additional stimulus packages may become necessary. We expect continued easy monetary and fiscal policies globally, as most central banks seek to avoid fostering a “double dip” recession.
| International Equity Total Returns | ||||
| For the 12 months ended November 30, 2009 (in U.S. dollars) | ||||
| MSCI EAFE Index | 37.72% | MSCI Europe Index | 40.83% | |
| MSCI EAFE Growth Index | 34.93% | MSCI World Free Index | 31.79% | |
| MSCI EAFE Value Index | 40.54% | MSCI Japan Index | 14.01% | |
| MSCI EM Growth Index | 83.97% | |||
4
| Performance |
| International Stock | |||
| Total Returns as of November 30, 2009 | |||
| Average Annual | |||
| Returns | |||
| Since | Inception | ||
| 1 year | Inception | Date | |
| Investor Class | 36.96% | 3.57% | 3/31/05 |
| MSCI EAFE Index | 37.72% | 3.51% | — |
Data presented reflect past performance. Past performance is no guarantee of future results. Current performance may be higher or lower than the performance shown. Investment return and principal value will fluctuate, and redemption value may be more or less than original cost. To obtain performance data current to the most recent month end, please call 1-800-345-2021 or visit americancentury.com. International investing involves special risks, such as political instability and currency fluctuations. Investing in emerging markets may accentuate these risks.
Data assumes reinvestment of dividends and capital gains, and none of the charts reflect the deduction of taxes that a shareholder would pay on fund distributions or the redemption of fund shares. Returns for the index are provided for comparison. The fund’s total returns include operating expenses (such as transaction costs and management fees) that reduce returns, while the total returns of the index do not.
5
International Stock
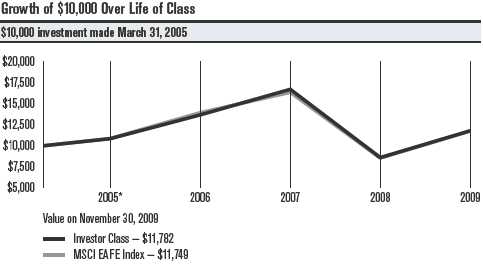
| One-Year Returns Over Life of Class | |||||
| Periods ended November 30 | |||||
| 2005* | 2006 | 2007 | 2008 | 2009 | |
| Investor Class | 8.40% | 26.07% | 22.22% | -48.50% | 36.96% |
| MSCI EAFE Index | 8.67% | 28.20% | 17.30% | -47.79% | 37.72% |
| *From 3/31/05, the Investor Class’s inception date. Not annualized. | |||||
| Total Annual Fund Operating Expenses | |||||
| Investor Class | 1.51% | ||||
The total annual fund operating expenses shown is as stated in the fund’s prospectus current as of the date of this report. The prospectus may vary from the expense ratio shown elsewhere in this report because it is based on a different time period, includes acquired fund fees and expenses, and, if applicable, does not include fee waivers or expense reimbursements.
Data presented reflect past performance. Past performance is no guarantee of future results. Current performance may be higher or lower than the performance shown. Investment return and principal value will fluctuate, and redemption value may be more or less than original cost. To obtain performance data current to the most recent month end, please call 1-800-345-2021 or visit americancentury.com. International investing involves special risks, such as political instability and currency fluctuations. Investing in eme rging markets may accentuate these risks.
Data assumes reinvestment of dividends and capital gains, and none of the charts reflect the deduction of taxes that a shareholder would pay on fund distributions or the redemption of fund shares. Returns for the index are provided for comparison. The fund’s total returns include operating expenses (such as transaction costs and management fees) that reduce returns, while the total returns of the index do not.
6
| Portfolio Commentary |
International Stock
Portfolio Managers: Alex Tedder and Raj Gandhi
Performance Summary
The International Stock portfolio gained 36.96% for the 12 months ended November 30, 2009, compared with its benchmark, the MSCI EAFE Index, which advanced 37.72%.
Despite the severe global recession, credit-market meltdown, and financial-sector crisis, international stocks finished the 12-month period with sharp gains. Initially, stocks plunged, as rising unemployment, shrinking industrial output, and negative economic growth rates sent investor confidence tumbling. But, by mid-March, market sentiment and stock performance reversed course quickly, as massive stimulus efforts from global central banks and governments generated optimism among investors.
On an absolute basis, all sectors and nearly every country represented in the portfolio and benchmark posted positive returns for the period. Sector allocations and currency factors accounted for the portfolio’s underperfor-mance relative to the benchmark.
Australia Led Detractors; Japan Topped Contributors
From a country perspective, the portfolio’s holdings in Australia detracted the most from relative results, followed by positions in France and Germany. Our underweighted position hurt in Australia, while stock selection was the culprit in France and Germany.
At the opposite end of the performance spectrum, Japan made the greatest contribution to portfolio performance, with our underweight and favorable stock selection aiding results. In addition, our portfolio-only positions in South Korea and China contributed positively to relative performance, as the countries’ economies benefitted from low interest rates and government stimulus efforts at home and abroad.
Financial Sector Lagged
After plunging in late 2008 and early 2009, the financial sector rebounded sharply during the remainder of the period. The financial sector represented the portfolio’s largest sector weighting at the end of the 12 months, and our overall stock selection was effective. But the portfolio’s underweight compared with the benchmark detracted from relative performance, particularly in the insurance and capital markets industries. In the insurance industry, our underweighted position in France’s AXA SA hurt results, and the position was among the portfolio’s top detractors. In the capital markets industry, not owning Germany’s Deutsche Bank AG hurt relative performance.
The industrials sector represented the second-largest performance detractor, with overweights in the machinery and airline industries and an underweight in industrial conglomerates accounting for the bulk of the lagging results.
7
International Stock
Technology Led Contributors
Information technology was the portfolio’s top-performing sector, with stock selection driving the solid results, particularly in the communications equipment segment, where Canadian-based Research In Motion (RIM) was the top-contributing stock. The portfolio’s out-of-benchmark position in RIM, the developer of the BlackBerry wireless device, was among the leading contributors for the period. Sales of the company’s touch-screen Storm device, RIM’s answer to Apple’s iPhone, gained traction after RIM resolved several software issues that emerged after the product’s initial launch.
The portfolio’s relative performance also received a boost from the consumer discretionary sector, where stock selection and an overweight were effective. In the automobile industry, South Korea’s Hyundai Motor Co. was among the portfolio’s leading contributors, benefitting from the United States’ “cash for clunkers” incentive program, which helped boost sales figures for the automaker. In addition, an overweight to specialty retailers boosted results, as consumers “traded down” for value. Portfolio holdings such as the U.K.’s Kingfisher (home improvement) and Japan’s FAST RETAILING (lower-priced clothing) and Nitori (the “Japanese IKEA”) benefited from these consumer spending trends.
Outlook
Signs of improvement in corporate earnings have surfaced throughout the world. While most of the improvements have come from cost cutting and restructuring, we remain encouraged and believe any revenue growth may immediately affect the bottom line. We will closely monitor the upcoming corporate earnings reporting season, which could provide more clarity on the sustainability of recent improvements. International Stock continues to primarily invest in companies located in developed countries around the world (excluding the United States).
8
| International Stock | ||
| Top Ten Holdings as of November 30, 2009 | ||
| % of net assets | % of net assets | |
| as of 11/30/09 | as of 5/31/09 | |
| BHP Billiton Ltd. | 2.3% | 1.6% |
| HSBC Holdings plc (Hong Kong) | 2.1% | 1.4% |
| Vale SA Preference Shares | 2.0% | 1.4% |
| Saipem SpA | 1.9% | 1.8% |
| Banco Santander SA | 1.9% | 1.8% |
| BG Group plc | 1.8% | 2.0% |
| Roche Holding AG | 1.7% | 1.2% |
| Telefonica SA | 1.7% | 1.2% |
| BNP Paribas | 1.6% | 1.1% |
| Nestle SA | 1.6% | 1.8% |
| Types of Investments in Portfolio | ||
| % of net assets | % of net assets | |
| as of 11/30/09 | as of 5/31/09 | |
| Foreign Common Stocks | 99.2% | 98.8% |
| Temporary Cash Investments | 0.6% | 0.6% |
| Other Assets and Liabilities | 0.2% | 0.6% |
| Investments by Country as of November 30, 2009 | ||
| % of net assets | % of net assets | |
| as of 11/30/09 | as of 5/31/09 | |
| United Kingdom | 18.8% | 18.4% |
| Japan | 15.1% | 13.8% |
| Switzerland | 8.2% | 10.3% |
| France | 6.1% | 6.1% |
| Germany | 6.0% | 6.7% |
| Australia | 4.6% | 4.2% |
| Brazil | 4.2% | 2.6% |
| People’s Republic of China | 3.8% | 2.9% |
| Spain | 3.6% | 3.4% |
| Sweden | 3.4% | 0.6% |
| Netherlands | 3.3% | 2.1% |
| Italy | 3.0% | 5.0% |
| South Korea | 3.0% | 2.7% |
| Multi-National | 2.0% | 0.5% |
| Other Countries | 14.1% | 19.5% |
| Cash and Equivalents* | 0.8% | 1.2% |
| *Includes temporary cash investments and other assets and liabilities. | ||
9
| Performance |
| International Discovery | |||||
| Total Returns as of November 30, 2009 | |||||
| Average Annual Returns | |||||
| Since | Inception | ||||
| 1 year | 5 years | 10 years | Inception | Date | |
| Investor Class | 38.06% | 6.61% | 4.97% | 11.55% | 4/1/94 |
| MSCI AC World ex-US | |||||
| Mid Cap Growth Index | 51.02% | 5.18% | 1.15% | N/A(1) | — |
| Institutional Class | 38.32% | 6.83% | 5.18% | 9.96% | 1/2/98 |
| Advisor Class | 37.71% | 6.36% | 4.72% | 7.79% | 4/28/98 |
| (1) Benchmark data first available June 1994. | |||||
Data presented reflect past performance. Past performance is no guarantee of future results. Current performance may be higher or lower than the performance shown. Investment return and principal value will fluctuate, and redemption value may be more or less than original cost. To obtain performance data current to the most recent month end, please call 1-800-345-2021 or visit americancentury.com. Historically, small company stocks have been more volatile than the stocks of larger, more established companies. International investing involves special risks, such as political instability and currency fluctuations. Investing in emerging markets may accentuate these risks.
Unless otherwise indicated, performance reflects Investor Class shares; performance for other share classes will vary due to differences in fee structure. For information about other share classes available, please consult the prospectus. Data assumes reinvestment of dividends and capital gains, and none of the charts reflect the deduction of taxes that a shareholder would pay on fund distributions or the redemption of fund shares. Returns for the index are provided for comparison. The fund’s total returns include operating expenses (such as transaction costs and management fees) that reduce returns, while the total returns of the index do not.
10
International Discovery
| One-Year Returns Over 10 Years | ||||||||||
| Periods ended November 30 | ||||||||||
| 2000 | 2001 | 2002 | 2003 | 2004 | 2005 | 2006 | 2007 | 2008 | 2009 | |
| Investor Class | -1.27% | -20.17% | -8.00% | 37.05% | 18.76% | 24.30% | 36.41% | 32.18% | -55.48% | 38.06% |
| MSCI AC World | ||||||||||
| ex-US Mid Cap | ||||||||||
| Growth Index | -22.74% | -23.36% | -10.71% | 29.81% | 26.90% | 18.62% | 31.62% | 19.12% | -54.16% | 51.02% |
| Total Annual Fund Operating Expenses | |||
| Investor Class | Institutional Class | Advisor Class | |
| 1.53% | 1.33% | 1.78% | |
The total annual fund operating expenses shown is as stated in the fund’s prospectus current as of the date of this report. The prospectus may vary from the expense ratio shown elsewhere in this report because it is based on a different time period, includes acquired fund fees and expenses, and, if applicable, does not include fee waivers or expense reimbursements.
Data presented reflect past performance. Past performance is no guarantee of future results. Current performance may be higher or lower than the performance shown. Investment return and principal value will fluctuate, and redemption value may be more or less than original cost. To obtain performance data current to the most recent month end, please call 1-800-345-2021 or visit americancentury.com. Historically, small company stocks have been more volatile than the stocks of larger, more established companies. International investing involves special risks, such as political instability and currency fluctuations. Investing in emerging markets may accentuate these risks.
Unless otherwise indicated, performance reflects Investor Class shares; performance for other share classes will vary due to differences in fee structure. For information about other share classes available, please consult the prospectus. Data assumes reinvestment of dividends and capital gains, and none of the charts reflect the deduction of taxes that a shareholder would pay on fund distributions or the redemption of fund shares. Returns for the index are provided for comparison. The fund’s total returns include operating expenses (such as transaction costs and management fees) that reduce returns, while the total returns of the index do not.
11
| Portfolio Commentary |
International Discovery
Portfolio Managers: Mark Kopinski and Brian Brady
Performance Summary
The International Discovery portfolio gained 38.06%* for the 12 months ended November 30, 2009, underperforming its benchmark, the MSCI All Country World ex-U.S. Mid Cap Growth Index, which advanced 51.02%.
Despite the severe global recession, credit-market meltdown, and financial-sector crisis, international stocks finished the 12-month period with sharp gains. Emerging markets stocks sharply outperformed developed market stocks, as investors seeking to recoup the losses of 2008 sought higher-yielding assets perceived to have fewer links with the battered developed economies that had been negatively affected by the global economic crisis and subprime market debacle.
Value-oriented (low price-to-book ratios) and highly leveraged companies pulled the market off its March 9, 2009, bottom. Earnings growth and momentum, which are important components of the portfolio’s investment process, underperformed during this initial market-recovery phase, and this underperformance accounted for the overall lagging results for the portfolio relative to the benchmark. In the second half of the period, market leadership transitioned to companies exhibiting accelerating earnings growth, and the portfolio’s relative underperformance narrowed.
Japan Led Detractors
From a country perspective, our exposure in Japan, the portfolio’s second-largest country weighting, detracted the most from relative results. Our underweight position helped, but it wasn’t enough to offset the negative impact of stock selection, which featured companies with stable earnings growth, such as Toyo Suisan and Osaka Gas. These names underperformed as the market turned in March. In addition, our positions in Switzer-land and North America, a non-benchmark weighting, detracted from performance.
At the opposite end of the performance spectrum, China, Norway, and Brazil made the greatest contributions to the portfolio’s relative performance.
Consumer, Industrials Stocks Disappointed
The portfolio’s consumer discretionary, industrials, and health care sectors represented the largest detractors to relative performance. In the consumer discretionary sector, stock selection was the culprit. In particular, Canadian T-shirt maker Gildan Activewear, the portfolio’s weakest holding, tumbled after reporting soft North American demand, which prompted a cut in its full-year profit outlook.
*All fund returns referenced in this commentary are for Investor Class shares.
12
International Discovery
Stock selection also detracted in the industrials sector. Our portfolio-only position in VT Group, a British defense and services company, who also exhibited stable earnings growth, was among the portfolio’s worst performers as the market looked for stocks that would benefit the most from economic recovery. In the health care sector, our overweight and negative stock selection in the biotechnology industry primarily accounted for the lagging results.
Energy, Materials Stocks Outperformed
After falling early in the reporting period, oil prices increased, pushing select energy stocks higher. Our energy equipment and services companies showed strong results, led by our overweighted position in Bermuda-based Seadrill, the portfolio’s top contributor for the period. The offshore drilling company announced it was actively pursuing acquisitions and successfully completed a new debt offering to increase its cash position.
Performance in the materials sector was led by our portfolio-only position in Nine Dragons Paper Holdings, one of China’s largest paper producers and a top contributor to the fund’s results. With China’s resilient economy providing a backdrop, the company streamlined its cost structure and we believe it remains positioned to benefit from slowdown-related attrition among smaller companies.
The portfolio’s financials sector also outperformed, led by BM&FBOVESPA, which operates Brazil’s main securities exchanges. The stock was among the portfolio’s top performers for the 12-month period, advancing on record trading volumes and a growing consensus that lower interest rates and higher commodity prices would spark Brazil’s economy.
Outlook
Following previous bear markets, growth stocks have tended to outperform value stocks, and we believe the International Discovery portfolio may be poised to capture such outperformance. Western Europe represents the fund’s largest regional exposure, while North America is the most significant relative overweight. Among sectors, the portfolio remains heavily exposed to technology and industrials, which we believe should benefit once the global economy transitions from recovery to expansion. International Discovery continues to primarily invest in small- to mid-sized companies located around the world (excluding the United States).
13
| International Discovery | ||
| Top Ten Holdings as of November 30, 2009 | ||
| % of net assets | % of net assets | |
| as of 11/30/09 | as of 5/31/09 | |
| Seadrill Ltd. | 2.9% | 3.1% |
| ASML Holding NV | 2.6% | 0.8% |
| Tullow Oil plc | 2.3% | 2.5% |
| Warner Chilcott plc, Class A | 1.9% | — |
| James Hardie Industries NV | 1.9% | — |
| Precision Drilling Trust | 1.8% | 1.9% |
| Nine Dragons Paper Holdings Ltd. | 1.7% | 0.9% |
| FLSmidth & Co. A/S | 1.6% | 0.4% |
| Serco Group plc | 1.5% | 0.8% |
| Marubeni Corp. | 1.5% | 1.3% |
| Types of Investments in Portfolio | ||
| % of net assets | % of net assets | |
| as of 11/30/09 | as of 5/31/09 | |
| Foreign Common Stocks | 97.9% | 98.3% |
| Temporary Cash Investments | 1.5% | 0.3% |
| Other Assets and Liabilities | 0.6% | 1.4% |
| Investments by Country as of November 30, 2009 | ||
| % of net assets | % of net assets | |
| as of 11/30/09 | as of 5/31/09 | |
| United Kingdom | 14.9% | 16.5% |
| Japan | 10.5% | 15.9% |
| Netherlands | 8.9% | 2.1% |
| Germany | 6.6% | 3.8% |
| Canada | 5.7% | 5.6% |
| Switzerland | 5.3% | 5.6% |
| Sweden | 4.7% | 1.7% |
| Australia | 4.0% | 3.1% |
| Hong Kong | 3.8% | 5.5% |
| Taiwan (Republic of China) | 3.7% | 5.3% |
| Bermuda | 2.9% | 3.1% |
| South Korea | 2.9% | 1.3% |
| Denmark | 2.9% | 0.7% |
| Ireland | 2.7% | 1.0% |
| Brazil | 2.6% | 5.1% |
| France | 2.5% | 1.8% |
| Finland | 2.0% | 0.6% |
| Other Countries | 11.3% | 19.6% |
| Cash and Equivalents* | 2.1% | 1.7% |
| *Includes temporary cash investments and other assets and liabilities. | ||
14
| Performance |
| International Opportunities | ||||
| Total Returns as of November 30, 2009 | ||||
| Average Annual Returns | ||||
| Since | Inception | |||
| 1 year | 5 years | Inception | Date | |
| Investor Class | 48.38% | 7.94% | 13.09% | 6/1/01 |
| MSCI AC World ex-US | ||||
| Small Cap Growth Index | 67.94% | 6.37% | 7.34%(1) | — |
| Institutional Class | 48.92% | 8.15% | 17.27% | 1/9/03 |
| (1) Since 5/31/01, the date nearest the Investor Class’s inception for which data are available. | ||||
Data presented reflect past performance. Past performance is no guarantee of future results. Current performance may be higher or lower than the performance shown. Investment return and principal value will fluctuate, and redemption value may be more or less than original cost. To obtain performance data current to the most recent month end, please call 1-800-345-2021 or visit americancentury.com. Historically, small company stocks have been more volatile than the stocks of larger, more established companies. International investing involves special risks, such as political instability and currency fluctuations. Investing in emerging markets may accentuate these risks.
Unless otherwise indicated, performance reflects Investor Class shares; performance for other share classes will vary due to differences in fee structure. For information about other share classes available, please consult the prospectus. Data assumes reinvestment of dividends and capital gains, and none of the charts reflect the deduction of taxes that a shareholder would pay on fund distributions or the redemption of fund shares. Returns for the index are provided for comparison. The fund’s total returns include operating expenses (such as transaction costs and management fees) that reduce returns, while the total returns of the index do not.
15
International Opportunities
| One-Year Returns Over Life of Class | |||||||||
| Periods ended November 30 | |||||||||
| 2001* | 2002 | 2003 | 2004 | 2005 | 2006 | 2007 | 2008 | 2009 | |
| Investor Class | -2.60% | -2.87% | 61.54% | 27.14% | 35.28% | 25.37% | 33.73% | -56.46% | 48.38% |
| MSCI AC World | |||||||||
| ex-US Small Cap | |||||||||
| Growth Index | -15.69% | -11.69% | 42.97% | 25.98% | 20.30% | 30.13% | 19.37% | -56.62% | 67.94% |
| *From 6/1/01, the Investor Class’s inception date. Index data from 5/31/01, the date nearest the Investor Class’s inception for which data are available. | |||||||||
| Not annualized. | |||||||||
| Total Annual Fund Operating Expenses | |
| Investor Class | Institutional Class |
| 1.98% | 1.78% |
The total annual fund operating expenses shown is as stated in the fund’s prospectus current as of the date of this report. The prospectus may vary from the expense ratio shown elsewhere in this report because it is based on a different time period, includes acquired fund fees and expenses, and, if applicable, does not include fee waivers or expense reimbursements.
Data presented reflect past performance. Past performance is no guarantee of future results. Current performance may be higher or lower than the performance shown. Investment return chart and principal value will fluctuate, and redemption value may be more or less than original cost. To obtain performance data current to the most recent month end, please call 1-800-345-2021 or visit americancentury.com. Historically, small company stocks have been more volatile than the stocks of larger, more established companies. International investing involves special risks, such as political instability and currency fluctuations. Investing in emerging markets may accentuate these risks.
Unless otherwise indicated, performance reflects Investor Class shares; performance for other share classes will vary due to differences in fee structure. For information about other share classes available, please consult the prospectus. Data assumes reinvestment of dividends and capital gains, and none of the charts reflect the deduction of taxes that a shareholder would pay on fund distributions or the redemption of fund shares. Returns for the index are provided for comparison. The fund’s total returns include operating expenses (such as transaction costs and management fees) that reduce returns, while the total returns of the index do not.
16
| Portfolio Commentary |
International Opportunities
Portfolio Managers: Mark Kopinski and Trevor Gurwich
Performance Summary
The International Opportunities portfolio gained 48.38%* for the 12 months ended November 30, 2009, underperforming its benchmark, the MSCI All Country World ex-U.S. Small Cap Growth Index, which advanced 67.94%.
Despite the severe global recession, credit-market meltdown, and financial-sector crisis, international stocks finished the 12-month period with sharp gains. Initially, stocks plunged, as rising unemployment, shrinking industrial output, and negative economic growth rates sent investor confidence tumbling. By mid-March, however, market sentiment and stock performance reversed course quickly, as massive stimulus efforts from global central banks and governments generated optimism among investors. Emerging markets stocks sharply outperformed developed market stocks, as investors seeking to recoup the losses of 2008 sought higher-yielding assets perceived to have fewer links with the battered developed economies.
The portfolio’s underperformance compared with the benchmark primarily was due to the significant value-based rally that initially fueled the stock market turnaround. Stocks that had suffered the most in 2008’s market plunge came roaring back to life. Our investment process, which focuses on companies with accelerating and improving earnings prospects, under-performed in this environment. But, since June 2009 the portfolio’s relative performance has improved, as our investing style has returned to favor.
Japan, Australia Led Country Detractors
From a country perspective, Japan, the portfolio’s largest-weighted country, was the weakest performer, as stock selection sharply detracted from results. Similarly, our stock picks in Australia and the United Kingdom, the portfolio’s second-largest country position, led to lagging results.
At the opposite end of the performance spectrum, the developing markets of China, India, and Turkey made the greatest positive contributions to the portfolio’s relative performance, reflecting the overall stronger results from the emerging markets. India-based construction and engineering firm Voltas was among the portfolio’s top contributors. The company’s stock gained on soaring profits and revenues, bolstered by sizeable air conditioning projects in Qatar and the United Arab Emirates. The company’s electro-mechanical and mining equipment divisions also won significant domestic contracts.
China National Building Material, a China-based cement firm, also was among the portfolio’s top performers. With the Chinese government directing stimulus funds toward road and rail projects, the company, a portfolio-only holding, reported healthy order volumes, completed a successful share offering, secured a four-year line of credit, and explored sale-leaseback options on its construction equipment.
*All fund returns referenced in this commentary are for Investor Class shares.
17
International Opportunities
Industrials, Financial Stocks Lagged
On an absolute basis, all sectors in the portfolio posted positive total returns for the period. Compared with the benchmark, though, only our utilities and consumer staples sectors outperformed, primarily due to favorable stock selection.
The industrials, financials and materials sectors represented the portfolio’s weakest contributors, as negative stock selection weighed on relative performance. In the industrials sector, Japan’s Nissha Printing, an industrial printing company, led the portfolio’s overall detractors, as the company lowered its fiscal-year profit outlook. Additionally, Japan’s AEON Delight, a building maintenance services company for shopping malls, was among the portfolio’s worst performers. The company announced its fiscal-year-end results would include a large loss due to the write-down of select securities.
Poor performance in the portfolio’s financials sector holdings primarily was due to ineffective stock selection in the diversified financial services industry. In the materials sector, our stock picks in the metals and mining industry drove the negative results, with our overweighted position in Australian gold producer St Barbara Limited among the portfolio’s weakest contributors, due to production declines.
Outlook
Signs of improvement in corporate earnings have surfaced throughout the world. While most of the improvements have come from cost cutting and restructuring, we remain encouraged and believe any revenue growth may immediately affect the bottom line. We will closely monitor the upcoming corporate earnings reporting season, which could provide more clarity on the sustainability of recent improvements. International Opportunities primarily invests in small-capitalization companies located around the world (excluding the United States).
18
| International Opportunities | ||
| Top Ten Holdings as of November 30, 2009 | ||
| % of net assets | % of net assets | |
| as of 11/30/09 | as of 5/31/09 | |
| CyberAgent, Inc. | 2.2% | 0.5% |
| MTU Aero Engines Holding AG | 2.0% | — |
| Azimut Holding SpA | 1.9% | 2.0% |
| Ansell Ltd. | 1.8% | — |
| SSL International plc | 1.6% | — |
| Diagnosticos da America SA | 1.6% | — |
| Gree, Inc. | 1.6% | — |
| Voltas Ltd. | 1.5% | 1.1% |
| SXC Health Solutions Corp.* | 1.5% | 0.7% |
| TGS Nopec Geophysical Co. ASA | 1.5% | 0.7% |
| *Includes shares traded on all exchanges. | ||
| Types of Investments in Portfolio | ||
| % of net assets | % of net assets | |
| as of 11/30/09 | as of 5/31/09 | |
| Foreign Common Stocks & Rights | 98.9% | 97.9% |
| Temporary Cash Investments | 1.5% | 0.8% |
| Other Assets and Liabilities | (0.4)% | 1.3% |
| Investments by Country as of November 30, 2009 | ||
| % of net assets | % of net assets | |
| as of 11/30/09 | as of 5/31/09 | |
| Japan | 12.9% | 15.1% |
| United Kingdom | 12.7% | 16.1% |
| Canada | 7.3% | 6.6% |
| Australia | 6.0% | 2.5% |
| Italy | 5.4% | 4.8% |
| Germany | 5.3% | 3.3% |
| Hong Kong | 4.9% | 7.3% |
| Brazil | 4.6% | 0.7% |
| Sweden | 4.4% | 2.1% |
| People’s Republic of China | 3.9% | 4.7% |
| India | 3.8% | 3.6% |
| Taiwan (Republic of China) | 3.7% | 7.3% |
| Switzerland | 2.8% | — |
| Norway | 2.7% | 1.2% |
| France | 2.5% | 2.0% |
| Netherlands | 2.3% | 1.3% |
| Other Countries | 13.7% | 19.3% |
| Cash and Equivalents** | 1.1% | 2.1% |
| **Includes temporary cash investments and other assets and liabilities. | ||
19
| Shareholder Fee Examples (Unaudited) |
Fund shareholders may incur two types of costs: (1) transaction costs, including sales charges (loads) on purchase payments and redemption/ exchange fees; and (2) ongoing costs, including management fees; distribution and service (12b-1) fees; and other fund expenses. This example is intended to help you understand your ongoing costs (in dollars) of investing in your fund and to compare these costs with the ongoing cost of investing in other mutual funds.
The example is based on an investment of $1,000 made at the beginning of the period and held for the entire period from June 1, 2009 to November 30, 2009.
Actual Expenses
The table provides information about actual account values and actual expenses for each class. You may use the information, together with the amount you invested, to estimate the expenses that you paid over the period. First, identify the share class you own. Then simply divide your account value by $1,000 (for example, an $8,600 account value divided by $1,000 = 8.6), then multiply the result by the number under the heading “Expenses Paid During Period” to estimate the expenses you paid on your account during this period.
If you hold Investor Class shares of any American Century Investments fund, or Institutional Class shares of the American Century Diversified Bond Fund, in an American Century Investments account (i.e., not a financial intermediary or retirement plan account), American Century Investments may charge you a $12.50 semiannual account maintenance fee if the value of those shares is less than $10,000. We will redeem shares automatically in one of your accounts to pay the $12.50 fee. In determining your total eligible investment amount, we will include your investments in all personal accounts (including American Century Investments Brokerage accounts) registered under your Social Security number. Personal accounts include individual accounts, joint accounts, UGMA/UTMA accounts, personal trusts, Coverdell Education Savings Accounts and IRAs (including traditional, Roth, Rollover, SEP-, SARSEP- and SIMPLE-IRAs), and certain other retirement accounts. If you have only business, business retirement, employer-sponsored or American Century Investments Brokerage accounts, you are currently not subject to this fee. We will not charge the fee as long as you choose to manage your accounts exclusively online. If you are subject to the Account Maintenance Fee, your account value could be reduced by the fee amount.
Hypothetical Example for Comparison Purposes
The table also provides information about hypothetical account values and hypothetical expenses based on the actual expense ratio of each class of your fund and an assumed rate of return of 5% per year before expenses, which is not the actual return of a fund’s share class. The hypothetical account values and expenses may not be used to estimate the actual ending account balance or expenses you paid for the period. You may use this information to compare the ongoing costs of investing in your fund and other funds. To do so, compare this 5% hypothetical example with the 5% hypothetical examples that appear in the shareholder reports of the other funds.
20
Please note that the expenses shown in the table are meant to highlight your ongoing costs only and do not reflect any transactional costs, such as sales charges (loads) or redemption/exchange fees. Therefore, the table is useful in comparing ongoing costs only, and will not help you determine the relative total costs of owning different funds. In addition, if these transactional costs were included, your costs would have been higher.
| Beginning | Ending | Expenses Paid | ||
| Account Value | Account Value | During Period* | Annualized | |
| 6/1/09 | 11/30/09 | 6/1/09 - 11/30/09 | Expense Ratio* | |
| International Stock | ||||
| Actual | ||||
| Investor Class | $1,000 | $1,196.10 | $8.26 | 1.50% |
| Hypothetical | ||||
| Investor Class | $1,000 | $1,017.55 | $7.59 | 1.50% |
| International Discovery | ||||
| Actual | ||||
| Investor Class | $1,000 | $1,184.20 | $7.88 | 1.44% |
| Institutional Class | $1,000 | $1,186.30 | $6.80 | 1.24% |
| Advisor Class | $1,000 | $1,183.90 | $9.25 | 1.69% |
| Hypothetical | ||||
| Investor Class | $1,000 | $1,017.85 | $7.28 | 1.44% |
| Institutional Class | $1,000 | $1,018.85 | $6.28 | 1.24% |
| Advisor Class | $1,000 | $1,016.60 | $8.54 | 1.69% |
| International Opportunities | ||||
| Actual | ||||
| Investor Class | $1,000 | $1,217.30 | $10.67 | 1.92% |
| Institutional Class | $1,000 | $1,217.60 | $9.56 | 1.72% |
| Hypothetical | ||||
| Investor Class | $1,000 | $1,015.44 | $9.70 | 1.92% |
| Institutional Class | $1,000 | $1,016.44 | $8.69 | 1.72% |
| *Expenses are equal to the class’s annualized expense ratio listed in the table above, multiplied by the average account value over the period, | ||||
| multiplied by 183, the number of days in the most recent fiscal half-year, divided by 365, to reflect the one-half year period. | ||||
21
| Schedule of Investments |
| International Stock | ||||||
| NOVEMBER 30, 2009 | ||||||
| Shares | Value | Shares | Value | |||
| Common Stocks — 99.2% | LVMH Moet Hennessy | |||||
| Louis Vuitton SA | 4,537 | $ 472,517 | ||||
| AUSTRALIA — 4.6% | Pernod-Ricard SA | 5,482 | 467,467 | |||
| BHP Billiton Ltd. | 46,942 | $ 1,775,659 | Publicis Groupe SA | 9,816 | 377,914 | |
| Commonwealth Bank | Societe Television | |||||
| of Australia | 15,957 | 771,673 | Francaise 1 | 13,155 | 234,269 | |
| QBE Insurance Group Ltd. | 9,388 | 191,230 | Total SA | 12,430 | 769,155 | |
| Wesfarmers Ltd. | 30,046 | 819,520 | 4,664,620 | |||
| 3,558,082 | GERMANY — 6.0% | |||||
| BELGIUM — 1.0% | Allianz SE | 7,005 | 860,612 | |||
| Anheuser-Busch InBev NV | 10,352 | 516,684 | BASF SE | 12,044 | 726,280 | |
| KBC Groep NV(1) | 5,473 | 243,581 | ||||
| Bayer AG | 7,148 | 547,280 | ||||
| 760,265 | Daimler AG | 12,129 | 614,119 | |||
| BERMUDA — 0.8% | Deutsche Boerse AG | 2,256 | 187,972 | |||
| Seadrill Ltd. | 26,576 | 614,377 | E.ON AG | 3,845 | 152,073 | |
| BRAZIL — 4.2% | Fresenius Medical Care | |||||
| Banco Santander | AG & Co. KGaA | 8,016 | 426,210 | |||
| Brasil SA ADR(1) | 14,472 | 197,543 | ||||
| HeidelbergCement AG | 8,137 | 540,040 | ||||
| Companhia Brasileira de | Metro AG | 4,170 | 262,042 | |||
| Meios de Pagamento | 34,520 | 323,471 | ||||
| Muenchener | ||||||
| Itau Unibanco Holding SA | Rueckversicherungs- | |||||
| Preference Shares | 26,280 | 568,115 | Gesellschaft AG | 1,994 | 312,673 | |
| Petroleo Brasileiro SA- | 4,629,301 | |||||
| Petrobras ADR | 11,559 | 592,746 | ||||
| Vale SA Preference Shares | 64,200 | 1,549,504 | GREECE — 1.3% | |||
| National Bank | ||||||
| 3,231,379 | of Greece SA(1) | 33,823 | 995,424 | |||
| CANADA — 1.2% | HONG KONG — 0.9% | |||||
| Canadian National | Li & Fung Ltd. | 158,000 | 636,073 | |||
| Railway Co. | 8,920 | 467,383 | ||||
| Melco Crown | ||||||
| EnCana Corp. | 5,747 | 309,648 | Entertainment Ltd. ADR(1) | 18,385 | 77,769 | |
| Research In Motion Ltd.(1) | 2,576 | 149,125 | 713,842 | |||
| 926,156 | INDIA — 1.2% | |||||
| CZECH REPUBLIC — 0.5% | Housing Development | |||||
| CEZ AS | 7,878 | 394,179 | Finance Corp. Ltd. | 4,600 | 273,612 | |
| DENMARK — 1.6% | Infosys Technologies Ltd. | 4,129 | 211,208 | |||
| Novo Nordisk A/S B Shares | 13,200 | 885,566 | Infrastructure Development | |||
| Vestas Wind Systems A/S(1) | 5,357 | 376,146 | Finance Co. Ltd. | 22,525 | 80,337 | |
| 1,261,712 | Larsen & Toubro Ltd. | 10,932 | 379,465 | |||
| FRANCE — 6.1% | 944,622 | |||||
| BNP Paribas | 15,003 | 1,239,027 | INDONESIA — 0.2% | |||
| Cie Generale des | PT Bank Rakyat Indonesia | 145,500 | 113,876 | |||
| Etablissements Michelin, | IRELAND — 1.2% | |||||
| Class B | 2,987 | 226,499 | CRH plc | 17,727 | 446,650 | |
| Danone SA | 5,068 | 302,948 | Experian plc | 25,443 | 239,836 | |
| GDF Suez | 7,014 | 292,891 | Ryanair Holdings plc ADR(1) | 10,338 | 270,959 | |
| Legrand SA | 10,263 | 281,933 | 957,445 | |||
22
| International Stock | ||||||
| Shares | Value | Shares | Value | |||
| ITALY — 3.0% | NETHERLANDS — 3.3% | |||||
| ENI SpA | 15,622 | $ 387,044 | Akzo Nobel NV | 5,617 | $ 356,177 | |
| Luxottica Group SpA | 5,874 | 146,237 | ASML Holding NV | 23,323 | 716,523 | |
| Saipem SpA | 46,083 | 1,482,177 | Koninklijke KPN NV | 18,945 | 336,242 | |
| UniCredit SpA(1) | 89,357 | 305,246 | TNT NV | 23,554 | 683,300 | |
| 2,320,704 | Unilever NV CVA | 14,303 | 438,231 | |||
| JAPAN — 15.1% | 2,530,473 | |||||
| Asahi Glass Co. Ltd. | 35,000 | 305,703 | NORWAY — 0.4% | |||
| Canon, Inc. | 4,100 | 157,948 | Yara International ASA | 6,339 | 271,753 | |
| FAST RETAILING CO. LTD. | 3,700 | 671,171 | PEOPLE’S REPUBLIC OF CHINA — 3.8% | |||
| Hitachi Construction | Baidu, Inc. ADR(1) | 719 | 311,859 | |||
| Machinery Co. Ltd. | 29,300 | 684,706 | Ctrip.com International | |||
| Honda Motor Co. Ltd. | 36,700 | 1,146,344 | Ltd. ADR(1) | 7,951 | 583,206 | |
| HOYA Corp. | 28,800 | 734,660 | Industrial & Commercial | |||
| Ibiden Co., Ltd. | 13,900 | 469,551 | Bank of China Ltd. H Shares | 755,000 | 638,093 | |
| iShares MSCI Japan Index | Mindray Medical | |||||
| Fund | 16,754 | 160,001 | International Ltd. ADR | 7,996 | 242,119 | |
| JGC Corp. | 19,000 | 355,426 | Sino-Ocean Land | |||
| Kubota Corp. | 14,000 | 123,253 | Holdings Ltd. | 185,000 | 184,521 | |
| Mitsubishi Corp. | 43,800 | 988,084 | Tencent Holdings Ltd. | 35,300 | 652,704 | |
| Mitsubishi UFJ Financial | ZTE Corp. H Shares | 56,800 | 321,742 | |||
| Group, Inc. | 83,900 | 467,836 | 2,934,244 | |||
| Nidec Corp. | 10,000 | 878,066 | RUSSIAN FEDERATION — 0.4% | |||
| Nitori Co. Ltd. | 9,000 | 753,818 | Mechel ADR | 5,771 | 112,246 | |
| Nomura ETF - Nikkei 225 | 5,100 | 555,784 | Vimpel-Communications ADR | 11,522 | 219,955 | |
| ORIX Corp. | 13,020 | 900,736 | 332,201 | |||
| Rakuten, Inc. | 1,080 | 872,096 | SINGAPORE — 0.3% | |||
| SOFTBANK CORP. | 24,800 | 593,892 | United Overseas Bank Ltd. | 16,000 | 217,803 | |
| Toshiba Corp.(1) | 80,000 | 423,878 | SOUTH KOREA — 3.0% | |||
| Unicharm Corp. | 3,600 | 367,330 | Hyundai Motor Co. | 8,015 | 682,391 | |
| 11,610,283 | POSCO | 1,793 | 860,418 | |||
| LUXEMBOURG — 0.6% | Samsung Electronics Co. Ltd. | 1,230 | 761,610 | |||
| Millicom International | 2,304,419 | |||||
| Cellular SA(1) | 4,872 | 364,426 | SPAIN — 3.6% | |||
| SES SA Fiduciary | Banco Santander SA | 84,299 | 1,444,268 | |||
| Depositary Receipt | 5,231 | 111,260 | Telefonica SA | 44,506 | 1,277,751 | |
| 475,686 | 2,722,019 | |||||
| MEXICO — 0.2% | SWEDEN — 3.4% | |||||
| Grupo Financiero Banorte | Atlas Copco AB A Shares | 60,368 | 855,528 | |||
| SAB de CV, Series O | 50,063 | 172,281 | Autoliv, Inc. | 3,345 | 135,841 | |
| MULTI-NATIONAL — 2.0% | Electrolux AB B Shares(1) | 20,747 | 507,698 | |||
| iShares MSCI EAFE Growth | ||||||
| Index Fund | 2,781 | 152,621 | Getinge AB B Shares | 9,755 | 198,275 | |
| iShares MSCI EAFE | H & M Hennes & Mauritz AB | |||||
| Index Fund | 10,436 | 578,363 | B Shares | 5,923 | 350,288 | |
| iShares MSCI Emerging | Volvo AB B Shares | 56,223 | 534,282 | |||
| Markets Index Fund | 19,115 | 774,540 | 2,581,912 | |||
| 1,505,524 | ||||||
23
| International Stock | ||||||
| Shares | Value | Shares | Value | |||
| SWITZERLAND — 8.2% | Intercontinental Hotels | |||||
| Adecco SA | 7,019 | $ 350,094 | Group plc | 27,083 | $ 374,924 | |
| Credit Suisse Group AG | 17,417 | 901,672 | Kingfisher plc | 143,343 | 559,350 | |
| Julius Baer Group Ltd. | 7,641 | 252,177 | Man Group plc | 50,136 | 262,612 | |
| Nestle SA | 25,980 | 1,228,065 | Next plc | 14,246 | 463,097 | |
| Novartis AG | 22,098 | 1,226,506 | Reckitt Benckiser Group plc | 13,240 | 675,215 | |
| Roche Holding AG | 8,097 | 1,324,443 | Rolls-Royce Group plc(1) | 49,913 | 389,621 | |
| Sonova Holding AG | 2,290 | 271,987 | Rolls-Royce Group plc | |||
| C Shares(1) | 2,786,160 | 4,584 | ||||
| Syngenta AG | 2,724 | 722,187 | ||||
| 6,277,131 | Smiths Group plc | 20,873 | 327,586 | |||
| TAIWAN (REPUBLIC OF CHINA) — 1.4% | Standard Chartered plc | 12,377 | 302,163 | |||
| Hon Hai Precision | Tesco plc | 140,666 | 978,863 | |||
| Industry Co. Ltd. | 113,000 | 477,579 | Tullow Oil plc | 17,733 | 359,989 | |
| Taiwan Semiconductor | Vodafone Group plc | 172,863 | 389,881 | |||
| Manufacturing Co. Ltd. ADR | 22,914 | 238,076 | 14,384,515 | |||
| Wistron Corp. | 174,366 | 320,241 | TOTAL COMMON STOCKS | |||
| 1,035,896 | (Cost $61,435,999) | 76,119,986 | ||||
| TURKEY — 0.9% | Temporary Cash Investments — 0.6% | |||||
| Turkiye Garanti Bankasi AS | 197,930 | 677,862 | JPMorgan U.S. Treasury | |||
| UNITED KINGDOM — 18.8% | Plus Money Market Fund | |||||
| Admiral Group plc | 31,350 | 547,199 | Agency Shares | 243,805 | 243,805 | |
| Antofagasta plc | 42,748 | 633,274 | Repurchase Agreement, Bank of America | |||
| ARM Holdings plc | 90,102 | 229,307 | Securities, LLC, (collateralized by various | |||
| U.S. Treasury obligations, 4.125%-4.50%, | ||||||
| AstraZeneca plc | 9,779 | 437,096 | 5/15/15-11/15/15, valued at $204,172), | |||
| Autonomy Corp. plc(1) | 6,504 | 152,471 | in a joint trading account at 0.12%, | |||
| Barclays plc | 216,129 | 1,039,462 | dated 11/30/09, due 12/1/09 | |||
| BG Group plc | 75,184 | 1,364,248 | (Delivery value $200,001) | 200,000 | ||
| BP plc | 55,499 | 524,618 | TOTAL TEMPORARY | |||
| CASH INVESTMENTS | ||||||
| British Airways plc(1) | 87,201 | 280,166 | (Cost $443,805) | 443,805 | ||
| British American | TOTAL INVESTMENT | |||||
| Tobacco plc | 14,122 | 429,097 | SECURITIES — 99.8% | |||
| British Sky Broadcasting | (Cost $61,879,804) | 76,563,791 | ||||
| Group plc | 34,197 | 297,883 | OTHER ASSETS | |||
| Capita Group plc (The) | 24,816 | 290,673 | AND LIABILITIES — 0.2% | 138,165 | ||
| Carnival plc(1) | 16,398 | 549,778 | TOTAL NET ASSETS — 100.0% | $76,701,956 | ||
| Compass Group plc | 67,124 | 475,714 | ||||
| GlaxoSmithKline plc | 21,921 | 453,302 | ||||
| HSBC Holdings plc | ||||||
| (Hong Kong) | 136,061 | 1,592,342 | ||||
24
| International Stock | |||
| Market Sector Diversification | Notes to Schedule of Investments | ||
| (as a % of net assets) | ADR = American Depositary Receipt | ||
| Financials | 20.8% | CVA = Certificaten Van Aandelen | |
| Consumer Discretionary | 14.8% | EAFE = Europe, Australasia, and Far East | |
| Industrials | 10.7% | ETF = Exchange Traded Fund | |
| Materials | 10.4% | MSCI = Morgan Stanley Capital International | |
| Information Technology | 9.8% | (1) Non-income producing. | |
| Consumer Staples | 8.5% | ||
| Energy | 8.3% | Geographic classifications and market sector diversification | |
| Health Care | 7.8% | are unaudited. | |
| Telecommunication Services | 4.1% | ||
| Diversified | 2.9% | ||
| Utilities | 1.1% | See Notes to Financial Statements. | |
| Cash and Equivalents* | 0.8% | ||
| *Includes temporary cash investments and other assets and liabilities. | |||
25
| International Discovery | ||||||
| NOVEMBER 30, 2009 | ||||||
| Shares | Value | Shares | Value | |||
| Common Stocks — 97.9% | FINLAND — 2.0% | |||||
| AUSTRALIA — 4.0% | KONE Oyj B Shares | 110,800 | $ 4,483,718 | |||
| Amcor Ltd. | 1,013,800 | $ 5,487,668 | Metso Oyj | 271,100 | 8,719,444 | |
| Asciano Group(1) | 1,430,700 | 2,168,676 | Nokian Renkaat Oyj | 241,100 | 6,096,479 | |
| Centennial Coal Co. Ltd. | 1,811,627 | 5,458,996 | 19,299,641 | |||
| Coca-Cola Amatil Ltd. | 798,700 | 7,754,211 | FRANCE — 2.5% | |||
| Cochlear Ltd. | 69,200 | 4,010,704 | Cap Gemini SA | 146,700 | 6,784,544 | |
| Fairfax Media Ltd. | 2,465,800 | 3,692,527 | M6-Metropole Television | 270,900 | 6,980,171 | |
| JB Hi-Fi Ltd. | 200,400 | 4,258,275 | Publicis Groupe SA | 267,100 | 10,283,281 | |
| 24,047,996 | ||||||
| OZ Minerals Ltd.(1) | 4,936,000 | 5,515,476 | ||||
| GERMANY — 6.6% | ||||||
| 38,346,533 | HeidelbergCement AG | 71,500 | 4,745,348 | |||
| AUSTRIA — 0.8% | ||||||
| Infineon Technologies AG(1) | 2,380,100 | 11,400,547 | ||||
| Andritz AG | 129,800 | 7,811,640 | ||||
| BELGIUM — 0.5% | Lanxess AG | 297,600 | 11,274,310 | |||
| Puma AG Rudolf | ||||||
| Bekaert SA | 32,500 | 4,836,605 | Dassler Sport | 38,500 | 13,226,854 | |
| BERMUDA — 2.9% | SMA Solar Technology AG | 50,400 | 6,702,054 | |||
| Seadrill Ltd. | 1,222,300 | 28,256,790 | United Internet AG(1) | 647,200 | 8,736,510 | |
| BRAZIL — 2.6% | Wacker Chemie AG | 42,900 | 7,062,625 | |||
| BM&FBOVESPA SA | 1,205,100 | 8,100,359 | 63,148,248 | |||
| Cia Brasileira de Distribuicao | GREECE — 0.5% | |||||
| Grupo Pao de Acucar ADR | 174,900 | 11,184,855 | ||||
| Piraeus Bank SA(1) | 345,700 | 5,035,133 | ||||
| Cosan SA Industria | ||||||
| e Comercio(1) | 143,000 | 1,678,040 | HONG KONG — 3.8% | |||
| PDG Realty SA | China Everbright Ltd. | 974,000 | 2,314,963 | |||
| Empreendimentos e | Melco Crown Entertainment | |||||
| Participacoes | 387,200 | 3,970,151 | Ltd. ADR(1) | 436,000 | 1,844,280 | |
| 24,933,405 | Nine Dragons Paper | |||||
| CANADA — 5.7% | Holdings Ltd. | 8,725,000 | 15,918,801 | |||
| Alimentation Couche Tard, | Noble Group Ltd. | 4,614,000 | 10,334,827 | |||
| Inc., Class B | 359,500 | 7,446,153 | Sino-Forest Corp.(1) | 345,000 | 6,037,663 | |
| Eldorado Gold Corp.(1) | 618,600 | 8,235,105 | 36,450,534 | |||
| First Quantum Minerals Ltd. | 98,800 | 7,707,224 | HUNGARY — 0.9% | |||
| Gildan Activewear, Inc.(1) | 507,100 | 9,781,959 | OTP Bank plc(1) | 290,000 | 8,647,899 | |
| Pacific Rubiales | INDIA — 0.9% | |||||
| Energy Corp.(1) | 326,100 | 4,749,059 | Housing Development | |||
| Precision Drilling Trust | 2,569,000 | 16,929,710 | & Infrastructure Ltd.(1) | 529,000 | 3,701,237 | |
| 54,849,210 | Maruti Suzuki India Ltd. | 153,600 | 5,142,620 | |||
| DENMARK — 2.9% | 8,843,857 | |||||
| DSV A/S(1) | 568,100 | 10,121,411 | INDONESIA — 0.5% | |||
| FLSmidth & Co. A/S | 238,300 | 15,506,341 | PT United Tractors Tbk | 3,135,000 | 4,956,981 | |
| Novozymes A/S B Shares | 19,200 | 1,944,735 | IRELAND — 2.7% | |||
| 27,572,487 | Experian plc | 759,600 | 7,160,311 | |||
| Warner Chilcott plc, | ||||||
| Class A(1) | 752,400 | 18,493,992 | ||||
| 25,654,303 | ||||||
26
| International Discovery | ||||||
| Shares | Value | Shares | Value | |||
| ITALY — 1.3% | PORTUGAL — 0.9% | |||||
| Bulgari SpA | 1,305,600 | $ 12,066,408 | Jeronimo Martins SGPS SA | 817,900 | $ 8,019,609 | |
| JAPAN — 10.5% | SOUTH AFRICA — 0.6% | |||||
| Gree, Inc. | 107,700 | 5,731,375 | Aspen Pharmacare | |||
| Hitachi Construction | Holdings Ltd.(1) | 659,800 | 6,058,933 | |||
| Machinery Co. Ltd. | 229,900 | 5,372,490 | SOUTH KOREA — 2.9% | |||
| JGC Corp. | 585,000 | 10,943,371 | Amorepacific Corp. | 6,800 | 5,023,392 | |
| Makita Corp. | 156,900 | 5,300,185 | Kia Motors Corp.(1) | 440,800 | 6,501,307 | |
| Marubeni Corp. | 2,734,000 | 14,422,767 | Samsung Electro-Mechanics | |||
| NGK Insulators Ltd. | 221,000 | 4,850,035 | Co. Ltd. | 164,500 | 13,156,605 | |
| Nippon Television | Samsung SDI Co. Ltd. | 32,600 | 3,546,525 | |||
| Network Corp. | 65,900 | 9,560,227 | 28,227,829 | |||
| Nitori Co. Ltd. | 23,800 | 1,993,429 | SPAIN — 1.4% | |||
| NSK Ltd. | 1,505,000 | 9,297,432 | Abengoa SA | 138,400 | 4,010,820 | |
| ORIX Corp. | 98,800 | 6,835,076 | Gestevision Telecinco SA | 367,100 | 4,090,045 | |
| Rinnai Corp. | 33,800 | 1,673,577 | Red Electrica Corp. SA | 87,000 | 4,755,109 | |
| Shinko Electric | 12,855,974 | |||||
| Industries Co. Ltd. | 213,700 | 3,008,710 | SWEDEN — 4.7% | |||
| Shionogi & Co. Ltd. | 179,700 | 3,870,909 | ASSA ABLOY AB B Shares | 328,200 | 6,030,570 | |
| Sumitomo Heavy | Electrolux AB B Shares(1) | 427,600 | 10,463,751 | |||
| Industries Ltd.(1) | 1,259,000 | 5,636,661 | ||||
| Modern Times Group AB | ||||||
| Sumitomo Rubber | B Shares | 219,000 | 9,738,150 | |||
| Industries Ltd. | 243,300 | 1,911,160 | ||||
| Ssab Svenskt Stal AB, | ||||||
| Unicharm Corp. | 41,100 | 4,193,684 | Class A | 657,500 | 10,581,793 | |
| Yamada Denki Co. Ltd. | 40,700 | 2,443,695 | Swedish Match AB | 376,000 | 8,090,023 | |
| Yamato Holdings Co. Ltd. | 275,000 | 3,811,314 | 44,904,287 | |||
| 100,856,097 | SWITZERLAND — 5.3% | |||||
| LUXEMBOURG — 0.6% | Actelion Ltd.(1) | 140,300 | 8,254,995 | |||
| SES SA Fiduciary | Adecco SA | 232,200 | 11,581,682 | |||
| Depositary Receipt | 284,300 | 6,046,906 | ||||
| Clariant AG(1) | 920,000 | 9,635,522 | ||||
| NETHERLANDS — 8.9% | ||||||
| ASML Holding NV | 825,000 | 25,345,413 | Geberit AG | 23,300 | 4,017,681 | |
| Chicago Bridge & Iron Co. | Julius Baer Group Ltd. | 55,700 | 1,838,275 | |||
| NV New York Shares | 245,100 | 4,311,309 | Nobel Biocare Holding AG | 165,500 | 4,918,289 | |
| Fugro NV CVA | 115,389 | 6,540,654 | Sonova Holding AG | 49,200 | 5,843,556 | |
| James Hardie | Straumann Holding AG | 17,400 | 4,264,901 | |||
| Industries NV(1) | 2,481,300 | 18,362,791 | 50,354,901 | |||
| Koninklijke Vopak NV(1) | 141,600 | 11,102,989 | TAIWAN (REPUBLIC OF CHINA) — 3.7% | |||
| QIAGEN NV(1) | 116,800 | 2,583,363 | Acer, Inc. | 1,756,000 | 4,371,037 | |
| Randstad Holding NV(1) | 166,000 | 7,243,417 | Foxconn Technology Co. Ltd. | 1,586,000 | 5,544,765 | |
| TNT NV | 343,100 | 9,953,313 | Prime View International | |||
| 85,443,249 | Co. Ltd.(1) | 4,574,000 | 10,106,324 | |||
| NORWAY — 0.7% | Wistron Corp. | 6,406,582 | 11,766,338 | |||
| Petroleum | Young Fast Optoelectronics | |||||
| Geo-Services ASA(1) | 622,300 | 6,469,385 | Co. Ltd. | 312,000 | 3,703,782 | |
| PEOPLE’S REPUBLIC OF CHINA — 0.6% | 35,492,246 | |||||
| Sino-Ocean Land | TURKEY — 1.1% | |||||
| Holdings Ltd. | 5,636,500 | 5,621,918 | Asya Katilim Bankasi AS(1) | 5,483,900 | 10,896,218 | |
27
| International Discovery | |||||
| Shares | Value | Market Sector Diversification | |||
| UNITED KINGDOM — 14.9% | (as a % of net assets) | ||||
| ARM Holdings plc | 2,105,000 | $ 5,357,161 | Industrials | 24.6% | |
| Burberry Group plc | 1,124,100 | 10,540,765 | Consumer Discretionary | 16.5% | |
| Carphone | Materials | 13.7% | |||
| Warehouse Group plc | 1,936,700 | 6,079,012 | Information Technology | 12.3% | |
| Cookson Group plc(1) | 447,100 | 2,842,801 | Energy | 9.4% | |
| Intercontinental Hotels | Financials | 7.8% | |||
| Group plc | 358,200 | 4,958,748 | Health Care | 6.9% | |
| International Power plc | 1,202,666 | 5,478,483 | Consumer Staples | 5.6% | |
| Invensys plc | 2,840,500 | 13,084,138 | Utilities | 1.1% | |
| Man Group plc | 2,070,300 | 10,844,228 | Cash and Equivalents* | 2.1% | |
| Michael Page | |||||
| International plc | 1,266,800 | 6,985,611 | *Includes temporary cash investments and other assets and liabilities. | ||
| Randgold Resources | Notes to Schedule of Investments | ||||
| Ltd. ADR | 74,000 | 6,270,760 | |||
| Schroders plc | 575,300 | 10,874,435 | ADR = American Depositary Receipt | ||
| Serco Group plc | 1,722,400 | 14,663,467 | CVA = Certificaten Van Aandelen | ||
| Smith & Nephew plc | 826,800 | 7,861,775 | (1) Non-income producing. | ||
| Travis Perkins plc(1) | 223,700 | 2,789,507 | |||
| Tullow Oil plc | 1,077,225 | 21,868,243 | Geographic classifications and market sector diversification | ||
| are unaudited. | |||||
| Vedanta Resources plc | 336,700 | 12,761,975 | |||
| 143,261,109 | |||||
| TOTAL COMMON STOCKS | |||||
| (Cost $730,772,563) | 939,266,331 | See Notes to Financial Statements. | |||
| Temporary Cash Investments — 1.5% | |||||
| JPMorgan U.S. Treasury | |||||
| Plus Money Market Fund | |||||
| Agency Shares | 58,514 | 58,514 | |||
| Repurchase Agreement, Bank of America | |||||
| Securities, LLC, (collateralized by various | |||||
| U.S. Treasury obligations, 4.125%-4.50%, | |||||
| 5/15/15-11/15/15, $14,087,897), in a joint | |||||
| trading account at 0.12%, dated 11/30/09, | |||||
| due 12/1/09 (Delivery value $13,800,046) | 13,800,000 | ||||
| TOTAL TEMPORARY | |||||
| CASH INVESTMENTS | |||||
| (Cost $13,858,514) | 13,858,514 | ||||
| TOTAL INVESTMENT | |||||
| SECURITIES — 99.4% | |||||
| (Cost $744,631,077) | 953,124,845 | ||||
| OTHER ASSETS | |||||
| AND LIABILITIES — 0.6% | 5,911,986 | ||||
| TOTAL NET ASSETS — 100.0% | $959,036,831 | ||||
28
| International Opportunities | ||||||
| NOVEMBER 30, 2009 | ||||||
| Shares | Value | Shares | Value | |||
| Common Stocks — 98.9% | DENMARK — 0.3% | |||||
| AUSTRALIA — 6.0% | FLSmidth & Co. A/S | 3,532 | $ 229,830 | |||
| Jyske Bank A/S(1) | 2,484 | 80,191 | ||||
| Ansell Ltd. | 175,496 | $ 1,710,239 | ||||
| Boart Longyear Group(1) | 2,376,457 | 685,628 | 310,021 | |||
| Equinox Minerals Ltd.(1) | 185,432 | 685,224 | FINLAND — 0.3% | |||
| Outotec Oyj | 8,091 | 264,485 | ||||
| Macarthur Coal Ltd. | 31,180 | 265,587 | ||||
| FRANCE — 2.5% | ||||||
| Mount Gibson Iron Ltd.(1) | 337,120 | 478,591 | ||||
| Gemalto NV(1) | 6,088 | 270,221 | ||||
| PanAust Ltd.(1) | 2,044,129 | 982,914 | ||||
| Groupe Steria SCA | 16,545 | 490,031 | ||||
| Seek Ltd. | 81,179 | 467,673 | Havas SA | 222,674 | 831,878 | |
| St Barbara Ltd.(1) | 861,450 | 272,206 | ||||
| Remy Cointreau SA | 13,912 | 699,800 | ||||
| 5,548,062 | 2,291,930 | |||||
| AUSTRIA — 0.6% | GERMANY — 5.3% | |||||
| bwin Interactive | Aixtron AG | 14,865 | 535,023 | |||
| Entertainment AG(1) | 4,963 | 275,731 | ||||
| Intercell AG(1) | 7,840 | 277,823 | Centrotherm | |||
| Photovoltaics AG(1) | 8,408 | 514,218 | ||||
| 553,554 | GFK SE | 13,332 | 462,431 | |||
| BELGIUM — 1.3% | Kloeckner & Co. SE(1) | 3,947 | 92,159 | |||
| Nyrstar(1) | 72,377 | 913,979 | ||||
| MTU Aero Engines | ||||||
| Telenet Group Holding NV(1) | 10,203 | 278,064 | Holding AG | 36,543 | 1,873,849 | |
| 1,192,043 | Rheinmetall AG | 8,084 | 483,114 | |||
| BERMUDA — 1.0% | Wirecard AG | 78,095 | 992,050 | |||
| Signet Jewelers Ltd.(1) | 35,463 | 900,772 | 4,952,844 | |||
| BRAZIL — 4.6% | GREECE — 0.6% | |||||
| Banco Panamericano SA | Hellenic Exchanges | |||||
| Preference Shares | 130,000 | 640,558 | SA Holding | 47,183 | 588,035 | |
| Diagnosticos | HONG KONG — 4.9% | |||||
| da America SA(1) | 46,900 | 1,453,352 | China Everbright | |||
| Localiza Rent A Car SA | 83,000 | 926,688 | International Ltd. | 2,136,000 | 1,019,761 | |
| PDG Realty SA | Comba Telecom Systems | |||||
| Empreendimentos e | Holdings Ltd. | 619,080 | 696,560 | |||
| Participacoes | 100,000 | 1,025,349 | Daphne International | |||
| Totvs SA | 3,700 | 219,555 | Holdings Ltd. | 596,000 | 457,571 | |
| 4,265,502 | Ju Teng International | |||||
| CANADA — 7.3% | Holdings Ltd. | 564,000 | 447,558 | |||
| Canadian Western Bank | 44,935 | 975,423 | Minth Group Ltd. | 518,000 | 735,221 | |
| Cott Corp.(1) | 100,195 | 849,654 | Neo-Neon Holdings Ltd. | 627,000 | 415,840 | |
| Detour Gold Corp.(1) | 58,330 | 905,292 | Shenzhen Investment Ltd. | 1,522,000 | 673,604 | |
| HudBay Minerals, Inc.(1) | 58,631 | 811,634 | Techtronic Industries Co. | 115,500 | 92,549 | |
| Northgate Minerals Corp.(1) | 84,428 | 268,787 | 4,538,664 | |||
| INDIA — 3.8% | ||||||
| Petrominerales Ltd.(1) | 33,480 | 539,601 | ||||
| Housing Development & | ||||||
| Precision Drilling Trust | 65,141 | 431,434 | Infrastructure Ltd.(1) | 63,894 | 447,045 | |
| SXC Health | McLeod Russel India Ltd. | 104,912 | 610,098 | |||
| Solutions Corp.(1) | 21,997 | 1,107,145 | ||||
| PSL Ltd. | 119,800 | 393,667 | ||||
| SXC Health Solutions Corp. | ||||||
| (NASDAQ)(1) | 5,447 | 276,108 | Rolta India Ltd. | 181,747 | 663,065 | |
| Trinidad Drilling Ltd. | 99,592 | 591,664 | Voltas Ltd. | 371,216 | 1,387,820 | |
| 6,756,742 | 3,501,695 | |||||
29
| International Opportunities | ||||||
| Shares | Value | Shares | Value | |||
| INDONESIA — 0.7% | NORWAY — 2.7% | |||||
| Holcim Indonesia Tbk PT(1) | 4,289,000 | $ 680,434 | Austevoll Seafood ASA(1) | 74,386 | $ 435,151 | |
| IRELAND — 0.9% | Petroleum Geo- | |||||
| Paddy Power plc | 21,974 | 801,780 | Services ASA(1) | 68,368 | 710,749 | |
| ISRAEL — 0.2% | TGS Nopec Geophysical | |||||
| Co. ASA(1) | 83,242 | 1,358,203 | ||||
| RADWARE Ltd.(1) | 14,205 | 185,801 | ||||
| 2,504,103 | ||||||
| ITALY — 5.4% | PEOPLE’S REPUBLIC OF CHINA — 3.9% | |||||
| Amplifon SpA(1) | 168,386 | 754,095 | ||||
| 7 Days Group | ||||||
| Azimut Holding SpA | 134,116 | 1,752,023 | Holdings Ltd.(1) | 36,156 | 428,087 | |
| DiaSorin SpA | 20,131 | 729,092 | AAC Acoustic Technology | |||
| Gruppo Editoriale | Holdings, Inc. | 316,000 | 441,174 | |||
| L’Espresso SpA(1) | 236,560 | 761,918 | Fantasia Holdings | |||
| Trevi Finanziaria SpA | 62,018 | 1,051,360 | Group Co. Ltd.(1) | 238,500 | 62,163 | |
| 5,048,488 | Shenguan Holdings | |||||
| Group Ltd.(1) | 772,000 | 508,023 | ||||
| JAPAN — 12.9% | ||||||
| CyberAgent, Inc. | 1,369 | 2,071,555 | Vinda International | |||
| Holdings Ltd. | 1,058,000 | 745,373 | ||||
| Disco Corp. | 9,100 | 524,271 | WuXi PharmaTech Cayman, | |||
| F.C.C. Co. Ltd. | 42,800 | 716,964 | Inc. ADR(1) | 54,739 | 954,101 | |
| Fuji Oil Co. Ltd. | 17,700 | 298,549 | Zhuzhou CSR Times Electric | |||
| Gree, Inc. | 27,200 | 1,447,478 | Co. Ltd. H Shares | 264,000 | 532,084 | |
| Horiba Ltd. | 40,100 | 896,266 | 3,671,005 | |||
| Kintetsu World Express, Inc. | 28,400 | 754,026 | SINGAPORE — 1.0% | |||
| Nabtesco Corp. | 65,000 | 718,128 | Ezra Holdings Ltd.(1) | 636,000 | 951,243 | |
| Nifco, Inc. | 26,800 | 481,805 | SOUTH AFRICA — 0.6% | |||
| Nippon Synthetic Chemical | Aquarius Platinum Ltd.(1) | 96,290 | 561,235 | |||
| Industry Co. Ltd. (The) | 105,000 | 733,688 | SOUTH KOREA — 1.7% | |||
| Pigeon Corp. | 12,000 | 521,981 | Daum | |||
| Sysmex Corp. | 13,100 | 707,739 | Communications Corp.(1) | 8,795 | 474,240 | |
| Takata Corp. | 26,000 | 503,216 | DigiTech Systems Co. Ltd.(1) | 20,622 | 442,483 | |
| THK Co. Ltd. | 30,100 | 494,818 | Hana Tour Service, Inc. | 6,086 | 242,592 | |
| Tokyu Livable, Inc. | 39,600 | 355,502 | MegaStudy Co. Ltd. | 2,065 | 426,213 | |
| Torishima Pump | 1,585,528 | |||||
| Manufacturing Co. Ltd. | 14,500 | 289,866 | SPAIN — 1.2% | |||
| Zeon Corp. | 115,000 | 468,302 | Antena 3 de Television SA | 50,660 | 441,958 | |
| 11,984,154 | Construcciones y Auxiliar de | |||||
| MALAYSIA — 1.0% | Ferrocarriles SA | 957 | 499,568 | |||
| IJM Corp. Bhd | 572,732 | 758,015 | Tecnicas Reunidas SA | 3,453 | 188,573 | |
| Top Glove Corp. Bhd | 76,300 | 205,791 | 1,130,099 | |||
| 963,806 | SWEDEN — 4.4% | |||||
| MEXICO — 0.7% | Autoliv, Inc. SDR | 13,093 | 528,674 | |||
| Genomma Lab Internacional | Billerud AB(1) | 67,850 | 463,263 | |||
| SA de CV, Series B(1) | 349,575 | 669,075 | Clas Ohlson AB, Class B | 27,290 | 530,412 | |
| NETHERLANDS — 2.3% | JM AB(1) | 58,165 | 967,811 | |||
| Aalberts Industries NV | 34,118 | 442,678 | Kinnevik Investment AB, | |||
| BinckBank NV | 34,214 | 660,670 | Class B | 28,404 | 430,854 | |
| Unit 4 Agresso NV(1) | 18,701 | 482,984 | Modern Times Group AB | |||
| USG People NV(1) | 32,888 | 583,213 | B Shares | 15,057 | 669,531 | |
| Nobia AB(1) | 70,382 | 467,427 | ||||
| 2,169,545 | ||||||
| 4,057,972 | ||||||
30
| International Opportunities | ||||||
| Shares | Value | Shares | Value | |||
| SWITZERLAND — 2.8% | Temporary Cash Investments — 1.5% | |||||
| Clariant AG(1) | 87,202 | $ 913,301 | ||||
| JPMorgan U.S. Treasury | ||||||
| Gategroup Holding AG(1) | 16,961 | 501,510 | Plus Money Market Fund | |||
| Sika AG | 792 | 1,190,622 | Agency Shares | 58,652 | $ 58,652 | |
| 2,605,433 | Repurchase Agreement, Bank of America | |||||
| TAIWAN (REPUBLIC OF CHINA) — 3.7% | Securities, LLC, (collateralized by various | |||||
| U.S. Treasury obligations, 4.125%-4.50%, | ||||||
| Johnson Health | 5/15/15-11/15/15, valued at $1,327,121), | |||||
| Tech Co. Ltd. | 289,000 | 414,025 | in a joint trading account at 0.12%, | |||
| Kinsus Interconnect | dated 11/30/09, due 12/1/09 | |||||
| Technology Corp. | 337,000 | 884,940 | (Delivery value $1,300,004) | 1,300,000 | ||
| Silitech Technology Corp. | 272,000 | 895,988 | TOTAL TEMPORARY | |||
| St. Shine Optical Co. Ltd. | 77,000 | 430,716 | CASH INVESTMENTS | |||
| WPG Holdings Co. Ltd. | 580,000 | 821,902 | (Cost $1,358,652) | 1,358,652 | ||
| TOTAL INVESTMENT | ||||||
| 3,447,571 | SECURITIES — 100.4% | |||||
| TURKEY — 1.6% | (Cost $74,458,303) | 93,373,718 | ||||
| Tofas Turk Otomobil | OTHER ASSETS | |||||
| Fabrikasi AS | 155,385 | 416,978 | AND LIABILITIES — (0.4)% | (372,326) | ||
| Turk Ekonomi Bankasi AS(1) | 838,703 | 1,120,489 | TOTAL NET ASSETS — 100.0% | $93,001,392 | ||
| 1,537,467 | ||||||
| UNITED KINGDOM — 12.7% | Market Sector Diversification | |||||
| Acergy SA | 47,608 | 700,870 | (as a % of net assets) | |||
| Afren plc(1) | 779,573 | 1,093,310 | Industrials | 20.7% | ||
| ARM Holdings plc | 270,446 | 688,277 | Consumer Discretionary | 17.6% | ||
| Aveva Group plc | 27,549 | 439,612 | Information Technology | 13.4% | ||
| Babcock International | Materials | 11.9% | ||||
| Group plc | 103,427 | 1,059,170 | Health Care | 11.5% | ||
| Britvic plc | 110,128 | 711,280 | Financials | 9.0% | ||
| Cape plc(1) | 127,967 | 479,982 | Energy | 7.7% | ||
| Carpetright plc | 29,383 | 431,658 | Consumer Staples | 6.3% | ||
| CSR plc(1) | 67,719 | 452,191 | Telecommunication Services | 0.8% | ||
| Gulf Keystone | Cash and Equivalents* | 1.1% | ||||
| Petroleum Ltd.(1) | 148,742 | 276,506 | ||||
| *Includes temporary cash investments and other assets and liabilities. | ||||||
| Inchcape plc(1) | 1,787,290 | 817,101 | ||||
| International Personal | Notes to Schedule of Investments | |||||
| Finance plc | 188,301 | 616,450 | ADR = American Depositary Receipt | |||
| Jazztel plc(1) | 1,112,695 | 471,156 | SDR = Swedish Depositary Receipt | |||
| Mcbride plc | 126,475 | 434,230 | (1) Non-income producing. | |||
| Michael Page | ||||||
| International plc | 94,024 | 518,484 | Geographic classifications and market sector diversification | |||
| Premier Oil plc(1) | 15,059 | 266,811 | are unaudited. | |||
| Rightmove plc | 50,086 | 442,469 | ||||
| SSL International plc | 119,015 | 1,453,753 | ||||
| Travis Perkins plc(1) | 35,499 | 442,668 | See Notes to Financial Statements. | |||
| 11,795,978 | ||||||
| TOTAL COMMON STOCKS | ||||||
| (Cost $73,099,651) | 92,015,066 | |||||
31
| Statement of Assets and Liabilities |
| NOVEMBER 30, 2009 | |||
| International | International | International | |
| Stock | Discovery | Opportunities | |
| Assets | |||
| Investment securities, at value (cost of $61,879,804, | |||
| $744,631,077 and $74,458,303, respectively) | $76,563,791 | $953,124,845 | $93,373,718 |
| Foreign currency holdings, at value (cost of $5,868, | |||
| $116,996 and $105,912, respectively) | 5,871 | 119,592 | 105,580 |
| Receivable for investments sold | 378,959 | 6,507,680 | 1,688,882 |
| Receivable for capital shares sold | 29,512 | 234,708 | 123,025 |
| Dividends and interest receivable | 186,357 | 2,058,948 | 79,231 |
| Other assets | 416 | 50,193 | 13,598 |
| 77,164,906 | 962,095,966 | 95,384,034 | |
| Liabilities | |||
| Disbursements in excess of demand deposit cash | 1,667 | 29,952 | — |
| Payable for investments purchased | 263,975 | 996,288 | 1,968,204 |
| Payable for capital shares redeemed | 102,137 | 647,858 | 200,346 |
| Accrued management fees | 95,171 | 1,116,849 | 144,060 |
| Distribution and service fees payable | — | 1,337 | — |
| Accrued foreign taxes | — | 266,851 | 70,032 |
| 462,950 | 3,059,135 | 2,382,642 | |
| Net Assets | $76,701,956 | $959,036,831 | $93,001,392 |
| Net Assets Consist of: | |||
| Capital (par value and paid-in surplus) | $91,559,720 | $1,320,104,431 | $123,155,438 |
| Undistributed net investment income | 692,264 | 909,682 | 462,743 |
| Accumulated net realized loss on investment and | |||
| foreign currency transactions | (30,242,020) | (570,193,168) | (49,482,691) |
| Net unrealized appreciation on investments and | |||
| translation of assets and liabilities in foreign currencies | 14,691,992 | 208,215,886 | 18,865,902 |
| $76,701,956 | $ 959,036,831 | $ 93,001,392 | |
| Investor Class, $0.01 Par Value | |||
| Net assets | $76,701,956 | $872,864,622 | $92,967,902 |
| Shares outstanding | 7,020,945 | 102,046,796 | 16,921,494 |
| Net asset value per share | $10.92 | $8.55 | $5.49 |
| Institutional Class, $0.01 Par Value | |||
| Net assets | N/A | $79,830,459 | $33,490 |
| Shares outstanding | N/A | 9,215,857 | 6,042 |
| Net asset value per share | N/A | $8.66 | $5.54 |
| Advisor Class, $0.01 Par Value | |||
| Net assets | N/A | $6,341,750 | N/A |
| Shares outstanding | N/A | 757,466 | N/A |
| Net asset value per share | N/A | $8.37 | N/A |
| See Notes to Financial Statements. | |||
32
| Statement of Operations |
| YEAR ENDED NOVEMBER 30, 2009 | |||
| International | International | International | |
| Stock | Discovery | Opportunities | |
| Investment Income (Loss) | |||
| Income: | |||
| Dividends (net of foreign taxes withheld of $144,238, | |||
| $1,093,134 and $101,389, respectively) | $ 1,650,778 | $ 13,284,784 | $ 1,021,385 |
| Interest | 875 | 16,018 | 3,694 |
| Securities lending, net | — | 53,210 | 3,771 |
| 1,651,653 | 13,354,012 | 1,028,850 | |
| Expenses: | |||
| Management fees | 970,981 | 12,090,908 | 1,395,187 |
| Distribution and service fees | — | 18,672 | — |
| Directors’ fees and expenses | 2,359 | 30,544 | 2,595 |
| Other expenses | 1,602 | 5,904 | 367 |
| 974,942 | 12,146,028 | 1,398,149 | |
| Net investment income (loss) | 676,711 | 1,207,984 | (369,299) |
| Realized and Unrealized Gain (Loss) | |||
| Net realized gain (loss) on: | |||
| Investment transactions (net of foreign tax expenses | |||
| paid (refunded) of $—, $566,722 and $—, respectively) | (10,144,284) | (77,378,599) | (945,597) |
| Foreign currency transactions | (1,054,520) | (6,173,932) | (701,037) |
| (11,198,804) | (83,552,531) | (1,646,634) | |
| Change in net unrealized appreciation (depreciation) on: | |||
| Investments (net of deferred foreign taxes of $—, $266,851 | |||
| and $70,032, respectively) | 22,243,188 | 261,811,860 | 23,143,827 |
| Translation of assets and liabilities in foreign currencies | 8,861,412 | 92,278,992 | 7,657,743 |
| 31,104,600 | 354,090,852 | 30,801,570 | |
| Net realized and unrealized gain (loss) | 19,905,796 | 270,538,321 | 29,154,936 |
| Net Increase (Decrease) in Net Assets | |||
| Resulting from Operations | $20,582,507 | $271,746,305 | $28,785,637 |
| See Notes to Financial Statements. | |||
33
| Statement of Changes in Net Assets |
| YEARS ENDED NOVEMBER 30, 2009 AND NOVEMBER 30, 2008 | ||||
| International Stock | International Discovery | |||
| Increase (Decrease) in Net Assets | 2009 | 2008 | 2009 | 2008 |
| Operations | ||||
| Net investment income (loss) | $ 676,711 | $ 1,256,435 | $ 1,207,984 | $ 7,979,262 |
| Net realized gain (loss) | (11,198,804) | (18,600,496) | (83,552,531) | (483,272,867) |
| Change in net unrealized | ||||
| appreciation (depreciation) | 31,104,600 | (46,228,444) | 354,090,852 | (561,643,872) |
| Net increase (decrease) in | ||||
| net assets resulting from operations | 20,582,507 | (63,572,505) | 271,746,305 | (1,036,937,477) |
| Distributions to Shareholders | ||||
| From net investment income: | ||||
| Investor Class | (936,365) | (1,082,682) | (6,272,184) | (6,356,563) |
| Institutional Class | — | — | (623,699) | (874,387) |
| Advisor Class | — | — | (57,587) | (6,979) |
| From net realized gains: | ||||
| Investor Class | — | (5,805,544) | — | (394,844,373) |
| Institutional Class | — | — | — | (32,915,911) |
| Advisor Class | — | — | — | (1,442,399) |
| Decrease in net assets from distributions | (936,365) | (6,888,226) | (6,953,470) | (436,440,612) |
| Capital Share Transactions | ||||
| Net increase (decrease) in net assets | ||||
| from capital share transactions | (2,858,744) | (14,439,277)(1) | (85,394,901) | 346,302,568(1) |
| Redemption Fees | ||||
| Increase in net assets from redemption fees | 2,513 | —(1) | 162,422 | —(1) |
| Net increase (decrease) in net assets | 16,789,911 | (84,900,008) | 179,560,356 | (1,127,075,521) |
| Net Assets | ||||
| Beginning of period | 59,912,045 | 144,812,053 | 779,476,475 | 1,906,551,996 |
| End of period | $76,701,956 | $ 59,912,045 | $959,036,831 | $ 779,476,475 |
| Undistributed net investment income | $692,264 | $919,289 | $909,682 | $6,695,502 |
| (1) Capital share transactions for the year ended November 30, 2008 were net of redemption fees (Note 4). | ||||
| See Notes to Financial Statements. | ||||
34
| YEARS ENDED NOVEMBER 30, 2009 AND NOVEMBER 30, 2008 | ||
| International Opportunities | ||
| Increase (Decrease) in Net Assets | 2009 | 2008 |
| Operations | ||
| Net investment income (loss) | $ (369,299) | $ 1,066,415 |
| Net realized gain (loss) | (1,646,634) | (46,449,501) |
| Change in net unrealized appreciation (depreciation) | 30,801,570 | (60,312,691) |
| Net increase (decrease) in net assets resulting from operations | 28,785,637 | (105,695,777) |
| Distributions to Shareholders | ||
| From net investment income: | ||
| Investor Class | — | (1,005,979) |
| Institutional Class | — | (33,311) |
| From net realized gains: | ||
| Investor Class | — | (48,940,313) |
| Institutional Class | — | (1,080,457) |
| Decrease in net assets from distributions | — | (51,060,060) |
| Capital Share Transactions | ||
| Net increase (decrease) in net assets from capital share transactions | (2,579,078) | 6,871,665(1) |
| Redemption Fees | ||
| Increase in net assets from redemption fees | 8,832 | —(1) |
| Net increase (decrease) in net assets | 26,215,391 | (149,884,172) |
| Net Assets | ||
| Beginning of period | 66,786,001 | 216,670,173 |
| End of period | $93,001,392 | $ 66,786,001 |
| Undistributed net investment income | $462,743 | — |
| (1) Capital share transactions for the year ended November 30, 2008 were net of redemption fees (Note 4). | ||
| See Notes to Financial Statements. | ||
35
| Notes to Financial Statements |
NOVEMBER 30, 2009
1. Organization and Summary of Significant Accounting Policies
Organization — American Century World Mutual Funds, Inc. (the corporation) is registered under the Investment Company Act of 1940 (the 1940 Act) as an open-end management investment company. International Stock Fund (International Stock), International Discovery Fund (International Discovery) and International Opportunities Fund (International Opportunities) (collectively, the funds) are three funds in a series issued by the corporation. The funds are diversified under the 1940 Act. The funds’ investment objective is to seek capital growth. The funds pursue their objective by investing primarily in equity securities of foreign companies. International Stock primarily invests in securities of issuers in developed foreign countries that are large-sized companies, although it may invest in companies of any size. International Discovery p rimarily invests in securities of issuers in developed or emerging market countries that are small- to medium-sized companies at the time of purchase. International Opportunities primarily invests in securities of issuers in developed or emerging market countries that are small-sized companies at the time of purchase. The following is a summary of the funds’ significant accounting policies.
Multiple Class — International Stock is authorized to issue the Investor Class. International Discovery is authorized to issue the Investor Class, the Institutional Class and the Advisor Class. International Opportunities is authorized to issue the Investor Class and the Institutional Class. The share classes differ principally in their respective distribution and shareholder servicing expenses and arrangements. All shares of the funds represent an equal pro rata interest in the net assets of the class to which such shares belong, and have identical voting, dividend, liquidation and other rights and the same terms and conditions, except for class specific expenses and exclusive rights to vote on matters affecting only individual classes. Income, non-class specific expenses, and realized and unrealized capital gains and losses of the funds are allocated to each class of shares based on their relative net assets.
Security Valuations — Securities traded primarily on a principal securities exchange are valued at the last reported sales price, or at the mean of the latest bid and asked prices where no last sales price is available. Depending on local convention or regulation, securities traded over-the-counter are valued at the mean of the latest bid and asked prices, the last sales price, or the official close price. Investments in open-end management investment companies are valued at the reported net asset value. Debt securities not traded on a principal securities exchange are valued through a commercial pricing service or at the mean of the most recent bid and asked prices. Discount notes may be valued through a commercial pricing service or at amortized cost, which approximates fair value. Securities traded on foreign securities exchanges and ov er-the-counter markets are normally completed before the close of business on days that the New York Stock Exchange (the Exchange) is open and may also take place on days when the Exchange is not open. If an event occurs after the value of a security was established but before the net asset value per share was determined that was likely to materially change the net asset value, that security would be valued as determined in accordance with procedures adopted by the Board of Directors. If the funds determine that the market price of a portfolio security is not readily available, or that the valuation methods mentioned above do not reflect the security’s fair value, such security is valued as determined by the Board of Directors or its designee, in accordance with procedures adopted by the Board of Directors, if such determination would materially impact a fund’s net asset value. Certain other circumstances may cause the funds to use alternative procedures to value a security such as: a security has been declared in default; trading in a security has been halted during the trading day; or there is a foreign market holiday and no trading will commence.
Security Transactions — For financial reporting purposes, security transactions are accounted for as of the trade date. Net realized gains and losses are determined on the identified cost basis, which is also used for federal income tax purposes. Certain countries impose taxes on realized gains on the sale of securities registered in their country. The funds record the foreign tax expense, if any, on an accrual basis. The foreign tax expense on realized gains and unrealized appreciation reduces the net realized gain (loss) on investment transactions and net unrealized appreciation (depreciation) on investments, respectively.
36
Investment Income — Dividend income less foreign taxes withheld, if any, is recorded as of the ex-dividend date. Interest income is recorded on the accrual basis and includes accretion of discounts and amortization of premiums.
Securities on Loan — The funds may lend portfolio securities through their lending agent to certain approved borrowers in order to earn additional income. The income earned, net of any rebates or fees, is included in the Statement of Operations. The funds continue to recognize any gain or loss in the market price of the securities loaned and record any interest earned or dividends declared.
Exchange Traded Funds — The funds may invest in exchange traded funds (ETFs). ETFs are a type of index fund bought and sold on a securities exchange. An ETF trades like common stock and represents a fixed portfolio of securities designed to track the performance and dividend yield of a particular domestic or foreign market index. A fund may purchase an ETF to temporarily gain exposure to a portion of the U.S. or a foreign market while awaiting purchase of underlying securities. The risks of owning an ETF generally reflect the risks of owning the underlying securities they are designed to track, although the lack of liquidity on an ETF could result in it being more volatile. Additionally, ETFs have fees and expenses that reduce their value.
Foreign Currency Translations — All assets and liabilities initially expressed in foreign currencies are translated into U.S. dollars at prevailing exchange rates at period end. The funds may enter into spot foreign currency exchange contracts to facilitate transactions denominated in a foreign currency. Purchases and sales of investment securities, dividend and interest income, spot foreign currency exchange contracts, and certain expenses are translated at the rates of exchange prevailing on the respective dates of such transactions. Realized and unrealized gains and losses from foreign currency translations arise from changes in currency exchange rates.
Net realized and unrealized foreign currency exchange gains or losses occurring during the holding period of investment securities are a component of net realized gain (loss) on foreign currency transactions and net unrealized appreciation (depreciation) on translation of assets and liabilities in foreign currencies, respectively. Certain countries may impose taxes on the contract amount of purchases and sales of foreign currency contracts in their currency. The funds record the foreign tax expense, if any, as a reduction to the net realized gain (loss) on foreign currency transactions.
Repurchase Agreements — The funds may enter into repurchase agreements with institutions that American Century Investment Management, Inc. (ACIM) has determined are creditworthy pursuant to criteria adopted by the Board of Directors. Each repurchase agreement is recorded at cost. Each fund requires that the collateral, represented by securities, received in a repurchase transaction be transferred to the custodian in a manner sufficient to enable each fund to obtain those securities in the event of a default under the repurchase agreement. ACIM monitors, on a daily basis, the securities transferred to ensure the value, including accrued interest, of the securities under each repurchase agreement is equal to or greater than amounts owed to each fund under each repurchase agreement.
Joint Trading Account — Pursuant to an Exemptive Order issued by the Securities and Exchange Commission, each fund, along with certain other funds in the American Century Investments family of funds, may transfer uninvested cash balances into a joint trading account. These balances are invested in one or more repurchase agreements that are collateralized by U.S. Treasury or Agency obligations.
Income Tax Status — It is each fund’s policy to distribute substantially all net investment income and net realized gains to shareholders and to otherwise qualify as a regulated investment company under provisions of the Internal Revenue Code. The funds are no longer subject to examination by tax authorities for years prior to 2006. Additionally, non-U.S. tax returns filed by the funds due to investments in certain foreign securities remain subject to examination by the relevant taxing authority for 7 years from the date of filing. At this time, management believes there are no uncertain tax positions which,
37
based on their technical merit, would not be sustained upon examination and for which it is reasonably possible that the total amounts of unrecognized tax benefits will significantly change in the next twelve months. Accordingly, no provision has been made for federal or state income taxes. Interest and penalties associated with any federal or state income tax obligations, if any, are recorded as interest expense.
Distributions to Shareholders — Distributions to shareholders are recorded on the ex-dividend date. Distributions from net investment income, if any, are generally declared and paid annually. Distributions from net realized gains, if any, are generally declared and paid twice per year. The funds may make distributions on a more frequent basis to comply with the distribution requirements of the Internal Revenue Code, in all events in a manner consistent with provisions of the 1940 Act.
Redemption — International Stock may impose a 2.00% redemption fee on shares held less than 60 days. International Discovery and International Opportunities may impose a 2.00% redemption fee on shares held less than 180 days. These fees may not be applicable to all classes. These redemption fees are retained by a fund and help cover transaction costs that long-term investors may bear when a fund sells securities to meet investor redemptions.
Indemnifications — Under the corporation’s organizational documents, its officers and directors are indemnified against certain liabilities arising out of the performance of their duties to the funds. In addition, in the normal course of business, the funds enter into contracts that provide general indemnifications. The maximum exposure under these arrangements is unknown as this would involve future claims that may be made against a fund. The risk of material loss from such claims is considered by management to be remote.
Use of Estimates — The financial statements are prepared in conformity with accounting principles generally accepted in the United States of America, which may require management to make certain estimates and assumptions at the date of the financial statements. Actual results could differ from these estimates.
Subsequent Events — Management has evaluated events or transactions that may have occurred since November 30, 2009, that would merit recognition or disclosure in the financial statements. This evaluation was completed through January 27, 2010, the date the financial statements were issued.
2. Fees and Transactions with Related Parties
Management Fees — The corporation has entered into a Management Agreement with American Century Global Investment Management, Inc. (ACGIM) (the investment advisor), under which ACGIM provides the funds with investment advisory and management services in exchange for a single, unified management fee (the fee) per class. The Agreement provides that all expenses of managing and operating the funds, except brokerage expenses, taxes, interest, fees and expenses of the independent directors (including legal counsel fees), and extraordinary expenses, will be paid by ACGIM. The fee is computed and accrued daily based on the daily net assets of each specific class of shares of each fund and paid monthly in arrears. For funds with a stepped fee schedule, the rate of the fee is determined by applying a fee rate calculation formula. This formula takes into account each fund’s assets as well as certain assets, if any, of other clients of the investment advisor outside the American Century Investments family of funds (such as subadvised funds and separate accounts) that have very similar investment teams and investment strategies (strategy assets). The annual management fee schedule for International Stock ranges from 1.10% to 1.50% for the Investor Class. The annual management fee schedule for International Discovery ranges from 1.20% to 1.75% for the Investor Class and the Advisor Class. The annual management fee schedule for International Opportunities ranges from 1.60% to 2.00% for the Investor Class. The Institutional Class is 0.20% less at each point within the range.
38
The effective annual management fee for each class of each fund for the year ended November 30, 2009, was as follows:
| Investor | Institutional | Advisor | |
| International Stock | 1.50% | N/A | N/A |
| International Discovery | 1.48% | 1.28% | 1.48% |
| International Opportunities | 1.95% | 1.75% | N/A |
ACGIM has entered into a Subadvisory Agreement with ACIM (the subadvisor) on behalf of the funds. The subadvisor makes investment decisions for the cash portion of the funds in accordance with the funds’ investment objectives, policies and restrictions under the supervision of ACGIM and the Board of Directors. ACGIM pays all costs associated with retaining ACIM as the subadvisor of the funds.
Distribution and Service Fees — The Board of Directors has adopted a Master Distribution and Individual Shareholder Services Plan (the plan) for the Advisor Class, pursuant to Rule 12b-1 of the 1940 Act. The plan provides that the Advisor Class will pay American Century Investment Services, Inc. (ACIS) an annual distribution and service fee of 0.25%. The fees are computed and accrued daily based on the Advisor Class’s daily net assets and paid monthly in arrears. The fees are used to pay financial intermediaries for distribution and individual shareholder services. Fees incurred under the plan during the year ended November 30, 2009, are detailed in the Statement of Operations.
Acquired Fund Fees and Expenses — The funds may invest in mutual funds, exchange traded funds, and business development companies (the acquired funds). Each fund will indirectly realize its pro rata share of the fees and expenses of the acquired funds in which it invests. These indirect fees and expenses are not paid out of each fund’s assets but are reflected in the return realized by the fund on its investment in the acquired funds.
Related Parties — Certain officers and directors of the corporation are also officers and/ or directors, and, as a group, controlling stockholders of American Century Companies, Inc. (ACC), the parent of the corporation’s investment advisor, ACGIM, the corporation’s subadvisor, ACIM, the distributor of the corporation, ACIS, and the corporation’s transfer agent, American Century Services, LLC.
The funds are eligible to invest in a money market fund for temporary purposes, which is managed by J.P. Morgan Investment Management, Inc. (JPMIM). The funds have a Mutual Funds Services Agreement with J.P. Morgan Investor Services Co. (JPMIS) and a securities lending agreement with JPMorgan Chase Bank (JPMCB). JPMCB is a custodian of the funds. JPMIM, JPMIS and JPMCB are wholly owned subsidiaries of JPMorgan Chase & Co. (JPM). JPM is an equity investor in ACC.
3. Investment Transactions
Investment transactions, excluding short-term investments, for the year ended November 30, 2009, were as follows:
| International Stock | International Discovery | International Opportunities | |
| Purchases | $74,713,790 | $1,677,262,927 | $172,937,883 |
| Sales | $78,335,346 | $1,768,851,243 | $176,131,730 |
39
| 4. Capital Share Transactions | ||||
| Transactions in shares of the funds were as follows: | ||||
| Year ended November 30, 2009 | Year ended November 30, 2008 | |||
| Shares | Amount | Shares | Amount | |
| International Stock | ||||
| Investor Class/Shares Authorized | 50,000,000 | 50,000,000 | ||
| Sold | 937,931 | $ 8,529,669 | 1,268,342 | $ 17,252,483 |
| Issued in reinvestment of distributions | 105,583 | 914,349 | 450,577 | 6,757,448 |
| Redeemed | (1,423,706) | (12,302,762) | (3,076,774) | (38,449,208)(1) |
| Net increase (decrease) | (380,192) | $ (2,858,744) | (1,357,855) | $(14,439,277) |
| International Discovery | ||||
| Investor Class/Shares Authorized | 400,000,000 | 400,000,000 | ||
| Sold | 8,973,349 | $ 62,070,331 | 15,572,354 | $185,693,343 |
| Issued in reinvestment of distributions | 1,112,979 | 6,032,128 | 28,325,967 | 386,169,151 |
| Redeemed | (21,983,823) | (150,599,718) | (25,534,894) | (273,173,021)(2) |
| (11,897,495) | (82,497,259) | 18,363,427 | 298,689,473 | |
| Institutional Class/Shares Authorized | 70,000,000 | 70,000,000 | ||
| Sold | 2,436,097 | 16,480,062 | 3,577,588 | 45,306,392 |
| Issued in reinvestment of distributions | 107,347 | 588,261 | 2,453,486 | 33,751,832 |
| Redeemed | (2,014,567) | (13,522,357) | (5,184,774) | (52,166,981)(3) |
| 528,877 | 3,545,966 | 846,300 | 26,891,243 | |
| Advisor Class/Shares Authorized | 10,000,000 | 10,000,000 | ||
| Sold | 245,044 | 1,614,204 | 2,008,006 | 24,142,371 |
| Issued in reinvestment of distributions | 10,693 | 56,778 | 109,343 | 1,447,972 |
| Redeemed | (1,230,260) | (8,114,590) | (523,292) | (4,868,491)(4) |
| (974,523) | (6,443,608) | 1,594,057 | 20,721,852 | |
| Net increase (decrease) | (12,343,141) | $(85,394,901) | 20,803,784 | $346,302,568 |
| International Opportunities | ||||
| Investor Class/Shares Authorized | 100,000,000 | 100,000,000 | ||
| Sold | 2,878,583 | $13,930,223 | 799,367 | $ 5,682,329 |
| Issued in reinvestment of distributions | — | — | 6,031,614 | 48,303,707 |
| Redeemed | (3,685,056) | (15,251,912) | (7,755,525) | (47,755,326)(5) |
| (806,473) | (1,321,689) | (924,544) | 6,230,710 | |
| Institutional Class/Shares Authorized | 10,000,000 | 10,000,000 | ||
| Sold | — | — | 242,328 | 1,848,016 |
| Issued in reinvestment of distributions | — | — | 138,903 | 1,113,768 |
| Redeemed | (328,394) | (1,257,389) | (441,223) | (2,320,829) |
| (328,394) | (1,257,389) | (59,992) | 640,955 | |
| Net increase (decrease) | (1,134,867) | $(2,579,078) | (984,536) | $ 6,871,665 |
| (1) | Net of redemption fees of $22,320. |
| (2) | Net of redemption fees of $401,633. |
| (3) | Net of redemption fees of $33,836. |
| (4) | Net of redemption fees of $29,868. |
| (5) | Net of redemption fees of $4,553. |
40
5. Fair Value Measurements
The funds’ securities valuation process is based on several considerations and may use multiple inputs to determine the fair value of the positions held by the funds. In conformity with accounting principles generally accepted in the United States of America, the inputs used to determine a valuation are classified into three broad levels as follows:
• Level 1 valuation inputs consist of actual quoted prices in an active market for identical securities;
• Level 2 valuation inputs consist of significant direct or indirect observable market data (including quoted prices for similar securities, evaluations of subsequent market events, interest rates, prepayment speeds, credit risk, etc.); or
• Level 3 valuation inputs consist of significant unobservable inputs (including a fund’s own assumptions).
The level classification is based on the lowest level input that is significant to the fair valuation measurement. The valuation inputs are not an indication of the risks associated with investing in these securities or other financial instruments.
The following is a summary of the valuation inputs used to determine the fair value of the funds’ securities as of November 30, 2009:
| Level 1 | Level 2 | Level 3 | |
| International Stock | |||
| Investment Securities | |||
| Foreign Common Stocks | $5,471,041 | $70,648,945 | — |
| Temporary Cash Investments | 243,805 | 200,000 | — |
| Total Value of Investment Securities | $5,714,846 | $70,848,945 | — |
| International Discovery | |||
| Investment Securities | |||
| Foreign Common Stocks | $68,816,865 | $870,449,466 | — |
| Temporary Cash Investments | 58,514 | 13,800,000 | — |
| Total Value of Investment Securities | $68,875,379 | $884,249,466 | — |
| International Opportunities | |||
| Investment Securities | |||
| Foreign Common Stocks | $2,693,751 | $89,321,315 | — |
| Temporary Cash Investments | 58,652 | 1,300,000 | — |
| Total Value of Investment Securities | $2,752,403 | $90,621,315 | — |
41
6. Bank Line of Credit
The funds, along with certain other funds in the American Century Investments family of funds, had a $500,000,000 unsecured bank line of credit agreement with Bank of America, N.A. The line expired December 10, 2008, and was not renewed. The agreement allowed the funds to borrow money for temporary or emergency purposes to fund shareholder redemptions. Borrowings under the agreement were subject to interest at the Federal Funds rate plus 0.40%. The funds did not borrow from the line during the year ended November 30, 2009.
7. Interfund Lending
The funds, along with certain other funds in the American Century Investments family of funds, may participate in an interfund lending program, pursuant to an Exemptive Order issued by the Securities and Exchange Commission (SEC). This program provides an alternative credit facility allowing the funds to borrow from or lend to other funds in the American Century Investments family of funds that permit such transactions. Interfund lending transactions are subject to each fund’s investment policies and borrowing and lending limits. The interfund loan rate earned/paid on interfund lending transactions is determined daily based on the average of certain current market rates. Interfund lending transactions normally extend only overnight, but can have a maximum duration of seven days. The program is subject to annual approval by the Board of Directors. During the year ended November 30, 2009, the funds did not utilize the progra m.
8. Risk Factors
There are certain risks involved in investing in foreign securities. These risks include those resulting from future adverse political, social, and economic developments, fluctuations in currency exchange rates, the possible imposition of exchange controls, and other foreign laws or restrictions. Investing in emerging markets may accentuate these risks.
International Discovery and International Opportunities concentrate their investments in common stocks of smaller companies. Because of this, International Discovery and International Opportunities may be subject to greater risk and market fluctuations than a fund investing in larger, more established companies.
9. Federal Tax Information
On December 15, 2009, International Stock, International Discovery and International Opportunities declared and paid the following per-share distributions from net investment income to shareholders of record on December 14, 2009:
| Investor | Institutional | Advisor | |
| International Stock | $0.1029 | N/A | N/A |
| International Discovery | $0.0086 | $0.0263 | — |
| International Opportunities | $0.0556 | $0.0671 | N/A |
42
The tax character of distributions paid during the years ended November 30, 2009 and November 30, 2008 were as follows:
| International Stock | International Discovery | |||
| 2009 | 2008 | 2009 | 2008 | |
| Distributions Paid From: | ||||
| Ordinary income | $936,365 | $3,196,425 | $6,953,470 | $142,720,514 |
| Long-term capital gains | — | $3,691,801 | — | $293,720,098 |
| International Opportunities | ||||
| 2009 | 2008 | |||
| Distributions Paid From: | ||||
| Ordinary income | — | $19,328,096 | ||
| Long-term capital gains | — | $31,731,964 | ||
The book-basis character of distributions made during the year from net investment income or net realized gains may differ from their ultimate characterization for federal income tax purposes. These differences reflect the differing character of certain income items and net realized gains and losses for financial statement and tax purposes, and may result in reclassification among certain capital accounts on the financial statements.
As of November 30, 2009, the federal tax cost of investments and the components of distributable earnings on a tax-basis were as follows:
| International | International | International | |
| Stock | Discovery | Opportunities | |
| Federal tax cost of investments | $63,237,001 | $749,147,163 | $76,503,399 |
| Gross tax appreciation of investments | $13,803,566 | $210,941,009 | $17,930,324 |
| Gross tax depreciation of investments | (476,776) | (6,963,327) | (1,060,005) |
| Net tax appreciation (depreciation) of investments | $13,326,790 | $203,977,682 | $16,870,319 |
| Net tax appreciation (depreciation) on translation | |||
| of assets and liabilities in foreign currencies | $ 7,573 | $ (277,884) | $ (49,513) |
| Net tax appreciation (depreciation) | $13,334,363 | $203,699,798 | $16,820,806 |
| Undistributed ordinary income | $782,081 | $2,387,041 | $1,830,669 |
| Accumulated capital losses | $(28,974,208) | $(566,991,044) | $(48,805,521) |
| Currency loss deferrals | — | $(163,395) | — |
The difference between book-basis and tax-basis cost and unrealized appreciation (depreciation) is attributable primarily to the tax deferral of losses on wash sales and on investments in passive foreign investment companies.
The accumulated capital losses listed above represent net capital loss carryovers that may be used to offset future realized capital gains for federal income tax purposes. Future capital loss carryover utilization in any given year may be subject to Internal Revenue Code limitations. The capital loss carryovers expire as follows:
| 2016 | 2017 | |
| International Stock | $(13,731,461) | $(15,242,747) |
| International Discovery | $(325,506,389) | $(241,484,655) |
| International Opportunites | $(37,030,164) | $(11,775,357) |
43
The currency loss deferrals listed on the previous page represent net foreign currency losses incurred in the one-month period ended November 30, 2009. International Discovery has elected to treat such losses as having been incurred in the following fiscal year for federal income tax purposes.
10. Recently Issued Accounting Standards
In March 2008, the Financial Accounting Standards Board (FASB) issued Accounting Standards Codification (ASC) Section 815-10 (formerly Statement of Financial Accounting Standards No. 161, “Disclosures about Derivative Instruments and Hedging Activities —an amendment of FASB Statement No. 133”). ASC Section 815-10 is effective for interim periods beginning after November 15, 2008 and has been adopted by the funds. ASC Section 815-10 amends and expands disclosures about derivative instruments and hedging activities. ASC Section 815-10 requires qualitative disclosures about the objectives and strategies of derivative instruments, quantitative disclosures about the fair value amounts of and gains and losses on derivative instruments, and disclosures of credit-risk-related contingent features in hedging activities.
11. Other Tax Information (Unaudited)
The following information is provided pursuant to provisions of the Internal Revenue Code.
The funds hereby designate up to the maximum amount allowable as qualified dividend income for the fiscal year ended November 30, 2009.
For corporate taxpayers, the funds hereby designate the following ordinary income distributions, or up to the maximum amount allowable, as qualified for the corporate dividends received deduction for the fiscal year ended November 30, 2009.
| International Stock | International Discovery | International Opportunities |
| — | $9,388 | — |
For the fiscal year ended November 30, 2009, the funds intend to pass through to shareholders the following as a foreign tax credit, or up to the maximum amount allowable, which represents taxes paid on the following income derived from sources within foreign countries or possessions of the United States.
| International Stock | International Discovery | International Opportunities | |
| Foreign source income | $1,774,280 | $14,257,350 | $1,120,470 |
| Foreign tax expense | $147,126 | $1,058,908 | $100,972 |
44
| Financial Highlights |
| International Stock | ||||||
| Investor Class | ||||||
| For a Share Outstanding Throughout the Years Ended November 30 (except as noted) | ||||||
| 2009 | 2008 | 2007 | 2006 | 2005(1) | ||
| Per-Share Data | ||||||
| Net Asset Value, Beginning of Period | $8.09 | $16.53 | $13.57 | $10.84 | $10.00 | |
| Income From Investment Operations | ||||||
| Net Investment Income (Loss) | 0.09(2) | 0.15(2) | 0.13 | 0.06 | 0.06(2) | |
| Net Realized and Unrealized Gain (Loss) | 2.87 | (7.81) | 2.88 | 2.74 | 0.78 | |
| Total From Investment Operations | 2.96 | (7.66) | 3.01 | 2.80 | 0.84 | |
| Distributions | ||||||
| From Net Investment Income | (0.13) | (0.12) | (0.05) | (0.08) | — | |
| From Net Realized Gains | — | (0.66) | — | — | — | |
| Total Distributions | (0.13) | (0.78) | (0.05) | (0.08) | — | |
| Redemption Fees(2) | —(3) | —(3) | —(3) | 0.01 | — | |
| Net Asset Value, End of Period | $10.92 | $8.09 | $16.53 | $13.57 | $10.84 | |
| Total Return(4) | 36.96% | (48.50)% | 22.22% | 26.07% | 8.40% | |
| Ratios/Supplemental Data | ||||||
| Ratio of Operating Expenses | ||||||
| to Average Net Assets | 1.50% | 1.51% | 1.50% | 1.50% | 1.50%(5) | |
| Ratio of Net Investment Income (Loss) | ||||||
| to Average Net Assets | 1.05% | 1.12% | 0.83% | 0.40% | 0.91%(5) | |
| Portfolio Turnover Rate | 117% | 107% | 103% | 109% | 109% | |
| Net Assets, End of Period (in thousands) | $76,702 | $59,912 | $144,812 | $90,181 | $20,342 | |
| (1) | March 31, 2005 (fund inception) through November 30, 2005. | |||||
| (2) | Computed using average shares outstanding throughout the period. | |||||
| (3) | Per-share amount was less than $0.005. | |||||
| (4) | Total return assumes reinvestment of net investment income and capital gains distributions, if any. Total returns for periods less than one year | |||||
| are not annualized. | ||||||
| (5) | Annualized. | |||||
| See Notes to Financial Statements. | ||||||
45
| International Discovery | ||||||
| Investor Class | ||||||
| For a Share Outstanding Throughout the Years Ended November 30 | ||||||
| 2009 | 2008 | 2007 | 2006 | 2005 | ||
| Per-Share Data | ||||||
| Net Asset Value, Beginning of Period | $6.26 | $18.40 | $18.01 | $15.94 | $15.11 | |
| Income From Investment Operations | ||||||
| Net Investment Income (Loss)(1) | 0.01 | 0.06 | 0.05 | (0.02) | 0.14 | |
| Net Realized and Unrealized Gain (Loss) | 2.34 | (8.09) | 4.60 | 5.00 | 2.97 | |
| Total From Investment Operations | 2.35 | (8.03) | 4.65 | 4.98 | 3.11 | |
| Distributions | ||||||
| From Net Investment Income | (0.06) | (0.06) | — | (0.13) | — | |
| From Net Realized Gains | — | (4.05) | (4.26) | (2.78) | (2.28) | |
| Total Distributions | (0.06) | (4.11) | (4.26) | (2.91) | (2.28) | |
| Net Asset Value, End of Period | $8.55 | $6.26 | $18.40 | $18.01 | $15.94 | |
| Total Return(2) | 38.06% | (55.48)% | 32.18% | 36.41% | 24.30% | |
| Ratios/Supplemental Data | ||||||
| Ratio of Operating Expenses | ||||||
| to Average Net Assets | 1.48% | 1.37% | 1.36% | 1.41% | 1.47% | |
| Ratio of Net Investment Income (Loss) | ||||||
| to Average Net Assets | 0.13% | 0.51% | 0.30% | (0.11)% | 1.02% | |
| Portfolio Turnover Rate | 207% | 175% | 162% | 148% | 145% | |
| Net Assets, End of Period (in thousands) | $872,865 | $713,764 | $1,758,335 | $1,446,955 | $1,145,623 | |
| (1) | Computed using average shares outstanding throughout the period. | |||||
| (2) | Total return assumes reinvestment of net investment income and capital gains distributions, if any. The total return of the classes may not | |||||
| precisely reflect the class expense differences because of the impact of calculating the net asset values to two decimal places. If net asset | ||||||
| values were calculated to three decimal places, the total return differences would more closely reflect the class expense differences. The | ||||||
| calculation of net asset values to two decimal places is made in accordance with SEC guidelines and does not result in any gain or loss of value | ||||||
| between one class and another. | ||||||
| See Notes to Financial Statements. | ||||||
46
| International Discovery | ||||||
| Institutional Class | ||||||
| For a Share Outstanding Throughout the Years Ended November 30 | ||||||
| 2009 | 2008 | 2007 | 2006 | 2005 | ||
| Per-Share Data | ||||||
| Net Asset Value, Beginning of Period | $6.34 | $18.59 | $18.16 | $16.06 | $15.21 | |
| Income From Investment Operations | ||||||
| Net Investment Income (Loss)(1) | 0.02 | 0.08 | 0.09 | 0.04 | 0.17 | |
| Net Realized and Unrealized Gain (Loss) | 2.37 | (8.18) | 4.64 | 5.00 | 2.99 | |
| Total From Investment Operations | 2.39 | (8.10) | 4.73 | 5.04 | 3.16 | |
| Distributions | ||||||
| From Net Investment Income | (0.07) | (0.10) | — | (0.16) | — | |
| From Net Realized Gains | — | (4.05) | (4.30) | (2.78) | (2.31) | |
| Total Distributions | (0.07) | (4.15) | (4.30) | (2.94) | (2.31) | |
| Net Asset Value, End of Period | $8.66 | $6.34 | $18.59 | $18.16 | $16.06 | |
| Total Return(2) | 38.32% | (55.37)% | 32.45% | 36.65% | 24.56% | |
| Ratios/Supplemental Data | ||||||
| Ratio of Operating Expenses | ||||||
| to Average Net Assets | 1.28% | 1.17% | 1.16% | 1.21% | 1.27% | |
| Ratio of Net Investment Income (Loss) | ||||||
| to Average Net Assets | 0.33% | 0.71% | 0.50% | 0.09% | 1.22% | |
| Portfolio Turnover Rate | 207% | 175% | 162% | 148% | 145% | |
| Net Assets, End of Period (in thousands) | $79,830 | $55,091 | $145,723 | $105,849 | $205,406 | |
| (1) | Computed using average shares outstanding throughout the period. | |||||
| (2) | Total return assumes reinvestment of net investment income and capital gains distributions, if any. The total return of the classes may not | |||||
| precisely reflect the class expense differences because of the impact of calculating the net asset values to two decimal places. If net asset | ||||||
| values were calculated to three decimal places, the total return differences would more closely reflect the class expense differences. The | ||||||
| calculation of net asset values to two decimal places is made in accordance with SEC guidelines and does not result in any gain or loss of value | ||||||
| between one class and another. | ||||||
| See Notes to Financial Statements. | ||||||
47
| International Discovery | ||||||
| Advisor Class | ||||||
| For a Share Outstanding Throughout the Years Ended November 30 | ||||||
| 2009 | 2008 | 2007 | 2006 | 2005 | ||
| Per-Share Data | ||||||
| Net Asset Value, Beginning of Period | $6.13 | $18.08 | $17.76 | $15.75 | $14.95 | |
| Income From Investment Operations | ||||||
| Net Investment Income (Loss)(1) | —(2) | 0.06 | 0.07 | (0.08) | 0.10 | |
| Net Realized and Unrealized Gain (Loss) | 2.29 | (7.95) | 4.46 | 4.96 | 2.95 | |
| Total From Investment Operations | 2.29 | (7.89) | 4.53 | 4.88 | 3.05 | |
| Distributions | ||||||
| From Net Investment Income | (0.05) | (0.01) | — | (0.09) | — | |
| From Net Realized Gains | — | (4.05) | (4.21) | (2.78) | (2.25) | |
| Total Distributions | (0.05) | (4.06) | (4.21) | (2.87) | (2.25) | |
| Net Asset Value, End of Period | $8.37 | $6.13 | $18.08 | $17.76 | $15.75 | |
| Total Return(3) | 37.71% | (55.56)% | 31.83% | 36.08% | 24.01% | |
| Ratios/Supplemental Data | ||||||
| Ratio of Operating Expenses | ||||||
| to Average Net Assets | 1.73% | 1.63% | 1.61% | 1.66% | 1.72% | |
| Ratio of Net Investment Income (Loss) | ||||||
| to Average Net Assets | (0.12)% | 0.25% | 0.05% | (0.36)% | 0.77% | |
| Portfolio Turnover Rate | 207% | 175% | 162% | 148% | 145% | |
| Net Assets, End of Period (in thousands) | $6,342 | $10,622 | $2,494 | $7 | $70 | |
| (1) | Computed using average shares outstanding throughout the period. | |||||
| (2) | Per-share amount was less than $0.005. | |||||
| (3) | Total return assumes reinvestment of net investment income and capital gains distributions, if any. The total return of the classes may not | |||||
| precisely reflect the class expense differences because of the impact of calculating the net asset values to two decimal places. If net asset | ||||||
| values were calculated to three decimal places, the total return differences would more closely reflect the class expense differences. The | ||||||
| calculation of net asset values to two decimal places is made in accordance with SEC guidelines and does not result in any gain or loss of value | ||||||
| between one class and another. | ||||||
| See Notes to Financial Statements. | ||||||
48
| International Opportunities | ||||||
| Investor Class | ||||||
| For a Share Outstanding Throughout the Years Ended November 30 | ||||||
| 2009 | 2008 | 2007 | 2006 | 2005 | ||
| Per-Share Data | ||||||
| Net Asset Value, Beginning of Period | $3.70 | $11.37 | $11.79 | $12.27 | $9.35 | |
| Income From Investment Operations | ||||||
| Net Investment Income (Loss)(1) | (0.02) | 0.05 | 0.02 | (0.01) | 0.02 | |
| Net Realized and Unrealized Gain (Loss) | 1.81 | (5.06) | 2.94 | 2.53 | 3.19 | |
| Total From Investment Operations | 1.79 | (5.01) | 2.96 | 2.52 | 3.21 | |
| Distributions | ||||||
| From Net Investment Income | — | (0.05) | —(2) | (0.01) | — | |
| From Net Realized Gains | — | (2.61) | (3.38) | (2.99) | (0.29) | |
| Total Distributions | — | (2.66) | (3.38) | (3.00) | (0.29) | |
| Net Asset Value, End of Period | $5.49 | $3.70 | $11.37 | $11.79 | $12.27 | |
| Total Return(3) | 48.38% | (56.46)% | 33.73% | 25.37% | 35.28% | |
| Ratios/Supplemental Data | ||||||
| Ratio of Operating Expenses | ||||||
| to Average Net Assets | 1.95% | 1.87% | 1.81% | 1.85% | 1.91% | |
| Ratio of Net Investment Income (Loss) | ||||||
| to Average Net Assets | (0.52)% | 0.72% | 0.19% | (0.06)% | 0.20% | |
| Portfolio Turnover Rate | 244% | 206% | 149% | 160% | 112% | |
| Net Assets, End of Period (in thousands) | $92,968 | $65,541 | $212,157 | $180,732 | $198,197 | |
| (1) | Computed using average shares outstanding throughout the period. | |||||
| (2) | Per-share amount was less than $0.005. | |||||
| (3) | Total return assumes reinvestment of net investment income and capital gains distributions, if any. The total return of the classes may not | |||||
| precisely reflect the class expense differences because of the impact of calculating the net asset values to two decimal places. If net asset | ||||||
| values were calculated to three decimal places, the total return differences would more closely reflect the class expense differences. The | ||||||
| calculation of net asset values to two decimal places is made in accordance with SEC guidelines and does not result in any gain or loss of value | ||||||
| between one class and another. | ||||||
| See Notes to Financial Statements. | ||||||
49
| International Opportunities | ||||||
| Institutional Class | ||||||
| For a Share Outstanding Throughout the Years Ended November 30 | ||||||
| 2009 | 2008 | 2007 | 2006 | 2005 | ||
| Per-Share Data | ||||||
| Net Asset Value, Beginning of Period | $3.72 | $11.44 | $11.85 | $12.32 | $9.37 | |
| Income From Investment Operations | ||||||
| Net Investment Income (Loss)(1) | (0.04) | 0.07 | 0.06 | 0.02 | 0.10 | |
| Net Realized and Unrealized Gain (Loss) | 1.86 | (5.10) | 2.94 | 2.54 | 3.14 | |
| Total From Investment Operations | 1.82 | (5.03) | 3.00 | 2.56 | 3.24 | |
| Distributions | ||||||
| From Net Investment Income | — | (0.08) | (0.03) | (0.04) | — | |
| From Net Realized Gains | — | (2.61) | (3.38) | (2.99) | (0.29) | |
| Total Distributions | — | (2.69) | (3.41) | (3.03) | (0.29) | |
| Net Asset Value, End of Period | $5.54 | $3.72 | $11.44 | $11.85 | $12.32 | |
| Total Return(2) | 48.92% | (56.44)% | 33.97% | 25.66% | 35.53% | |
| Ratios/Supplemental Data | ||||||
| Ratio of Operating Expenses | ||||||
| to Average Net Assets | 1.75% | 1.67% | 1.61% | 1.65% | 1.71% | |
| Ratio of Net Investment Income (Loss) | ||||||
| to Average Net Assets | (0.32)% | 0.92% | 0.39% | 0.14% | 0.40% | |
| Portfolio Turnover Rate | 244% | 206% | 149% | 160% | 112% | |
| Net Assets, End of Period (in thousands) | $33 | $1,245 | $4,513 | $1,099 | $31 | |
| (1) | Computed using average shares outstanding throughout the period. | |||||
| (2) | Total return assumes reinvestment of net investment income and capital gains distributions, if any. The total return of the classes may not | |||||
| precisely reflect the class expense differences because of the impact of calculating the net asset values to two decimal places. If net asset | ||||||
| values were calculated to three decimal places, the total return differences would more closely reflect the class expense differences. The | ||||||
| calculation of net asset values to two decimal places is made in accordance with SEC guidelines and does not result in any gain or loss of value | ||||||
| between one class and another. | ||||||
| See Notes to Financial Statements. | ||||||
50
| Report of Independent Registered Public Accounting Firm |
The Board of Directors and Shareholders, American Century World Mutual Funds, Inc.:
We have audited the accompanying statements of assets and liabilities, including the schedules of investments, of International Stock Fund, International Discovery Fund, and International Opportunities Fund, three of the funds constituting American Century World Mutual Funds, Inc. (the “Corporation”), as of November 30, 2009, and the related statements of operations for the year then ended, the statements of changes in net assets for each of the two years in the period then ended, and the financial highlights for each of the periods presented. These financial statements and financial highlights are the responsibility of the Corporation’s management. Our responsibility is to express an opinion on these financial statements and financial highlights based on our audits.
We conducted our audits in accordance with the standards of the Public Company Accounting Oversight Board (United States). Those standards require that we plan and perform the audit to obtain reasonable assurance about whether the financial statements and financial highlights are free of material misstatement. The Corporation is not required to have, nor were we engaged to perform, an audit of its internal control over financial reporting. Our audits included consideration of internal control over financial reporting as a basis for designing audit procedures that are appropriate in the circumstances, but not for the purpose of expressing an opinion on the effectiveness of the Corporation’s internal control over financial reporting. Accordingly, we express no such opinion. An audit also includes examining, on a test basis, evidence supporting the amounts and disclosures in the financial statements, assessing the accounting principles used and significant estimates made by management, as well as evaluating the overall financial statement presentation. Our procedures included confirmation of securities owned as of November 30, 2009, by correspondence with the custodian and brokers; where replies were not received from brokers, we performed other auditing procedures. We believe that our audits provide a reasonable basis for our opinion.
In our opinion, the financial statements and financial highlights referred to above present fairly, in all material respects, the respective financial positions of International Stock Fund, International Discovery Fund, and International Opportunities Fund of American Century World Mutual Funds, Inc., as of November 30, 2009, the results of their operations for the year then ended, the changes in their net assets for each of the two years in the period then ended, and the financial highlights for each of the periods presented, in conformity with accounting principles generally accepted in the United States of America.
Deloitte & Touche LLP
Kansas City, Missouri
January 27, 2010
51
| Management |
The individuals listed below serve as directors or officers of the funds. Each director serves until his or her successor is duly elected and qualified or until he or she retires. Mandatory retirement age for independent directors is 72. However, the mandatory retirement age of any director may be extended with the approval of the remaining independent directors. Those listed as interested directors are “interested” primarily by virtue of their engagement as directors and/or officers of, or ownership interest in, American Century Companies, Inc. (ACC) or its wholly owned, direct or indirect, subsidiaries, including the funds’ investment advisor, American Century Global Investment Management, Inc. (ACGIM) or American Century Investment Management, Inc. (ACIM); the funds’ principal underwriter, American Century Investment Services, Inc. (ACIS); and the funds’ transfer agent, American Century Services, LLC (ACS).
The other directors (more than three-fourths of the total number) are independent; that is, they have never been employees, directors or officers of, and have no financial interest in, ACC or any of its wholly owned, direct or indirect, subsidiaries, including ACGIM, ACIM, ACIS and ACS. The directors serve in this capacity for seven registered investment companies in the American Century Investments family of funds.
All persons named as officers of the funds also serve in similar capacities for the other 14 registered investment companies in the American Century Investments family of funds advised by ACGIM or ACIM, unless otherwise noted. Only officers with policy-making functions are listed. No officer is compensated for his or her service as an officer of the funds. The listed officers are interested persons of the funds and are appointed or re-appointed on an annual basis.
Interested Director
Jonathan S. Thomas, 4500 Main Street, Kansas City, MO 64111
Year of Birth: 1963
Position(s) Held with Funds: Director (since 2007) and President (since 2007)
Principal Occupation(s) During Past 5 Years: President and Chief Executive Officer, ACC
(March 2007 to present); Chief Administrative Officer, ACC (February 2006 to
February 2007); Executive Vice President, ACC (November 2005 to February 2007).
Also serves as: President, Chief Executive Officer and Director, ACS; Executive
Vice President, ACIM and ACGIM; Director, ACIM, ACGIM, ACIS and other ACC
subsidiaries. Managing Director, Morgan Stanley (March 2000 to November 2005)
Number of Portfolios in Fund Complex Overseen by Director: 103
Other Directorships Held by Director: None
Independent Directors
Thomas A. Brown, 4500 Main Street, Kansas City, MO 64111
Year of Birth: 1940
Position(s) Held with Funds: Director (since 1980)
Principal Occupation(s) During Past 5 Years: Managing Member, Associated Investments, LLC
(real estate investment company); Managing Member, Brown Cascade Properties,
LLC (real estate investment company); Retired, Area Vice President, Applied
Industrial Technologies (bearings and power transmission company)
Number of Portfolios in Fund Complex Overseen by Director: 63
Other Directorships Held by Director: None
52
Andrea C. Hall, Ph.D., 4500 Main Street, Kansas City, MO 64111
Year of Birth: 1945
Position(s) Held with Funds: Director (since 1997)
Principal Occupation(s) During Past 5 Years: Retired, Advisor to the President, Midwest
Research Institute (not-for-profit, contract research organization)
Number of Portfolios in Fund Complex Overseen by Director: 63
Other Directorships Held by Director: None
James A. Olson, 4500 Main Street, Kansas City, MO 64111
Year of Birth: 1942
Position(s) Held with Funds: Director (since 2007)
Principal Occupation(s) During Past 5 Years: Member, Plaza Belmont LLC (private equity
fund manager); Chief Financial Officer, Plaza Belmont LLC (September 1999 to
September 2006)
Number of Portfolios in Fund Complex Overseen by Director: 63
Other Directorships Held by Director: Saia, Inc.; Entertainment Properties Trust
Donald H. Pratt, 4500 Main Street, Kansas City, MO 64111
Year of Birth: 1937
Position(s) Held with Funds: Director (since 1995) and Chairman of the Board (since 2005)
Principal Occupation(s) During Past 5 Years: Chairman and Chief Executive Officer, Western
Investments, Inc. (real estate company); Retired Chairman of the Board, Butler
Manufacturing Company (metal buildings producer)
Number of Portfolios in Fund Complex Overseen by Director: 63
Other Directorships Held by Director: None
Gale E. Sayers, 4500 Main Street, Kansas City, MO 64111
Year of Birth: 1943
Position(s) Held with Funds: Director (since 2000)
Principal Occupation(s) During Past 5 Years: President, Chief Executive Officer and Founder,
Sayers40, Inc. (technology products and services provider)
Number of Portfolios in Fund Complex Overseen by Director: 63
Other Directorships Held by Director: None
M. Jeannine Strandjord, 4500 Main Street, Kansas City, MO 64111
Year of Birth: 1945
Position(s) Held with Funds: Director (since 1994)
Principal Occupation(s) During Past 5 Years: Retired, formerly Senior Vice President, Sprint
Corporation (telecommunications company)
Number of Portfolios in Fund Complex Overseen by Director: 63
Other Directorships Held by Director: DST Systems, Inc.; Euronet Worldwide, Inc.; Charming
Shoppes, Inc.
John R. Whitten, 4500 Main Street, Kansas City, MO 64111
Year of Birth: 1946
Position(s) Held with Funds: Director (since 2008)
Principal Occupation(s) During Past 5 Years: Project Consultant, Celanese Corp. (industrial
chemical company) (September 2004 to January 2005)
Number of Portfolios in Fund Complex Overseen by Director: 63
Other Directorships Held by Director: Rudolph Technologies, Inc.
53
Officers
Barry Fink, 4500 Main Street, Kansas City, MO 64111
Year of Birth: 1955
Position(s) Held with Funds: Executive Vice President (since 2007)
Principal Occupation(s) During Past 5 Years: Chief Operating Officer and Executive Vice
President, ACC (September 2007 to present); President, ACS (October 2007 to
present); Managing Director, Morgan Stanley (2000 to 2007); Global General
Counsel, Morgan Stanley (2000 to 2006). Also serves as: Director, ACC, ACS,
ACIS and other ACC subsidiaries
Maryanne Roepke, 4500 Main Street, Kansas City, MO 64111
Year of Birth: 1956
Position(s) Held with Funds: Chief Compliance Officer (since 2006) and Senior Vice
President (since 2000)
Principal Occupation(s) During Past 5 Years: Chief Compliance Officer, ACIM, ACGIM
and ACS (August 2006 to present); Assistant Treasurer, ACC (January 1995 to
August 2006); and Treasurer and Chief Financial Officer, various American
Century Investments funds (July 2000 to August 2006). Also serves as: Senior
Vice President, ACS
Charles A. Etherington, 4500 Main Street, Kansas City, MO 64111
Year of Birth: 1957
Position(s) Held with Funds: General Counsel (since 2007) and Senior Vice President
(since 2006)
Principal Occupation(s) During Past 5 Years: Attorney, ACC (February 1994 to present); Vice
President, ACC (November 2005 to present); General Counsel, ACC (March 2007
to present). Also serves as: General Counsel, ACIM, ACGIM, ACS, ACIS and other
ACC subsidiaries; and Senior Vice President, ACIM, ACGIM and ACS
Robert Leach, 4500 Main Street, Kansas City, MO 64111
Year of Birth: 1966
Position(s) Held with Funds: Vice President, Treasurer and Chief Financial Officer (all
since 2006)
Principal Occupation(s) During Past 5 Years: Vice President, ACS (February 2000 to present); and
Controller, various American Century Investments funds (1997 to September 2006)
David H. Reinmiller, 4500 Main Street, Kansas City, MO 64111
Year of Birth: 1963
Position(s) Held with Funds: Vice President (since September 2000)
Principal Occupation(s) During Past 5 Years: Attorney, ACC (January 1994 to present);
Associate General Counsel, ACC (January 2001 to present); Chief Compliance
Officer, American Century Investments funds, ACIM and ACGIM (January 2001 to
February 2005). Also serves as: Associate General Counsel, ACIM, ACGIM, ACS,
ACIS and other ACC subsidiaries; and Vice President, ACIM, ACGIM and ACS
Ward Stauffer, 4500 Main Street, Kansas City, MO 64111
Year of Birth: 1960
Position(s) Held with Funds: Secretary (since February 2005)
Principal Occupation(s) During Past 5 Years: Attorney, ACC (June 2003 to present)
The SAI has additional information about the funds’ directors and is available without charge, upon request, by calling 1-800-345-2021.
54
| Approval of Management Agreements |
Under Section 15(c) of the Investment Company Act, contracts for investment advisory services (including subadvisory services) are required to be reviewed, evaluated and approved by a majority of a fund’s independent directors or trustees (the “Directors”) each year. At American Century Investments, this process is referred to as the “15(c) Process.” As a part of this process, the board reviews fund performance, shareholder services, audit and compliance information, and a variety of other reports from the advisor concerning fund operations. In addition to this annual review, the board of directors oversees and evaluates on a continuous basis at its quarterly meetings the nature and quality of significant services performed by the advisor and the subadvisor, fund performance, audit and compliance information, and a variety of other reports relating to fund operations. The board, or committees of the boa rd, also holds special meetings as needed.
Under a Securities and Exchange Commission rule, each fund is required to disclose in its annual or semiannual report, as appropriate, the material factors and conclusions that formed the basis for the board’s approval or renewal of any advisory agreements within the fund’s most recently completed fiscal half-year period.
Annual Contract Review Process
As part of the annual 15(c) Process undertaken during the most recent fiscal half-year period, the Directors reviewed extensive data and information compiled by the advisor and certain independent providers of evaluative data (the “15(c) Providers”) concerning International Stock, International Discovery, and International Opportunities (the “Funds”) and the services provided to the Funds under the management and subadvisory agreements. The information considered and the discussions held at the meetings included, but were not limited to:
• the nature, extent and quality of investment management, shareholder services and other services provided to the Funds;
• the wide range of programs and services the advisor provides to the Funds and their shareholders on a routine and non-routine basis;
• the compliance policies, procedures, and regulatory experience of both the advisor and the subadvisor;
• data comparing the cost of owning the Funds to the cost of owning a similar fund;
• data comparing the Funds’ performance to appropriate benchmarks and/ or a peer group of other mutual funds with similar investment objectives and strategies;
• financial data showing the profitability of the Funds to the advisor and the overall profitability of the advisor;
55
• data comparing services provided and charges to other investment management clients of the advisor; and
• consideration of collateral benefits derived by the advisor from the manage ment of the Funds and any potential economies of scale relating thereto.
In keeping with its practice, the Funds’ board of directors held two in-person meetings and one telephonic meeting to review and discuss the information provided. The board also had the benefit of the advice of its independent counsel throughout the period.
Factors Considered
The Directors considered all of the information provided by the advisor, the 15(c) Providers, and the board’s independent counsel, and evaluated such information for each fund for which the board has responsibility. In connection with their review of the Funds, the Directors did not identify any single factor as being all-important or controlling, and each Director may have attributed different levels of importance to different factors. In deciding to renew the management and subadvisory agreements under the terms ultimately determined by the board to be appropriate, the Directors’ decision was based on the following factors.
Nature, Extent and Quality of Services – Generally. Under the management agreement, the advisor is responsible for providing or arranging for all services necessary for the operation of the Funds. The board noted that under the management agreement, the advisor provides or arranges at its own expense a wide variety of services including:
• Fund construction and design
• portfolio security selection
• initial capitalization/funding
• securities trading
• Fund administration
• custody of Fund assets
• daily valuation of each Fund’s portfolio
• shareholder servicing and transfer agency, including shareholder confirmations, recordkeeping and communications
• legal services
• regulatory and portfolio compliance
• financial reporting
• marketing and distribution
56
The Directors noted that many of the services provided by the advisor have expanded over time both in terms of quantity and complexity in response to shareholder demands, competition in the industry and the changing regulatory environment. They discussed with the advisor the challenges presented by these changes and the impact on the Funds. The directors specifically noted that with respect to the Funds, the advisor had retained the subad-visor to provide the day-to-day cash management services. In performing their evaluation, the Directors considered information received in connection with the annual review, as well as information provided on an ongoing basis at their regularly scheduled board and committee meetings.
Investment Management Services. The nature of the investment management services provided to the Funds is quite complex and allows Fund shareholders access to professional money management, instant diversification of their investments, and liquidity. In evaluating investment performance, the board expects the advisor and subadvisor to manage the Funds in accordance with its investment objectives and approved strategies. Further, the Directors recognize that the advisor and subadvisor have an obligation to monitor trading activities, and in particular to seek the best execution of fund trades, and to evaluate the use of and payment for research. In providing these services, the advisor and subadvisor utilize teams of investment professionals (portfolio managers, analysts, research assistants, and securities traders) who require extensive in formation technology, research, training, compliance and other systems to conduct their business. At each quarterly meeting the Directors review investment performance information for the Funds, together with comparative information for appropriate benchmarks and/or peer groups of funds managed similarly to the Funds. The Directors also review detailed performance information during the 15(c) Process comparing each Fund’s performance with that of similar funds not managed by the advisor. If performance concerns are identified, the Directors discuss with the advisor the reasons for such results (e.g., market conditions, security selection) and any efforts being undertaken to improve performance. International Stock’s performance for both the one- and three-year periods was above the median for its peer group. The performance of International Discovery and International Opportunities was above the median for its respective peer group for the three-year period and below the median for the one-year per iod.
Shareholder and Other Services. The advisor provides the Funds with a comprehensive package of transfer agency, shareholder, and other services. The Directors review reports and evaluations of such services at their regular quarterly meetings, including the annual meeting concerning contract review, and reports to the board. These reports include, but are not limited to, information regarding the operational efficiency and accuracy of the shareholder and transfer agency services provided, staffing levels, shareholder satisfaction (as measured by external as well as internal sources), technology support, new products and services offered to Fund shareholders, securities trading activities, portfolio valuation services, auditing
57
services, and legal and operational compliance activities. Certain aspects of shareholder and transfer agency service level efficiency and the quality of securities trading activities are measured by independent third party providers and are presented in comparison to other fund groups not managed by the advisor.
Costs of Services Provided and Profitability. The advisor provides detailed information concerning its cost of providing various services to the Funds, its profitability in managing the Funds, its overall profitability, and its financial condition. The Directors have reviewed with the advisor the methodology used to prepare this financial information. This financial information regarding the advisor is considered in order to evaluate the advisor’s financial condition, its ability to continue to provide services under the management agreement, and the reasonableness of the current management fee. The board concluded that the advisor’s profits were reasonable in light of the services provided to the Funds. The board did not consider the profitability of the subadvisor because the subadvisor is paid from the unified fee of the advis or as a result of arm’s length negotiations.
Ethics. The Directors generally consider the advisor’s commitment to providing quality services to shareholders and to conducting its business ethically. They noted that the advisor’s practices generally meet or exceed industry best practices. With respect to the subadvisor, as part of its oversight responsibilities, the board approves the subadvisor’s code of ethics and any changes thereto. Further, through the advisor’s compliance group, the board stays abreast of any violations of the subadvisor’s code.
Economies of Scale. The Directors review information provided by the advisor regarding the possible existence of economies of scale in connection with the management of the Funds. The Directors concluded that economies of scale are difficult to measure and predict with precision, especially on a fund-by-fund basis. The analysis of economies of scale is further complicated by the additional services and content provided by the advisor and its reinvestment in its ability to provide and expand those services. Accordingly, the Directors seek to evaluate economies of scale by reviewing other information, such as year-over-year profitability of the advisor generally, the profitability of its management of the Funds specifically, the expenses incurred by the advisor in providing various functions to the Funds, and the fees of competitive funds no t managed by the advisor. The Directors believe the advisor is appropriately sharing economies of scale through its competitive fee structure, fee breakpoints as each Fund increases in size, and through reinvestment in its business to provide shareholders additional content and services.
Comparison to Other Funds’ Fees. The Funds pay the advisor a single, all-inclusive (or unified) management fee for providing all services necessary for the management and operation of the Funds, other than brokerage expenses, taxes, interest, extraordinary expenses, and the fees and expenses of each Fund’s independent directors (including their independent legal counsel).
58
The Directors specifically noted that the subadvisory fees paid to the subadvisor under the subadvisory agreement were subject to arm’s length negotiation between the advisor and the subadvisor and are paid by the advisor out of its unified fee.
Under the unified fee structure, the advisor is responsible for providing all investment advisory, custody, audit, administrative, compliance, record-keeping, marketing and shareholder services, or arranging and supervising third parties to provide such services. By contrast, most other funds are charged a variety of fees, including an investment advisory fee, a transfer agency fee, an administrative fee, distribution charges and other expenses. Other than their investment advisory fees and Rule 12b-1 distribution fees, all other components of the total fees charged by these other funds may be increased without shareholder approval. The board believes the unified fee structure is a benefit to Fund shareholders because it clearly discloses to shareholders the cost of owning Fund shares, and, since the unified fee cannot be increased without a vote of Fund shareholders, it shifts to the advisor the risk of increased costs of o perating the Fund and provides a direct incentive to minimize administrative inefficiencies. Part of the Directors’ analysis of fee levels involves reviewing certain evaluative data compiled by a 15(c) Provider comparing each Fund’s unified fee to the total expense ratio of other funds in the Fund’s peer group and performing a regression analysis to evaluate the effect of fee breakpoints as assets under management increase. The unified fee charged to the shareholders of International Discovery was below the median of the total expense ratios of its peer group. The unified fees charged to shareholders of International Stock and International Opportunities were above the median of the total expense ratios of their respective peer groups. In addition, the Directors also reviewed updated fee level data provided by the advisor, but recognized that comparative data was particularly difficult to evaluate given the significant market developments during the past year. The board concluded that the mana gement fee paid by each Fund to the advisor was reasonable in light of the services provided to the Fund.
Comparison to Fees and Services Provided to Other Clients of the Advisor. The Directors also requested and received information from the advisor concerning the nature of the services, fees, and profitability of its advisory services to advisory clients other than the Funds. They observed that these varying types of client accounts require different services and involve different regulatory and entrepreneurial risks than the management of the Funds. The Directors analyzed this information and concluded that the fees charged and services provided to the Funds were reasonable by comparison.
Collateral Benefits Derived by the Advisor. The Directors considered the existence of collateral benefits the advisor may receive as a result of its relationship with the Funds. They concluded that the advisor’s primary business is managing mutual funds and it generally does not use fund or shareholder information to generate profits in other lines of business, and therefore does not derive any significant collateral benefits from them. The Directors
59
noted that the advisor receives proprietary research from broker-dealers that execute fund portfolio transactions and concluded that this research is likely to benefit fund shareholders. The Directors also determined that the advisor is able to provide investment management services to certain clients other than the Funds, at least in part, due to its existing infrastructure built to serve the fund complex. The Directors concluded, however, that the assets of those other clients are not material to the analysis and, in any event, are included with the assets of the Funds to determine breakpoints in each Fund’s fee schedule, provided they are managed using the same investment team and strategy.
Conclusions of the Directors
As a result of this process, the board, including all of the independent directors, in the absence of particular circumstances and assisted by the advice of legal counsel that is independent of the advisor, taking into account all of the factors discussed above and the information provided by the advisor concluded that the investment management agreement between each Fund and the advisor is fair and reasonable in light of the services provided and should be renewed.
Additionally, the board, including all the independent directors, in the absence of particular circumstances and assisted by the advice of legal counsel that is independent of the advisor, taking into account all of the factors discussed above and the information provided by the advisor, concluded that the subadvisory agreement between the advisor and the subadvisor, on behalf of each Fund, is fair and reasonable in light of the services provided and should be renewed.
60
| Additional Information |
Retirement Account Information
As required by law, distributions you receive from certain IRAs, or 403(b), 457 and qualified plans are subject to federal income tax withholding, unless you elect not to have withholding apply. Tax will be withheld on the total amount withdrawn even though you may be receiving amounts that are not subject to withholding, such as nondeductible contributions. In such case, excess amounts of withholding could occur. You may adjust your withholding election so that a greater or lesser amount will be withheld.
If you don’t want us to withhold on this amount, you must notify us to not withhold the federal income tax. You may notify us in writing or in certain situations by telephone or through other electronic means. You have the right to revoke your withholding election at any time and any election you make may remain in effect until revoked by filing a new election.
Remember, even if you elect not to have income tax withheld, you are liable for paying income tax on the taxable portion of your withdrawal. If you elect not to have income tax withheld or you don’t have enough income tax withheld, you may be responsible for payment of estimated tax. You may incur penalties under the estimated tax rules if your withholding and estimated tax payments are not sufficient. You can reduce or defer the income tax on a distribution by directly or indirectly rolling such distribution over to another IRA or eligible plan. You should consult your tax advisor for additional information.
State tax will be withheld if, at the time of your distribution, your address is within one of the mandatory withholding states and you have federal income tax withheld. State taxes will be withheld from your distribution in accordance with the respective state rules.
Proxy Voting Guidelines
American Century Global Investment Management, Inc., the funds’ investment advisor, is responsible for exercising the voting rights associated with the securities purchased and/or held by the funds. A description of the policies and procedures the advisor uses in fulfilling this responsibility is available without charge, upon request, by calling 1-800-345-2021. It is also available on American Century Investments’ website at americancentury. com and on the Securities and Exchange Commission’s website at sec.gov. Information regarding how the investment advisor voted proxies relating to portfolio securities during the most recent 12-month period ended June 30 is available on the “About Us” page at americancentury.com. It is also available at sec.gov.
Quarterly Portfolio Disclosure
The funds file their complete schedule of portfolio holdings with the Securities and Exchange Commission (SEC) for the first and third quarters of each fiscal year on Form N-Q. The funds’ Forms N-Q are available on the SEC’s website at sec.gov, and may be reviewed and copied at the SEC’s Public Reference Room in Washington, DC. Information on the operation of the Public Reference Room may be obtained by calling 1-800-SEC-0330. The funds also make their complete schedule of portfolio holdings for the most recent quarter of their fiscal year available on their website at americancentury.com and, upon request, by calling 1-800-345-2021.
61
| Index Definitions |
The following indices are used to illustrate investment market, sector, or style performance or to serve as fund performance comparisons. They are not investment products available for purchase.
Morgan Stanley Capital International (MSCI) has developed several indices that measure the performance of foreign stock markets.
The Morgan Stanley Capital International All Country World Index (MSCI ACWI) is designed to measure equity market performance of developed and emerging markets. The MSCI ACWI includes 47 country indices.
The MSCI AC (All Country) World ex-US Mid Cap Growth Index represents the performance of mid cap growth stocks in developed and emerging markets, excluding the United States.
The MSCI AC (All Country) World ex-US Small Cap Growth Index represents the performance of small cap growth stocks in developed and emerging markets, excluding the United States.
The MSCI EAFE (Europe, Australasia, Far East) Index is designed to measure developed market equity performance, excluding the U.S. and Canada.
The MSCI EAFE Growth Index is a capitalization-weighted index that monitors the performance of growth stocks from Europe, Australasia, and the Far East.
The MSCI EAFE Value Index is a capitalization-weighted index that monitors the performance of value stocks from Europe, Australasia, and the Far East.
The MSCI EM (Emerging Markets) Growth Index represents the performance of growth stocks in global emerging market countries.
The MSCI Europe Index is designed to measure equity market performance in Europe.
The MSCI Japan Index is designed to measure equity market performance in Japan.
The MSCI World Free Index represents the performance of stocks in developed countries (including the United States) that are available for purchase by global investors.
62
| Notes |
63
| Notes |
64

| Contact Us | |
| americancentury.com | |
| Automated Information Line | 1-800-345-8765 |
| Investor Services Representative | 1-800-345-2021 or |
| 816-531-5575 | |
| Business, Not-For-Profit, Employer-Sponsored | |
| Retirement Plans | 1-800-345-3533 |
| Banks and Trust Companies, Broker-Dealers, | |
| Financial Professionals, Insurance Companies | 1-800-345-6488 |
| Telecommunications Device for the Deaf | 1-800-634-4113 |
| American Century World Mutual Funds, Inc. | |
| Investment Advisor: | |
| American Century Global Investment Management, Inc. | |
| New York, New York |
This report and the statements it contains are submitted for the general
information of our shareholders. The report is not authorized for distribution to
prospective investors unless preceded or accompanied by an effective prospectus.
American Century Investment Services, Inc., Distributor
©2010 American Century Proprietary Holdings, Inc. All rights reserved.
1001
CL-ANN-67331S

| Contact Us | |
| americancentury.com | |
| Automated Information Line | 1-800-345-8765 |
| Investor Services Representative | 1-800-345-2021 or |
| 816-531-5575 | |
| Business, Not-For-Profit, Employer-Sponsored | |
| Retirement Plans | 1-800-345-3533 |
| Banks and Trust Companies, Broker-Dealers, | |
| Financial Professionals, Insurance Companies | 1-800-345-6488 |
| Telecommunications Device for the Deaf | 1-800-634-4113 |
| American Century World Mutual Funds, Inc. | |
| Investment Advisor: | |
| American Century Global Investment Management, Inc. | |
| New York, New York |
This report and the statements it contains are submitted for the general
information of our shareholders. The report is not authorized for distribution to
prospective investors unless preceded or accompanied by an effective prospectus.
American Century Investment Services, Inc., Distributor
©2010 American Century Proprietary Holdings, Inc. All rights reserved.
1001
CL-ANN-67331N
| Annual Report |
| November 30, 2009 |
![]()
| American Century Investments |
NT International Growth Fund
NT Emerging Markets Fund
| Table of Contents |
| President’s Letter | 2 |
| Independent Chairman’s Letter | 3 |
| Market Perspective | 4 |
| International Equity Total Returns | 4 |
| NT International Growth | |
| Performance | 5 |
| Portfolio Commentary | 7 |
| Top Ten Holdings | 9 |
| Types of Investments in Portfolio | 9 |
| Investments by Country | 9 |
| NT Emerging Markets | |
| Performance | 10 |
| Portfolio Commentary | 12 |
| Top Ten Holdings | 14 |
| Types of Investments in Portfolio | 14 |
| Investments by Country | 14 |
| Shareholder Fee Examples | 15 |
| Financial Statements | |
| Schedule of Investments | 17 |
| Statement of Assets and Liabilities | 24 |
| Statement of Operations | 25 |
| Statement of Changes in Net Assets | 26 |
| Notes to Financial Statements | 27 |
| Financial Highlights | 34 |
| Report of Independent Registered Public Accounting Firm | 36 |
| Other Information | |
| Management | 37 |
| Approval of Management Agreements | 40 |
| Additional Information | 46 |
| Index Definitions | 47 |
The opinions expressed in the Market Perspective and each of the Portfolio Commentaries reflect those of the portfolio management team as of the date of the report, and do not necessarily represent the opinions of American Century Investments or any other person in the American Century Investments organization. Any such opinions are subject to change at any time based upon market or other conditions and American Century Investments disclaims any responsibility to update such opinions. These opinions may not be relied upon as investment advice and, because investment decisions made by American Century Investments funds are based on numerous factors, may not be relied upon as an indication of trading intent on behalf of any American Century Investments fund. Security examples are used for representational purposes only and are not intended as recommendations to purchase or sell securities. Performance information for com parative indices and securities is provided to American Century Investments by third party vendors. To the best of American Century Investments’ knowledge, such information is accurate at the time of printing.
| President’s Letter |

Dear Investor:
Thank you for taking time to review the following pages, which provide the performance of your investment along with the perspectives of our experienced portfolio management team for the financial reporting period ended November 30, 2009. We appreciate your trust in American Century Investments® at this volatile, transitional time in the economy and investment markets.
As the upheavals associated with the “Great Recession” gradually subside, our senior management team has put considerable thought into how the investment environment has changed and what new challenges and opportunities await us. Critical factors that we are anticipating in 2010 include marked shifts in investment and spending behavior, along with consolidation in our industry.
Most importantly, we think the U.S. economic recovery will be slow and extended. The economy and capital markets have come a long way since Lehman Brothers collapsed in the third quarter of 2008, but 2010 will likely bring continuing challenges. The U.S. stock market’s rebound since last March and the second-half economic surge in 2009 were fueled largely by corporate cost-cutting and unprecedented monetary and fiscal stimulus, including some key programs that have since expired or been scaled back.
Meanwhile, the resilient but struggling consumer sector still faces double-digit unemployment, heavy debt burdens, tight credit conditions, and a housing market that is starting to stabilize, but remains vulnerable. Much of our investment positioning in 2009 cautiously reflected these still unstable economic fundamentals, leading to underperformance, in some cases, versus market benchmarks buoyed by the rally of riskier assets. We still support our fundamentally based positioning because we believe strongly that some markets—driven more by technical factors than fundamentals—have advanced further than underlying economic conditions warrant, and remain susceptible to the possibility of more volatility ahead.
Thank you for your continued confidence in us.
Sincerely,

Jonathan Thomas
President and Chief Executive Officer
American Century Investments
2
| Independent Chairman’s Letter |

In my first letter to shareholders of the American Century Investments funds, I invited you to contact me with your questions. I have been gratified with your response. Most shareholder inquiries to date have related to specific fund performance issues. As I noted in my individual responses, your board through the Fund Performance Committee continues to stress improved performance in our quarterly meetings with chief investment officers and fund managers.
An important part of our fund performance review process is a face-to-face meeting with portfolio managers. The board traveled during the second quarter to the American Century Investments office in Mountain View, California to meet with the fund of funds and asset allocation portfolio management teams. These meetings validated the importance of thorough reviews of investment opportunities by the credit management personnel resident in that office. As a result of their efforts, American Century Investments funds were able to avoid the “toxic assets” that plagued many other fund families in 2008.
From April through June 2009, the board conducted its annual review of the advisory contracts between American Century Investments and each fund. Our efforts involved a review of fund information, including assets under management; total expense ratio compared to peers; economies of scale; fee breakpoints that reduce shareholder costs as assets increase; performance compared to peers and benchmarks; and the quality of services provided to fund shareholders. A detailed discussion of board considerations in connection with advisory contract renewal is included annually in each fund’s shareholder reports. During this review, the board focuses on a detailed comparison of the competitive position of each fund and has negotiated more than 60 breakpoints or fee reductions in the past five years.
The board looks forward to another year of work on your behalf and your comments are appreciated. You are invited to email me at dhpratt@fundboardchair.com.
3
| Market Perspective |

By Mark Kopinski, Chief Investment Officer, Global and Non-U.S. Equity
Stocks Shook Off Early Declines
The near-collapse of the global financial system in the fall of 2008 fueled the worldwide recession and credit crisis and sent investors fleeing stocks and other risky assets. In this environment, international equity markets plunged to multi-year lows on sharp double-digit losses.
By mid-March, investor confidence and stock market performance showed an abrupt and surprising turnaround, triggered by a belief that the global financial system was no longer on the verge of collapse. Optimistic investors focused on early signs suggesting the global recession was easing, favoring lower-quality stocks that had been battered the most in the prior months. By the third quarter of 2009, gross domestic product returned to positive territory in Germany, France, and Japan, while industrial production and global trade levels improved in China. Meanwhile, consumer confidence improved throughout Europe, and in the United Kingdom the troubled housing market showed signs of stabilizing.
After bottoming on March 9, global stock markets rallied sharply to finish the 12-month period with strong gains. With renewed confidence in equities, investors shifted funds toward riskier assets, which, combined with rising commodity prices, bolstered performance among emerging markets.
Recovery’s Sustainability Remained in Question
Despite improving conditions, central bankers worldwide voiced concerns about the overall stability and sustainability of the economic recovery. The Bank of Japan stated downside risks remain, and European Central Bank officials stressed a recovery likely would be uneven. At the same time, officials mulled plans to reduce market liquidity, as the massive and widespread government stimulus efforts neared expiration. Meanwhile, rising unemployment dampened consumer spending, pricing data failed to support inflationary or deflationary expectations, and the Chinese government repeated concerns about overcapacity in the materials sector.
If, in the coming months, consumers worldwide do not increase spending, either due to prolonged unemployment or the need to repair their net worth, additional stimulus packages may become necessary. We expect continued easy monetary and fiscal policies globally, as most central banks seek to avoid fostering a “double dip” recession.
| International Equity Total Returns | ||||
| For the 12 months ended November 30, 2009 (in U.S. dollars) | ||||
| MSCI EAFE Index | 37.72% | MSCI Europe Index | 40.83% | |
| MSCI EAFE Growth Index | 34.93% | MSCI World Free Index | 31.79% | |
| MSCI EAFE Value Index | 40.54% | MSCI Japan Index | 14.01% | |
| MSCI EM Growth Index | 83.97% | |||
4
| Performance |
| NT International Growth | |||
| Total Returns as of November 30, 2009 | |||
| Average Annual | |||
| Returns | |||
| Since | Inception | ||
| 1 year | Inception | Date | |
| Institutional Class | 39.09% | -2.67% | 5/12/06 |
| MSCI EAFE Index | 37.72% | -3.37% | — |
| MSCI EAFE Growth Index | 34.93% | -3.18% | — |
Data presented reflect past performance. Past performance is no guarantee of future results. Current performance may be higher or lower than the performance shown. Investment return and principal value will fluctuate, and redemption value may be more or less than original cost. To obtain performance data current to the most recent month end, please call 1-800-345-2021 or visit americancentury.com. International investing involves special risks, such as political instability and currency fluctuations. Investing in emerging markets may accentuate these risks.
Data assumes reinvestment of dividends and capital gains, and none of the charts reflect the deduction of taxes that a shareholder would pay on fund distributions or the redemption of fund shares. Returns for the indices are provided for comparison. The fund’s total returns include operating expenses (such as transaction costs and management fees) that reduce returns, while the total returns of the indices do not.
5
NT International Growth
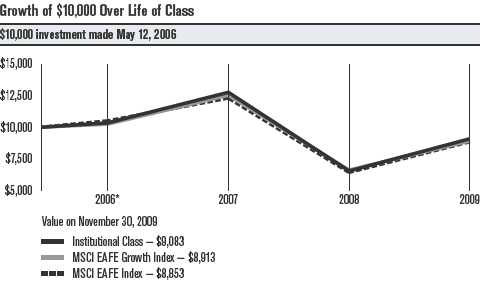
| One-Year Returns Over Life of Class | ||||
| Periods ended November 30 | ||||
| 2006* | 2007 | 2008 | 2009 | |
| Institutional Class | 3.40% | 23.40% | -48.82% | 39.09% |
| MSCI EAFE Index | 4.97% | 17.30% | -47.79% | 37.72% |
| MSCI EAFE Growth Index | 2.43% | 22.32% | -47.28% | 34.93% |
| *From 5/12/06, the Institutional Class’s inception date. Not annualized. | ||||
| Total Annual Fund Operating Expenses | ||||
| Institutional Class | 1.22% | |||
The total annual fund operating expenses shown is as stated in the fund’s prospectus current as of the date of this report. The prospectus may vary from the expense ratio shown elsewhere in this report because it is based on a different time period, includes acquired fund fees and expenses, and, if applicable, does not include fee waivers or expense reimbursements.
Data presented reflect past performance. Past performance is no guarantee of future results. Current performance may be higher or lower than the performance shown. Investment return and principal value will fluctuate, and redemption value may be more or less than original cost. To obtain performance data current to the most recent month end, please call 1-800-345-2021 or visit americancentury.com. International investing involves special risks, such as political instability and currency fluctuations. Investing in emerging markets may accentuate these risks.
Data assumes reinvestment of dividends and capital gains, and none of the charts reflect the deduction of taxes that a shareholder would pay on fund distributions or the redemption of fund shares. Returns for the indices are provided for comparison. The fund’s total returns include operating expenses (such as transaction costs and management fees) that reduce returns, while the total returns of the indices do not.
6
| Portfolio Commentary |
NT International Growth
Portfolio Managers: Alex Tedder and Raj Gandhi
Performance Summary
The NT International Growth portfolio advanced 39.09% for the 12 months ended November 30, 2009, outperforming its benchmark, the MSCI EAFE Index, which gained 37.72%.
Despite the severe global recession, credit-market meltdown, and financial-sector crisis, international stocks finished the 12-month period with sharp gains. Initially, stocks plunged, as rising unemployment, shrinking industrial output, and negative economic growth rates sent investor confidence tumbling. By mid-March, however, market sentiment and stock performance reversed course quickly, as massive stimulus efforts from global central banks and governments generated optimism among investors.
On an absolute basis, all sectors and nearly every country represented in the portfolio and benchmark posted positive returns for the 12-month period. Stock selection, primarily in the information technology and financial sectors, accounted for the portfolio’s outperformance relative to the benchmark.
Japan, South Korea Were Top Countries
From a regional perspective, the portfolio’s holdings in Japan contributed the most to relative performance, due to favorable stock selection combined with an underweight position. South Korea, a non-benchmark country, also contributed strongly to portfolio results, as the country’s economy benefited from low interest rates and government stimulus efforts. In particular, Hyundai Motor Co. was among the portfolio’s leading contributors, as the “cash for clunkers” incentive program in the U.S. boosted sales for the automaker.
At the opposite end of the spectrum, an underweight position in Australia and poor stock selection in Germany hurt the portfolio’s performance.
Technology, Utilities Drove Sector Results
Information technology was the portfolio’s top-performing sector, with stock selection driving the solid results. Our stock selection was particularly effective in the communications equipment segment, where Canadian-based Research In Motion (RIM) was the top-contributing stock. The portfolio’s out-of-benchmark position in RIM, the developer of the BlackBerry wireless device, was among the leading contributors for the period. Sales of the company’s touch-screen Storm device, RIM’s answer to Apple’s iPhone, gained traction after RIM resolved several software issues that emerged after the product’s initial launch.
7
NT International Growth
An underweight position in the utilities sector also contributed strongly to relative performance. In addition, the portfolio’s energy sector was strong, while the consumer discretionary sector, the second-largest weighting in the fund, contributed positively. In addition to the positive contribution from Hyundai Motor Co., an overweight to specialty retailers boosted results. In the challenging economic environment, consumers “traded down” for value. Portfolio holdings such as the U.K.’s Kingfisher (home improvement) and Japan’s FAST RETAILING (lower-priced clothing) and Nitori (the “Japanese IKEA”) benefited from these consumer spending trends.
Industrials, Materials Sectors Lagged
The industrials sector represented the portfolio’s largest performance detractor, primarily due to an underweight to the sector and ineffective stock selection. Our underweight in industrial conglomerates combined with an overweight in the machinery industry accounted for the bulk of the sector’s underperformance. Our overweight position in Central Japan Railway was the sector’s largest laggard, and it was among the weakest holdings in the portfolio.
The portfolio’s materials sector also hurt performance, due to an underweight in the metals and mining industry. Australia’s Rio Tinto Limited, a mining company, was among the portfolio’s largest detractors.
Outlook
Signs of improvement in corporate earnings have surfaced globally. While most of the improvements have come from cost cutting and restructuring, we remain encouraged and believe any revenue growth may immediately affect the bottom line. Nevertheless, the upcoming corporate earnings reporting season should provide more clarity on the sustainability of recent improvements. NT International Growth continues to primarily invest in companies located in developed countries around the world (excluding the United States).
8
| NT International Growth | ||
| Top Ten Holdings as of November 30, 2009 | ||
| % of net assets | % of net assets | |
| as of 11/30/09 | as of 5/31/09 | |
| HSBC Holdings plc (Hong Kong) | 2.0% | 1.4% |
| BHP Billiton Ltd. | 2.0% | 1.6% |
| Vale SA Preference Shares | 1.9% | 1.4% |
| Banco Santander SA | 1.9% | 1.9% |
| BG Group plc | 1.7% | 1.9% |
| Roche Holding AG | 1.7% | 1.3% |
| Saipem SpA | 1.6% | 1.7% |
| Telefonica SA | 1.6% | 1.0% |
| BNP Paribas | 1.6% | 1.2% |
| Novartis AG | 1.6% | 1.2% |
| Types of Investments in Portfolio | ||
| % of net assets | % of net assets | |
| as of 11/30/09 | as of 5/31/09 | |
| Foreign Common Stocks | 98.6% | 98.7% |
| Temporary Cash Investments | 1.0% | 0.9% |
| Other Assets and Liabilities | 0.4% | 0.4% |
| Investments by Country as of November 30, 2009 | ||
| % of net assets | % of net assets | |
| as of 11/30/09 | as of 5/31/09 | |
| United Kingdom | 17.8% | 17.2% |
| Japan | 15.1% | 13.8% |
| Switzerland | 8.0% | 10.0% |
| France | 6.6% | 6.0% |
| Germany | 5.9% | 6.5% |
| Australia | 4.3% | 4.4% |
| Brazil | 4.1% | 2.6% |
| People’s Republic of China | 3.8% | 3.0% |
| Spain | 3.5% | 3.3% |
| Sweden | 3.3% | 0.6% |
| Netherlands | 3.2% | 2.1% |
| South Korea | 2.8% | 2.9% |
| Other Countries | 20.2% | 26.3% |
| Cash and Equivalents* | 1.4% | 1.3% |
| *Includes temporary cash investments and other assets and liabilities. | ||
9
| Performance |
| NT Emerging Markets | ||||
| Total Returns as of November 30, 2009 | ||||
| Average Annual | ||||
| Returns | ||||
| Since | Inception | |||
| 1 year | Inception | Date | ||
| Institutional Class | 73.87% | 2.33% | 5/12/06 | |
| MSCI EM Growth Index(1) | 83.97% | 7.16%(2) | — | |
| MSCI EM Index | 85.12% | 5.42% | — | |
| (1) | In April of 2009, the fund’s benchmark changed from the MSCI EM Index to the MSCI EM Growth Index. The fund’s investment advisor believes | |||
| this index better represents the fund’s portfolio composition. | ||||
| (2) | Since 5/31/06, the date nearest the fund’s inception for which data are available. | |||
Data presented reflect past performance. Past performance is no guarantee of future results. Current performance may be higher or lower than the performance shown. Investment return and principal value will fluctuate, and redemption value may be more or less than original cost. To obtain performance data current to the most recent month end, please call 1-800-345-2021 or visit americancentury.com. International investing involves special risks, such as political instability and currency fluctuations. Investing in emerging markets may accentuate these risks.
Data assumes reinvestment of dividends and capital gains, and none of the charts reflect the deduction of taxes that a shareholder would pay on fund distributions or the redemption of fund shares. Returns for the indices are provided for comparison. The fund’s total returns include operating expenses (such as transaction costs and management fees) that reduce returns, while the total returns of the indices do not.
10
NT Emerging Markets
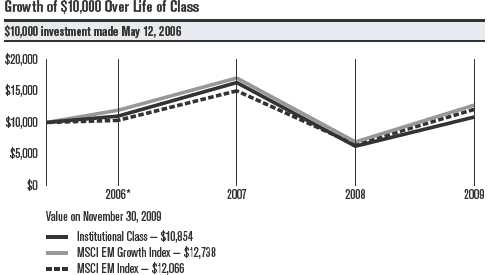
| One-Year Returns Over Life of Class | |||||
| Periods ended November 30 | |||||
| 2006* | 2007 | 2008 | 2009 | ||
| Institutional Class | 10.10% | 48.22% | -61.75% | 73.87% | |
| MSCI EM Growth Index | 19.34% | 42.79% | -59.37% | 83.97% | |
| MSCI EM Index | 3.37% | 45.15% | -56.56% | 85.12% | |
| *From 5/12/06, the Institutional Class’s inception date. MSCI EM Growth Index data from 5/31/06, the date nearest the fund’s inception for which | |||||
| data are available. Not annualized. | |||||
| Total Annual Fund Operating Expenses | |||||
| Institutional Class | 1.67% | ||||
The total annual fund operating expenses shown is as stated in the fund’s prospectus current as of the date of this report. The prospectus may vary from the expense ratio shown elsewhere in this report because it is based on a different time period, includes acquired fund fees and expenses, and, if applicable, does not include fee waivers or expense reimbursements.
Data presented reflect past performance. Past performance is no guarantee of future results. Current performance may be higher or lower than the performance shown. Investment return and principal value will fluctuate, and redemption value may be more or less than original cost. To obtain performance data current to the most recent month end, please call 1-800-345-2021 or visit americancentury.com. International investing involves special risks, such as political instability and currency fluctuations. Investing in emerging markets may accentuate these risks.
Data assumes reinvestment of dividends and capital gains, and none of the charts reflect the deduction of taxes that a shareholder would pay on fund distributions or the redemption of fund shares. Returns for the indices are provided for comparison. The fund’s total returns include operating expenses (such as transaction costs and management fees) that reduce returns, while the total returns of the indices do not.
11
| Portfolio Commentary |
NT Emerging Markets
Portfolio Manager: Patricia Ribeiro
Performance Summary
The NT Emerging Markets portfolio advanced 73.87% for the 12 months ended November 30, 2009, underperforming its benchmark, the MSCI EM Growth Index,* which gained 83.97%.
Emerging markets stocks surged in 2009, as investors seeking to recoup the losses of 2008 sought higher-yielding assets with fewer links to battered developed economies negatively influenced by the global economic crisis and subprime market debacle. While the fallout in global markets left few economies unscathed, sound macroeconomic fundamentals and stimulus measures helped emerging market countries cope better than other nations. Moreover, most emerging markets were shielded from the problems of the developed world due to years of conservative fiscal policy, higher savings rates, employment growth, and increases in business and infrastructure investment. Unlike consumers in the U.S. and other developed countries, consumers in emerging economies did not take on huge amounts of debt, and financial institutions avoided toxic assets such as subprime mortgages.
The portfolio’s underperformance relative to the benchmark primarily was due to sector allocations and the impact of currency exchange rates. Overall, our stock selection was a positive contributor, but it was not sufficient to offset the negative impact of our sector allocations and currency factors.
Israel Led Detractors; Mexico Led Contributors
From a regional perspective, the portfolio’s largest detractors to performance included Israel, Brazil, and India. Stock selection hurt in Israel and India, while currency factors were a negative influence in Brazil. On the positive side, Turkey, Mexico, and Russia represented the portfolio’s leading country contributors, primarily due to positive stock selection.
All Sectors Showed Strong Returns
On an absolute basis, all of the portfolio’s 10 sectors posted strong gains for the 12-month period, with returns in the utilities and materials sectors reaching 100%. Relative to the benchmark, the portfolio’s information technology, energy, and materials sectors detracted from results, while its telecommunication services, utilities, and industrials sectors contributed positively to relative performance.
Our poor relative performance in the information technology sector was primarily due to portfolio-only holding Rolta India, the fund’s leading detractor for the period. Stock in the India-based geospatial mapping systems company plummeted in the wake of a financial scandal involving Indian technology outsourcing company Satyam. Subsequent rumors implicated Rolta, which denied any wrongdoing.
*In April 2009, the fund’s benchmark changed from the MSCI EM Index to the MSCI EM Growth Index. The fund’s investment advisor believes this index better represents the fund’s portfolio composition.
12
NT Emerging Markets
In the energy sector, our stock selection and overweight position generally were favorable, but currency exchange rates detracted from results. In the materials sector, our strategies in the chemicals and metals and mining industries accounted for the bulk of the lagging results. In particular, our underweight position in Brazilian iron ore miner Vale SA detracted from performance.
The portfolio’s outperformance in the telecommunication services sector was largely due to stock selection and our underweight position in the wireless industry. Specifically, Mexico’s America Movil SAB, a wireless telecom services provider doing business in Mexico and Latin America, was a leading contributor. Stock selection drove the strong overall performance in the portfolio’s utilities sector. In particular, the portfolio benefited from our overweight position in India’s state-owned Power Grid Corp. In the industrials sector, our overweight position in China High Speed Transmission Equipment Group, a manufacturer of gear boxes for wind turbines, drove results. With an absolute total return of nearly 200%, the stock finished the 12-month period as the leading contributor to the portfolio’s performance.
Outlook
Emerging markets have been able to withstand the greatest economic crisis since the Great Depression, primarily because they have managed their economies well throughout the past several years. While challenges remain, we expect emerging markets may continue to offer above-average earnings growth in the short and long term. We believe the global economy should start growing again in 2010, and the emerging markets may accelerate at a much faster rate than the U.S. and Europe, due in part to continued frugality among Western consumers.
13
| NT Emerging Markets | ||
| Top Ten Holdings as of November 30, 2009 | ||
| % of net assets | % of net assets | |
| as of 11/30/09 | as of 5/31/09 | |
| Samsung Electronics Co. Ltd. | 5.0% | 3.5% |
| Vale SA Preference Shares | 4.8% | 4.2% |
| Petroleo Brasileiro SA — Petrobras ADR | 3.6% | 4.9% |
| Itau Unibanco Holding SA Preference Shares | 3.0% | 2.0% |
| Hon Hai Precision Industry Co. Ltd. | 2.6% | 2.2% |
| Taiwan Semiconductor Manufacturing Co. Ltd. | 2.6% | 2.4% |
| China Life Insurance Co. Ltd. H Shares | 2.3% | 1.8% |
| Sberbank of Russian Federation | 2.3% | 1.2% |
| Infosys Technologies Ltd. | 2.2% | 0.8% |
| America Movil SAB de CV, Series L ADR | 2.2% | 2.2% |
| Types of Investments in Portfolio | ||
| % of net assets | % of net assets | |
| as of 11/30/09 | as of 5/31/09 | |
| Foreign Common Stocks | 92.3% | 98.3% |
| Temporary Cash Investments | 3.8% | 0.7% |
| Other Assets and Liabilities | 3.9% | 1.0% |
| Investments by Country as of November 30, 2009 | ||
| % of net assets | % of net assets | |
| as of 11/30/09 | as of 5/31/09 | |
| Brazil | 15.5% | 16.7% |
| People’s Republic of China | 13.2% | 13.7% |
| South Korea | 12.2% | 11.7% |
| Russian Federation | 9.1% | 6.7% |
| Taiwan (Republic of China) | 8.0% | 14.2% |
| India | 7.4% | 8.5% |
| Hong Kong | 5.5% | 5.2% |
| South Africa | 5.0% | 6.7% |
| Mexico | 3.9% | 2.8% |
| Indonesia | 3.0% | 2.3% |
| Turkey | 2.3% | 1.8% |
| Other Countries | 7.2% | 8.0% |
| Cash and Equivalents* | 7.7% | 1.7% |
| *Includes temporary cash investments and other assets and liabilities. | ||
14
| Shareholder Fee Examples (Unaudited) |
Fund shareholders may incur two types of costs: (1) transaction costs, including sales charges (loads) on purchase payments and redemption/ exchange fees; and (2) ongoing costs, including management fees; distribution and service (12b-1) fees; and other fund expenses. This example is intended to help you understand your ongoing costs (in dollars) of investing in your fund and to compare these costs with the ongoing cost of investing in other mutual funds.
The example is based on an investment of $1,000 made at the beginning of the period and held for the entire period from June 1, 2009 to November 30, 2009.
Actual Expenses
The table provides information about actual account values and actual expenses for each class. You may use the information, together with the amount you invested, to estimate the expenses that you paid over the period. First, identify the share class you own. Then simply divide your account value by $1,000 (for example, an $8,600 account value divided by $1,000 = 8.6), then multiply the result by the number under the heading “Expenses Paid During Period” to estimate the expenses you paid on your account during this period.
If you hold Investor Class shares of any American Century Investments fund, or Institutional Class shares of the American Century Diversified Bond Fund, in an American Century Investments account (i.e., not a financial intermediary or retirement plan account), American Century Investments may charge you a $12.50 semiannual account maintenance fee if the value of those shares is less than $10,000. We will redeem shares automatically in one of your accounts to pay the $12.50 fee. In determining your total eligible investment amount, we will include your investments in all personal accounts (including American Century Investments Brokerage accounts) registered under your Social Security number. Personal accounts include individual accounts, joint accounts, UGMA/UTMA accounts, personal trusts, Coverdell Education Savings Accounts and IRAs (including traditional, Roth, Rollover, SEP-, SARSEP- and SIMPLE-IRAs), and certain other retirement accounts. If you have only business, business retirement, employer-sponsored or American Century Investments Brokerage accounts, you are currently not subject to this fee. We will not charge the fee as long as you choose to manage your accounts exclusively online. If you are subject to the Account Maintenance Fee, your account value could be reduced by the fee amount.
Hypothetical Example for Comparison Purposes
The table also provides information about hypothetical account values and hypothetical expenses based on the actual expense ratio of each class of your fund and an assumed rate of return of 5% per year before expenses, which is not the actual return of a fund’s share class. The hypothetical account values and expenses may not be used to estimate the actual ending account balance or expenses you paid for the period. You may use this information to compare the ongoing costs of investing in your fund and other funds. To do so, compare this 5% hypothetical example with the 5% hypothetical examples that appear in the shareholder reports of the other funds.
15
Please note that the expenses shown in the table are meant to highlight your ongoing costs only and do not reflect any transactional costs, such as sales charges (loads) or redemption/exchange fees. Therefore, the table is useful in comparing ongoing costs only, and will not help you determine the relative total costs of owning different funds. In addition, if these transactional costs were included, your costs would have been higher.
| Beginning | Ending | Expenses Paid | ||
| Account Value | Account Value | During Period* | Annualized | |
| 6/1/09 | 11/30/09 | 6/1/09 - 11/30/09 | Expense Ratio* | |
| NT International Growth | ||||
| Actual | $1,000 | $1,197.50 | $6.39 | 1.16% |
| Hypothetical | $1,000 | $1,019.25 | $5.87 | 1.16% |
| NT Emerging Markets | ||||
| Actual | $1,000 | $1,258.50 | $8.78 | 1.55% |
| Hypothetical | $1,000 | $1,017.30 | $7.84 | 1.55% |
| *Expenses are equal to the class’s annualized expense ratio listed in the table above, multiplied by the average account value over the period, | ||||
| multiplied by 183, the number of days in the most recent fiscal half-year, divided by 365, to reflect the one-half year period. | ||||
16
| Schedule of Investments |
| NT International Growth | ||||||
| NOVEMBER 30, 2009 | ||||||
| Shares | Value | Shares | Value | |||
| Common Stocks — 98.6% | LVMH Moet Hennessy Louis | |||||
| Vuitton SA | 10,100 | $ 1,051,890 | ||||
| AUSTRALIA — 4.3% | Pernod-Ricard SA | 11,658 | 994,113 | |||
| BHP Billiton Ltd. | 87,331 | $ 3,303,441 | Publicis Groupe SA | 20,800 | 800,795 | |
| Commonwealth Bank of | Societe Television | |||||
| Australia | 32,500 | 1,571,684 | Francaise 1 | 27,845 | 495,874 | |
| QBE Insurance Group Ltd. | 20,400 | 415,540 | Total SA | 28,024 | 1,734,093 | |
| Wesfarmers Ltd. | 61,860 | 1,687,263 | 10,735,577 | |||
| 6,977,928 | GERMANY — 5.9% | |||||
| BELGIUM — 1.0% | Allianz SE | 14,300 | 1,756,853 | |||
| Anheuser-Busch InBev NV | 22,708 | 1,133,391 | BASF SE | 24,400 | 1,471,375 | |
| KBC Groep NV(1) | 11,600 | 516,269 | ||||
| Bayer AG | 14,600 | 1,117,835 | ||||
| 1,649,660 | Daimler AG | 24,500 | 1,240,490 | |||
| BERMUDA — 0.8% | Deutsche Boerse AG | 4,540 | 378,277 | |||
| Seadrill Ltd. | 53,800 | 1,243,733 | E.ON AG | 7,900 | 312,451 | |
| BRAZIL — 4.1% | Fresenius Medical Care | |||||
| Banco Santander | AG & Co. KGaA | 16,470 | 875,708 | |||
| Brasil SA ADR(1) | 30,600 | 417,690 | ||||
| HeidelbergCement AG | 17,240 | 1,144,193 | ||||
| Companhia Brasileira de | Metro AG | 8,800 | 552,991 | |||
| Meios de Pagamento | 82,151 | 769,800 | ||||
| Muenchener | ||||||
| Itau Unibanco Holding SA | Rueckversicherungs- | |||||
| Preference Shares | 55,600 | 1,201,948 | Gesellschaft AG | 5,200 | 815,396 | |
| Petroleo Brasileiro | 9,665,569 | |||||
| SA-Petrobras ADR | 24,400 | 1,251,232 | ||||
| Vale SA Preference Shares | 129,800 | 3,132,798 | GREECE — 1.2% | |||
| National Bank | ||||||
| 6,773,468 | of Greece SA(1) | 66,790 | 1,965,655 | |||
| CANADA — 1.2% | HONG KONG — 1.0% | |||||
| Canadian National | Li & Fung Ltd. | 356,000 | 1,433,178 | |||
| Railway Co. | 18,300 | 958,868 | ||||
| Melco Crown Entertainment | ||||||
| EnCana Corp. | 12,176 | 656,043 | Ltd. ADR(1) | 38,905 | 164,568 | |
| Research In Motion Ltd.(1) | 5,400 | 312,606 | 1,597,746 | |||
| 1,927,517 | INDIA — 1.3% | |||||
| CZECH REPUBLIC — 0.5% | Bharat Heavy Electricals Ltd. | 5,000 | 241,186 | |||
| CEZ AS | 16,700 | 835,591 | Housing Development | |||
| DENMARK — 1.8% | Finance Corp. Ltd. | 9,567 | 569,053 | |||
| Novo Nordisk A/S B Shares | 28,000 | 1,878,474 | Infosys Technologies Ltd. | 8,600 | 439,910 | |
| Vestas Wind Systems A/S(1) | 14,400 | 1,011,108 | Infrastructure Development | |||
| 2,889,582 | Finance Co. Ltd. | 47,000 | 167,630 | |||
| FRANCE — 6.6% | Larsen & Toubro Ltd. | 22,600 | 784,477 | |||
| BNP Paribas | 31,770 | 2,623,733 | 2,202,256 | |||
| Cie Generale des | INDONESIA — 0.1% | |||||
| Etablissements Michelin, | PT Bank Rakyat Indonesia | 306,500 | 239,884 | |||
| Class B | 8,800 | 667,289 | IRELAND — 1.5% | |||
| Danone SA | 10,722 | 640,926 | CRH plc | 43,759 | 1,102,552 | |
| GDF Suez | 14,400 | 601,317 | Experian plc | 52,100 | 491,117 | |
| Lafarge SA | 6,090 | 500,475 | Ryanair Holdings plc ADR(1) | 33,319 | 873,291 | |
| Legrand SA | 22,754 | 625,072 | 2,466,960 | |||
17
| NT International Growth | ||||||
| Shares | Value | Shares | Value | |||
| ITALY — 2.7% | MULTI-NATIONAL — 1.9% | |||||
| ENI SpA | 32,311 | $ 800,524 | iShares MSCI EAFE Growth | |||
| Luxottica Group SpA | 11,800 | 293,769 | Index Fund | 5,700 | $ 312,816 | |
| Saipem SpA | 82,462 | 2,652,242 | iShares MSCI EAFE | |||
| UniCredit SpA(1) | 188,900 | 645,287 | Index Fund | 24,100 | 1,335,622 | |
| iShares MSCI Emerging | ||||||
| 4,391,822 | Markets Index Fund | 34,200 | 1,385,784 | |||
| JAPAN — 15.1% | 3,034,222 | |||||
| Asahi Glass Co. Ltd. | 74,000 | 646,344 | NETHERLANDS — 3.2% | |||
| Canon, Inc. | 8,500 | 327,453 | Akzo Nobel NV | 11,100 | 703,856 | |
| FAST RETAILING CO. LTD. | 7,900 | 1,433,040 | ASML Holding NV | 48,000 | 1,474,642 | |
| Hitachi Construction | Koninklijke KPN NV | 39,100 | 693,959 | |||
| Machinery Co. Ltd. | 62,100 | 1,451,203 | ||||
| TNT NV | 49,800 | 1,444,695 | ||||
| Honda Motor Co. Ltd. | 77,200 | 2,411,384 | ||||
| Unilever NV CVA | 30,300 | 928,366 | ||||
| HOYA Corp. | 60,000 | 1,530,542 | ||||
| 5,245,518 | ||||||
| Ibiden Co., Ltd. | 28,900 | 976,261 | ||||
| NORWAY — 0.4% | ||||||
| iShares MSCI Japan | ||||||
| Index Fund | 40,100 | 382,955 | Yara International ASA | 13,300 | 570,171 | |
| JGC Corp. | 41,000 | 766,971 | PEOPLE’S REPUBLIC OF CHINA — 3.8% | |||
| Kubota Corp. | 30,000 | 264,114 | Baidu, Inc. ADR(1) | 1,500 | 650,610 | |
| Mitsubishi Corp. | 88,000 | 1,985,192 | Ctrip.com International | |||
| Ltd. ADR(1) | 16,882 | 1,238,295 | ||||
| Mitsubishi UFJ Financial | ||||||
| Group, Inc. | 174,000 | 970,245 | Industrial & Commercial | |||
| Nidec Corp. | 20,900 | 1,835,157 | Bank of China Ltd. H Shares | 1,599,000 | 1,351,404 | |
| Mindray Medical | ||||||
| Nitori Co. Ltd. | 18,550 | 1,553,702 | International Ltd. ADR | 16,900 | 511,732 | |
| Nomura ETF - Nikkei 225 | 10,800 | 1,176,955 | Sino-Ocean Land | |||
| ORIX Corp. | 27,600 | 1,909,394 | Holdings Ltd. | 391,500 | 390,487 | |
| Rakuten, Inc. | 2,300 | 1,857,242 | Tencent Holdings Ltd. | 74,600 | 1,379,369 | |
| Sharp Corp. | 26,000 | 297,177 | ZTE Corp. H Shares | 116,600 | 660,478 | |
| SOFTBANK CORP. | 51,400 | 1,230,889 | 6,182,375 | |||
| Toshiba Corp.(1) | 167,000 | 884,845 | POLAND — 1.0% | |||
| Unicharm Corp. | 7,900 | 806,085 | Powszechna Kasa | |||
| 24,697,150 | Oszczednosci Bank Polski SA | 119,300 | 1,619,554 | |||
| LUXEMBOURG — 0.6% | RUSSIAN FEDERATION — 0.4% | |||||
| Millicom International | Mechel ADR | 12,100 | 235,345 | |||
| Cellular SA(1) | 10,806 | 808,289 | Vimpel-Communications ADR | 24,400 | 465,796 | |
| SES SA Fiduciary | 701,141 | |||||
| Depositary Receipt | 11,100 | 236,091 | SINGAPORE — 0.3% | |||
| 1,044,380 | United Overseas Bank Ltd. | 40,000 | 544,509 | |||
| MEXICO — 0.2% | SOUTH KOREA — 2.8% | |||||
| Grupo Financiero Banorte | Hyundai Motor Co. | 16,895 | 1,438,429 | |||
| SAB de CV, Series O | 105,900 | 364,431 | ||||
| POSCO | 3,300 | 1,583,591 | ||||
| Samsung Electronics | ||||||
| Co. Ltd. | 2,600 | 1,609,907 | ||||
| 4,631,927 | ||||||
18
| NT International Growth | ||||||
| Shares | Value | Shares | Value | |||
| SPAIN — 3.5% | British Sky Broadcasting | |||||
| Banco Santander SA | 178,358 | $ 3,055,751 | Group plc | 68,900 | $ 600,174 | |
| Telefonica SA | 91,900 | 2,638,416 | Capita Group plc (The) | 53,463 | 626,218 | |
| 5,694,167 | Carnival plc(1) | 33,200 | 1,113,101 | |||
| SWEDEN — 3.3% | Compass Group plc | 137,100 | 971,640 | |||
| Atlas Copco AB A Shares | 127,800 | 1,811,167 | GlaxoSmithKline plc | 45,372 | 938,243 | |
| Autoliv, Inc. | 8,400 | 341,124 | HSBC Holdings plc | |||
| Electrolux AB B Shares(1) | 38,500 | 942,129 | (Hong Kong) | 285,778 | 3,344,503 | |
| Intercontinental Hotels | ||||||
| Getinge AB B Shares | 20,600 | 418,705 | Group plc | 56,800 | 786,312 | |
| H & M Hennes & Mauritz AB | Kingfisher plc | 281,132 | 1,097,027 | |||
| B Shares | 13,500 | 798,395 | ||||
| Volvo AB B Shares | 116,300 | 1,105,188 | Man Group plc | 102,393 | 536,334 | |
| 5,416,708 | Next plc | 30,200 | 981,717 | |||
| SWITZERLAND — 8.0% | Reckitt Benckiser Group plc | 28,008 | 1,428,355 | |||
| Rolls-Royce Group plc(1) | 112,700 | 879,736 | ||||
| Adecco SA | 14,600 | 728,219 | ||||
| Credit Suisse Group AG | 35,900 | 1,858,530 | Rolls-Royce Group plc | |||
| C Shares(1) | 5,592,000 | 9,199 | ||||
| Julius Baer Group Ltd. | 20,700 | 683,165 | Smiths Group plc | 42,600 | 668,575 | |
| Nestle SA | 53,500 | 2,528,926 | Standard Chartered plc | 15,438 | 376,892 | |
| Novartis AG | 46,765 | 2,595,598 | Tesco plc | 289,253 | 2,012,846 | |
| Roche Holding AG | 16,566 | 2,709,736 | Tullow Oil plc | 40,800 | 828,262 | |
| Sonova Holding AG | 4,900 | 581,980 | Vodafone Group plc | 366,000 | 825,488 | |
| Syngenta AG | 5,107 | 1,353,969 | 29,031,535 | |||
| 13,040,123 | TOTAL COMMON STOCKS | |||||
| TAIWAN (REPUBLIC OF CHINA) — 1.4% | (Cost $128,735,099) | 161,160,958 | ||||
| Hon Hai Precision | ||||||
| Industry Co. Ltd. | 270,000 | 1,141,117 | Temporary Cash Investments — 1.0% | |||
| Taiwan Semiconductor | JPMorgan U.S. Treasury | |||||
| Manufacturing Co. Ltd. ADR | 54,449 | 565,725 | Plus Money Market Fund | |||
| Wistron Corp. | 347,535 | 638,283 | Agency Shares | 78,477 | 78,477 | |
| 2,345,125 | Repurchase Agreement, Bank of America | |||||
| Securities, LLC, (collateralized by various | ||||||
| TURKEY — 0.9% | U.S. Treasury obligations, 4.125%-4.50%, | |||||
| Turkiye Garanti Bankasi AS | 419,000 | 1,434,974 | 5/15/15-11/15/15, valued at $1,633,379), | |||
| UNITED KINGDOM — 17.8% | in a joint trading account at 0.12%, | |||||
| Admiral Group plc | 64,176 | 1,120,161 | dated 11/30/09, due 12/1/09 | |||
| (Delivery value $1,600,005) | 1,600,000 | |||||
| Antofagasta plc | 86,500 | 1,281,422 | TOTAL TEMPORARY | |||
| ARM Holdings plc | 190,800 | 485,580 | CASH INVESTMENTS | |||
| AstraZeneca plc | 20,200 | 902,887 | (Cost $1,678,477) | 1,678,477 | ||
| Autonomy Corp. plc(1) | 17,183 | 402,815 | TOTAL INVESTMENT | |||
| Barclays plc | 451,035 | 2,169,230 | SECURITIES — 99.6% | |||
| BG Group plc | 155,731 | 2,825,810 | (Cost $130,413,576) | 162,839,435 | ||
| OTHER ASSETS | ||||||
| BP plc | 130,300 | 1,231,693 | AND LIABILITIES — 0.4% | 636,854 | ||
| British Airways plc(1) | 182,800 | 587,315 | TOTAL NET ASSETS — 100.0% | $163,476,289 | ||
19
| NT International Growth | |||
| Market Sector Diversification | Notes to Schedule of Investments | ||
| (as a % of net assets) | ADR = American Depositary Receipt | ||
| Financials | 21.4% | CVA = Certificaten Van Aandelen | |
| Consumer Discretionary | 14.8% | EAFE = Europe, Australasia, and Far East | |
| Industrials | 11.0% | ETF = Exchange Traded Fund | |
| Materials | 10.0% | MSCI = Morgan Stanley Capital International | |
| Information Technology | 9.8% | (1) Non-income producing. | |
| Energy | 8.1% | ||
| Consumer Staples | 7.8% | Geographic classifications and market sector diversification | |
| Health Care | 7.7% | are unaudited. | |
| Telecommunication Services | 4.1% | ||
| Diversified | 2.8% | ||
| Utilities | 1.1% | See Notes to Financial Statements. | |
| Cash and Equivalents* | 1.4% | ||
| *Includes temporary cash investments and other assets and liabilities. | |||
20
| NT Emerging Markets | ||||||
| NOVEMBER 30, 2009 | ||||||
| Shares | Value | Shares | Value | |||
| Common Stocks — 92.3% | Maruti Suzuki India Ltd. | 13,322 | $ 446,029 | |||
| BRAZIL — 15.5% | Reliance Industries Ltd. | 15,634 | 357,449 | |||
| Cia Brasileira de Distribuicao | Sterlite Industries India Ltd. | 7,546 | 139,094 | |||
| Grupo Pao de Acucar | Sterlite Industries India | |||||
| Preference Shares | 13,700 | $ 431,564 | Ltd. ADR | 7,856 | 144,236 | |
| Fibria Celulose SA(1) | 22,441 | 383,625 | 4,437,882 | |||
| Gerdau SA | INDONESIA — 3.0% | |||||
| Preference Shares | 25,700 | 396,736 | PT Astra International Tbk | 119,500 | 408,865 | |
| Itau Unibanco Holding SA | PT Bank Rakyat Indonesia | 573,000 | 448,461 | |||
| Preference Shares | 82,859 | 1,791,227 | PT Perusahaan Gas Negara | 1,653,000 | 638,123 | |
| MRV Engenharia e | PT Semen Gresik | |||||
| Participacoes SA | 12,200 | 264,432 | Persero Tbk | 419,000 | 323,501 | |
| Natura Cosmeticos SA | 15,100 | 288,581 | 1,818,950 | |||
| PDG Realty SA | ISRAEL — 0.6% | |||||
| Empreendimentos | ||||||
| e Participacoes | 33,500 | 343,492 | Teva Pharmaceutical | |||
| Industries Ltd. ADR | 7,183 | 379,191 | ||||
| Petroleo Brasileiro SA — | MALAYSIA — 1.1% | |||||
| Petrobras ADR | 42,035 | 2,155,555 | ||||
| Vale SA Preference Shares | 119,100 | 2,874,547 | CIMB Group Holdings Bhd | 173,600 | 646,810 | |
| Vivo Particpacoes SA ADR | 14,442 | 440,481 | MEXICO — 3.9% | |||
| 9,370,240 | America Movil SAB de CV, | |||||
| Series L ADR | 26,948 | 1,303,744 | ||||
| HONG KONG — 5.5% | Cemex SAB de CV ADR(1) | 16,856 | 190,304 | |||
| China Merchants Holdings | ||||||
| International Co. Ltd. | 64,000 | 199,018 | Grupo Financiero Banorte | |||
| SAB de CV, Series O | 80,920 | 278,468 | ||||
| China Mobile Ltd. ADR | 16,319 | 764,871 | Wal-Mart de Mexico | |||
| China Overseas Land & | SAB de CV | 143,379 | 589,760 | |||
| Investment Ltd. | 152,000 | 326,749 | 2,362,276 | |||
| China Resources Land Ltd. | 156,000 | 361,918 | PEOPLE’S REPUBLIC OF CHINA — 13.2% | |||
| CNOOC Ltd. | 407,000 | 627,038 | Bank of China Ltd. H Shares | 469,000 | 264,454 | |
| Fushan International Energy | ||||||
| Group Ltd. | 660,000 | 612,306 | BYD Co. Ltd. H Shares(1) | 18,000 | 157,354 | |
| Shimao Property | China High Speed | |||||
| Holdings Ltd. | 215,000 | 408,359 | Transmission Equipment | |||
| Group Co. Ltd. | 159,000 | 375,443 | ||||
| 3,300,259 | ||||||
| China Life Insurance Co. Ltd. | ||||||
| HUNGARY — 1.0% | H Shares | 283,000 | 1,416,817 | |||
| OTP Bank plc(1) | 21,311 | 635,501 | China National Building | |||
| INDIA — 7.4% | Material Co. Ltd. H Shares | 134,000 | 257,970 | |||
| Aban Offshore Ltd. | 7,809 | 211,975 | China Shenhua Energy Co. | |||
| Ashok Leyland Ltd. | 276,668 | 310,482 | Ltd. H Shares | 200,500 | 980,503 | |
| Bharat Heavy Electricals Ltd. | 6,930 | 334,283 | Ctrip.com International | |||
| Ltd. ADR(1) | 10,707 | 785,358 | ||||
| HDFC Bank Ltd. | 10,055 | 381,805 | ||||
| Industrial & Commercial | ||||||
| ICICI Bank Ltd. | 15,394 | 287,212 | Bank of China Ltd. H Shares | 1,106,000 | 934,742 | |
| Infosys Technologies Ltd. | 25,991 | 1,329,500 | NetEase.com, Inc. ADR(1) | 9,529 | 364,389 | |
| JSW Steel Ltd. | 23,222 | 495,817 | ||||
21
| NT Emerging Markets | ||||||
| Shares | Value | Shares | Value | |||
| Ping An Insurance Group Co. | SOUTH KOREA — 12.2% | |||||
| of China Ltd. H Shares | 42,500 | $ 396,481 | Hankook Tire Co. Ltd. | 26,320 | $ 522,869 | |
| Sino-Ocean Land | Hyundai Mobis | 1,987 | 254,612 | |||
| Holdings Ltd. | 221,000 | 220,428 | Hyundai Motor Co. | 4,714 | 401,347 | |
| Sinopharm Group Co. | ||||||
| H Shares(1) | 98,400 | 346,620 | LG Chem Ltd. | 1,656 | 298,359 | |
| Tencent Holdings Ltd. | 63,700 | 1,177,826 | LG Electronics, Inc. | 2,629 | 232,875 | |
| Zhuzhou CSR Times Electric | LG Household & Health | |||||
| Co. Ltd. H Shares | 136,000 | 274,104 | Care Ltd. | 2,109 | 517,819 | |
| 7,952,489 | Lotte Shopping Co. Ltd. | 1,628 | 504,025 | |||
| PERU — 0.5% | POSCO | 1,044 | 500,991 | |||
| Credicorp Ltd. | 4,190 | 299,376 | Samsung Electronics | |||
| Co. Ltd. | 4,858 | 3,008,049 | ||||
| POLAND — 0.7% | Samsung Engineering | |||||
| KGHM Polska Miedz SA | 10,842 | 421,984 | Co. Ltd. | 5,397 | 503,590 | |
| RUSSIAN FEDERATION — 9.1% | Shinhan Financial | |||||
| CTC Media, Inc.(1) | 19,282 | 268,984 | Group Co. Ltd.(1) | 15,990 | 626,371 | |
| OAO Gazprom ADR | 39,390 | 894,941 | 7,370,907 | |||
| OAO LUKOIL ADR | 5,409 | 314,263 | TAIWAN (REPUBLIC OF CHINA) — 8.0% | |||
| Polyus Zoloto OAO ADR(1) | 9,066 | 260,194 | Acer, Inc. | 124,000 | 308,661 | |
| Rosneft Oil Co. GDR | 39,772 | 320,165 | Hon Hai Precision | |||
| Sberbank of Russian | Industry Co. Ltd. | 373,557 | 1,578,786 | |||
| Federation | 595,742 | 1,412,504 | MediaTek, Inc. | 30,252 | 476,639 | |
| Vimpel-Communications ADR | 54,849 | 1,047,067 | Richtek Technology Corp. | 35,000 | 327,387 | |
| Wimm-Bill-Dann Foods | Taiwan Semiconductor | |||||
| OJSC ADR(1) | 28,487 | 566,891 | Manufacturing Co. Ltd. | 811,774 | 1,541,359 | |
| X5 Retail Group NV GDR(1) | 13,487 | 391,123 | Wistron Corp. | 168,594 | 309,640 | |
| 5,476,132 | Young Fast | |||||
| SINGAPORE — 0.6% | Optoelectronics Co. Ltd. | 26,000 | 308,649 | |||
| Wilmar International Ltd. | 84,000 | 382,370 | 4,851,121 | |||
| SOUTH AFRICA — 5.0% | THAILAND — 1.9% | |||||
| Aspen Pharmacare | Banpu PCL | 26,500 | 432,035 | |||
| Holdings Ltd.(1) | 60,401 | 554,661 | CP ALL PCL | 822,700 | 514,729 | |
| Foschini Ltd. | 31,105 | 238,591 | Kasikornbank PCL | 68,700 | 179,783 | |
| Gold Fields Ltd. ADR | 15,052 | 222,469 | 1,126,547 | |||
| Impala Platinum | TURKEY — 2.3% | |||||
| Holdings Ltd. | 8,415 | 195,176 | Tofas Turk Otomobil | |||
| Kumba Iron Ore Ltd. | 15,107 | 514,107 | Fabrikasi AS | 153,453 | 411,794 | |
| MTN Group Ltd. | 36,946 | 592,733 | Turk Hava Yollari AO | 96,336 | 307,601 | |
| Naspers Ltd. N Shares | 14,982 | 561,061 | Turkiye Garanti Bankasi AS | 187,804 | 643,184 | |
| Shoprite Holdings Ltd. | 18,113 | 151,557 | 1,362,579 | |||
| 3,030,355 | UNITED KINGDOM — 0.8% | |||||
| Antofagasta plc | 31,881 | 472,289 | ||||
| TOTAL COMMON STOCKS | ||||||
| (Cost $37,550,264) | 55,697,258 | |||||
22
| NT Emerging Markets | |||||
| Shares | Value | Market Sector Diversification | |||
| Temporary Cash Investments — 3.8% | (as a % of net assets) | ||||
| Financials | 19.8% | ||||
| JPMorgan U.S. Treasury | |||||
| Plus Money Market Fund | Information Technology | 18.0% | |||
| Agency Shares | 79,521 | $ 79,521 | Materials | 14.4% | |
| Repurchase Agreement, Bank of America | Energy | 10.4% | |||
| Securities, LLC, (collateralized by various | Consumer Discretionary | 9.4% | |||
| U.S. Treasury obligations, 4.125%-4.50%, | Telecommunication Services | 6.9% | |||
| 5/15/15-11/15/15, valued at $2,245,897), | |||||
| in a joint trading account at 0.12%, | Consumer Staples | 6.4% | |||
| dated 11/30/09, due 12/1/09 | Industrials | 3.8% | |||
| (Delivery value $2,200,007) | 2,200,000 | Health Care | 2.1% | ||
| TOTAL TEMPORARY | Utilities | 1.1% | |||
| CASH INVESTMENTS | Cash and Equivalents* | 7.7% | |||
| (Cost $2,279,521) | 2,279,521 | ||||
| TOTAL INVESTMENT | *Includes temporary cash investments and other assets and liabilities. | ||||
| SECURITIES — 96.1% | |||||
| (Cost $39,829,785) | 57,976,779 | ||||
| OTHER ASSETS | Notes to Schedule of Investments | ||||
| AND LIABILITIES — 3.9% | 2,333,766 | ADR = American Depositary Receipt | |||
| TOTAL NET ASSETS — 100.0% | $60,310,545 | GDR = Global Depositary Receipt | |||
| OJSC = Open Joint Stock Company | |||||
| (1) Non-income producing. | |||||
| Geographic classifications and market sector diversification | |||||
| are unaudited. | |||||
| See Notes to Financial Statements. | |||||
23
| Statement of Assets and Liabilities |
| NOVEMBER 30, 2009 | ||
| NT International | NT Emerging | |
| Growth | Markets | |
| Assets | ||
| Investment securities, at value (cost of $130,413,576 and $39,829,785, respectively) | $162,839,435 | $57,976,779 |
| Foreign currency holdings, at value (cost of $13,339 and $658, respectively) | 13,347 | 661 |
| Receivable for investments sold | 698,842 | 2,390,136 |
| Receivable for capital shares sold | 334,214 | 124,819 |
| Dividends and interest receivable | 365,787 | 49,354 |
| Other assets | 3,739 | 1,224 |
| 164,255,364 | 60,542,973 | |
| Liabilities | ||
| Disbursements in excess of demand deposit cash | 3,398 | — |
| Payable for investments purchased | 574,210 | — |
| Accrued management fees | 152,423 | 74,026 |
| Accrued foreign taxes | 49,044 | 158,402 |
| 779,075 | 232,428 | |
| Net Assets | $163,476,289 | $60,310,545 |
| Institutional Class Capital Shares, $0.01 Par Value | ||
| Authorized | 100,000,000 | 100,000,000 |
| Outstanding | 18,987,155 | 6,803,329 |
| Net Asset Value Per Share | $8.61 | $8.86 |
| Net Assets Consist of: | ||
| Capital (par value and paid-in surplus) | $152,081,620 | $51,718,100 |
| Undistributed net investment income | 2,058,184 | 92,099 |
| Accumulated net realized loss on investment and foreign currency transactions | (23,059,312) | (9,487,294) |
| Net unrealized appreciation on investments and translation of assets | ||
| and liabilities in foreign currencies | 32,395,797 | 17,987,640 |
| $163,476,289 | $60,310,545 | |
| See Notes to Financial Statements. | ||
24
| Statement of Operations |
| YEAR ENDED NOVEMBER 30, 2009 | ||
| NT International | NT Emerging | |
| Growth | Markets | |
| Investment Income (Loss) | ||
| Income: | ||
| Dividends (net of foreign taxes withheld of $275,583 and $71,688, respectively) | $ 3,051,983 | $ 820,581 |
| Interest | 1,795 | 799 |
| 3,053,778 | 821,380 | |
| Expenses: | ||
| Management fees | 1,384,471 | 665,386 |
| Directors’ fees and expenses | 4,123 | 1,487 |
| Other expenses | 830 | 177 |
| 1,389,424 | 667,050 | |
| Net investment income (loss) | 1,664,354 | 154,330 |
| Realized and Unrealized Gain (Loss) | ||
| Net realized gain (loss) on: | ||
| Investment transactions (net of foreign tax expenses | ||
| paid (refunded) of $16,492 and $3,291, respectively) | (10,809,257) | (947,619) |
| Foreign currency transactions | 908,925 | (1,053,954) |
| (9,900,332) | (2,001,573) | |
| Change in net unrealized appreciation (depreciation) on: | ||
| Investments (net of deferred foreign taxes | ||
| of $49,044 and $158,402, respectively) | 36,319,140 | 21,439,893 |
| Translation of assets and liabilities in foreign currencies | 12,917,588 | 4,083,203 |
| 49,236,728 | 25,523,096 | |
| Net realized and unrealized gain (loss) | 39,336,396 | 23,521,523 |
| Net Increase (Decrease) in Net Assets Resulting from Operations | $41,000,750 | $23,675,853 |
| See Notes to Financial Statements. | ||
25
| Statement of Changes in Net Assets |
| YEARS ENDED NOVEMBER 30, 2009 AND NOVEMBER 30, 2008 | ||||
| NT International Growth | NT Emerging Markets | |||
| Increase (Decrease) in Net Assets | 2009 | 2008 | 2009 | 2008 |
| Operations | ||||
| Net investment income (loss) | $ 1,664,354 | $ 1,057,236 | $ 154,330 | $ 281,229 |
| Net realized gain (loss) | (9,900,332) | (12,540,805) | (2,001,573) | (7,576,355) |
| Change in net unrealized appreciation | ||||
| (depreciation) | 49,236,728 | (29,526,599) | 25,523,096 | (14,838,418) |
| Net increase (decrease) in net assets | ||||
| resulting from operations | 41,000,750 | (41,010,168) | 23,675,853 | (22,133,544) |
| Distributions to Shareholders | ||||
| From net investment income | (1,011,101) | (585,193) | (152,834) | (292,689) |
| From net realized gains | — | (1,418,391) | — | (3,880,783) |
| Decrease in net assets from distributions | (1,011,101) | (2,003,584) | (152,834) | (4,173,472) |
| Capital Share Transactions | ||||
| Proceeds from shares sold | 97,265,914 | 47,294,600 | 32,244,736 | 25,420,763 |
| Payments for shares redeemed | (29,638,929) | (16,124,105) | (16,171,865) | (6,777,463) |
| Net increase (decrease) in net assets | ||||
| from capital share transactions | 67,626,985 | 31,170,495 | 16,072,871 | 18,643,300 |
| Net increase (decrease) in net assets | 107,616,634 | (11,843,257) | 39,595,890 | (7,663,716) |
| Net Assets | ||||
| Beginning of period | 55,859,655 | 67,702,912 | 20,714,655 | 28,378,371 |
| End of period | $163,476,289 | $55,859,655 | $60,310,545 | $20,714,655 |
| Undistributed net investment income | $2,058,184 | $1,000,779 | $92,099 | $143,450 |
| Transactions in Shares of the Funds | ||||
| Sold | 14,216,297 | 4,992,480 | 5,177,295 | 2,804,035 |
| Redeemed | (4,111,431) | (1,433,404) | (2,421,624) | (508,834) |
| Net increase (decrease) in shares | ||||
| of the funds | 10,104,866 | 3,559,076 | 2,755,671 | 2,295,201 |
| See Notes to Financial Statements. | ||||
26
| Notes to Financial Statements |
NOVEMBER 30, 2009
1. Organization and Summary of Significant Accounting Policies
Organization — American Century World Mutual Funds, Inc. (the corporation) is registered under the Investment Company Act of 1940 (the 1940 Act) as an open-end management investment company. NT International Growth Fund (NT International Growth) and NT Emerging Markets Fund (NT Emerging Markets) (collectively, the funds) are two funds in a series issued by the corporation. The funds are diversified under the 1940 Act. The funds’ investment objective is to seek capital growth. The funds pursue this objective by investing primarily in equity securities of foreign companies. NT International Growth primarily invests in companies located in at least three developed countries (excluding United States). NT Emerging Markets invests at least 80% of its assets in securities of issuers in emerging market countries. The funds are not permitted t o invest in any securities issued by companies assigned by the Global Industry Classification Standard to the tobacco industry. The following is a summary of the funds’ significant accounting policies.
Security Valuations — Securities traded primarily on a principal securities exchange are valued at the last reported sales price, or at the mean of the latest bid and asked prices where no last sales price is available. Depending on local convention or regulation, securities traded over-the-counter are valued at the mean of the latest bid and asked prices, the last sales price, or the official close price. Investments in open-end management investment companies are valued at the reported net asset value. Debt securities not traded on a principal securities exchange are valued through a commercial pricing service or at the mean of the most recent bid and asked prices. Discount notes may be valued through a commercial pricing service or at amortized cost, which approximates fair value. Securities traded on foreign securities exchanges and ov er-the-counter markets are normally completed before the close of business on days that the New York Stock Exchange (the Exchange) is open and may also take place on days when the Exchange is not open. If an event occurs after the value of a security was established but before the net asset value per share was determined that was likely to materially change the net asset value, that security would be valued as determined in accordance with procedures adopted by the Board of Directors. If the funds determine that the market price of a portfolio security is not readily available, or that the valuation methods mentioned above do not reflect the security’s fair value, such security is valued as determined by the Board of Directors or its designee, in accordance with procedures adopted by the Board of Directors, if such determination would materially impact a fund’s net asset value. Certain other circumstances may cause the funds to use alternative procedures to value a security such as: a security has been declared in default; trading in a security has been halted during the trading day; or there is a foreign market holiday and no trading will commence.
Security Transactions — For financial reporting purposes, security transactions are accounted for as of the trade date. Net realized gains and losses are determined on the identified cost basis, which is also used for federal income tax purposes. Certain countries impose taxes on realized gains on the sale of securities registered in their country. The funds record the foreign tax expense, if any, on an accrual basis. The foreign tax expense on realized gains and unrealized appreciation reduces the net realized gain (loss) on investment transactions and net unrealized appreciation (depreciation) on investments, respectively.
Investment Income — Dividend income less foreign taxes withheld, if any, is recorded as of the ex-dividend date. Interest income is recorded on the accrual basis and includes accretion of discounts and amortization of premiums.
Exchange Traded Funds — The funds may invest in exchange traded funds (ETFs). ETFs are a type of index fund bought and sold on a securities exchange. An ETF trades like common stock and represents a fixed portfolio of securities designed to track the performance and dividend yield of a particular domestic or foreign market index. A fund may purchase an ETF to temporarily gain exposure to a portion of the U.S. or a foreign market while awaiting purchase of underlying securities. The risks of owning an ETF generally reflect the risks of owning the underlying securities they are designed to track, although the lack of liquidity on an ETF could result in it being more volatile. Additionally, ETFs have fees and expenses that reduce their value.
27
Foreign Currency Translations — All assets and liabilities initially expressed in foreign currencies are translated into U.S. dollars at prevailing exchange rates at period end. The funds may enter into spot foreign currency exchange contracts to facilitate transactions denominated in a foreign currency. Purchases and sales of investment securities, dividend and interest income, spot foreign currency exchange contracts, and certain expenses are translated at the rates of exchange prevailing on the respective dates of such transactions. Realized and unrealized gains and losses from foreign currency translations arise from changes in currency exchange rates.
Net realized and unrealized foreign currency exchange gains or losses occurring during the holding period of investment securities are a component of net realized gain (loss) on foreign currency transactions and net unrealized appreciation (depreciation) on translation of assets and liabilities in foreign currencies, respectively. Certain countries may impose taxes on the contract amount of purchases and sales of foreign currency contracts in their currency. The funds record the foreign tax expense, if any, as a reduction to the net realized gain (loss) on foreign currency transactions.
Repurchase Agreements — The funds may enter into repurchase agreements with institutions that American Century Investment Management, Inc. (ACIM) has determined are creditworthy pursuant to criteria adopted by the Board of Directors. Each repurchase agreement is recorded at cost. Each fund requires that the collateral, represented by securities, received in a repurchase transaction be transferred to the custodian in a manner sufficient to enable each fund to obtain those securities in the event of a default under the repurchase agreement. ACIM monitors, on a daily basis, the securities transferred to ensure the value, including accrued interest, of the securities under each repurchase agreement is equal to or greater than amounts owed to each fund under each repurchase agreement.
Joint Trading Account — Pursuant to an Exemptive Order issued by the Securities and Exchange Commission, each fund, along with certain other funds in the American Century Investments family of funds, may transfer uninvested cash balances into a joint trading account. These balances are invested in one or more repurchase agreements that are collateralized by U.S. Treasury or Agency obligations.
Income Tax Status — It is each fund’s policy to distribute substantially all net investment income and net realized gains to shareholders and to otherwise qualify as a regulated investment company under provisions of the Internal Revenue Code. All tax years for the funds remain subject to examination by tax authorities. Additionally, non-U.S. tax returns filed by the funds due to investments in certain foreign securities remain subject to examination by the relevant taxing authority for 7 years from the date of filing. At this time, management believes there are no uncertain tax positions which, based on their technical merit, would not be sustained upon examination and for which it is reasonably possible that the total amounts of unrecognized tax benefits will significantly change in the next twelve months. Accordingly, no provi sion has been made for federal or state income taxes. Interest and penalties associated with any federal or state income tax obligations, if any, are recorded as interest expense.
Distributions to Shareholders — Distributions to shareholders are recorded on the ex-dividend date. Distributions from net investment income, if any, are generally declared and paid annually. Distributions from net realized gains, if any, are generally declared and paid twice per year. The funds may make distributions on a more frequent basis to comply with the distribution requirements of the Internal Revenue Code, in all events in a manner consistent with provisions of the 1940 Act.
Indemnifications — Under the corporation’s organizational documents, its officers and directors are indemnified against certain liabilities arising out of the performance of their duties to the funds. In addition, in the normal course of business, the funds enter into contracts that provide general indemnifications. The maximum exposure under these arrangements is unknown as this would involve future claims that may be made against a fund. The risk of material loss from such claims is considered by management to be remote.
28
Use of Estimates — The financial statements are prepared in conformity with accounting principles generally accepted in the United States of America, which may require management to make certain estimates and assumptions at the date of the financial statements. Actual results could differ from these estimates.
Subsequent Events — Management has evaluated events or transactions that may have occurred since November 30, 2009, that would merit recognition or disclosure in the financial statements. This evaluation was completed through January 27, 2010, the date the financial statements were available to be issued.
2. Fees and Transactions with Related Parties
Management Fees — The corporation has entered into a Management Agreement with American Century Global Investment Management, Inc. (ACGIM) (the investment advisor), under which ACGIM provides the funds with investment advisory and management services in exchange for a single, unified management fee (the fee). The Agreement provides that all expenses of managing and operating the funds, except brokerage expenses, taxes, interest, fees and expenses of the independent directors (including legal counsel fees) and extraordinary expenses, will be paid by ACGIM. The fee is computed and accrued daily based on the daily net assets of each fund and paid monthly in arrears. For funds with a stepped fee schedule, the rate of the fee is determined by applying a fee rate calculation formula. This formula takes into account each fund’s assets as wel l as certain assets, if any, of other clients of the investment advisor outside the American Century Investments family of funds (such as subadvised funds and separate accounts) that have very similar investment teams and investment strategies (strategy assets). The strategy assets of NT International Growth and NT Emerging Markets include the assets of International Growth Fund and Emerging Markets Fund, respectively, two funds in a series issued by the corporation. The annual management fee schedule for NT International Growth ranges from 0.90% to 1.30%. The annual management fee schedule for NT Emerging Markets ranges from 1.05% to 1.65%. The effective annual management fee for NT International Growth and NT Emerging Markets for the year ended November 30, 2009 was 1.18% and 1.57%, respectively.
ACGIM has entered into a Subadvisory Agreement with ACIM (the subadvisor) on behalf of the funds. The subadvisor makes investment decisions for the cash portion of the funds in accordance with the funds’ investment objectives, policies and restrictions under the supervision of ACGIM and the Board of Directors. ACGIM pays all costs associated with retaining ACIM as the subadvisor of the funds.
Acquired Fund Fees and Expenses — The funds may invest in mutual funds, exchange traded funds, and business development companies (the acquired funds). Each fund will indirectly realize its pro rata share of the fees and expenses of the acquired funds in which it invests. These indirect fees and expenses are not paid out of each fund’s assets but are reflected in the return realized by the fund on its investment in the acquired funds.
Related Parties — Certain officers and directors of the corporation are also officers and/or directors, and as a group, controlling stockholders of American Century Companies, Inc. (ACC), the parent of the corporation’s investment advisor, ACGIM, the corporation’s subadvisor, ACIM, the distributor of the corporation, American Century Investment Services, Inc., and the corporation’s transfer agent, American Century Services, LLC. The funds are wholly owned, in aggregate, by various funds in a series issued by American Century Asset Allocation Portfolios, Inc. (ACAAP). ACAAP does not invest in the funds for the purpose of exercising management or control.
The funds are eligible to invest in a money market fund for temporary purposes, which is managed by J.P. Morgan Investment Management, Inc. (JPMIM). The funds have a Mutual Funds Services Agreement with J.P. Morgan Investor Services Co. (JPMIS) and a securities lending agreement with JPMorgan Chase Bank (JPMCB). JPMCB is a custodian of the funds. JPMIM, JPMIS and JPMCB are wholly owned subsidiaries of JPMorgan Chase & Co. (JPM). JPM is an equity investor in ACC.
29
3. Investment Transactions
Investment transactions, excluding short-term investments, for the year ended November 30, 2009, were as follows:
| NT International Growth | NT Emerging Markets | |
| Purchases | $216,745,284 | $75,708,414 |
| Sales | $150,213,220 | $63,832,470 |
4. Fair Value Measurements
The funds’ securities valuation process is based on several considerations and may use multiple inputs to determine the fair value of the positions held by the funds. In conformity with accounting principles generally accepted in the United States of America, the inputs used to determine a valuation are classified into three broad levels as follows:
• Level 1 valuation inputs consist of actual quoted prices in an active market for identical securities;
• Level 2 valuation inputs consist of significant direct or indirect observable market data (including quoted prices for similar securities, evaluations of subsequent market events, interest rates, prepayment speeds, credit risk, etc.); or
• Level 3 valuation inputs consist of significant unobservable inputs (including a fund’s own assumptions).
The level classification is based on the lowest level input that is significant to the fair valuation measurement. The valuation inputs are not an indication of the risks associated with investing in these securities or other financial instruments.
The following is a summary of the valuation inputs used to determine the fair value of the funds’ securities as of November 30, 2009:
| Level 1 | Level 2 | Level 3 | ||
| NT International Growth | ||||
| Investment Securities | ||||
| Foreign Common Stocks | $11,909,522 | $149,251,436 | — | |
| Temporary Cash Investments | 78,477 | 1,600,000 | — | |
| Total Value of Investment Securities | $11,987,999 | $150,851,436 | — | |
| NT Emerging Markets | ||||
| Investment Securities | ||||
| Foreign Common Stocks | $8,932,917 | $46,764,341 | — | |
| Temporary Cash Investments | 79,521 | 2,200,000 | — | |
| Total Value of Investment Securities | $9,012,438 | $48,964,341 | — | |
30
5. Bank Line of Credit
The funds, along with certain other funds in the American Century Investments family of funds, had a $500,000,000 unsecured bank line of credit agreement with Bank of America, N.A. The line expired December 10, 2008, and was not renewed. The agreement allowed the funds to borrow money for temporary or emergency purposes to fund shareholder redemptions. Borrowings under the agreement were subject to interest at the Federal Funds rate plus 0.40%. The funds did not borrow from the line during the year ended November 30, 2009.
6. Interfund Lending
The funds, along with certain other funds in the American Century Investments family of funds, may participate in an interfund lending program, pursuant to an Exemptive Order issued by the Securities and Exchange Commission (SEC). This program provides an alternative credit facility allowing the funds to borrow from or lend to other funds in the American Century Investments family of funds that permit such transactions. Interfund lending transactions are subject to each fund’s investment policies and borrowing and lending limits. The interfund loan rate earned/paid on interfund lending transactions is determined daily based on the average of certain current market rates. Interfund lending transactions normally extend only overnight, but can have a maximum duration of seven days. The program is subject to annual approval by the Board of Directors. During the year ended November 30, 2009, the funds did not utilize the progra m.
7. Risk Factors
There are certain risks involved in investing in foreign securities. These risks include those resulting from future adverse political, social, and economic developments, fluctuations in currency exchange rates, the possible imposition of exchange controls, and other foreign laws or restrictions. Investing in emerging markets may accentuate these risks.
8. Federal Tax Information
On December 15, 2009, NT International Growth declared and paid a $0.1134 per-share distribution from net investment income to Institutional Class shareholders of record on December 14, 2009.
The tax character of distributions paid during the years ended November 30, 2009 and November 30, 2008 were as follows:
| NT International Growth | NT Emerging Markets | |||
| 2009 | 2008 | 2009 | 2008 | |
| Distributions Paid From | ||||
| Ordinary income | $1,011,101 | $1,139,053 | $152,834 | $2,352,219 |
| Long-term capital gains | — | $864,531 | — | $1,821,253 |
The book-basis character of distributions made during the year from net investment income or net realized gains may differ from their ultimate characterization for federal income tax purposes. These differences reflect the differing character of certain income items and net realized gains and losses for financial statement and tax purposes, and may result in reclassification among certain capital accounts on the financial statements.
31
As of November 30, 2009, the federal tax cost of investments and the components of distributable earnings on a tax-basis were as follows:
| NT International | NT Emerging | |
| Growth | Markets | |
| Federal tax cost of investments | $133,885,781 | $41,018,630 |
| Gross tax appreciation of investments | $29,647,884 | $17,190,546 |
| Gross tax depreciation of investments | (694,230) | (232,397) |
| Net tax appreciation (depreciation) of investments | $28,953,654 | $16,958,149 |
| Net tax appreciation (depreciation) on translation of assets | ||
| and liabilities in foreign currencies | $(31,172) | $(159,426) |
| Net tax appreciation (depreciation) | $28,922,482 | $16,798,723 |
| Undistributed ordinary income | $2,269,242 | $94,186 |
| Accumulated capital losses | $(19,721,852) | $(8,255,031) |
| Capital loss deferrals | $(72,856) | $(43,417) |
| Currency loss deferrals | $(2,347) | $(2,016) |
The difference between book-basis and tax-basis cost and unrealized appreciation (depreciation) is attributable primarily to the tax deferral of losses on wash sales and on investments in passive foreign investment companies.
The accumulated capital losses listed above represent net capital loss carryovers that may be used to offset future realized capital gains for federal income tax purposes. Future capital loss carryover utilization in any given year may be subject to Internal Revenue Code limitations. The capital loss carryovers expire as follows:
| 2016 | 2017 | |
| NT International Growth | $(6,493,006) | $(13,228,846) |
| NT Emerging Markets | $(3,705,184) | $(4,549,847) |
The capital and currency loss deferrals listed above represent net capital and foreign currency losses incurred in the one-month period ended November 30, 2009. The funds have elected to treat such losses as having been incurred in the following fiscal year for federal income tax purposes.
9. Recently Issued Accounting Standards
In March 2008, the Financial Accounting Standards Board (FASB) issued Accounting Standards Codification (ASC) Section 815-10 (formerly Statement of Financial Accounting Standards No. 161, “Disclosures about Derivative Instruments and Hedging Activities —an amendment of FASB Statement No. 133”). ASC Section 815-10 is effective for interim periods beginning after November 15, 2008 and has been adopted by the funds. ASC Section 815-10 amends and expands disclosures about derivative instruments and hedging activities. ASC Section 815-10 requires qualitative disclosures about the objectives and strategies of derivative instruments, quantitative disclosures about the fair value amounts of and gains and losses on derivative instruments, and disclosures of credit-risk-related contingent features in hedging activities.
32
10. Other Tax Information (Unaudited)
The following information is provided pursuant to provisions of the Internal Revenue Code.
The funds hereby designate up to the maximum amount allowable as qualified dividend income for the fiscal year ended November 30, 2009.
For corporate taxpayers, the funds hereby designate the following ordinary income distributions, or up to the maximum amount allowable, as qualified for the corporate dividends received deduction for the fiscal year ended November 30, 2009.
| NT International Growth | NT Emerging Markets |
| $14,969 | — |
33
| Financial Highlights |
| NT International Growth | |||||
| For a Share Outstanding Throughout the Years Ended November 30 (except as noted) | |||||
| 2009 | 2008 | 2007 | 2006(1) | ||
| Per-Share Data | |||||
| Net Asset Value, Beginning of Period | $6.29 | $12.72 | $10.34 | $10.00 | |
| Income From Investment Operations | |||||
| Net Investment Income (Loss) | 0.10(2) | 0.16(2) | 0.12 | 0.03 | |
| Net Realized and Unrealized Gain (Loss) | 2.33 | (6.18) | 2.29 | 0.31 | |
| Total From Investment Operations | 2.43 | (6.02) | 2.41 | 0.34 | |
| Distributions | |||||
| From Net Investment Income | (0.11) | (0.12) | (0.03) | — | |
| From Net Realized Gains | — | (0.29) | — | — | |
| Total Distributions | (0.11) | (0.41) | (0.03) | — | |
| Net Asset Value, End of Period | $8.61 | $6.29 | $12.72 | $10.34 | |
| Total Return(3) | 39.09% | (48.82)% | 23.40% | 3.40% | |
| Ratios/Supplemental Data | |||||
| Ratio of Operating Expenses to Average Net Assets | 1.18% | 1.12% | 1.07% | 1.07%(4) | |
| Ratio of Net Investment Income (Loss) to Average Net Assets | 1.41% | 1.62% | 1.15% | 0.59%(4) | |
| Portfolio Turnover Rate | 132% | 119% | 104% | 65% | |
| Net Assets, End of Period (in thousands) | $163,476 | $55,860 | $67,703 | $46,380 | |
| (1) | May 12, 2006 (fund inception) through November 30, 2006. | ||||
| (2) | Computed using average shares outstanding throughout the period. | ||||
| (3) | Total return assumes reinvestment of net investment income and capital gains distributions, if any. Total returns for periods less than one year | ||||
| are not annualized. | |||||
| (4) | Annualized | ||||
| See Notes to Financial Statements. | |||||
34
| NT Emerging Markets | |||||
| For a Share Outstanding Throughout the Years Ended November 30 (except as noted) | |||||
| 2009 | 2008 | 2007 | 2006(1) | ||
| Per-Share Data | |||||
| Net Asset Value, Beginning of Period | $5.12 | $16.19 | $11.01 | $10.00 | |
| Income From Investment Operations | |||||
| Net Investment Income (Loss) | 0.02(2) | 0.11(2) | 0.15 | 0.07 | |
| Net Realized and Unrealized Gain (Loss) | 3.74 | (8.52) | 5.12 | 0.94 | |
| Total From Investment Operations | 3.76 | (8.41) | 5.27 | 1.01 | |
| Distributions | |||||
| From Net Investment Income | (0.02) | (0.20) | (0.09) | — | |
| From Net Realized Gains | — | (2.46) | — | — | |
| Total Distributions | (0.02) | (2.66) | (0.09) | — | |
| Net Asset Value, End of Period | $8.86 | $5.12 | $16.19 | $11.01 | |
| Total Return(3) | 73.87% | (61.75)% | 48.22% | 10.10% | |
| Ratios/Supplemental Data | |||||
| Ratio of Operating Expenses to Average Net Assets | 1.57% | 1.52% | 1.46% | 1.60%(4) | |
| Ratio of Net Investment Income (Loss) to Average Net Assets | 0.36% | 1.17% | 1.12% | 1.68%(4) | |
| Portfolio Turnover Rate | 158% | 157% | 113% | 59% | |
| Net Assets, End of Period (in thousands) | $60,311 | $20,715 | $28,378 | $19,844 | |
| (1) | May 12, 2006 (fund inception) through November 30, 2006. | ||||
| (2) | Computed using average shares outstanding throughout the period. | ||||
| (3) | Total return assumes reinvestment of net investment income and capital gains distributions, if any. Total returns for periods less than one year | ||||
| are not annualized. | |||||
| (4) | Annualized | ||||
| See Notes to Financial Statements. | |||||
35
| Report of Independent Registered Public Accounting Firm |
The Board of Directors and Shareholders,
American Century World Mutual Funds, Inc.:
We have audited the accompanying statements of assets and liabilities, including the schedules of investments, of NT International Growth Fund and NT Emerging Markets Fund, two of the funds constituting American Century World Mutual Funds, Inc. (the “Corporation”), as of November 30, 2009, and the related statements of operations for the year then ended, the statements of changes in net assets for each of the two years in the period then ended, and the financial highlights for each of the three years in the period then ended and for the period May 12, 2006 (inception of the funds) through November 30, 2006. These financial statements and financial highlights are the responsibility of the Corporation’s management. Our responsibility is to express an opinion on these financial statements and financial highlights based on our audits.
We conducted our audits in accordance with the standards of the Public Company Accounting Oversight Board (United States). Those standards require that we plan and perform the audit to obtain reasonable assurance about whether the financial statements and financial highlights are free of material misstatement. The Corporation is not required to have, nor were we engaged to perform, an audit of its internal control over financial reporting. Our audits included consideration of internal control over financial reporting as a basis for designing audit procedures that are appropriate in the circumstances, but not for the purpose of expressing an opinion on the effectiveness of the Corporation’s internal control over financial reporting. Accordingly, we express no such opinion. An audit also includes examining, on a test basis, evidence supporting the amounts and disclosures in the financial statements, assessing the accounting principles used and significant estimates made by management, as well as evaluating the overall financial statement presentation. Our procedures included confirmation of securities owned as of November 30, 2009, by correspondence with the custodian and brokers; where replies were not received from brokers, we performed other auditing procedures. We believe that our audits provide a reasonable basis for our opinion.
In our opinion, the financial statements and financial highlights referred to above present fairly, in all material respects, the respective financial positions of NT International Growth Fund and NT Emerging Markets Fund of American Century World Mutual Funds, Inc., as of November 30, 2009, the results of their operations for the year then ended, the changes in their net assets for each of the two years in the period then ended, and the financial highlights for each of the three years in the period then ended and for the period May 12, 2006 through November 30, 2006, in conformity with accounting principles generally accepted in the United States of America.
Deloitte & Touche LLP
Kansas City, Missouri
January 27, 2010
36
| Management |
The individuals listed below serve as directors or officers of the funds. Each director serves until his or her successor is duly elected and qualified or until he or she retires. Mandatory retirement age for independent directors is 72. However, the mandatory retirement age of any director may be extended with the approval of the remaining independent directors. Those listed as interested directors are “interested” primarily by virtue of their engagement as directors and/or officers of, or ownership interest in, American Century Companies, Inc. (ACC) or its wholly owned, direct or indirect, subsidiaries, including the funds’ investment advisor, American Century Global Investment Management, Inc. (ACGIM) or American Century Investment Management, Inc. (ACIM); the funds’ principal underwriter, American Century Investment Services, Inc. (ACIS); and the funds’ transfer agent, American Century Services, LLC (ACS).
The other directors (more than three-fourths of the total number) are independent; that is, they have never been employees, directors or officers of, and have no financial interest in, ACC or any of its wholly owned, direct or indirect, subsidiaries, including ACGIM, ACIM, ACIS and ACS. The directors serve in this capacity for seven registered investment companies in the American Century Investments family of funds.
All persons named as officers of the funds also serve in similar capacities for the other 14 registered investment companies in the American Century Investments family of funds advised by ACGIM or ACIM, unless otherwise noted. Only officers with policy-making functions are listed. No officer is compensated for his or her service as an officer of the funds. The listed officers are interested persons of the funds and are appointed or re-appointed on an annual basis.
Interested Director
Jonathan S. Thomas, 4500 Main Street, Kansas City, MO 64111
Year of Birth: 1963
Position(s) Held with Funds: Director (since 2007) and President (since 2007)
Principal Occupation(s) During Past 5 Years: President and Chief Executive Officer, ACC
(March 2007 to present); Chief Administrative Officer, ACC (February 2006 to
February 2007); Executive Vice President, ACC (November 2005 to February 2007).
Also serves as: President, Chief Executive Officer and Director, ACS; Executive
Vice President, ACIM and ACGIM; Director, ACIM, ACGIM, ACIS and other ACC
subsidiaries. Managing Director, Morgan Stanley (March 2000 to November 2005)
Number of Portfolios in Fund Complex Overseen by Director: 103
Other Directorships Held by Director: None
Independent Directors
Thomas A. Brown, 4500 Main Street, Kansas City, MO 64111
Year of Birth: 1940
Position(s) Held with Funds: Director (since 1980)
Principal Occupation(s) During Past 5 Years: Managing Member, Associated Investments, LLC
(real estate investment company); Managing Member, Brown Cascade Properties,
LLC (real estate investment company); Retired, Area Vice President, Applied
Industrial Technologies (bearings and power transmission company)
Number of Portfolios in Fund Complex Overseen by Director: 63
Other Directorships Held by Director: None
37
Andrea C. Hall, Ph.D., 4500 Main Street, Kansas City, MO 64111
Year of Birth: 1945
Position(s) Held with Funds: Director (since 1997)
Principal Occupation(s) During Past 5 Years: Retired, Advisor to the President, Midwest
Research Institute (not-for-profit, contract research organization)
Number of Portfolios in Fund Complex Overseen by Director: 63
Other Directorships Held by Director: None
James A. Olson, 4500 Main Street, Kansas City, MO 64111
Year of Birth: 1942
Position(s) Held with Funds: Director (since 2007)
Principal Occupation(s) During Past 5 Years: Member, Plaza Belmont LLC (private equity
fund manager); Chief Financial Officer, Plaza Belmont LLC (September 1999 to
September 2006)
Number of Portfolios in Fund Complex Overseen by Director: 63
Other Directorships Held by Director: Saia, Inc.; Entertainment Properties Trust
Donald H. Pratt, 4500 Main Street, Kansas City, MO 64111
Year of Birth: 1937
Position(s) Held with Funds: Director (since 1995) and Chairman of the Board (since 2005)
Principal Occupation(s) During Past 5 Years: Chairman and Chief Executive Officer, Western
Investments, Inc. (real estate company); Retired Chairman of the Board, Butler
Manufacturing Company (metal buildings producer)
Number of Portfolios in Fund Complex Overseen by Director: 63
Other Directorships Held by Director: None
Gale E. Sayers, 4500 Main Street, Kansas City, MO 64111
Year of Birth: 1943
Position(s) Held with Funds: Director (since 2000)
Principal Occupation(s) During Past 5 Years: President, Chief Executive Officer and Founder,
Sayers40, Inc. (technology products and services provider)
Number of Portfolios in Fund Complex Overseen by Director: 63
Other Directorships Held by Director: None
M. Jeannine Strandjord, 4500 Main Street, Kansas City, MO 64111
Year of Birth: 1945
Position(s) Held with Funds: Director (since 1994)
Principal Occupation(s) During Past 5 Years: Retired, formerly Senior Vice President, Sprint
Corporation (telecommunications company)
Number of Portfolios in Fund Complex Overseen by Director: 63
Other Directorships Held by Director: DST Systems, Inc.; Euronet Worldwide, Inc.; Charming
Shoppes, Inc.
John R. Whitten, 4500 Main Street, Kansas City, MO 64111
Year of Birth: 1946
Position(s) Held with Funds: Director (since 2008)
Principal Occupation(s) During Past 5 Years: Project Consultant, Celanese Corp. (industrial
chemical company) (September 2004 to January 2005)
Number of Portfolios in Fund Complex Overseen by Director: 63
Other Directorships Held by Director: Rudolph Technologies, Inc.
38
Officers
Barry Fink, 4500 Main Street, Kansas City, MO 64111
Year of Birth: 1955
Position(s) Held with Funds: Executive Vice President (since 2007)
Principal Occupation(s) During Past 5 Years: Chief Operating Officer and Executive Vice
President, ACC (September 2007 to present); President, ACS (October 2007 to
present); Managing Director, Morgan Stanley (2000 to 2007); Global General
Counsel, Morgan Stanley (2000 to 2006). Also serves as: Director, ACC, ACS, ACIS
and other ACC subsidiaries
Maryanne Roepke, 4500 Main Street, Kansas City, MO 64111
Year of Birth: 1956
Position(s) Held with Funds: Chief Compliance Officer (since 2006) and Senior Vice
President (since 2000)
Principal Occupation(s) During Past 5 Years: Chief Compliance Officer, ACIM, ACGIM
and ACS (August 2006 to present); Assistant Treasurer, ACC (January 1995 to
August 2006); and Treasurer and Chief Financial Officer, various American
Century Investments funds (July 2000 to August 2006). Also serves as: Senior
Vice President, ACS
Charles A. Etherington, 4500 Main Street, Kansas City, MO 64111
Year of Birth: 1957
Position(s) Held with Funds: General Counsel (since 2007) and Senior Vice President
(since 2006)
Principal Occupation(s) During Past 5 Years: Attorney, ACC (February 1994 to present); Vice
President, ACC (November 2005 to present); General Counsel, ACC (March 2007
to present). Also serves as: General Counsel, ACIM, ACGIM, ACS, ACIS and other
ACC subsidiaries; and Senior Vice President, ACIM, ACGIM and ACS
Robert Leach, 4500 Main Street, Kansas City, MO 64111
Year of Birth: 1966
Position(s) Held with Funds: Vice President, Treasurer and Chief Financial Officer (all
since 2006)
Principal Occupation(s) During Past 5 Years: Vice President, ACS (February 2000 to present); and
Controller, various American Century Investments funds (1997 to September 2006)
David H. Reinmiller, 4500 Main Street, Kansas City, MO 64111
Year of Birth: 1963
Position(s) Held with Funds: Vice President (since September 2000)
Principal Occupation(s) During Past 5 Years: Attorney, ACC (January 1994 to present);
Associate General Counsel, ACC (January 2001 to present); Chief Compliance
Officer, American Century Investments funds, ACIM and ACGIM (January 2001 to
February 2005). Also serves as: Associate General Counsel, ACIM, ACGIM, ACS,
ACIS and other ACC subsidiaries; and Vice President, ACIM, ACGIM and ACS
Ward Stauffer, 4500 Main Street, Kansas City, MO 64111
Year of Birth: 1960
Position(s) Held with Funds: Secretary (since February 2005)
Principal Occupation(s) During Past 5 Years: Attorney, ACC (June 2003 to present)
The SAI has additional information about the funds’ directors and is available without charge, upon request, by calling 1-800-345-2021.
39
| Approval of Management Agreements |
Under Section 15(c) of the Investment Company Act, contracts for investment advisory services (including subadvisory services) are required to be reviewed, evaluated and approved by a majority of a fund’s independent directors or trustees (the “Directors”) each year. At American Century Investments, this process is referred to as the “15(c) Process.” As a part of this process, the board reviews fund performance, shareholder services, audit and compliance information, and a variety of other reports from the advisor concerning fund operations. In addition to this annual review, the board of directors oversees and evaluates on a continuous basis at its quarterly meetings the nature and quality of significant services performed by the advisor and the subadvisor, fund performance, audit and compliance information, and a variety of other reports relating to fund operations. The board, or committees of the boa rd, also holds special meetings as needed.
Under a Securities and Exchange Commission rule, each fund is required to disclose in its annual or semiannual report, as appropriate, the material factors and conclusions that formed the basis for the board’s approval or renewal of any advisory agreements within the fund’s most recently completed fiscal half-year period.
Annual Contract Review Process
As part of the annual 15(c) Process undertaken during the most recent fiscal half-year period, the Directors reviewed extensive data and information compiled by the advisor and certain independent providers of evaluative data (the “15(c) Providers”) concerning NT International Growth and NT Emerging Markets (the “Funds”) and the services provided to the Funds under the management and subadvisory agreements. The information considered and the discussions held at the meetings included, but were not limited to:
• the nature, extent and quality of investment management, shareholder services and other services provided to the Funds;
• the wide range of programs and services the advisor provides to the Funds and their shareholders on a routine and non-routine basis;
• the compliance policies, procedures, and regulatory experience of both the advisor and the subadvisor;
• data comparing the cost of owning the Funds to the cost of owning a similar fund;
• data comparing the Funds’ performance to appropriate benchmarks and/ or a peer group of other mutual funds with similar investment objectives and strategies;
• financial data showing the profitability of the Funds to the advisor and the overall profitability of the advisor;
40
• data comparing services provided and charges to other investment management clients of the advisor; and
• consideration of collateral benefits derived by the advisor from the manage-ment of the Funds and any potential economies of scale relating thereto.
In keeping with its practice, the Funds’ board of directors held two in-person meetings and one telephonic meeting to review and discuss the information provided. The board also had the benefit of the advice of its independent counsel throughout the period.
Factors Considered
The Directors considered all of the information provided by the advisor, the 15(c) Providers, and the board’s independent counsel, and evaluated such information for each fund for which the board has responsibility. In connection with their review of the Funds, the Directors did not identify any single factor as being all-important or controlling, and each Director may have attributed different levels of importance to different factors. In deciding to renew the management and subadvisory agreements under the terms ultimately determined by the board to be appropriate, the Directors’ decision was based on the following factors.
Nature, Extent and Quality of Services – Generally. Under the management agreement, the advisor is responsible for providing or arranging for all services necessary for the operation of the Funds. The board noted that under the management agreement, the advisor provides or arranges at its own expense a wide variety of services including:
• Fund construction and design
• portfolio security selection
• initial capitalization/funding
• securities trading
• Fund administration
• custody of Fund assets
• daily valuation of each Fund’s portfolio
• shareholder servicing and transfer agency, including shareholder confirmations, recordkeeping and communications
• legal services
• regulatory and portfolio compliance
• financial reporting
• marketing and distribution
41
The Directors noted that many of the services provided by the advisor have expanded over time both in terms of quantity and complexity in response to shareholder demands, competition in the industry and the changing regulatory environment. They discussed with the advisor the challenges presented by these changes and the impact on the Funds. The directors specifically noted that with respect to the Funds, the advisor had retained the subad-visor to provide the day-to-day cash management services. In performing their evaluation, the Directors considered information received in connection with the annual review, as well as information provided on an ongoing basis at their regularly scheduled board and committee meetings.
Investment Management Services. The nature of the investment management services provided to the Funds is quite complex and allows Fund shareholders access to professional money management, instant diversification of their investments, and liquidity. In evaluating investment performance, the board expects the advisor and subadvisor to manage the Funds in accordance with its investment objectives and approved strategies. Further, the Directors recognize that the advisor and subadvisor have an obligation to monitor trading activities, and in particular to seek the best execution of fund trades, and to evaluate the use of and payment for research. In providing these services, the advisor and subadvisor utilize teams of investment professionals (portfolio managers, analysts, research assistants, and securities traders) who require extensive in formation technology, research, training, compliance and other systems to conduct their business. At each quarterly meeting the Directors review investment performance information for the Funds, together with comparative information for appropriate benchmarks and/or peer groups of funds managed similarly to the Funds. The Directors also review detailed performance information during the 15(c) Process comparing each Fund’s performance with that of similar funds not managed by the advisor. If performance concerns are identified, the Directors discuss with the advisor the reasons for such results (e.g., market conditions, security selection) and any efforts being undertaken to improve performance. NT International Growth’s performance for both the one- and three-year periods was above the median for its peer group. NT Emerging Markets’ performance was above the median for its peer group for the three-year period and below the median for the one-year period.
Shareholder and Other Services. The advisor provides the Funds with a comprehensive package of transfer agency, shareholder, and other services. The Directors review reports and evaluations of such services at their regular quarterly meetings, including the annual meeting concerning contract review, and reports to the board. These reports include, but are not limited to, information regarding the operational efficiency and accuracy of the shareholder and transfer agency services provided, staffing levels, shareholder satisfaction (as measured by external as well as internal sources), technology support, new products and services offered to Fund shareholders, securities trading activities, portfolio valuation services, auditing services, and legal and operational compliance activities. Certain aspects of shareholder and transfer agency serv ice level efficiency and the quality of securities trading activities are measured by independent third party providers and are presented in comparison to other fund groups not managed by the advisor.
42
Costs of Services Provided and Profitability. The advisor provides detailed information concerning its cost of providing various services to the Funds, its profitability in managing the Funds, its overall profitability, and its financial condition. The Directors have reviewed with the advisor the methodology used to prepare this financial information. This financial information regarding the advisor is considered in order to evaluate the advisor’s financial condition, its ability to continue to provide services under the management agreement, and the reasonableness of the current management fee. The board concluded that the advisor’s profits were reasonable in light of the services provided to the Funds. The board did not consider the profitability of the subadvisor because the subadvisor is paid from the unified fee of the advis or as a result of arm’s length negotiations.
Ethics. The Directors generally consider the advisor’s commitment to providing quality services to shareholders and to conducting its business ethically. They noted that the advisor’s practices generally meet or exceed industry best practices. With respect to the subadvisor, as part of its oversight responsibilities, the board approves the subadvisor’s code of ethics and any changes thereto. Further, through the advisor’s compliance group, the board stays abreast of any violations of the subadvisor’s code.
Economies of Scale. The Directors review information provided by the advisor regarding the possible existence of economies of scale in connection with the management of the Funds. The Directors concluded that economies of scale are difficult to measure and predict with precision, especially on a fund-by-fund basis. The analysis of economies of scale is further complicated by the additional services and content provided by the advisor and its reinvestment in its ability to provide and expand those services. Accordingly, the Directors seek to evaluate economies of scale by reviewing other information, such as year-over-year profitability of the advisor generally, the profitability of its management of the Funds specifically, the expenses incurred by the advisor in providing various functions to the Funds, and the fees of competitive funds no t managed by the advisor. The Directors believe the advisor is appropriately sharing economies of scale through its competitive fee structure, fee breakpoints as each Fund increases in size, and through reinvestment in its business to provide shareholders additional content and services.
Comparison to Other Funds’ Fees. The Funds pay the advisor a single, all-inclusive (or unified) management fee for providing all services necessary for the management and operation of the Funds, other than brokerage expenses, taxes, interest, extraordinary expenses, and the fees and expenses of each Fund’s independent directors (including their independent legal counsel). The Directors specifically noted that the subadvisory fees paid to the subadvisor under the subadvisory agreement were subject to arm’s length negotiation between the advisor and the subadvisor and are paid by the advisor out of its unified fee.
43
Under the unified fee structure, the advisor is responsible for providing all investment advisory, custody, audit, administrative, compliance, record-keeping, marketing and shareholder services, or arranging and supervising third parties to provide such services. By contrast, most other funds are charged a variety of fees, including an investment advisory fee, a transfer agency fee, an administrative fee, distribution charges and other expenses. Other than their investment advisory fees and Rule 12b-1 distribution fees, all other components of the total fees charged by these other funds may be increased without shareholder approval. The board believes the unified fee structure is a benefit to Fund shareholders because it clearly discloses to shareholders the cost of owning Fund shares, and, since the unified fee cannot be increased without a vote of Fund shareholders, it shifts to the advisor the risk of increased costs of o perating the Funds and provides a direct incentive to minimize administrative inefficiencies. Part of the Directors’ analysis of fee levels involves reviewing certain evaluative data compiled by a 15(c) Provider comparing each Fund’s unified fee to the total expense ratio of other funds in the Funds’ peer group and performing a regression analysis to evaluate the effect of fee breakpoints as assets under management increase. The unified fees charged to shareholders of each of the Funds were above the median of the total expense ratios of their respective peer groups. In addition, the Directors also reviewed updated fee level data provided by the advisor, but recognized that comparative data was particularly difficult to evaluate given the significant market developments during the past year. The board concluded that the management fee paid by each Fund to the advisor was reasonable in light of the services provided to the Funds.
Comparison to Fees and Services Provided to Other Clients of the Advisor. The Directors also requested and received information from the advisor concerning the nature of the services, fees, and profitability of its advisory services to advisory clients other than the Funds. They observed that these varying types of client accounts require different services and involve different regulatory and entrepreneurial risks than the management of the Funds. The Directors analyzed this information and concluded that the fees charged and services provided to the Funds were reasonable by comparison.
Collateral Benefits Derived by the Advisor. The Directors considered the existence of collateral benefits the advisor may receive as a result of its relationship with the Funds. They concluded that the advisor’s primary business is managing mutual funds and it generally does not use fund or shareholder information to generate profits in other lines of business, and therefore does not derive any significant collateral benefits from them. The Directors noted that the advisor receives proprietary research from broker-dealers that execute fund portfolio transactions and concluded that this research is likely to benefit fund shareholders. The Directors also determined that the advisor is able to provide investment management services to certain clients other than the Funds, at least in part, due to its existing infrastructure built to serv e the fund complex. The Directors concluded, however, that the assets of those other clients are not material to the analysis and, in any event, are included with the assets of the Funds to determine breakpoints in each Fund’s fee schedule, provided they are managed using the same investment team and strategy.
44
Conclusions of the Directors
As a result of this process, the board, including all of the independent directors, in the absence of particular circumstances and assisted by the advice of legal counsel that is independent of the advisor, taking into account all of the factors discussed above and the information provided by the advisor concluded that the investment management agreement between each Fund and the advisor is fair and reasonable in light of the services provided and should be renewed.
Additionally, the board, including all the independent directors, in the absence of particular circumstances and assisted by the advice of legal counsel that is independent of the advisor, taking into account all of the factors discussed above and the information provided by the advisor, concluded that the subadvisory agreement between the advisor and the subadvisor, on behalf of each Fund, is fair and reasonable in light of the services provided and should be renewed.
45
| Additional Information |
Retirement Account Information
As required by law, distributions you receive from certain IRAs, or 403(b), 457 and qualified plans are subject to federal income tax withholding, unless you elect not to have withholding apply. Tax will be withheld on the total amount withdrawn even though you may be receiving amounts that are not subject to withholding, such as nondeductible contributions. In such case, excess amounts of withholding could occur. You may adjust your withholding election so that a greater or lesser amount will be withheld.
If you don’t want us to withhold on this amount, you must notify us to not withhold the federal income tax. You may notify us in writing or in certain situations by telephone or through other electronic means. You have the right to revoke your withholding election at any time and any election you make may remain in effect until revoked by filing a new election.
Remember, even if you elect not to have income tax withheld, you are liable for paying income tax on the taxable portion of your withdrawal. If you elect not to have income tax withheld or you don’t have enough income tax withheld, you may be responsible for payment of estimated tax. You may incur penalties under the estimated tax rules if your withholding and estimated tax payments are not sufficient. You can reduce or defer the income tax on a distribution by directly or indirectly rolling such distribution over to another IRA or eligible plan. You should consult your tax advisor for additional information.
State tax will be withheld if, at the time of your distribution, your address is within one of the mandatory withholding states and you have federal income tax withheld. State taxes will be withheld from your distribution in accordance with the respective state rules.
Proxy Voting Guidelines
American Century Global Investment Management, Inc., the funds’ investment advisor, is responsible for exercising the voting rights associated with the securities purchased and/or held by the funds. A description of the policies and procedures the advisor uses in fulfilling this responsibility is available without charge, upon request, by calling 1-800-345-2021. It is also available on American Century Investments’ website at americancentury.com and on the Securities and Exchange Commission’s website at sec.gov. Information regarding how the investment advisor voted proxies relating to portfolio securities during the most recent 12-month period ended June 30 is available on the “About Us” page at americancentury.com. It is also available at sec.gov.
Quarterly Portfolio Disclosure
The funds file their complete schedule of portfolio holdings with the Securities and Exchange Commission (SEC) for the first and third quarters of each fiscal year on Form N-Q. The funds’ Forms N-Q are available on the SEC’s website at sec.gov, and may be reviewed and copied at the SEC’s Public Reference Room in Washington, DC. Information on the operation of the Public Reference Room may be obtained by calling 1-800-SEC-0330. The funds also make their complete schedule of portfolio holdings for the most recent quarter of their fiscal year available on their website at americancentury.com and, upon request, by calling 1-800-345-2021.
46
| Index Definitions |
The following indices are used to illustrate investment market, sector, or style performance or to serve as fund performance comparisons. They are not investment products available for purchase.
Morgan Stanley Capital International (MSCI) has developed several indices that measure the performance of foreign stock markets.
The MSCI EAFE (Europe, Australasia, Far East) Index is designed to measure developed market equity performance, excluding the U.S. and Canada.
The MSCI EAFE Growth Index is a capitalization-weighted index that monitors the performance of growth stocks from Europe, Australasia, and the Far East.
The MSCI EAFE Value Index is a capitalization-weighted index that monitors the performance of value stocks from Europe, Australasia, and the Far East.
The MSCI EM (Emerging Markets) Index represents the performance of stocks in global emerging market countries.
The MSCI EM Growth Index represents the performance of growth stocks in global emerging market countries.
The MSCI Europe Index is designed to measure equity market performance in Europe.
The MSCI Japan Index is designed to measure equity market performance in Japan.
The MSCI World Free Index represents the performance of stocks in developed countries (including the United States) that are available for purchase by global investors.
47
| Notes |
48

| Contact Us | |
| americancentury.com | |
| Automated Information Line | 1-800-345-8765 |
| Investor Services Representative | 1-800-345-2021 or |
| 816-531-5575 | |
| Business, Not-For-Profit, Employer-Sponsored | |
| Retirement Plans | 1-800-345-3533 |
| Banks and Trust Companies, Broker-Dealers, | |
| Financial Professionals, Insurance Companies | 1-800-345-6488 |
| Telecommunications Device for the Deaf | 1-800-634-4113 |
| American Century World Mutual Funds, Inc. | |
| Investment Advisor: | |
| American Century Global Investment Management, Inc. | |
| New York, New York |
This report and the statements it contains are submitted for the general
information of our shareholders. The report is not authorized for distribution to
prospective investors unless preceded or accompanied by an effective prospectus.
American Century Investment Services, Inc., Distributor
©2010 American Century Proprietary Holdings, Inc. All rights reserved.
1001
CL-ANN-67329N
| ITEM 2. CODE OF ETHICS. | ||
| (a) | The registrant has adopted a Code of Ethics for Senior Financial Officers that applies to the | |
| registrant’s principal executive officer, principal financial officer, principal accounting officer, | ||
| and persons performing similar functions. | ||
| (b) | No response required. | |
| (c) | None. | |
| (d) | None. | |
| (e) | Not applicable. | |
| (f) | The registrant’s Code of Ethics for Senior Financial Officers was filed as Exhibit 12 (a)(1) to | |
| American Century Asset Allocation Portfolios, Inc.’s Annual Certified Shareholder Report on | ||
| Form N-CSR, File No. 811-21591, on September 29, 2005, and is incorporated herein by | ||
| reference. | ||
| ITEM 3. AUDIT COMMITTEE FINANCIAL EXPERT. | ||
| (a)(1) | The registrant’s board has determined that the registrant has at least one audit committee | |
| financial expert serving on its audit committee. | ||
| (a)(2) | James A. Olson, Thomas A. Brown and Gale E. Sayers are the registrant’s designated audit | |
| committee financial experts. They are “independent” as defined in Item 3 of Form N-CSR. | ||
| (a)(3) | Not applicable. | |
| (b) | No response required. | |
| (c) | No response required. | |
| (d) | No response required. | |
| ITEM 4. PRINCIPAL ACCOUNTANT FEES AND SERVICES. | ||
| (a) | Audit Fees. | |
| The aggregate fees billed for each of the last two fiscal years for professional services rendered by the | ||
| principal accountant for the audit of the registrant’s annual financial statements or services that are | ||
| normally provided by the accountant in connection with statutory and regulatory filings or engagements | ||
| for those fiscal years were as follows: | ||
| FY 2008: | $239,403 | |
| FY 2009: | $204,457 | |
| (b) | Audit-Related Fees. | |
| The aggregate fees billed in each of the last two fiscal years for assurance and related services by the | ||
| principal accountant that are reasonably related to the performance of the audit of the registrant’s | ||
| financial statements and are not reported under paragraph (a) of this Item were as follows: | ||
| For services rendered to the registrant: | ||
| FY 2008: | $0 | |
| FY 2009: | $0 | |
| Fees required to be approved pursuant to paragraph (c)(7)(ii) of Rule 2-01 of Regulation S-X | ||
| (relating to certain engagements for non-audit services with the registrant’s investment adviser | ||
| and its affiliates): | ||
| FY 2008: | $0 | |
| FY 2009: | $0 | |
| (c) | Tax Fees. | |
| The aggregate fees billed in each of the last two fiscal years for professional services rendered by the | ||
| principal accountant for tax compliance, tax advice, and tax planning were as follows: | ||
| For services rendered to the registrant: | ||
| FY 2008: | $0 | |
| FY 2009: | $0 | |
| Fees required to be approved pursuant to paragraph (c)(7)(ii) of Rule 2-01 of Regulation S-X | ||
| (relating to certain engagements for non-audit services with the registrant’s investment adviser | ||
| and its affiliates): | ||
| FY 2008: | $0 | |
| FY 2009: | $0 | |
| (d) | All Other Fees. | |
| The aggregate fees billed in each of the last two fiscal years for products and services provided by the | ||
| principal accountant, other than the services reported in paragraphs (a) through (c) of this Item were as | ||
| follows: | ||
| For services rendered to the registrant: | ||
| FY 2008: | $0 | |
| FY 2009: | $0 | |
| Fees required to be approved pursuant to paragraph (c)(7)(ii) of Rule 2-01 of Regulation S-X | ||
| (relating to certain engagements for non-audit services with the registrant’s investment adviser | ||
| and its affiliates): | ||
| FY 2008: | $0 | |
| FY 2009: | $0 | |
| (e)(1) | In accordance with paragraph (c)(7)(i)(A) of Rule 2-01 of Regulation S-X, before the | |
| accountant is engaged by the registrant to render audit or non-audit services, the engagement is | ||
| approved by the registrant’s audit committee. Pursuant to paragraph (c)(7)(ii) of Rule 2-01 of | ||
| Regulation S-X, the registrant’s audit committee also pre-approves its accountant’s | ||
| engagements for non-audit services with the registrant’s investment adviser, its parent company, | ||
| and any entity controlled by, or under common control with the investment adviser that | ||
| provides ongoing services to the registrant, if the engagement relates directly to the operations | ||
| and financial reporting of the registrant. | ||
| (e)(2) | All services described in each of paragraphs (b) through (d) of this Item were pre-approved | |
| before the engagement by the registrant’s audit committee pursuant to paragraph (c)(7)(i)(A) of | ||
| Rule 2-01 of Regulation S-X. Consequently, none of such services were required to be | ||
| approved by the audit committee pursuant to paragraph (c)(7)(i)(C). | ||
| (f) | The percentage of hours expended on the principal accountant’s engagement to audit the | |
| registrant’s financial statements for the most recent fiscal year that were attributed to work | ||
| performed by persons other than the principal accountant’s full-time, permanent employees was | ||
| less than 50%. | ||
| (g) | The aggregate non-audit fees billed by the registrant’s accountant for services rendered to the | |
| registrant, and rendered to the registrant’s investment adviser (not including any sub-adviser | ||
| whose role is primarily portfolio management and is subcontracted with or overseen by another | ||
| investment adviser), and any entity controlling, controlled by, or under common control with | ||
| the adviser that provides ongoing services to the registrant for each of the last two fiscal years | ||
| of the registrant were as follows: | ||
| FY 2008: | $93,552 | |
| FY 2009: | $55,065 | |
| (h) | The registrant’s investment adviser and accountant have notified the registrant’s audit | |
| committee of all non-audit services that were rendered by the registrant’s accountant to the | ||
| registrant’s investment adviser, its parent company, and any entity controlled by, or under | ||
| common control with the investment adviser that provides services to the registrant, which | ||
| services were not required to be pre-approved pursuant to paragraph (c)(7)(ii) of Rule 2-01 of | ||
| Regulation S-X. The notification provided to the registrant’s audit committee included | ||
| sufficient details regarding such services to allow the registrant’s audit committee to consider | ||
| the continuing independence of its principal accountant. | ||
| ITEM 5. AUDIT COMMITTEE OF LISTED REGISTRANTS. | ||
| Not applicable. | ||
| ITEM 6. INVESTMENTS. | |
| (a) | The schedule of investments is included as part of the report to stockholders filed under Item 1 |
| of this Form. | |
| (b) | Not applicable. |
| ITEM 7. DISCLOSURE OF PROXY VOTING POLICIES AND PROCEDURES FOR | |
| CLOSED-END MANAGEMENT INVESTMENT COMPANIES. | |
| Not applicable. | |
| ITEM 8. PORTFOLIO MANAGERS OF CLOSED-END MANAGEMENT | |
| INVESTMENT COMPANIES. | |
| Not applicable. | |
| ITEM 9. PURCHASES OF EQUITY SECURITIES BY CLOSED-END MANAGEMENT | |
| INVESTMENT COMPANY AND AFFILIATED PURCHASERS. | |
| Not applicable. | |
| ITEM 10. SUBMISSION OF MATTERS TO A VOTE OF SECURITY HOLDERS. | |
| During the reporting period, there were no material changes to the procedures by which shareholders may | |
| recommend nominees to the registrant’s board. | |
| ITEM 11. CONTROLS AND PROCEDURES. | |
| (a) | The registrant's principal executive officer and principal financial officer have concluded that |
| the registrant's disclosure controls and procedures (as defined in Rule 30a-3(c) under the | |
| Investment Company Act of 1940) are effective based on their evaluation of these controls and | |
| procedures as of a date within 90 days of the filing date of this report. | |
| (b) | There were no changes in the registrant's internal control over financial reporting (as defined in |
| Rule 30a-3(d) under the Investment Company Act of 1940) that occurred during the registrant's | |
| second fiscal quarter of the period covered by this report that have materially affected, or are | |
| reasonably likely to materially affect, the registrant's internal control over financial reporting. | |
| ITEM 12. EXHIBITS. | |
| (a)(1) | Registrant’s Code of Ethics for Senior Financial Officers, which is the subject of the disclosure |
| required by Item 2 of Form N-CSR, was filed as Exhibit 12(a)(1) to American Century Asset | |
| Allocation Portfolios, Inc.’s Certified Shareholder Report on Form N-CSR, File No. 811-21591, | |
| on September 29, 2005. | |
| (a)(2) | Separate certifications by the registrant’s principal executive officer and principal financial |
| officer, pursuant to Section 302 of the Sarbanes-Oxley Act of 2002 and Rule 30a-2(a) under the | |
| Investment Company Act of 1940, are filed and attached hereto as EX-99.CERT. | |
| (a)(3) | Not applicable. |
| (b) | A certification by the registrant’s chief executive officer and chief financial officer, pursuant to |
| Section 906 of the Sarbanes-Oxley Act of 2002, is furnished and attached hereto as EX- | |
| 99.906CERT. |
SIGNATURES
Pursuant to the requirements of the Securities Exchange Act of 1934 and the Investment Company Act of 1940, the registrant has duly caused this report to be signed on its behalf by the undersigned, thereunto duly authorized.
| Registrant: | American Century World Mutual Funds, Inc. | |
| By: | /s/ Jonathan S. Thomas | |
| Name: | Jonathan S. Thomas | |
| Title: | President | |
| Date: | January 29, 2010 | |
Pursuant to the requirements of the Securities Exchange Act of 1934 and the Investment Company Act of 1940, this report has been signed below by the following persons on behalf of the registrant and in the capacities and on the dates indicated.
| By: | /s/ Jonathan S. Thomas | |
| Name: | Jonathan S. Thomas | |
| Title: | President | |
| (principal executive officer) | ||
| Date: | January 29, 2010 | |
| By: | /s/ Robert J. Leach | |
| Name: | Robert J. Leach | |
| Title: | Vice President, Treasurer, and | |
| Chief Financial Officer | ||
| (principal financial officer) | ||
| Date: | January 29, 2010 | |