0000874766srt:AMBestARatingMember2021-12-310000874766hig:PCPersonalLinesMemberhig:HomeownersMemberus-gaap:ShortdurationInsuranceContractsAccidentYear2013Member2015-12-31
UNITED STATES
SECURITIES AND EXCHANGE COMMISSION
Washington, D.C. 20549
FORM 10-K
(Mark One)
| ☑ | ANNUAL REPORT PURSUANT TO SECTION 13 OR 15(d) OF THE SECURITIES EXCHANGE ACT OF 1934 | |||||||
For the fiscal year ended December 31, 2021
or
| ☐ | TRANSITION REPORT PURSUANT TO SECTION 13 OR 15(d) OF THE SECURITIES EXCHANGE ACT OF 1934 | |||||||
For the transition period from to
Commission file number 001-13958

THE HARTFORD FINANCIAL SERVICES GROUP, INC.
(Exact name of registrant as specified in its charter)
| Delaware | 13-3317783 | |||||||
| (State or other jurisdiction of incorporation or organization) | (I.R.S. Employer Identification No.) | |||||||
One Hartford Plaza, Hartford, Connecticut 06155
(Address of principal executive offices) (Zip Code)
(860) 547-5000
(Registrant’s telephone number, including area code)
SECURITIES REGISTERED PURSUANT TO SECTION 12 (b) OF THE ACT:
| Title of each class | Trading Symbol(s) | Name of each exchange on which registered | ||||||
| Common Stock, par value $0.01 per share | HIG | The New York Stock Exchange | ||||||
| 6.10% Notes due October 1, 2041 | HIG 41 | The New York Stock Exchange | ||||||
| 7.875% Fixed-to-Floating Rate Junior Subordinated Debentures due 2042 | HGH | The New York Stock Exchange | ||||||
| Depositary Shares, Each Representing a 1/1,000th Interest in a Share of 6.000% Non-Cumulative Preferred Stock, Series G, par value $0.01 per share | HIG PR G | The New York Stock Exchange | ||||||
SECURITIES REGISTERED PURSUANT TO SECTION 12 (g) OF THE ACT:
None
| Indicate by check mark: | |||||||||||||||||
| • | if the registrant is a well-known seasoned issuer, as defined in Rule 405 of the Securities Act. | Yes | ☑ | No | |||||||||||||
| • | if the registrant is not required to file reports pursuant to Section 13 or Section 15(d) of the Exchange Act. | Yes | No | ☑ | |||||||||||||
| • | whether the registrant (1) has filed all reports required to be filed by Section 13 or 15(d) of the Securities Exchange Act of 1934 during the preceding 12 months (or for such shorter period that the registrant was required to file such reports), and (2) has been subject to such filing requirements for the past 90 days. | Yes | ☑ | No | |||||||||||||
| • | whether the registrant has submitted electronically every Interactive Data File required to be submitted pursuant to Rule 405 of Regulation S-T during the preceding 12 months (or for such shorter period that the registrant was required to submit such files). | Yes | ☑ | No | |||||||||||||
| • | whether the registrant is a large accelerated filer, an accelerated filer, a non-accelerated filer, a smaller reporting company or an emerging growth company. See definitions of “large accelerated filer,” “accelerated filer,” “smaller reporting company” and "emerging growth company" in Rule 12b-2 of the Exchange Act. | ||||||||||||||||
| Large accelerated filer | ☑ | Accelerated filer | ☐ | Non-accelerated filer | ☐ | Smaller reporting company | ☐ | Emerging growth company | ☐ | ||||||||||||||||||||
If an emerging growth company, indicate by check mark if the registrant has elected not to use the extended transition period for complying with any new or revised financial accounting standards provided pursuant to Section 13(a) of the Exchange Act.
Indicate by check mark whether the registrant has filed a report on and attestation to its management’s assessment of the effectiveness of its internal control over financial reporting under Section 404(b) of the Sarbanes-Oxley Act (15 U.S.C. 7262(b)) by the registered public accounting firm that prepared or issued its audit report. ☑
| • whether the registrant is a shell company (as defined in Rule 12b-2 of the Exchange Act). | Yes | ☐ | No | ☑ | ||||||||||
The aggregate market value of the shares of Common Stock held by non-affiliates of the registrant as of June 30, 2021 was approximately $22 billion, based on the closing price of $61.97 per share of the Common Stock on the New York Stock Exchange on June 30, 2021.
As of February 17, 2022, there were outstanding 331,646,836 shares of Common Stock, $0.01 par value per share, of the registrant.
Documents Incorporated by Reference
Portions of the registrant’s definitive proxy statement for its 2022 annual meeting of stockholders are incorporated by reference in Part III of this Form 10-K.
THE HARTFORD FINANCIAL SERVICES GROUP, INC.
ANNUAL REPORT ON FORM 10-K
FOR THE FISCAL YEAR ENDED DECEMBER 31, 2021
TABLE OF CONTENTS
| Item | Description | Page | ||||||
| 1 | ||||||||
| 1A. | ||||||||
| 1B. | UNRESOLVED STAFF COMMENTS | None | ||||||
| 2 | ||||||||
| 3 | ||||||||
| 4 | MINE SAFETY DISCLOSURES | Not Applicable | ||||||
| 5 | ||||||||
| 6 | RESERVED | None | ||||||
| 7 | ||||||||
| 7A. | QUANTITATIVE AND QUALITATIVE DISCLOSURES ABOUT MARKET RISK | [a] | ||||||
| 8 | FINANCIAL STATEMENTS AND SUPPLEMENTARY DATA | [b] | ||||||
| 9 | CHANGES IN AND DISAGREEMENTS WITH ACCOUNTANTS ON ACCOUNTING AND FINANCIAL DISCLOSURE | None | ||||||
| 9A. | ||||||||
| 9B. | OTHER INFORMATION | None | ||||||
| 10 | ||||||||
| 11 | EXECUTIVE COMPENSATION | [c] | ||||||
| 12 | ||||||||
| 13 | CERTAIN RELATIONSHIPS AND RELATED TRANSACTIONS, AND DIRECTOR INDEPENDENCE | [d] | ||||||
| 14 | PRINCIPAL ACCOUNTING FEES AND SERVICES | [e] | ||||||
| 15 | ||||||||
| 16 | FORM 10-K SUMMARY | Not Applicable | ||||||
[a] The information required by this item is set forth in the Enterprise Risk Management section of Item 7, Management's Discussion and Analysis of Financial Condition and Results of Operations and is incorporated herein by reference.
[b] See Index to Consolidated Financial Statements and Schedules elsewhere herein.
[c] The information called for by Item 11 will be set forth in the Proxy Statement under the subcaptions "Compensation Discussion and Analysis", "Executive Compensation", "Director Compensation", "Report of the Compensation and Management Development Committee", and "Compensation and Management Development Committee Interlocks and Insider Participation" and is incorporated herein by reference.
[d] Any information called for by Item 13 will be set forth in the Proxy Statement under the caption and subcaption "Board and Governance Matters" and "Director Independence" and is incorporated herein by reference.
[e] The information called for by Item 14 will be set forth in the Proxy Statement under the caption "Audit Matters" and is incorporated herein by reference.
3
Forward-looking Statements
Certain of the statements contained herein are forward-looking statements made pursuant to the safe harbor provisions of the Private Securities Litigation Reform Act of 1995. Forward-looking statements can be identified by words such as “anticipates,” “intends,” “plans,” “seeks,” “believes,” “estimates,” “expects,” “projects,” and similar references to future periods.
Forward-looking statements are based on management's current expectations and assumptions regarding future economic, competitive, legislative and other developments and their potential effect upon The Hartford Financial Services Group, Inc. and its subsidiaries (collectively, the "Company" or "The Hartford"). Because forward-looking statements relate to the future, they are subject to inherent uncertainties, risks and changes in circumstances that are difficult to predict. Actual results could differ materially from expectations depending on the evolution of various factors, including the risks and uncertainties identified below, as well as factors described in such forward-looking statements; or in Part I, Item 1A, Risk Factors, in Part II, Item 7. Management's Discussion and Analysis of Financial Condition and Results of Operations, and those identified from time to time in our other filings with the Securities and Exchange Commission.
•Risks relating to the continued COVID-19 pandemic, including impacts to the Company's insurance and product-related, regulatory/legal, recessionary and other global economic, capital and liquidity and operational risks
•Risks Relating to Economic, Political and Global Market Conditions:
◦challenges related to the Company’s current operating environment, including global political, economic and market conditions, and the effect of financial market disruptions, economic downturns, changes in trade regulation including tariffs and other barriers or other potentially adverse macroeconomic developments on the demand for our products and returns in our investment portfolios;
◦market risks associated with our business, including changes in credit spreads, equity prices, interest rates, inflation rate, foreign currency exchange rates and market volatility;
◦the impact on our investment portfolio if our investment portfolio is concentrated in any particular segment of the economy;
◦the impacts of changing climate and weather patterns on our businesses, operations and investment portfolio including on claims, demand and pricing of our products, the availability and cost of reinsurance, our modeling data used to evaluate and manage risks of catastrophes and severe weather events, the value of our investment portfolios and credit risk with reinsurers and other counterparties;
◦the risks associated with the discontinuance of the London Inter-Bank Offered Rate ("LIBOR") on the securities we hold or may have issued, other financial instruments and any other assets and liabilities whose value is tied to LIBOR;
•Insurance Industry and Product-Related Risks:
◦the possibility of unfavorable loss development, including with respect to long-tailed exposures;
◦the significant uncertainties that limit our ability to estimate the ultimate reserves necessary for asbestos and environmental claims;
◦the possibility of another pandemic, civil unrest, earthquake, or other natural or man-made disaster that may adversely affect our businesses;
◦weather and other natural physical events, including the intensity and frequency of thunderstorms, tornadoes, hail, wildfires, flooding, winter storms, hurricanes and tropical storms, as well as climate change and its potential impact on weather patterns;
◦the possible occurrence of terrorist attacks and the Company’s inability to contain its exposure as a result of, among other factors, the inability to exclude coverage for terrorist attacks from workers' compensation policies and limitations on reinsurance coverage from the federal government under applicable laws;
◦the Company’s ability to effectively price its property and casualty policies, including its ability to obtain regulatory consents to pricing actions or to non-renewal or withdrawal of certain product lines;
◦actions by competitors that may be larger or have greater financial resources than we do;
◦technological changes, including usage-based methods of determining premiums, advancements in automotive safety features, the development of autonomous vehicles, and platforms that facilitate ride sharing,
◦the Company's ability to market, distribute and provide insurance products and investment advisory services through current and future distribution channels and advisory firms;
◦the uncertain effects of emerging claim and coverage issues;
•Financial Strength, Credit and Counterparty Risks:
◦risks to our business, financial position, prospects and results associated with negative rating actions or downgrades in the Company’s financial strength and credit ratings or negative rating actions or downgrades relating to our investments;
4
◦capital requirements which are subject to many factors, including many that are outside the Company’s control, such as National Association of Insurance Commissioners ("NAIC") risk based capital formulas, rating agency capital models, Funds at Lloyd's and Solvency Capital Requirement, which can in turn affect our credit and financial strength ratings, cost of capital, regulatory compliance and other aspects of our business and results;
◦losses due to nonperformance or defaults by others, including credit risk with counterparties associated with investments, derivatives, premiums receivable, reinsurance recoverables and indemnifications provided by third parties in connection with previous dispositions;
◦the potential for losses due to our reinsurers' unwillingness or inability to meet their obligations under reinsurance contracts and the availability, pricing and adequacy of reinsurance to protect the Company against losses;
◦state and international regulatory limitations on the ability of the Company and certain of its subsidiaries to declare and pay dividends;
•Risks Relating to Estimates, Assumptions and Valuations:
◦risk associated with the use of analytical models in making decisions in key areas such as underwriting, pricing, capital management, reserving, investments, reinsurance and catastrophe risk management;
◦the potential for differing interpretations of the methodologies, estimations and assumptions that underlie the Company’s fair value estimates for its investments and the evaluation of intent-to-sell impairments and allowance for credit losses on available-for-sale securities and mortgage loans;
◦the potential for impairments of our goodwill;
•Strategic and Operational Risks:
◦the Company’s ability to maintain the availability of its systems and safeguard the security of its data in the event of a disaster, cyber or other information security incident or other unanticipated event;
◦the potential for difficulties arising from outsourcing and similar third-party relationships;
◦the risks, challenges and uncertainties associated with capital management plans, expense reduction initiatives and other actions;
◦risks associated with acquisitions and divestitures, including the challenges of integrating acquired companies or businesses, which may result in our inability to achieve the anticipated benefits and synergies and may result in unintended consequences;
◦difficulty in attracting and retaining talented and qualified personnel, including key employees, such as executives, managers and employees with strong technological, analytical and other specialized skills;
◦the Company’s ability to protect its intellectual property and defend against claims of infringement;
•Regulatory and Legal Risks:
◦the cost and other potential effects of increased federal, state and international regulatory and legislative developments, including those that could adversely impact the demand for the Company’s products, operating costs and required capital levels;
◦unfavorable judicial or legislative developments;
◦the impact of changes in federal, state or foreign tax laws;
◦regulatory requirements that could delay, deter or prevent a takeover attempt that stockholders might consider in their best interests; and
◦the impact of potential changes in accounting principles and related financial reporting requirements.
Any forward-looking statement made by the Company in this document speaks only as of the date of the filing of this Form 10-K. Factors or events that could cause the Company’s actual results to differ may emerge from time to time, and it is not possible for the Company to predict all of them. The Company undertakes no obligation to publicly update any forward-looking statement, whether as a result of new information, future developments or otherwise.
5
Part I - Item 1. Business
| Item 1. | ||||||||||||||
BUSINESS
(Dollar amounts in millions, except for per share data, unless otherwise stated)
GENERAL
The Hartford Financial Services Group, Inc. (together with its subsidiaries, “The Hartford”, the “Company”, “we”, or “our”) is a holding company for a group of subsidiaries that provide property and casualty ("P&C") insurance, group benefits insurance and services, and mutual funds and exchange-traded products to individual and business customers in the United States as well as in the United Kingdom and other international locations. The Hartford is headquartered in Connecticut and its oldest subsidiary, Hartford Fire Insurance Company, dates back to 1810. At December 31, 2021, total assets and total stockholders’ equity of The Hartford were $76.6 billion and $17.8 billion, respectively.
ORGANIZATION
The Hartford strives to maintain and enhance its position as a market leader within the financial services industry. The Company sells diverse and innovative products through multiple distribution channels to individuals and businesses and is considered a leading property and casualty and employee group benefits insurer. The Hartford Stag logo is one of the most recognized symbols in the financial services industry.
As a holding company, The Hartford Financial Services Group, Inc. is separate and distinct from its subsidiaries and has no significant business operations of its own. The holding company relies on the dividends from its insurance companies and other subsidiaries as the principal source of cash flow to meet its obligations, pay dividends and repurchase common stock.
Information regarding the cash flow and liquidity needs of The Hartford Financial Services Group, Inc. may be found in Part II, Item 7, Management’s Discussion and Analysis of Financial Condition and Results of Operations (“MD&A”) — Capital Resources and Liquidity.
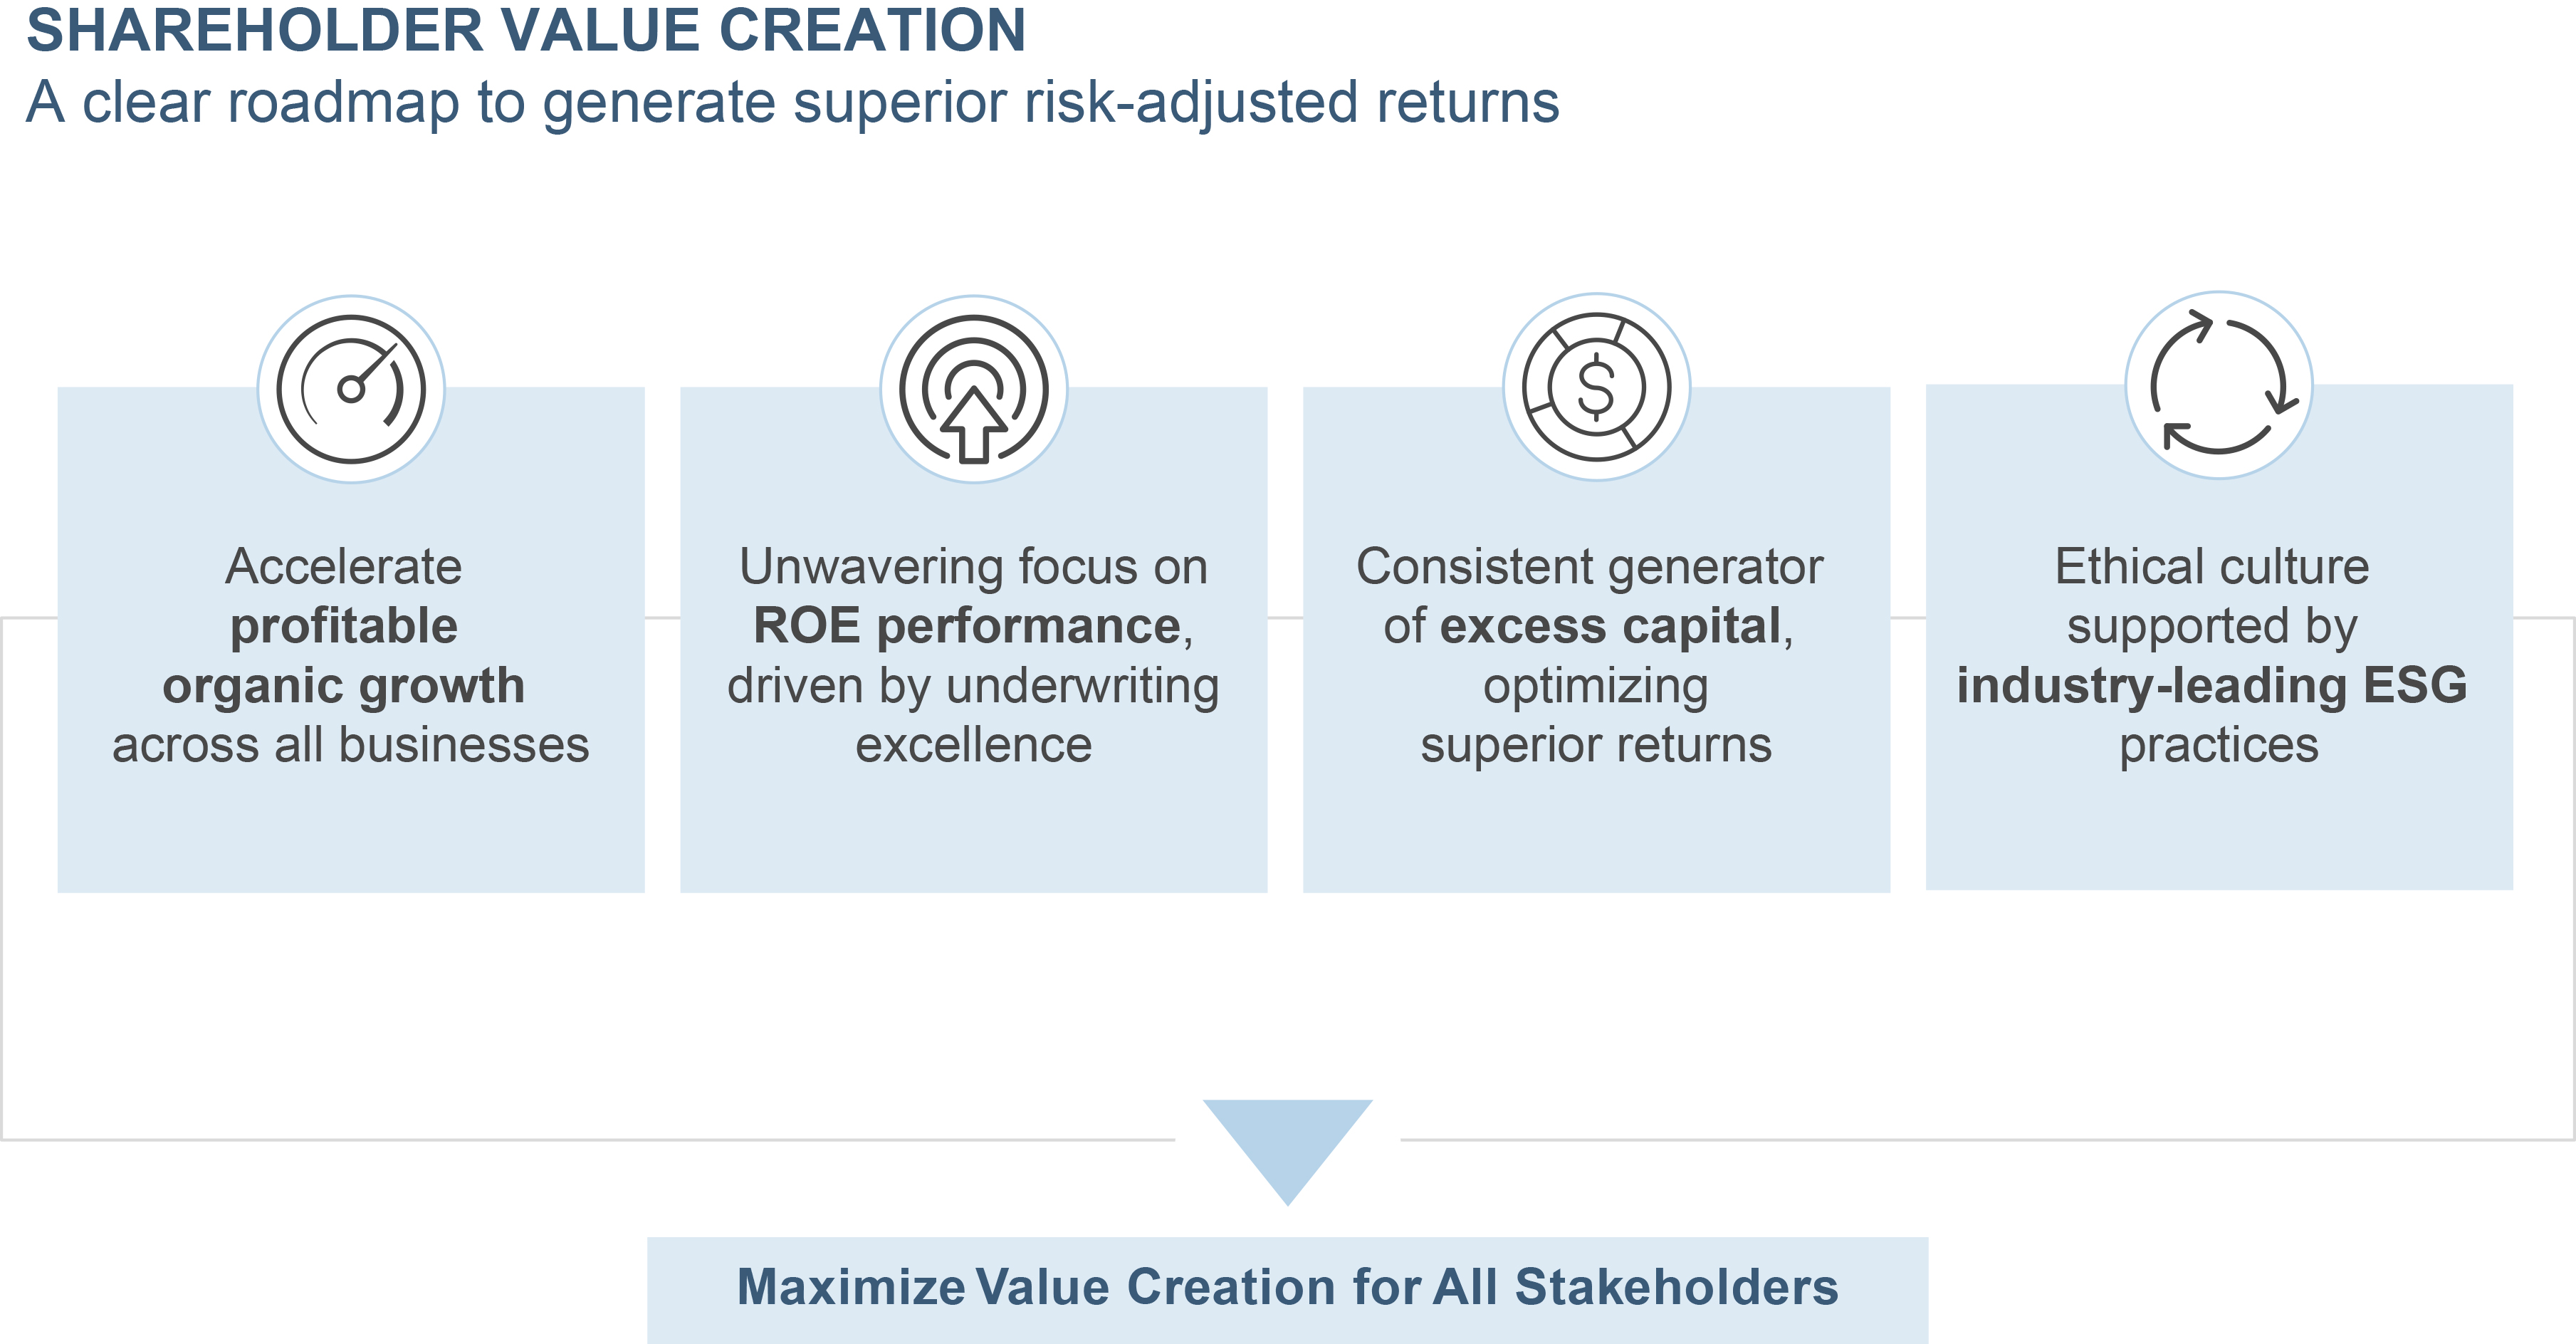
PURPOSE and STRATEGIC PRIORITIES
The Hartford’s mission is to provide people with the support and protection they need to pursue their unique ambitions, seize opportunity, and prevail through unexpected challenge. Our strategy to maximize value creation for all stakeholders focuses on advancing underwriting excellence, emphasizing digital capabilities, maximizing distribution channels, optimizing organizational efficiency, and advancing environmental, social and governance ("ESG") leadership.
We endeavor to maintain and enhance our position as a market leader by leveraging our core strengths of underwriting excellence, risk management, claims, product development and distribution. We are investing in claims, analytics, data science and digital capabilities to strengthen our existing competitive advantages.
An ethics, people, and performance-driven culture drives our values. We have proactive positions on ESG issues important to our sustainability, and our capacity to deliver long-term stockholder value.
6
Part I - Item 1. Business
2022 Priorities
As we enter 2022, our strategy remains consistent and we are focused on the following priorities across our businesses:
•Advancing leading underwriting capabilities across our portfolio to offer expanded products and services;
•Emphasizing digital, data and analytics, and data science that enhance the customer experience and improve the underwriting and claims decision making;
•Maximizing distribution channels and product breadth to increase market share;
•Optimizing organizational efficiency with a focus on continuous improvement. For information on the Company’s operational transformation and cost reduction plan (called “Hartford Next”), refer to The Hartford’s Operations section of Part II - Item 7. Management's Discussion and Analysis of Financial Condition and Results of Operations. Before considering investments in new products and technology, we are on track to achieve a reduction in annual insurance operating costs and other expenses of approximately $540 in 2022 and $625 in 2023, relative to 2019;
•Balancing capital deployment for organic growth, investments in the business, and return to stockholders through dividends and share repurchases; and
•Continuing to advance ESG leadership in order to attract and retain top talent and enhance value to stockholders. For more information on retaining and attracting talent through our diversity, equity and inclusion initiatives, refer to the Human Capital Resources section of Part 1, Item 1.
Within our businesses, we will continue to pursue objectives specific to each, including:
Commercial Lines
•Benefiting from a firm pricing environment in most property and liability lines while navigating continued pricing pressure in workers’ compensation by staying disciplined in our underwriting;
•Successfully leveraging our broader underwriting capabilities, product breadth, risk appetite and expanded access to cross-sell global specialty product lines to customers of small commercial and middle & large commercial, and grow specialized verticals in middle & large commercial;
•Accelerating use of data, digital technology and voice of customer to transform and differentiate our business; and
•Expanding distribution to match customers’ preferred access points.
Personal Lines
•Continuing to transform our products, regain competitive momentum, and grow top-line through the continued rollout of our new automobile and homeowners product, Prevail, which is tailored to the
mature market and includes digital service capabilities that provide real time transaction support;
•Transforming underwriting to improve member experience and reduce expense;
•Driving new business growth in AARP Direct through direct marketing initiatives designed to increase conversion rates; and
•Expanding use of telematics and investing in digital capabilities.
Group Benefits
•Continuing to grow revenues through strong sales and persistency;
•Expanding absence/leave management capabilities and pursuing product innovation to meet the rapidly evolving needs of employers and employees;
•Continuing to grow market share of voluntary product offerings, including supplemental health coverage, as well as new state paid family and medical leave;
•Completing the implementation of our disability and leave management claims platform, The Hartford Ability Advantage, to enhance the overall customer experience and accommodate the Company’s leave management programs; and
•Investing in data and analytics to enhance risk management and reinvent processes at the intersection of data, analytics, artificial intelligence and technology.
Hartford Funds
•Driving organic growth across key distribution channels;
•Working with subadvisors to launch products to meet the needs of financial advisors and their clients.
REPORTING SEGMENTS
The Hartford conducts business principally in five reporting segments including Commercial Lines, Personal Lines, Property & Casualty Other Operations, Group Benefits and Hartford Funds, as well as a Corporate category. The Company includes in the Corporate category reserves for run-off structured settlement and terminal funding agreement liabilities, restructuring costs, capital raising activities (including equity financing, debt financing and related interest expense), transaction expenses incurred in connection with acquisitions, certain M&A costs, purchase accounting adjustments related to goodwill and other expenses not allocated to the reporting segments. Corporate also includes investment management fees and expenses related to managing third party business, including management of a portion of the invested assets of Talcott Resolution Life, Inc. and its subsidiaries as well as certain affiliates. Talcott Resolution Life, Inc. is the holding company of the life and annuity business that we sold in May 2018. In addition, up until June 30, 2021, Corporate included a 9.7% ownership interest in Hopmeadow Holdings LP, the legal entity that acquired Talcott Resolution in May 2018
7
Part I - Item 1. Business
(Hopmeadow Holdings, LP, Talcott Resolution Life Inc., and its subsidiaries are collectively referred to as “Talcott Resolution”).
2021 Revenues of $22,390 by Segment
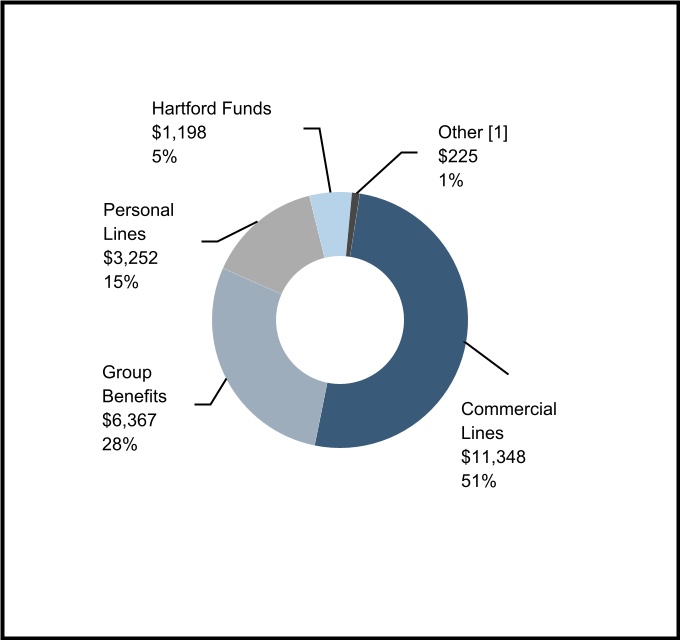
[1]Includes Revenue of $88 for Property & Casualty Other Operations and $137 for Corporate.
The following discussion describes the principal products and services, marketing and distribution, and competition of The Hartford's reporting segments. For further discussion of the reporting segments, including financial disclosures of revenues by product line, net income (loss), and assets for each reporting segment, see Note 4 - Segment Information of Notes to Consolidated Financial Statements.
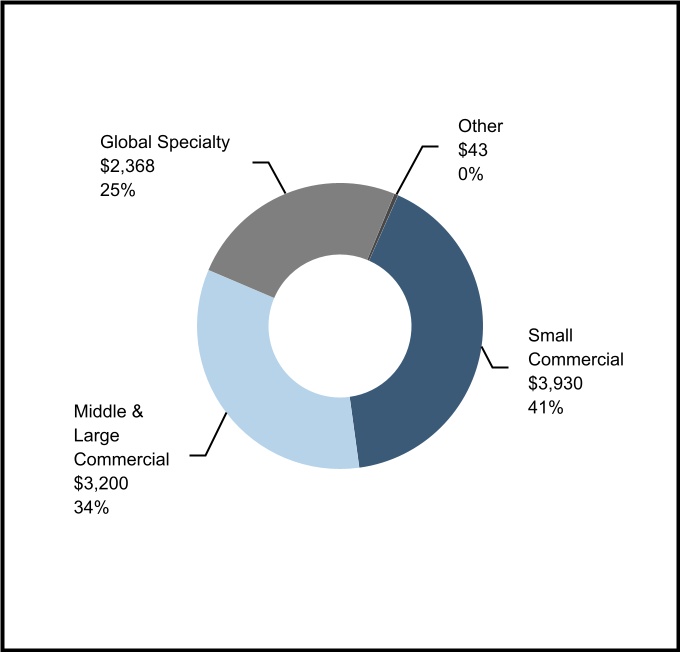
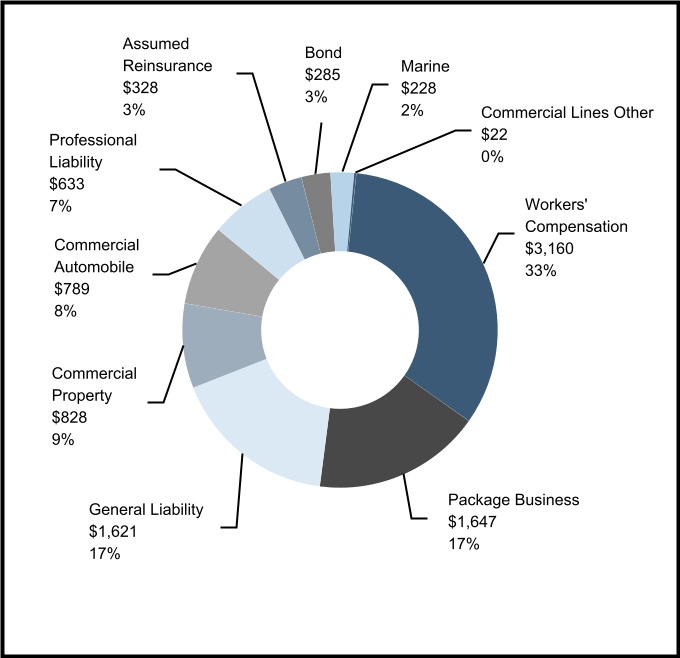
|COMMERCIAL LINES | ||
2021 Earned Premiums of $9,541 by Line of Business
2021 Earned Premiums of $9,541 by Product
8
Part I - Item 1. Business
Principal Products and Services
| Automobile | Covers damage to a business's fleet of vehicles due to collision or other perils (automobile physical damage). In addition to first party automobile physical damage, commercial automobile covers liability for bodily injuries and property damage suffered by third parties and losses caused by uninsured or under-insured motorists. | ||||
| Property | Covers the building a business owns or leases as well as its personal property, including tools and equipment, inventory, and furniture. A commercial property insurance policy covers losses resulting from fire, wind, hail, earthquake, theft and other covered perils, including coverage for assets such as accounts receivable and valuable papers and records. Commercial property may include specialized equipment insurance, which provides coverage for loss or damage resulting from the mechanical breakdown of boilers and machinery. | ||||
| General Liability | Covers a business in the event it is sued for causing harm to a person and/or damage to property. General liability insurance covers third-party claims arising from accidents occurring on the insured’s premises or arising out of their operations. General liability insurance may also cover losses arising from product liability and provides replacement of lost income due to an event that interrupts business operations. | ||||
| Marine | Encompasses various ocean and inland marine coverages including cargo, craft, hull, specie, transport and liability, among others. | ||||
| Package Business | Covers both property and general liability damages. | ||||
| Workers' Compensation | Covers employers for losses incurred due to employees sustaining an injury, illness or disability in connection with their work. Benefits paid under workers’ compensation policies may include reimbursement of medical care costs, replacement income, compensation for permanent injuries and benefits to survivors. Workers’ compensation is provided under both guaranteed cost policies (coverage for a fixed premium) and loss sensitive policies where premiums are adjustable based on the loss experience of the employer. | ||||
| Professional Liability | Covers liability arising from directors and officers acting in their official capacity and liability for errors and omissions committed by professionals and others. Coverage may also provide employment practices insurance relating to allegations of wrongful termination and discrimination. | ||||
| Bond | Encompasses fidelity and surety insurance, including commercial surety, contract surety and fidelity bonds. Commercial surety includes bonds that insure non-performance by contractors, license and permit bonds to help meet government-mandated requirements and probate and judicial bonds for fiduciaries and civil court proceedings. Contract surety bonds may include payment and performance bonds for contractors. Fidelity bonds may include ERISA bonds related to the handling of retirement plan assets and bonds protecting against employee theft or fraud. The Company also provides credit and political risk insurance offered to clients with global operations. | ||||
| Assumed Reinsurance | Includes assumed reinsurance of property, liability, surety, credit and political, marine and agriculture risks throughout the world but principally in Europe and the Americas. Business principally provides cover on broad books of business (i.e. treaty), as opposed to individual risks (i.e. facultative). | ||||
Through its three lines of business of small commercial, middle & large commercial, and global specialty, Commercial Lines offers its products and services to businesses in the United States ("U.S.") and internationally. Commercial Lines generally consists of products written for small businesses and middle market companies as well as national and multi-national accounts, largely distributed through retail agents and brokers, wholesale agents and global and specialty reinsurance brokers. The majority of Commercial Lines written premium is generated by small commercial and middle market lines, which provide coverage options and customized pricing based on the policyholder’s individual risk characteristics. Small commercial and middle market lines within middle & large commercial are generally referred to as standard commercial lines.
Small commercial provides coverages for small businesses, which the Company generally considers to be businesses with an annual payroll under $20, revenues under $50 and property values less than $20 per location. Primary coverages provided include workers' compensation, property, general liability and commercial automobile. Within small commercial, both property and general liability coverages are offered under a single package policy, marketed under the Spectrum name. Small commercial also provides excess and surplus lines coverage to small businesses including umbrella, general liability, property and other coverages.
Middle & large commercial business provides insurance coverages to medium-sized and national accounts businesses, which are companies whose payroll, revenue and property values exceed the small business definition. In addition to offering standard commercial lines products, including workers' compensation, property, general liability and commercial automobile products, middle & large commercial includes program business which provides tailored programs, primarily to customers with common risk characteristics. On national accounts, a significant portion of the business is written through large deductible programs. Other programs written within middle & large commercial are retrospectively-rated where the ultimate premium collected from the insured is adjusted based on how incurred losses for the policy year develop over time, subject to a minimum and maximum premium. Also within middle & large commercial, the Company writes captive programs business, which provides tailored programs to those seeking a loss sensitive solution where premiums are adjustable based on loss experience.
Lines of business written by small commercial and middle & large commercial are subject to rate regulation and written pricing increases or decreases partly in response to loss cost trends. Workers’ compensation rates are based on loss experience and are informed by data submitted through the National Council on Compensation Insurance ("NCCI"). Workers’ compensation rates have been under downward pressure for the industry due to favorable loss cost trends in
9
Part I - Item 1. Business
recent years, including due to lower claim frequency that occurred during the pandemic.
Global specialty provides a variety of customized insurance products, including property, liability, marine, professional liability, and bond. The vast majority of the business written by our Navigators Group insurance subsidiaries is reported in the global specialty business unit.
Marketing and Distribution
Commercial Lines provides insurance products and services through the Company’s regional offices, branches and sales and policyholder service centers throughout the United States and, to a lesser extent, overseas, principally in the United Kingdom. The products are marketed and distributed using independent retail agents and brokers, wholesale agents and global and specialty reinsurance brokers, with business also sold direct-to-consumer. In addition, the Company offers insurance products to customers of payroll service providers through its relationships with major national payroll companies in the United States and to members of affinity organizations. As the sole corporate member of Lloyd's Syndicate 1221 ("Lloyd's Syndicate"), the Company has the exclusive right to underwrite business up to an approved level of premium in the Lloyd’s market.
In the United States, independent agents, brokers and wholesalers are consolidating and this trend is expected to continue. This will likely result in a larger proportion of written premium being concentrated among fewer agents, brokers and wholesalers. These distribution partners are leveraging data and analytics for bargaining power.
Competition
Small Commercial
In small commercial, The Hartford competes against large national carriers, regional carriers and direct writers. Competitors include stock companies, mutual companies and other underwriting organizations. The small commercial market remains highly competitive and fragmented as carriers seek to differentiate themselves through product expansion, price, enhanced service and leading technology. Larger carriers such as The Hartford are continually advancing their pricing sophistication and ease of doing business with agents and customers through the use of technology, analytics and other capabilities that improve the process of evaluating a risk, quoting new business and servicing customers. The Company also continuously enhances digital capabilities as customers and distributors demand more access and convenience, and expands product and underwriting capabilities to accommodate both larger accounts and a broader risk appetite.
Existing competitors and new entrants, including start-up and non-traditional carriers, are actively looking to expand sales of business insurance products to small businesses through increasing their underwriting appetite, deepening their relationships with distribution partners, and through on-line and direct-to-consumer marketing. Carriers that can quote business in an automated way have a competitive advantage by shortening the time from quoting to issuance. Through its ICON quoting tool, The Hartford quotes over 70% of its Spectrum package business and workers’ compensation new business policies without human intervention.
Middle & Large Commercial
Middle & large commercial business is considered “high touch” and involves individual underwriting and pricing decisions. Competition in this market includes stock companies, mutual companies, alternative risk sharing groups and other underwriting organizations. In addition, some larger brokers are now becoming competitors through acquisition of managing general agents or managing general underwriters. Carriers in this marketplace seek to differentiate their product offerings, including by leveraging their umbrella and excess liability underwriting capacity to sell other lines of business. The pricing of middle market and national accounts is prone to significant volatility over time due to changes in individual account characteristics and exposure, as well as legislative and macro-economic forces. National and regional carriers participate in the middle & large commercial insurance sector, resulting in a competitive environment where pricing and policy terms are critical to securing new business and retaining existing accounts. Within this competitive environment, The Hartford is working to deepen its product and underwriting capabilities, leverage its sales and underwriting talent and expand its use of data analytics and third party data to make risk selection and pricing decisions. In product development and related areas such as claims and risk engineering, the Company has extended its capabilities in industry verticals, such as energy, construction, technology and life sciences.
Through business partners, the Company offers business insurance coverages to exporters and other U.S. companies with a physical presence overseas. The Hartford’s middle & large commercial business will leverage the investments in product, underwriting, and technology to better match price to individual risk as the firm pursues responsible growth strategies to deliver target returns.
For specialty casualty businesses within middle & large commercial, pricing competition continues to be significant, particularly for the larger individual accounts. As a means to mitigate the cost of insurance on larger accounts, more insureds may opt for loss-sensitive products, including retrospectively rated contracts, in lieu of guaranteed cost policies.
Global Specialty
Global specialty competes against multi-national insurance and reinsurance companies, writing marine, property, excess casualty, professional liability, bond and assumed reinsurance. Global specialty writes many surplus lines of business which are lines of business not written through standard products licensed or admitted in a state. Since 2010, surplus lines has accounted for an increasing share of total commercial lines industry direct written premiums.
Customers served by the global specialty marketplace expect tailored policy language for their unique risks and, increasingly, are looking for a single insurance carrier to meet all their coverage needs. The Company has been successful in cross-selling global specialty product lines acquired through the Navigators Insurance Group acquisition to customers of small commercial and of middle & large commercial and seeks to expand cross-sell opportunities in the future. The Hartford competes on the basis of its underwriting capabilities where it uses data and actuarial insights to enhance risk selection. The Company seeks to drive greater efficiency, shorten the quoting process and improve the customer’s experience through
10
Part I - Item 1. Business
expanded use of digital capabilities. While global specialty benefitted from firm market conditions in 2020 and 2021, more capital has entered the specialty lines marketplace, increasing competition and putting downward pressure on rates.
Lloyd's Syndicate and London market business have been under financial stress in recent years due to a perceived lack of adequate pricing and an excessive focus on growth at the expense of underwriting discipline in those markets, combined with a significant increase in the level of catastrophe activity. As such, syndicates and London market carriers, including The Hartford, have taken pricing and underwriting actions to improve
profitability. Lloyd's, which is regulated by the Financial Conduct Authority and Prudential Regulatory Authority in the U.K., has been implementing changes to improve performance of the syndicates including a more rigorous approach to the approval of syndicate business plans. Additionally, Lloyd’s has also introduced recent changes which require that members limit the amount of tier 2 capital (e.g. letters of credit) that can be used to meet syndicate solvency capital requirements. For further discussion, see Part II, Item 7, MD&A - Capital Resources and Liquidity.
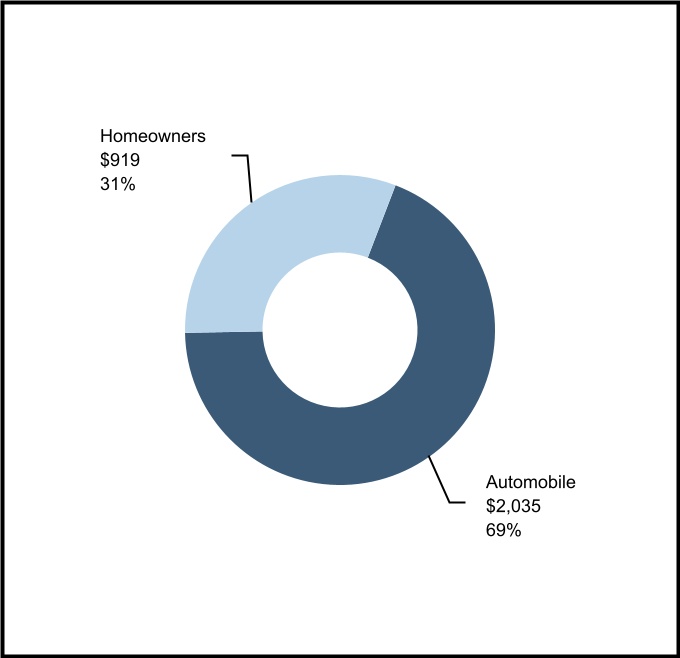
|PERSONAL LINES | ||
2021 Earned Premiums of $2,954 by Line of Business
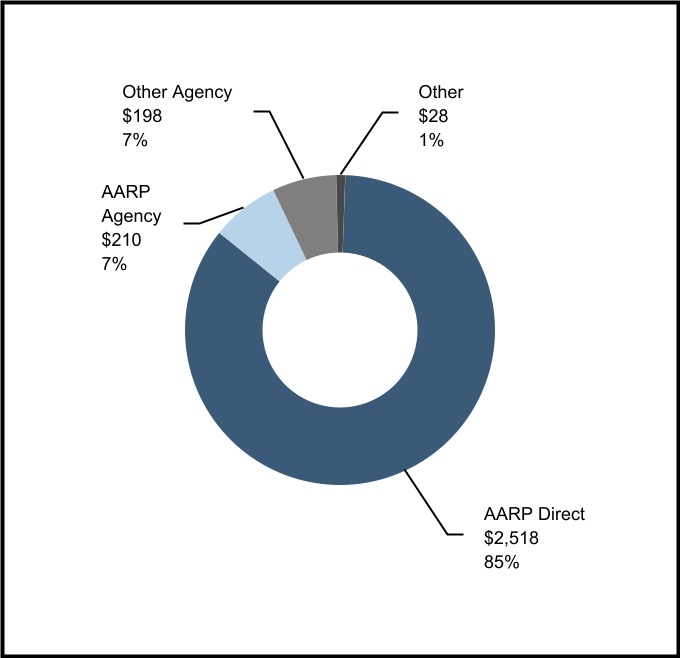
2021 Earned Premiums of $2,954 by Product
Principal Products and Services
| Automobile | Covers damage to an individual insured’s own vehicle due to collision or other perils and is referred to as automobile physical damage. In addition to first party automobile physical damage, automobile insurance covers liability for bodily injuries and property damage suffered by third parties and losses caused by uninsured or underinsured motorists. Also, under no-fault laws, policies written in some states provide first party personal injury protection. Some of the Company’s personal automobile insurance policies also offer personal umbrella liability coverage for an additional premium. | ||||
| Homeowners | Insures against losses to residences and contents from fire, wind and other perils. Homeowners insurance includes owned dwellings, rental properties and coverage for tenants. The policies may provide other coverages, including loss related to recreation vehicles or watercraft, identity theft and personal items such as jewelry. | ||||
Personal Lines provides automobile, homeowners and personal umbrella coverages to individuals across the United States, mostly through a program designed exclusively for members of AARP (“AARP Program”). The Hartford's automobile and homeowners products provide coverage options and pricing tailored to a customer's individual risk. The Hartford has individual customer relationships with AARP Program policyholders and, as a group, they represent a significant portion of the total Personal Lines' business. Business sold to AARP members, either direct or through independent agents, amounted to earned premiums of $2.7 billion, $2.8 billion and
$2.9 billion in 2021, 2020 and 2019, respectively. The AARP relationship provides The Company with a competitive advantage to capitalize on the continued growth of the over age-50 population.
During 2021, the Company began introducing its new product, Prevail, which is being rolled out for new business on a state-by-state basis through 2022 and into 2023 and was in seven states as of December, 2021. Prevail is tailored to the mature market and includes digital service capabilities that provide real time transaction support. Among other things, overall rate levels, price segmentation, rating factors and underwriting procedures
11
Part I - Item 1. Business
are being updated through the introduction of Prevail. Personal Lines works with carrier partners to provide risk protection options for AARP members with needs beyond the company’s current product offering.
Marketing and Distribution
Personal Lines reaches diverse customers through multiple distribution channels, including direct-to-consumer and independent agents. The direct-to-consumer channel continues to represent a larger share of the automobile insurance market, accounting for more than one-third of premiums. In direct-to-consumer, Personal Lines markets its products through a mix of media, including direct mail, digital marketing, television as well as digital and print advertising. Through the agency channel, Personal Lines provides products and services to customers through a network of independent agents in the standard personal lines market, primarily serving mature, preferred consumers. These independent agents are not employees of the Company.
Personal Lines has made significant investments in offering direct and agency-based customers the opportunity to interact with the company on-line, including via mobile devices. In addition, its technology platform for telephone sales centers enables sales representatives to provide an enhanced experience for direct-to-consumer customers, positioning the Company to offer unique capabilities to AARP’s member base.
Most of Personal Lines' sales are associated with its exclusive licensing arrangement with AARP, with the current agreement in place through December 31, 2032, to market automobile, homeowners and personal umbrella coverages to AARP's approximately 37 million members, primarily direct but also through independent agents. This relationship with AARP, which has been in place since 1984, provides Personal Lines with an important competitive advantage given the increase in the population of those over age 50 and the strength of the AARP brand.
New business premium growth partly depends on the rate that consumers shop for insurance and while shopping rates have generally rebounded since the depths of the pandemic, they have rebounded more slowly in the 50-plus age segment. Prior to May 2021, in most states, new business automobile and home policies were issued to AARP members with a lifetime continuation agreement endorsement, providing that the policies will be renewed as long as certain terms are met, such as timely payment of premium and maintaining a driver’s license in good standing. However, beginning in May 2021, Personal Lines no longer offers the lifetime continuation agreement to new business home and automobile policies. The endorsement will remain on renewal policies with original new business effective dates prior to May 2021.
In addition to selling to AARP members, Personal Lines offers its automobile and homeowners products to non-AARP customers, primarily through the independent agent channel within select underwriting markets where we believe we have a competitive advantage. Personal Lines leverages its agency channel to target AARP members and other customer segments that value the advice of an independent agent and recognize the differentiated experience the Company provides. In particular, the Company has taken action to distinguish its brand and improve profitability in the independent agent channel with fewer and more highly partnered agents.
Competition
The personal lines automobile and homeowners insurance markets are highly competitive. Personal lines insurance is written by insurance companies of varying sizes that compete principally on the basis of price, product, service, including claims handling, the insurer's ratings and brand recognition. Companies with strong ratings, recognized brands, direct sales capability and economies of scale will have a competitive advantage. Larger carriers have the advantage of economies of scale with the top ten personal lines insurers accounting for approximately 70% of market share.
In recent years, insurers have increased their advertising in the direct-to-consumer market in an effort to gain new business and retain profitable business. The growth of direct-to-consumer sales, including by new entrants to the marketplace, continues to outpace sales in the agency distribution channel.
Insurers that distribute products principally through agency channels compete by offering commissions and additional incentives to attract new business. To distinguish themselves in the marketplace, top tier insurers are offering on-line and self-service capabilities that make it easier for agents and consumers to do business with the insurer. A large majority of agents have been using “comparative rater” tools that allow the agent to compare premium quotes among several insurance companies. The use of comparative rater tools increases price competition. Insurers that are able to capitalize on their brand and reputation, differentiate their products and deliver strong customer service are more likely to be successful in this market.
The use of data mining and predictive modeling is used by more and more carriers to target the most profitable business, and carriers have further segmented their pricing plans to expand market share in what they believe to be the most profitable segments. The Company continues to invest in capabilities to better utilize data and analytics, and thereby, refine and manage underwriting and pricing. Carriers, including The Hartford, have invested in telematics capabilities to enable better risk selection and pricing segmentation in response to changes in driving patterns. In 43 states, the Hartford offers its telematics program, TrueLane, which offers discounts for good driving behavior based on such attributes as braking, speed, distracted driving, and acceleration.
Also, new automobile technology advancements, including lane departure warnings, backup cameras, automatic braking and active collision alerts, are being deployed rapidly and are expected to improve driver safety and reduce the likelihood of vehicle collisions. However, these features include expensive parts, potentially increasing average claim severity.
In 2021, inflation had an increasing impact on the industry. Supply chain pressures, advanced vehicle technology, and a tight labor market have increased the cost of automobile repairs and supply chain issues are also resulting in higher costs to repair homes.
12
Part I - Item 1. Business
|P&C OTHER OPERATIONS | ||
Property & Casualty Other Operations includes certain property and casualty operations, managed by the Company, that have discontinued writing new business and includes substantially all of the Company's pre-1986 asbestos and environmental ("A&E") exposures. For a discussion of coverages provided under
policies written with exposure to A&E prior to 1986, reported within the P&C Other Operations segment (“Run-off A&E”), run-off assumed reinsurance and all other non-A&E exposures, see Part II, Item 7, MD&A - Critical Accounting Estimates, Property & Casualty Insurance Product Reserves.
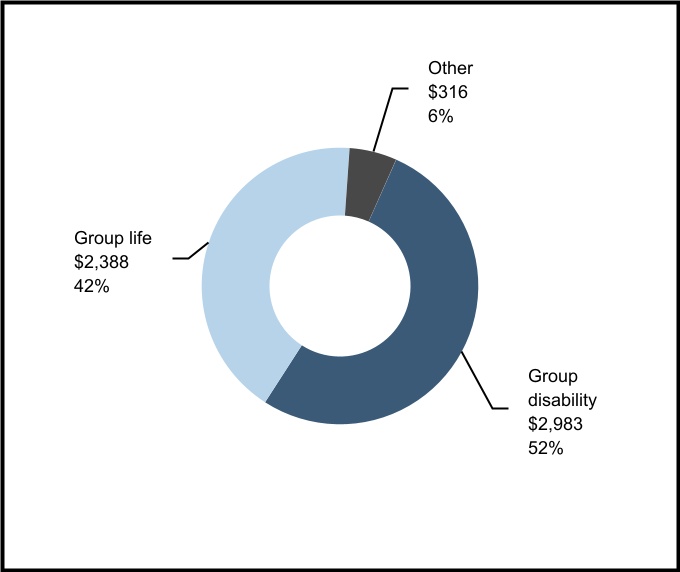
|GROUP BENEFITS | ||
2021 Premiums and Fee Income of $5,687
Principal Products and Services
| Group Life | Typically is term life insurance provided in the form of yearly renewable term life insurance. Other life coverages in this category include accidental death and dismemberment and travel accident insurance. | ||||
| Group Disability | Typically comprised of short-term disability and long-term disability plans that pay a percentage of an employee’s salary for a period of time if they are ill or injured and cannot perform the duties of their job. Short-term and long-term disability policies have elimination periods that must be satisfied prior to benefit payments. The Company also earns fee income from leave management services for federal, state and employer family and medical leave programs, as well as the administration of employer self-funded disability plans. | ||||
| Other Products | Includes other group coverages such as retiree health insurance, critical illness, accident, hospital indemnity and participant accident coverages. | ||||
Group insurance typically covers an entire group of people under a single contract, most typically the employees of a single employer or members of an association.
Group Benefits provides group life, disability and other group coverages to members of employer groups, associations and affinity groups through direct insurance policies and provides reinsurance to other insurance companies. In addition to employer paid coverages, the segment offers voluntary product coverages which are offered through employee payroll deductions. Group Benefits also offers disability underwriting, administration, and claims processing to self-funded employer plans. In addition, the segment offers a single-company leave management solution, which integrates work absence data from the insurer’s short-term and long-term group disability and
workers’ compensation insurance business with its leave management administration services.
Statutory paid family leave ("PFL") and paid family medical leave ("PFML") programs are a source of growth as the Company offers fully insured coverage or administers self-insured coverage for some of these programs. As of 2021, nine states and the District of Columbia have enacted PFL programs and additional states are considering adopting paid family leave or paid family and medical leave programs.
Group Benefits generally offers term insurance policies, allowing for the adjustment of rates or policy terms at renewal in order to minimize the adverse effect of market trends, loss costs, declining interest rates and other factors. Policies are typically
13
Part I - Item 1. Business
sold with one, two or three-year rate guarantees depending upon the product and market segment.
Marketing and Distribution
The Group Benefits distribution network is managed through a regional sales office system to distribute its group insurance products and services through a variety of distribution outlets including brokers, consultants, third-party administrators and trade associations. Additionally, the segment has relationships with several private exchanges which offer its products to employer groups. Technology providers, including human resources platform vendors, are taking an increasingly prominent role in influencing customer decisions that also influence selection of the group benefits insurance provider.
Competition
Group Benefits competes with numerous insurance companies and financial intermediaries marketing insurance products. The market for group benefits is expected to grow as the COVID-19 pandemic has driven new demand for employee benefits among both employees and employers. For example, there is increased interest in benefits addressing mental health and wellness, caregiving costs and remote work considerations.
In order to differentiate itself, Group Benefits uses its risk management expertise and economies of scale to derive a competitive advantage. Competitive factors include the extent of products offered, price, the quality of customer and claims handling services, and the Company's relationship with third-party distributors and private exchanges. Active price competition continues in the marketplace, resulting in multi-year rate guarantees being offered to customers. Top tier insurers in
the marketplace also offer on-line and self-service capabilities to third party distributors and consumers. The relatively large size and underwriting capacity of the Group Benefits business provides a competitive advantage over smaller competitors.
The Company's market presence has increased in recent years, benefiting from our industry leading digital technology and integrated absence management and claims platform.
Additionally, as employers continue to focus on reducing the cost of employee benefits, we expect more companies to offer voluntary products paid for by employees. Across the industry, the sale of voluntary product offerings, including supplemental health coverage, is growing at a faster rate than employer-provided benefits. Competitive factors affecting the sale of voluntary products include the breadth of products, product education, enrollment capabilities and overall customer service. The Company, as well its competitors, are investing in technology to offer digital capabilities, and to improve product offerings and service levels, particularly with voluntary products.
We offer voluntary products including critical illness, accident and hospital indemnity coverage to employees through our Employee Choice Benefits programs, and travel accident coverage for employers and other organizations. The Company's enhanced enrollment and marketing tools, such as My Tomorrow©, are providing additional opportunities to educate individual participants about supplementary benefits and deepen their knowledge about product selection.
In addition to providing group disability, leave management and life insurance, we offer integrated claim, leave and benefits administration with The Hartford's Ability Advantage platform.
|HARTFORD FUNDS | ||
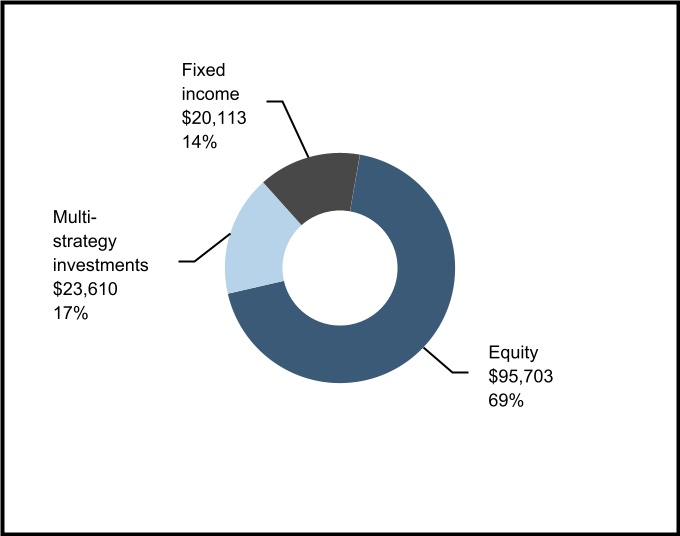
Hartford Funds Segment Assets Under Management ("AUM") of $157,895 as of December 31, 2021
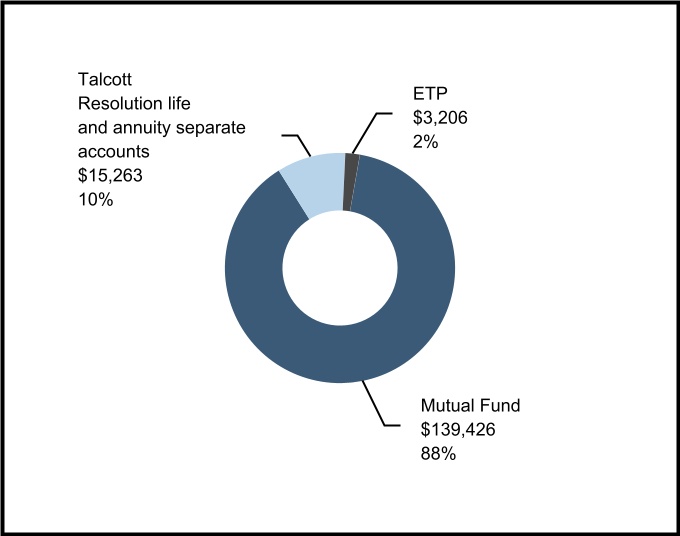
Mutual Fund AUM as of December 31, 2021
14
Part I - Item 1. Business
Principal Products and Services
| Mutual Funds | Includes approximately 60 actively managed mutual funds across a variety of asset classes including domestic and international equity, fixed income, and multi-strategy investments, principally subadvised by two unaffiliated institutional asset management firms that have comprehensive global investment capabilities. | ||||
| ETP | Exchange-traded products ("ETP") include actively managed exchange-traded funds (ETFs) and multifactor ETFs. Actively managed ETFs include fixed income, domestic equity and commodity products utilizing the same investment platform as our mutual funds. Multifactor ETFs are designed to track indices using passive investment techniques that strive to improve performance relative to traditional capitalization-weighted indices. | ||||
| Talcott Resolution life and annuity separate accounts | Relates to assets of the life and annuity business sold in May 2018 that are still managed by the Company's Hartford Funds segment. | ||||
The Hartford Funds segment provides investment management, administration, product distribution and related services to investors through a diverse set of investment products in domestic and international markets. Hartford Funds' comprehensive range of products and services assist clients in achieving their desired investment objectives. AUM are separated into three distinct categories referred to as mutual funds, ETP and Talcott Resolution life and annuity separate accounts, which relate to the life and annuity business sold in May 2018. The Hartford Funds segment will continue to manage the mutual fund assets of Talcott Resolution, though these assets are expected to continue to decline over time.
Marketing and Distribution
Our funds and ETPs are sold through national and regional broker-dealer organizations, independent financial advisers, defined contribution plans, financial consultants, bank trust groups and registered investment advisers. Our distribution
team is organized to sell primarily in the United States. The investment products for Talcott Resolution are not actively distributed.
Competition
The investment management industry is mature and highly competitive. Firms are differentiated by investment performance, range of products offered, brand recognition, financial strength, proprietary distribution channels, quality of service and level of fees charged relative to quality of investment products. The Hartford Funds segment competes with a large number of asset management firms and other financial institutions and differentiates itself through superior fund performance, product breadth, strong distribution and competitive fees. In recent years demand for lower cost passive investment strategies has outpaced demand for actively managed strategies and has taken market share from active managers.
|CORPORATE | ||
The Company includes in the Corporate category investment management fees and expenses related to managing third party business, including management of a portion of the invested assets of Talcott Resolution, reserves for run-off structured settlement and terminal funding agreement liabilities, restructuring costs, capital raising activities (including equity financing, debt financing and related interest expense), transaction expenses incurred in connection with an acquisition, certain M&A costs, purchase accounting adjustments related to
goodwill and other expenses not allocated to the reporting segments.
Additionally, until June 30, 2021 the Corporate category included a 9.7% ownership interest in the legal entity that acquired Talcott Resolution. For discussion of this sale, see Part II, Item 7, MD&A — The Hartford's Operations.
15
Part I - Item 1. Business
RESERVES
Total Reserves as of December 31, 2021 [1]
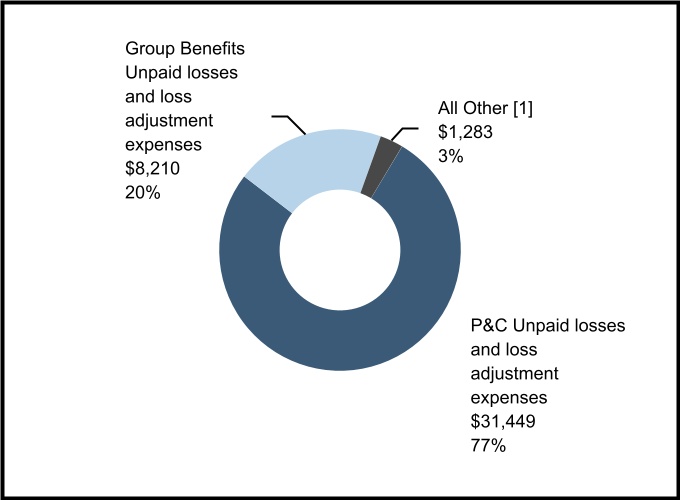
[1]Includes reserves for future policy benefits and other policyholder funds and benefits payable of $596 and $687, respectively, of which $399 and $426, respectively, relate to the Group Benefits segment with the remainder related to run-off structured settlement and terminal funding agreements within Corporate.
The reserve for unpaid losses and loss adjustment expenses includes a liability for unpaid losses, including those that have been incurred but not yet reported, as well as estimates of all expenses associated with processing and settling these insurance claims, including reserves related to both Property & Casualty and Group Benefits.
Total Property & Casualty Reserves as of December 31, 2021
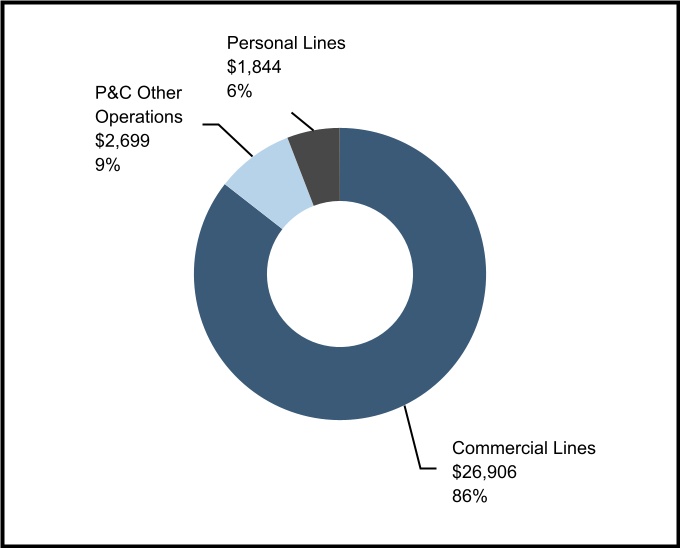
Further discussion of The Hartford’s property and casualty insurance product reserves, including run-off asbestos and environmental claims reserves within P&C Other Operations, may be found in Part II, Item 7, MD&A — Critical Accounting Estimates — Property and Casualty Insurance Product Reserves. Additional discussion may be found in Notes to Consolidated Financial Statements, including in the Company’s accounting policies for insurance product reserves within Note 1 - Basis of Presentation and Significant Accounting Policies and in Note 12 - Reserve for Unpaid Losses and Loss Adjustment Expenses of Notes to Consolidated Financial Statements.
Total Group Benefits Reserves as of December 31, 2021 [1]
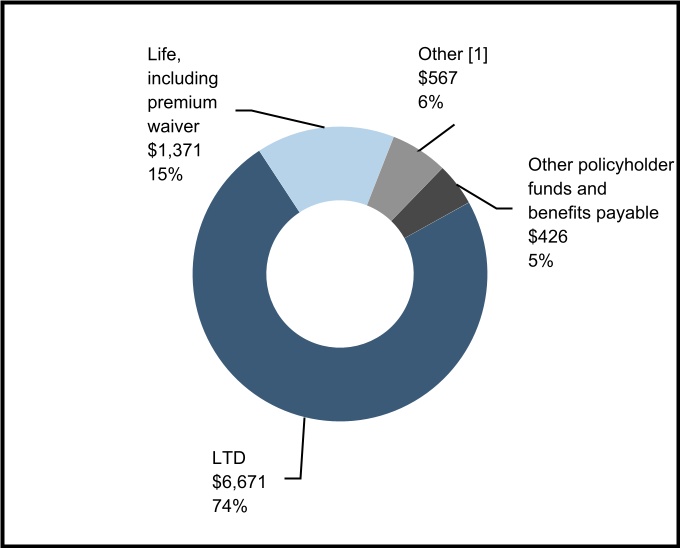
[1]Includes short duration contract reserves of $129 for short-term disability and $39 of supplemental health as well as reserves for future policy benefits that includes $286 of paid up life reserves and policy reserves on life policies, $96 of reserves for conversions to individual life and $17 of other reserves.
Group Benefits reserves include unpaid loss and loss adjustments expenses for long-term disability, group life and other lines of business as well as reserves for other policyholder funds and reserves for future policy benefits. Other policyholder funds and benefits payable represent deposits from policyholders where the company does not have insurance risk but is subject to investment risk. Reserves for future policy benefits represent life-contingent reserves for which the company is subject to insurance and investment risk.
Discussion of The Hartford's Group Benefits long-term disability reserves may be found in Part II, Item 7, MD&A — Critical Accounting Estimates — Group Benefits Long-term Disability ("LTD") Reserves, Net of Reinsurance. Additional discussion may be found in Note 12 - Reserve for Unpaid Losses and Loss Adjustment Expenses of Notes to Consolidated Financial Statements.
16
Part I - Item 1. Business
UNDERWRITING FOR P&C AND GROUP BENEFITS
The Company underwrites the risks it insures in order to manage exposure to loss through favorable risk selection and diversification. Risk modeling is used to manage, within specified limits, the aggregate exposure taken in each line of business and across the Company. For property and casualty business, aggregate exposure limits are set by geographic zone and peril. Products are priced according to the risk characteristics of the insured’s exposures. Rates charged for Personal Lines products are filed with the states in which we write business. Rates for Commercial Lines products are also filed with the states but the premium charged may be modified based on the insured’s relative risk profile and workers’ compensation policies may be subject to modification based on prior loss experience. Pricing for Group Benefits products, including long-term disability and life insurance, is also based on an underwriting of the risks and a projection of estimated losses, including consideration of investment income.
Pricing adequacy depends on a number of factors, including the ability to obtain regulatory approval for rate changes, proper evaluation of underwriting risks, the ability to project future loss cost frequency and severity based on historical loss experience adjusted for known trends, the Company’s response to rate actions taken by competitors, its expense levels and expectations about regulatory and legal developments. The Company seeks to price its insurance policies such that insurance premiums and future net investment income earned on premiums received will cover underwriting expenses and the ultimate cost of paying claims reported on the policies and provide for a profit margin. For many of its insurance products, the Company is required to obtain approval for its premium rates from state insurance departments and the Lloyd's Syndicate's ability to write business is subject to Lloyd's approval for its premium capacity each year.
Geographic Distribution of Earned Premium (% of total)
| Location | Commercial Lines | Personal Lines | Group Benefits | Total | ||||||||||
| California | 8 | % | 2 | % | 2 | % | 12 | % | ||||||
| New York | 5 | % | 1 | % | 3 | % | 9 | % | ||||||
| Texas | 4 | % | 1 | % | 2 | % | 7 | % | ||||||
| Florida | 3 | % | 1 | % | 1 | % | 5 | % | ||||||
| All other [1] | 33 | % | 11 | % | 23 | % | 67 | % | ||||||
| Total | 53 | % | 16 | % | 31 | % | 100 | % | ||||||
[1]No other single state or country accounted for 5% or more of the Company's consolidated earned premium in 2021.
CLAIMS ADMINISTRATION FOR P&C AND GROUP BENEFITS
Claims administration includes the functions associated with the receipt of initial loss notices, claims adjudication and estimates, legal representation for insureds where appropriate, establishment of case reserves, payment of losses and notification to reinsurers. These activities are performed by approximately 6,600 claim professionals handling 50 states, Washington D.C and 2 international locations, organized to meet the specific claim service needs for our various product offerings. Our combined workers’ compensation and Group Benefits units enable us to leverage synergies for improved outcomes.
Claim payments for benefits, losses and loss adjustment expenses are the largest expenditure for the Company.
REINSURANCE
For discussion of reinsurance, see Part II, Item 7, MD&A — Enterprise Risk Management and Note 9 - Reinsurance of Notes to Consolidated Financial Statements.
INVESTMENT OPERATIONS
Hartford Investment Management Company (“HIMCO”) is an SEC registered investment advisor and manages the Company's investment operations. HIMCO provides customized investment strategies for The Hartford's investment portfolio, as well as for The Hartford's pension plan and institutional clients, including certain assets of Talcott Resolution.
As of December 31, 2021 and 2020, the fair value of HIMCO’s total assets under management was approximately $105.4 billion and $106.1 billion, respectively, including $43.6 billion and $45.9 billion, respectively, that were held in HIMCO managed third party accounts and $4.7 billion and $4.6 billion, respectively, that support the Company's pension and other postretirement benefit plans.
Management of The Hartford's Investment Portfolio
HIMCO manages the Company's investment portfolios to maximize economic value and generate the returns necessary to support The Hartford’s various product obligations, within internally established objectives, guidelines and risk tolerances. The portfolio objectives and guidelines are developed based upon the asset/liability profile, including duration, convexity and other characteristics within specified risk tolerances. The risk tolerances considered include, but are not limited to, asset sector, credit issuer allocation limits, and maximum portfolio limits for below investment grade holdings. The Company attempts to minimize adverse impacts to the portfolio and the
17
Part I - Item 1. Business
Company’s results of operations from changes in economic conditions through asset diversification, asset allocation limits, asset/liability duration matching and the use of derivatives. For further discussion of HIMCO’s portfolio management approach, see Part II, Item 7, MD&A — Enterprise Risk Management.
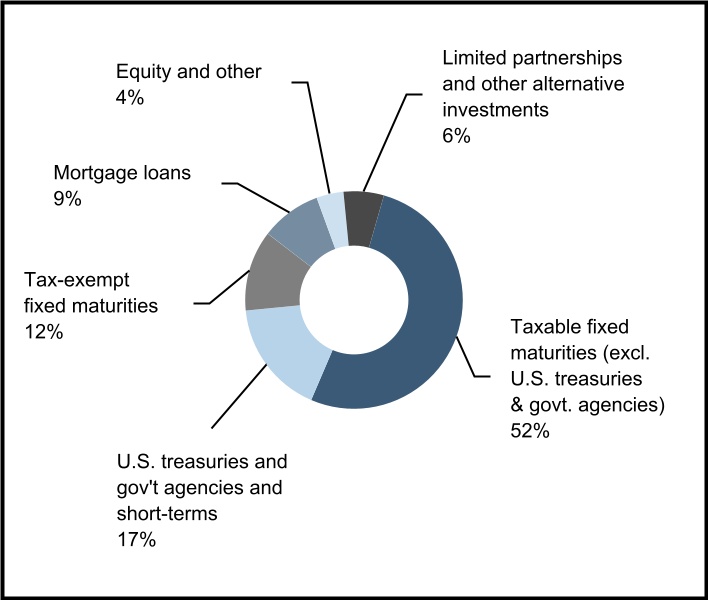
The Hartford's Investment Portfolio of $57.7 billion as of December 31, 2021
ENTERPRISE RISK MANAGEMENT
The Company has insurance, operational and financial risks. For discussion on how The Hartford manages these risks, see Part II, Item 7, MD&A - Enterprise Risk Management.
REGULATION
State and Foreign Insurance Laws
State insurance laws are intended to supervise and regulate insurers with the goal of protecting policyholders and ensuring the solvency of the insurers. As such, the insurance laws and regulations grant broad authority to state insurance departments (“Departments”) to oversee and regulate the business of insurance. The Departments monitor the financial stability of an insurer by requiring insurers to maintain certain solvency standards and minimum capital and surplus requirements; invested asset requirements; state deposits of securities; guaranty fund premiums; restrictions on the size of risks which may be insured under a single policy; and adequate reserves and other necessary provisions for unearned premiums, unpaid losses and loss adjustment expenses and other liabilities, both reported and unreported. In addition, the Departments perform periodic market and financial examinations of insurers and require insurers to file annual and other reports on the financial condition of the companies. Policyholder protection is also regulated by the Departments through licensing of insurers, sales employees, agents and brokers and others; approval of
premium rates and policy forms; and claims administration requirements.
Many states also have laws regulating insurance holding company systems. These laws require insurance companies, which are formed and chartered in the state (“Domestic Insurers”), to register with the state department of insurance (referred to as their “domestic state or regulator”) and file information concerning the operations of companies within the holding company system that may materially affect the operations, management or financial condition of the insurers within the system. Insurance holding company regulations principally relate to (i) state insurance approval of the acquisition of Domestic Insurers, (ii) prior review or approval of certain transactions between the domestic insurer and its affiliates, and (iii) regulation of dividends made by the domestic insurer. All transactions within a holding company system affecting Domestic Insurers must be determined to be fair and equitable.
The extent of financial services regulation on business outside the United States varies significantly among the countries in which The Hartford operates. Foreign financial services providers in certain countries are faced with greater restrictions than domestic competitors domiciled in that particular jurisdiction. Our International operations include a Lloyd’s Syndicate which is required to meet the minimum market standards set by Lloyd’s, as well as UK Prudential Regulation Authority (“PRA”) and UK Financial Conduct Authority (“FCA”) regulatory requirements. Pursuant to Solvency II, both Lloyd’s and the PRA focus on the adequacy of capital held and solvency of an insurer against the risk profile and management of the authorized insurer in setting capital requirements
Federal and State Securities and Financial Regulation Laws
The Company sells and distributes its mutual funds through a broker dealer subsidiary, and is subject to regulation promulgated and enforced by the Financial Industry Regulatory Authority, the SEC and/or, in some instances, state securities administrators. Other subsidiaries operate as investment advisers registered with the SEC under the Investment Advisers’ Act of 1940, as amended, and are registered as investment advisers under certain state laws, as applicable. Because federal and state laws and regulations are primarily intended to protect investors in securities markets, they generally grant regulators broad rulemaking and enforcement authority. Some of these regulations include, among other things, regulations impacting sales methods, trading practices, suitability of investments, use and safekeeping of customers’ funds, corporate governance, capital, recordkeeping, and reporting requirements.
Failure to comply with federal and state laws and regulations may result in fines, the issuance of cease-and-desist orders or suspension, termination or limitation of the activities of our operations and/or our employees.
18
Part I - Item 1. Business
INTELLECTUAL PROPERTY
We rely on a combination of contractual rights and copyright, trademark, patent and trade secret laws to establish and protect our intellectual property.
We have a trademark portfolio that we consider important in the marketing of our products and services, including, among others, the trademarks of The Hartford name, the Stag Logo and the combination of these two trademarks. The duration of trademark registrations may be renewed indefinitely subject to country-specific use and registration requirements. We regard our trademarks as highly valuable assets in marketing our products and services and vigorously seek to protect them against infringement. In addition, we own a number of patents and patent applications relating to on-line quoting, insurance related processing, insurance telematics, proprietary interface platforms, and other matters, some of which may be important to our business operations. Patents are of varying duration depending on filing date, and will typically expire at the end of their natural term.
HUMAN CAPITAL RESOURCES
The Hartford has approximately 18,100 employees as of December 31, 2021.
Management, including the CEO and Chief Human Resources Officer ("CHRO"), establishes the hiring and compensation practices for our company. The Board is periodically updated on key employee engagement and employee relations measures, including our annual employee survey results. In addition, the Board’s Compensation and Management Development Committee (“Compensation Committee”) is responsible for reviewing performance and approving compensation paid to senior leaders, and, among other things, the oversight of succession planning, pay equity practices, and diversity, equity and inclusion ("DEI") initiatives. Our Human Resources team, led by our CHRO, supports the Compensation Committee in the execution of its responsibilities. In addition to the day-to-day support and counseling they provide to our leaders, managers and employees, the Human Resources team also monitors key indicators to keep a pulse on trends across our employee population including employee engagement, employee relations matters, career mobility, talent acquisition, and retention.
Talent Attraction, Retention and Development
The Hartford prioritizes building a diverse workforce and an inclusive and equitable work environment where employees are respected, inspired to perform at their best, and are recognized for their contributions. We believe that the combination of a diverse workforce and an operating culture that actively embraces different experiences, perspectives and insights results in better decisions, outcomes and experiences for both our customers and employees. We persistently work to improve the employee experience in support of our continuing strategic
objective to attract, retain and develop the best talent in the industry.
Our commitment to a robust talent pool starts at the top. The Board of Directors engages with the Compensation Committee annually to review executive level talent, consider key pipeline talent and conduct succession planning. In addition, our leadership team conducts a comprehensive annual Talent Review process across our organization each year.
In 2021, we achieved top quartile employee engagement and performance enablement scores as measured by an independent third party survey through continued focus on management effectiveness, collaboration, innovation and well-being, as well as DEI.
To keep pace with the evolving expectations of employees and external candidates, we focus on a broad array of actions, including:
•Providing career growth and development opportunities by enhancing our talent management systems, including succession planning, executive recruitment, training, development and retention strategies; and
•Holding leaders accountable for their talent decisions and measuring progress against business line-specific DEI goals (including a talent mobility scorecard), reviewed periodically by the CEO and executive leadership team.
For entry-level roles in the organization, we recruit at colleges and universities, partner with both internal and external recruiters, and offer a range of training and development programs, including:
•The Hartford’s Leadership Development program which provides curriculum to enhance leadership skill sets for all participants – from first-time leaders through our executive ranks;
•The Hartford’s Apprenticeship Program which prepares students for careers in insurance; and
•Our HartCode Academy Developer Training Program which provides employees with Information Technology ("IT") application development skills, providing a pipeline of diverse IT talent from across the Company.
Pay and Benefits
Compensation and Pay Equity
We offer competitive pay and benefits to our employees, with a performance-based, variable compensation structure making up a larger share of the total compensation paid to executives and senior leaders in the organization. Variable compensation includes an annual bonus plan and long-term incentive awards. Annual bonus payouts are informed by whether the Company achieves core earnings above or below a target level that is determined from the annual operating plan set at the beginning of each year and reviewed and approved by the Compensation Committee. Long-term incentive awards include restricted stock units, performance shares and, for the most senior executives, stock options. Additional information about The Hartford’s variable compensation programs is provided in the Company’s Proxy Statement.
To help ensure pay equity, we use an independent third party compensation specialist firm to conduct statistical pay equity
19
Part I - Item 1. Business
analyses for our U.S. employees each year – a three-step process that includes analysis before, during and after the annual compensation planning cycle. This analysis enables us to identify unexplained pay disparities, conduct additional research to determine reasons for these differences and take appropriate actions to address the disparities if necessary.
The Compensation Committee is updated annually on our compensation equity processes and status.
The Hartford also engages in a number of additional practices to ensure pay fairness, including:
•Centralized compensation function ensuring consistent programs and practices across the enterprise;
•Enterprise-wide framework for evaluating and aligning roles and compensation levels based on job responsibilities, market competitiveness, strategic importance of the role, and other relevant factors;
•Prohibition against asking external job applicants for current or historical compensation information;
•A practice to disclose to applicants and employees the salary ranges for all posted positions;
•Individual compensation decisions that consider each employee’s experience, proficiency, and performance;
•Training for managers and human resources business partners on performance assessment and compensation planning; and
•Multiple levels of review and approval required for all compensation decisions.
We are committed to our extensive, long-standing policies and practices to ensure fair pay across the organization, while also staying attuned to external best practices and insights, and leveraging input from subject matter experts. We evaluate our performance every year, and as markets and talent pools shift over time we work to evolve our practices accordingly.
Employee Health and Wellness
The Hartford offers a comprehensive benefits package and award-winning wellness programs to help our employees live healthy lives and achieve their full potential. Our extensive benefits include:
•Medical plan options;
•Dental and vision coverage options;
•401(k) plan with company non-elective and matching contributions;
•Paid time off ("PTO") with at least 19 days of annual eligibility to start;
•Paid holidays;
•Flexible work schedules, including remote work arrangements;
•Tuition reimbursement;
•Family medical leave;
•Parental leave;
•Adoption support program;
•Organ and bone marrow donation leave policy; and
•Employee assistance program.
The Company also offers a medical advocacy program and well-being programs including nutrition counseling, weight management, sleep improvement, fitness reimbursement and more.
Diversity, Equity and Inclusion
The Hartford seeks to be an insurance industry leader in having a diverse workforce and promoting an equitable and inclusive workplace, enabling us to attract and leverage top talent to meet our business goals. We are committed to ethical conduct and a bias-free workplace for all employees as we continue building, enhancing and sustaining an inclusive supportive culture that reflects the diversity of our customer base.
We continue to invest in and accelerate a wide range of strategies to improve representation of talent that’s demographically underrepresented in the insurance industry, including targeted initiatives to improve the representation of women and people of color, and education to help employees understand, identify and mitigate bias.
We are proud to have taken additional steps to hold our leaders accountable for making progress against our DEI goals. To that end, the Company required each business and functional area, in partnership with our human resources team, to create and adopt individualized DEI plans with specific DEI goals. Leaders meet with the CEO twice a year to review progress against those goals and final results are then considered as part of the annual performance assessment process. The Company has demonstrated its commitment to DEI progress through its active involvement in organizations such as the CEO Action for Racial Equity and Catalyst CEO Champions for Change and has been recognized for its commitment to inclusive workplaces by a number of organizations.
Our 2021 performance share grants under the Company’s long-term incentive plan included a performance share modifier tied to the company's workforce representation goals. The modifier will determine whether an increase or decrease of 10% on performance share awards is warranted based upon performance against predetermined year-end 2023 representation goals for women and people of color in executive level roles. This change will be described in greater detail in our 2022 proxy statement. The Compensation and Management Development Committee's intent is to include the modifier with 2024 and 2027 performance share awards to encourage progress toward the Company's 2030 representation goals.
Building a diverse workforce and creating an equitable and inclusive culture is a top priority and a business imperative. We recognize that this work is central to leading, governing and managing risks better. As of December 31, 2021, women and people of color represent 61% and 30% of our workforce, respectively. The Board of Directors is updated annually on the Company’s DEI efforts.
We have nine Employee Resource Groups (“ERG’s”) that are voluntary participation groups led by employees, dedicated to fostering a diverse and inclusive workplace. These groups focus on the development and success of the Company’s employees through education, networking, mentorship and community volunteer opportunities. As of December 31, 2021, we had 106
20
Part I - Item 1. Business
local ERG chapters, and over 50% of employees were members of at least one ERG. In 2021, over 6,000 employees participated in Courageous Conversations, a program to allow employees to respectfully exchange perspectives, that ultimately contributes to a more inclusive workplace. Additionally, the Empower program is an enterprise leadership program designed to accelerate the readiness and encourage sponsorship of high performing, high potential people of color.
For more information on the Company’s human capital including our commitments, goals, initiatives and progress, as well as our employee demographics, refer to The Hartford’s Sustainability Highlight Report available on the investor relations section of the Company’s website at: https://ir.thehartford.com. The Hartford’s 2021 Sustainability Highlight Report is expected to be published prior to the Company’s annual meeting in May 2022.
AVAILABLE INFORMATION
The Company’s Internet address is www.thehartford.com. Our annual report on Form 10-K, quarterly reports on Form 10-Q, current reports on Form 8-K, and amendments to those reports are available, without charge, on the investor relations section of our website, https://ir.thehartford.com, as soon as reasonably practicable after they are electronically filed with, or furnished to, the SEC. Reports filed with the SEC may be viewed at www.sec.gov. References in this report to our website address are provided only as a convenience and do not constitute, and should not be viewed as, an incorporation by reference of the information contained on, or available through, the website. Therefore, such information should not be considered part of this report.
21
Part I - Item 1A. Risk Factors
| Item 1A. | ||||||||||||||
RISK FACTORS
In deciding whether to invest in The Hartford, you should carefully consider the following risks, any of which could have a material adverse effect on our business, financial condition, results of operations or liquidity and could also impact the trading price of our securities. These risks are not exclusive, and additional risks to which we are subject include, but are not limited to, the factors mentioned under “Forward-Looking Statements” above and the risks of our businesses described elsewhere in this Annual Report on Form 10-K.
The following risk factors have been organized by category for ease of use, however many of the risks may have impacts in more than one category. The occurrence of certain of them may, in turn, cause the emergence or exacerbate the effect of others. Such a combination could materially increase the severity of the impact of these risks on our business, results of operations, financial condition or liquidity.
The pandemic caused by the spread of COVID-19 could continue to impact our business and may have a material adverse impact on our business results, financial condition, results of operations and/or liquidity.
The global spread of COVID-19 has continued to cause significant market uncertainty and economic disruption. The extent to which COVID-19 continues to impact our business, financial condition, results of operations and/or liquidity will depend on future developments which are highly uncertain and cannot be easily predicted including: the potential spread of new COVID-19 variants; the effectiveness of vaccines; natural immunity and current or emerging therapeutic treatments in preventing infection, serious illness and death; the percentage of those infected who are of working age; and the strain on the health care system preventing timely treatment of chronic illnesses. Additional uncertainty exists regarding governmental, business and individual actions that have been and may continue to be taken in response to the pandemic; the impact of the pandemic on economic activity and actions taken in response; potential legislative, regulatory, and judicial responses to the pandemic pertaining specifically to insurance underwriting and claims; the effect on our customers and customers’ demand for our products; our ability to sell our products and our ability to use historical experience to assist our decision making in areas including underwriting, pricing, capital management and investments.
Below are several key effects of COVID-19 on the Company’s business results, financial condition, results of operations and/or liquidity:
•Insurance and Product Related Risk - The Company may continue to incur increased loss costs under insurance policies that we have written including for workers’ compensation, group life insurance, short-term disability, general liability, surety, director and officer liability, and employment practices liability, as well as property business.
In addition, the Company’s Group Benefits business has issued group life policies to employers and associations, which may continue to result in increased death claims due to claims where COVID-19 is specifically listed as the cause of death and indirect impacts of the pandemic such as causes of death due to patients deferring regular treatments of chronic conditions (together, referred to as "excess mortality"). We may also continue to experience higher short-term disability and paid family leave claims from employees and covered individuals who have been affected by COVID-19.
Under general liability or umbrella policies, we may have exposure to increased claims for indemnification from our insureds who may be found liable for negligently having exposed third parties to COVID-19 at a place of business, home or other premise. In our commercial surety lines, there is the potential for elevated frequency and severity due to an increase in the number of bankruptcies, especially in small businesses and impacted industries such as hospitality, entertainment and transportation. In construction surety, there is the potential for elevated losses if contractors experience project shutdowns or payment delays, which could negatively impact their cash flows, or result in disruptions in their supply chains, labor shortages or inflation in the cost of materials. We may also have increased allegations under director and officer and employment practices liability policies for inadequate disclosures, mismanagement of resources, and hiring/lay off actions relating to COVID-19.
Nearly all of our property insurance policies require direct physical loss or damage to property and contain standard exclusions that we believe preclude coverage for COVID-19 related claims, and the vast majority of such policies contain exclusions for virus-related losses. Nevertheless, the Company and certain of its writing companies have been served as defendants in lawsuits seeking insurance coverage under commercial insurance policies for alleged losses resulting from the shutdown or suspension of our insureds’ businesses due to the spread of COVID-19. While the Company and its subsidiaries deny the allegations and are defending vigorously and while almost none of the plaintiffs have submitted proofs of loss or otherwise quantified or factually supported any allegedly covered loss, it is possible that adverse outcomes, if any, in the aggregate, could have a material adverse effect on the Company’s consolidated operating results.
•Regulatory/Legal Risk - There could be legal and regulatory responses to concerns about COVID-19 and related public health issues that will impact our business, including the possible extension of insurance coverage beyond our policy language, such as for business interruption, civil authority and other claims. Further, policyholders may elect to litigate coverage issues which would lead to increased costs to the Company. For additional information on legislative and regulatory risks,
22
Part I - Item 1A. Risk Factors
see Part I, Item 2, MD&A - Capital Resources and Liquidity, Contingencies, Legislative and Regulatory Developments.
•Recessionary and other Global Economic Risk - If vaccines and other treatments are not effective at preventing serious illness or death from any new COVID-19 variants that arise, governments may reinstitute containment efforts, including curtailing access to businesses, including many of the Company’s insureds. In addition, disruption of the supply chain or other factors caused by the pandemic could result in an economic downturn and, as a result, potentially increase policy lapses and non-renewals and reduce demand for new business. In an economic downturn, employers may reduce work forces, resulting in lower premiums for the Company’s workers’ compensation and group benefit products. As such, the continuation of the COVID-19 pandemic and resulting economic stress could reduce earned premiums.
In addition, in an economic downturn or in periods of a decline in real estate valuations, the Company could experience credit losses on various asset balances, including receivables and the principal amount of various invested assets, including fixed maturities and mortgage loans. In addition to credit losses on invested assets, The Company could experience declines in the value of available for sale debt securities if credit spreads were to widen significantly, which would reduce stockholders’ equity. In addition, disruption in equity markets could result in net realized or unrealized losses on our equity securities carried at fair value or reduce net investment income in future periods from our non-fixed income investment portfolio, including from private equity, hedge fund and real estate partnership investments. The Company could also experience higher reinsurance costs and/or more limited availability of reinsurance coverage. Reinsurance treaties renewed by the Company subsequent to July 1, 2020 exclude coverage for losses arising from communicable diseases.
Also, market volatility may cause us to change our existing hedging strategies resulting in economic loss. If markets become less liquid and/or experience lower trading volumes, it may be more difficult to value certain investment securities that we hold. Additionally, the Company may determine that an impairment has occurred when assessing its goodwill and other intangible assets, which would result in reduced earnings in the period that the impairment is recorded.
•Capital and Liquidity Risk - We may also experience capital and liquidity pressures including the need to provide additional capital to certain insurance subsidiaries, reductions in the amount of available dividend capacity from our subsidiaries and the need to post more collateral due to declining investment valuations or due to requirements under derivative agreements. Further, among other possible actions, we may choose not to repurchase shares and may decide to invest proceeds from maturing fixed maturities in short-term investments which earn lower returns.
•Operational Risk - The Company also faces operational risks as a result of COVID-19. The Company has limited the number of employees working in its offices, resulting in the vast majority of employees working from home as of
February 2022. While the Company has the technology in place to enable hybrid and remote arrangements and to facilitate communication with insureds, intermediaries, claimants and other third parties, there is a risk that business operations will be disrupted due to, among other things, cybersecurity attacks or data security incidents, higher than anticipated web traffic and call volumes as well as lack of sufficient broadband internet connectivity for employees and third parties working from home. In addition, if large numbers of our employees contract COVID-19 and are unable to perform their duties due to illness, it may result in periods of inadequate staffing. If any of those disruptions become significant, results could include, among other impacts, delays in settling claims, processing new business, renewals, cancellations and endorsements for insureds, billing and collecting premiums, transacting with reinsurers, contracting with and paying vendors, and disruptions to investment operations.
We rely on vendors, including some located overseas, for a number of services including IT development, IT maintenance support and various business processes, including, among others, certain claims administration, policy administration, and other operational functions. As the COVID-19 virus has affected virtually all parts of the world, our vendors could also experience disruptions to their operations and while we have contingency plans for some level of disruption, there can be no assurance that issues vendors experience with their business processes would not have a material effect on our own operations.
For all of the reasons discussed above, the global public health and economic impacts caused by the COVID 19 pandemic could have a material adverse effect on our financial condition, results of operations and liquidity.
Risks Relating to Economic, Political and Global Market Conditions
Unfavorable economic, political and global market conditions may adversely impact our business and results of operations.
The Company’s investment portfolio and insurance business are sensitive to changes in economic, political and global capital market conditions, such as the effect of a weak economy, including labor supply shortages, and changes in credit spreads, equity prices, interest rates, inflation, foreign currency exchange rates, and shifts in demand and supply of U.S. dollars. Weak economic conditions, such as high unemployment, low labor force participation, lower family income, a weak real estate market, lower business investment and lower consumer spending may adversely affect the demand for insurance and financial products and lower the Company’s profitability in some cases. In addition, political instability, politically motivated violence or civil unrest, may increase the frequency and severity of insured losses. In addition, a deterioration in global economic
23
Part I - Item 1A. Risk Factors
conditions and/or geopolitical conditions, including due to military action, trade wars, tariffs or other actions with respect to international trade agreements or policies, has the potential to, among other things, reduce demand for our products, reduce exposures we insure, drive higher inflation that could increase the Company’s loss costs and result in increased incidence of claims, particularly for workers’ compensation and disability claims. The Company’s investment portfolio includes limited partnerships and other alternative investments and equity securities for which changes in value are reported in earnings. These investments may be adversely impacted by economic volatility, including real estate market deterioration, which could impact our net investment returns and result in an adverse impact on operating results.
Below are several key factors impacted by changes in economic, political, and global market conditions and their potential effect on the Company’s business and results of operations:
•Credit Spread Risk - Credit spread exposure is reflected in the market prices of fixed income instruments where lower rated securities generally trade at a higher credit spread. If issuer credit spreads increase or widen, the market value of our investment portfolio may decline. If the credit spread widening is significant and occurs over an extended period of time, the Company may recognize credit losses, resulting in decreased earnings. If credit spreads tighten significantly, the Company’s net investment income associated with new purchases of fixed maturities may be reduced. In addition, the value of credit derivatives under which the Company assumes exposure or purchases protection are impacted by changes in credit spreads, with losses occurring when credit spreads widen for assumed exposure or when credit spreads tighten if credit protection has been purchased.
•Equity Markets Risk - A decline in equity markets may result in net realized or unrealized losses on our equity securities carried at fair value or reduce net investment income in future periods from our non-fixed income investment portfolio, including from private equity, hedge fund and real estate partnership investments, and lower earnings from Hartford Funds where fee income is earned based upon the fair value of the assets under management. Equity markets are unpredictable. In the past few years, equity markets have been volatile, which could be indicative of a greater risk of a decline. For additional information on equity market sensitivity, see Part II, Item 7, MD&A - Enterprise Risk Management, Financial Risk- Equity Risk.
•Interest Rate Risk - Global economic conditions may result in the persistence of a low interest rate environment which would continue to pressure our net investment income and could result in lower margins on certain products. For additional information on interest rate sensitivity, see Part II, Item 7, MD&A - Enterprise Risk Management, Financial Risk - Interest Rate Risk
New and renewal business for our property and casualty and group benefits products is priced considering prevailing interest rates. As interest rates decline, in order to achieve the same economic return, we would have to increase product prices to offset the lower anticipated investment income earned on invested premiums. Conversely, as interest rates rise, pricing targets will tend to decrease to
reflect higher anticipated investment income. Our ability to effectively react to such changes in interest rates may affect our competitiveness in the marketplace, and in turn, could reduce written premium and earnings. For additional information on interest rate sensitivity, see Part II, Item 7, MD&A - Enterprise Risk Management, Financial Risk - Interest Rate Risk.
In addition, due to the long-term nature of the liabilities within our Group Benefits operations, particularly for long-term disability, declines in interest rates over an extended period of time would result in our having to reinvest at lower yields. On the other hand, a rise in interest rates, in the absence of other countervailing changes, would reduce the market value of our investment portfolio. A decline in market value of invested assets due to an increase in interest rates could also limit our ability to realize tax benefits from recognized capital losses.
•Inflation Risk - Inflation is a risk to our property and casualty business because, in many cases, claims are paid out many years after a policy is written and premium is collected for the risk. Supply chain issues arising from conditions due to the pandemic have contributed to inflation in the cost of labor and repairs for insurance claims paid to insureds and third parties. A greater than expected increase in inflation related to the cost of medical services and repairs over the claim settlement period can result in higher claim costs than what was estimated at the time the policy was written. Inflation can also affect consumer spending and business investment which can reduce the demand for our products and services. In addition, sustained inflation may result in an increase in interest rates, which would result in a reduction in the fair value of our investment portfolio.
•Changes in the Labor Market - Evolving labor market conditions, including increased competition for talent, could make it difficult to hire and retain employees and could increase compensation and benefit expense. New technologies may lead to changes in skill sets needed from the workforce, resulting in difficulty in attracting, developing and retaining employees. If insured businesses cannot hire enough qualified people to sell products and services to customers, economic activity may be depressed and lower insured exposure, hindering the Company's growth.
•Foreign Currency Exchange Rate - Changes in foreign currency exchange rates may impact our non-U.S. dollar denominated investments and foreign subsidiaries. As the Company has expanded its international operations, exposure to exchange rate fluctuations has increased. We hold cash and fixed maturity securities denominated in foreign currencies, including British Pounds and Canadian dollars, among others, and also have other assets and liabilities denominated in foreign currencies such as premiums receivable and loss reserves. While the Company predominately uses asset-liability matching, including the use of derivatives, to hedge certain of these exposures to fluctuations in foreign currency exchange rates, these actions do not eliminate the risk that
24
Part I - Item 1A. Risk Factors
changes in the exchange rates of foreign currencies to the U.S. dollar could result in financial loss to the Company, including realized or unrealized losses resulting from currency revaluation and increases to regulatory capital requirements for foreign subsidiaries that have net assets that are not denominated in their local currency. For additional information on foreign exchange risk, see Part II, Item 7, MD&A - Enterprise Risk Management, Financial Risk.
Concentration of our investment portfolio increases the potential for significant losses.
The concentration of our investment portfolios in any particular industry, collateral type, group of related industries or geographic sector could have an adverse effect on our investment portfolios and consequently on our business, financial condition, results of operations, and liquidity. Events or developments that have a negative impact on any particular industry, collateral type, group of related industries or geographic region may have a greater adverse effect on our investment portfolio to the extent that the portfolio is concentrated rather than diversified.
Further, if issuers of securities or loans we hold are acquired, merge or otherwise consolidate with other issuers of securities or loans held by the Company, our investment portfolio’s credit concentration risk to issuers could increase for a period of time, until the Company is able to sell securities to get back in compliance with the established investment credit policies.
Changing climate and weather patterns may adversely affect our business, financial condition and results of operation.
Climate change presents risks to us as an insurer, investor and employer. Climate models indicate that rising temperatures will likely result in rising sea levels over the decades to come and may increase the frequency and intensity of natural catastrophes and severe weather events. Extreme weather events such as abnormally high temperatures may result in increased losses associated with our property, automobile, workers’ compensation and group benefits businesses. Changing climate patterns may also increase the duration, frequency and intensity of heat/cold waves, which may result in increased claims for property damage, business interruption and losses under workers’ compensation, group disability and group life coverages. Precipitation patterns across the U.S. are projected to change, which if realized, may increase risks of flash floods and wildfires. If third parties assert that climate change-related risks and damages are caused by insured businesses, or arise from alleged mismanagement at insured businesses, we may experience increased claims under general liability and management liability policies. Additionally, there may be an impact on the demand, price and availability of automobile and homeowners insurance, and there is a risk of higher reinsurance costs or more limited availability of reinsurance coverage. Changes in climate conditions may also cause our underlying modeling data to not adequately reflect frequency and severity, limiting our ability to effectively evaluate and manage risks of catastrophes and severe weather events. Among other impacts, this could result in not charging enough premiums or not obtaining timely state approvals for rate increases to cover the risks we insure. We may also experience
significant interruptions to the Company’s systems and operations that hinder our ability to sell and service business, manage claims and operate our business.
In addition, climate change-related risks may adversely impact the value of the investments that we hold, resulting in potential realized or unrealized losses on our invested assets. Our decision to invest in certain securities, loans, or other investments may also be impacted by changes in climate patterns due to:
•changes in supply/demand for traditional sources of energy (e.g., coal, oil, natural gas);
•advances in low-carbon technology and renewable energy development;
•effects of extreme weather events on the physical and operational exposure of industries and issuers; and
•internal investment guidelines and policies related to the global energy transition.
The effects of climate change could also lead to increased credit risk of other counterparties we transact business with, including reinsurers. Rising sea levels may lead to decreases in real estate values in coastal areas, reducing premium and demand for commercial property and homeowners insurance and adversely impacting the value of our real estate-related investments. Additionally, government policies or regulations to slow climate change, such as emission controls or technology mandates, may have an adverse impact on sectors such as utilities, transportation and manufacturing, affecting demand for our products and our investments in these sectors. Moreover, regulators may undertake actions to minimize the effects of climate change on consumers, which could affect coverage provided under insurance contracts and administrative process.
These emerging regulatory initiatives, or other climate-related policies we adopt, may result in non-renewal of business or not underwriting or investing in certain industry sectors.
Because there is significant variability associated with the impacts of climate change, we cannot predict how physical, legal, regulatory and social responses may impact our business.
The discontinuance of LIBOR may adversely affect the value of certain investments we hold and floating rate securities we have issued, and any other assets or liabilities whose value may be tied to LIBOR.
LIBOR is an indicative measure of the average interest rate at which major global banks could borrow from one another. LIBOR is used as a benchmark or reference rate in certain derivatives and floating rate fixed maturities that are part of our investment portfolio, as well as two classes of junior subordinated debentures that we have issued and are currently outstanding.
In July 2017, the U.K. Financial Conduct Authority ("FCA") announced that by the end of 2021 it intended to stop persuading or compelling banks to report information used to set LIBOR. Since 2017, actions by regulators have resulted in efforts to establish alternative reference rates to LIBOR in several major currencies. The Alternative Reference Rate
25
Part I - Item 1A. Risk Factors
Committee, a group of private-market participants convened by the Federal Reserve Board and the Federal Reserve Bank of New York, has recommended the Secured Overnight Funding Rate (“SOFR”) as its preferred alternative rate for U.S. dollar LIBOR. SOFR is a measure of the cost of borrowing cash overnight, collateralized by U.S. Treasury securities, and is based on directly observable U.S. Treasury-backed repurchase transactions. The Federal Reserve Bank of New York began publishing daily SOFR in April 2018. Development and adoption of broadly accepted methodologies for transitioning from LIBOR, an unsecured forward-looking rate, to SOFR, a secured rate based on historical transactions, is ongoing.
On March 5, 2021, the FCA announced that publication of certain LIBOR settings in currencies other than U.S. dollars would cease immediately after December 31, 2021, and that publication of U.S. dollar LIBOR on a representative basis would cease for the one-week and two-month settings immediately after December 31, 2021 and for the remaining U.S. dollar settings immediately after June 30, 2023. Although the most widely used settings of U.S. dollar LIBOR continue to be published and used in existing transactions, regulatory pressures and other factors have resulted in a general decline in new U.S. dollar LIBOR-based transactions.
The Company continues to monitor and assess the potential impacts of the discontinuation of LIBOR, which will vary depending on (1) existing contract language to determine a LIBOR replacement rate, referred to as “fallback provisions”, in individual contracts, (2) the effects of certain legislation providing for LIBOR replacement rates or otherwise affecting contractual fallback provisions and (3) whether, how, and when industry participants develop and widely adopt new reference rates and fallback provisions for both existing and new products or instruments. At this time, it is not possible to predict how markets will respond to these new rates and the effect that the discontinuation of LIBOR might have on new or existing financial instruments. If LIBOR ceases to exist or is found by regulators to no longer be representative, outstanding contracts with interest rates tied to LIBOR may be adversely affected and impact our results of operations through a reduction in value of some of our LIBOR referenced floating rate investments, an increase in the interest we pay on our outstanding junior subordinated debentures, or an adverse impact to hedge effectiveness of derivatives or availability of hedge accounting. Additionally, any discontinuation of or transition from LIBOR may impact pricing, valuation and risk analytic processes and hedging strategies.
For additional information on the Company’s financial instruments that are tied to LIBOR, see Part II, Item 7, Management's Discussion and Analysis of Financial Condition and Results of Operation, Enterprise Risk Management, Financial Risk.
Insurance Industry and Product Related Risks
Unfavorable loss development may adversely affect our business, financial condition, results of operations and liquidity.
We establish property and casualty loss reserves to cover our estimated liability for the payment of all unpaid losses and loss expenses incurred with respect to premiums earned on our policies. Loss reserves are estimates of what we expect the ultimate settlement and administration of claims will cost, less what has been paid to date. These estimates are based upon actuarial projections and on our assessment of currently available data, as well as estimates of claims severity and frequency, legal theories of liability and other factors. For risks due to evolving changes in social, economic and environmental conditions, see the Risk Factor, “Unexpected and unintended claim and coverage issues under our insurance contracts may adversely impact our financial performance.”
Loss reserve estimates are refined periodically as experience develops and claims are reported and settled, potentially resulting in increases to our reserves. Increases in reserves would be recognized as an expense during the periods in which these determinations are made, thereby adversely affecting our results of operations for those periods. In addition, since reserve estimates of aggregate loss costs for prior years are used in pricing our insurance products, inaccurate reserves can lead to our products not being priced adequately to cover actual losses and related loss expenses in order to generate a profit.
We continue to receive A&E claims, the vast majority of which relate to policies written before 1986. Estimating the ultimate gross reserves needed for unpaid losses and related expenses for asbestos and environmental claims is particularly difficult for insurers and reinsurers. The actuarial tools and other techniques used to estimate the ultimate cost of more traditional insurance exposures tend to be less precise when used to estimate reserves for some A&E exposures.
Moreover, the assumptions used to estimate gross reserves for A&E claims, such as claim frequency over time, average severity, and how various policy provisions will be interpreted, are subject to significant uncertainty. It is also not possible to predict changes in the legal and legislative environment and their effect on the future development of A&E claims. These factors, among others, make the variability of gross reserves estimates for these longer-tailed exposures significantly greater than for other more traditional exposures.
Effective December 31, 2016, the Company entered into an agreement with National Indemnity Company (“NICO”), a subsidiary of Berkshire Hathaway Inc. (“Berkshire”) whereby the Company is reinsured for subsequent adverse development on substantially all of its net A&E reserves up to an aggregate net limit of $1.5 billion. We remain directly liable to claimants and if the reinsurer does not fulfill its obligations under the agreement or if future adverse development exceeds the $1.5 billion aggregate limit, we may need to increase our recorded net reserves which could have a material adverse effect on our financial condition, results of operations and liquidity. For
26
Part I - Item 1A. Risk Factors
additional information related to risks associated with the adverse development cover, see Note 12 - Reserve for Unpaid Losses and Loss Adjustment Expenses of Notes to Consolidated Financial Statements.
We are vulnerable to losses from catastrophes, both natural and man-made.
Our insurance operations expose us to claims arising out of catastrophes. Catastrophes can be caused by various unpredictable natural events, including, among others, earthquakes, hurricanes, hailstorms, severe winter weather, wind storms, fires, tornadoes, and pandemics. Catastrophes can also be man-made, such as terrorist attacks, civil unrest, cyber-attacks, explosions or infrastructure failures.
The geographic distribution of our business subjects us to catastrophe exposure for events occurring in a number of areas, including, but not limited to: hurricanes in Florida, the Gulf Coast, the Northeast and the Atlantic coast regions of the United States; tornadoes and hail in the Midwest and Southeast; earthquakes in geographical regions exposed to seismic activity; wildfires in the West; and the spread of disease, which can occur throughout multiple geographic locations. We are also exposed to catastrophe losses in other parts of the world through our global specialty business. Any increases in the values and concentrations of insureds and property in these areas would increase the severity of catastrophic events in the future. In addition, changes in climate and/or weather patterns may increase the frequency and/or intensity of severe weather and natural catastrophe events potentially leading to increased insured losses. Potential examples include, but are not limited to:
•an increase in the frequency or intensity of wind and thunderstorm and tornado/hailstorm events due to increased convection in the atmosphere,
•more frequent and larger wildfires in certain geographies,
•higher incidence of deluge flooding, and
•the potential for an increase in frequency and severity of hurricane events.
Insufficient incorporation of climatic trends into widely used catastrophe models and internal tools to assess risk from natural catastrophe perils could lead to ineffective evaluation and management of catastrophe risk. For a further discussion of climate-related risks, see the above-referenced Risk Factor, “Changing climate and weather patterns may adversely affect our business, financial condition and results of operation.”
Our businesses also have exposure to global or nationally occurring pandemics caused by highly infectious and potentially fatal diseases spread through human, animal or plant populations.
In the event of one or more catastrophes, policyholders may be unable to meet their obligations to pay premiums on our insurance policies. Further, our liquidity could be constrained by a catastrophe, or multiple catastrophes. In addition, in part because accounting rules do not permit insurers to reserve for such catastrophic events until they occur, claims from catastrophic events could have a material adverse effect on our business, financial condition, results of operations or liquidity. The amount we charge for catastrophe exposure may be
inadequate if the frequency or severity of catastrophe losses changes over time or if the models we use to estimate the exposure prove inadequate. In addition, regulators or legislators could limit our ability to charge adequate pricing for catastrophe exposures or shift more responsibility for covering risk.
Terrorism is an example of a significant man-made caused potential catastrophe. Private sector catastrophe reinsurance is limited and generally unavailable for terrorism losses caused by attacks with nuclear, biological, chemical or radiological weapons. In addition, workers' compensation policies generally do not have exclusions or limitations for terrorism losses. Reinsurance coverage from the federal government under the Terrorism Risk Insurance Program (the "Program") Reauthorization Act of 2019 (“TRIPRA 2019”) is also limited and only applies for certified acts of terrorism that exceed a certain threshold of industry losses. Accordingly, the effects of a terrorist attack in the geographic areas we serve may result in claims and related losses for which we do not have adequate reinsurance. TRIPRA 2019 also requires that the federal government create the following reports, which could lead to additional legislation or regulation: (1) Treasury Department to include in its biennial report on the effectiveness of the Program an evaluation of the availability and affordability of terrorism risk insurance for places of worship; and (2) Government Accountability Office report to analyze and address the vulnerabilities and potential costs of cyber terrorism, to assess adequacy of coverage under the Program, and to make recommendations for future legislative changes to address evolving cyber terrorism risks. Further, the continued threat of terrorism and the occurrence of terrorist attacks, as well as heightened security measures and military action in response to these threats and attacks or other geopolitical or military crises, may cause significant volatility in global financial markets, disruptions to commerce and reduced economic activity. These consequences could have an adverse effect on the value of the assets in our investment portfolio. Terrorist attacks also could disrupt our operation centers. In addition, TRIPRA 2019 expires on December 31, 2027 and if the U.S. Congress does not reauthorize the program or significantly reduces the government’s share of covered terrorism losses, the Company’s exposure to terrorism losses could increase materially unless it can purchase alternative terrorism reinsurance protection in the private markets at affordable prices or takes actions to materially reduce its exposure in lines of business subject to terrorism risk. For a further discussion of TRIPRA, see Part II, Item 7, MD&A - Enterprise Risk Management - Insurance Risk Management, Reinsurance as a Risk Management Strategy.
Cyber risk exposure exists through stand-alone cyber policies as well as cyber coverage endorsements on some property, general liability, management liability and directors and officers policies. Increasing frequency of cyber attacks and the evolving nature of cyber risk taking place across the globe may potentially lead to increased insured losses across the industry and for the businesses we insure. Our insureds may be increasingly exposed to cyber-related attacks with insured losses to property (including data and systems), breach of data, ransom payments and business interruption.
As a result, it is possible that any, or a combination of all, of these factors related to a catastrophe, or multiple catastrophes, whether natural or man-made, can have a material adverse
27
Part I - Item 1A. Risk Factors
effect on our business, financial condition, results of operations or liquidity.
Pricing for our products is subject to our ability to adequately assess risks, estimate losses and comply with state and international insurance regulations.
We seek to price our property and casualty and group benefits insurance policies such that insurance premiums and future net investment income earned on premiums received will provide for an acceptable profit in excess of underwriting expenses and the cost of paying claims. Pricing adequacy depends on a number of factors, including proper evaluation of underwriting risks, the ability to project future claim costs, our expense levels, net investment income realized, our response to rate actions taken by competitors, legal and regulatory developments, including in international markets, and the ability to obtain regulatory approval for rate changes.
State insurance departments regulate many of the premium rates we charge and also propose rate changes for the benefit of the property and casualty consumer at the expense of the insurer, which may not allow us to reach targeted levels of profitability. Moreover, regulators may seek to prohibit or constrain the use of certain underwriting and rating factors, which may affect our ability to price risks. In addition to regulating rates, certain states have enacted laws that require a property and casualty insurer to participate in assigned risk plans, reinsurance facilities, joint underwriting associations and other residual market plans. State regulators also require that an insurer offer property and casualty coverage to all consumers and often restrict an insurer's ability to charge the price it might otherwise charge or restrict an insurer's ability to offer or enforce specific policy deductibles. In these markets, we may be compelled to underwrite significant amounts of business at lower than desired rates or accept additional risk not contemplated in our existing rates, participate in the operating losses of residual market plans or pay assessments to fund operating deficits of state-sponsored funds, possibly leading to lower returns on equity. The laws and regulations of many states also limit an insurer's ability to withdraw from one or more lines of insurance in the state, except pursuant to a plan that is approved by the state's insurance department. Additionally, certain states require insurers to participate in guaranty funds for impaired or insolvent insurance companies. These funds periodically assess losses against all insurance companies doing business in the state. Any of these factors could have a material adverse effect on our business, financial condition, results of operations or liquidity. For more on international regulatory risks, see the Risk Factor, “Regulatory and legislative developments could have a material adverse impact on our business, financial condition, results of operations and liquidity.”
Additionally, the property and casualty and group benefits insurance markets have been historically cyclical, experiencing periods characterized by relatively high levels of price competition, less restrictive underwriting standards, more expansive coverage offerings, multi-year rate guarantees and declining premium rates, followed by periods of relatively low levels of competition, more selective underwriting standards, more coverage restrictions and increasing premium rates. In all of our property and casualty and group benefits insurance product lines, there is a risk that the premium we charge may
ultimately prove to be inadequate as reported losses emerge. In addition, there is a risk that regulatory constraints, price competition or incorrect pricing assumptions could prevent us from achieving targeted returns. Inadequate pricing could have a material adverse effect on our results of operations and financial condition.
Competitive activity, use of predictive analytics, or technological changes may adversely affect our market share, demand for our products, or our financial results.
The industries in which we operate are highly competitive. Our principal competitors are other property and casualty insurers, group benefits providers and providers of mutual funds and exchange-traded products. Competitors may expand their risk appetites in products and services where The Hartford currently enjoys a competitive advantage. Larger competitors with more capital and new entrants to the market could result in increased pricing pressures on a number of our products and services and may harm our ability to maintain or increase our profitability. For example, larger competitors, including those formed through consolidation or who may acquire new entrants to the market, such as insurtech firms, may have lower operating costs and an ability to absorb greater risk while maintaining their financial strength ratings, thereby allowing them to price their products more competitively. In addition, a number of insurers are making use of predictive analytics to, among other things, improve pricing accuracy, be more targeted in marketing, strengthen customer relationships and provide more customized loss prevention services. If they are able to use predictive analytics and other data and/or adopt innovative new technologies more effectively than we are, it may give them a competitive advantage. Because of the highly competitive nature of the industries we compete in, there can be no assurance that we will continue to compete effectively with our industry rivals, or that competitive pressure will not have a material adverse effect on our business and results of operations.
Our business could also be affected by technological changes, including further advancements in automotive safety features, the development of autonomous or “self-driving” vehicles, and platforms that facilitate ride sharing. These technologies could impact the frequency or severity of losses, disrupt the demand for certain of our products, or reduce the size of the automobile insurance market as a whole. The risks we insure are also affected by the increased use of technology in homes and businesses, including technology used in heating, ventilation, air conditioning and security systems and the introduction of more automated loss control measures. Increased use of advanced analytics and automation in the workplace could potentially affect the demand for workers' compensation insurance products over time. In addition, our business may be disrupted due to failures of accelerated technological changes, including our automation of minimally complex tasks, which may adversely impact our business and results of operations. While there is substantial uncertainty about the timing, penetration and reliability of such technologies, and the legal frameworks that may apply, such as to autonomous vehicles, any such impacts could have a material adverse effect on our business and results of operations.
28
Part I - Item 1A. Risk Factors
We may experience difficulty in marketing and providing insurance products and investment advisory services through distribution channels and advisory firms.
We distribute our insurance products, mutual funds and ETPs through a variety of distribution channels and financial intermediaries, including brokers, independent agents, wholesale agents, reinsurance brokers, broker-dealers, banks, registered investment advisors, affinity partners, our own internal sales force and other third-party organizations. In some areas of our business, we generate a significant portion of our business through third-party arrangements. For example, we market personal lines products in large part through an exclusive licensing arrangement with AARP that continues through December 31, 2032. Our ability to distribute products through the AARP program may be adversely impacted by membership levels and the pace of membership growth. In addition, the independent agent and broker distribution channel is consolidating which could result in a larger proportion of written premium being concentrated among fewer agents and brokers, potentially increasing our cost of acquiring new business. While we periodically seek to renew or extend third party arrangements, there can be no assurance that our relationship with these third parties will continue or that the economics of these relationships won't change to make them less financially attractive to the Company. An interruption in our relationship with certain of these third parties could materially affect our ability to market our products and could have a material adverse effect on our business, financial condition, results of operations and liquidity.
Unexpected and unintended claim and coverage issues under our insurance contracts may adversely impact our financial performance.
Changes in industry practices and in legal, judicial, social and other environmental conditions, technological advances or fraudulent activities, may require us to pay claims we did not intend to cover when we wrote the policies. Social, economic, political and environmental issues, including rising income inequality, climate change, prescription drug use and addiction, exposures to new substances or those substances previously considered to be safe and found to have latent exposure, along with the use of social media to proliferate messaging around such issues, has expanded the theories for reporting claims, which may increase our claims administration and/or litigation costs. State and local governments' increased efforts aimed to respond to the costs and concerns associated with these types of issues, may also lead to expansive, new theories for reporting claims or may lead to the passage of "reviver" statutes that extend the statute of limitations for the reporting of these claims, including statutes passed in certain states with respect to sexual molestation and sexual abuse claims. In addition, these and other social, economic, political and environmental issues may either extend coverage beyond our underwriting intent or increase the frequency or severity of claims. Some of these changes, advances or activities may not become apparent until some time after we have issued insurance contracts that are affected by the changes, advances or activities and/or we may be unable to compensate for such losses through future pricing
and underwriting. As a result, the full extent of liability under our insurance contracts may not be known for many years after a contract is issued, and this liability may have a material adverse effect on our business, financial condition, results of operations and liquidity at the time it becomes known.
Financial Strength, Credit and Counterparty Risks
Downgrades in our financial strength or credit ratings may make our products less attractive, increase our cost of capital and inhibit our ability to refinance our debt.
Financial strength and credit ratings are important in establishing the competitive position of insurance companies. Rating agencies assign ratings based upon several factors. While most of the factors relate to the rated company, others relate to the views of the rating agency (including its assessment of the strategic importance of the rated company to the insurance group), general economic conditions, and circumstances outside the rated company's control. In addition, rating agencies may employ different models and formulas to assess the financial strength of a rated company, and from time to time rating agencies have altered these models. Changes to the models or factors used by the rating agencies to assign ratings could adversely impact a rating agency's judgment of its internal rating and the publicly issued rating it assigns us.
Our financial strength ratings, which are intended to measure our ability to meet policyholder obligations, are an important factor affecting public confidence in most of our products and, as a result, our competitiveness. A downgrade or a potential downgrade in the rating of our financial strength or of one of our principal insurance subsidiaries could affect our competitive position and reduce future sales of our products.
Our credit ratings also affect our cost of capital. A downgrade or a potential downgrade of our credit ratings could make it more difficult or costly to refinance maturing debt obligations, to support business growth at our insurance subsidiaries and to maintain or improve the financial strength ratings of our principal insurance subsidiaries. These events could materially adversely affect our business, financial condition, results of operations and liquidity. For a further discussion of potential impacts of ratings downgrades on derivative instruments, including potential collateral calls, see Part II, Item 7, MD&A - Capital Resources and Liquidity - Derivative Commitments.
The amount of capital that we must hold to maintain our financial strength and credit ratings and meet other requirements can vary significantly from time to time and is sensitive to a number of factors outside of our control.
We conduct the vast majority of our business through licensed insurance company subsidiaries. In the United States, statutory accounting standards and statutory capital and reserve requirements for these entities are prescribed by the applicable
29
Part I - Item 1A. Risk Factors
insurance regulators and the NAIC. The minimum capital we must hold is based on risk-based capital (“RBC”) formulas for both life and property and casualty companies. The RBC formula for life companies is applicable to our group benefits business and establishes capital requirements relating to insurance, business, asset, credit, interest rate and off-balance sheet risks. The RBC formula for property and casualty companies sets required statutory surplus levels based on underwriting, asset and credit and off-balance sheet risks.
Countries in which our international insurance subsidiaries are incorporated or deemed commercially domiciled are subject to regulatory requirements as defined by the regulatory jurisdiction, including Solvency II. In addition, our Lloyd’s member company must maintain required Funds at Lloyd's ("FAL") to meet the capital requirements of its syndicate. The FAL is determined based on the syndicate’s Solvency Capital Requirement (“SCR”) under the Solvency II capital adequacy model plus an economic capital assessment determined by the Lloyd’s Franchise Board (which is responsible for the day-to-day management of the Lloyd's market).
In any particular year, statutory surplus amounts, RBC ratios, FAL and SCR may increase or decrease depending on a variety of factors, some of which are outside the Company's control, including:
•the amount of statutory income or losses generated by our insurance subsidiaries;
•the amount of additional capital our insurance subsidiaries must hold to support business growth;
•the amount of dividends or distributions paid to the holding company;
•changes in equity market levels;
•the value of certain fixed-income and equity securities in our investment portfolio;
•the value of certain derivative instruments;
•changes in interest rates;
•admissibility of deferred tax assets;
•changes to the regulatory capital formulas; and
•regulatory changes to accounting guidance for determining capital adequacy.
Among other factors, rating agencies consider the level of statutory capital and surplus of our U.S. insurance subsidiaries as well as the level of a measure of Generally Accepted Accounting Principles ("GAAP") capital held by the Company in determining the Company's financial strength and credit ratings. Rating agencies may implement changes to their capital formulas that have the effect of increasing the amount of capital we must hold in order to maintain our current ratings. If our capital resources are insufficient to maintain a particular rating by one or more rating agencies, we may need to raise capital through public or private equity or debt financing. If we were not to raise additional capital, either at our discretion or because we were unable to do so, our financial strength and credit ratings might be downgraded by one or more rating agencies.
Losses due to nonperformance or defaults by counterparties can have a material adverse effect on the value of our investments, reduce our profitability or sources of liquidity.
We have credit risk with counterparties associated with investments, derivatives, premiums receivable, reinsurance recoverables and indemnifications provided by third parties in connection with previous dispositions. Among others, our counterparties include issuers of fixed maturity and equity securities we hold, borrowers of mortgage loans we hold, customers, trading counterparties, counterparties under swaps and other derivative contracts, reinsurers, clearing agents, exchanges, clearing houses and other financial intermediaries and guarantors. These counterparties may default on their obligations to us due to bankruptcy, insolvency, lack of liquidity, adverse economic conditions, operational failure, fraud, government intervention and other reasons. In addition, for exchange-traded derivatives, such as futures, options and "cleared" over-the-counter derivatives, the Company is generally exposed to the credit risk of the relevant central counterparty clearing house. Defaults by these counterparties on their obligations to us could have a material adverse effect on the value of our investments, financial condition, results of operations and liquidity. Additionally, if the underlying assets supporting the structured securities we invest in default on their payment obligations, our securities will incur losses.
The availability of reinsurance and our ability to recover under reinsurance contracts may not be sufficient to protect us against losses.
As an insurer, we frequently use reinsurance to reduce the effect of losses that may arise from, among other things, catastrophes and other risks that can cause unfavorable results of operations. In addition, our assumed reinsurance business purchases retrocessional coverage for a portion of the risks it assumes. Under these reinsurance arrangements, other insurers assume a portion of our losses and related expenses; however, we remain liable as the direct insurer on all risks reinsured. Consequently, ceded reinsurance arrangements do not eliminate our obligation to pay claims, and we are subject to our reinsurers' credit risk with respect to our ability to recover amounts due from them. The inability or unwillingness of any reinsurer or retrocessionaire to meet its financial obligations to us, including the impact of any insolvency or rehabilitation proceedings involving a reinsurer or retrocessionaire that could affect the Company's access to collateral held in trust, could have a material adverse effect on our financial condition, results of operations and liquidity.
In addition, should the availability and cost of reinsurance change materially, we may have to pay higher reinsurance costs, accept an increase in our net liability exposure, reduce the amount of business we write, or access to the extent possible other alternatives to reinsurance, such as use of the capital markets. Further, due to the inherent uncertainties as to collection and the length of time before reinsurance recoverables will be due, it is possible that future adjustments to the Company’s reinsurance recoverables, net of the allowance, could be required, which could have a material adverse effect on the Company’s consolidated results of operations or liquidity in a particular quarterly or annual period.
30
Part I - Item 1A. Risk Factors
Our ability to declare and pay dividends is subject to limitations.
The payment of future dividends on our capital stock is subject to the discretion of our board of directors, which considers, among other factors, our operating results, overall financial condition, credit-risk considerations and capital requirements, as well as general business and market conditions. Our board of directors may only declare such dividends out of funds legally available for such payments. Moreover, our common stockholders are subject to the prior dividend rights of any holders of depositary shares representing preferred stock then outstanding. The terms of our outstanding junior subordinated debt securities prohibit us from declaring or paying any dividends or distributions on our capital stock or purchasing, acquiring, or making a liquidation payment on such stock, if we have given notice of our election to defer interest payments and the related deferral period has not yet commenced or a deferral period is continuing.
Moreover, as a holding company that is separate and distinct from our insurance subsidiaries, we have no significant business operations of our own. Therefore, we rely on dividends from our insurance company subsidiaries and other subsidiaries as the principal source of cash flow to meet our obligations. Subsidiary dividends fund payments on our debt securities and the payment of dividends to stockholders on our capital stock. Connecticut state laws and certain other U.S. jurisdictions in which we operate limit the payment of dividends and require notice to and approval by the state insurance commissioner for the declaration or payment of dividends above certain levels. The laws and regulations of the countries in which our international insurance subsidiaries are incorporated or deemed commercially domiciled, as well as requirements of the Council of Lloyd’s, also impose limitations on the payment of dividends which, in some instances, are more restrictive. Dividends paid from our insurance subsidiaries are further dependent on their cash requirements. In addition, in the event of liquidation or reorganization of a subsidiary, prior claims of a subsidiary’s creditors may take precedence over the holding company’s right to a dividend or distribution from the subsidiary except to the extent that the holding company may be a creditor of that subsidiary. For further discussion on dividends from insurance subsidiaries, see Part II, Item 7, MD&A - Capital Resources & Liquidity.
Risks Relating to Estimates, Assumptions and Valuations
Actual results could materially differ from the analytical models we use to assist our decision making in key areas such as underwriting, pricing, capital management, reserving, investments, reinsurance and catastrophe risks.
We use models to help make decisions related to, among other things, underwriting, pricing, capital allocation, reserving, investments, reinsurance, and catastrophe risk. Both proprietary
and third party models we use incorporate numerous assumptions and forecasts about the future level and variability of interest rates, capital requirements, loss frequency and severity, currency exchange rates, policyholder behavior, equity markets and inflation, among others. The models are subject to the inherent limitations of any statistical analysis as the historical internal and industry data and assumptions used in the models may not be indicative of what will happen in the future. Consequently, actual results may differ materially from our modeled results. The profitability and financial condition of the Company substantially depends on the extent to which our actual experience is consistent with assumptions we use in our models and ultimate model outputs. If, based upon these models or other factors, we misprice our products or our estimates of the risks we are exposed to prove to be materially inaccurate, our business, financial condition, results of operations or liquidity may be adversely affected.
The valuation of our securities and investments and the determination of allowances and credit losses are highly subjective and based on methodologies, estimations and assumptions that are subject to differing interpretations and market conditions.
Estimated fair values of the Company’s investments are based on available market information and judgments about financial instruments, including estimates of the timing and amounts of expected future cash flows and the credit standing of the issuer or counterparty. During periods of market disruption, it may be difficult to value certain of our securities if trading becomes less frequent and/or market data becomes less observable. There may be certain asset classes that were in active markets with significant observable data that become illiquid due to the financial environment. In addition, there may be certain securities whose fair value is based on one or more unobservable inputs, even during normal market conditions. As a result, the determination of the fair values of these securities may include inputs and assumptions that require more estimation and management judgment and the use of complex valuation methodologies. These fair values may differ materially from the value at which the investments may be ultimately sold. Further, rapidly changing or unprecedented credit and equity market conditions could materially impact the valuation of securities and the period-to-period changes in value could vary significantly. Decreases in value could have a material adverse effect on our business, results of operations, financial condition and liquidity.
Similarly, management’s decision on whether to record an allowance for credit losses is subject to significant judgments and assumptions regarding changes in general economic conditions, the issuer's financial condition or future recovery prospects, estimated future cash flows, the expected recovery period and the accuracy of third party information used in internal assessments. As a result, management’s evaluations and assessments are highly judgmental and its projections of future cash flows over the life of certain securities may ultimately prove incorrect as facts and circumstances change.
31
Part I - Item 1A. Risk Factors
If our businesses do not perform well, we may be required to recognize an impairment of our goodwill.
Goodwill represents the excess of the amounts we paid to acquire subsidiaries and other businesses over the fair value of their net assets at the date of acquisition. We test goodwill at least annually for impairment. Impairment testing is performed based upon estimates of the fair value of the “reporting unit” to which the goodwill relates. The reporting unit is the operating segment or a business one level below an operating segment if discrete financial information is prepared and regularly reviewed by management at that level. The fair value of the reporting unit could decrease if new business, customer retention, profitability or other drivers of performance differ from expectations. If it is determined that the goodwill has been impaired, the Company must write down the goodwill by the amount of the impairment, with a corresponding charge to net income (loss). These write downs could have a material adverse effect on our results of operations or financial condition.
Strategic and Operational Risks
Our businesses may suffer and we may incur substantial costs if we are unable to access our systems and safeguard the security of our data in the event of a disaster, cyber breach or other information security incident.
We use technology to process, store, retrieve, evaluate and utilize customer and company data and information. Our information technology and telecommunications systems, in turn, interface with and rely upon third-party systems. We and our third party vendors must be able to access our systems to provide insurance quotes, process premium payments, make changes to existing policies, file and pay claims, administer mutual funds, provide customer support, manage our investment portfolios, report on financial results and perform other necessary business functions.
Systems failures or outages could compromise our ability to perform these business functions in a timely manner, which could harm our ability to conduct business and hurt our relationships with our business partners and customers. In the event of a disaster such as a natural catastrophe, a pandemic, civil unrest, an industrial accident, a cyber-attack, a blackout, a terrorist attack (including conventional, nuclear, biological, chemical or radiological) or war, systems upon which we rely may be inaccessible to our employees, customers or business partners for an extended period of time. Even if our employees and business partners are able to report to work, they may be unable to perform their duties for an extended period of time if our data or systems used to conduct our business are disabled or destroyed.
Our systems have been, and will likely continue to be, subject to viruses or other malicious codes, unauthorized access, cyber-attacks (such as ransomware and denial of service), cyber frauds or other computer related penetrations. The frequency and sophistication of such threats continue to increase as well.
While, to date, The Hartford is not aware of having experienced a material breach of our cyber security systems, administrative, internal accounting and technical controls as well as other preventive actions may be insufficient to prevent physical and electronic break-ins, denial of service, cyber-attacks, business email compromises, ransomware or other security breaches to our systems or those of third parties with whom we do business. Such an event could compromise our confidential information as well as that of our clients and third parties, impede or interrupt our business operations and result in other negative consequences, including remediation costs, loss of revenue, additional regulatory scrutiny and litigation and reputational damage. In addition, we routinely transmit to third parties personal, confidential and proprietary information, which may be related to employees and customers, by email and other electronic means, along with receiving and storing such information on our systems. Although we attempt to protect privileged and confidential information, we may be unable to secure the information in all events, especially with clients, vendors, service providers, counterparties and other third parties who may not have appropriate controls to protect confidential information.
Our businesses must comply with regulations to control the privacy of customer, employee and third party data, and state, federal and international regulations regarding data privacy, including the European Union General Data Protection Regulation and California Consumer Privacy Act, are becoming increasingly more onerous. A misuse or mishandling of confidential or proprietary information could result in legal liability, regulatory action and reputational harm.
Third parties, including third party administrators and cloud-based systems, are also subject to cyber-attacks and breaches of confidential information, along with the other risks outlined above, any one of which may result in our incurring substantial costs and other negative consequences, including a material adverse effect on our business, reputation, financial condition, results of operations and liquidity. While we maintain cyber liability insurance that provides both third party liability and first party insurance coverages, our insurance may not be sufficient to protect against all loss.
Performance problems due to outsourcing and other third-party relationships may compromise our ability to conduct business.
We outsource certain business and administrative functions and rely on third-party vendors to perform certain functions or provide certain services on our behalf and have a significant number of information technology and business processes outsourced with a single vendor. If we are unable to reach agreement in the negotiation of contracts or renewals with certain third-party providers, or if such third-party providers experience disruptions in their processes or with relied upon vendors, or if they do not perform as anticipated, we may be unable to meet our obligations to customers and claimants, incur higher costs and lose business which may have a material adverse effect on our business and results of operations. For other risks associated with our outsourcing of certain functions, see the Risk Factor, “Our businesses may suffer and we may incur substantial costs if we are unable to access our systems and safeguard the security of our data in the event of a disaster, cyber breach or other information security incident.”
32
Part I - Item 1A. Risk Factors
Our ability to execute on capital management plans, expense reduction initiatives and other actions is subject to material challenges, uncertainties and risks.
The ability to execute on capital management plans is subject to material challenges, uncertainties and risks. From time to time, our capital management plans may include the repurchase of common stock, the paydown of outstanding debt or both. We may not achieve all of the benefits we expect to derive from these plans. For an equity repurchase plan approved by the Board, such capital management plan would be subject to execution risks, including, among others, risks related to market fluctuations, investor interest and potential legal constraints that could delay execution at an otherwise optimal time. There can be no assurance that we will fully execute any such plan. In addition, we may not be successful in keeping our businesses cost efficient. We may take future actions, including acquisitions, divestitures or restructurings that may involve additional uncertainties and risks that negatively impact our business, financial condition, results of operations and liquidity.
Acquisitions and divestitures may not produce the anticipated benefits and may result in unintended consequences, which could have a material adverse impact on our financial condition and results of operations.
We may not be able to successfully integrate acquired businesses or achieve the expected synergies as a result of such acquisitions or divestitures. The process of integrating an acquired company or business can be complex and costly and may create unforeseen operating difficulties including ineffective integration of underwriting, risk management, claims handling, finance, information technology and actuarial practices. Difficulties integrating an acquired business may also result in the acquired business performing differently than we expected including through the loss of customers or in our failure to realize anticipated increased premium growth or expense-related efficiencies. We could be adversely affected by the acquisition due to unanticipated performance issues and additional expense, unforeseen liabilities, transaction-related charges, downgrades by third-party rating agencies, diversion of management time and resources to integration challenges, loss of key employees, regulatory requirements, exposure to tax liabilities, amortization of expenses related to intangibles and charges for impairment of long-term assets or goodwill. In addition, we may be adversely impacted by uncertainties related to reserve estimates of the acquired company and its design and operation of internal controls over financial reporting. We may be unable to distribute as much capital to the holding company as planned due to regulatory restrictions or other reasons that may adversely affect our liquidity.
In addition, in the case of business or asset dispositions, we may have continued financial exposure to the divested businesses through reinsurance, indemnification or other financial arrangements following the transaction. The expected benefits of acquired or divested businesses may not be realized and involve additional uncertainties and risks that may negatively impact our business, financial condition, results of operations and liquidity.
Difficulty in attracting and retaining talented and qualified personnel may adversely affect the execution of our business strategies.
Our ability to attract, develop and retain talented employees, managers and executives is critical to our success. There is significant competition within and outside the insurance and financial services industry for qualified employees, particularly for individuals with highly specialized knowledge in areas such as underwriting, actuarial, data and analytics, technology and digital commerce and investment management. Our continued ability to compete effectively in our businesses and to expand into new business areas depends on our ability to attract new employees and to develop, retain and motivate our existing employees. The loss of key employees, including executives, managers and employees with strong technological, analytical and other specialized skills, may adversely impact the execution of our business objectives or result in loss of important institutional knowledge. Our inability to attract and retain key personnel could have a material adverse effect on our financial condition and results of operations.
We may not be able to protect our intellectual property and may be subject to infringement claims.
We rely on a combination of contractual rights and copyright, trademark, patent and trade secret laws to establish and protect our intellectual property. Although we use a broad range of measures to protect our intellectual property rights, third parties may infringe or misappropriate our intellectual property. We may have to litigate to enforce and protect our intellectual property and to determine its scope, validity or enforceability, which could divert significant resources and may not prove successful. Litigation to enforce our intellectual property rights may not be successful and cost a significant amount of money. The inability to secure or enforce the protection of our intellectual property assets could harm our reputation and have a material adverse effect on our business and our ability to compete. We also may be subject to costly litigation in the event that another party alleges our operations or activities infringe upon their intellectual property rights, including patent rights, or violate license usage rights. Any such intellectual property claims and any resulting litigation could result in significant expense and liability for damages, and in some circumstances we could be enjoined from providing certain products or services to our customers, or utilizing and benefiting from certain patent, copyrights, trademarks, trade secrets or licenses, or alternatively could be required to enter into costly licensing arrangements with third parties, all of which could have a material adverse effect on our business, results of operations and financial condition.
33
Part I - Item 1A. Risk Factors
Regulatory and Legal Risks
Regulatory and legislative developments could have a material adverse impact on our business, financial condition, results of operations and liquidity.
We are subject to extensive laws and regulations that are complex, subject to change and often conflict in their approach or intended outcomes. Compliance with these laws and regulations can increase cost, affect our strategy, and constrain our ability to adequately price our products.
In the U.S., regulatory initiatives and legislative developments may significantly affect our operations and prospects in ways that we cannot predict. For example, further reforms to the Affordable Care Act, and potential modifications of the Dodd-Frank Act, including expansion of the role of the Federal Insurance Office ("FIO") or repeal of the McCarran-Ferguson Act, could have unanticipated consequences for the Company and its businesses. It is unclear whether and to what extent Congress will continue to pursue these types of reforms, and how those changes might impact the Company, its business, financial conditions, results of operations and liquidity.
Our U.S. insurance subsidiaries are regulated by the insurance departments of the states in which they are domiciled, licensed or authorized to conduct business. State regulations generally seek to protect the interests of policyholders rather than an insurer or the insurer’s stockholders and other investors. U.S. state laws grant insurance regulatory authorities broad administrative powers with respect to, among other things, licensing and authorizing lines of business, approving policy forms and premium rates, setting statutory capital and reserve requirements, limiting the types and amounts of certain investments and restricting underwriting practices. State insurance departments also set constraints on domestic insurer transactions with affiliates and dividends and, in many cases, must approve affiliate transactions and extraordinary dividends as well as strategic transactions such as acquisitions and divestitures.
Our international insurance subsidiaries are subject to the laws and regulations of the relevant jurisdictions in which they operate, including the requirements of the Prudential Regulation Authority and the Financial Conduct Authority in the U.K and the Insurance Authority in Hong Kong. Our Lloyd’s Syndicate is also subject to management and supervision by the Council of Lloyd’s, which has wide discretionary powers to regulate members’ underwriting at Lloyd’s, as well as regulations imposed by overseas regulators where the Lloyd’s Syndicate conducts business.
There is continued uncertainty as to whether and how the U.K. might continue to access the E.U. Single Market now that the U.K. has left the E.U. following the conclusion of the Trade and Cooperation Agreement on December 30, 2020. There is the prospect of "equivalence" decisions to provide the U.K. with access, but these would be designed to cover a limited range of financial services activity and not offer permanent market access.
In addition, future regulatory initiatives could be adopted at the federal, state and international level that could impact the profitability of our businesses. For example, the NAIC and state insurance regulators are continually reexamining existing laws and regulations, specifically focusing on modifications to U.S. statutory accounting principles, interpretations of existing laws and the development of new laws and regulations. The NAIC continues to enhance the U.S. system of insurance solvency regulation, with a particular focus on group supervision, risk-based capital, accounting and financial reporting, enterprise risk management and reinsurance which could, among other things, affect statutory measures of capital sufficiency, including risk-based capital ratios.
In response to climate change, regulators at the federal, state and international level could impose new regulations requiring disclosure of underwriting or investment in certain industry sectors or could take other actions such as implementing a temporary moratorium on cancellation of policies within catastrophe prone areas. Specifically, the U.S. Securities and Exchange Commission (“SEC”) is considering new rules to require climate-related risk disclosures in public filings and the FIO continues to analyze the potential for climate change to affect insurance and reinsurance coverage, which could result in increased data collection and reporting. Regulators may also impose new requirements affecting our operations such as enforcing compliance with reductions in greenhouse gas emissions (GHGe) and increasing the targeted reductions in the future.
In addition, changes in laws or regulations, particularly relating to privacy and data security and potential limitations on predictive models, such as use of certain underwriting rating variables, may materially impede our ability to execute on business strategies and/or our ability to be competitive. Any proposed or future legislation or NAIC initiatives, if adopted, may be more restrictive on our ability to conduct business than current regulatory requirements or may result in higher costs or increased statutory capital and reserve requirements. In addition, the Federal Reserve Board and the International Association of Insurance Supervisors ("IAIS") continue to advance the development of insurance group capital standards. As of January 1, 2020, the IAIS Insurance Capital Standard entered a five-year monitoring period at the end of which insurance firms are required to be in compliance with such standards. While the Company would not currently be subject to either of these capital standard regimes, it is possible that, in the future, standards similar to what is being contemplated by the Federal Reserve Board or the IAIS could apply to the Company. Working through the NAIC, U.S. state insurance regulators have developed a group capital calculation for use in solvency-monitoring activities. The calculation is intended to provide additional analytical information to the lead state for use in assessing group risks and capital adequacy to complement the current holding company analysis in the U.S. The next step is for the revised NAIC Model Act and Regulation to go to the states for adoption. The Covered Agreement between the U.S. and European Union, as well as the Covered Agreement between the U.S. and the U.K., provide a 60-month period (expiring September 22, 2022) for the U.S. to implement a "worldwide group capital calculation" for U.S. groups. If this deadline is not met, European Union member states and the U.K. each could potentially subject U.S. groups doing business in the EU and the U.K. to their own group supervision requirements, possibly including imposition of Solvency II's group capital standard.
34
Part I - Item 1A. Risk Factors
Further, a particular regulator or enforcement authority may interpret a legal, accounting, or reserving issue differently than we have, exposing us to different or additional regulatory risks. The application of these regulations and guidelines by insurers involves interpretations and judgments that may be challenged by state insurance departments and other regulators. The result of those potential challenges could require us to increase levels of regulatory capital and reserves or incur higher operating and/or tax costs.
In addition, our asset management businesses are also subject to extensive regulation in the various jurisdictions where they operate. These laws and regulations are primarily intended to protect investors in the securities markets or investment advisory clients and generally grant supervisory authorities broad administrative powers. Compliance with these laws and regulations is costly, time consuming and personnel intensive, and may have an adverse effect on our business, financial condition, results of operations and liquidity.
Our insurance business is sensitive to significant changes in the legal environment that could adversely affect The Hartford’s results of operations or financial condition or harm its businesses.
Like any major P&C insurance company, litigation is a routine part of The Hartford’s business - both in defending and indemnifying our insureds and in litigating insurance coverage disputes. The Hartford accounts for such activity by establishing unpaid loss and loss adjustment expense reserves. Significant changes in the legal environment could cause our ultimate liabilities to change from our current expectations. Such changes could be judicial in nature, like trends in the size of jury awards, developments in the law relating to tort liability or the liability of insurers, and rulings concerning the scope of insurance coverage or the amount or types of damages covered by insurance. In addition, changes in federal or state laws and regulations relating to the liability of insurers or policyholders, including state laws expanding “bad faith” liability and state “reviver” statutes, extending statutes of limitations for certain sexual molestation and sexual abuse claims, could result in changes in business practices, additional litigation, or could result in unexpected losses, including increased frequency and severity of claims. It is impossible to forecast such changes reliably, much less to predict how they might affect our loss reserves or how those changes might adversely affect our ability to price our insurance products appropriately. Thus, significant judicial or legislative developments could adversely affect The Hartford’s business, financial condition, results of operations and liquidity.
Changes in federal, state or foreign tax laws could adversely affect our business, financial condition, results of operations and liquidity.
Changes in federal, state or foreign tax laws and tax rates or regulations could have a material adverse effect on our profitability and financial condition by increasing the Company's overall tax and compliance burdens. The Company’s federal and state tax returns reflect certain items such as tax-exempt bond interest, tax credits, and insurance reserve deductions. There is an increasing risk that, in the context of tax reform in
the U.S., federal and/or state tax legislation could modify or eliminate these items, impacting the Company, its investments, investment strategies, and/or its policyholders.
Regulatory requirements could delay, deter or prevent a takeover attempt that stockholders might consider in their best interests.
Before a person can acquire control of a U.S. insurance company, prior written approval must be obtained from the insurance commissioner of the state where the domestic insurer is domiciled. Prior to granting approval of an application to acquire control of a domestic insurer, the state insurance commissioner will consider such factors as the financial strength of the applicant, the acquirer's plans for the future operations of the domestic insurer, and any such additional information as the insurance commissioner may deem necessary or appropriate for the protection of policyholders or in the public interest. Generally, state statutes provide that control over a domestic insurer is presumed to exist if any person, directly or indirectly, owns, controls, holds with the power to vote, or holds proxies representing 10 percent or more of the voting securities of the domestic insurer or its parent company. Because a person acquiring 10 percent or more of our common stock would indirectly control the same percentage of the stock of our U.S. insurance subsidiaries, the insurance change of control laws of various U.S. jurisdictions would likely apply to such a transaction. Other laws or required approvals pertaining to one or more of our existing subsidiaries, or a future subsidiary, may contain similar or additional restrictions on the acquisition of control of the Company. These laws and similar rules applying to subsidiaries domiciled outside of the United States may discourage potential acquisition proposals and may delay, deter, or prevent a change of control, including transactions that our Board of Directors and some or all of our stockholders might consider to be desirable.
Changes in accounting principles and financial reporting requirements could adversely affect our results of operations or financial condition.
As an SEC registrant, we are currently required to prepare our financial statements in accordance with U.S. GAAP, as promulgated by the Financial Accounting Standards Board ("FASB"). Accordingly, we are required to adopt new guidance or interpretations which may have a material effect on our results of operations and financial condition that is either unexpected or has a greater impact than expected. For a description of changes in accounting standards that are currently pending and, if known, our estimates of their expected impact, see Note 1 - Basis of Presentation and Significant Accounting Policies of Notes to the Consolidated Financial Statements.
35
Part I - Item 2. Properties
| Item 2. | ||||||||||||||
PROPERTIES
As of December 31, 2021, The Hartford owned building space totaling approximately 1.8 million square feet consisting principally of 1.77 million square feet for its home office complex in Hartford, Connecticut and other properties within the greater Hartford, Connecticut area. In addition, we lease offices throughout North America, the United Kingdom and other overseas locations to house administrative, claims handling,
sales and other business operations. As of December 31, 2021, The Hartford leased approximately 1.3 million square feet throughout North America, 22 thousand square feet in London and 5 thousand square feet in other international branches. All of the properties owned or leased are used by one or more of all five reporting segments, depending on the location. For more information on reporting segments, see Part I, Item 1, Business Reporting Segments. The Company believes its properties and facilities are suitable and adequate for current operations.
| Item 3. | ||||||||||||||
LEGAL PROCEEDINGS
For a discussion regarding The Hartford’s legal proceedings, see the information contained under “Litigation,” including “COVID-19 Pandemic Business Income Insurance Litigation ” and “Run-off Asbestos and Environmental Claims,” in Note 15 - Commitments and Contingencies of the Notes to Consolidated Financial Statements.
36
Part II - Item 5. Market for the Hartford's Common Equity, Related Stockholder Matters and Issuer Purchases of Equity Securities
| Item 5. | ||||||||||||||
MARKET FOR THE HARTFORD'S COMMON EQUITY, RELATED STOCKHOLDER MATTERS AND ISSUER PURCHASES OF EQUITY SECURITIES
The Hartford’s common stock is traded on the New York Stock Exchange (“NYSE”) under the trading symbol “HIG”. As of February 17, 2022, the Company had approximately 9,679 registered holders of record of the Company's common stock. A substantially greater number of holders of our common stock are “street name” holders or beneficial holders, whose shares
are held of record by banks, brokers and other financial institutions.
The Hartford's cash dividends paid on common stock and expected payment of future cash dividends are discussed in the Summary of Capital Resources and Liquidity and Liquidity Requirements and Sources of Capital - Dividends sections of Part II, Item 7, MD&A — Capital Resources and Liquidity.
For information related to securities authorized for issuance under equity compensation plans, see Part III, Item 12, Security Ownership of Certain Beneficial Owners and Management and Related Stockholder Matters.
Repurchases of common stock by the Company during the quarter ended December 31, 2021 are set forth below. During the period from January 1, 2022 through February 17, 2022, the Company repurchased 3.8 million shares for $274.
| Repurchases of Common Stock by the Issuer for the Three Months Ended December 31, 2021 | ||||||||||||||
| Period | Total Number of Shares Purchased | Average Price Paid Per Share | Total Number of Shares Purchased as Part of Publicly Announced Plans or Programs | Approximate Dollar Value of Shares that May Yet Be Purchased Under the Plans or Programs [1] | ||||||||||
| (in millions) | ||||||||||||||
| October 1, 2021 - October 31, 2021 | 1,618,168 | $ | 72.42 | 1,618,168 | $ | 1,681 | ||||||||
| November 1, 2021 - November 30, 2021 | 3,165,842 | $ | 71.02 | 3,165,842 | $ | 1,456 | ||||||||
| December 1, 2021 - December 31, 2021 | 2,328,073 | $ | 67.86 | 2,328,073 | $ | 1,298 | ||||||||
| Total | 7,112,083 | $ | 70.31 | 7,112,083 | ||||||||||
[1]On December 17, 2020, the Board of Directors authorized a new equity repurchase plan for $1.5 billion for the period commencing January 1, 2021 through December 31, 2022. The Board of Directors increased this authorization by $1 billion on April 22, 2021 and by $500 on October 28, 2021, bringing the aggregate repurchase authorization to $3.0 billion through December 31, 2022. The timing of any repurchases of shares under the remaining equity repurchase authorization is dependent upon several factors, including the market price of the Company's securities, the Company's capital position, consideration of the effect of any repurchases on the Company's financial strength or credit ratings, the Company's blackout periods, and other considerations.
|TOTAL RETURN TO STOCKHOLDERS | ||
The following tables present The Hartford’s annual return percentage and five-year total return on its common stock including reinvestment of dividends in comparison to the S&P
500 and the S&P Insurance Composite Index.
| Annual Return Percentage | ||||||||||||||||||||
| For the years ended | ||||||||||||||||||||
| Company/Index | 2017 | 2018 | 2019 | 2020 | 2021 | |||||||||||||||
| The Hartford Financial Services Group, Inc. | 20.25 | % | (19.24 | %) | 39.71 | % | (16.98 | %) | 44.27 | % | ||||||||||
| S&P 500 Index | 21.83 | % | (4.38 | %) | 31.49 | % | 18.40 | % | 28.71 | % | ||||||||||
| S&P Insurance Composite Index | 16.19 | % | (11.21 | %) | 29.38 | % | (0.44 | %) | 32.12 | % | ||||||||||
37
Part II - Item 5. Market for the Hartford's Common Equity, Related Stockholder Matters and Issuer Purchases of Equity Securities
| Cumulative Five-Year Total Return | |||||||||||||||||||||||||||||
| Base | |||||||||||||||||||||||||||||
| Period | For the years ended | ||||||||||||||||||||||||||||
| Company/Index | 2016 | 2017 | 2018 | 2019 | 2020 | 2021 | |||||||||||||||||||||||
| The Hartford Financial Services Group, Inc. | $ | 100 | $ | 120.25 | $ | 97.11 | $ | 135.68 | $ | 112.64 | $ | 162.51 | |||||||||||||||||
| S&P 500 Index | $ | 100 | $ | 121.83 | $ | 116.49 | $ | 153.18 | $ | 181.36 | $ | 233.43 | |||||||||||||||||
| S&P Insurance Composite Index | $ | 100 | $ | 116.19 | $ | 103.17 | $ | 133.48 | $ | 132.89 | $ | 175.57 | |||||||||||||||||
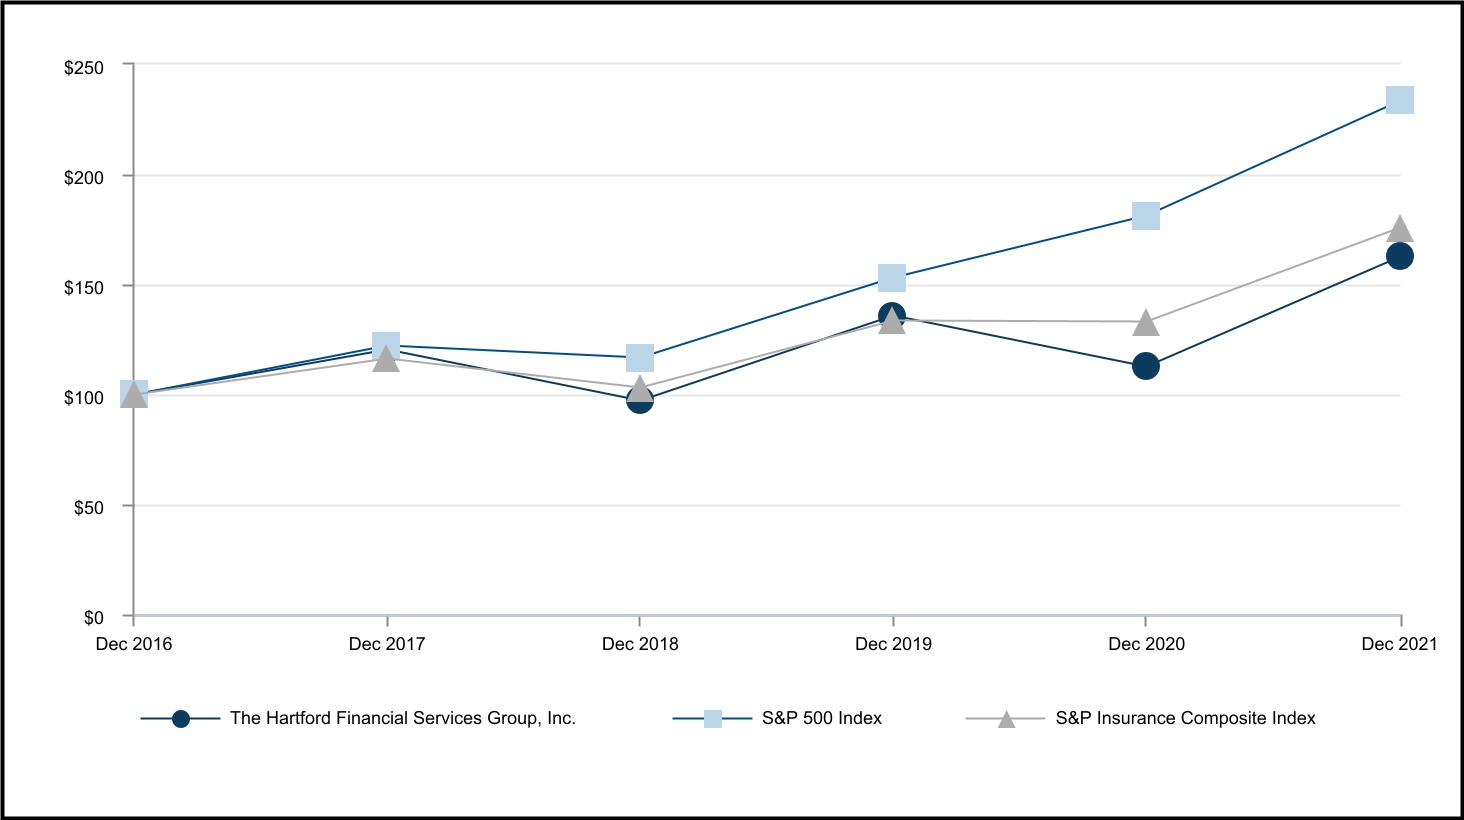
38
Part II - Item 7. Management's Discussion and Analysis of Financial Condition and Results of Operations
| Item 7. | ||||||||||||||
MANAGEMENT’S DISCUSSION AND ANALYSIS OF FINANCIAL CONDITION AND RESULTS OF OPERATIONS
(Dollar amounts in millions, except for per share data, unless otherwise stated)
The Hartford provides projections and other forward-looking information in the following discussions, which contain many forward-looking statements, particularly relating to the Company’s future financial performance. These forward-looking statements are estimates based on information currently available to the Company, are made pursuant to the safe harbor provisions of the Private Securities Litigation Reform Act of 1995 and are subject to the cautionary statements set forth on pages 4 and 5 of this Form 10-K. Actual results are likely to differ, and in the past have differed, materially from those forecast by the Company, depending on the outcome of various factors, including, but not limited to, those set forth in the following discussion and in Part I, Item 1A, Risk Factors, and those identified from time to time in our other filings with the Securities and Exchange Commission. The Hartford undertakes no obligation to publicly update any forward-looking statements, whether as a result of new information, future developments or otherwise.
On December 29, 2021, the Company completed the sale of all of the issued and outstanding equity of Navigators Holdings (Europe) N.V., a Belgium holding company, and its subsidiaries, Bracht, Deckers & Mackelbert N.V. (“BDM”) and Assurances Contintales Contintale Verzekeringen N.V. (“ASCO”), (collectively referred to as "Continental Europe Operations").
For discussion of reclassifications, acquisitions, and dispositions, see Note 1 - Basis of Presentation and Significant Accounting Policies, Note 2 - Business Acquisitions and Note 22 - Business Dispositions of Notes to Consolidated Financial Statements.
The Hartford defines increases or decreases greater than or equal to 200% as “NM” or not meaningful.
For discussion of the earliest of the three years included in the financial statements of the current filing, refer to Part 2, Item 7, Management's Discussion and Analysis of Financial Condition and Results of Operations in The Hartford’s 2020 Form 10-K Annual Report.
Index
| Description | Page | ||||
Throughout the MD&A, we use certain terms and abbreviations, the more commonly used are summarized in the Acronyms section.
KEY PERFORMANCE MEASURES AND RATIOS
The Company considers the measures and ratios in the following discussion to be key performance indicators for its businesses. Management believes that these ratios and measures are useful in understanding the underlying trends in The Hartford’s businesses. However, these key performance indicators should only be used in conjunction with, and not in lieu of, the results presented in the segment discussions that follow in this MD&A. These ratios and measures may not be comparable to other performance measures used by the Company’s competitors.
Definitions of Non-GAAP and Other Measures and Ratios
Assets Under Management (“AUM”)- Include mutual fund and ETP assets. AUM is a measure used by the Company's Hartford Funds segment because a significant portion of the segments’s revenues and expenses are based upon asset values. These revenues and expenses increase or decrease with a rise or fall in AUM whether caused by changes in the market or through net flows.
Book Value per Diluted Share excluding accumulated other comprehensive income ("AOCI")- This is a non-GAAP per share measure that is calculated by dividing (a) common stockholders' equity, excluding AOCI, after tax, by (b) common shares outstanding
39
Part II - Item 7. Management's Discussion and Analysis of Financial Condition and Results of Operations
and dilutive potential common shares. The Company provides this measure to enable investors to analyze the amount of the Company's net worth that is primarily attributable to the Company's business operations. The Company believes that excluding AOCI from the numerator is useful to investors because it eliminates the effect of items that can fluctuate significantly from period to period, primarily based on changes in interest rates. Book value per diluted share is the most directly comparable U.S. GAAP measure.
Combined Ratio- The sum of the loss and loss adjustment expense ratio, the expense ratio and the policyholder dividend ratio. This ratio is a relative measurement that describes the related cost of losses and expenses for every $100 of earned premiums. A combined ratio below 100 demonstrates underwriting profit; a combined ratio above 100 demonstrates underwriting losses.
Core Earnings- The Hartford uses the non-GAAP measure core earnings as an important measure of the Company’s operating performance. The Hartford believes that core earnings provides investors with a valuable measure of the performance of the Company’s ongoing businesses because it reveals trends in our insurance and financial services businesses that may be obscured by including the net effect of certain items. Therefore, the following items are excluded from core earnings:
•Certain realized gains and losses - Some realized gains and losses are primarily driven by investment decisions and external economic developments, the nature and timing of which are unrelated to the insurance and underwriting aspects of our business. Accordingly, core earnings excludes the effect of all realized gains and losses that tend to be highly variable from period to period based on capital market conditions. The Hartford believes, however, that some realized gains and losses are integrally related to our insurance operations, so core earnings includes net realized gains and losses such as net periodic settlements on credit derivatives. These net realized gains and losses are directly related to an offsetting item included in the income statement such as net investment income.
•Restructuring and other costs - Costs incurred as part of a restructuring plan are not a recurring operating expense of the business.
•Loss on extinguishment of debt - Largely consisting of make-whole payments or tender premiums upon paying debt off before maturity, these losses are not a recurring operating expense of the business.
•Gains and losses on reinsurance transactions - Gains or losses on reinsurance, such as those entered into upon sale of a business or to reinsure loss reserves, are not a recurring operating expense of the business.
•Integration and other non-recurring M&A costs - These costs, including transaction costs incurred in connection with an acquired business, are incurred over a short period of time and do not represent an ongoing operating expense of the business.
•Change in loss reserves upon acquisition of a business - These changes in loss reserves are excluded from core earnings because such changes could obscure the ability to compare results in periods after the acquisition to results of periods prior to the acquisition.
•Deferred gain resulting from retroactive reinsurance and subsequent changes in the deferred gain - Retroactive reinsurance agreements economically transfer risk to the reinsurers and including the full benefit from retroactive reinsurance in core earnings provides greater insight into the economics of the business.
•Change in valuation allowance on deferred taxes related to non-core components of before tax income - These changes in valuation allowances are excluded from core earnings because they relate to non-core components of before tax income, such as tax attributes like capital loss carryforwards.
•Results of discontinued operations - These results are excluded from core earnings for businesses sold or held for sale because such results could obscure the ability to compare period over period results for our ongoing businesses.
In addition to the above components of net income available to common stockholders that are excluded from core earnings, preferred stock dividends declared, which are excluded from net income available to common stockholders, are included in the determination of core earnings. Preferred stock dividends are a cost of financing more akin to interest expense on debt and are expected to be a recurring expense as long as the preferred stock is outstanding.
Net income (loss) and net income (loss) available to common stockholders are the most directly comparable U.S. GAAP measures to core earnings. Core earnings should not be considered as a substitute for net income (loss) or net income (loss) available to common stockholders and does not reflect the overall profitability of the Company's business. Therefore, The Hartford believes that it is useful for investors to evaluate net income (loss), net income (loss) available to common stockholders, and core earnings when reviewing the Company's performance.
40
Part II - Item 7. Management's Discussion and Analysis of Financial Condition and Results of Operations
Reconciliation of Net Income to Core Earnings
| For the years ended December 31, | |||||||||||
| 2021 | 2020 | 2019 | |||||||||
| Net income | $ | 2,365 | $ | 1,737 | $ | 2,085 | |||||
| Preferred stock dividends | 21 | 21 | 21 | ||||||||
| Net income available to common stockholders | $ | 2,344 | $ | 1,716 | $ | 2,064 | |||||
| Adjustments to reconcile net income available to common stockholders to core earnings: | |||||||||||
| Net realized losses (gains) excluded from core earnings, before tax | (505) | 18 | (389) | ||||||||
| Restructuring and other costs, before tax | 1 | 104 | — | ||||||||
| Loss on extinguishment of debt, before tax | — | — | 90 | ||||||||
| Loss on reinsurance transactions, before tax | — | — | 91 | ||||||||
| Integration and other non-recurring M&A costs, before tax | 58 | 51 | 91 | ||||||||
| Change in loss reserves upon acquisition of a business, before tax | — | — | 97 | ||||||||
| Change in deferred gain on retroactive reinsurance, before tax | 246 | 312 | 16 | ||||||||
| Income tax expense (benefit) [1] | 34 | (115) | 2 | ||||||||
| Core earnings | $ | 2,178 | $ | 2,086 | $ | 2,062 | |||||
[1] Primarily represents the federal income tax expense (benefit) related to before tax items not included in core earnings and includes the effect of changes in net deferred taxes due to changes in enacted tax rates.
Core Earnings Margin- The Hartford uses the non-GAAP measure core earnings margin to evaluate, and believes it is an important measure of, the Group Benefits segment's operating performance. Core earnings margin is calculated by dividing core earnings by revenues, excluding buyouts and realized gains (losses). Net income margin, calculated by dividing net income by revenues, is the most directly comparable U.S. GAAP measure. The Company believes that core earnings margin provides investors with a valuable measure of the performance of Group Benefits because it reveals trends in the business that may be obscured by the effect of buyouts and realized gains (losses) as well as other items excluded in the calculation of core earnings. Core earnings margin should not be considered as a substitute for net income margin and does not reflect the overall profitability of Group Benefits. Therefore, the Company believes it is important for investors to evaluate both core earnings margin and net income margin when reviewing performance. A reconciliation of net income margin to core earnings margin is set forth in the Results of Operations section within MD&A - Group Benefits.
Current Accident Year Catastrophe Ratio- A component of the loss and loss adjustment expense ratio, represents the ratio of catastrophe losses incurred in the current accident year (net of reinsurance) to earned premiums. For U.S. events, a catastrophe is an event that causes $25 or more in industry insured property losses and affects a significant number of property and casualty policyholders and insurers, as defined by the Property Claim Services office of Verisk. For international events, the Company's approach is similar, informed, in part, by how Lloyd's of London defines catastrophes. Lloyd's of London is an insurance market-place operating worldwide ("Lloyd's"). Lloyd's does not underwrite risks. The Company accepts risks as the sole member of Lloyd's Syndicate 1221 ("Lloyd's Syndicate"). The current accident year catastrophe ratio includes the effect of catastrophe losses, but does not include the effect of reinstatement premiums.
Expense Ratio- For the underwriting segments of Commercial Lines and Personal Lines is the ratio of underwriting expenses less fee income, to earned premiums. Underwriting expenses include the amortization of deferred policy acquisition costs ("DAC") and insurance operating costs and expenses, including certain centralized services costs and bad debt expense. DAC include commissions, taxes, licenses and fees and other incremental direct underwriting expenses and are amortized over the policy term.
The expense ratio for Group Benefits is expressed as the ratio of insurance operating costs and other expenses including amortization of intangibles and amortization of DAC, to premiums and other considerations, excluding buyout premiums.
The expense ratio for Commercial Lines, Personal Lines and Group Benefits does not include integration and other transaction costs associated with an acquired business.
Fee Income- Is largely driven from amounts earned as a result of contractually defined percentages of assets under management in our Hartford Funds business. These fees are generally earned on a daily basis. Therefore, the growth in assets under management either through net inflows or favorable market performance will have a favorable impact on fee income. Conversely, either net outflows or unfavorable market performance will reduce fee income.
Gross New Business Premium- Represents the amount of premiums charged, before ceded reinsurance, for policies issued to customers who were not insured with the Company in the previous policy term. Gross new business premium plus gross renewal written premium less ceded reinsurance equals total written premium.
Loss and Loss Adjustment Expense Ratio- A measure of the cost of claims incurred in the calendar year divided by earned premium and includes losses and loss
41
Part II - Item 7. Management's Discussion and Analysis of Financial Condition and Results of Operations
adjustment expenses incurred for both the current and prior accident years. Among other factors, the loss and loss adjustment expense ratio needed for the Company to achieve its targeted return on equity ("ROE") fluctuates from year to year based on changes in the expected investment yield over the claim settlement period, the timing of expected claim settlements and the targeted returns set by management based on the competitive environment.
The loss and loss adjustment expense ratio is affected by claim frequency and claim severity, particularly for shorter-tail property lines of business, where the emergence of claim frequency and severity is credible and likely indicative of ultimate losses. Claim frequency represents the percentage change in the average number of reported claims per unit of exposure in the current accident year compared to that of the previous accident year. Claim severity represents the percentage change in the estimated average cost per claim in the current accident year compared to that of the previous accident year. As one of the factors used to determine pricing, the Company’s practice is to first make an overall assumption about claim frequency and severity for a given line of business and then, as part of the rate-making process, adjust the assumption as appropriate for the particular state, product or coverage.
Loss and Loss Adjustment Expense Ratio before Catastrophes and Prior Accident Year Development- A measure of the cost of non-catastrophe loss and loss adjustment expenses incurred in the current accident year divided by earned premiums. Management believes that the current accident year loss and loss adjustment expense ratio before catastrophes is a performance measure that is useful to investors as it removes the impact of volatile and unpredictable catastrophe losses and prior accident year development.
Loss Ratio, excluding Buyouts- Utilized for the Group Benefits segment and is expressed as a ratio of benefits, losses and loss adjustment expenses, excluding those related to buyout premiums, to premiums and other considerations, excluding buyout premiums. Since Group Benefits occasionally buys a block of claims for a stated premium amount, the Company excludes this buyout from the loss ratio used for evaluating the profitability of the business as buyouts may distort the loss ratio. Buyout premiums represent takeover of open claim liabilities and other non-recurring premium amounts.
Mutual Fund and Exchange-Traded Product Assets- Are owned by the shareholders of those products and not by the Company and, therefore, are not reflected in the Company’s Consolidated Financial Statements except in instances where the Company seeds new investment products.
Mutual fund and ETP assets are a measure used by the Company primarily because a significant portion of the Company’s Hartford Funds segment revenues and expenses are based upon asset values. These revenues and expenses increase or decrease with a rise or fall in AUM whether caused by changes in the market or through net flows.
Net New Business Premium- Represents the amount of premiums charged, after ceded reinsurance, for policies issued to customers who were not insured with the Company in the
previous policy term. Net new business premium plus renewal written premium equals total written premium.
Policy Count Retention- Represents the ratio of the number of renewal policies issued during the current year period divided by the number of policies issued in the previous calendar period before considering policies cancelled subsequent to renewal. Policy count retention is affected by a number of factors, including the percentage of renewal policy quotes accepted and decisions by the Company to non-renew policies because of specific policy underwriting concerns or because of a decision to reduce premium writings in certain classes of business or states. Policy count retention is also affected by advertising and rate actions taken by competitors.
Policy Count Retention, Net of Cancellations- Represents the ratio of the number of renewal policies issued net of cancellations during the current year period divided by the number of policies issued net of cancellations in the previous calendar period.
Policies in Force- Represents the number of policies with coverage in effect as of the end of the period. The number of policies in force is a growth measure used for Personal Lines and standard commercial lines (small commercial and middle market lines within middle & large commercial) within Commercial Lines and is affected by both new business growth and policy count retention.
Policyholder Dividend Ratio- The ratio of policyholder dividends to earned premium.
Prior Accident Year Loss and Loss Adjustment Expense Ratio- Represents the increase (decrease) in the estimated cost of settling catastrophe and non-catastrophe claims incurred in prior accident years as recorded in the current calendar year divided by earned premiums.
Reinstatement Premiums- Represents additional ceded premium paid for the reinstatement of the amount of reinsurance coverage that was reduced as a result of the Company ceding losses to reinsurers.
Renewal Earned Price Increase (Decrease)- Written premiums are earned over the policy term, which is six months for certain Personal Lines automobile business and twelve months for substantially all of the remainder of the Company’s Property and Casualty business. Since the Company earns premiums over the six to twelve month term of the policies, renewal earned price increases (decreases) lag renewal written price increases (decreases) by six to twelve months.
Renewal Written Price Increase (Decrease)- For Commercial Lines, represents the combined effect of rate changes, amount of insurance and individual risk pricing decisions per unit of exposure on commercial lines policies that renewed. For Personal Lines, renewal written price increases represent the total change in premium per policy since the prior year on those policies that renewed and includes the combined effect of rate changes, amount of insurance and other changes in exposure. For Personal Lines, other changes in exposure include, but are not limited to, the effect of changes in number of drivers, vehicles and incidents, as well as changes in customer policy elections, such as deductibles and limits. The rate
42
Part II - Item 7. Management's Discussion and Analysis of Financial Condition and Results of Operations
component represents the change in rate filed with and approved by state regulators during the period and the amount of insurance represents the change in the value of the rating base, such as model year/vehicle symbol for automobiles, building replacement costs for property and wage inflation for workers’ compensation. A number of factors affect renewal written price increases (decreases) including expected loss costs as projected by the Company’s pricing actuaries, rate filings approved by state regulators, risk selection decisions made by the Company’s underwriters and marketplace competition. Renewal written price changes reflect the property and casualty insurance market cycle. Prices tend to increase for a particular line of business when insurance carriers have incurred significant losses in that line of business in the recent past or the industry as a whole commits less of its capital to writing exposures in that line of business. Prices tend to decrease when recent loss experience has been favorable or when competition among insurance carriers increases. Renewal written price statistics are subject to change from period to period, based on a number of factors, including changes in actuarial estimates and the effect of subsequent cancellations and non-renewals, and modifications made to better reflect ultimate pricing achieved.
Return on Assets ("ROA"), Core Earnings-The Company uses this non-GAAP financial measure to evaluate, and believes is an important measure of, the Hartford Funds segment’s operating performance. ROA, core earnings is calculated by dividing annualized core earnings by a daily average AUM. ROA is the most directly comparable U.S. GAAP measure. The Company believes that ROA, core earnings, provides investors with a valuable measure of the performance of the Hartford Funds segment because it reveals trends in our business that may be obscured by the effect of items excluded in the calculation of core earnings. ROA, core earnings, should not be considered as a substitute for ROA and does not reflect the overall profitability of our Hartford Funds business. Therefore, the Company believes it is important for investors to evaluate both ROA, and ROA, core earnings when reviewing the Hartford Funds segment performance. A reconciliation of ROA to ROA, core earnings is set forth in the Results of Operations section within MD&A - Hartford Funds.
Underlying Combined Ratio-This non-GAAP financial measure of underwriting results represents the combined ratio before catastrophes, prior accident year development and current accident year change in loss reserves upon acquisition of a business. Combined ratio is the most directly comparable GAAP measure. The underlying combined ratio represents the combined ratio for the current accident year, excluding the impact of current accident year catastrophes and current accident year change in loss reserves upon acquisition of a business. The Company believes this ratio is an important measure of the trend in profitability since it removes the impact of volatile and unpredictable catastrophe losses and prior accident year loss and loss adjustment expense reserve development. The changes to loss reserves upon acquisition of a business are excluded from underlying combined ratio because such changes could obscure the ability to compare results in periods after the acquisition to results of periods prior to the acquisition as such trends are valuable to our investors' ability to assess the Company's financial performance. A reconciliation of combined ratio to underlying combined ratio is set forth in the Results of Operations section within MD&A - Commercial Lines and Personal Lines.
Underwriting Gain (Loss)- The Hartford's management evaluates profitability of the Commercial and Personal Lines segments primarily on the basis of underwriting gain or loss. Underwriting gain (loss) is a before tax non-GAAP measure that represents earned premiums less incurred losses, loss adjustment expenses and underwriting expenses. Net income (loss) is the most directly comparable GAAP measure. Underwriting gain (loss) is influenced significantly by earned premium growth and the adequacy of The Hartford's pricing. Underwriting profitability over time is also greatly influenced by The Hartford's underwriting discipline, as management strives to manage exposure to loss through favorable risk selection and diversification, effective management of claims, use of reinsurance and its ability to manage its expenses. The Hartford believes that the measure underwriting gain (loss) provides investors with a valuable measure of profitability, before tax, derived from underwriting activities, which are managed separately from the Company's investing activities.
43
Part II - Item 7. Management's Discussion and Analysis of Financial Condition and Results of Operations
Reconciliation of Net Income to Underwriting Gain (Loss)
| For the years ended December 31, | |||||||||||||||||
| 2021 | 2020 | 2019 | |||||||||||||||
| Commercial Lines | |||||||||||||||||
| Net income | $ | 1,757 | $ | 856 | $ | 1,192 | |||||||||||
| Adjustments to reconcile net income to underwriting gain (loss): | |||||||||||||||||
| Net servicing income | (13) | (4) | (2) | ||||||||||||||
| Net investment income | (1,502) | (1,160) | (1,129) | ||||||||||||||
| Net realized losses (gains) | (260) | 60 | (271) | ||||||||||||||
| Other expense | 18 | 35 | 38 | ||||||||||||||
| Loss on reinsurance transaction | — | — | 91 | ||||||||||||||
| Income tax expense | 402 | 176 | 270 | ||||||||||||||
| Underwriting gain (loss) | $ | 402 | $ | (37) | $ | 189 | |||||||||||
| Personal Lines | |||||||||||||||||
| Net income (loss) | $ | 385 | $ | 718 | $ | 318 | |||||||||||
| Adjustments to reconcile net income to underwriting gain (loss): | |||||||||||||||||
| Net servicing income | (19) | (14) | (13) | ||||||||||||||
| Net investment income | (157) | (157) | (179) | ||||||||||||||
| Net realized losses (gains) | (29) | 5 | (43) | ||||||||||||||
| Other expense | — | 1 | 1 | ||||||||||||||
| Income tax expense | 95 | 184 | 76 | ||||||||||||||
| Underwriting gain | $ | 275 | $ | 737 | $ | 160 | |||||||||||
| P&C Other Ops | |||||||||||||||||
| Net Income | $ | (95) | $ | (168) | $ | 61 | |||||||||||
| Adjustments to reconcile net income to underwriting gain (loss): | |||||||||||||||||
| Net investment income | (75) | (55) | (84) | ||||||||||||||
| Net realized losses (gains) | (13) | 1 | (20) | ||||||||||||||
| Other expense (income) | 1 | (1) | — | ||||||||||||||
| Income tax expense (benefit) | (28) | (46) | 12 | ||||||||||||||
| Underwriting loss | $ | (210) | $ | (269) | $ | (31) | |||||||||||
Written and Earned Premiums- Written premium represents the amount of premiums charged for policies issued, net of reinsurance, during a fiscal period. Premiums are considered earned and are included in the financial results on a pro rata basis over the policy period. Management believes that written premium is a performance measure that is useful to investors as it reflects current trends in the Company’s sale of property and casualty insurance products. Written and earned premium are recorded net of ceded reinsurance premium.
Traditional life and disability insurance type products, such as those sold by Group Benefits, collect premiums from policyholders in exchange for financial protection for the policyholder from a specified insurable loss, such as death or disability. These premiums, together with net investment income earned, are used to pay the contractual obligations under these insurance contracts.
Two major factors, new sales and persistency, impact premium growth. Sales can increase or decrease in a given year based on a number of factors including, but not limited to, customer demand for the Company’s product offerings, pricing competition, distribution channels and the Company’s reputation
and ratings. Persistency refers to the percentage of premium remaining in-force from year-to-year.
THE HARTFORD'S OPERATIONS
The Hartford conducts business principally in five reporting segments including Commercial Lines, Personal Lines, Property & Casualty Other Operations, Group Benefits and Hartford Funds, as well as a Corporate category. The Company includes in the Corporate category reserves for run-off structured settlement and terminal funding agreement liabilities, restructuring costs, capital raising activities (including equity financing, debt financing and related interest expense), transaction expenses incurred in connection with an acquisition, certain M&A costs, purchase accounting adjustments related to goodwill and other expenses not allocated to the reporting segments. Corporate also includes investment management fees and expenses related to managing third party business, including management of a portion of the invested assets of Talcott Resolution Life, Inc. and its subsidiaries as well as
44
Part II - Item 7. Management's Discussion and Analysis of Financial Condition and Results of Operations
certain affiliates. In addition, up until June 30, 2021, Corporate included a 9.7% ownership interest in Hopmeadow Holdings LP, the legal entity that acquired Talcott Resolution in May 2018 (Hopmeadow Holdings, LP, Talcott Resolution Life Inc., and its subsidiaries are collectively referred to as "Talcott Resolution"). The sale of Talcott Resolution to a new investor was completed on June 30, 2021. The Company received a total of $217 in connection with the sale of its 9.7% ownership interest, resulting in a realized gain of $46 before tax in 2021.
The Company derives its revenues principally from: (a) premiums earned for insurance coverage provided to insureds; (b) management fees on mutual fund and ETP assets; (c) net investment income; (d) fees earned for services provided to third parties; and (e) net realized gains and losses. Premiums charged for insurance coverage are earned principally on a pro rata basis over the terms of the related policies in-force.
The profitability of the Company's property and casualty insurance businesses over time is greatly influenced by the Company’s underwriting discipline, which seeks to manage exposure to loss through favorable risk selection and diversification, its management of claims, its use of reinsurance, the size of its in force block, actual mortality and morbidity experience, and its ability to manage its expense ratio which it accomplishes through economies of scale and its management of acquisition costs and other underwriting expenses. Pricing adequacy depends on a number of factors, including the ability to obtain regulatory approval for rate changes, proper evaluation of underwriting risks, the ability to project future loss cost frequency and severity based on historical loss experience adjusted for known trends, the Company’s response to rate actions taken by competitors, its expense levels and expectations about regulatory and legal developments. The Company seeks to price its insurance policies such that insurance premiums and future net investment income earned on premiums received will cover underwriting expenses and the ultimate cost of paying claims reported on the policies and provide for a profit margin. For many of its insurance products, the Company is required to obtain approval for its premium rates from state insurance departments and the Lloyd's Syndicate's ability to write business is subject to Lloyd's approval for its premium capacity each year. Most of Personal Lines written premium is associated with our exclusive licensing agreement with AARP, which is effective through December 31, 2032. This agreement provides an important competitive advantage given the size of the 50 plus population and the strength of the AARP brand.
Similar to property and casualty, profitability of the group benefits business depends, in large part, on the ability to evaluate and price risks appropriately and make reliable estimates of mortality, morbidity, disability and longevity. To manage the pricing risk, Group Benefits generally offers term insurance policies, allowing for the adjustment of rates or policy terms in order to minimize the adverse effect of market trends, loss costs, declining interest rates and other factors. However, as policies are typically sold with rate guarantees of up to three years, pricing for the Company’s products could prove to be inadequate if loss and expense trends emerge adversely during the rate guarantee period or if investment returns are lower than expected at the time the products were sold. For some of its products, the Company is required to obtain approval for its premium rates from state insurance departments. New and
renewal business for group benefits business, particularly for long-term disability, are priced using an assumption about expected investment yields over time. While the Company employs asset-liability duration matching strategies to mitigate risk and may use interest-rate sensitive derivatives to hedge its exposure in the Group Benefits investment portfolio, cash flow patterns related to the payment of benefits and claims are uncertain and actual investment yields could differ significantly from expected investment yields, affecting profitability of the business. In addition to appropriately evaluating and pricing risks, the profitability of the Group Benefits business depends on other factors, including the Company’s response to pricing decisions and other actions taken by competitors, its ability to offer voluntary products and self-service capabilities, the persistency of its sold business and its ability to manage its expenses which it seeks to achieve through economies of scale and operating efficiencies.
The financial results of the Company’s mutual fund and ETP businesses depend largely on the amount of assets under management and the level of fees charged based, in part, on asset share class and product type. Changes in assets under management are driven by the two main factors of net flows and the market return of the funds, which are heavily influenced by the return realized in the equity and bond markets. Net flows are comprised of new sales less redemptions by mutual fund and ETP shareholders. Financial results are highly correlated to the growth in assets under management since these products generally earn fee income on a daily basis.
The investment return, or yield, on invested assets is an important element of the Company’s earnings since insurance products are priced with the assumption that premiums received can be invested for a period of time before benefits, losses and loss adjustment expenses are paid. Due to the need to maintain sufficient liquidity to satisfy claim obligations, the majority of the Company’s invested assets have been held in available-for-sale securities, including, among other asset classes, corporate bonds, municipal bonds, government debt, short-term debt, mortgage-backed securities, asset-backed securities and collateralized loan obligations. The primary investment objective for the Company is to maximize economic value, consistent with acceptable risk parameters, including the management of credit risk and interest rate sensitivity of invested assets, while generating sufficient net of tax income to meet policyholder and corporate obligations. Investment strategies are developed based on a variety of factors including business needs, regulatory requirements and tax considerations.
Impact of COVID-19 on our financial condition, results of operations and liquidity
Impact to written and earned premiums
Despite the rollout of vaccines and states largely lifting restrictions allowing business to re-open, the COVID-19 pandemic continues to pose a threat to the economic recovery of the U.S. and other countries in which we operate. As one of the largest providers of small business insurance in the U.S., we were negatively affected by economic effects of the pandemic on small businesses beginning in March of 2020. An
45
Part II - Item 7. Management's Discussion and Analysis of Financial Condition and Results of Operations
improvement in economic conditions in 2021 has contributed to an increase of 11% in our small commercial written premiums. Our middle & large commercial business was also negatively affected by COVID-19 and written premium has rebounded with an increase of 12% in 2021. Overall, Commercial Lines written premium increased $1,072, or 12%, in 2021 with growth in workers' compensation, small commercial package business, general liability, U.S. wholesale, U.S. financial lines and global reinsurance.
Personal Lines written premium declined 1% in 2021 due to the effect of non-renewed premium exceeding new business, partially offset by the effect of premium credits given in the second quarter of 2020.
In Group Benefits, fully insured ongoing premium increased 4% in 2021, primarily due to higher in-force employer group
disability premiums and higher supplemental health product premiums.
Impact to direct benefits, losses and loss adjustment expenses from COVID-19 claims
Total pandemic-related losses were higher in 2021 compared to 2020 driven by higher excess mortality in our group life business and an increase in pandemic-related short-term disability claims, partially offset by a reduction of P&C COVID-19 incurred losses.
| For the year ended December 31, | |||||||||||||||||
| 2021 | 2020 | ||||||||||||||||
| Excess mortality claims on group life | $ | 583 | $ | 239 | |||||||||||||
| COVID-19 short-term disability claims [1] | 31 | (9) | |||||||||||||||
| Workers' compensation COVID-19 claims | 20 | 66 | |||||||||||||||
| Global specialty financial lines and other | 11 | 71 | |||||||||||||||
| Commercial property | — | 141 | |||||||||||||||
| Total direct COVID-19 and excess mortality claims | $ | 645 | $ | 508 | |||||||||||||
[1]The year ended December 31, 2020 included both short-term disability and New York paid family leave claims related to COVID-19 and lower incurred losses due to fewer elective procedures during the early stages of the pandemic more than offset direct COVID-19 incurred losses.
Excess mortality in the group life business includes both claims where COVID-19 is specifically listed as the cause of death and indirect impacts of the pandemic such as causes of death due to patients deferring regular treatments of chronic conditions. The incidence of excess mortality claims is subject to significant uncertainty as it is dependent on a number of factors difficult to predict including, among others, the ultimate vaccination rate of the population, the potential spread of new COVID-19 variants, the effectiveness of the vaccines against new variants, the effectiveness of other treatments to prevent serious illness and death, the percentage of those infected who are of working age and the strain on the health care system preventing timely treatment of chronic illnesses.
Within P&C, direct COVID-19 incurred losses in 2021 were predominantly on workers' compensation claims incurred in the first quarter. We incur COVID-19 workers’ compensation losses when it is determined that workers were exposed to COVID-19 out of and in the course of their employment and in other cases where states have passed laws providing for the presumption of coverage for certain industry classes, including health care and other essential workers.
Apart from COVID-19 workers' compensation claims, net of favorable frequency, and incurred losses within financial lines, P&C COVID-19 incurred losses in 2020 primarily included $141 for property claims. There were no COVID-19 P&C property losses incurred in 2021. Nearly all of our property insurance policies require direct physical loss or damage to property and contain standard exclusions that we believe preclude coverage for COVID-19 related claims, and the vast majority of such policies contain exclusions for virus-related losses.
Other impacts from COVID-19
In Personal Lines automobile, miles driven and average claim severity increased in 2021, which has increased automobile loss costs. In addition, as the effects of favorable claim frequency
from lower miles driven during the pandemic have been factored into rates, we have experienced lower earned pricing increases resulting in a higher automobile loss ratio in 2021 than in 2020. Refer to Personal Lines Results of Operations for discussion of pricing and loss cost trends for the year ended December 31, 2021.
As we emerge from the pandemic, inflationary pressures in the economy have resulted in increased claim severity in 2021 in automobile and property lines of business in both Commercial Lines and Personal Lines. As expectations of inflationary pressures have increased, interest rates rose in 2021 and higher interest rates reduce the fair value of our investments in fixed maturity securities, available for sale ("AFS").
Aided by some improvement in the economy and the effect of the government’s economic stimulus payments to our customers, in 2021, we recorded a decrease of $47 in the allowance for credit losses ("ACL") on premiums receivable, reflecting a lower expectation of credit losses, though there remains an elevated risk of uncollectible premiums receivable relative to historical trends if economic conditions do not improve further.
As we emerge from the pandemic, we expect travel costs and certain employee benefits costs will increase relative to the lower level of those costs we have incurred in 2020 and 2021.
For information about resources the Company has to manage capital and liquidity, refer to the Capital Resources & Liquidity section of MD&A.
For additional information about the potential economic impacts to the Company of the COVID-19 pandemic, see the risk factor "The pandemic caused by the spread of COVID-19 has disrupted our operations and may have a material adverse
46
Part II - Item 7. Management's Discussion and Analysis of Financial Condition and Results of Operations
impact on our business results, financial condition, results of operations and/or liquidity" in Item 1A of Part I.
Operational transformation and cost reduction plan
In recognition of the need to become more cost efficient and competitive along with enhancing the experience we provide to agents and customers, on July 30, 2020, the Company announced an operational transformation and cost reduction plan it refers to as Hartford Next.Through reduction of its headcount, IT investments to further enhance our capabilities, and other activities, relative to 2019, the Company expects to achieve a reduction in annual insurance operating costs and other expenses of approximately $540 by 2022 and $625 by 2023.
To achieve those expected savings, we expect to incur approximately $401 over the course of the program, with $217
expensed cumulatively through December 31, 2021, and expected expenses of $89 in 2022, $38 in 2023 and $57 after 2023, with the expenses after 2023 consisting mostly of amortization of internal use software and capitalized real estate costs. Included in the estimated costs of $401, we expect to incur restructuring costs of approximately $130, including $48 of employee severance, and approximately $82 of other costs, including consulting expenses, lease termination expenses and the cost to retire certain IT applications. Restructuring costs are reported as a charge to net income but not in core earnings.
The following table presents Hartford Next program costs incurred, including restructuring costs, and expense savings relative to 2019 realized in 2021 and expected annual costs and expense savings relative to 2019 for the full year in 2022 and 2023:
| Hartford Next Costs and Expense Savings | |||||||||||||||||
| 2020 | 2021 | Estimate for 2022 | Estimate for 2023 | ||||||||||||||
| Employee severance | $ | 73 | $ | (25) | $ | — | $ | — | |||||||||
| IT costs to retire applications | 2 | 9 | 10 | — | |||||||||||||
| Professional fees and other expenses | 29 | 17 | 15 | — | |||||||||||||
| Estimated restructuring costs | 104 | 1 | 25 | — | |||||||||||||
| Non-capitalized IT costs | 30 | 46 | 45 | 22 | |||||||||||||
| Other costs | 19 | 17 | 14 | 6 | |||||||||||||
| Amortization of capitalized IT development costs [1] | — | — | 4 | 9 | |||||||||||||
| Amortization of capitalized real estate [2] | — | — | 1 | 1 | |||||||||||||
| Estimated costs within core earnings | 49 | 63 | 64 | 38 | |||||||||||||
| Total Hartford Next program costs | 153 | 64 | 89 | 38 | |||||||||||||
| Cumulative savings relative to 2019 beginning July 1, 2020 | (106) | (423) | (540) | (625) | |||||||||||||
| Net expense (savings) before tax | $ | 47 | $ | (359) | $ | (451) | $ | (587) | |||||||||
| Net expense (savings) before tax: | |||||||||||||||||
| To be accounted for within core earnings | $ | (57) | $ | (360) | $ | (476) | $ | (587) | |||||||||
| Restructuring costs recognized outside of core earnings | 104 | 1 | 25 | — | |||||||||||||
| Net expense (savings) before tax | $ | 47 | $ | (359) | $ | (451) | $ | (587) | |||||||||
[1]Does not include approximately $34 of IT asset amortization after 2023.
[2]Does not include approximately $19 of real estate amortization after 2023.
47
Part II - Item 7. Management's Discussion and Analysis of Financial Condition and Results of Operations
2021 FINANCIAL HIGHLIGHTS
| Net Income Available to Common Stockholders | Net Income Available to Common Stockholders per Diluted Share | Book Value per Diluted Share | ||||||||||||
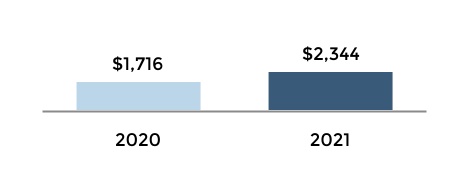
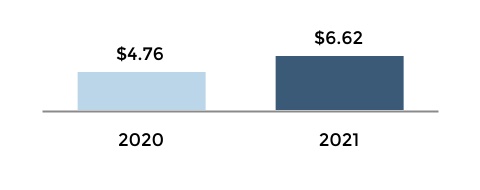
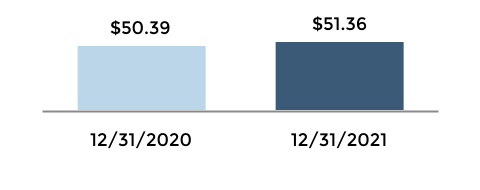
| Ý | Increased $628 or 37% | Ý | Increased $1.86 or 39% | Ý | Increased $0.97 or 1.9% | |||||||||||||||||||||||||||
| + | A change from net realized losses in the 2020 period to gains in the 2021 period | + | Increase in net income available to common stockholders | + | Net income in excess of common stockholder dividends and share repurchases | |||||||||||||||||||||||||||
| + | Increase in net investment income | + | Share repurchases | + | Decrease in dilutive shares from the prior year | |||||||||||||||||||||||||||
| + | Decrease in P&C COVID-19 incurred losses | - | Increase in dilutive shares under stock-based compensation largely due to an increase in the quarterly average stock price | |||||||||||||||||||||||||||||
| + | Higher earned premiums in Commercial Lines and a lower P&C underlying loss ratio before COVID-19 | - | Decrease in common stockholders' equity largely due to decrease in AOCI, driven by a decline in net unrealized gains on available for sale securities | |||||||||||||||||||||||||||||
| + | Lower restructuring costs | |||||||||||||||||||||||||||||||
| + | Increase in earnings from Hartford Funds | |||||||||||||||||||||||||||||||
| - | Higher excess mortality losses in group life and COVID-19 losses in group disability | |||||||||||||||||||||||||||||||
| - | A change from net favorable to net unfavorable P&C prior accident year reserve development | |||||||||||||||||||||||||||||||
| - | Higher current accident year catastrophes | |||||||||||||||||||||||||||||||
| - | An increase in personal automobile claim frequency and severity | |||||||||||||||||||||||||||||||
| - | Lower income from the former Talcott Resolution investment | |||||||||||||||||||||||||||||||
| Investment Yield, After Tax | Property & Casualty Combined Ratio | Group Benefits Net Income Margin | ||||||||||||
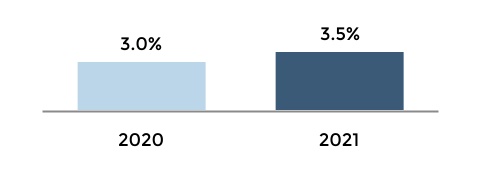
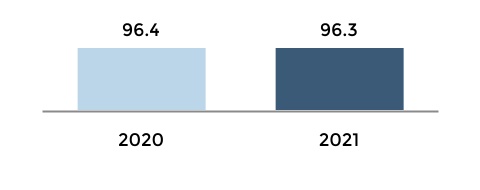
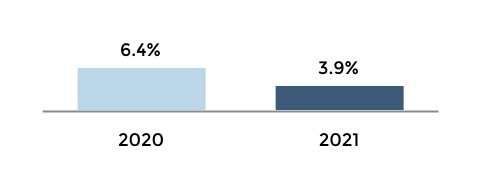
| Ý | Increased 50 bps | Þ | Improved 0.1 points | Þ | Decreased 2.5 points | |||||||||||||||||||||||||||
| + | Greater returns on limited partnerships and other alternative investments | + | Decrease in COVID-19 incurred losses | - | Higher excess mortality in group life | |||||||||||||||||||||||||||
| - | Lower reinvestment rates and lower yield on variable rate securities | + | Lower current accident year loss ratio before COVID-19 in global specialty and workers' compensation | - | A higher group disability loss ratio primarily due to higher short-term and long-term disability claim incidence | |||||||||||||||||||||||||||
| - | A change to unfavorable prior accident year reserve development | - | A higher expense ratio | |||||||||||||||||||||||||||||
| + | Higher net investment income | |||||||||||||||||||||||||||||||
| - | Higher current accident year catastrophes | + | Greater net realized gains | |||||||||||||||||||||||||||||
| - | Higher personal automobile claim frequency and severity | |||||||||||||||||||||||||||||||
| - | An increase in underwriting expenses | |||||||||||||||||||||||||||||||
48
Part II - Item 7. Management's Discussion and Analysis of Financial Condition and Results of Operations
CONSOLIDATED RESULTS OF OPERATIONS
The Consolidated Results of Operations should be read in conjunction with the Company's Consolidated Financial Statements and the related Notes as well as with the segment operating results sections of the MD&A.
Consolidated Results of Operations
| 2021 | 2020 | 2019 | Increase (Decrease) From 2020 to 2021 | Increase (Decrease) From 2019 to 2020 | ||||||||||||||||||||||||||||
| Earned premiums | $ | 17,999 | $ | 17,288 | $ | 16,923 | 4 | % | 2 | % | ||||||||||||||||||||||
| Fee income | 1,488 | 1,277 | 1,301 | 17 | % | (2 | %) | |||||||||||||||||||||||||
| Net investment income | 2,313 | 1,846 | 1,951 | 25 | % | (5 | %) | |||||||||||||||||||||||||
| Net realized gains (losses) | 509 | (14) | 395 | NM | (104 | %) | ||||||||||||||||||||||||||
| Other revenues | 81 | 126 | 170 | (36 | %) | (26 | %) | |||||||||||||||||||||||||
| Total revenues | 22,390 | 20,523 | 20,740 | 9 | % | (1 | %) | |||||||||||||||||||||||||
| Benefits, losses and loss adjustment expenses | 12,729 | 11,805 | 11,472 | 8 | % | 3 | % | |||||||||||||||||||||||||
| Amortization of deferred policy acquisition costs | 1,680 | 1,706 | 1,622 | (2 | %) | 5 | % | |||||||||||||||||||||||||
| Insurance operating costs and other expenses | 4,779 | 4,480 | 4,580 | 7 | % | (2 | %) | |||||||||||||||||||||||||
| Loss on extinguishment of debt | — | — | 90 | — | % | (100 | %) | |||||||||||||||||||||||||
| Loss on reinsurance transactions | — | — | 91 | — | % | (100 | %) | |||||||||||||||||||||||||
| Interest expense | 234 | 236 | 259 | (1 | %) | (9 | %) | |||||||||||||||||||||||||
| Amortization of other intangible assets | 71 | 72 | 66 | (1 | %) | 9 | % | |||||||||||||||||||||||||
| Restructuring and other costs | 1 | 104 | — | (99 | %) | NM | ||||||||||||||||||||||||||
| Total benefits, losses and expenses | 19,494 | 18,403 | 18,180 | 6 | % | 1 | % | |||||||||||||||||||||||||
| Income before income taxes | 2,896 | 2,120 | 2,560 | 37 | % | (17 | %) | |||||||||||||||||||||||||
| Income tax expense | 531 | 383 | 475 | 39 | % | (19 | %) | |||||||||||||||||||||||||
| Net income | 2,365 | 1,737 | 2,085 | 36 | % | (17 | %) | |||||||||||||||||||||||||
| Preferred stock dividends | 21 | 21 | 21 | — | % | — | % | |||||||||||||||||||||||||
| Net income available to common stockholders | $ | 2,344 | $ | 1,716 | $ | 2,064 | 37 | % | (17 | %) | ||||||||||||||||||||||
Year ended December 31, 2021 compared to year ended December 31, 2020
Net income available to common stockholders increased by $628 primarily driven by:
•A $523 before tax change from net realized losses in 2020 to net realized gains in 2021, primarily driven by changes in valuation and sales of equity securities from losses in the 2020 period to gains in the 2021 period;
•An increase in net investment income of $467 before tax driven by higher returns on limited partnerships and other alternative investments;
• A $103 before tax decrease in restructuring costs related to the Hartford Next operational transformation and cost reduction plan;
•An increase in earnings from Hartford Funds; and
•An increase in P&C underwriting results of $36 before tax, with a reduction in COVID-19 incurred losses, a lower Commercial Lines underlying loss and loss adjustment expense ratio before COVID-19 and the effect of earned premium growth largely offset by a change to net unfavorable prior accident year reserve development, higher personal automobile loss costs and higher underwriting expenses.
These increases were partially offset by:
•A $384 before tax increase in excess mortality claims and COVID-19 related impacts to short-term-disability losses; and
•Lower income from the Talcott Resolution investment, which was divested on June 30, 2021.
For a discussion of the Company's operating results by segment, see MD&A - Segment Operating Summaries. In addition, for further discussion of impacts resulting from the COVID-19 pandemic, refer to the Impact of COVID-19 on our financial condition, results of operations and liquidity section of this MD&A.
49
Part II - Item 7. Management's Discussion and Analysis of Financial Condition and Results of Operations
REVENUE
Earned Premiums
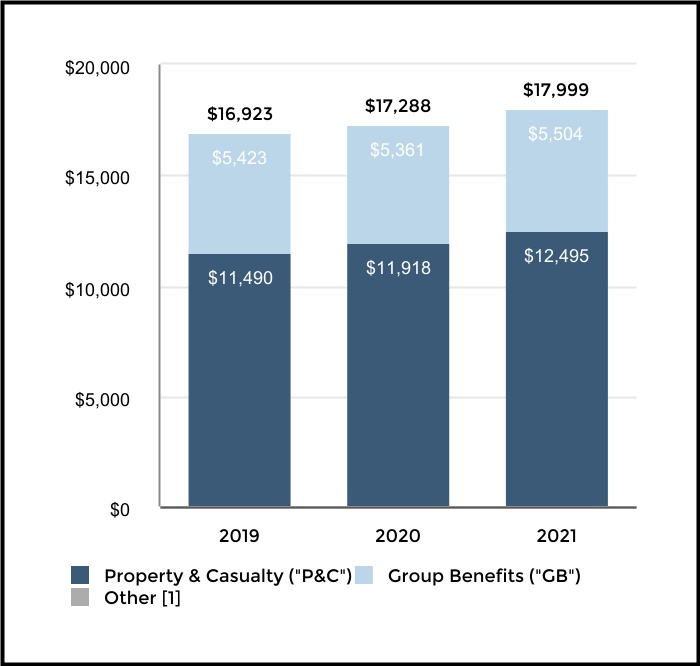
[1]For the years ended 2020 and 2019, the total includes $9, and $10 respectively, recorded in Corporate other revenue.
Earned premiums increased primarily due to:
•An increase in P&C reflecting a 7% increase in Commercial Lines and a 2% decrease in Personal Lines. Contributing to the increase in Commercial Lines was the effect of higher audit and endorsement premiums as the result of higher insured exposures given the economic recovery in 2021. For Personal Lines, the effect of non-renewals outpacing new business was partially offset by the effect of $81 in COVID-related premium credits in the 2020 period; and
•An increase in Group Benefits earned premium of 3% year over year due to an increase in group disability and higher supplemental health product premiums, partially offset by the effect of buyout premium in the 2020 period.
Fee income increased, largely driven by Hartford Funds as a result of higher daily average assets under management due to an increase in equity market levels and net inflows.
Other revenues decreased by $45, primarily driven by lower income of $53 before tax from the Talcott Resolution investment, which was divested on June 30, 2021.
Net investment income increased primarily due to:
•Greater income from limited partnerships and other alternative investments primarily driven by higher valuations and cash distributions within private equity funds and sales of underlying investments within real estate funds;
•A higher level of invested assets;
Net Investment Income
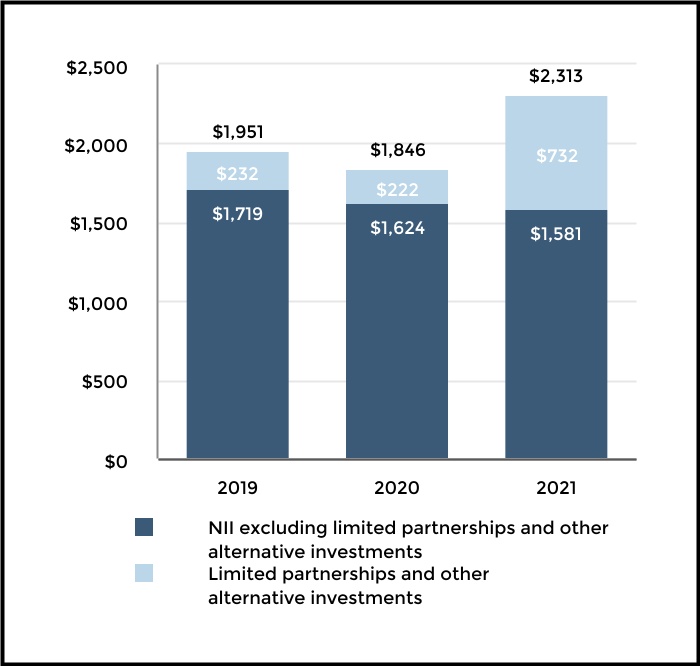
•Greater income from non-routine income items, including yield adjustments on prepayable securities; and
•Higher yield from equity investments.
These increases were partially offset by:
•A lower yield on fixed maturity investments resulting from reinvesting at lower rates and a lower yield on floating rate investments.
Net realized gains (losses) changed from net losses in the 2020 period to net gains in the 2021 period, primarily driven by:
•Gains on equity securities in the 2021 period driven by appreciation in value compared to losses on equity securities in the 2020 period, partially offset by net realized gains in the 2020 period upon termination of derivatives used to hedge against a decline in equity market levels;
•A net reduction in ACL on mortgage loans and fixed maturities in the 2021 period due to an improved economic outlook, compared to increases in the ACL on mortgage loans and fixed maturities in the 2020 period;
•A $46 before tax net realized gain in 2021 resulting from sale of the Company's 9.7% previously owned interest in Talcott Resolution;
•A lower level of losses in 2021 than in 2020 related to the sale of the Continental Europe Operations; and
•Higher net realized gains on sales of fixed maturity securities.
For further discussion of investment results, see MD&A - Investment Results, Net Realized Gains and MD&A - Investment Results, Net Investment Income.
50
Part II - Item 7. Management's Discussion and Analysis of Financial Condition and Results of Operations
BENEFITS, LOSSES AND EXPENSES
P&C Losses and LAE Incurred
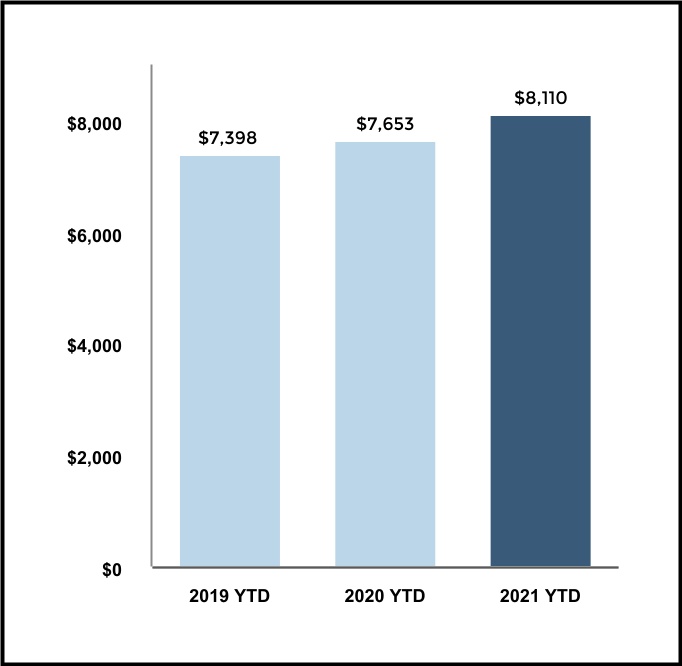
Benefits, losses and loss adjustment expenses increased due to:
•An increase in incurred losses for Property & Casualty of $457 which was driven by:
•An unfavorable change of $335 in P&C net prior accident year reserve development. Prior accident year reserve development in the 2021 period was a net unfavorable $199 before tax, driven by reserve increases for sexual molestation and sexual abuse claims, primarily to reflect claims made against the Boy Scouts of America ("BSA"), partially offset by reserve decreases in workers' compensation, catastrophes, package business, personal automobile, commercial property, and bond. Prior accident year development in the 2021 period also included adverse reserve development ceded to NICO under an adverse development cover ("ADC") of $155 before tax for A&E reserves and $91 before tax for Navigators reserves related to 2018 and prior accident years, both of which the Company recognized a deferred gain under retroactive reinsurance accounting. Prior accident year reserve development in 2020 was a favorable $136 before tax, driven by $529 of reserve reductions related to catastrophes, including decreases in estimated losses arising from wind and hail events in 2017, 2018 and 2019 and from the 2017 and 2018 California wildfires, including a $289 before tax subrogation benefit from PG&E Corporation and Pacific Gas and Electric Company (together, "PG&E"). Reserve development in 2020 also included a $254 before tax reserve increase for sexual molestation and abuse claims, a $208 before tax increase in A&E reserves and a $102 before tax of adverse development for Navigators related to 2018 and prior accident years. While $220 of A&E and $102 of Navigators’ reserve development in 2020 has been economically ceded to
Group Benefits Losses and LAE Incurred
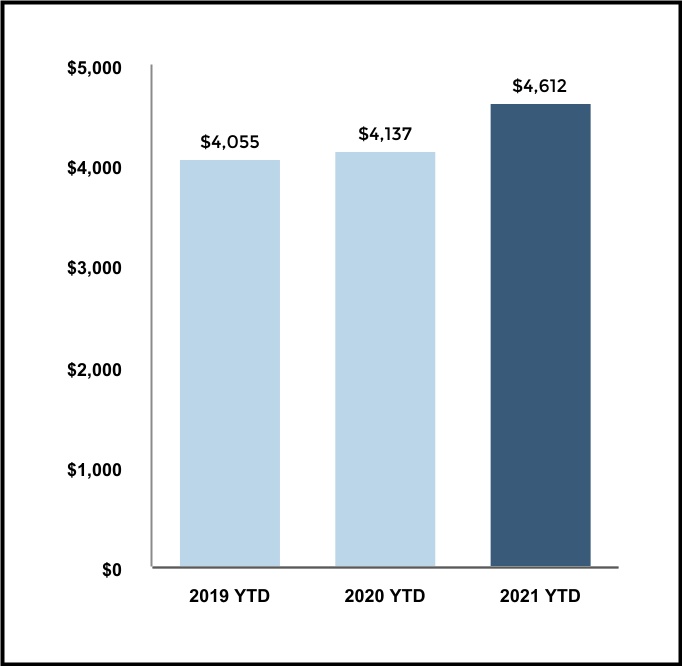
NICO, the Company recognized a $312 deferred gain under retroactive reinsurance accounting with $10 of the $220 ceded A&E losses recognized as a benefit to income in 2020. For further discussion, see Note 12 - Reserve for Unpaid Losses and Loss Adjustment Expenses of Notes to Consolidated Financial Statements;
•An increase in current accident year catastrophe losses of $58, before tax. Catastrophe losses in the 2021 period were principally from hurricane Ida and February winter storms, as well as from tornado, wind and hail events in Texas, the Midwest and Southeast. Catastrophe losses in 2020 were primarily from civil unrest, a number of hurricanes and tropical storms, Pacific Coast wildfires and Northeast windstorms as well as tornado, wind and hail events in the South, Midwest and Central Plains; and
•An increase in P&C current accident year ("CAY") loss and loss adjustment expenses before catastrophes primarily due to the effect of higher earned premiums in commercial lines, higher personal automobile claim frequency and severity, and higher non-catastrophe property losses partially offset by a $247 before tax decrease in COVID-19 incurred losses and lower current accident year loss ratios before COVID-19 in global specialty, workers’ compensation and general liability.
•An increase in Group Benefits of $475 primarily driven by a $344 before tax increase in excess mortality claims in group life, the effect of an increase in earned premiums and higher short-term and long-term disability claim incidence especially compared to the favorable incidence levels experienced during the early stages of the pandemic. The increased claim incidence was partially offset by a higher
51
Part II - Item 7. Management's Discussion and Analysis of Financial Condition and Results of Operations
favorable New York Paid Family Leave adjustment recognized in the 2021 period.
For further discussion of impacts resulting from the COVID-19 pandemic, refer to the impact of COVID-19 on our financial condition, results of operations and liquidity section of this MD&A.
Amortization of deferred policy acquisition costs decreased from the prior year period driven, in part, by a decrease in Personal Lines due to lower earned premiums.
Insurance operating costs and other expenses increased due to:
•Higher variable costs of the Hartford Funds business due to higher daily average assets under management;
•Higher variable incentive compensation costs;
•An increase in supplemental and contingent commissions;
•Increased costs in Group Benefits to handle elevated claim levels resulting from the pandemic, higher technology costs and increased AARP direct marketing costs in Personal Lines; and
•Legal and consulting costs associated with the unsolicited proposals from Chubb Limited (“Chubb”) to acquire the Company.
These increases were partially offset by:
•Lower staffing and other costs driven by the Company’s Hartford Next operational transformation and cost reduction plan; and
•A decrease in the ACL on uncollectible premiums receivable in Property & Casualty and Group Benefits in the 2021 period compared to an increase in the 2020 period due to the economic impacts of COVID-19.
Restructuring and other costs decreased as the prior year period included severance costs related to the Company's Hartford Next operational transformation and cost reduction plan. For further discussion of impacts resulting from the Hartford Next initiative, see MD&A - The Hartford's Operations, The Hartford's Operations, Operational Transformation and Cost Reduction Plan and Note 23 - Restructuring and Other Costs of Notes to Consolidated Financial Statements.
Income tax expense increased primarily due to an increase in income before tax.
For further discussion of income taxes, see Note 17 - Income Taxes of Notes to Consolidated Financial Statements.
INVESTMENT RESULTS
| Composition of Invested Assets | |||||||||||||||||
| December 31, 2021 | December 31, 2020 | ||||||||||||||||
| Amount | Percent | Amount | Percent | ||||||||||||||
| Fixed maturities, available-for-sale ("AFS"), at fair value | $ | 42,847 | 74.2 | % | $ | 45,035 | 79.7 | % | |||||||||
| Equity securities, at fair value | 2,094 | 3.6 | % | 1,438 | 2.5 | % | |||||||||||
| Mortgage loans (net of ACL of $29 and $38) | 5,383 | 9.3 | % | 4,493 | 7.9 | % | |||||||||||
| Limited partnerships and other alternative investments | 3,353 | 5.8 | % | 2,082 | 3.7 | % | |||||||||||
| Other investments [1] | 375 | 0.7 | % | 201 | 0.4 | % | |||||||||||
| Short-term investments | 3,697 | 6.4 | % | 3,283 | 5.8 | % | |||||||||||
| Total investments | $ | 57,749 | 100.0 | % | $ | 56,532 | 100.0 | % | |||||||||
[1] Primarily consists of fixed maturities, at fair value using the fair value option ("FVO"), equity fund investments, overseas deposits, consolidated investment funds and derivative instruments which are carried at fair value.
December 31, 2021 compared to December 31, 2020
Total investments increased primarily due to an increase in limited partnerships and other alternative investments, mortgage loans, and equity securities, partially offset by a decrease in fixed maturities, AFS.
Limited partnerships and other alternative investments increased primarily driven by increased valuations and additional investments in real estate joint ventures.
Mortgage loans increased largely due to funding of industrial, multifamily, and retail commercial whole loans.
Equity securities increased due to net purchases and appreciation in value due to higher equity market levels.
Fixed maturities, AFS decreased primarily due to a decrease in valuations due to higher interest rates, partially offset by tighter credit spreads. The decline was also due to the reinvestment into other asset classes.
52
Part II - Item 7. Management's Discussion and Analysis of Financial Condition and Results of Operations
| Net Investment Income | ||||||||||||||||||||||||||
| For the years ended December 31, | ||||||||||||||||||||||||||
| 2021 | 2020 | 2019 | ||||||||||||||||||||||||
| (Before tax) | Amount | Yield [1] | Amount | Yield [1] | Amount | Yield [1] | ||||||||||||||||||||
| Fixed maturities [2] | $ | 1,349 | 3.1 | % | $ | 1,442 | 3.4 | % | $ | 1,559 | 3.8 | % | ||||||||||||||
| Equity securities | 73 | 4.9 | % | 39 | 3.7 | % | 46 | 3.4 | % | |||||||||||||||||
| Mortgage loans | 181 | 3.7 | % | 172 | 3.9 | % | 165 | 4.4 | % | |||||||||||||||||
| Limited partnerships and other alternative investments | 732 | 31.8 | % | 222 | 12.3 | % | 232 | 14.4 | % | |||||||||||||||||
| Other [3] | 58 | 42 | 32 | |||||||||||||||||||||||
| Investment expense | (80) | (71) | (83) | |||||||||||||||||||||||
| Total net investment income | $ | 2,313 | 4.3 | % | $ | 1,846 | 3.6 | % | $ | 1,951 | 4.1 | % | ||||||||||||||
| Total net investment income excluding limited partnerships and other alternative investments | $ | 1,581 | 3.1 | % | $ | 1,624 | 3.3 | % | $ | 1,719 | 3.7 | % | ||||||||||||||
[1]Yields calculated using annualized net investment income divided by the monthly average invested assets at amortized cost, as applicable, excluding repurchase agreement and securities lending collateral, if any, and derivatives book value.
[2]Includes net investment income on short-term investments.
[3]Primarily includes changes in fair value of certain equity fund investments and income from derivatives that qualify for hedge accounting and are used to hedge fixed maturities.
Year ended December 31, 2021 compared to the year ended December 31, 2020
Total net investment income increased primarily due to:
•Greater income from limited partnerships and other alternative investments primarily driven by higher valuations and cash distributions within private equity funds and sales of underlying investments within real estate funds;
•A higher level of invested assets;
•Greater income from non-routine items, including yield adjustments on prepayable securities; and
•A higher yield from equity investments.
These increases were partially offset by a lower yield on fixed maturities resulting from reinvesting at lower rates and a lower yield on floating rate investments.
Annualized net investment income yield, excluding limited partnerships and other alternative investments, was down primarily due to lower reinvestment rates, partially offset
by greater income from non-routine income items and a higher yield on equity securities.
Average reinvestment rate, on fixed maturities and mortgage loans, excluding certain U.S. Treasury securities, for the year-ended December 31, 2021, was 2.6% which was below the average yield of sales and maturities of 3.0% for the same period. Average reinvestment rate for the year-ended December 31, 2020, was 2.5% which was below the average yield of sales and maturities of 3.4%.
For the 2022 calendar year, we expect the annualized net investment income yield, excluding limited partnerships and other alternative investments, to be lower than the portfolio yield earned in 2021 due to lower reinvestment rates. The estimated impact on annualized net investment income yield is subject to variability due to evolving market conditions, active portfolio management, and the level of non-routine income items, such as make-whole payments, prepayment penalties on mortgage loans and yield adjustments on prepayable securities.
53
Part II - Item 7. Management's Discussion and Analysis of Financial Condition and Results of Operations
| Net Realized Gains (Losses) | |||||||||||
| For the years ended December 31, | |||||||||||
| (Before tax) | 2021 | 2020 | 2019 | ||||||||
Gross gains on sales of fixed maturities | $ | 319 | $ | 255 | $ | 234 | |||||
Gross losses on sales of fixed maturities | (89) | (50) | (56) | ||||||||
| Equity securities [1] | 227 | (214) | 254 | ||||||||
| Net credit losses on fixed maturities, AFS [2] | 4 | (28) | |||||||||
| Change in ACL on mortgage loans [3] | 9 | (19) | |||||||||
| Intent-to-sell impairments [2] | — | (5) | — | ||||||||
| Net other-than-temporary impairment ("OTTI") losses recognized in earnings | (3) | ||||||||||
| Valuation allowances on mortgage loans | 1 | ||||||||||
| Other, net [4] | 39 | 47 | (35) | ||||||||
| Net realized gains (losses) | $ | 509 | $ | (14) | $ | 395 | |||||
[1]The net unrealized gains on equity securities still held as of the end of the period and included in net realized gains (losses) were $155, $53, and $164 for the years ended December 31, 2021, 2020, and 2019, respectively.
[2]Due to the adoption of accounting guidance for credit losses on January 1, 2020, realized losses previously reported as OTTI are now presented as credit losses which are net of any recoveries. For further information refer to Note 1 - Basis of Presentation and Significant Accounting Policies. In addition, see Credit Losses on Fixed Maturities, AFS and Intent-to-Sell Impairments within the Investment Portfolio Risks and Risk Management section of the MD&A.
[3]Represents the change in ACL recorded during the period following the adoption of accounting guidance for credit losses on January 1, 2020. For further information refer to Note 1 - Basis of Presentation and Significant Accounting Policies. In addition, see ACL on Mortgage Loans within the Investment Portfolio Risks and Risk Management section of the MD&A.
[4]Includes gains (losses) on non-qualifying derivatives for 2021, 2020, and 2019 of $12, $104, and $(24), respectively, gains (losses) from transactional foreign currency revaluation of $(1), $(1) and (9), respectively, and a loss of $21 and $48, respectively, on the sale of Continental Europe Operations for the years ended December 31, 2021 and 2020. For the year-ended December 31, 2021, there was also a gain of $46 on the sale of the Company's previously owned interest in Talcott Resolution.
Year ended December 31, 2021
Gross gains and losses on sales were primarily due to net sales of corporate securities and tax-exempt municipals, in addition to sales of U.S. treasuries for duration and risk management.
Equity securities net gains were primarily driven by appreciation in value due to higher equity market levels and gains realized on exit of private equity direct investments.
Other, net gains and losses included a gain of $46 on the sale of the Company's 9.7% retained interest in Talcott Resolution, sold on June 30, 2021, and a loss of $21 related to the sale of the Company's Continental Europe Operations, which was completed on December 29, 2021. Also included were gains of $7 on credit derivatives driven by a decrease in credit spreads.
Year ended December 31, 2020
Gross gains and losses on sales were primarily driven by issuer-specific sales of corporate securities and tax-exempt municipal bonds, rebalancing within the foreign government sector, and sales of U.S. treasury securities for duration and/or liquidity management.
Equity securities net losses were driven by mark-to-market losses due to the decline in equity market levels in the first quarter and losses incurred on sales across multiple issuers as the Company reduced its exposure to equity securities, partially offset by mark-to-market gains on certain preferred equities.
Other, net gains are primarily due to $75 of realized gains on terminated derivatives used to hedge against a decline in equity market levels and $21 of gains on interest rate derivatives due to a decline in interest rates. These gains were partially offset by
a loss of $48, before tax, on the sale of the Company’s Continental Europe Operations which the Company agreed to sell in September of 2020.
CRITICAL ACCOUNTING ESTIMATES
The preparation of financial statements in conformity with U.S. GAAP requires management to make estimates and assumptions that affect the reported amounts of assets and liabilities and disclosure of contingent assets and liabilities at the date of the financial statements and the reported amounts of revenues and expenses during the reporting period. Actual results could differ, and in the past have differed, from those estimates.
The Company has identified the following estimates as critical in that they involve a higher degree of judgment and are subject to a significant degree of variability:
•property and casualty insurance product reserves, net of reinsurance;
•group benefit LTD reserves, net of reinsurance;
•evaluation of goodwill for impairment;
•valuation of investments and derivative instruments including evaluation of credit losses on fixed maturities, AFS and ACL on mortgage loans; and
•contingencies relating to corporate litigation and regulatory matters.
54
Part II - Item 7. Management's Discussion and Analysis of Financial Condition and Results of Operations
In developing these estimates management makes subjective and complex judgments that are inherently uncertain and subject to material change as facts and circumstances develop. Although variability is inherent in these estimates, management believes the amounts provided are appropriate based upon the
facts available upon compilation of the financial statements. Certain of these estimates are particularly sensitive to market conditions, and deterioration and/or volatility in the worldwide debt or equity markets could have a material impact on the Consolidated Financial Statements.
|PROPERTY & CASUALTY INSURANCE PRODUCT RESERVES, NET OF REINSURANCE
P&C Loss and Loss Adjustment Expense Reserves, Net of Reinsurance, by Segment as of December 31, 2021
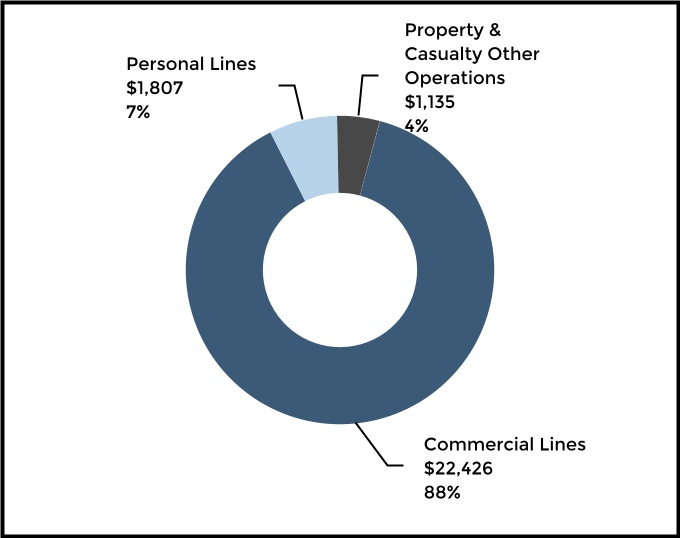
Loss and LAE Reserves, Net of Reinsurance as of December 31, 2021
| Commercial Lines | Personal Lines | Property & Casualty Other Operations | Total Property & Casualty Insurance | % Total Reserves-net | ||||||||||||||||
| Workers’ compensation | $ | 11,259 | $ | — | $ | — | $ | 11,259 | 44.4% | |||||||||||
| General liability | 4,960 | — | — | 4,960 | 19.5% | |||||||||||||||
| Marine | 303 | — | — | 303 | 1.2% | |||||||||||||||
| Package business [1] | 1,924 | — | — | 1,924 | 7.6% | |||||||||||||||
| Commercial property | 530 | — | — | 530 | 2.1% | |||||||||||||||
| Automobile liability | 1,175 | 1,390 | — | 2,565 | 10.1% | |||||||||||||||
| Automobile physical damage | 14 | 40 | — | 54 | 0.2% | |||||||||||||||
| Professional liability | 1,261 | — | — | 1,261 | 5.0% | |||||||||||||||
| Bond | 434 | — | — | 434 | 1.7% | |||||||||||||||
| Homeowners | — | 364 | — | 364 | 1.4% | |||||||||||||||
| Asbestos and environmental | 110 | 10 | 604 | 724 | 2.9% | |||||||||||||||
| Assumed reinsurance | 285 | — | 96 | 381 | 1.5% | |||||||||||||||
| All other | 171 | 3 | 435 | 609 | 2.4% | |||||||||||||||
| Total reserves-net | 22,426 | 1,807 | 1,135 | 25,368 | 100.0% | |||||||||||||||
| Reinsurance and other recoverables | 4,480 | 37 | 1,564 | 6,081 | ||||||||||||||||
| Total reserves-gross | $ | 26,906 | $ | 1,844 | $ | 2,699 | $ | 31,449 | ||||||||||||
[1]Commercial Lines policy packages that include property and general liability coverages are generally referred to as the package line of business.
55
Part II - Item 7. Management's Discussion and Analysis of Financial Condition and Results of Operations
For descriptions of the coverages provided under the lines of business shown above, see Part I - Item1, Business.
Overview of Reserving for Property and Casualty Insurance Claims
It typically takes many months or years to pay claims incurred under a property and casualty insurance product; accordingly, the Company must establish reserves at the time the loss is incurred. Most of the Company’s policies provide for occurrence-based coverage where the loss is incurred when a claim event happens like an automobile accident, house or building fire or injury to an employee under a workers’ compensation policy. Some of the Company's policies, mostly for directors and officers insurance and errors and omissions insurance, are claims-made policies where the loss is incurred in the period the claim event is reported to the Company even if the loss event itself occurred in an earlier period.
Loss and loss adjustment expense reserves provide for the estimated ultimate costs of paying claims under insurance policies written by the Company, less amounts paid to date. These reserves include estimates for both claims that have been reported and those that have not yet been reported, and include estimates of all expenses associated with processing and settling these claims. Case reserves are established by a claims handler on each individual claim and are adjusted as new information becomes known during the course of handling the claim. Incurred but not reported (“IBNR”) reserves represent the difference between the estimated ultimate cost of all claims and the actual loss and loss adjustment expenses reported to the Company by claimants (“reported losses”). Reported losses represent cumulative loss and loss adjustment expenses paid plus case reserves for outstanding reported claims. For most lines, Company actuaries evaluate the total reserves (IBNR and case reserves) on an accident year basis. An accident year is the calendar year in which a loss is incurred, or, in the case of claims-made policies, the calendar year in which a loss is reported. For certain lines acquired from the Navigators Group book of business, total reserves are evaluated on a policy year basis and then converted to accident year. A policy year is the calendar year in which a policy incepts.
Factors that Change Reserve Estimates- Reserve estimates can change over time because of unexpected changes in the external environment. Inflation in claim costs, such as with medical care, hospital care, automobile parts, wages and home and building repair, would cause claims to settle for more than they are initially reserved. Changes in the economy can cause an increase or decrease in the number of reported claims (claim frequency). For example, an improving economy could result in more automobile miles driven and a higher number of automobile reported claims, or a change in economic conditions can lead to more or less workers’ compensation reported claims. An increase in the number or percentage of claims litigated can increase the average settlement amount per claim (claim severity). Changes in the judicial environment can affect interpretations of damages and how policy coverage applies which could increase or decrease claim severity. Over time, judges or juries in certain jurisdictions may be more inclined to determine liability and award damages. New legislation can also change how damages are defined or change the statutes of limitations for the filing of civil suits, resulting in greater claim frequency or severity. In addition, new
types of injuries may arise from exposures not contemplated when the policies were written. Past examples include pharmaceutical products, silica, lead paint, sexual molestation and sexual abuse and construction defects.
Reserve estimates can also change over time because of changes in internal Company operations. A delay or acceleration in handling claims may signal a need to increase or reduce reserves from what was initially estimated. New lines of business may have loss development patterns that are not well established. Changes in the geographic mix of business, changes in the mix of business by industry and changes in the mix of business by policy limit or deductible can increase the risk that losses will ultimately develop differently than the loss development patterns assumed in our reserving. In addition, changes in the quality of risk selection in underwriting and changes in interpretations of policy language could increase or decrease ultimate losses from what was assumed in establishing the reserves.
In the case of assumed reinsurance, all of the above risks apply. The Company assumes property and casualty risks from other insurance companies as part of its Global Re business acquired from Navigators Group and from certain pools and associations. Global Re, which is a part of the global specialty business, mostly assumes property, casualty and specialty risks. Changes in the case reserving and reporting patterns of insurance companies ceding to The Hartford can create additional uncertainty in estimating the reserves. Due to the inherent complexity of the assumptions used, final claim settlements may vary significantly from the present estimates of direct and assumed reserves, particularly when those settlements may not occur until well into the future.
Reinsurance Recoverables- Through both facultative and treaty reinsurance agreements, the Company cedes a share of the risks it has underwritten to other insurance companies. The Company records reinsurance recoverables for losses and loss adjustment expenses ceded to its reinsurers representing the anticipated recovery from reinsurers of unpaid claims, including IBNR.
The Company estimates the portion of losses and loss adjustment expenses to be ceded based on the terms of any applicable facultative and treaty reinsurance, including an estimate of IBNR for losses that will ultimately be ceded.
The Company provides an allowance for uncollectible reinsurance, reflecting management’s best estimate of reinsurance cessions that may be uncollectible in the future due to reinsurers’ unwillingness or inability to pay. The allowance for uncollectible reinsurance comprises an ACL and an allowance for disputed balances. The ACL primarily considers the credit quality of the Company's reinsurers while the allowance for disputes considers recent outcomes in arbitration and litigation in disputes between reinsurers and cedants and recent commutation activity between reinsurers and cedants that may signal how the Company’s own reinsurance claims may settle. Where its reinsurance contracts permit, the Company secures funding of future claim obligations with various forms of collateral, including irrevocable letters of credit, secured trusts, funds held accounts and group-wide offsets. The allowance for uncollectible reinsurance was $96 as of December 31, 2021, comprised of $42 related to Commercial Lines, $1 related to
56
Part II - Item 7. Management's Discussion and Analysis of Financial Condition and Results of Operations
Personal Lines and $53 related to Property & Casualty Other Operations.
The Company’s estimate of reinsurance recoverables, net of an allowance for uncollectible reinsurance, is subject to similar risks and uncertainties as the estimate of the gross reserve for unpaid losses and loss adjustment expenses for direct and assumed exposures.
Review of Reserve Adequacy- The Hartford regularly reviews the appropriateness of reserve levels at the line of business or more detailed level, taking into consideration the variety of trends that impact the ultimate settlement of claims. For Property & Casualty Other Operations, asbestos and environmental (“Run-off A&E”) reserves are reviewed by type of event rather than by line of business.
Reserve adjustments, which may be material, are reflected in the operating results of the period in which the adjustment is determined to be necessary. In the judgment of management, information currently available has been properly considered in establishing the reserves for unpaid losses and loss adjustment expenses and in recording the reinsurance recoverables for ceded unpaid losses.
Reserving Methodology
The following is a discussion of the reserving methods used for the Company's property and casualty lines of business other than asbestos and environmental.
Reserves are set by line of business within the operating segments. A single line of business may be written in more than one segment. Lines of business for which reported losses emerge over a long period of time are referred to as long-tail lines of business. Lines of business for which reported losses emerge more quickly are referred to as short-tail lines of business. The Company’s shortest-tail lines of business are homeowners, commercial property, marine and automobile physical damage. The longest tail lines of business include workers’ compensation, general liability, professional liability and assumed reinsurance. For short-tail lines of business, emergence of paid losses and case reserves is credible and likely indicative of ultimate losses. For long-tail lines of business, emergence of paid losses and case reserves is less credible in the early periods after a given accident year and, accordingly, may not be indicative of ultimate losses.
Use of Actuarial Methods and Judgments- The Company’s reserving actuaries regularly review reserves for both current and prior accident years using the most current claim data. A variety of actuarial methods and judgments are used for most lines of business to arrive at selections of estimated ultimate losses and loss adjustment expenses. New methods may be added for specific lines over time to inform these selections where appropriate. The reserve selections incorporate input, as appropriate, from claims personnel, pricing actuaries and operating management about reported loss cost trends and other factors that could affect the reserve estimates. Most reserves are reviewed fully each quarter, including loss and loss adjustment expense reserves for homeowners, commercial property, marine property, automobile physical damage, automobile liability, package property business, and workers’ compensation. Other reserves, including most general liability and professional liability lines, are reviewed semi-annually. Certain additional reserves are also reviewed semi-
annually or annually, including reserves for losses incurred in accident years older than twelve years for Personal Lines and older than twenty years for Commercial Lines, as well as reserves for bond, assumed reinsurance, latent exposures such as construction defects, and unallocated loss adjustment expenses. For reserves that are reviewed semi-annually or annually, management monitors the emergence of paid and reported losses in the intervening quarters and, if necessary, performs a reserve review to determine whether the reserve estimate should change.
An expected loss ratio is used in initially recording the reserves for both short-tail and long-tail lines of business. This expected loss ratio is determined by starting with the average loss ratio of recent prior accident years and adjusting that ratio for the effect of expected changes to earned pricing, loss frequency and severity, mix of business, ceded reinsurance and other factors. For short-tail lines, IBNR for the current accident year is initially recorded as the product of the expected loss ratio for the period, earned premium for the period and the proportion of losses expected to be reported in future calendar periods for the current accident period. For long-tailed lines, IBNR reserves for the current accident year are initially recorded as the product of the expected loss ratio for the period and the earned premium for the period, less reported losses for the period.
As losses emerge or develop in periods subsequent to a given accident year, reserving actuaries use other methods to estimate ultimate unpaid losses in addition to the expected loss ratio method. These primarily include paid and reported loss development methods, frequency/severity techniques and the Bornhuetter-Ferguson method (a combination of the expected loss ratio and paid development or reported development method). Within any one line of business, the methods that are given more influence vary based primarily on the maturity of the accident year, the mix of business and the particular internal and external influences impacting the claims experience or the methods. The output of the reserve reviews are reserve estimates representing a range of actuarial indications.
Reserve Discounting- Most of the Company’s property and casualty insurance product reserves are not discounted. However, the Company has discounted liabilities funded through structured settlements and has discounted a portion of workers’ compensation reserves that have a fixed and determinable payment stream. For further discussion of these discounted liabilities, see Note 1 - Basis of Presentation and Significant Accounting Policies of Notes to Consolidated Financial Statements.
Differences Between GAAP and Statutory Basis Reserves- As of December 31, 2021 and 2020, U.S. property and casualty insurance product reserves for losses and loss adjustment expenses, net of reinsurance recoverables, reported under U.S. GAAP were lower than net reserves reported on a statutory basis, primarily due to reinsurance recoverables on two ceded retroactive reinsurance agreements that are recorded as a reduction of other liabilities under statutory accounting. One of the retroactive reinsurance agreements covers substantially all adverse development on asbestos and environmental reserves subsequent to 2016, up to a $1.5 billion limit, and the other covered adverse development on Navigators Insurers' existing net loss and allocated loss adjustment reserves as of December 31, 2018, up to a $300 limit. Under both agreements,
57
Part II - Item 7. Management's Discussion and Analysis of Financial Condition and Results of Operations
the Company cedes to NICO, a subsidiary of Berkshire Hathaway Inc. ("Berkshire").
Reserving Methods by Line of Business- Apart from Run-off A&E which is discussed in the following section on Property & Casualty Other Operations, below is a general discussion of which reserving methods are preferred by line of business. Because the actuarial estimates are generated at a
much finer level of detail than line of business (e.g., by distribution channel, coverage, accident period), other methods than those described for the line of business may also be employed for a coverage and accident year within a line of business. Also, as circumstances change, the methods that are given more influence will change.
Preferred Reserving Methods by Line of Business
| Commercial property, homeowners and automobile physical damage | These short-tailed lines are fast-developing and paid and reported development techniques are used as these methods use historical data to develop paid and reported loss development patterns, which are then applied to cumulative paid and reported losses by accident period to estimate ultimate losses. In addition to paid and reported development methods, for the most immature accident months, the Company uses frequency and severity techniques and the initial expected loss ratio. The advantage of frequency/severity techniques is that frequency estimates are generally easier to predict and external information can be used to supplement internal data in estimating average severity. | ||||
| Personal automobile liability | For personal automobile liability, and bodily injury in particular, in addition to traditional paid and reported development methods, the Company relies on frequency/severity techniques and Berquist-Sherman techniques. Because the paid development technique is affected by changes in claim closure patterns and the reported development method is affected by changes in case reserving practices, the Company reviews and often relies on Berquist-Sherman techniques which adjust these patterns to reflect current settlement rates and case reserving practices. The Company generally uses the reported development method for older accident years and a combination of reported development, frequency/severity and Berquist-Sherman methods for more recent accident years. For older accident periods, reported losses are a good indicator of ultimate losses given the high percentage of ultimate losses reported to date. For more recent periods, the frequency/severity techniques are not affected as much by changes in case reserve practices and changing disposal rates and the Berquist-Sherman techniques specifically adjust for these changes. | ||||
| Commercial automobile liability | The Company performs a variety of techniques, including the paid and reported development methods and frequency/severity techniques. For older, more mature accident years, the Company primarily uses reported development techniques. For more recent accident years, the Company relies on several methods that incorporate expected loss ratios, reported loss development, paid loss development, frequency/severity, case reserve adequacy, and claim settlement rates. | ||||
| Professional liability | Reported and paid loss development patterns for this line tend to be volatile. Therefore, the Company typically supplements the expected loss ratio method and paid and reported development methods with others such as individual claim reviews and frequency and severity techniques. | ||||
| General liability, bond and large deductible workers’ compensation | For these long-tailed lines of business, the Company generally relies on the expected loss ratio and reported development techniques. The Company generally weights these techniques together, relying more heavily on the expected loss ratio method at early ages of development and shifting more weight onto the reported development method as an accident year matures. For certain general liability lines the Company uses a Berquist-Sherman technique to adjust for changes in claim reserving patterns. The Company also uses various frequency/severity methods aimed at capturing large loss development and in some bond lines individual claim reviews are used. | ||||
| Workers’ compensation | Workers’ compensation is the Company’s single largest reserve line of business and a wide range of methods are used. Due to the long-tailed nature of workers' compensation, the selection of methods is driven by expected loss ratio methods ("ELR") at early evaluations with emphasis shifting first to Bornhuetter-Ferguson methods, then to paid and reported development methods (with more reliance placed on paid methods), and finally to methods that are responsive to the inventory of open claims. Across these techniques, there are adjustments related to changes in emergence patterns across years, projections of future cost inflation, outlier claims, and analysis of larger states. | ||||
| Marine | For marine liability, the Company generally relies on the expected loss ratio, Berquist-Sherman, and reported development techniques. The Company generally weights these techniques together, relying more heavily on the expected loss ratio method at early ages of development and then shifts towards Berquist-Sherman and then more towards the reported development method as an accident year matures. For marine property segments, the Company relies on a Berquist-Sherman method for early development ages then shifts to reported development techniques. | ||||
| Assumed reinsurance and all other | Standard methods, such as expected loss ratio, Berquist-Sherman and reported development techniques are applied. These methods and analyses are informed by underlying treaty by treaty analyses supporting the expected loss ratios, and cedant data will often inform the loss development patterns. In some instances, reserve indications may also be influenced by information gained from claims and underwriting audits. Policy quarter and policy year loss reserve estimates are then converted to an accident year basis. | ||||
| Allocated loss adjustment expenses ("ALAE") | For some lines of business (e.g., professional liability, assumed reinsurance, and the acquired Navigators Group book of business), ALAE and losses are analyzed together. For most lines of business, however, ALAE is analyzed separately, using paid development techniques and a ratio of paid ALAE to paid loss is applied to loss reserves to estimate unpaid ALAE. | ||||
| Unallocated loss adjustment expenses ("ULAE") | ULAE is analyzed separately from loss and ALAE. For most lines of business, future ULAE costs to be paid are projected based on an expected claim handling cost per claim year, the anticipated claim closure pattern and the ratio of paid ULAE to paid loss is applied to estimated unpaid losses. For some lines, a simplified paid-to-paid approach is used. | ||||
58
Part II - Item 7. Management's Discussion and Analysis of Financial Condition and Results of Operations
The recorded reserve for losses and loss adjustment expenses represents the Company's best estimate of the ultimate settlement amount of unpaid losses and loss adjustment expenses. In applying judgment, the best estimate is selected after considering the estimates derived from a number of actuarial methods, giving more weight to those methods deemed more predictive of ultimate unpaid losses and loss adjustment expenses. The Company does not produce a statistical range or confidence interval of reserve estimates and, since reserving methods with more credibility are given greater weight, the selected best estimate may differ from the mid-point of the various estimates produced by the actuarial methods used.
Assumptions used in arriving at the selected actuarial indications consider a number of factors, including the immaturity of emerged claims in recent accident years, emerging trends in the recent past, and the level of volatility within each line of business.
Adjustments to reserves of prior accident years are referred to as “prior accident year development”. Increases in previous estimates of ultimate loss costs are referred to as either an increase in prior accident year reserves or as unfavorable reserve development. Decreases in previous estimates of ultimate loss costs are referred to as either a decrease in prior accident year reserves or as favorable reserve development. Reserve development can influence the comparability of year over year underwriting results.
For a discussion of changes to reserve estimates recorded in 2021, see Note 12 - Reserve for Unpaid Losses and Loss Adjustment Expenses in the Notes to Consolidated Financial Statements.
Current Trends Contributing to Reserve Uncertainty
The Hartford is a multi-line company in the property and casualty insurance business. The Hartford is, therefore, subject to reserve uncertainty stemming from changes in loss trends and other conditions which could become material at any point in time. As market conditions and loss trends develop, management must assess whether those conditions constitute a long-term trend that should result in a reserving action (i.e., increasing or decreasing the reserve).
General liability- Within Commercial Lines and Property & Casualty Other Operations, the Company has exposure to general liability claims, including from bodily injury, property damage and product liability. Reserves for these exposures can be particularly difficult to estimate due to the long development pattern and uncertainty about how cases will settle. In particular, the Company has exposure to bodily injury claims that is the result of long-term or continuous exposure to harmful products or substances. Examples include, but are not limited to, pharmaceutical products, silica, talcum powder, per-and polyfluoroalkyl substances ("PFAS"), head injuries and lead paint. The Company also has exposure to claims from construction defects, where property damage or bodily injury from negligent construction is alleged. In addition, the Company has exposure to claims asserted against religious institutions, and other organizations, including the Boy Scouts of America, relating to sexual molestation and sexual abuse. For additional information related to the Company's settlement agreement with
the Boy Scouts of America, see Note 12 - Reserve for Unpaid Losses and Loss Adjustment Expenses in the Notes to Consolidated Financial Statements. State “reviver” statutes, extending statutes of limitations for certain sexual molestation and sexual abuse claims, could result in additional litigation or could result in unexpected sexual molestation and sexual abuse losses. Such exposures may involve potentially long latency periods and may implicate coverage in multiple policy periods, which can raise complex coverage issues with significant effects on the ultimate scope of coverage. Such exposures may also be impacted by insured bankruptcies. These factors make reserves for such claims more uncertain than other bodily injury or property damage claims. With regard to these exposures, the Company monitors trends in litigation, the external environment including legislation, the similarities to other mass torts and the potential impact on the Company’s reserves. Additionally, uncertainty in estimated claim severity causes reserve variability, particularly with respect to changes in internal claim handling and case reserving practices.
Workers’ compensation- Included in both small commercial and in middle & large commercial, workers’ compensation is the Company’s single biggest line of business and the property and casualty line of business with the longest pattern of loss emergence. To the extent that patterns in the frequency of settlement payments deviate from historical patterns, loss reserve estimates would be less reliable. Medical costs make up approximately 50% of workers’ compensation payments. As such, reserve estimates for workers’ compensation are particularly sensitive to changes in medical inflation, the changing use of medical care procedures and changes in state legislative and regulatory environments. In addition, a deteriorating economic environment can reduce the ability of an injured worker to return to work and lengthen the time a worker receives disability benefits. In National Accounts, reserves for large deductible workers’ compensation insurance require estimating losses attributable to the deductible amount that will be paid by the insured; if such losses are not paid by the insured due to financial difficulties, the Company is contractually liable.
Commercial Lines automobile- Uncertainty in estimated claim severity causes reserve variability for commercial automobile losses including reserve variability due to changes in internal claim handling and case reserving practices as well as due to changes in the external environment.
Directors' and officers' insurance- Uncertainty regarding the number and severity of security class action suits can result in reserve volatility for directors' and officers' insurance claims. Additionally, the Company’s exposure to losses under directors’ and officers’ insurance policies, both domestically and internationally, is primarily in excess layers, making estimates of loss more complex.
Personal Lines automobile- While claims emerge over relatively shorter periods, estimates can still vary due to a number of factors, including uncertain estimates of frequency and severity trends. Severity trends are affected by changes in internal claim handling and case reserving practices as well as by changes in the external environment, such as due to inflation in labor and materials because of supply chain disruptions affecting repair costs. Changes in claim practices increase the uncertainty in the interpretation of case reserve data, which
59
Part II - Item 7. Management's Discussion and Analysis of Financial Condition and Results of Operations
increases the uncertainty in recorded reserve levels. Severity trends have increased in recent accident years, in part driven by more expensive parts associated with new automobile technology, causing additional uncertainty about the reliability of past patterns. In addition, the introduction of new products and class plans has led to a different mix of business by type of insured than the Company experienced in the past. Such changes in mix increase the uncertainty of the reserve projections, since historical data and reporting patterns may not be applicable to the new business.
Assumed reinsurance- While the pricing and reserving processes can be challenging and idiosyncratic for insurance companies, the inherent uncertainties of setting prices and estimating such reserves are even greater for the reinsurer. This is primarily due to the longer time between the date of an occurrence and the reporting of claims to the reinsurer, the diversity of development patterns among different types of reinsurance treaties or contracts, the necessary reliance on the ceding companies for information regarding reported claims and differing pricing and reserving practices among ceding companies. In addition, trends that have affected development of liabilities in the past may not necessarily occur or impact liability development in the same manner or to the same degree in the future. As a result, actual losses and LAE may deviate, perhaps substantially, from the expected estimates.
International business- In addition to several of the line-specific trends listed above, the International business acquired through the Navigators Group book of business may have additional uncertainty due to geopolitical, foreign currency, and trade dispute risks.
COVID-19 impacts- As further explained under the "Impact of COVID-19 on our financial condition, results of operations and liquidity" section of this MD&A, the Company incurred $31 of COVID-19 claims in 2021 within P&C, including in workers' compensation and financial lines. Under workers’ compensation, we have experienced a continuation of COVID-19 incurred losses, particularly due to laws or directives in certain states that require coverage of COVID-19 claims for health care and other essential workers based on a presumption that they contracted the virus while working. Under financial lines, we have experienced COVID-19 related claims under employment practices liability insurance policies. These claims tend to be low severity and we are monitoring emerging trends related to return to work and vaccine mandates. We continue to monitor exposure under director's and officer's insurance policies.
In addition to the direct impacts of COVID-19 mentioned above, we are monitoring for indirect impacts as well. This past year we have seen inflationary pressure on building material and labor costs due to supply chain disruption because of the pandemic. This has the potential to impact homeowners and commercial property severity and lengthen reporting patterns due to claim settlement delays. Supply chain disruption as a result of the pandemic has also had an impact on the automobile industry impacting physical damage severities.
Reserve estimates for COVID-19 claims are difficult to estimate. In establishing reserves for COVID-19 incurred claims through December 31, 2021, we have provided IBNR at a higher percentage of ultimate estimated incurred losses than usual as we expect longer claim reporting patterns given the effects of COVID-19. For example, we expect longer delays than usual between the time a worker is treated and the date the claim is
eventually submitted for workers' compensation coverage. Reserve estimates for directors’ and officers’ (“D&O”), errors and omissions ("E&O") and employment practices liability are subject to significant uncertainty given that estimates must be made of the expected ultimate severity of claims that have recently been reported. Changes in the legal environment and litigation process, including but not limited to court delays and closings, may also have potential impacts on development patterns for liability lines.
Catastrophes- Within Commercial Lines and Personal Lines, the Company is exposed to incurred losses from catastrophe events, primarily for damage to property. Reserves for hurricanes, tropical storms, tornado/hail, wildfires, earthquakes and other catastrophe events are subject to significant uncertainty about the number and average severity of claims arising from those events, particularly in cases where the event occurs near the end of a financial reporting period when there is limited information about the extent of damages. For example, after a catastrophe event, it may take a period of time before we are able to access the impacted areas limiting the ability of our claims adjusting staff to inspect losses, make estimates and determine the damages that are covered by the policy. To estimate catastrophe losses, we consider information from claim notices received to date, third party data, visual images of the affected area where we have exposures and our own historical experience of loss reporting patterns for similar events.
Impact of Key Assumptions on Reserves
As stated above, the Company’s practice is to estimate reserves using a variety of methods, assumptions and data elements within its reserve estimation. The Company does not use statistical loss distributions or confidence levels in the process of determining its reserve estimate and, as a result, does not disclose reserve ranges.
Across most lines of business, the most important reserve assumptions are future loss development factors applied to paid or reported losses to date. The trend in loss cost frequency and severity is also a key assumption, particularly in the most recent accident years, where loss development factors are less credible.
The following discussion discloses possible variation from current estimates of loss reserves due to a change in certain key indicators of potential losses. For automobile liability lines in both Personal Lines and Commercial Lines, the key indicator is the annual loss cost trend, particularly the severity trend component of loss costs. For workers’ compensation and general liability, loss development patterns are a key indicator, particularly for more mature accident years. For workers’ compensation, paid loss development patterns have been impacted by medical cost inflation and other changes in loss cost trends. For general liability, incurred loss development patterns have been impacted by, among other things, emergence of new types of claims (e.g., PFAS claims) and a shift in the mixture between smaller, more routine claims and larger, more complex claims.
Each of the impacts described below is estimated individually, without consideration for any correlation among key indicators or among lines of business. Therefore, it would be inappropriate to take each of the amounts described below and add them
60
Part II - Item 7. Management's Discussion and Analysis of Financial Condition and Results of Operations
together in an attempt to estimate volatility for the Company’s reserves in total. For any one reserving line of business, the estimated variation in reserves due to changes in key indicators is a reasonable estimate of potential reserve development that may occur in the future, likely over a period of several calendar years. The variation discussed is not meant to be a worst-case scenario, and, therefore, it is possible that future variation may be more than the amounts discussed below. Moreover, the variation discussed does not represent a complete statistical range of potential reserve outcomes, and factors exist beyond the key indicators considered which have the potential to drive additional variation to the Company's reserves.
| Possible Change in Key Indicator | Reserves, Net of Reinsurance December 31, 2021 | Estimated Range of Potential Reserve Development | |||||||||
Personal Automobile Liability | +/- 2.5 points to the annual assumed change in loss cost severity for the two most recent accident years | $1.4 billion | +/- $65 | ||||||||
| Commercial Automobile Liability | +/- 2.5 points to the annual assumed change in loss cost severity for the two most recent accident years | $1.2 billion | +/- $30 | ||||||||
| Workers' Compensation | 2% change in paid loss development patterns | $11.3 billion | +/- $400 | ||||||||
| General Liability | 8% change in reported loss development patterns | $5.0 billion | +/- $500 | ||||||||
Reserving for Asbestos and Environmental Claims
How A&E Reserves are Set- The process for establishing reserves for asbestos and environmental claims first involves estimating the required reserves gross of ceded reinsurance and then estimating reinsurance recoverables.
In establishing reserves for gross asbestos claims, the Company evaluates its insureds’ estimated liabilities for such claims by examining exposures for individual insureds and assessing how coverage applies. The Company considers a variety of factors, including the jurisdictions where underlying claims have been brought, past, pending and anticipated future claim activity, the level of plaintiff demands, disease mix, past settlement values of similar claims, dismissal rates, allocated loss adjustment expense, and potential impact of other defendants being in bankruptcy.
Similarly, the Company reviews exposures to establish gross environmental reserves. The Company considers several factors in estimating environmental liabilities, including historical values of similar claims, the number of sites involved, the insureds’ alleged activities at each site, the alleged environmental damage, the respective shares of liability of
potentially responsible parties, the appropriateness and cost of remediation, the nature of governmental enforcement activities or mandated remediation efforts and potential impact of other defendants being in bankruptcy.
After evaluating its insureds’ probable liabilities for asbestos and/or environmental claims, the Company evaluates the insurance coverage in place for such claims. The Company considers its insureds’ total available insurance coverage, including the coverage issued by the Company. The Company also considers relevant judicial interpretations of policy language, the nature of how policy limits are enforced on multi-year policies and applicable coverage defenses or determinations, if any.
The estimated liabilities of insureds and the Company’s exposure to the insureds depends heavily on an analysis of the relevant legal issues and litigation environment. This analysis is conducted by the Company’s lawyers and is subject to applicable privileges.
For both asbestos and environmental reserves, the Company also analyzes its historical paid and reported losses and expenses year by year, to assess any emerging trends, fluctuations or characteristics suggested by the aggregate paid and reported activity. The historical losses and expenses are analyzed on both a direct basis and net of reinsurance.
Once the gross ultimate exposure for indemnity and allocated loss adjustment expense is determined for its insureds by each policy year, the Company calculates its ceded reinsurance projection based on any applicable facultative and treaty reinsurance and the Company’s experience with reinsurance collections. See the section that follows entitled A&E Adverse Development Cover that discusses the impact the reinsurance agreement with NICO may have on future adverse development of asbestos and environmental reserves, if any.
Uncertainties Regarding Adequacy of A&E Reserves- A number of factors affect the variability of estimates for gross asbestos and environmental reserves including assumptions with respect to the frequency of claims, the average severity of those claims settled with payment, the dismissal rate of claims with no payment, resolution of coverage disputes with our policyholders and the expense to indemnity ratio. Reserve estimates for gross asbestos and environmental reserves are subject to greater variability than reserve estimates for more traditional exposures.
The process of estimating asbestos and environmental reserves remains subject to a wide variety of uncertainties, which are detailed in Note 15 - Commitments and Contingencies of Notes to Consolidated Financial Statements. The Company believes that its current asbestos and environmental reserves are appropriate. Future developments could continue to cause the Company to change its estimates of its gross asbestos and environmental reserves. Losses ceded under the adverse development cover ("A&E ADC") with NICO in excess of the ceded premium paid of $650 have resulted in a deferred gain resulting in a timing difference between when gross reserves are increased and when reinsurance recoveries are recognized. This timing difference results in a charge to net income until such periods when the recoveries are recognized. Consistent with past practice, the Company will continue to monitor its reserves in Property & Casualty Other Operations regularly,
61
Part II - Item 7. Management's Discussion and Analysis of Financial Condition and Results of Operations
including its annual reviews of asbestos liabilities, reinsurance recoverables, the allowance for uncollectible reinsurance, and environmental liabilities. Where future developments indicate, we will make appropriate adjustments to the reserves at that time.
Total P&C Insurance Product Reserves Development
In the opinion of management, based upon the known facts and current law, the reserves recorded for the Company’s property
and casualty insurance products at December 31, 2021 represent the Company’s best estimate of its ultimate liability for unpaid losses and loss adjustment expenses related to losses covered by policies written by the Company. However, because of the significant uncertainties surrounding reserves, it is possible that management’s estimate of the ultimate liabilities for these claims may change in the future and that the required adjustment to currently recorded reserves could be material to the Company’s results of operations and liquidity.
Rollforward of Property and Casualty Insurance Product Liabilities for Unpaid Losses and LAE for the Year Ended December 31, 2021
| Commercial Lines | Personal Lines | Property & Casualty Other Operations | Total Property & Casualty Insurance | |||||||||||||||||
| Beginning liabilities for unpaid losses and loss adjustment expenses, gross | $ | 25,058 | $ | 1,836 | $ | 2,728 | $ | 29,622 | ||||||||||||
| Reinsurance and other recoverables | 4,271 | 28 | 1,426 | 5,725 | ||||||||||||||||
| Beginning liabilities for unpaid losses and loss adjustment expenses, net | 20,787 | 1,808 | 1,302 | 23,897 | ||||||||||||||||
| Provision for unpaid losses and loss adjustment expenses | ||||||||||||||||||||
| Current accident year before catastrophes | 5,407 | 1,840 | — | 7,247 | ||||||||||||||||
| Current accident year ("CAY") catastrophes | 496 | 168 | — | 664 | ||||||||||||||||
| Prior accident year development ("PYD") [1] | 141 | (144) | 202 | 199 | ||||||||||||||||
| Total provision for unpaid losses and loss adjustment expenses | 6,044 | 1,864 | 202 | 8,110 | ||||||||||||||||
| Change in deferred gain on retroactive reinsurance included in other liabilities [1] | (91) | — | (155) | (246) | ||||||||||||||||
| Payments | (4,316) | (1,865) | (214) | (6,395) | ||||||||||||||||
| Foreign currency adjustment | 2 | — | — | 2 | ||||||||||||||||
| Ending liabilities for unpaid losses and loss adjustment expenses, net | 22,426 | 1,807 | 1,135 | 25,368 | ||||||||||||||||
| Reinsurance and other recoverables | 4,480 | 37 | 1,564 | 6,081 | ||||||||||||||||
| Ending liabilities for unpaid losses and loss adjustment expenses, gross | $ | 26,906 | $ | 1,844 | $ | 2,699 | $ | 31,449 | ||||||||||||
| Earned premiums and fee income | $ | 9,575 | $ | 2,986 | ||||||||||||||||
| Loss and loss expense paid ratio [2] | 45.1 | 62.5 | ||||||||||||||||||
| Loss and loss expense incurred ratio | 63.4 | 63.1 | ||||||||||||||||||
| Prior accident year development (pts) [3] | 1.5 | (4.9) | ||||||||||||||||||
[1]Prior accident year development does not include the benefit of a portion of losses ceded under the Navigators and A&E ADCs which, under retroactive reinsurance accounting, is deferred and is recognized over the period the ceded losses are recovered in cash from NICO. For additional information regarding the two adverse development cover reinsurance agreements, refer to Note 12 - Reserve for Unpaid Losses and Loss Adjustment Expenses of Notes to Consolidated Financial Statements.
[2]The “loss and loss expense paid ratio” represents the ratio of paid losses and loss adjustment expenses to earned premiums and fee income.
[3]“Prior accident year development (pts)” represents the ratio of prior accident year development to earned premiums.
62
Part II - Item 7. Management's Discussion and Analysis of Financial Condition and Results of Operations
| Current Accident Year Catastrophe Losses for the Year Ended December 31, 2021, Net of Reinsurance | |||||||||||
Commercial Lines | Personal Lines | Total | |||||||||
| Wind and hail | $ | 157 | $ | 94 | $ | 251 | |||||
| Winter storms [1] | 151 | 18 | 169 | ||||||||
| Hurricanes and Tropical Storms | 151 | 43 | 194 | ||||||||
| Wildfires | 9 | 23 | 32 | ||||||||
| Losses ceded to the aggregate catastrophe treaty [2] | (29) | (10) | (39) | ||||||||
| Catastrophes before assumed reinsurance | 439 | 168 | 607 | ||||||||
| Global assumed reinsurance business [3] | 57 | — | 57 | ||||||||
| Total catastrophe losses | $ | 496 | $ | 168 | $ | 664 | |||||
[1]Includes catastrophe losses from the February winter storms in Texas and other areas within Commercial Lines and Personal Lines of $206 and $24, respectively, gross of reinsurance, and $151 and $18, respectively, net of reinsurance under the Company's per occurrence property catastrophe treaty covering events other than earthquakes and named hurricanes and tropical storms. The reinsurance covers 70% of up to $250 of losses in excess of $100 from such events occurring within a seven day time period, subject to a $50 annual aggregate deductible. These recoveries do not inure to the benefit of the aggregate property catastrophe treaty reinsurers. For further information on the treaty, refer to Enterprise Risk Management — Insurance Risk section of this MD&A.
[2]For further information on the aggregate catastrophe treaty, refer to Enterprise Risk Management — Insurance Risk section of this MD&A.
[3]Catastrophe losses incurred on global assumed reinsurance business are not covered under the Company's aggregate property catastrophe treaty. For further information on the treaty, refer to Enterprise Risk Management — Insurance Risk section of this MD&A.
| Unfavorable (Favorable) Prior Accident Year Development for the Year Ended December 31, 2021 | ||||||||||||||
| Commercial Lines | Personal Lines | Property & Casualty Other Operations | Total Property & Casualty Insurance | |||||||||||
| Workers’ compensation | $ | (190) | $ | — | $ | — | $ | (190) | ||||||
| Workers’ compensation discount accretion | 35 | — | — | 35 | ||||||||||
| General liability | 454 | — | — | 454 | ||||||||||
| Marine | 1 | — | — | 1 | ||||||||||
| Package business | (91) | — | — | (91) | ||||||||||
| Commercial property | (26) | — | — | (26) | ||||||||||
| Professional liability | (2) | — | — | (2) | ||||||||||
| Bond | (26) | — | — | (26) | ||||||||||
| Assumed reinsurance | (6) | — | — | (6) | ||||||||||
| Automobile liability | 9 | (90) | — | (81) | ||||||||||
| Homeowners | — | 3 | — | 3 | ||||||||||
| Net asbestos and environmental reserves | — | — | — | — | ||||||||||
| Catastrophes | (97) | (57) | — | (154) | ||||||||||
| Uncollectible reinsurance | (5) | — | (1) | (6) | ||||||||||
| Other reserve re-estimates, net | (6) | — | 48 | 42 | ||||||||||
| Prior accident year development before change in deferred gain | 50 | (144) | 47 | (47) | ||||||||||
| Change in deferred gain on retroactive reinsurance included in other liabilities | 91 | — | 155 | 246 | ||||||||||
| Total prior accident year development | $ | 141 | $ | (144) | $ | 202 | $ | 199 | ||||||
63
Part II - Item 7. Management's Discussion and Analysis of Financial Condition and Results of Operations
Rollforward of Property and Casualty Insurance Product Liabilities for Unpaid Losses and LAE for the Year Ended December 31, 2020
| Commercial Lines | Personal Lines | Property & Casualty Other Operations | Total Property & Casualty Insurance | ||||||||||||||
| Beginning liabilities for unpaid losses and loss adjustment expenses, gross | $ | 23,363 | $ | 2,201 | $ | 2,697 | $ | 28,261 | |||||||||
| Reinsurance and other recoverables [1] | 4,029 | 68 | 1,178 | 5,275 | |||||||||||||
| Beginning liabilities for unpaid losses and loss adjustment expenses, net | 19,334 | 2,133 | 1,519 | 22,986 | |||||||||||||
| Provision for unpaid losses and loss adjustment expenses | |||||||||||||||||
| Current accident year before catastrophes | 5,493 | 1,695 | — | 7,188 | |||||||||||||
| Current accident year catastrophes | 397 | 209 | — | 606 | |||||||||||||
| Prior accident year development [2] | 44 | (438) | 258 | (136) | |||||||||||||
| Total provision for unpaid losses and loss adjustment expenses | 5,934 | 1,466 | 258 | 7,658 | |||||||||||||
| Change in deferred gain on retroactive reinsurance included in other liabilities [2] | (102) | — | (210) | (312) | |||||||||||||
| Payments | (4,348) | (1,791) | (265) | (6,404) | |||||||||||||
| Net reserves transferred to liabilities held for sale | (45) | — | — | (45) | |||||||||||||
| Foreign currency adjustment | 14 | — | — | 14 | |||||||||||||
| Ending liabilities for unpaid losses and loss adjustment expenses, net | 20,787 | 1,808 | 1,302 | 23,897 | |||||||||||||
| Reinsurance and other recoverables | 4,271 | 28 | 1,426 | 5,725 | |||||||||||||
| Ending liabilities for unpaid losses and loss adjustment expenses, gross | $ | 25,058 | $ | 1,836 | $ | 2,728 | $ | 29,622 | |||||||||
| Earned premiums and fee income | $ | 8,940 | $ | 3,042 | |||||||||||||
| Loss and loss expense paid ratio [3] | 48.6 | 58.9 | |||||||||||||||
| Loss and loss expense incurred ratio | 66.5 | 48.7 | |||||||||||||||
| Prior accident year development (pts) [4] | 0.5 | (14.6) | |||||||||||||||
[1]Includes a cumulative effect adjustment of $1 and $(1) for Commercial Lines and Property & Casualty Other Operations respectively, representing an adjustment to the ACL recorded on adoption of accounting guidance for credit losses on January 1, 2020. See Note 1 - Basis of Presentation and Significant Accounting Policies of Notes to Consolidated Financial Statements for further information.
[2]Prior accident year development does not include the benefit of a portion of losses ceded under the Navigators and A&E ADCs which, under retroactive reinsurance accounting, is deferred and is recognized over the period the ceded losses are recovered in cash from NICO. For additional information regarding the two adverse development cover reinsurance agreements, refer to Note 12 - Reserve for Unpaid Losses and Loss Adjustment Expenses of Notes to Consolidated Financial Statements.
[3]The “loss and loss expense paid ratio” represents the ratio of paid losses and loss adjustment expenses to earned premiums and fee income.
[4]“Prior accident year development (pts)” represents the ratio of prior accident year development to earned premiums.
| Current Accident Year Catastrophe Losses for the Year Ended December 31, 2020, Net of Reinsurance | |||||||||||
Commercial Lines | Personal Lines | Total | |||||||||
| Wind and hail | $ | 167 | $ | 97 | $ | 264 | |||||
| Civil Unrest | 105 | — | 105 | ||||||||
| Hurricanes and Tropical Storms | 96 | 51 | 147 | ||||||||
| Wildfires | 21 | 61 | 82 | ||||||||
| Other | 8 | — | 8 | ||||||||
| Total catastrophe losses | $ | 397 | $ | 209 | $ | 606 | |||||
In December, 2019, the judge overseeing the bankruptcy of PG&E approved an $11 billion settlement of insurance subrogation claims to resolve all such claims arising from the 2017 Northern California wildfires and 2018 Camp wildfire. That settlement was contingent upon, among other things, the judge entering an order confirming PG&E’s chapter 11 bankruptcy plan (“PG&E Plan”) incorporating the settlement agreement. On June 20, 2020, the bankruptcy court judge approved the PG&E
Plan and PG&E subsequently transferred the $11 billion settlement amount to a trust designed to allocate and distribute the settlement among subrogation holders, including certain of the Company’s insurance subsidiaries. In the second quarter of 2020, the Company recorded an estimated $289 subrogation benefit though the ultimate amount it collects will depend on how the Company’s ultimate paid claims subject to subrogation compare to other insurers’ ultimate paid claims subject to
64
Part II - Item 7. Management's Discussion and Analysis of Financial Condition and Results of Operations
subrogation. In 2020, the Company received distributions, net of attorney costs, of $227.
| Unfavorable (Favorable) Prior Accident Year Development for the Year Ended December 31, 2020 | ||||||||||||||
| Commercial Lines | Personal Lines | Property & Casualty Other Operations | Total Property & Casualty Insurance | |||||||||||
| Workers’ compensation | $ | (110) | $ | — | $ | — | $ | (110) | ||||||
| Workers’ compensation discount accretion | 35 | — | — | 35 | ||||||||||
| General liability | 237 | — | — | 237 | ||||||||||
| Marine | 3 | — | — | 3 | ||||||||||
| Package business | (58) | — | — | (58) | ||||||||||
| Commercial property | (4) | — | — | (4) | ||||||||||
| Professional liability | (14) | — | — | (14) | ||||||||||
| Bond | (19) | — | — | (19) | ||||||||||
| Assumed reinsurance | (6) | — | — | (6) | ||||||||||
| Automobile liability | 27 | (61) | — | (34) | ||||||||||
| Homeowners | — | 7 | — | 7 | ||||||||||
| Net asbestos and environmental reserves | — | — | (2) | (2) | ||||||||||
| Catastrophes | (149) | (380) | — | (529) | ||||||||||
| Uncollectible reinsurance | — | — | (8) | (8) | ||||||||||
| Other reserve re-estimates, net | — | (4) | 58 | 54 | ||||||||||
| Prior accident year development before change in deferred gain | (58) | (438) | 48 | (448) | ||||||||||
| Change in deferred gain on retroactive reinsurance included in other liabilities | 102 | — | 210 | 312 | ||||||||||
| Total prior accident year development | $ | 44 | $ | (438) | $ | 258 | $ | (136) | ||||||
65
Part II - Item 7. Management's Discussion and Analysis of Financial Condition and Results of Operations
Rollforward of Property and Casualty Insurance Product Liabilities for Unpaid Losses and LAE for the Year Ended December 31, 2019
| Commercial Lines | Personal Lines | Property & Casualty Other Operations | Total Property & Casualty Insurance | |||||||||||
| Beginning liabilities for unpaid losses and loss adjustment expenses, gross | $ | 19,455 | $ | 2,456 | $ | 2,673 | $ | 24,584 | ||||||
| Reinsurance and other recoverables | 3,137 | 108 | 987 | 4,232 | ||||||||||
| Beginning liabilities for unpaid losses and loss adjustment expenses, net | 16,318 | 2,348 | 1,686 | 20,352 | ||||||||||
| Navigators Group Acquisition | 2,001 | — | — | 2,001 | ||||||||||
| Provision for unpaid losses and loss adjustment expenses | ||||||||||||||
| Current accident year before catastrophes | 4,913 | 2,087 | — | 7,000 | ||||||||||
| Current accident year catastrophes | 323 | 140 | — | 463 | ||||||||||
| Prior accident year development [1] | (44) | (42) | 21 | (65) | ||||||||||
| Total provision for unpaid losses and loss adjustment expenses | 5,192 | 2,185 | 21 | 7,398 | ||||||||||
| Change in deferred gain on retroactive reinsurance included in other liabilities [1] | (16) | — | — | (16) | ||||||||||
| Payments | (4,161) | (2,400) | (187) | (6,748) | ||||||||||
| Foreign currency adjustment | (1) | — | — | (1) | ||||||||||
| Ending liabilities for unpaid losses and loss adjustment expenses, net | 19,333 | 2,133 | 1,520 | 22,986 | ||||||||||
| Reinsurance and other recoverables | 4,030 | 68 | 1,177 | 5,275 | ||||||||||
| Ending liabilities for unpaid losses and loss adjustment expenses, gross | $ | 23,363 | $ | 2,201 | $ | 2,697 | $ | 28,261 | ||||||
| Earned premiums and fee income | $ | 8,325 | $ | 3,235 | ||||||||||
| Loss and loss expense paid ratio [2] | 50.0 | 74.2 | ||||||||||||
| Loss and loss expense incurred ratio | 62.6 | 68.3 | ||||||||||||
| Prior accident year development (pts) [3] | (0.5) | (1.3) | ||||||||||||
[1]Prior accident year development does not include the benefit of a portion of losses ceded under the Navigators and A&E ADCs which, under retroactive reinsurance accounting, is deferred and is recognized over the period the ceded losses are recovered in cash from NICO. For additional information regarding the two adverse development cover reinsurance agreements, refer to Note 12 - Reserve for Unpaid Losses and Loss Adjustment Expenses of Notes to Consolidated Financial Statements.
[2]The “loss and loss expense paid ratio” represents the ratio of paid losses and loss adjustment expenses to earned premiums and fee income.
[3]“Prior accident year development (pts)” represents the ratio of prior accident year development to earned premiums.
| Current Accident Year Catastrophe Losses for the Year Ended December 31, 2019, Net of Reinsurance | |||||||||||
Commercial Lines | Personal Lines | Total | |||||||||
| Wind and hail | $ | 157 | $ | 102 | $ | 259 | |||||
| Winter storms | 54 | 18 | 72 | ||||||||
| Tropical storms | 18 | 5 | 23 | ||||||||
| Hurricanes | 20 | 4 | 24 | ||||||||
| Wildfires | 4 | 4 | 8 | ||||||||
| Tornadoes | 53 | 7 | 60 | ||||||||
| Typhoons | 16 | — | 16 | ||||||||
| Other | 1 | — | 1 | ||||||||
| Total catastrophe losses | $ | 323 | $ | 140 | $ | 463 | |||||
66
Part II - Item 7. Management's Discussion and Analysis of Financial Condition and Results of Operations
| Unfavorable (Favorable) Prior Accident Year Development for the Year Ended December 31, 2019 | ||||||||||||||
| Commercial Lines | Personal Lines | Property & Casualty Other Operations | Total Property & Casualty Insurance | |||||||||||
| Workers’ compensation | $ | (120) | $ | — | $ | — | $ | (120) | ||||||
| Workers’ compensation discount accretion | 33 | — | — | 33 | ||||||||||
| General liability | 61 | — | — | 61 | ||||||||||
| Marine | 8 | — | — | 8 | ||||||||||
| Package business | (47) | — | — | (47) | ||||||||||
| Commercial property | (11) | — | — | (11) | ||||||||||
| Professional liability | 29 | — | — | 29 | ||||||||||
| Bond | (3) | — | — | (3) | ||||||||||
| Assumed reinsurance | 3 | — | — | 3 | ||||||||||
| Automobile liability | 27 | (38) | — | (11) | ||||||||||
| Homeowners | — | 3 | — | 3 | ||||||||||
| Net asbestos and environmental reserves | — | — | — | — | ||||||||||
| Catastrophes | (40) | (2) | — | (42) | ||||||||||
| Uncollectible reinsurance | (5) | — | (25) | (30) | ||||||||||
| Other reserve re-estimates, net | 5 | (5) | 46 | 46 | ||||||||||
| Total prior accident year development | (60) | (42) | 21 | (81) | ||||||||||
| Change in deferred gain on retroactive reinsurance included in other liabilities | 16 | — | — | 16 | ||||||||||
| Total prior accident year development | $ | (44) | $ | (42) | $ | 21 | $ | (65) | ||||||
For discussion of the factors contributing to unfavorable (favorable) for the prior accident year reserve development 2021, 2020, and 2019 periods, refer to Note 12 - Reserve for
Unpaid Losses and Loss Adjustment Expenses of Notes to Consolidated Financial Statements.
|PROPERTY & CASUALTY OTHER OPERATIONS
Net reserves and reserve activity in Property & Casualty Other Operations are categorized and reported as asbestos, environmental, and “all other”. The “all other” category of reserves covers a wide range of insurance and assumed reinsurance coverages, including, but not limited to, potential liability for construction defects, lead paint, silica, pharmaceutical products, head injuries, sexual molestation and sexual abuse and other long-tail liabilities. In addition to various insurance and assumed reinsurance exposures, "all other" includes unallocated loss adjustment expense reserves. "All other" also includes the Company’s allowance for uncollectible reinsurance. When the Company commutes a ceded reinsurance contract or settles a ceded reinsurance dispute, net reserves for the related cause of loss (including asbestos, environmental or all other) are increased for the portion of the
allowance for uncollectible reinsurance attributable to that commutation or settlement.
Asbestos and Environmental Reserves
The vast majority of the Company's exposure to A&E relates to policy coverages provided prior to 1986, reported within the P&C Other Operations segment (“Run-off A&E”). In addition, since 1986, the Company has written asbestos and environmental exposures under general liability policies and pollution liability under homeowners policies, which are reported in the Commercial Lines and Personal Lines segments.
67
Part II - Item 7. Management's Discussion and Analysis of Financial Condition and Results of Operations
Run-off A&E Summary as of December 31, 2021
| Asbestos | Environmental | Total Run-off A&E | ||||||||||||
| Gross | ||||||||||||||
| Direct | $ | 1,247 | $ | 394 | $ | 1,641 | ||||||||
| Assumed Reinsurance | 460 | 68 | 528 | |||||||||||
| Total | 1,707 | 462 | 2,169 | |||||||||||
| Ceded- other than NICO | (444) | (68) | (512) | |||||||||||
| Total net reserves, before ceded losses to NICO | 1,263 | 394 | 1,657 | |||||||||||
| Ceded - NICO A&E ADC "Run-off"[1] | (1,053) | |||||||||||||
| Net | $ | 604 | ||||||||||||
[1]Including $1,053 of ceded losses for Run-off A&E and a ($38) reduction in ceded losses for Commercial Lines and Personal Lines, cumulative net incurred losses of $1,015 have been ceded to NICO under an adverse development cover reinsurance agreement. See the section that follows entitled A&E Adverse Development Cover for additional information.
Rollforward of Run-off A&E Losses and LAE
| Asbestos | Environmental | Total Run-off A&E | |||||||||
| 2021 | |||||||||||
| Beginning net reserves before reinsurance recoverable from NICO | $ | 1,268 | $ | 419 | $ | 1,687 | |||||
| Losses and loss adjustment expenses incurred before ceding to NICO A&E ADC | 104 | 51 | 155 | ||||||||
| Losses and loss adjustment expenses paid | (112) | (76) | (188) | ||||||||
| Reclassification of allowance for uncollectible reinsurance [1] | 3 | — | 3 | ||||||||
| Ending net reserves before reinsurance recoverable from NICO | 1,263 | 394 | 1,657 | ||||||||
| Reinsurance recoverable from NICO A&E ADC | (1,053) | ||||||||||
| Ending net reserves | $ | 604 | |||||||||
| 2020 | |||||||||||
| Beginning net reserves before reinsurance recoverable from NICO | $ | 1,308 | $ | 346 | $ | 1,654 | |||||
| Losses and loss adjustment expenses incurred before ceding to NICO A&E ADC | 130 | 106 | 236 | ||||||||
| Losses and loss adjustment expenses paid | (172) | (33) | (205) | ||||||||
| Reclassification of allowance for uncollectible reinsurance [1] | 2 | — | 2 | ||||||||
| Ending net reserves before reinsurance recoverable from NICO | 1,268 | 419 | 1,687 | ||||||||
| Reinsurance recoverable from NICO A&E ADC | (898) | ||||||||||
| Ending net reserves | $ | 789 | |||||||||
| 2019 | |||||||||||
| Beginning net reserves before reinsurance recoverable from NICO | $ | 1,342 | $ | 321 | $ | 1,663 | |||||
| Losses and loss adjustment expenses incurred before ceding to NICO A&E ADC | 76 | 56 | 132 | ||||||||
| Losses and loss adjustment expenses paid | (111) | (32) | (143) | ||||||||
| Reclassification of allowance for uncollectible reinsurance [1] | 1 | 1 | 2 | ||||||||
| Ending net reserves before reinsurance recoverable from NICO | 1,308 | 346 | 1,654 | ||||||||
| Reinsurance recoverable from NICO A&E ADC | (660) | ||||||||||
| Ending liability — net | $ | 994 | |||||||||
[1]Related to the reclassification of an allowance for uncollectible reinsurance from the "all other" category of P&C Other Operations reserves.
A&E Adverse Development Cover
Effective December 31, 2016, the Company entered into an A&E ADC reinsurance agreement with NICO, a subsidiary of Berkshire, to reduce uncertainty about potential adverse development. Under the A&E ADC, the Company paid a reinsurance premium of $650 for NICO to assume adverse net loss and allocated loss adjustment expense reserve development up to $1.5 billion above the Company’s existing net A&E reserves as of December 31, 2016 of approximately $1.7 billion, including both Run-off A&E and A&E reserves in Commercial Lines and Personal Lines. The $650 reinsurance premium was placed in a collateral trust account as security for
NICO’s claim payment obligations to the Company. The Company has retained the risk of collection on amounts due from other third-party reinsurers and continues to be responsible for claims handling and other administrative services, subject to certain conditions. The A&E ADC covers substantially all the Company’s A&E reserve development up to the reinsurance limit.
Under retroactive reinsurance accounting, net adverse A&E reserve development after December 31, 2016 results in an offsetting reinsurance recoverable up to the $1.5 billion limit. Cumulative ceded losses up to the $650 reinsurance
68
Part II - Item 7. Management's Discussion and Analysis of Financial Condition and Results of Operations
premium paid have been recognized as a dollar-for-dollar offset to direct losses incurred. Cumulative ceded losses exceeding the $650 reinsurance premium paid have resulted in a deferred gain. As of December 31, 2021, the Company has incurred a cumulative $1,015 in adverse development on A&E reserves that have been ceded under the A&E ADC treaty with NICO, including $1,053 for Run-off A&E reserves, partially offset by a $38 reduction for A&E reserves in Commercial Lines and Personal Lines. As such, $485 of coverage is available for future adverse net reserve development, if any. As a result, the Company has recorded a $365 deferred gain within other liabilities, representing the difference between the reinsurance recoverable of $1,015 and ceded premium paid of $650. The deferred gain is recognized over the claim settlement period in the proportion of the amount of cumulative ceded losses collected from the reinsurer to the estimated ultimate reinsurance recoveries. Consequently, until periods when the deferred gain is recognized as a benefit to earnings, cumulative adverse development of asbestos and environmental claims will result in charges against earnings, which may be significant.
Net and Gross Survival Ratios
Net and gross survival ratios are a measure of the quotient of the carried reserves divided by average annual payments (net of reinsurance and on a gross basis) and is an indication of the number of years that carried reserves would last (i.e. survive) if future annual payments were consistent with the calculated historical average.
Since December 31, 2016, asbestos and environmental net reserves have been declining since all adverse development has been ceded to NICO, up to a limit of $1.5 billion and the deferred gain on retroactive reinsurance has been recorded within other liabilities rather than in net loss and loss adjustment expense reserves. Recoveries from NICO will not be collected until the Company has cumulative loss payments of more than the attachment point of $1.7 billion which was based on the carrying value of net reserves as of December 31, 2016. Accordingly, the payment of losses without any current collection of recoveries from NICO has reduced the Company’s net loss reserves which decreases the net survival ratios such that, unadjusted, the net survival ratios would not be representative of the true number of years of average loss payments covered by the reserves. Therefore, the net survival ratios presented in the table below are calculated before considering the effect of the A&E ADC reinsurance agreement but net of other reinsurance in place.
Net and Gross Survival Ratios
| Asbestos | Environmental | |||||||||||||
| One year net survival ratio | 11.3 | 5.2 | ||||||||||||
| Three year net survival ratio | 9.6 | 8.4 | ||||||||||||
| One year gross survival ratio | 10.9 | 4.2 | ||||||||||||
| Three year gross survival ratio | 9.4 | 7.4 | ||||||||||||
Run-off A&E Paid and Incurred Losses and LAE Development
| Asbestos | Environmental | Total A&E | ||||||||||||||||||
| Paid Losses & LAE | Incurred Losses & LAE | Paid Losses & LAE | Incurred Losses & LAE | Paid Losses & LAE | Incurred Losses & LAE | |||||||||||||||
| 2021 | ||||||||||||||||||||
| Gross | $ | 157 | $ | 148 | $ | 109 | $ | 55 | $ | 266 | $ | 203 | ||||||||
| Ceded- other than NICO | (45) | (44) | (33) | (4) | (78) | (48) | ||||||||||||||
| Net - Gross of ADC | 112 | 104 | 76 | 51 | 188 | 155 | ||||||||||||||
| Ceded - NICO A&E ADC | — | (155) | ||||||||||||||||||
| Net | $ | 188 | $ | — | ||||||||||||||||
| 2020 | ||||||||||||||||||||
| Gross | $ | 252 | $ | 170 | $ | 40 | $ | 141 | $ | 292 | $ | 311 | ||||||||
| Ceded- other than NICO | (80) | (40) | (7) | (35) | (87) | (75) | ||||||||||||||
| Net - Gross of ADC | 172 | 130 | 33 | 106 | 205 | 236 | ||||||||||||||
| Ceded - NICO A&E ADC | — | (238) | ||||||||||||||||||
| Net | $ | 205 | $ | (2) | ||||||||||||||||
| 2019 | ||||||||||||||||||||
| Gross | $ | 131 | $ | 115 | $ | 39 | $ | 95 | $ | 170 | $ | 210 | ||||||||
| Ceded- other than NICO | (20) | (39) | (7) | (39) | (27) | (78) | ||||||||||||||
| Net - Gross of ADC | 111 | 76 | 32 | 56 | 143 | 132 | ||||||||||||||
| Ceded - NICO A&E ADC | — | (132) | ||||||||||||||||||
| Net | $ | 143 | $ | — | ||||||||||||||||
Annual Reserve Reviews
Review of Asbestos and Environmental Reserves
The Company performs its regular comprehensive annual review of asbestos and environmental reserves in the fourth quarter, including both Run-off A&E (P&C Other Operations) and asbestos and environmental reserves included in Commercial
Lines and Personal Lines. As part of the evaluation of asbestos and environmental reserves in the fourth quarter of 2021, the Company reviewed all of its open direct domestic insurance accounts exposed to asbestos and environmental liability, as well as assumed reinsurance accounts.
69
Part II - Item 7. Management's Discussion and Analysis of Financial Condition and Results of Operations
2021 comprehensive annual reviews
As a result of the 2021 fourth quarter review, the Company increased estimated asbestos reserves before NICO reinsurance by $106, including $104 in P&C Other Operations, primarily due to an increase in claim settlement rates, claim settlement values, and defense costs, which more than offset the impact of a decline in claim filing frequency. Also contributing was an increase in the Company's estimated share of liability under pending or potential cost sharing agreements and settlements. The increase in asbestos reserves was offset by a $106 reinsurance recoverable under the NICO treaty.
As a result of the 2021 fourth quarter review, the Company increased estimated environmental reserves before NICO reinsurance by $49, including $51 in P&C Other Operations, primarily due to the settlement of a large coal ash remediation claim, an increase in legal defense costs and higher site remediation costs. The increase in environmental reserves was offset by a $49 reinsurance recoverable under the NICO treaty.
The total $155 increase in asbestos and environmental reserves in P&C Other Operations was offset by a $155 reinsurance recoverable under the NICO treaty. Since cumulative losses ceded to the A&E ADC exceed the $650 of ceded premium paid, the Company recognized a $155 increase in deferred gain on retroactive reinsurance, resulting in the Company recording a charge to earnings of $155 in 2021.
2020 comprehensive annual reviews
As a result of the 2020 fourth quarter review, the Company increased estimated asbestos reserves before NICO reinsurance in P&C Other Operations by $130, primarily due to an increase in the rate of asbestos claims settlements for both mesothelioma and non-mesothelioma claims. In addition, average settlement values and defense costs were higher than anticipated, driven by elevated plaintiff demands. Overall, the number of claim filings in the period covered by the 2020 study was roughly flat with the 2019 study, driven by an increase in non-mesothelioma claim filings, while the number of mesothelioma claim filings decreased as expected. The increase in asbestos reserves was offset by $132 reinsurance recoverable under the NICO treaty, recognizing ($2) in reserve releases not subject to the NICO treaty.
As a result of the 2020 fourth quarter review, the Company increased estimated environmental reserves before NICO reinsurance in P&C Other Operations by $106, primarily due to an increasing number of claims and suits alleging contamination from or exposure to PFAS. In addition, higher than anticipated remediation costs and legal defense costs also contributed to the reserve increase. The increase in environmental reserves was offset by a $106 reinsurance recoverable under the NICO treaty.
The total $236 increase in asbestos and environmental reserves in P&C Other Operations was offset by a $238 reinsurance recoverable under the NICO treaty, with a ($2) release in asbestos reserves not subject to the NICO treaty. Including a reduction of asbestos and environmental reserves in Commercial Lines and Personal Lines, the net increase in A&E reserves ceded to the A&E ADC in 2020 was $220 offset by a $220 increase in reinsurance recoverables under the NICO treaty. However, since cumulative losses ceded to the A&E ADC of $860 exceed the $650 of ceded premium paid, the Company recognized a $210 increase in deferred gain on retroactive
reinsurance, resulting in the Company recording a charge to earnings of $208 in 2020, consisting of the $210 deferred gain net of the $2 of favorable development on A&E reserves not subject to the NICO treaty.
For information regarding the 2019 comprehensive annual review, refer to Part 2, Item 7, Management's Discussion and Analysis of Financial Condition and Results of Operations in The Hartford’s 2020 Form 10-K Annual Report.
Major Categories of Asbestos Accounts
Direct asbestos exposures include both Known and Unallocated Direct Accounts.
•Known Direct Accounts- includes both Major Asbestos Defendants and Non-Major Accounts, and represent approximately 71% of the Company's total Direct gross asbestos reserves as of December 31, 2021 compared to approximately 71% as of December 31, 2020. Major Asbestos Defendants have been defined as the “Top 70” accounts in Tillinghast's published Tiers 1 and 2 and Wellington accounts, while Non-Major accounts are comprised of all other direct asbestos accounts and largely represent smaller and more peripheral defendants. Major Asbestos Defendants have the fewest number of asbestos accounts.
•Unallocated Direct Accounts- includes an estimate of the reserves necessary for asbestos claims related to direct insureds that have not previously tendered asbestos claims to the Company and exposures related to liability claims that may not be subject to an aggregate limit under the applicable policies. These exposures represent approximately 29% of the Company's Direct gross asbestos reserves as of December 31, 2021 compared to approximately 29% as of December 31, 2020.
Review of "All Other" Reserves in Property & Casualty Other Operations
Prior year development on all other reserves resulted in increases of $47, $50 and $21, respectively for calendar years 2021, 2020 and 2019. Included in the 2021 adverse reserve development was the portion of the increase in reserve for sexual molestation and sexual abuse claims recognized in P&C Other Operations, principally on assumed reinsurance. Also included in 2021 adverse development was an increase in reserves for ULAE, primarily due to an increase in expected aggregate claim handling costs associated with asbestos and environmental claims. For more information on the increase in reserves for sexual molestation and sexual abuse claims, see Note 12 - Reserve for Unpaid Losses and Loss Adjustment Expenses, of the Notes to Consolidated Financial Statements.
The Company provides an allowance for uncollectible reinsurance, reflecting management’s best estimate of reinsurance cessions that may be uncollectible in the future due to reinsurers’ unwillingness or inability to pay. In performing its assessment, the Company evaluates the collectibility of the reinsurance recoverables and the adequacy of the allowance for uncollectible reinsurance associated with older, long-term casualty liabilities reported in Property & Casualty Other Operations. In conducting these evaluations, the company used its most recent detailed evaluations of ceded liabilities reported in the segment. The Company analyzed the overall credit quality of the Company’s reinsurers, recent trends in arbitration and litigation outcomes in disputes between cedants and reinsurers,
70
Part II - Item 7. Management's Discussion and Analysis of Financial Condition and Results of Operations
and recent developments in commutation activity between reinsurers and cedants. As of 2021, 2020, and 2019 the allowance for uncollectible reinsurance for Property & Casualty Other Operations totaled $53, $60 and $71, respectively. Due to the inherent uncertainties as to collection and the length of time
before reinsurance recoverables become due, particularly for older, long-term casualty liabilities, it is possible that future adjustments to the Company’s reinsurance recoverables, net of the allowance, could be required.
|IMPACT OF RE-ESTIMATES ON PROPERTY & CASUALTY INSURANCE PRODUCT RESERVES
Estimating property and casualty insurance product reserves uses a variety of methods, assumptions and data elements. Ultimate losses may vary materially from the current estimates. Many factors can contribute to these variations and the need to change the previous estimate of required reserve levels. Prior accident year reserve development is generally due to the emergence of additional facts that were not known or anticipated at the time of the prior reserve estimate and/or due to changes in interpretations of information and trends.
The table below shows the range of annual reserve re-estimates experienced by The Hartford over the past ten years. The range of prior accident year development shown in the table below is net of losses ceded, including losses ceded under two adverse
development cover reinsurance agreements with NICO that are accounted for as a deferred gain on retroactive reinsurance. The amount of prior accident year development (as shown in the reserve rollforward) for a given calendar year is expressed as a percent of the beginning calendar year reserves, net of reinsurance. The ranges presented are significantly influenced by the facts and circumstances of each particular year and by the fact that only the last ten years are included in the range. Accordingly, these percentages are not intended to be a prediction of the range of possible future variability. For further discussion of the potential for variability in recorded loss reserves, see Preferred Reserving Methods by Line of Business and Impact of Key Assumptions on Reserves sections.
Range of Prior Accident Year Unfavorable (Favorable) Development for the Ten Years Ended December 31, 2021
| Commercial Lines | Personal Lines | Property & Casualty Other Operations | Total Property & Casualty [1] | |||||||||||
| Annual range of prior accident year unfavorable (favorable) development for the ten years ended December 31, 2021 | (1.3%) - 0.6% | (20.5%) - 8.3% | 0.9% - 9.8% | (1.9%) - 2.4% | ||||||||||
[1]Excluding the reserve increases for asbestos and environmental reserves, over the past ten years, reserve re-estimates for total property and casualty insurance ranged from (1.9%) to 1.0%.
The potential variability of the Company’s property and casualty insurance product reserves would normally be expected to vary by segment and the types of loss exposures insured by those segments. Illustrative factors influencing the potential reserve variability for each of the segments are discussed under Critical Accounting Estimates for Property & Casualty Insurance Product Reserves and Asbestos and Environmental Reserves. See the section entitled Property & Casualty Other Operations, Annual Reserve Reviews about the impact that the A&E ADC retroactive reinsurance agreement with NICO has on net reserve changes of asbestos and environmental reserves.
The following table summarizes the effect of reserve re-estimates, net of reinsurance, on calendar year operations for the ten-year period ended December 31, 2021. The total of each column details the amount of reserve re-estimates made in the indicated calendar year and shows the accident years to which the re-estimates are applicable. The amounts in the total column on the far right represent the cumulative reserve re-estimates during the ten year period ended December 31, 2021 for the indicated accident year in each row. This table does not include Navigators Group reserve re-estimates for periods prior to the acquisition of the business on May 23, 2019.
71
Part II - Item 7. Management's Discussion and Analysis of Financial Condition and Results of Operations
Effect of Net Reserve Re-estimates on Calendar Year Operations
| Calendar Year | |||||||||||||||||||||||||||||||||||
| 2012 | 2013 | 2014 | 2015 | 2016 | 2017 | 2018 | 2019 | 2020 | 2021 | Total | |||||||||||||||||||||||||
| By Accident Year | |||||||||||||||||||||||||||||||||||
| 2011 & Prior | $ | (4) | $ | 173 | $ | 326 | $ | 362 | $ | 310 | $ | 93 | $ | (26) | $ | 19 | $ | 277 | $ | 569 | $ | 2,099 | |||||||||||||
| 2012 | 19 | — | (55) | (35) | (12) | (15) | (15) | (25) | (14) | (152) | |||||||||||||||||||||||||
| 2013 | (98) | (43) | (29) | (33) | (2) | (26) | (15) | (35) | (281) | ||||||||||||||||||||||||||
| 2014 | (14) | 20 | (19) | (54) | (29) | (28) | (59) | (183) | |||||||||||||||||||||||||||
| 2015 | 191 | (41) | (93) | 19 | (16) | (70) | (10) | ||||||||||||||||||||||||||||
| 2016 | (29) | 14 | (11) | (38) | (83) | (147) | |||||||||||||||||||||||||||||
| 2017 | 9 | (116) | (204) | (111) | (422) | ||||||||||||||||||||||||||||||
| 2018 | 78 | (307) | (96) | (325) | |||||||||||||||||||||||||||||||
| 2019 | (92) | (47) | (139) | ||||||||||||||||||||||||||||||||
| 2020 | (101) | (101) | |||||||||||||||||||||||||||||||||
| Increase (decrease) in net reserves [1] | (4) | 192 | 228 | 250 | 457 | (41) | (167) | (81) | (448) | (47) | 339 | ||||||||||||||||||||||||
| Change in deferred gain on retroactive reinsurance included in other liabilities | 16 | 312 | 246 | ||||||||||||||||||||||||||||||||
| Total unfavorable (favorable) prior accident year development | $ | (65) | $ | (136) | $ | 199 | |||||||||||||||||||||||||||||
[1]Increase (decrease) in net reserves by accident year in the above table is net of losses ceded, including losses ceded under two adverse development cover reinsurance agreements with NICO accounted for as a deferred gain on retroactive reinsurance. One agreement covers substantially all A&E reserve development for 2016 and prior accident years (the “A&E ADC”) up to an aggregate limit of $1.5 billion and the other covered substantially all reserve development of Navigators Insurance Company and certain of its affiliates for 2018 and prior accident years (“Navigators ADC”) up to an aggregate limit of $300. For calendar years before 2017, the 2011 and prior accident year development includes adverse development for A&E reserves. For additional information regarding the two adverse development cover reinsurance agreements, refer to Note 12 – Reserve for Unpaid Losses and Loss Adjustment Expenses of Notes to Consolidated Financial Statements.
The commentary below explains, by accident year, the total prior accident year development recognized over the past 10 years.
Accident year 2011 and Prior
The net increases in estimates of ultimate losses for accident years 2011 and prior were driven mostly by increased reserves for asbestos and environmental reserves, and also by increased estimates for customs bonds, sexual molestation and sexual abuse and other mass torts claims. Also contributing was an increase in workers' compensation and commercial automobile liability, offset by favorable development in personal automobile liability.
Accident years 2012 and 2013
Estimates of ultimate losses were decreased for accident years 2012 and 2013 due to favorable frequency and/or medical severity trends for workers’ compensation and favorable professional liability claim emergence. Favorable emergence of property lines of business, including catastrophes, for the 2013 accident year, was partially offset by increased reserves in automobile liability due to increased severity of large claims.
Accident years 2014 and 2015
Changes in estimates of ultimate losses for accident years 2014 and 2015 were largely driven by favorable frequency and medical severity trends for workers' compensation, partially offset by unfavorable frequency and severity trends for personal and commercial automobile liability and increased severity of liability claims on package business.
Accident year 2016
Estimates of ultimate losses were decreased for the 2016 accident year largely due to reserve decreases on workers' compensation and personal automobile liability due to lower
estimated severity, partially offset by unfavorable reserve estimates for higher hazard general liability exposures due to increased frequency and severity trends, higher estimated severity in middle & large commercial and on the acquired Navigators Group book of business related to U.S. construction, premises liability, products liability and excess casualty.
Accident year 2017
Ultimate loss estimates were decreased for the 2017 accident year mainly due to release of reserves related to catastrophes, lower reserve estimates in personal automobile liability due to emergence of lower estimated severity and lower reserve estimates for workers’ compensation related to lower than previously estimated claim severity, partially offset by increases in estimates of ultimate losses in general liability and bond. Partially offsetting was an increase to general liability reserves that was related to high hazard exposures which experienced increased frequency and severity trends. In addition, unfavorable bond reserve re-estimates were driven by large claims.
Accident year 2018
Ultimate loss estimates were decreased for the 2018 accident year mainly due to reduction in estimated catastrophe reserves for California wildfires and for various wind and hail events. Reserve estimates were also reduced, to a lesser extent, for personal automobile liability which decreased due to lower than previously expected claim severity. These reserve decreases were partially offset by increases in commercial automobile liability and general liability. Commercial automobile liability reserve increases were related to higher estimated severity on middle & large commercial claims. Increases in general liability reserves for middle market and complex liability claims were also largely due to higher than previously expected severity.
72
Part II - Item 7. Management's Discussion and Analysis of Financial Condition and Results of Operations
Accident year 2019
Ultimate loss estimates were decreased for the 2019 accident year mainly due to favorable emergence of property lines of business, primarily related to catastrophes. In addition, reduced reserve estimates for personal automobile liability were largely offset by higher reserve estimates for commercial automobile liability.
Accident year 2020
Ultimate loss estimates were decreased for the 2020 accident year mainly due to favorable emergence of property lines of business, inclusive of catastrophes. Reserve estimates were also reduced, to a lesser extent, for personal automobile liability due to lower estimated severity and for general liability.
|GROUP BENEFIT RESERVES, NET OF REINSURANCE
The Company establishes reserves for group life and accident & health contracts, including long-term disability coverage, for both reported claims and claims related to insured events that the Company estimates have been incurred but have not yet been reported. As long-term disability reserves are long-tail claim liabilities, they are discounted because the payment pattern and the ultimate costs are reasonably fixed and determinable on an individual claim basis. The Company held $6,437 and $6,494 of LTD unpaid losses and loss adjustment expenses, net of reinsurance, as of December 31, 2021 and 2020, respectively.
Reserving Methodology
How Reserves are Set - A Disabled Life Reserve ("DLR") is calculated for each LTD claim. The DLR for each claim is the expected present value of all future benefit payments starting with the known monthly gross benefit which is reduced for estimates of the expected claim recovery due to return to work or claimant death, offsets from other income including offsets from Social Security benefits, and discounting where the discount rate is tied to expected investment yield at the time the claim is incurred. Estimated future benefit payments represent the monthly income benefit that is paid until recovery, death or expiration of benefits. Claim recoveries are estimated based on claim characteristics such as age and diagnosis and represent an estimate of benefits that will terminate, generally as a result of the claimant returning to work or being deemed able to return to work. For claims recently closed due to recovery, a portion of the DLR is retained for the possibility that the claim reopens upon further evidence of disability. In addition, a reserve for estimated unpaid claim expenses is included in the DLR.
The DLR also includes a liability for potential payments to pending claimants beyond the elimination period who have not yet been approved for LTD. In these cases, the present value of future benefits is reduced for the likelihood of claim denial based on Company experience.
Estimates for IBNR claims are made by applying completion factors to expected emerged experience by line of business. Included within IBNR are bulk reserves for claims reported but still within the waiting period until benefits are paid, typically 3 or 6 months depending on the contract. Completion factors are derived from standard actuarial techniques using triangles that display historical claim count emergence by incurral month. These estimates are reviewed for reasonableness and are adjusted for current trends and other factors expected to cause a change in claim emergence. The reserves include an estimate of unpaid claim expenses, including a provision for the cost of initial set-up of the claim once reported.
For all products, including LTD, there is a period generally ranging from two to twelve months, depending on the product and line of business, where emerged claims for an incurral year
are not yet credible enough to be a basis for estimating reserves. In these cases, the ultimate loss is estimated using earned premium multiplied by an expected loss ratio based on pricing assumptions of claim incidence, claim severity, and earned pricing.
Impact of Key Assumptions on Reserves
The key assumptions affecting long-term disability, which is the largest reserve within Group Benefits, include:
Discount Rate - The discount rate is the interest rate at which expected future claim cash flows are discounted to determine the present value. A higher selected discount rate results in a lower reserve. If the discount rate is higher than our future investment returns, our invested assets will not earn enough investment income to cover the discount accretion on our claim reserves which would negatively affect our profits. For each incurral year, the discount rates are estimated based on investment yields expected to be earned net of investment expenses. The incurral year is the year in which the claim is incurred and the estimated settlement pattern is determined. Once established, discount rates for each incurral year are unchanged except that LTD reserves assumed from the acquisition of Aetna's U.S. group life and disability business are all discounted using rates as of the November 1, 2017 acquisition date. The weighted average discount rate on LTD reserves was 3.3% and 3.4% in 2021 and 2020, respectively. Had the discount rate for each incurral year been 10 basis points lower at the time they were established, our LTD unpaid loss and loss adjustment expense reserves would be higher by $28, before tax, as of December 31, 2021.
Claim Termination Rates (inclusive of mortality, recoveries, and expiration of benefits) - Claim termination rates are an estimate of the rate at which claimants will cease receiving benefits during a given calendar year. Terminations result from a number of factors, including death, recoveries and expiration of benefits. The probability that benefits will terminate in each future month for each claim is estimated using a predictive model that uses past Company experience, contract provisions, job characteristics and other claimant-specific characteristics such as diagnosis, time since disability began, and age. Actual claim termination experience will vary from period to period. Over the past 10 years, claim termination rates for a single incurral year have generally increased and have ranged from 5% below to 8% above current assumptions over that time period. For a single recent incurral year (such as 2021), a one percent decrease in our assumption for LTD claim termination rates would increase our reserves by $10. For all incurral years combined, as of December 31, 2021, a one percent decrease in our assumption for our LTD claim
73
Part II - Item 7. Management's Discussion and Analysis of Financial Condition and Results of Operations
termination rates would increase our Group Benefits unpaid losses and loss adjustment expense reserves by $23.
Impact of COVID-19 on 2021 Results of Operations
Within Group Benefits, the Company experienced excess mortality in its group life business of $583 in 2021, primarily caused by direct and indirect impacts of COVID-19. Within the group disability business, in 2021 the Company recognized $31 of COVID-19 related losses from short-term disability claims.
Current Trends Contributing to Reserve Uncertainty
While we have not seen a significant change in claim recovery patterns to date due to COVID-19, we have observed delays in
the Social Security Administration’s processing of disability claims. Other potential pandemic-related risks, such as delays in medical care or return-to-work and the emerging risk of long-COVID symptoms are being monitored. Also, due to the effects on the economy, we could experience an increase in claim incidence on long-term disability claims.
We hedge our interest rate exposure over a three year period at the time we price and sell long-term disability policies and our weighted average discount rate assumption for the 2021 incurral year is down slightly from that of the 2020 incurral year.
|EVALUATION OF GOODWILL FOR IMPAIRMENT
Goodwill balances are reviewed for impairment at least annually, or more frequently if events occur or circumstances change that would indicate that a triggering event for a potential impairment has occurred. The recognition and measurement of goodwill impairment is based on the excess of the carrying value of the reporting unit over its estimated fair value, up to the amount of the reporting unit’s goodwill.
The estimated fair value of each reporting unit incorporates multiple inputs into discounted cash flow calculations including assumptions that market participants would make in valuing the reporting unit. Assumptions include levels of economic capital, future business growth, earnings projections, assets under management for Hartford Funds and the weighted average cost of capital used for purposes of discounting. Decreases in business growth, decreases in earnings projections and increases in the weighted average cost of capital will all cause a reporting unit’s fair value to decrease, increasing the possibility of impairment.
A reporting unit is defined as an operating segment or one level below an operating segment. The Company’s reporting units for which goodwill has been allocated consist of Commercial Lines, Personal Lines, Group Benefits and Hartford Funds.
The carrying value of goodwill was $1,911 as of December 31, 2021 and was comprised of $659 for Commercial Lines, $119 for Personal Lines, $861 for Group Benefits, and $272 for Hartford Funds.
The annual goodwill assessment for the reporting units was completed as of October 31, 2021, and resulted in no write-downs of goodwill for the year ended December 31, 2021. All reporting units passed the annual impairment test with a significant margin. For information regarding the 2021 and 2020 impairment tests see Note 11 - Goodwill & Other Intangible Assets of Notes to Consolidated Financial Statements.
|VALUATION OF INVESTMENTS AND DERIVATIVE INSTRUMENTS
Fixed Maturities, Equity Securities, Short-term Investments, and Derivatives
The Company generally determines fair values using valuation techniques that use prices, rates, and other relevant information evident from market transactions involving identical or similar instruments. Valuation techniques also include, where appropriate, estimates of future cash flows that are converted into a single discounted amount using current market expectations. The Company uses a "waterfall" approach comprised of the following pricing sources which are listed in priority order: quoted prices, prices from third-party pricing services, internal matrix pricing, and independent broker quotes. The fair value of derivative instruments is determined primarily using a discounted cash flow model or option model technique and incorporate counterparty credit risk. In some cases, quoted market prices for exchange-traded transactions and transactions cleared through central clearing houses ("OTC-cleared") may be used and in other cases independent broker quotes may be
used. For further discussion, see the Fixed Maturities, Equity Securities, Short-term Investments and Derivatives section in Note 5 - Fair Value Measurements of Notes to Consolidated Financial Statements.
Evaluation of Credit Losses on Fixed Maturities, AFS and ACL on Mortgage Loans
Each quarter, a committee of investment and accounting professionals evaluates investments to determine if a credit loss is present for fixed maturities, AFS or an ACL is required for mortgage loans. This evaluation is a quantitative and qualitative process, which is subject to risks and uncertainties. For further discussion of the accounting policies, see the Significant Investment Accounting Policies Section in Note 1 - Basis of Presentation and Significant Accounting Policies of Notes to Consolidated Financial Statements. For a discussion of credit losses recorded, see the Credit Losses on Fixed Maturities, AFS and Intent-to-Sell Impairments and ACL on Mortgage Loans
74
Part II - Item 7. Management's Discussion and Analysis of Financial Condition and Results of Operations
sections within the Investment Portfolio Risks and Risk Management section of the MD&A.
|CONTINGENCIES RELATING TO CORPORATE LITIGATION AND REGULATORY MATTERS
Management evaluates each contingent matter separately. A loss is recorded if probable and reasonably estimable. Management establishes reserves for these contingencies at its “best estimate,” or, if no one number within the range of possible losses is more probable than any other, the Company records an estimated reserve at the low end of the range of losses.
The Company has a quarterly monitoring process involving legal and accounting professionals. Legal personnel first identify outstanding corporate litigation and regulatory matters posing a reasonable possibility of loss. These matters are then jointly reviewed by accounting and legal personnel to evaluate the facts and changes since the last review in order to determine if a provision for loss should be recorded or adjusted, the amount that should be recorded, and the appropriate disclosure. The outcomes of certain contingencies currently being evaluated by
the Company, which relate to corporate litigation and regulatory matters, are inherently difficult to predict, and the reserves that have been established for the estimated settlement amounts are subject to significant changes. Management expects that the ultimate liability, if any, with respect to such lawsuits, after consideration of provisions made for estimated losses, will not be material to the consolidated financial condition of the Company. In view of the uncertainties regarding the outcome of these matters, as well as the tax-deductibility of payments, it is possible that the ultimate cost to the Company of these matters could exceed the reserve by an amount that would have a material adverse effect on the Company’s consolidated results of operations and liquidity in a particular quarterly or annual period.
75
Part II - Item 7. Management's Discussion and Analysis of Financial Condition and Results of Operations
| SEGMENT OPERATING SUMMARIES | ||
|COMMERCIAL LINES - RESULTS OF OPERATIONS | ||
Underwriting Summary
| 2021 | 2020 | 2019 | Increase (Decrease) From 2020 to 2021 | Increase (Decrease) From 2019 to 2020 | |||||||||||||
| Written premiums | $ | 10,041 | $ | 8,969 | $ | 8,452 | 12 | % | 6 | % | |||||||
| Change in unearned premium reserve | 500 | 59 | 162 | NM | (64 | %) | |||||||||||
| Earned premiums | 9,541 | 8,910 | 8,290 | 7 | % | 7 | % | ||||||||||
| Fee income | 34 | 30 | 35 | 13 | % | (14 | %) | ||||||||||
| Losses and loss adjustment expenses | |||||||||||||||||
| Current accident year before catastrophes | 5,407 | 5,488 | 4,913 | (1 | %) | 12 | % | ||||||||||
| Current accident year catastrophes [1] | 496 | 397 | 323 | 25 | % | 23 | % | ||||||||||
| Prior accident year development [1] | 141 | 44 | (44) | NM | NM | ||||||||||||
| Total losses and loss adjustment expenses | 6,044 | 5,929 | 5,192 | 2 | % | 14 | % | ||||||||||
| Amortization of DAC | 1,398 | 1,397 | 1,296 | — | % | 8 | % | ||||||||||
| Underwriting expenses | 1,678 | 1,594 | 1,600 | 5 | % | — | % | ||||||||||
| Amortization of other intangible assets | 29 | 28 | 18 | 4 | % | 56 | % | ||||||||||
| Dividends to policyholders | 24 | 29 | 30 | (17 | %) | (3 | %) | ||||||||||
| Underwriting gain (loss) | 402 | (37) | 189 | NM | (120 | %) | |||||||||||
| Net servicing income | 13 | 4 | 2 | NM | 100 | % | |||||||||||
| Net investment income [2] | 1,502 | 1,160 | 1,129 | 29 | % | 3 | % | ||||||||||
| Net realized gains (losses) [2] | 260 | (60) | 271 | NM | (122 | %) | |||||||||||
| Loss on reinsurance transaction | — | — | (91) | — | % | 100 | % | ||||||||||
| Other (expenses) | (18) | (35) | (38) | 49 | % | 8 | % | ||||||||||
| Income before income taxes | 2,159 | 1,032 | 1,462 | 109 | % | (29 | %) | ||||||||||
| Income tax expense [3] | 402 | 176 | 270 | 128 | % | (35 | %) | ||||||||||
| Net income | $ | 1,757 | $ | 856 | $ | 1,192 | 105 | % | (28 | %) | |||||||
[1]For additional information on current accident year catastrophes and prior accident year development, see MD&A - Critical Accounting Estimates, Property and Casualty Insurance Product Reserves Development, Net of Reinsurance and Note 12- Reserve for Unpaid Losses and Loss Adjustment Expenses of Notes to Consolidated Financial Statements.
[2]For discussion of consolidated investment results, see MD&A - Investment Results.
[3]For discussion of income taxes, see Note 17 - Income Taxes of Notes to Consolidated Financial Statements.
76
Part II - Item 7. Management's Discussion and Analysis of Financial Condition and Results of Operations
Premium Measures
| 2021 | 2020 | 2019 | ||||||||||||
| Small Commercial: | ||||||||||||||
| Net new business premium | $ | 673 | $ | 557 | $ | 646 | ||||||||
| Policy count retention [1] | 84 | % | 83 | % | 82 | % | ||||||||
| Policy count retention, net of cancellations [1] | 87 | % | 84 | % | 83 | % | ||||||||
| Renewal written price increases | 3.0 | % | 2.0 | % | 1.7 | % | ||||||||
| Renewal earned price increases | 2.6 | % | 2.1 | % | 1.9 | % | ||||||||
| Policies in-force as of end of period (in thousands) | 1,366 | 1,283 | 1,291 | |||||||||||
| Middle Market [2]: | ||||||||||||||
| Net new business premium | $ | 532 | $ | 479 | $ | 584 | ||||||||
| Policy count retention [1] | 82 | % | 78 | % | 81 | % | ||||||||
| Policy count retention, net of cancellations [1] | 83 | % | 78 | % | 81 | % | ||||||||
| Renewal written price increases | 6.0 | % | 7.7 | % | 3.9 | % | ||||||||
| Renewal earned price increases | 7.3 | % | 6.5 | % | 2.8 | % | ||||||||
| Global Specialty: | ||||||||||||||
| Global specialty gross new business premium [3] | $ | 912 | $ | 752 | ||||||||||
| U.S. global specialty renewal written price increases | 11.5 | % | 17.3 | % | ||||||||||
| U.S. global specialty renewal earned price increases | 16.6 | % | 13.0 | % | ||||||||||
| International global specialty renewal written price increases [4] | 19.6 | % | 41.8 | % | ||||||||||
| International global specialty renewal earned price increases [4] | 42.8 | % | 41.3 | % | ||||||||||
[1]Policy count retention represents the ratio of the number of renewal policies issued during the current year period divided by the number of policies issued in the previous calendar year period before considering policies cancelled subsequent to renewal. Policy count retention, net of cancellations, represents the ratio of the number of renewal policies issued net of cancellations during the current year period divided by the number of policies issued net of cancellations in the previous calendar year period.
[2]Except for net new business premium, metrics for middle market exclude loss sensitive and programs businesses.
[3]Excludes Global Re and Continental Europe Operations and is before ceded reinsurance.
[4]Excludes offshore energy policies, political violence and terrorism policies, and any business under which the managing agent of our Lloyd's Syndicate delegates underwriting authority to coverholders and other third parties.
Underwriting Ratios
| 2021 | 2020 | 2019 | Increase (Decrease) From 2020 to 2021 | Increase (Decrease) From 2019 to 2020 | |||||||||||||
| Loss and loss adjustment expense ratio | |||||||||||||||||
| Current accident year before catastrophes | 56.7 | 61.6 | 59.3 | (4.9) | 2.3 | ||||||||||||
| Current accident year catastrophes | 5.2 | 4.5 | 3.9 | 0.7 | 0.6 | ||||||||||||
| Prior accident year development | 1.5 | 0.5 | (0.5) | 1.0 | 1.0 | ||||||||||||
| Total loss and loss adjustment expense ratio | 63.3 | 66.5 | 62.6 | (3.2) | 3.9 | ||||||||||||
| Expense ratio | 32.2 | 33.5 | 34.7 | (1.3) | (1.2) | ||||||||||||
| Policyholder dividend ratio | 0.3 | 0.3 | 0.4 | — | (0.1) | ||||||||||||
| Combined ratio | 95.8 | 100.4 | 97.7 | (4.6) | 2.7 | ||||||||||||
| Impact of current accident year catastrophes and prior year development | (6.7) | (5.0) | (3.4) | (1.7) | (1.6) | ||||||||||||
| Impact of current accident year change in loss reserves upon acquisition of a business [1] | — | — | (0.3) | — | 0.3 | ||||||||||||
| Underlying combined ratio | 89.1 | 95.5 | 94.0 | (6.4) | 1.5 | ||||||||||||
[1]Upon acquisition of Navigators Group and a review of Navigators Insurers reserves, the year ended December 31, 2019 included $68 of prior accident year reserve increases and $29 of current accident year reserve increases which were excluded for the purposes of the underlying combined ratio calculation.
77
Part II - Item 7. Management's Discussion and Analysis of Financial Condition and Results of Operations
Net Income
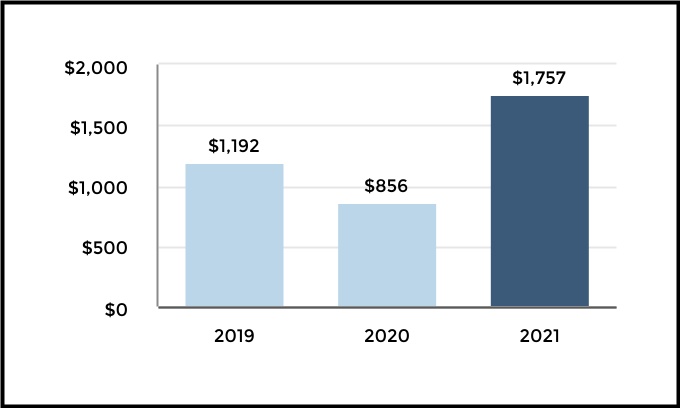
Year ended December 31, 2021 compared to the year ended December 31, 2020
Net income increased primarily due to a change from an underwriting loss to an underwriting gain, higher net investment income and a change from net realized losses to net realized gains. For further discussion of investment results, see MD&A - Investment Results.
Underwriting Gain (Loss)
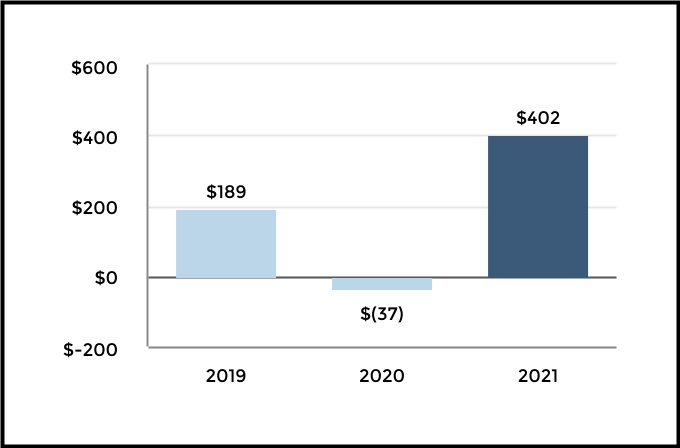
Year ended December 31, 2021 compared to the year ended December 31, 2020
Underwriting gain in 2021 compared with an underwriting loss in 2020 with the improvement primarily due to lower current accident year losses before catastrophes, partially offset by higher net unfavorable prior accident year development and higher current accident year catastrophes. The decrease in current accident year losses before catastrophes was primarily driven by $278 before tax of COVID-19 incurred losses in 2020 compared with $31 before tax of COVID-19 incurred losses in 2021, partially offset by the impact of higher earned premium on incurred losses. Underwriting expenses increased due to higher contingent and supplemental commissions, incentive compensation, technology costs and marketing expenses, partially offset by a decrease in the allowance for credit losses on premiums receivable in the 2021 period compared to an increase in the 2020 period and savings from Hartford Next initiatives.
Earned Premiums
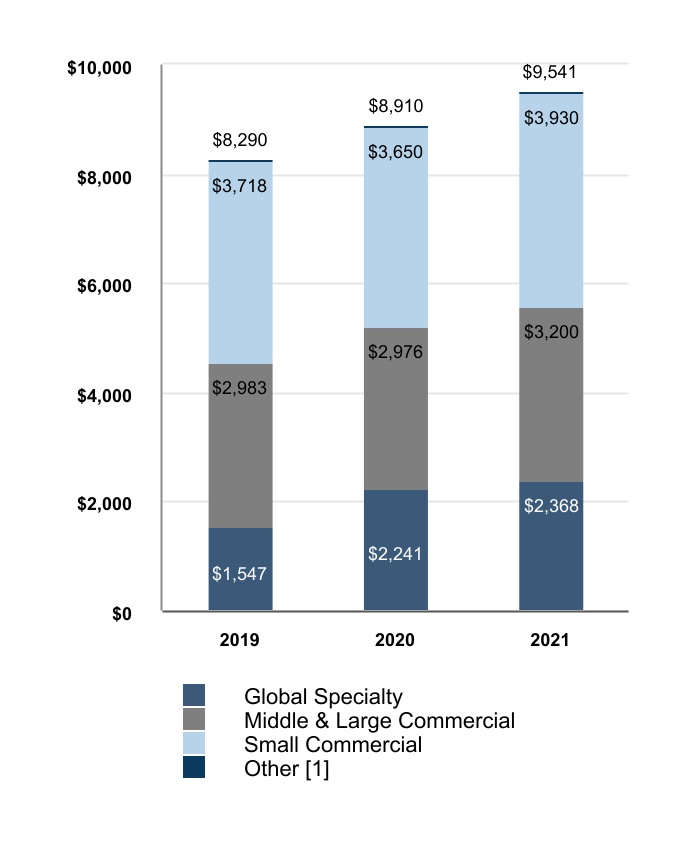
[1]Other of $42, $43 and $43 for 2019, 2020 and 2021, respectively, is included in the total.
Written Premiums

[1]Other written premiums of $41, $41 and $43 for the year ended December 31, 2019, 2020 and 2021, respectively, is included in the total.
78
Part II - Item 7. Management's Discussion and Analysis of Financial Condition and Results of Operations
Year ended December 31, 2021 compared to the year ended December 31, 2020
Earned premiums increased in 2021 due to written premium increases over the prior 12 months as well as due to higher premiums from audits and endorsements, principally in workers’ compensation due to an increasing exposure base from higher payrolls as the economy recovers from the pandemic.
Written premiums increased in 2021 driven by growth in small commercial, middle & large commercial and global specialty across most lines of business.
The Company recognized renewal written pricing increases in all lines in 2021, with moderating price increases across most lines in middle market and global specialty. In global specialty, our U.S. wholesale book achieved an approximate 16% renewal written price increase, led by excess casualty. Global specialty international lines achieved a nearly 20% price increase, led by D&O. In small commercial, renewal written price increases were higher in 2021 than 2020, with workers' compensation pricing slightly positive in 2021 due to rising wages, along with mid-single digit increases in most other lines. In middle market, the Company recognized high single-digit to low double-digit rate increases in most middle market lines other than workers’ compensation, which experienced low single-digit written pricing increases.
Written premium increased across all three lines of business.
•Small commercial written premium increased in 2021 driven by exposure growth from higher audit and endorsement premium, higher policy count retention, renewal written pricing increases in all lines as well as new business growth. Written premium grew in all lines of business, with the most significant growth in package business and workers’ compensation.
•Middle & large commercial written premium increased in 2021 driven by exposure growth from higher audit and endorsement premium, improved retention, renewal written pricing increases in all lines as well as new business growth. Written premium grew in most lines of business, including general industries, national accounts, complex liability solutions and specialized industries.
•Global specialty written premium increased in 2021 driven by continued strong written pricing increases, higher retention and growth in gross new written premium. Written premium grew in all lines except international, with the most significant growth in U.S. wholesale, financial lines and global reinsurance.
Current Accident Year Loss and LAE Ratio before Catastrophes
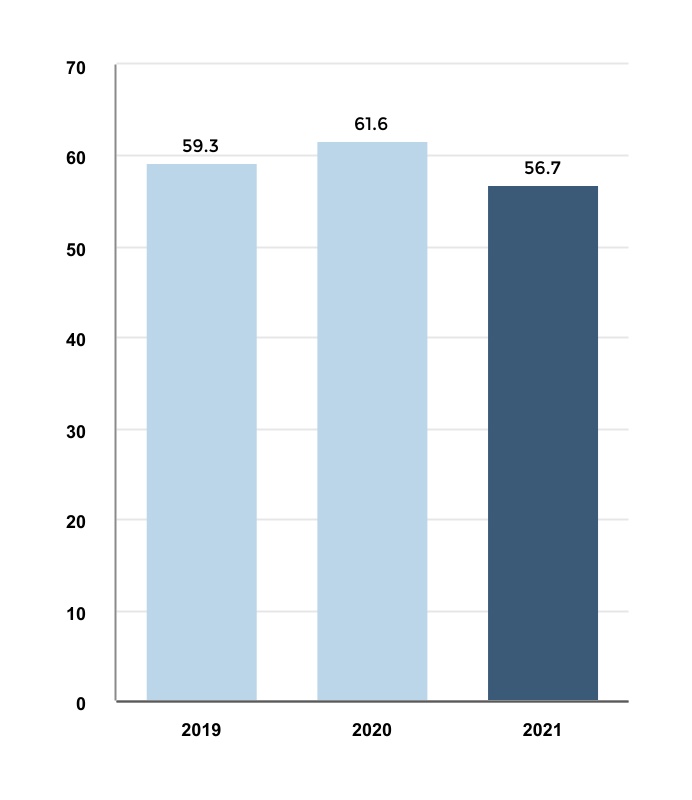
Year ended December 31, 2021 compared to the year ended December 31, 2020
Current Accident Year Loss and LAE ratio before catastrophes decreased in 2021 primarily due to lower COVID-19 incurred losses in 2021 as well as due to lower loss ratios in global specialty and workers’ compensation. The lower loss ratios in global specialty were largely the result of rate and underwriting actions to improve profitability in those lines and was driven by U.S. financial lines, global reinsurance, U.S. wholesale and international.
2021 included COVID-19 incurred losses of $31 before tax, including losses of $20 in workers’ compensation and $11 in financial and other lines. 2020 included COVID-19 incurred losses of $278 before tax, including losses of $141 in property, $66 in workers’ compensation, net of favorable frequency on other workers' compensation claims, and $71 in financial and other lines.
Included in the $141 of COVID-19 property incurred losses and loss adjustment expenses in 2020 were $101 of losses arising from a small number of property policies that do not require direct physical loss or damage and from policies intended to cover specific business needs, including crisis management and performance disruption as well as a reserve of $40 for legal defense costs. Workers’ compensation COVID-19 incurred losses include claims in both states with presumptive coverage and in other states where the claimant must prove their COVID-19 illness was contracted at work. Financial lines COVID-19 claims include exposures in D&O, E&O and employment practices liability and the recessionary impacts on the surety book of business.
79
Part II - Item 7. Management's Discussion and Analysis of Financial Condition and Results of Operations
Catastrophes and Unfavorable (Favorable) Prior Accident Year Development
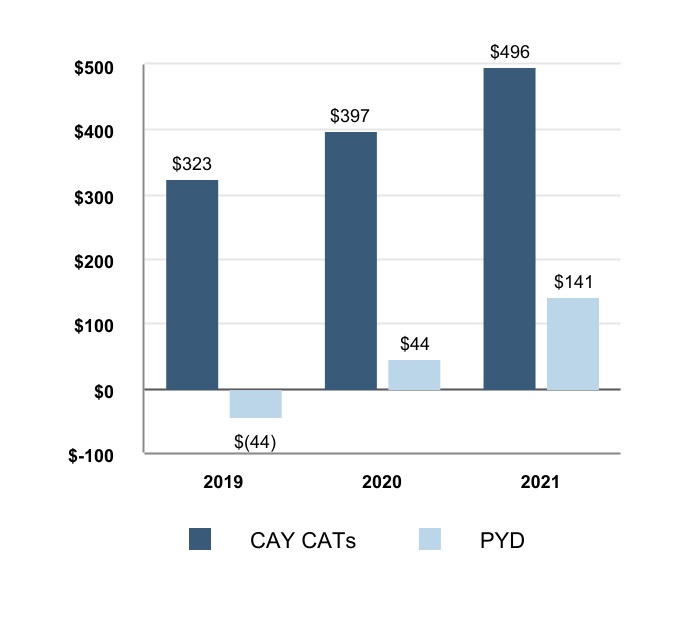
Year ended December 31, 2021 compared to the year ended December 31, 2020
Current accident year catastrophe losses for 2021 included losses from tornado, wind and hail events, mostly concentrated in the Midwest, Texas and Southeast as well as hurricane Ida, and February winter storms primarily in the South.
Current accident year catastrophe losses for 2020 were primarily from civil unrest, a number of hurricanes and tropical storms, Pacific Coast wildfires, and Northeast windstorms as well as tornado, wind and hail events in the South, Midwest and Central Plains.
Prior accident year development was net unfavorable for 2021. Reserve development in 2021 included an increase in general liability that included a reserve increase related to the settlement with Boy Scouts of America on sexual molestation and sexual abuse claims, largely offset by reserve decreases for workers' compensation, package business, catastrophes, commercial property and bond.
Net unfavorable reserve development for 2020 included reserve increases for general liability driven primarily by increases in reserves for sexual molestation and sexual abuse claims, and increases in commercial automobile liability reserves, partially offset by net reserve decreases for catastrophes, workers' compensation and package business. Partially offsetting was
favorable development on prior year catastrophe reserves in 2020 due to recognizing a $29 before tax subrogation benefit from a settlement with PG&E over certain of the 2017 and 2018 California wildfires and a reduction in estimated catastrophe losses from a number of wind and hail events that occurred in 2017, 2018 and 2019.
Prior accident year development in both 2021 and 2020 included reserve increases related to Navigators Group on 2018 and prior accident years that was economically ceded to NICO but for which the benefit was not recognized in earnings as it has been recorded as a deferred gain on retroactive reinsurance.
2022 Outlook
The Company expects Commercial Lines written premiums in 2022 to be 4% to 5% higher than written premiums in 2021, with growth across small commercial, middle & large commercial, and global specialty. In small commercial, policy retention is expected to remain strong with new business growth across all lines of business. In middle & large commercial, we expect written premium growth in our general industries book of business driven by improved retention and new business growth, as well as an increase in new business in specialized industries. In global specialty, premium growth in 2022 is expected primarily in wholesale and financial lines in the U.S., as well as in global reinsurance and international.
In 2022, management expects positive renewal written pricing in most lines, though workers' compensation pricing is expected to be flat to slightly negative. Across the rest of Commercial Lines, mid single-digit rate increases are expected to continue in most lines with written pricing increases in the high single-digits in wholesale and ocean marine. Written pricing increases in 2022 in lines other than workers’ compensation are driven by a number of factors including the effects of social inflation, increased catastrophe losses due to changing weather patterns, and a prolonged low interest rate environment, that puts added pressure on the need for underwriting profits to make up for the lost investment yield.
The Company expects the Commercial Lines combined ratio will be 90.0 to 92.0 in 2022, compared to 95.8 in 2021, primarily due to lower current accident year catastrophe losses expected in 2022, and the effect of a prior accident year reserve increase and COVID-19 incurred claims in 2021. Apart from lower expected COVID-19 claims, we expect earned pricing increases in excess of loss costs in most lines except workers’ compensation, while the expense ratio is expected to improve driven, in part, by additional savings from Hartford Next initiatives. The underlying combined ratio is expected to be 86.5 to 88.5 in 2022 compared to 89.1 in 2021.
80
Part II - Item 7. Management's Discussion and Analysis of Financial Condition and Results of Operations
| PERSONAL LINES - RESULTS OF OPERATIONS | ||
Underwriting Summary
| 2021 | 2020 | 2019 | Increase (Decrease) From 2020 to 2021 | Increase (Decrease) From 2019 to 2020 | |||||||||||||
| Written premiums | $ | 2,908 | $ | 2,936 | $ | 3,131 | (1 | %) | (6 | %) | |||||||
| Change in unearned premium reserve | (46) | (72) | (67) | 36 | % | (7 | %) | ||||||||||
| Earned premiums | 2,954 | 3,008 | 3,198 | (2 | %) | (6 | %) | ||||||||||
| Fee income | 32 | 34 | 37 | (6 | %) | (8 | %) | ||||||||||
| Losses and loss adjustment expenses | |||||||||||||||||
| Current accident year before catastrophes | 1,840 | 1,695 | 2,087 | 9 | % | (19 | %) | ||||||||||
| Current accident year catastrophes [1] | 168 | 209 | 140 | (20 | %) | 49 | % | ||||||||||
| Prior accident year development [1] | (144) | (438) | (42) | 67 | % | NM | |||||||||||
| Total losses and loss adjustment expenses | 1,864 | 1,466 | 2,185 | 27 | % | (33 | %) | ||||||||||
| Amortization of DAC | 230 | 244 | 259 | (6 | %) | (6 | %) | ||||||||||
| Underwriting expenses | 615 | 591 | 625 | 4 | % | (5 | %) | ||||||||||
| Amortization of other intangible assets | 2 | 4 | 6 | (50 | %) | (33 | %) | ||||||||||
| Underwriting gain | 275 | 737 | 160 | (63 | %) | NM | |||||||||||
| Net servicing income [2] | 19 | 14 | 13 | 36 | % | 8 | % | ||||||||||
| Net investment income [3] | 157 | 157 | 179 | — | % | (12 | %) | ||||||||||
| Net realized gains (losses) [3] | 29 | (5) | 43 | NM | (112 | %) | |||||||||||
| Other income (expenses) | — | (1) | (1) | 100 | % | — | % | ||||||||||
| Income before income taxes | 480 | 902 | 394 | (47 | %) | 129 | % | ||||||||||
| Income tax expense [4] | 95 | 184 | 76 | (48 | %) | 142 | % | ||||||||||
| Net income | $ | 385 | $ | 718 | $ | 318 | (46 | %) | 126 | % | |||||||
[1]For discussion of current accident year catastrophes and prior accident year development, see MD&A - Critical Accounting Estimates, Property and Casualty Insurance Product Reserves, Net of Reinsurance and Note 12 - Reserve for Unpaid Losses and Loss Adjustment Expenses.
[2]Includes servicing revenues of $80, $81, and $83 for 2021, 2020, and 2019, respectively and includes servicing expenses of $61, $67, and $70 for 2021, 2020, and 2019, respectively.
[3]For discussion of consolidated investment results, see MD&A - Investment Results.
[4]For discussion of income taxes, see Note 17 - Income Taxes of Notes to Consolidated Financial Statements.
Written and Earned Premiums
| Written Premiums | 2021 | 2020 | 2019 | Increase (Decrease) From 2020 to 2021 | Increase (Decrease) From 2019 to 2020 | ||||||||||||
| Product Line | |||||||||||||||||
| Automobile | $ | 1,997 | $ | 2,003 | $ | 2,176 | — | % | (8 | %) | |||||||
| Homeowners | 911 | 933 | 955 | (2 | %) | (2 | %) | ||||||||||
| Total | $ | 2,908 | $ | 2,936 | $ | 3,131 | (1 | %) | (6 | %) | |||||||
| Earned Premiums | |||||||||||||||||
| Product Line | |||||||||||||||||
| Automobile | $ | 2,035 | $ | 2,058 | $ | 2,221 | (1 | %) | (7 | %) | |||||||
| Homeowners | 919 | 950 | 977 | (3 | %) | (3 | %) | ||||||||||
| Total | $ | 2,954 | $ | 3,008 | $ | 3,198 | (2 | %) | (6 | %) | |||||||
81
Part II - Item 7. Management's Discussion and Analysis of Financial Condition and Results of Operations
Premium Measures
| 2021 | 2020 | 2019 | |||||||||||||||
| Policies in-force end of period (in thousands) | |||||||||||||||||
| Automobile | 1,317 | 1,369 | 1,422 | ||||||||||||||
| Homeowners | 773 | 826 | 877 | ||||||||||||||
| New business written premium | |||||||||||||||||
| Automobile | $ | 219 | $ | 223 | $ | 220 | |||||||||||
| Homeowners | $ | 60 | $ | 63 | $ | 73 | |||||||||||
| Policy count retention [1] | |||||||||||||||||
| Automobile | 84 | % | 84 | % | 83 | % | |||||||||||
| Homeowners | 85 | % | 84 | % | 83 | % | |||||||||||
| Policy count retention, net of cancellations [1] | |||||||||||||||||
| Automobile | 84 | % | 86 | % | 85 | % | |||||||||||
| Homeowners | 84 | % | 86 | % | 85 | % | |||||||||||
| Renewal written price increase | |||||||||||||||||
| Automobile | 2.2 | % | 2.4 | % | 4.6 | % | |||||||||||
| Homeowners | 8.5 | % | 6.4 | % | 6.5 | % | |||||||||||
| Renewal earned price increase | |||||||||||||||||
| Automobile | 2.1 | % | 3.4 | % | 5.5 | % | |||||||||||
| Homeowners | 8.1 | % | 5.7 | % | 8.4 | % | |||||||||||
[1]Policy count retention represents the ratio of the number of renewal policies issued during the current year period divided by the number of policies issued in the previous calendar period before considering policies cancelled subsequent to renewal. Policy count retention, net of cancellations, represents the ratio of the number of renewal policies issued net of cancellations during the current year period divided by the number of policies issued net of cancellations in the previous calendar period.
Underwriting Ratios
| 2021 | 2020 | 2019 | Increase (Decrease) From 2020 to 2021 | Increase (Decrease) From 2019 to 2020 | |||||||||||||
| Loss and loss adjustment expense ratio | |||||||||||||||||
| Current accident year before catastrophes | 62.3 | 56.3 | 65.3 | 6.0 | (9.0) | ||||||||||||
| Current accident year catastrophes | 5.7 | 6.9 | 4.4 | (1.2) | 2.5 | ||||||||||||
| Prior accident year development | (4.9) | (14.6) | (1.3) | 9.7 | (13.3) | ||||||||||||
| Total loss and loss adjustment expense ratio | 63.1 | 48.7 | 68.3 | 14.4 | (19.6) | ||||||||||||
| Expense ratio | 27.6 | 26.8 | 26.7 | 0.8 | 0.1 | ||||||||||||
| Combined ratio | 90.7 | 75.5 | 95.0 | 15.2 | (19.5) | ||||||||||||
| Impact of current accident year catastrophes and prior year development | (0.8) | 7.7 | (3.1) | (8.5) | 10.8 | ||||||||||||
| Underlying combined ratio | 89.9 | 83.1 | 91.9 | 6.8 | (8.8) | ||||||||||||
Product Combined Ratios
| 2021 | 2020 | 2019 | Increase (Decrease) From 2020 to 2021 | Increase (Decrease) From 2019 to 2020 | |||||||||||||
| Automobile | |||||||||||||||||
| Combined ratio | 92.9 | 85.5 | 96.6 | 7.4 | (11.1) | ||||||||||||
| Underlying combined ratio | 95.9 | 88.0 | 97.9 | 7.9 | (9.9) | ||||||||||||
| Homeowners | |||||||||||||||||
| Combined ratio | 86.8 | 54.2 | 91.7 | 32.6 | (37.5) | ||||||||||||
| Underlying combined ratio | 76.5 | 72.5 | 78.3 | 4.0 | (5.8) | ||||||||||||
82
Part II - Item 7. Management's Discussion and Analysis of Financial Condition and Results of Operations
Net Income
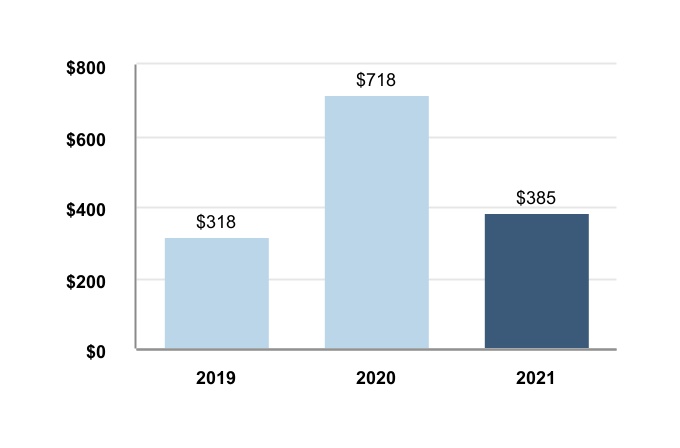
Year ended December 31, 2021 compared to the year ended December 31, 2020
Net income decreased in 2021, largely driven by a decrease in underwriting gain, partially offset by a change from net realized losses to net realized gains and an increase in net servicing income.
Underwriting Gain
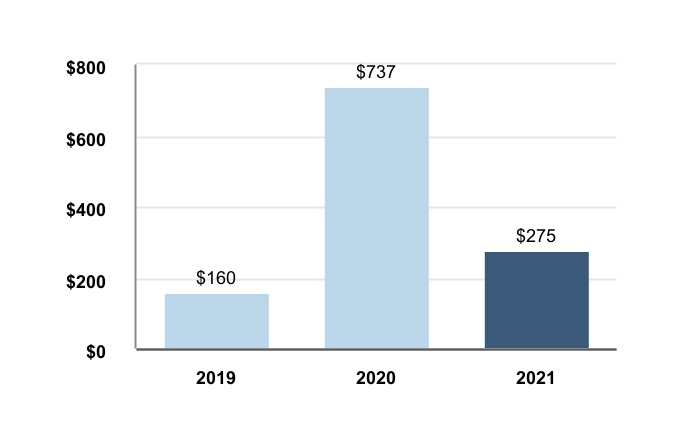
Year ended December 31, 2021 compared to the year ended December 31, 2020
Underwriting gain decreased in 2021, primarily due to a decrease in favorable prior accident year catastrophe reserve development and higher current accident year personal automobile loss costs. Also contributing was an increase in underwriting expenses and higher current accident year non-catastrophe property losses, partially offset by lower current accident year catastrophe losses. Contributing to the increase in underwriting expenses in 2021 was higher costs for AARP direct marketing, incentive compensation, and technology, partially offset by cost savings from the Hartford Next initiative.
Earned Premiums
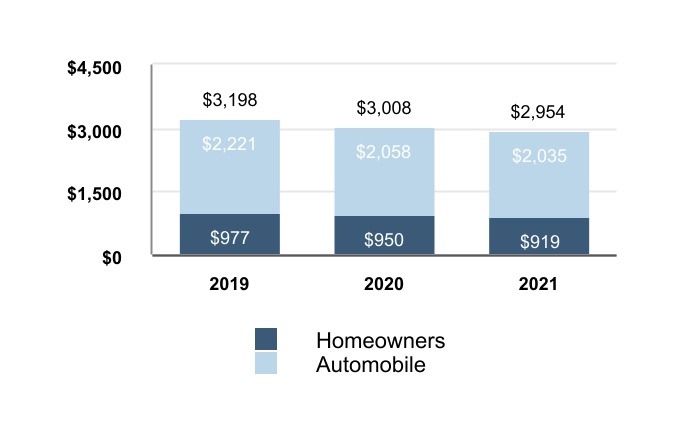
Year ended December 31, 2021 compared to the year ended December 31, 2020
Earned premiums decreased in 2021 due to the effect of a decline in written premium over the prior twelve months in both Agency channels and in AARP Direct due to non-renewals exceeding new business. The decrease was partially offset by the effect of $81 of premium credits given to automobile policyholders in the second quarter of 2020 in recognition of shelter-in-place guidelines that reduced miles driven in 2020.
Written Premiums
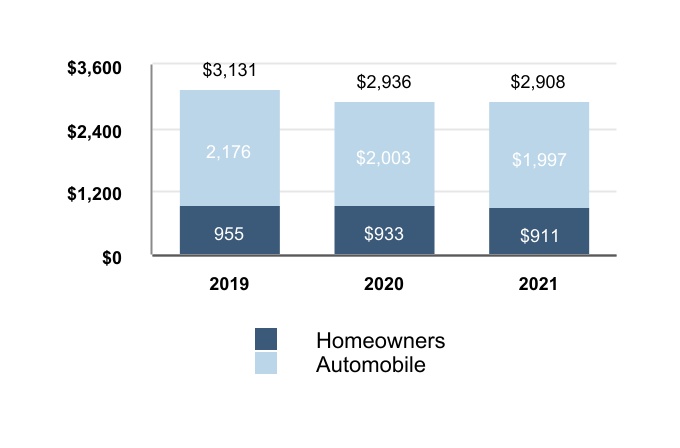
Written premiums decreased in automobile for 2021 due to the effect of non-renewed premium exceeding new business, partially offset by the effect of the premium credits given in the 2020 period. Written premium declined in homeowners due to the effect of non-renewed premium exceeding new business. For automobile and homeowners new business decreased in 2021 compared to the prior year.
Renewal written pricing increases were down modestly in automobile for 2021 while renewal written pricing increases for homeowners were higher in 2021 in response to recent loss cost trends.
Policy count retention was flat for automobile and was up slightly for homeowners.
Policies in-force decreased in the 2021 period in both automobile and homeowners driven by not generating enough new business to offset the loss of non-renewed policies.
83
Part II - Item 7. Management's Discussion and Analysis of Financial Condition and Results of Operations
Current Accident Year Loss and Loss Adjustment Expense Ratio before Catastrophes
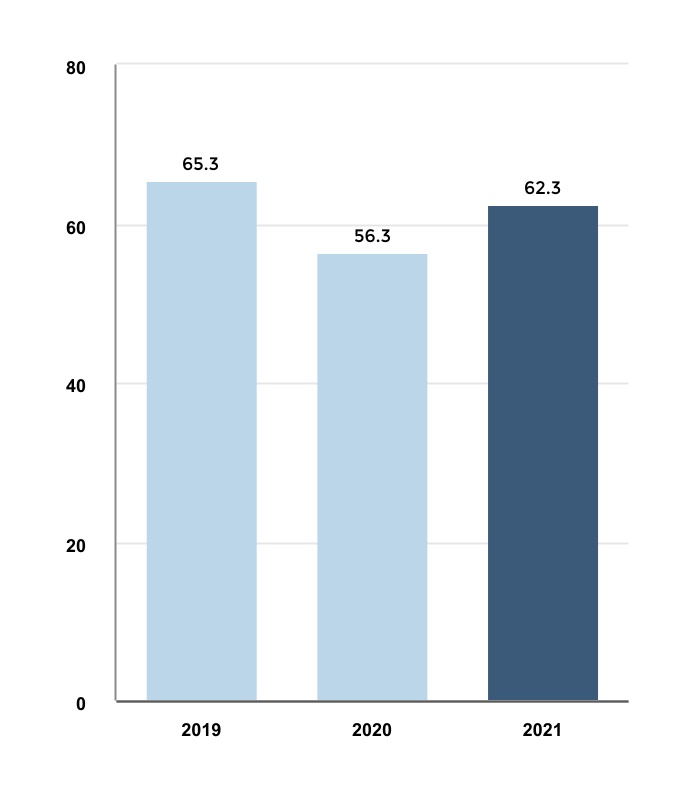
Year ended December 31, 2021 compared to the year ended December 31, 2020
Current accident year loss and LAE ratio before catastrophes increased in 2021 by 7.1 points in automobile and 3.1 points in homeowners. The increase in automobile was due to higher claim frequency, due to an increase in miles driven, and an increase in average claim severity. For 2021, the homeowners current accident year loss and LAE ratio before catastrophes increased due to an increase in weather and non-weather severity, partially offset by the effect of earned pricing increases. Contributing to the increase in homeowners severity was the effect of higher rebuilding costs and a greater number of large losses.
Current Accident Year Catastrophes and Unfavorable (Favorable) Prior Accident Year Development
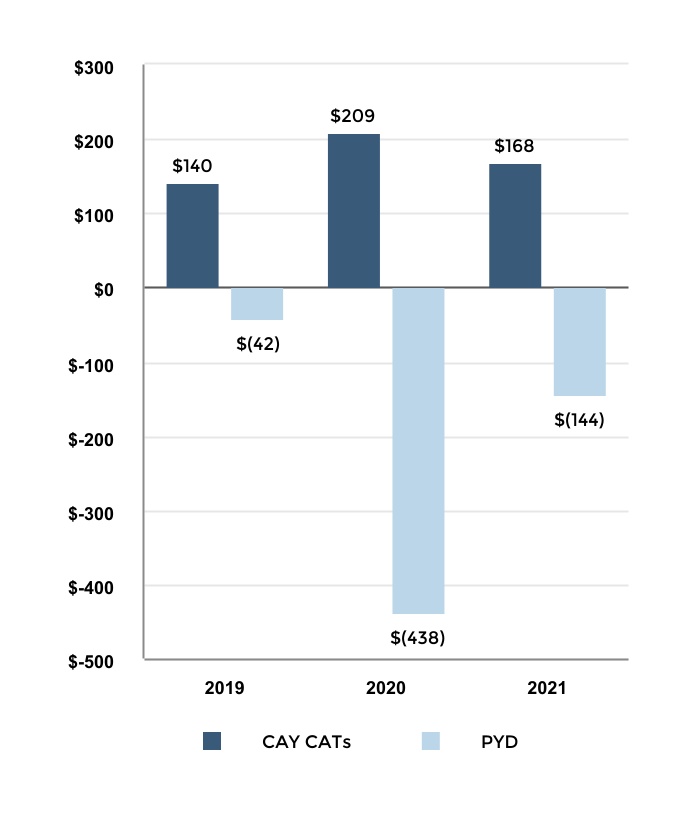
Year ended December 31, 2021 compared to the year ended December 31, 2020
Current accident year catastrophe losses decreased in 2021 compared to the prior year. Current accident year catastrophe losses for 2021 included losses from hurricane Ida, tropical storms, California wildfires, and February winter storms as well as losses largely from tornado, wind and hail events, mostly concentrated in Texas, the Southeast, Midwest and Mountain West.
Current accident year catastrophe losses for 2020 were primarily from Pacific Coast wildfires, tropical storm Isaias, hurricane Laura, and various tornado, wind and hail events in the South, Midwest and Central Plains.
Prior accident year development was less favorable in 2021, with the decrease largely due to lower reserve reductions for prior year catastrophes. Prior accident year development was favorable in 2021, with a reduction in personal automobile liability and a decrease in catastrophe reserves, driven by reductions in estimates for prior year hurricanes, tornado & hail and wildfires, including the benefit of higher expected subrogation recoveries related to the 2017 and 2018 California wildfires. Prior accident year development was favorable in 2020 with reserve reductions in catastrophes and, to a lesser extent, personal automobile liability. The reduction in catastrophe reserves for 2020 was driven by lower estimated losses for the 2017 and 2018 California wildfires, including a $260 subrogation benefit from PG&E, as well as a reduction in losses for various 2018 and 2019 wind and hail events.
84
Part II - Item 7. Management's Discussion and Analysis of Financial Condition and Results of Operations
2022 Outlook
Written premium is expected to decrease in 2022 compared with 2021 as non-renewal of premium more than offsets new business. While new business conversions are expected to increase with the continued rollout of the Prevail automobile and home product in additional states, new business premium is expected to be lower despite expected higher conversion rates as the Company transitions from 12-month automobile policies to 6-month automobile policies for AARP members.
In 2022, the Company expects written pricing increases in automobile to be in the low to mid-single digits throughout the year as the effect of recent claim frequency and severity trends are reflected in rate filings. Written pricing increases in homeowners are expected to be in the mid-to-high single digits.
The Company expects the combined ratio for Personal Lines will be 97.0 to 99.0 in 2022 compared to 90.7 in 2021 as 2021
benefited from claim frequency that was still below pre-pandemic levels as well as from lower current accident year catastrophe losses and favorable prior accident year development. The underlying combined ratio for Personal Lines is expected to be 90.0 to 92.0 in 2022 compared to 89.9 in 2021 due to an increase in the current accident year loss and loss adjustment expense ratio before catastrophes in both automobile and homeowners with supply chain disruptions causing an increase in severity through 2022. For automobile, we expect the underlying combined ratio to increase driven by an increase in both claim frequency and severity. The underlying combined ratio for homeowners is also expected to increase in 2022, primarily driven by a return to a higher, more normal, level of non-catastrophe weather loss experience, partially offset by the effect of earned pricing increases.
| PROPERTY & CASUALTY OTHER OPERATIONS - RESULTS OF OPERATIONS | ||
Underwriting Summary
| 2021 | 2020 | 2019 | Increase (Decrease) From 2020 to 2021 | Increase (Decrease) From 2019 to 2020 | |||||||||||||
| Change in unearned premium reserve | $ | — | $ | — | $ | (2) | — | % | 100 | % | |||||||
| Earned premiums | — | — | 2 | — | % | (100 | %) | ||||||||||
| Losses and loss adjustment expenses | |||||||||||||||||
| Prior accident year development [1] | 202 | 258 | 21 | (22 | %) | NM | |||||||||||
| Total losses and loss adjustment expenses | 202 | 258 | 21 | (22 | %) | NM | |||||||||||
| Underwriting expenses | 8 | 11 | 12 | (27 | %) | (8 | %) | ||||||||||
| Underwriting loss | (210) | (269) | (31) | 22 | % | NM | |||||||||||
| Net investment income [2] | 75 | 55 | 84 | 36 | % | (35 | %) | ||||||||||
| Net realized gains (losses) [2] | 13 | (1) | 20 | NM | (105 | %) | |||||||||||
| Other income (expenses) | (1) | 1 | — | NM | NM | ||||||||||||
| Income (loss) before income taxes | (123) | (214) | 73 | 43 | % | NM | |||||||||||
| Income tax expense (benefit) [3] | (28) | (46) | 12 | 39 | % | NM | |||||||||||
| Net income (loss) | $ | (95) | $ | (168) | $ | 61 | 43 | % | NM | ||||||||
[1]For discussion of prior accident year development, see MD&A - Critical Accounting Estimates, Property and Casualty Insurance Product Reserves, Net of Reinsurance and Note 12 - Reserve for Unpaid Losses and Loss Adjustment Expenses of Notes to Consolidated Financial Statements.
[2]For discussion of consolidated investment results, see MD&A - Investment Results.
[3]For discussion of income taxes, see Note 17 - Income Taxes of Notes to Consolidated Financial Statements.
85
Part II - Item 7. Management's Discussion and Analysis of Financial Condition and Results of Operations
Net Income (Loss)
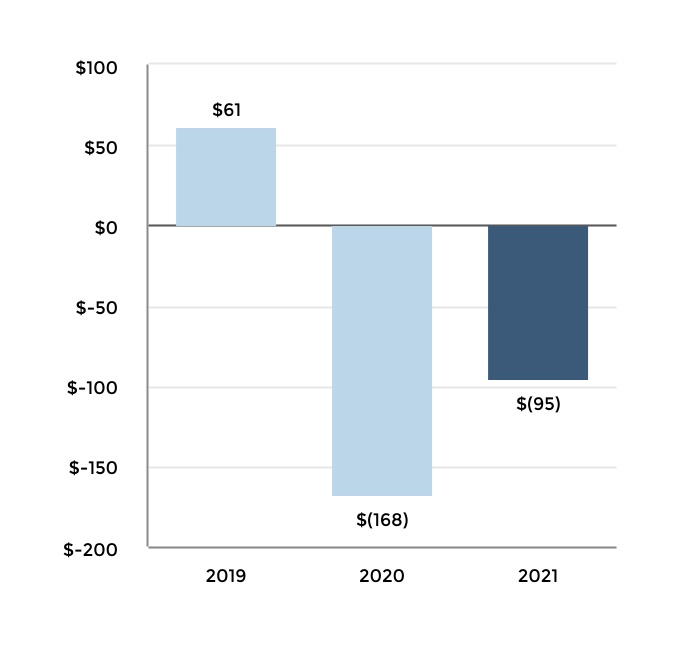
Year ended December 31, 2021 compared to the year ended December 31, 2020
Net loss in 2021 decreased compared to 2020, primarily due to lower unfavorable prior accident year reserve development, higher net investment income and a change from net realized losses to net realized gains.
Underwriting loss in 2021 decreased from 2020 primarily due to a lower increase in A&E reserves. Unfavorable prior
accident year development in 2021 included a $155 increase in A&E reserves, an increase in reserves for sexual molestation and sexual abuse claims, primarily on assumed reinsurance, and a $14 increase in ULAE reserves, partially offset by a reduction in the allowance for uncollectible reinsurance. Unfavorable prior accident year development in 2020 primarily included a $208 increase in A&E reserves, and a $35 increase in ULAE reserves. In both periods, the increase in ULAE reserves was primarily driven by the higher estimate for A&E claims.
Before NICO reinsurance in 2021, A&E reserves were increased by $155 in P&C Other Operations, including $104 for asbestos and $51 for environmental. Cumulative adverse A&E reserve development on both ongoing operations and P&C Other Operations totaled $1,015 through December 31, 2021 and since this amount exceeds ceded premium paid for the A&E ADC of $650, the Company has recognized a $365 deferred gain on retroactive reinsurance as of December 31, 2021, within other liabilities, including a $155 increase in deferred gain in 2021 recognized within P&C Other Operations.
Asbestos reserves prior accident year development in 2021 before NICO reinsurance of $104 was primarily due to an increase in claim settlement rates, claim settlement values, and defense costs, which more than offset the impact of a decline in claim filing frequency. Also contributing was an increase in the Company's estimated share of liability under pending or potential cost sharing agreements and settlements.
Environmental reserves prior accident year development in 2021 before NICO reinsurance of $51 was primarily due to the settlement of a large coal ash remediation claim, an increase in legal defense costs and higher site remediation costs.
|GROUP BENEFITS - RESULTS OF OPERATIONS | ||
Operating Summary
| 2021 | 2020 | 2019 | Increase (Decrease) From 2020 to 2021 | Increase (Decrease) From 2019 to 2020 | |||||||||||||
| Premiums and other considerations | $ | 5,687 | $ | 5,536 | $ | 5,603 | 3 | % | (1 | %) | |||||||
| Net investment income [1] | 550 | 448 | 486 | 23 | % | (8 | %) | ||||||||||
| Net realized gains [1] | 130 | 22 | 34 | NM | (35 | %) | |||||||||||
| Total revenues | 6,367 | 6,006 | 6,123 | 6 | % | (2 | %) | ||||||||||
| Benefits, losses and loss adjustment expenses | 4,612 | 4,137 | 4,055 | 11 | % | 2 | % | ||||||||||
| Amortization of DAC | 40 | 50 | 54 | (20 | %) | (7 | %) | ||||||||||
| Insurance operating costs and other expenses | 1,373 | 1,308 | 1,311 | 5 | % | — | % | ||||||||||
| Amortization of other intangible assets | 40 | 40 | 41 | — | % | (2 | %) | ||||||||||
| Total benefits, losses and expenses | 6,065 | 5,535 | 5,461 | 10 | % | 1 | % | ||||||||||
| Income before income taxes | 302 | 471 | 662 | (36 | %) | (29 | %) | ||||||||||
| Income tax expense [2] | 53 | 88 | 126 | (40 | %) | (30 | %) | ||||||||||
| Net income | $ | 249 | $ | 383 | $ | 536 | (35 | %) | (29 | %) | |||||||
[1]For discussion of consolidated investment results, see MD&A - Investment Results.
[2]For discussion of income taxes, see Note 17 - Income Taxes of Notes to the Consolidated Financial Statements.
86
Part II - Item 7. Management's Discussion and Analysis of Financial Condition and Results of Operations
Premiums and Other Considerations
| 2021 | 2020 | 2019 | Increase (Decrease) From 2020 to 2021 | Increase (Decrease) From 2019 to 2020 | |||||||||||||
| Fully insured — ongoing premiums | $ | 5,502 | $ | 5,305 | $ | 5,416 | 4 | % | (2 | %) | |||||||
| Buyout premiums | 2 | 56 | 7 | (96 | %) | NM | |||||||||||
| Fee income | 183 | 175 | 180 | 5 | % | (3 | %) | ||||||||||
| Total premiums and other considerations | $ | 5,687 | $ | 5,536 | $ | 5,603 | 3 | % | (1 | %) | |||||||
| Fully insured ongoing sales, excluding buyouts | $ | 760 | $ | 717 | $ | 647 | 6 | % | 11 | % | |||||||
Ratios, Excluding Buyouts
| 2021 | 2020 | 2019 | Increase (Decrease) From 2020 to 2021 | Increase (Decrease) From 2019 to 2020 | |||||||||||||
| Group disability loss ratio | 68.2 | % | 66.1 | % | 67.3 | % | 2.1 | (1.2) | |||||||||
| Group life loss ratio | 101.9 | % | 87.5 | % | 79.5 | % | 14.4 | 8.0 | |||||||||
| Total loss ratio | 81.1 | % | 74.5 | % | 72.3 | % | 6.6 | 2.2 | |||||||||
| Expense ratio [1] | 25.5 | % | 25.2 | % | 24.5 | % | 0.3 | 0.7 | |||||||||
[1]Integration and transaction costs related to the acquisition of Aetna's U.S. group life and disability business are not included in the expense ratio.
Margin
| 2021 | 2020 | 2019 | Increase (Decrease) From 2020 to 2021 | Increase (Decrease) From 2019 to 2020 | |||||||||||||
| Net income margin | 3.9 | % | 6.4 | % | 8.8 | % | (2.5) | (2.4) | |||||||||
| Adjustments to reconcile net income margin to core earnings margin: | |||||||||||||||||
| Net realized losses (gains) excluded from core earnings, before tax | (2.0 | %) | (0.4 | %) | (0.5 | %) | (1.6) | 0.1 | |||||||||
| Integration and other non-recurring M&A costs, before tax | 0.1 | % | 0.3 | % | 0.6 | % | (0.2) | (0.3) | |||||||||
| Income tax benefit | 0.5 | % | — | % | — | % | 0.5 | 0.0 | |||||||||
| Impact of excluding buyouts from denominator of core earnings margin | — | % | 0.1 | % | — | % | (0.1) | 0.1 | |||||||||
| Core earnings margin | 2.5 | % | 6.4 | % | 8.9 | % | (3.9) | (2.5) | |||||||||
87
Part II - Item 7. Management's Discussion and Analysis of Financial Condition and Results of Operations
Net Income
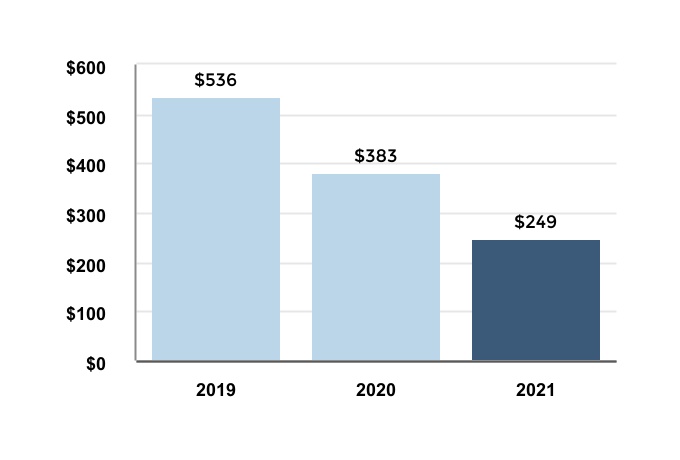
Year ended December 31, 2021 compared to the year ended December 31, 2020
Net income decreased largely driven by higher excess mortality and short-term disability losses and higher operating expenses, partially offset by an increase in net realized gains, an increase in net investment income and increased earned premiums.
Insurance operating costs and other expenses were higher year over year as an increase in incentive compensation, technology costs and claim costs to handle elevated claim levels resulting from the pandemic was partially offset by lower staffing and other costs due to the Hartford Next operational transformation and cost reduction program and a decrease in integration costs.
In addition, 2021 included a decrease in the allowance for credit losses on premiums receivable compared to an increase in the allowance in the prior year.
Fully Insured Ongoing Premiums
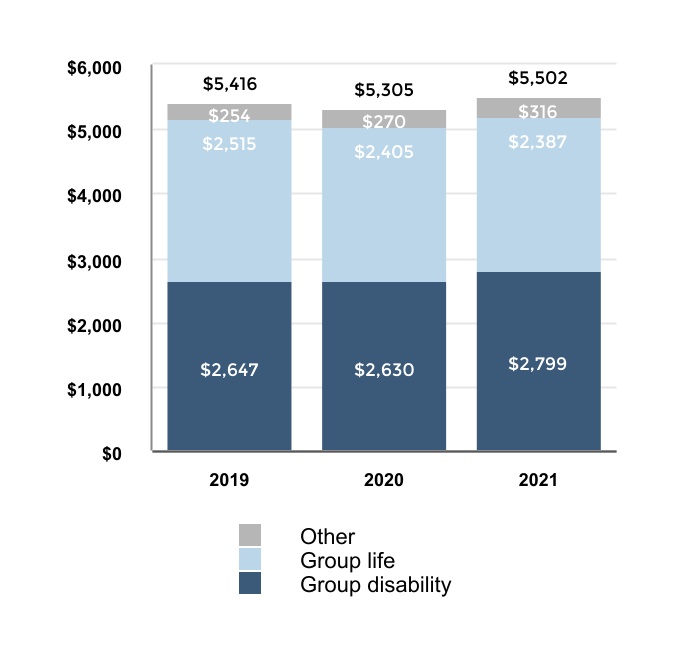
Year ended December 31, 2021 compared to the year ended December 31, 2020
Fully insured ongoing premiums increased primarily due to an increase in exposure on existing accounts as our customers emerge from the pandemic, as well as strong persistency and sales.
Fully insured ongoing sales, excluding buyouts increased with increases in group disability and other partially offset by a decrease in group life.
88
Part II - Item 7. Management's Discussion and Analysis of Financial Condition and Results of Operations
Ratios
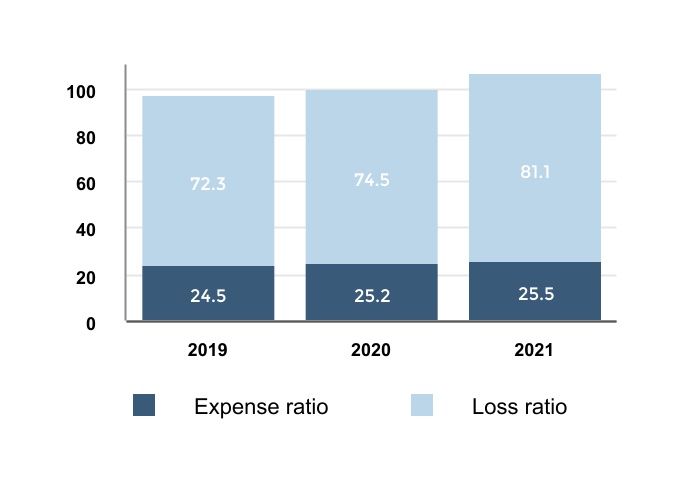
Year ended December 31, 2021 compared to the year ended December 31, 2020
Total loss ratio increased 6.6 points for 2021 reflecting a higher group life loss ratio and higher group disability loss ratio. The group life loss ratio increased 14.4 points driven by a 14.5 point increase in excess mortality claims compared to the twelve month period ended December 31, 2020. For the twelve month periods ended December 31, 2021 and 2020, excess mortality losses were $583 and $239, respectively. The group disability loss ratio increased 2.1 points over the twelve-month period ended December 31, 2020. Both the short-term and long-term disability loss ratios reflect increased claim incidence especially compared to the favorable incidence levels experienced during the early stages of the pandemic. The increased claim incidence was partially offset by a higher favorable New York Paid Family Leave adjustment recognized in the 2021 period.
Expense ratio increased 0.3 points in 2021 driven by an increase in incentive compensation, technology costs and claim costs to handle elevated claim levels resulting from the pandemic, partially offset by lower staffing and other costs as a result of the Hartford Next operational transformation and cost reduction program, and higher earned premiums. Also included was a decrease in the allowance for credit losses on premiums receivable compared to an increase in the allowance in the prior year period.
2022 Outlook
The Company expects Group Benefits fully insured ongoing premiums to increase approximately 2% in 2022 due to higher book persistency and continued strong sales. We expect net income in 2022 to benefit from lower excess mortality and pandemic related short-term disability losses, partially offset by the effects of downward pressure on pricing due to recent historical favorable long-term disability claim incidence, an expectation of higher claim incidence and less favorable recoveries on long-term disability claims in 2022 and lower expected investment yields. For 2022, we have assumed excess mortality losses of $100 to $200 before tax and COVID-19 short-term disability losses of approximately $25 before tax. The level of excess mortality losses is subject to significant uncertainty as it is dependent on a number of factors difficult to predict including, among others, the ultimate vaccination rate of the population, the continued effectiveness of the vaccines, the potential spread of new COVID-19 variants, the percentage of those infected who are of working age and the strain on the health care system preventing timely treatment of chronic illnesses. Compared to the net income margin of 3.9% in 2021, the net income margin in 2022 will largely depend on the level of excess mortality claims and other COVID-19 impacts. Based on the assumed range of excess mortality and COVID-19 short-term disability losses, the core earnings margin is expected to be 3.1% to 5.4% in 2022 compared to the 2.5% core earnings margin reported in 2021.
89
Part II - Item 7. Management's Discussion and Analysis of Financial Condition and Results of Operations
|HARTFORD FUNDS - RESULTS OF OPERATIONS | ||
Operating Summary
| 2021 | 2020 | 2019 | Increase (Decrease) From 2020 to 2021 | Increase (Decrease) From 2019 to 2020 | |||||||||||||
| Fee income and other revenue | $ | 1,189 | $ | 989 | $ | 999 | 20 | % | (1 | %) | |||||||
| Net investment income | 5 | 4 | 7 | 25 | % | (43 | %) | ||||||||||
| Net realized gains | 4 | 8 | 5 | (50 | %) | 60 | % | ||||||||||
| Total revenues | 1,198 | 1,001 | 1,011 | 20 | % | (1 | %) | ||||||||||
| Amortization of DAC | 12 | 14 | 12 | (14 | %) | 17 | % | ||||||||||
| Operating costs and other expenses | 913 | 773 | 813 | 18 | % | (5 | %) | ||||||||||
| Total benefits, losses and expenses | 925 | 787 | 825 | 18 | % | (5 | %) | ||||||||||
| Income before income taxes | 273 | 214 | 186 | 28 | % | 15 | % | ||||||||||
| Income tax expense [1] | 56 | 44 | 37 | 27 | % | 19 | % | ||||||||||
| Net income | $ | 217 | $ | 170 | $ | 149 | 28 | % | 14 | % | |||||||
| Daily average total Hartford Funds segment AUM | $ | 151,347 | $ | 120,908 | $ | 117,914 | 25 | % | 3 | % | |||||||
| Return on Assets ("ROA") [2] | 14.3 | 14.1 | 12.5 | 0.2 | 1.6 | ||||||||||||
| Adjustments to reconcile ROA to ROA, core earnings: | |||||||||||||||||
| Effect of net realized gains, excluded from core earnings, before tax | (0.3) | (0.7) | (0.3) | 0.4 | (0.4) | ||||||||||||
| Effect of income tax expense | 0.1 | 0.1 | — | 0.0 | 0.1 | ||||||||||||
| Return on Assets ("ROA"), core earnings [2] | 14.1 | 13.5 | 12.2 | 0.6 | 1.3 | ||||||||||||
[1]For discussion of income taxes, see Note 17 - Income Taxes of Notes to Consolidated Financial Statements.
[2]Represents annualized earnings divided by a daily average of assets under management, as measured in basis points.
Hartford Funds Segment AUM
| 2021 | 2020 | 2019 | Increase (Decrease) From 2020 to 2021 | Increase (Decrease) From 2019 to 2020 | |||||||||||||
| Mutual Fund and ETP AUM - beginning of period | $ | 124,627 | $ | 112,533 | $ | 91,557 | 11 | % | 23 | % | |||||||
| Sales - mutual fund | 32,399 | 28,604 | 22,479 | 13 | % | 27 | % | ||||||||||
| Redemptions - mutual fund | (28,653) | (31,412) | (23,624) | 9 | % | (33 | %) | ||||||||||
| Net flows - ETP | 121 | (276) | 1,332 | 144 | % | (121 | %) | ||||||||||
| Net Flows - mutual fund and ETP | 3,867 | (3,084) | 187 | NM | NM | ||||||||||||
| Change in market value and other | 14,138 | 15,178 | 20,789 | (7 | %) | (27 | %) | ||||||||||
| Mutual Fund and ETP AUM - end of period | 142,632 | 124,627 | 112,533 | 14 | % | 11 | % | ||||||||||
| Talcott Resolution life and annuity separate account AUM [1] | 15,263 | 14,809 | 14,425 | 3 | % | 3 | % | ||||||||||
| Hartford Funds AUM - end of period | $ | 157,895 | $ | 139,436 | $ | 126,958 | 13 | % | 10 | % | |||||||
[1]Represents AUM of the life and annuity business sold in May 2018 that is still managed by the Company's Hartford Funds segment.
90
Part II - Item 7. Management's Discussion and Analysis of Financial Condition and Results of Operations
Mutual Fund AUM by Asset Class
| 2021 | 2020 | 2019 | Increase (Decrease) From 2020 to 2021 | Increase (Decrease) From 2019 to 2020 | |||||||||||||
| Equity | $ | 95,703 | $ | 82,123 | $ | 71,629 | 17 | % | 15 | % | |||||||
| Fixed Income | 20,113 | 17,034 | 16,130 | 18 | % | 6 | % | ||||||||||
| Multi-Strategy Investments [1] | 23,610 | 22,645 | 21,332 | 4 | % | 6 | % | ||||||||||
| Exchange-traded products | 3,206 | 2,825 | 3,442 | 13 | % | (18 | %) | ||||||||||
| Mutual Fund and ETP AUM | $ | 142,632 | $ | 124,627 | $ | 112,533 | 14 | % | 11 | % | |||||||
[1]Includes balanced, allocation, and alternative investment products.
Net Income
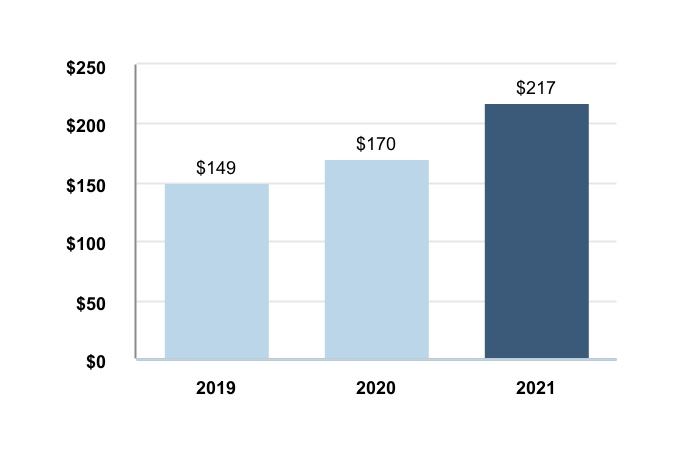
Year ended December 31, 2021 compared to the year ended December 31, 2020
Net income increased primarily due to higher fee income as a result of an increase in daily average assets under management, partially offset by higher variable costs and the effect of a $12 reduction in contingent consideration payable associated with the acquisition of Lattice that was recognized in first quarter 2020.
Hartford Funds AUM
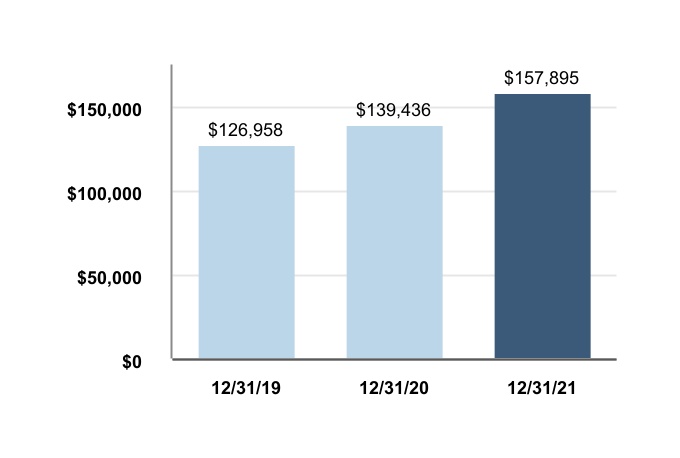
December 31, 2021 compared to December 31, 2020
Hartford Funds AUM increased primarily due to net inflows and an increase in market values over the previous twelve months. Net inflows on mutual fund and ETP of $3.9 billion in 2021 compared to net outflows of $3.1 billion for the year ended December 31, 2020.
2022 Outlook
Assuming net inflows and continued growth in equity markets in 2022, the Company expects net income for Hartford Funds to increase from 2021.
91
Part II - Item 7. Management's Discussion and Analysis of Financial Condition and Results of Operations
|CORPORATE - RESULTS OF OPERATIONS | ||
Operating Summary
| 2021 | 2020 | 2019 | Increase (Decrease) From 2020 to 2021 | Increase (Decrease) From 2019 to 2020 | |||||||||||||
| Fee income [1] | $ | 50 | $ | 49 | $ | 50 | 2 | % | (2 | %) | |||||||
| Net investment income | 24 | 22 | 66 | 9 | % | (67 | %) | ||||||||||
| Net realized gains | 73 | 22 | 22 | NM | — | % | |||||||||||
| Other revenue | (10) | 53 | 96 | (119 | %) | (45 | %) | ||||||||||
| Total revenues | 137 | 146 | 234 | (6 | %) | (38 | %) | ||||||||||
| Benefits, losses and loss adjustment expenses [2] | 7 | 15 | 19 | (53 | %) | (21 | %) | ||||||||||
| Insurance operating costs and other expenses [1] | 90 | 76 | 83 | 18 | % | (8 | %) | ||||||||||
| Loss on extinguishment of debt [3] | — | — | 90 | — | % | (100 | %) | ||||||||||
| Interest expense [3] | 234 | 236 | 259 | (1 | %) | (9 | %) | ||||||||||
| Restructuring and other costs | 1 | 104 | — | (99 | %) | NM | |||||||||||
| Total benefits, losses and expenses | 332 | 431 | 451 | (23 | %) | (4 | %) | ||||||||||
| Loss before income taxes | (195) | (285) | (217) | 32 | % | (31 | %) | ||||||||||
| Income tax benefit [4] | (47) | (63) | (46) | 25 | % | (37 | %) | ||||||||||
| Net loss | (148) | (222) | (171) | 33 | % | (30 | %) | ||||||||||
| Preferred stock dividends | 21 | 21 | 21 | — | % | — | % | ||||||||||
| Net loss available to common stockholders | $ | (169) | $ | (243) | $ | (192) | 30 | % | (27 | %) | |||||||
[1]Includes investment management fees and expenses related to managing third party business, including management of a portion of the invested assets of Talcott Resolution.
[2]Includes benefits expense on life and annuity business previously underwritten by the Company.
[3]For discussion of debt, see Note 14 - Debt of Notes to Consolidated Financial Statements.
[4]For discussion of income taxes, see Note 17 - Income Taxes of Notes to Consolidated Financial Statements.
Net Loss
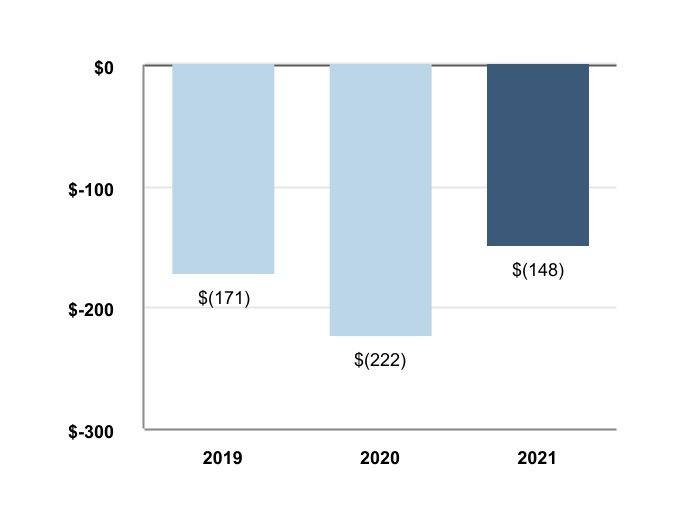
Year ended December 31, 2021 compared to the year ended December 31, 2020
Net loss available to common stockholders decreased from 2020 primarily due to a decrease in restructuring and other costs and greater net realized gains, partially offset by a change from income to loss from the Company’s previously owned equity interest in Talcott Resolution and higher insurance operating costs and other expenses.
Income (loss) from the Company’s previously owned equity interest in Talcott Resolution was $(11) and $42, respectively, for 2021 and 2020. The increase in operating costs and other expenses for 2021 was primarily driven by legal and consulting costs associated with the unsolicited proposals from Chubb Limited to acquire the Company, partially offset by lower consulting fees. Net realized gains for 2021 included a $46 gain on sale of the Company’s 9.7% retained equity interest in Talcott Resolution.
Interest Expense
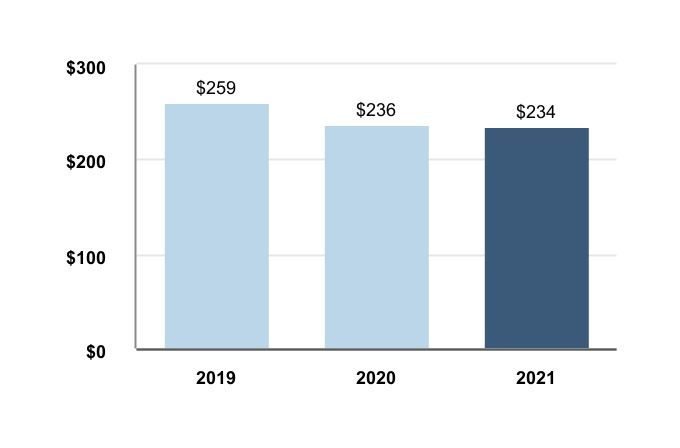
92
Part II - Item 7. Management's Discussion and Analysis of Financial Condition and Results of Operations
Year ended December 31, 2021 compared to the year ended December 31, 2020
Interest expense in 2021 was relatively consistent with 2020 due to the repayment of our 5.5% senior notes in March
2020 offset by the issuance of the 2.9% senior notes in September 2021.
ENTERPRISE RISK MANAGEMENT
The Company’s Board of Directors has ultimate responsibility for risk oversight, as described more fully in our Proxy Statement, while management is tasked with the day-to-day management of the Company’s risks.
The Company manages and monitors risk through risk policies, controls and limits. At the senior management level, an Enterprise Risk and Capital Committee (“ERCC”) oversees the risk profile and risk management practices of the Company. As illustrated below, a number of functional committees sit underneath the ERCC, providing oversight of specific risk areas and recommending risk mitigation strategies to the ERCC.
| ERCC Members | ||
| CEO (Chair) | ||
| President | ||
| Chief Financial Officer | ||
| Chief Investment Officer | ||
| Chief Risk Officer | ||
| Chief Underwriting Officer | ||
| General Counsel | ||
| Others as deemed necessary by the Committee Chair | ||
| ERCC | ||||||||||||||||||||||||||||||||||||||||||||||||||||||||||||||
| Asset Liability Committee | Underwriting Risk Committee | Emerging Risk Steering Committee | Operational Risk Committee | Economic Capital Executive Committee | Model Oversight Committee | |||||||||||||||||||||||||||||||||||||||||||||||||||||||||
The Company's enterprise risk management ("ERM") function supports the ERCC and functional committees, and is tasked with, among other things:
•risk identification and assessment;
•the development of risk appetites, tolerances, and limits;
•risk monitoring; and
•internal and external risk reporting.
The Company categorizes its main risks as insurance risk, operational risk and financial risk, each of which is described in more detail below.
|INSURANCE RISK
Insurance risk is the risk of losses of both a catastrophic and non-catastrophic nature on the P&C and Group Benefits products the Company has sold. Catastrophe insurance risk is the exposure arising from both natural (e.g., weather, earthquakes, wildfires, pandemics) and man-made catastrophes (e.g., terrorism, cyber-attacks) that create a concentration or
aggregation of loss across the Company's insurance or asset portfolios.
Sources of Insurance Risk Non-catastrophe insurance risks exist within each of the Company's segments except Hartford Funds and include:
•Property- Risk of loss to personal or commercial property from automobile related accidents, weather, explosions, smoke, shaking, fire, theft, vandalism, inadequate installation, faulty equipment, collisions and falling objects, and/or machinery mechanical breakdown resulting in physical damage and other covered perils.
•Liability- Risk of loss from automobile related accidents, uninsured and underinsured drivers, lawsuits from accidents, defective products, breach of warranty, negligent acts by professional practitioners, environmental claims, latent exposures, fraud, coercion, forgery, failure to fulfill obligations per contract surety, liability from errors and omissions, losses from political and credit coverages, losses from derivative lawsuits, and other securities actions and covered perils.
93
Part II - Item 7. Management's Discussion and Analysis of Financial Condition and Results of Operations
•Mortality- Risk of loss from unexpected trends in insured deaths impacting timing of payouts from group life insurance, personal or commercial automobile related accidents, and death of employees or executives during the course of employment, while on disability, or while collecting workers compensation benefits.
•Morbidity- Risk of loss to an insured from illness incurred during the course of employment or illness from other covered perils.
•Disability- Risk of loss incurred from personal or commercial automobile related losses, accidents arising outside of the workplace, injuries or accidents incurred during the course of employment, or from equipment, with each loss resulting in short term or long-term disability payments.
•Longevity- Risk of loss from increased life expectancy trends among policyholders receiving long-term benefit payments.
•Cyber Insurance- Risk of loss to property, breach of data and business interruption from various types of cyber-attacks.
Catastrophe risk primarily arises in the property, automobile, workers' compensation, casualty, group life, and group disability lines of business. Not all insurance losses arising from catastrophe risk are categorized as catastrophe losses within the segment operating results. For example, losses arising from the COVID-19 pandemic were not categorized as catastrophe losses within either the P&C or Group Benefits segments as the pandemic was not identified as a catastrophe event by the Property Claim Service in the U.S. See the term Current Accident Year Catastrophe Ratio within the Key Performance Measures section of MD&A for an explanation of how the Company defines catastrophe losses in its financial reporting.
Impact Non-catastrophe insurance risk can arise from unexpected loss experience, underpriced business and/or underestimation of loss reserves and can have significant effects on the Company’s earnings. Catastrophe insurance risk can arise from various unpredictable events and can have significant effects on the Company's earnings and may result in losses that could constrain its liquidity.
Management The Company's policies and procedures for managing these risks include disciplined underwriting protocols, exposure controls, sophisticated risk-based pricing, risk modeling, risk transfer, and capital management strategies. The Company has established underwriting guidelines for both individual risks, including individual policy limits, and risks in the aggregate, including aggregate exposure limits by geographic zone and peril. The Company uses both internal and third-party models to estimate the potential loss resulting from various catastrophe events and the potential financial impact those events would have on the Company's financial position and results of operations across its businesses.
In addition, certain insurance products offered by The Hartford provide coverage for losses incurred due to cyber events and the Company has assessed and modeled how those products would respond to different events in order to manage its aggregate exposure to losses incurred under the insurance policies we sell. The Company models numerous deterministic scenarios including losses caused by malware, data breach, distributed denial of service attacks, intrusions of cloud environments and attacks of power grids.
Among specific risk tolerances set by the Company, risk limits are set for natural catastrophes, terrorism risk and pandemic risk.
94
Part II - Item 7. Management's Discussion and Analysis of Financial Condition and Results of Operations
| Risk | Definition | Details and Company Limits | ||||||||||||
| Natural catastrophe | Exposure arising from natural phenomena (e.g., earthquakes, wildfires, etc.) that create a concentration or aggregation of loss across the Company's insurance or asset portfolios and the inherent volatility of weather or climate pattern changes. | The Company generally limits its estimated before tax loss as a result of natural catastrophes for property & casualty exposures from a single 250-year event to less than 30% of the reported capital and surplus of the property and casualty insurance subsidiaries prior to reinsurance and to less than 15% of the reported capital and surplus of the property and casualty insurance subsidiaries after reinsurance. The Company generally limits its estimated before tax loss from an aggregation of multiple natural catastrophe events for an all-peril annual aggregate 100-year event to less than 18% reported capital and surplus of the property and casualty insurance subsidiaries after reinsurance. From time to time the estimated loss from natural catastrophes may fluctuate above or below these limits due to changes in modeled loss estimates, exposures or statutory surplus. [1] The table below represents the estimated before tax catastrophe loss exceedance probabilities, from an aggregate of all catastrophe events occurring in a one-year timeframe before and after reinsurance and from a single hurricane or earthquake occurrence. | ||||||||||||
| Modeled Loss Gross and Net of Reinsurance [2] | ||||||||||||||
| Probability of Loss Exceedance [3] | Gross of Reinsurance | Net of Reinsurance | ||||||||||||
| Aggregate annual all-peril (1-in-100) (1.0%) | $ | 2,062 | $ | 1,160 | ||||||||||
| Aggregate annual all-peril (1-in-250) (0.4%) | $ | 2,893 | $ | 1,726 | ||||||||||
| Hurricane single occurrence (1-in-100) (1.0%) | $ | 1,106 | $ | 459 | ||||||||||
| Hurricane single occurrence (1-in-250) (0.4%) | $ | 1,854 | $ | 904 | ||||||||||
| Earthquake single occurrence (1-in-100) (1.0%) | $ | 783 | $ | 414 | ||||||||||
| Earthquake single occurrence (1-in-250) (0.4%) | $ | 1,482 | $ | 661 | ||||||||||
| Terrorism | The risk of losses from terrorist attacks, including losses caused by single-site and multi-site conventional attacks, as well as the potential for attacks using nuclear, biological, chemical or radiological weapons (“NBCR”). | Enterprise limits for terrorism apply to aggregations of risk across property & casualty, group benefits and specific asset portfolios and are defined based on a deterministic, single-site conventional terrorism attack scenario. The Company manages its potential estimated loss from a conventional terrorism loss scenario, up to $2.0 billion net of reinsurance and $2.5 billion gross of reinsurance, before coverage under TRIPRA. In addition, the Company monitors exposures monthly and employs both internally developed and vendor-licensed loss modeling tools as part of its risk management discipline. Our modeled exposures to conventional terrorist attacks around landmark locations may fluctuate above and below our stated limits. | ||||||||||||
| Pandemic | The exposure to loss arising from widespread influenza or other pathogens or bacterial infections that create an aggregation of loss across the Company's insurance or asset portfolios. | The Company generally limits its estimated before tax loss from a single 250 year pandemic event to less than 18% of the aggregate reported capital and surplus of the property and casualty and group benefits insurance subsidiaries. In evaluating these scenarios, the Company assesses the impact on group life, short-term disability, long-term disability and property & casualty claims. While ERM has a process to track and manage these limits, from time to time, the estimated loss for pandemics may fluctuate above or below these limits due to changes in modeled loss estimates, exposures, or statutory surplus. In addition, the Company assesses losses in the investment portfolio associated with market declines in the event of a widespread pandemic. [1] | ||||||||||||
[1]For U.S. insurance subsidiaries, reported capital and surplus is equal to actual U.S. statutory capital and surplus. For Navigators Insurers in non-U.S. jurisdictions, reported capital and surplus is equal to U.S. GAAP equity of those subsidiaries less certain assets such as goodwill and intangible assets.
[2]The loss estimates represent total property modeled losses for hurricane single occurrence events, property and workers' compensation modeled losses for earthquake single occurrence events, and modeled aggregate annual losses for natural catastrophes from all perils (hurricane, flood, earthquake, hail, tornado, wildfire and winter storms). The net loss estimates provided assume that the Company is able to recover all losses ceded to reinsurers under its reinsurance programs. The Company also manages natural catastrophe risk for group life and group disability, which in combination with property and workers compensation loss estimates are subject to separate enterprise risk management net aggregate loss limits as a percent of enterprise surplus.
[3]The modeled probability of loss exceedance represents the likelihood of a loss from single peril occurrence or from an aggregate of catastrophe events from all perils to exceed the indicated amount in a one-year time frame.
Reinsurance as a Risk Management Strategy
The Company uses reinsurance to transfer certain risks to reinsurance companies based on specific geographic or risk concentrations. A variety of traditional reinsurance products are used as part of the Company's risk management strategy, including excess of loss occurrence-based products that reinsure property and workers' compensation exposures, and individual risk (including facultative reinsurance) or quota share arrangements, that reinsure losses from specific classes or lines of business. The Company has no significant finite risk contracts in place and the statutory surplus benefit from all such prior year
contracts is immaterial. The Hartford also participates in governmentally administered reinsurance facilities such as the Florida Hurricane Catastrophe Fund (“FHCF”), TRIPRA and other reinsurance programs relating to particular risks or specific lines of business.
Reinsurance for Catastrophes- The Company utilizes various reinsurance programs to mitigate catastrophe losses including excess of loss occurrence-based treaties covering property and workers’ compensation, and an aggregate property catastrophe treaty as well as individual risk agreements (including facultative reinsurance) that reinsure losses from specific classes or lines
95
Part II - Item 7. Management's Discussion and Analysis of Financial Condition and Results of Operations
of business. The aggregate property catastrophe treaty covers the aggregate of catastrophe events designated by the Property Claim Services office of Verisk and, for international business, net losses arising from two or more risks involved in the same loss occurrence totaling at least $500 thousand, in excess of a $700 retention. The occurrence-based property catastrophe treaties respond in excess of $100 per occurrence for all perils other than earthquakes and named hurricanes and tropical
storms (subject to a $50 annual aggregate deductible). Beginning with the January 1, 2021 renewal, our per occurrence property catastrophe treaty and workers’ compensation catastrophe treaty incepting January 1, 2021 do not cover pandemic losses, as most industry reinsurance programs exclude communicable disease. The Company has reinsurance in place to cover individual group life losses in excess of $1 per person.
Primary Catastrophe Treaty Reinsurance Coverages as of January 1, 2022 [1]
| Portion of losses reinsured | Portion of losses retained by The Hartford | |||||||
| Per Occurrence Property Catastrophe Treaty from 1/1/2022 to 12/31/2022 [1] [2] | ||||||||
| Losses of $0 to $100 | None | 100% retained | ||||||
| Losses of $100 to $350 for earthquakes and named hurricanes and tropical storms [3] | None | 100% retained | ||||||
| Losses of $100 to $350 from one event other than earthquakes and named hurricanes and tropical storms (subject to a $50 Annual Aggregate Deductible ("AAD")) [3] | 70% of $250 in excess of $100 | 30% co-participation | ||||||
| Losses of $350 to $500 from one event (all perils) | 75% of $150 in excess of $350 | 25% co-participation | ||||||
| Losses of $500 to $1.1 billion from one event [4] (all perils) | 90% of $600 in excess $500 | 10% co-participation | ||||||
| Aggregate Property Catastrophe Treaty for 1/1/2022 to 12/31/2022 [5] | ||||||||
| $0 to $700 of aggregate losses | None | 100% retained | ||||||
| $700 to $900 of aggregate losses | 100% | None | ||||||
| Workers' Compensation Catastrophe Treaty for 1/1/2022 to 12/31/2022 | ||||||||
| Losses of $0 to $100 from one event | None | 100% retained | ||||||
| Losses of $100 to $450 from one event [6] | 80% of $350 in excess of $100 | 20% co-participation | ||||||
[1]These treaties do not cover the assumed reinsurance business which purchases its own retrocessional coverage.
[2]In addition to the Per Occurrence Property Catastrophe Treaty, for Florida wind events, The Hartford has purchased the mandatory FHCF reinsurance for the annual period starting at June 1, 2021. Retention and coverage varies by writing company. The writing company with the largest coverage under FHCF is Hartford Insurance Company of the Midwest, with coverage estimated at approximately 90% of $52 in per event losses in excess of a $21 retention (estimates are based on best available information at this time and are periodically updated as information is made available by Florida).
[3]Named hurricanes and tropical storms are defined as any storm or storm system declared to be a hurricane or tropical storm by the US National Hurricane Center, US Weather Prediction Center, or their successor organizations (being divisions of the US National Weather Service).
[4]Portions of this layer of coverage extend beyond a traditional one year term.
[5]The aggregate treaty is not limited to a single event; rather, it is designed to provide reinsurance protection for the aggregate of all catastrophe events (up to $350 per event), either designated by the Property Claim Services office of Verisk or, for international business, net losses arising from two or more risks involved in the same loss occurrence totaling at least $500 thousand. All catastrophe losses, except assumed reinsurance business losses, apply toward satisfying the $700 attachment point under the aggregate treaty.
[6]In addition to the limits shown, the workers' compensation reinsurance includes a non-catastrophe, industrial accident layer, providing coverage for 80% of $30 in per event losses in excess of a $20 retention.
In addition to the property catastrophe reinsurance coverage described in the above table, the Company has other reinsurance agreements that cover property catastrophe losses. The Per Occurrence Property Catastrophe Treaty, and Workers' Compensation Catastrophe Treaty include a provision to reinstate one limit in the event that a catastrophe loss exhausts limits on one or more layers under the treaties.
Reinsurance for Terrorism- For the risk of terrorism, private sector catastrophe reinsurance capacity is generally limited and largely unavailable for terrorism losses caused by nuclear, biological, chemical or radiological attacks. As such, the Company's principal reinsurance protection against large-scale terrorist attacks is the coverage currently provided through TRIPRA to the end of 2027.
TRIPRA provides a backstop for insurance-related losses resulting from any “act of terrorism”, which is certified by the
Secretary of the Treasury, in consultation with the Secretary of Homeland Security and the Attorney General, for losses that exceed a threshold of industry losses of $200. Under the program, in any one calendar year, the federal government will pay a percentage of losses incurred from a certified act of terrorism after an insurer's losses exceed 20% of the Company's eligible direct commercial earned premiums of the prior calendar year up to a combined annual aggregate limit for the federal government and all insurers of $100 billion. The percentage of losses paid by the federal government is 80% . The Company's estimated deductible under the program is $1.7 billion for 2022. If an act of terrorism or acts of terrorism result in covered losses exceeding the $100 billion annual industry aggregate limit, Congress would be responsible for determining how additional losses in excess of $100 billion will be paid.
96
Part II - Item 7. Management's Discussion and Analysis of Financial Condition and Results of Operations
Reinsurance for A&E and Navigators Group Reserve Development - The Company has two ADC reinsurance agreements in place, both of which are accounted for as retroactive reinsurance. One agreement covers substantially all A&E reserve development for 2016 and prior accident years (the “A&E ADC”) up to an aggregate limit of $1.5 billion and the other covered substantially all reserve development of Navigators Insurance Company and certain of its affiliates for 2018 and prior accident years (“Navigators ADC”) up to an aggregate limit
of $300. As the Company has ceded all of the $300 available limit under the Navigators ADC, there is no remaining limit available as of December 31, 2021. Any net adverse loss development above the $300 limit is reflected in the Company's results from operations. For more information on the A&E ADC and the Navigators ADC, see Note 1, Basis of Presentation and Significant Accounting Policies, and Note 12, Reserve for Unpaid Losses and Loss Adjustment Expenses of Notes to Consolidated Financial Statements.
Reinsurance Recoverables
Property and Casualty insurance product reinsurance recoverables represent loss and loss adjustment expense recoverables from a number of entities, including reinsurers and pools. A portion of the total gross reinsurance recoverables balance relates to the Company’s participation in various mandatory (assigned) and involuntary risk pools and the value of annuity contracts held under structured settlement agreements.
Group Benefits and Corporate reinsurance recoverables represent reserves for future policy benefits and unpaid loss and loss adjustment expenses and other policyholder funds and benefits payable that are recoverable from a number of reinsurers.
The table below shows the gross and net reinsurance recoverables reported in the Property and Casualty and Group Benefits reporting segments as well as Corporate.
To manage reinsurer credit risk, a reinsurance security review committee evaluates the credit standing, financial performance, management and operational quality of each potential reinsurer.
In placing reinsurance, the Company considers the nature of the risk reinsured, including the expected liability payout duration, and establishes limits tiered by reinsurer credit rating. Where its contracts permit, the Company secures future claim obligations with various forms of collateral or other credit enhancement,
including irrevocable letters of credit, secured trusts, funds held accounts and group wide offsets. As part of its reinsurance recoverable review, the Company analyzes recent developments in commutation activity between reinsurers and cedants, recent trends in arbitration and litigation outcomes in disputes between cedants and reinsurers and the overall credit quality of the Company’s reinsurers. For further discussion on reinsurance recoverables, including details of recoverables by AM Best credit rating, see Note 9 – Reinsurance of Notes to Consolidated Financial Statements.
Annually, the Company completes evaluations of the reinsurance recoverable asset associated with older, long-term casualty liabilities reported in the Property & Casualty Other Operations reporting segment and the allowance for uncollectible reinsurance reported in the Commercial Lines and Group Benefits reporting segments as well as the Corporate category. For a discussion regarding the results of the evaluation of older, long-term casualty liabilities reported in the Property & Casualty Other Operations reporting segment, see MD&A - Critical Accounting Estimates, Property and Casualty Insurance Product Reserves, Net of Reinsurance. For a discussion of the allowance for uncollectible reinsurance, see Note 9 – Reinsurance of Notes to Consolidated Financial Statements.
Reinsurance Recoverables as of December 31,
| Property and Casualty | Group Benefits | Corporate | Total | |||||||||||||||||||||||
| 2021 | 2020 | 2021 | 2020 | 2021 | 2020 | 2021 | 2020 | |||||||||||||||||||
| Paid loss and loss adjustment expenses | $ | 319 | $ | 269 | $ | 5 | $ | 6 | $ | — | $ | — | $ | 324 | $ | 275 | ||||||||||
| Unpaid loss and loss adjustment expenses | 5,774 | 5,297 | 246 | 239 | 278 | 308 | 6,298 | 5,844 | ||||||||||||||||||
| Gross reinsurance recoverables | 6,093 | 5,566 | 251 | 245 | 278 | 308 | 6,622 | 6,119 | ||||||||||||||||||
| Allowance for uncollectible reinsurance | (96) | (105) | (1) | (1) | (2) | (2) | (99) | (108) | ||||||||||||||||||
| Net reinsurance recoverables | $ | 5,997 | $ | 5,461 | $ | 250 | $ | 244 | $ | 276 | $ | 306 | $ | 6,523 | $ | 6,011 | ||||||||||
Guaranty Funds and Other Insurance-related Assessments
As part of its risk management strategy, the Company regularly monitors the financial strength of other insurers and, in particular, activity by insurance regulators and various state guaranty associations in the U.S. relating to troubled insurers. In all states, insurers licensed to transact certain classes of insurance are required to become members of a guaranty fund.
|OPERATIONAL RISK
Operational risk is the risk of loss resulting from inadequate or failed internal processes and systems, human error, or from external events.
Sources of Operational Risk Operational risk is inherent in the Company's business and functional areas. Operational risks include: compliance with laws and regulation, cybersecurity, business disruption, technology failure, inadequate execution or process management, reliance on
97
Part II - Item 7. Management's Discussion and Analysis of Financial Condition and Results of Operations
model and data analytics, internal fraud, external fraud, third party dependency and attraction and retention of talent.
Impact Operational risk can result in financial loss, disruption of our business, regulatory actions or damage to our reputation.
Management Responsibility for day-to-day management of operational risk lies within each business unit and functional area. ERM provides an enterprise-wide view of the Company's operational risk on an aggregate basis. ERM is responsible for establishing, maintaining and communicating the framework, principles and guidelines of the Company's operational risk management program. Operational risk mitigation strategies include the following:
•Establishing policies and monitoring risk tolerances and exceptions;
•Conducting business risk assessments and implementing action plans where necessary;
•Validating existing crisis management protocols;
•Identifying and monitoring emerging risks; and
•Purchasing insurance coverage.
In response to COVID-19 the Company continues to assess evolving risks related to COVID-19 while monitoring guidance and regulations to maintain certain practices in the interest of the health and welfare of our employees and to reduce operational risk. Among others, current practices include enabling work from home and hybrid work arrangements, mandating protocols that employees must follow when they are in the office and established contact tracing processes for in-office and customer facing individuals who have had exposure to COVID-19. We also continue to work with vendors to ensure they have business continuity plans in place.
Cybersecurity Risk
The Hartford has implemented an information protection program with established governance routines that promote an adaptive approach for assessing and managing risks. The Hartford employs a ‘defense-in-depth’ strategy that uses multiple security measures to protect the integrity of the Company's information assets. This ‘defense-in-depth’ strategy aligns to the National Institute of Standards and Technology ("NIST") Cyber Security Framework and provides preventative, detective and responsive measures that collectively protects the Company. The Hartford continually assesses cyber capabilities and threat detection. Various cyber assurance methods, including security metrics, third party security assessments, external penetration testing, red team exercises, and cyber incident response exercises are used to test the effectiveness of the overall cybersecurity control environment. Additionally, The Company collaborates with industry associations, government authorities, peers and external advisors to monitor the threat environment and to inform our security practices.
The Hartford, like many other large financial services companies, blocks attempted cyber intrusions on a daily basis. In the event of a cyber intrusion, the Company invokes its Cyber Incident Response Program (the "Program") commensurate with the nature of the intrusion. While the actual methods employed differ based on the event, our approach uses internal teams and outside advisors with specialized skills to support the response and recovery efforts and requires elevation of issues, as necessary, to senior management. In addition, we have
procedures to ensure timely notification of critical cybersecurity incidents pursuant to the Program to help identify employees who may have material non-public information and to implement blackout restrictions on trading the Company's securities during the investigation and assessment of such cybersecurity incidents.
From a governance perspective, senior members of our Enterprise Risk Management, Information Protection and Internal Audit functions provide detailed, regular reports on cybersecurity matters to the Board, including the Finance, Investment, and Risk Management Committee ("FIRMCo"), a committee consisting of all directors and the Audit Committee, which oversees controls for the Company's major risk exposures, and has principal responsibility for oversight of cybersecurity risk. The topics covered by these updates include the Company's activities, policies and procedures to prevent, detect and respond to cybersecurity incidents, as well as lessons learned from cybersecurity incidents and internal and external testing of our cyber defenses.
|FINANCIAL RISK
Financial risks include direct and indirect risks to the Company's financial objectives from events that impact financial market conditions and the value of financial assets. Some events may cause correlated movement in multiple risk factors. The primary sources of financial risks are the Company's invested assets.
Consistent with its risk appetite, the Company establishes financial risk limits to control potential loss on a U.S. GAAP, statutory, and economic basis. Exposures are actively monitored and managed, with risks mitigated where appropriate. The Company uses various risk management strategies, including limiting aggregation of risk, portfolio re-balancing and hedging with over-the-counter ("OTC") and exchange-traded derivatives with counterparties meeting the appropriate regulatory and due diligence requirements. Derivatives are utilized to achieve the following Company-approved objectives: (1) hedging risk arising from interest rate, equity market, commodity market, credit spread and issuer default, price or currency exchange rate risk or volatility; (2) managing liquidity; (3) controlling transaction costs; and (4) engaging in income generation covered call transactions and synthetic replication transactions. Derivative activities are monitored and evaluated by the Company’s compliance and risk management teams and reviewed by senior management. The Company identifies different categories of financial risk, including liquidity, credit, interest rate, equity, and foreign currency exchange.
Liquidity Risk
Liquidity risk is the risk to current or prospective earnings or capital arising from the Company's inability or perceived inability to meet its contractual funding obligations as they come due.
Sources of Liquidity Risk Sources of liquidity risk include funding risk, company-specific liquidity risk and market liquidity risk resulting from differences in the amount and timing of sources and uses of cash as well as company-specific and general market conditions. Stressed market conditions may impact the ability to sell assets or otherwise transact business and may result in a significant loss in value.
98
Part II - Item 7. Management's Discussion and Analysis of Financial Condition and Results of Operations
Impact Inadequate capital resources and liquidity could negatively affect the Company’s overall financial strength and its ability to generate cash flows from its businesses, borrow funds at competitive rates, and raise new capital to meet operating and growth needs.
Management The Company has defined ongoing monitoring and reporting requirements to assess liquidity across the enterprise under both current and stressed market conditions. The Company measures and manages liquidity risk exposures and funding needs within prescribed limits across legal entities, taking into account legal, regulatory and operational limitations to the transferability of liquid assets among legal entities. The Company also monitors internal and external conditions, and identifies material risk changes and emerging risks that may impact operating cash flows or liquid assets. The liquidity requirements of The Hartford Financial Services Group, Inc. ("HFSG Holding Company") have been and will continue to be met by the HFSG Holding Company's fixed maturities, short-term investments and cash, and dividends from its subsidiaries, principally its insurance operations, as well as the issuance of common stock, debt or other capital securities and borrowings from its credit facilities as needed. The Company maintains multiple sources of contingent liquidity including a revolving credit facility, an intercompany liquidity agreement that allows for short-term advances of funds among the HFSG Holding Company and certain affiliates, and access to collateralized advances from the Federal Home Loan Bank of Boston ("FHLBB") for certain affiliates. The Company's CFO has primary responsibility for liquidity risk.
Refer to the Capital Resources & Liquidity section of MD&A for the discussion of what the Company is doing to manage liquidity during the COVID-19 pandemic.
Credit Risk and Counterparty Risk
Credit risk is the risk to earnings or capital due to uncertainty of an obligor’s or counterparty’s ability or willingness to meet its obligations in accordance with contractually agreed upon terms. Credit risk is comprised of three major factors: the risk of change in credit quality, or credit migration risk; the risk of default; and the risk of a change in value due to changes in credit spreads.
Sources of Credit Risk The majority of the Company’s credit risk is concentrated in its investment holdings and use of derivatives, but it is also present in the Company’s ceded reinsurance activities and various insurance products.
Impact A decline in creditworthiness is typically reflected as an increase in an investment’s credit spread and an associated decline in the investment's fair value, potentially resulting in recording an ACL and an increased probability of a realized loss upon sale. In certain instances, counterparties may default on their obligations and the Company may realize a loss on default. Premiums receivable, including premiums for retrospectively rated plans, reinsurance recoverable and deductible losses recoverable are also subject to credit risk based on the counterparty’s inability to pay.
For a discussion of impacts resulting from the COVID-19 pandemic, refer to the Impact of COVID-19 on our financial condition, results of operations and liquidity section of this MD&A.
Management The objective of the Company’s enterprise credit risk management strategy is to identify, quantify, and manage credit risk in aggregate and to limit potential losses in accordance with the Company's credit risk management policy. The Company manages its credit risk by managing aggregations of risk, holding a diversified mix of issuers and counterparties across its investment, reinsurance, and insurance portfolios and limiting exposure to any specific reinsurer or counterparty. Potential credit losses can be mitigated through diversification (e.g., geographic regions, asset types, industry sectors), hedging and the use of collateral to reduce net credit exposure.
The Company manages credit risk through the use of various surveillance, analyses and governance processes. The investment and reinsurance areas have formal policies and procedures for counterparty approvals and authorizations, which establish criteria defining minimum levels of creditworthiness and financial stability for eligible counterparties. Potential investments are subject to underwriting reviews and private securities are subject to management approval. Mitigation strategies vary across the three sources of credit risk, but may include:
•Investing in a portfolio of high-quality and diverse securities;
•Selling investments subject to credit risk;
•Hedging through use of credit default swaps;
•Clearing derivative transactions through central clearing houses that require daily variation margin;
•Entering into derivative and reinsurance contracts only with strong creditworthy institutions;
•Requiring collateral; and
•Non-renewing policies/contracts or reinsurance treaties.
The Company has developed credit exposure thresholds which are based upon counterparty ratings. Aggregate counterparty credit quality and exposure are monitored on a daily basis utilizing an enterprise-wide credit exposure information system that contains data on issuers, ratings, exposures, and credit limits. Exposures are tracked on a current and potential basis and aggregated by ultimate parent of the counterparty across investments, reinsurance receivables, insurance products with credit risk, and derivatives.
As of December 31, 2021, the Company had no investment exposure to any credit concentration risk of a single issuer or counterparty greater than 10% of the Company's stockholders' equity, other than the U.S. government and certain U.S. government agencies. For further discussion of concentration of credit risk in the investment portfolio, see the Concentration of Credit Risk section in Note 6 - Investments of Notes to Consolidated Financial Statements.
99
Part II - Item 7. Management's Discussion and Analysis of Financial Condition and Results of Operations
Assets and Liabilities Subject to Credit Risk
Investments Essentially all of the Company's invested assets are subject to credit risk. In 2021, there were net credit recoveries on fixed maturities, AFS and a decrease in the ACL on mortgage loans of $4 and $9 respectively, primarily due to an improved economic environment. In 2020, there were net credit losses on fixed maturities, AFS and an increase in the ACL on mortgage loans of $28 and $19 respectively, due primarily to the negative economic impacts resulting from the pandemic. Refer to the Investment Portfolio Risk section of Financial Risk Management under “Credit Losses on Fixed Maturities, AFS and Intent-to-Sell Impairments" and "ACL on Mortgage Loans”.
Reinsurance recoverables Reinsurance recoverables, net of an allowance for uncollectible reinsurance, were $6,523 and $6,011 as of December 31, 2021 and 2020 respectively. Refer to the Enterprise Risk Management section of the MD&A under “Reinsurance as a Risk Management Strategy.”
Premiums receivable and agents' balances Premiums receivable and agents’ balances, net of an ACL, were $4,445 and $4,268, as of December 31, 2021 and 2020, respectively. For a discussion regarding collectibility of these balances, see Note 8 - Premiums Receivable and Agents' Balances of Notes to Consolidated Financial Statements.
Credit Risk of Derivatives
The Company uses various derivative counterparties in executing its derivative transactions. The use of counterparties creates credit risk that the counterparty may not perform in accordance with the terms of the derivative transaction.
Downgrades to the credit ratings of the Company’s insurance operating companies may have adverse implications for its use of derivatives. In some cases, downgrades may give derivative counterparties for OTC derivatives and clearing brokers for OTC-cleared derivatives the right to cancel and settle outstanding derivative trades or require additional collateral to be posted. In addition, downgrades may result in counterparties and clearing brokers becoming unwilling to engage in or clear additional derivatives or may require additional collateralization before entering into any new trades.
Managing the Credit Risk of Counterparties to Derivative Instruments
The Company also has derivative counterparty exposure policies which limit the Company’s exposure to credit risk. The Company monitors counterparty exposure on a monthly basis to ensure compliance with Company policies and statutory limitations. The Company’s policies with respect to derivative counterparty exposure establishes market-based credit limits, favors long-term financial stability and creditworthiness of the counterparty and typically requires credit enhancement/credit risk reducing agreements, which are monitored and evaluated by the Company’s risk management team and reviewed by senior management.
The Company minimizes the credit risk of derivative instruments by entering into transactions with high quality counterparties primarily rated A or better. The Company also generally requires that OTC derivative contracts be governed by an International
Swaps and Derivatives Association ("ISDA") Master Agreement, which is structured by legal entity and by counterparty and permits right of offset. The Company enters into credit support annexes in conjunction with the ISDA agreements, which require daily collateral settlement based upon agreed upon thresholds.
The Company also has derivative counterparty exposure policies which limit the Company’s exposure to credit risk. Credit exposures are generally quantified based on the prior business day’s net fair value, including income accruals, of all derivative positions transacted with a single counterparty for each separate legal entity. The notional amount of derivative contracts represents the basis upon which pay or receive amounts are calculated and are not reflective of credit risk. The Company enters into collateral arrangements in connection with its derivatives positions and collateral is pledged to or held by, or on behalf of, the Company to the extent the exposure is greater than zero, subject to minimum transfer thresholds, if applicable. In accordance with industry standards and the contractual requirements, collateral is typically settled on the same business day. For further discussion, see the Derivative Commitments section of Note 15 - Commitments and Contingencies of Notes to Consolidated Financial Statements.
Use of Credit Derivatives
The Company may also use credit default swaps to manage credit exposure or to assume credit risk to enhance yield.
Credit Risk Reduced Through Credit Derivatives
The Company uses credit derivatives to purchase credit protection with respect to a single entity or referenced index. The Company purchases credit protection through credit default swaps to economically hedge and manage credit risk of certain fixed maturity investments across multiple sectors of the investment portfolio. As of December 31, 2021 and 2020, the notional amount related to credit derivatives that purchase credit protection was $112 and $6, respectively, while the fair value was $(2) and less than $(1), respectively. These amounts do not include positions that are in offsetting relationships.
Credit Risk Assumed Through Credit Derivatives
The Company also enters into credit default swaps that assume credit risk as part of replication transactions. Replication transactions are used as an economical means to synthetically replicate the characteristics and performance of assets that are permissible investments under the Company’s investment policies. These swaps primarily reference investment grade single corporate issuers and indexes. As of December 31, 2021, the Company did not hold credit default swaps that assume credit risk. As of December 31, 2020, the notional amount related to credit derivatives that assume credit risk was $675 and the fair value was $21. These amounts do not include positions that are in offsetting relationships.
For further information on credit derivatives, see Note 7 - Derivatives of Notes to Consolidated Financial Statements.
Credit Risk of Business Operations
A portion of the Company's Commercial Lines business is written with large deductibles or under retrospectively-rated plans. Under some commercial insurance contracts with a large deductible, the Company is obligated to pay the claimant the full amount of the claim and the Company is subsequently reimbursed by the policyholder for the deductible amount. As such, the Company is subject to credit risk until reimbursement
100
Part II - Item 7. Management's Discussion and Analysis of Financial Condition and Results of Operations
is made. Retrospectively-rated policies are utilized primarily for workers' compensation coverage, whereby the ultimate premium is adjusted based on actual losses incurred. Although the premium adjustment feature of a retrospectively-rated policy substantially reduces insurance risk for the Company, it presents credit risk to the Company. The Company’s results of operations could be adversely affected if a significant portion of such policyholders failed to reimburse the Company for the deductible amount or the amount of additional premium owed under retrospectively-rated policies. The Company manages these credit risks through credit analysis, collateral requirements, and regular monitoring. For more information, see Note 8- Premiums Receivable and Agents' Balances of Notes to the Consolidated Financial Statements.
Interest Rate Risk
Interest rate risk is the risk of financial loss due to adverse changes in the value of assets and liabilities arising from movements in interest rates. Interest rate risk encompasses exposures with respect to changes in the level of interest rates, the shape of the term structure of rates and the volatility of interest rates. Interest rate risk does not include exposure to changes in credit spreads.
Sources of Interest Rate Risk The Company has exposure to interest rate risk arising from investments in fixed maturities and commercial mortgage loans, issuances by the Company of debt securities, preferred stock and similar securities, discount rate assumptions associated with the Company’s claim reserves and pension and other postretirement benefit obligations, and assets that support the Company's pension and other postretirement benefit plans.
Impact Changes in interest rates from current levels can have both favorable and unfavorable effects for the Company.
| Change in Interest Rates | Favorable Effects | Unfavorable Effects | ||||||
| Ý | •Additional net investment income due to reinvesting at higher yields and higher yields on variable rate securities | •Decrease in the fair value of the fixed income investment portfolio | ||||||
•Higher interest expense on variable rate debt obligations | ||||||||
| Þ | •Increase in the fair value of the fixed income investment portfolio | •Lower net investment income due to reinvesting at lower yields and lower yields on variable rate securities | ||||||
•Lower interest expense on variable rate debt obligations | •Acceleration in paydowns and prepayments or calls of certain mortgage-backed and municipal securities | |||||||
Management The Company manages its exposure to interest rate risk by constructing investment portfolios that seek
to protect the Company from the economic impact associated with changes in interest rates by setting portfolio duration targets that are aligned with the duration of the liabilities that they support. The Company analyzes interest rate risk using various models including parametric models and cash flow simulation under various market scenarios of the liabilities and their supporting investment portfolios. Key metrics that the Company uses to quantify its exposure to interest rate risk inherent in its invested assets and the associated liabilities include duration, convexity and key rate duration.
The Company primarily utilizes interest rate swaps and, to a lesser extent, futures to mitigate interest rate risk associated with its investment portfolio or liabilities and to manage portfolio duration. Interest rate swaps are primarily used to convert interest receipts or payments to a fixed or variable rate. The use of such swaps enables the Company to customize contract terms and conditions to desired objectives and manage the duration profile within established tolerances. As of December 31, 2021 and 2020, notional amounts pertaining to derivatives utilized to manage interest rate risk, including offsetting positions, totaled $9.9 billion and $10.7 billion, respectively, and primarily relate to hedging invested assets. The fair value of these derivatives was $(46) and $(69) as of December 31, 2021 and 2020, respectively.
Assets and Liabilities Subject to Interest Rate Risk
Fixed income investments The fair value of fixed income investments, which include fixed maturities, commercial mortgage loans, and short-term investments, was $51.9 billion and $52.8 billion at December 31, 2021 and 2020, respectively. The weighted average duration of the portfolio, including derivative instruments, was approximately 4.3 years and 4.9 years as of December 31, 2021 and 2020, respectively. Changes in the fair value of fixed maturities due to changes in interest rates are reflected as a component of AOCI.
Long-term debt obligations The Company's variable rate debt obligations will generally result in increased interest expense as a result of higher interest rates; the inverse is true during a declining interest rate environment. Changes in the value of long-term debt as a result of changes in interest rates will impact the fair value of these instruments but not the carrying value in the Company's Consolidated Balance Sheets.
Group life and disability product liabilities The cash outflows associated with contracts issued by the Company's Group Benefits segment, primarily group life and short and long-term disability policy liabilities, are not interest rate sensitive but vary based on timing. Though the aggregate cash flow payment streams are relatively predictable, these products rely upon actuarial pricing assumptions (including mortality and morbidity) and have an element of cash flow uncertainty. As of December 31, 2021 and 2020, the Company had $8,609 and $8,653, respectively of reserves for group life and disability contracts. Changes in the value of the liabilities as a result of changes in interest rates will impact the fair value of these instruments but not the carrying value in the Company's Consolidated Balance Sheets.
101
Part II - Item 7. Management's Discussion and Analysis of Financial Condition and Results of Operations
Pension and other postretirement benefit obligations The Company’s pension and other postretirement benefit obligations are exposed to interest rate risk based upon the sensitivity of present value obligations to changes in liability discount rates as well as the sensitivity of the fair value of investments in the plan portfolios to changes in interest rates. The discount rate assumption is based upon an interest rate yield curve that reflects high-quality fixed income investments consistent with the maturity profile of the expected liability cash flows. The Company is exposed to the risk of having to make additional plan contributions if the plans’ investment returns, including from investments in fixed maturities, are lower than expected. (For further discussion of discounting pension and other postretirement benefit obligations, refer to Note 19 - Employee Benefit Plans of Notes to Consolidated Financial Statements.)
Interest Rate Sensitivity
Group Life and Disability Reserves and Invested Assets Supporting Them
Included in the following table is the before tax change in the net economic value of contracts issued by the Company’s Group Benefits segment, primarily group life and disability, for which fixed valuation discount rate assumptions are established based upon investment returns assumed in pricing, along with the corresponding invested assets. Also included in this analysis are the interest rate sensitive derivatives used by the Company to hedge its exposure to interest rate risk in the investment portfolios supporting these contracts. This analysis does not include the assets and corresponding liabilities of other insurance products such as automobile, property, workers' compensation and general liability insurance. Certain financial instruments, such as limited partnerships and other alternative investments, have been omitted from the analysis as the interest rate sensitivity of these investments is generally lower and less predictable than fixed income investments. The calculation of the estimated hypothetical change in net economic value below assumes a 100 basis point upward and downward parallel shift in the yield curve.
The selection of the 100 basis point parallel shift in the yield curve was made only as an illustration of the potential hypothetical impact of such an event and should not be construed as a prediction of future market events. Actual results could differ materially from those illustrated below due to the nature of the estimates and assumptions used in the analysis. The Company’s sensitivity analysis calculation assumes that the composition of invested assets and liabilities remain materially consistent throughout the year and that the current relationship between short-term and long-term interest rates will remain constant over time. As a result, these calculations may not fully capture the impact of portfolio re-allocations, significant product sales or non-parallel changes in interest rates.
Interest Rate Sensitivity of Group Benefits Short and Long-term Disability Reserves and Invested Assets Supporting Them
| Change in Net Economic Value as of December 31, | ||||||||||||||
| 2021 | 2020 | |||||||||||||
| Basis point shift | -100 | +100 | -100 | +100 | ||||||||||
| Increase (decrease) in economic value, before tax | $ | 101 | $ | (94) | $ | 137 | $ | (133) | ||||||
The carrying value of assets related to the businesses included in the table above was $11.3 billion and $12.1 billion, as of December 31, 2021 and 2020, respectively, and included fixed maturities, commercial mortgage loans and short-term investments. The assets are monitored and managed within set duration guidelines and are evaluated on a daily basis, as well as annually, using scenario simulation techniques in compliance with regulatory requirements.
Invested Assets not Supporting Group Life and Disability Reserves
The following table provides an analysis showing the estimated before tax change in the fair value of the Company’s investments and related derivatives, excluding assets supporting group life and disability reserves which are included in the table above, assuming 100 basis point upward and downward parallel shifts in the yield curve as of December 31, 2021 and 2020. Certain financial instruments, such as limited partnerships and other alternative investments, have been omitted from the analysis as the interest rate sensitivity of these investments is generally lower and less predictable than fixed income investments.
Interest Rate Sensitivity of Invested Assets Not Supporting Group Benefits Short and Long-term Disability Reserves
| Change in Fair Value as of December 31, | ||||||||||||||
| 2021 | 2020 | |||||||||||||
| Basis point shift | -100 | +100 | -100 | +100 | ||||||||||
| Increase (decrease) in fair value, before tax | $ | 1,841 | $ | (1,730) | $ | 2,054 | $ | (1,906) | ||||||
The carrying value of fixed maturities, commercial mortgage loans and short-term investments related to the businesses included in the table above was $40.6 billion and $40.7 billion as of December 31, 2021 and 2020, respectively.
Long-term Debt
A 100 basis point parallel decrease in the yield curve would result in an increase in the fair value of long-term debt by $732 and $670 as of December 31, 2021 and 2020, respectively. A 100 basis point parallel increase in the yield curve would result in a decrease in the fair value of long-term debt by $600 and $551 as of December 31, 2021 and 2020, respectively. Changes in the value of long-term debt as a result of changes in interest rates will not impact the carrying value in the Company's Consolidated Balance Sheets.
Pension and Other Postretirement Plan Obligations
A 100 basis point parallel decrease in the yield curve would
102
Part II - Item 7. Management's Discussion and Analysis of Financial Condition and Results of Operations
impact both the value of the underlying pension assets and the value of the liabilities, resulting in an increase in the unfunded liabilities (or decrease in asset) for pension and other postretirement plan obligations of $36 and $196 as of December 31, 2021 and 2020, respectively. A 100 basis point parallel increase in the yield curve would have the inverse effect and result in a decrease in the unfunded liabilities (or increase in assets) for pension and other postretirement plan obligations of $17 and $148 as of December 31, 2021 and 2020, respectively. Gains or losses due to changes in interest rates on the pension and postretirement plan obligations are recorded within AOCI and are amortized into the actuarial loss component of net periodic benefit cost when they exceed a threshold.
Discontinuation of LIBOR In July 2017, the U.K. Financial Conduct Authority ("FCA") announced that by the end of 2021 it intended to stop persuading or compelling banks to report information used to set LIBOR. On March 5, 2021, the FCA announced that publication of certain LIBOR settings in currencies other than U.S. dollars would cease immediately after December 31, 2021, and that publication of U.S. dollar LIBOR on a representative basis would cease for the one-week and two-month settings immediately after December 31, 2021 and for the remaining U.S. dollar settings immediately after June 30, 2023. Although the most widely used settings of U.S. dollar LIBOR continue to be published and used in existing transactions, regulatory pressures and other factors have resulted in a general decline in new U.S. dollar LIBOR-based transactions. The Company continues to monitor the potential impacts of the discontinuation of LIBOR, which is used as a benchmark or reference rate for certain investments and derivatives the Company owns and floating rate debt the Company has issued.
The Company has identified three principal types of outstanding contracts that may be affected by the discontinuance of or transition from LIBOR to an alternative reference rate, including floating rate fixed maturity investments the Company holds in its investment portfolio; derivative instruments that hedge interest rate risk; and one class of junior subordinated debentures that mature after June 30, 2023.
•Using our best estimate of expected future cash flows including prepayments and maturities, the book value of LIBOR referenced floating rate fixed maturities that the Company owns as of December 31, 2021 and that the Company expects to be outstanding after June 2023 is $4 billion. The Company has performed a review of the LIBOR replacement language on these assets and believes that greater than 90% have language that supports a transition to a new standard benchmark rate. The Company will continue to assess the remaining holdings and work with counterparties, as appropriate, to determine LIBOR replacement language or manage the assets in other ways, such as through asset sales.
•The notional amount of derivative instruments as of December 31, 2021 with a floating rate component that references LIBOR that the Company expects to be outstanding after June 30, 2023, considering maturities, is $8.1 billion, with $7.9 billion being cleared through an exchange or clearinghouse. The Company anticipates that substantially all existing derivatives referencing LIBOR, whether or not cleared through an exchange or clearing
house, will transition from LIBOR to SOFR or other market alternative rates in line with new market standards.
•The Company has issued $1.1 billion of junior subordinated debentures that mature after June 30, 2023 with LIBOR referenced floating interest rates. The Company expects to call its $600 of 7.875% junior subordinated debentures at par in April of 2022 and, for the $500 of 3 month LIBOR + 2.125% notes, is assessing options to manage the risk associated with the transition away from LIBOR.
The uncertainty regarding the continued use and reliability of LIBOR, including the timing of such transition, could reduce the value of some of our floating rate fixed maturity investments and increase the interest the Company pays on the junior subordinated debentures.
There is also a risk that certain derivatives may no longer qualify for hedge accounting if reference rates change on derivative contracts but the reference interest rate of the instruments being hedged do not change in a substantially similar manner, particularly for cash flow hedges of floating rate investments the Company owns and junior subordinated debentures the Company has issued. The loss of hedge accounting could result in the recognition of gains or losses on derivatives in the income statement rather than in accumulated other comprehensive income. The Company has adopted the FASB's temporary guidance which allows for contract modifications made solely due to rate reform (such as replacing LIBOR with another reference rate) as continuations of existing contracts and to maintain hedge accounting when the hedging effectiveness between the financial instrument and its hedge is only affected by the change to the reference rate. The FASB is deliberating revised guidance which would extend the accounting relief for contract modifications made and hedge relationships entered into or evaluated through December 31, 2024, after which there is uncertainty whether certain outstanding derivative contracts will continue to qualify for hedge accounting either because the replacement rate of the financial instrument being hedged is not sufficiently matched to the reference rate of the derivative contract or because replacement rate language for the hedged instrument has not been determined. For a discussion of risks related to the discontinuance of LIBOR, see Part I, Item 1A, - Risk Factors for the risk factor "The discontinuance of LIBOR may adversely affect the value of certain investments we hold and floating rate securities we have issued, and another other assets or liabilities whose value may be tied to LIBOR."
Equity Risk
Equity risk is the risk of financial loss due to changes in the value of global equities or equity indices.
Sources of Equity Risk
The Company has exposure to equity risk from invested assets, assets that support the Company’s pension and other postretirement benefit plans, and fee income derived from Hartford Funds assets under management.
103
Part II - Item 7. Management's Discussion and Analysis of Financial Condition and Results of Operations
Impact The investment portfolio is exposed to losses from market declines affecting equity securities and derivatives, which could negatively impact the Company's reported earnings. In addition, investments in limited partnerships and other alternative investments generally have a level of correlation to domestic equity market levels and can expose the Company to losses in earnings if valuations decline; however, earnings impacts are recognized on a lag as results from private equity investments and other funds are generally reported on a three-month delay. For assets supporting pension and other postretirement benefit plans, the Company may be required to make additional plan contributions if equity investments in the plan portfolios decline in value. Hartford Funds earnings are also significantly influenced by the U.S. and other equity markets. Generally, declines in equity markets will reduce the value of average daily assets under management and the amount of fee income generated from those assets. Increases in equity markets will generally have the inverse impact.
Management The Company uses various approaches in managing its equity exposure, including limits on the proportion of assets invested in equities, diversification of the equity portfolio, and, at times, hedging of changes in equity indices. For assets supporting pension and other postretirement benefit plans, the asset allocation mix is reviewed on a periodic basis. In order to minimize risk, the pension plans maintain a listing of permissible and prohibited investments and impose concentration limits and investment quality requirements on permissible investment options.
Assets and Liabilities Subject to Equity Risk
Investment portfolio The investment portfolio is exposed to losses from market declines affecting equity securities and derivatives, and certain alternative assets and limited partnerships. Generally, declines in equity markets will reduce the value of these types of investments and could negatively impact the Company’s earnings while increases in equity will have the inverse impact. For equity securities, the changes in fair value are reported in net realized gains and losses. For alternative assets and limited partnerships, the Company's share of earnings for the period is recorded in net investment income, though typically on a delay based on the
availability of the underlying financial statements. For a discussion of equity sensitivity, see below.
Assets supporting pension and other postretirement benefit plans The Company may be required to make additional plan contributions if equity investments in the plan portfolios decline in value. For a discussion of equity sensitivity, see below.
Declines in value are recognized as unrealized losses in AOCI. Increases in equity markets are recognized as unrealized gains in AOCI. Unrealized gains and losses in AOCI are amortized into the actuarial loss component of net periodic benefit cost when they exceed a threshold. For further discussion of equity risk associated with the pension plans, see Note 19 - Employee Benefit Plans of Notes to Consolidated Financial Statements.
Assets under management Assets under management in Hartford Funds may decrease in value during equity market declines, which would result in lower earnings because fee income is earned based upon the value of assets under management.
Equity Sensitivity
Investment portfolio and the assets supporting pension and other postretirement benefit plans
Included in the following tables are the estimated before tax change in the economic value of the Company’s invested assets and assets supporting pension and other postretirement benefit plans with sensitivity to equity risk. The calculation of the hypothetical change in economic value below assumes a 20% upward and downward shock to the Standard & Poor's 500 Composite Price Index ("S&P 500"). For limited partnerships and other alternative investments, the movement in economic value is calculated using a beta analysis largely derived from historical experience relative to the S&P 500.
The selection of the 20% shock to the S&P 500 was made only as an illustration of the potential hypothetical impact of such an event and should not be construed as a prediction of future market events. Actual results could differ materially from those illustrated below due to the nature of the estimates and assumptions used in the analysis. These calculations do not capture the impact of portfolio re-allocations.
Equity Sensitivity
| As of December 31, 2021 | As of December 31, 2020 [1] | ||||||||||||||||||||||
| Shock to S&P 500 | Shock to S&P 500 | ||||||||||||||||||||||
| (Before tax) | Fair Value | +20% | -20% | Fair Value | +20% | -20% | |||||||||||||||||
| Investment Portfolio | $ | 5,447 | $ | 641 | $ | (641) | $ | 3,520 | $ | 397 | $ | (397) | |||||||||||
| Assets supporting pension and other postretirement benefit plans | $ | 1,245 | $ | 167 | $ | (167) | $ | 1,573 | $ | 240 | $ | (240) | |||||||||||
[1]Table excludes the Company's investment in Hopmeadow Holdings LP which was reported in other assets on the Company's Consolidated Balance Sheets prior to being sold on June 30, 2021.
Hartford Funds assets under management
Hartford Funds earnings are significantly influenced by the U.S. and other equity markets. If equity markets were to hypothetically decline 20% and remain depressed for one year, the estimated before tax impact on reported earnings for that one year period is approximately $65 as of December 31, 2021.
The selection of the 20% shock to the S&P 500 was made only as an illustration of the potential hypothetical impact of such an event and should not be construed as a prediction of future market events. Actual results could differ materially due to the nature of the estimates and assumptions used in the analysis.
104
Part II - Item 7. Management's Discussion and Analysis of Financial Condition and Results of Operations
Foreign Currency Exchange Risk
Foreign currency exchange risk is the risk of financial loss due to changes in the relative value between currencies.
Sources of Currency Risk The Company has foreign currency exchange risk in non-U.S. dollar denominated cash, fixed maturities, equities, and derivative instruments. In addition, the Company has non-U.S. subsidiaries, some with functional currencies other than U.S. dollar, and which transact business in multiple currencies resulting in assets and liabilities denominated in foreign currencies.
Impact Changes in relative values between currencies can create variability in cash flows and realized or unrealized gains and losses on changes in the fair value of assets and liabilities. The impact on the fair value of fixed maturities, AFS due to changes in foreign currency exchange rates, in relation to functional currency, is reported in unrealized gains or losses as part of other comprehensive income. The realization of gains or losses resulting from investment sales or from changes in investments that record changes in fair value through the income statement due to changes in foreign currency exchange rates is reflected through net realized gains and losses.
In regards to insurance and reinsurance contracts that the Company enters into for which we are obligated to pay losses in a foreign currency, the impact of changes in foreign currency exchange rates on assets and liabilities related to these contracts is reflected through net realized gains and losses. These assets or liabilities include, but are not limited to, cash and cash equivalents, premiums receivable, reinsurance recoverables, and unpaid losses and loss adjustment expenses. Additionally, the Company translates the assets, liabilities, and income of non-U.S. dollar functional currency legal entities into U.S. dollar. This translation amount is reported as a component of other comprehensive income.
Management The Company manages its foreign currency exchange risk primarily through asset-liability matching and through the use of derivative instruments. However, legal entity capital is invested in local currencies in order to satisfy regulatory requirements and to support local insurance operations. The foreign currency exposure of non-U.S. dollar denominated investments will most commonly be reduced through the sale of the assets or through hedges using foreign currency swaps and forwards.
Investment portfolio The Company is exposed to foreign exchange risk affecting non-U.S. dollar denominated cash, fixed maturities, equities and derivative instruments. Changes in relative values between currencies can positively or negatively impact net realized gains and losses or unrealized gains (losses) as part of other comprehensive income.
Assets supporting pension plan Changes in relative values between currencies can positively or negatively impact unrealized gains and losses in AOCI. Unrealized gains and losses in AOCI are amortized into the actuarial loss component of net periodic benefit cost when they exceed a threshold. As of December 31, 2021 and 2020, the Company had pension plan assets of $97 and $95, respectively, of non-U.S. dollar investments in multiple currencies. These amounts are excluded from the sensitivity analysis below.
Insurance contract related assets and liabilities The Company has non-U.S. dollar denominated insurance and reinsurance contracts and associated premiums receivable, reinsurance recoverables and unpaid losses and loss adjustment expenses, that are exposed to foreign exchange risk. For contracts that are within U.S, dollar functional currency legal entities, changes in foreign currency exchange rates can positively or negatively impact net realized gains and losses. For contracts within non-U.S. dollar functional currency legal entities, changes in foreign currency exchange rates can positively or negatively impact other comprehensive income.
Foreign Currency Sensitivity
For the Company’s primary currencies that create foreign exchange risk, the following table provides the estimated impact of a hypothetical 10% unfavorable change in exchange rates. Actual results could differ materially due to the nature of the estimates and assumptions used in the analysis. The amounts presented are in U.S. dollars and before tax.
Foreign Currency Sensitivity [1]
| GBP | CAD | 10% Unfavorable Change | |||||||||
| December 31, 2021 | |||||||||||
| Net assets (liabilities) | $ | 287 | $ | 132 | $ | (38) | |||||
| December 31, 2020 | |||||||||||
| Net assets (liabilities) | $ | 296 | $ | 189 | $ | (44) | |||||
[1]Amount excludes currencies where the value of net assets in U.S. dollar equivalent is less than 1% of total net assets of the Company.
105
Part II - Item 7. Management's Discussion and Analysis of Financial Condition and Results of Operations
Financial Risk on U.S. Statutory Capital
U.S. Statutory surplus amounts and RBC ratios may increase or decrease in any period depending upon a variety of factors and may be compounded in extreme scenarios or if multiple factors occur at the same time. At times, the impact of changes in certain market factors or a combination of multiple factors on RBC ratios can be counterintuitive. Factors include:
•A decrease in the value of certain fixed-income and equity securities in our investment portfolio, due in part to credit spreads widening, an increase in interest rates, or a decline in equity market levels, may result in a decrease in statutory surplus and RBC ratios;
•A decline in investment yields may reduce our net investment income, which may result in a decrease in statutory surplus and RBC ratios;
•Decreases in the value of certain derivative instruments that do not get hedge accounting, may reduce statutory surplus and RBC ratios; and
•Non-market factors can also impact the amount and volatility of either our actual or potential obligation, as well as the related statutory surplus and RBC ratios.
Most of these factors are outside of the Company’s control. Among other factors, rating agencies consider the level of statutory capital and surplus of our U.S. insurance subsidiaries as well as the level of a measure of GAAP capital held by the Company in determining the Company’s financial strength and credit ratings. Rating agencies may implement changes to their internal models that have the effect of increasing or decreasing the amount of capital we must hold in order to maintain our current ratings.
Investment Portfolio Risk
The following table presents the Company’s fixed maturities, AFS, by credit quality. The credit ratings referenced throughout this section are based on availability and are generally the midpoint of the available ratings among Moody’s, S&P, and Fitch. If no rating is available from a rating agency, then an internally developed rating is used. Accrued interest receivable
related to fixed maturities are recorded in other assets on the Consolidated Balance Sheets and are not included in the amortized cost or fair value of the fixed maturities. For further information refer to Note 6 - Investments.
Fixed Maturities, AFS by Credit Quality
| December 31, 2021 | December 31, 2020 | ||||||||||||||||||||||
| Amortized Cost | Fair Value | Percent of Total Fair Value | Amortized Cost | Fair Value | Percent of Total Fair Value | ||||||||||||||||||
| United States Government/Government agencies | $ | 5,706 | $ | 5,881 | 13.7 | % | $ | 4,872 | $ | 5,214 | 11.6 | % | |||||||||||
| AAA | 5,917 | 6,133 | 14.3 | % | 6,482 | 6,848 | 15.2 | % | |||||||||||||||
| AA | 7,279 | 7,718 | 18.0 | % | 7,840 | 8,453 | 18.8 | % | |||||||||||||||
| A | 10,277 | 10,962 | 25.6 | % | 10,500 | 11,595 | 25.7 | % | |||||||||||||||
| BBB | 9,196 | 9,708 | 22.7 | % | 9,831 | 10,856 | 24.1 | % | |||||||||||||||
| BB & below | 2,413 | 2,445 | 5.7 | % | 2,036 | 2,069 | 4.6 | % | |||||||||||||||
| Total fixed maturities, AFS | $ | 40,788 | $ | 42,847 | 100.0 | % | $ | 41,561 | $ | 45,035 | 100.0 | % | |||||||||||
The fair value of fixed maturities, AFS decreased as compared to December 31, 2020, primarily due a decrease in valuations due to higher interest rates, partially offset by tighter credit spreads. The decline was also due to the reinvestment into other asset classes.
Fixed maturities, FVO, included within other investments on the Consolidated Balance Sheets, are not included in the preceding table. For further discussion on FVO securities, see Note 5 - Fair Value Measurements of Notes to Consolidated Financial Statements.
106
Part II - Item 7. Management's Discussion and Analysis of Financial Condition and Results of Operations
Fixed Maturities, AFS by Type
| December 31, 2021 | December 31, 2020 | ||||||||||||||||||||||||||||||||||||||||
| Amortized Cost | ACL | Gross Unrealized Gains | Gross Unrealized Losses | Fair Value | Percent of Total Fair Value | Amortized Cost | ACL | Gross Unrealized Gains | Gross Unrealized Losses | Fair Value | Percent of Total Fair Value | ||||||||||||||||||||||||||||||
| Asset-backed securities ("ABS") | |||||||||||||||||||||||||||||||||||||||||
| Consumer loans | $ | 959 | $ | — | $ | 11 | $ | (2) | $ | 968 | 2.3 | % | $ | 1,396 | $ | — | $ | 35 | $ | — | $ | 1,431 | 3.2 | % | |||||||||||||||||
| Other | 166 | — | 2 | (1) | 167 | 0.4 | % | 129 | — | 4 | — | 133 | 0.3 | % | |||||||||||||||||||||||||||
| Collateralized loan obligations ("CLOs") | 3,019 | — | 8 | (2) | 3,025 | 7.1 | % | 2,780 | — | 7 | (7) | 2,780 | 6.2 | % | |||||||||||||||||||||||||||
| Commercial Mortgage-Backed Securities ("CMBS") | |||||||||||||||||||||||||||||||||||||||||
| Agency [1] | 1,390 | — | 75 | (5) | 1,460 | 3.4 | % | 1,779 | — | 117 | (6) | 1,890 | 4.2 | % | |||||||||||||||||||||||||||
| Bonds | 2,327 | — | 92 | (9) | 2,410 | 5.6 | % | 2,160 | — | 159 | (13) | 2,306 | 5.1 | % | |||||||||||||||||||||||||||
| Interest only | 238 | — | 12 | (1) | 249 | 0.6 | % | 280 | — | 10 | (2) | 288 | 0.6 | % | |||||||||||||||||||||||||||
| Corporate | |||||||||||||||||||||||||||||||||||||||||
| Basic industry | 761 | — | 34 | (5) | 790 | 1.8 | % | 727 | — | 69 | (1) | 795 | 1.8 | % | |||||||||||||||||||||||||||
| Capital goods | 1,442 | — | 84 | (9) | 1,517 | 3.5 | % | 1,488 | — | 148 | (11) | 1,625 | 3.6 | % | |||||||||||||||||||||||||||
| Consumer cyclical | 1,161 | (1) | 50 | (5) | 1,205 | 2.8 | % | 1,434 | (1) | 108 | (1) | 1,540 | 3.4 | % | |||||||||||||||||||||||||||
| Consumer non-cyclical | 2,473 | — | 134 | (8) | 2,599 | 6.1 | % | 2,878 | — | 314 | (4) | 3,188 | 7.1 | % | |||||||||||||||||||||||||||
| Energy | 1,405 | — | 99 | (2) | 1,502 | 3.5 | % | 1,474 | (1) | 147 | (4) | 1,616 | 3.6 | % | |||||||||||||||||||||||||||
| Financial services | 4,648 | — | 214 | (20) | 4,842 | 11.3 | % | 4,523 | (21) | 398 | (4) | 4,896 | 10.9 | % | |||||||||||||||||||||||||||
| Tech./comm. | 2,658 | — | 216 | (11) | 2,863 | 6.7 | % | 2,651 | — | 370 | (3) | 3,018 | 6.7 | % | |||||||||||||||||||||||||||
| Transportation | 744 | — | 43 | (3) | 784 | 1.8 | % | 747 | — | 85 | (3) | 829 | 1.8 | % | |||||||||||||||||||||||||||
| Utilities | 1,917 | — | 141 | (8) | 2,050 | 4.8 | % | 1,999 | — | 250 | — | 2,249 | 5.0 | % | |||||||||||||||||||||||||||
| Other | 535 | — | 23 | (3) | 555 | 1.3 | % | 480 | — | 37 | — | 517 | 1.1 | % | |||||||||||||||||||||||||||
| Foreign govt./govt. agencies | 883 | — | 33 | (6) | 910 | 2.1 | % | 842 | — | 77 | — | 919 | 2.0 | % | |||||||||||||||||||||||||||
| Municipal bonds | |||||||||||||||||||||||||||||||||||||||||
| Taxable | 1,079 | — | 83 | (2) | 1,160 | 2.7 | % | 1,084 | — | 109 | (1) | 1,192 | 2.6 | % | |||||||||||||||||||||||||||
| Tax-exempt | 6,394 | — | 704 | (1) | 7,097 | 16.6 | % | 7,480 | — | 831 | — | 8,311 | 18.5 | % | |||||||||||||||||||||||||||
| Residential Mortgage-Backed Securities ("RMBS") | |||||||||||||||||||||||||||||||||||||||||
| Agency | 1,337 | — | 44 | (11) | 1,370 | 3.2 | % | 1,829 | — | 92 | (2) | 1,919 | 4.3 | % | |||||||||||||||||||||||||||
| Non-agency | 2,101 | — | 11 | (16) | 2,096 | 4.9 | % | 1,755 | — | 41 | (1) | 1,795 | 4.0 | % | |||||||||||||||||||||||||||
| Alt-A | 12 | — | 1 | — | 13 | — | % | 27 | — | 2 | — | 29 | 0.1 | % | |||||||||||||||||||||||||||
| Sub-prime | 160 | — | 4 | — | 164 | 0.4 | % | 355 | — | 9 | — | 364 | 0.8 | % | |||||||||||||||||||||||||||
| U.S. Treasuries | 2,979 | — | 86 | (14) | 3,051 | 7.1 | % | 1,264 | — | 141 | — | 1,405 | 3.1 | % | |||||||||||||||||||||||||||
| Total fixed maturities, AFS | $ | 40,788 | $ | (1) | $ | 2,204 | $ | (144) | $ | 42,847 | 100.0 | % | $ | 41,561 | $ | (23) | $ | 3,560 | $ | (63) | $ | 45,035 | 100.0 | % | |||||||||||||||||
| Fixed maturities, FVO [2] | $ | 160 | $ | — | |||||||||||||||||||||||||||||||||||||
[1]Includes securities with pools of loans issued by the Small Business Administration which are backed by the full faith and credit of the U.S. government..
[2]Included within other investments on the Consolidated Balance Sheets.
The fair value of fixed maturities, AFS decreased as compared with December 31, 2020, primarily due to a decrease in valuations due to higher interest rates, partially offset by tighter
credit spreads. The decline was also due to the reinvestment into other asset classes.The Company primarily decreased holdings of tax-exempt municipal bonds, agency and sub-prime
107
Part II - Item 7. Management's Discussion and Analysis of Financial Condition and Results of Operations
RMBS, consumer cyclical and non-cyclical corporate bonds, consumer loans, and agency CMBS, while primarily increasing holdings in U.S. treasuries, non-agency RMBS, CLOs, and CMBS bonds.
Commercial & Residential Real Estate
The following table presents the Company’s exposure to CMBS and RMBS by credit quality included in the preceding Fixed Maturities, AFS by Type table.
Exposure to CMBS and RMBS as of December 31, 2021
| AAA | AA | A | BBB | BB and Below | Total | |||||||||||||||||||||||||||||||||
| Amortized Cost | Fair Value | Amortized Cost | Fair Value | Amortized Cost | Fair Value | Amortized Cost | Fair Value | Amortized Cost | Fair Value | Amortized Cost | Fair Value | |||||||||||||||||||||||||||
| CMBS | ||||||||||||||||||||||||||||||||||||||
| Agency [1] | $ | 1,380 | $ | 1,450 | $ | 10 | $ | 10 | $ | — | $ | — | $ | — | $ | — | $ | — | $ | — | $ | 1,390 | $ | 1,460 | ||||||||||||||
| Bonds | 950 | 995 | 571 | 593 | 439 | 453 | 182 | 186 | 185 | 183 | 2,327 | 2,410 | ||||||||||||||||||||||||||
| Interest Only | 134 | 141 | 92 | 96 | 1 | 1 | 10 | 10 | 1 | 1 | 238 | 249 | ||||||||||||||||||||||||||
| Total CMBS | 2,464 | 2,586 | 673 | 699 | 440 | 454 | 192 | 196 | 186 | 184 | 3,955 | 4,119 | ||||||||||||||||||||||||||
| RMBS | ||||||||||||||||||||||||||||||||||||||
| Agency | 1,315 | 1,347 | 22 | 23 | — | — | — | — | — | — | 1,337 | 1,370 | ||||||||||||||||||||||||||
| Non-Agency | 840 | 845 | 554 | 552 | 477 | 473 | 199 | 196 | 31 | 30 | 2,101 | 2,096 | ||||||||||||||||||||||||||
| Alt-A | — | — | — | — | — | — | — | — | 12 | 13 | 12 | 13 | ||||||||||||||||||||||||||
| Sub-Prime | 6 | 7 | 34 | 35 | 47 | 48 | 24 | 24 | 49 | 50 | 160 | 164 | ||||||||||||||||||||||||||
| Total RMBS | 2,161 | 2,199 | 610 | 610 | 524 | 521 | 223 | 220 | 92 | 93 | 3,610 | 3,643 | ||||||||||||||||||||||||||
| Total CMBS & RMBS | $ | 4,625 | $ | 4,785 | $ | 1,283 | $ | 1,309 | $ | 964 | $ | 975 | $ | 415 | $ | 416 | $ | 278 | $ | 277 | $ | 7,565 | $ | 7,762 | ||||||||||||||
Exposure to CMBS and RMBS as of December 31, 2020
| AAA | AA | A | BBB | BB and Below | Total | |||||||||||||||||||||||||||||||||
| Amortized Cost | Fair Value | Amortized Cost | Fair Value | Amortized Cost | Fair Value | Amortized Cost | Fair Value | Amortized Cost | Fair Value | Amortized Cost | Fair Value | |||||||||||||||||||||||||||
| CMBS | ||||||||||||||||||||||||||||||||||||||
| Agency [1] | $ | 1,771 | $ | 1,882 | $ | 8 | $ | 8 | $ | — | $ | — | $ | — | $ | — | $ | — | $ | — | $ | 1,779 | $ | 1,890 | ||||||||||||||
| Bonds | 1,009 | 1,101 | 541 | 582 | 423 | 430 | 170 | 179 | 17 | 14 | 2,160 | 2,306 | ||||||||||||||||||||||||||
| Interest Only | 177 | 183 | 90 | 93 | 8 | 7 | 4 | 4 | 1 | 1 | 280 | 288 | ||||||||||||||||||||||||||
| Total CMBS | 2,957 | 3,166 | 639 | 683 | 431 | 437 | 174 | 183 | 18 | 15 | 4,219 | 4,484 | ||||||||||||||||||||||||||
| RMBS | ||||||||||||||||||||||||||||||||||||||
| Agency | 1,807 | 1,894 | 22 | 25 | — | — | — | — | — | — | 1,829 | 1,919 | ||||||||||||||||||||||||||
| Non-Agency | 1,034 | 1,063 | 371 | 380 | 313 | 315 | 36 | 36 | 1 | 1 | 1,755 | 1,795 | ||||||||||||||||||||||||||
| Alt-A | — | — | 3 | 3 | 2 | 2 | 2 | 2 | 20 | 22 | 27 | 29 | ||||||||||||||||||||||||||
| Sub-Prime | 1 | 1 | 25 | 26 | 114 | 116 | 102 | 105 | 113 | 116 | 355 | 364 | ||||||||||||||||||||||||||
| Total RMBS | 2,842 | 2,958 | 421 | 434 | 429 | 433 | 140 | 143 | 134 | 139 | 3,966 | 4,107 | ||||||||||||||||||||||||||
| Total CMBS & RMBS | $ | 5,799 | $ | 6,124 | $ | 1,060 | $ | 1,117 | $ | 860 | $ | 870 | $ | 314 | $ | 326 | $ | 152 | $ | 154 | $ | 8,185 | $ | 8,591 | ||||||||||||||
[1]Includes securities with pools of loans issued by the Small Business Administration which are backed by the full faith and credit of the U.S. government.
The Company also has exposure to commercial mortgage loans. These loans are collateralized by real estate properties that are diversified both geographically throughout the United States and by property type. These commercial loans are originated by the Company as high quality whole loans, and the Company may sell participation interests in one or more loans to third parties. A loan participation interest represents a pro-rata share in interest and principal payments generated by the participated loan, and the relationship between the Company as loan originator, lead participant and servicer and the third party
as a participant are governed by a participation agreement.
As of December 31, 2021, mortgage loans had an amortized cost of $5.4 billion and carrying value of $5.4 billion, with an ACL of $29. As of December 31, 2020, mortgage loans had an amortized cost of $4.5 billion and carrying value of $4.5 billion, with an ACL of $38. The decrease in the allowance is primarily attributable to improved economic scenarios, partially offset by an increase driven by net additions of new loans.
108
Part II - Item 7. Management's Discussion and Analysis of Financial Condition and Results of Operations
The Company funded $1.3 billion of commercial mortgage loans with a weighted average loan-to-value (“LTV”) ratio of 57% and a weighted average yield of 2.9% during the twelve months ended December 31, 2021. The Company continues to originate commercial mortgage loans in high growth markets across the country focusing primarily on institutional-quality industrial, multi-family, and retail properties with strong LTV ratios. There were no mortgage loans held for sale as of December 31, 2021 or December 31, 2020.
Municipal Bonds
The following table presents the Company’s exposure to municipal bonds by type and weighted average credit quality included in the preceding Securities by Type table.
Available For Sale Investments in Municipal Bonds
| December 31, 2021 | December 31, 2020 | ||||||||||||||||||||||
| Amortized Cost | Fair Value | Weighted Average Credit Quality | Amortized Cost | Fair Value | Weighted Average Credit Quality | ||||||||||||||||||
| General Obligation | $ | 910 | $ | 1,031 | AA+ | $ | 1,082 | $ | 1,232 | AA+ | |||||||||||||
| Pre-refunded [1] | 487 | 519 | AAA | 889 | 940 | AAA | |||||||||||||||||
| Revenue | |||||||||||||||||||||||
| Transportation | 1,404 | 1,579 | A+ | 1,441 | 1,636 | A+ | |||||||||||||||||
| Health Care | 1,274 | 1,397 | A+ | 1,273 | 1,407 | A+ | |||||||||||||||||
| Leasing [2] | 813 | 874 | AA- | 905 | 985 | AA- | |||||||||||||||||
| Education | 670 | 748 | AA | 732 | 824 | AA | |||||||||||||||||
| Water & Sewer | 504 | 538 | AA | 644 | 694 | AA | |||||||||||||||||
| Sales Tax | 370 | 436 | AA | 394 | 464 | AA | |||||||||||||||||
| Power | 317 | 357 | A+ | 401 | 450 | A+ | |||||||||||||||||
| Housing | 98 | 103 | AA | 102 | 109 | AA+ | |||||||||||||||||
| Other | 626 | 675 | AA- | 701 | 762 | A+ | |||||||||||||||||
| Total Revenue | 6,076 | 6,707 | AA- | 6,593 | 7,331 | AA- | |||||||||||||||||
| Total Municipal | $ | 7,473 | $ | 8,257 | AA- | $ | 8,564 | $ | 9,503 | AA- | |||||||||||||
[1]Pre-refunded bonds are bonds for which an irrevocable trust containing sufficient U.S. treasury, agency, or other securities has been established to fund the remaining payments of principal and interest.
[2]Leasing revenue bonds are generally the obligations of a financing authority established by the municipality that leases facilities back to a municipality. The notes are typically secured by lease payments made by the municipality that is leasing the facilities financed by the issue. Lease payments may be subject to annual appropriation by the municipality or the municipality may be obligated to appropriate general tax revenues to make lease payments.
As of December 31, 2021, the largest issuer concentrations were the New York State Dormitory Authority, the State of California, and the Pennsylvania State Turnpike Commission, which each comprised less than 3% of the municipal bond portfolio and were primarily comprised of general obligation and revenue bonds. As of December 31, 2020, the largest issuer concentrations were the New York State Dormitory Authority, the Commonwealth of Massachusetts, and the New York City Municipal Water Finance Authority, which each comprised less than 3% of the municipal bond portfolio and were primarily comprised of general obligation and revenue bonds. In total, municipal bonds make up 14% of the fair value of the Company's investment portfolio. While COVID-19 has had an impact on many municipal issuers, credit fundamentals in this sector have broadly stabilized due to an unprecedented influx of federal relief funds and a strong economic recovery.
Limited Partnerships and Other Alternative Investments
The following table presents the Company’s investments in limited partnerships and other alternative investments which include hedge funds, real estate funds, and private equity funds. Real estate funds consist of investments primarily in real estate joint ventures and, to a lesser extent, equity funds. Private equity funds primarily consist of investments in funds whose assets typically consist of a diversified pool of investments in small to mid-sized non-public businesses with high growth potential and strong owner sponsorship, as well as limited exposure to public markets.
Income or losses on investments in limited partnerships and other alternative investments are recognized on a lag as results from private equity investments and other funds are generally reported on a three-month delay.
109
Part II - Item 7. Management's Discussion and Analysis of Financial Condition and Results of Operations
Limited Partnerships and Other Alternative Investments - Net Investment Income
| Year Ended December 31, | ||||||||||||||||||||||||||||||||||||||||||||
| 2021 | 2020 | 2019 | ||||||||||||||||||||||||||||||||||||||||||
| Amount | Yield [1] | Amount | Yield [1] | Amount | Yield [1] | |||||||||||||||||||||||||||||||||||||||
| Hedge funds | $ | 33 | 17.7 | % | $ | 9 | 7.1 | % | $ | 5 | 7.2 | % | ||||||||||||||||||||||||||||||||
| Real estate funds | 149 | 18.4 | % | 85 | 20.3 | % | 70 | 17.0 | % | |||||||||||||||||||||||||||||||||||
| Private equity funds | 456 | 51.3 | % | 106 | 12.4 | % | 126 | 16.6 | % | |||||||||||||||||||||||||||||||||||
| Other alternative investments [2] | 94 | 22.6 | % | 22 | 5.4 | % | 31 | 8.2 | % | |||||||||||||||||||||||||||||||||||
| Total | $ | 732 | 31.8 | % | $ | 222 | 12.3 | % | $ | 232 | 14.4 | % | ||||||||||||||||||||||||||||||||
[1]Yields calculated using annualized net investment income divided by the monthly average invested assets.
[2]Consists of an insurer-owned life insurance policy which is primarily invested in fixed income, private equity, and hedge funds.
Investments in Limited Partnerships and Other Alternative Investments
| December 31, 2021 | December 31, 2020 | ||||||||||||||||
| Amount | Percent | Amount | Percent | ||||||||||||||
| Hedge funds | $ | 274 | 8.2 | % | $ | 158 | 7.6 | % | |||||||||
| Real estate funds | 1,315 | 39.2 | % | 563 | 27.0 | % | |||||||||||
| Private equity and other funds | 1,256 | 37.5 | % | 944 | 45.4 | % | |||||||||||
| Other alternative investments [1] | 508 | 15.1 | % | 417 | 20.0 | % | |||||||||||
| Total | $ | 3,353 | 100.0 | % | $ | 2,082 | 100.0 | % | |||||||||
[1]Consists of an insurer-owned life insurance policy which is primarily invested in fixed income, private equity, and hedge funds.
Fixed Maturities, AFS — Unrealized Loss Aging
The total gross unrealized losses were $144 as of December 31, 2021, and have increased $81 from December 31, 2020, primarily due to higher interest rates, partially offset by tighter credit spreads. As of December 31, 2021, $141 of the gross unrealized losses were associated with fixed maturities, AFS depressed less than 20% of amortized cost. The remaining $3 of gross unrealized losses were associated with fixed maturities, AFS depressed greater than 20%. The fixed maturities, AFS depressed more than 20%, primarily related to commercial real estate securities that were purchased at tighter credit spreads.
As part of the Company’s ongoing investment monitoring process, the Company has reviewed its fixed maturities, AFS in an unrealized loss position and concluded that these fixed maturities are temporarily depressed and are expected to recover in value as the investments approach maturity or as market spreads tighten. For these fixed maturities in an unrealized loss position where an ACL has not been recorded, the Company’s best estimate of expected future cash flows are sufficient to recover the amortized cost basis of the investment. Furthermore, the Company neither has an intention to sell nor does it expect to be required to sell these investments. For further information regarding the Company’s ACL analysis, see the Credit Losses on Fixed Maturities, AFS and Intent-to-Sell Impairments section below.
Unrealized Loss Aging for Fixed Maturities, AFS
| December 31, 2021 | December 31, 2020 | ||||||||||||||||||||||||||||||||||
| Consecutive Months | Items | Amortized Cost | ACL | Unrealized Loss | Fair Value | Items | Amortized Cost | ACL | Unrealized Loss | Fair Value | |||||||||||||||||||||||||
| Three months or less | 640 | $ | 6,193 | $ | — | $ | (32) | $ | 6,161 | 102 | $ | 625 | $ | — | $ | (3) | $ | 622 | |||||||||||||||||
| Greater than three to six months | 404 | 3,249 | — | (55) | 3,194 | 46 | 367 | — | (5) | 362 | |||||||||||||||||||||||||
| Greater than six to nine months | 101 | 571 | — | (5) | 566 | 8 | 6 | — | (1) | 5 | |||||||||||||||||||||||||
| Greater than nine to eleven months | 171 | 1,041 | — | (29) | 1,012 | 186 | 1,275 | (1) | (27) | 1,247 | |||||||||||||||||||||||||
| Twelve months or more | 184 | 631 | — | (23) | 608 | 205 | 994 | — | (27) | 967 | |||||||||||||||||||||||||
| Total | 1,500 | $ | 11,685 | $ | — | $ | (144) | $ | 11,541 | 547 | $ | 3,267 | $ | (1) | $ | (63) | $ | 3,203 | |||||||||||||||||
110
Part II - Item 7. Management's Discussion and Analysis of Financial Condition and Results of Operations
Unrealized Loss Aging for Fixed Maturities, AFS Continuously Depressed Over 20%
| December 31, 2021 | December 31, 2020 | ||||||||||||||||||||||||||||
| Consecutive Months | Items | Amortized Cost | Unrealized Loss | Fair Value | Items | Amortized Cost | Unrealized Loss | Fair Value | |||||||||||||||||||||
| Three months or less | — | $ | — | $ | — | $ | — | 2 | $ | 2 | $ | (1) | $ | 1 | |||||||||||||||
| Greater than six to nine months | — | — | — | — | 1 | 46 | (10) | 36 | |||||||||||||||||||||
| Greater than nine to eleven months | — | — | — | — | 2 | 5 | (1) | 4 | |||||||||||||||||||||
| Twelve months or more | 20 | 5 | (3) | 2 | 24 | 5 | (2) | 3 | |||||||||||||||||||||
| Total | 20 | $ | 5 | $ | (3) | $ | 2 | 29 | $ | 58 | $ | (14) | $ | 44 | |||||||||||||||
Credit Losses on Fixed Maturities, AFS and Intent-to-Sell Impairments
For the year ended December 31, 2021
The Company recorded a net decrease in the ACL of $4, driven by increases in the fair value of corporate issuers that had an ACL in prior periods, partially offset by credit losses on a media/entertainment company. Unrealized losses on securities with an ACL recognized in other comprehensive income were less than $1. For further information, refer to Note 6 - Investments of Notes to Consolidated Financial Statements.
There were no intent-to-sell impairments.
The Company incorporates its best estimate of future performance using internal assumptions and judgments that are informed by economic and industry specific trends, as well as our expectations with respect to security specific developments.
Future intent-to-sell impairments or credit losses may develop as the result of changes in our intent to sell specific securities that are in an unrealized loss position or if modeling assumptions, such as macroeconomic factors or security specific developments, change unfavorably from our current modeling assumptions, resulting in lower cash flow expectations.
For the year ended December 31, 2020
The Company recorded net credit losses on fixed maturities, AFS of $28. The losses were primarily attributable to corporate fixed maturities, mainly one private regional and commercial aircraft lessor and to a lesser extent, one tax-exempt municipal bond impacted by COVID-19. Unrealized losses on securities with ACL recognized in other comprehensive income were $1.
Intent-to-sell impairments of $5 were primarily related to one corporate issuer in the energy sector and one issuer with exposure to India.
ACL on Mortgage Loans
For the year ended December 31, 2021
The Company reviews mortgage loans on a quarterly basis to estimate the ACL with changes in the ACL recorded in net realized gains and losses. Apart from an ACL recorded on individual mortgage loans where the borrower is experiencing financial difficulties, the Company records an ACL on the pool of mortgage loans based on lifetime expected credit losses. For
further information, refer to Note 6 - Investments of Notes to Consolidated Financial Statements.
The Company recorded a decrease in the ACL on mortgage loans of $9. The decrease was primarily the result of improved economic scenarios, partially offset by an increase driven by net additions of new loans. The Company did not record an ACL on any individual mortgage loans.
For the year ended December 31, 2020
The Company recorded an increase in the ACL on mortgage loans of $19. The increase in the allowance was due to the effects of the COVID-19 pandemic and its impacts on the economic forecasts, as well as lower estimated property values and operating income. The Company did not record an ACL on any individual mortgage loans.
CAPITAL RESOURCES AND LIQUIDITY
The following section discusses the overall financial strength of The Hartford and its insurance operations including their ability to generate cash flows from each of their business segments, borrow funds at competitive rates and raise new capital to meet operating and growth needs.
|SUMMARY OF CAPITAL RESOURCES AND LIQUIDITY
Capital available to the holding company as of December 31, 2021:
•$1.9 billion in fixed maturities, short-term investments, investment sales receivable and cash at the HFSG Holding Company.
•A senior unsecured revolving credit facility that provides for borrowing capacity up to $750 of unsecured credit through October 27, 2026. As of December 31, 2021, there were no borrowings outstanding.
•An intercompany liquidity agreement that allows for short-term advances of funds among the HFSG Holding Company and certain affiliates of up to $2.0 billion for liquidity and other general corporate purposes. As of December 31, 2021, there were no borrowings outstanding.
111
Part II - Item 7. Management's Discussion and Analysis of Financial Condition and Results of Operations
2022 expected dividends and other sources of capital:
The future payment of dividends from our subsidiaries is dependent on several factors including the extent to which COVID-19 impacts our business, results of operations, financial condition and liquidity
•P&C - The Company's U.S. property and casualty insurance subsidiaries have dividend capacity of $2.0 billion for 2022, with $1.3 to $1.4 billion of net dividends expected in 2022.
•Group Benefits - HLA has dividend capacity of $241 in 2022 with $175 to $200 of dividends expected in 2022.
•Hartford Funds - HFSG Holding Company expects to receive $175 to $200 in dividends from Hartford Funds in 2022.
Expected liquidity requirements for the next twelve months as of December 31, 2021:
•$210 of interest on debt;
•$21 dividends on preferred stock, subject to the discretion of the Board of Directors;
•$525 of common stockholders' dividends, subject to the discretion of the Board of Directors and before share repurchases; and
•$600 of 7.875% junior subordinated debentures expected to be called at par in April of 2022.
Expected liquidity requirements for beyond the next twelve months as of December 31, 2021:
•Interest on debt and debt repayments, see Note 14 - Debt of Notes to Consolidated Financial Statements.
•Preferred stock and common stock dividends, subject to the discretion of the Board of Directors.
Equity repurchase program:
Authorization for equity repurchases of up to $3.0 billion effective through December 31, 2022. Under the program, the Company repurchased 25.9 million shares during the period from January 1, 2021 to December 31, 2021 for $1.7 billion with $1.3 billion of authorization remaining as of December 31, 2021.
|LIQUIDITY REQUIREMENTS AND SOURCES OF CAPITAL
The Hartford Financial Services Group, Inc. ("HFSG Holding Company")
The liquidity requirements of the holding company of The Hartford Financial Services Group, Inc. will primarily be met by HFSG Holding Company’s fixed maturities; short-term investments and cash; and dividends from its subsidiaries, principally its insurance operations.
The Company maintains sufficient liquidity and has a variety of contingent liquidity resources to manage liquidity across a range of economic scenarios. We continue to expect to successfully manage our liquidity throughout the pandemic.
The HFSG Holding Company expects to continue to receive dividends from its operating subsidiaries in the future and manages capital in its operating subsidiaries to be sufficient under significant economic stress scenarios. Dividends from subsidiaries and other sources of funds at the holding company may be used to repurchase shares under the authorized share repurchase program at the discretion of management.
Under significant economic stress scenarios, the Company has the ability to meet short-term cash requirements, if needed, by borrowing under its revolving credit facility or by having its insurance subsidiaries take collateralized advances under a facility with the FHLBB. The Company could also choose to have its insurance subsidiaries sell certain highly liquid, high quality fixed maturities or the Company could issue debt in the public markets under its shelf registration.
Debt
On September 21, 2021, The Hartford issued $600 of 2.9% senior notes (“2.9% Notes”) due September 15, 2051 for net proceeds of approximately $588, after deducting underwriting discounts and expenses from the offering. Interest is payable semi-annually in arrears on March 15 and September 15, commencing March 15, 2022. The Hartford, at its option, can redeem the 2.9% Notes at any time, in whole or part, at a redemption price equal to the greater of 100% of the principal amount being redeemed or a make-whole amount based on a comparable maturity US Treasury plus 20 basis points, plus any accrued and unpaid interest, except the 2.9% Notes may be redeemed at par within six months of maturity. The Hartford intends to use the net proceeds along with other available resources to repay The Hartford's $600 7.875% junior subordinated debentures (“7.875% Notes”), which are redeemable at par on or after April 15, 2022. The Hartford expects to recognize a loss on extinguishment of debt of $9, before tax, on redemption.
On March 30, 2020, The Hartford repaid at maturity the $500 principal amount of its 5.5% senior notes.
For additional information on Debt, see Note 14 - Debt of Notes to Consolidated Financial Statements.
112
Part II - Item 7. Management's Discussion and Analysis of Financial Condition and Results of Operations
|Equity
In December 2020, the Company announced a $1.5 billion share repurchase authorization by the Board of Directors which is effective from January 1, 2021 through December 31, 2022. The authorization was increased by the Board of Directors to $2.5 billion in April 2021 and then further increased to $3.0 billion in October 2021. During the period from January 1, 2022 through February 17, 2022, the Company repurchased 3.8 million shares for $274 and has $1.0 billion of authorization remaining as of February 17, 2022. The timing of any future repurchases will be dependent upon several factors, including the market price of the Company's securities, the Company's capital position, consideration of the effect of any repurchases on the Company's financial strength or credit ratings, the Company's blackout periods, and other considerations.
Under The Hartford's previous $1.0 billion share repurchase program authorized by its Board of Directors in February 2019 and which expired on December 31, 2020, the Company repurchased 2.7 million and 3.4 million shares for $150 and $200 during the years ended 2020 and 2019, respectively.
For further information, see Note 16 - Equity of Notes to Consolidated Financial Statements.
|DIVIDENDS
The Hartford's Board of Directors declared the following quarterly dividends since October 1, 2021:
Common Stock Dividends
| Declared | Record | Payable | Amount per share | ||||||||
| October 28, 2021 | December 1, 2021 | January 4, 2022 | $ | 0.385 | |||||||
| February 16, 2022 | March 1, 2022 | April 4, 2022 | $ | 0.385 | |||||||
Preferred Stock Dividends
| Declared | Record | Payable | Amount per share | ||||||||
| December 15, 2021 | February 1, 2022 | February 15, 2022 | $ | 375.00 | |||||||
| February 16, 2022 | May 2, 2022 | May 16, 2022 | $ | 375.00 | |||||||
There are no current restrictions on HFSG Holding Company's ability to pay dividends to its stockholders.
For a discussion of restrictions on dividends to HFSG Holding Company from its insurance subsidiaries, see the following "Dividends from Subsidiaries" discussion. For a discussion of potential restrictions on the HFSG Holding Company's ability to pay dividends, see Part I, Item 1A, — Risk Factors for the risk factor "Our ability to declare and pay dividends is subject to limitations."
|DIVIDENDS FROM SUBSIDIARIES
Dividends to HFSG Holding Company from its insurance subsidiaries are restricted by insurance regulation. The Company’s principal insurance subsidiaries are domiciled in the United States and the United Kingdom.
The payment of dividends by Connecticut-domiciled insurers is limited under the insurance holding company laws of Connecticut. These laws require notice to and approval by the state insurance commissioner for the declaration or payment of any dividend, which, together with other dividends or distributions made within the preceding twelve months, exceeds the greater of (i) 10% of the insurer’s statutory policyholder surplus as of December 31 of the preceding year or (ii) net income (or net gain from operations, if such company is a life insurance company) for the preceding year, in each case determined under statutory insurance accounting principles. In addition, if any dividend of a Connecticut-domiciled insurer exceeds the insurer’s earned surplus, it requires the prior approval of the Connecticut Insurance Commissioner.
Property casualty insurers domiciled in New York, including Navigators Insurance Company ("NIC") and Navigators Specialty Insurance Company ("NSIC"), generally may not, without notice to and approval by the state insurance commissioner, pay dividends out of earned surplus in any twelve‑month period that exceeds the lesser of (i) 10% of the insurer’s statutory policyholders’ surplus as of the most recent financial statement on file, or (ii) 100% of its adjusted net investment income, as defined, for the same twelve month period.
The insurance holding company laws of the other jurisdictions in which The Hartford’s insurance subsidiaries are incorporated (or deemed commercially domiciled) generally contain similar (although in certain instances more restrictive) limitations on the payment of dividends. In addition to statutory limitations on paying dividends, the Company also takes other items into consideration when determining dividends from subsidiaries. These considerations include, but are not limited to, expected earnings and capitalization of the subsidiaries, regulatory capital requirements and liquidity requirements of the individual operating company.
Corporate members of Lloyd's syndicates may pay dividends to its parent to the extent of available profits that have been distributed from the syndicate in excess of the FAL capital requirement and subject to restrictions imposed under UK Company Law. The FAL is determined based on the SCR under the Solvency II capital adequacy model, the current regulatory framework governing UK domiciled insurers, plus a Lloyd’s specific economic capital assessment.
Insurers domiciled in the United Kingdom may pay dividends to their parent out of their statutory profits subject to restrictions imposed under U.K. Company law and Solvency II.
In 2021, HFSG Holding Company received $295 of dividends from HLA and $165 from Hartford Funds. In addition, HFSG Holding Company received $1.1 billion of net dividends from P&C subsidiaries in 2021 which excludes $150 of P&C dividends that were subsequently contributed to P&C subsidiaries and $50 of P&C dividends related to interest
113
Part II - Item 7. Management's Discussion and Analysis of Financial Condition and Results of Operations
payments on an intercompany note owed by Hartford Holdings, Inc. ("HHI") to Hartford Fire Insurance Company.
|OTHER SOURCES OF CAPITAL FOR THE HFSG HOLDING COMPANY
The Hartford endeavors to maintain a capital structure that provides financial and operational flexibility to its insurance subsidiaries, ratings that support its competitive position in the financial services marketplace (see the "Ratings" section below for further discussion), and stockholder returns. As a result, the Company may from time to time raise capital from the issuance of debt, common equity, preferred stock, equity-related debt or other capital securities and is continuously evaluating strategic opportunities. The issuance of debt, common equity, equity-related debt or other capital securities could result in the dilution of stockholder interests or reduced net income to common stockholders due to additional interest expense or preferred stock dividends.
Shelf Registrations
The Hartford filed an automatic shelf registration statement with the Securities and Exchange Commission ("the SEC") on May 17, 2019 that permits it to offer and sell debt and equity securities during the three-year life of the registration statement.
For further information regarding Shelf Registrations, see Note 14 - Debt of Notes to Consolidated Financial Statements.
Revolving Credit Facility
In 2018, The Hartford entered into a senior unsecured revolving credit facility (the "Credit Facility") that provides up to $750 of unsecured credit with an expiration date of March 29, 2023. On October 27, 2021, The Hartford amended and restated the Credit Facility and extended it through October 27, 2026. As of December 31, 2021, no borrowings were outstanding and no letters of credit were issued under the Credit Facility and The Hartford was in compliance with all financial covenants. For further information regarding the Credit Facility, see Note 14– Debt of Notes to Consolidated Financial Statements.
Intercompany Liquidity Agreements
The Company has $2.0 billion available under an intercompany liquidity agreement that allows for short-term advances of funds among the HFSG Holding Company and certain affiliates of up to $2.0 billion for liquidity and other general corporate purposes. The Connecticut Department of Insurance ("CTDOI") granted approval for certain affiliated insurance companies that are parties to the agreement to treat receivables from a parent, including the HFSG Holding Company, as admitted assets for statutory accounting purposes.
As of December 31, 2021, there were no amounts outstanding at the HFSG Holding Company.
Collateralized Advances with Federal Home Loan Bank of Boston
The Company’s subsidiaries, Hartford Fire Insurance Company (“Hartford Fire”) and Hartford Life and Accident Insurance Company ("HLA"), are members of the FHLBB. Membership allows these subsidiaries access to collateralized advances, which may be short- or long-term with fixed or variable rates. Advances may be used to support general corporate purposes,
which would be presented as short- or long-term debt, or to earn incremental investment income, which would be presented in other liabilities consistent with other collateralized financing transactions. As of December 31, 2021, there were no advances outstanding. The CTDOI permits Hartford Fire and HLA to pledge up to $1.3 billion and $0.6 billion in qualifying assets, respectively, without prior approval, to secure FHLBB advances in 2022. For further information regarding the Company's collateralized advances with Federal Home Loan Bank of Boston, see Note 14 - Debt of Notes to Consolidated Financial Statements.
Lloyd's Letter of Credit Facilities
The Hartford has entered into a committed credit facility agreement with a syndicate of lenders (the "Club Facility") as well as a non-committed $25 credit facility with a lender (the "Bilateral Facility"). The Club Facility has two tranches with one tranche extending a $104 commitment and the other tranche extending a £85 million ($115 as of December 31, 2021) commitment. As of December 31, 2021, letters of credit with an aggregate face amount of $104 and £68 million, or $92, were outstanding under the Club Facility and no letters of credit were outstanding under the Bilateral Facility.
Among other covenants, the Club Facility and Bilateral Facility contain financial covenants regarding The Hartford's consolidated net worth and financial leverage and that limit the amount of letters of credit that can support Funds and Lloyd's, consistent with Lloyd's requirements. As of December 31, 2021, The Hartford was in compliance with all financial covenants of both facilities.
For further information regarding the Club Facility and the Bilateral Facility, see Note 14– Debt of Notes to Consolidated Financial Statements.
Other Sources and Uses of Capital
As part of the sale of the former retained interest in Talcott Resolution, which was completed on June 30, 2021, the Company received $217 of proceeds.
In May 2021, the Company contributed €15 million ($18) to Navigators Holdings (Europe) N.V., a Belgium holding company. On December 29, 2021, the Company received approximately $20, before $9 of transaction costs, related to the sale of its Continental Europe Operations.
|PENSION PLANS AND OTHER POSTRETIREMENT BENEFITS
While the Company has significant discretion in making voluntary contributions to the U. S. qualified defined benefit pension plan, minimum contributions are mandated in certain circumstances pursuant to the Employee Retirement Income Security Act of 1974, as amended by the Pension Protection Act of 2006, the Worker, Retiree, and Employer Recovery Act of 2008, the Preservation of Access to Care for Medicare Beneficiaries and Pension Relief Act of 2010, the Moving Ahead for Progress in the 21st Century Act of 2012 (MAP-21) and Internal Revenue Code regulations. The Company did not make any contributions to the U. S. qualified defined benefit pension plan in 2021, and made contributions to this pension plan of approximately $70 in both 2020 and 2019. No contributions
114
Part II - Item 7. Management's Discussion and Analysis of Financial Condition and Results of Operations
were made to the other postretirement plans in 2021, 2020 and 2019. The Company’s 2021, 2020 and 2019 required minimum funding contributions were immaterial. The Company does not have a 2022 required minimum funding contribution for the U.S. qualified defined benefit pension plan and the funding requirements for all pension plans are expected to be immaterial. The Company has not determined whether, and to what extent, contributions may be made to the U.S. qualified defined benefit pension plan in 2022. The Company will monitor the funded status of the U.S. qualified defined benefit pension plan during 2022 to make this determination. As of December 31, 2021, the U.S. qualified defined benefit pension plan is fully funded and in an asset position. For further discussion of pension and other postretirement benefit obligations, see Note 19 - Employee Benefit Plans of Notes to Consolidated Financial Statements.
|DERIVATIVE COMMITMENTS
Certain of the Company’s derivative agreements contain provisions that are tied to the financial strength ratings, as set by nationally recognized statistical rating agencies, of the individual legal entity that entered into the derivative agreement. If the legal entity’s financial strength were to fall below certain ratings, the counterparties to the derivative agreements could terminate agreements and demand immediate settlement of the outstanding net derivative positions transacted under each agreement. For further information, refer to Note 15 - Commitments and Contingencies of Notes to Consolidated Financial Statements.
As of December 31, 2021, no derivative positions would be subject to immediate termination in the event of a downgrade of one level below the current financial strength ratings. This could change as a result of changes in our hedging activities or to the extent changes in contractual terms are negotiated.
|INSURANCE OPERATIONS
While subject to variability period to period, underwriting and investment cash flows continue to provide sufficient liquidity to meet anticipated demands. For information about the impact of COVID-19 on the Company's cash flows see Part I, Item 1A, Risk Factors of this Annual Report on Form 10-K.
The principal sources of operating funds are premiums, fees earned from insurance and administrative service agreements, and investment income, while investing cash flows primarily originate from maturities and sales of invested assets.
The Company’s insurance operations consist of property and casualty insurance products (collectively referred to as “Property & Casualty Operations”) and Group Benefits.
The Company's insurance operations hold fixed maturity securities including a significant short-term investment position (securities with maturities of one year or less at the time of purchase) to meet liquidity needs. Liquidity requirements that are unable to be funded by the Company's insurance operations' short-term investments would be satisfied with current operating funds, including premiums or investing cash flows, which includes proceeds received through the sale of invested assets. A sale of invested assets could result in significant realized losses.
The following tables represent the fixed maturity holdings, including the aforementioned cash and short-term investments available to meet liquidity needs, for each of the Company’s insurance operations.
Property & Casualty
| As of | |||||
| December 31, 2021 | |||||
| Fixed maturities | $ | 33,143 | |||
| Short-term investments | 1,332 | ||||
| Cash | 176 | ||||
| Less: Derivative collateral | 36 | ||||
| Total | $ | 34,615 | |||
Property & Casualty operations invested assets also include $1.4 billion in equity securities, $3.9 billion in mortgage loans and $2.7 billion in limited partnerships and other alternative investments.
Group Benefits Operations
| As of | ||||||||
| December 31, 2021 | ||||||||
| Fixed maturities | $ | 9,487 | ||||||
| Short-term investments | 352 | |||||||
| Cash | 15 | |||||||
| Less: Derivative collateral | 18 | |||||||
| Total | $ | 9,836 | ||||||
Group Benefits operations invested assets also include $338 in equity securities, $1.5 billion in mortgage loans and $664 in limited partnerships and other alternative investments.
The primary uses of funds are to pay claims, claim adjustment expenses, commissions and other underwriting and insurance operating costs, to pay taxes, to purchase new investments and to make dividend payments to the HFSG Holding Company.
Property & Casualty reserves for unpaid losses and loss adjustment expenses as of December 31, 2021 were $31.4 billion. Reserves for Property & Casualty unpaid losses and loss adjustment expenses include case reserves and IBNR. The ultimate amount to be paid to settle both case reserves and IBNR is an estimate, subject to significant uncertainty. The actual amount to be paid is not finally determined until the Company reaches a settlement with the claimant. Final claim settlements may vary significantly from the present estimates, particularly since many claims will not be settled until well into the future. For a discussion of The Hartford’s judgment in estimating reserves for Property & Casualty see Part II, Item 7, MD&A - Critical Accounting Estimates, Property & Casualty Insurance Product Reserves, and for historical payments by reserve line net of reinsurance, see Note 12 – Reserve for Unpaid Losses and Loss Adjustment Expenses of Notes to Consolidated Financial Statements. The timing of future payments for the next twelve months and for beyond twelve months could vary materially from historical payment patterns due to, among other things, changes in claim reporting and payment patterns and large unanticipated settlements. In particular, there is significant uncertainty over the claim payment patterns of asbestos and environmental claims.
115
Part II - Item 7. Management's Discussion and Analysis of Financial Condition and Results of Operations
Group Benefits reserves as of December 31, 2021 were $9.0 billion. Estimated group life and disability obligations are based on assumptions comparable with the Company’s historical experience, modified for recent observed trends. For a discussion of The Hartford’s judgment in estimating reserves for Group Benefits see Part II, Item 7, MD&A - Critical Accounting Estimates, Group Benefit LTD Reserves, Net of Reinsurance, for further discussion on future policy benefits, see Note 13 Reserve for Future Policy Benefits and for historical payments by reserve line, net of reinsurance, see Note 12 – Reserve for Unpaid Losses and Loss Adjustment Expenses of Notes to Consolidated Financial Statements. Due to the significance of the assumptions used, payments for the next twelve months and beyond twelve months could materially differ from historical patterns.
Corporate includes retained reserves of $458 as of December 31, 2021 related to retained run-off liabilities of its former life and annuity business. For further discussion on future policy benefits, see Note 13 Reserve for Future Policy Benefits.
Hartford Funds
Hartford Funds principal sources of operating funds are fees earned from basis points on assets under management with uses primarily for payments to subadvisors and other general operating expenses. As of December 31, 2021, Hartford Funds cash and short-term investments were $254.
|PURCHASE AND OTHER OBLIGATIONS
The Hartford’s unfunded commitments to purchase investments in limited partnerships and other alternative investments, private placements, and mortgage loans are disclosed in Note 15 - Commitments and Contingencies of Notes to Consolidated Financial Statements. It is anticipated that these unfunded commitments will be funded through the Company’s normal operating and investing activities.
In the normal course of business, the Company enters into contractual commitments to purchase various goods and services such as maintenance, human resources, and information technology. The Company’s operating lease commitments are disclosed in Note 21 - Leases of Notes to Consolidated Financial Statements. It is anticipated that these purchase commitments and operating lease obligations will be funded through the Company’s normal operating and investing activities.
|CAPITALIZATION
| Capital Structure | |||||||||||
| December 31, 2021 | December 31, 2020 | Change | |||||||||
| Long-term debt | $ | 4,944 | $ | 4,352 | 14% | ||||||
| Total debt | 4,944 | 4,352 | 14% | ||||||||
| Common stockholders' equity, excluding AOCI, net of tax | 17,337 | 17,052 | 2% | ||||||||
| Preferred stock | 334 | 334 | —% | ||||||||
| AOCI, net of tax | 172 | 1,170 | (85)% | ||||||||
| Total stockholders’ equity | $ | 17,843 | $ | 18,556 | (4%) | ||||||
| Total capitalization | $ | 22,787 | $ | 22,908 | (1%) | ||||||
| Debt to stockholders’ equity | 28 | % | 23 | % | |||||||
| Debt to capitalization | 22 | % | 19 | % | |||||||
Total capitalization decreased $121, or 1%, as of December 31, 2021 compared to December 31, 2020 primarily due to share repurchases in the period and a decrease in AOCI, partially offset by net income in excess of stockholder dividends and an increase in long-term debt due to the issuance of the 2.9% Notes.
For additional information on AOCI, net of tax, including unrealized gains from securities, see Note 18 - Changes in and Reclassifications From Accumulated Other Comprehensive Income and Note 6 - Investments of Notes to Consolidated Financial Statements. For additional information on debt, see Note 14 - Debt of Notes to Consolidated Financial Statements.
116
Part II - Item 7. Management's Discussion and Analysis of Financial Condition and Results of Operations
|CASH FLOW[1]
| 2021 | 2020 | 2019 | |||||||||
| Net cash provided by operating activities | $ | 4,093 | $ | 3,871 | $ | 3,489 | |||||
| Net cash used for investing activities | $ | (2,466) | $ | (2,066) | $ | (2,148) | |||||
| Net cash used for financing activities | $ | (1,581) | $ | (1,778) | $ | (1,191) | |||||
| Cash and restricted cash— end of year | $ | 337 | $ | 239 | $ | 262 | |||||
[1]Cash activities in 2021 and 2020 include cash flows related to Continental Europe Operations classified as held for sale beginning in the third quarter of 2020 and sold on December 29, 2021. See Note 22 - Business Dispositions of Notes to Consolidated Financial Statements for discussion of this transaction.
Year ended December 31, 2021 compared to the year ended December 31, 2020
Net cash provided by operating activities increased in 2021 as compared to the prior year period primarily driven by an increase in Commercial Lines and Group Benefits premiums received, greater cash distributions from limited partnerships, lower payroll and employee related expenditures, a decrease in restructuring costs and the impact of Personal Lines premium refunds in the 2020 period. Positive cash flow impacts were partially offset by an increase in income taxes paid and an increase in Group Benefits loss and loss adjustment expenses paid.
Cash used for investing activities increased in 2021 as compared to the prior year as a result of a decrease from net proceeds to net payments for equity securities, an increase in net payments for partnerships, an increase in net payments for mortgage loans, an increase in net payments for other investing activities and a decrease from net proceeds to net payments for derivatives, partially offset by an increase from net payments to net proceeds for fixed maturities and consideration received from the sale of the Company's equity interest in Talcott Resolution.
Cash used for financing activities decreased primarily due to proceeds from the issuance of debt in 2021, debt repayments in the 2020 period, and a decrease in cash used for securities lending transactions, partially offset by an increase in share repurchases in 2021.
Operating cash flows for the year ended December 31, 2021 have been adequate to meet liquidity requirements.
|EQUITY MARKETS
For a discussion of the potential impact of the equity markets on capital and liquidity, see the Financial Risk on Statutory Capital and Liquidity Risk section in this MD&A.
|RATINGS
Ratings are an important factor in establishing a competitive position in the insurance marketplace and impact the Company's ability to access financing and its cost of borrowing. There can be no assurance that the Company’s ratings will
continue for any given period of time, or that they will not be changed. In the event the Company’s ratings are downgraded, the Company’s competitive position, ability to access financing, and its cost of borrowing, may be adversely impacted.
On July 21, 2021, Moody's upgraded the insurance financial strength rating of HLA to A1 from A2. The upgrade reflects HLA’s leading market position in the group life and disability business, its distribution capabilities and consistent profitability, as well as implicit support from The Hartford.
Insurance Financial Strength Ratings as of February 17, 2022
| A.M. Best | Standard & Poor's | Moody's | |||||||||
| Hartford Fire Insurance Company | A+ | A+ | A1 | ||||||||
| Hartford Life and Accident Insurance Company | A+ | A+ | A1 | ||||||||
| Navigators Insurance Company | A+ | A | Not Rated | ||||||||
| Other Ratings: | |||||||||||
| The Hartford Financial Services Group, Inc.: | |||||||||||
| Senior debt | a- | BBB+ | Baa1 | ||||||||
These ratings are not a recommendation to buy, sell or hold any of The Hartford’s securities and they may be revised or withdrawn at any time at the discretion of the rating organization. Each agency’s rating should be evaluated independently of any other agency’s rating. The system and the number of rating categories can vary across rating agencies.
Among other factors, rating agencies consider the level of statutory capital and surplus of our U.S. insurance subsidiaries as well as the level of a measure of GAAP capital held by the Company in determining the Company's financial strength and credit ratings. Rating agencies may implement changes to their capital formulas that have the effect of increasing the amount of capital we must hold in order to maintain our current ratings. See Part I, Item 1A. Risk Factors — “Downgrades in our financial strength or credit ratings may make our products less attractive, increase our cost of capital and inhibit our ability to refinance our debt.”
117
Part II - Item 7. Management's Discussion and Analysis of Financial Condition and Results of Operations
|STATUTORY CAPITAL
| U.S. Statutory Capital Rollforward for the Company's Insurance Subsidiaries | |||||||||||
| Property and Casualty Insurance Subsidiaries [1] [2] | Group Benefits Insurance Subsidiary | Total | |||||||||
| U.S. statutory capital at January 1, 2021 | $ | 10,795 | $ | 2,601 | $ | 13,396 | |||||
| Statutory income | 1,774 | 32 | 1,806 | ||||||||
| Dividends to parent | (1,105) | (295) | (1,400) | ||||||||
| Other items | 450 | 72 | 522 | ||||||||
| Net change to U.S. statutory capital | 1,119 | (191) | 928 | ||||||||
| U.S. statutory capital at December 31, 2021 | $ | 11,914 | $ | 2,410 | $ | 14,324 | |||||
[1]The statutory capital for property and casualty insurance subsidiaries in this table does not include the value of an intercompany note owed by HHI to Hartford Fire Insurance Company.
[2]Excludes insurance operations in the U.K. and Continental Europe.
.
Stat to GAAP Differences
Significant differences between U.S. GAAP stockholders’ equity and aggregate statutory capital prepared in accordance with U.S. STAT include the following:
•U.S. STAT excludes equity of non-insurance and foreign insurance subsidiaries not held by U.S. insurance subsidiaries.
•Costs incurred by the Company to acquire insurance policies are deferred under U.S. GAAP while those costs are expensed immediately under U.S. STAT.
•Temporary differences between the book and tax basis of an asset or liability which are recorded as deferred tax assets are evaluated for recoverability under U.S. GAAP while these amounts are then subject to further admissibility tests under U.S. STAT.
•The assumptions used in the determination of Group Benefits reserves (i.e. for Group Benefits contracts) are prescribed under U.S. STAT, while the assumptions used under U.S. GAAP are generally the Company’s best estimates.
•The difference between the amortized cost and fair value of fixed maturity and other investments, net of tax, is recorded as an increase or decrease to the carrying value of the related asset and to equity under U.S. GAAP, while, under U.S. STAT, most investments are carried at amortized cost with only certain securities carried at fair value, such as equity securities and certain lower rated bonds required by the NAIC to be recorded at the lower of amortized cost or fair value.
•U.S. STAT for life insurance companies like HLA establishes a formula reserve for realized and unrealized losses due to default and equity risks associated with certain invested assets (the Asset Valuation Reserve), while U.S. GAAP does not. Also, for those realized gains and losses caused by changes in interest rates, U.S. STAT for life insurance companies defers and amortizes the gains and losses, caused by changes in interest rates, into income over the original life to maturity of the asset sold (the Interest Maintenance Reserve) while U.S. GAAP does not.
•Goodwill arising from the acquisition of a business is tested for recoverability on an annual basis (or more frequently, as necessary) for U.S. GAAP, while under U.S. STAT goodwill is amortized over a period not to exceed 10 years and the amount of goodwill admitted as an asset is limited.
•The deferred gain on retroactive reinsurance for losses ceded to the Navigators and A&E ADC agreements is recognized within a special category of surplus under U.S. STAT but is recognized within other liabilities under U.S. GAAP.
In addition, certain assets, including a portion of premiums receivable and fixed assets, are non-admitted (recorded at zero value and charged against surplus) under U.S. STAT. U.S. GAAP generally evaluates assets based on their recoverability.
|RISK BASED CAPITAL
The Company's U.S. insurance companies' states of domicile impose RBC requirements. The requirements provide a means of measuring the minimum amount of statutory capital appropriate for an insurance company to support its overall business operations based on its size and risk profile. Companies below specific trigger points or ratios are classified within certain levels, each of which requires specified corrective action. All of the Company's U.S. operating insurance
subsidiaries had RBC ratios in excess of the minimum levels required by the applicable insurance regulations.
Similar to the RBC ratios that are employed by U.S. insurance regulators, regulatory authorities in the international jurisdictions in which the Company operates generally establish minimum solvency requirements for insurance companies. All of the Company's international insurance subsidiaries expect to
118
Part II - Item 7. Management's Discussion and Analysis of Financial Condition and Results of Operations
maintain capital levels in excess of the minimum levels required by the applicable regulatory authorities.
|SENSITIVITY
In any particular period, statutory capital amounts and RBC ratios may increase or decrease depending upon a variety of factors. The amount of change in the statutory capital or RBC ratios can vary based on individual factors and may be compounded in extreme scenarios or if multiple factors occur at the same time. At times the impact of changes in certain market factors or a combination of multiple factors on RBC ratios can be counterintuitive. For further discussion on these factors, see MD&A - Enterprise Risk Management, Financial Risk on Statutory Capital.
Statutory capital at the insurance subsidiaries has been maintained at capital levels commensurate with the Company's desired RBC ratios and ratings from rating agencies. The amount of statutory capital can increase or decrease depending on a number of factors affecting insurance results including, among other factors, the level of catastrophe claims incurred, the amount of reserve development, the effect of changes in interest rates on investment income and the discounting of loss reserves, and the effect of realized gains and losses on investments.
|CONTINGENCIES
Legal Proceedings
For a discussion regarding contingencies related to The Hartford’s legal proceedings, see the information contained under “Litigation” and “Run-off Asbestos and Environmental Claims,” in Note 15 - Commitments and Contingencies of the Notes to Consolidated Financial Statements and Part I, Item 3 Legal Proceedings, which are incorporated herein by reference.
Legislative and Regulatory Developments
COVID-19 Global Pandemic
State and federal lawmakers continue to propose legislation and regulation to address the effects of the COVID-19 pandemic and to promote recovery from the pandemic. There have been proposals to impose retroactive coverage of COVID-19 claims under existing business interruption coverage provisions. If such proposals were enacted, they could represent a material exposure for the Company. Further, some states have adopted, or are considering incorporating, a presumption that if certain workers become infected with COVID-19, such infection would constitute an occupational disease triggering workers’ compensation coverage. In addition, state insurance regulators, including California, New Jersey and New York, have encouraged (and in some cases required) insurers to offer immediate relief to policyholders. As the COVID-19 global pandemic continues, regulators may require us or we may elect to provide additional consumer and/or business financial relief. We may also see this manifest in the review and approval of new rate filings, with regulators applying heightened scrutiny even when rate reductions are proposed. The duration and scope of such regulatory/Company actions are uncertain, and
the impacts of such actions could adversely affect the Company’s insurance business.
Proposals have been introduced in Congress to enact a pandemic risk insurance coverage through a risk sharing mechanism between insurers and the federal government for future pandemics. Timing for any Congressional action with respect to these proposals is uncertain at this time. If such a program were to be enacted, it could represent a significant obligation for the Company in terms of deductible and co-share obligations.
Biden Administration Build Back Better Agenda
During 2021, the Biden Administration called for Congressional action on the President’s Build Back Better Agenda, which outlined funding across traditional infrastructure and human infrastructure in the U.S.
On November 15, 2021, President Biden signed the bipartisan “Infrastructure Investment and Jobs Act” into law, which provided funding for traditional infrastructure such as roads, bridges and highways.
The second phase of Build Back Better proposes funding for a national paid family and medical leave program, clean energy initiatives, affordable childcare and more in the Build Back Better Act.
Notably, a national paid family and medical leave program could affect existing state-based disability and paid leave programs or other products and services that the Company provides through its Group Benefits business.
If enacted, the effect of new proposals from the Build Back Better agenda on the Company’s operations, including the ability to attract new business and retain existing customers is unclear. While Congress is considering partisan action on the Build Back Better agenda, the nature and timing of such action is unclear.
Patient Protection and Affordable Care Act of 2010 (the "Affordable Care Act")
It is unclear whether the Administration, Congress or the courts will seek to reverse, amend or alter the ongoing operation of the Affordable Care Act ("ACA"). If such actions were to occur, they might have an impact on various aspects of our businesses, including our insurance businesses. The Hartford’s core business does not involve the issuance of health insurance, and we have not observed any material impacts on the Company’s workers’ compensation business or group benefits business from the ACA. We will continue to monitor the impact of the ACA and any reforms on consumer, broker and medical provider behavior for leading indicators of changes in medical costs or loss payments primarily on the Company's workers' compensation and disability liabilities. The potential effect on The Hartford as an employer would be consistent with other large employers.
119
Part II - Item 7. Management's Discussion and Analysis of Financial Condition and Results of Operations
US Tax Reform
As Congress debates action on various spending initiatives, it may consider a variety of proposals to fund the cost of new spending with revenue raising measures. Proposals from the Build Back Better agenda, as well as the Biden Administration commitment to the OECD global minimum tax, could be drivers of tax policy changes, including a possible increase in the corporate tax rate, creation of a corporate minimum tax and other changes to taxes owed on income earned outside of the U.S. These and other tax proposals and regulatory initiatives that may be considered by Congress and/or the U.S. Treasury Department could have a material effect on the Company and its insurance businesses. The nature and timing of any Congressional or regulatory action with respect to any such efforts is unclear.
Post-Brexit UK Regulatory Reforms
The UK Prudential Regulation Authority (“PRA”) is reviewing the Solvency II regime, introduced across the EU during 2016 to
align insurance entities’ risk frameworks for managing capital adequacy and risk management practices, as well as increased transparency and enhanced regulatory supervision.
The PRA also recognizes that climate change presents a material financial risk to insurers and the financial system and for 2022 the PRA will incorporate the financial risks posed by supervision into its core supervisory approach.
Guaranty Fund and Other Insurance-related Assessments
For a discussion regarding Guaranty Fund and Other Insurance-related Assessments, see Note 15 - Commitments and Contingencies of Notes to Consolidated Financial Statements.
IMPACT OF NEW ACCOUNTING STANDARDS
For a discussion of accounting standards, see Note 1 - Basis of Presentation and Significant Accounting Policies of Notes to Consolidated Financial Statements.
120
Part II - Item 7. Management's Discussion and Analysis of Financial Condition and Results of Operations
ACRONYMS
A&E Asbestos and Environmental | HIMCO Hartford Investment Management Company | |||||||
ABS Asset Backed Securities | IBNR Incurred But Not Reported | |||||||
ACL Allowance for Credit Losses | IT Information Technology | |||||||
ADC Adverse Development Cover | LCL Liability for Credit Losses | |||||||
AFS Available-For-Sale | LIBOR London Inter-Bank Offered Rate | |||||||
ALAE Allocated Loss Adjustment Expenses | LTD Long-Term Disability | |||||||
AOCI Accumulated Other Comprehensive Income | LTV Loan-to-Value | |||||||
AUM Assets Under Management | MD&A Management's Discussion and Analysis of Financial Conditions and Results of Operations | |||||||
CAY Current Accident Year | NAIC National Association of Insurance Commissioners | |||||||
CLO Collateralized Loan Obligation | NIC Navigators Insurance Company | |||||||
CMBS Commercial Mortgage-Backed Securities | NICO National Indemnity Company, a subsidiary of Berkshire Hathaway Inc. (“Berkshire”) | |||||||
DAC Deferred Policy Acquisition Costs | NM Not Meaningful | |||||||
DEI Diversity, Equity and Inclusion | NOLs Net Operating Loss Carryforwards or Carrybacks | |||||||
DLR Disabled Life Reserve | NSIC Navigators Specialty Insurance Company | |||||||
DSCR Debt Service Coverage Ratio | OCI Other Comprehensive Income | |||||||
ERCC Enterprise Risk and Capital Committee | OTC Over-the-Counter | |||||||
ESPP The Hartford Employee Stock Purchase Plan | P&C Property and Casualty | |||||||
ETF Exchange-Traded Funds | PG&E PG&E Corporation and Pacific Gas and Electric Company | |||||||
ETP Exchange-Traded Products | PYD Prior Year Development | |||||||
FAL Funds at Lloyd's | RBC Risk-Based Capital | |||||||
FASB Financial Accounting Standards Board | RMBS Residential Mortgage-Backed Securities | |||||||
FHLBB Federal Home Loan Bank of Boston | ROA Return on Assets | |||||||
GAAP Generally Accepted Accounting Principles | ROE Return on Equity | |||||||
GB Group Benefits | SCR Solvency Capital Requirement | |||||||
HFSG Hartford Financial Services Group, Inc. | SOFR Secured Overnight Funding Rate | |||||||
HHI Hartford Holdings, Inc. | ULAE Unallocated Loss Adjustment Expenses | |||||||
121
Part II - Item 9A. Controls and Procedures
| Item 9A. | ||||||||||||||
EVALUATION OF DISCLOSURE CONTROLS AND PROCEDURES
The Company's principal executive officer and its principal financial officer, based on their evaluation of the Company's disclosure controls and procedures (as defined in Exchange Act Rule 13a-15(e)) have concluded that the Company's disclosure controls and procedures are effective for the purposes set forth in the definition thereof in Exchange Act Rule 13a-15(e) as of December 31, 2021.
MANAGEMENT'S ANNUAL REPORT ON INTERNAL CONTROL OVER FINANCIAL REPORTING
The management of The Hartford Financial Services Group, Inc. and its subsidiaries (“The Hartford”) is responsible for establishing and maintaining adequate internal control over financial reporting for The Hartford as defined in Rule 13a-15(f) under the Securities Exchange Act of 1934.
A company's internal control over financial reporting is a process designed to provide reasonable assurance regarding the reliability of financial reporting and the preparation of financial statements for external purposes in accordance with accounting principles generally accepted in the United States. A company's internal control over financial reporting includes policies and procedures that (1) pertain to the maintenance of records that in reasonable detail accurately and fairly reflect the transactions and dispositions of the assets of the company; (2) provide reasonable assurance that transactions are recorded as necessary to permit preparation of financial statements in accordance with accounting principles generally accepted in the United States, and that receipts and expenditures of the company are being made only in accordance with authorizations of management and directors of the company; and (3) provide reasonable assurance regarding prevention or timely detection of unauthorized acquisition, use or disposition of the company's assets that could have a material effect on the financial statements.
Because of its inherent limitations, internal control over financial reporting may not prevent or detect misstatements. Also, projections of any evaluation of effectiveness to future periods are subject to the risk that controls may become inadequate because of changes in conditions, or that the degree of compliance with the policies or procedures may deteriorate.
The Hartford's management assessed its internal controls over financial reporting as of December 31, 2021 in relation to criteria for effective internal control over financial reporting described in “Internal Control-Integrated Framework (2013)” issued by the Committee of Sponsoring Organizations of the Treadway Commission. Based on this assessment under those criteria, The Hartford's management concluded that its internal control over financial reporting was effective as of December 31, 2021.
CHANGES IN INTERNAL CONTROL OVER FINANCIAL REPORTING
There were no changes in the Company's internal control over financial reporting that occurred during the Company's fourth fiscal quarter of 2021 that have materially affected, or are reasonably likely to materially affect, the Company's internal control over financial reporting.
ATTESTATION REPORT OF THE COMPANY'S REGISTERED PUBLIC ACCOUNTING FIRM
The Hartford's independent registered public accounting firm, Deloitte & Touche LLP, has issued their attestation report on the Company's internal control over financial reporting which is set forth below.
122
Part II - Item 9A. Controls and Procedures
Report of Independent Registered Public Accounting Firm
To the Board of Directors and Stockholders of
The Hartford Financial Services Group, Inc.
Hartford, Connecticut
Opinion on Internal Control over Financial Reporting
We have audited the internal control over financial reporting of The Hartford Financial Services Group, Inc. and its subsidiaries (the “Company”) as of December 31, 2021, based on criteria established in Internal Control — Integrated Framework (2013) issued by the Committee of Sponsoring Organizations of the Treadway Commission (COSO). In our opinion, the Company maintained, in all material respects, effective internal control over financial reporting as of December 31, 2021, based on criteria established in Internal Control — Integrated Framework (2013) issued by COSO.
We have also audited, in accordance with the standards of the Public Company Accounting Oversight Board (United States) (PCAOB), the consolidated financial statements as of and for the year ended December 31, 2021, of the Company and our report dated February 18, 2022, expressed an unqualified opinion on those financial statements.
Basis for Opinion
The Company’s management is responsible for maintaining effective internal control over financial reporting and for its assessment of the effectiveness of internal control over financial reporting, included in the accompanying Management's Annual Report on Internal Control over Financial Reporting. Our responsibility is to express an opinion on the Company’s internal control over financial reporting based on our audit. We are a public accounting firm registered with the PCAOB and are required to be independent with respect to the Company in accordance with the U.S. federal securities laws and the applicable rules and regulations of the Securities and Exchange Commission and the PCAOB.
We conducted our audit in accordance with the standards of the PCAOB. Those standards require that we plan and perform the audit to obtain reasonable assurance about whether effective internal control over financial reporting was maintained in all material respects. Our audit included obtaining an understanding of internal control over financial reporting, assessing the risk that a material weakness exists, testing and evaluating the design and operating effectiveness of internal control based on the assessed risk, and performing such other procedures as we considered necessary in the circumstances. We believe that our audit provides a reasonable basis for our opinion.
Definition and Limitations of Internal Control over Financial Reporting
A company’s internal control over financial reporting is a process designed to provide reasonable assurance regarding the reliability of financial reporting and the preparation of financial statements for external purposes in accordance with generally accepted accounting principles. A company’s internal control over financial reporting includes those policies and procedures that (1) pertain to the maintenance of records that, in reasonable detail, accurately and fairly reflect the transactions and dispositions of the assets of the company; (2) provide reasonable assurance that transactions are recorded as necessary to permit preparation of financial statements in accordance with generally accepted accounting principles, and that receipts and expenditures of the company are being made only in accordance with authorizations of management and directors of the company; and (3) provide reasonable assurance regarding prevention or timely detection of unauthorized acquisition, use, or disposition of the company’s assets that could have a material effect on the financial statements.
Because of its inherent limitations, internal control over financial reporting may not prevent or detect misstatements. Also, projections of any evaluation of effectiveness to future periods are subject to the risk that controls may become inadequate because of changes in conditions, or that the degree of compliance with the policies or procedures may deteriorate.
/s/ DELOITTE & TOUCHE LLP
Hartford, Connecticut
February 18, 2022
123
Part III - Item 10. Directors, Executive Officers ad Corporate Governance of The Hartford
| Item 10. | ||||||||||||||
Certain of the information called for by Item 10 will be set forth in the definitive proxy statement for the 2022 annual meeting of stockholders (the “Proxy Statement”) to be filed by The Hartford with the Securities and Exchange Commission within 120 days after the end of the fiscal year covered by this Form 10-K under the captions and subcaptions “Board and Governance Matters”, and “Director Nominees" and is incorporated herein by reference.
The Company has adopted a Code of Ethics and Business Conduct, which is applicable to all employees of the Company, including the principal executive officer, the principal financial officer and the principal accounting officer. The Code of Ethics and Business Conduct is available on the investor relations section of the Company’s website at: http://ir.thehartford.com.
Any waiver of, or material amendment to, the Code of Ethics and Business Conduct will be posted promptly to our web site in accordance with applicable NYSE and SEC rules.
EXECUTIVE OFFICERS OF THE HARTFORD
Information about the executive officers of The Hartford who are also nominees for election as directors will be set forth in The Hartford’s Proxy Statement. Set forth below is information about the other executive officers of the Company as of February 17, 2022:
| Name | Age | Position with The Hartford and Business Experience For the Past Five Years | ||||||
| Jonathan R. Bennett | 57 | Executive Vice President and Head of Group Benefits (August 2019-present); Chief Financial Officer and Head of Strategy for Property and Casualty and Group Benefits (October, 2012-August 2019) | ||||||
| Claire H. Burns | 53 | Chief Marketing and Communications Officer (September 2021-present); Chief Marketing and Strategy Officer, Prudential International (February 2018-July 2021); Senior Vice President and Chief Customer Officer, MetLife (November 2012-January 2018) | ||||||
| Beth A. Costello | 54 | Executive Vice President and Chief Financial Officer (July 2014-present) | ||||||
| Douglas G. Elliot | 61 | President (July 2014-present) | ||||||
| John J. Kinney | 50 | Executive Vice President, Head of Claims & Operations (August 2021-present); Chief Claims Officer (April 2013-August 2021) | ||||||
| Scott R. Lewis | 59 | Senior Vice President and Controller (May 2013-present) | ||||||
| Robert W. Paiano | 60 | Executive Vice President and Chief Risk Officer (June 2017-present); Senior Vice President & Treasurer (July 2010-May 2017) | ||||||
| David C. Robinson | 56 | Executive Vice President and General Counsel (June 2015-present) | ||||||
| Lori A. Rodden | 51 | Executive Vice President Chief Human Resources Officer (October 2019-present); Senior Vice President and Lead Human Resources Business Partner for Property & Casualty, Group Benefits, Claims and Actuarial (April 2016-October 2019) and Vice President and Lead Human Resources for Middle Market, Large Commercial, Sales & Distribution and underwriting (November 2014-April 2016) | ||||||
| Deepa Soni | 52 | Executive Vice President, Head of Technology, Data, Analytics & Information Security (August 2021-present); Chief Information Officer (September 2019-August 2021); U.S. Chief Information Officer, BMO Financial Group (April 2016-September 2019) | ||||||
| Amy M. Stepnowski | 53 | Executive Vice President Chief Investment Officer (August 2020-present); President of Hartford Investment Management Company (August 2020-Present); Managing Director and Head of Public Credit Research Hartford Investment Management Company (September 2008-August 2020) | ||||||
124
Part III - Item 12. Security Ownership of Certain Beneficial Owners and Management and Related Stockholder Matters
| Item 12. | ||||||||||||||
Certain of the information called for by Item 12 will be set forth in the Proxy Statement under the caption “Information on Stock Ownership” and is incorporated herein by reference.
EQUITY COMPENSATION PLAN INFORMATION
The following table provides information as of December 31, 2021 about the securities authorized for issuance under the Company’s equity compensation plans. The Company maintains The Hartford 2010 Incentive Stock Plan (the “2010 Stock Plan”), The Hartford 2014 Incentive Stock Plan (the "2014 Stock Plan"), the 2020 Stock Incentive Plan (the "2020 Stock Plan") (collectively the "Stock Plans") and The Hartford Employee Stock Purchase Plan (the “ESPP”).
On May 20, 2020, the stockholders of the Company approved the 2020 Stock Plan, which superseded the earlier plans. Pursuant to the provisions of the 2020 Stock Plan, no additional shares may be issued from the 2014 Stock Plan. To the extent that any awards under the 2010 Stock Plan and the 2014 Stock Plan are forfeited, terminated, surrendered, exchanged, expire unexercised or are settled in cash in lieu of stock (including to effect tax withholding) or for the issuance of a lesser number of shares than the number of shares subject to the award, the shares subject to such awards (or the relevant portion thereof) shall be available for award under the 2020 Stock Plan and such shares shall be added to the total number of shares available under the 2020 Stock Plan. For a description of the 2020 Stock Plan and the ESPP, see Note 20 - Stock Compensation Plans of Notes to Consolidated Financial Statements.
| (a) | (b) | (c) | ||||||||||||
Number of Securities to be Issued Upon Exercise of Outstanding Options, Warrants and Rights [1] | Weighted-average Exercise Price of Outstanding Options, Warrants and Rights [2] | Number of Securities Remaining Available for Future Issuance Under Equity Compensation Plans (Excluding Securities Reflected in Column (a)) [3] | ||||||||||||
| Equity compensation plans approved by stockholders | 11,470,824 | $ | 47.46 | 13,211,964 | ||||||||||
| Equity compensation plans not approved by stockholders | — | — | — | |||||||||||
| Total | 11,470,824 | $ | 47.46 | 13,211,964 | ||||||||||
[1]The amount shown in this column includes 6,435,452 outstanding options awarded under the 2010 Stock Plan, the 2014 Stock Plan and the 2020 Stock Plan. The amount shown in this column includes 4,031,435 outstanding restricted stock units, 764,755 outstanding performance shares at 100% of target (which excludes 623,464 shares that vested on December 31, 2021, related to the 2019-2021 performance period) and 239,182 non-vested dividend equivalent shares as of December 31, 2021 under the 2014 Stock Plan and the 2020 Stock Plan. The maximum number of performance shares that could be awarded is 1,529,510 (200% of target) if the Company achieved the highest performance level. Under the 2014 and 2020 Stock Plans, no more than 500,000 shares in the aggregate can be earned by an individual employee with respect to restricted stock unit and performance share awards made in a single calendar year. As a result, the number of shares ultimately distributed to an employee with respect to awards made in the same year will be reduced, if necessary, so that the number does not exceed this limit.
[2]The weighted-average exercise price reflects outstanding options and does not reflect outstanding restricted stock units or performance shares because they do not have exercise prices.
[3]Of these shares, 3,544,674 remain available for purchase under the ESPP as of December 31, 2021. 9,667,290 shares remain available for issuance as options, restricted stock units, restricted stock awards or performance shares under the 2020 Stock Plan as of December 31, 2021.
125
Part IV. Item 15. Exhibits, Financial Statement Schedules
| Item 15. | ||||||||||||||
(a) Documents filed as a part of this report:
(1)Consolidated Financial Statements. See Index to Consolidated Financial Statements and Schedules elsewhere herein.
(2)Consolidated Financial Statement Schedules. See Index to Consolidated Financial Statement and Schedules elsewhere herein.
(3)Exhibits. See Exhibit Index elsewhere herein.
THE HARTFORD FINANCIAL SERVICES GROUP, INC.
INDEX TO CONSOLIDATED FINANCIAL STATEMENTS AND SCHEDULES
| DESCRIPTION | PAGE | ||||
| FINANCIAL STATEMENTS | |||||
| NOTES TO CONSOLIDATED FINANCIAL STATEMENTS | |||||
| SCHEDULES | |||||
| Schedule VI — Supplemental Information Concerning Property and Casualty Insurance Operations | [2] | ||||
[1] Deloitte & Touche LLP (PCAOB ID No. 34) is our principal accountant and an independent registered public accounting firm.
[2] Schedule has been omitted as information required is disclosed in the Notes to Consolidated Financial Statements or other Schedules.
126
REPORT OF INDEPENDENT REGISTERED PUBLIC ACCOUNTING FIRM
To the Board of Directors and Stockholders of
The Hartford Financial Services Group, Inc.
Hartford, Connecticut
Opinion on the Financial Statements
We have audited the accompanying consolidated balance sheets of The Hartford Financial Services Group, Inc. and its subsidiaries (the "Company") as of December 31, 2021 and 2020, the related consolidated statements of operations, comprehensive income, changes in stockholders' equity, and cash flows, for each of the three years in the period ended December 31, 2021, and the related notes and the schedules listed in the Index at Item 15 (collectively referred to as the "financial statements"). In our opinion, the financial statements present fairly, in all material respects, the financial position of the Company as of December 31, 2021 and 2020, and the results of its operations and its cash flows for each of the three years in the period ended December 31, 2021, in conformity with accounting principles generally accepted in the United States of America.
We have also audited, in accordance with the standards of the Public Company Accounting Oversight Board (United States) (PCAOB), the Company's internal control over financial reporting as of December 31, 2021, based on criteria established in Internal Control — Integrated Framework (2013) issued by the Committee of Sponsoring Organizations of the Treadway Commission and our report dated February 18, 2022, expressed an unqualified opinion on the Company's internal control over financial reporting.
Basis for Opinion
These financial statements are the responsibility of the Company's management. Our responsibility is to express an opinion on the Company's financial statements based on our audits. We are a public accounting firm registered with the PCAOB and are required to be independent with respect to the Company in accordance with the U.S. federal securities laws and the applicable rules and regulations of the Securities and Exchange Commission and the PCAOB.
We conducted our audits in accordance with the standards of the PCAOB. Those standards require that we plan and perform the audit to obtain reasonable assurance about whether the financial statements are free of material misstatement, whether due to error or fraud. Our audits included performing procedures to assess the risks of material misstatement of the financial statements, whether due to error or fraud, and performing procedures that respond to those risks. Such procedures included examining, on a test basis, evidence regarding the amounts and disclosures in the financial statements. Our audits also included evaluating the accounting principles used and significant estimates made by management, as well as evaluating the overall presentation of the financial statements. We believe that our audits provide a reasonable basis for our opinion.
Critical Audit Matters
The critical audit matters communicated below are matters arising from the current period audit of the financial statements that were communicated or required to be communicated to the audit committee and that (1) relate to accounts or disclosures that are material to the financial statements and (2) involved our especially challenging, subjective, or complex judgments. The communication of critical audit matters does not alter in any way our opinion on the financial statements, taken as a whole, and we are not, by communicating the critical audit matters below, providing separate opinions on the critical audit matters or on the accounts or disclosures to which they relate.
Unpaid Losses and Loss Adjustment Expenses - Refer to Notes 1 and 12 to the financial statements
Critical Audit Matter Description
For property and casualty and group life and disability insurance products, the Company establishes reserves for unpaid losses and loss adjustment expenses to provide for the estimated costs of paying claims under insurance policies written by the Company. These reserves include estimates for both claims that have been reported and claims that have been incurred but not reported and include estimates of all losses and loss adjustment expenses associated with processing and settling these claims. This estimation process is based significantly on the assumption that past developments are an appropriate predictor of future events and involves a variety of actuarial techniques that analyze experience, trends and other relevant factors.
Given the subjectivity of estimating the ultimate cost to settle the liabilities for reported and unreported claims due to uncertainties caused by various factors including frequency and severity of claims as well as changes in the legislative and regulatory environment, performing audit procedures to evaluate whether unpaid losses and loss adjustment expenses were appropriately recorded as of December 31, 2021, required a high degree of auditor judgment and an increased extent of effort, including the need to involve our actuarial specialists.
How the Critical Audit Matter Was Addressed in the Audit
Our audit procedures related to the unpaid losses and loss adjustment expenses included the following, among others:
•We tested the effectiveness of controls related to the unpaid losses and loss adjustment expenses, including controls over inputs, methods, and assumptions used in the Company's estimation processes.
•We tested the underlying data that served as the basis for the Company’s analysis, including historical claims.
•With the assistance of our actuarial specialists, we evaluated the methods and assumptions used by the Company to estimate the unpaid losses and loss adjustment expenses by:
127
•Comparing the Company’s prior year assumptions of expected development of ultimate loss to actual losses incurred during the current year to identify potential management bias in the determination of the unpaid losses and loss adjustment expenses.
•Assessing the reasonableness of the Company’s analysis, and for selected reserving lines, developing independent estimates of the unpaid losses and loss adjustment expenses and comparing such estimates to the Company’s estimates.
Investments in Fixed Maturities Classified as Available-for-Sale - Refer to Notes 5 and 6 to the financial statements
Critical Audit Matter Description
Investments in fixed maturities classified as available-for-sale are reported at fair value in the financial statements. The investments without readily determinable fair values were valued using significant unobservable inputs, such as credit spreads and interest rates beyond the observable curve, that involved considerable judgment by the Company.
Given the Company used models and unobservable inputs to estimate the fair value of investments in fixed maturities classified as available-for-sale, performing audit procedures to evaluate these inputs required a high degree of auditor judgment and an increased extent of effort, including the need to involve our fair value specialists.
How the Critical Audit Matter Was Addressed in the Audit
Our audit procedures related to the models and unobservable inputs used by the Company to estimate the fair value of investments in fixed maturities classified as available-for-sale included the following, among others:
•We tested the effectiveness of controls over the valuation of investments in fixed maturities classified as available-for-sale, including controls over inputs, methods, and assumptions used in the Company’s estimation processes.
•On a sample basis, we tested the accuracy and completeness of the investments owned as of December 31, 2021, and the relevant security attributes used in the determination of their fair values.
•With the assistance of our fair value specialists, for a sample of investments, we tested the mathematical accuracy of the fair value calculation and developed independent estimates of the fair value and compared our estimates to the Company’s estimates. In addition to developing independent estimates, we obtained an understanding of the models and inputs used by the Company and assessed those models and inputs for reasonableness. Such assessment included comparing inputs to external sources or developing independent inputs.
/s/ DELOITTE & TOUCHE LLP
Hartford, Connecticut
February 18, 2022
We have served as the Company’s auditor since 2002.
128
THE HARTFORD FINANCIAL SERVICES GROUP, INC.
Consolidated Statements of Operations
| For the years ended December 31, | |||||||||||
| (in millions, except for per share data) | 2021 | 2020 | 2019 | ||||||||
| Revenues | |||||||||||
| Earned premiums | $ | 17,999 | $ | 17,288 | $ | 16,923 | |||||
| Fee income | 1,488 | 1,277 | 1,301 | ||||||||
| Net investment income | 2,313 | 1,846 | 1,951 | ||||||||
| Net realized gains (losses) | 509 | (14) | 395 | ||||||||
| Other revenues | 81 | 126 | 170 | ||||||||
| Total revenues | 22,390 | 20,523 | 20,740 | ||||||||
| Benefits, losses and expenses | |||||||||||
| Benefits, losses and loss adjustment expenses | 12,729 | 11,805 | 11,472 | ||||||||
| Amortization of deferred policy acquisition costs ("DAC") | 1,680 | 1,706 | 1,622 | ||||||||
| Insurance operating costs and other expenses | 4,779 | 4,480 | 4,580 | ||||||||
| Loss on extinguishment of debt | — | — | 90 | ||||||||
| Loss on reinsurance transaction | — | — | 91 | ||||||||
| Interest expense | 234 | 236 | 259 | ||||||||
| Amortization of other intangible assets | 71 | 72 | 66 | ||||||||
| Restructuring and other costs | 1 | 104 | — | ||||||||
| Total benefits, losses and expenses | 19,494 | 18,403 | 18,180 | ||||||||
| Income before income taxes | 2,896 | 2,120 | 2,560 | ||||||||
| Income tax expense | 531 | 383 | 475 | ||||||||
| Net income | 2,365 | 1,737 | 2,085 | ||||||||
| Preferred stock dividends | 21 | 21 | 21 | ||||||||
| Net income available to common stockholders | $ | 2,344 | $ | 1,716 | $ | 2,064 | |||||
| Net income available to common stockholders per common share | |||||||||||
| Basic | $ | 6.71 | $ | 4.79 | $ | 5.72 | |||||
| Diluted | $ | 6.62 | $ | 4.76 | $ | 5.66 | |||||
See Notes to Consolidated Financial Statements.
129
THE HARTFORD FINANCIAL SERVICES GROUP, INC.
Consolidated Statements of Comprehensive Income
| For the years ended December 31, | |||||||||||
| (in millions) | 2021 | 2020 | 2019 | ||||||||
| Net income | $ | 2,365 | $ | 1,737 | $ | 2,085 | |||||
| Other comprehensive income (loss) (“OCI”): | |||||||||||
| Change in net unrealized gain on fixed maturities | (1,218) | 1,150 | 1,660 | ||||||||
| Change in unrealized losses on fixed maturities for which an allowance for credit losses ("ACL") has been recorded | — | 1 | |||||||||
| Change in other-than-temporary impairment ("OTTI") losses recognized in other comprehensive income ("OCI") | 1 | ||||||||||
| Change in net gain on cash flow hedging instruments | (6) | 3 | 14 | ||||||||
| Change in foreign currency translation adjustments | (2) | 9 | 4 | ||||||||
| Change in pension and other postretirement plan adjustments | 228 | (45) | (48) | ||||||||
| OCI, net of tax | (998) | 1,118 | 1,631 | ||||||||
| Comprehensive income | $ | 1,367 | $ | 2,855 | $ | 3,716 | |||||
See Notes to Consolidated Financial Statements
130
THE HARTFORD FINANCIAL SERVICES GROUP, INC.
Consolidated Balance Sheets
| As of December 31, | ||||||||
| (in millions, except for share and per share data) | 2021 | 2020 | ||||||
| Assets | ||||||||
| Investments: | ||||||||
| Fixed maturities, available-for-sale, at fair value (amortized cost of $40,788 and $41,561, and ACL of $1 and $23) | $ | 42,847 | $ | 45,035 | ||||
| Equity securities, at fair value | 2,094 | 1,438 | ||||||
| Mortgage loans (net of ACL of $29 and $38) | 5,383 | 4,493 | ||||||
| Limited partnerships and other alternative investments | 3,353 | 2,082 | ||||||
| Other investments | 375 | 201 | ||||||
| Short-term investments | 3,697 | 3,283 | ||||||
| Total investments | 57,749 | 56,532 | ||||||
| Cash | 205 | 151 | ||||||
| Restricted Cash | 132 | 88 | ||||||
| Premiums receivable and agents' balances (net of ACL of $105 and $152) | 4,445 | 4,268 | ||||||
| Reinsurance recoverables (net of allowance for uncollectible reinsurance of $99 and $108) | 6,523 | 6,011 | ||||||
| Deferred policy acquisition costs | 881 | 789 | ||||||
| Deferred income taxes, net | 270 | 46 | ||||||
| Goodwill | 1,911 | 1,911 | ||||||
| Property and equipment, net | 1,027 | 1,122 | ||||||
| Other intangible assets, net | 858 | 950 | ||||||
| Other assets | 2,577 | 2,066 | ||||||
| Assets held for sale | — | 177 | ||||||
| Total assets | $ | 76,578 | $ | 74,111 | ||||
| Liabilities | ||||||||
| Unpaid losses and loss adjustment expenses | $ | 39,659 | $ | 37,855 | ||||
| Reserve for future policy benefits | 596 | 638 | ||||||
| Other policyholder funds and benefits payable | 687 | 701 | ||||||
| Unearned premiums | 7,194 | 6,629 | ||||||
| Long-term debt | 4,944 | 4,352 | ||||||
| Other liabilities | 5,655 | 5,222 | ||||||
| Liabilities held for sale | — | 158 | ||||||
| Total liabilities | 58,735 | 55,555 | ||||||
| Commitments and Contingencies (Note 15) | ||||||||
| Stockholders’ Equity | ||||||||
| Preferred stock, $0.01 par value — 50,000,000 shares authorized, 13,800 shares issued at December 31, 2021 and December 31, 2020, aggregate liquidation preference of $345 | 334 | 334 | ||||||
| Common stock, $0.01 par value — 1,500,000,000 shares authorized, 366,960,228 shares issued at December 31, 2021 and 384,923,222 shares issued at December 31, 2020 | 4 | 4 | ||||||
| Additional paid-in capital | 3,309 | 4,322 | ||||||
| Retained earnings | 15,764 | 13,918 | ||||||
| Treasury stock, at cost — 32,034,244 and 26,434,682 shares | (1,740) | (1,192) | ||||||
| Accumulated other comprehensive income, net of tax | 172 | 1,170 | ||||||
| Total stockholders' equity | 17,843 | 18,556 | ||||||
| Total liabilities and stockholders’ equity | $ | 76,578 | $ | 74,111 | ||||
See Notes to Consolidated Financial Statements.
131
THE HARTFORD FINANCIAL SERVICES GROUP, INC.
Consolidated Statements of Changes in Stockholders' Equity
| For the years ended December 31, | |||||||||||
| (in millions, except for share and per share data) | 2021 | 2020 | 2019 | ||||||||
| Preferred Stock | $ | 334 | $ | 334 | $ | 334 | |||||
| Common Stock | 4 | 4 | 4 | ||||||||
| Additional Paid-in Capital | |||||||||||
| Additional Paid-in Capital, beginning of period | 4,322 | 4,312 | 4,378 | ||||||||
| Issuance of shares under incentive and stock compensation plans | (90) | (96) | (100) | ||||||||
| Stock-based compensation plans expense | 116 | 106 | 114 | ||||||||
| Issuance of shares for warrant exercise | — | — | (80) | ||||||||
| Treasury stock retired | (1,039) | — | — | ||||||||
| Additional Paid-in Capital, end of period | 3,309 | 4,322 | 4,312 | ||||||||
| Retained Earnings | |||||||||||
| Retained Earnings, beginning of period | 13,918 | 12,685 | 11,055 | ||||||||
| Cumulative effect of accounting changes, net of tax | — | (18) | — | ||||||||
| Adjusted balance beginning of period | 13,918 | 12,667 | 11,055 | ||||||||
| Net income | 2,365 | 1,737 | 2,085 | ||||||||
| Dividends declared on preferred stock | (21) | (21) | (21) | ||||||||
| Dividends declared on common stock | (498) | (465) | (434) | ||||||||
| Retained Earnings, end of period | 15,764 | 13,918 | 12,685 | ||||||||
| Treasury Stock, at cost | |||||||||||
| Treasury Stock, at cost, beginning of period | (1,192) | (1,117) | (1,091) | ||||||||
| Treasury stock acquired | (1,702) | (150) | (200) | ||||||||
| Treasury stock retired | 1,039 | — | — | ||||||||
| Issuance of shares under incentive and stock compensation plans | 146 | 112 | 135 | ||||||||
| Net shares acquired related to employee incentive and stock compensation plans | (31) | (37) | (41) | ||||||||
| Issuance of shares for warrant exercise | — | — | 80 | ||||||||
| Treasury Stock, at cost, end of period | (1,740) | (1,192) | (1,117) | ||||||||
| Accumulated Other Comprehensive Income (Loss), net of tax | |||||||||||
| Accumulated Other Comprehensive Income (Loss), net of tax, beginning of period | 1,170 | 52 | (1,579) | ||||||||
| Total other comprehensive income (loss) | (998) | 1,118 | 1,631 | ||||||||
| Accumulated Other Comprehensive Income, net of tax, end of period | 172 | 1,170 | 52 | ||||||||
| Total Stockholders’ Equity | $ | 17,843 | $ | 18,556 | $ | 16,270 | |||||
| Preferred Shares Outstanding | 13,800 | 13,800 | 13,800 | ||||||||
| Common Shares Outstanding | |||||||||||
| Common Shares Outstanding, beginning of period (in thousands) | 358,489 | 359,570 | 359,151 | ||||||||
| Treasury stock acquired | (25,878) | (2,661) | (3,412) | ||||||||
| Issuance of shares under incentive and stock compensation plans | 2,902 | 2,298 | 2,906 | ||||||||
| Return of shares under incentive and stock compensation plans to treasury stock | (587) | (718) | (796) | ||||||||
| Issuance of shares for warrant exercise | — | — | 1,721 | ||||||||
| Common Shares Outstanding, end of period | 334,926 | 358,489 | 359,570 | ||||||||
| Cash dividends declared per common share | $ | 1.44 | $ | 1.30 | $ | 1.20 | |||||
| Cash dividends declared per preferred share | $ | 1,500.00 | $ | 1,500.00 | $ | 1,500.00 | |||||
See Notes to Consolidated Financial Statements.
132
THE HARTFORD FINANCIAL SERVICES GROUP, INC.
Consolidated Statements of Cash Flows
| For the years ended December 31, | |||||||||||
| (in millions) | 2021 | 2020 | 2019 | ||||||||
| Operating Activities | |||||||||||
| Net income | $ | 2,365 | $ | 1,737 | $ | 2,085 | |||||
| Adjustments to reconcile net income to net cash provided by operating activities | |||||||||||
| Net realized gains | (530) | (34) | (395) | ||||||||
| Amortization of deferred policy acquisition costs | 1,680 | 1,706 | 1,622 | ||||||||
| Additions to deferred policy acquisition costs | (1,751) | (1,666) | (1,635) | ||||||||
| Depreciation and amortization | 680 | 562 | 451 | ||||||||
| Loss on extinguishment of debt | — | — | 90 | ||||||||
| Loss on sale of business | 21 | 48 | — | ||||||||
| Other operating activities, net | (133) | 85 | 76 | ||||||||
| Change in assets and liabilities: | |||||||||||
| Increase in reinsurance recoverables | (582) | (540) | (81) | ||||||||
| Net change in accrued and deferred income taxes | 85 | 459 | 886 | ||||||||
| Increase in insurance liabilities | 2,416 | 1,426 | 768 | ||||||||
| Net change in other assets and other liabilities | (158) | 88 | (378) | ||||||||
| Net cash provided by operating activities | 4,093 | 3,871 | 3,489 | ||||||||
| Investing Activities | |||||||||||
| Proceeds from the sale/maturity/prepayment of: | |||||||||||
| Fixed maturities, available-for-sale | 22,457 | 19,534 | 18,499 | ||||||||
| Equity securities at fair value | 626 | 1,485 | 1,553 | ||||||||
| Mortgage loans | 1,506 | 948 | 771 | ||||||||
| Partnerships | 537 | 167 | 238 | ||||||||
| Payments for the purchase of: | |||||||||||
| Fixed maturities, available-for-sale | (21,754) | (21,112) | (19,881) | ||||||||
| Equity securities at fair value | (1,420) | (962) | (1,316) | ||||||||
| Mortgage loans | (2,386) | (1,264) | (1,275) | ||||||||
| Partnerships | (1,317) | (491) | (303) | ||||||||
| Net proceeds from (payments for) derivatives | (7) | 112 | 32 | ||||||||
| Net additions to property and equipment | (133) | (114) | (105) | ||||||||
| Net proceeds from (payments for) short-term investments | (417) | (368) | 1,491 | ||||||||
| Other investing activities, net | (169) | (1) | 49 | ||||||||
| Proceeds from businesses sold, net of cash transferred | 11 | — | — | ||||||||
| Amounts paid for business acquired, net of cash acquired | — | — | (1,901) | ||||||||
| Net cash used for investing activities | (2,466) | (2,066) | (2,148) | ||||||||
| Financing Activities | |||||||||||
| Deposits and other additions to investment and universal life-type contracts | 89 | 60 | 123 | ||||||||
| Withdrawals and other deductions from investment and universal life-type contracts | (75) | (102) | (124) | ||||||||
| Net decrease in securities loaned or sold under agreements to repurchase | — | (587) | (323) | ||||||||
| Repayment of debt | — | (500) | (1,583) | ||||||||
| Proceeds from the issuance of debt | 588 | — | 1,376 | ||||||||
| Net issuance (return) of shares under incentive and stock compensation plans | 25 | (21) | (6) | ||||||||
| Treasury stock acquired | (1,702) | (150) | (200) | ||||||||
| Dividends paid on preferred stock | (21) | (21) | (21) | ||||||||
| Dividends paid on common stock | (485) | (457) | (433) | ||||||||
| Net cash used for financing activities | (1,581) | (1,778) | (1,191) | ||||||||
| Foreign exchange rate effect on cash | (6) | 8 | (9) | ||||||||
| Net increase in cash and restricted cash, including cash classified within assets held for sale | 40 | 35 | 141 | ||||||||
| Less: Net increase (decrease) in cash classified as assets held for sale | (58) | 58 | — | ||||||||
| Net increase (decrease) in cash and restricted cash | 98 | (23) | 141 | ||||||||
| Cash and restricted cash — beginning of period | 239 | 262 | 121 | ||||||||
| Cash and restricted cash — end of period | $ | 337 | $ | 239 | $ | 262 | |||||
| Supplemental Disclosure of Cash Flow Information | |||||||||||
| Income tax paid (received) | $ | 496 | $ | (71) | $ | (396) | |||||
| Interest paid | $ | 214 | $ | 232 | $ | 261 | |||||
See Notes to Consolidated Financial Statements.
133
|
| Note 1 - Basis of Presentation and Significant Accounting Policies | ||||||||
THE HARTFORD FINANCIAL SERVICES GROUP, INC.
NOTES TO CONSOLIDATED FINANCIAL STATEMENTS
(Dollar amounts in millions, except for per share data, unless otherwise stated)
1. BASIS OF PRESENTATION AND SIGNIFICANT ACCOUNTING POLICIES
The Hartford Financial Services Group, Inc. is a holding company for insurance and financial services subsidiaries that provide property and casualty insurance, group life and disability products and mutual funds and exchange-traded products to individual and business customers in the United States as well as in the United Kingdom, and other international locations (collectively, “The Hartford”, the “Company”, “we” or “our”).
On December 29, 2021, the Company completed the sale of all of the issued and outstanding equity of Navigators Holdings (Europe) N.V., a Belgium holding company, and its subsidiaries, Bracht, Deckers & Mackelbert N.V. (“BDM”) and Assurances Contintales Contintale Verzekeringen N.V. (“ASCO”), (collectively referred to as "Continental Europe Operations"). For further discussion of this transaction, see Note 22 - Business Dispositions.
On May 23, 2019, the Company completed the acquisition of The Navigators Group, Inc. ("Navigators Group"), a global specialty underwriter, for $70 a share, or $2.137 billion in cash, including transaction expenses. For further discussion of these transactions, see Note 2 - Business Acquisitions and Note 22 - Business Dispositions.
The Consolidated Financial Statements have been prepared in accordance with accounting principles generally accepted in the United States of America (“U.S. Generally Accepted Accounting Principles”) which differ materially from the accounting practices prescribed by various insurance regulatory authorities.
Consolidation
The Consolidated Financial Statements include the accounts of The Hartford Financial Services Group, Inc., and entities in which the Company directly or indirectly has a controlling financial interest. Entities in which the Company has significant influence over the operating and financing decisions but does not control are reported using the equity method. Intercompany transactions and balances between The Hartford and its subsidiaries and affiliates have been eliminated.
Use of Estimates
The preparation of financial statements in conformity with U.S. Generally Accepted Accounting Principles ("GAAP") requires management to make estimates and assumptions that affect the reported amounts of assets and liabilities and the disclosure of contingent assets and liabilities at the date of the financial statements and the reported amounts of revenues and expenses during the reporting period. Actual results could differ from those estimates.
The most significant estimates include those used in determining property and casualty and group long-term disability insurance product reserves, net of reinsurance; evaluation of goodwill for impairment; valuation of investments and derivative instruments; and contingencies relating to corporate litigation and regulatory matters.
Reclassifications
Certain reclassifications have been made to prior year financial information to conform to the current year presentation.
Adoption of New Accounting Standards
Goodwill
On January 1, 2020, the Company adopted the Financial Accounting Standards Board's ("FASB") updated guidance on testing goodwill for impairment with no effect at adoption. The updated guidance requires impairment of goodwill if the carrying value of the reporting unit is greater than the estimated fair value, with the amount of the impairment not to exceed the carrying value of the reporting unit’s goodwill. Goodwill is reviewed for impairment at least annually and more frequently if events occur or circumstances change that would indicate that a triggering event for a potential impairment has occurred. Under the updated guidance, changes in market-based factors are more likely to result in a goodwill impairment than under the prior accounting guidance, whether a reporting unit's fair value is estimated using an income approach or a market approach. For example, changes in the weighted average cost of capital that is used to discount expected cash flows under the income approach or changes in market-based factors such as peer company price to earnings multiples or price to book multiples under a market approach can significantly affect changes to the estimated fair value of each reporting unit and such changes could result in impairments that have a material effect on our results of operations and financial condition.
Financial Instruments - Credit Losses
On January 1, 2020, the Company adopted the FASB’s updated guidance for recognition and measurement of credit losses on financial instruments. The new guidance replaces the “incurred loss” approach with an “expected loss” model for recognizing credit losses for financial instruments carried at other than fair value. Under the new model, for financial instruments carried at other than fair value, such as mortgage loans, reinsurance recoverables and receivables, an allowance for credit losses ("ACL") is recognized which is an estimate of credit losses expected over the life of financial instruments. Under the prior accounting model an ACL was recognized using an incurred loss approach. The new guidance also requires that we estimate a liability for credit losses ("LCL") on off balance sheet credit exposures such as financial guarantees and mortgage loan commitments that the Company cannot unconditionally cancel.
Credit losses on fixed maturities, available-for-sale ("AFS") carried at fair value continue to be measured based on the present value of expected future cash flows compared to amortized cost; however, the losses are now recognized through
134
|
| Note 1 - Basis of Presentation and Significant Accounting Policies | ||||||||
THE HARTFORD FINANCIAL SERVICES GROUP, INC.
NOTES TO CONSOLIDATED FINANCIAL STATEMENTS (continued)
an ACL and no longer as an adjustment to the amortized cost. Recoveries of credit losses on fixed maturities, AFS are now recognized as reversals of the ACL and no longer accreted as investment income through an adjustment to the investment yield. The ACL on fixed maturities, AFS cannot cause the net carrying value to be below fair value and, therefore, it is possible that future increases in fair value due to decreases in market interest rates could cause the reversal of the ACL and increase net income. The new guidance also requires purchased financial assets with a more-than-insignificant amount of credit deterioration since original issuance to be recorded based on contractual amounts due and an initial allowance recorded at the date of purchase.
The Company adopted the guidance effective January 1, 2020, through a cumulative-effect adjustment that decreased retained earnings by $18, representing a net increase to the ACL and LCL, after tax. No ACL was recognized at adoption for fixed maturities, AFS; rather, these investments are evaluated for an ACL prospectively. The Company does not have any purchased financial assets with a more than insignificant amount of credit deterioration since original issuance.
Impact of Adoption on Consolidated Balance Sheet
| Balance as of January 1, 2020 | |||||||||||
| Opening Balance | Cumulative Effect of Accounting Change | Adjusted Opening Balance | |||||||||
| Mortgage loans | $ | 4,215 | $ | 4,215 | |||||||
| ACL on mortgage loans | — | $ | (19) | (19) | |||||||
| Mortgage loans, net of ACL | 4,215 | (19) | 4,196 | ||||||||
| Premiums receivable and agents’ balances | 4,529 | 4,529 | |||||||||
| ACL on premiums receivable and agents' balances | (145) | 23 | (122) | ||||||||
| Premiums receivable and agents' balances, net of ACL | 4,384 | 23 | 4,407 | ||||||||
| Reinsurance recoverables | 5,641 | 5,641 | |||||||||
| ACL and allowance for disputed amounts on reinsurance recoverables | (114) | (2) | (116) | ||||||||
| Reinsurance recoverables, net of allowance for uncollectible reinsurance | 5,527 | (2) | 5,525 | ||||||||
| Deferred income tax asset, net | 299 | 5 | 304 | ||||||||
| Other liabilities | (5,157) | (25) | (5,182) | ||||||||
| Retained Earnings | $ | 12,685 | $ | (18) | $ | 12,667 | |||||
Summary of Adoption Impacts
| Net increase to ACL and LCL | $ | (23) | |||
| Net tax effects | 5 | ||||
| Net decrease to retained earnings | $ | (18) | |||
Reference Rate Reform
On March 12, 2020, the Company adopted the FASB’s temporary guidance, which allows The Hartford to account for contract modifications made solely due to rate reform (such as replacing London Inter-Bank Offered Rate ("LIBOR") with another reference rate) as continuations of existing contracts and to maintain hedge accounting when the hedging effectiveness between a financial instrument and its hedge is only affected by the change to a replacement rate. As a result, The Hartford will not recognize gains and losses during the transition period of LIBOR to an alternative reference rate that would otherwise have arisen from accounting assessments and remeasurements. The guidance expires for contract modifications made and hedge relationships entered into or evaluated after December 31, 2022. The Company is not required to measure the effect of adoption on its financial position, cash flows or net income because the guidance
135
|
| Note 1 - Basis of Presentation and Significant Accounting Policies | ||||||||
THE HARTFORD FINANCIAL SERVICES GROUP, INC.
NOTES TO CONSOLIDATED FINANCIAL STATEMENTS (continued)
provides relief from accounting for the effects of the change to a replacement rate.
Future Adoption of New Accounting Standards
Reserve for Future Policy Benefits
The FASB issued new guidance on accounting for long-duration insurance contracts. The Company’s long-duration insurance contracts include paid-up life insurance and whole-life insurance policies resulting from conversion from group life policies and run-off structured settlement and terminal funding agreement liabilities with total future policy benefit reserves of $596 and $638 as of December 31, 2021 and 2020, respectively. Under existing guidance, a reserve for future policy benefits is calculated as the present value of future benefits and related expenses less the present value of any future premiums using assumptions “locked in” at the time the policies were issued, including discount rate, lapse rate, mortality, and expense assumptions. Under existing guidance, assumptions are only updated if there is an expected premium deficiency. The new guidance will require that underlying cash flow assumptions (such as for lapse rate and mortality) be reviewed and updated at least annually in the same quarter each year. The new guidance also requires that the discount rate assumption be updated each quarter and be based on an upper-medium grade (low-credit-risk) fixed-income investment yield. The change in the reserve estimate as a result of updating cash flow assumptions will be recognized in net income. The change in the reserve estimate as a result of updating the discount rate assumption will be recognized in other comprehensive income. Because reserves will be based on updated assumptions and no longer locked in at contract inception, there will no longer be a test for premium deficiency. The new guidance will be effective January 1, 2023, and will be applied retrospectively to January 1, 2021 (the “transition date”). The Company will not early adopt the updated guidance and will apply a modified retrospective transition method.
The Company’s implementation activities are ongoing and include reviewing and validating methodologies, data and assumptions used to estimate the reserve for future policy benefits and developing disclosures as required by the new guidance. The Company expects the adoption of the new guidance to result in an increase to the reserve for future policy benefits and a corresponding decrease to accumulated other comprehensive income ("AOCI") as of the transition date because market upper-medium grade (low-credit-risk) fixed-income investment yields were lower as of the transition date than the locked in rates that were previously used to discount the reserves. The adoption is not expected to have a material effect on the Company’s total liabilities, stockholders’ equity or results of operations.
Significant Accounting Policies
The Company’s significant accounting policies are as follows:
Revenue Recognition
Premium Revenue from Direct Insurance and Assumed Reinsurance
Property and casualty premiums are earned on a pro rata basis over the policy period and include accruals for policies that have been written by agents but not yet reported to us, as well as ultimate premium revenue anticipated under auditable and retrospectively rated policies. We estimate the amount of premium not yet reported based on current and historical trends of the business being written. Such estimates are regularly reviewed and updated and any resulting adjustments are included in the current year's results. Unearned premiums represent the premiums applicable to the unexpired terms of policies in force, or period of risk.
Group life, disability and accident premiums are generally due from policyholders and recognized as revenue on a pro rata basis over the period of the contracts.
An estimated ACL is recorded on the basis of periodic evaluations of balances due from insureds and considering historical credit loss information, adjusted for current economic conditions and beginning January 1, 2020, reasonable and supportable forecasts when appropriate . The Company records total credit loss expenses related to premiums receivable in insurance operating costs and other expenses. Write-offs of premiums receivable and agents' balances and any related ACL are recorded in the period in which the balance is deemed uncollectible. Refer to Note 8 - Premiums Receivable and Agents' Balances for further discussion regarding the allowance for doubtful accounts included in premiums receivable and agents’ balances.
Revenue from Non-Insurance Contracts with Customers
Installment fees are charged on property and casualty insurance contracts for billing the insurance customer in installments over the policy term. These fees are recognized in fee income as earned on collection.
Insurance servicing revenues within Personal Lines consist of up-front commissions earned for collecting premiums and processing claims on insurance policies for which The Hartford does not assume underwriting risk, predominantly related to the National Flood Insurance Plan program. These insurance servicing revenues are recognized over the period of the flood program's policy terms.
Group Benefits earns fee income from employers for the administration of underwriting, implementation and claims processing for employer self-funded plans and for leave management services. Fees are recognized as services are provided and collected monthly.
Hartford Funds provides investment management, administrative and distribution services to mutual funds and exchange-traded products. The Company assesses investment advisory, distribution and other asset management fees primarily based on the average daily net asset values from mutual funds and exchange-traded products, which are
136
|
| Note 1 - Basis of Presentation and Significant Accounting Policies | ||||||||
THE HARTFORD FINANCIAL SERVICES GROUP, INC.
NOTES TO CONSOLIDATED FINANCIAL STATEMENTS (continued)
recorded in the period in which the services are provided and are collected monthly. Fluctuations in domestic and international markets and related investment performance, volume and mix of sales and redemptions of mutual funds or exchange-traded products, and other changes to the composition of assets under management are all factors that ultimately have a direct effect on fee income earned.
Hartford Funds other fees primarily include transfer agent fees, generally assessed as a charge per account, and are recognized as fee income in the period in which the services are provided with payments collected monthly.
Corporate investment management and other fees are primarily for managing third party invested assets, including management of a portion of the invested assets of The Hartford’s former life and annuity business. These fees, calculated based on the average quarterly net asset values, are recorded in the period in which the services are provided and are collected quarterly. Fluctuations in markets and interest rates and other changes to the composition of assets under management are all factors that ultimately have a direct effect on fee income earned.
Dividends to Policyholders
Policyholder dividends are paid to certain property and casualty policyholders. Policies that receive dividends are referred to as participating policies. Participating dividends to policyholders are accrued and reported in insurance operating costs and other expenses and other liabilities using an estimate of the amount to be paid based on underlying contractual obligations under policies and applicable state laws.
Net written premiums for participating property and casualty insurance policies represented 7%, 7% and 9% of total net written premiums for the years ended December 31, 2021, 2020 and 2019, respectively. Participating dividends to property and casualty policyholders were $24, $29 and $30 for the years ended December 31, 2021, 2020 and 2019, respectively.
There were no additional amounts of income allocated to participating policyholders.
Investments
Overview
The Company’s investments in fixed maturities include bonds, structured securities, and redeemable preferred stock and commercial paper. Most of these investments are classified as AFS and are carried at fair value. The after tax difference between fair value and cost or amortized cost is reflected in stockholders’ equity as a component of AOCI. Equity securities are measured at fair value with any changes in valuation reported in net income. Mortgage loans are recorded at the outstanding principal balance adjusted for amortization of premiums or discounts and net of an ACL. Short-term investments are carried at amortized cost, which approximates fair value. Limited partnerships and other alternative investments are reported at their carrying value and are primarily accounted for under the equity method with the Company’s share of earnings included in net investment income. Recognition of income related to limited partnerships and other alternative investments is delayed due to the availability of the related financial information, as private equity and other funds are generally on a three-month delay.
Accordingly, income for the years ended December 31, 2021, 2020, and 2019 may not include the full impact of current year changes in valuation of the underlying assets and liabilities of the funds, which are generally obtained from the limited partnerships. Other investments primarily consist of investments of consolidated investment funds for which the Company has provided seed money and reports the underlying investments at fair value with changes in the fair value recognized in income consistent with accounting requirements for investment companies. Also included in other investments are derivative instruments which are carried at fair value, overseas deposits which are measured at fair value using the net asset value as a practical expedient, equity fund investments, and certain investments for which the Company has elected the fair value option ("FVO"). These investments are carried at fair value and changes in value are recorded in net realized gains and losses.
Net Realized Gains and Losses
Net realized gains and losses from investment sales are reported as a component of revenues and are determined on a specific identification basis. Net realized gains and losses also result from fair value changes in equity securities, fixed maturities, FVO, and derivatives contracts that do not qualify, or are not designated, as a hedge for accounting purposes. Prior to January 1, 2020, impairments of fixed maturities and changes in mortgage loan valuation allowances were recognized as net realized losses as discussed in Note 6 -Investments. Effective January 1, 2020, the Company records net credit losses on fixed maturities, AFS and changes in the ACL on mortgage loans as a component of net realized gains and losses. For further information, see Financial Instruments - Credit Losses discussion above.
Net Investment Income
Interest income from fixed maturities and mortgage loans is recognized when earned on the constant effective yield method based on the estimated timing of cash flows. Most premiums and discounts on fixed maturities are amortized to the maturity date. Premiums on callable bonds may be amortized to call dates based on call prices. For securitized financial assets subject to prepayment risk, yields are recalculated and adjusted periodically to reflect historical and/or estimated future prepayments using the retrospective method. For certain other asset-backed securities, including securities that previously had an ACL and interest only securities, any yield adjustments are made using the prospective method. Prepayment fees and make-whole payments on fixed maturities and mortgage loans are recorded in net investment income when earned. For equity securities, dividends are recognized as investment income on the ex-dividend date. Limited partnerships and other alternative investments primarily use the equity method of accounting to recognize the Company’s share of earnings. Prior to January 1, 2020, for impaired fixed maturities, the Company accreted the new amortized cost to the estimated future cash flows over the expected remaining life of the investment by prospectively adjusting the effective yield, if necessary. Effective January 1, 2020, the Company no longer records credit losses as adjustments to the amortized cost of the fixed maturity but rather records an ACL. Future changes in the ACL resulting from improvements in expected future cash flows are not recorded as adjustments to yield through net investment income but are recorded through net realized gains and losses. For fixed maturities with an ACL, net investment income is recognized at
137
|
| Note 1 - Basis of Presentation and Significant Accounting Policies | ||||||||
THE HARTFORD FINANCIAL SERVICES GROUP, INC.
NOTES TO CONSOLIDATED FINANCIAL STATEMENTS (continued)
the original effective rate and accretion of the ACL is recognized through net realized gains and losses. For further information, see Financial Instruments - Credit Losses discussion above. The Company’s non-income producing investments were not material for the years ended December 31, 2021, 2020 and 2019.
Derivative Instruments
Overview
The Company utilizes a variety of over-the-counter ("OTC") derivatives, derivatives cleared through central clearing houses ("OTC-cleared") and exchange traded derivative instruments as part of its overall risk management strategy as well as to engage in income generation covered call transactions and replication transactions. The types of instruments may include swaps, caps, floors, forwards, futures and options to achieve the following Company-approved objectives:
•to hedge risk arising from interest rate, equity market, commodity market, credit spread and issuer default, price or currency exchange rates or volatility;
•to manage liquidity;
•to control transaction costs;
•to enter into income generation covered call transactions and synthetic replication transactions.
Interest rate and credit default swaps involve the periodic exchange of cash flows with other parties, at specified intervals, calculated using agreed upon rates or other financial variables and notional principal amounts. Generally, little to no cash or principal payments are exchanged at the inception of the contract. Typically, at the time a swap is entered into, the cash flow streams exchanged by the counterparties are equal in value.
The Company clears certain interest rate swap and credit default swap derivative transactions through central clearing houses. OTC-cleared derivatives require initial collateral at the inception of the trade in the form of cash or highly liquid securities, such as U.S. Treasuries and government agency investments. Central clearing houses also require additional cash as variation margin based on daily market value movements. For information on collateral, see the Derivative Collateral Arrangements section in Note 7 - Derivatives. In addition, OTC-cleared transactions include price alignment amounts either received or paid on the variation margin, which are reflected in realized gains and losses or, if characterized as interest, in net investment income.
Forward contracts are customized commitments that specify a rate of interest or currency exchange rate to be paid or received on an obligation beginning on a future start date and are typically settled in cash.
Financial futures are standardized commitments to either purchase or sell designated financial instruments, at a future date, for a specified price and may be settled in cash or through delivery of the underlying instrument. Futures contracts trade on organized exchanges. Margin requirements for futures are met by pledging securities or cash, and changes in the futures’ contract values are settled daily in cash.
Option contracts grant the purchaser, for a premium payment, the right to either purchase from or sell to the issuer a financial instrument at a specified price, within a specified period or on a stated date. The contracts may reference commodities, which grant the purchaser the right to either purchase from or sell to the issuer commodities at a specified price, within a specified period or on a stated date. Option contracts are typically settled in cash.
Foreign currency swaps exchange an initial principal amount in two currencies, agreeing to re-exchange the currencies at a future date, at an agreed upon exchange rate. There may also be a periodic exchange of payments at specified intervals calculated using the agreed upon rates and exchanged principal amounts.
The Company’s derivative transactions conducted in insurance company subsidiaries are used in strategies permitted under the derivative use plans required by the State of Connecticut, the State of Illinois and the State of New York insurance departments.
Accounting and Financial Statement Presentation of Derivative Instruments and Hedging Activities
Derivative instruments are recognized on the Consolidated Balance Sheets at fair value and are reported in Other Investments and Other Liabilities. For balance sheet presentation purposes, the Company has elected to offset the fair value amounts, income accruals, and related cash collateral receivables and payables of OTC derivative instruments executed in a legal entity and with the same counterparty or under a master netting agreement, which provides the Company with the legal right of offset.
On the date the derivative contract is entered into, the Company designates the derivative as (1) a hedge of the fair value of a recognized asset or liability (“fair value” hedge), (2) a hedge of the variability in cash flows of a forecasted transaction or of amounts to be received or paid related to a recognized asset or liability (“cash flow” hedge), (3) a hedge of a net investment in a foreign operation (“net investment” hedge) or (4) held for other investment and/or risk management purposes, which primarily involve managing asset or liability related risks and do not qualify for hedge accounting. The Company currently does not designate any derivatives as fair value or net investment hedges.
Cash Flow Hedges - Changes in the fair value of a derivative that is designated and qualifies as a cash flow hedge, including foreign-currency cash flow hedges, are recorded in AOCI and are reclassified into earnings when the variability of the cash flow of the hedged item impacts earnings. Gains and losses on derivative contracts that are reclassified from AOCI to current period earnings are included in the line item in the Consolidated Statements of Operations in which the cash flows of the hedged item are recorded. Periodic derivative net coupon settlements are recorded in the line item of the Consolidated Statements of Operations in which the cash flows of the hedged item are recorded. Cash flows from cash flow hedges are presented in the same category as the cash flows from the items being hedged in the Consolidated Statement of Cash Flows.
Other Investment and/or Risk Management Activities - The Company’s other investment and/or risk management activities
138
|
| Note 1 - Basis of Presentation and Significant Accounting Policies | ||||||||
THE HARTFORD FINANCIAL SERVICES GROUP, INC.
NOTES TO CONSOLIDATED FINANCIAL STATEMENTS (continued)
primarily relate to strategies used to reduce economic risk or replicate permitted investments and do not receive hedge accounting treatment. Changes in the fair value, including periodic derivative net coupon settlements, of derivative instruments held for other investment and/or risk management purposes are reported in current period earnings as net realized gains and losses.
Hedge Documentation and Effectiveness Testing
To qualify for hedge accounting treatment, a derivative must be highly effective in mitigating the designated changes in fair value or cash flows of the hedged item. At hedge inception, the Company formally documents all relationships between hedging instruments and hedged items, as well as its risk-management objective and strategy for undertaking each hedge transaction. The documentation process includes linking derivatives that are designated as fair value, cash flow, or net investment hedges to specific assets or liabilities on the balance sheet or to specific forecasted transactions and defining the effectiveness testing methods to be used. The Company also formally assesses both at the hedge’s inception and ongoing on a quarterly basis, whether the derivatives that are used in hedging transactions have been and are expected to continue to be highly effective in offsetting changes in fair values, cash flows or net investment in foreign operations of hedged items. Hedge effectiveness is assessed primarily using quantitative methods as well as using qualitative methods. Quantitative methods include regression or other statistical analysis of changes in fair value or cash flows associated with the hedge relationship. Qualitative methods may include comparison of critical terms of the derivative to the hedged item.
Discontinuance of Hedge Accounting
The Company discontinues hedge accounting prospectively when (1) it is determined that the qualifying criteria are no longer met; (2) the derivative is no longer designated as a hedging instrument; or (3) the derivative expires or is sold, terminated or exercised.
When cash flow hedge accounting is discontinued because the Company becomes aware that it is not probable that the forecasted transaction will occur, the derivative continues to be carried on the balance sheet at its fair value, and gains and losses that were accumulated in AOCI are recognized immediately in earnings.
In other situations in which hedge accounting is discontinued, including those where the derivative is sold, terminated or exercised, amounts previously deferred in AOCI are reclassified into earnings when earnings are impacted by the hedged item.
Embedded Derivatives
The Company may purchase investments that contain embedded derivative instruments. When it is determined that (1) the embedded derivative possesses economic characteristics that are not clearly and closely related to the economic characteristics of the host contract and (2) a separate instrument with the same terms would qualify as a derivative instrument, the embedded derivative is bifurcated from the host for measurement purposes. The embedded derivative, which is reported with the host instrument in the Consolidated Balance Sheets, is carried at fair value with changes in fair value reported in net realized gains and losses.
Credit Risk of Derivative Instruments
Credit risk is defined as the risk of financial loss due to uncertainty of an obligor’s or counterparty’s ability or willingness to meet its obligations in accordance with agreed upon terms. Credit exposures are measured using the market value of the derivatives, resulting in amounts owed to the Company by its counterparties or potential payment obligations from the Company to its counterparties. The Company generally requires that OTC derivative contracts, other than certain forward contracts, be governed by International Swaps and Derivatives Association agreements which are structured by legal entity and by counterparty, and permit right of offset. Some agreements require daily collateral settlement based upon agreed upon thresholds. For purposes of daily derivative collateral maintenance, credit exposures are generally quantified based on the prior business day’s market value and collateral is pledged to and held by, or on behalf of, the Company to the extent the current value of the derivatives is greater than zero, subject to minimum transfer thresholds, if applicable. The Company also minimizes the credit risk of derivative instruments by entering into transactions with high quality counterparties primarily rated A or better, which are monitored and evaluated by the Company’s risk management team and reviewed by senior management. OTC-cleared derivatives are governed by clearing house rules. Transactions cleared through a central clearing house reduce risk due to their ability to require daily variation margin and act as an independent valuation source. In addition, the Company monitors counterparty credit exposure on a monthly basis to ensure compliance with Company policies and statutory limitations.
Cash and Restricted Cash
Cash represents cash on hand and demand deposits with banks or other financial institutions. Restrictions on cash primarily relate to funds that are held to support regulatory and contractual obligations.
Reinsurance
The Company cedes insurance to affiliated and unaffiliated insurers in order to limit its maximum losses and to diversify its exposures and provide statutory surplus relief. Such arrangements do not relieve the Company of its primary liability to policyholders. Failure of reinsurers to honor their obligations could result in losses to the Company. The Company also assumes reinsurance from other insurers and is a member of and participates in reinsurance pools and associations. Assumed reinsurance refers to the Company’s acceptance of certain insurance risks that other insurance companies or pools have underwritten.
Reinsurance accounting is followed for ceded and assumed transactions that provide indemnification against loss or liability relating to insurance risk (i.e. risk transfer). To meet risk transfer requirements, a reinsurance agreement must include insurance risk, consisting of underwriting and timing risk, and a reasonable possibility of a significant loss to the reinsurer. If the ceded and assumed transactions do not meet risk transfer requirements, the Company accounts for these transactions as deposit transactions. As of December 31, 2021, the Company's deposit liability was $99 reported in other liabilities.
Premiums, benefits, losses and loss adjustment expenses reflect the net effects of ceded and assumed reinsurance
139
|
| Note 1 - Basis of Presentation and Significant Accounting Policies | ||||||||
THE HARTFORD FINANCIAL SERVICES GROUP, INC.
NOTES TO CONSOLIDATED FINANCIAL STATEMENTS (continued)
transactions. Included in other assets are prepaid reinsurance premiums, which represent the portion of premiums ceded to reinsurers applicable to the unexpired terms of the reinsurance contracts. Reinsurance recoverables are balances due from reinsurance companies for paid and unpaid losses and loss adjustment expenses and are presented net of an allowance for uncollectible reinsurance. Changes in the allowance for uncollectible reinsurance are reported in benefits, losses and loss adjustment expenses in the Company's Consolidated Statements of Operations.
The Company periodically evaluates the recoverability of its reinsurance recoverable assets and establishes an allowance for uncollectible reinsurance. The allowance for uncollectible reinsurance reflects management’s best estimate of reinsurance cessions that may be uncollectible in the future due to reinsurers’ unwillingness or inability to pay. The allowance for uncollectible reinsurance comprises an ACL and an allowance for disputed balances. Based on this analysis, the Company may adjust the allowance for uncollectible reinsurance or charge off reinsurer balances that are determined to be uncollectible. The Company records credit losses related to reinsurance recoverables in benefits losses and loss adjustment expenses. Write-offs of reinsurance recoverables and any related ACL are recorded in the period in which the balance is deemed uncollectible. Expected recoveries are included in the estimate of the ACL.
Retroactive reinsurance agreements, including adverse development covers, are reinsurance agreements under which our reinsurer agrees to reimburse us as a result of past insurable events. For these agreements, the consideration paid in excess of the estimated ultimate losses recoverable under the agreement at inception is recognized as a loss on reinsurance transaction. The benefit of subsequent adverse development ceded up to the total consideration paid is recognized as ceded losses, which are a reduction of incurred losses and loss adjustment expenses. The excess of the estimated amounts ultimately recoverable under the agreement over the consideration paid is recognized as a deferred gain liability and amortized into income over the period the ceded losses are recovered in cash from the reinsurer. The amount of the deferred gain liability is recalculated each period based on cumulative recoveries not yet collected relative to the latest estimate of ultimate losses recoverable. Ceded loss reserves under retroactive agreements were $1.3 billion and $1.1 billion, and the deferred gain liability reported in other liabilities was $574 and $328, as of December 31, 2021 and 2020, respectively. In any given period, the change in deferred gain included in net income includes amortization of the deferred gain based on the percentage of ultimate ceded losses collected plus any change in the deferred gain liability due to changes in the estimated ultimate losses recoverable. The effect on income from change in the deferred gain was a charge to earnings of $246, $312 and $16 before tax for the years ended December 31, 2021, 2020, and 2019 respectively.
Deferred Policy Acquisition Costs
DAC represents costs that are directly related to the acquisition of new and renewal insurance contracts and incremental direct costs of contract acquisition that are incurred in transactions with independent third parties or in compensation to employees. Such costs primarily include commissions, premium taxes, costs
of policy issuance and underwriting, and certain other expenses that are directly related to successfully issued contracts.
For property and casualty insurance products and group life, disability and accident contracts, costs are deferred and amortized ratably over the period the related premiums are earned. Deferred acquisition costs are reviewed to determine if they are recoverable from future income, and if not, are charged to expense. Anticipated investment income is considered in the determination of the recoverability of DAC.
Income Taxes
The Company recognizes taxes payable or refundable for the current year and deferred taxes for the tax consequences of temporary differences between the financial reporting and tax basis of assets and liabilities. Deferred tax assets and liabilities are measured using enacted tax rates expected to apply to taxable income in the years the temporary differences are expected to reverse. A deferred tax provision is recorded for the tax effects of differences between the Company's current taxable income and its income before tax under generally accepted accounting principles in the Consolidated Statements of Operations. For deferred tax assets, the Company records a valuation allowance that is adequate to reduce the total deferred tax asset to an amount that will more likely than not be realized.
Goodwill
Goodwill represents the excess of the cost to acquire a business over the fair value of net assets acquired. Goodwill is not amortized but is reviewed for impairment at least annually or more frequently if events occur or circumstances change that would indicate that a triggering event for a potential impairment has occurred. Goodwill is tested for impairment by comparing the fair value of a reporting unit to its carrying value. Goodwill is impaired up to the amount that the carrying value of the reporting unit exceeds the fair value. A reporting unit is defined as an operating segment or one level below an operating segment. The Company’s reporting units, for which goodwill has been allocated consist of Commercial Lines, Personal Lines, Group Benefits, and Hartford Funds.
Management’s determination of the fair value of each reporting unit incorporates multiple inputs into discounted cash flow calculations, including assumptions that market participants would make in valuing the reporting unit. Assumptions include levels of economic capital required to support the business, future business growth, earnings projections, the weighted average cost of capital used for purposes of discounting and, for the Hartford Funds segment, assets under management. Decreases in business growth, decreases in earnings projections and increases in the weighted average cost of capital will all cause a reporting unit’s fair value to decrease, increasing the possibility of impairments.
Intangible Assets
Acquired intangible assets on the Consolidated Balance Sheets include purchased customer relationship and agency or other distribution rights and licenses measured at fair value at acquisition. The Company amortizes finite-lived other intangible assets over their useful lives generally on a straight-line basis over the period of expected benefit, ranging from 1 to 15 years. Management revises amortization periods if it believes there has been a change in the length of time that an intangible asset will
140
|
| Note 1 - Basis of Presentation and Significant Accounting Policies | ||||||||
THE HARTFORD FINANCIAL SERVICES GROUP, INC.
NOTES TO CONSOLIDATED FINANCIAL STATEMENTS (continued)
continue to have value. Indefinite-lived intangible assets are not subject to amortization. Intangible assets are assessed for impairment generally when events or circumstances indicate a potential impairment and at least annually for indefinite-lived intangibles. Finite-lived intangible assets are impaired if the carrying amount is not recoverable from undiscounted cash flows. Indefinite-lived intangible assets are impaired if the carrying amount exceeds fair value. Impaired intangible assets are written down to fair value.
Property and Equipment
Property and equipment, which includes capitalized software, is carried at cost net of accumulated depreciation. Depreciation is based on the estimated useful lives of the various classes of property and equipment and is recognized principally on the straight-line method. Accumulated depreciation was $2.3 billion and $2.1 billion as of December 31, 2021 and 2020, respectively. Depreciation expense was $342, $313, and $283 for the years ended December 31, 2021, 2020 and 2019, respectively.
Leases
Leases are classified as financing or operating leases. Where the lease is economically similar to a purchase because The Hartford obtains control of the underlying asset, the lease is classified as a financing lease and the Company recognizes amortization of the right of use asset and interest expense on the liability. Where the lease provides The Hartford with only the right to control the use of the underlying asset over the lease term and the lease term is greater than one year, the lease is an operating lease and the lease cost is recognized as rental expense over the lease term on a straight-line basis. Leases with a term of one year or less are also expensed over the lease term but not recognized on the balance sheet.
Unpaid Losses and Loss Adjustment Expenses
For property and casualty and group life and disability insurance and assumed reinsurance products, the Company establishes reserves for unpaid losses and loss adjustment expenses to provide for the estimated costs of paying claims under insurance policies written by the Company. These reserves include estimates for both claims that have been reported and those that have not yet been reported, and include estimates of all losses and loss adjustment expenses associated with processing and settling these claims. Estimating the ultimate cost of future losses and loss adjustment expenses is an uncertain and complex process. This estimation process is based significantly on the assumption that past developments are an appropriate predictor of future events, and involves a variety of actuarial techniques that analyze experience, trends and other relevant factors. The effects of inflation are implicitly considered in the reserving process. A number of complex factors influence the uncertainties involved with the reserving process including social and economic trends and changes in the concepts of legal liability and damage awards. Accordingly, final claim settlements may vary from the present estimates, particularly when those payments may not occur until well into
the future. The Company regularly reviews the adequacy of its estimated losses and loss adjustment expense reserves by reserve line within the various reporting segments. Adjustments to previously established reserves are reflected in the operating results of the period in which the adjustment is determined to be necessary. Such adjustments could possibly be significant, reflecting any variety of new and adverse or favorable trends.
Most of the Company’s property and casualty insurance products reserves are not discounted. However, the Company has discounted to present value certain reserves for indemnity payments that are due to claimants under workers’ compensation policies because the payment pattern and the ultimate costs are reasonably fixed and determinable on an individual claim basis. The discount rate is based on the risk free rate for the expected claim duration as determined in the year the claims were incurred. The Company also has discounted liabilities for structured settlement agreements that provide fixed periodic payments to claimants. These structured settlements include annuities purchased to fund unpaid losses for permanently disabled claimants. These structured settlement liabilities are discounted to present value using the rate implicit in the purchased annuities and the purchased annuities are accounted for within reinsurance recoverables.
Group life and disability contracts with long-tail claim liabilities are discounted because the payment pattern and the ultimate costs are reasonably fixed and determinable on an individual claim basis. The discount rates are estimated based on investment yields expected to be earned on the cash flows net of investment expenses and expected credit losses. The Company establishes discount rates for these reserves in the year the claims are incurred (the incurral year) which is when the estimated settlement pattern is determined. The discount rate for life and disability reserves acquired from Aetna's U.S. group life and disability business were based on interest rates in effect at the acquisition date of November 1, 2017.
For further information about how unpaid losses and loss adjustment expenses are established, see Note 12 - Reserve for Unpaid Losses and Loss Adjustment Expenses.
Foreign Currency
Foreign currency translation gains and losses are reflected in stockholders’ equity as a component of AOCI. The Company’s foreign subsidiaries’ balance sheet accounts are translated at the exchange rates in effect at each year end and income statement accounts are translated at the average rates of exchange prevailing during the year. The national currencies of the international operations are generally their functional currencies; however, the U.S. dollar is the functional currency of Lloyd's Syndicate 1221 ("Lloyd's Syndicate"), the Lloyd's Syndicate for which the Company is the sole corporate member, in the U.K. Gains and losses resulting from the remeasurement of foreign currency transactions are reflected in earnings in net realized gains (losses) in the period in which they occur
141
|
| Note 2 - Business Acquisitions | ||||||||
THE HARTFORD FINANCIAL SERVICES GROUP, INC.
NOTES TO CONSOLIDATED FINANCIAL STATEMENTS (continued)
2. BUSINESS ACQUISITIONS
Navigators Group
On May 23, 2019, The Hartford acquired 100% of the outstanding shares of Navigators Group for $70 a share, or $2.121 billion, comprised of cash of $2.098 billion and a liability for cash awards to replace share-based awards of $23. The acquisition of the specialty underwriter expands product offerings and geographic reach, and adds underwriting and industry talent to strengthen the Company’s value proposition to agents and customers. At acquisition, the Company recorded provisional estimates of the fair value of the assets acquired and liabilities assumed. In the second quarter of 2020, The Hartford finalized its provisional estimates and recorded additional assets
of $9 and liabilities of $7 with a net reduction in goodwill of $2. The measurement period adjustments, determined as if the accounting had been completed as of the acquisition date, had no effect on the Consolidated Statements of Operations for the twelve months ended December 31, 2020. The following table presents the preliminary allocation of the purchase price to the assets acquired and liabilities assumed as of the acquisition date, the measurement period adjustments recorded, and the final purchase price allocation.
Fair Value of Assets Acquired and Liabilities Assumed at the Acquisition Date
| Preliminary Values as of May 23, 2019 (as previously reported) | Measurement Period Adjustments | Adjusted Values as of May 23, 2019 | |||||||||
| Assets | |||||||||||
| Cash and invested assets | $ | 3,848 | $ | 3 | $ | 3,851 | |||||
| Premiums receivable | 492 | 6 | 498 | ||||||||
| Reinsurance recoverables | 1,100 | (3) | 1,097 | ||||||||
| Prepaid reinsurance premiums | 238 | — | 238 | ||||||||
| Other intangible assets | 580 | — | 580 | ||||||||
| Property and equipment | 83 | — | 83 | ||||||||
| Other assets | 99 | 3 | 102 | ||||||||
| Total Assets Acquired | 6,440 | 9 | 6,449 | ||||||||
| Liabilities | |||||||||||
| Unpaid losses and loss adjustment expenses | 2,823 | — | 2,823 | ||||||||
| Unearned premiums | 1,219 | — | 1,219 | ||||||||
| Long-term debt | 284 | — | 284 | ||||||||
| Deferred income taxes, net | 48 | (1) | 47 | ||||||||
| Other liabilities | 568 | 8 | 576 | ||||||||
| Total Liabilities Assumed | 4,942 | 7 | 4,949 | ||||||||
| Net identifiable assets acquired | 1,498 | 2 | 1,500 | ||||||||
| Goodwill [1] | 623 | (2) | 621 | ||||||||
| Net Assets Acquired | $ | 2,121 | $ | — | $ | 2,121 | |||||
[1] Non-deductible for income tax purposes.
142
|
| Note 2 - Business Acquisitions | ||||||||
THE HARTFORD FINANCIAL SERVICES GROUP, INC.
NOTES TO CONSOLIDATED FINANCIAL STATEMENTS (continued)
Intangible Assets Recorded in Connection with the Acquisition
| Asset | Amount | Weighted Average Expected Life | ||||||
| Value of in-force contracts - Property and Casualty ("P&C") | $ | 180 | 1 | |||||
| Distribution relationships | 302 | 15 | ||||||
| Trade name | 17 | 10 | ||||||
| Total finite life intangibles | 499 | 10 | ||||||
| Capacity of Lloyd's Syndicate | 66 | |||||||
| Licenses | 15 | |||||||
| Total indefinite life intangibles | 81 | |||||||
| Total other intangible assets | $ | 580 | ||||||
The value of in-force contracts represents the estimated profits relating to the unexpired contracts in force net of related prepaid reinsurance at the acquisition date through expiry of the contracts. The value of distribution relationships was estimated using net cash flows expected to come from the renewals of in-force contracts and new business sold through existing distribution partners less costs to service the related policies. The value of the trade name was estimated using an assumed cost of a market-based royalty fee applied to net cash flows expected to come from business marketed as Navigators, a brand of The Hartford. Lloyd's of London is an insurance market-place operating worldwide ("Lloyd's"). Lloyd's does not underwrite risks. Corporate members accept underwriting risks through the syndicates that they form. The Company accepts risks as the sole corporate member of Lloyd's Syndicate. The value of the capacity of Lloyd’s Syndicate was estimated using net cash flows attributable to Navigators Group's right to underwrite business up to an approved level of premium in the Lloyd’s market. The values for in-force contracts, the distribution relationships, trade name and the capacity of the Lloyd's Syndicate were estimated using a discounted cash flow method. Significant inputs to the valuation models include estimates of expected new business, premium retention rates, investment returns, claim costs, expenses and discount rates based on a weighted average cost of capital. The value of licenses to write insurance in over 50 U.S. jurisdictions was estimated based on recent transactions for shell companies.
Property and equipment includes real estate owned and right of use assets under leases that were valued based on current values and market rental rates, software that was valued based on estimated replacement cost and furniture and equipment. These will be amortized over periods consistent with the Company’s policy.
The fair value of unpaid losses and loss adjustment expenses net of related reinsurance recoverables was estimated based on the present value of expected future net unpaid loss and loss adjustment expense payments discounted using a risk-free interest rate as of the acquisition date plus a risk margin. The discount and risk margin amounts substantially offset.
Debt assumed in the transaction was valued based on the principal and interest payments discounted at the current market
yield. This debt was paid off in August 2019. For further discussion of this transaction, see Note 14 - Debt.
The $621 of goodwill recognized is largely attributable to the acquired employee workforce and underwriting talent, leverageable operating platform, improved investment yield and economies of scale. Goodwill is allocated to the Company's Commercial Lines reporting segment.
Immediately after closing on the acquisition of Navigators Group, effective May 23, 2019, the Company purchased an aggregate excess of loss reinsurance agreement covering adverse reserve development (“Navigators ADC”) from National Indemnity Company ("NICO") on behalf of Navigators Insurance Company and certain of its affiliates (collectively, “Navigators Insurers”). Under the Navigators ADC, the Navigators Insurers paid NICO a reinsurance premium of $91 in exchange for reinsurance coverage of $300 of adverse net loss reserve development that attaches $100 above the Navigators Insurers' existing net loss and allocated loss adjustment reserves as of December 31, 2018 subject to the treaty of $1.816 billion for accidents and losses prior to December 31, 2018. In addition to recognizing a $91 before tax charge to earnings in 2019 for the Navigators ADC reinsurance premium, the Company recognized a charge against earnings of $97 before tax in the second quarter of 2019 as a result of a review of Navigators Insurers’ net acquired reserves upon acquisition of the business. Navigators Insurers had previously recognized $52 before tax of adverse reserve development in the first quarter of 2019, including $32 of adverse development subject to the Navigators ADC. As such, reserve development of $97 before tax recognized upon acquisition of the business included $68 remaining of the $100 Navigators ADC retention for 2018 and prior accident years and $29 of adverse reserve development related to the 2019 accident year which is not covered by the Navigators ADC.
On 2018 and prior accident year reserves subject to the Navigators ADC, the Company recognized a total of $84 of adverse development in 2019, including the $68 of reserve development recorded upon acquisition of the business. The $84 of prior accident year reserve development was net of a $91 net reinsurance benefit recognized under the Navigators ADC. For information about the Navigators ADC after the acquisition date, refer to Note 12 - Reserve for Unpaid Losses and Loss Adjustment Expenses.
Since the acquisition date of May 23, 2019, the revenues and net losses of the business acquired have been included in the Company's Consolidated Statements of Operations in the Commercial Lines reporting segment with revenues of $1.0 billion and net losses of $167 during the period from the acquisition date to December 31, 2019, including the $91 before tax ($72 net of tax) of premium paid for the Navigators ADC, a charge of $97 before tax ($77 net of tax) for the increase in acquired reserves following the acquisition, a charge of $16 before tax ($13 net of tax) for the deferred gain on retroactive reinsurance and net investment income of $67 before tax ($54 net of tax). For further discussion of the Navigators ADC, see Note 12 - Reserve for Unpaid Losses and Loss Adjustment Expenses.
The Company recognized $17 of acquisition related costs for the twelve months ended December 31, 2019. These costs are
143
|
| Note 2 - Business Acquisitions | ||||||||
THE HARTFORD FINANCIAL SERVICES GROUP, INC.
NOTES TO CONSOLIDATED FINANCIAL STATEMENTS (continued)
included in insurance operating costs and other expenses in the Consolidated Statement of Operations.
The following table presents supplemental unaudited pro forma amounts of revenue and net income for the year ended December 31, 2019 for the Company as though the business was acquired on January 1, 2018. Pro forma adjustments include the revenue and earnings of Navigators Group for each period as well as amortization of identifiable intangible assets acquired.
Pro Forma Results for the Year Ended December 31
| Revenue | Earnings | |||||||
| 2019 Supplemental (unaudited) combined pro forma | $ | 21,416 | $ | 2,080 | ||||
3. EARNINGS PER COMMON SHARE
Computation of Basic and Diluted Earnings per Common Share
| For the years ended December 31, | |||||||||||||||||
| (In millions, except for per share data) | 2021 | 2020 | 2019 | ||||||||||||||
| Earnings | |||||||||||||||||
| Net income | $ | 2,365 | $ | 1,737 | $ | 2,085 | |||||||||||
| Less: Preferred stock dividends | 21 | 21 | 21 | ||||||||||||||
| Net income available to common stockholders | $ | 2,344 | $ | 1,716 | $ | 2,064 | |||||||||||
| Shares | |||||||||||||||||
| Weighted average common shares outstanding, basic | 349.1 | 358.3 | 360.9 | ||||||||||||||
| Dilutive effect of warrants [1] | — | — | 0.5 | ||||||||||||||
| Dilutive effect of stock-based awards under compensation plans | 5.0 | 2.3 | 3.5 | ||||||||||||||
| Weighted average common shares outstanding and dilutive potential common shares [2] | 354.1 | 360.6 | 364.9 | ||||||||||||||
| Net income available to common stockholders per common share | |||||||||||||||||
| Basic | $ | 6.71 | $ | 4.79 | $ | 5.72 | |||||||||||
| Diluted | $ | 6.62 | $ | 4.76 | $ | 5.66 | |||||||||||
[1]On June 26, 2019 the Capital Purchase Program warrants issued in 2009 expired.
[2]For additional information, see Note 16 - Equity and Note 20 - Stock Compensation Plans of Notes to Consolidated Financial Statements.
Basic earnings per common share is computed based on the weighted average number of common shares outstanding during the year. Diluted earnings per common share includes the dilutive effect of assumed exercise or issuance of warrants and stock-based awards under compensation plans.
Under the treasury stock method, for warrants and stock-based awards, shares are assumed to be issued and then reduced for
the number of shares repurchasable with theoretical proceeds at the average market price for the period. Contingently issuable shares are included for the number of shares issuable assuming the end of the reporting period was the end of the contingency period, if dilutive.
4. SEGMENT INFORMATION
The Company conducts business principally in 5 reporting segments comprising Commercial Lines, Personal Lines, Property & Casualty Other Operations, Group Benefits and Hartford Funds, as well as a Corporate category.
Over 95% of the Company’s revenues are generated in the United States (“U.S.”). The remaining revenues are generated in Europe and other international locations.
We report our results of operations consistent with the manner in which our chief operating decision maker ("CODM") reviews the business to assess performance, make operating decisions and allocate resources. The Company’s reporting segments, as well as the Corporate category, are as follows:
Commercial Lines
Commercial Lines provides workers’ compensation, property, automobile, general liability, umbrella, professional liability, bond, marine, livestock and assumed reinsurance to businesses in the U.S. and internationally, along with a variety of customized insurance products and risk management services including professional liability, bond, surety, and specialty casualty coverages.
Personal Lines
Personal Lines provides standard automobile, homeowners and personal umbrella coverages to individuals across the U.S., including a special program designed exclusively for members of AARP. This agreement provides an important competitive advantage given the size of the 50 plus population and the
144
|
| Note 4 - Segment Information | ||||||||
THE HARTFORD FINANCIAL SERVICES GROUP, INC.
NOTES TO CONSOLIDATED FINANCIAL STATEMENTS (continued)
strength of the AARP brand, and is in place through December 31, 2032.
Property & Casualty Other Operations
Property & Casualty Other Operations includes certain property and casualty operations, managed by the Company, that have discontinued writing new business and includes substantially all of the Company’s asbestos and environmental exposures.
Group Benefits
Group Benefits provides employers and associations with group life, accident and disability coverage, along with other products and services, including voluntary benefits, and group retiree health.
Hartford Funds
Hartford Funds offers investment products for retail and retirement accounts and provides investment management, distribution and administrative services such as product design, implementation and oversight. This business also manages a portion of the mutual funds which support the variable annuity products within the life and annuity business sold in May 2018.
Corporate
The Company includes in the Corporate category reserves for run-off structured settlement and terminal funding agreement liabilities, restructuring costs, capital raising activities (including equity financing, debt financing and related interest expense), transaction expenses incurred in connection with an acquisition, certain M&A costs, purchase accounting adjustments related to goodwill and other expenses not allocated to the reporting segments. Corporate also includes investment management fees and expenses related to managing third party business, including management a portion of the invested assets of Talcott Resolution Life, Inc. and its subsidiaries as well certain affiliates. In addition, up until June 30, 2021, Corporate included a 9.7% ownership interest in Hopmeadow Holdings LP, the legal entity that acquired Talcott Resolution in May 2018 (Hopmeadow Holdings, LP, Talcott Resolution Life Inc., and its subsidiaries are collectively referred to as "Talcott Resolution"). Refer to Note 6 - Investments for additional information.
Financial Measures and Other Segment Information
Certain transactions between segments occur during the year that primarily relate to tax settlements, insurance coverage, expense reimbursements, services provided, investment transfers and capital contributions. In addition, certain inter-segment transactions occur that relate to interest income on allocated surplus. Consolidated net income is unaffected by such transactions.
Revenues
| For the years ended December 31, | |||||||||||
| 2021 | 2020 | 2019 | |||||||||
| Earned premiums and fee income: | |||||||||||
| Commercial Lines | |||||||||||
| Workers’ compensation | $ | 3,172 | $ | 3,034 | $ | 3,314 | |||||
| Liability | 1,622 | 1,401 | 1,064 | ||||||||
| Marine | 228 | 251 | 147 | ||||||||
| Package business | 1,665 | 1,540 | 1,471 | ||||||||
| Property | 829 | 793 | 728 | ||||||||
| Professional liability | 655 | 595 | 447 | ||||||||
| Bond | 287 | 274 | 261 | ||||||||
| Assumed reinsurance | 328 | 298 | 180 | ||||||||
| Automobile | 789 | 754 | 713 | ||||||||
| Total Commercial Lines | 9,575 | 8,940 | 8,325 | ||||||||
| Personal Lines | |||||||||||
| Automobile | 2,059 | 2,081 | 2,248 | ||||||||
| Homeowners | 927 | 961 | 987 | ||||||||
| Total Personal Lines [1] | 2,986 | 3,042 | 3,235 | ||||||||
| Property & Casualty Other Operations | — | — | 2 | ||||||||
| Group Benefits | |||||||||||
| Group disability | 2,983 | 2,832 | 2,828 | ||||||||
| Group life | 2,388 | 2,434 | 2,521 | ||||||||
| Other | 316 | 270 | 254 | ||||||||
| Total Group Benefits | 5,687 | 5,536 | 5,603 | ||||||||
| Hartford Funds | |||||||||||
| Mutual fund and Exchange-Traded Products ("ETP") | 1,094 | 903 | 907 | ||||||||
| Talcott Resolution life and annuity separate accounts [2] | 95 | 86 | 92 | ||||||||
| Total Hartford Funds | 1,189 | 989 | 999 | ||||||||
| Corporate | 50 | 58 | 60 | ||||||||
| Total earned premiums and fee income | 19,487 | 18,565 | 18,224 | ||||||||
| Total net investment income | 2,313 | 1,846 | 1,951 | ||||||||
| Net realized gains (losses) | 509 | (14) | 395 | ||||||||
| Other revenues | 81 | 126 | 170 | ||||||||
| Total revenues | $ | 22,390 | $ | 20,523 | $ | 20,740 | |||||
[1]For 2021, 2020 and 2019, AARP members accounted for earned premiums of $2.7 billion, $2.8 billion and $2.9 billion, respectively.
[2]Represents revenues earned on the life and annuity separate account assets under management ("AUM") sold in May 2018 that is still managed by the Company's Hartford Funds segment.
145
|
| Note 4 - Segment Information | ||||||||
THE HARTFORD FINANCIAL SERVICES GROUP, INC.
NOTES TO CONSOLIDATED FINANCIAL STATEMENTS (continued)
Net Income (Loss)
| For the years ended December 31, | |||||||||||
| 2021 | 2020 | 2019 | |||||||||
| Commercial Lines | $ | 1,757 | $ | 856 | $ | 1,192 | |||||
| Personal Lines | 385 | 718 | 318 | ||||||||
| Property & Casualty Other Operations | (95) | (168) | 61 | ||||||||
| Group Benefits | 249 | 383 | 536 | ||||||||
| Hartford Funds | 217 | 170 | 149 | ||||||||
| Corporate | (148) | (222) | (171) | ||||||||
| Net income | 2,365 | 1,737 | 2,085 | ||||||||
| Preferred stock dividends | 21 | 21 | 21 | ||||||||
| Net income available to common stockholders | $ | 2,344 | $ | 1,716 | $ | 2,064 | |||||
Net Investment Income
| For the years ended December 31, | |||||||||||
| 2021 | 2020 | 2019 | |||||||||
| Commercial Lines | $ | 1,502 | $ | 1,160 | $ | 1,129 | |||||
| Personal Lines | 157 | 157 | 179 | ||||||||
| Property & Casualty Other Operations | 75 | 55 | 84 | ||||||||
| Group Benefits | 550 | 448 | 486 | ||||||||
| Hartford Funds | 5 | 4 | 7 | ||||||||
| Corporate | 24 | 22 | 66 | ||||||||
| Net investment income | $ | 2,313 | $ | 1,846 | $ | 1,951 | |||||
Amortization of DAC
| For the years ended December 31, | |||||||||||
| 2021 | 2020 | 2019 | |||||||||
| Commercial Lines | $ | 1,398 | $ | 1,397 | $ | 1,296 | |||||
| Personal Lines | 230 | 244 | 259 | ||||||||
| Group Benefits | 40 | 50 | 54 | ||||||||
| Hartford Funds | 12 | 14 | 12 | ||||||||
| Corporate | — | 1 | 1 | ||||||||
| Total amortization of DAC | $ | 1,680 | $ | 1,706 | $ | 1,622 | |||||
Amortization of Other Intangible Assets
| For the years ended December 31, | |||||||||||
| 2021 | 2020 | 2019 | |||||||||
| Commercial Lines | $ | 29 | $ | 28 | $ | 18 | |||||
| Personal Lines | 2 | 4 | 6 | ||||||||
| Group Benefits | 40 | 40 | 41 | ||||||||
| Corporate | — | — | 1 | ||||||||
| Total amortization of other intangible assets | $ | 71 | $ | 72 | $ | 66 | |||||
Income Tax Expense (Benefit)
| For the years ended December 31, | |||||||||||
| 2021 | 2020 | 2019 | |||||||||
| Commercial Lines | $ | 402 | $ | 176 | $ | 270 | |||||
| Personal Lines | 95 | 184 | 76 | ||||||||
| Property & Casualty Other Operations | (28) | (46) | 12 | ||||||||
| Group Benefits | 53 | 88 | 126 | ||||||||
| Hartford Funds | 56 | 44 | 37 | ||||||||
| Corporate | (47) | (63) | (46) | ||||||||
| Total income tax expense | $ | 531 | $ | 383 | $ | 475 | |||||
Assets
| As of December 31, | ||||||||
| 2021 | 2020 | |||||||
| Commercial Lines | $ | 48,234 | $ | 45,482 | ||||
| Personal Lines | 5,587 | 5,969 | ||||||
| Property & Casualty Other Operations | 3,792 | 3,505 | ||||||
| Group Benefits | 14,442 | 14,732 | ||||||
| Hartford Funds | 720 | 662 | ||||||
| Corporate | 3,803 | 3,761 | ||||||
| Total assets | $ | 76,578 | $ | 74,111 | ||||
146
|
| Note 4 - Segment Information | ||||||||
THE HARTFORD FINANCIAL SERVICES GROUP, INC.
NOTES TO CONSOLIDATED FINANCIAL STATEMENTS (continued)
Revenue from Non-Insurance Contracts with Customers
| For the years ended December 31, | |||||||||||||||||||||||
| Revenue Line Item | 2021 | 2020 | 2019 | ||||||||||||||||||||
| Commercial Lines | |||||||||||||||||||||||
| Installment billing fees | Fee income | $ | 34 | $ | 30 | $ | 35 | ||||||||||||||||
| Personal Lines | |||||||||||||||||||||||
| Installment billing fees | Fee income | 32 | 34 | 37 | |||||||||||||||||||
| Insurance servicing revenues | Other revenues | 80 | 81 | 83 | |||||||||||||||||||
| Group Benefits | |||||||||||||||||||||||
| Administrative services | Fee income | 183 | 175 | 180 | |||||||||||||||||||
| Hartford Funds | |||||||||||||||||||||||
| Advisor, distribution and other management fees | Fee income | 1,086 | 901 | 911 | |||||||||||||||||||
| Other fees | Fee income | 103 | 88 | 88 | |||||||||||||||||||
| Corporate | |||||||||||||||||||||||
| Investment management and other fees | Fee income | 50 | 49 | 50 | |||||||||||||||||||
| Transition service revenues | Other revenues | 1 | 2 | 20 | |||||||||||||||||||
| Total non-insurance revenues with customers | $ | 1,569 | $ | 1,360 | $ | 1,404 | |||||||||||||||||
5. FAIR VALUE MEASUREMENTS
The Company carries certain financial assets and liabilities at estimated fair value. Fair value is defined as the price that would be received to sell an asset or paid to transfer a liability in the principal or most advantageous market in an orderly transaction between market participants. Our fair value framework includes a hierarchy that gives the highest priority to the use of quoted prices in active markets, followed by the use of market observable inputs, followed by the use of unobservable inputs.
The fair value hierarchy levels are as follows:
Level 1 Fair values based primarily on unadjusted quoted prices for identical assets or liabilities, in active markets that the Company has the ability to access at the measurement date.
Level 2 Fair values primarily based on observable inputs, other than quoted prices included in Level 1, or based on prices for similar assets and liabilities.
Level 3 Fair values derived when one or more of the significant inputs are unobservable (including assumptions about risk). With little or no observable market, the determination of fair values uses considerable judgment and represents the Company’s best estimate of an amount that could be realized in a market exchange for the asset or liability. Also included are securities that are traded within illiquid markets and/or priced by independent brokers.
The Company will classify the financial asset or liability by level based upon the lowest level input that is significant to the determination of the fair value. In most cases, both observable inputs (e.g., changes in interest rates) and unobservable inputs (e.g., changes in risk assumptions) are used to determine fair values that the Company has classified within Level 3.
147
|
| Note 5 - Fair Value Measurements | ||||||||
THE HARTFORD FINANCIAL SERVICES GROUP, INC.
NOTES TO CONSOLIDATED FINANCIAL STATEMENTS (continued)
| Assets and (Liabilities) Carried at Fair Value by Hierarchy Level as of December 31, 2021 | ||||||||||||||
| Total | Quoted Prices in Active Markets for Identical Assets (Level 1) | Significant Observable Inputs (Level 2) | Significant Unobservable Inputs (Level 3) | |||||||||||
| Assets accounted for at fair value on a recurring basis | ||||||||||||||
| Fixed maturities, AFS | ||||||||||||||
| Asset backed securities ("ABS") | $ | 1,135 | $ | — | $ | 1,135 | $ | — | ||||||
| Collateralized loan obligations ("CLOs") | 3,025 | — | 2,768 | 257 | ||||||||||
| Commercial mortgage-backed securities ("CMBS") | 4,119 | — | 3,923 | 196 | ||||||||||
| Corporate | 18,707 | — | 17,089 | 1,618 | ||||||||||
| Foreign government/government agencies | 910 | — | 905 | 5 | ||||||||||
| Municipal | 8,257 | — | 8,257 | — | ||||||||||
| Residential mortgage-backed securities ("RMBS") | 3,643 | — | 3,315 | 328 | ||||||||||
| U.S. Treasuries | 3,051 | 882 | 2,169 | — | ||||||||||
| Total fixed maturities | 42,847 | 882 | 39,561 | 2,404 | ||||||||||
| Equity securities, at fair value | 2,094 | 1,453 | 577 | 64 | ||||||||||
| Derivative assets | ||||||||||||||
| Credit derivatives | 2 | — | 2 | — | ||||||||||
| Foreign exchange derivatives | 6 | — | 5 | 1 | ||||||||||
| Interest rate derivatives | (1) | — | (1) | — | ||||||||||
| Total derivative assets [1] | 7 | — | 6 | 1 | ||||||||||
| Fixed maturities, at fair value using the fair value option ("FVO") [2] | 160 | — | — | 160 | ||||||||||
| Short-term investments | 3,697 | 1,627 | 1,990 | 80 | ||||||||||
| Total assets accounted for at fair value on a recurring basis | $ | 48,805 | $ | 3,962 | $ | 42,134 | $ | 2,709 | ||||||
| Liabilities accounted for at fair value on a recurring basis | ||||||||||||||
| Derivative liabilities | ||||||||||||||
| Credit derivatives | $ | (4) | $ | — | $ | (4) | $ | — | ||||||
| Foreign exchange derivatives | — | — | 1 | (1) | ||||||||||
| Interest rate derivatives | (45) | — | (45) | — | ||||||||||
| Total derivative liabilities [3] | (49) | — | (48) | (1) | ||||||||||
| Total liabilities accounted for at fair value on a recurring basis | $ | (49) | $ | — | $ | (48) | $ | (1) | ||||||
148
|
| Note 5 - Fair Value Measurements | ||||||||
THE HARTFORD FINANCIAL SERVICES GROUP, INC.
NOTES TO CONSOLIDATED FINANCIAL STATEMENTS (continued)
| Assets and (Liabilities) Carried at Fair Value by Hierarchy Level as of December 31, 2020 | ||||||||||||||
| Total | Quoted Prices in Active Markets for Identical Assets (Level 1) | Significant Observable Inputs (Level 2) | Significant Unobservable Inputs (Level 3) | |||||||||||
| Assets accounted for at fair value on a recurring basis | ||||||||||||||
| Fixed maturities, AFS | ||||||||||||||
| ABS | $ | 1,564 | $ | — | $ | 1,564 | $ | — | ||||||
| CLOs | 2,780 | — | 2,420 | 360 | ||||||||||
| CMBS | 4,484 | — | 4,407 | 77 | ||||||||||
| Corporate | 20,273 | — | 19,392 | 881 | ||||||||||
| Foreign government/government agencies | 919 | — | 913 | 6 | ||||||||||
| Municipal | 9,503 | — | 9,503 | — | ||||||||||
| RMBS | 4,107 | — | 3,726 | 381 | ||||||||||
| U.S. Treasuries | 1,405 | 529 | 876 | — | ||||||||||
| Total fixed maturities | 45,035 | 529 | 42,801 | 1,705 | ||||||||||
| Equity securities, at fair value | 1,438 | 872 | 496 | 70 | ||||||||||
| Derivative assets | ||||||||||||||
| Credit derivatives | 21 | — | 21 | — | ||||||||||
| Foreign exchange derivatives | 1 | — | 1 | — | ||||||||||
| Interest rate derivatives | 1 | — | 1 | — | ||||||||||
| Total derivative assets [1] | 23 | — | 23 | — | ||||||||||
| Short-term investments | 3,283 | 2,663 | 590 | 30 | ||||||||||
| Total assets accounted for at fair value on a recurring basis | $ | 49,779 | $ | 4,064 | $ | 43,910 | $ | 1,805 | ||||||
| Liabilities accounted for at fair value on a recurring basis | ||||||||||||||
| Derivative liabilities | ||||||||||||||
| Foreign exchange derivatives | $ | (14) | $ | — | $ | (14) | $ | — | ||||||
| Interest rate derivatives | (70) | — | (70) | — | ||||||||||
| Total derivative liabilities [3] | (84) | — | (84) | — | ||||||||||
| Total liabilities accounted for at fair value on a recurring basis | $ | (84) | $ | — | $ | (84) | $ | — | ||||||
[1]Includes derivative instruments in a net positive fair value position after consideration of the accrued interest and impact of collateral posting requirements which may be imposed by agreements and applicable law. See footnote 3 to this table for derivative liabilities.
[2]Included within other investments on the Consolidated Balance Sheets.
[3]Includes derivative instruments in a net negative fair value position (derivative liability) after consideration of the accrued interest and impact of collateral posting requirements which may be imposed by agreements and applicable law.
The Company has overseas deposits included in other investments of $65 and $54 as of December 31, 2021 and December 31, 2020, respectively, which are measured at fair value using the net asset value as a practical expedient.
FIXED MATURITIES, EQUITY SECURITIES, SHORT-TERM INVESTMENTS, AND DERIVATIVES
Valuation Techniques
The Company generally determines fair values using valuation techniques that use prices, rates, and other relevant information evident from market transactions involving identical or similar instruments. Valuation techniques also include, where appropriate, estimates of future cash flows that are converted into a single discounted amount using current market expectations. The Company uses a "waterfall" approach
comprised of the following pricing sources and techniques, which are listed in priority order:
•Quoted prices, unadjusted, for identical assets or liabilities in active markets, which are classified as Level 1.
•Prices from third-party pricing services, which primarily utilize a combination of techniques. These services utilize recently reported trades of identical, similar, or benchmark securities making adjustments for market observable inputs available through the reporting date. If there are no recently reported trades, they may use a discounted cash flow technique to develop a price using expected cash flows based upon the anticipated future performance of the underlying collateral discounted at an estimated market rate. Both techniques develop prices that consider the time value of future cash flows and provide a margin for risk, including liquidity and credit risk. Most prices provided by third-party pricing services are classified as Level 2 because the inputs used in pricing the securities are observable. However, some securities that are less liquid or trade less actively are classified as Level 3. Additionally,
149
|
| Note 5 - Fair Value Measurements | ||||||||
THE HARTFORD FINANCIAL SERVICES GROUP, INC.
NOTES TO CONSOLIDATED FINANCIAL STATEMENTS (continued)
certain long-dated securities, such as municipal securities and bank loans, include benchmark interest rate or credit spread assumptions that are not observable in the marketplace and are thus classified as Level 3.
•Internal matrix pricing is a valuation process internally developed for private placement securities for which the Company is unable to obtain a price from a third-party pricing service. Internal pricing matrices determine credit spreads that, when combined with risk-free rates, are applied to contractual cash flows to develop a price. The Company develops credit spreads using market based data for public securities adjusted for credit spread differentials between public and private securities, which are obtained from a survey of multiple private placement brokers. The market-based reference credit spread considers the issuer’s sector, financial strength, and term to maturity, using an independent public security index, while the credit spread differential considers the non-public nature of the security. Securities priced using internal matrix pricing are classified as Level 2 because the significant inputs are observable or can be corroborated with observable data.
•Independent broker quotes, which are typically non-binding, use inputs that can be difficult to corroborate with observable market based data. Brokers may use present value techniques using assumptions specific to the security types, or they may use recent transactions of similar securities. Due to the lack of transparency in the process that brokers use to develop prices, valuations that are based on independent broker quotes are classified as Level 3.
The fair value of derivative instruments is determined primarily using a discounted cash flow model or option model technique and incorporates counterparty credit risk. In some cases, quoted market prices for exchange-traded and OTC cleared derivatives may be used and in other cases independent broker quotes may be used. The pricing valuation models primarily use inputs that are observable in the market or can be corroborated by observable market data. The valuation of certain derivatives may include significant inputs that are unobservable, such as
volatility levels, and reflect the Company’s view of what other market participants would use when pricing such instruments.
Valuation Controls
The process for determining the fair value of investments is monitored by the Valuation Committee, which is a cross-functional group of senior management within the Company. The purpose of the Valuation Committee is to provide oversight of the pricing policy, procedures and controls, including approval of valuation methodologies and pricing sources. The Valuation Committee reviews market data trends, pricing statistics and trading statistics to ensure that prices are reasonable and consistent with our fair value framework. Controls and procedures used to assess third-party pricing services are reviewed by the Valuation Committee, including the results of annual due-diligence reviews. Controls include, but are not limited to, reviewing daily and monthly price changes, stale prices, and missing prices and comparing new trade prices to third-party pricing services, weekly price changes to published bond index prices, and daily OTC derivative market valuations to counterparty valuations. The Company has a dedicated pricing group that works with trading and investment professionals to challenge prices received by a third party pricing source if the Company believes that the valuation received does not accurately reflect the fair value. New valuation models and changes to current models require approval by the Valuation Committee. In addition, the Company’s enterprise-wide Operational Risk Management function provides an independent review of the suitability and reliability of model inputs, as well as an analysis of significant changes to current models.
Valuation Inputs
Quoted prices for identical assets in active markets are considered Level 1 and consist of on-the-run U.S. Treasuries, money market funds, exchange-traded equity securities, open-ended mutual funds, certain short-term investments, and exchange traded derivative instruments.
150
|
| Note 5 - Fair Value Measurements | ||||||||
THE HARTFORD FINANCIAL SERVICES GROUP, INC.
NOTES TO CONSOLIDATED FINANCIAL STATEMENTS (continued)
Valuation Inputs Used in Levels 2 and 3 Measurements for Securities and Derivatives
Level 2 Primary Observable Inputs | Level 3 Primary Unobservable Inputs | |||||||
| Fixed Maturity Investments | ||||||||
| Structured securities (includes ABS, CLOs, CMBS and RMBS) | ||||||||
• Benchmark yields and spreads • Monthly payment information • Collateral performance, which varies by vintage year and includes delinquency rates, loss severity rates and refinancing assumptions • Credit default swap indices Other inputs for ABS, CLOs, and RMBS: • Estimate of future principal prepayments, derived from the characteristics of the underlying structure • Prepayment speeds previously experienced at the interest rate levels projected for the collateral | • Independent broker quotes • Credit spreads beyond observable curve • Interest rates beyond observable curve Other inputs for less liquid securities or those that trade less actively, including subprime RMBS: • Estimated cash flows • Credit spreads, which include illiquidity premium • Constant prepayment rates • Constant default rates • Loss severity | |||||||
| Corporates | ||||||||
• Benchmark yields and spreads • Reported trades, bids, offers of the same or similar securities • Issuer spreads and credit default swap curves Other inputs for investment grade privately placed securities that utilize internal matrix pricing : • Credit spreads for public securities of similar quality, maturity, and sector, adjusted for non-public nature | • Independent broker quotes • Credit spreads beyond observable curve • Interest rates beyond observable curve Other inputs for below investment grade privately placed securities and private bank loans: • Credit spreads for public securities of similar quality, maturity, and sector, adjusted for non-public nature | |||||||
| U.S Treasuries, Municipals, and Foreign government/government agencies | ||||||||
• Benchmark yields and spreads • Issuer credit default swap curves • Political events in emerging market economies • Municipal Securities Rulemaking Board reported trades and material event notices • Issuer financial statements | • Credit spreads beyond observable curve • Interest rates beyond observable curve | |||||||
| Equity Securities | ||||||||
| • Quoted prices in markets that are not active | • For privately traded equity securities, internal discounted cash flow models utilizing earnings multiples or other cash flow assumptions that are not observable | |||||||
| Short-term Investments | ||||||||
• Benchmark yields and spreads • Reported trades, bids, offers • Issuer spreads and credit default swap curves • Material event notices and new issue money market rates | • Independent broker quotes | |||||||
| Derivatives | ||||||||
| Credit derivatives | ||||||||
• Swap yield curve • Credit default swap curves | Not applicable | |||||||
| Foreign exchange derivatives | ||||||||
• Swap yield curve • Currency spot and forward rates • Cross currency basis curves | • Independent broker quotes | |||||||
| Interest rate derivatives | ||||||||
| • Swap yield curve | • Independent broker quotes • Interest rate volatility | |||||||
151
|
| Note 5 - Fair Value Measurements | ||||||||
THE HARTFORD FINANCIAL SERVICES GROUP, INC.
NOTES TO CONSOLIDATED FINANCIAL STATEMENTS (continued)
Significant Unobservable Inputs for Level 3 - Securities
| Assets accounted for at fair value on a recurring basis | Fair Value | Predominant Valuation Technique | Significant Unobservable Input | Minimum | Maximum | Weighted Average [1] | Impact of Increase in Input on Fair Value [2] | ||||||||||||||||
| As of December 31, 2021 | |||||||||||||||||||||||
| CLOs [3] | $ | 211 | Discounted cash flows | Spread | 234 bps | 258 bps | 257 bps | Decrease | |||||||||||||||
| CMBS [3] | $ | 192 | Discounted cash flows | Spread (encompasses prepayment, default risk and loss severity) | 203 bps | 468 bps | 266 bps | Decrease | |||||||||||||||
| Corporate [4] | $ | 1,532 | Discounted cash flows | Spread | 96 bps | 1,227 bps | 298 bps | Decrease | |||||||||||||||
| RMBS [3] | $ | 266 | Discounted cash flows | Spread [6] | 48 bps | 229 bps | 89 bps | Decrease | |||||||||||||||
| Constant prepayment rate [6] | 2% | 16% | 7% | Decrease [5] | |||||||||||||||||||
| Constant default rate [6] | 1% | 6% | 3% | Decrease | |||||||||||||||||||
| Loss severity [6] | —% | 100% | 63% | Decrease | |||||||||||||||||||
| As of December 31, 2020 | |||||||||||||||||||||||
| CLOs [3] | $ | 340 | Discounted cash flows | Spread | 304 bps | 305 bps | 304 bps | Decrease | |||||||||||||||
| CMBS [3] | $ | 20 | Discounted cash flows | Spread (encompasses prepayment, default risk and loss severity) | 255 bps | 975 bps | 688 bps | Decrease | |||||||||||||||
| Corporate [4] | $ | 749 | Discounted cash flows | Spread | 110 bps | 692 bps | 293 bps | Decrease | |||||||||||||||
| RMBS [3] | $ | 364 | Discounted cash flows | Spread [6] | 7 bps | 937 bps | 119 bps | Decrease | |||||||||||||||
| Constant prepayment rate [6] | —% | 10% | 5% | Decrease [5] | |||||||||||||||||||
| Constant default rate [6] | 2% | 6% | 3% | Decrease | |||||||||||||||||||
| Loss severity [6] | —% | 100% | 84% | Decrease | |||||||||||||||||||
[1]The weighted average is determined based on the fair value of the securities.
[2]Conversely, the impact of a decrease in input would have the opposite impact to the fair value as that presented in the table.
[3]Excludes securities for which the Company bases fair value on broker quotations.
[4]Excludes securities for which the Company bases fair value on broker quotations; however, included are broker priced lower-rated private placement securities for which the Company receives spread and yield information to corroborate the fair value.
[5]Decrease for above market rate coupons and increase for below market rate coupons.
[6]Generally, a change in the assumption used for the constant default rate would have been accompanied by a directionally similar change in the assumption used for the loss severity and a directionally opposite change in the assumption used for constant prepayment rate and would have resulted in wider spreads.
As of December 31, 2021 and 2020, the fair values of the Company's level 3 derivatives were less than $1 for both periods.
The table above excludes certain securities for which fair values are predominately based on independent broker quotes. While the Company does not have access to the significant unobservable inputs that independent brokers may use in their pricing process, the Company believes brokers likely use inputs similar to those used by the Company and third-party pricing services to price similar instruments. As such, in their pricing models, brokers likely use estimated loss severity rates, prepayment rates, constant default rates and credit spreads. Therefore, similar to non-broker priced securities, increases in these inputs would generally cause fair values to decrease. For the year ended December 31, 2021, no significant adjustments were made by the Company to broker prices received.
152
|
| Note 5 - Fair Value Measurements | ||||||||
THE HARTFORD FINANCIAL SERVICES GROUP, INC.
NOTES TO CONSOLIDATED FINANCIAL STATEMENTS (continued)
Contingent Consideration
The acquisition of Lattice Strategies LLC ("Lattice") on July 29, 2016 required the Company to make payments to former owners of Lattice of up to $60 contingent upon growth in ETP assets under management ("AUM") over a period of four years beginning on the date of acquisition. The contingent consideration was measured at fair value on a quarterly basis by projecting future eligible ETP AUM over the contingency period to estimate the amount of expected payout. The future expected payout had been discounted back to the valuation date using a risk-adjusted discount rate of 10.0%. The risk-adjusted discount rate is an internally generated and significant unobservable input to fair value.
In January 2020, we made a third payment of $10 after Lattice AUM reached $3.0 billion. Given the dramatic market declines and outflows in March, 2020, Lattice AUM declined to $2.3 billion as of March 30, 2020 and the Company reduced the
remaining contingent consideration liability to zero, recognizing an $11.9 before tax reduction in expense in first quarter 2020.
The earn out period ended on July 29, 2020 with no additional consideration payable.
For disclosure of contingent consideration related to the sale of Continental Europe Operations, refer to Note 22 - Business Dispositions.
LEVEL 3 ASSETS AND LIABILITIES MEASURED AT FAIR VALUE ON A RECURRING BASIS USING SIGNIFICANT UNOBSERVABLE INPUTS
The Company uses derivative instruments to manage the risk associated with certain assets and liabilities. However, the derivative instrument may not be classified within the same fair value hierarchy level as the associated asset or liability.
Fair Value Rollforwards for Financial Instruments Classified as Level 3 for the Year Ended December 31, 2021
| Total realized/unrealized gains (losses) | ||||||||||||||||||||||||||||||||
| Fair value as of January 1, 2021 | Included in net income [1] | Included in OCI [2] | Purchases | Settlements | Sales | Transfers into Level 3 [3] | Transfers out of Level 3 [3] | Fair value as of December 31, 2021 | ||||||||||||||||||||||||
| Assets | ||||||||||||||||||||||||||||||||
| Fixed Maturities, AFS | ||||||||||||||||||||||||||||||||
| ABS | $ | — | $ | — | $ | — | $ | 42 | $ | — | $ | (3) | $ | — | $ | (39) | $ | — | ||||||||||||||
| CLOs | 360 | — | (1) | 471 | (124) | — | — | (449) | 257 | |||||||||||||||||||||||
| CMBS | 77 | — | 1 | 166 | (4) | (1) | 5 | (48) | 196 | |||||||||||||||||||||||
| Corporate | 881 | 14 | (34) | 828 | (154) | (47) | 172 | (42) | 1,618 | |||||||||||||||||||||||
| Foreign Govt./Govt. Agencies | 6 | — | — | 5 | — | (6) | — | — | 5 | |||||||||||||||||||||||
| RMBS | 381 | — | (4) | 369 | (193) | (14) | — | (211) | 328 | |||||||||||||||||||||||
| Total Fixed Maturities, AFS | 1,705 | 14 | (38) | 1,881 | (475) | (71) | 177 | (789) | 2,404 | |||||||||||||||||||||||
| Equity Securities, at fair value | 70 | 42 | — | 6 | (53) | (1) | — | — | 64 | |||||||||||||||||||||||
| Fixed maturities, FVO [4] | — | (6) | — | 160 | 6 | — | — | — | 160 | |||||||||||||||||||||||
| Short-term investments | 30 | — | — | 98 | (48) | — | — | — | 80 | |||||||||||||||||||||||
| Total Assets | $ | 1,805 | $ | 50 | $ | (38) | $ | 2,145 | $ | (570) | $ | (72) | $ | 177 | $ | (789) | $ | 2,708 | ||||||||||||||
153
|
| Note 5 - Fair Value Measurements | ||||||||
THE HARTFORD FINANCIAL SERVICES GROUP, INC.
NOTES TO CONSOLIDATED FINANCIAL STATEMENTS (continued)
Fair Value Rollforwards for Financial Instruments Classified as Level 3 for the Year Ended December 31, 2020
| Total realized/unrealized gains (losses) | |||||||||||||||||||||||||||||||||||
| Fair value as of January 1, 2020 | Included in net income [1] | Included in OCI [2] | Purchases | Settlements | Sales | Transfers into Level 3 [3] | Transfers out of Level 3 [3] | Fair value as of December 31, 2020 | |||||||||||||||||||||||||||
| Assets | |||||||||||||||||||||||||||||||||||
| Fixed Maturities, AFS | |||||||||||||||||||||||||||||||||||
| ABS | $ | 15 | $ | — | $ | (1) | $ | 43 | $ | — | $ | — | $ | — | $ | (57) | $ | — | |||||||||||||||||
| CLOs | 95 | — | 1 | 389 | (43) | — | — | (82) | 360 | ||||||||||||||||||||||||||
| CMBS | 9 | — | 3 | 79 | (5) | — | 13 | (22) | 77 | ||||||||||||||||||||||||||
| Corporate | 732 | (31) | 31 | 272 | (143) | (36) | 486 | (430) | 881 | ||||||||||||||||||||||||||
| Foreign Govt./Govt. Agencies | 3 | — | — | 6 | — | — | — | (3) | 6 | ||||||||||||||||||||||||||
| Municipal | — | (3) | 2 | — | — | (6) | 7 | — | — | ||||||||||||||||||||||||||
| RMBS | 560 | — | (11) | 66 | (182) | (7) | — | (45) | 381 | ||||||||||||||||||||||||||
| Total Fixed Maturities, AFS | 1,414 | (34) | 25 | 855 | (373) | (49) | 506 | (639) | 1,705 | ||||||||||||||||||||||||||
| Equity Securities, at fair value | 73 | (10) | — | 6 | — | — | 1 | — | 70 | ||||||||||||||||||||||||||
| Short-term investments | 15 | — | — | 30 | (15) | — | — | — | 30 | ||||||||||||||||||||||||||
| Total Assets | $ | 1,502 | $ | (44) | $ | 25 | $ | 891 | $ | (388) | $ | (49) | $ | 507 | $ | (639) | $ | 1,805 | |||||||||||||||||
| Liabilities | |||||||||||||||||||||||||||||||||||
| Derivatives, net [5] | |||||||||||||||||||||||||||||||||||
| Equity | $ | (15) | $ | 36 | $ | — | $ | — | $ | (21) | $ | — | $ | — | $ | — | $ | — | |||||||||||||||||
| Total Derivatives, net [5] | (15) | 36 | — | — | (21) | — | — | — | — | ||||||||||||||||||||||||||
| Contingent Considerations | (22) | 12 | — | — | 10 | — | — | — | — | ||||||||||||||||||||||||||
| Total Liabilities | $ | (37) | $ | 48 | $ | — | $ | — | $ | (11) | $ | — | $ | — | $ | — | $ | — | |||||||||||||||||
[1]Amounts in these columns are generally reported in net realized gains (losses). All amounts are before income taxes.
[2]All amounts are before income taxes.
[3]Transfers in and/or (out) of Level 3 are primarily attributable to the availability of market observable information and the re-evaluation of the observability of pricing inputs.
[4]Included within other investments on the Consolidated Balance Sheets.
[5]Derivative instruments are reported in this table on a net basis for asset (liability) positions and reported in the Consolidated Balance Sheets in other investments and other liabilities.
154
|
| Note 5 - Fair Value Measurements | ||||||||
THE HARTFORD FINANCIAL SERVICES GROUP, INC.
NOTES TO CONSOLIDATED FINANCIAL STATEMENTS (continued)
Changes in Unrealized Gains (Losses) for Financial Instruments Classified as Level 3 Still Held at Year End
| December 31, 2021 | December 31, 2020 | |||||||||||||||||||
| Changes in Unrealized Gain/(Loss) included in Net Income [1] [2] | Changes in Unrealized Gain/(Loss) included in OCI [3] | Changes in Unrealized Gain/(Loss) included in Net Income [1] [2] | Changes in Unrealized Gain/(Loss) included in OCI [3] | |||||||||||||||||
| Assets | ||||||||||||||||||||
| Fixed Maturities, AFS | ||||||||||||||||||||
| CLOs | $ | — | $ | (1) | $ | — | $ | 1 | ||||||||||||
| CMBS | — | 1 | — | 4 | ||||||||||||||||
| Corporate | — | (32) | (21) | 24 | ||||||||||||||||
| RMBS | — | (4) | — | (10) | ||||||||||||||||
| Total Fixed Maturities, AFS | — | (36) | (21) | 19 | ||||||||||||||||
| Equity Securities, at fair value | 4 | — | (9) | — | ||||||||||||||||
| Fixed Maturities, FVO [4] | (6) | — | — | — | ||||||||||||||||
| Total Assets | $ | (2) | $ | (36) | $ | (30) | $ | 19 | ||||||||||||
| Liabilities | ||||||||||||||||||||
| Contingent Consideration | $ | — | $ | — | $ | 12 | $ | — | ||||||||||||
| Total Liabilities | $ | — | $ | — | $ | 12 | $ | — | ||||||||||||
[1]All amounts in these rows are reported in net gains (losses). All amounts are before income taxes.
[2]Amounts presented are for Level 3 only and therefore may not agree to other disclosures included herein.
[3]Changes in unrealized gain (loss) on fixed maturities, AFS are reported in changes in net unrealized gain on securities in the Consolidated Statements of Comprehensive Income.
[4]Included within other investments on the Consolidated Balance Sheets.
FAIR VALUE OPTION
The Company has elected the fair value option for certain investments in residual interests of securitizations in order to reflect changes in fair value in earnings. These instruments are included within other investments on the Consolidated Balance Sheets and changes in the fair value of these securities are reported in net realized gains and losses.
As of December 31, 2021, the fair value of assets using the fair value option was $160. As of December 31, 2020, the Company did not have any assets using the fair value option.
For the year ended December 31, 2021 realized losses related to the change in fair value of assets using the fair value option were $6. For the years ended December 31, 2020 and 2019, there were no realized gains (losses) related to the change in fair value of assets using the fair value option.
FINANCIAL INSTRUMENTS NOT CARRIED AT FAIR VALUE
Financial Assets and Liabilities Not Carried at Fair Value
| December 31, 2021 | December 31, 2020 | ||||||||||||||||||||||
| Fair Value Hierarchy Level | Carrying Amount [1] | Fair Value | Fair Value Hierarchy Level | Carrying Amount [1] | Fair Value | ||||||||||||||||||
| Assets | |||||||||||||||||||||||
| Mortgage loans | Level 3 | $ | 5,383 | $ | 5,576 | Level 3 | $ | 4,493 | $ | 4,792 | |||||||||||||
| Liabilities | |||||||||||||||||||||||
| Other policyholder funds and benefits payable | Level 3 | $ | 687 | $ | 689 | Level 3 | $ | 701 | $ | 703 | |||||||||||||
| Senior notes [2] | Level 2 | $ | 3,854 | $ | 4,725 | Level 2 | $ | 3,262 | $ | 4,363 | |||||||||||||
| Junior subordinated debentures [2] | Level 2 | $ | 1,090 | $ | 1,086 | Level 2 | $ | 1,090 | $ | 1,107 | |||||||||||||
[1] As of December 31, 2021 and December 31, 2020, carrying amount of mortgage loans is net of ACL of $29 and $38 respectively
[2] Included in long-term debt in the Consolidated Balance Sheets, except for any current maturities, which are included in short-term debt when applicable.
155
|
| Note 6 - Investments | ||||||||
THE HARTFORD FINANCIAL SERVICES GROUP, INC.
NOTES TO CONSOLIDATED FINANCIAL STATEMENTS (continued)
6. INVESTMENTS
Net Investment Income
| For the years ended December 31, | |||||||||||
| (Before tax) | 2021 | 2020 | 2019 | ||||||||
| Fixed maturities [1] | $ | 1,349 | $ | 1,442 | $ | 1,559 | |||||
| Equity securities | 73 | 39 | 46 | ||||||||
| Mortgage loans | 181 | 172 | 165 | ||||||||
| Limited partnerships and other alternative investments | 732 | 222 | 232 | ||||||||
| Other investments [2] | 58 | 42 | 32 | ||||||||
| Investment expenses | (80) | (71) | (83) | ||||||||
| Total net investment income | $ | 2,313 | $ | 1,846 | $ | 1,951 | |||||
[1]Includes net investment income on short-term investments.
[2]Primarily includes changes in fair value of certain equity fund investments and income from derivatives that qualify for hedge accounting and are used to hedge fixed maturities.
Net Realized Gains (Losses)
| For the years ended December 31, | |||||||||||
| (Before tax) | 2021 | 2020 | 2019 | ||||||||
| Gross gains on sales of fixed maturities | $ | 319 | $ | 255 | $ | 234 | |||||
| Gross losses on sales of fixed maturities | (89) | (50) | (56) | ||||||||
| Equity securities [1] | |||||||||||
| Net realized gains (losses) on sales of equity securities | 81 | (118) | 78 | ||||||||
| Change in net unrealized gains (losses) of equity securities | 146 | (96) | 176 | ||||||||
| Net realized and unrealized gains (losses) on equity securities | 227 | (214) | 254 | ||||||||
| Net credit losses on fixed maturities, AFS [2] | 4 | (28) | |||||||||
| Change in ACL on mortgage loans [3] | 9 | (19) | |||||||||
| Intent-to-sell impairments | — | (5) | — | ||||||||
| Net OTTI losses recognized in earnings | (3) | ||||||||||
| Valuation allowances on mortgage loans | 1 | ||||||||||
| Other, net [4] | 39 | 47 | (35) | ||||||||
| Net realized gains (losses) | $ | 509 | $ | (14) | $ | 395 | |||||
[1]The net unrealized gains on equity securities still held as of the end of the period and included in net realized gains (losses) were $155, $53, and $164 for the years ended December 31, 2021, 2020, and 2019, respectively.
[2]Due to the adoption of accounting guidance for credit losses on January 1, 2020, realized losses previously reported as OTTI are now presented as credit losses which are net of any recoveries. For further information refer to Note 1 - Basis of Presentation and Significant Accounting Policies.
[3]Represents the change in ACL recorded during the period following the adoption of accounting guidance for credit losses on January 1, 2020. For further information refer to Note 1 - Basis of Presentation and Significant Accounting Policies.
[4]Includes gains (losses) on non-qualifying derivatives for 2021, 2020, and 2019 of $12, $104, and $(24), respectively, gains (losses) from transactional foreign currency revaluation of $(1), $(1) and $(9), respectively, and a loss of $21 and $48, respectively, on the sale of the Continental Europe Operations for the years ended December 31, 2021 and 2020. For the year ended December 31, 2021, there was also a gain of $46 on the sale of the Company's previously owned interest in Talcott Resolution.
Proceeds from the sales of fixed maturities, AFS totaled $15.9 billion, $15.1 billion, and $14.4 billion for the years ended December 31, 2021, 2020, and 2019, respectively. Sales of AFS securities in 2021 were primarily a result of tactical changes to the portfolio driven by changing market conditions, in addition to duration and liquidity management.
Accrued Interest Receivable on Fixed Maturities, AFS and Mortgage Loans
As of December 31, 2021 and December 31, 2020, the Company reported accrued interest receivable related to fixed maturities, AFS of $299 and $327, respectively, and accrued interest receivable related to mortgage loans of $16 and $14, respectively. These amounts are recorded in other assets on the Consolidated Balance Sheets and are not included in the carrying value of the fixed maturities or mortgage loans. The
156
|
| Note 6 - Investments | ||||||||
THE HARTFORD FINANCIAL SERVICES GROUP, INC.
NOTES TO CONSOLIDATED FINANCIAL STATEMENTS (continued)
Company does not include the current accrued interest receivable balance when estimating the ACL. The Company has a policy to write-off accrued interest receivable balances that are more than 90 days past due. Write-offs of accrued interest receivable are recorded as a credit loss component of net realized gains and losses.
Interest income on fixed maturities and mortgage loans is accrued unless it is past due over 90 days or management deems the interest uncollectible.
Recognition and Presentation of Intent-to-Sell Impairments and ACL on Fixed Maturities, AFS
The Company will record an "intent-to-sell impairment" as a reduction to the amortized cost of fixed maturities, AFS in an unrealized loss position if the Company intends to sell or it is more likely than not that the Company will be required to sell the fixed maturity before a recovery in value. A corresponding charge is recorded in net realized losses equal to the difference between the fair value on the impairment date and the amortized cost basis of the fixed maturity before recognizing the impairment.
When fixed maturities are in an unrealized loss position and the Company does not record an intent-to-sell impairment, the Company will record an ACL for the portion of the unrealized loss due to a credit loss. Any remaining unrealized loss on a fixed maturity after recording an ACL is the non-credit amount and is recorded in OCI. The ACL is the excess of the amortized cost over the greater of the Company's best estimate of the present value of expected future cash flows or the security's fair value. Cash flows are discounted at the effective yield that is used to record interest income. The ACL cannot exceed the unrealized loss and, therefore, it may fluctuate with changes in the fair value of the fixed maturity if the fair value is greater than the Company's best estimate of the present value of expected future cash flows. The initial ACL and any subsequent changes are recorded in net realized gains and losses. The ACL is written off against the amortized cost in the period in which all or a portion of the related fixed maturity is determined to be uncollectible.
Developing the Company’s best estimate of expected future cash flows is a quantitative and qualitative process that incorporates information received from third-party sources along with certain internal assumptions regarding the future performance. The Company's considerations include, but are not limited to, (a) changes in the financial condition of the issuer and/or the underlying collateral, (b) whether the issuer is current on contractually obligated interest and principal payments, (c) credit ratings, (d) payment structure of the security and (e) the extent to which the fair value has been less than the amortized cost of the security.
For non-structured securities, assumptions include, but are not limited to, economic and industry-specific trends and fundamentals, instrument-specific developments including changes in credit ratings, industry earnings multiples and the issuer’s ability to restructure, access capital markets, and execute asset sales.
For structured securities, assumptions include, but are not limited to, various performance indicators such as historical and projected default and recovery rates, credit ratings, current and projected delinquency rates, loan-to-value ratios ("LTVs"), average cumulative collateral loss rates that vary by vintage year, prepayment speeds, and property value declines. These assumptions require the use of significant management judgment and include the probability of issuer default and estimates regarding timing and amount of expected recoveries which may include estimating the underlying collateral value.
Prior to January 1, 2020, the Company recorded an OTTI loss on fixed maturities for which the Company did not expect to recover the entire amortized cost basis. For these securities, the excess of the amortized cost basis over its fair value was separated into the portion representing a credit OTTI, which was recorded in net realized losses, and the remaining non-credit amount, which was recorded in OCI. The Company’s best estimate of discounted expected future cash flows became the new cost basis and accreted prospectively into net investment income over the estimated remaining life of the security.
| ACL on Fixed Maturities, AFS by Type | |||||||||||||||||||||||
| For the years ended December 31, | |||||||||||||||||||||||
| 2021 | 2020 | ||||||||||||||||||||||
| (Before tax) | Corporate | Total | Corporate | Municipal | Total | ||||||||||||||||||
| Balance as of beginning of period | $ | 23 | $ | 23 | $ | — | $ | — | $ | — | |||||||||||||
| Credit losses on fixed maturities where an allowance was not previously recorded | 2 | 2 | 36 | 3 | 39 | ||||||||||||||||||
| Reduction due to sales | (18) | (18) | (4) | (3) | (7) | ||||||||||||||||||
| Net increases (decreases) on fixed maturities where an allowance was previously recorded | (6) | (6) | (9) | — | (9) | ||||||||||||||||||
| Balance as of end of period | $ | 1 | $ | 1 | $ | 23 | $ | — | $ | 23 | |||||||||||||
157
|
| Note 6 - Investments | ||||||||
THE HARTFORD FINANCIAL SERVICES GROUP, INC.
NOTES TO CONSOLIDATED FINANCIAL STATEMENTS (continued)
| Cumulative Credit Impairments on Fixed Maturities, AFS | |||||
| (Before tax) | For the year ended December 31, 2019 | ||||
| Balance as of beginning of period | $ | (19) | |||
| Additions for credit impairments recognized on [1]: | |||||
| Fixed maturities not previously impaired | (3) | ||||
| Reductions for credit impairments previously recognized on: | |||||
| Fixed maturities that matured or were sold during the period | 3 | ||||
| Balance as of end of period | $ | (19) | |||
[1]These additions are included in the net OTTI losses recognized in earnings in the Consolidated Statements of Operations.
Fixed Maturities, AFS
| Fixed Maturities, AFS, by Type | ||||||||||||||||||||||||||||||||||||||
| December 31, 2021 | December 31, 2020 | |||||||||||||||||||||||||||||||||||||
Amortized Cost | ACL | Gross Unrealized Gains | Gross Unrealized Losses | Fair Value | Amortized Cost | ACL | Gross Unrealized Gains | Gross Unrealized Losses | Fair Value | |||||||||||||||||||||||||||||
| ABS | $ | 1,125 | $ | — | $ | 13 | $ | (3) | $ | 1,135 | $ | 1,525 | $ | — | $ | 39 | $ | — | $ | 1,564 | ||||||||||||||||||
| CLOs | 3,019 | — | 8 | (2) | 3,025 | 2,780 | — | 7 | (7) | 2,780 | ||||||||||||||||||||||||||||
| CMBS | 3,955 | — | 179 | (15) | 4,119 | 4,219 | — | 286 | (21) | 4,484 | ||||||||||||||||||||||||||||
| Corporate | 17,744 | (1) | 1,038 | (74) | 18,707 | 18,401 | (23) | 1,926 | (31) | 20,273 | ||||||||||||||||||||||||||||
| Foreign govt./govt. agencies | 883 | — | 33 | (6) | 910 | 842 | — | 77 | — | 919 | ||||||||||||||||||||||||||||
| Municipal | 7,473 | — | 787 | (3) | 8,257 | 8,564 | — | 940 | (1) | 9,503 | ||||||||||||||||||||||||||||
| RMBS | 3,610 | — | 60 | (27) | 3,643 | 3,966 | — | 144 | (3) | 4,107 | ||||||||||||||||||||||||||||
| U.S. Treasuries | 2,979 | — | 86 | (14) | 3,051 | 1,264 | — | 141 | — | 1,405 | ||||||||||||||||||||||||||||
| Total fixed maturities, AFS | $ | 40,788 | $ | (1) | $ | 2,204 | $ | (144) | $ | 42,847 | $ | 41,561 | $ | (23) | $ | 3,560 | $ | (63) | $ | 45,035 | ||||||||||||||||||
Fixed Maturities, AFS, by Contractual Maturity Year
| December 31, 2021 | December 31, 2020 | ||||||||||||||||
| Amortized Cost | Fair Value | Amortized Cost | Fair Value | ||||||||||||||
| One year or less | $ | 1,400 | $ | 1,419 | $ | 1,411 | $ | 1,432 | |||||||||
| Over one year through five years | 8,615 | 8,894 | 7,832 | 8,286 | |||||||||||||
| Over five years through ten years | 8,303 | 8,633 | 7,622 | 8,354 | |||||||||||||
| Over ten years | 10,761 | 11,979 | 12,206 | 14,028 | |||||||||||||
| Subtotal | 29,079 | 30,925 | 29,071 | 32,100 | |||||||||||||
| Mortgage-backed and asset-backed securities | 11,709 | 11,922 | 12,490 | 12,935 | |||||||||||||
| Total fixed maturities, AFS | $ | 40,788 | $ | 42,847 | $ | 41,561 | $ | 45,035 | |||||||||
Estimated maturities may differ from contractual maturities due to call or prepayment provisions. Due to the potential for variability in payment speeds (i.e. prepayments or extensions), mortgage-backed and asset-backed securities are not categorized by contractual maturity.
Concentration of Credit Risk
The Company aims to maintain a diversified investment portfolio including issuer, sector and geographic stratification, where applicable, and has established certain exposure limits, diversification standards and review procedures to mitigate credit risk. The Company had no investment exposure to any credit concentration risk of a single issuer greater than 10% of the
Company's stockholders' equity as of December 31, 2021 or December 31, 2020, other than the U.S. government and certain U.S. government agencies.
As of December 31, 2021, other than U.S. government and certain U.S. government agencies, the Company’s three largest exposures by issuer were the Government of Canada, Apple Inc., and the IBM Corporation each of which comprised less than 1% of total invested assets. As of December 31, 2020, other than U.S. government and certain U.S. government agencies, the Company’s three largest exposures by issuer were Apple Inc., the IBM Corporation, and the New York State Dormitory Authority each of which comprised less than 1% of total invested
158
|
| Note 6 - Investments | ||||||||
THE HARTFORD FINANCIAL SERVICES GROUP, INC.
NOTES TO CONSOLIDATED FINANCIAL STATEMENTS (continued)
assets. The Company’s three largest exposures by sector as of December 31, 2021 were the municipal sector, the financial services sector, and the CMBS sector which comprised approximately 14%, 8%, and 7%, respectively, of total invested assets. The Company’s three largest exposures by sector as of
December 31, 2020 were the municipal sector, the financial services sector, and CMBS sector which comprised approximately 17%, 9%, and 8%, respectively, of total invested assets.
Unrealized Losses on Fixed Maturities, AFS
| Unrealized Loss Aging for Fixed Maturities, AFS by Type and Length of Time as of December 31, 2021 | |||||||||||||||||||||||||||||||||||
| Less Than 12 Months | 12 Months or More | Total | |||||||||||||||||||||||||||||||||
| Fair Value | Unrealized Losses | Fair Value | Unrealized Losses | Fair Value | Unrealized Losses | ||||||||||||||||||||||||||||||
| ABS | $ | 396 | $ | (3) | $ | — | $ | — | $ | 396 | $ | (3) | |||||||||||||||||||||||
| CLOs | 1,434 | (2) | 147 | — | 1,581 | (2) | |||||||||||||||||||||||||||||
| CMBS | 594 | (7) | 82 | (8) | 676 | (15) | |||||||||||||||||||||||||||||
| Corporate | 3,698 | (65) | 234 | (9) | 3,932 | (74) | |||||||||||||||||||||||||||||
| Foreign govt./govt. agencies | 340 | (5) | 16 | (1) | 356 | (6) | |||||||||||||||||||||||||||||
| Municipal | 301 | (3) | 12 | — | 313 | (3) | |||||||||||||||||||||||||||||
| RMBS | 1,869 | (23) | 94 | (4) | 1,963 | (27) | |||||||||||||||||||||||||||||
| U.S. Treasuries | 2,301 | (13) | 23 | (1) | 2,324 | (14) | |||||||||||||||||||||||||||||
| Total fixed maturities, AFS in an unrealized loss position | $ | 10,933 | $ | (121) | $ | 608 | $ | (23) | $ | 11,541 | $ | (144) | |||||||||||||||||||||||
| Unrealized Loss Aging for Fixed Maturities, AFS by Type and Length of Time as of December 31, 2020 | |||||||||||||||||||||||||||||||||||
| Less Than 12 Months | 12 Months or More | Total | |||||||||||||||||||||||||||||||||
| Fair Value | Unrealized Losses | Fair Value | Unrealized Losses | Fair Value | Unrealized Losses | ||||||||||||||||||||||||||||||
| ABS | $ | 44 | $ | — | $ | — | $ | — | $ | 44 | $ | — | |||||||||||||||||||||||
| CLOs | 758 | (2) | 715 | (5) | 1,473 | (7) | |||||||||||||||||||||||||||||
| CMBS | 410 | (17) | 19 | (4) | 429 | (21) | |||||||||||||||||||||||||||||
| Corporate | 466 | (13) | 212 | (18) | 678 | (31) | |||||||||||||||||||||||||||||
| Foreign govt./govt. agencies | 24 | — | — | — | 24 | — | |||||||||||||||||||||||||||||
| Municipal | 34 | (1) | — | — | 34 | (1) | |||||||||||||||||||||||||||||
| RMBS | 461 | (3) | 21 | — | 482 | (3) | |||||||||||||||||||||||||||||
| U.S. Treasuries | 39 | — | — | — | 39 | — | |||||||||||||||||||||||||||||
| Total fixed maturities, AFS in an unrealized loss position | $ | 2,236 | $ | (36) | $ | 967 | $ | (27) | $ | 3,203 | $ | (63) | |||||||||||||||||||||||
As of December 31, 2021, fixed maturities, AFS in an unrealized loss position consisted of 1,500 instruments, primarily in the corporate sectors, most notably financial services and technology and communications, as well as RMBS, CMBS, and U.S. Treasuries which were depressed largely due to higher interest rates and/or wider credit spreads since the purchase date. As of December 31, 2021, 99% of these fixed maturities were depressed less than 20% of cost or amortized cost. The increase in gross unrealized losses during 2021 was primarily attributable to higher interest rates, partially offset by tighter credit spreads.
Most of the fixed maturities depressed for twelve months or more relate to the corporate and CMBS sectors which were primarily depressed because current market spreads are wider than at the respective purchase dates. Additionally, certain corporate fixed maturities were also depressed because of their variable-rate coupons and long-dated maturities. The Company neither has an intention to sell nor does it expect to be required to sell the fixed maturities outlined in the preceding discussion. The decision to record credit losses on fixed maturities, AFS in the form of an ACL requires us to make qualitative and quantitative estimates of expected future cash flows.
159
|
| Note 6 - Investments | ||||||||
THE HARTFORD FINANCIAL SERVICES GROUP, INC.
NOTES TO CONSOLIDATED FINANCIAL STATEMENTS (continued)
Mortgage Loans
ACL on Mortgage Loans
The Company reviews mortgage loans on a quarterly basis to estimate the ACL with changes in the ACL recorded in net realized gains and losses. Apart from an ACL recorded on individual mortgage loans where the borrower is experiencing financial difficulties, the Company records an ACL on the pool of mortgage loans based on lifetime expected credit losses. The Company utilizes a third-party forecasting model to estimate lifetime expected credit losses at a loan level under multiple economic scenarios. The scenarios use macroeconomic data provided by an internationally recognized economics firm that generates forecasts of varying economic factors such as GDP growth, unemployment and interest rates. The economic scenarios are projected over 10 years. The first two to four years of the 10-year period assume a specific modeled economic scenario (including moderate upside, moderate recession and severe recession scenarios) and then revert to historical long-term assumptions over the remaining period. Using these economic scenarios, the forecasting model projects property-specific operating income and capitalization rates used to estimate the value of a future operating income stream. The operating income and the property valuations derived from capitalization rates are compared to loan payment and principal amounts to create debt service coverage ratios ("DSCRs") and LTVs over the forecast period. The model overlays historical data about mortgage loan performance based on DSCRs and LTVs and projects the probability of default, amount of loss given a default and resulting expected loss through maturity for each loan under each economic scenario. Economic scenarios are probability-weighted based on a statistical analysis of the forecasted economic factors and qualitative analysis. The Company records the change in the ACL on mortgage loans based on the weighted-average expected credit losses across the selected economic scenarios.
When a borrower is experiencing financial difficulty, including when foreclosure is probable, the Company measures an ACL on individual mortgage loans. The ACL is established for any shortfall between the amortized cost of the loan and the fair value of the collateral less costs to sell. Estimates of collectibility from an individual borrower require the use of significant management judgment and include the probability and timing of borrower default and loss severity estimates. In addition, cash flow projections may change based upon new information about the borrower's ability to pay and/or the value of underlying collateral such as changes in projected property value estimates. As of December 31, 2021, the Company did not have any mortgage loans for which an ACL was established on an individual basis.
There were 0 mortgage loans held-for-sale as of December 31, 2021 or December 31, 2020. In addition, as of December 31, 2021 and December 31, 2020, the Company had no mortgage loans that have had extensions or restructurings other than what is allowable under the original terms of the contract.
Prior to January 1, 2020, for mortgage loans that were deemed impaired, a valuation allowance was established for the difference between the carrying amount and estimated fair value, which was generally the Company's share of the fair value of the collateral. A valuation allowance also may have been recorded
for an individual loan or for a group of loans that had an LTV ratio of 90% or greater, a low DSCR or other lower credit quality characteristics. Changes in valuation allowances were recognized as net realized losses.
| ACL on Mortgage Loans | |||||||||||
| For the years ended December 31, | |||||||||||
| 2021 | 2020 | 2019 | |||||||||
| ACL as of beginning of period | $ | 38 | $ | — | $ | 1 | |||||
| Cumulative effect of accounting changes [1] | 19 | ||||||||||
| Adjusted beginning ACL | 38 | 19 | 1 | ||||||||
| Current period provision (release) | (9) | 19 | (1) | ||||||||
| ACL as of December 31, | $ | 29 | $ | 38 | $ | — | |||||
[1]Represents the adjustment to the ACL recorded on adoption of accounting guidance for credit losses on January 1, 2020. For further information refer to Note 1 - Basis of Presentation and Significant Accounting Policies.
The decrease in the allowance for the year ended December 31, 2021, is the result of improved economic scenarios, including improved GDP growth and unemployment, and higher property valuations as compared to the prior periods, partially offset by an increase driven by net additions of new loans. We continue to monitor the impact on our mortgage loan portfolio from borrower behavior in response to the economic stress caused by the pandemic. Borrowers with lower LTVs have an incentive to continue to make payments of principal and/or interest in order to preserve the equity they have in the underlying commercial real estate properties. During 2020, the Company increased the estimate of the ACL in response to significant economic stress experienced as a result of the COVID-19 pandemic.
The weighted-average LTV ratio of the Company’s mortgage loan portfolio was 51% as of December 31, 2021, while the weighted-average LTV ratio at origination of these loans was 60%. LTV ratios compare the loan amount to the value of the underlying property collateralizing the loan with property values based on appraisals updated no less than annually. Factors considered in estimating property values include, among other things, actual and expected property cash flows, geographic market data and the ratio of the property's net operating income to its value. DSCR compares a property’s net operating income to the borrower’s principal and interest payments and are updated no less than annually through reviews of underlying properties.
160
|
| Note 6 - Investments | ||||||||
THE HARTFORD FINANCIAL SERVICES GROUP, INC.
NOTES TO CONSOLIDATED FINANCIAL STATEMENTS (continued)
| Mortgage Loans LTV & DSCR by Origination Year as of December 31, 2021 | ||||||||||||||||||||||||||||||||||||||||||||
| 2021 | 2020 | 2019 | 2018 | 2017 | 2016 & Prior | Total | ||||||||||||||||||||||||||||||||||||||
| Loan-to-value | Amortized Cost | Avg. DSCR | Amortized Cost | Avg. DSCR | Amortized Cost | Avg. DSCR | Amortized Cost | Avg. DSCR | Amortized Cost | Avg. DSCR | Amortized Cost | Avg. DSCR | Amortized Cost [1] | Avg. DSCR | ||||||||||||||||||||||||||||||
| 65% - 80% | $ | 7 | 2.37x | $ | 50 | 2.63x | $ | 91 | 1.57x | $ | 100 | 1.00x | $ | 45 | 1.37x | $ | 97 | 1.80x | $ | 390 | 1.61x | |||||||||||||||||||||||
| Less than 65% | 1,481 | 2.70x | 645 | 2.78x | 722 | 2.78x | 472 | 2.23x | 417 | 1.91x | 1,285 | 2.45x | 5,022 | 2.55x | ||||||||||||||||||||||||||||||
| Total mortgage loans | $ | 1,488 | 2.70x | $ | 695 | 2.77x | $ | 813 | 2.64x | $ | 572 | 2.02x | $ | 462 | 1.86x | $ | 1,382 | 2.41x | $ | 5,412 | 2.48x | |||||||||||||||||||||||
| Mortgage Loans LTV & DSCR by Origination Year as of December 31, 2020 | ||||||||||||||||||||||||||||||||||||||||||||
| 2020 | 2019 | 2018 | 2017 | 2016 | 2015 & Prior | Total | ||||||||||||||||||||||||||||||||||||||
| Loan-to-value | Amortized Cost | Avg. DSCR | Amortized Cost | Avg. DSCR | Amortized Cost | Avg. DSCR | Amortized Cost | Avg. DSCR | Amortized Cost | Avg. DSCR | Amortized Cost | Avg. DSCR | Amortized Cost [1] | Avg. DSCR | ||||||||||||||||||||||||||||||
| 65% - 80% | $ | 28 | 1.62x | $ | 243 | 1.58x | $ | 212 | 1.33x | $ | 45 | 2.02x | $ | 51 | 1.92x | $ | 115 | 1.74x | $ | 694 | 1.59x | |||||||||||||||||||||||
| Less than 65% | 659 | 2.56x | 676 | 2.85x | 410 | 2.25x | 446 | 1.89x | 235 | 2.99x | 1,411 | 3.01x | 3,837 | 2.69x | ||||||||||||||||||||||||||||||
| Total mortgage loans | $ | 687 | 2.52x | $ | 919 | 2.51x | $ | 622 | 1.94x | $ | 491 | 1.90x | $ | 286 | 2.80x | $ | 1,526 | 2.92x | $ | 4,531 | 2.52x | |||||||||||||||||||||||
| Mortgage Loans by Region | |||||||||||||||||
| December 31, 2021 | December 31, 2020 | ||||||||||||||||
| Amortized Cost | Percent of Total | Amortized Cost | Percent of Total | ||||||||||||||
| East North Central | $ | 284 | 5.2 | % | $ | 290 | 6.4 | % | |||||||||
| Middle Atlantic | 303 | 5.6 | % | 291 | 6.4 | % | |||||||||||
| Mountain | 450 | 8.3 | % | 254 | 5.6 | % | |||||||||||
| New England | 393 | 7.3 | % | 397 | 8.8 | % | |||||||||||
| Pacific | 1,245 | 23.0 | % | 1,001 | 22.1 | % | |||||||||||
| South Atlantic | 1,556 | 28.8 | % | 1,038 | 22.9 | % | |||||||||||
| West North Central | 85 | 1.6 | % | 44 | 1.0 | % | |||||||||||
| West South Central | 424 | 7.8 | % | 433 | 9.5 | % | |||||||||||
| Other [1] | 672 | 12.4 | % | 783 | 17.3 | % | |||||||||||
| Total mortgage loans | $ | 5,412 | 100.0 | % | $ | 4,531 | 100.0 | % | |||||||||
| ACL | (29) | (38) | |||||||||||||||
| Total mortgage loans, net of ACL | $ | 5,383 | $ | 4,493 | |||||||||||||
[1]Primarily represents loans collateralized by multiple properties in various regions.
| Mortgage Loans by Property Type | |||||||||||||||||
| December 31, 2021 | December 31, 2020 | ||||||||||||||||
| Amortized Cost | Percent of Total | Amortized Cost | Percent of Total | ||||||||||||||
| Commercial | |||||||||||||||||
| Industrial | $ | 1,931 | 35.7 | % | $ | 1,339 | 29.5 | % | |||||||||
| Multifamily | 1,833 | 33.9 | % | 1,498 | 33.1 | % | |||||||||||
| Office | 627 | 11.6 | % | 774 | 17.1 | % | |||||||||||
| Retail [1] | 951 | 17.6 | % | 788 | 17.4 | % | |||||||||||
| Single Family | 30 | 0.5 | % | 92 | 2.0 | % | |||||||||||
| Other | 40 | 0.7 | % | 40 | 0.9 | % | |||||||||||
| Total mortgage loans | $ | 5,412 | 100.0 | % | $ | 4,531 | 100.0 | % | |||||||||
| ACL | (29) | (38) | |||||||||||||||
| Total mortgage loans, net of ACL | $ | 5,383 | $ | 4,493 | |||||||||||||
[1] Primarily comprised of grocery-anchored retail centers, with no exposure to regional shopping malls.
Past-Due Mortgage Loans
Mortgage loans are considered past due if a payment of principal or interest is not received according to the contractual terms of the loan agreement, which typically includes a grace period. As of December 31, 2021 and December 31, 2020, the Company held no mortgage loans considered past due.
Mortgage Servicing
The Company originates, sells, and services commercial mortgage loans on behalf of third parties and recognizes servicing fee income over the period that services are performed. As of December 31, 2021, under this program, the Company serviced mortgage loans with a total outstanding principal of $8.2 billion, of which $3.9 billion was serviced on
161
|
| Note 6 - Investments | ||||||||
THE HARTFORD FINANCIAL SERVICES GROUP, INC.
NOTES TO CONSOLIDATED FINANCIAL STATEMENTS (continued)
behalf of third parties and $4.3 billion was retained and reported in total investments on the Company's Consolidated Balance Sheets. As of December 31, 2020, the Company serviced mortgage loans with a total outstanding principal balance of $6.9 billion, of which $3.7 billion was serviced on behalf of third parties and $3.2 billion was retained and reported in total investments on the Company's Consolidated Balance Sheets. Servicing rights are carried at the lower of cost or fair value and were $0 as of December 31, 2021 and December 31, 2020, because servicing fees were market-level fees at origination and remain adequate to compensate the Company for servicing the loans.
Variable Interest Entities
The Company is engaged with various special purpose entities and other entities that are deemed to be VIEs primarily as an investor through normal investment activities but also as an investment manager.
A VIE is an entity that either has investors that lack certain essential characteristics of a controlling financial interest, such as simple majority kick-out rights, or lacks sufficient funds to finance its own activities without financial support provided by other entities. The Company performs ongoing qualitative assessments of its VIEs to determine whether the Company has a controlling financial interest in the VIE and therefore is the primary beneficiary. The Company is deemed to have a controlling financial interest when it has both the ability to direct the activities that most significantly impact the economic performance of the VIE and the obligation to absorb losses or right to receive benefits from the VIE that could potentially be significant to the VIE. Based on the Company’s assessment, if it determines it is the primary beneficiary, the Company consolidates the VIE in the Company’s Consolidated Financial Statements.
Consolidated VIEs
As of December 31, 2021 and 2020, the Company did 0t hold any securities for which it is the primary beneficiary.
Non-Consolidated VIEs
The Company, through normal investment activities, makes passive investments in limited partnerships and other alternative investments. For these non-consolidated VIEs, the Company has determined it is not the primary beneficiary as it has no ability to direct activities that could significantly affect the economic performance of the investments. The Company’s maximum exposure to loss as of December 31, 2021 and 2020 is limited to the total carrying value of $1.9 billion and $1.3 billion, respectively, which are a portion of the investments in limited partnerships and other alternative investments in the Company's Consolidated Balance Sheets that are primarily recorded using the equity method of accounting. As of December 31, 2021 and 2020, the Company has outstanding commitments totaling $1.4 billion and $768, respectively, whereby the Company is committed to fund these investments and may be called by the partnership during the commitment period to fund the purchase of new investments and partnership expenses. These investments are generally of a passive nature in that the Company does not take an active role in management.
In addition, the Company makes passive investments in structured securities issued by VIEs for which the Company is not the manager. These investments are included in ABS, CLOs, CMBS, and RMBS and are reported in fixed maturities, AFS, and, for assets where the Company has elected the fair value option, in other investments. The Company has not provided financial or other support with respect to these investments other than its original investment. For these investments, the Company determined it is not the primary beneficiary due to the relative size of the Company’s investment in comparison to the principal amount of the structured securities issued by the VIEs, the Company’s inability to direct the activities that most significantly impact the economic performance of the VIEs, and, where applicable, the level of credit subordination which reduces the Company’s obligation to absorb losses or right to receive benefits. The Company’s maximum exposure to loss on these investments is limited to the amount of the Company’s investment.
Securities Lending, Reverse Repurchase Agreements, Other Collateral Transactions and Restricted Investments
Securities Lending
Under a securities lending program, the Company lends certain fixed maturities within the corporate, foreign government/government agencies, and municipal sectors as well as equity securities to qualifying third-party borrowers in return for collateral in the form of cash or securities. For domestic and non-domestic loaned securities, respectively, borrowers provide collateral of 102% and 105% of the fair value of the securities lent at the time of the loan. Borrowers will return the securities to the Company for cash or securities collateral at maturity dates generally of 90 days or less. Security collateral on deposit from counterparties in connection with securities lending transactions may not be sold or re-pledged, except in the event of default by the counterparty, and is not reflected on the Company’s Consolidated Balance Sheets. Additional collateral is obtained if the fair value of the collateral falls below 100% of the fair value of the loaned securities. The agreements are continuous and do not have stated maturity dates and provide the counterparty the right to sell or re-pledge the securities loaned. If cash, rather than securities, is received as collateral, the cash is typically invested in short-term investments or fixed maturities and is reported as an asset on the Company's Consolidated Balance Sheets. Income associated with securities lending transactions is reported as a component of net investment income in the Company’s Consolidated Statements of Operations. While the Company had securities on loan as part of a securities lending program during 2020, as of December 31, 2021 and December 31, 2020, the Company did not have any securities on loan as part of a securities lending program.
Reverse Repurchase Agreements
From time to time, the Company enters into reverse repurchase agreements where the Company purchases securities and simultaneously agrees to resell the same or substantially the same securities. The maturity of these transactions is generally within one year. The agreements require additional collateral to
162
|
| Note 6 - Investments | ||||||||
THE HARTFORD FINANCIAL SERVICES GROUP, INC.
NOTES TO CONSOLIDATED FINANCIAL STATEMENTS (continued)
be transferred to the Company under specified conditions and the Company has the right to sell or re-pledge the securities received. The Company accounts for reverse repurchase agreements as collateralized financing. As of December 31, 2021 and December 31, 2020, the Company reported $30 and $30, respectively, within short-term investments on the Consolidated Balance Sheets representing a receivable for the amount of cash transferred to purchase the securities.
Other Collateral Transactions
As of December 31, 2021 and December 31, 2020, the Company pledged collateral of $9 and $34, respectively, of U.S. government securities or cash primarily related to certain bank loan participations committed to through a limited partnership agreement. Amounts also include collateral related to letters of credit.
For disclosure of collateral in support of derivative transactions, refer to the Derivative Collateral Arrangements section in Note 7 - Derivatives.
Other Restricted Investments
The Company is required by law to deposit securities with government agencies in certain states in which it conducts business. In addition, the Company is required to hold fixed maturities and short-term investments in trust for the benefit of syndicate policyholders, hold fixed maturities in a Lloyd's of London ("Lloyd's") trust account to provide a portion of the required capital, and maintain other investments primarily consisting of overseas deposits in various countries with Lloyd's to support underwriting activities in those countries. Lloyd's is an insurance market-place operating worldwide. Lloyd's does not underwrite risks. The Company accepts risks as the sole member of Lloyd's Syndicate 1221 ("Lloyd's Syndicate").
The following table presents the components of the Company’s exposure to other restricted investments.
| December 31, 2021 | December 31, 2020 | |||||||
| Fair Value | Fair Value | |||||||
| Securities on deposit with government agencies | $ | 2,376 | $ | 2,600 | ||||
| Fixed maturities in trust for benefit of syndicate policyholders | 712 | 661 | ||||||
| Short-term investments in trust for benefit of syndicate policyholders | 7 | 26 | ||||||
| Fixed maturities in Lloyd's's trust account | 160 | 175 | ||||||
| Other investments | 65 | 54 | ||||||
| Total Other Restricted Investments | $ | 3,320 | $ | 3,516 | ||||
Equity Method Investments
The majority of the Company's investments in limited partnerships and other alternative investments, including hedge funds, real estate funds, and private equity funds (collectively, “limited partnerships”), are accounted for under the equity method of accounting. The remainder of investments in limited partnerships and other alternative investments consists of investments in insurer-owned life insurance accounted for at cash surrender value. Prior to June 30, 2021, the Company also had a retained 9.7% investment in Hopmeadow Holdings LP, the legal entity that acquired Talcott Resolution in May 2018
(collectively referred to as "Talcott Resolution"), which was accounted for under the equity method of accounting and was reported in other assets on the Company's Consolidated Balance Sheets. On June 30, 2021, the Company sold its 9.7% ownership interest in Talcott Resolution and received a total $217 in connection with the sale, resulting in a realized gain on sale of $46 before tax during 2021.
The Company recognized total equity method income of $630, $244, and $267 for the years ended December 31, 2021, 2020 and 2019, respectively. Equity method income is reported in net investment income, except amounts related to strategic investments classified in other assets which are reported in other revenues. For investments accounted for under the equity method, the Company’s maximum exposure to loss as of December 31, 2021 is limited to the total carrying value of $2.9 billion. In addition, the Company has outstanding commitments totaling $1.6 billion to fund limited partnership investments as of December 31, 2021. The Company’s investments accounted for under the equity method are generally of a passive nature in that the Company does not take an active role in the management.
In 2021, aggregate investment income from investments accounted for under the equity method exceeded 10% of the Company’s before tax consolidated net income (loss). Accordingly, the Company is disclosing aggregated, summarized financial data for the Company’s investments accounted for under the equity method. This aggregated, summarized financial data does not represent the Company’s proportionate share of investees' assets or earnings. Aggregate total assets of the investees totaled $249.8 billion and $339.6 billion as of December 31, 2021 and 2020, respectively. Aggregate total liabilities of the investees totaled $41.0 billion and $181.5 billion as of December 31, 2021 and 2020, respectively. Aggregate net investment income of the investees totaled $2.1 billion, $954, and $618 for the periods ended December 31, 2021, 2020 and 2019, respectively. Aggregate net income excluding net investment income of the investees totaled $46.7 billion, $7.4 billion and $13.4 billion for the periods ended December 31, 2021, 2020 and 2019, respectively. As of, and for the period ended, December 31, 2021, the aggregated summarized financial data reflects the latest available financial information.
163
|
| Note 7 - Derivatives | ||||||||
THE HARTFORD FINANCIAL SERVICES GROUP, INC.
NOTES TO CONSOLIDATED FINANCIAL STATEMENTS (continued)
7. DERIVATIVES
The Company utilizes a variety of OTC, OTC-cleared and exchange traded derivative instruments as a part of its overall risk management strategy as well as to enter into replication transactions or income generation covered call transactions. Derivative instruments are used to manage risk associated with interest rate, equity market, credit spread, issuer default, price, and currency exchange rate or volatility. Replication transactions are used as an economical means to synthetically replicate the characteristics and performance of assets that are permissible investments under the Company’s investment policies.
STRATEGIES THAT QUALIFY FOR HEDGE ACCOUNTING
Some of the Company's derivatives satisfy hedge accounting requirements as outlined in Note 1 - Basis of Presentation and Significant Accounting Policies. Typically, these hedging instruments include interest rate swaps and, to a lesser extent, foreign currency swaps where the terms or expected cash flows of the hedged item closely match the terms of the swap. The interest rate swaps are typically used to manage interest rate duration of certain fixed maturity securities or debt instruments issued.
Cash Flow Hedges
Interest rate swaps are predominantly used to manage portfolio duration and better match cash receipts from assets with cash disbursements required to fund liabilities. These derivatives primarily convert interest receipts on variable-rate fixed maturity securities to fixed rates. The Company has also entered into interest rate swaps to convert the variable interest payments on 3 month LIBOR + 2.125% junior subordinated debt to fixed interest payments. For further information, see the Junior Subordinated Debentures section within Note 14 - Debt.
Foreign currency swaps are used to convert foreign currency-denominated cash flows related to certain investment receipts to U.S. dollars in order to reduce cash flow fluctuations due to changes in currency rates.
The Company also previously entered into forward starting swap agreements to hedge the interest rate exposure related to the future purchase of fixed-rate securities, primarily to hedge interest rate risk inherent in the assumptions used to price certain group benefits liabilities.
NON-QUALIFYING STRATEGIES
Derivative relationships that do not qualify for hedge accounting (“non-qualifying strategies”) primarily include hedges of interest rate, foreign currency and equity risk of certain fixed maturities and equities. In addition, hedging and replication strategies that utilize credit default swaps do not qualify for hedge accounting. The non-qualifying strategies include:
Credit Contracts
Credit default swaps are used to purchase credit protection on an individual entity or referenced index to economically hedge against default risk and credit-related changes in the value of
fixed maturity securities. Credit default swaps are also used to assume credit risk related to an individual entity or referenced index as a part of replication transactions. These contracts require the Company to pay or receive a periodic fee in exchange for compensation from the counterparty or the Company should the referenced security issuers experience a credit event, as defined in the contract. The Company also enters into credit default swaps to terminate existing credit default swaps, thereby offsetting the changes in value of the original swap going forward.
Interest Rate Swaps, Swaptions and Futures
The Company uses interest rate swaps and futures to manage interest rate duration between assets and liabilities. In addition, the Company enters into interest rate swaps to terminate existing swaps, thereby offsetting the changes in value of the original swap going forward. As of December 31, 2021 and December 31, 2020, the notional amount of interest rate swaps in offsetting relationships was $7.2 billion and $7.6 billion, respectively.
Foreign Currency Swaps and Forwards
The Company enters into foreign currency swaps to convert the foreign currency exposures of certain foreign currency-denominated fixed maturity investments to U.S. dollars.
Equity Index Options
The Company has previously entered into equity index options to hedge the impact of a decline in the equity markets on the investment portfolio. The Company has also entered into covered call options on equity securities to generate additional return.
DERIVATIVE BALANCE SHEET CLASSIFICATION
For reporting purposes, the Company has elected to offset within assets or liabilities based upon the net of the fair value amounts, income accruals, and related cash collateral receivables and payables of OTC derivative instruments executed in a legal entity and with the same counterparty under a master netting agreement, which provides the Company with the legal right of offset. The following fair value amounts do not include income accruals or related cash collateral receivables and payables, which are netted with derivative fair value amounts to determine balance sheet presentation. The Company’s derivative instruments are held for risk management purposes, unless otherwise noted in the following table. The notional amount of derivative contracts represents the basis upon which pay or receive amounts are calculated and is presented in the table to quantify the volume of the Company’s derivative activity. Notional amounts are not necessarily reflective of credit risk.
164
|
| Note 7 - Derivatives | ||||||||
THE HARTFORD FINANCIAL SERVICES GROUP, INC.
NOTES TO CONSOLIDATED FINANCIAL STATEMENTS (continued)
Derivative Balance Sheet Presentation
| Net Derivatives | Asset Derivatives | Liability Derivatives | ||||||||||||||||||||||||
| Notional Amount | Fair Value | Fair Value | Fair Value | |||||||||||||||||||||||
| Hedge Designation/ Derivative Type | Dec 31, 2021 | Dec 31, 2020 | Dec 31, 2021 | Dec 31, 2020 | Dec 31, 2021 | Dec 31, 2020 | Dec 31, 2021 | Dec 31, 2020 | ||||||||||||||||||
| Cash flow hedges | ||||||||||||||||||||||||||
| Interest rate swaps | $ | 2,340 | $ | 2,340 | $ | — | $ | — | $ | — | $ | — | $ | — | $ | — | ||||||||||
| Foreign currency swaps | 437 | 286 | 6 | (13) | 11 | 3 | (5) | (16) | ||||||||||||||||||
| Total cash flow hedges | 2,777 | 2,626 | 6 | (13) | 11 | 3 | (5) | (16) | ||||||||||||||||||
| Non-qualifying strategies | ||||||||||||||||||||||||||
| Interest rate contracts | ||||||||||||||||||||||||||
| Interest rate swaps and futures | 7,567 | 8,335 | (46) | (69) | 3 | 4 | (49) | (73) | ||||||||||||||||||
| Foreign exchange contracts | ||||||||||||||||||||||||||
| Foreign currency swaps and forwards | 558 | 269 | — | — | — | — | — | — | ||||||||||||||||||
| Credit contracts | ||||||||||||||||||||||||||
| Credit derivatives that purchase credit protection | 112 | 6 | (2) | — | — | — | (2) | — | ||||||||||||||||||
| Credit derivatives that assume credit risk [1] | — | 675 | — | 21 | — | 21 | — | — | ||||||||||||||||||
| Credit derivatives in offsetting positions | 210 | 218 | — | — | 3 | 5 | (3) | (5) | ||||||||||||||||||
| Total non-qualifying strategies | 8,447 | 9,503 | (48) | (48) | 6 | 30 | (54) | (78) | ||||||||||||||||||
| Total cash flow hedges and non-qualifying strategies | $ | 11,224 | $ | 12,129 | $ | (42) | $ | (61) | $ | 17 | $ | 33 | $ | (59) | $ | (94) | ||||||||||
| Balance Sheet Location | ||||||||||||||||||||||||||
| Fixed maturities, available-for-sale | $ | 413 | $ | 269 | $ | — | $ | — | $ | — | $ | — | $ | — | $ | — | ||||||||||
| Other investments | 1,452 | 9,585 | 7 | 23 | 10 | 25 | (3) | (2) | ||||||||||||||||||
| Other liabilities | 9,359 | 2,275 | (49) | (84) | 7 | 8 | (56) | (92) | ||||||||||||||||||
| Total derivatives | $ | 11,224 | $ | 12,129 | $ | (42) | $ | (61) | $ | 17 | $ | 33 | $ | (59) | $ | (94) | ||||||||||
[1]The derivative instruments related to this strategy are held for other investment purposes.
Offsetting of Derivative Assets/Liabilities
The following tables present the gross fair value amounts, the amounts offset, and net position of derivative instruments eligible for offset in the Company's Consolidated Balance Sheets. Amounts offset include fair value amounts, income accruals and related cash collateral receivables and payables associated with derivative instruments that are traded under a common master netting agreement, as described in the preceding discussion. Also included in the tables are financial collateral receivables and payables, which are contractually permitted to be offset upon an event of default, although are disallowed for offsetting under U.S. GAAP.
165
|
| Note 7 - Derivatives | ||||||||
THE HARTFORD FINANCIAL SERVICES GROUP, INC.
NOTES TO CONSOLIDATED FINANCIAL STATEMENTS (continued)
Offsetting Derivative Assets and Liabilities
| (i) | (ii) | (iii) = (i) - (ii) | (iv) | (v) = (iii) - (iv) | ||||||||||||||||
| Net Amounts Presented in the Statement of Financial Position | Collateral Disallowed for Offset in the Statement of Financial Position | |||||||||||||||||||
| Gross Amounts of Recognized Assets (Liabilities) | Gross Amounts Offset in the Statement of Financial Position | Derivative Assets [1] (Liabilities) [2] | Accrued Interest and Cash Collateral (Received) [3] Pledged [2] | Financial Collateral (Received) Pledged [4] | Net Amount | |||||||||||||||
| As of December 31, 2021 | ||||||||||||||||||||
| Other investments | $ | 17 | $ | 13 | $ | 7 | $ | (3) | $ | 4 | $ | — | ||||||||
| Other liabilities | $ | (59) | $ | (10) | $ | (49) | $ | — | $ | (47) | $ | (2) | ||||||||
| As of December 31, 2020 | ||||||||||||||||||||
| Other investments | $ | 33 | $ | 31 | $ | 23 | $ | (21) | $ | 1 | $ | 1 | ||||||||
| Other liabilities | $ | (94) | $ | (6) | $ | (84) | $ | (4) | $ | (83) | $ | (5) | ||||||||
[1]Included in other investments in the Company's Consolidated Balance Sheets.
[2]Included in other liabilities in the Company's Consolidated Balance Sheets and is limited to the net derivative payable associated with each counterparty.
[3]Included in other investments in the Company's Consolidated Balance Sheets and is limited to the net derivative receivable associated with each counterparty.
[4]Excludes collateral associated with exchange-traded derivative instruments.
CASH FLOW HEDGES
For derivative instruments that are designated and qualify as cash flow hedges, the gain or loss on the derivative is reported as a component of OCI and reclassified into earnings in the
same period or periods during which the hedged transaction affects earnings. All components of each derivative’s gain or loss were included in the assessment of hedge effectiveness.
| Gain (Loss) Recognized in OCI | |||||||||||
| Year Ended December 31, | |||||||||||
| 2021 | 2020 | 2019 | |||||||||
| Interest rate swaps | $ | 4 | $ | 38 | $ | 18 | |||||
| Foreign currency swaps | 24 | (8) | 8 | ||||||||
| Total | $ | 28 | $ | 30 | $ | 26 | |||||
| Gain (Loss) Reclassified from AOCI into Income | |||||||||||||||||||||||||||||||||||
| Year Ended December 31, | |||||||||||||||||||||||||||||||||||
| 2021 | 2020 | 2019 | |||||||||||||||||||||||||||||||||
| Net Realized Gain/(Loss) | Net Investment Income | Interest Expense | Net Realized Gain/(Loss) | Net Investment Income | Interest Expense | Net Realized Gain/(Loss) | Net Investment Income | Interest Expense | |||||||||||||||||||||||||||
| Interest rate swaps | $ | — | $ | 41 | $ | (10) | $ | — | $ | 29 | $ | (7) | $ | 2 | $ | 4 | $ | 1 | |||||||||||||||||
| Foreign currency swaps | — | 5 | — | (1) | 5 | — | — | 3 | — | ||||||||||||||||||||||||||
| Total | $ | — | $ | 46 | $ | (10) | $ | (1) | $ | 34 | $ | (7) | $ | 2 | $ | 7 | $ | 1 | |||||||||||||||||
| Total amounts presented on the Consolidated Statement of Operations | $ | 509 | $ | 2,313 | $ | 234 | $ | (14) | $ | 1,846 | $ | 236 | $ | 395 | $ | 1,951 | $ | 259 | |||||||||||||||||
As of December 31, 2021, the before tax deferred net gains on derivative instruments recorded in AOCI that are expected to be reclassified to earnings during the next twelve months are $25. This expectation is based on the anticipated interest payments on hedged investments in fixed maturity securities and long-term debt that will occur over the next twelve months. At that time, the Company will recognize the deferred net gains (losses) as an
adjustment to net investment income or interest expense, as applicable, over the term of the hedged instrument cash flows.
During the years ended December 31, 2021, 2020, and 2019, the Company had no net reclassifications from AOCI to earnings resulting from the discontinuance of cash-flow hedges due to forecasted transactions that were no longer probable of occurring.
166
|
| Note 7 - Derivatives | ||||||||
THE HARTFORD FINANCIAL SERVICES GROUP, INC.
NOTES TO CONSOLIDATED FINANCIAL STATEMENTS (continued)
NON-QUALIFYING STRATEGIES
For non-qualifying strategies, including embedded derivatives that are required to be bifurcated from their host contracts and
accounted for as derivatives, the gain or loss on the derivative is recognized currently in earnings within net realized gains (losses).
Non-Qualifying Strategies Recognized within Net Realized Gains (Losses)
| For the Year Ended December 31, | |||||||||||
| 2021 | 2020 | 2019 | |||||||||
| Interest rate contracts | |||||||||||
| Interest rate swaps, swaptions and futures | $ | 3 | $ | 21 | $ | (35) | |||||
| Credit contracts | |||||||||||
| Credit derivatives that purchase credit protection | — | 2 | (5) | ||||||||
| Credit derivatives that assume credit risk | 7 | 2 | 32 | ||||||||
| Equity contracts | |||||||||||
| Equity options | — | 76 | (17) | ||||||||
| Foreign exchange contracts | |||||||||||
| Foreign currency swaps and forwards | 2 | 3 | 1 | ||||||||
| Total | $ | 12 | $ | 104 | $ | (24) | |||||
Credit Risk Assumed through Credit Derivatives
The Company enters into credit default swaps that assume credit risk of a single entity or referenced index in order to synthetically replicate investment transactions that are permissible under the Company's investment policies. The Company will receive periodic payments based on an agreed upon rate and notional amount and will only make a payment if there is a credit event. A credit event payment will typically be equal to the notional value of the swap contract less the value of the referenced security issuer’s debt obligation after the
occurrence of the credit event. A credit event is generally defined as a default on contractually obligated interest or principal payments or bankruptcy of the referenced entity. The credit default swaps in which the Company assumes credit risk primarily reference investment grade single corporate issuers and baskets, which include standard diversified portfolios of corporate and CMBS issuers. The diversified portfolios of corporate issuers are established within sector concentration limits and may be divided into tranches that possess different credit ratings.
167
|
| Note 7 - Derivatives | ||||||||
THE HARTFORD FINANCIAL SERVICES GROUP, INC.
NOTES TO CONSOLIDATED FINANCIAL STATEMENTS (continued)
Credit Risk Assumed Derivatives by Type
| Underlying Referenced Credit Obligation(s) [1] | ||||||||||||||||||||||||||
| Notional Amount [2] | Fair Value | Weighted Average Years to Maturity | Type | Average Credit Rating | Offsetting Notional Amount [3] | Offsetting Fair Value [3] | ||||||||||||||||||||
| As of December 31, 2021 | ||||||||||||||||||||||||||
| Basket credit default swaps [4] | ||||||||||||||||||||||||||
| Investment grade risk exposure | $ | 101 | $ | — | 6 years | CMBS Credit | AAA | $ | 101 | $ | — | |||||||||||||||
| Below investment grade risk exposure | 4 | (2) | Less than 1 year | CMBS Credit | CCC | 4 | 2 | |||||||||||||||||||
| Total | $ | 105 | $ | (2) | $ | 105 | $ | 2 | ||||||||||||||||||
| As of December 31, 2020 | ||||||||||||||||||||||||||
| Single name credit default swaps | ||||||||||||||||||||||||||
| Investment grade risk exposure | $ | 175 | $ | 9 | 5 years | Corporate Credit | A- | $ | — | $ | — | |||||||||||||||
| Basket credit default swaps [4] | ||||||||||||||||||||||||||
| Investment grade risk exposure | 500 | 12 | 5 years | Corporate Credit | BBB+ | — | — | |||||||||||||||||||
| Investment grade risk exposure | 100 | 1 | 8 years | CMBS Credit | AAA | 100 | (1) | |||||||||||||||||||
| Below investment grade risk exposure | 9 | (4) | Less than 1 year | CMBS Credit | CCC+ | 9 | 4 | |||||||||||||||||||
| Total | $ | 784 | $ | 18 | $ | 109 | $ | 3 | ||||||||||||||||||
[1]The average credit ratings are based on availability and are generally the midpoint of the available ratings among Moody’s, S&P, and Fitch. If no rating is available from a rating agency, then an internally developed rating is used.
[2]Notional amount is equal to the maximum potential future loss amount. These derivatives are governed by agreements and applicable law which include collateral posting requirements. There is no additional specific collateral related to these contracts or recourse provisions included in the contracts to offset losses.
[3]The Company has entered into offsetting credit default swaps to terminate certain existing credit default swaps, thereby offsetting the future changes in value of, or losses paid related to, the original swap.
[4]Comprised of swaps of standard market indices of diversified portfolios of corporate and CMBS issuers referenced through credit default swaps. These swaps are subsequently valued based upon the observable standard market index.
DERIVATIVE COLLATERAL ARRANGEMENTS
The Company enters into various collateral arrangements in connection with its derivative instruments, which require both the pledging and accepting of collateral. As of December 31, 2021 and 2020, the Company has pledged cash collateral associated with derivative instruments of $2 and $0, respectively. In general, collateral receivable is recorded in other assets or other liabilities on the Company's Consolidated Balance Sheets as determined by the Company's election to offset on the balance sheet. As of December 31, 2021 and 2020, the Company pledged securities collateral associated with derivative instruments with a fair value of $48 and $90, respectively, which have been included in fixed maturities on the Consolidated Balance Sheets. The counterparties have the right to sell or re-pledge these securities.
In addition, as of December 31, 2021 and 2020 , the Company has pledged initial margin of cash related to OTC-cleared and exchange traded derivatives with a fair value of $12 and $21, respectively, which is recorded in other investments or other assets on the Company's Consolidated Balance Sheets. As of
December 31, 2021 and 2020, the Company has pledged initial margin of securities related to OTC-cleared and exchange traded derivatives with a fair value of $82 and $62, respectively, which are included within fixed maturities on the Company's Consolidated Balance Sheets.
As of December 31, 2021 and 2020, the Company accepted cash collateral associated with derivative instruments of $7 and $24, respectively, which was invested and recorded in the Consolidated Balance Sheets in fixed maturities and short-term investments with corresponding amounts recorded in other investments or other liabilities as determined by the Company's election to offset on the balance sheet. The Company also accepted securities collateral as of December 31, 2021 and 2020 with a fair value of $5 and $1, respectively, which the Company has the right to repledge or sell. As of December 31, 2021 and 2020, the Company had no repledged securities. In addition, as of December 31, 2021 and 2020, non-cash collateral accepted was held in separate custodial accounts and was not included in the Company’s Consolidated Balance Sheets.
168
|
| Note 8 - Premiums Receivable and Agents' Balances | ||||||||
THE HARTFORD FINANCIAL SERVICES GROUP, INC.
NOTES TO CONSOLIDATED FINANCIAL STATEMENTS (continued)
8. PREMIUMS RECEIVABLE AND AGENTS' BALANCES
| Premiums Receivable and Agents' Balances | ||||||||
| As of December 31, | ||||||||
| 2021 | 2020 | |||||||
| Premiums receivable, excluding receivables for losses within a deductible and retrospectively-rated policy premiums ("loss sensitive business") | $ | 4,130 | $ | 3,851 | ||||
| Receivables for loss sensitive business, by credit quality: | ||||||||
| AAA | — | — | ||||||
| AA | 130 | 142 | ||||||
| A | 52 | 62 | ||||||
| BBB | 133 | 185 | ||||||
| BB | 64 | 115 | ||||||
| Below BB | 41 | 65 | ||||||
| Total receivables for loss sensitive business | 420 | 569 | ||||||
| Total Premiums Receivable and Agents' Balances, Gross | 4,550 | 4,420 | ||||||
| ACL | (105) | (152) | ||||||
| Total Premiums Receivable and Agents' Balances, Net of ACL | $ | 4,445 | $ | 4,268 | ||||
ACL on Premiums Receivable and Agents' Balances
Premiums receivable and agents' balances, excluding receivables for loss sensitive business, are primarily comprised of premiums due from policyholders, which are typically collectible within one year or less. For these balances, the ACL is estimated based on an aging of receivables and recent historical credit loss and collection experience, adjusted for current economic conditions and reasonable and supportable forecasts, when appropriate. Balances are considered past due when amounts that have been billed are not collected within contractually stipulated time periods. The Company had an immaterial amount of receivables with a due date of more than one year that are past-due.
A portion of the Company's Commercial Lines business is written with large deductibles or under retrospectively-rated plans (referred to as "loss sensitive business"). Under some commercial insurance contracts with a large deductible, the Company is obligated to pay the claimant the full amount of the claim and the Company is subsequently reimbursed by the policyholder for the deductible amount. As such, the Company is subject to credit risk until reimbursement is made. Retrospectively-rated policies are utilized primarily for workers' compensation coverage, whereby the ultimate premium is adjusted based on actual losses incurred. Although the premium adjustment feature of a retrospectively-rated policy substantially reduces insurance risk for the Company, it presents credit risk to the Company. The Company’s results of operations could be adversely affected if a significant portion of such policyholders
failed to reimburse the Company for the deductible amount or the amount of additional premium owed under retrospectively-rated policies. The Company manages these credit risks through credit analysis, collateral requirements, and oversight.
The ACL for receivables for loss sensitive business is estimated as the amount of the receivable exposed to loss multiplied by estimated factors for probability of default and the amount of loss given a default. The probability of default is assigned based on each policyholder's credit rating, or a rating is estimated if no external rating is available. Credit ratings are reviewed and updated at least annually. The exposure amount is estimated net of collateral and other credit enhancement, considering the nature of the collateral, potential future changes in collateral values, and historical loss information for the type of collateral obtained. The probability of default factors are historical corporate defaults for receivables with similar durations estimated through multiple economic cycles. Credit ratings are forward-looking and consider a variety of economic outcomes. The loss given default factors are based on a study of historical recovery rates for general creditors through multiple economic cycles. The Company's evaluation of the required ACL for receivables for loss sensitive business considers the current economic environment as well as the probability-weighted macroeconomic scenarios similar to the approach used for estimating the ACL for mortgage loans. See Note 6 - Investments.
During 2021, the ACL on premiums receivable decreased as the provision required on premiums written during the year was more than offset by write-offs and a reduction in the provision, primarily reflecting lessening expected impacts of COVID-19 relative to prior assumptions in certain lines of business. In 2020, an increase in the ACL was due to the increasing impacts of COVID-19.
169
|
| Note 8 - Premiums Receivable and Agents' Balances | ||||||||
THE HARTFORD FINANCIAL SERVICES GROUP, INC.
NOTES TO CONSOLIDATED FINANCIAL STATEMENTS (continued)
| Rollforward of ACL on Premiums Receivable and Agents' Balances for the Year Ended | |||||||||||||||||||||||
| December 31, 2021 | December 31, 2020 | ||||||||||||||||||||||
| Premiums Receivable and Agents' Balances, Excluding Receivables for Loss Sensitive Business | Receivables for Loss Sensitive Business | Total | Premiums Receivable and Agents' Balances, Excluding Receivables for Loss Sensitive Business | Receivables for Loss Sensitive Business | Total | ||||||||||||||||||
| Beginning ACL | $ | 117 | $ | 35 | $ | 152 | $ | 85 | $ | 60 | $ | 145 | |||||||||||
| Cumulative effect of accounting change [1] | (2) | (21) | (23) | ||||||||||||||||||||
| Adjusted beginning ACL | 117 | 35 | 152 | 83 | 39 | 122 | |||||||||||||||||
| Current period provision (release) | 17 | (13) | 4 | 78 | (4) | 74 | |||||||||||||||||
| Current period gross write-offs | (59) | — | (59) | (49) | — | (49) | |||||||||||||||||
| Current period gross recoveries | 8 | — | 8 | 5 | — | 5 | |||||||||||||||||
| Ending ACL | $ | 83 | $ | 22 | $ | 105 | $ | 117 | $ | 35 | $ | 152 | |||||||||||
[1]Represents the adjustment to the ACL recorded on adoption of accounting guidance for credit losses on January 1, 2020. The adjusted beginning ACL was based on the Company's historical loss information adjusted for current conditions and the forecasted economic environment at the time the guidance was adopted. For further information refer to Note 1 - Basis of Presentation and Significant Accounting Policies.
9. REINSURANCE
The Company cedes insurance risk to reinsurers to enable the Company to manage capital and risk exposure. Such arrangements do not relieve the Company of its primary liability to policyholders. Failure of reinsurers to honor their obligations could result in losses to the Company. The Company's procedures include carefully selecting its reinsurers, structuring agreements to provide collateral funds where necessary, and regularly monitoring the financial condition and ratings of its reinsurers.
The Company has two adverse development cover (“ADC”) reinsurance agreements in place, both of which are accounted for as retroactive reinsurance. One agreement covers substantially all asbestos and environmental ("A&E") reserve development for 2016 and prior accident years ("A&E ADC") up to an aggregate limit of $1.5 billion and the other covered substantially all reserve development of Navigators Insurance Company and certain of its affiliates for 2018 and prior accident years (the Navigators ADC) up to an aggregate limit of $300. As the Company has ceded all of the $300 available limit, there is 0 remaining limit available as of December 31, 2021 under the Navigators ADC. For more information on ADC agreements, see Note 1 -Basis of Presentation and Significant Accounting Policies, and Note 12 -Reserve for Unpaid Losses and Loss Adjustment Expenses.
Property and Casualty ceded losses, which reduce losses and loss adjustment expenses incurred, were $1,243, $1,156 and
$826 for the years ended December 31, 2021, 2020 and 2019, respectively.
Group Benefits ceded losses, which reduce losses and loss adjustment expenses incurred, were $85, $63 and $73 for the years ended December 31, 2021, 2020 and 2019, respectively.
Reinsurance Recoverables
Reinsurance recoverables include balances due from reinsurance companies and are presented net of an allowance for uncollectible reinsurance. Reinsurance recoverables include an estimate of the amount of gross losses and loss adjustment expense reserves that may be ceded under the terms of the reinsurance agreements, including incurred but not reported unpaid losses. The Company’s estimate of losses and loss adjustment expense reserves ceded to reinsurers is based on assumptions that are consistent with those used in establishing the gross reserves for amounts the Company owes to its claimants. The Company estimates its ceded reinsurance recoverables based on the terms of any applicable facultative and treaty reinsurance, including an estimate of how incurred but not reported losses will ultimately be ceded under reinsurance agreements. Accordingly, the Company’s estimate of reinsurance recoverables is subject to similar risks and uncertainties as the estimate of the gross reserve for unpaid losses and loss adjustment expenses.
170
|
| Note 9 - Reinsurance | ||||||||
THE HARTFORD FINANCIAL SERVICES GROUP, INC.
NOTES TO CONSOLIDATED FINANCIAL STATEMENTS (continued)
| Reinsurance Recoverables by Credit Quality Indicator | |||||||||||||||||||||||||||||
| As of December 31, 2021 | As of December 31, 2020 | ||||||||||||||||||||||||||||
| Property and Casualty | Group Benefits | Corporate | Total | Property and Casualty | Group Benefits | Corporate | Total | ||||||||||||||||||||||
| AM Best Financial Strength Rating | |||||||||||||||||||||||||||||
| A++ | $ | 1,860 | $ | — | $ | — | $ | 1,860 | $ | 1,598 | $ | — | $ | — | $ | 1,598 | |||||||||||||
| A+ | 1,999 | 237 | 275 | 2,511 | 1,788 | 230 | 305 | 2,323 | |||||||||||||||||||||
| A | 713 | — | — | 713 | 638 | — | — | 638 | |||||||||||||||||||||
| A- | 37 | 9 | — | 46 | 37 | 9 | — | 46 | |||||||||||||||||||||
| B++ | 639 | — | 3 | 642 | 666 | — | 3 | 669 | |||||||||||||||||||||
| Below B++ | 20 | — | — | 20 | 21 | 1 | — | 22 | |||||||||||||||||||||
| Total Rated by AM Best | 5,268 | 246 | 278 | 5,792 | 4,748 | 240 | 308 | 5,296 | |||||||||||||||||||||
| Mandatory (Assigned) and Voluntary Risk Pools | 239 | — | — | 239 | 259 | — | — | 259 | |||||||||||||||||||||
| Captives | 331 | — | — | 331 | 305 | — | — | 305 | |||||||||||||||||||||
| Other not rated companies | 255 | 5 | — | 260 | 254 | 5 | — | 259 | |||||||||||||||||||||
| Gross Reinsurance Recoverables | 6,093 | 251 | 278 | 6,622 | 5,566 | 245 | 308 | 6,119 | |||||||||||||||||||||
| Allowance for uncollectible reinsurance | (96) | (1) | (2) | (99) | (105) | (1) | (2) | (108) | |||||||||||||||||||||
| Net Reinsurance Recoverables | $ | 5,997 | $ | 250 | $ | 276 | $ | 6,523 | $ | 5,461 | $ | 244 | $ | 306 | $ | 6,011 | |||||||||||||
Balances are considered past due when amounts that have been billed are not collected within contractually stipulated time periods, generally 30, 60 or 90 days. To manage reinsurer credit risk, a reinsurance security review committee evaluates the credit standing, financial performance, management and operational quality of each potential reinsurer. In placing reinsurance, the Company considers the nature of the risk reinsured, including the expected liability payout duration, and establishes limits tiered by reinsurer credit rating.
Where its contracts permit, the Company secures future claim obligations with various forms of collateral or other credit enhancement, including irrevocable letters of credit, secured trusts, funds held accounts and group wide offsets. As part of its reinsurance recoverable review, the Company analyzes recent developments in commutation activity between reinsurers and cedants, recent trends in arbitration and litigation outcomes in disputes between cedants and reinsurers and the overall credit quality of the Company’s reinsurers.
Due to the inherent uncertainties as to collection and the length of time before reinsurance recoverables become due, it is possible that future adjustments to the Company’s reinsurance recoverables, net of the allowance, could be required, which could have a material adverse effect on the Company’s consolidated results of operations or cash flows in a particular quarter or annual period.
The allowance for uncollectible reinsurance comprises an ACL and an allowance for disputed balances. The ACL is estimated as the amount of reinsurance recoverables exposed to loss multiplied by estimated factors for the probability of default and the amount of loss given a default. The probability of default is assigned based on each reinsurer's credit rating, or a rating is estimated if no external rating is available. Credit ratings are reviewed on a quarterly basis and any significant changes are reflected in an updated estimate. The probability of default
factors are historical insurer and reinsurer defaults for liabilities with similar durations to the reinsured liabilities as estimated through multiple economic cycles. Credit ratings are forward-looking and consider a variety of economic outcomes. The loss given default factors are based on a study of historical recovery rates for general creditors of corporations through multiple economic cycles or, in the case of purchased annuities funding structured settlements accounted for as reinsurance, historical recovery rates for annuity contract holders.
As shown in the table above, a portion of the total gross reinsurance recoverable balance relates to the Company’s participation in various mandatory (assigned) and voluntary risk pools. Reinsurance recoverables due from pools are backed by the financial position of all insurance companies participating in the pools and the credit backing the reinsurance recoverable is not limited to the financial strength of each pool. The mandatory pools generally are funded through policy assessments or surcharges and if any participant in the pool defaults, remaining liabilities are apportioned among the other members.
The Company's evaluation of the required ACL for reinsurance recoverables considers the current economic environment as well as macroeconomic scenarios similar to the approach used to estimate the ACL for mortgage loans. See Note 6 - Investments. Insurance companies, including reinsurers, are regulated and hold risk-based capital to mitigate the risk of loss due to economic factors and other risks. Non-U.S. reinsurers are either subject to a capital regime substantively equivalent to domestic insurers or we hold collateral to support collection of reinsurance recoverables. As a result, there is limited history of losses from insurer defaults. There were $1 in write-offs for the period ended December 31, 2021 that would impact the ACL. The decrease in the ACL in 2021 was primarily due to a higher-than-expected recovery from one reinsurer on which the Company had recognized an ACL. In 2020, the increase in the ACL includes the increasing impacts of COVID-19.
171
|
| Note 9 - Reinsurance | ||||||||
THE HARTFORD FINANCIAL SERVICES GROUP, INC.
NOTES TO CONSOLIDATED FINANCIAL STATEMENTS (continued)
| Allowance for Uncollectible Reinsurance | |||||||||||||||||||||||||||||
| As of December 31, 2021 | As of December 31, 2020 | ||||||||||||||||||||||||||||
| Property and Casualty | Group Benefits | Corporate | Total | Property and Casualty | Group Benefits | Corporate | Total | ||||||||||||||||||||||
| Beginning allowance for uncollectible reinsurance | $ | 105 | $ | 1 | $ | 2 | $ | 108 | $ | 114 | $ | — | $ | — | $ | 114 | |||||||||||||
| Beginning allowance for disputed amounts | 53 | — | — | 53 | 66 | — | — | 66 | |||||||||||||||||||||
| Beginning ACL | 52 | 1 | 2 | 55 | 48 | — | — | 48 | |||||||||||||||||||||
| Cumulative effect of accounting change [1] | — | 1 | 1 | 2 | |||||||||||||||||||||||||
| Adjusted beginning ACL | 52 | 1 | 2 | 55 | 48 | 1 | 1 | 50 | |||||||||||||||||||||
| Current period provision (release) | (9) | — | — | (9) | 3 | — | 1 | 4 | |||||||||||||||||||||
| Current period gross write-offs | (1) | — | — | (1) | — | — | — | — | |||||||||||||||||||||
| Current period gross recoveries | — | — | — | — | 1 | — | — | 1 | |||||||||||||||||||||
| Ending ACL | 42 | 1 | 2 | 45 | 52 | 1 | 2 | 55 | |||||||||||||||||||||
| Ending allowance for disputed amounts | 54 | — | — | 54 | 53 | — | — | 53 | |||||||||||||||||||||
| Ending allowance for uncollectible reinsurance | $ | 96 | $ | 1 | $ | 2 | $ | 99 | $ | 105 | $ | 1 | $ | 2 | $ | 108 | |||||||||||||
[1]Represents the adjustment to the ACL recorded on adoption of accounting guidance for credit losses on January 1, 2020. For further information refer to Note 1 - Basis of Presentation and Significant Accounting Policies
Insurance Revenues
Property and Casualty Insurance Revenue
| For the years ended December 31, | ||||||||||||||
| Premiums Written | 2021 | 2020 | 2019 | |||||||||||
| Direct | $ | 13,696 | $ | 12,537 | $ | 12,190 | ||||||||
| Assumed | 631 | 577 | 371 | |||||||||||
| Ceded | (1,378) | (1,209) | (978) | |||||||||||
| Net | $ | 12,949 | $ | 11,905 | $ | 11,583 | ||||||||
| Premiums Earned | ||||||||||||||
| Direct | $ | 13,204 | $ | 12,551 | $ | 12,010 | ||||||||
| Assumed | 568 | 540 | 416 | |||||||||||
| Ceded | (1,277) | (1,173) | (936) | |||||||||||
| Net | $ | 12,495 | $ | 11,918 | $ | 11,490 | ||||||||
Group Benefits Revenue
| For the years ended December 31, | |||||||||||
| 2021 | 2020 | 2019 | |||||||||
| Gross earned premiums, fees and other considerations | $ | 5,663 | $ | 5,245 | $ | 4,122 | |||||
| Reinsurance assumed | 128 | 387 | 1,572 | ||||||||
| Reinsurance ceded | (104) | (96) | (91) | ||||||||
| Net earned premiums, fees and other considerations | $ | 5,687 | $ | 5,536 | $ | 5,603 | |||||
For its group benefits products, the Company reinsures certain of its risks to other reinsurers under yearly renewable term and coinsurance arrangements and variations thereto. Yearly renewable term and coinsurance arrangements result in passing
a portion of the risk to the reinsurer. Generally, the reinsurer receives a proportionate amount of the premiums less an allowance for commissions and expenses and is liable for a corresponding proportionate amount of all benefit payments.
172
|
| Note 10 - Deferred Policy Acquisition Costs | ||||||||
THE HARTFORD FINANCIAL SERVICES GROUP, INC.
NOTES TO CONSOLIDATED FINANCIAL STATEMENTS (continued)
10. DEFERRED POLICY ACQUISITION COSTS
Changes in DAC
| For the years ended December 31, | |||||||||||
| 2021 | 2020 | 2019 | |||||||||
| Balance, beginning of period | $ | 789 | $ | 785 | $ | 670 | |||||
| Deferred costs | 1,751 | 1,666 | 1,635 | ||||||||
| Amortization — DAC | (1,680) | (1,706) | (1,622) | ||||||||
| Add back amortization of value of business acquired [1] | 21 | 47 | 102 | ||||||||
| DAC transferred to assets held for sale | — | (3) | — | ||||||||
| Balance, end of period | $ | 881 | $ | 789 | $ | 785 | |||||
[1]While the value of in-force contracts acquired from the Navigators Group acquisition is included in other intangible assets, the amortization of that asset is recorded as DAC amortization.
11. GOODWILL & OTHER INTANGIBLE ASSETS
Goodwill Carrying Value as of December 31, 2021
| Commercial Lines | Personal Lines | Hartford Funds | Group Benefits | Corporate [1] | Total | |||||||||||||||
| Balance at December 31, 2019 | $ | 661 | $ | 119 | $ | 180 | $ | 723 | $ | 230 | $ | 1,913 | ||||||||
| Measurement period adjustments [2] | (2) | — | — | — | — | (2) | ||||||||||||||
| Balance at December 31, 2020 | $ | 659 | $ | 119 | $ | 180 | $ | 723 | $ | 230 | $ | 1,911 | ||||||||
| Measurement period adjustments [2] | — | — | — | — | — | — | ||||||||||||||
| Balance at December 31, 2021 | $ | 659 | $ | 119 | $ | 180 | $ | 723 | $ | 230 | $ | 1,911 | ||||||||
[1]The Corporate category includes goodwill that was acquired at a holding company level and not pushed down to a subsidiary within a reportable segment. Carrying value of goodwill within Corporate as of December 31, 2021, 2020, and 2019 includes $138 and $92 for the Group Benefits and Hartford Funds reporting units, respectively.
[2] For further discussion on goodwill related to the acquisition of Navigators Group, refer to Note 2 - Business Acquisitions .
The annual goodwill assessment for The Hartford's reporting units was completed as of October 31, 2021, 2020, and 2019, which resulted in no write-downs of goodwill in the respective
years then ended. In 2021, all reporting units passed their annual impairment test with a significant margin.
Other Intangible Assets
| As of December 31, 2021 | As of December 31, 2020 | ||||||||||||||||||||||
| Gross Carrying Amount | Accumulated Amortization | Net Carrying Amount | Gross Carrying Amount | Accumulated Amortization | Net Carrying Amount | ||||||||||||||||||
| Amortized Intangible Assets: | |||||||||||||||||||||||
| Value of in-force contracts | $ | 203 | $ | (194) | $ | 9 | $ | 203 | $ | (172) | $ | 31 | |||||||||||
| Customer relationships | 636 | (177) | 459 | 636 | (134) | 502 | |||||||||||||||||
| Marketing agreement with Aetna | 16 | (4) | 12 | 16 | (3) | 13 | |||||||||||||||||
| Distribution Agreement [1] | 79 | (68) | 11 | 79 | (65) | 14 | |||||||||||||||||
| Distribution and Agency relationships & Other | 340 | (68) | 272 | 340 | (45) | 295 | |||||||||||||||||
| Total Finite Life Intangibles | 1,274 | (511) | 763 | 1,274 | (419) | 855 | |||||||||||||||||
| Total Indefinite Life Intangible Assets | 95 | 95 | 95 | 95 | |||||||||||||||||||
| Total Other Intangible Assets | $ | 1,369 | $ | (511) | $ | 858 | $ | 1,369 | $ | (419) | $ | 950 | |||||||||||
[1]On May 28, 2020, the Company amended its distribution agreement to, among other changes in terms, extend the agreement. As a result of this extension in term, The Hartford reassessed the useful life of the distribution agreement to amortize over a remaining life of approximately 6.5 years.
173
|
| Note 11 - Goodwill & Other Intangible Assets | ||||||||
THE HARTFORD FINANCIAL SERVICES GROUP, INC.
NOTES TO CONSOLIDATED FINANCIAL STATEMENTS (continued)
Expected Before Tax Amortization Expense [1] for Acquired Intangibles as of December 31, 2021
| Value of In-force Contracts | Other Intangible Assets | |||||||
| 2022 | $ | 9 | $ | 70 | ||||
| 2023 | $ | — | $ | 70 | ||||
| 2024 | $ | — | $ | 70 | ||||
| 2025 | $ | — | $ | 70 | ||||
| 2026 | $ | — | $ | 70 | ||||
[1]In the Consolidated Statements of Operations, the amortization of value of in-force contracts is reported in amortization of deferred policy acquisition costs and the amortization of other intangible assets is reported in amortization of other intangible assets.
12. RESERVE FOR UNPAID LOSSES AND LOSS ADJUSTMENT EXPENSES
|PROPERTY & CASUALTY INSURANCE PRODUCT RESERVES, NET OF REINSURANCE
Rollforward of Liabilities for Unpaid Losses and Loss Adjustment Expenses
| For the years ended December 31, | |||||||||||
| 2021 | 2020 | 2019 | |||||||||
| Beginning liabilities for unpaid losses and loss adjustment expenses, gross | $ | 29,622 | $ | 28,261 | $ | 24,584 | |||||
| Reinsurance and other recoverables | 5,725 | 5,275 | 4,232 | ||||||||
| Beginning liabilities for unpaid losses and loss adjustment expenses, net | 23,897 | 22,986 | 20,352 | ||||||||
| Navigators Group acquisition | — | — | 2,001 | ||||||||
| Provision for unpaid losses and loss adjustment expenses | |||||||||||
| Current accident year | 7,911 | 7,794 | 7,463 | ||||||||
| Prior accident year development [1] | 199 | (136) | (65) | ||||||||
| Total provision for unpaid losses and loss adjustment expenses | 8,110 | 7,658 | 7,398 | ||||||||
| Change in deferred gain on retroactive reinsurance included in other liabilities [1] | (246) | (312) | (16) | ||||||||
| Payments | |||||||||||
| Current accident year | (2,276) | (2,214) | (2,374) | ||||||||
| Prior accident years | (4,119) | (4,190) | (4,374) | ||||||||
| Total payments | (6,395) | (6,404) | (6,748) | ||||||||
| Net change in reserves transferred to liabilities held for sale | — | (45) | — | ||||||||
| Foreign currency adjustment | 2 | 14 | (1) | ||||||||
| Ending liabilities for unpaid losses and loss adjustment expenses, net | 25,368 | 23,897 | 22,986 | ||||||||
| Reinsurance and other recoverables | 6,081 | 5,725 | 5,275 | ||||||||
| Ending liabilities for unpaid losses and loss adjustment expenses, gross | $ | 31,449 | $ | 29,622 | $ | 28,261 | |||||
[1]Prior accident year development does not include the benefit of a portion of losses ceded under the Navigators and A&E ADC which, under retroactive reinsurance accounting, is deferred and is recognized over the period the ceded losses are recovered in cash from NICO. For additional information regarding the two adverse development cover reinsurance agreements, refer to Adverse Development Covers discussion below.
174
|
| Note 12 - Reserves for Unpaid Loss and Loss Adjustment Expenses | ||||||||
THE HARTFORD FINANCIAL SERVICES GROUP, INC.
NOTES TO CONSOLIDATED FINANCIAL STATEMENTS (continued)
Property and Casualty Insurance Products Reserves, Net of Reinsurance, that are Discounted
| For the years ended December 31, | |||||||||||||||||||||||||||||
| 2021 | 2020 | 2019 | |||||||||||||||||||||||||||
| Liability for unpaid losses and loss adjustment expenses, at undiscounted amounts | $ | 1,405 | $ | 1,334 | $ | 1,331 | |||||||||||||||||||||||
| Amount of discount | 355 | 367 | 388 | ||||||||||||||||||||||||||
| Carrying value of liability for unpaid losses and loss adjustment expenses | $ | 1,050 | $ | 967 | $ | 943 | |||||||||||||||||||||||
| Discount accretion included in losses and loss adjustment expenses | $ | 36 | $ | 36 | $ | 33 | |||||||||||||||||||||||
| Weighted average discount rate | 2.54 | % | 2.68 | % | 2.91 | % | |||||||||||||||||||||||
| Range of discount rates | 0.83 | % | - | 14.03 | % | 0.83 | % | - | 14.03 | % | 1.76 | % | - | 14.03 | % | ||||||||||||||
Reserves are discounted at rates in effect at the time claims were incurred, ranging from 0.83% for accident year 2020 to 14.03% for accident year 1981.
The reserves recorded for the Company’s property and casualty insurance products at December 31, 2021 represent the Company’s best estimate of its ultimate liability for losses and loss adjustment expenses related to losses covered by policies written by the Company. However, because of the significant uncertainties surrounding reserves it is possible that management’s estimate of the ultimate liabilities for these claims may change and that the required adjustment to recorded reserves could exceed the currently recorded reserves by an amount that could be material to the Company’s results of operations or cash flows.
Losses and loss adjustment expenses are also impacted by trends including frequency and severity as well as changes in the legislative and regulatory environment. In the case of the reserves for asbestos exposures, factors contributing to the high degree of uncertainty in the ultimate settlement of the liabilities gross of reinsurance include inadequate loss development patterns, plaintiffs’ expanding theories of liability, the risks inherent in major litigation, and inconsistent emerging legal doctrines. In the case of the reserves for environmental exposures before reinsurance, factors contributing to the high degree of uncertainty in gross reserves include expanding theories of liabilities and damages, the risks inherent in major litigation, inconsistent decisions concerning the existence and scope of coverage for environmental claims, and uncertainty as to the monetary amount being sought by the claimant from the insured.
(Favorable) Unfavorable Prior Accident Year Development
| For the years ended December 31, | |||||||||||
| 2021 | 2020 | 2019 | |||||||||
| Workers’ compensation | $ | (190) | $ | (110) | $ | (120) | |||||
| Workers’ compensation discount accretion | 35 | 35 | 33 | ||||||||
| General liability | 454 | 237 | 61 | ||||||||
| Marine | 1 | 3 | 8 | ||||||||
| Package business | (91) | (58) | (47) | ||||||||
| Commercial property | (26) | (4) | (11) | ||||||||
| Professional liability | (2) | (14) | 29 | ||||||||
| Bond | (26) | (19) | (3) | ||||||||
| Assumed reinsurance | (6) | (6) | 3 | ||||||||
| Automobile liability - Commercial Lines | 9 | 27 | 27 | ||||||||
| Automobile liability - Personal Lines | (90) | (61) | (38) | ||||||||
| Homeowners | 3 | 7 | 3 | ||||||||
| Net asbestos and environmental reserves | — | (2) | — | ||||||||
| Catastrophes | (154) | (529) | (42) | ||||||||
| Uncollectible reinsurance | (6) | (8) | (30) | ||||||||
| Other reserve re-estimates, net | 42 | 54 | 46 | ||||||||
Prior accident year development, including full benefit for the ADC cession | (47) | (448) | (81) | ||||||||
| Change in deferred gain on retroactive reinsurance included in other liabilities [1] | 246 | 312 | 16 | ||||||||
| Total prior accident year development | $ | 199 | $ | (136) | $ | (65) | |||||
[1]The change in deferred gain for the years ended December 31, 2021 and 2020 included $155 and $210, respectively of adverse development on A&E reserves in excess of ceded premium paid and included $91 and $102, respectively, of adverse development on Navigators 2018 and prior accident year reserves, primarily within professional liability, general liability and marine.
2021 re-estimates of prior accident year reserves
Workers’ compensation reserves were decreased within small commercial and middle & large commercial for the
175
|
| Note 12 - Reserves for Unpaid Loss and Loss Adjustment Expenses | ||||||||
THE HARTFORD FINANCIAL SERVICES GROUP, INC.
NOTES TO CONSOLIDATED FINANCIAL STATEMENTS (continued)
2013 through 2018 accident years driven by lower than previously estimated claim severity.
General liability reserves were increased including an increase for sexual molestation and sexual abuse claims above the amount of reserves previously recorded for this exposure, primarily to reflect an increase in reserves for claims made against the Boy Scouts of America ("BSA") as discussed further below, partially offset by reserve decreases for other mass torts and extra contractual liability claims. In addition, the Company recognized reserve increases on Navigators’ wholesale construction business for 2018 and prior accident years, largely included within the change in deferred gain on retroactive reinsurance in the above table.
Package business reserves decreased largely due to lower estimated loss adjustment expenses for accident years 2014 to 2018 and a reduction in estimated reserves for extra contractual liability claims.
Commercial property reserves were decreased primarily due to favorable development for the 2020 accident year in both middle & large commercial and global specialty.
Professional liability reserves were decreased due to lower estimated severity in both large and middle market directors’ and officers’ (“D&O”) insurance for older accident years. More than offsetting this favorable reserve development were reserve increases on legacy Navigators public company directors’ and officers’ insurance for 2019 and prior accident years, a portion of which is reflected within the change in deferred gain on retroactive reinsurance in the above table.
Bond reserves were reduced mostly due to favorable emergence on contract surety claims driven by higher than previously anticipated recoveries, largely for the 2016 to 2017 accident years.
Automobile liability reserves were decreased in Personal Lines principally due to lower estimated severity on AARP Direct and Agency claims, primarily within accident years 2017 to 2020, and a reduction in estimated reserves for extra contractual liability claims.
Catastrophes reserves were decreased in both Commercial and Personal Lines primarily driven by a reduction in reserves for 2018 and 2019 wind and hail events, lower estimated losses from 2018 and 2020 hurricanes, a reduction in estimated losses from the 2017 and 2018 California wildfires, including an expected recovery of subrogation from a utility related to the 2018 Woolsey wildfire in California, and a reduction in losses relating to the 2020 civil unrest.
Asbestos and environmental reserves were reviewed in fourth quarter 2021 resulting in a $155 increase in reserves before ADC reinsurance, including $106 for asbestos and $49 for environmental. The Company recognized a $155 deferred gain on retroactive reinsurance, representing the amount of losses ceded to the ADC in excess of ceded premium paid. For additional information related to the adverse development cover with NICO, see the Adverse Development Covers section below and Note 15 - Commitments and Contingencies.
Other reserve re-estimates, net, were increased primarily due to an increase in reserves for sexual molestation and sexual abuse claims within P&C Other Operations, principally on assumed reinsurance, as well as an increase in unallocated loss adjustment expense ("ULAE") reserves within P&C Other Operations driven by an increase in gross asbestos and environmental reserves.
2020 re-estimates of prior accident year reserves
Workers’ compensation reserves were reduced on national account business within middle & large commercial, driven by lower than previously estimated claim severity for the 2015 and prior accident years, including on captives business, and were reduced in small commercial due to lower than expected claim severity for the 2013 to 2018 accident years.
General liability reserves were increased primarily due to a $254 increase in reserves for sexual molestation and sexual abuse claims related to cases brought against religious and other organizations that were insureds of the Company, partly offset by a decrease in reserves for other mass torts and extra contractual liability claims. The sexual molestation and sexual abuse exposures may involve potentially long latency periods and may implicate coverage in multiple policy periods, which can raise complex coverage issues with significant effects on the ultimate scope of coverage. This increase in reserves reflects an increase in claim incidence largely due to reviver statutes, which is legislation passed in a number of states that provides an opportunity for claimants to file claims for a period of time despite the fact that the original statute of limitations had expired. The reserve increase in 2020 was principally from claims asserted against the Boy Scouts of America (“Boy Scouts”).
In addition, general liability reserve increases on construction account business were largely offset by decreases in ULAE reserves. Reserves were increased for guaranteed cost construction business for accident years 2014 to 2019 as incurred losses are developing higher than previously expected for premises and operations claims and product liability claims, partly due to a change in industry mix and a heavier concentration of losses in California than initially assumed, as well as increased reserves for middle market and complex liability claims for accident year 2018 largely due to higher than expected severity. Also contributing were increases in reserves on primary layer construction account business within global specialty, mainly related to accident years 2015 to 2017, which is included as a component of the change in deferred gain under retroactive reinsurance in the above table.
Marine reserves were increased principally due to an increase in domestic marine liability, mostly in accident years 2017 and 2018 due to a higher number of large losses. The increase in marine reserves is included as a component of the change in deferred gain under retroactive reinsurance in the above table.
Package business reserves decreased for accident years 2014 to 2017 largely due to lower estimates of allocated loss adjustment expenses.
176
|
| Note 12 - Reserves for Unpaid Loss and Loss Adjustment Expenses | ||||||||
THE HARTFORD FINANCIAL SERVICES GROUP, INC.
NOTES TO CONSOLIDATED FINANCIAL STATEMENTS (continued)
Commercial property reserves were decreased for accident year 2019 due to favorable developments on marine and middle market property claims.
Professional liability reserves were decreased primarily due to lower estimated severity on non-security class action D&O claims and fewer than expected E&O claims with financial institutions for the 2011 to 2018 accident years, partially offset by an increase in D&O reserves for the 2019 accident year driven by higher frequency of class action lawsuits and an increase in large Syndicate D&O losses for the 2016 and 2017 accident years. These Syndicate reserve increases within global specialty are included as a component of the change in deferred gain under retroactive reinsurance in the above table.
Bond reserves were reduced within contract surety driven by both favorable loss development on the 2015 to 2017 accident years and higher than expected loss recoveries on older accident years
Assumed reinsurance reserves were increased for accident year 2018 mostly due to higher accident and health reserve estimates for medical professionals on assumed casualty business. These reserve increases are included as a component of the change in deferred gain under retroactive reinsurance in the above table.
Automobile liability reserves were decreased in Personal Lines principally due to lower than previously expected AARP Direct automobile liability claim severity for the 2017 to 2019 accident years. Automobile liability reserves were increased in Commercial Lines primarily due to higher than expected large losses within middle & large commercial, predominantly within the 2015 to 2019 accident years.
Catastrophes reserves were reduced, primarily due to a reduction in estimated reserves for 2017 and 2018 California wildfires and a reduction in estimated catastrophes for wind and hail events in the 2017 to 2019 accident years, partially offset by an increase in reserves for 2019 typhoons Hagibis and Faxai in Asia. The reduction in reserves for the 2017 and 2018 wildfires was largely due to recognizing a $289 subrogation benefit in the second quarter of 2020 from PG&E Corporation and Pacific Gas and Electric Company ("PG&E") as well as a reduction in gross estimated losses on those wildfires.
In December, 2019, the judge overseeing the bankruptcy of PG&E approved an $11 billion settlement of insurance subrogation claims to resolve all such claims arising from the 2017 Northern California wildfires and 2018 Camp wildfire. That settlement was contingent upon, among other things, the judge entering an order confirming PG&E’s chapter 11 bankruptcy plan (“PG&E Plan”) incorporating the settlement agreement. On June 20, 2020, the bankruptcy court judge approved the PG&E Plan and PG&E subsequently transferred the $11 billion settlement amount to a trust designed to allocate and distribute the settlement among subrogation holders, including certain of the Company’s insurance subsidiaries. In the second quarter of 2020, the Company recorded an estimated $289 subrogation benefit though the ultimate amount it collects will depend on how the Company’s ultimate paid claims subject to subrogation compare to other insurers’ ultimate paid claims subject to subrogation.
Uncollectible reinsurance reserves were reduced due to higher than expected recoveries from reinsurers in older accident years.
Asbestos and environmental reserves were reviewed in fourth quarter 2020 resulting in a $218 increase in reserves before ADC reinsurance, including $127 for asbestos and $91 for environmental. Of the $218 increase in A&E reserves, the Company ceded $220 to the A&E ADC resulting in a net reserve release of $2. Of the $220 of adverse development ceded to the A&E ADC, the Company recognized a $210 deferred gain on retroactive reinsurance, representing the amount of losses ceded to the ADC in excess of ceded premium paid. For additional information related to the adverse development cover with NICO, see the Adverse Development Covers section below and Note 15 - Commitments and Contingencies.
Other reserve re-estimates, net, primarily represents an increase in ULAE reserves in Property & Casualty Other Operations that was largely driven by an increase in gross asbestos and environmental reserves.
2019 re-estimates of prior accident year reserves
Workers’ compensation reserves were reduced, principally in small commercial driven by lower than previously estimated claim severity for the 2014 through 2017 accident years and, to a lesser extent, in national accounts due to lower estimated claim severity, primarily for accident years 2013 and prior.
General liability reserves were increased, primarily due to reserve increases in small commercial for accident years 2017 and 2018 due to higher frequency of high-severity bodily injury claims, reserve increases in middle & large commercial for accident years 2015 to 2018 due to higher estimated severity, as well as increased estimated severity on the acquired Navigators Group book of business related to U.S. construction, premises liability, products liability and excess casualty, mostly related to accident years 2014 to 2017. In addition, an increase in reserves for mass torts for 2009 and prior accident years was offset by a decrease in reserves for extra contractual liability claims for more recent accident years, including the 2018 accident year.
Marine reserves were increased, principally related to pollution exposure from the 1980s and 1990s related to the Navigators Group book of business.
Package business reserves were decreased, primarily due to favorable emergence on property claims related to accident years 2016 through 2018 and due to favorable development of loss adjustment expenses on general liability claims for 2017 and prior accident years.
Commercial property reserves were decreased, principally due to favorable emergence of reported losses, including on the acquired Navigators Group book of business, related to offshore energy in accident years 2017 to 2018 and construction engineering across accident years 2015 to 2018.
Professional liability reserves were increased, primarily due to increased securities litigation and large loss
177
|
| Note 12 - Reserves for Unpaid Loss and Loss Adjustment Expenses | ||||||||
THE HARTFORD FINANCIAL SERVICES GROUP, INC.
NOTES TO CONSOLIDATED FINANCIAL STATEMENTS (continued)
activity, including wrongful termination and discrimination claims, related to accident years 2017 and 2018 and increased estimated frequency and severity of directors’ and officers’ reserves on the Navigators Group book of business, principally for the 2014 to 2018 accident years. Partially offsetting the increase was a decrease in average severity on public company directors’ and officers’ claim reserves and errors and omissions claim reserves for accident years 2014 and prior.
Automobile liability reserves were decreased in Personal Lines and increased in Commercial Lines. The decrease in Personal Lines was due to the emergence of lower estimated severity in automobile liability for accident year 2017. The increase in Commercial Lines was due to higher estimated severity on national accounts, principally in accident years 2017 and 2018, and higher estimated severity for accident year 2018 in small commercial and middle market, partially offset by lower estimated severity for 2017 and prior accident years in small commercial and middle market.
Catastrophes reserves were reduced, primarily as a result of lower estimated net losses from 2017 hurricanes Harvey and Irma and the 2017 California wildfires. While gross loss reserve estimates for the 2018 California wildfires were also reduced, this was largely offset by a reduction in reinsurance recoverables resulting in very little change to estimated net losses from those wildfires.
Uncollectible reinsurance reserves were reduced due to higher than expected recoveries from reinsurers in older accident years.
Other reserve re-estimates, net, primarily represents an increase in ULAE reserves in Property & Casualty Other Operations that was driven by an increase in gross asbestos and environmental reserves, as well as higher than anticipated ULAE costs in recent years, prompting an increase in the projected ULAE run rate.
Settlement Agreement with Boy Scouts of America
On September 14, 2021, the Company announced that it entered into a new agreement-in-principle with the BSA, related to sexual molestation and sexual abuse claims associated with liability policies issued by various Hartford writing companies in the 1970s and early 1980s, superseding its prior agreement of April 16, 2021, which now includes the BSA, its local councils and the representatives of a majority of the sexual abuse claimants. As part of the agreement-in-principle, The Hartford will pay $787, before tax, for claims associated with policies mostly issued in the 1970s. In exchange for The Hartford’s payment, the BSA and its local councils will fully release The Hartford from any obligation under policies The Hartford issued to the BSA and its local councils. In addition, the representatives for the claimants joining this agreement-in-principle will support a plan of reorganization which incorporates the settlement. The prior agreement of April 16, 2021 to settle these claims for $650 did not include the local councils or representatives of a majority of the claimants.
The agreement-in-principle was reached in connection with BSA’s Chapter 11 bankruptcy and will become a final settlement upon the occurrence of certain conditions, including, but not
limited to, execution of a definitive settlement agreement, confirmation of BSA’s plan of reorganization, receipt of executed releases from the local councils, and approval of the parties' settlement as part of the confirmation of BSA's plan of reorganization by the bankruptcy and district courts. Assuming that all conditions are satisfied, the parties to the agreement-in-principle expect to receive court approval of the settlement by mid 2022. However, no assurance can be given that all the conditions precedent to the settlement will be satisfied or that final court approval, if obtained, will not be delayed for various procedural reasons.
If the bankruptcy court ultimately does not approve BSA’s plan of reorganization including terms of the agreement-in-principle, it is possible that adverse outcomes, if any, could have a material adverse effect on the Company’s consolidated operating results.
Adverse Development Covers
The Company has an adverse development cover reinsurance agreement with NICO, a subsidiary of Berkshire Hathaway Inc., to reinsure loss development after 2016 on substantially all of the Company’s asbestos and environmental reserves (the “A&E ADC”). Under the A&E ADC, the Company paid a reinsurance premium of $650 for NICO to assume adverse net loss reserve development up to $1.5 billion above the Company’s existing net A&E reserves as of December 31, 2016 of approximately $1.7 billion including reserves for A&E exposure for accident years prior to 1986 that are reported in Property & Casualty Other Operations ("Run-off A&E") and reserves for A&E exposure for accident years 1986 and subsequent from policies underwritten prior to 2016 that are reported in ongoing Commercial Lines and Personal Lines. The $650 reinsurance premium was placed into a collateral trust account as security for NICO’s claim payment obligations to the Company. The Company has retained the risk of collection on amounts due from other third-party reinsurers and continues to be responsible for claims handling and other administrative services, subject to certain conditions. The A&E ADC covers substantially all the Company’s A&E reserve development up to the reinsurance limit.
Under retroactive reinsurance accounting, net adverse A&E reserve development after December 31, 2016 results in an offsetting reinsurance recoverable up to the $1.5 billion limit. Cumulative ceded losses up to the $650 reinsurance premium paid have been recognized as a dollar-for-dollar offset to direct losses incurred. Cumulative ceded losses exceeding the $650 reinsurance premium paid result in a deferred gain. As of December 31, 2021, the Company has incurred $1,015 in cumulative adverse development on asbestos and environmental reserves that have been ceded under the A&E ADC treaty with NICO with $485 of available limit remaining under the A&E ADC. As a result, the Company has recorded a $365 deferred gain within other liabilities, representing the difference between the reinsurance recoverable of $1,015 and ceded premium paid of $650. The deferred gain is recognized over the claim settlement period in the proportion of the amount of cumulative ceded losses collected from the reinsurer to the estimated ultimate reinsurance recoveries. Consequently, until periods when the deferred gain is recognized as a benefit to earnings, cumulative adverse development of asbestos and environmental claims will result in charges against earnings which may be significant.
178
|
| Note 12 - Reserves for Unpaid Loss and Loss Adjustment Expenses | ||||||||
THE HARTFORD FINANCIAL SERVICES GROUP, INC.
NOTES TO CONSOLIDATED FINANCIAL STATEMENTS (continued)
Immediately after closing on the acquisition of Navigators Group, effective May 23, 2019, the Company purchased the Navigators ADC, an aggregate excess of loss reinsurance agreement covering adverse reserve development, from NICO on behalf of Navigators Insurers. Under the Navigators ADC, the Navigators Insurers paid NICO a reinsurance premium of $91 in exchange for reinsurance coverage of $300 of adverse net loss reserve development that attaches $100 above the Navigators Insurers' existing net loss and allocated loss adjustment reserves as of December 31, 2018 subject to the treaty of $1.816 billion for accidents and losses prior to December 31, 2018.
As of December 31, 2021, the Company has recorded a reinsurance recoverable under the Navigators ADC of $300 as estimated cumulative loss development on the 2018 and prior accident year reserves has exhausted the treaty limit. While the reinsurance recoverable is $300, the Company has recorded a $209 cumulative deferred gain within other liabilities since, under retroactive reinsurance accounting, ceded losses in excess of the $91 of ceded premium paid must be recognized as a deferred gain. Of the $209 of cumulative ceded losses in excess of ceded premium paid, $91, $102 and $16 were recognized as changes in deferred gain in 2021, 2020 and 2019, respectively.
Reconciliation of Loss Development to Liability for Unpaid Losses and Loss Adjustment Expenses As of December 31, 2021
| Losses and Allocated Loss Adjustment Expenses, Net of Reinsurance | Subtotal | |||||||||||||||||||||||||||||||
| Reserve Line | Cumulative Incurred for Accident Years Displayed in Triangles | Cumulative Paid for Accident Years Displayed in Triangles | Unpaid for Accident Years not Displayed in Triangles | Unpaid Unallocated Loss Adjustment Expenses, Net of Reinsurance | Discount | Unpaid Losses and Loss Adjustment Expenses, Net of Reinsurance | Reinsurance and Other Recoverables | Liability for Unpaid Losses and Loss Adjustment Expenses | ||||||||||||||||||||||||
| Workers' compensation | $ | 18,263 | $ | (9,992) | $ | 2,981 | $ | 348 | $ | (341) | $ | 11,259 | $ | 1,793 | $ | 13,052 | ||||||||||||||||
| General liability | 6,731 | (3,157) | 1,240 | 146 | — | 4,960 | 870 | 5,830 | ||||||||||||||||||||||||
| Marine | 1,516 | (1,242) | 17 | 12 | — | 303 | 235 | 538 | ||||||||||||||||||||||||
| Package business | 6,952 | (5,208) | 77 | 103 | — | 1,924 | 90 | 2,014 | ||||||||||||||||||||||||
| Commercial property | 3,830 | (3,342) | 24 | 18 | — | 530 | 268 | 798 | ||||||||||||||||||||||||
| Commercial automobile liability | 3,908 | (2,778) | 22 | 23 | — | 1,175 | 91 | 1,266 | ||||||||||||||||||||||||
| Commercial automobile physical damage | 172 | (162) | 4 | — | — | 14 | (1) | 13 | ||||||||||||||||||||||||
| Professional liability | 2,511 | (1,335) | 47 | 38 | — | 1,261 | 781 | 2,042 | ||||||||||||||||||||||||
| Bond | 625 | (254) | 32 | 31 | — | 434 | 10 | 444 | ||||||||||||||||||||||||
| Assumed Reinsurance | 1,384 | (1,106) | 3 | 4 | — | 285 | 50 | 335 | ||||||||||||||||||||||||
| Personal automobile liability | 11,104 | (9,809) | 29 | 66 | — | 1,390 | 23 | 1,413 | ||||||||||||||||||||||||
| Personal automobile physical damage | 1,200 | (1,170) | 7 | 3 | — | 40 | — | 40 | ||||||||||||||||||||||||
| Homeowners | 6,307 | (5,982) | 5 | 34 | — | 364 | 17 | 381 | ||||||||||||||||||||||||
| Other ongoing business | 183 | 5 | (14) | 174 | 310 | 484 | ||||||||||||||||||||||||||
| Asbestos and environmental [1] | 724 | — | — | 724 | 1,545 | 2,269 | ||||||||||||||||||||||||||
| Other operations [1] | 374 | 157 | — | 531 | (1) | 530 | ||||||||||||||||||||||||||
| Total P&C | $ | 64,503 | $ | (45,537) | $ | 5,769 | $ | 988 | $ | (355) | $ | 25,368 | $ | 6,081 | $ | 31,449 | ||||||||||||||||
[1]Asbestos and environmental and other operations include asbestos, environmental and other latent exposures not foreseen when coverages were written, including, but not limited to, potential liability for pharmaceutical products, silica, talcum powder, head injuries, lead paint, construction defects, sexual molestation and sexual abuse and other long-tail liabilities. These reserve lines do not have significant paid or incurred loss development for the most recent ten accident years and therefore do not have loss development displayed in triangles.
179
|
| Note 12 - Reserves for Unpaid Loss and Loss Adjustment Expenses | ||||||||
THE HARTFORD FINANCIAL SERVICES GROUP, INC.
NOTES TO CONSOLIDATED FINANCIAL STATEMENTS (continued)
The reserve lines in the above table and the loss triangles that follow represent the significant lines of business for which the Company regularly reviews the appropriateness of reserve levels. These reserve lines differ from the reserve lines reported on a statutory basis, as prescribed by the National Association of Insurance Commissioners ("NAIC"). The cumulative incurred losses displayed in the above table include the full reinsurance benefit of ceding $300 of losses to the Navigators ADC even though $209 of that benefit has been recorded as a deferred gain within other liabilities and recognized as a charge to earnings within incurred loss and loss adjustment expenses included in the consolidated statement of operations. The $300 of Navigators Insurers losses ceded to the Navigators ADC included in the following triangles $110 for professional liability,$86 for general liability, $39 for marine, $29 for assumed reinsurance, $16 for commercial automobile and $3 for commercial property and included $17 for older accident years and lines of business that are not in the following triangles.
The following loss triangles present historical loss development for incurred and paid claims by accident year, including loss development on Navigators Insurers reserves prior to and after the May 23, 2019 acquisition date. Because the loss triangles include pre-acquisition date changes in ultimate incurred loss estimates for Navigators Insurers’ reserves, changes in reserve development evident in the incurred loss triangles may differ from prior accident year development recorded by the Company as shown in the (Favorable) Unfavorable Prior Accident Year Development table above as that only includes changes in Navigators Insurers’ reserves post acquisition. In addition, the incurred loss triangles include reserve development on both catastrophe and non-catastrophe claims whereas the (Favorable) Unfavorable Prior Accident Year Development table above shows the total amount of catastrophe reserve development across all lines of business on a single line.
Triangles are limited to the number of years for which claims incurred typically remain outstanding, not exceeding ten years. Short-tail lines, which represent claims generally expected to be paid within a few years, have three years of claim development displayed. Incurred but not reported ("IBNR") reserves shown in loss triangles include reserves for incurred but not reported claims as well as reserves for expected development on reported claims. Incurred and cumulative paid losses in currencies other than the U.S. dollar have been converted into U.S. dollars using the exchange rates as of December 31, 2021.
180
|
| Note 12 - Reserves for Unpaid Loss and Loss Adjustment Expenses | ||||||||
THE HARTFORD FINANCIAL SERVICES GROUP, INC.
NOTES TO CONSOLIDATED FINANCIAL STATEMENTS (continued)
Workers' Compensation
| Incurred Losses & Allocated Loss Adjustment Expenses, Net of Reinsurance | ||||||||||||||||||||||||||||||||||||||
| For the years ended December 31, | ||||||||||||||||||||||||||||||||||||||
| (Unaudited) | ||||||||||||||||||||||||||||||||||||||
| Accident Year | 2012 | 2013 | 2014 | 2015 | 2016 | 2017 | 2018 | 2019 | 2020 | 2021 | IBNR Reserves | Claims Reported | ||||||||||||||||||||||||||
| 2012 | $ | 2,185 | $ | 2,207 | $ | 2,207 | $ | 2,181 | $ | 2,168 | $ | 2,169 | $ | 2,154 | $ | 2,146 | $ | 2,135 | $ | 2,133 | $ | 310 | 171,562 | |||||||||||||||
| 2013 | 2,020 | 1,981 | 1,920 | 1,883 | 1,861 | 1,861 | 1,850 | 1,831 | 1,811 | 346 | 151,492 | |||||||||||||||||||||||||||
| 2014 | 1,869 | 1,838 | 1,789 | 1,761 | 1,713 | 1,692 | 1,679 | 1,654 | 386 | 126,288 | ||||||||||||||||||||||||||||
| 2015 | 1,873 | 1,835 | 1,801 | 1,724 | 1,714 | 1,699 | 1,667 | 412 | 114,113 | |||||||||||||||||||||||||||||
| 2016 | 1,772 | 1,772 | 1,780 | 1,767 | 1,748 | 1,708 | 489 | 112,302 | ||||||||||||||||||||||||||||||
| 2017 | 1,862 | 1,869 | 1,840 | 1,822 | 1,757 | 636 | 111,800 | |||||||||||||||||||||||||||||||
| 2018 | 1,916 | 1,917 | 1,915 | 1,904 | 726 | 118,951 | ||||||||||||||||||||||||||||||||
| 2019 | 1,937 | 1,935 | 1,934 | 844 | 119,416 | |||||||||||||||||||||||||||||||||
| 2020 | 1,865 | 1,864 | 1,114 | 90,199 | ||||||||||||||||||||||||||||||||||
| 2021 | 1,831 | 1,314 | 93,860 | |||||||||||||||||||||||||||||||||||
| Total | $ | 18,263 | ||||||||||||||||||||||||||||||||||||
| Cumulative Paid Losses & Allocated Loss Adjustment Expenses, Net of Reinsurance | ||||||||||||||||||||||||||||||||
| For the years ended December 31, | ||||||||||||||||||||||||||||||||
| (Unaudited) | ||||||||||||||||||||||||||||||||
| Accident Year | 2012 | 2013 | 2014 | 2015 | 2016 | 2017 | 2018 | 2019 | 2020 | 2021 | ||||||||||||||||||||||
| 2012 | $ | 359 | $ | 809 | $ | 1,106 | $ | 1,313 | $ | 1,436 | $ | 1,529 | $ | 1,587 | $ | 1,644 | $ | 1,678 | $ | 1,706 | ||||||||||||
| 2013 | 304 | 675 | 917 | 1,071 | 1,175 | 1,260 | 1,304 | 1,339 | 1,361 | |||||||||||||||||||||||
| 2014 | 275 | 598 | 811 | 960 | 1,041 | 1,099 | 1,137 | 1,167 | ||||||||||||||||||||||||
| 2015 | 261 | 576 | 778 | 909 | 1,004 | 1,068 | 1,117 | |||||||||||||||||||||||||
| 2016 | 255 | 579 | 779 | 908 | 1,003 | 1,064 | ||||||||||||||||||||||||||
| 2017 | 261 | 575 | 778 | 900 | 977 | |||||||||||||||||||||||||||
| 2018 | 283 | 624 | 837 | 983 | ||||||||||||||||||||||||||||
| 2019 | 291 | 637 | 856 | |||||||||||||||||||||||||||||
| 2020 | 223 | 507 | ||||||||||||||||||||||||||||||
| 2021 | 254 | |||||||||||||||||||||||||||||||
| Total | $ | 9,992 | ||||||||||||||||||||||||||||||
181
|
| Note 12 - Reserves for Unpaid Loss and Loss Adjustment Expenses | ||||||||
THE HARTFORD FINANCIAL SERVICES GROUP, INC.
NOTES TO CONSOLIDATED FINANCIAL STATEMENTS (continued)
General Liability
| Incurred Losses & Allocated Loss Adjustment Expenses, Net of Reinsurance | ||||||||||||||||||||||||||||||||||||||
| For the years ended December 31, | ||||||||||||||||||||||||||||||||||||||
| (Unaudited) | ||||||||||||||||||||||||||||||||||||||
| Accident Year | 2012 | 2013 | 2014 | 2015 | 2016 | 2017 | 2018 | 2019 | 2020 | 2021 | IBNR Reserves | Claims Reported | ||||||||||||||||||||||||||
| 2012 | $ | 423 | $ | 402 | $ | 399 | $ | 392 | $ | 410 | $ | 408 | $ | 421 | $ | 413 | $ | 407 | $ | 406 | $ | 41 | 16,768 | |||||||||||||||
| 2013 | 455 | 442 | 456 | 484 | 488 | 502 | 505 | 508 | 500 | 42 | 14,134 | |||||||||||||||||||||||||||
| 2014 | 506 | 475 | 481 | 494 | 513 | 522 | 515 | 505 | 52 | 15,242 | ||||||||||||||||||||||||||||
| 2015 | 556 | 560 | 554 | 594 | 633 | 647 | 637 | 71 | 15,627 | |||||||||||||||||||||||||||||
| 2016 | 613 | 583 | 607 | 632 | 632 | 620 | 92 | 16,817 | ||||||||||||||||||||||||||||||
| 2017 | 626 | 614 | 613 | 615 | 613 | 174 | 16,447 | |||||||||||||||||||||||||||||||
| 2018 | 692 | 669 | 697 | 703 | 295 | 17,749 | ||||||||||||||||||||||||||||||||
| 2019 | 822 | 827 | 822 | 512 | 16,858 | |||||||||||||||||||||||||||||||||
| 2020 | 938 | 923 | 739 | 11,991 | ||||||||||||||||||||||||||||||||||
| 2021 | 1,002 | 929 | 8,364 | |||||||||||||||||||||||||||||||||||
| Total | $ | 6,731 | ||||||||||||||||||||||||||||||||||||
| Cumulative Paid Losses & Allocated Loss Adjustment Expenses, Net of Reinsurance | ||||||||||||||||||||||||||||||||
| For the years ended December 31, | ||||||||||||||||||||||||||||||||
| (Unaudited) | ||||||||||||||||||||||||||||||||
| Accident Year | 2012 | 2013 | 2014 | 2015 | 2016 | 2017 | 2018 | 2019 | 2020 | 2021 | ||||||||||||||||||||||
| 2012 | $ | 13 | $ | 55 | $ | 101 | $ | 170 | $ | 233 | $ | 280 | $ | 305 | $ | 323 | $ | 332 | $ | 352 | ||||||||||||
| 2013 | 13 | 53 | 141 | 233 | 320 | 372 | 398 | 422 | 442 | |||||||||||||||||||||||
| 2014 | 15 | 42 | 130 | 214 | 304 | 358 | 402 | 423 | ||||||||||||||||||||||||
| 2015 | 10 | 55 | 156 | 278 | 409 | 477 | 524 | |||||||||||||||||||||||||
| 2016 | 12 | 52 | 131 | 283 | 368 | 447 | ||||||||||||||||||||||||||
| 2017 | 15 | 67 | 156 | 255 | 344 | |||||||||||||||||||||||||||
| 2018 | 21 | 84 | 177 | 288 | ||||||||||||||||||||||||||||
| 2019 | 29 | 100 | 193 | |||||||||||||||||||||||||||||
| 2020 | 45 | 110 | ||||||||||||||||||||||||||||||
| 2021 | 34 | |||||||||||||||||||||||||||||||
| Total | $ | 3,157 | ||||||||||||||||||||||||||||||
182
|
| Note 12 - Reserves for Unpaid Loss and Loss Adjustment Expenses | ||||||||
THE HARTFORD FINANCIAL SERVICES GROUP, INC.
NOTES TO CONSOLIDATED FINANCIAL STATEMENTS (continued)
Marine
| Incurred Losses & Allocated Loss Adjustment Expenses, Net of Reinsurance | ||||||||||||||||||||||||||||||||||||||
| For the years ended December 31, | ||||||||||||||||||||||||||||||||||||||
| (Unaudited) | ||||||||||||||||||||||||||||||||||||||
| Accident Year | 2012 | 2013 | 2014 | 2015 | 2016 | 2017 | 2018 | 2019 | 2020 | 2021 | IBNR Reserves [1] | Claims Reported | ||||||||||||||||||||||||||
| 2012 | $ | 196 | $ | 220 | $ | 180 | $ | 169 | $ | 163 | $ | 164 | $ | 168 | $ | 164 | $ | 164 | $ | 165 | $ | 1 | 6,789 | |||||||||||||||
| 2013 | 149 | 152 | 134 | 136 | 140 | 135 | 138 | 140 | 139 | (2) | 6,629 | |||||||||||||||||||||||||||
| 2014 | 163 | 160 | 158 | 165 | 164 | 169 | 167 | 171 | 1 | 7,137 | ||||||||||||||||||||||||||||
| 2015 | 158 | 146 | 146 | 148 | 134 | 138 | 140 | (3) | 10,137 | |||||||||||||||||||||||||||||
| 2016 | 140 | 143 | 138 | 148 | 150 | 147 | (17) | 13,178 | ||||||||||||||||||||||||||||||
| 2017 | 160 | 187 | 175 | 174 | 180 | (8) | 15,586 | |||||||||||||||||||||||||||||||
| 2018 | 144 | 161 | 154 | 161 | (8) | 14,037 | ||||||||||||||||||||||||||||||||
| 2019 | 144 | 142 | 140 | 15 | 8,413 | |||||||||||||||||||||||||||||||||
| 2020 | 150 | 142 | 26 | 4,730 | ||||||||||||||||||||||||||||||||||
| 2021 | 131 | 72 | 3,499 | |||||||||||||||||||||||||||||||||||
| Total | $ | 1,516 | ||||||||||||||||||||||||||||||||||||
[1]Contributing to the negative IBNR reserves for some accident years is a lag in the timing of expected reinsurance recoveries under the Navigators ADC with NICO. Recoveries from NICO will not be collected until the Company has cumulative loss payments for all covered lines of more than the attachment point.
| Cumulative Paid Losses & Allocated Loss Adjustment Expenses, Net of Reinsurance | ||||||||||||||||||||||||||||||||
| For the years ended December 31, | ||||||||||||||||||||||||||||||||
| (Unaudited) | ||||||||||||||||||||||||||||||||
| Accident Year | 2012 | 2013 | 2014 | 2015 | 2016 | 2017 | 2018 | 2019 | 2020 | 2021 | ||||||||||||||||||||||
| 2012 | $ | 51 | $ | 101 | $ | 125 | $ | 139 | $ | 148 | $ | 152 | $ | 155 | $ | 159 | $ | 158 | $ | 159 | ||||||||||||
| 2013 | 42 | 82 | 100 | 112 | 119 | 121 | 126 | 133 | 134 | |||||||||||||||||||||||
| 2014 | 41 | 81 | 116 | 131 | 151 | 157 | 159 | 162 | ||||||||||||||||||||||||
| 2015 | 40 | 85 | 116 | 126 | 134 | 140 | 141 | |||||||||||||||||||||||||
| 2016 | 35 | 80 | 106 | 123 | 132 | 141 | ||||||||||||||||||||||||||
| 2017 | 48 | 111 | 142 | 154 | 163 | |||||||||||||||||||||||||||
| 2018 | 37 | 104 | 138 | 148 | ||||||||||||||||||||||||||||
| 2019 | 36 | 83 | 101 | |||||||||||||||||||||||||||||
| 2020 | 32 | 69 | ||||||||||||||||||||||||||||||
| 2021 | 24 | |||||||||||||||||||||||||||||||
| Total | $ | 1,242 | ||||||||||||||||||||||||||||||
183
|
| Note 12 - Reserves for Unpaid Loss and Loss Adjustment Expenses | ||||||||
THE HARTFORD FINANCIAL SERVICES GROUP, INC.
NOTES TO CONSOLIDATED FINANCIAL STATEMENTS (continued)
Package Business
| Incurred Losses & Allocated Loss Adjustment Expenses, Net of Reinsurance | ||||||||||||||||||||||||||||||||||||||
| For the years ended December 31, | ||||||||||||||||||||||||||||||||||||||
| (Unaudited) | ||||||||||||||||||||||||||||||||||||||
| Accident Year | 2012 | 2013 | 2014 | 2015 | 2016 | 2017 | 2018 | 2019 | 2020 | 2021 | IBNR Reserves | Claims Reported | ||||||||||||||||||||||||||
| 2012 | $ | 736 | $ | 725 | $ | 728 | $ | 731 | $ | 736 | $ | 735 | $ | 739 | $ | 732 | $ | 732 | $ | 727 | $ | 24 | 59,921 | |||||||||||||||
| 2013 | 579 | 565 | 573 | 585 | 586 | 592 | 586 | 587 | 583 | 22 | 43,675 | |||||||||||||||||||||||||||
| 2014 | 566 | 578 | 601 | 602 | 603 | 603 | 593 | 581 | 29 | 43,321 | ||||||||||||||||||||||||||||
| 2015 | 582 | 588 | 585 | 583 | 588 | 581 | 567 | 34 | 42,232 | |||||||||||||||||||||||||||||
| 2016 | 655 | 638 | 632 | 625 | 611 | 595 | 51 | 44,079 | ||||||||||||||||||||||||||||||
| 2017 | 695 | 702 | 692 | 657 | 644 | 73 | 46,638 | |||||||||||||||||||||||||||||||
| 2018 | 719 | 724 | 688 | 667 | 114 | 44,822 | ||||||||||||||||||||||||||||||||
| 2019 | 813 | 769 | 749 | 175 | 43,073 | |||||||||||||||||||||||||||||||||
| 2020 | 915 | 893 | 316 | 61,161 | ||||||||||||||||||||||||||||||||||
| 2021 | 946 | 412 | 40,792 | |||||||||||||||||||||||||||||||||||
| Total | $ | 6,952 | ||||||||||||||||||||||||||||||||||||
| Cumulative Paid Losses & Allocated Loss Adjustment Expenses, Net of Reinsurance | ||||||||||||||||||||||||||||||||
| For the years ended December 31, | ||||||||||||||||||||||||||||||||
| (Unaudited) | ||||||||||||||||||||||||||||||||
| Accident Year | 2012 | 2013 | 2014 | 2015 | 2016 | 2017 | 2018 | 2019 | 2020 | 2021 | ||||||||||||||||||||||
| 2012 | $ | 286 | $ | 486 | $ | 560 | $ | 616 | $ | 652 | $ | 673 | $ | 687 | $ | 694 | $ | 697 | $ | 699 | ||||||||||||
| 2013 | 225 | 339 | 414 | 467 | 504 | 522 | 541 | 549 | 552 | |||||||||||||||||||||||
| 2014 | 226 | 345 | 416 | 468 | 507 | 525 | 535 | 542 | ||||||||||||||||||||||||
| 2015 | 212 | 332 | 383 | 445 | 486 | 505 | 513 | |||||||||||||||||||||||||
| 2016 | 225 | 353 | 410 | 465 | 500 | 521 | ||||||||||||||||||||||||||
| 2017 | 235 | 372 | 447 | 496 | 534 | |||||||||||||||||||||||||||
| 2018 | 237 | 402 | 451 | 498 | ||||||||||||||||||||||||||||
| 2019 | 254 | 413 | 488 | |||||||||||||||||||||||||||||
| 2020 | 326 | 493 | ||||||||||||||||||||||||||||||
| 2021 | 368 | |||||||||||||||||||||||||||||||
| Total | $ | 5,208 | ||||||||||||||||||||||||||||||
184
|
| Note 12 - Reserves for Unpaid Loss and Loss Adjustment Expenses | ||||||||
THE HARTFORD FINANCIAL SERVICES GROUP, INC.
NOTES TO CONSOLIDATED FINANCIAL STATEMENTS (continued)
Commercial Property
| Incurred Losses & Allocated Loss Adjustment Expenses, Net of Reinsurance | ||||||||||||||||||||||||||||||||||||||
| For the years ended December 31, | ||||||||||||||||||||||||||||||||||||||
| (Unaudited) | ||||||||||||||||||||||||||||||||||||||
| Accident Year | 2012 | 2013 | 2014 | 2015 | 2016 | 2017 | 2018 | 2019 | 2020 | 2021 | IBNR Reserves | Claims Reported | ||||||||||||||||||||||||||
| 2012 | $ | 369 | $ | 333 | $ | 334 | $ | 335 | $ | 337 | $ | 335 | $ | 334 | $ | 333 | $ | 332 | $ | 332 | $ | — | 26,861 | |||||||||||||||
| 2013 | 268 | 252 | 254 | 252 | 249 | 248 | 247 | 247 | 247 | — | 21,620 | |||||||||||||||||||||||||||
| 2014 | 293 | 281 | 282 | 280 | 279 | 280 | 280 | 279 | (1) | 21,030 | ||||||||||||||||||||||||||||
| 2015 | 299 | 301 | 302 | 301 | 305 | 304 | 301 | — | 21,029 | |||||||||||||||||||||||||||||
| 2016 | 406 | 420 | 399 | 406 | 408 | 408 | 3 | 23,781 | ||||||||||||||||||||||||||||||
| 2017 | 577 | 516 | 456 | 439 | 441 | 5 | 24,382 | |||||||||||||||||||||||||||||||
| 2018 | 450 | 437 | 424 | 403 | 8 | 21,715 | ||||||||||||||||||||||||||||||||
| 2019 | 480 | 440 | 419 | 4 | 21,002 | |||||||||||||||||||||||||||||||||
| 2020 | 501 | 469 | 96 | 20,327 | ||||||||||||||||||||||||||||||||||
| 2021 | 531 | 108 | 16,394 | |||||||||||||||||||||||||||||||||||
| Total | $ | 3,830 | ||||||||||||||||||||||||||||||||||||
| Cumulative Paid Losses & Allocated Loss Adjustment Expenses, Net of Reinsurance | ||||||||||||||||||||||||||||||||
| For the years ended December 31, | ||||||||||||||||||||||||||||||||
| (Unaudited) | ||||||||||||||||||||||||||||||||
| Accident Year | 2012 | 2013 | 2014 | 2015 | 2016 | 2017 | 2018 | 2019 | 2020 | 2021 | ||||||||||||||||||||||
| 2012 | $ | 182 | $ | 296 | $ | 317 | $ | 326 | $ | 331 | $ | 331 | $ | 331 | $ | 330 | $ | 330 | $ | 330 | ||||||||||||
| 2013 | 161 | 223 | 238 | 243 | 242 | 244 | 245 | 245 | 245 | |||||||||||||||||||||||
| 2014 | 170 | 250 | 270 | 279 | 279 | 279 | 280 | 280 | ||||||||||||||||||||||||
| 2015 | 179 | 257 | 285 | 296 | 302 | 303 | 302 | |||||||||||||||||||||||||
| 2016 | 215 | 342 | 379 | 396 | 402 | 406 | ||||||||||||||||||||||||||
| 2017 | 229 | 378 | 412 | 427 | 433 | |||||||||||||||||||||||||||
| 2018 | 188 | 344 | 379 | 386 | ||||||||||||||||||||||||||||
| 2019 | 215 | 351 | 383 | |||||||||||||||||||||||||||||
| 2020 | 221 | 336 | ||||||||||||||||||||||||||||||
| 2021 | 241 | |||||||||||||||||||||||||||||||
| Total | $ | 3,342 | ||||||||||||||||||||||||||||||
185
|
| Note 12 - Reserves for Unpaid Loss and Loss Adjustment Expenses | ||||||||
THE HARTFORD FINANCIAL SERVICES GROUP, INC.
NOTES TO CONSOLIDATED FINANCIAL STATEMENTS (continued)
Commercial Automobile Liability
| Incurred Losses & Allocated Loss Adjustment Expenses, Net of Reinsurance | ||||||||||||||||||||||||||||||||||||||
| For the years ended December 31, | ||||||||||||||||||||||||||||||||||||||
| (Unaudited) | ||||||||||||||||||||||||||||||||||||||
| Accident Year | 2012 | 2013 | 2014 | 2015 | 2016 | 2017 | 2018 | 2019 | 2020 | 2021 | IBNR Reserves | Claims Reported | ||||||||||||||||||||||||||
| 2012 | $ | 311 | $ | 377 | $ | 391 | $ | 402 | $ | 395 | $ | 389 | $ | 387 | $ | 388 | $ | 388 | $ | 387 | $ | 6 | 36,053 | |||||||||||||||
| 2013 | 311 | 318 | 334 | 341 | 340 | 339 | 336 | 334 | 333 | 7 | 32,242 | |||||||||||||||||||||||||||
| 2014 | 309 | 317 | 331 | 337 | 341 | 334 | 333 | 332 | 6 | 29,613 | ||||||||||||||||||||||||||||
| 2015 | 308 | 358 | 372 | 356 | 356 | 359 | 360 | 10 | 28,565 | |||||||||||||||||||||||||||||
| 2016 | 385 | 393 | 390 | 391 | 391 | 395 | 15 | 29,167 | ||||||||||||||||||||||||||||||
| 2017 | 372 | 383 | 379 | 383 | 381 | 11 | 26,341 | |||||||||||||||||||||||||||||||
| 2018 | 349 | 396 | 405 | 406 | 36 | 24,610 | ||||||||||||||||||||||||||||||||
| 2019 | 425 | 439 | 450 | 114 | 28,216 | |||||||||||||||||||||||||||||||||
| 2020 | 428 | 424 | 227 | 21,557 | ||||||||||||||||||||||||||||||||||
| 2021 | 440 | 340 | 17,404 | |||||||||||||||||||||||||||||||||||
| Total | $ | 3,908 | ||||||||||||||||||||||||||||||||||||
| Cumulative Paid Losses & Allocated Loss Adjustment Expense, Net of Reinsurance | ||||||||||||||||||||||||||||||||
| For the years ended December 31 | ||||||||||||||||||||||||||||||||
| (Unaudited) | ||||||||||||||||||||||||||||||||
| Accident Year | 2012 | 2013 | 2014 | 2015 | 2016 | 2017 | 2018 | 2019 | 2020 | 2021 | ||||||||||||||||||||||
| 2012 | $ | 65 | $ | 143 | $ | 234 | $ | 307 | $ | 346 | $ | 359 | $ | 372 | $ | 376 | $ | 378 | $ | 379 | ||||||||||||
| 2013 | 62 | 130 | 202 | 259 | 295 | 311 | 320 | 323 | 324 | |||||||||||||||||||||||
| 2014 | 59 | 131 | 197 | 252 | 299 | 309 | 318 | 320 | ||||||||||||||||||||||||
| 2015 | 62 | 142 | 207 | 267 | 314 | 335 | 344 | |||||||||||||||||||||||||
| 2016 | 65 | 147 | 232 | 303 | 339 | 357 | ||||||||||||||||||||||||||
| 2017 | 60 | 134 | 211 | 285 | 328 | |||||||||||||||||||||||||||
| 2018 | 62 | 153 | 238 | 305 | ||||||||||||||||||||||||||||
| 2019 | 67 | 160 | 247 | |||||||||||||||||||||||||||||
| 2020 | 55 | 119 | ||||||||||||||||||||||||||||||
| 2021 | 55 | |||||||||||||||||||||||||||||||
| Total | $ | 2,778 | ||||||||||||||||||||||||||||||
186
|
| Note 12 - Reserves for Unpaid Loss and Loss Adjustment Expenses | ||||||||
THE HARTFORD FINANCIAL SERVICES GROUP, INC.
NOTES TO CONSOLIDATED FINANCIAL STATEMENTS (continued)
Commercial Automobile Physical Damage
| Incurred Losses & Allocated Loss Adjustment Expenses, Net of Reinsurance | |||||||||||||||||
| For the years ended December 31, | |||||||||||||||||
| (Unaudited) | |||||||||||||||||
| Accident Year | 2019 | 2020 | 2021 | IBNR Reserves | Claims Reported | ||||||||||||
| 2019 | $ | 63 | $ | 64 | $ | 63 | $ | 1 | 19,853 | ||||||||
| 2020 | 51 | 51 | 1 | 14,671 | |||||||||||||
| 2021 | 58 | 2 | 14,253 | ||||||||||||||
| Total | $ | 172 | |||||||||||||||
| Cumulative Paid Losses & Allocated Loss Adjustment Expenses, Net of Reinsurance | |||||||||||
| For the years ended December 31, | |||||||||||
| (Unaudited) | |||||||||||
| Accident Year | 2019 | 2020 | 2021 | ||||||||
| 2019 | $ | 56 | $ | 62 | $ | 62 | |||||
| 2020 | 45 | 50 | |||||||||
| 2021 | 50 | ||||||||||
| Total | $ | 162 | |||||||||
187
|
| Note 12 - Reserves for Unpaid Loss and Loss Adjustment Expenses | ||||||||
THE HARTFORD FINANCIAL SERVICES GROUP, INC.
NOTES TO CONSOLIDATED FINANCIAL STATEMENTS (continued)
Professional Liability
| Incurred Losses & Allocated Loss Adjustment Expenses, Net of Reinsurance | ||||||||||||||||||||||||||||||||||||||
| For the years ended December 31, | ||||||||||||||||||||||||||||||||||||||
| (Unaudited) | ||||||||||||||||||||||||||||||||||||||
| Claims Made Year | 2012 | 2013 | 2014 | 2015 | 2016 | 2017 | 2018 | 2019 | 2020 | 2021 | IBNR Reserves | Claims Reported | ||||||||||||||||||||||||||
| 2012 | $ | 242 | $ | 238 | $ | 238 | $ | 218 | $ | 221 | $ | 221 | $ | 219 | $ | 225 | $ | 217 | $ | 212 | $ | (3) | 7,037 | |||||||||||||||
| 2013 | 207 | 195 | 187 | 174 | 174 | 173 | 171 | 171 | 169 | 14 | 5,979 | |||||||||||||||||||||||||||
| 2014 | 187 | 183 | 181 | 178 | 179 | 182 | 183 | 174 | 21 | 6,734 | ||||||||||||||||||||||||||||
| 2015 | 164 | 174 | 180 | 190 | 214 | 207 | 200 | 15 | 7,245 | |||||||||||||||||||||||||||||
| 2016 | 183 | 176 | 204 | 197 | 196 | 197 | 27 | 8,391 | ||||||||||||||||||||||||||||||
| 2017 | 205 | 203 | 232 | 226 | 241 | 47 | 9,466 | |||||||||||||||||||||||||||||||
| 2018 | 248 | 281 | 278 | 278 | 74 | 10,040 | ||||||||||||||||||||||||||||||||
| 2019 | 298 | 317 | 336 | 150 | 9,654 | |||||||||||||||||||||||||||||||||
| 2020 | 370 | 365 | 259 | 7,713 | ||||||||||||||||||||||||||||||||||
| 2021 | 339 | 310 | 5,450 | |||||||||||||||||||||||||||||||||||
| Total | $ | 2,511 | ||||||||||||||||||||||||||||||||||||
| Cumulative Paid Losses & Allocated Loss Adjustment Expenses, Net of Reinsurance | ||||||||||||||||||||||||||||||||
| For the years ended December 31, | ||||||||||||||||||||||||||||||||
| (Unaudited) | ||||||||||||||||||||||||||||||||
| Claims Made Year | 2012 | 2013 | 2014 | 2015 | 2016 | 2017 | 2018 | 2019 | 2020 | 2021 | ||||||||||||||||||||||
| 2012 | $ | 17 | $ | 67 | $ | 100 | $ | 139 | $ | 155 | $ | 169 | $ | 172 | $ | 175 | $ | 175 | $ | 176 | ||||||||||||
| 2013 | 10 | 44 | 67 | 88 | 116 | 131 | 137 | 142 | 148 | |||||||||||||||||||||||
| 2014 | 8 | 38 | 74 | 108 | 131 | 135 | 146 | 145 | ||||||||||||||||||||||||
| 2015 | 9 | 40 | 85 | 107 | 125 | 141 | 164 | |||||||||||||||||||||||||
| 2016 | 8 | 51 | 88 | 112 | 125 | 149 | ||||||||||||||||||||||||||
| 2017 | 11 | 48 | 88 | 123 | 151 | |||||||||||||||||||||||||||
| 2018 | 15 | 73 | 130 | 166 | ||||||||||||||||||||||||||||
| 2019 | 21 | 78 | 150 | |||||||||||||||||||||||||||||
| 2020 | 19 | 71 | ||||||||||||||||||||||||||||||
| 2021 | 15 | |||||||||||||||||||||||||||||||
| Total | $ | 1,335 | ||||||||||||||||||||||||||||||
188
|
| Note 12 - Reserves for Unpaid Loss and Loss Adjustment Expenses | ||||||||
THE HARTFORD FINANCIAL SERVICES GROUP, INC.
NOTES TO CONSOLIDATED FINANCIAL STATEMENTS (continued)
Bond
| Incurred Losses & Allocated Loss Adjustment Expenses, Net of Reinsurance | ||||||||||||||||||||||||||||||||||||||
| For the years ended December 31, | ||||||||||||||||||||||||||||||||||||||
| (Unaudited) | ||||||||||||||||||||||||||||||||||||||
| Accident Year | 2012 | 2013 | 2014 | 2015 | 2016 | 2017 | 2018 | 2019 | 2020 | 2021 | IBNR Reserves | Claims Reported | ||||||||||||||||||||||||||
| 2012 | $ | 71 | $ | 70 | $ | 61 | $ | 55 | $ | 49 | $ | 49 | $ | 45 | $ | 48 | $ | 48 | $ | 46 | $ | 11 | 1,729 | |||||||||||||||
| 2013 | 64 | 58 | 55 | 48 | 49 | 39 | 35 | 34 | 34 | 13 | 1,468 | |||||||||||||||||||||||||||
| 2014 | 71 | 67 | 66 | 67 | 59 | 59 | 60 | 60 | 8 | 1,387 | ||||||||||||||||||||||||||||
| 2015 | 67 | 67 | 63 | 60 | 54 | 48 | 47 | 17 | 1,395 | |||||||||||||||||||||||||||||
| 2016 | 61 | 61 | 61 | 55 | 51 | 45 | 23 | 1,339 | ||||||||||||||||||||||||||||||
| 2017 | 63 | 90 | 101 | 94 | 79 | 36 | 1,724 | |||||||||||||||||||||||||||||||
| 2018 | 68 | 68 | 72 | 71 | 36 | 1,664 | ||||||||||||||||||||||||||||||||
| 2019 | 72 | 73 | 74 | 58 | 1,779 | |||||||||||||||||||||||||||||||||
| 2020 | 83 | 84 | 71 | 1,889 | ||||||||||||||||||||||||||||||||||
| 2021 | 85 | 68 | 1,960 | |||||||||||||||||||||||||||||||||||
| Total | $ | 625 | ||||||||||||||||||||||||||||||||||||
| Cumulative Paid Losses & Allocated Loss Adjustment Expenses, Net of Reinsurance | ||||||||||||||||||||||||||||||||
| For the years ended December 31, | ||||||||||||||||||||||||||||||||
| (Unaudited) | ||||||||||||||||||||||||||||||||
| Accident Year | 2012 | 2013 | 2014 | 2015 | 2016 | 2017 | 2018 | 2019 | 2020 | 2021 | ||||||||||||||||||||||
| 2012 | $ | 12 | $ | 25 | $ | 26 | $ | 24 | $ | 26 | $ | 26 | $ | 34 | $ | 35 | $ | 35 | $ | 34 | ||||||||||||
| 2013 | 3 | 9 | 17 | 19 | 19 | 19 | 20 | 20 | 20 | |||||||||||||||||||||||
| 2014 | 18 | 31 | 40 | 43 | 43 | 44 | 46 | 47 | ||||||||||||||||||||||||
| 2015 | 9 | 20 | 24 | 31 | 34 | 32 | 30 | |||||||||||||||||||||||||
| 2016 | 2 | 12 | 15 | 20 | 22 | 22 | ||||||||||||||||||||||||||
| 2017 | 5 | 46 | 55 | 54 | 42 | |||||||||||||||||||||||||||
| 2018 | 6 | 16 | 23 | 24 | ||||||||||||||||||||||||||||
| 2019 | 3 | 13 | 15 | |||||||||||||||||||||||||||||
| 2020 | 4 | 12 | ||||||||||||||||||||||||||||||
| 2021 | 8 | |||||||||||||||||||||||||||||||
| Total | $ | 254 | ||||||||||||||||||||||||||||||
189
|
| Note 12 - Reserves for Unpaid Loss and Loss Adjustment Expenses | ||||||||
THE HARTFORD FINANCIAL SERVICES GROUP, INC.
NOTES TO CONSOLIDATED FINANCIAL STATEMENTS (continued)
Assumed Reinsurance
| Incurred Losses & Allocated Loss Adjustment Expenses, Net of Reinsurance | ||||||||||||||||||||||||||||||||||||||
| For the years ended December 31, | ||||||||||||||||||||||||||||||||||||||
| (Unaudited) | ||||||||||||||||||||||||||||||||||||||
| Accident Year | 2012 | 2013 | 2014 | 2015 | 2016 | 2017 | 2018 | 2019 | 2020 | 2021 | IBNR Reserves [1] | Claims Reported | ||||||||||||||||||||||||||
| 2012 | $ | 107 | $ | 99 | $ | 93 | $ | 88 | $ | 115 | $ | 120 | $ | 119 | $ | 120 | $ | 120 | $ | 120 | $ | — | 1,468 | |||||||||||||||
| 2013 | 115 | 119 | 103 | 105 | 102 | 102 | 103 | 103 | 103 | (1) | 1,656 | |||||||||||||||||||||||||||
| 2014 | 119 | 142 | 122 | 118 | 115 | 116 | 116 | 115 | (1) | 1,820 | ||||||||||||||||||||||||||||
| 2015 | 102 | 92 | 94 | 94 | 95 | 96 | 96 | — | 1,582 | |||||||||||||||||||||||||||||
| 2016 | 89 | 91 | 98 | 100 | 102 | 102 | (5) | 1,730 | ||||||||||||||||||||||||||||||
| 2017 | 129 | 153 | 162 | 157 | 153 | (3) | 2,166 | |||||||||||||||||||||||||||||||
| 2018 | 129 | 128 | 130 | 135 | (13) | 2,263 | ||||||||||||||||||||||||||||||||
| 2019 | 181 | 190 | 187 | 20 | 2,522 | |||||||||||||||||||||||||||||||||
| 2020 | 183 | 181 | 71 | 1,623 | ||||||||||||||||||||||||||||||||||
| 2021 | 192 | 104 | 584 | |||||||||||||||||||||||||||||||||||
| Total | $ | 1,384 | ||||||||||||||||||||||||||||||||||||
[1]Contributing to the negative IBNR reserves for some accident years is a lag in the timing of expected reinsurance recoveries under the Navigators ADC with NICO. Recoveries from NICO will not be collected until the Company has cumulative loss payments for all covered lines of more than the attachment point.
| Cumulative Paid Losses & Allocated Loss Adjustment Expenses, Net of Reinsurance | ||||||||||||||||||||||||||||||||
| For the years ended December 31, | ||||||||||||||||||||||||||||||||
| (Unaudited) | ||||||||||||||||||||||||||||||||
| Accident Year | 2012 | 2013 | 2014 | 2015 | 2016 | 2017 | 2018 | 2019 | 2020 | 2021 | ||||||||||||||||||||||
| 2012 | $ | 38 | $ | 77 | $ | 83 | $ | 85 | $ | 112 | $ | 118 | $ | 118 | $ | 119 | $ | 119 | $ | 119 | ||||||||||||
| 2013 | 53 | 83 | 91 | 98 | 100 | 101 | 103 | 103 | 103 | |||||||||||||||||||||||
| 2014 | 66 | 119 | 106 | 109 | 112 | 113 | 114 | 115 | ||||||||||||||||||||||||
| 2015 | 42 | 65 | 77 | 83 | 91 | 94 | 95 | |||||||||||||||||||||||||
| 2016 | 36 | 66 | 84 | 90 | 95 | 97 | ||||||||||||||||||||||||||
| 2017 | 44 | 116 | 135 | 145 | 147 | |||||||||||||||||||||||||||
| 2018 | 25 | 112 | 134 | 140 | ||||||||||||||||||||||||||||
| 2019 | 62 | 132 | 154 | |||||||||||||||||||||||||||||
| 2020 | 50 | 90 | ||||||||||||||||||||||||||||||
| 2021 | 46 | |||||||||||||||||||||||||||||||
| Total | $ | 1,106 | ||||||||||||||||||||||||||||||
190
|
| Note 12 - Reserves for Unpaid Loss and Loss Adjustment Expenses | ||||||||
THE HARTFORD FINANCIAL SERVICES GROUP, INC.
NOTES TO CONSOLIDATED FINANCIAL STATEMENTS (continued)
Personal Automobile Liability
| Incurred Losses & Allocated Loss Adjustment Expenses, Net of Reinsurance | ||||||||||||||||||||||||||||||||||||||
| For the years ended December 31, | ||||||||||||||||||||||||||||||||||||||
| (Unaudited) | ||||||||||||||||||||||||||||||||||||||
| Accident Year | 2012 | 2013 | 2014 | 2015 | 2016 | 2017 | 2018 | 2019 | 2020 | 2021 | IBNR Reserves | Claims Reported | ||||||||||||||||||||||||||
| 2012 | $ | 1,141 | $ | 1,149 | $ | 1,146 | $ | 1,142 | $ | 1,133 | $ | 1,130 | $ | 1,130 | $ | 1,130 | $ | 1,129 | $ | 1,128 | $ | 4 | 210,757 | |||||||||||||||
| 2013 | 1,131 | 1,145 | 1,144 | 1,153 | 1,152 | 1,153 | 1,157 | 1,156 | 1,155 | 6 | 205,485 | |||||||||||||||||||||||||||
| 2014 | 1,146 | 1,153 | 1,198 | 1,200 | 1,199 | 1,202 | 1,201 | 1,199 | 6 | 209,022 | ||||||||||||||||||||||||||||
| 2015 | 1,195 | 1,340 | 1,338 | 1,330 | 1,331 | 1,328 | 1,324 | 8 | 216,889 | |||||||||||||||||||||||||||||
| 2016 | 1,407 | 1,402 | 1,393 | 1,397 | 1,395 | 1,386 | 11 | 215,839 | ||||||||||||||||||||||||||||||
| 2017 | 1,277 | 1,275 | 1,228 | 1,214 | 1,200 | 18 | 187,513 | |||||||||||||||||||||||||||||||
| 2018 | 1,108 | 1,104 | 1,072 | 1,058 | 51 | 156,152 | ||||||||||||||||||||||||||||||||
| 2019 | 1,018 | 1,010 | 991 | 97 | 139,360 | |||||||||||||||||||||||||||||||||
| 2020 | 805 | 782 | 192 | 95,755 | ||||||||||||||||||||||||||||||||||
| 2021 | 881 | 444 | 94,494 | |||||||||||||||||||||||||||||||||||
| Total | $ | 11,104 | ||||||||||||||||||||||||||||||||||||
| Cumulative Paid Losses & Allocated Loss Adjustment Expenses, Net of Reinsurance | ||||||||||||||||||||||||||||||||
| For the years ended December 31, | ||||||||||||||||||||||||||||||||
| (Unaudited) | ||||||||||||||||||||||||||||||||
| Accident Year | 2012 | 2013 | 2014 | 2015 | 2016 | 2017 | 2018 | 2019 | 2020 | 2021 | ||||||||||||||||||||||
| 2012 | $ | 441 | $ | 818 | $ | 986 | $ | 1,067 | $ | 1,104 | $ | 1,114 | $ | 1,120 | $ | 1,122 | $ | 1,123 | $ | 1,123 | ||||||||||||
| 2013 | 442 | 816 | 1,002 | 1,091 | 1,121 | 1,135 | 1,142 | 1,144 | 1,148 | |||||||||||||||||||||||
| 2014 | 430 | 843 | 1,032 | 1,125 | 1,165 | 1,182 | 1,186 | 1,190 | ||||||||||||||||||||||||
| 2015 | 475 | 935 | 1,142 | 1,243 | 1,292 | 1,304 | 1,310 | |||||||||||||||||||||||||
| 2016 | 505 | 968 | 1,188 | 1,308 | 1,345 | 1,363 | ||||||||||||||||||||||||||
| 2017 | 441 | 836 | 1,033 | 1,123 | 1,161 | |||||||||||||||||||||||||||
| 2018 | 359 | 710 | 888 | 965 | ||||||||||||||||||||||||||||
| 2019 | 323 | 654 | 816 | |||||||||||||||||||||||||||||
| 2020 | 238 | 486 | ||||||||||||||||||||||||||||||
| 2021 | 247 | |||||||||||||||||||||||||||||||
| Total | $ | 9,809 | ||||||||||||||||||||||||||||||
191
|
| Note 12 - Reserves for Unpaid Loss and Loss Adjustment Expenses | ||||||||
THE HARTFORD FINANCIAL SERVICES GROUP, INC.
NOTES TO CONSOLIDATED FINANCIAL STATEMENTS (continued)
Personal Automobile Physical Damage
| Incurred Losses & Allocated Loss Adjustment Expenses, Net of Reinsurance | |||||||||||||||||
| For the years ended December 31, | |||||||||||||||||
| (Unaudited) | |||||||||||||||||
| Accident Year | 2019 | 2020 | 2021 | IBNR Reserves | Claims Reported | ||||||||||||
| 2019 | $ | 445 | $ | 442 | $ | 441 | $ | — | 277,060 | ||||||||
| 2020 | 349 | 346 | 5 | 210,783 | |||||||||||||
| 2021 | 413 | (6) | 213,209 | ||||||||||||||
| Total | $ | 1,200 | |||||||||||||||
| Cumulative Paid Losses & Allocated Loss Adjustment Expenses, Net of Reinsurance | |||||||||||
| For the years ended December 31, | |||||||||||
| (Unaudited) | |||||||||||
| Accident Year | 2019 | 2020 | 2021 | ||||||||
| 2019 | $ | 427 | $ | 441 | $ | 441 | |||||
| 2020 | 333 | 341 | |||||||||
| 2021 | 388 | ||||||||||
| Total | $ | 1,170 | |||||||||
192
|
| Note 12 - Reserves for Unpaid Loss and Loss Adjustment Expenses | ||||||||
THE HARTFORD FINANCIAL SERVICES GROUP, INC.
NOTES TO CONSOLIDATED FINANCIAL STATEMENTS (continued)
Homeowners
| Incurred Losses & Allocated Loss Adjustment Expenses, Net of Reinsurance | ||||||||||||||||||||||||||||||||||||||
| For the years ended December 31, | ||||||||||||||||||||||||||||||||||||||
| (Unaudited) | ||||||||||||||||||||||||||||||||||||||
| Accident Year | 2012 | 2013 | 2014 | 2015 | 2016 | 2017 | 2018 | 2019 | 2020 | 2021 | IBNR Reserves | Claims Reported | ||||||||||||||||||||||||||
| 2012 | $ | 774 | $ | 741 | $ | 741 | $ | 741 | $ | 739 | $ | 738 | $ | 738 | $ | 738 | $ | 737 | $ | 737 | $ | — | 142,860 | |||||||||||||||
| 2013 | 673 | 638 | 637 | 634 | 632 | 630 | 629 | 630 | 629 | 1 | 113,552 | |||||||||||||||||||||||||||
| 2014 | 710 | 707 | 702 | 700 | 698 | 698 | 698 | 698 | — | 121,923 | ||||||||||||||||||||||||||||
| 2015 | 690 | 703 | 690 | 684 | 684 | 684 | 684 | 1 | 119,997 | |||||||||||||||||||||||||||||
| 2016 | 669 | 673 | 663 | 658 | 658 | 658 | 2 | 119,793 | ||||||||||||||||||||||||||||||
| 2017 | 866 | 889 | 884 | 783 | 775 | 6 | 124,713 | |||||||||||||||||||||||||||||||
| 2018 | 903 | 910 | 673 | 642 | (6) | 102,784 | ||||||||||||||||||||||||||||||||
| 2019 | 501 | 475 | 470 | 13 | 84,536 | |||||||||||||||||||||||||||||||||
| 2020 | 525 | 512 | 26 | 87,841 | ||||||||||||||||||||||||||||||||||
| 2021 | 502 | 107 | 71,196 | |||||||||||||||||||||||||||||||||||
| Total | $ | 6,307 | ||||||||||||||||||||||||||||||||||||
| Cumulative Paid Losses & Allocated Loss Adjustment Expenses, Net of Reinsurance | ||||||||||||||||||||||||||||||||
| For the years ended December 31, | ||||||||||||||||||||||||||||||||
| (Unaudited) | ||||||||||||||||||||||||||||||||
| Accident Year | 2012 | 2013 | 2014 | 2015 | 2016 | 2017 | 2018 | 2019 | 2020 | 2021 | ||||||||||||||||||||||
| 2012 | $ | 547 | $ | 696 | $ | 719 | $ | 727 | $ | 731 | $ | 734 | $ | 735 | $ | 736 | $ | 736 | $ | 736 | ||||||||||||
| 2013 | 467 | 590 | 611 | 622 | 626 | 627 | 628 | 628 | 628 | |||||||||||||||||||||||
| 2014 | 526 | 663 | 684 | 691 | 695 | 697 | 697 | 698 | ||||||||||||||||||||||||
| 2015 | 487 | 645 | 665 | 674 | 680 | 681 | 681 | |||||||||||||||||||||||||
| 2016 | 481 | 621 | 640 | 649 | 653 | 655 | ||||||||||||||||||||||||||
| 2017 | 538 | 747 | 795 | 757 | 761 | |||||||||||||||||||||||||||
| 2018 | 484 | 712 | 616 | 619 | ||||||||||||||||||||||||||||
| 2019 | 318 | 425 | 445 | |||||||||||||||||||||||||||||
| 2020 | 335 | 454 | ||||||||||||||||||||||||||||||
| 2021 | 305 | |||||||||||||||||||||||||||||||
| Total | $ | 5,982 | ||||||||||||||||||||||||||||||
Property and casualty reserves, including IBNR reserves
The Company estimates ultimate losses and allocated loss adjustment expenses by accident year. IBNR represents the excess of estimated ultimate loss reserves over case reserves. The process to estimate ultimate losses and loss adjustment expenses is an integral part of the Company's reserve setting. Reserves for allocated and unallocated loss adjustment expenses are generally established separate from the reserves for losses.
Reserves for losses are set by line of business within the reporting segments. Case reserves are established by a claims handler on each individual claim and are adjusted as new information becomes known during the course of handling the
claim. Lines of business for which reported losses emerge over a long period of time are referred to as long-tail lines of business. Lines of business for which reported losses emerge more quickly are referred to as short-tail lines of business. The Company’s shortest tail lines of business are homeowners, commercial property and automobile physical damage. The longest tail lines of business include workers’ compensation, general liability and professional liability. For short-tail lines of business, emergence of paid loss and case reserves is credible and likely indicative of ultimate losses. For long-tail lines of business, emergence of paid losses and case reserves is less credible in the early periods after a given accident year and, accordingly, may not be indicative of ultimate losses.
The Company’s reserving actuaries regularly review reserves for both current and prior accident years using the most current
193
|
| Note 12 - Reserves for Unpaid Loss and Loss Adjustment Expenses | ||||||||
THE HARTFORD FINANCIAL SERVICES GROUP, INC.
NOTES TO CONSOLIDATED FINANCIAL STATEMENTS (continued)
claim data. A variety of actuarial methods and judgments are used for most lines of business to arrive at selections of estimated ultimate losses and loss adjustment expenses. The reserve selections incorporate input, as appropriate, from claims personnel, pricing actuaries and operating management about reported loss cost trends and other factors that could affect the reserve estimates.
For both short-tail and long-tail lines of business, an expected loss ratio is used to record initial reserves. This expected loss ratio is determined by starting with the average loss ratio of recent prior accident years and adjusting that ratio for the effect of expected changes to earned pricing, loss frequency and severity, mix of business, ceded reinsurance and other factors. For short-tail lines, IBNR for the current accident year is initially recorded as the product of the expected loss ratio for the period, earned premium for the period and the proportion of losses expected to be reported in future calendar periods for the current accident period. For long-tailed lines, IBNR reserves for the current accident year are initially recorded as the product of the expected loss ratio for the period and the earned premium for the period, less reported losses for the period. For certain short-tailed lines of business, IBNR amounts in the above loss development triangles are negative due to anticipated salvage and subrogation recoveries on paid losses.
As losses for a given accident year emerge or develop in subsequent periods, reserving actuaries use other methods to estimate ultimate unpaid losses in addition to the expected loss ratio method. These primarily include paid and reported loss development methods, frequency/severity techniques and the Bornhuetter-Ferguson method (a combination of the expected loss ratio and paid development or reported development method). Within any one line of business, the methods that are given more weight vary based primarily on the maturity of the accident year, the mix of business and the particular internal and external influences impacting the claims experience or the methods. The output of the reserve reviews are reserve estimates that are referred to as actuarial indications.
Paid development and reported development techniques are used for most lines of business though more weight is given to the reported development method for some of the long-tailed lines like general liability. In addition, for long-tailed lines of business, the Company relies on the expected loss ratio method for immature accident years. Frequency/severity techniques are used predominantly for professional liability and are also used for automobile liability. The Berquist-Sherman technique is also used for automobile liability, marine and assumed reinsurance. For most lines, reserves for allocated loss adjustment expenses ("ALAE", or those expenses related to specific claims) are analyzed using paid development techniques and an analysis of the relationship between ALAE and loss payments. For most of the lines acquired through the Navigators Group book of business, loss and ALAE are reviewed on a combined basis. Reserves for ULAE are determined using the expected cost per claim year and the anticipated claim closure pattern as well as the ratio of paid ULAE to paid losses.
The recorded reserve for losses and loss adjustment expenses represents the actuarial best estimate of the ultimate settlement amount of unpaid losses and loss adjustment expenses. In applying judgment, actuaries select the best estimate after considering the estimates derived from a number of actuarial
methods, giving more weight to those methods deemed more predictive of ultimate unpaid losses and loss adjustment expenses. The Company does not produce a statistical range or confidence interval of reserve estimates and, since reserving methods with more credibility are given greater weight, the selected best estimate may differ from the mid-point of the various estimates produced by the actuarial methods used.
Cumulative number of reported claims
For most property and casualty lines, claim counts represent the number of claim features on a reported claim where a claim feature is each separate coverage for each claimant affected by the claim event. For example, one car accident that results in two bodily injury claims and one automobile damage liability claim would be counted as three claims within the personal automobile liability triangle. Similarly, a fire that impacts one commercial building may result in multiple claim features due to the potential for claims related to business interruption, structural damage, and loss of the physical contents of the building. Claim features that result in no paid losses are included in the reported claim counts. For some property and casualty lines, such as marine and assumed reinsurance, a claim count represents each reported claim regardless of the number of features. For assumed bordereau business and business written on binders, one claim count is posted for each bordereau received, which could account for multiple claims.
194
|
| Note 12 - Reserves for Unpaid Loss and Loss Adjustment Expenses | ||||||||
THE HARTFORD FINANCIAL SERVICES GROUP, INC.
NOTES TO CONSOLIDATED FINANCIAL STATEMENTS (continued)
| Average Annual Percentage Payout of Incurred Claims by Age, Net of Reinsurance [1] | ||||||||||||||||||||||||||||||||
| (Unaudited) | ||||||||||||||||||||||||||||||||
| Reserve Line | 1st Year | 2nd Year | 3rd Year | 4th Year | 5th Year | 6th Year | 7th Year | 8th Year | 9th Year | 10th Year | ||||||||||||||||||||||
| Workers' compensation | 15.1 | % | 18.7 | % | 12.3 | % | 8.2 | % | 5.4 | % | 4.0 | % | 2.6 | % | 2.1 | % | 1.4 | % | 1.3 | % | ||||||||||||
| General liability | 2.9 | % | 7.8 | % | 14.2 | % | 18.2 | % | 16.6 | % | 11.2 | % | 6.9 | % | 4.5 | % | 3.1 | % | 4.8 | % | ||||||||||||
| Marine | 25.3 | % | 31.4 | % | 17.5 | % | 8.0 | % | 6.6 | % | 3.4 | % | 1.9 | % | 3.1 | % | — | % | 0.7 | % | ||||||||||||
| Package business | 37.4 | % | 21.8 | % | 10.4 | % | 8.6 | % | 6.2 | % | 3.2 | % | 2.1 | % | 1.2 | % | 0.4 | % | 0.3 | % | ||||||||||||
| Commercial property | 53.5 | % | 30.6 | % | 7.7 | % | 3.0 | % | 1.0 | % | 0.5 | % | 0.1 | % | (0.1 | %) | (0.1 | %) | — | % | ||||||||||||
| Commercial automobile liability | 15.8 | % | 20.3 | % | 20.6 | % | 17.6 | % | 11.4 | % | 4.5 | % | 2.7 | % | 0.8 | % | 0.5 | % | 0.4 | % | ||||||||||||
| Commercial automobile physical damage | 88.0 | % | 9.7 | % | (0.4 | %) | ||||||||||||||||||||||||||
| Professional liability | 5.3 | % | 18.4 | % | 18.7 | % | 14.3 | % | 10.8 | % | 7.6 | % | 5.9 | % | 1.1 | % | 1.6 | % | 0.7 | % | ||||||||||||
| Bond | 12.2 | % | 22.2 | % | 10.3 | % | 4.6 | % | (0.2 | %) | (0.5 | %) | 4.4 | % | 1.8 | % | (0.2 | %) | (1.6 | %) | ||||||||||||
| Assumed Reinsurance | 35.2 | % | 36.9 | % | 9.1 | % | 4.9 | % | 7.0 | % | 2.4 | % | 1.0 | % | 0.3 | % | 0.3 | % | 0.1 | % | ||||||||||||
| Personal automobile liability | 34.7 | % | 33.3 | % | 16.0 | % | 7.7 | % | 3.1 | % | 1.2 | % | 0.5 | % | 0.2 | % | 0.2 | % | — | % | ||||||||||||
| Personal automobile physical damage | 95.7 | % | 2.7 | % | (0.1 | %) | ||||||||||||||||||||||||||
| Homeowners | 70.7 | % | 23.5 | % | 1.4 | % | 0.3 | % | 0.6 | % | 0.3 | % | 0.1 | % | 0.1 | % | — | % | — | % | ||||||||||||
|GROUP LIFE, DISABILITY AND ACCIDENT PRODUCTS
Rollforward of Liabilities for Unpaid Losses and Loss Adjustment Expenses
| For the years ended December 31, | |||||||||||
| 2021 | 2020 | 2019 | |||||||||
| Beginning liabilities for unpaid losses and loss adjustment expenses, gross | $ | 8,233 | $ | 8,256 | $ | 8,445 | |||||
| Reinsurance recoverables [1] | 237 | 247 | 239 | ||||||||
| Beginning liabilities for unpaid losses and loss adjustment expenses, net | 7,996 | 8,009 | 8,206 | ||||||||
| Provision for unpaid losses and loss adjustment expenses | |||||||||||
| Current incurral year | 5,021 | 4,511 | 4,385 | ||||||||
| Prior year's discount accretion | 201 | 209 | 219 | ||||||||
| Prior incurral year development [2] | (458) | (445) | (410) | ||||||||
| Total provision for unpaid losses and loss adjustment expenses [3] | 4,764 | 4,275 | 4,194 | ||||||||
| Payments | |||||||||||
| Current incurral year | (2,631) | (2,288) | (2,277) | ||||||||
| Prior incurral years | (2,164) | (2,000) | (2,114) | ||||||||
| Total payments | (4,795) | (4,288) | (4,391) | ||||||||
| Ending liabilities for unpaid losses and loss adjustment expenses, net | 7,965 | 7,996 | 8,009 | ||||||||
| Reinsurance recoverables | 245 | 237 | 247 | ||||||||
| Ending liabilities for unpaid losses and loss adjustment expenses, gross | $ | 8,210 | $ | 8,233 | $ | 8,256 | |||||
[1] Includes a cumulative effect adjustment of $(1) representing an adjustment to the ACL recorded on adoption of accounting guidance for credit losses on January 1, 2020. See Note 1 - Basis of Presentation and Significant Accounting Policies.
[2]Prior incurral year development represents the change in estimated ultimate incurred losses and loss adjustment expenses for prior incurral years on a discounted basis.
[3]Includes unallocated loss adjustment expenses of $179, $178 and $178 for the years ended December 31, 2021, 2020 and 2019, respectively, that are recorded in insurance operating costs and other expenses in the Consolidated Statements of Operations.
195
|
| Note 12 - Reserves for Unpaid Loss and Loss Adjustment Expenses | ||||||||
THE HARTFORD FINANCIAL SERVICES GROUP, INC.
NOTES TO CONSOLIDATED FINANCIAL STATEMENTS (continued)
Group Life, Disability and Accident Products Reserves, Net of Reinsurance, that are Discounted
| For the years ended December 31, | |||||||||||||||||||||||||||||
| 2021 | 2020 | 2019 | |||||||||||||||||||||||||||
| Liability for unpaid losses and loss adjustment expenses, at undiscounted amounts | $ | 8,176 | $ | 8,380 | $ | 8,636 | |||||||||||||||||||||||
| Amount of discount | (1,304) | (1,353) | (1,401) | ||||||||||||||||||||||||||
| Carrying value of liability for unpaid losses and loss adjustment expenses | $ | 6,872 | $ | 7,027 | $ | 7,235 | |||||||||||||||||||||||
| Weighted average discount rate | 3.3 | % | 3.4 | % | 3.4 | % | |||||||||||||||||||||||
| Range of discount rate | 2.1 | % | - | 8.0 | % | 2.1 | % | - | 8.0 | % | 2.1 | % | - | 8.0 | % | ||||||||||||||
Reserves are discounted at rates in effect at the time claims were incurred, ranging from 2.1% for life and disability reserves acquired from Aetna based on interest rates in effect at the acquisition date of November 1, 2017, to 8.0% for the Company’s pre-acquisition reserves for incurral year 1990, and vary by product. Prior year's discount accretion has been calculated as the average reserve balance for the year times the weighted average discount rate.
2021 re-estimates of prior incurral year reserves
Group disability- Prior period reserve estimates decreased by approximately $380 largely driven by group long-term disability claim incidence lower than prior assumptions together with strong recoveries on prior incurral year claims, and by a New York Paid Family Leave program refund.
Group life and accident (including group life premium waiver)- Prior period reserve estimates decreased by approximately $65 largely driven by lower-than-previously expected claim incidence in both group life premium waiver and group accidental death and dismemberment.
Supplemental Accident & Health- Prior period reserve estimates decreased by approximately $10 driven by lower-than-previously expected claim incidence during the pandemic.
2020 re-estimates of prior incurral year reserves
Group disability- Prior period reserve estimates decreased by approximately $365 largely driven by group long-term disability lower claim incidence and higher recoveries on prior incurral year claims, and a refund on the New York Paid Family Leave program.
Group life and accident (including group life premium waiver)- Prior period reserve estimates decreased by approximately $65 largely driven by lower-than-previously expected claim incidence in group life premium waiver.
Supplemental Accident & Health- Prior period reserve estimates decreased by approximately $15 driven by lower-than-expected emergence of prior year claims, especially for voluntary critical Illness and voluntary accident products.
2019 re-estimates of prior incurral year reserves
Group disability- Prior period reserve estimates decreased by approximately $340 largely driven by group long-term disability claim incidence lower than prior assumptions and strong recoveries on prior incurral year claims, including the impact of updating Long-term Disability ("LTD") recovery probabilities to be based on more recent experience. New York Paid Family Leave also experienced favorable claim emergence including an experience refund.
Group life and accident (including group life premium waiver)- Prior period reserve estimates decreased by approximately $60 largely driven by lower-than-previously expected claim incidence in group life premium waiver.
196
|
| Note 12 - Reserves for Unpaid Loss and Loss Adjustment Expenses | ||||||||
THE HARTFORD FINANCIAL SERVICES GROUP, INC.
NOTES TO CONSOLIDATED FINANCIAL STATEMENTS (continued)
Reconciliation of Loss Development to Liability for Unpaid Losses and Loss Adjustment Expenses as of December 31, 2021
| Losses and Allocated Loss Adjustment Expenses, Net of Reinsurance | Subtotal | |||||||||||||||||||||||||
| Reserve Line | Cumulative Incurred for Incurral Years Displayed in Triangles | Cumulative Paid for Incurral Years Displayed in Triangles | Unpaid for Incurral Years not Displayed in Triangles | Unpaid Unallocated Loss Adjustment Expenses, Net of Reinsurance | Discount | Unpaid Losses and Loss Adjustment Expenses, Net of Reinsurance | Reinsurance and Other Recoverables | Liability for Unpaid Losses and Loss Adjustment Expenses | ||||||||||||||||||
| Group long-term disability | $ | 14,113 | $ | (8,219) | $ | 1,546 | $ | 189 | $ | (1,192) | $ | 6,437 | $ | 234 | $ | 6,671 | ||||||||||
| Group life and accident, excluding premium waiver | 6,323 | (5,644) | 163 | 4 | (18) | 828 | 5 | 833 | ||||||||||||||||||
| Group short-term disability | 124 | 5 | — | 129 | — | 129 | ||||||||||||||||||||
| Group life premium waiver | 620 | 11 | (94) | 537 | 1 | 538 | ||||||||||||||||||||
| Group supplemental health | 34 | — | 0 | 34 | 5 | 39 | ||||||||||||||||||||
| Total Group Benefits | $ | 20,436 | $ | (13,863) | $ | 2,487 | $ | 209 | $ | (1,304) | $ | 7,965 | $ | 245 | $ | 8,210 | ||||||||||
The following loss triangles present historical loss development for incurred and paid claims by the year the insured claim occurred, referred to as the incurral year. Triangles are limited to the number of years for which claims incurred typically remain
outstanding, not exceeding ten years. Short-tail lines, which represent claims generally expected to be paid within a few years, have three years of claim development displayed.
Group Long-Term Disability
| Undiscounted Incurred Losses & Allocated Loss Adjustment Expenses, Net of Reinsurance | ||||||||||||||||||||||||||||||||||||||
| For the years ended December 31, | ||||||||||||||||||||||||||||||||||||||
| (Unaudited) | ||||||||||||||||||||||||||||||||||||||
Incurral Year | 2012 | 2013 | 2014 | 2015 | 2016 | 2017 | 2018 | 2019 | 2020 | 2021 | IBNR Reserves | Claims Reported | ||||||||||||||||||||||||||
| 2012 | $ | 1,829 | $ | 1,605 | $ | 1,539 | $ | 1,532 | $ | 1,530 | $ | 1,515 | $ | 1,504 | $ | 1,486 | $ | 1,479 | $ | 1,474 | $ | — | 35,814 | |||||||||||||||
| 2013 | 1,660 | 1,479 | 1,429 | 1,429 | 1,416 | 1,413 | 1,399 | 1,385 | 1,378 | — | 30,757 | |||||||||||||||||||||||||||
| 2014 | 1,636 | 1,473 | 1,430 | 1,431 | 1,431 | 1,408 | 1,395 | 1,389 | — | 31,927 | ||||||||||||||||||||||||||||
| 2015 | 1,595 | 1,442 | 1,422 | 1,420 | 1,401 | 1,385 | 1,380 | — | 32,727 | |||||||||||||||||||||||||||||
| 2016 | 1,651 | 1,481 | 1,468 | 1,437 | 1,417 | 1,409 | — | 33,301 | ||||||||||||||||||||||||||||||
| 2017 | 1,597 | 1,413 | 1,358 | 1,316 | 1,304 | 1 | 30,902 | |||||||||||||||||||||||||||||||
| 2018 | 1,647 | 1,387 | 1,309 | 1,277 | 1 | 28,403 | ||||||||||||||||||||||||||||||||
| 2019 | 1,650 | 1,424 | 1,327 | 5 | 27,375 | |||||||||||||||||||||||||||||||||
| 2020 | 1,686 | 1,407 | 29 | 25,503 | ||||||||||||||||||||||||||||||||||
| 2021 | 1,768 | 881 | 17,132 | |||||||||||||||||||||||||||||||||||
| Total | $ | 14,113 | ||||||||||||||||||||||||||||||||||||
197
|
| Note 12 - Reserves for Unpaid Loss and Loss Adjustment Expenses | ||||||||
THE HARTFORD FINANCIAL SERVICES GROUP, INC.
NOTES TO CONSOLIDATED FINANCIAL STATEMENTS (continued)
| Cumulative Paid Losses & Allocated Loss Adjustment Expenses, Net of Reinsurance | ||||||||||||||||||||||||||||||||
| For the years ended December 31, | ||||||||||||||||||||||||||||||||
| (Unaudited) | ||||||||||||||||||||||||||||||||
| Incurral Year | 2012 | 2013 | 2014 | 2015 | 2016 | 2017 | 2018 | 2019 | 2020 | 2021 | ||||||||||||||||||||||
| 2012 | $ | 108 | $ | 483 | $ | 708 | $ | 835 | $ | 933 | $ | 1,014 | $ | 1,080 | $ | 1,138 | $ | 1,185 | $ | 1,227 | ||||||||||||
| 2013 | 102 | 443 | 664 | 791 | 881 | 954 | 1,016 | 1,067 | 1,113 | |||||||||||||||||||||||
| 2014 | 103 | 448 | 675 | 801 | 884 | 960 | 1,025 | 1,079 | ||||||||||||||||||||||||
| 2015 | 108 | 460 | 687 | 806 | 891 | 962 | 1,025 | |||||||||||||||||||||||||
| 2016 | 112 | 479 | 705 | 819 | 907 | 981 | ||||||||||||||||||||||||||
| 2017 | 109 | 452 | 658 | 757 | 842 | |||||||||||||||||||||||||||
| 2018 | 105 | 447 | 639 | 743 | ||||||||||||||||||||||||||||
| 2019 | 101 | 454 | 650 | |||||||||||||||||||||||||||||
| 2020 | 100 | 458 | ||||||||||||||||||||||||||||||
| 2021 | 101 | |||||||||||||||||||||||||||||||
| Total | $ | 8,219 | ||||||||||||||||||||||||||||||
Group Life and Accident, excluding Premium Waiver
| Undiscounted Incurred Losses & Allocated Loss Adjustment Expenses, Net of Reinsurance | |||||||||||||||||
| For the years ended December 31, | |||||||||||||||||
| (Unaudited) | |||||||||||||||||
| Incurral Year | 2019 | 2020 | 2021 | IBNR Reserves | Claims Reported | ||||||||||||
| 2019 | $ | 1,902 | $ | 1,866 | $ | 1,867 | $ | 9 | 57,811 | ||||||||
| 2020 | 2,072 | 2,072 | 21 | 60,509 | |||||||||||||
| 2021 | 2,384 | 467 | 51,507 | ||||||||||||||
| Total | $ | 6,323 | |||||||||||||||
| Cumulative Paid Losses & Allocated Loss Adjustment Expenses, Net of Reinsurance | |||||||||||
| For the years ended December 31, | |||||||||||
| (Unaudited) | |||||||||||
| Incurral Year | 2019 | 2020 | 2021 | ||||||||
| 2019 | $ | 1,471 | $ | 1,830 | $ | 1,847 | |||||
| 2020 | 1,524 | 2,033 | |||||||||
| 2021 | 1,764 | ||||||||||
| Total | $ | 5,644 | |||||||||
Group life, disability and accident reserves, including IBNR
The majority of Group Benefits’ reserves are for LTD claimants who are known to be disabled and are currently receiving benefits. A Disabled Life Reserve ("DLR") is calculated for each
LTD claim. The DLR for each claim is the expected present value of all estimated future benefit payments and includes estimates of claim recovery, investment yield, and offsets from other income, including offsets from Social Security benefits and workers’ compensation. Estimated future benefit payments represent the monthly income benefit that is paid until recovery, death or expiration of benefits. Claim recoveries are estimated based on claim characteristics such as age and diagnosis and represent an estimate of benefits that will terminate, generally as a result of the claimant returning to work or being deemed able to return to work. The DLR also includes a liability for payments to claimants who have not yet been approved for LTD. In these cases, the present value of future benefits is reduced for the likelihood of claim denial based on Company experience. For claims recently closed due to recovery, a portion of the DLR is retained for the possibility that the claim reopens upon further evidence of disability. In addition, a reserve for estimated unpaid claim expenses is included in the DLR.
For incurral years with IBNR claims, estimates of ultimate losses are made by applying completion factors to the dollar amount of claims reported or expected depending on the market segment. IBNR represents estimated ultimate losses less both DLR and cumulative paid amounts for all reported claims. Completion factors are derived using standard actuarial techniques using triangles that display historical claim count emergence by incurral month. These estimates are reviewed for reasonableness and are adjusted for current trends and other factors expected to cause a change in claim emergence. The IBNR includes an estimate of unpaid claim expenses, including a provision for the cost of initial set-up of the claim once reported.
198
|
| Note 12 - Reserves for Unpaid Loss and Loss Adjustment Expenses | ||||||||
THE HARTFORD FINANCIAL SERVICES GROUP, INC.
NOTES TO CONSOLIDATED FINANCIAL STATEMENTS (continued)
For all products, including LTD, there is a period generally ranging from two to twelve months, depending on the product and market segment, where emerged claim information for an incurral year is not yet credible enough to be a basis for an IBNR projection. In these cases, the ultimate losses and allocated loss adjustment expenses are estimated using earned premium multiplied by an expected loss ratio.
The Company also records reserves for future death benefits under group term life policies that provide for premiums to be waived in the event the insured is unable to work due to disability and has satisfied an elimination period, which is typically nine months (premium waiver reserves). The death benefit reserve for these group life premium waiver claims is estimated for a known disabled claimant equal to the present value of expected future cash outflows (typically a lump sum face amount payable at death plus claim expenses) with separate estimates for claimant recovery (when no death benefit is payable) and for death before recovery or benefit expiry (when death benefit is payable). The IBNR for premium waiver death benefits is estimated with standard actuarial development methods.
In addition, the Company also records reserves for group term life, accidental death & dismemberment, short term disability, and other group products that have short claim payout periods. For these products, reserves are determined using paid or reported actuarial development methods. The resulting claim triangles produce a completion pattern and estimate of ultimate loss. IBNR for these lines of business equals the estimated ultimate losses and loss adjustment expenses less the amount of paid or reported claims depending on whether the paid or reported development method was used. Estimates are reviewed for reasonableness and are adjusted for current trends or other factors that affect the development pattern.
Cumulative number of reported claims
For group life, disability and accident coverages, claim counts include claims that are approved, pending approval and terminated and exclude denied claims. Due to the nature of the claims, one claimant represents one event.
| Average Annual Percentage Payout of Incurred Claims by Age, Net of Reinsurance | |||||||||||||||||||||||||||||||||||
| (Unaudited) | |||||||||||||||||||||||||||||||||||
| 1st Year | 2nd Year | 3rd Year | 4th Year | 5th Year | 6th Year | 7th Year | 8th Year | 9th Year | 10th Year | ||||||||||||||||||||||||||
| Group long-term disability | 7.5 | % | 25.8 | % | 15.7 | % | 8.5 | % | 6.3 | % | 5.4 | % | 4.5 | % | 3.8 | % | 3.3 | % | 2.8 | % | |||||||||||||||
| Group life and accident, excluding premium waiver | 75.4 | % | 21.9 | % | 1.0 | % | |||||||||||||||||||||||||||||
13. RESERVE FOR FUTURE POLICY BENEFITS
Changes in Reserves for Future Policy Benefits [1] | |||||||||||
| For the years ended December 31, | |||||||||||
| 2021 | 2020 | ||||||||||
| Beginning liability balance | $ | 638 | $ | 635 | |||||||
| Incurred | 61 | 85 | |||||||||
| Paid | (94) | (85) | |||||||||
| Change in unrealized investment gains and losses | (9) | 3 | |||||||||
| Ending liability balance | $ | 596 | $ | 638 | |||||||
| Ending reinsurance recoverable asset | $ | 22 | $ | 28 | |||||||
[1]Reserve for future policy benefits includes paid-up life insurance and whole-life policies resulting from conversion from group life policies included within the Group Benefits segment and reserves for run-off structured settlement and terminal funding agreement liabilities, which are in the Corporate category.
199
THE HARTFORD FINANCIAL SERVICES GROUP, INC.
NOTES TO CONSOLIDATED FINANCIAL STATEMENTS (continued)
14. DEBT
The Company’s long-term debt securities are issued by Hartford Financial Services Group, Inc. ("HFSG Holding Company"), are unsecured obligations of HFSG Holding Company, and rank on a parity with all other unsecured and unsubordinated indebtedness of HFSG Holding Company.
Debt is carried net of discount and issuance cost.
Interest expense on debt is included in the Corporate category for segment reporting.
Long-term Debt by Issuance
| As of December 31, | |||||||||||
| 2021 | 2020 | ||||||||||
| Revolving Credit Facilities | $ | — | $ | — | |||||||
| Senior Notes and Debentures | |||||||||||
| 2.8% Notes, due 2029 | 600 | 600 | |||||||||
| 5.95% Notes, due 2036 | 300 | 300 | |||||||||
| 6.625% Notes, due 2040 | 295 | 295 | |||||||||
| 6.1% Notes, due 2041 | 409 | 409 | |||||||||
| 6.625% Notes, due 2042 | 178 | 178 | |||||||||
| 4.3% Notes, due 2043 | 300 | 300 | |||||||||
| 4.4% Notes, due 2048 | 500 | 500 | |||||||||
| 3.6% Notes, due 2049 | 800 | 800 | |||||||||
| 2.9% Notes, due 2051 | 600 | — | |||||||||
| Junior Subordinated Debentures | |||||||||||
| 7.875% Notes, due 2042 | 600 | 600 | |||||||||
| 3 Month LIBOR + 2.125% Notes, due 2067 [1] | 500 | 500 | |||||||||
| Total Notes and Debentures | 5,082 | 4,482 | |||||||||
| Unamortized discount and debt issuance cost [2] | (138) | (130) | |||||||||
| Total Debt | 4,944 | 4,352 | |||||||||
| Less: Current maturities | — | — | |||||||||
| Long-Term Debt | $ | 4,944 | $ | 4,352 | |||||||
[1]In April 2017, the Company entered into an interest rate swap agreement expiring February 15, 2027 to effectively convert the variable interest payments for this debenture into fixed interest payments of approximately 4.39%.
[2]This amount includes unamortized discount of $74 and $75 as of December 31, 2021 and 2020, respectively, on the 6.1% Notes, due 2041.
The effective interest rate on the 6.1% senior notes due 2041 is 7.9%. The effective interest rate on the remaining notes does not differ materially from the stated rate. The Company incurred interest expense of $234, $236 and $259 on debt for the years ended December 31, 2021, 2020 and 2019, respectively.
Shelf Registrations
On May 17, 2019, the Company filed with the Securities and Exchange Commission an automatic shelf registration statement (Registration No. 333-231592) for the potential offering and sale of debt and equity securities. The registration statement allows for the following types of securities to be offered: debt securities, junior subordinated debt securities, guarantees, preferred stock,
common stock, depositary shares, warrants, stock purchase contracts, and stock purchase units. In that The Hartford is a well-known seasoned issuer, as defined in Rule 405 under the Securities Act of 1933, the registration statement went effective immediately upon filing and The Hartford may offer and sell an unlimited amount of securities under the registration statement during the three-year life of the registration statement.
Senior Notes
On September 21, 2021, The Hartford issued $600 of 2.9% senior notes (“2.9% Notes”) due September 15, 2051 for net proceeds of approximately $588, after deducting underwriting discounts and expenses from the offering. Interest is payable semi-annually in arrears on March 15 and September 15, commencing March 15, 2022. The Hartford, at its option, can redeem the 2.9% Notes at any time, in whole or part, at a redemption price equal to the greater of 100% of the principal amount being redeemed or a make-whole amount based on a comparable maturity US Treasury plus 20 basis points, plus any accrued and unpaid interest, except the 2.9% Notes may be redeemed at par within six months of maturity.
On March 30, 2020, The Hartford repaid at maturity the $500 principal amount of its 5.5% senior notes.
In the Navigators Group acquisition, the Company assumed $265 par value 5.75% Senior notes due on October 15, 2023 with a fair value of $284 as of the acquisition date.
On August 19, 2019, The Hartford issued $600 of 2.8% senior notes (“2.8% Notes”) due August 19, 2029 and $800 of 3.6% senior notes (“3.6% Notes”) due August 19, 2049 for net proceeds of approximately $1.38 billion, after deducting underwriting discounts and expenses. Under both senior note issuances, interest is payable semi-annually in arrears on August 19 and February 19, commencing February 19, 2020. The Hartford, at its option, can redeem the 2.8% Notes and the 3.6% Notes at any time, in whole or part, at a redemption price equal to the greater of 100% of the principal amount being redeemed or a make-whole amount based on a comparable maturity US Treasury rate plus a basis point spread, plus any accrued and unpaid interest, except the make-whole amount is not applicable within the final three months of maturity for the 2.8% Notes and the final six months of maturity for the 3.6% Notes. The spread over the comparable maturity US Treasury rates for determining the make-whole amount is 20 and 25 basis points for the 2.8% Notes and 3.6% Notes, respectively.
After receiving proceeds from the issuance of the 2.8% Notes and 3.6% Notes, in third quarter 2019, The Hartford repaid $265 of 5.75% senior notes due 2023 that had been assumed in the Navigators Group acquisition and $800 of 5.125% senior notes due 2022 of the Hartford Financial Services Group, Inc., and recognized a loss on extinguishment of debt of $90.
On January 15, 2019, The Hartford repaid at maturity the $413 principal amount of its 6.0% senior notes.
200
THE HARTFORD FINANCIAL SERVICES GROUP, INC.
NOTES TO CONSOLIDATED FINANCIAL STATEMENTS (continued)
Junior Subordinated Debentures
Junior Subordinated Debentures by Issuance as of December 31, 2021
| Issue | 7.875% Debentures | 3 Month LIBOR + 2.125% | ||||||||||||||||||
| Face Value | $ | 600 | $ | 500 | ||||||||||||||||
| Interest Rate [1] | 7.875 | % | [2] | N/A | [3] | |||||||||||||||
| Call Date | April 15, 2022 | February 15, 2022 | [4] | |||||||||||||||||
| Interest Rate Subsequent to Call Date [2] | 3 Month LIBOR + 5.596% | 3 Month LIBOR + 2.125% | [5] | |||||||||||||||||
| Final Maturity | April 15, 2042 | February 12, 2067 | ||||||||||||||||||
[1]Interest rate in effect until call date.
[2]Payable quarterly in arrears.
[3]Debentures were issued on the original call date of February 15, 2017. The interest rate is variable and resets quarterly.
[4]Although the original call date was February 15, 2017, a Replacement Capital Covenant associated with the debenture prohibits the Company from redeeming all or any portion of the notes on or prior to February 15, 2022, unless consent from covered bondholders is obtained.
[5]In April 2017, the company entered into an interest rate swap agreement expiring February 15, 2027 to effectively convert the interest payments for the 3 Month LIBOR + 2.125% debenture into fixed interest payments of approximately 4.39%.
The debentures are unsecured, subordinated and junior in right of payment and upon liquidation to all of the Company’s existing and future senior indebtedness. In addition, the debentures are effectively subordinated to all of the Company’s subsidiaries’ existing and future indebtedness and other liabilities, including obligations to policyholders. The debentures do not limit the Company’s or the Company’s subsidiaries’ ability to incur additional debt, including debt that ranks senior in right of payment and upon liquidation to the debentures.
The Company has the right to defer interest payments for up to a consecutive ten years without giving rise to an event of default. Deferred interest will continue to accrue and will accrue additional interest at the then applicable interest rate. If the Company defers interest payments, the Company generally may not make payments on or redeem or purchase any shares of its capital stock or any of its debt securities or guarantees that rank upon liquidation, dissolution or winding up equally with or junior to the debentures, subject to certain limited exceptions.
The 7.875% and 3 Month LIBOR plus 2.125% debentures may be redeemed in whole prior to the call date upon certain tax or rating agency events, at a price equal to the greater of 100% of the principal amount being redeemed and the applicable make-whole amount plus any accrued and unpaid interest. The Company may elect to redeem the 7.875% and 3 Month LIBOR plus 2.125% debentures in whole or in part on or after the call date for the principal amount being redeemed plus accrued and unpaid interest to the date of redemption.
In connection with the offering of the 3 Month LIBOR plus 2.125% debenture, the Company entered into a Replacement Capital Covenant ("RCC") for the benefit of holders of one or more designated series of the Company's indebtedness, initially the Company's 4.3% notes due 2043. Under the terms of the
RCC, if the Company redeems the debenture any time prior to February 12, 2047 (or such earlier date on which the RCC terminates by its terms) it can only do so with the proceeds from the sale of certain qualifying replacement securities. The RCC also prohibits the Company from redeeming all or any portion of the notes on or prior to February 15, 2022.
In July 2017, the U.K. Financial Conduct Authority ("FCA") announced that by the end of 2021 it intended to stop persuading or compelling banks to report information used to set LIBOR. On March 5, 2021, the FCA announced that publication of certain LIBOR settings in currencies other than U.S. dollars would cease immediately after December 31, 2021, and that publication of U.S. dollar LIBOR on a representative basis would cease for the one-week and two-month settings immediately after December 31, 2021 and for the remaining U.S. dollar settings immediately after June 30, 2023. The Company continues to monitor and assess the potential impacts of the discontinuation of LIBOR on its outstanding junior subordinated debentures.
Long-Term Debt
Long-term Debt Maturities (at par value) as of December 31, 2021
| 2022 - Current maturities | $ | — | |||
| 2023 | $ | — | |||
| 2024 | $ | — | |||
| 2025 | $ | — | |||
| 2026 | $ | — | |||
| Thereafter | $ | 5,082 | |||
Revolving Credit Facility
In 2018, The Hartford entered into a $750 senior unsecured five-year revolving credit facility (the "Credit Facility"), with an expiration date of March 29, 2023. On October 27, 2021, The Hartford amended and restated the Credit Facility (as amended, the “2021 Credit Facility”) which, among other changes, extends the term of the facility through October 27, 2026, includes provisions for determining LIBOR successor rates, and resets the level of The Hartford’s minimum consolidated net worth financial covenant to $11.25 billion, excluding AOCI. The 2021 Credit Facility provides up to $750 of unsecured credit, including $100 available to support letters of credit. Under the 2021 Credit Facility:
•Revolving loans may be in multiple currencies.
•U.S. dollar loans will bear interest at a floating rate equivalent to an indexed rate that varies depending on the type of borrowing plus a basis point spread based on The Hartford's credit rating and will mature no later than October 27, 2026.
•Letters of credit bear a fee based on The Hartford's credit rating and expire no later than October 27, 2027.
The 2021 Credit Facility limits the ratio of senior debt to capitalization, excluding AOCI, at 35% and includes other customary covenants. The 2021 Credit Facility is for general corporate purposes.
201
THE HARTFORD FINANCIAL SERVICES GROUP, INC.
NOTES TO CONSOLIDATED FINANCIAL STATEMENTS (continued)
As of December 31, 2021, no borrowings were outstanding, no letters of credit were issued under the 2021 Credit Facility and the Company was in compliance with all financial covenants.
Lloyd's Letter of Credit Facilities
As a result of the acquisition of Navigators Group in 2019, The Hartford had two letter of credit facility agreements: the Club Facility and the Bilateral Facility, which were used to provide a portion of the capital requirements at Lloyd's. As of September 30, 2020, uncollateralized letters of credit with an aggregate face amount of $165 and £60 million, or $78, were outstanding under the Club Facility and £18 million, or $23, was outstanding under the $25 Bilateral Facility. These agreements terminated on November 5, 2020.
On November 5, 2020, The Hartford entered into a new committed credit facility agreement with a syndicate of lenders (the “Club Facility”). The Club Facility has two tranches with one tranche extending a $104 commitment and the other tranche extending a £85 million ($115 as of December 31, 2021) commitment. In addition, on November 5, 2020, The Hartford entered into a new non-committed $25 credit facility with a lender (the “Bilateral Facility”). The term of both of these facilities is two years. The purpose of these facilities is to issue letters of credit that may be treated as Funds at Lloyd’s to support underwriting capacity provided by the Navigators Corporate Underwriters Limited to the Lloyd’s Syndicate 1221 for the 2021 and 2022 underwriting years of account (and prior open years). As of December 31, 2021, letters of credit with an aggregate face amount of $104 and £68 million, or $92, were outstanding under the Club Facility and no letters of credit were outstanding under the Bilateral Facility.
Among other covenants, the Club Facility and Bilateral Facility contain financial covenants regarding The Hartford’s consolidated net worth and financial leverage and that limit the amount of letters of credit that can support Funds at Lloyd’s, consistent with Lloyd’s requirements. As of December 31, 2021, The Hartford was in compliance with all financial covenants of both facilities.
Commercial Paper
On December 17, 2020, the Board of Directors terminated the HFSG Holding Company's commercial paper program, under which the maximum borrowings available were $750.
Collateralized Advances with Federal Home Loan Bank of Boston
The Company’s subsidiaries, Hartford Fire Insurance Company (“Hartford Fire”) and HLA, are members of the Federal Home Loan Bank of Boston ("FHLBB"). Membership allows these subsidiaries access to collateralized advances, which may be short- or long-term with fixed or variable rates. FHLBB membership required the purchase of member stock and requires additional member stock ownership of 3% or 4% of any amount borrowed. Acceptable forms of collateral include real estate backed fixed maturities and mortgage loans and the amount of advances that can be taken is limited to a percentage of the fair value of the assets that ranges from a high of 97% for US government-backed fixed maturities maturing within 3 years to a low of 40% for A-rated commercial mortgage-backed fixed maturities maturing in 5 years or more. In its consolidated
balance sheets, The Hartford presents the liability for advances taken based on use of the funds with advances for general corporate purposes presented in short- or long-term debt and advances to earn incremental investment income presented in other liabilities, consistent with other collateralized financing transactions such as securities lending and repurchase agreements. The Connecticut Department of Insurance permits Hartford Fire and HLA to pledge up to $1.3 billion and $0.6 billion in qualifying assets, respectively, without prior approval, to secure FHLBB advances in 2022. The pledge limit is determined quarterly based on statutory admitted assets and capital and surplus of Hartford Fire and HLA, respectively.
As of December 31, 2021, there were no advances outstanding under the FHLBB facility.
202
|
| Note 15 - Commitments and Contingencies | ||||||||
THE HARTFORD FINANCIAL SERVICES GROUP, INC.
NOTES TO CONSOLIDATED FINANCIAL STATEMENTS (continued)
15. COMMITMENTS AND CONTINGENCIES
Management evaluates each contingent matter separately. A loss is recorded if probable and reasonably estimable. Management establishes liabilities for these contingencies at its “best estimate,” or, if no one number within the range of possible losses is more probable than any other, the Company records an estimated liability at the low end of the range of losses.
LITIGATION
The Hartford is involved in claims litigation arising in the ordinary course of business, both as a liability insurer defending or providing indemnity for third-party claims brought against insureds and as an insurer defending coverage claims brought against it. The Hartford accounts for such activity through the establishment of unpaid loss and loss adjustment expense reserves. Subject to the uncertainties related to sexual molestation and sexual abuse claims discussed in Note 12, Reserve for Unpaid Losses and Loss Adjustment Expenses, and in the following discussion under the caption “COVID-19 Pandemic Business Income Insurance Litigation” and under the caption “Run-off Asbestos and Environmental Claims,” management expects that the ultimate liability, if any, with respect to such ordinary-course claims litigation, after consideration of provisions made for potential losses and costs of defense, will not be material to the consolidated financial condition, results of operations or cash flows of The Hartford.
The Hartford is also involved in other kinds of legal actions, some of which assert claims for substantial amounts. In addition to the matter described below, these actions include putative class actions seeking certification of a state or national class. Such putative class actions have alleged, for example, underpayment of claims or improper sales or underwriting practices in connection with various kinds of insurance policies, such as personal and commercial automobile, property, disability, life and inland marine. The Hartford also is involved in individual actions in which punitive damages are sought, such as claims alleging bad faith in the handling of insurance claims or other allegedly unfair or improper business practices. Like many other insurers, The Hartford also has been joined in actions by asbestos plaintiffs asserting, among other things, that insurers had a duty to protect the public from the dangers of asbestos and that insurers committed unfair trade practices by asserting defenses on behalf of their policyholders in the underlying asbestos cases. Management expects that the ultimate liability, if any, with respect to such lawsuits, after consideration of provisions made for estimated losses, will not be material to the consolidated financial condition of The Hartford. Nonetheless, given the large or indeterminate amounts sought in certain of these actions, and the inherent unpredictability of litigation, the outcome in certain matters could, from time to time, have a material adverse effect on the Company’s results of operations or cash flows in particular quarterly or annual periods.
COVID-19 Pandemic Business Income Insurance Litigation
Like many others in the property and casualty insurance industry, beginning in April 2020, various direct and indirect subsidiaries of the Company (collectively the "Hartford Writing
Companies”), and in some instances the Company itself, have been served as defendants in lawsuits seeking insurance coverage under commercial insurance policies issued by the Hartford Writing Companies for alleged losses resulting from the shutdown or suspension of their businesses due to the spread of COVID-19. More than 260 such lawsuits have been filed, of which more than 60 purport to be filed on behalf of broad nationwide or statewide classes of policyholders. These lawsuits have been filed in state and federal courts in roughly 34 states. Although the allegations vary, the plaintiffs generally seek a declaration of insurance coverage, damages for breach of contract in unspecified amounts, interest, and attorneys' fees. Many of the lawsuits also allege that the insurance claims were denied in bad faith or otherwise in violation of state laws and seek extra-contractual or punitive damages. Some of the lawsuits also allege that the Hartford Writing Companies engaged in unfair business practices by collecting or retaining excess premium.
The Company and its subsidiaries deny the allegations and continue to vigorously defend these suits. The Hartford Writing Companies maintain that they have no coverage obligations with respect to these suits for business income allegedly lost by the plaintiffs due to the COVID-19 pandemic based on the clear terms of the applicable insurance policies. Although the policy terms vary depending, among other things, upon the size, nature, and location of the policyholder’s business, in general, the claims at issue in these lawsuits were denied because the claimant identified no direct physical damage or loss to property at the insured premises, and the governmental orders that led to the complete or partial shutdown of the business were not due to the existence of any direct physical loss or damage in the immediate vicinity of the insured premises and did not prohibit access to the insured premises, as required by the terms of the insurance policies. In addition, the vast majority of the policies at issue expressly exclude from coverage any loss caused directly or indirectly by the presence, growth, proliferation, spread or activity of a virus, subject to a narrow set of exceptions not applicable in connection with this pandemic, and contain a pollution and contamination exclusion that, among other things, expressly excludes from coverage any loss caused by material that threatens human health or welfare.
In addition to the inherent difficulty in predicting litigation outcomes, the COVID-19 pandemic business income coverage lawsuits present numerous uncertainties and contingencies that are not yet fully known, including how many policyholders will ultimately file claims, the number of lawsuits that will be filed, the extent to which any state or nationwide classes will be certified, and the size and scope of any such classes. The legal theories advocated by plaintiffs vary significantly by case as do the state laws that govern the policy interpretation. These lawsuits are at various stages of litigation; some are in the earliest stages of litigation, many complaints are in the process of being amended, some have been dismissed voluntarily and may be refiled, while others have been dismissed through rulings in favor of the Hartford Writing Companies. Discovery is underway in certain single plaintiff cases and class actions. More than 40 policyholders have appealed dismissals in favor of the Hartford Writing Companies. The Hartford Writing Companies' first appellate decision was received on December 27, 2021 when
203
|
| Note 15 - Commitments and Contingencies | ||||||||
THE HARTFORD FINANCIAL SERVICES GROUP, INC.
NOTES TO CONSOLIDATED FINANCIAL STATEMENTS (continued)
the Second Circuit Court of Appeals affirmed a trial court ruling in Sentinel Ins. Co. Ltd.'s favor. The remainder of the Hartford Writing Companies' appeals are at various stages of the process.
In addition, business income calculations depend upon a wide range of factors that are particular to the circumstances of each individual policyholder and, here, almost none of the plaintiffs have submitted proofs of loss or otherwise quantified or factually supported any allegedly covered loss, and, in any event, the Company’s experience shows that demands for damages often bear little relation to a reasonable estimate of potential loss. Accordingly, management cannot now reasonably estimate the possible loss or range of loss, if any. Nonetheless, given the large number of claims and potential claims, the indeterminate amounts sought, and the inherent unpredictability of litigation, it is possible that adverse outcomes, if any, in the aggregate, could have a material adverse effect on the Company’s consolidated operating results.
Run-off Asbestos and Environmental Claims
The Company continues to receive A&E claims. Asbestos claims relate primarily to bodily injuries asserted by people who came in contact with asbestos or products containing asbestos. Environmental claims relate primarily to pollution and related clean-up costs.
The vast majority of the Company's exposure to A&E relates to Run-off A&E, reported within the P&C Other Operations segment. In addition, since 1986, the Company has written asbestos and environmental exposures under general liability policies and pollution liability under homeowners policies, which are reported in the Commercial Lines and Personal Lines segments.
Prior to 1986, the Company wrote several different categories of insurance contracts that may cover A&E claims. First, the Company wrote primary policies providing the first layer of coverage in an insured’s liability program. Second, the Company wrote excess and umbrella policies providing higher layers of coverage for losses that exhaust the limits of underlying coverage. Third, the Company acted as a reinsurer assuming a portion of those risks assumed by other insurers writing primary, excess, umbrella and reinsurance coverages.
Significant uncertainty limits the ability of insurers and reinsurers to estimate the ultimate reserves necessary for unpaid gross losses and expenses related to environmental and particularly asbestos claims. The degree of variability of gross reserve estimates for these exposures is significantly greater than for other more traditional exposures.
In the case of the reserves for asbestos exposures, factors contributing to the high degree of uncertainty include inadequate loss development patterns, plaintiffs’ expanding theories of liability, the risks inherent in major litigation, and inconsistent and emerging legal doctrines with respect to the underlying claims and with respect to the Company's coverage obligations. Furthermore, over time, insurers, including the Company, have experienced significant changes in the rate at which asbestos claims are brought, the claims experience of particular insureds, and the value of claims, making predictions of future exposure from past experience uncertain. Plaintiffs and insureds also
have sought to use bankruptcy proceedings, including “pre-packaged” bankruptcies, to accelerate and increase loss payments by insurers. In addition, some policyholders have asserted new classes of claims for coverages to which an aggregate limit of liability may not apply. Further uncertainties include insolvencies of other carriers, insolvencies of insureds and unanticipated developments pertaining to the Company’s ability to recover reinsurance for A&E claims. Management believes these issues are not likely to be resolved in the near future.
In the case of the reserves for environmental exposures, factors contributing to the high degree of uncertainty include expanding theories of liability and damages against insureds, emerging risks such as PFAS, the risks inherent in major litigation, inconsistent and emerging legal doctrines concerning the existence and scope of coverage for environmental claims, and the scope and level of complexity of the remediation required by regulators.
The reporting pattern for assumed reinsurance claims, including those related to A&E claims, is much longer than for direct claims. In many instances, it takes months or years to determine that the policyholder’s own obligations have been met and how the reinsurance in question may apply to such claims. The delay in reporting reinsurance claims and exposures adds to the uncertainty of estimating the related reserves.
It is also not possible to predict changes in the legal and legislative environment and their effect on the future development of A&E claims.
Given the factors described above, the Company believes the actuarial tools and other techniques it employs to estimate the ultimate cost of claims for more traditional kinds of insurance exposure are less precise in estimating reserves for A&E exposures. For this reason, the Company principally relies on exposure-based analysis to estimate the ultimate costs of these claims, both gross and net of reinsurance, and regularly evaluates new account information in assessing its potential A&E exposures. The Company supplements this exposure-based analysis with evaluations of the Company’s historical direct net loss and expense paid and reported experience, and net loss and expense paid and reported experience by calendar and/or report year, to assess any emerging trends, fluctuations or characteristics suggested by the aggregate paid and reported activity.
While the Company believes that its current A&E reserves are appropriate, significant uncertainties limit the ability of insurers and reinsurers to estimate the ultimate reserves necessary for unpaid losses and related expenses. The ultimate liabilities, thus, could exceed the currently recorded reserves, and any such additional liability, while not estimable now, could be material to The Hartford’s consolidated operating results and liquidity.
For its Run-off A&E, as of December 31, 2021, the Company reported $604 of net asbestos and environmental reserves . In addition, the Company has recorded a $365 deferred gain within other liabilities for losses economically ceded to NICO but for which the benefit is not recognized in earnings until later periods. While the Company believes that its current Run-off A&E reserves are appropriate, significant uncertainties limit our ability to estimate the ultimate reserves necessary for unpaid
204
|
| Note 15 - Commitments and Contingencies | ||||||||
THE HARTFORD FINANCIAL SERVICES GROUP, INC.
NOTES TO CONSOLIDATED FINANCIAL STATEMENTS (continued)
losses and related expenses. The ultimate liabilities, thus, could exceed the currently recorded reserves, and any such additional liability, while not reasonably estimable now, could be material to The Hartford's consolidated operating results and liquidity.
The Company’s A&E ADC reinsurance agreement with NICO reinsures substantially all A&E reserve development for 2016 and prior accident years, including Run-off A&E and A&E reserves included in Commercial Lines and Personal Lines. The A&E ADC has a coverage limit of $1.5 billion above the Company’s existing net A&E reserves as of December 31, 2016 of approximately $1.7 billion. As of December 31, 2021, the Company has incurred $1,015 in cumulative adverse development on A&E reserves that have been ceded under the A&E ADC treaty with NICO, leaving $485 of coverage available for future adverse net reserve development, if any. Cumulative adverse development of A&E claims for accident years 2016 and prior could ultimately exceed the $1.5 billion treaty limit in which case any adverse development in excess of the treaty limit would be absorbed as a charge to earnings by the Company. In these scenarios, the effect of these charges could be material to the Company’s consolidated operating results and liquidity. For more information on the A&E ADC, refer to Note 12, Reserve for Unpaid Losses and Loss Adjustment Expenses.
UNFUNDED COMMITMENTS
As of December 31, 2021, the Company has outstanding commitments totaling $2.4 billion, of which $1.6 billion is primarily committed to fund limited partnerships and other alternative investments, which may be called by the partnership during the commitment period to fund the purchase of new investments and partnership expenses. The funding of purchase investments in limited partnerships and other alternative investments are at the discretion of the general partner or manager and may be called at any time. Additionally, $185 of the outstanding commitments relate to various funding obligations primarily associated with private debt and equity securities. The remaining outstanding commitments of $679 relate to mortgage loans. Of the $2.4 billion in total outstanding commitments, $382 are related to mortgage loan commitments which the Company can cancel unconditionally.
GUARANTY FUNDS AND OTHER INSURANCE-RELATED ASSESSMENTS
In all states, insurers licensed to transact certain classes of insurance are required to become members of a guaranty fund. In most states, in the event of the insolvency of an insurer writing any such class of insurance in the state, the guaranty funds may assess its members to pay covered claims of the insolvent insurers. Assessments are based on each member's proportionate share of written premiums in the state for the classes of insurance in which the insolvent insurer was engaged. Assessments are generally limited for any year to 1 or 2 percent of the premiums written per year depending on the state. Some states permit member insurers to recover assessments paid through surcharges on policyholders or through full or partial premium tax offsets, while other states permit recovery of assessments through the rate filing process.
Liabilities for guaranty fund and other insurance-related assessments are accrued when an assessment is probable, when it can be reasonably estimated, and when the event obligating the Company to pay an imposed or probable assessment has occurred. Liabilities for guaranty funds and other insurance-related assessments are not discounted and are included as part of other liabilities in the Consolidated Balance Sheets. As of December 31, 2021 and 2020 the liability balance was $74 and $83, respectively. As of December 31, 2021 and 2020, there were no premium tax offsets related to guaranty fund or other insurance-related assessments.
Derivative Commitments
Certain of the Company’s derivative agreements contain provisions that are tied to the financial strength ratings, as set by nationally recognized statistical agencies, of the individual legal entity that entered into the derivative agreement. If the legal entity’s financial strength were to fall below certain ratings, the counterparties to the derivative agreements could, in certain instances, terminate the agreements and demand immediate settlement of all outstanding derivative positions traded under each impacted bilateral agreement.
The settlement amount is determined by netting the derivative positions transacted under each agreement. If the termination rights were to be exercised by the counterparties, it could impact the legal entity’s ability to conduct hedging activities by increasing the associated costs and decreasing the willingness of counterparties to transact with the legal entity. The aggregate fair value of all derivative instruments with credit-risk-related contingent features that are in a net liability position as of December 31, 2021 was $52 for which the legal entities have posted collateral of $50 in the normal course of business. Based on derivative contractual terms as of December 31, 2021, a downgrade of the current financial strength ratings by either Moody's or S&P would not require additional assets to be posted as collateral. This requirement could change as a result of changes in our hedging activities or to the extent changes in contractual terms are negotiated. The nature of the additional collateral that we would post, if required, would be primarily in the form of U.S. Treasury bills, U.S. Treasury notes and government agency securities.
GUARANTEES
In the ordinary course of selling businesses or entities to third parties, the Company has agreed to indemnify purchasers for losses arising subsequent to the closing due to breaches of representations and warranties with respect to the business or entity being sold or with respect to covenants and obligations of the Company and/or its subsidiaries. These obligations are typically subject to various time limitations, defined by the contract or by operation of law, such as statutes of limitation. In some cases, the maximum potential obligation is subject to contractual limitations, while in other cases such limitations are not specified or applicable. The Company does not expect to make any payments on these guarantees and is not carrying any liabilities associated with these guarantees.
The Hartford has guaranteed the timely payment of contractual claims under certain life, accident and health and annuity contracts issued by its former life and annuity business with most of the guaranteed contracts issued between 1990 and
205
|
| Note 15 - Commitments and Contingencies | ||||||||
THE HARTFORD FINANCIAL SERVICES GROUP, INC.
NOTES TO CONSOLIDATED FINANCIAL STATEMENTS (continued)
1997 (the "Talcott Guarantees"). Upon the sale of the life and annuity business in May 2018, the purchaser indemnified the Company for any liability arising under the guarantees. The Talcott Guarantees cover contractual obligations only but otherwise have no limitation as to maximum potential future payments. Prior to January 1, 2020, the Company had not recorded a liability because the likelihood of any payment under the Talcott Guarantees is remote. Upon adoption of new credit loss guidance on January 1, 2020, the Company estimated a LCL of $25. For further information refer to Note 1 - Basis of Presentation and Significant Accounting Policies.
The LCL is calculated for the estimated amount payable under guaranteed contracts multiplied by the probability of default and the amount of loss given a default. The probability of default is assigned by credit rating of the applicable insurance company that issued the contract and is based on historical insurance industry defaults for liabilities with similar durations estimated through multiple economic cycles. Credit ratings are current and
forward-looking and consider a variety of economic outcomes. Because annuities represent the majority of the contracts issued, the loss given default factors are based on a historical study of annuity policyholder recoveries from insolvent estate assets. The Company's exposure is expected to run off over a period that will include more than one economic cycle.
The Company's evaluation of the required LCL for the Talcott Guarantees considers the current economic environment as well as macroeconomic scenarios similar to the approach used to estimate the ACL for mortgage loans. See Note 6 - Investments. In 2020, the LCL increased to $26 primarily due to the increasing impacts of COVID-19. During 2021, the LCL decreased to $25 primarily reflecting a decrease in the estimated amount payable under guaranteed contracts as well as lessening expected impacts of COVID-19 relative to prior assumptions. The Company has never experienced a loss on financial guarantees of this nature and we believe the risk of loss is remote.
16. EQUITY
Equity Repurchase Program
In December 2020, the Board of Directors authorized an equity repurchase plan for $1.5 billion for the period commencing January 1, 2021 through December 31, 2022. The Board of Directors increased this authorization by $1 billion in April, 2021 and by $500 in October, 2021, bringing the aggregate repurchase authorization to $3.0 billion through December 31, 2022. For the year ended December 31, 2021, The Hartford repurchased $1.7 billion (25.9 million shares) of common stock under this program. The timing of any repurchases of shares under the remaining equity repurchase authorization is dependent upon several factors, including the market price of the Company's securities, the Company's capital position, consideration of the effect of any repurchases on the Company's financial strength or credit ratings, the Company's blackout periods, and other considerations.
Under The Hartford’s previous $1.0 billion share repurchase program authorized by its Board of Directors in February 2019 and which expired on December 31, 2020, the Company repurchased 2.7 million and 3.4 million shares for $150 and $200 during the years ended 2020 and 2019, respectively.
Preferred Stock
The Company has outstanding 13.8 million depositary shares each representing 1/1000th interest in a share of the Company’s 6.0% Series G non-cumulative perpetual preferred stock (“Preferred Stock”) with a liquidation preference of $25,000 per share (equivalent to $25.00 per depositary share). The Preferred Stock is perpetual and has no maturity date. Dividends are recorded when declared. Dividends are payable, if declared, quarterly in arrears on the 15th day of February, May, August and November of each year. If a dividend is not declared and paid or made payable on all outstanding shares of the Preferred Stock for the latest completed dividend period, no dividends may be paid or declared on The Hartford’s common stock and The Hartford may not purchase, redeem, or otherwise acquire its common stock.
The Preferred Stock is redeemable at the Company’s option in whole or in part, on or after November 15, 2023 at a redemption price of $25,000 per share, plus unpaid dividends attributable to the current dividend period. Prior to November 15, 2023, the Preferred Stock is redeemable at the Company’s option, in whole but not in part, within 90 days of the occurrence of (a) a rating agency event at a redemption price equal to $25,500 per share, plus unpaid dividends attributable to the current dividend period in circumstances where a rating agency changes its criteria used to assign equity credit to securities like the Preferred Stock; or (b) a regulatory capital event at a redemption price equal to $25,000 per share, plus unpaid dividends attributable to the current dividend period in circumstances where a capital regulator such as a state insurance regulator changes or proposes to change capital adequacy rules.
Capital Purchase Program ("CPP") Warrants
CPP warrants were issued in 2009 as part of a program established by the U.S. Department of the Treasury under the Emergency Economic Stabilization Act of 2008. The CPP warrants expired on June 26, 2019.
The declaration of common stock dividends by the Company in excess of a threshold triggered a provision in the Company's warrant agreement with The Bank of New York Mellon resulting in adjustments to the CPP warrant exercise price and the number of shares deliverable for each warrant exercised (“Warrant Share Number”). CPP warrant exercises were 1.9 million during the year ended December 31, 2019, and had exercise prices that ranged from $8.750 to $8.836. The exercise price was settled by the Company withholding the number of common shares issuable upon exercise of the warrants equal to the value of the aggregate exercise price of the warrants so exercised determined by reference to the closing price of the Company's common stock on the trading day on which the warrants were exercised and notice was delivered to the warrant agent.
206
THE HARTFORD FINANCIAL SERVICES GROUP, INC.
NOTES TO CONSOLIDATED FINANCIAL STATEMENTS (continued)
STATUTORY RESULTS
The U.S. domestic insurance subsidiaries of The Hartford prepare their statutory financial statements in conformity with statutory accounting practices prescribed or permitted by the applicable state insurance department which vary materially from U.S. GAAP. Prescribed statutory accounting practices include publications of the NAIC, as well as state laws, regulations and general administrative rules. The differences between statutory financial statements and financial statements prepared in accordance with U.S. GAAP vary between domestic and foreign jurisdictions. The principal differences are that statutory financial statements do not reflect deferred policy acquisition costs and limit deferred income taxes, recognize a deferred gain on retroactive reinsurance within a special surplus account rather than as other liabilities, predominately use interest rate and mortality assumptions prescribed by the NAIC for life benefit reserves, generally carry bonds at amortized cost, and present reinsurance assets and liabilities net of reinsurance. For reporting purposes, statutory capital and surplus is referred to collectively as "statutory capital".
U.S. Statutory Net Income
| For the years ended December 31, | |||||||||||
| 2021 | 2020 | 2019 | |||||||||
| Group Benefits Insurance Subsidiary | $ | 32 | $ | 310 | $ | 513 | |||||
| Property and Casualty Insurance Subsidiaries | 1,774 | 1,598 | 1,391 | ||||||||
| Total | $ | 1,806 | $ | 1,908 | $ | 1,904 | |||||
U.S. Statutory Capital
| As of December 31, | ||||||||
| 2021 | 2020 | |||||||
| Group Benefits Insurance Subsidiary | $ | 2,410 | $ | 2,601 | ||||
| Property and Casualty Insurance Subsidiaries | 11,914 | 10,795 | ||||||
| Total | $ | 14,324 | $ | 13,396 | ||||
Regulatory Capital Requirements
The Company's U.S. insurance companies' states of domicile impose risk-based capital ("RBC") requirements. The requirements provide a means of measuring the minimum amount of statutory capital appropriate for an insurance company to support its overall business operations based on its size and risk profile. Companies below specific trigger points or ratios are classified within certain levels, each of which requires specified corrective action. All of the Company's operating insurance subsidiaries had RBC ratios in excess of the minimum levels required by the applicable insurance regulations.
Similar to the RBC ratios that are employed by U.S. insurance regulators, regulatory authorities in the international jurisdictions in which the Company operates generally establish minimum solvency requirements for insurance companies. All of the Company's international insurance subsidiaries expect to
maintain capital levels in excess of the minimum levels required by the applicable regulatory authorities.
Dividend Restrictions
Dividends to HFSG Holding Company from its insurance subsidiaries are restricted by insurance regulation. The Company’s principal insurance subsidiaries are domiciled in the United States and the United Kingdom.
The payment of dividends by Connecticut-domiciled insurers is limited under the insurance holding company laws of Connecticut. These laws require notice to and approval by the state insurance commissioner for the declaration or payment of any dividend, which, together with other dividends or distributions made within the preceding twelve months, exceeds the greater of (i) 10% of the insurer’s statutory policyholder surplus as of December 31 of the preceding year or (ii) net income (or net gain from operations, if such company is a life insurance company) for the preceding year, in each case determined under statutory insurance accounting principles. In addition, if any dividend of a Connecticut-domiciled insurer exceeds the insurer’s earned surplus, it requires the prior approval of the Connecticut Insurance Commissioner.
Property casualty insurers domiciled in New York, including Navigators Insurance Company ("NIC") and Navigators Specialty Insurance Company ("NSIC"), generally may not, without notice to and approval by the state insurance commissioner, pay dividends out of earned surplus in any twelve‑month period that exceeds the lesser of (i) 10% of the insurer’s statutory policyholders’ surplus as of the most recent financial statement on file, or (ii) 100% of its adjusted net investment income, as defined, for the same twelve month period.
Corporate members of Lloyd's Syndicates may pay dividends to its parent to the extent of available profits that have been distributed from the syndicate in excess of the Funds at Lloyd's ("FAL") capital requirement and subject to restrictions imposed under UK Company Law. The FAL is determined based on the syndicate’s solvency capital requirement of the syndicate under the Solvency II capital adequacy model, the current regulatory framework governing UK domiciled insurers, plus a Lloyd’s specific economic capital assessment. Insurers domiciled in the United Kingdom may pay dividends to its parent out of its statutory profits subject to restrictions imposed under U.K. Company law and Solvency II.
The insurance holding company laws of the other jurisdictions in which The Hartford’s insurance subsidiaries are incorporated (or deemed commercially domiciled) generally contain similar (although in certain instances more restrictive) limitations on the payment of dividends. In addition to statutory limitations on paying dividends, the Company also takes other items into consideration when determining dividends from subsidiaries. These considerations include, but are not limited to, expected earnings and capitalization of the subsidiaries, regulatory capital requirements, liquidity requirements of the individual operating company and are also dependent on the extent to which COVID-19 impacts our business, results of operations, financial condition, and liquidity.
In 2021, the Company received $295 of dividends from HLA and $165 from Hartford Funds. In addition, HFSG Holding Company
207
THE HARTFORD FINANCIAL SERVICES GROUP, INC.
NOTES TO CONSOLIDATED FINANCIAL STATEMENTS (continued)
received $1.1 billion of net dividends from P&C subsidiaries in 2021 which excludes $150 of P&C dividends that were subsequently contributed to P&C subsidiaries and $50 of P&C dividends related to interest payments on an intercompany note owed by Hartford Holding Inc. ("HHI") to Hartford Fire Insurance Company.
The Company’s property and casualty insurance subsidiaries have dividend capacity of $2.0 billion for 2022, with $1.3 to $1.4 billion of net dividends expected in 2022.
HLA has dividend capacity of $241 in 2022 with $175 to $200 of dividends expected in 2022.
There are no current restrictions on HFSG Holding Company's ability to pay dividends to its stockholders.
Restricted Net Assets
The Company's insurance subsidiaries had net assets of $16.9 billion, determined in accordance with U.S. GAAP, that were restricted from payment to the HFSG Holding Company, without prior regulatory approval at December 31, 2021.
17. INCOME TAXES
INCOME TAX EXPENSE
The Company and its subsidiaries file income tax returns in the U.S. federal jurisdiction, and various state and foreign jurisdictions, as applicable. Income before income taxes included income from domestic operations of $2,910, $2,222 and $2,644 for the years ended December 31, 2021, 2020 and 2019, and income (losses) from foreign operations of $(14), $(102) and $(84) for the years ended December 31, 2021, 2020 and 2019.
Income Tax Expense
| For the years ended December 31, | |||||||||||
| 2021 | 2020 | 2019 | |||||||||
| Income tax expense (benefit) | |||||||||||
| Current - U.S. federal | $ | 486 | $ | 410 | $ | 8 | |||||
| Foreign | 2 | — | — | ||||||||
| Total current | 488 | 410 | 8 | ||||||||
| Deferred - U.S. federal | 49 | (20) | 476 | ||||||||
| Foreign | (6) | (7) | (9) | ||||||||
| Total deferred | 43 | (27) | 467 | ||||||||
| Total income tax expense | $ | 531 | $ | 383 | $ | 475 | |||||
Income Tax Rate Reconciliation
| For the years ended December 31, | |||||||||||
| 2021 | 2020 | 2019 | |||||||||
| Tax provision at U.S. federal statutory rate | $ | 608 | $ | 445 | $ | 538 | |||||
| Tax-exempt interest | (40) | (46) | (56) | ||||||||
| Increase in deferred tax valuation allowance | 9 | 9 | 2 | ||||||||
| Sale of business | (5) | (8) | — | ||||||||
| Earnings on corporate owned life insurance | (22) | (6) | (11) | ||||||||
| Tax credits | (9) | (5) | — | ||||||||
| Carryback benefit | — | (5) | — | ||||||||
| Tax law change | (8) | (6) | — | ||||||||
| Other | (2) | 5 | 2 | ||||||||
| Provision for income taxes | $ | 531 | $ | 383 | $ | 475 | |||||
DEFERRED TAXES
Deferred tax assets and liabilities on the consolidated balance sheets represent the tax consequences of differences between the financial reporting and tax basis of assets and liabilities.
The Company predominantly pays non-income state taxes as a percentage of premiums written which are accounted for as policy acquisition costs. State income taxes were $4, $3 and $5 for the years ended December 31, 2021, 2020 and 2019, respectively, and are included in other expenses. The Hartford has not recorded state deferred taxes, including net deferred tax assets from state operating loss carryforwards, because the Company does not expect to earn state taxable income to utilize such state tax benefits.
208
|
| Note 17 - Income Taxes | ||||||||
THE HARTFORD FINANCIAL SERVICES GROUP, INC.
NOTES TO CONSOLIDATED FINANCIAL STATEMENTS (continued)
Deferred Tax Assets (Liabilities)
| As of December 31, | ||||||||
| 2021 | 2020 | |||||||
| Deferred tax assets | ||||||||
| Loss reserves and tax discount | $ | 386 | $ | 312 | ||||
| Unearned premium reserve and other underwriting related reserves | 406 | 384 | ||||||
| Investment-related items | 8 | 125 | ||||||
| Employee benefits | 225 | 282 | ||||||
| Net operating loss carryover | 29 | 11 | ||||||
| Other | — | 34 | ||||||
| Total deferred tax assets | 1,054 | 1,148 | ||||||
| Valuation allowance | (7) | (4) | ||||||
| Deferred tax assets, net of valuation allowance | 1,047 | 1,144 | ||||||
| Deferred tax liabilities | ||||||||
| Deferred acquisition costs | (129) | (120) | ||||||
| Net unrealized gains on investments | (428) | (758) | ||||||
| Other depreciable and amortizable assets | (216) | (220) | ||||||
| Other | (4) | — | ||||||
| Total deferred tax liabilities | (777) | (1,098) | ||||||
| Net deferred tax asset | $ | 270 | $ | 46 | ||||
As of December 31, 2021, the Company has foreign net operating losses of $29 for which a valuation allowance of $7 has been established. While the foreign net operating losses ("NOLs") do not expire, this assessment reflects uncertainty in the Company's ability to generate sufficient taxable income in the near term in those specific jurisdictions.
Management has assessed the need for a valuation allowance against its deferred tax assets based on tax character and jurisdiction. In making the assessment, management considered future taxable temporary difference reversals, future taxable income exclusive of reversing temporary differences and carryovers, taxable income in open carry back years and other tax planning strategies which management views as prudent and feasible.
UNCERTAIN TAX POSITIONS
Rollforward of Unrecognized Tax Benefits
| For the years ended December 31, | |||||||||||||||||
| 2021 | 2020 | 2019 | |||||||||||||||
| Balance, beginning of period | $ | 15 | $ | 14 | $ | 14 | |||||||||||
| Gross increases - tax positions in current period | 6 | 1 | — | ||||||||||||||
| Lapse of statute of limitations | (5) | — | — | ||||||||||||||
| Balance, end of period | $ | 16 | $ | 15 | $ | 14 | |||||||||||
The entire amount of unrecognized tax benefits, if recognized, would affect the effective tax rate in the period of the release. The Company recognized $5 of its previously unrecognized tax benefits associated with dividends from segregated asset accounts of the life and annuity business sold in 2018. This liability was subject to a tax indemnification agreement and a corresponding receivable included in other assets has been taken down upon lapse of the statute of limitations.
OTHER TAX MATTERS
On June 10, 2021, the United Kingdom enacted Finance Bill 2021, which included an increase in the corporate tax rate from 19% to 25%, effective April 1, 2023. In 2021, the Company recorded a tax benefit of $8, which reflects the estimated benefit of the change in tax rate on the deferred tax assets and liabilities of its U.K. subsidiaries.
On March 27, 2020, as part of the business stimulus package in response to the COVID-19 pandemic, the U.S. government enacted the Coronavirus Aid, Relief, and Economic Security ("CARES") Act. The CARES Act established new tax provisions including, but not limited to: (1) five-year carryback of net operating losses generated in 2018, 2019 and 2020; (2) accelerated refund of alternative minimum tax credit carryforwards; and (3) retroactive changes to allow accelerated depreciation for certain depreciable property.
For the year ended December 31, 2020 the Company recorded a tax benefit of $11 related to the expected carryback of losses from the Navigators Group 2019 pre-acquisition tax returns to recover taxes paid in prior years at the previous statutory tax rate of 35%, of which $6 was by virtue of the non-insurance carryback provision of the CARES Act.
For the year ended December 31, 2021 and 2020 the Company recorded a tax benefit of $5 and $8 related to the excess of tax basis over GAAP basis on the sale of the continental Europe operations. Refer to Note 22 - Business Dispositions.
The federal income tax audits for the Company have been completed through 2013, and the Company is not currently under federal income tax examination for any open years. The statute of limitations is closed through the 2017 tax year with the exception of NOL carryforwards utilized in open tax years. Management believes that adequate provision has been made in the Company's Consolidated Financial Statements for any potential adjustments that may result from tax examinations and other tax-related matters for all open tax years.
The Company classifies interest and penalties (if applicable) as income tax expense in the Consolidated Financial Statements. The Company recognized net interest income of $1, $1 and $1 for the years ended December 31, 2021, 2020 and 2019. The Company has no interest payable as of December 31, 2021, 2020 and 2019. The Company does not believe it would be subject to any penalties in any open tax years and, therefore, has not recorded any accrual for penalties.
209
|
| Note 18 - Accumulated Other Comprehensive Income | ||||||||
THE HARTFORD FINANCIAL SERVICES GROUP, INC.
NOTES TO CONSOLIDATED FINANCIAL STATEMENTS (continued)
18. CHANGES IN AND RECLASSIFICATIONS FROM ACCUMULATED OTHER COMPREHENSIVE INCOME
Changes in AOCI, Net of Tax for the Year Ended December 31, 2021
| Changes in | ||||||||||||||||||||
| Net Unrealized Gain on Fixed Maturities | Unrealized Loss on Fixed Maturities with ACL | Net Gain (Loss) on Cash Flow Hedging Instruments | Foreign Currency Translation Adjustments | Pension and Other Postretirement Plan Adjustments | AOCI, net of tax | |||||||||||||||
| Beginning balance | $ | 2,834 | $ | (2) | $ | 12 | $ | 43 | $ | (1,717) | $ | 1,170 | ||||||||
| OCI before reclassifications | (1,307) | — | 28 | (3) | 219 | (1,063) | ||||||||||||||
| Amounts reclassified from AOCI | (234) | — | (36) | — | 70 | (200) | ||||||||||||||
| OCI, before tax | (1,541) | — | (8) | (3) | 289 | (1,263) | ||||||||||||||
| Income tax benefit (expense) | 323 | — | 2 | 1 | (61) | 265 | ||||||||||||||
| OCI, net of tax | (1,218) | — | (6) | (2) | 228 | (998) | ||||||||||||||
| Ending balance | $ | 1,616 | $ | (2) | $ | 6 | $ | 41 | $ | (1,489) | $ | 172 | ||||||||
Changes in AOCI, Net of Tax for the Year Ended December 31, 2020
| Changes in | ||||||||||||||||||||
| Net Unrealized Gain on Fixed Maturities | Unrealized Loss on Fixed Maturities with ACL | Net Gain (Loss) on Cash Flow Hedging Instruments | Foreign Currency Translation Adjustments | Pension and Other Postretirement Plan Adjustments | AOCI, net of tax | |||||||||||||||
| Beginning balance | $ | 1,684 | $ | (3) | $ | 9 | $ | 34 | $ | (1,672) | $ | 52 | ||||||||
| OCI before reclassifications | 1,627 | 1 | 30 | 11 | (117) | 1,552 | ||||||||||||||
| Amounts reclassified from AOCI | (171) | — | (26) | — | 60 | (137) | ||||||||||||||
| OCI, before tax | 1,456 | 1 | 4 | 11 | (57) | 1,415 | ||||||||||||||
| Income tax benefit (expense) | (306) | — | (1) | (2) | 12 | (297) | ||||||||||||||
| OCI, net of tax | 1,150 | 1 | 3 | 9 | (45) | 1,118 | ||||||||||||||
| Ending balance | $ | 2,834 | $ | (2) | $ | 12 | $ | 43 | $ | (1,717) | $ | 1,170 | ||||||||
Changes in AOCI, Net of Tax for the Year ended December 31, 2019
| Changes in | |||||||||||||||||||||||||||||||||||||||||
| Net Unrealized Gain on Fixed Maturities | OTTI Losses in OCI | Net Gain on Cash Flow Hedging Instruments | Foreign Currency Translation Adjustments | Pension and Other Postretirement Plan Adjustments | AOCI, net of tax | ||||||||||||||||||||||||||||||||||||
| Beginning balance | $ | 24 | $ | (4) | $ | (5) | $ | 30 | $ | (1,624) | $ | (1,579) | |||||||||||||||||||||||||||||
| OCI before reclassifications | 2,275 | 1 | 28 | 5 | (104) | 2,205 | |||||||||||||||||||||||||||||||||||
| Amounts reclassified from AOCI | (174) | — | (10) | — | 43 | (141) | |||||||||||||||||||||||||||||||||||
| OCI, before tax | 2,101 | 1 | 18 | 5 | (61) | 2,064 | |||||||||||||||||||||||||||||||||||
| Income tax benefit (expense) | (441) | — | (4) | (1) | 13 | (433) | |||||||||||||||||||||||||||||||||||
| OCI, net of tax | 1,660 | 1 | 14 | 4 | (48) | 1,631 | |||||||||||||||||||||||||||||||||||
| Ending balance | $ | 1,684 | $ | (3) | $ | 9 | $ | 34 | $ | (1,672) | $ | 52 | |||||||||||||||||||||||||||||
210
|
| Note 18 - Accumulated Other Comprehensive Income | ||||||||
THE HARTFORD FINANCIAL SERVICES GROUP, INC.
NOTES TO CONSOLIDATED FINANCIAL STATEMENTS (continued)
Reclassifications from AOCI
| AOCI | Amount Reclassified from AOCI | Affected Line Item in the Consolidated Statement of Operations | ||||||||||||
| For the year ended December 31, 2021 | For the year ended December 31, 2020 | For the year ended December 31, 2019 | ||||||||||||
| Net Unrealized Gain on Fixed Maturities | ||||||||||||||
| Fixed maturities, AFS | $ | 234 | $ | 171 | $ | 174 | Net realized gains (losses) | |||||||
| 234 | 171 | 174 | Total before tax | |||||||||||
| 49 | 36 | 37 | Income tax expense | |||||||||||
| $ | 185 | $ | 135 | $ | 137 | Net income | ||||||||
| Net Gains on Cash Flow Hedging Instruments | ||||||||||||||
| Interest rate swaps | $ | — | $ | — | $ | 2 | Net realized gains (losses) | |||||||
| Interest rate swaps | 41 | 29 | 4 | Net investment income | ||||||||||
| Interest rate swaps | (10) | (7) | 1 | Interest expense | ||||||||||
| Foreign currency swaps | — | (1) | — | Net realized gains (losses) | ||||||||||
| Foreign currency swaps | 5 | 5 | 3 | Net investment income | ||||||||||
| 36 | 26 | 10 | Total before tax | |||||||||||
| 8 | 5 | 2 | Income tax expense | |||||||||||
| $ | 28 | $ | 21 | $ | 8 | Net income | ||||||||
| Pension and Other Postretirement Plan Adjustments | ||||||||||||||
| Amortization of prior service credit | $ | 7 | $ | 7 | $ | 7 | Insurance operating costs and other expenses | |||||||
| Amortization of actuarial loss | (77) | (67) | (50) | Insurance operating costs and other expenses | ||||||||||
| (70) | (60) | (43) | Total before tax | |||||||||||
| (15) | (13) | (9) | Income tax expense | |||||||||||
| (55) | (47) | (34) | Net income | |||||||||||
| Total amounts reclassified from AOCI | $ | 158 | $ | 109 | $ | 111 | Net income | |||||||
19. EMPLOYEE BENEFIT PLANS
Investment and Savings Plan
Substantially all U.S. employees of the Company are eligible to participate in The Hartford Investment and Savings Plan under which designated contributions may be invested in a variety of investments, including up to 10% in a fund consisting largely of common stock of The Hartford. The Company's contributions include a non-elective contribution of 2.0% of eligible compensation and a dollar-for-dollar matching contribution of up to 6.0% of eligible compensation contributed by the employee each pay period. The Company also maintains a non-qualified savings plan, The Hartford Excess Savings Plan, with the dollar-for-dollar matching contributions related to employee compensation in excess of the amount of eligible compensation that can be contributed under the tax-qualified Investment and Savings Plan. An employee's eligible compensation includes overtime and bonuses but for the Investment and Savings Plan and Excess Savings Plan combined, is limited to $1 annually. The total cost to The Hartford for these plans was approximately
$147, $153 and $156 for the years ended December 31, 2021, 2020 and 2019, respectively.
Additionally, The Hartford has established defined contribution pension plans for certain employees of the Company’s international subsidiaries. The cost to The Hartford for the years ended December 31, 2021, 2020 and 2019 for these plans was immaterial.
Postretirement Benefit Plans
Defined Benefit Pension Plan- The Company maintains The Hartford Retirement Plan for U.S. Employees, a U.S. qualified defined benefit pension plan (“U.S. Pension Plan”) that covers substantially all U.S. employees hired prior to January 1, 2013. The Company also maintains non-qualified pension plans to provide retirement benefits previously accrued that are in excess of Internal Revenue Code limitations, as well as a Canadian defined benefit pension plan. Together, the non-
211
|
| Note 19 - Employee Benefit Plans | ||||||||
THE HARTFORD FINANCIAL SERVICES GROUP, INC.
NOTES TO CONSOLIDATED FINANCIAL STATEMENTS (continued)
qualified and Canadian defined benefit plan are referred to as "Other Pension Plans".
The U.S. Pension Plan includes two benefit formulas, both of which are frozen: a final average pay formula (for which all accruals ceased as of December 31, 2008) and a cash balance formula for which benefit accruals ceased as of December 31, 2012, although interest will continue to accrue to existing cash balance formula account balances. Employees who were participants as of December 31, 2012 continue to earn vesting credit with respect to their frozen accrued benefits if they continue to work. The interest crediting rate on the cash balance plan is the greater of the average annual yield on 10-year U.S. Treasury Securities or 3.3%. The Hartford Excess Pension Plan I and The Hartford Excess Pension Plan II, the Company's non-qualified excess pension benefit plans for certain highly compensated employees, are also frozen.
Group Retiree Health Plan- The Company provides certain health care and life insurance benefits for eligible retired employees. The Company’s contribution for health care benefits are a function of the retiree’s date of retirement and years of service. In addition, the plan has a defined dollar cap for certain retirees which limits average Company contributions. The Hartford has prefunded a portion of the health care obligations where such prefunding can be accomplished on a tax effective basis. Beginning January 1, 2017, for retirees 65 and older who were participating in the Retiree PPO Medical Plan, the Company funds the cost of medical and dental health care benefits through contributions to a Health Reimbursement Account and covered individuals can access a variety of insurance plans from a health care exchange. Effective January 1, 2002, Company-subsidized retiree medical, retiree dental and retiree life insurance benefits were eliminated for employees with original hire dates with the Company on or after January 1, 2002. The Company also amended its postretirement medical, dental and life insurance coverage plans to no longer provide subsidized coverage for employees who retired on or after January 1, 2014.
Assumptions
Pursuant to accounting principles related to the Company’s pension and other postretirement obligations to employees
under its various benefit plans, the Company is required to make a significant number of assumptions in order to calculate the related liabilities and expenses each period. The two economic assumptions that have the most impact on pension and other postretirement expense under the defined benefit pension plans and group retiree health plan are the discount rate and the expected long-term rate of return on plan assets. The assumed discount rates and yield curve is based on high-quality fixed income investments consistent with the maturity profile of the expected liability cash flows. Based on all available market and industry information, it was determined that 2.91% and 2.72% were the appropriate discount rates as of December 31, 2021 to calculate the Company’s U.S. Pension Plan and other postretirement obligations, respectively.
The expected long-term rate of return considers the actual compound rates of return earned over various historical time periods. The Company also considers the investment volatility, duration and total returns for various time periods related to the characteristics of the pension obligation, which are influenced by the Company's workforce demographics. In addition, for the pension plan, the Company anticipates an allocation of approximately 73% in fixed income securities and 27% in non fixed income securities (global equities, hedge funds and private market alternatives) to derive an expected long-term rate of return. For the other postretirement plans, the Company anticipates an allocation of approximately 70% in fixed income securities and 30% in non fixed income securities. Based upon these analyses, management determined the long-term rate of return assumption to be 5.40% and 4.90% for the Company's U.S. Pension Plan and other postretirement obligations, respectively, for the year ended December 31, 2021 and 6.00% and 5.60% for the Company's U.S. Pension Plan and other postretirement obligations, respectively, for the year ended December 31, 2020. To determine the Company's 2022 expense, the Company has assumed an expected long-term rate of return on plan assets of 5.10% and 4.80% for the Company's U.S. Pension Plan and other postretirement obligations, respectively.
212
|
| Note 19 - Employee Benefit Plans | ||||||||
THE HARTFORD FINANCIAL SERVICES GROUP, INC.
NOTES TO CONSOLIDATED FINANCIAL STATEMENTS (continued)
Assumptions Used in Calculating the Benefit Obligations and the Net Amount Recognized
| For the years ended December 31, | |||||||||||
| 2021 | 2020 | 2019 | |||||||||
| Weighted Average Assumptions used to determine benefit obligations | |||||||||||
| Discount rate: | |||||||||||
| U.S. Pension Plan | 2.91 | % | 2.65 | % | 3.33 | % | |||||
| Other Pension Plans | 2.83 | % | 2.51 | % | 3.23 | % | |||||
| Other postretirement benefits | 2.72 | % | 2.36 | % | 3.15 | % | |||||
| Interest crediting rate on cash balance plan | 3.30 | % | 3.30 | % | 3.30 | % | |||||
| Weighted Average Assumptions used to determine net periodic benefit costs: | |||||||||||
| Discount rate: | |||||||||||
| U.S. Pension Plan | 2.66 | % | 3.33 | % | 4.35 | % | |||||
| Other Pension Plans | 2.52 | % | 3.25 | % | 4.28 | % | |||||
| Other postretirement benefits | 2.36 | % | 3.15 | % | 4.23 | % | |||||
| Expected long-term rate of return on plan assets: | |||||||||||
| U.S. Pension Plan | 5.40 | % | 6.00 | % | 6.45 | % | |||||
| Other Pension Plans | 2.90 | % | 3.90 | % | 4.50 | % | |||||
| Other postretirement benefits | 4.90 | % | 5.60 | % | 6.00 | % | |||||
| Assumed Health Care Cost Trend Rates | |||||||||||
| Pre-65 health care cost trend rate | 7.00 | % | 7.00 | % | 7.00 | % | |||||
| Post-65 health care cost trend rate | N/A | N/A | N/A | ||||||||
| Rate to which the cost trend rate is assumed to decline (the ultimate trend rate) | 4.50 | % | 4.50 | % | 4.50 | % | |||||
| Year that the rate reaches the ultimate trend rate | 2033 | 2033 | 2033 | ||||||||
Obligations and Funded Status
The following tables set forth a reconciliation of beginning and ending balances of the benefit obligation and fair value of plan assets, as well as the funded status of the Company's defined benefit pension and postretirement health care and life
insurance benefit plans. Information is presented for the qualified U.S. Pension Plan, Other Pension Plans (including non-qualified plans and the Canadian pension plan) and other postretirement benefits.
213
|
| Note 19 - Employee Benefit Plans | ||||||||
THE HARTFORD FINANCIAL SERVICES GROUP, INC.
NOTES TO CONSOLIDATED FINANCIAL STATEMENTS (continued)
Obligations and Funded Status
| U.S. Pension Plan | Other Pension Plans | Total Pension Plans | Other Postretirement Benefits | ||||||||||||||||||||||||||||||||
| For the years ended December 31, | |||||||||||||||||||||||||||||||||||
| 2021 | 2020 | 2021 | 2020 | 2021 | 2020 | 2021 | 2020 | ||||||||||||||||||||||||||||
| Change in Benefit Obligation | |||||||||||||||||||||||||||||||||||
| Benefit obligation — beginning of year | $ | 4,409 | $ | 4,060 | $ | 466 | $ | 438 | $ | 4,875 | $ | 4,498 | $ | 220 | $ | 223 | |||||||||||||||||||
| Service cost | 4 | 4 | — | — | 4 | 4 | — | — | |||||||||||||||||||||||||||
| Interest cost | 87 | 115 | 9 | 12 | 96 | 127 | 3 | 6 | |||||||||||||||||||||||||||
| Plan participants’ contributions | — | — | — | — | — | — | 11 | 11 | |||||||||||||||||||||||||||
| Actuarial loss (gain) | (7) | 8 | 2 | 4 | (5) | 12 | 1 | (2) | |||||||||||||||||||||||||||
| Changes in assumptions | (96) | 399 | (11) | 38 | (107) | 437 | (5) | 16 | |||||||||||||||||||||||||||
| Benefits and expenses paid | (187) | (177) | (26) | (26) | (213) | (203) | (33) | (34) | |||||||||||||||||||||||||||
| Foreign exchange adjustment | — | — | (1) | — | (1) | — | — | — | |||||||||||||||||||||||||||
| Benefit obligation — end of year [1] | $ | 4,210 | $ | 4,409 | $ | 439 | $ | 466 | $ | 4,649 | $ | 4,875 | $ | 197 | $ | 220 | |||||||||||||||||||
| Change in Plan Assets | |||||||||||||||||||||||||||||||||||
| Fair value of plan assets — beginning of year | $ | 4,346 | $ | 3,899 | $ | 17 | $ | 15 | $ | 4,363 | $ | 3,914 | $ | 63 | $ | 75 | |||||||||||||||||||
| Actual return on plan assets | 338 | 566 | (1) | 2 | 337 | 568 | 4 | 6 | |||||||||||||||||||||||||||
| Employer contributions [2] | — | 70 | — | — | — | 70 | 7 | 5 | |||||||||||||||||||||||||||
| Benefits paid [3] | (187) | (177) | (1) | — | (188) | (177) | (23) | (23) | |||||||||||||||||||||||||||
| Expenses paid | (30) | (12) | — | — | (30) | (12) | — | — | |||||||||||||||||||||||||||
| Fair value of plan assets — end of year | $ | 4,467 | $ | 4,346 | $ | 15 | $ | 17 | $ | 4,482 | $ | 4,363 | $ | 51 | $ | 63 | |||||||||||||||||||
| Funded status — end of year | $ | 257 | $ | (63) | $ | (424) | $ | (449) | $ | (167) | $ | (512) | $ | (146) | $ | (157) | |||||||||||||||||||
| Amounts Recognized in the Consolidated Balance Sheets | |||||||||||||||||||||||||||||||||||
| Other assets | $ | 257 | $ | — | $ | — | $ | — | $ | 257 | $ | — | $ | — | $ | — | |||||||||||||||||||
| Other liabilities | $ | — | $ | (63) | $ | (424) | $ | (449) | $ | (424) | $ | (512) | $ | (146) | $ | (157) | |||||||||||||||||||
[1] As of December 31, 2021 and 2020, the Accumulated Benefit Obligation is equal to the Projected Benefit Obligation.
[2] Employer contributions in 2020 to the U.S. qualified defined benefit pension plan were discretionary, made in cash, and did not include contributions of the Company’s common stock.
[3] Other postretirement benefits paid represent non-key employee postretirement medical benefits paid from the Company's prefunded trust fund.
Changes in assumptions for the U.S. Pension Plan in 2021 primarily included a $109 decrease in the benefit obligation for pension benefits as a result of an increase in the discount rate from 2.65% as of the December 31, 2020 valuation to 2.91% as of the December 31, 2021 valuation. Changes in assumptions in 2020 included a $395 increase in the benefit obligation for pension benefits as a result of a decrease in the discount rate from 3.33% as of the December 31, 2019 valuation to 2.65% as of the December 31, 2020 valuation.
Changes in assumptions for the Other Pension Plans in 2021 primarily included a $12 decrease in the benefit obligation for pension benefits as a result of an increase in the discount rate from 2.51% as of the December 31, 2020 valuation to 2.83% as of the December 31, 2021 valuation. Changes in assumptions in 2020 included a $39 increase in the benefit obligation for pension benefits as a result of a decrease in the discount rate from 3.23% as of the December 31, 2019 valuation to 2.51% as of the December 31, 2020 valuation.
The cash balance plan pension benefit obligation was $414 and $443 as of December 31, 2021 and 2020, respectively.
The fair value of assets for total pension plans, and hence the funded status, presented in the table above excludes assets of $210 and $186 as of December 31, 2021 and 2020, respectively, held in rabbi trusts and designated for the Other Pension Plans. The assets do not qualify as plan assets; however, the assets are available to pay benefits for certain retired, terminated and active participants. Such assets are available to the Company’s general creditors in the event of insolvency. The rabbi trust assets consist of equity and fixed income investments. To the extent the fair value of these rabbi trusts were included in the table above, total pension plan assets would have been $4,692 and $4,549 as of December 31, 2021 and 2020, respectively, and the funded status of total pension plans would have been $43 and $(326) as of December 31, 2021 and 2020, respectively.
The tables below present an aggregate view of net periodic cost (benefit) and components of other comprehensive income and AOCI for pension plans that includes both the U.S. Pension Plan and Other Pension Plans. Net periodic cost (benefit) is recognized in insurance operating costs and other expenses in the consolidated statement of operations.
214
|
| Note 19 - Employee Benefit Plans | ||||||||
THE HARTFORD FINANCIAL SERVICES GROUP, INC.
NOTES TO CONSOLIDATED FINANCIAL STATEMENTS (continued)
Net Periodic Cost (Benefit)
| Pension Benefits | Other Postretirement Benefits | |||||||||||||||||||
| For the years ended December 31, | ||||||||||||||||||||
| 2021 | 2020 | 2019 | 2021 | 2020 | 2019 | |||||||||||||||
| Service cost | $ | 4 | $ | 4 | $ | 4 | $ | — | $ | — | $ | — | ||||||||
| Interest cost | 96 | 127 | 159 | 3 | 6 | 8 | ||||||||||||||
| Expected return on plan assets | (205) | (215) | (226) | (3) | (4) | (4) | ||||||||||||||
| Amortization of prior service credit | — | — | — | (7) | (7) | (7) | ||||||||||||||
| Amortization of actuarial loss | 69 | 60 | 44 | 8 | 7 | 6 | ||||||||||||||
| Net periodic cost (benefit) | $ | (36) | $ | (24) | $ | (19) | $ | 1 | $ | 2 | $ | 3 | ||||||||
Amounts Recognized in Other Comprehensive Income (Loss)
| Pension Benefits | Other Postretirement Benefits | |||||||||||||||||||
| For the years ended December 31, | ||||||||||||||||||||
| 2021 | 2020 | 2019 | 2021 | 2020 | 2019 | |||||||||||||||
| Amortization of actuarial loss | $ | 69 | $ | 60 | $ | 44 | $ | 8 | $ | 7 | $ | 6 | ||||||||
| Amortization of prior service credit | — | — | — | (7) | (7) | (7) | ||||||||||||||
| Net income (loss) arising during the year | 214 | (106) | (88) | 5 | (11) | (18) | ||||||||||||||
| Prior service cost (credit) | — | — | — | — | — | 2 | ||||||||||||||
| Total | $ | 283 | $ | (46) | $ | (44) | $ | 6 | $ | (11) | $ | (17) | ||||||||
Amounts in Accumulated Other Comprehensive Income (Loss), Before Tax, not yet Recognized as Components of Net Periodic Benefit Cost
| Pension Benefits | Other Postretirement Benefits | |||||||||||||||||||
| As of December 31, | ||||||||||||||||||||
| 2021 | 2020 | 2019 | 2021 | 2020 | 2019 | |||||||||||||||
| Net loss | $ | (1,815) | $ | (2,098) | $ | (2,052) | $ | (124) | $ | (136) | $ | (132) | ||||||||
| Prior service credit | — | — | — | 54 | 60 | 67 | ||||||||||||||
| Total | $ | (1,815) | $ | (2,098) | $ | (2,052) | $ | (70) | $ | (76) | $ | (65) | ||||||||
Pension Plan Assets
Investment Strategy and Target Allocation
The overall investment strategy of the U.S. Pension Plan is to produce total investment returns that provide sufficient funding for present and anticipated future benefit obligations within the constraints of a prudent level of portfolio risk and diversification. With respect to asset management, the oversight responsibility of the U.S. Pension Plan rests with The Hartford’s Pension Investment Committee composed of individuals whose responsibilities include establishing overall objectives and the setting of investment policy; selecting appropriate investment options and ranges; selecting qualified service providers such as investment managers and investment consultants; reviewing the asset allocation mix and asset allocation targets on a regular basis; and monitoring performance to determine whether or not the rate of return objectives are being met and that policy and guidelines are being followed. The Pension Investment Committee has adopted a de-risking glide path that reduces the target allocation to equity securities and alternative assets and increases the allocation to fixed income securities over time in response to improvement in the funded status of the U.S. Pension Plan. The Company believes that the asset allocation
decision will be the single most important factor determining the long-term performance of the U.S. Pension Plan.
Target Asset Allocation
| Pension Plans | Other Postretirement Plans | |||||||||||||
| Minimum | Maximum | Minimum | Maximum | |||||||||||
| Equity securities | 3 | % | 23 | % | — | % | 45 | % | ||||||
| Fixed income securities | 69 | % | 77 | % | 55 | % | 100 | % | ||||||
| Alternative assets | — | % | 28 | % | — | % | — | % | ||||||
Divergent market performance among different asset classes and changes in the context of the glide path may, from time to time, cause the asset allocation to deviate from the desired asset allocation ranges. The asset allocation mix is reviewed on a periodic basis. If it is determined that an asset allocation mix rebalancing is required, future portfolio additions and withdrawals will be used first, as necessary, to bring the allocation within tactical ranges, before shifting assets across portfolios.
215
|
| Note 19 - Employee Benefit Plans | ||||||||
THE HARTFORD FINANCIAL SERVICES GROUP, INC.
NOTES TO CONSOLIDATED FINANCIAL STATEMENTS (continued)
The U.S. Pension Plan invests in investment portfolios, including commingled funds and partnerships, managed by affiliated and unaffiliated managers to gain exposure to emerging markets, equity, hedge funds and other alternative investments. These portfolios encompass multiple asset classes reflecting the current needs of the U.S. Pension Plan, the investment preferences and risk tolerance of the U.S. Pension Plan and the desired degree of diversification. These asset classes include publicly traded equities, bonds and alternative investments and are made up of individual investments in cash and cash equivalents, equity securities, debt securities, asset-backed
securities, mortgage loans and hedge funds. Hedge fund investments represent a diversified portfolio of partnership investments in a variety of strategies.
In addition, the Company uses U.S. Treasury bond futures contracts and U.S. Treasury STRIPS, in addition to certain other investments, in a duration overlay program to adjust the duration of U.S. Pension Plan assets to better match the duration of the benefit obligation.
Pension Plan Assets at Fair Value
| As of December 31, 2021 | As of December 31, 2020 | ||||||||||||||||||||||||||||
| Asset Category | Level 1 | Level 2 | Level 3 | Total | Level 1 | Level 2 | Level 3 | Total | |||||||||||||||||||||
| Short-term investments: | $ | 120 | $ | 29 | $ | — | $ | 149 | $ | 75 | $ | 25 | $ | — | $ | 100 | |||||||||||||
| Fixed Income Securities: | |||||||||||||||||||||||||||||
| Corporate | — | 2,333 | 42 | 2,375 | — | 2,303 | 39 | 2,342 | |||||||||||||||||||||
| RMBS | — | 98 | — | 98 | — | 41 | 1 | 42 | |||||||||||||||||||||
| U.S. Treasuries | 23 | 169 | — | 192 | — | 47 | — | 47 | |||||||||||||||||||||
| Foreign government | — | 38 | 2 | 40 | — | 16 | 9 | 25 | |||||||||||||||||||||
| CMBS | — | 56 | 4 | 60 | — | 30 | — | 30 | |||||||||||||||||||||
| Other fixed income [1] | — | 185 | 1 | 186 | — | 137 | — | 137 | |||||||||||||||||||||
| Mortgage Loans | — | — | 202 | 202 | — | — | 161 | 161 | |||||||||||||||||||||
| Equity Securities: | |||||||||||||||||||||||||||||
| Domestic | 237 | — | — | 237 | 513 | — | — | 513 | |||||||||||||||||||||
| International | 121 | — | — | 121 | 271 | — | — | 271 | |||||||||||||||||||||
| Total pension plan assets at fair value, in the fair value hierarchy [2] | $ | 501 | $ | 2,908 | $ | 251 | $ | 3,660 | $ | 859 | $ | 2,599 | $ | 210 | $ | 3,668 | |||||||||||||
| Other Investments, at net asset value [3]: | |||||||||||||||||||||||||||||
| Private Market Alternatives | 572 | 451 | |||||||||||||||||||||||||||
| Hedge funds | 199 | 224 | |||||||||||||||||||||||||||
| Total pension plan assets at fair value | $ | 501 | $ | 2,908 | $ | 251 | $ | 4,431 | $ | 859 | $ | 2,599 | $ | 210 | $ | 4,343 | |||||||||||||
[1]Includes ABS, municipal bonds, and CDOs.
[2]Excludes $51 and $20 as of December 31, 2021 and 2020, respectively, of investment receivables net of investment payables that are excluded from this disclosure requirement because they are trade receivables in the ordinary course of business where the carrying amount approximates fair value.
[3]Investments that are measured at net asset value per share or an equivalent and have not been classified in the fair value hierarchy.
The tables below provide fair value level 3 rollforwards for the U.S. Pension Plan Assets for which significant unobservable inputs ("Level 3") are used in the fair value measurement on a recurring basis. The U.S. Pension Plan classifies the fair value of financial instruments within Level 3 if there are no observable markets for
the instruments or, in the absence of active markets, if one or more of the significant inputs used to determine fair value are based on the U.S. Pension Plan’s own assumptions. Therefore, the gains and losses in the tables below include changes in fair value due to both observable and unobservable factors.
216
|
| Note 19 - Employee Benefit Plans | ||||||||
THE HARTFORD FINANCIAL SERVICES GROUP, INC.
NOTES TO CONSOLIDATED FINANCIAL STATEMENTS (continued)
| Pension Plan Asset Fair Value Measurements Using Significant Unobservable Inputs (Level 3) | |||||||||||||||||||||||
| Assets | Corporate | RMBS | Foreign government | Mortgage loans | Other [1] | Totals | |||||||||||||||||
| Fair Value as of January 1, 2021 | $ | 39 | $ | 1 | $ | 9 | $ | 161 | $ | — | $ | 210 | |||||||||||
| Realized gains (losses), net | — | — | — | (3) | — | (3) | |||||||||||||||||
| Changes in unrealized gains, net | — | — | — | — | — | — | |||||||||||||||||
| Purchases | 6 | — | — | 55 | 5 | 66 | |||||||||||||||||
| Settlements | — | — | — | — | — | — | |||||||||||||||||
| Sales | (5) | — | (7) | (11) | — | (23) | |||||||||||||||||
| Transfers into Level 3 | 2 | — | — | — | — | 2 | |||||||||||||||||
| Transfers out of Level 3 | — | (1) | — | — | — | (1) | |||||||||||||||||
| Fair Value as of December 31, 2021 | $ | 42 | $ | — | $ | 2 | $ | 202 | $ | 5 | $ | 251 | |||||||||||
| Fair Value as of January 1, 2020 | $ | 27 | $ | — | $ | 1 | $ | 131 | $ | 1 | $ | 160 | |||||||||||
| Realized gains (losses), net | — | — | — | — | (1) | (1) | |||||||||||||||||
| Changes in unrealized gains, net | 1 | — | — | 4 | 1 | 6 | |||||||||||||||||
| Purchases | 14 | 1 | 9 | 32 | — | 56 | |||||||||||||||||
| Settlements | — | — | — | — | — | — | |||||||||||||||||
| Sales | (3) | — | — | (6) | — | (9) | |||||||||||||||||
| Transfers into Level 3 | — | — | — | — | — | — | |||||||||||||||||
| Transfers out of Level 3 | — | — | (1) | — | (1) | (2) | |||||||||||||||||
| Fair Value as of December 31, 2020 | $ | 39 | $ | 1 | $ | 9 | $ | 161 | $ | — | $ | 210 | |||||||||||
[1]"Other" includes U.S. Treasuries, Other fixed income and CMBS investments.
During the year ended December 31, 2021, transfers into and (out) of Level 3 are primarily attributable to the appearance of or lack thereof of market observable information and the re-evaluation of the observability of pricing inputs.
During the year ended December 31, 2020, transfers into and (out) of Level 3 are primarily attributable to the appearance of or
lack thereof of market observable information and the re-evaluation of the observability of pricing inputs.
There was less than $1 in Company common stock included in the U.S. Pension Plan’s assets as of December 31, 2021 and 2020.
Other Postretirement Plan Assets at Fair Value
| As of December 31, 2021 | As of December 31, 2020 | ||||||||||||||||||||||||||||
| Asset Category | Level 1 | Level 2 | Level 3 | Total | Level 1 | Level 2 | Level 3 | Total | |||||||||||||||||||||
| Short-term investments | $ | 1 | $ | — | $ | — | $ | 1 | $ | 2 | $ | — | $ | — | $ | 2 | |||||||||||||
| Fixed Income Securities: | |||||||||||||||||||||||||||||
| Corporate | — | 11 | — | 11 | — | 16 | — | 16 | |||||||||||||||||||||
| RMBS | — | 7 | — | 7 | — | 9 | — | 9 | |||||||||||||||||||||
| U.S. Treasuries | 1 | 13 | — | 14 | — | 16 | — | 16 | |||||||||||||||||||||
| Foreign government | 1 | — | — | 1 | — | — | — | — | |||||||||||||||||||||
| CMBS | — | — | — | — | — | 1 | — | 1 | |||||||||||||||||||||
| Other fixed income | — | 1 | — | 1 | — | 2 | — | 2 | |||||||||||||||||||||
| Equity Securities: | |||||||||||||||||||||||||||||
| Large-cap | 16 | — | — | 16 | 17 | — | — | 17 | |||||||||||||||||||||
| Total other postretirement plan assets at fair value | $ | 19 | $ | 32 | $ | — | $ | 51 | $ | 19 | $ | 44 | $ | — | $ | 63 | |||||||||||||
There was no Company common stock included in the other postretirement benefit plan assets as of December 31, 2021 and 2020.
Concentration of Risk
In order to minimize risk, the Pension Plan maintains a listing of permissible and prohibited investments. In addition, the Pension Plan has certain concentration limits and investment quality requirements imposed on permissible investment options.
217
|
| Note 19 - Employee Benefit Plans | ||||||||
THE HARTFORD FINANCIAL SERVICES GROUP, INC.
NOTES TO CONSOLIDATED FINANCIAL STATEMENTS (continued)
Permissible investments include U.S. equity, international equity, alternative asset and fixed income investments including derivative instruments. Permissible derivative instruments include futures contracts, options, swaps, currency forwards, caps or floors and may be used to control risk or enhance return but will not be used for leverage purposes.
Securities specifically prohibited from purchase include, but are not limited to: shares or fixed income instruments issued by The Hartford (other than equity securities purchased on the open market as part of a passively managed strategy), short sales of any type within long-only portfolios, non-derivative securities involving the use of margin, leveraged floaters and inverse floaters, including money market obligations, natural resource real properties such as oil, gas or timber and precious metals.
Other than U.S. government and certain U.S. government agencies backed by the full faith and credit of the U.S. government, the Pension Plan does not have any material exposure to any concentration risk of a single issuer.
Expected Employer Contributions
The Company does not have a 2022 required minimum funding contribution for the U.S. qualified defined benefit pension plan. The Company has not determined whether, and to what extent,
contributions may be made to the U. S. qualified defined benefit pension plan in 2022. The Company will monitor the funded status of the U.S. qualified defined benefit pension plan during 2022 to make this determination.
Benefit Payments
Amounts of Benefits Expected to be Paid over the next Ten Years from Pension and other Postretirement Plans as of December 31, 2021
| Pension Benefits | Other Postretirement Benefits | |||||||
| 2022 | $ | 228 | $ | 20 | ||||
| 2023 | 234 | 18 | ||||||
| 2024 | 240 | 16 | ||||||
| 2025 | 250 | 15 | ||||||
| 2026 | 249 | 14 | ||||||
| 2027 - 2031 | 1,265 | 56 | ||||||
| Total | $ | 2,466 | $ | 139 | ||||
20. STOCK COMPENSATION PLANS
The Company's stock-based compensation plans are described below. Shares issued in satisfaction of stock-based compensation may be made available from authorized but unissued shares, shares held by the Company in treasury or from shares purchased in the open market. In 2021, 2020 and 2019, the Company issued shares from treasury in satisfaction of stock-based compensation.
The Hartford measures stock compensation at the grant date based on the estimated fair value of the award and recognizes expense on a straight-line basis, net of estimated forfeitures, over the requisite service period. Stock-based compensation expense, included in insurance operating costs and other expenses in the consolidated statement of operations, was as follows:
Stock-Based Compensation Expense
| For the years ended December 31, | |||||||||||
| 2021 | 2020 | 2019 | |||||||||
| Stock-based compensation plans expense | $ | 128 | $ | 116 | $ | 125 | |||||
| Income tax benefit | (22) | (20) | (21) | ||||||||
| Excess tax benefit on awards vested, exercised and expired | (6) | (1) | (6) | ||||||||
| Total stock-based compensation plans expense, net of tax | $ | 100 | $ | 95 | $ | 98 | |||||
The Company did not capitalize any cost of stock-based compensation. As of December 31, 2021, the total compensation cost related to non-vested awards not yet recognized was $71, which is expected to be recognized over a weighted average period of 2 years.
Stock Plan
Future stock-based awards may be granted under The Hartford's 2020 Stock Incentive Plan (the "Stock Incentive Plan") other than the Subsidiary Stock Plan and the Employee Stock Purchase Plan described below. The Stock Incentive Plan provides for awards to be granted in the form of non-qualified or incentive stock options qualifying under Section 422 of the Internal Revenue Code, stock appreciation rights, performance shares, restricted stock or restricted stock units, or any other form of stock-based award. The maximum number of shares, subject to adjustments set forth in the 2020 Stock Plan, that may be issued to Company employees and third-party service providers during the 10-year duration of the Stock Incentive Plan
218
|
| Note 20 - Stock Compensation Plans | ||||||||
THE HARTFORD FINANCIAL SERVICES GROUP, INC.
NOTES TO CONSOLIDATED FINANCIAL STATEMENTS (continued)
is the sum of 11,250,000 shares, any shares cancelled subsequent to February 29, 2020, plus any shares used for tax withholding purposes. If any award under an earlier incentive stock plan is forfeited, terminated, surrendered, exchanged, expires unexercised, or is settled in cash in lieu of stock (including to effect tax withholding) or for the net issuance of a lesser number of shares than the number subject to the award, the shares of stock subject to such award (or the relevant portion thereof) shall be available for awards under the Stock Incentive Plan and such shares shall be added to the maximum limit. As of December 31, 2021, there were 9,667,290 shares available for future issuance.
The fair values of awards granted under the Stock Incentive Plan are measured as of the grant date and expensed ratably over the awards’ vesting periods, generally 3 years. For stock option awards to retirement-eligible employees, the Company recognizes the expense over a period shorter than the stated vesting period because the employees receive accelerated vesting upon retirement and, therefore, the vesting period is considered non-substantive. Beginning with awards granted in 2017, employees with restricted stock units and performance shares receive accelerated vesting upon meeting certain retirement eligibility criteria.
Stock Option Awards
Under the Stock Incentive Plan, options granted have an exercise price at least equal to the market price of the
Company’s common stock on the date of grant, and an option’s maximum term is not to exceed 10 years. Options generally become exercisable over a period of three years commencing one year from the date of grant.
The Company uses a hybrid lattice/Monte-Carlo based option valuation model (the “Plan Valuation Model”) that incorporates the possibility of early exercise of options into the valuation. The Plan Valuation Model also incorporates the Company’s historical termination and exercise experience to determine the option value.
The Plan Valuation Model incorporates ranges of assumptions for inputs, and those ranges are disclosed below. The term structure of volatility is generally constructed utilizing implied volatilities from exchange-traded options, historical volatility of the Company’s stock and other factors. The Company uses historical data to estimate option exercise and employee termination within the Plan Valuation Model, and accommodates variations in employee preference and risk-tolerance by segregating the grantee pool into a series of behavioral cohorts and conducting a fair valuation for each cohort individually. The expected term of options granted is derived from the output of the option Plan Valuation Model and represents, in a mathematical sense, the period of time that options are expected to be outstanding. The risk-free rate for periods within the contractual life of the option is based on the U.S. Constant Maturity Treasury yield curve in effect at the time of grant.
Stock Options Valuation Assumptions
| For the years ended December 31, | |||||||||||||||||||||||||||||
| 2021 | 2020 | 2019 | |||||||||||||||||||||||||||
| Expected dividend yield | 2.8% | 2.6% | 2.5% | ||||||||||||||||||||||||||
| Expected annualized spot volatility | 34.1 | % | - | 43.0% | 22.2 | % | - | 36.2% | 20.7 | % | - | 36.7% | |||||||||||||||||
| Weighted average annualized volatility | 39.4% | 30.9% | 29.3% | ||||||||||||||||||||||||||
| Risk-free spot rate | 0.03 | % | - | 1.4% | 1.3 | % | - | 1.6% | 2.4 | % | - | 2.6% | |||||||||||||||||
| Expected term | 6.4 years | 6.6 years | 5.9 years | ||||||||||||||||||||||||||
Non-qualified Stock Option Activity Under the Stock Incentive Plan
Number of Options (in thousands) | Weighted Average Exercise Price | Weighted Average Remaining Contractual Term | Aggregate Intrinsic Value | |||||||||||
| For the year ended December 31, 2021 | ||||||||||||||
| Outstanding at beginning of year | 6,693 | $ | 45.54 | |||||||||||
| Granted | 930 | $ | 51.87 | |||||||||||
| Exercised | (1,137) | $ | 39.51 | |||||||||||
| Forfeited | (51) | $ | 53.03 | |||||||||||
| Expired | — | $ | — | |||||||||||
| Outstanding at end of year | 6,435 | $ | 47.46 | 5.7 | $ | 139 | ||||||||
| Outstanding, fully vested and expected to vest | 6,385 | $ | 47.42 | 5.7 | $ | 138 | ||||||||
| Exercisable at end of year | 4,749 | $ | 45.67 | 4.7 | $ | 111 | ||||||||
Aggregate intrinsic value represents the value of the Company's closing stock price on the last trading day of the period in excess of the exercise price multiplied by the number of options outstanding or exercisable. The aggregate intrinsic value excludes the effect of stock options that have a zero or negative
intrinsic value. The weighted average grant-date fair value per share of options granted during the years ended December 31, 2021, 2020, and 2019 was $14.88, $12.97 and $11.71, respectively. For the years ended December 31, 2021, 2020, and 2019, The Hartford received $45, $3, and $24, respectively,
219
|
| Note 20 - Stock Compensation Plans | ||||||||
THE HARTFORD FINANCIAL SERVICES GROUP, INC.
NOTES TO CONSOLIDATED FINANCIAL STATEMENTS (continued)
in cash from exercised stock options. The Hartford recognized tax benefits of $4, $0, and $2 on stock options exercised for the years ended December 31, 2021, 2020 and 2019, respectively. The total intrinsic value of options exercised during the years ended December 31, 2021, 2020 and 2019 was $28, $2, and $16, respectively.
Share Awards
Share awards granted under the Stock Incentive Plan and outstanding include restricted stock units and performance shares. Performance shares become payable within a range of 0% to 200% of the number of shares initially granted based upon the attainment of specific performance goals achieved at the end of three years and for the 2021 grant subject to a modifier that will either increase or decrease final performance by 10% based upon results against predetermined year-end 2023 representation goals for women and people of color in executive level roles. Beginning in 2017, performance shares vest at the earlier of an employee's retirement eligibility date or three years.
Performance share awards granted prior to 2020 that are not dependent on market conditions are valued equal to the market price of the Company's common stock on the date of grant less a discount for the absence of dividends. Performance share awards granted in 2021 and 2020 that are not dependent on market conditions are valued equal to the market price of the Company’s common stock on the date of grant. Stock-compensation expense for these performance share awards without market conditions is based on a current estimate of the number of awards expected to vest based on the performance level achieved and, therefore, may change during the performance period as new estimates of performance are available.
Other performance share awards or portions thereof have a market condition based upon the Company's total stockholder return relative to a group of peer companies within a period of three years from the date of grant. Stock compensation expense for these performance share awards is based on the number of awards expected to vest as estimated at the grant date and, therefore, does not change for changes in estimated performance. The Company uses a risk neutral Monte-Carlo Plan Valuation Model that incorporates time to maturity, implied volatilities of the Company and the peer companies, and correlations between the Company and the peer companies and interest rates.
Assumptions for Total Stockholder Return Performance Shares
| For the years ended December 31, | |||||||||||||||||||||||||||||
| 2021 | 2020 | 2019 | |||||||||||||||||||||||||||
| Volatility of common stock | 37.3% | 19.6% | 19.4% | ||||||||||||||||||||||||||
| Average volatility of peer companies | 27.0 | % | - | 49.0% | 18.0 | % | - | 31.0% | 16.0 | % | - | 27.0% | |||||||||||||||||
| Average correlation coefficient of peer companies | 67.0% | 51.0% | 50.0% | ||||||||||||||||||||||||||
| Risk-free spot rate | 0.2% | 1.2% | 2.4% | ||||||||||||||||||||||||||
| Term | 3.0 years | 3.0 years | 3.0 years | ||||||||||||||||||||||||||
220
|
| Note 20 - Stock Compensation Plans | ||||||||
THE HARTFORD FINANCIAL SERVICES GROUP, INC.
NOTES TO CONSOLIDATED FINANCIAL STATEMENTS (continued)
Total Share Awards
Non-vested Share Award Activity Under the Stock Incentive Plan
Restricted Stock Units | Performance Shares | |||||||||||||
Number of Shares (in thousands) | Weighted-Average Grant-Date Fair Value | Number of Shares (in thousands) | Weighted-Average Grant date Fair Value | |||||||||||
| Non-vested shares | For the year ended December 31, 2021 | |||||||||||||
| Non-vested at beginning of year | 3,866 | $ | 52.58 | 790 | $ | 54.82 | ||||||||
| Granted | 1,628 | $ | 52.13 | 419 | $ | 56.09 | ||||||||
| Performance based adjustment, net | 225 | $ | 60.67 | |||||||||||
| Vested | (1,160) | $ | 52.72 | (624) | $ | 56.44 | ||||||||
| Forfeited | (303) | $ | 51.30 | (45) | $ | 52.89 | ||||||||
| Non-vested at end of year | 4,031 | $ | 52.45 | 765 | $ | 52.53 | ||||||||
In addition to the non-vested shares presented in the above table, there are related non-vested dividend equivalent shares. The number of non-vested dividend equivalent shares related to restricted stock units was 209 thousand and 186 thousand as of December 31, 2021 and 2020, respectively, and the number of non-vested dividend equivalent shares related to performance shares was 30 thousand and 11 thousand as of December 31, 2021 and 2020, respectively. The dividend equivalent shares are subject to the same vesting terms as the restricted stock units and performance shares.
The weighted average grant-date fair value per share of restricted stock units granted during the years ended December 31, 2021, 2020, and 2019 was $52.13, $54.64 and $50.49, respectively. The weighted average grant-
date fair value per share of performance shares granted during the years ended December 31, 2021, 2020, and 2019 was $56.09, $55.62 and $54.07, respectively.
The total fair value of shares vested during the years ended December 31, 2021, 2020 and 2019 was $105, $73 and $102, respectively, based on actual or estimated performance factors. The Company did not make cash payments in settlement of stock compensation during the years ended December 31, 2021, 2020 and 2019.
Subsidiary Stock Plan
In 2013 the Company established a subsidiary stock-based compensation plan similar to the Stock Incentive Plan, except that it awards non-public subsidiary stock as compensation. The
Company recognized stock-based compensation plan expense of $11, $11 and $11 in the years ended December 31, 2021, 2020 and 2019, respectively, for the subsidiary stock plan. Upon employee vesting of subsidiary stock, the Company recognizes a noncontrolling equity interest. Employees are restricted from selling vested subsidiary stock to anyone other than the Company and the Company has discretion on the amount of stock to repurchase. Therefore, the subsidiary stock is classified as equity because it is not mandatorily redeemable. For the years ended December 31, 2021, 2020 and 2019, the Company repurchased $16, $10 and $8, respectively, in subsidiary stock.
Employee Stock Purchase Plan
The Company sponsors The Hartford Employee Stock Purchase Plan ("ESPP"). Under this plan, eligible employees of The Hartford purchase common stock of the Company at a discount rate of 5% of the market price per share on the last trading day of the offering period. Accordingly, the plan is a non-compensatory plan. Employees purchase a variable number of shares of stock through payroll deductions elected as of the beginning of the offering period. The Company may sell up to 15,400,000 shares of stock to eligible employees under the ESPP. As of December 31, 2021, there were 3,544,674 shares available for future issuance. During the years ended December 31, 2021, 2020 and 2019, 199,173 shares, 340,653 shares, and 213,472 shares were sold, respectively. For the years ended December 31, 2021, 2020 and 2019, The Hartford received $13, $13 and $11, respectively, in cash from sales under this plan.
21. LEASES
The Hartford has operating leases for real estate and equipment. The right-of-use asset as of December 31, 2021 and 2020 was $167 and $209, respectively, and is included in property and equipment, net, in the Consolidated Balance Sheet. The lease liability as of December 31, 2021 and 2020 was $184 and $221, respectively, and is included in other liabilities in the Consolidated Balance Sheet. Variable lease costs include changes in interest rates on variable rate leases
primarily for automobiles. In 2021, variable lease costs of $4 were reported in restructuring and other costs for lease terminations under Hartford Next (see Note 23 - Restructuring and Other Costs for more information), and were excluded from components of lease expense.
221
THE HARTFORD FINANCIAL SERVICES GROUP, INC.
NOTES TO CONSOLIDATED FINANCIAL STATEMENTS (continued)
Components of Lease Expense
| For the years ended December 31, | |||||||||||
| 2021 | 2020 | 2019 | |||||||||
| Operating lease cost | $ | 45 | $ | 52 | $ | 49 | |||||
| Short-term lease cost | — | — | 2 | ||||||||
| Variable lease cost | 2 | — | 1 | ||||||||
| Sublease income | (3) | (5) | (5) | ||||||||
| Total lease costs included in insurance operating costs and other expenses | $ | 44 | $ | 47 | $ | 47 | |||||
Supplemental Operating Lease Information
| For the years ended December 31, | |||||||||||
| 2021 | 2020 | 2019 | |||||||||
| Operating cash flows for operating leases (for the twelve months ended) | $ | 46 | $ | 54 | $ | 50 | |||||
| Right-of-use asset obtained in exchange for new operating lease liabilities | 3 | 49 | 42 | ||||||||
| Weighted-average remaining lease term in years for operating leases | 6 years | 7 years | 6 years | ||||||||
| Weighted-average discount rate for operating leases | 3.0 | % | 3.1 | % | 3.5 | % | |||||
Maturities of Operating Lease Liabilities as of December 31, 2021
| Operating Leases | |||||
| 2022 | $ | 42 | |||
| 2023 | 40 | ||||
| 2024 | 31 | ||||
| 2025 | 23 | ||||
| 2026 | 18 | ||||
| Thereafter | 46 | ||||
| Total lease payments | 200 | ||||
| Less: Discount on lease payments to present value | 16 | ||||
| Total lease liability | $ | 184 | |||
22. BUSINESS DISPOSITIONS
Sale of Continental Europe Operations
On December 29, 2021, the Company completed the sale of its Continental Europe Operations for approximately $11, net of transaction costs. The complete sale of the Continental Europe Operations consists of multiple arrangements designed as a single transaction. The Continental Europe Operations are included in the Commercial Lines segment. Revenues and earnings are not material to the Company's consolidated results of operations for the years ended December 31, 2021, 2020 and 2019.
The sale resulted in losses of approximately $21 and $48, before tax, for the periods ended December 31, 2021 and 2020, respectively, which were recorded within net realized gains (losses) in the Consolidated Statements of Operations. The Company also recorded related income tax benefits on the sale of $5 and $18, for after tax losses of $16 and $30, for the years ended December 31, 2021 and 2020, respectively.
Total consideration less costs to sell of $11 is subject to change based on how the ultimate amounts required to settle claims on 2020 and prior accident years, as determined at the end of 2024, compare with recorded reserves as currently estimated.
The contingent consideration has been estimated at its fair value of $0 and could result in an increase or decrease in consideration depending on how ultimate losses develop. Any change in the estimated fair value of contingent consideration in a future period would increase or decrease the estimated loss on sale in that period.
222
|
| Note 22 - Business Dispositions | ||||||||
THE HARTFORD FINANCIAL SERVICES GROUP, INC.
NOTES TO CONSOLIDATED FINANCIAL STATEMENTS (continued)
Major Classes of Assets and Liabilities Transferred by the Company to the Buyer in Connection with the Sale
| Carrying Value as of | ||||||||
| Closing | December 31, 2020 [1][2] | |||||||
| Assets | ||||||||
| Investments and cash | $ | 150 | $ | 142 | ||||
| Reinsurance recoverables and other | 13 | 35 | ||||||
| Total assets held for sale | 163 | 177 | ||||||
| Liabilities | ||||||||
| Unpaid losses and loss adjustment expenses | 81 | 84 | ||||||
| Unearned premiums | 19 | 31 | ||||||
| Other liabilities | 52 | 43 | ||||||
| Total liabilities held for sale | $ | 152 | $ | 158 | ||||
[1]As of December 31, 2020, the estimated fair value of the disposal group is $14 based on the estimated consideration to be received less cost to sell. Within the disposal group, as of December 31, 2020, investments in fixed maturities and short-term investments, which are measured at fair value on a recurring basis, had a fair value of $84, of which $1 was based on quoted prices in active markets for identical assets and $83 was based on significant observable inputs. The remaining fair value less costs to sell for the disposal group is ($70), which is measured on a nonrecurring basis using significant unobservable inputs. See Note 5—Fair Value Measurements for more information.
[2]Classified as assets and liabilities held for sale.
23. RESTRUCTURING AND OTHER COSTS
In recognition of the need to become more cost efficient and competitive along with enhancing the experience we provide to agents and customers, on July 30, 2020 the Company announced an operational transformation and cost reduction plan it refers to as Hartford Next. Hartford Next is intended to reduce annual insurance operating costs and other expenses through reduction of the Company's headcount, investment in information technology ("IT") to further enhance our capabilities, and other activities. The activities are expected to be substantially complete by the end of 2023.
Termination benefits related to workforce reductions and professional fees are included within restructuring and other costs in the Consolidated Statement of Operations and unpaid restructuring costs are included in other liabilities in the
Company's Consolidated Balance Sheets. For the year ended December 31, 2021, the severance benefits accrual was reduced $25 due to more recent experience of higher than expected voluntary attrition. Subsequent to December 31, 2021, the Company expects to incur additional costs including, amortization of right of use assets and other lease exit costs, other IT costs to retire applications, and other expenses. Total restructuring and other costs are expected to be approximately $130, before tax, and will be recognized in Corporate for segment reporting. The estimated restructuring and other costs for future periods do not include all costs associated with the real estate consolidation plan as those plans are still being finalized.
| Restructuring and Other Costs, Before Tax | ||||||||||||||||||||
| Incurred in the Year Ended December 31, 2020 | Incurred in the Year Ended December 31, 2021 | Cumulative Incurred Through December 31, 2021 | Total Amount Expected to be Incurred | |||||||||||||||||
| Severance benefits | $ | 73 | $ | (25) | $ | 48 | $ | 48 | ||||||||||||
| IT costs | 2 | 9 | 11 | 21 | ||||||||||||||||
| Professional fees and other expenses | 29 | 17 | 46 | 61 | ||||||||||||||||
| Total restructuring and other costs, before tax | $ | 104 | $ | 1 | $ | 105 | $ | 130 | ||||||||||||
223
|
| Note 23 - Restructuring and Other Costs | ||||||||
THE HARTFORD FINANCIAL SERVICES GROUP, INC.
NOTES TO CONSOLIDATED FINANCIAL STATEMENTS (continued)
| Accrued Restructuring and Other Costs | ||||||||||||||||||||
| Year Ended December 31, 2021 | ||||||||||||||||||||
| Severance Benefits and Related Costs | IT Costs | Professional Fees and Other | Total Restructuring and Other Costs Liability | |||||||||||||||||
| Balance, beginning of period | $ | 54 | $ | — | $ | — | $ | 54 | ||||||||||||
| Incurred | (25) | 9 | 17 | 1 | ||||||||||||||||
| Payments | (11) | (9) | (17) | (37) | ||||||||||||||||
| Balance, end of period | $ | 18 | $ | — | $ | — | $ | 18 | ||||||||||||
| Accrued Restructuring and Other Costs | ||||||||||||||||||||
| Year Ended December 31, 2020 | ||||||||||||||||||||
| Severance Benefits and Related Costs | IT Costs | Professional Fees and Other | Total Restructuring and Other Costs Liability | |||||||||||||||||
| Balance, beginning of period | $ | — | $ | — | $ | — | $ | — | ||||||||||||
| Incurred | 73 | 2 | 29 | 104 | ||||||||||||||||
| Payments | (19) | (2) | (29) | (50) | ||||||||||||||||
| Balance, end of period | $ | 54 | $ | — | $ | — | $ | 54 | ||||||||||||
224
Part IV - Schedule I. Summary of Investments - Other Investments in Affiliates
THE HARTFORD FINANCIAL SERVICES GROUP, INC.
SCHEDULE I
SUMMARY OF INVESTMENTS — OTHER THAN INVESTMENTS IN AFFILIATES
(in millions)
| As of December 31, 2021 | |||||||||||
| Type of Investment | Cost | Fair Value | Amount at which shown on Balance Sheet | ||||||||
| Fixed Maturities | |||||||||||
| Bonds and notes | |||||||||||
| U.S. government and government agencies and authorities (guaranteed and sponsored) | $ | 5,706 | $ | 5,881 | $ | 5,881 | |||||
| States, municipalities and political subdivisions | 7,473 | 8,257 | 8,257 | ||||||||
| Foreign governments | 883 | 910 | 910 | ||||||||
| Public utilities | 1,917 | 2,050 | 2,050 | ||||||||
| All other corporate bonds | 15,827 | 16,657 | 16,657 | ||||||||
| All other mortgage-backed and asset-backed securities | 8,982 | 9,092 | 9,092 | ||||||||
| Total fixed maturities, available-for-sale | 40,788 | 42,847 | 42,847 | ||||||||
| Equity Securities | |||||||||||
| Common stocks | |||||||||||
| Industrial, miscellaneous and all other | 1,509 | 1,509 | 1,509 | ||||||||
| Non-redeemable preferred stocks | 585 | 585 | 585 | ||||||||
| Total equity securities, at fair value | 2,094 | 2,094 | 2,094 | ||||||||
| Mortgage loans [1] | 5,412 | 5,576 | 5,383 | ||||||||
| Other investments | 370 | 375 | 375 | ||||||||
| Short-term investments | 3,697 | 3,697 | 3,697 | ||||||||
| Investments in partnerships and trusts | 3,353 | 3,353 | |||||||||
| Total investments | $ | 55,714 | $ | 57,749 | |||||||
[1]Cost of mortgage loans excludes the allowance for credit losses ("ACL") of $29. For further information, refer to Schedule V - Valuation and Qualifying Accounts.
225
Part IV - Schedule II. Condensed Financial Information of the Hartford Financial Services Group, Inc.
THE HARTFORD FINANCIAL SERVICES GROUP, INC.
SCHEDULE II
CONDENSED FINANCIAL INFORMATION OF THE HARTFORD FINANCIAL SERVICES GROUP, INC.
(Registrant)
(in millions)
| As of December 31, | ||||||||
| Condensed Balance Sheets | 2021 | 2020 | ||||||
| Assets | ||||||||
| Fixed maturities, available-for-sale, at fair value (amortized cost of $174 and $127) | $ | 173 | $ | 127 | ||||
| Other investments | 12 | 20 | ||||||
| Short-term investments | 1,732 | 1,678 | ||||||
| Cash | — | — | ||||||
| Investment in affiliates | 22,546 | 22,986 | ||||||
| Deferred income taxes | 430 | 493 | ||||||
| Unamortized issue costs | 3 | 2 | ||||||
| Other assets | 344 | 66 | ||||||
| Total assets | $ | 25,240 | $ | 25,372 | ||||
| Liabilities and Stockholders’ Equity | ||||||||
| Net payable to affiliates | $ | 1,820 | $ | 1,757 | ||||
| Long-term debt | 4,944 | 4,352 | ||||||
| Other liabilities | 633 | 707 | ||||||
| Total liabilities | 7,397 | 6,816 | ||||||
| Total stockholders’ equity | 17,843 | 18,556 | ||||||
| Total liabilities and stockholders’ equity | $ | 25,240 | $ | 25,372 | ||||
The condensed financial statements should be read in conjunction with the consolidated financial statements and notes thereto.
226
Part IV - Schedule II. Condensed Financial Information of the Hartford Financial Services Group, Inc.
THE HARTFORD FINANCIAL SERVICES GROUP, INC.
SCHEDULE II
CONDENSED FINANCIAL INFORMATION OF THE HARTFORD FINANCIAL SERVICES GROUP, INC. (continued)
(Registrant)
(in millions)
| For the years ended December 31, | |||||||||||
| Condensed Statements of Operations and Comprehensive Income | 2021 | 2020 | 2019 | ||||||||
| Net investment income | $ | 2 | $ | 9 | $ | 50 | |||||
| Net realized gains (losses) | (1) | (2) | 3 | ||||||||
| Total revenues | 1 | 7 | 53 | ||||||||
| Interest expense | 234 | 236 | 255 | ||||||||
| Loss on extinguishment of debt | — | — | 68 | ||||||||
| Other expense (income) | (2) | (8) | 15 | ||||||||
| Total expenses | 232 | 228 | 338 | ||||||||
| Loss before income taxes and earnings of subsidiaries | (231) | (221) | (285) | ||||||||
| Income tax expense (benefit) | (51) | (39) | (60) | ||||||||
| Income (loss) before earnings of subsidiaries | (180) | (182) | (225) | ||||||||
| Earnings of subsidiaries | 2,545 | 1,919 | 2,310 | ||||||||
| Net income | 2,365 | 1,737 | 2,085 | ||||||||
| Other comprehensive income (loss) - parent company: | |||||||||||
| Change in net gain or loss on cash-flow hedging instruments | 24 | (28) | (24) | ||||||||
| Change in net unrealized gain or loss on fixed maturities | (1) | (1) | 5 | ||||||||
| Change in pension and other postretirement plan adjustments | 224 | (36) | (35) | ||||||||
| Other comprehensive income (loss), net of taxes before other comprehensive income of subsidiaries | 247 | (65) | (54) | ||||||||
| Other comprehensive income (loss) of subsidiaries | (1,245) | 1,183 | 1,685 | ||||||||
| Total other comprehensive income (loss) | (998) | 1,118 | 1,631 | ||||||||
| Total comprehensive income | $ | 1,367 | $ | 2,855 | $ | 3,716 | |||||
The condensed financial statements should be read in conjunction with the consolidated financial statements and notes thereto.
227
Part IV - Schedule II. Condensed Financial Information of the Hartford Financial Services Group, Inc.
THE HARTFORD FINANCIAL SERVICES GROUP, INC.
SCHEDULE II
CONDENSED FINANCIAL INFORMATION OF THE HARTFORD FINANCIAL SERVICES GROUP, INC. (continued)
(Registrant)
(in millions)
| For the years ended December 31, | |||||||||||
| Condensed Statements of Cash Flows | 2021 | 2020 | 2019 | ||||||||
| Operating Activities | |||||||||||
| Net income | $ | 2,365 | $ | 1,737 | $ | 2,085 | |||||
| Loss on extinguishment of debt | — | — | 68 | ||||||||
| Dividends received from subsidiaries | 1,277 | 995 | 18 | ||||||||
| Equity in net income of subsidiaries | (2,545) | (1,919) | (2,310) | ||||||||
| Net realized losses (gains) | 1 | 2 | 3 | ||||||||
| Change in operating assets and liabilities | 36 | 504 | 640 | ||||||||
| Cash provided by operating activities | 1,134 | 1,319 | 504 | ||||||||
| Investing Activities | |||||||||||
| Net proceeds from (payments for) short-term investments | (54) | (802) | 1,731 | ||||||||
| Proceeds from the sale/maturity/prepayment of: | |||||||||||
| Fixed maturities, available-for-sale | 25 | 311 | 478 | ||||||||
| Equity securities, at fair value | — | 124 | — | ||||||||
| Payments for the purchase of: | |||||||||||
| Fixed maturities, available-for-sale | (74) | (128) | — | ||||||||
| Net payments for derivatives | 38 | (57) | (33) | ||||||||
| Amount paid for business acquired | — | — | (2,098) | ||||||||
| Capital returned from (contributions to) subsidiaries | 530 | 386 | (20) | ||||||||
| Cash provided by (used for) investing activities | 465 | (166) | 58 | ||||||||
| Financing Activities | |||||||||||
| Proceeds from issuance of debt | 588 | — | 1,376 | ||||||||
| Repayments of debt | — | (500) | (1,278) | ||||||||
| Treasury stock acquired | (1,702) | (150) | (200) | ||||||||
| Net issuance (return of) shares under incentive and stock compensation plans | 25 | (21) | (6) | ||||||||
| Dividends paid on common shares | (489) | (461) | (436) | ||||||||
| Dividends paid on preferred shares | (21) | (21) | (21) | ||||||||
| Cash used for financing activities | (1,599) | (1,153) | (565) | ||||||||
| Net increase (decrease) in cash | — | — | (3) | ||||||||
| Cash — beginning of period | — | — | 3 | ||||||||
| Cash — end of period | $ | — | $ | — | $ | — | |||||
| Supplemental Disclosure of Cash Flow Information | |||||||||||
| Interest Paid | $ | 214 | $ | 232 | $ | 255 | |||||
The condensed financial statements should be read in conjunction with the consolidated financial statements and notes thereto.
228
Part IV - Schedule III. Supplementary Insurance Information
THE HARTFORD FINANCIAL SERVICES GROUP, INC.
SCHEDULE III
SUPPLEMENTARY INSURANCE INFORMATION
(in millions)
| Segment | Deferred Policy Acquisition Costs | Unpaid Losses and Loss Adjustment Expenses | Reserve for Future Policy Benefits | Unearned Premiums | Other Policyholder Funds and Benefits Payable | ||||||||||||
| As of December 31, 2021 | |||||||||||||||||
| Commercial Lines | $ | 742 | $ | 26,906 | $ | — | $ | 5,693 | $ | — | |||||||
| Personal Lines | 101 | 1,844 | — | 1,459 | — | ||||||||||||
| Property & Casualty Other Operations | — | 2,699 | — | 2 | — | ||||||||||||
| Group Benefits | 31 | 8,210 | 399 | 40 | 426 | ||||||||||||
| Hartford Funds | 7 | — | — | — | — | ||||||||||||
| Corporate | — | — | 197 | — | 261 | ||||||||||||
| Consolidated | $ | 881 | $ | 39,659 | $ | 596 | $ | 7,194 | $ | 687 | |||||||
| As of December 31, 2020 | |||||||||||||||||
| Commercial Lines | $ | 641 | $ | 25,058 | $ | — | $ | 5,081 | $ | — | |||||||
| Personal Lines | 103 | 1,836 | — | 1,506 | — | ||||||||||||
| Property & Casualty Other Operations | — | 2,728 | — | 2 | — | ||||||||||||
| Group Benefits | 38 | 8,233 | 420 | 40 | 415 | ||||||||||||
| Hartford Funds | 7 | — | — | — | — | ||||||||||||
| Corporate | — | — | 218 | — | 286 | ||||||||||||
| Consolidated | $ | 789 | $ | 37,855 | $ | 638 | $ | 6,629 | $ | 701 | |||||||
229
Part IV - Schedule III. Supplementary Insurance Information
THE HARTFORD FINANCIAL SERVICES GROUP, INC.
SCHEDULE III
SUPPLEMENTARY INSURANCE INFORMATION
(in millions)
| Segment | Earned Premiums, Fee Income and Other | Net Investment Income | Benefits, Losses and Loss Adjustment Expenses | Amortization of Deferred Policy Acquisition Costs | Insurance Operating Costs and Other Expenses [1] | Net Written Premiums [2] | ||||||||||||||
| For the year December 31, 2021 | ||||||||||||||||||||
| Commercial Lines | $ | 9,586 | $ | 1,502 | $ | 6,044 | $ | 1,398 | $ | 1,747 | $ | 10,041 | ||||||||
| Personal Lines | 3,066 | 157 | 1,864 | 230 | 678 | 2,908 | ||||||||||||||
| Property & Casualty Other Operations | — | 75 | 202 | — | 9 | — | ||||||||||||||
| Group Benefits | 5,687 | 550 | 4,612 | 40 | 1,413 | — | ||||||||||||||
| Hartford Funds | 1,189 | 5 | — | 12 | 913 | — | ||||||||||||||
| Corporate | 40 | 24 | 7 | — | 325 | — | ||||||||||||||
| Consolidated | $ | 19,568 | $ | 2,313 | $ | 12,729 | $ | 1,680 | $ | 5,085 | $ | 12,949 | ||||||||
| For the year December 31, 2020 | ||||||||||||||||||||
| Commercial Lines | $ | 8,941 | $ | 1,160 | $ | 5,929 | $ | 1,397 | $ | 1,683 | $ | 8,969 | ||||||||
| Personal Lines | 3,123 | 157 | 1,466 | 244 | 663 | 2,936 | ||||||||||||||
| Property & Casualty Other Operations | — | 55 | 258 | — | 10 | — | ||||||||||||||
| Group Benefits | 5,536 | 448 | 4,137 | 50 | 1,348 | — | ||||||||||||||
| Hartford Funds | 989 | 4 | — | 14 | 773 | — | ||||||||||||||
| Corporate | 102 | 22 | 15 | 1 | 415 | 9 | ||||||||||||||
| Consolidated | $ | 18,691 | $ | 1,846 | $ | 11,805 | $ | 1,706 | $ | 4,892 | $ | 11,914 | ||||||||
| For the year December 31, 2019 | ||||||||||||||||||||
| Commercial Lines | $ | 8,326 | $ | 1,129 | $ | 5,192 | $ | 1,296 | $ | 1,776 | $ | 8,452 | ||||||||
| Personal Lines | 3,318 | 179 | 2,185 | 259 | 702 | 3,131 | ||||||||||||||
| Property & Casualty Other Operations | 2 | 84 | 21 | — | 12 | — | ||||||||||||||
| Group Benefits | 5,603 | 486 | 4,055 | 54 | 1,352 | — | ||||||||||||||
| Hartford Funds | 999 | 7 | — | 12 | 813 | — | ||||||||||||||
| Corporate | 146 | 66 | 19 | 1 | 431 | 12 | ||||||||||||||
| Consolidated | $ | 18,394 | $ | 1,951 | $ | 11,472 | $ | 1,622 | $ | 5,086 | $ | 11,595 | ||||||||
[1]Includes interest expense, loss on extinguishment of debt, restructuring and other costs, loss on reinsurance transaction and amortization of intangible assets.
[2]Excludes life insurance pursuant to Regulation S-X.
230
Part IV - Schedule IV. Reinsurance
THE HARTFORD FINANCIAL SERVICES GROUP, INC.
SCHEDULE IV
REINSURANCE
(in millions)
Gross Amount | Ceded Amount | Assumed From Other Companies | Net Amount | Percentage of Amount Assumed to Net | |||||||||||||
| For the year ended December 31, 2021 | |||||||||||||||||
| Life insurance in-force | $ | 1,112,333 | $ | 22,814 | $ | 21,230 | $ | 1,110,749 | 2 | % | |||||||
| Insurance revenues | |||||||||||||||||
| Property and casualty insurance | $ | 13,204 | $ | 1,277 | $ | 568 | $ | 12,495 | 5 | % | |||||||
| Life insurance and annuities | 2,367 | 25 | 46 | 2,388 | 2 | % | |||||||||||
| Accident and health insurance | 3,296 | 79 | 82 | 3,299 | 2 | % | |||||||||||
| Total insurance revenues | $ | 18,867 | $ | 1,381 | $ | 696 | $ | 18,182 | 4 | % | |||||||
| For the year ended December 31, 2020 | |||||||||||||||||
| Life insurance in-force | $ | 1,134,390 | $ | 19,055 | $ | 20,373 | $ | 1,135,708 | 2 | % | |||||||
| Insurance revenues | |||||||||||||||||
| Property and casualty insurance | $ | 12,551 | $ | 1,173 | $ | 540 | $ | 11,918 | 5 | % | |||||||
| Life insurance and annuities | 2,251 | 24 | 207 | 2,434 | 9 | % | |||||||||||
| Accident and health insurance | 2,994 | 72 | 180 | 3,102 | 6 | % | |||||||||||
| Total insurance revenues | $ | 17,796 | $ | 1,269 | $ | 927 | $ | 17,454 | 5 | % | |||||||
| For the year ended December 31, 2019 | |||||||||||||||||
| Life insurance in-force | $ | 879,496 | $ | 18,483 | $ | 254,739 | $ | 1,115,752 | 23 | % | |||||||
| Insurance revenues | |||||||||||||||||
| Property and casualty insurance | $ | 12,010 | $ | 936 | $ | 416 | $ | 11,490 | 4 | % | |||||||
| Life insurance and annuities | 1,739 | 25 | 807 | 2,521 | 32 | % | |||||||||||
| Accident and health insurance | 2,383 | 66 | 765 | 3,082 | 25 | % | |||||||||||
| Total insurance revenues | $ | 16,132 | $ | 1,027 | $ | 1,988 | $ | 17,093 | 12 | % | |||||||
231
Part IV - Schedule V. Valuation and Qualifying Accounts
THE HARTFORD FINANCIAL SERVICES GROUP, INC.
SCHEDULE V
VALUATION AND QUALIFYING ACCOUNTS
(in millions)
| Balance January 1, [1] | Increase (decrease) in Costs and Expenses | Write-offs/ Payments/ Other | Balance December 31, | ||||||||||||||
| 2021 | |||||||||||||||||
| Allowance for credit losses ("ACL") on fixed maturities, available-for-sale | $ | 23 | $ | (4) | $ | (18) | $ | 1 | |||||||||
| ACL on mortgage loans | $ | 38 | $ | (9) | $ | — | $ | 29 | |||||||||
| ACL on premiums receivable and agents' balances | $ | 152 | $ | 4 | $ | (51) | $ | 105 | |||||||||
| Allowance for uncollectible reinsurance | $ | 108 | $ | 3 | $ | (12) | $ | 99 | |||||||||
| Valuation allowance for deferred taxes | $ | 4 | $ | 9 | $ | (6) | $ | 7 | |||||||||
| 2020 | |||||||||||||||||
| ACL on fixed maturities, available-for-sale | $ | 30 | $ | (7) | $ | 23 | |||||||||||
| ACL on mortgage loans | $ | 19 | $ | 19 | $ | — | $ | 38 | |||||||||
| ACL on premiums receivable and agents' balances | $ | 122 | $ | 74 | $ | (44) | $ | 152 | |||||||||
| Allowance for uncollectible reinsurance | $ | 116 | $ | 4 | $ | (12) | $ | 108 | |||||||||
| Valuation allowance for deferred taxes | $ | 4 | $ | 9 | $ | (9) | $ | 4 | |||||||||
| 2019 | |||||||||||||||||
| ACL on mortgage loans | $ | 1 | $ | (1) | $ | — | $ | — | |||||||||
| ACL on premiums receivable and agents' balances | $ | 135 | $ | 42 | $ | (32) | $ | 145 | |||||||||
| Allowance for uncollectible reinsurance | $ | 126 | $ | 2 | $ | (14) | $ | 114 | |||||||||
| Valuation allowance for deferred taxes | $ | — | $ | — | $ | 4 | $ | 4 | |||||||||
[1]The balance as of January 1, 2020 reflects a cumulative effect adjustments recorded to retained earnings of $19, $(23), and $2, for the ACL on mortgage loans, ACL on premiums receivable and agents' balances, and the allowance for uncollectible reinsurance, respectively. For more information see Note 1 - Basis of Presentation and Significant Accounting Policies.
232
THE HARTFORD FINANCIAL SERVICES GROUP, INC.
FOR THE FISCAL YEAR ENDED DECEMBER 31, 2021
FORM 10-K
EXHIBITS INDEX
The exhibits attached to this Form 10-K are those that are required by Item 601 of Regulation S-K.
| Incorporated by Reference | ||||||||||||||||||||
| Exhibit No. | Description | Form | File No. | Exhibit No. | Filing Date | |||||||||||||||
| 2.01 | 10-Q | 001-13958 | 2.01 | 11/01/2012 | ||||||||||||||||
| 2.02 | 10-Q | 001-13958 | 2.02 | 11/01/2012 | ||||||||||||||||
| 2.03 | 8-K | 001-13958 | 2.01 | 12/04/2017 | ||||||||||||||||
| 2.04 | 8-K | 001-13958 | 2.01 | 10/23/2017 | ||||||||||||||||
| 2.05 | 10-Q | 001-13958 | 2.01 | 07/27/2017 | ||||||||||||||||
| 2.06 | 8-K/A | 001-13958 | 2.1 | 08/22/2018 | ||||||||||||||||
| 3.01 | 8-K | 001-13958 | 3.01 | 10/20/2014 | ||||||||||||||||
| 3.02 | 8-K | 001-13958 | 3.1 | 11/05/2018 | ||||||||||||||||
| 3.03 | 8-K | 001-13958 | 3.1 | 12/17/2020 | ||||||||||||||||
| 4.01 | 8-K | 001-13958 | 4.1 | 03/12/2004 | ||||||||||||||||
| 4.02 | 8-K | 001-13958 | 4.01 | 02/16/2007 | ||||||||||||||||
| 4.03 | S-3ASR | 333-142044 | 4.03 | 04/11/2007 | ||||||||||||||||
| 4.04 | 8-K | 001-13958 | 4.1 | 06/06/2008 | ||||||||||||||||
| 4.05 | 8-K | 001-13958 | 4.2 | 06/06/2008 | ||||||||||||||||
| 4.06 | 8-K/A | 001-13958 | 4.3 | 04/06/2012 | ||||||||||||||||
| 4.07 | S-3ASR | 333-190506 | 4.07 | 08/09/2013 | ||||||||||||||||
| 4.08 | 8-K | 001-13958 | 4.01 | 02/15/2017 | ||||||||||||||||
| 4.09 | 8-K | 001-13958 | 3.1 | 11/05/2018 | ||||||||||||||||
233
| Incorporated by Reference | ||||||||||||||||||||
| Exhibit No. | Description | Form | File No. | Exhibit No. | Filing Date | |||||||||||||||
| 4.10 | 8-K | 001-13958 | 4.2 | 11/06/2018 | ||||||||||||||||
| 4.11 | 8-K | 001-13958 | 4.3 | 11/06/2018 | ||||||||||||||||
| 4.12 | 8-K | 001-13958 | 4.3 | 08/19/2019 | ||||||||||||||||
| 4.13 | 8-K | 001-13958 | 4.4 | 09/21/2021 | ||||||||||||||||
| 4.14 | ||||||||||||||||||||
| 10.01 | Aggregate Excess of Loss Reinsurance Agreement by and between Hartford Fire Insurance Company, First State Insurance Company, New England Insurance Company, New England Reinsurance Corporation, Hartford Accident and Indemnity Company, Hartford Casualty Insurance Company, Hartford Fire Insurance Company, Hartford Insurance Company of Illinois, Hartford Insurance Company of the Midwest, Hartford Insurance Company of the Southeast, Hartford Lloyd’s Insurance Company, Hartford Underwriters Insurance Company, Nutmeg Insurance Company, Pacific Insurance Company, Limited, Property and Casualty Insurance Company of Hartford, Sentinel Insurance Company, Ltd., Trumbull Insurance Company, Twin City Fire Insurance Company (collectively, the "Reinsured") and National Indemnity Company (the "Reinsurer") dated as of December 30, 2016.** †† | |||||||||||||||||||
| 10.02 | 8-K | 001-13958 | 10.1 | 10/28/2021 | ||||||||||||||||
| *10.03 | 10-K | 001-13958 | 10.12 | 02/24/2006 | ||||||||||||||||
| *10.04 | 10-K | 001-13958 | 10.06 | 02/12/2009 | ||||||||||||||||
| *10.05 | 10-Q | 001-13958 | 10.04 | 08/04/2010 | ||||||||||||||||
| *10.06 | 10-K | 001-13958 | 10.10 | 02/25/2011 | ||||||||||||||||
| *10.07 | 10-K | 001-13958 | 10.18 | 03/01/2013 | ||||||||||||||||
| *10.08 | 10-K | 001-13958 | 10.19 | 03/01/2013 | ||||||||||||||||
| *10.09 | 8-K | 001-13958 | 10.01 | 07/29/2013 | ||||||||||||||||
| *10.10 | 10-K | 001-13958 | 10.05 | 02/28/2014 | ||||||||||||||||
| *10.11 | S-8 | 333-197671 | 4.03 | 07/28/2014 | ||||||||||||||||
| *10.12 | 10-Q | 001-13958 | 10.03 | 07/30/2014 | ||||||||||||||||
| *10.13 | 10-K | 001-13958 | 10.06 | 02/27/2015 | ||||||||||||||||
| *10.14 | 10-Q | 001-13958 | 10.01 | 07/27/2015 | ||||||||||||||||
| *10.15 | 10-Q | 001-13958 | 10.02 | 04/26/2018 | ||||||||||||||||
| *10.16 | 8-K | 001-13958 | 10.01 | 02/21/2019 | ||||||||||||||||
| *10.17 | 10-Q | 001-13958 | 10.01 | 11/04/2019 | ||||||||||||||||
| *10.18 | S-8 | 001-13958 | 4.03 | 07/31/2020 | ||||||||||||||||
| *10.19 | 10-K | 001-13958 | 10.24 | 02/19/2021 | ||||||||||||||||
| *10.20 | 10-K | 001-13958 | 10.25 | 02/19/2021 | ||||||||||||||||
234
| Incorporated by Reference | ||||||||||||||||||||
| Exhibit No. | Description | Form | File No. | Exhibit No. | Filing Date | |||||||||||||||
| *10.21 | 10-K | 001-13958 | 10.26 | 02/19/2021 | ||||||||||||||||
| *10.22 | ||||||||||||||||||||
| *10.23 | ||||||||||||||||||||
| *10.24 | ||||||||||||||||||||
| 21.01 | ||||||||||||||||||||
| 23.01 | ||||||||||||||||||||
| 24.01 | ||||||||||||||||||||
| 31.01 | ||||||||||||||||||||
| 31.02 | ||||||||||||||||||||
| 32.01 | ||||||||||||||||||||
| 32.02 | ||||||||||||||||||||
| 101.INS | Inline XBRL Instance Document - the instance document does not appear in the Interactive Data File because its XBRL tags are embedded within the Inline XBRL document. | |||||||||||||||||||
| 101.SCH | Inline XBRL Taxonomy Extension Schema. | |||||||||||||||||||
| 101.CAL | Inline XBRL Taxonomy Extension Calculation Linkbase. | |||||||||||||||||||
| 101.DEF | Inline XBRL Taxonomy Extension Definition Linkbase.** | |||||||||||||||||||
| 101.LAB | Inline XBRL Taxonomy Extension Label Linkbase.** | |||||||||||||||||||
| 101.PRE | Inline XBRL Taxonomy Extension Presentation Linkbase.** | |||||||||||||||||||
| 104.01 | Cover Page Interactive Data File - formatted in Inline XBRL and included as Exhibit 101 | |||||||||||||||||||
| * | Management contract, compensatory plan or arrangement. | |||||||
| ** | Filed with the Securities and Exchange Commission as an exhibit to this report. | |||||||
† | Certain portions of this exhibit have been omitted pursuant to the Securities and Exchange Commission Order Granting Confidential Treatment Under the Securities Exchange Act of 1934, dated August 7, 2017 | |||||||
| †† | Certain portions of this exhibit have been omitted pursuant to Section (b)(10)(iv) of Item 601 of Regulation S-K. The registrant agrees to furnish a copy of this exhibit to the Securities and Exchange Commission upon request. | |||||||
235
SIGNATURES
Pursuant to the requirements of Section 13 or 15(d) of the Securities Exchange Act of 1934, the registrant has duly caused this report to be signed on its behalf by the undersigned, thereunto duly authorized.
| THE HARTFORD FINANCIAL SERVICES GROUP, INC. | ||||||||||||||
| By: | /s/ Scott R. Lewis | |||||||||||||
| Scott R. Lewis | ||||||||||||||
| Senior Vice President and Controller | ||||||||||||||
| (Chief accounting officer and duly authorized signatory) | ||||||||||||||
Date: February 18, 2022
236
Pursuant to the requirements of the Securities Exchange Act of 1934, this report has been signed below by the following persons on behalf of the registrant and in the capacities and on the dates indicated.
| Signature | Title | Date | ||||||||||||||||||
/s/ Christopher J. Swift | Chairman, Chief Executive Officer and Director | February 18, 2022 | ||||||||||||||||||
| Christopher J. Swift | (Principal Executive Officer) | |||||||||||||||||||
| /s/ Beth A. Costello | Executive Vice President and Chief Financial Officer | February 18, 2022 | ||||||||||||||||||
| Beth A. Costello | (Principal Financial Officer) | |||||||||||||||||||
| /s/ Scott R. Lewis | Senior Vice President and Controller | February 18, 2022 | ||||||||||||||||||
| Scott R. Lewis | (Principal Accounting Officer) | |||||||||||||||||||
| * | Director | February 18, 2022 | ||||||||||||||||||
| Robert B. Allardice III | ||||||||||||||||||||
| * | Director | February 18, 2022 | ||||||||||||||||||
| Larry D. De Shon | ||||||||||||||||||||
| * | Director | February 18, 2022 | ||||||||||||||||||
| Carlos Dominguez | ||||||||||||||||||||
| * | Director | February 18, 2022 | ||||||||||||||||||
| Trevor Fetter | ||||||||||||||||||||
| * | Director | February 18, 2022 | ||||||||||||||||||
| Kathryn A. Mikells | ||||||||||||||||||||
| * | Director | February 18, 2022 | ||||||||||||||||||
| Michael G. Morris | ||||||||||||||||||||
| * | Director | February 18, 2022 | ||||||||||||||||||
| Teresa W. Roseborough | ||||||||||||||||||||
| * | Director | February 18, 2022 | ||||||||||||||||||
| Virginia P. Ruesterholz | ||||||||||||||||||||
| * | Director | February 18, 2022 | ||||||||||||||||||
| Matthew E. Winter | ||||||||||||||||||||
| * | Director | February 18, 2022 | ||||||||||||||||||
| Greig Woodring | ||||||||||||||||||||
| *By: | /s/ David C. Robinson | |||||||||||||||||||
| David C. Robinson | ||||||||||||||||||||
| As Attorney-in-Fact | ||||||||||||||||||||
237