UNITED STATES SECURITIES AND EXCHANGE COMMISSION
Washington, D.C. 20549
FORM N-CSR
CERTIFIED SHAREHOLDER REPORT OF REGISTERED MANAGEMENT INVESTMENT COMPANIES
Investment Company Act file number 811-06312
The Lazard Funds, Inc.
(Exact name of registrant as specified in charter)
30 Rockefeller Plaza
New York, New York 10112
(Address of principal executive offices) (Zip code)
Mark R. Anderson, Esq.
Lazard Asset Management LLC
30 Rockefeller Plaza
New York, New York 10112
(Name and address of agent for service)
Registrant’s telephone number, including area code: (212) 632-6000
Date of fiscal year end: 12/31
Date of reporting period: 6/30/22
ITEM 1. REPORTS TO STOCKHOLDERS.
![]()
Lazard Funds
Semi-Annual Report
June 30, 2022
Equity Funds
Lazard Developing Markets Equity Portfolio Lazard Emerging Markets Core Equity Portfolio Lazard Emerging Markets Equity Advantage Portfolio Lazard Emerging Markets Equity Portfolio Lazard Emerging Markets Strategic Equity Portfolio Lazard Equity Franchise Portfolio Lazard Global Equity Select Portfolio Lazard Global Listed Infrastructure Portfolio Lazard Global Strategic Equity Portfolio Lazard International Equity Advantage Portfolio | Lazard International Equity Portfolio Lazard International Equity Select Portfolio Lazard International Quality Growth Portfolio Lazard International Small Cap Equity Portfolio Lazard International Strategic Equity Portfolio Lazard Managed Equity Volatility Portfolio Lazard US Equity Concentrated Portfolio Lazard US Equity Focus Portfolio Lazard US Small-Mid Cap Equity Portfolio Lazard US Sustainable Equity Portfolio Lazard US Systematic Small Cap Equity Portfolio |
The Lazard Funds, Inc. Table of Contents
Please consider a Portfolio’s investment objective, risks, charges and expenses carefully before investing. For more complete information about The Lazard Funds, Inc. (the “Fund”), you may obtain a prospectus or a Portfolio’s summary prospectus by calling 800-823-6300, or online, at www.lazardassetmanagement.com. Read the prospectus or the Portfolio’s summary prospectus carefully before you invest. The prospectus and a Portfolio’s summary prospectus contain the investment objective, risks, charges, expenses and other information about the Portfolio, which are not detailed in this report.
Distributed by Lazard Asset Management Securities LLC.
Semi-Annual Report 1
The Lazard Funds, Inc. A Message from Lazard (unaudited)
Dear Shareholder:
The first six months of 2022 were a turbulent period for financial markets, as optimism about the global economic outlook, which remained resilient throughout 2021, gave way to growing anxiety about worsening inflationary pressure.
Events during the period conspired to create stiff macro headwinds for markets. The economic fallout from Russia’s invasion of Ukraine and the harsh retaliatory sanctions imposed by Western countries rippled across financial markets and the wider global economy because of Russia’s stature as one of the world’s largest producers of oil, natural gas, and other commodities. Energy prices rose sharply, and supply chains bottlenecks worsened due to shortages of Russian industrial metals. Supply chains were further snarled when the Chinese government imposed harsh lockdowns on some of China’s most important cities, including those that serve as global manufacturing hubs, in an attempt to stamp out a rapidly spreading coronavirus outbreak.
With inflation reaching levels not seen in decades, the global monetary landscape shifted dramatically in the period, as policymakers sought to rein in soaring prices by pulling back from the ultra-low interest-rate-policies they implemented to contain the economic fallout from the coronavirus pandemic. In all, central banks from at least 45 countries raised interest rates in the first six months of 2022. At the same time, investors grew nervous that interest rates hikes, especially from major central banks, would tip the fragile global economy into a recession. In the US, the Federal Reserve (the “Fed”) adopted an increasingly aggressive posture during the period, raising its benchmark short-term interest rate by 25 basis points (bps), 50 bps, and 75 bps in March, May, and June, respectively, with more hikes likely, as domestic inflation reached a 40-year high. The Fed also began reducing its $9 trillion balance sheet of Treasury and mortgage bonds in June, which further tightened financial conditions. Across the Atlantic, the European Central Bank stated that it was prepared to raise interest rates in July for the first time in over a decade amid soaring inflation in the euro zone. Elsewhere in Europe, the Bank of England increased its benchmark interest rate four times in the six-month period, as inflation in the UK reached a level not seen since 1982.
2 Semi-Annual Report
Against this backdrop, global equity markets, as measured by the MSCI All Country World Index, fell 20.2% in the period, as stock investors fretted about the impact soaring inflation would have on corporate earnings. Notably, the S&P 500 Index recorded its worst first-half performance since 1970. The Fed’s aggressive rate-hike campaign also drove up the yields of risk-free US Treasury bonds, which undercut the appeal of stocks.
Meanwhile, global bond markets also came under pressure as many central banks transitioned from ultra-accommodative monetary policies to tighter regimes to tame increasing inflationary pressures. Sovereign rates rose amid the faster-than-expected acceleration of central bank interest rate hikes and, in the case of the Fed, balance sheet shrinking. Although credit spreads initially did well in the first quarter of the year, the second quarter saw both investment grade and high yield spreads generally widen compared to historical levels. Consequently, many bond markets around the world suffered losses, with many indices posting outsized year-to-date negative returns through mid-year. Notable among this group of indices was the Bloomberg Global Aggregate Bond Index, which fell 13.9% in the period. Underscoring the high level of risk aversion in the markets, the US dollar continued to strengthen, asserting itself as the safe-haven global currency and further supported by a hawkish central bank determined to regain its inflation fighting credibility.
The challenging market conditions in 2022 are a reminder of the importance of active portfolio management. Turbulent markets are likely to differentiate winners from losers. We remain confident that fundamental analysis and security selection will be crucial drivers of performance going forward. We are privileged that you have turned to Lazard for your investment needs and value your continued confidence in our investment management capabilities.
Sincerely,
Lazard Asset Management LLC
Semi-Annual Report 3
The Lazard Funds, Inc. Performance Overviews (unaudited)
Please see the “Notes to the Performance Overviews” for important information about the calculation of total returns, performance information generally, performance differences between Institutional Shares, Open Shares and R6 Shares, and the indexes shown below.
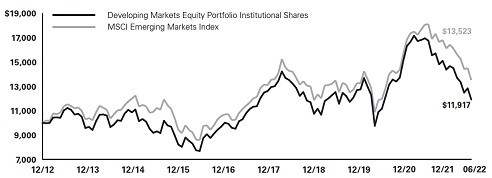
Lazard Developing Markets Equity Portfolio
Comparison of Changes in Value of $10,000 Investment in the Institutional Shares of Lazard Developing Markets Equity Portfolio and the MSCI Emerging Markets® Index
Average Annual Total Returns
Periods Ended June 30, 2022
| One | Five | Ten | |||||
| year | year | year | |||||
| Institutional | -28.90% | 0.95% | 1.77% | ||||
| Open | -29.10% | 0.66% | 1.44% | ||||
| MSCI Emerging Markets Index | -25.28% | 2.18% | 3.06% |
4 Semi-Annual Report
Lazard Emerging Markets Core Equity Portfolio
Comparison of Changes in Value of $10,000 Investment in the Institutional Shares of Lazard Emerging Markets Core Equity Portfolio and the MSCI Emerging Markets Index

Average Annual Total Returns
Periods Ended June 30, 2022
| One year | Five year | Since Inception | † | ||||
| Institutional | -32.77% | -1.93% | -0.23% | ||||
| Open | -32.96% | -2.28% | -0.58% | ||||
| R6 | -32.79% | N/A | -5.63% | ||||
| MSCI Emerging Markets Index | -25.28% | 2.18% | 1.98% (Institutional and Open Shares) 1.10 (R6 Shares) |
| † | The inception date for the Institutional and Open Shares was October 31, 2013 and for the R6 Shares was April 6, 2018. |
Semi-Annual Report 5
Lazard Emerging Markets Equity Advantage Portfolio
Comparison of Changes in Value of $10,000 Investment in the Institutional Shares of Lazard Emerging Markets Equity Advantage Portfolio and the MSCI Emerging Markets Index

Average Annual Total Returns
Periods Ended June 30, 2022
| One year | Five year | Since Inception | † | ||||
| Institutional | -24.97% | 2.82% | 3.38% | ||||
| Open | -25.26% | 2.52% | 3.07% | ||||
| MSCI Emerging Markets Index | -25.28% | 2.18% | 2.37% |
| † | The inception date for the Portfolio was May 29, 2015. |
6 Semi-Annual Report
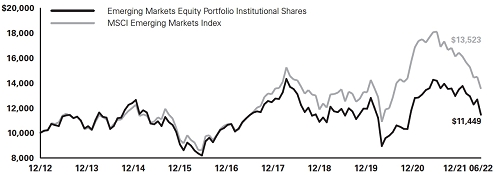
Lazard Emerging Markets Equity Portfolio
Comparison of Changes in Value of $10,000 Investment in the Institutional Shares of Lazard Emerging Markets Equity Portfolio and the MSCI Emerging Markets Index
Average Annual Total Returns
Periods Ended June 30, 2022
| One year | Five year | Ten year | Since Inception | † | |||||
| Institutional | -19.23% | -0.36% | 1.36% | 5.61% | |||||
| Open | -19.42% | -0.61% | 1.10% | 5.24% | |||||
| R6 | -19.18% | -0.35% | N/A | 0.81% | |||||
| MSCI Emerging Markets Index | -25.28% | 2.18% | 3.06% | 4.92% (Institutional Shares) 5.34% (Open Shares) 3.00% (R6 Shares) |
| † | The inception date for the Institutional Shares was July 15, 1994, for the Open Shares was January 8, 1997 and for the R6 Shares was January 19, 2015. |
Semi-Annual Report 7
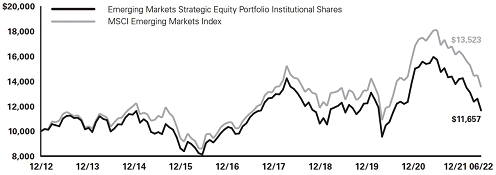
Lazard Emerging Markets Strategic Equity Portfolio
Comparison of Changes in Value of $10,000 Investment in the Institutional Shares of Lazard Emerging Markets Strategic Equity Portfolio and the MSCI Emerging Markets Index
Average Annual Total Returns
Periods Ended June 30, 2022
| One | Five | Ten | |||||
| year | year | year | |||||
| Institutional | -25.84% | -0.01% | 1.55% | ||||
| Open | -25.97% | -0.27% | 1.28% | ||||
| MSCI Emerging Markets Index | -25.28% | 2.18% | 3.06% |
Lazard Equity Franchise Portfolio
Comparison of Changes in Value of $10,000 Investment in the Institutional Shares of Lazard Equity Franchise Portfolio and the MSCI World® Index

Average Annual Total Returns
Periods Ended June 30, 2022
| One year | Since Inception | † | |||
| Institutional | -2.60% | 7.12% | |||
| Open | -2.84% | 6.86% | |||
| MSCI World Index | -14.34% | 7.02% |
| † | The inception date for the Portfolio was September 29, 2017. |
8 Semi-Annual Report
Lazard Global Equity Select Portfolio
Comparison of Changes in Value of $10,000 Investment in the Institutional Shares of Lazard Global Equity Select Portfolio and the MSCI ACWI®
![]()
Average Annual Total Returns
Periods Ended June 30, 2022
| One year | Five year | Since Inception | † | ||||
| Institutional | -15.09% | 7.62% | 6.94% | ||||
| Open | -15.37% | 7.30% | 6.63% | ||||
| MSCI ACWI | -15.75% | 7.00% | 6.55% |
| † | The inception date for the Portfolio was December 31, 2013. |
Lazard Global Listed Infrastructure Portfolio
Comparison of Changes in Value of $10,000 Investment in the Institutional Shares of Lazard Global Listed Infrastructure Portfolio, the MSCI World Core Infrastructure (Hedged) Index and the MSCI World Index

Average Annual Total Returns
Periods Ended June 30, 2022
| One | Five | Ten | |||||
| year | year | year | |||||
| Institutional | 9.96% | 6.92% | 12.43% | ||||
| Open | 9.67% | 6.65% | 12.13% | ||||
| MSCI World Index | -14.34% | 7.67% | 9.51% | ||||
| MSCI World Core Infrastructure (USD Hedged) Index | 6.30% | 8.64% | 10.53% |
Semi-Annual Report 9
Lazard Global Strategic Equity Portfolio
Comparison of Changes in Value of $10,000 Investment in the Institutional Shares of Lazard Global Strategic Equity Portfolio and the MSCI ACWI

Average Annual Total Returns
Periods Ended June 30, 2022
| One year | Five year | Since Inception | † | ||||
| Institutional | -18.51% | 7.32% | 5.80% | ||||
| Open | -18.99% | 7.01% | 5.48% | ||||
| MSCI ACWI | -15.75% | 7.00% | 6.18% |
| † | The inception date for the Portfolio was August 29, 2014. |
10 Semi-Annual Report
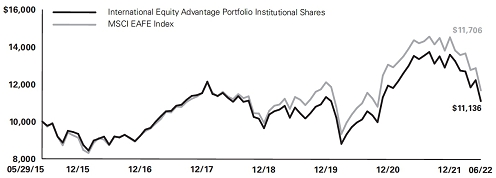
Lazard International Equity Advantage Portfolio
Comparison of Changes in Value of $10,000 Investment in the Institutional Shares of Lazard International Equity Advantage Portfolio and the MSCI EAFE® Index
Average Annual Total Returns
Periods Ended June 30, 2022
| One year | Five year | Since Inception | † | ||||
| Institutional | -16.75% | 1.03% | 1.53% | ||||
| Open | -16.98% | 0.75% | 1.24% | ||||
| MSCI EAFE Index | -17.77% | 2.20% | 2.25% |
| † | The inception date for the Portfolio was May 29, 2015. |
Semi-Annual Report 11
Lazard International Equity Portfolio
Comparison of Changes in Value of $10,000 Investment in the Institutional Shares of Lazard International Equity Portfolio and the MSCI EAFE Index
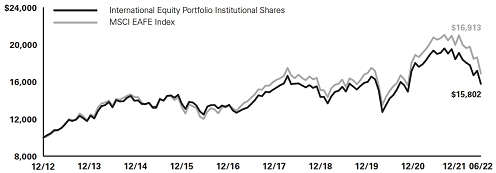
Average Annual Total Returns
Periods Ended June 30, 2022
| One year | Five year | Ten year | Since Inception | † | |||||
| Institutional | -16.92% | 1.78% | 4.68% | 5.28% | |||||
| Open | -17.10% | 1.52% | 4.40% | 4.11% | |||||
| R6 | -16.88% | 1.80% | N/A | 1.66% | |||||
| MSCI EAFE Index | -17.77% | 2.20% | 5.40% | 4.84% (Institutional Shares) 4.37% (Open Shares) 2.67% (R6 Shares) |
| † | The inception date for the Institutional Shares was October 29, 1991, for the Open Shares was January 23, 1997 and for the R6 Shares was April 1, 2015. |
12 Semi-Annual Report
Lazard International Equity Select Portfolio
Comparison of Changes in Value of $10,000 Investment in the Institutional Shares of Lazard International Equity Select Portfolio, the MSCI ACWI ex-US and the MSCI EAFE/ACWI ex-US Linked Index
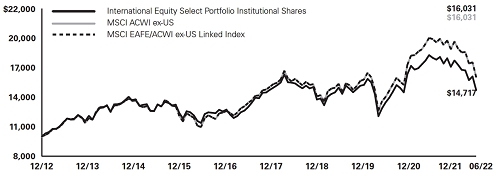
Average Annual Total Returns
Periods Ended June 30, 2022
| One | Five | Ten | |||||
| year | year | year | |||||
| Institutional | -18.24% | 1.17% | 3.94% | ||||
| Open | -18.41% | 0.91% | 3.62% | ||||
| MSCI ACWI ex-US | -19.42% | 2.50% | 4.83% | ||||
| MSCI EAFE/ACWI ex-US Linked Index | -19.42% | 2.50% | 4.83% |
Semi-Annual Report 13
Lazard International Quality Growth Portfolio
Comparison of Changes in Value of $10,000 Investment in the Institutional Shares of Lazard International Quality Growth Portfolio and the MSCI ACWI ex-US

Average Annual Total Returns
Periods Ended June 30, 2022
| One year | Since Inception | † | |||
| Institutional | -23.37% | 9.28% | |||
| Open | -23.56% | 8.99% | |||
| MSCI ACWI ex-US | -19.42% | 4.91% |
| † | The inception date for the Portfolio was December 31, 2018. |
Lazard International Small Cap Equity Portfolio
Comparison of Changes in Value of $10,000 Investment in the Institutional Shares of Lazard International Small Cap Equity Portfolio and the MSCI EAFE Small Cap® Index

Average Annual Total Returns
Periods Ended June 30, 2022
| One | Five | Ten | |||||
| year | year | year | |||||
| Institutional | -28.18% | 0.19% | 5.83% | ||||
| Open | -28.31% | -0.06% | 5.56% | ||||
| MSCI EAFE Small Cap Index | -23.98% | 1.72% | 7.18% |
14 Semi-Annual Report
Lazard International Strategic Equity Portfolio
Comparison of Changes in Value of $10,000 Investment in the Institutional Shares of Lazard International Strategic Equity Portfolio and the MSCI EAFE Index

Average Annual Total Returns
Periods Ended June 30, 2022
| One year | Five year | Ten year | Since Inception | † | |||||
| Institutional | -20.24% | 2.99% | 5.78% | 5.15% | |||||
| Open | -20.40% | 2.73% | 5.52% | 4.04% | |||||
| R6 | -20.28% | 2.99% | N/A | 2.83% | |||||
| MSCI EAFE Index | -17.77% | 2.20% | 5.40% | 3.77% (Institutional Shares) 3.01% (Open Shares) 3.53% (R6 Shares) |
| † | The inception date for the Institutional Shares was October 31, 2005, for the Open Shares was February 3, 2006 and for the R6 Shares was January 19, 2015. |
Semi-Annual Report 15
Lazard Managed Equity Volatility Portfolio
Comparison of Changes in Value of $10,000 Investment in the Institutional Shares of Lazard Managed Equity Volatility Portfolio and the MSCI World Index
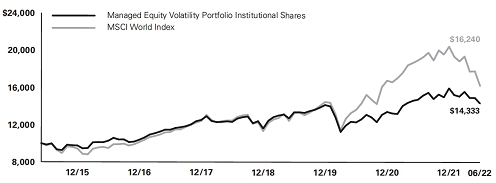
Average Annual Total Returns
Periods Ended June 30, 2022
| One year | Five year | Since Inception | † | ||||
| Institutional | -2.77% | 4.56% | 5.21% | ||||
| Open | -2.94% | 4.28% | 4.91% | ||||
| MSCI World Index | -14.34% | 7.67% | 7.09% |
| † | The inception date for the Portfolio was May 29, 2015. |
16 Semi-Annual Report
Lazard US Equity Concentrated Portfolio
Comparison of Changes in Value of $10,000 Investment in the Institutional Shares of Lazard US Equity Concentrated Portfolio, the S&P 500 Index and the Russell 1000 Value/S&P 500 Linked Index

Average Annual Total Returns
Periods Ended June 30, 2022
| One year | Five year | Ten year | Since Inception | † | |||||
| Institutional | -11.92% | 8.09% | 11.90% | 8.11% | |||||
| Open | -12.14% | 7.79% | 11.55% | 7.80% | |||||
| R6 | -11.90% | 8.08% | N/A | 8.62% | |||||
| S&P 500 Index | -10.62% | 11.31% | 12.96% | 9.13% (Institutional and Open Shares) 12.33% (R6 Shares) | |||||
| Russell 1000 Value/S&P 500 Linked Index | -10.62% | 11.31% | 12.96% | 8.53% (Institutional and Open Shares) N/A (R6 Shares) |
| † | The inception date for the Institutional and Open Shares was September 30, 2005 and for the R6 Shares was November 15, 2016. |
Semi-Annual Report 17
Lazard US Equity Focus Portfolio
Comparison of Changes in Value of $10,000 Investment in the Institutional Shares of Lazard US Equity Select Portfolio and the S&P 500 Index

Average Annual Total Returns
Periods Ended June 30, 2022
| One year | Five year | Ten year | Since Inception | † | |||||
| Institutional | -10.67% | 11.31% | 11.93% | 7.99% | |||||
| Open | -10.98% | 10.99% | 11.60% | 7.67% | |||||
| R6 | -10.73% | 11.30% | N/A | 9.90% | |||||
| S&P 500 Index | -10.62% | 11.31% | 12.96% | 8.88% (Institutional and Open Shares) 11.07% (R6 Shares) |
| † | The inception date for the Institutional and Open Shares was December 30, 2004 and for the R6 Shares was May 19, 2014. |
18 Semi-Annual Report
Lazard US Small-Mid Cap Equity Portfolio
Comparison of Changes in Value of $10,000 Investment in the Institutional Shares of Lazard US Small-Mid Cap Equity Portfolio and the Russell 2500 Index
![]()
Average Annual Total Returns
Periods Ended June 30, 2022
| One year | Five year | Ten year | Since Inception | † | |||||
| Institutional | -17.29% | 4.90% | 9.41% | 9.94% | |||||
| Open | -17.57% | 4.56% | 9.07% | 7.58% | |||||
| R6 | -18.68% | N/A | N/A | 0.56% | |||||
| Russell 2500 Index | -21.00% | 7.04% | 10.49% | 10.3% (Institutional Shares) 8.95% (Open Shares) 4.29% (R6 Shares) |
| † | The inception date for the Institutional Shares was October 30, 1991, for the Open Shares was January 30, 1997 and for the R6 Shares was January 8, 2020. |
Semi-Annual Report 19
Lazard US Sustainable Equity Portfolio
Comparison of Changes in Value of $10,000 Investment in the Institutional Shares of Lazard US Sustainable Equity Portfolio and the S&P 500 Index

Average Annual Total Returns
Periods Ended June 30, 2022
| One year | Since Inception | † | |||
| Institutional | -11.66% | 11.48% | |||
| Open | -11.95% | 11.14% | |||
| S&P 500 Index | -10.62% | 12.18% |
| † | The inception date for the Institutional Shares and Open Shares was June 30, 2020. |
20 Semi-Annual Report
Lazard US Systematic Small Cap Equity Portfolio
Comparison of Changes in Value of $10,000 Investment in the Institutional Shares of Lazard US Systematic Small Cap Equity Portfolio and the Russell 2000 Index
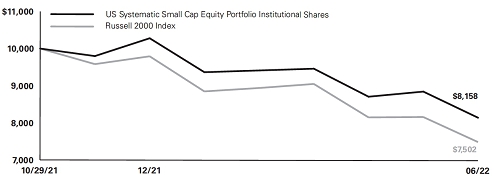
Average Annual Total Returns
Periods Ended June 30, 2022
| Since Inception | † | ||
| Institutional | 18.42% | ||
| Open | 18.50% | ||
| Russell 2000 Index | 24.98% |
| † | The inception date for the Institutional Shares and Open Shares was October 29, 2021. |
Notes to Performance Overviews:
Information About Portfolio Performance Shown Above
Total returns reflect reinvestment of all dividends and distributions, if any. Certain expenses of the Portfolio may have been waived or reimbursed by Lazard Asset Management LLC, the Fund’s investment manager (the “Investment Manager”), State Street Bank and Trust Company, the Fund’s administrator (“State Street”), or DST Asset Manager Solutions, Inc., the Fund’s transfer agent and dividend disbursement agent (“DST”); without such waiver/reimbursement of expenses, the Portfolio’s returns would have been lower. Returns for a period of less than one year are not annualized.
Performance results do not include adjustments made for financial reporting purposes in accordance with US Generally Accepted Accounting Principles (“GAAP”), if any, and also exclude one-time adjustments related to the receipt of settlement proceeds by the Lazard International Equity, Lazard International Small Cap Equity and Lazard Developing Markets Equity Portfolios from a class action lawsuit. For the Lazard Developing Markets Equity Portfolio, these proceeds impacted the total return of Open Shares but did not impact that of Institutional Shares; amounts may differ from amounts reported in the financial highlights.
The performance quoted represents past performance. Current performance may be lower or higher than the performance quoted. Past performance is not indicative, or a guarantee, of future results; the investment return and principal value of an investment in a Portfolio will fluctuate, so that Portfolio shares, when redeemed, may be worth more or less than their original cost. Within the longer periods illustrated, there may have been short-term fluctuations, counter to the overall trend of investment results, and no single period of any length may be taken as typical of what may be expected in future periods. The graphs and tables above do not reflect the deduction of taxes that a shareholder would pay on a Portfolio’s distributions or the redemption of Portfolio shares.
Semi-Annual Report 21
The performance of Institutional Shares, Open Shares and R6 Shares of a Portfolio, as applicable, may vary, primarily based on the differences in fees borne by shareholders investing in different classes of a Portfolio.
Information About Index Performance Shown Above
The performance data of the indices have been prepared from sources and data that the Investment Manager believes to be reliable, but no representation is made as to their accuracy. The indices are unmanaged, have no fees or costs and are not available for investment.
The MSCI Emerging Markets Index is a free-float-adjusted market capitalization index that is designed to measure equity market performance in the global emerging markets. The MSCI Emerging Markets Index consists of 24 emerging markets country indices.
The MSCI World Index is a free-float-adjusted market capitalization index that is designed to measure global developed markets equity performance. The MSCI World Index consists of 23 developed markets country indices.
The MSCI ACWI is a free-float-adjusted market capitalization weighted index that is designed to measure the equity market performance of developed and emerging markets. The MSCI ACWI consists of 47 country indices comprising 23 developed and 24 emerging markets country indices.
The MSCI World Core Infrastructure (Hedged) Index (the “Infrastructure Index”) captures large and mid-cap securities across the 23 developed market countries. The Infrastructure Index is designed to represent the performance of listed companies within the developed markets that are engaged in core industrial infrastructure activities. However, note that the Lazard Global Listed Infrastructure Portfolio invests in a range of companies globally, and is not limited to investing in developed markets countries.
The MSCI EAFE Index is a free-float-adjusted market capitalization index that is designed to measure developed markets equity performance, excluding the United States and Canada. The MSCI EAFE Index consists of 21 developed markets country indices.
The MSCI ACWI ex-US is a free-float-adjusted market capitalization weighted index that is designed to measure the equity market performance of developed and emerging markets, excluding the United States. The MSCI ACWI ex-US consists of 46 country indices comprising 22 developed and 24 emerging markets country indices.
The MSCI EAFE/ACWI ex-US Linked Index is an unmanaged index created by the Investment Manager which links the performance of the MSCI EAFE Index for all periods through June 30, 2010 (when the Lazard International Equity Select Portfolio’s benchmark index changed) and the MSCI ACWI ex-US for all periods thereafter.
The MSCI EAFE Small Cap Index targets all companies with market capitalizations below that of the companies in the MSCI EAFE Index and up to 99% coverage of the free-float-adjusted market capitalization in each market (subject to minimum investability criteria and a universal minimum size range). The MSCI EAFE Small Cap Index consists of 21 developed markets country indices.
The S&P 500 Index is a market capitalization-weighted index of 500 companies in leading industries of the US economy.
The Russell 1000 Value/S&P 500 Linked Index is an unmanaged index created by the Investment Manager which links the performance of the Russell 1000® Value Index for
22 Semi-Annual Report
all periods through May 30, 2012 (when the Lazard US Equity Concentrated Portfolio’s investment strategy changed) and the S&P 500 Index for all periods thereafter.
The Russell 1000 Value Index measures the performance of those Russell 1000 companies with lower price-to-book ratios and lower forecasted growth values. The Russell 1000 Index measures the performance of the large-cap segment of the US equity universe. It includes approximately 1000 of the largest securities based on a combination of their market cap and current index membership.
The Russell 2000 Index measures the performance of the small-cap segment of the US equity universe. The Russell 2000 Index is a subset of the Russell 3000 Index representing approximately 10% of the total market capitalization of that index. It includes approximately 2000 of the smallest securities based on a combination of their market cap and current index membership.
The Russell 2500 Index measures the performance of the small-to mid-cap segment of the US equity universe, commonly referred to as “smid” cap. The Russell 2500 Index is a subset of the Russell 3000® Index. The Russell 3000 Index measures the performance of the largest 3000 US companies, representing approximately 98% of the investable US equity market. The Russell 2500 Index includes approximately 2500 of the smallest securities based on a combination of their market cap and current index membership.
Semi-Annual Report 23
The Lazard Funds, Inc.
Information About Your Portfolio’s Expenses (unaudited)
Expense Example
As a shareholder in a Portfolio, you incur ongoing costs, including management fees, distribution and service (12b-1) fees (Open Shares only), and other expenses. This Example is intended to help you understand your ongoing costs (in dollars) of investing in a Portfolio and to compare these costs with the ongoing costs of investing in other mutual funds. The Example is based on an investment of $1,000 invested at the beginning of the six month period from January 1, 2022 through June 30, 2022 and held for the entire period.
Actual Expenses
For each share class of the Portfolios, the first line of the accompanying table provides information about actual account values and actual expenses. You may use the information in this line, together with the amount you invested, to estimate the expenses that you paid over the period. Simply divide your account value by $1,000 (for example, an $8,600 account value divided by $1,000=8.6), then multiply the result by the number in the first line under the heading entitled “Expenses Paid During Period” to estimate the expenses you paid on your account during this period.
Hypothetical Example for Comparison Purposes
For each share class of the Portfolios, the second line of the accompanying table provides information about hypothetical account values and hypothetical expenses based on the class’ actual expense ratio and an assumed rate of return of 5% per year before expenses, which is not the Portfolio’s actual return. The hypothetical account values and expenses may not be used to estimate the actual ending account balance or expenses you paid for the period. You may use this information to compare the ongoing costs of investing in the Portfolio and other mutual funds. To do so, compare this 5% hypothetical example with the 5% hypothetical examples that appear in the shareholder reports of other mutual funds.
24 Semi-Annual Report
| Portfolio | Beginning Account Value 1/1/22 | Ending Account Value 6/30/22 | Expenses Paid During Period* 1/1/22 - 6/30/22 | Annualized Expense Ratio During Period 1/1/22 - 6/30/22 | ||||||
| Developing Markets Equity | ||||||||||
| Institutional Shares | ||||||||||
| Actual | $1,000.00 | $ | 812.30 | $5.17 | 1.15% | |||||
| Hypothetical (5% Return Before Expenses) | $1,000.00 | $ | 1,019.09 | $5.76 | 1.15% | |||||
| Open Shares | ||||||||||
| Actual | $1,000.00 | $ | 811.20 | $6.29 | 1.40% | |||||
| Hypothetical (5% Return Before Expenses) | $1,000.00 | $ | 1,017.85 | $7.00 | 1.40% | |||||
| Emerging Markets Core Equity | ||||||||||
| Institutional Shares | ||||||||||
| Actual | $1,000.00 | $ | 783.70 | $5.44 | 1.23% | |||||
| Hypothetical (5% Return Before Expenses) | $1,000.00 | $ | 1,018.70 | $6.16 | 1.23% | |||||
| Open Shares | ||||||||||
| Actual | $1,000.00 | $ | 783.20 | $6.63 | 1.50% | |||||
| Hypothetical (5% Return Before Expenses) | $1,000.00 | $ | 1,017.36 | $7.50 | 1.50% | |||||
| R6 Shares | ||||||||||
| Actual | $1,000.00 | $ | 783.90 | $5.31 | 1.20% | |||||
| Hypothetical (5% Return Before Expenses) | $1,000.00 | $ | 1,018.84 | $6.01 | 1.20% | |||||
| Emerging Markets Equity Advantage | ||||||||||
| Institutional Shares | ||||||||||
| Actual | $1,000.00 | $ | 823.80 | $4.12 | 0.91% | |||||
| Hypothetical (5% Return Before Expenses) | $1,000.00 | $ | 1,020.28 | $4.56 | 0.91% | |||||
| Open Shares | ||||||||||
| Actual | $1,000.00 | $ | 823.00 | $5.24 | 1.16% | |||||
| Hypothetical (5% Return Before Expenses) | $1,000.00 | $ | 1,019.04 | $5.81 | 1.16% | |||||
Semi-Annual Report 25
| Portfolio | Beginning Account Value 1/1/22 | Ending Account Value 6/30/22 | Expenses Paid During Period* 1/1/22 - 6/30/22 | Annualized Expense Ratio During Period 1/1/22 - 6/30/22 | ||||||
| Emerging Markets Equity | ||||||||||
| Institutional Shares | ||||||||||
| Actual | $1,000.00 | $ | 849.30 | $4.95 | 1.08% | |||||
| Hypothetical (5% Return Before Expenses) | $1,000.00 | $ | 1,019.44 | $5.41 | 1.08% | |||||
| Open Shares | ||||||||||
| Actual | $1,000.00 | $ | 848.10 | $6.14 | 1.34% | |||||
| Hypothetical (5% Return Before Expenses) | $1,000.00 | $ | 1,018.15 | $6.71 | 1.34% | |||||
| R6 Shares | ||||||||||
| Actual | $1,000.00 | $ | 849.40 | $5.00 | 1.09% | |||||
| Hypothetical (5% Return Before Expenses) | $1,000.00 | $ | 1,019.39 | $5.46 | 1.09% | |||||
| Emerging Markets Strategic Equity | ||||||||||
| Institutional Shares | ||||||||||
| Actual | $1,000.00 | $ | 822.10 | $5.20 | 1.15% | |||||
| Hypothetical (5% Return Before Expenses) | $1,000.00 | $ | 1,019.09 | $5.76 | 1.15% | |||||
| Open Shares | ||||||||||
| Actual | $1,000.00 | $ | 821.20 | $6.32 | 1.40% | |||||
| Hypothetical (5% Return Before Expenses) | $1,000.00 | $ | 1,017.85 | $7.00 | 1.40% | |||||
| Equity Franchise | ||||||||||
| Institutional Shares | ||||||||||
| Actual | $1,000.00 | $ | 927.60 | $4.54 | 0.95% | |||||
| Hypothetical (5% Return Before Expenses) | $1,000.00 | $ | 1,020.08 | $4.76 | 0.95% | |||||
| Open Shares | ||||||||||
| Actual | $1,000.00 | $ | 927.60 | $5.74 | 1.20% | |||||
| Hypothetical (5% Return Before Expenses) | $1,000.00 | $ | 1,018.84 | $6.01 | 1.20% | |||||
26 Semi-Annual Report
| Portfolio | Beginning Account Value 1/1/22 | Ending Account Value 6/30/22 | Expenses Paid During Period* 1/1/22 - 6/30/22 | Annualized Expense Ratio During Period 1/1/22 - 6/30/22 | ||||||
| Global Equity Select | ||||||||||
| Institutional Shares | ||||||||||
| Actual | $1,000.00 | $ | 796.00 | $3.87 | 0.87% | |||||
| Hypothetical (5% Return Before Expenses) | $1,000.00 | $ | 1,020.48 | $4.36 | 0.87% | |||||
| Open Shares | ||||||||||
| Actual | $1,000.00 | $ | 794.50 | $5.12 | 1.15% | |||||
| Hypothetical (5% Return Before Expenses) | $1,000.00 | $ | 1,019.09 | $5.76 | 1.15% | |||||
| Global Listed Infrastructure | ||||||||||
| Institutional Shares | ||||||||||
| Actual | $1,000.00 | $ | 995.90 | $4.75 | 0.96% | |||||
| Hypothetical (5% Return Before Expenses) | $1,000.00 | $ | 1,020.03 | $4.81 | 0.96% | |||||
| Open Shares | ||||||||||
| Actual | $1,000.00 | $ | 994.00 | $5.98 | 1.21% | |||||
| Hypothetical (5% Return Before Expenses) | $1,000.00 | $ | 1,018.79 | $6.06 | 1.21% | |||||
| Global Strategic Equity | ||||||||||
| Institutional Shares | ||||||||||
| Actual | $1,000.00 | $ | 774.60 | $4.18 | 0.95% | |||||
| Hypothetical (5% Return Before Expenses) | $1,000.00 | $ | 1,020.08 | $4.76 | 0.95% | |||||
| Open Shares | ||||||||||
| Actual | $1,000.00 | $ | 772.80 | $5.27 | 1.20% | |||||
| Hypothetical (5% Return Before Expenses) | $1,000.00 | $ | 1,018.84 | $6.01 | 1.20% | |||||
| International Equity Advantage | ||||||||||
| Institutional Shares | ||||||||||
| Actual | $1,000.00 | $ | 817.70 | $4.06 | 0.90% | |||||
| Hypothetical (5% Return Before Expenses) | $1,000.00 | $ | 1,020.33 | $4.51 | 0.90% | |||||
| Open Shares | ||||||||||
| Actual | $1,000.00 | $ | 816.10 | $5.18 | 1.15% | |||||
| Hypothetical (5% Return Before Expenses) | $1,000.00 | $ | 1,019.09 | $5.76 | 1.15% | |||||
Semi-Annual Report 27
| Portfolio | Beginning Account Value 1/1/22 | Ending Account Value 6/30/22 | Expenses Paid During Period* 1/1/22 - 6/30/22 | Annualized Expense Ratio During Period 1/1/22 - 6/30/22 | ||||||
| International Equity | ||||||||||
| Institutional Shares | ||||||||||
| Actual | $1,000.00 | $ | 825.90 | $3.85 | 0.85% | |||||
| Hypothetical (5% Return Before Expenses) | $1,000.00 | $ | 1,020.58 | $4.26 | 0.85% | |||||
| Open Shares | ||||||||||
| Actual | $1,000.00 | $ | 825.10 | $4.98 | 1.10% | |||||
| Hypothetical (5% Return Before Expenses) | $1,000.00 | $ | 1,019.34 | $5.51 | 1.10% | |||||
| R6 Shares | ||||||||||
| Actual | $1,000.00 | $ | 826.20 | $3.62 | 0.80% | |||||
| Hypothetical (5% Return Before Expenses) | $1,000.00 | $ | 1,020.83 | $4.01 | 0.80% | |||||
| International Equity Select | ||||||||||
| Institutional Shares | ||||||||||
| Actual | $1,000.00 | $ | 829.70 | $4.08 | 0.90% | |||||
| Hypothetical (5% Return Before Expenses) | $1,000.00 | $ | 1,020.33 | $4.51 | 0.90% | |||||
| Open Shares | ||||||||||
| Actual | $1,000.00 | $ | 828.00 | $5.21 | 1.15% | |||||
| Hypothetical (5% Return Before Expenses) | $1,000.00 | $ | 1,019.09 | $5.76 | 1.15% | |||||
| International Quality Growth | ||||||||||
| Institutional Shares | ||||||||||
| Actual | $1,000.00 | $ | 769.00 | $3.73 | 0.85% | |||||
| Hypothetical (5% Return Before Expenses) | $1,000.00 | $ | 1,020.58 | $4.26 | 0.85% | |||||
| Open Shares | ||||||||||
| Actual | $1,000.00 | $ | 768.30 | $4.82 | 1.10% | |||||
| Hypothetical (5% Return Before Expenses) | $1,000.00 | $ | 1,019.34 | $5.51 | 1.10% | |||||
28 Semi-Annual Report
| Portfolio | Beginning Account Value 1/1/22 | Ending Account Value 6/30/22 | Expenses Paid During Period* 1/1/22 - 6/30/22 | Annualized Expense Ratio During Period 1/1/22 - 6/30/22 | ||||||
| International Small Cap Equity | ||||||||||
| Institutional Shares | ||||||||||
| Actual | $1,000.00 | $ | 718.80 | $4.82 | 1.13% | |||||
| Hypothetical (5% Return Before Expenses) | $1,000.00 | $ | 1,019.19 | $5.66 | 1.13% | |||||
| Open Shares | ||||||||||
| Actual | $1,000.00 | $ | 718.00 | $5.88 | 1.38% | |||||
| Hypothetical (5% Return Before Expenses) | $1,000.00 | $ | 1,017.95 | $6.90 | 1.38% | |||||
| International Strategic Equity | ||||||||||
| Institutional Shares | ||||||||||
| Actual | $1,000.00 | $ | 808.80 | $3.63 | 0.81% | |||||
| Hypothetical (5% Return Before Expenses) | $1,000.00 | $ | 1,020.78 | $4.06 | 0.81% | |||||
| Open Shares | ||||||||||
| Actual | $1,000.00 | $ | 808.20 | $4.80 | 1.07% | |||||
| Hypothetical (5% Return Before Expenses) | $1,000.00 | $ | 1,019.49 | $5.36 | 1.07% | |||||
| R6 Shares | ||||||||||
| Actual | $1,000.00 | $ | 808.90 | $3.63 | 0.81% | |||||
| Hypothetical (5% Return Before Expenses) | $1,000.00 | $ | 1,020.78 | $4.06 | 0.81% | |||||
| Managed Equity Volatility | ||||||||||
| Institutional Shares | ||||||||||
| Actual | $1,000.00 | $ | 898.30 | $3.53 | 0.75% | |||||
| Hypothetical (5% Return Before Expenses) | $1,000.00 | $ | 1,021.08 | $3.76 | 0.75% | |||||
| Open Shares | ||||||||||
| Actual | $1,000.00 | $ | 897.40 | $4.70 | 1.00% | |||||
| Hypothetical (5% Return Before Expenses) | $1,000.00 | $ | 1,019.84 | $5.01 | 1.00% | |||||
Semi-Annual Report 29
| Portfolio | Beginning Account Value 1/1/22 | Ending Account Value 6/30/22 | Expenses Paid During Period* 1/1/22 - 6/30/22 | Annualized Expense Ratio During Period 1/1/22 - 6/30/22 | ||||||
| US Equity Concentrated | ||||||||||
| Institutional Shares | ||||||||||
| Actual | $1,000.00 | $ | 809.60 | $3.45 | 0.77% | |||||
| Hypothetical (5% Return Before Expenses) | $1,000.00 | $ | 1,020.98 | $3.86 | 0.77% | |||||
| Open Shares | ||||||||||
| Actual | $1,000.00 | $ | 808.40 | $4.66 | 1.04% | |||||
| Hypothetical (5% Return Before Expenses) | $1,000.00 | $ | 1,019.64 | $5.21 | 1.04% | |||||
| R6 Shares | ||||||||||
| Actual | $1,000.00 | $ | 809.20 | $3.50 | 0.78% | |||||
| Hypothetical (5% Return Before Expenses) | $1,000.00 | $ | 1,020.93 | $3.91 | 0.78% | |||||
| US Equity Focus | ||||||||||
| Institutional Shares | ||||||||||
| Actual | $1,000.00 | $ | 818.90 | $3.16 | 0.70% | |||||
| Hypothetical (5% Return Before Expenses) | $1,000.00 | $ | 1,021.32 | $3.51 | 0.70% | |||||
| Open Shares | ||||||||||
| Actual | $1,000.00 | $ | 817.50 | $4.28 | 0.95% | |||||
| Hypothetical (5% Return Before Expenses) | $1,000.00 | $ | 1,020.08 | $4.76 | 0.95% | |||||
| R6 Shares | ||||||||||
| Actual | $1,000.00 | $ | 818.40 | $3.16 | 0.70% | |||||
| Hypothetical (5% Return Before Expenses) | $1,000.00 | $ | 1,021.32 | $3.51 | 0.70% | |||||
| US Small-Mid Cap Equity | ||||||||||
| Institutional Shares | ||||||||||
| Actual | $1,000.00 | $ | 806.90 | $4.52 | 1.01% | |||||
| Hypothetical (5% Return Before Expenses) | $1,000.00 | $ | 1,019.79 | $5.06 | 1.01% | |||||
| Open Shares | ||||||||||
| Actual | $1,000.00 | $ | 805.30 | $5.86 | 1.31% | |||||
| Hypothetical (5% Return Before Expenses) | $1,000.00 | $ | 1,018.30 | $6.56 | 1.31% | |||||
| R6 Shares | ||||||||||
| Actual | $1,000.00 | $ | 793.10 | $4.58 | 1.03% | |||||
| Hypothetical (5% Return Before Expenses) | $1,000.00 | $ | 1,019.69 | $5.16 | 1.03% | |||||
30 Semi-Annual Report
| Portfolio | Beginning Account Value 1/1/22 | Ending Account Value 6/30/22 | Expenses Paid During Period* 1/1/22 - 6/30/22 | Annualized Expense Ratio During Period 1/1/22 - 6/30/22 | ||||||
| US Sustainable Equity | ||||||||||
| Institutional Shares | ||||||||||
| Actual | $1,000.00 | $ | 785.20 | $3.32 | 0.75% | |||||
| Hypothetical (5% Return Before Expenses) | $1,000.00 | $ | 1,021.08 | $3.76 | 0.75% | |||||
| Open Shares | ||||||||||
| Actual | $1,000.00 | $ | 783.50 | $4.42 | 1.00% | |||||
| Hypothetical (5% Return Before Expenses) | $1,000.00 | $ | 1,019.84 | $5.01 | 1.00% | |||||
| US Systematic Small Cap Equity | ||||||||||
| Institutional Shares | ||||||||||
| Actual | $1,000.00 | $ | 793.40 | $4.05 | 0.91% | |||||
| Hypothetical (5% Return Before Expenses) | $1,000.00 | $ | 1,020.28 | $4.56 | 0.91% | |||||
| Open Shares | ||||||||||
| Actual | $1,000.00 | $ | 792.80 | $5.11 | 1.15% | |||||
| Hypothetical (5% Return Before Expenses) | $1,000.00 | $ | 1,019.09 | $5.76 | 1.15% | |||||
| * | Expenses are equal to the annualized expense ratio, net of expenses waivers and reimbursements, of each share class multiplied by the average account value over the period, multiplied by 181/365 (to reflect one-half year period). |
Semi-Annual Report 31
| Asset Class/Sector* | Lazard Global Strategic Equity Portfolio | Lazard International Equity Advantage Portfolio | Lazard International Equity Portfolio | Lazard International Equity Select Portfolio | ||||||||||||
| Equity | ||||||||||||||||
| Communication Services | 9.1 | % | 4.4 | % | 4.4 | % | 6.0 | % | ||||||||
| Consumer Discretionary | 3.9 | 11.2 | 12.7 | 10.1 | ||||||||||||
| Consumer Staples | 5.9 | 9.4 | 9.4 | 3.9 | ||||||||||||
| Energy | 1.8 | 4.8 | 7.5 | 8.4 | ||||||||||||
| Financials | 14.0 | 17.2 | 13.0 | 16.3 | ||||||||||||
| Health Care | 22.7 | 14.4 | 12.9 | 10.0 | ||||||||||||
| Industrials | 10.7 | 16.1 | 18.5 | 19.7 | ||||||||||||
| Information Technology | 23.1 | 9.3 | 4.9 | 7.7 | ||||||||||||
| Materials | 3.9 | 6.3 | 6.6 | 6.6 | ||||||||||||
| Real Estate | — | 2.7 | 2.2 | 1.8 | ||||||||||||
| Utilities | 1.6 | 3.9 | 6.1 | 5.3 | ||||||||||||
| Short-Term Investments | 3.3 | 0.3 | 1.8 | 4.2 | ||||||||||||
| Total Investments | 100.0 | % | 100.0 | % | 100.0 | % | 100.0 | % | ||||||||
| Asset Class/Sector* | Lazard International Quality Growth Portfolio | Lazard International Small Cap Equity Portfolio | Lazard International Strategic Equity Portfolio | Lazard Managed Equity Volatility Portfolio | ||||||||||||
| Equity | ||||||||||||||||
| Communication Services | 8.2 | % | 2.7 | % | 3.0 | % | 10.5 | % | ||||||||
| Consumer Discretionary | 14.2 | 11.4 | 9.7 | 4.8 | ||||||||||||
| Consumer Staples | 11.5 | 6.9 | 10.3 | 20.1 | ||||||||||||
| Energy | — | 3.1 | 2.4 | 1.1 | ||||||||||||
| Financials | 22.4 | 14.3 | 17.3 | 9.3 | ||||||||||||
| Health Care | 9.6 | 7.1 | 12.1 | 16.3 | ||||||||||||
| Industrials | 17.4 | 21.1 | 23.2 | 8.5 | ||||||||||||
| Information Technology | 14.2 | 11.2 | 7.4 | 8.9 | ||||||||||||
| 8.Materials | — | 5.6 | 5.8 | 2.1 | ||||||||||||
| Real Estate | — | 10.3 | 2.7 | 5.7 | ||||||||||||
| Utilities | — | 4.1 | 5.0 | 11.0 | ||||||||||||
| Short-Term Investments | 2.5 | 2.2 | 1.1 | 1.7 | ||||||||||||
| Total Investments | 100.0 | % | 100.0 | % | 100.0 | % | 100.0 | % | ||||||||
| * | Represents percentage of total investments. |
32 Semi-Annual Report
The Lazard Funds, Inc.
Portfolio Holdings Presented by Sector June 30, 2022 (unaudited)
| Asset Class/Sector* | Lazard Developing Markets Equity Portfolio | Lazard Emerging Markets Core Equity Portfolio | Lazard Emerging Markets Equity Advantage Portfolio | Lazard Emerging Markets Equity Portfolio | ||||||||||||
| Equity | ||||||||||||||||
| Communication Services | 9.6 | % | 10.6 | % | 10.8 | % | 5.2 | % | ||||||||
| Consumer Discretionary | 21.7 | 15.2 | 14.7 | 10.5 | ||||||||||||
| Consumer Staples | 3.6 | 3.9 | 6.0 | 6.6 | ||||||||||||
| Energy | 2.2 | 8.6 | 5.2 | 8.3 | ||||||||||||
| Financials | 19.1 | 20.1 | 21.1 | 25.8 | ||||||||||||
| Health Care | 1.3 | 1.6 | 3.6 | 4.2 | ||||||||||||
| Industrials | 12.0 | 8.9 | 4.9 | 4.4 | ||||||||||||
| Information Technology | 25.7 | 20.9 | 20.4 | 20.1 | ||||||||||||
| Materials | 3.4 | 8.6 | 7.5 | 8.0 | ||||||||||||
| Real Estate | — | — | 1.4 | 3.1 | ||||||||||||
| Utilities | — | 1.1 | 3.0 | 1.9 | ||||||||||||
| Short-Term Investments | 1.4 | 0.5 | 1.4 | 1.9 | ||||||||||||
| Total Investments | 100.0 | % | 100.0 | % | 100.0 | % | 100.0 | % | ||||||||
| Asset Class/Sector* | Lazard Emerging Markets Strategic Equity Portfolio | Lazard Equity Franchise Portfolio | Lazard Global Equity Select Portfolio | Lazard Global Listed Infrastructure Portfolio | ||||||||||||
| Equity | ||||||||||||||||
| Communication Services | 9.2 | % | 10.3 | % | 7.7 | % | 3.8 | % | ||||||||
| Consumer Discretionary | 15.5 | 21.1 | 18.0 | — | ||||||||||||
| Consumer Staples | 6.4 | 2.0 | 10.6 | — | ||||||||||||
| Energy | 5.0 | — | — | — | ||||||||||||
| Financials | 25.2 | — | 13.3 | — | ||||||||||||
| Health Care | 3.4 | 23.2 | 13.4 | — | ||||||||||||
| Industrials | 2.3 | 17.0 | 15.8 | 39.5 | ||||||||||||
| Information Technology | 20.3 | 23.3 | 19.0 | — | ||||||||||||
| Materials | 7.5 | — | 0.8 | — | ||||||||||||
| Real Estate | 1.3 | — | — | — | ||||||||||||
| Utilities | 1.5 | — | — | 48.9 | ||||||||||||
| Short-Term Investments | 2.4 | 3.1 | 1.4 | 7.8 | ||||||||||||
| Total Investments | 100.0 | % | 100.0 | % | 100.0 | % | 100.0 | % | ||||||||
| * | Represents percentage of total investments. |
Semi-Annual Report 33
| Asset Class/Sector* | Lazard US Equity Concentrated Portfolio | Lazard US Equity Focus Portfolio | Lazard US Small-Mid Cap Equity Portfolio | Lazard US Sustainable Equity Portfolio | ||||||||||||
| Equity | ||||||||||||||||
| Communication Services | 10.2 | % | 6.6 | % | 3.9 | % | 1.2 | % | ||||||||
| Consumer Discretionary | 15.8 | 17.1 | 10.4 | 5.9 | ||||||||||||
| Consumer Staples | 7.2 | 3.5 | 3.4 | 5.7 | ||||||||||||
| Energy | — | — | 5.3 | — | ||||||||||||
| Financials | 4.8 | 17.7 | 14.7 | 10.9 | ||||||||||||
| Health Care | 9.6 | 18.9 | 12.6 | 25.7 | ||||||||||||
| Industrials | 13.6 | 10.4 | 19.3 | 11.2 | ||||||||||||
| Information Technology | 27.7 | 21.6 | 14.4 | 27.0 | ||||||||||||
| Materials | 2.6 | — | 7.5 | 4.8 | ||||||||||||
| Real Estate | 7.3 | 1.9 | 6.4 | 2.5 | ||||||||||||
| Utilities | — | — | 2.1 | — | ||||||||||||
| Short-Term Investments | 1.2 | 2.3 | — | 5.1 | ||||||||||||
| Total Investments | 100.0 | % | 100.0 | % | 100.0 | % | 100.0 | % | ||||||||
| Asset Class/Sector* | Lazard US Systematic Small Cap Equity Portfolio | |||||||||||||||
| Equity | ||||||||||||||||
| Communication Services | 3.2 | % | ||||||||||||||
| Consumer Discretionary | 11.6 | |||||||||||||||
| Consumer Staples | 5.8 | |||||||||||||||
| Energy | 2.1 | |||||||||||||||
| Financials | 6.9 | |||||||||||||||
| Health Care | 18.3 | |||||||||||||||
| Industrials | 23.0 | |||||||||||||||
| Information Technology | 16.6 | |||||||||||||||
| Materials | 5.5 | |||||||||||||||
| Real Estate | 4.7 | |||||||||||||||
| Utilities | 0.8 | |||||||||||||||
| Short-Term Investments | 1.5 | |||||||||||||||
| Total Investments | 100.0 | % | ||||||||||||||
| * | Represents percentage of total investments. |
34 Semi-Annual Report
The Lazard Funds, Inc. Portfolios of Investments
June 30, 2022 (unaudited)
The accompanying notes are an integral part of these financial statements.
Semi-Annual Report 35
| Description | Shares | Fair Value | ||||||
| Lazard Developing Markets Equity Portfolio (continued) | ||||||||
| Hong Kong | 0.9% | ||||||||
| Techtronic Industries Co., Ltd. | 104,002 | $ | 1,087,294 | |||||
| Hungary | 1.3% | ||||||||
| Richter Gedeon Nyrt. | 80,604 | 1,459,061 | ||||||
| India | 10.5% | ||||||||
| Bajaj Finance, Ltd. | 18,979 | 1,301,331 | ||||||
| HDFC Bank, Ltd. ADR | 52,868 | 2,905,625 | ||||||
| ICICI Bank, Ltd. Sponsored ADR | 160,083 | 2,839,872 | ||||||
| Mphasis, Ltd. | 25,699 | 748,455 | ||||||
| Reliance Industries, Ltd. | 79,155 | 2,606,329 | ||||||
| UPL, Ltd. | 228,177 | 1,830,290 | ||||||
| 12,231,902 | ||||||||
| Indonesia | 3.4% | ||||||||
| PT Bank Central Asia Tbk | 3,581,800 | 1,745,325 | ||||||
| PT Bank Rakyat Indonesia (Persero) Tbk | 7,871,349 | 2,195,539 | ||||||
| 3,940,864 | ||||||||
| Mexico | 2.0% | ||||||||
| Grupo Financiero Banorte SAB de CV, Class O | 408,257 | 2,277,241 | ||||||
| Peru | 0.9% | ||||||||
| Credicorp, Ltd. | 8,318 | 997,411 | ||||||
| Philippines | 2.2% | ||||||||
| BDO Unibank, Inc. | 785,285 | 1,578,024 | ||||||
| International Container Terminal Services, Inc. | 301,379 | 1,008,396 | ||||||
| 2,586,420 | ||||||||
| Poland | 0.7% | ||||||||
| InPost SA (*) | 148,808 | 864,205 | ||||||
| South Africa | 3.4% | ||||||||
| Capitec Bank Holdings, Ltd. | 6,583 | 803,788 | ||||||
| Standard Bank Group, Ltd. | 178,137 | 1,701,107 | ||||||
| The Foschini Group, Ltd. | 201,530 | 1,512,993 | ||||||
| 4,017,888 | ||||||||
The accompanying notes are an integral part of these financial statements.
36 Semi-Annual Report
| Description | Shares | Fair Value | ||||||
| Lazard Developing Markets Equity Portfolio (continued) | ||||||||
| South Korea | 11.3% | ||||||||
| AfreecaTV Co., Ltd. | 14,919 | $ | 923,359 | |||||
| CJ Logistics Corp. (*) | 8,839 | 778,095 | ||||||
| NAVER Corp. | 6,254 | 1,160,294 | ||||||
| Samsung Electronics Co., Ltd. | 138,876 | 6,083,416 | ||||||
| SK Hynix, Inc. | 41,934 | 2,933,119 | ||||||
| WONIK IPS Co., Ltd. | 56,946 | 1,303,499 | ||||||
| 13,181,782 | ||||||||
| Taiwan | 15.2% | ||||||||
| ASE Technology Holding Co., Ltd. | 698,289 | 1,798,730 | ||||||
| Bizlink Holding, Inc. | 184,000 | 1,907,094 | ||||||
| Chroma ATE, Inc. | 278,000 | 1,428,878 | ||||||
| Hiwin Technologies Corp. | 126,844 | 1,020,379 | ||||||
| Lotes Co., Ltd. | 69,000 | 1,545,805 | ||||||
| MediaTek, Inc. | 68,000 | 1,480,987 | ||||||
| RichWave Technology Corp. | 197,000 | 1,041,239 | ||||||
| Sercomm Corp. | 360,000 | 978,442 | ||||||
| Silicon Motion Technology Corp. ADR | 19,716 | 1,650,229 | ||||||
| Taiwan Semiconductor Manufacturing Co., Ltd. | 307,000 | 4,889,474 | ||||||
| 17,741,257 | ||||||||
| United States | 2.0% | ||||||||
| JS Global Lifestyle Co., Ltd. | 1,765,000 | 2,304,633 | ||||||
| Zambia | 1.1% | ||||||||
| First Quantum Minerals, Ltd. | 64,784 | 1,229,044 | ||||||
| Total Common Stocks (Cost $108,519,793) | 114,478,599 | |||||||
| Short-Term Investments | 1.4% | ||||||||
| State Street Institutional Treasury Money Market Fund, Premier Class, 1.04% (7 day yield) (Cost $1,674,713) | 1,674,713 | 1,674,713 | ||||||
The accompanying notes are an integral part of these financial statements.
Semi-Annual Report 37
| Description | Shares | Fair Value | ||||||
| Lazard Developing Markets Equity Portfolio (concluded) | ||||||||
| Total Investments | 99.7% (Cost $110,194,506) | $ | 116,153,312 | ||||||
| Cash and Other Assets in Excess of Liabilities | 0.3% | 341,814 | |||||||
| Net Assets | 100.0% | $ | 116,495,126 | ||||||
The accompanying notes are an integral part of these financial statements.
38 Semi-Annual Report
The accompanying notes are an integral part of these financial statements.
Semi-Annual Report 39
| Description | Shares | Fair Value | ||||||
| Lazard Emerging Markets Core Equity Portfolio (continued) | ||||||||
| Ping An Insurance (Group) Co. of China, Ltd., Class H | 260,000 | $ | 1,799,624 | |||||
| Prosus NV | 14,338 | 947,574 | ||||||
| Remegen Co., Ltd., Class H (*) | 67,000 | 376,236 | ||||||
| Shenzhen Inovance Technology Co., Ltd., Class A | 62,400 | 614,700 | ||||||
| Shenzhou International Group Holdings, Ltd. | 68,591 | 843,031 | ||||||
| Tencent Holdings, Ltd. | 129,400 | 5,876,506 | ||||||
| Wuxi Biologics Cayman, Inc. (*) | 99,000 | 911,944 | ||||||
| Wuxi Lead Intelligent Equipment Co., Ltd., Class A | 136,000 | 1,287,948 | ||||||
| XPeng, Inc., Class A | 59,000 | 948,056 | ||||||
| Yum China Holdings, Inc. | 23,954 | 1,161,769 | ||||||
| 31,805,351 | ||||||||
| Hong Kong | 0.9% | ||||||||
| Techtronic Industries Co., Ltd. | 98,500 | 1,029,773 | ||||||
| India | 12.8% | ||||||||
| HDFC Bank, Ltd. ADR | 51,585 | 2,835,112 | ||||||
| Hindalco Industries, Ltd. | 217,105 | 933,455 | ||||||
| ICICI Bank, Ltd. Sponsored ADR | 52,250 | 926,915 | ||||||
| Infosys, Ltd. Sponsored ADR | 117,140 | 2,168,261 | ||||||
| Larsen & Toubro, Ltd. | 68,623 | 1,356,676 | ||||||
| Reliance Industries, Ltd. | 68,775 | 2,264,547 | ||||||
| Star Health & Allied Insurance Co., Ltd. | 153,400 | 951,267 | ||||||
| UPL, Ltd. | 235,516 | 1,889,159 | ||||||
| WNS Holdings, Ltd. ADR (*) | 12,601 | 940,539 | ||||||
| 14,265,931 | ||||||||
| Indonesia | 2.9% | ||||||||
| PT Bank Mandiri (Persero) Tbk | 3,249,900 | 1,735,025 | ||||||
| PT Telkom Indonesia (Persero) Tbk ADR | 54,605 | 1,476,519 | ||||||
| 3,211,544 | ||||||||
| Malaysia | 1.0% | ||||||||
| Public Bank Berhad | 1,129,800 | 1,120,606 | ||||||
| Mexico | 4.8% | ||||||||
| Arca Continental SAB de CV | 227,445 | 1,498,618 | ||||||
| Cemex SAB de CV Sponsored ADR (*) | 320,101 | 1,254,796 | ||||||
The accompanying notes are an integral part of these financial statements.
40 Semi-Annual Report
| Description | Shares | Fair Value | ||||||
| Lazard Emerging Markets Core Equity Portfolio (continued) | ||||||||
| Grupo Aeroportuario del Pacifico SAB de CV ADR | 11,595 | $ | 1,618,430 | |||||
| Grupo Financiero Banorte SAB de CV, Class O | 166,800 | 930,404 | ||||||
| 5,302,248 | ||||||||
| Philippines | 1.5% | ||||||||
| BDO Unibank, Inc. | 477,201 | 958,932 | ||||||
| PLDT, Inc. | 24,170 | 737,824 | ||||||
| 1,696,756 | ||||||||
| Poland | 1.4% | ||||||||
| CD Projekt SA | 9,338 | 199,873 | ||||||
| KGHM Polska Miedz SA | 51,616 | 1,374,424 | ||||||
| 1,574,297 | ||||||||
| Qatar | 1.0% | ||||||||
| Qatar National Bank QPSC | 204,760 | 1,124,484 | ||||||
| South Africa | 2.3% | ||||||||
| Anglo American PLC | 38,967 | 1,391,313 | ||||||
| Naspers, Ltd., N Shares | 2,050 | 299,873 | ||||||
| The Bidvest Group, Ltd. | 70,801 | 912,378 | ||||||
| 2,603,564 | ||||||||
| South Korea | 11.0% | ||||||||
| DB Insurance Co., Ltd. | 15,624 | 738,425 | ||||||
| KB Financial Group, Inc. | 18,665 | 693,013 | ||||||
| LG Chem, Ltd. | 2,741 | 1,090,772 | ||||||
| LG Electronics, Inc. | 9,059 | 617,507 | ||||||
| NAVER Corp. | 3,493 | 648,050 | ||||||
| Samsung Electronics Co., Ltd. | 124,889 | 5,470,720 | ||||||
| Samsung SDI Co., Ltd. | 2,453 | 1,006,685 | ||||||
| SK Hynix, Inc. | 18,427 | 1,288,897 | ||||||
| SM Entertainment Co., Ltd. | 14,023 | 682,889 | ||||||
| 12,236,958 | ||||||||
| Taiwan | 13.0% | ||||||||
| Accton Technology Corp. | 82,000 | 663,416 | ||||||
| ASE Technology Holding Co., Ltd. | 358,000 | 922,176 | ||||||
| Eclat Textile Co., Ltd. | 58,789 | 822,327 | ||||||
The accompanying notes are an integral part of these financial statements.
Semi-Annual Report 41
| Description | Shares | Fair Value | ||||||
| Lazard Emerging Markets Core Equity Portfolio (concluded) | ||||||||
| Feng TAY Enterprise Co., Ltd. | 120,000 | $ | 707,451 | |||||
| Nien Made Enterprise Co., Ltd. | 69,000 | 680,440 | ||||||
| Realtek Semiconductor Corp. | 51,000 | 621,805 | ||||||
| Taiwan Semiconductor Manufacturing Co., Ltd. Sponsored ADR | 123,495 | 10,095,716 | ||||||
| 14,513,331 | ||||||||
| Thailand | 3.2% | ||||||||
| Home Product Center Public Co., Ltd. (‡) | 2,965,700 | 1,065,320 | ||||||
| PTT Exploration & Production Public Co., Ltd. (‡) | 560,500 | 2,528,631 | ||||||
| 3,593,951 | ||||||||
| United Arab Emirates | 2.8% | ||||||||
| Abu Dhabi Ports Co. PJSC | 1,506,403 | 2,262,532 | ||||||
| ADNOC Drilling Co. PJSC | 891,901 | 826,036 | ||||||
| 3,088,568 | ||||||||
| United Kingdom | 0.8% | ||||||||
| Unilever PLC Sponsored ADR | 19,561 | 896,481 | ||||||
| United States | 0.8% | ||||||||
| Tenaris SA ADR | 32,741 | 841,116 | ||||||
| Total Common Stocks (Cost $103,382,096) | 110,542,048 | |||||||
| Short-Term Investments | 0.5% | ||||||||
| State Street Institutional Treasury Money Market Fund, Premier Class, 1.04% (7 day yield) (Cost $547,500) | 547,500 | 547,500 | ||||||
| Total Investments | 99.7% (Cost $103,929,596) | $ | 111,089,548 | ||||||
| Cash and Other Assets in Excess of Liabilities | 0.3% | 323,410 | |||||||
| Net Assets | 100.0% | $ | 111,412,958 | ||||||
The accompanying notes are an integral part of these financial statements.
42 Semi-Annual Report
The accompanying notes are an integral part of these financial statements.
Semi-Annual Report 43
| Description | Shares | Fair Value | ||||||
| Lazard Emerging Markets Equity Advantage Portfolio (continued) | ||||||||
| China Taiping Insurance Holdings Co., Ltd. | 122,200 | $ | 151,093 | |||||
| China World Trade Center Co., Ltd., Class A | 46,487 | 102,691 | ||||||
| China Yongda Automobiles Services Holdings, Ltd. | 114,000 | 107,928 | ||||||
| Chongqing Brewery Co., Ltd., Class A | 5,400 | 118,476 | ||||||
| CITIC, Ltd. | 119,000 | 120,792 | ||||||
| Contemporary Amperex Technology Co., Ltd., Class A | 1,400 | 112,102 | ||||||
| COSCO SHIPPING Holdings Co., Ltd., Class H | 130,300 | 182,314 | ||||||
| Country Garden Services Holdings Co., Ltd. | 23,000 | 104,670 | ||||||
| CSPC Pharmaceutical Group, Ltd. | 407,840 | 405,962 | ||||||
| East Money Information Co., Ltd. Class A | 51,294 | 194,998 | ||||||
| G-bits Network Technology Xiamen Co., Ltd., Class A | 1,700 | 98,714 | ||||||
| GD Power Development Co., Ltd., Class A | 336,200 | 196,592 | ||||||
| GF Securities Co., Ltd., Class H | 57,000 | 75,486 | ||||||
| Gigadevice Semiconductor Beijing, Inc., Class A | 5,600 | 119,218 | ||||||
| Greattown Holdings, Ltd. | 217,997 | 119,785 | ||||||
| Haidilao International Holding, Ltd. (*) | 41,000 | 97,975 | ||||||
| Haier Smart Home Co., Ltd. Class H | 48,200 | 181,044 | ||||||
| Industrial &Commercial Bank of China, Ltd., Class H | 498,000 | 296,025 | ||||||
| Inner Mongolia Yili Industrial Group Co., Ltd., Class A | 30,200 | 175,857 | ||||||
| JD Health International, Inc. (*) | 8,600 | 69,165 | ||||||
| JD.com, Inc., Class A | 22,154 | 716,330 | ||||||
| Kuaishou Technology (*) | 9,100 | 102,058 | ||||||
| Lenovo Group, Ltd. | 328,000 | 307,246 | ||||||
| Li Auto, Inc. ADR (*) | 4,820 | 184,654 | ||||||
| Li Ning Co., Ltd. | 26,500 | 250,494 | ||||||
| Meituan, Class B (*) | 31,200 | 788,420 | ||||||
| Metallurgical Corp. of China, Ltd., Class H | 276,000 | 66,232 | ||||||
| Midea Group Co., Ltd., Class A | 12,700 | 115,152 | ||||||
| NetEase, Inc. | 33,400 | 625,080 | ||||||
| New China Life Insurance Co., Ltd., Class H | 34,000 | 96,650 | ||||||
| NIO, Inc. ADR (*) | 4,344 | 94,352 | ||||||
| Nongfu Spring Co., Ltd. | 31,800 | 184,879 | ||||||
| Oppein Home Group, Inc., Class A | 4,600 | 103,644 | ||||||
| PetroChina Co., Ltd., Class H | 1,016,000 | 478,218 | ||||||
| Pharmaron Beijing Co., Ltd., Class H | 8,400 | 84,452 | ||||||
The accompanying notes are an integral part of these financial statements.
44 Semi-Annual Report
| Description | Shares | Fair Value | ||||||
| Lazard Emerging Markets Equity Advantage Portfolio (continued) | ||||||||
| PICC Property & Casualty Co., Ltd., Class H | 366,000 | $ | 381,664 | |||||
| Pinduoduo, Inc. ADR (*) | 2,460 | 152,028 | ||||||
| Power Construction Corp. of China, Ltd. | 114,900 | 135,314 | ||||||
| Shanghai Construction Group Co., Ltd. | 283,700 | 128,558 | ||||||
| Shanxi Taigang Stainless Steel Co., Ltd. Class A | 94,100 | 76,655 | ||||||
| Shenyang Xingqi Pharmaceutical Co., Ltd. Class A | 6,000 | 137,572 | ||||||
| Shenzhen Inovance Technology Co., Ltd., Class A | 8,500 | 83,733 | ||||||
| Shenzhen Mindray Bio-Medical Electronics Co., Ltd., Class A | 1,800 | 84,389 | ||||||
| Sunny Optical Technology Group Co., Ltd. | 7,700 | 125,297 | ||||||
| Tencent Holdings, Ltd. | 51,000 | 2,316,088 | ||||||
| The People’s Insurance Co. Group of China, Ltd., Class H | 709,000 | 217,173 | ||||||
| Tongwei Co., Ltd. | 19,393 | 173,848 | ||||||
| Vipshop Holdings, Ltd. ADR (*) | 8,207 | 81,167 | ||||||
| WuXi AppTec Co., Ltd., Class H | 7,700 | 102,809 | ||||||
| Wuxi Biologics Cayman, Inc. (*) | 16,500 | 151,991 | ||||||
| Yadea Group Holdings, Ltd. | 90,000 | 176,818 | ||||||
| Zhongsheng Group Holdings, Ltd. | 43,500 | 307,238 | ||||||
| 18,945,843 | ||||||||
| Colombia | 0.4% | ||||||||
| Bancolombia SA Sponsored ADR | 7,349 | 226,570 | ||||||
| Czech Republic | 0.4% | ||||||||
| CEZ AS | 5,048 | 227,479 | ||||||
| Greece | 0.5% | ||||||||
| Hellenic Telecommunications Organization SA | 16,343 | 284,849 | ||||||
| Hong Kong | 0.3% | ||||||||
| Orient Overseas International, Ltd. | 5,500 | 146,300 | ||||||
| Hungary | 0.4% | ||||||||
| MOL Hungarian Oil & Gas PLC | 28,440 | 220,318 | ||||||
The accompanying notes are an integral part of these financial statements.
Semi-Annual Report 45
| Description | Shares | Fair Value | ||||||
| Lazard Emerging Markets Equity Advantage Portfolio (continued) | ||||||||
| India | 11.5% | ||||||||
| Axis Bank, Ltd. GDR (*) | 1,693 | $ | 68,104 | |||||
| Dr Reddy’s Laboratories, Ltd. ADR | 7,411 | 410,495 | ||||||
| GAIL India, Ltd. GDR | 19,616 | 203,979 | ||||||
| HDFC Bank, Ltd. ADR | 16,161 | 888,208 | ||||||
| ICICI Bank, Ltd. Sponsored ADR | 64,286 | 1,140,434 | ||||||
| Infosys, Ltd. Sponsored ADR | 54,608 | 1,010,794 | ||||||
| Larsen & Toubro, Ltd. GDR | 17,056 | 336,388 | ||||||
| Larsen & Toubro, Ltd. GDR (United States) | 795 | 15,661 | ||||||
| Reliance Industries, Ltd. Sponsored GDR (#) | 13,772 | 897,208 | ||||||
| State Bank of India GDR | 4,948 | 288,301 | ||||||
| Tata Motors, Ltd. Sponsored ADR (*) | 9,869 | 255,311 | ||||||
| Tata Steel, Ltd. GDR | 5,153 | 55,916 | ||||||
| Wipro, Ltd. ADR | 58,726 | 311,835 | ||||||
| WNS Holdings, Ltd. ADR (*) | 3,679 | 274,601 | ||||||
| 6,157,235 | ||||||||
| Indonesia | 3.8% | ||||||||
| Kalbe Farma Tbk PT | 1,221,500 | 136,107 | ||||||
| PT Astra International Tbk | 972,300 | 432,046 | ||||||
| PT Bank Mandiri (Persero) Tbk | 1,067,300 | 569,799 | ||||||
| PT Bank Negara Indonesia (Persero) Tbk | 201,100 | 106,069 | ||||||
| PT Bank Rakyat Indonesia (Persero) Tbk | 543,900 | 151,709 | ||||||
| PT Telkom Indonesia (Persero) Tbk ADR | 4,899 | 132,469 | ||||||
| PT Unilever Indonesia Tbk | 1,074,400 | 343,925 | ||||||
| Sumber Alfaria Trijaya Tbk PT | 1,039,100 | 142,331 | ||||||
| 2,014,455 | ||||||||
| Malaysia | 1.5% | ||||||||
| CIMB Group Holdings Berhad | 162,500 | 182,947 | ||||||
| Hong Leong Financial Group Bhd | 28,700 | 120,570 | ||||||
| Inari Amertron Berhad | 129,400 | 77,315 | ||||||
| Petronas Chemicals Group Bhd | 200,200 | 409,065 | ||||||
| 789,897 | ||||||||
| Mexico | 2.6% | ||||||||
| America Movil SAB de CV, Series L | 253,900 | 259,461 | ||||||
| Arca Continental SAB de CV | 41,100 | 270,805 | ||||||
| Coca-Cola Femsa SAB de CV Sponsored ADR | 4,992 | 275,958 | ||||||
The accompanying notes are an integral part of these financial statements.
46 Semi-Annual Report
| Description | Shares | Fair Value | ||||||
| Lazard Emerging Markets Equity Advantage Portfolio (continued) | ||||||||
| Gruma SAB de CV, Class B | 11,765 | $ | 130,202 | |||||
| Grupo Mexico SAB de CV, Series B | 25,000 | 103,521 | ||||||
| Wal-Mart de Mexico SAB de CV | 107,200 | 369,585 | ||||||
| 1,409,532 | ||||||||
| Philippines | 0.6% | ||||||||
| BDO Unibank, Inc. | 77,160 | 155,052 | ||||||
| International Container Terminal Services, Inc. | 44,700 | 149,564 | ||||||
| 304,616 | ||||||||
| Poland | 0.4% | ||||||||
| KGHM Polska Miedz SA | 2,121 | 56,478 | ||||||
| Orange Polska SA | 67,304 | 94,372 | ||||||
| Polski Koncern Naftowy ORLEN SA | 5,041 | 77,273 | ||||||
| 228,123 | ||||||||
| Russia | 0.0% | ||||||||
| PhosAgro PJSC (¢) | 42 | 0 | ||||||
| Severstal PJSC GDR (¢) | 9,589 | 0 | ||||||
| 0 | ||||||||
| Saudi Arabia | 4.0% | ||||||||
| Al Rajhi Bank | 25,967 | 571,895 | ||||||
| Arabian Internet & Communications Services Co. | 3,116 | 164,494 | ||||||
| Arriyadh Development Co. | 12,133 | 72,895 | ||||||
| Bank Al-Jazira | 11,251 | 67,007 | ||||||
| Leejam Sports Co. JSC | 3,679 | 87,810 | ||||||
| SABIC Agri-Nutrients Co. | 5,102 | 187,483 | ||||||
| Saudi Arabian Mining Co. (*) | 6,426 | 85,546 | ||||||
| Saudi Arabian Oil Co. | 12,250 | 126,747 | ||||||
| Saudi Basic Industries Corp. | 18,813 | 509,765 | ||||||
| Saudi Electricity Co. | 21,744 | 140,667 | ||||||
| Saudi Research & Media Group (*) | 2,882 | 144,377 | ||||||
| 2,158,686 | ||||||||
| South Africa | 3.2% | ||||||||
| Absa Group, Ltd. | 17,855 | 170,021 | ||||||
| Anglo American Platinum, Ltd. | 845 | 74,162 | ||||||
| FirstRand, Ltd. | 61,494 | 236,292 | ||||||
| Gold Fields, Ltd. Sponsored ADR | 13,793 | 125,792 | ||||||
| Harmony Gold Mining Co., Ltd. Sponsored ADR | 29,396 | 92,010 | ||||||
The accompanying notes are an integral part of these financial statements.
Semi-Annual Report 47
| Description | Shares | Fair Value | ||||||
| Lazard Emerging Markets Equity Advantage Portfolio (continued) | ||||||||
| Impala Platinum Holdings, Ltd. | 7,912 | $ | 88,159 | |||||
| MTN Group, Ltd. | 17,289 | 140,571 | ||||||
| MultiChoice Group, Ltd. | 10,480 | 74,598 | ||||||
| Naspers, Ltd., N Shares | 1,792 | 262,133 | ||||||
| Sappi, Ltd. (*) | 23,082 | 76,507 | ||||||
| Sasol, Ltd. (*) | 8,295 | 191,633 | ||||||
| Sibanye Stillwater, Ltd. | 41,868 | 104,047 | ||||||
| Vodacom Group, Ltd. | 11,058 | 89,261 | ||||||
| 1,725,186 | ||||||||
| South Korea | 12.4% | ||||||||
| AfreecaTV Co., Ltd. | 1,486 | 91,971 | ||||||
| BGF retail Co., Ltd. | 389 | 56,621 | ||||||
| CJ CheilJedang Corp. | 564 | 164,891 | ||||||
| DB HiTek Co., Ltd. | 2,059 | 79,510 | ||||||
| DGB Financial Group, Inc. | 22,382 | 131,462 | ||||||
| Foosung Co., Ltd. | 10,500 | 144,061 | ||||||
| Hana Financial Group, Inc. | 5,620 | 170,664 | ||||||
| HMM Co., Ltd. | 3,485 | 66,103 | ||||||
| KB Financial Group, Inc. | 9,127 | 338,876 | ||||||
| Kia Corp. | 9,993 | 596,196 | ||||||
| Korean Reinsurance Co. | 36,507 | 236,405 | ||||||
| KT Corp. | 25,187 | 707,916 | ||||||
| KT&G Corp. | 3,995 | 252,885 | ||||||
| LG Chem, Ltd. | 458 | 182,260 | ||||||
| LG Electronics, Inc. | 1,361 | 92,773 | ||||||
| LG Innotek Co., Ltd. | 729 | 192,019 | ||||||
| POSCO Holdings Inc | 326 | 58,004 | ||||||
| Samsung Electro-Mechanics Co., Ltd. | 1,988 | 199,255 | ||||||
| Samsung Electronics Co., Ltd. GDR | 1,856 | 2,027,160 | ||||||
| Samsung SDI Co., Ltd. | 543 | 222,841 | ||||||
| SK Hynix, Inc. | 3,354 | 234,599 | ||||||
| Woori Financial Group, Inc. | 42,023 | 392,459 | ||||||
| 6,638,931 | ||||||||
| Taiwan | 14.5% | ||||||||
| Advanced Energy Solution Holding Co., Ltd. | 2,000 | 65,268 | ||||||
| Asia Vital Components Co., Ltd. | 37,000 | 115,682 | ||||||
The accompanying notes are an integral part of these financial statements.
48 Semi-Annual Report
| Description | Shares | Fair Value | ||||||
| Lazard Emerging Markets Equity Advantage Portfolio (continued) | ||||||||
| ASPEED Technology, Inc. | 1,100 | $ | 69,593 | |||||
| Bizlink Holding, Inc. | 8,000 | 82,917 | ||||||
| Chailease Holding Co., Ltd. | 31,500 | 221,067 | ||||||
| China Airlines, Ltd. (*) | 79,000 | 62,499 | ||||||
| Delta Electronics, Inc. | 54,000 | 400,045 | ||||||
| E Ink Holdings, Inc. | 15,000 | 94,661 | ||||||
| Eva Airways Corp. (*) | 112,000 | 119,011 | ||||||
| Evergreen Marine Corp. Taiwan, Ltd. | 36,000 | 102,297 | ||||||
| Faraday Technology Corp. | 13,000 | 82,946 | ||||||
| Global Unichip Corp. | 8,000 | 129,562 | ||||||
| Hiwin Technologies Corp. | 26,000 | 209,154 | ||||||
| International Games System Co., Ltd. | 4,000 | 100,400 | ||||||
| Kinik Co. | 24,000 | 117,650 | ||||||
| Lotes Co., Ltd. | 8,000 | 179,224 | ||||||
| MediaTek, Inc. | 13,000 | 283,130 | ||||||
| Nan Ya Plastics Corp. | 44,000 | 122,757 | ||||||
| Nan Ya Printed Circuit Board Corp. | 16,000 | 139,269 | ||||||
| Novatek Microelectronics Corp. | 6,000 | 60,604 | ||||||
| Realtek Semiconductor Corp. | 7,000 | 85,346 | ||||||
| Ruentex Development Co., Ltd. | 39,000 | 96,206 | ||||||
| SinoPac Financial Holdings Co., Ltd. | 737,000 | 416,505 | ||||||
| Taiwan Semiconductor Manufacturing Co., Ltd. | 209,000 | 3,328,665 | ||||||
| Tong Yang Industry Co., Ltd. | 106,000 | 175,798 | ||||||
| Unimicron Technology Corp. | 42,000 | 222,728 | ||||||
| United Microelectronics Corp. | 119,000 | 155,932 | ||||||
| Vanguard International Semiconductor Corp. | 21,000 | 53,917 | ||||||
| Voltronic Power Technology Corp. | 2,000 | 97,091 | ||||||
| Wan Hai Lines, Ltd. | 20,400 | 81,717 | ||||||
| Winbond Electronics Corp. | 111,000 | 81,094 | ||||||
| Yang Ming Marine Transport Corp. | 39,000 | 107,809 | ||||||
| Yuanta Financial Holding Co., Ltd. | 110,000 | 72,836 | ||||||
| 7,733,380 | ||||||||
| Thailand | 2.1% | ||||||||
| Bangkok Bank Public Co. Ltd. | 56,900 | 215,278 | ||||||
| Bumrungrad Hospital Public Co. Ltd. (‡) | 37,600 | 190,366 | ||||||
| Chularat Hospital Public Co., Ltd. NVDR | 984,000 | 102,900 | ||||||
The accompanying notes are an integral part of these financial statements.
Semi-Annual Report 49
| Description | Shares | Fair Value | ||||||
| Lazard Emerging Markets Equity Advantage Portfolio (concluded) | ||||||||
| Kasikornbank Public Co., Ltd. NVDR | 36,500 | $ | 155,659 | |||||
| Kiatnakin Phatra Bank Public Co., Ltd NVDR | 49,900 | 87,625 | ||||||
| Krung Thai Bank Public Co., Ltd. NVDR | 285,200 | 125,030 | ||||||
| Land & Houses Public Co., Ltd. (‡) | 466,400 | 110,153 | ||||||
| Osotspa Public Co., Ltd (‡) | 167,900 | 162,652 | ||||||
| 1,149,663 | ||||||||
| United States | 0.4% | ||||||||
| JBS SA | 27,000 | 162,977 | ||||||
| Parade Technologies, Ltd. | 1,000 | 38,356 | ||||||
| 201,333 | ||||||||
| Total Common Stocks (Cost $60,044,460) | 52,165,417 | |||||||
| Preferred Stocks | 0.8% | ||||||||
| Brazil | 0.8% | ||||||||
| Petroleo Brasileiro SA (Cost $372,929) | 78,239 | 417,548 | ||||||
| Short-Term Investments | 1.4% | ||||||||
| State Street Institutional Treasury Money Market Fund, Premier Class, 1.04% (7 day yield) (Cost $737,913) | 737,913 | 737,913 | ||||||
| Total Investments | 99.6% (Cost $61,155,302) | $ | 53,320,878 | ||||||
| Cash and Other Assets in Excess of Liabilities | 0.4% | 193,698 | |||||||
| Net Assets | 100.0% | $ | 53,514,576 | ||||||
The accompanying notes are an integral part of these financial statements.
50 Semi-Annual Report
The accompanying notes are an integral part of these financial statements.
Semi-Annual Report 51
| Description | Shares | Fair Value | ||||||
| Lazard Emerging Markets Equity Portfolio (continued) | ||||||||
| Greece | 1.1% | ||||||||
| OPAP SA | 2,219,980 | $ | 31,894,451 | |||||
| Hong Kong | 1.1% | ||||||||
| ASM Pacific Technology, Ltd. | 3,689,400 | 31,419,592 | ||||||
| Hungary | 1.1% | ||||||||
| OTP Bank Nyrt | 1,437,664 | 32,205,595 | ||||||
| India | 7.1% | ||||||||
| Axis Bank, Ltd. (*) | 3,232,451 | 26,129,099 | ||||||
| Bajaj Auto, Ltd. | 547,741 | 25,836,996 | ||||||
| Bharat Petroleum Corp., Ltd. | 4,876,648 | 19,069,594 | ||||||
| Hero MotoCorp, Ltd. | 667,337 | 23,025,500 | ||||||
| Indus Towers, Ltd. | 15,021,008 | 39,846,076 | ||||||
| Petronet LNG, Ltd. | 11,999,296 | 33,069,220 | ||||||
| UPL, Ltd. | 4,157,126 | 33,345,804 | ||||||
| 200,322,289 | ||||||||
| Indonesia | 4.3% | ||||||||
| PT Astra International Tbk | 73,689,600 | 32,744,347 | ||||||
| PT Bank Mandiri (Persero) Tbk | 87,316,042 | 46,615,436 | ||||||
| PT Telkom Indonesia (Persero) Tbk ADR | 1,282,358 | 34,674,960 | ||||||
| PT United Tractors Tbk | 4,522,700 | 8,606,488 | ||||||
| 122,641,231 | ||||||||
| Mexico | 4.9% | ||||||||
| America Movil SAB de CV, Class L Sponsored ADR | 1,588,639 | 32,455,895 | ||||||
| Grupo Financiero Banorte SAB de CV, Class O | 4,282,437 | 23,887,265 | ||||||
| Grupo Mexico SAB de CV, Series B | 9,248,572 | 38,296,755 | ||||||
| Kimberly-Clark de Mexico SAB de CV, Series A | 17,959,695 | 24,318,978 | ||||||
| Ternium SA Sponsored ADR | 571,549 | 20,627,203 | ||||||
| 139,586,096 | ||||||||
| Portugal | 2.6% | ||||||||
| Galp Energia SGPS SA | 6,269,390 | 73,490,084 | ||||||
The accompanying notes are an integral part of these financial statements.
52 Semi-Annual Report
| Description | Shares | Fair Value | ||||||
| Lazard Emerging Markets Equity Portfolio (continued) | ||||||||
| Russia | 0.0% | ||||||||
| Mobile TeleSystems PJSC Sponsored ADR (¢) | 4,695,624 | $ | 5 | |||||
| Sberbank of Russia PJSC (*), (¢) | 13,596,421 | 13 | ||||||
| 18 | ||||||||
| South Africa | 7.6% | ||||||||
| Anglo American PLC | 688,266 | 24,574,479 | ||||||
| Life Healthcare Group Holdings, Ltd. | 24,270,257 | 26,773,527 | ||||||
| Nedbank Group, Ltd. | 4,649,803 | 59,331,688 | ||||||
| Sanlam, Ltd. | 6,341,029 | 20,630,991 | ||||||
| Standard Bank Group, Ltd. | 3,592,200 | 34,303,463 | ||||||
| The Bidvest Group, Ltd. | 2,103,486 | 27,106,596 | ||||||
| Vodacom Group, Ltd. | 2,632,775 | 21,251,840 | ||||||
| 213,972,584 | ||||||||
| South Korea | 14.3% | ||||||||
| Coway Co., Ltd. | 714,426 | 35,189,594 | ||||||
| Hyundai Mobis Co., Ltd. | 201,553 | 30,924,156 | ||||||
| KB Financial Group, Inc. | 1,343,045 | 49,865,934 | ||||||
| Kia Corp. | 467,127 | 27,869,415 | ||||||
| KT Corp. | 694,395 | 19,516,938 | ||||||
| KT&G Corp. | 387,589 | 24,534,537 | ||||||
| Samsung Electronics Co., Ltd. | 2,001,125 | 87,658,596 | ||||||
| Shinhan Financial Group Co., Ltd. | 1,648,998 | 47,181,262 | ||||||
| SK Hynix, Inc. | 1,181,109 | 82,613,953 | ||||||
| 405,354,385 | ||||||||
| Taiwan | 10.7% | ||||||||
| ASE Technology Holding Co., Ltd. | 19,064,000 | 49,107,166 | ||||||
| Globalwafers Co., Ltd. | 1,397,000 | 21,163,241 | ||||||
| Hon Hai Precision Industry Co., Ltd. | 14,684,425 | 53,717,223 | ||||||
| MediaTek, Inc. | 1,096,000 | 23,870,027 | ||||||
| Novatek Microelectronics Corp. | 3,745,000 | 37,826,953 | ||||||
| Quanta Computer, Inc. | 19,033,000 | 50,964,322 | ||||||
| Taiwan Semiconductor Manufacturing Co., Ltd. | 2,351,913 | 37,458,037 | ||||||
| Wiwynn Corp. | 1,181,000 | 27,554,435 | ||||||
| 301,661,404 | ||||||||
The accompanying notes are an integral part of these financial statements.
Semi-Annual Report 53
| Description | Shares | Fair Value | ||||||
| Lazard Emerging Markets Equity Portfolio (concluded) | ||||||||
| Thailand | 1.7% | ||||||||
| Kasikornbank Public Co., Ltd. | 6,405,454 | $ | 27,509,328 | |||||
| The Siam Cement Public Co., Ltd. (‡) | 2,014,200 | 21,307,051 | ||||||
| 48,816,379 | ||||||||
| United Kingdom | 1.6% | ||||||||
| Unilever PLC | 970,324 | 44,175,881 | ||||||
| Total Common Stocks (Cost $2,815,462,147) | 2,755,002,814 | |||||||
| Short-Term Investments | 1.9% | ||||||||
| State Street Institutional Treasury Money Market Fund, Premier Class, 1.04% (7 day yield) (Cost $54,058,325) | 54,058,325 | 54,058,325 | ||||||
| Total Investments | 99.2% (Cost $2,869,520,472) | $ | 2,809,061,139 | ||||||
| Cash and Other Assets in Excess of Liabilities | 0.8% | 22,207,137 | |||||||
| Net Assets | 100.0% | $ | 2,831,268,276 | ||||||
The accompanying notes are an integral part of these financial statements.
54 Semi-Annual Report
The accompanying notes are an integral part of these financial statements.
Semi-Annual Report 55
| Description | Shares | Fair Value | ||||||
| Lazard Emerging Markets Strategic Equity Portfolio (continued) | ||||||||
| Hong Kong | 1.3% | ||||||||
| Techtronic Industries Co., Ltd. | 60,782 | $ | 635,448 | |||||
| India | 14.1% | ||||||||
| HDFC Bank, Ltd. | 98,455 | 1,684,459 | ||||||
| ITC, Ltd. | 229,139 | 794,579 | ||||||
| Reliance Industries, Ltd. | 50,765 | 1,671,534 | ||||||
| SBI Cards & Payment Services, Ltd. | 37,816 | 368,550 | ||||||
| State Bank of India | 105,502 | 623,724 | ||||||
| Tata Consultancy Services, Ltd. | 31,482 | 1,304,764 | ||||||
| UPL, Ltd. | 62,985 | 505,225 | ||||||
| 6,952,835 | ||||||||
| Indonesia | 3.9% | ||||||||
| PT Astra International Tbk | 1,008,900 | 448,310 | ||||||
| PT Bank Central Asia Tbk | 1,795,700 | 875,001 | ||||||
| PT Telkom Indonesia (Persero) Tbk ADR | 21,191 | 573,005 | ||||||
| 1,896,316 | ||||||||
| Macau | 0.7% | ||||||||
| Sands China, Ltd. (*) | 144,800 | 353,582 | ||||||
| Mexico | 4.8% | ||||||||
| America Movil SAB de CV, Class L Sponsored ADR | 36,518 | 746,063 | ||||||
| Grupo Financiero Banorte SAB de CV, Class O | 92,877 | 518,064 | ||||||
| Grupo Mexico SAB de CV, Series B | 169,499 | 701,866 | ||||||
| Kimberly-Clark de Mexico SAB de CV, Series A | 289,074 | 391,431 | ||||||
| 2,357,424 | ||||||||
| Russia | 0.0% | ||||||||
| Mobile TeleSystems PJSC Sponsored ADR (¢) | 45,259 | 0 | ||||||
| Sberbank of Russia PJSC (*), (¢) | 213,889 | 0 | ||||||
| 0 | ||||||||
| Saudi Arabia | 2.5% | ||||||||
| Arabian Internet & Communications Services Co. | 10,492 | 553,872 | ||||||
| The Saudi National Bank | 38,614 | 679,310 | ||||||
| 1,233,182 | ||||||||
The accompanying notes are an integral part of these financial statements.
56 Semi-Annual Report
| Description | Shares | Fair Value | ||||||
| Lazard Emerging Markets Strategic Equity Portfolio (continued) | ||||||||
| South Africa | 4.4% | ||||||||
| Anglo American PLC | 32,213 | $ | 1,150,163 | |||||
| Capitec Bank Holdings, Ltd. | 4,469 | 545,667 | ||||||
| Vodacom Group, Ltd. | 56,366 | 454,988 | ||||||
| 2,150,818 | ||||||||
| South Korea | 11.0% | ||||||||
| Coway Co., Ltd. | 11,597 | 571,219 | ||||||
| Hyundai Mobis Co., Ltd. | 3,172 | 486,678 | ||||||
| NAVER Corp. | 3,029 | 561,965 | ||||||
| Samsung Electronics Co., Ltd. | 34,832 | 1,525,804 | ||||||
| Shinhan Financial Group Co., Ltd. | 38,571 | 1,103,597 | ||||||
| SK Hynix, Inc. | 16,285 | 1,139,072 | ||||||
| 5,388,335 | ||||||||
| Taiwan | 13.3% | ||||||||
| ASE Technology Holding Co., Ltd. | 151,000 | 388,962 | ||||||
| CTBC Financial Holding Co., Ltd. | 1,385,000 | 1,176,794 | ||||||
| Hon Hai Precision Industry Co., Ltd. | 329,136 | 1,204,015 | ||||||
| MediaTek, Inc. | 32,000 | 696,935 | ||||||
| Quanta Computer, Inc. | 246,000 | 658,710 | ||||||
| Taiwan Semiconductor Manufacturing Co., Ltd. | 152,387 | 2,427,011 | ||||||
| 6,552,427 | ||||||||
| Thailand | 1.1% | ||||||||
| CP ALL Public Co., Ltd. | 328,700 | 564,801 | ||||||
| United Kingdom | 1.7% | ||||||||
| Unilever PLC | 18,701 | 851,399 | ||||||
| Total Common Stocks (Cost $52,195,182) | 47,082,928 | |||||||
| Preferred Stocks | 1.1% | ||||||||
| Brazil | 1.1% | ||||||||
| Banco Bradesco SA (Cost $652,808) | 161,810 | 531,797 | ||||||
The accompanying notes are an integral part of these financial statements.
Semi-Annual Report 57
| Description | Shares | Fair Value | ||||||
| Lazard Emerging Markets Strategic Equity Portfolio (concluded) | ||||||||
| Short-Term Investments | 2.4% | ||||||||
| State Street Institutional Treasury Money Market Fund, Premier Class, 1.04% (7 day yield) (Cost $1,163,949) | 1,163,949 | $ | 1,163,949 | |||||
| Total Investments | 99.3% (Cost $54,011,939) | $ | 48,778,674 | ||||||
| Cash and Other Assets in Excess of Liabilities | 0.7% | 332,057 | |||||||
| Net Assets | 100.0% | $ | 49,110,731 | ||||||
The accompanying notes are an integral part of these financial statements.
58 Semi-Annual Report
The accompanying notes are an integral part of these financial statements.
Semi-Annual Report 59
| Description | Shares | Fair Value | ||||||
| Lazard Equity Franchise Portfolio (concluded) | ||||||||
| SS&C Technologies Holdings, Inc. | 50,323 | $ | 2,922,257 | |||||
| Starbucks Corp. | 38,617 | 2,949,953 | ||||||
| Tapestry, Inc. | 283,704 | 8,658,646 | ||||||
| The TJX Cos., Inc. | 51,698 | 2,887,333 | ||||||
| Visa, Inc., Class A | 29,589 | 5,825,778 | ||||||
| 108,384,779 | ||||||||
| Total Common Stocks (Cost $144,796,253) | 139,858,032 | |||||||
| Short-Term Investments | 3.0% | ||||||||
| State Street Institutional Treasury Money Market Fund, Premier Class, 1.04% (7 day yield) (Cost $4,471,481) | 4,471,481 | 4,471,481 | ||||||
| Total Investments | 98.2% (Cost $149,267,734) | $ | 144,329,513 | ||||||
| Cash and Other Assets in Excess of Liabilities | 1.8% | 2,709,545 | |||||||
| Net Assets | 100.0% | $ | 147,039,058 | ||||||
The accompanying notes are an integral part of these financial statements.
60 Semi-Annual Report
The accompanying notes are an integral part of these financial statements.
Semi-Annual Report 61
| Description | Shares | Fair Value | ||||||
| Lazard Global Equity Select Portfolio (continued) | ||||||||
| Japan | 4.9% | ||||||||
| BayCurrent Consulting, Inc. | 2,700 | $ | 719,400 | |||||
| Kadokawa Corp. | 43,200 | 931,270 | ||||||
| Nintendo Co., Ltd. | 2,600 | 1,123,700 | ||||||
| Olympus Corp. | 55,300 | 1,112,126 | ||||||
| Shimano, Inc. | 4,800 | 811,961 | ||||||
| 4,698,457 | ||||||||
| Netherlands | 2.7% | ||||||||
| Wolters Kluwer NV | 26,374 | 2,565,705 | ||||||
| Spain | 0.7% | ||||||||
| Industria de Diseno Textil SA | 30,369 | 687,780 | ||||||
| Sweden | 2.0% | ||||||||
| Assa Abloy AB, Class B | 28,539 | 610,733 | ||||||
| Hexagon AB, B Shares | 120,781 | 1,255,902 | ||||||
| 1,866,635 | ||||||||
| Switzerland | 3.7% | ||||||||
| ABB, Ltd. | 46,904 | 1,253,559 | ||||||
| Partners Group Holding AG | 1,135 | 1,023,890 | ||||||
| The Swatch Group AG | 5,163 | 1,225,122 | ||||||
| 3,502,571 | ||||||||
| Taiwan | 1.8% | ||||||||
| Taiwan Semiconductor Manufacturing Co., Ltd. Sponsored ADR | 20,735 | 1,695,086 | ||||||
| United Kingdom | 6.6% | ||||||||
| Coca-Cola Europacific Partners PLC | 22,375 | 1,154,774 | ||||||
| Diageo PLC | 36,213 | 1,562,294 | ||||||
| RELX PLC | 67,988 | 1,845,535 | ||||||
| Unilever PLC | 38,992 | 1,774,688 | ||||||
| 6,337,291 | ||||||||
| United States | 57.1% | ||||||||
| Accenture PLC, Class A | 8,895 | 2,469,697 | ||||||
| Alphabet, Inc., Class A (*) | 1,674 | 3,648,081 | ||||||
| Amazon.com, Inc. (*) | 26,360 | 2,799,696 | ||||||
The accompanying notes are an integral part of these financial statements.
62 Semi-Annual Report
| Description | Shares | Fair Value | ||||||
| Lazard Global Equity Select Portfolio (continued) | ||||||||
| Amphenol Corp., Class A | 16,034 | $ | 1,032,269 | |||||
| Aon PLC, Class A | 7,293 | 1,966,776 | ||||||
| Avery Dennison Corp. | 4,924 | 797,048 | ||||||
| Booz Allen Hamilton Holding Corp. | 19,473 | 1,759,580 | ||||||
| Boston Scientific Corp. (*) | 30,990 | 1,154,997 | ||||||
| BRP, Inc. | 11,638 | 716,254 | ||||||
| Deere & Co. | 3,065 | 917,876 | ||||||
| Dollar General Corp. | 8,599 | 2,110,539 | ||||||
| Intercontinental Exchange, Inc. | 18,055 | 1,697,892 | ||||||
| IQVIA Holdings, Inc. (*) | 12,406 | 2,691,978 | ||||||
| Johnson & Johnson | 13,625 | 2,418,574 | ||||||
| Lowe’s Cos., Inc. | 9,346 | 1,632,466 | ||||||
| McDonald’s Corp. | 7,187 | 1,774,327 | ||||||
| Microsoft Corp. | 14,405 | 3,699,636 | ||||||
| Motorola Solutions, Inc. | 9,791 | 2,052,194 | ||||||
| NIKE, Inc., Class B | 11,025 | 1,126,755 | ||||||
| PTC, Inc. (*) | 12,224 | 1,299,900 | ||||||
| Rockwell Automation, Inc. | 4,817 | 960,076 | ||||||
| S&P Global, Inc. | 4,757 | 1,603,394 | ||||||
| Texas Instruments, Inc. | 10,171 | 1,562,774 | ||||||
| The Charles Schwab Corp. | 23,939 | 1,512,466 | ||||||
| The Coca-Cola Co. | 31,942 | 2,009,471 | ||||||
| The Procter & Gamble Co. | 11,769 | 1,692,264 | ||||||
| Thermo Fisher Scientific, Inc. | 5,397 | 2,932,082 | ||||||
| TopBuild Corp. (*) | 3,556 | 594,421 | ||||||
| Visa, Inc., Class A | 9,531 | 1,876,559 | ||||||
| Warner Music Group Corp., Class A | 18,676 | 454,947 | ||||||
| Zoetis, Inc. | 8,746 | 1,503,350 | ||||||
| 54,468,339 | ||||||||
| Total Common Stocks (Cost $77,582,642) | 93,989,043 | |||||||
| Short-Term Investments | 1.4% | ||||||||
| State Street Institutional Treasury Money Market Fund, Premier Class, 1.04% (7 day yield) (Cost $1,297,099) | 1,297,099 | 1,297,099 | ||||||
The accompanying notes are an integral part of these financial statements.
Semi-Annual Report 63
| Description | Shares | Fair Value | ||||||
| Lazard Global Equity Select Portfolio (concluded) | ||||||||
| Total Investments | 99.9% (Cost $78,879,741) | $ | 95,286,142 | ||||||
| Cash and Other Assets in Excess of Liabilities | 0.1% | 85,621 | |||||||
| Net Assets | 100.0% | $ | 95,371,763 | ||||||
The accompanying notes are an integral part of these financial statements.
64 Semi-Annual Report
The accompanying notes are an integral part of these financial statements.
Semi-Annual Report 65
| Description | Shares | Fair Value | ||||||
| Lazard Global Listed Infrastructure Portfolio (continued) | ||||||||
| United Kingdom | 17.0% | ||||||||
| National Grid PLC | 50,190,700 | $ | 643,207,363 | |||||
| Pennon Group PLC | 12,879,212 | 149,834,186 | ||||||
| Severn Trent PLC | 8,058,555 | 266,851,924 | ||||||
| United Utilities Group PLC | 30,132,700 | 374,283,318 | ||||||
| 1,434,176,791 | ||||||||
| United States | 25.9% | ||||||||
| Ameren Corp. | 892,593 | 80,654,703 | ||||||
| Consolidated Edison, Inc. | 3,930,655 | 373,805,291 | ||||||
| CSX Corp. | 13,136,881 | 381,757,762 | ||||||
| Norfolk Southern Corp. | 1,742,219 | 395,988,957 | ||||||
| NorthWestern Corp. (^) | 2,858,238 | 168,435,965 | ||||||
| Pinnacle West Capital Corp. | 5,404,679 | 395,190,128 | ||||||
| Union Pacific Corp. | 1,842,400 | 392,947,072 | ||||||
| 2,188,779,878 | ||||||||
| Total Common Stocks (Cost $7,541,240,819) | 7,817,840,921 | |||||||
| Short-Term Investments | 7.8% | ||||||||
| State Street Institutional Treasury Money Market Fund, Premier Class, 1.04% (7 day yield) (Cost $662,580,630) | 662,580,630 | 662,580,630 | ||||||
| Total Investments | 100.2% (Cost $8,203,821,449) (») | $ | 8,480,421,551 | ||||||
| Liabilities in Excess of Cash and Other Assets | (0.2)% | (20,206,806 | ) | ||||||
| Net Assets | 100.0% | $ | 8,460,214,745 | ||||||
The accompanying notes are an integral part of these financial statements.
66 Semi-Annual Report
Lazard Global Listed Infrastructure Portfolio (concluded)
Forward Currency Contracts open at June 30, 2022:
| Currency Purchased | Quantity | Currency Sold | Quantity | Counterparty | Settlement Date | Unrealized Appreciation | Unrealized Depreciation | ||||||||||||||
| AUD | 50,414,850 | USD | 34,941,514 | HSB | 09/28/22 | $ | — | $ | 118,084 | ||||||||||||
| CAD | 11,988,308 | USD | 9,295,952 | HSB | 09/28/22 | 18,830 | — | ||||||||||||||
| CHF | 4,585,439 | USD | 4,794,228 | BNP | 09/28/22 | 38,577 | — | ||||||||||||||
| HKD | 160,235,317 | USD | 20,474,727 | HSB | 09/28/22 | — | 5,921 | ||||||||||||||
| USD | 8,576,304 | AUD | 12,261,497 | BNP | 09/28/22 | 106,828 | — | ||||||||||||||
| USD | 117,680,776 | AUD | 168,234,120 | CIT | 09/28/22 | 1,475,152 | — | ||||||||||||||
| USD | 26,838,342 | AUD | 39,616,806 | HSB | 09/28/22 | — | 526,474 | ||||||||||||||
| USD | 131,604,268 | AUD | 188,097,459 | HSB | 09/28/22 | 1,678,289 | — | ||||||||||||||
| USD | 105,436,825 | AUD | 150,725,237 | MSC | 09/28/22 | 1,325,243 | — | ||||||||||||||
| USD | 128,482,918 | AUD | 183,700,548 | SSB | 09/28/22 | 1,594,051 | — | ||||||||||||||
| USD | 6,134,959 | CAD | 7,936,858 | BNP | 09/28/22 | — | 31,891 | ||||||||||||||
| USD | 92,730,299 | CAD | 119,999,971 | CIT | 09/28/22 | — | 508,340 | ||||||||||||||
| USD | 55,313,041 | CAD | 71,560,638 | HSB | 09/28/22 | — | 288,777 | ||||||||||||||
| USD | 5,104,763 | CAD | 6,604,134 | MSC | 09/28/22 | — | 26,575 | ||||||||||||||
| USD | 19,546,798 | CAD | 25,288,670 | SCB | 09/28/22 | — | 102,217 | ||||||||||||||
| USD | 39,954,356 | CHF | 38,214,344 | BNP | 09/28/22 | — | 321,493 | ||||||||||||||
| USD | 35,284,829 | CHF | 33,744,646 | SCB | 09/28/22 | — | 280,201 | ||||||||||||||
| USD | 62,869,881 | CHF | 60,137,242 | SSB | 09/28/22 | — | 511,516 | ||||||||||||||
| USD | 330,737,487 | EUR | 311,045,214 | BNP | 09/28/22 | 2,792,009 | — | ||||||||||||||
| USD | 428,407,285 | EUR | 402,598,695 | CAN | 09/28/22 | 3,933,879 | — | ||||||||||||||
| USD | 585,353,393 | EUR | 550,881,955 | CIT | 09/28/22 | 4,539,938 | — | ||||||||||||||
| USD | 183,402,425 | EUR | 172,432,283 | HSB | 09/28/22 | 1,601,244 | — | ||||||||||||||
| USD | 364,668,740 | EUR | 343,204,717 | MEL | 09/28/22 | 2,816,412 | — | ||||||||||||||
| USD | 518,701,382 | EUR | 487,948,432 | RBC | 09/28/22 | 4,240,866 | — | ||||||||||||||
| USD | 618,479,342 | EUR | 581,739,579 | SSB | 09/28/22 | 5,131,651 | — | ||||||||||||||
| USD | 296,155,983 | GBP | 240,616,811 | CAN | 09/28/22 | 2,771,952 | — | ||||||||||||||
| USD | 109,273,808 | GBP | 90,831,023 | HSB | 09/28/22 | — | 1,476,441 | ||||||||||||||
| USD | 142,079,463 | GBP | 115,440,898 | HSB | 09/28/22 | 1,322,397 | — | ||||||||||||||
| USD | 217,220,057 | GBP | 176,771,258 | MSC | 09/28/22 | 1,682,896 | — | ||||||||||||||
| USD | 427,268,659 | GBP | 347,705,051 | RBC | 09/28/22 | 3,311,957 | — | ||||||||||||||
| USD | 273,141,168 | GBP | 222,226,789 | SSB | 09/28/22 | 2,180,087 | — | ||||||||||||||
| USD | 89,277,100 | HKD | 699,287,435 | BNP | 09/28/22 | — | 51,392 | ||||||||||||||
| USD | 86,896,803 | HKD | 680,580,106 | HSB | 09/28/22 | — | 41,974 | ||||||||||||||
| USD | 38,086,871 | HKD | 298,311,611 | MSC | 09/28/22 | — | 20,100 | ||||||||||||||
| USD | 9,644,378 | HKD | 75,539,980 | SCB | 09/28/22 | — | 5,262 | ||||||||||||||
| USD | 96,416,971 | HKD | 755,234,134 | SSB | 09/28/22 | — | 58,274 | ||||||||||||||
| Total gross unrealized appreciation/depreciation on Forward Currency Contracts | $ | 42,562,258 | $ | 4,374,932 | |||||||||||||||||
The accompanying notes are an integral part of these financial statements.
Semi-Annual Report 67
The accompanying notes are an integral part of these financial statements.
68 Semi-Annual Report
| Description | Shares | Fair Value | ||||||
| Lazard Global Strategic Equity Portfolio (continued) | ||||||||
| Netherlands | 3.1% | ||||||||
| Akzo Nobel NV | 1,404 | $ | 92,760 | |||||
| Universal Music Group NV | 14,761 | 298,234 | ||||||
| 390,994 | ||||||||
| Portugal | 1.6% | ||||||||
| Energias de Portugal SA | 43,412 | 202,894 | ||||||
| South Africa | 1.2% | ||||||||
| Anglo American PLC | 4,180 | 149,247 | ||||||
| South Korea | 1.6% | ||||||||
| Osstem Implant Co., Ltd. | 2,511 | 193,972 | ||||||
| Sweden | 0.6% | ||||||||
| Volvo Car AB, Class B | 10,361 | 68,791 | ||||||
| Switzerland | 2.5% | ||||||||
| ABB, Ltd. | 8,638 | 230,860 | ||||||
| Idorsia, Ltd. (*) | 5,653 | 81,313 | ||||||
| 312,173 | ||||||||
| Taiwan | 1.9% | ||||||||
| Taiwan Semiconductor Manufacturing Co., Ltd. | 15,000 | 238,899 | ||||||
| United Kingdom | 6.1% | ||||||||
| Coca-Cola European Partners PLC | 3,479 | 178,585 | ||||||
| easyJet PLC (*) | 9,808 | 43,849 | ||||||
| Informa PLC (*) | 9,192 | 59,238 | ||||||
| Linde PLC (*) | 800 | 229,669 | ||||||
| RELX PLC | 8,959 | 243,192 | ||||||
| 754,533 | ||||||||
| United States | 56.9% | ||||||||
| Accenture PLC, Class A | 886 | 245,998 | ||||||
| Adobe, Inc. (*) | 737 | 269,786 | ||||||
| Alphabet, Inc., Class A (*) | 270 | 588,400 | ||||||
| Amphenol Corp., Class A | 3,252 | 209,364 | ||||||
| Analog Devices, Inc. | 1,779 | 259,894 | ||||||
The accompanying notes are an integral part of these financial statements.
Semi-Annual Report 69
| Description | Shares | Fair Value | ||||||
| Lazard Global Strategic Equity Portfolio (concluded) | ||||||||
| Aon PLC, Class A | 1,288 | $ | 347,348 | |||||
| Applied Materials, Inc. | 2,292 | 208,526 | ||||||
| Bank of America Corp. | 7,370 | 229,428 | ||||||
| Boston Scientific Corp. (*) | 6,914 | 257,685 | ||||||
| CyberArk Software, Ltd. (*) | 866 | 110,813 | ||||||
| Danaher Corp. | 1,154 | 292,562 | ||||||
| Dollar General Corp. | 1,201 | 294,773 | ||||||
| Helmerich & Payne, Inc. | 5,184 | 223,223 | ||||||
| Intercontinental Exchange, Inc. | 3,313 | 311,555 | ||||||
| Intuit, Inc. | 546 | 210,450 | ||||||
| IQVIA Holdings, Inc. (*) | 1,935 | 419,876 | ||||||
| Johnson & Johnson | 2,069 | 367,268 | ||||||
| Microsoft Corp. | 2,620 | 672,895 | ||||||
| S&P Global, Inc. | 971 | 327,285 | ||||||
| The Coca-Cola Co. | 3,860 | 242,833 | ||||||
| The Estee Lauder Cos., Inc., Class A | 480 | 122,242 | ||||||
| UnitedHealth Group, Inc. | 844 | 433,504 | ||||||
| Visa, Inc., Class A | 1,317 | 259,304 | ||||||
| Zoetis, Inc. | 937 | 161,061 | ||||||
| 7,066,073 | ||||||||
| Total Common Stocks (Cost $13,260,591) | 12,037,939 | |||||||
| Short-Term Investments | 3.3% | ||||||||
| State Street Institutional Treasury Money Market Fund, Premier Class, 1.04% (7 day yield) (Cost $409,062) | 409,062 | 409,062 | ||||||
| Total Investments | 100.2% (Cost $13,669,653) | $ | 12,447,001 | ||||||
| Liabilities in Excess of Cash and Other Assets | (0.2)% | (23,338 | ) | ||||||
| Net Assets | 100.0% | $ | 12,423,663 | ||||||
The accompanying notes are an integral part of these financial statements.
70 Semi-Annual Report
The accompanying notes are an integral part of these financial statements.
Semi-Annual Report 71
| Description | Shares | Fair Value | ||||||
| Lazard International Equity Advantage Portfolio (continued) | ||||||||
| Finland | 0.5% | ||||||||
| Nokia oyj. Sponsored ADR | 2,225 | $ | 10,257 | |||||
| Nordea Bank Abp | 208 | 1,832 | ||||||
| 12,089 | ||||||||
| France | 10.2% | ||||||||
| Airbus SE | 133 | 13,059 | ||||||
| AXA SA | 681 | 15,476 | ||||||
| BioMerieux | 67 | 6,544 | ||||||
| BNP Paribas SA | 67 | 3,190 | ||||||
| Capgemini SE | 145 | 25,075 | ||||||
| Carrefour SA | 685 | 12,154 | ||||||
| Cie de Saint-Gobain | 718 | 31,189 | ||||||
| Electricite de France SA | 1,099 | 8,995 | ||||||
| Gaztransport Et Technigaz SA | 21 | 2,631 | ||||||
| Kering SA | 54 | 28,056 | ||||||
| L’Oreal SA | 27 | 9,329 | ||||||
| La Francaise des Jeux SAEM | 309 | 10,765 | ||||||
| Nexity SA | 53 | 1,428 | ||||||
| Sanofi | 141 | 14,259 | ||||||
| Sartorius Stedim Biotech | 16 | 5,065 | ||||||
| Societe Generale SA | 1,679 | 36,823 | ||||||
| TotalEnergies SE | 190 | 10,015 | ||||||
| Vinci SA | 138 | 12,398 | ||||||
| 246,451 | ||||||||
| Germany | 5.3% | ||||||||
| Beiersdorf AG | 59 | 6,027 | ||||||
| Deutsche Bank AG | 1,814 | 15,806 | ||||||
| Deutsche Post AG | 1,080 | 40,463 | ||||||
| Hapag-Lloyd AG | 20 | 5,179 | ||||||
| Heidelberger Druckmaschinen AG (*) | 1,341 | 2,004 | ||||||
| Mercedes-Benz Group AG | 210 | 12,153 | ||||||
| Merck KGaA | 95 | 16,034 | ||||||
| Nemetschek SE | 253 | 15,314 | ||||||
| Rheinmetall AG | 49 | 11,315 | ||||||
| Siemens Energy AG (*) | 221 | 3,241 | ||||||
| 127,536 | ||||||||
The accompanying notes are an integral part of these financial statements.
72 Semi-Annual Report
| Description | Shares | Fair Value | ||||||
| Lazard International Equity Advantage Portfolio (continued) | ||||||||
| Hong Kong | 2.2% | ||||||||
| Jardine Matheson Holdings, Ltd. | 300 | $ | 15,790 | |||||
| Kerry Properties, Ltd. | 1,500 | 4,171 | ||||||
| Swire Pacific, Ltd., Class A | 1,500 | 9,013 | ||||||
| WH Group, Ltd. | 30,500 | 23,597 | ||||||
| 52,571 | ||||||||
| Israel | 0.4% | ||||||||
| Check Point Software Technologies, Ltd. (*) | 67 | 8,159 | ||||||
| Perion Network, Ltd. (*) | 131 | 2,382 | ||||||
| 10,541 | ||||||||
| Italy | 1.0% | ||||||||
| Banco BPM SpA | 905 | 2,597 | ||||||
| Reply SpA | 60 | 7,310 | ||||||
| UniCredit SpA | 1,579 | 15,141 | ||||||
| 25,048 | ||||||||
| Japan | 22.0% | ||||||||
| AGC, Inc. | 500 | 17,593 | ||||||
| Canon, Inc. | 700 | 15,925 | ||||||
| Chugai Pharmaceutical Co., Ltd. | 400 | 10,236 | ||||||
| Dai-ichi Life Holdings, Inc. | 800 | 14,769 | ||||||
| Daikin Industries, Ltd. | 100 | 16,050 | ||||||
| Daiwa House Industry Co., Ltd. | 600 | 13,994 | ||||||
| Electric Power Development Co., Ltd. | 1,000 | 16,535 | ||||||
| Honda Motor Co., Ltd. | 300 | 7,257 | ||||||
| Iida Group Holdings Co., Ltd. | 400 | 6,161 | ||||||
| Japan Post Holdings Co., Ltd. | 6,900 | 49,299 | ||||||
| Japan Post Insurance Co., Ltd. | 300 | 4,801 | ||||||
| Japan Tobacco, Inc. | 2,500 | 43,242 | ||||||
| Kaneka Corp. | 300 | 7,391 | ||||||
| KDDI Corp. | 200 | 6,324 | ||||||
| Marubeni Corp. | 500 | 4,513 | ||||||
| Mitsubishi Electric Corp. | 2,200 | 23,548 | ||||||
| Mitsui & Co., Ltd. | 2,200 | 48,582 | ||||||
| Mitsui Chemicals, Inc. | 400 | 8,528 | ||||||
| MS&AD Insurance Group Holdings, Inc. | 300 | 9,198 | ||||||
| NEC Corp. | 100 | 3,888 | ||||||
The accompanying notes are an integral part of these financial statements.
Semi-Annual Report 73
| Description | Shares | Fair Value | ||||||
| Lazard International Equity Advantage Portfolio (continued) | ||||||||
| Nintendo Co., Ltd. ADR | 513 | $ | 27,610 | |||||
| Nippon Telegraph & Telephone Corp. | 200 | 5,742 | ||||||
| Nishi-Nippon Financial Holdings, Inc. | 500 | 2,766 | ||||||
| Nisshinbo Holdings, Inc. | 1,400 | 10,542 | ||||||
| Okamura Corp. | 300 | 2,682 | ||||||
| Olympus Corp. | 100 | 2,011 | ||||||
| ORIX Corp. | 800 | 13,430 | ||||||
| Panasonic Holdings Corp. | 2,900 | 23,460 | ||||||
| Recruit Holdings Co., Ltd. | 100 | 2,949 | ||||||
| Shimano, Inc. ADR | 409 | 6,908 | ||||||
| Shin-Etsu Chemical Co., Ltd. | 133 | 15,014 | ||||||
| SKY Perfect JSAT Holdings, Inc. | 1,000 | 3,981 | ||||||
| Softbank Corp. | 2,000 | 22,198 | ||||||
| Sumco Corp. | 600 | 7,721 | ||||||
| Sumitomo Chemical Co., Ltd. | 4,600 | 17,957 | ||||||
| Sumitomo Mitsui Financial Group, Inc. | 100 | 2,970 | ||||||
| The 77 Bank, Ltd. | 200 | 2,677 | ||||||
| Tokyo Electron, Ltd. Sponsored ADR | 184 | 14,998 | ||||||
| Yamaha Corp. | 400 | 16,464 | ||||||
| ZOZO, Inc. | 100 | 1,804 | ||||||
| 531,718 | ||||||||
| Luxembourg | 0.2% | ||||||||
| Eurofins Scientific SE | 57 | 4,506 | ||||||
| Malta | 0.0% | ||||||||
| Kindred Group PLC | 133 | 1,106 | ||||||
| Netherlands | 8.4% | ||||||||
| Adyen NV (*) | 15 | 22,050 | ||||||
| Aegon NV | 1,718 | 7,488 | ||||||
| ASML Holding NV | 100 | 48,263 | ||||||
| Koninklijke Ahold Delhaize NV | 237 | 6,177 | ||||||
| NN Group NV | 323 | 14,773 | ||||||
| Shell PLC | 2,664 | 69,518 | ||||||
| Wolters Kluwer NV | 360 | 35,021 | ||||||
| 203,290 | ||||||||
The accompanying notes are an integral part of these financial statements.
74 Semi-Annual Report
| Description | Shares | Fair Value | ||||||
| Lazard International Equity Advantage Portfolio (continued) | ||||||||
| New Zealand | 0.1% | ||||||||
| Fisher & Paykel Healthcare Corp., Ltd. | 129 | $ | 1,607 | |||||
| Norway | 0.4% | ||||||||
| Aker BP ASA | 202 | 6,980 | ||||||
| Grieg Seafood ASA | 173 | 2,466 | ||||||
| 9,446 | ||||||||
| Portugal | 0.8% | ||||||||
| Jeronimo Martins SGPS SA | 856 | 18,606 | ||||||
| Singapore | 1.5% | ||||||||
| DBS Group Holdings, Ltd. | 700 | 14,983 | ||||||
| Jardine Cycle & Carriage, Ltd. | 600 | 12,226 | ||||||
| STMicroelectronics NV | 166 | 5,278 | ||||||
| Yangzijiang Financial Holding Ltd. (*) | 11,100 | 3,276 | ||||||
| 35,763 | ||||||||
| South Africa | 0.7% | ||||||||
| Anglo American PLC | 449 | 16,031 | ||||||
| Spain | 4.6% | ||||||||
| Banco de Sabadell SA | 13,639 | 11,008 | ||||||
| Banco Santander SA | 13,142 | 37,060 | ||||||
| Iberdrola SA | 3,601 | 37,367 | ||||||
| Industria de Diseno Textil SA | 909 | 20,586 | ||||||
| Laboratorios Farmaceuticos Rovi SA | 93 | 5,729 | ||||||
| 111,750 | ||||||||
| Sweden | 2.3% | ||||||||
| Betsson AB | 655 | 3,960 | ||||||
| Electrolux AB | 90 | 1,212 | ||||||
| Evolution AB | 29 | 2,640 | ||||||
| Lundin Energy AB | 406 | 277 | ||||||
| Lundin Energy MergerCo AB (¢) | 406 | 15,757 | ||||||
| Telefonaktiebolaget LM Ericsson, B Shares | 2,460 | 18,361 | ||||||
| Volvo Car AB, Class B | 2,089 | 13,870 | ||||||
| 56,077 | ||||||||
The accompanying notes are an integral part of these financial statements.
Semi-Annual Report 75
| Description | Shares | Fair Value | ||||||
| Lazard International Equity Advantage Portfolio (continued) | ||||||||
| Switzerland | 7.1% | ||||||||
| Novartis AG | 249 | $ | 21,064 | |||||
| Roche Holding AG | 256 | 85,460 | ||||||
| Sonova Holding AG | 8 | 2,548 | ||||||
| UBS Group AG | 3,125 | 50,444 | ||||||
| Zurich Insurance Group AG | 29 | 12,622 | ||||||
| 172,138 | ||||||||
| United Kingdom | 9.9% | ||||||||
| Barclays PLC | 5,312 | 9,945 | ||||||
| BP PLC Sponsored ADR | 333 | 9,441 | ||||||
| Compass Group PLC | 128 | 2,621 | ||||||
| Computacenter PLC | 87 | 2,487 | ||||||
| Halfords Group PLC | 585 | 1,024 | ||||||
| IMI PLC | 142 | 2,028 | ||||||
| Imperial Brands PLC | 1,066 | 23,826 | ||||||
| Natwest Group PLC | 4,651 | 12,372 | ||||||
| RELX PLC | 52 | 1,404 | ||||||
| Safestore Holdings PLC REIT | 409 | 5,286 | ||||||
| SSE PLC | 1,486 | 29,378 | ||||||
| Standard Chartered PLC | 5,387 | 40,617 | ||||||
| Unilever PLC | 1,306 | 59,458 | ||||||
| Virgin Money UK PLC | 1,115 | 1,776 | ||||||
| Vodafone Group PLC | 24,430 | 37,687 | ||||||
| 239,350 | ||||||||
| United States | 6.1% | ||||||||
| GSK PLC | 3,565 | 76,656 | ||||||
| International Game Technology PLC | 336 | 6,236 | ||||||
| Nestle SA | 135 | 15,839 | ||||||
| Schneider Electric SE | 84 | 9,951 | ||||||
| Stellantis NV | 3,136 | 39,208 | ||||||
| 147,890 | ||||||||
| Total Common Stocks (Cost $2,594,913) | 2,365,804 | |||||||
The accompanying notes are an integral part of these financial statements.
76 Semi-Annual Report
| Description | Shares | Fair Value | ||||||
| Lazard International Equity Advantage Portfolio (concluded) | ||||||||
| Preferred Stocks | 0.9% | ||||||||
| Germany | 0.9% | ||||||||
| Bayerische Motoren Werke AG | 114 | $ | 8,076 | |||||
| Sartorius AG | 22 | 7,685 | ||||||
| Volkswagen AG | 53 | 7,077 | ||||||
| Total Preferred Stocks (Cost $26,491) | 22,838 | |||||||
| Short-Term Investments | 0.3% | ||||||||
| State Street Institutional Treasury Money Market Fund, Premier Class, 1.04% (7 day yield) (Cost $6,476) | 6,476 | 6,476 | ||||||
| Total Investments | 99.0% (Cost $2,627,880) | $ | 2,395,118 | ||||||
| Cash and Other Assets in Excess of Liabilities | 1.0% | 23,004 | |||||||
| Net Assets | 100.0% | $ | 2,418,122 | ||||||
The accompanying notes are an integral part of these financial statements.
Semi-Annual Report 77
The accompanying notes are an integral part of these financial statements.
78 Semi-Annual Report
| Description | Shares | Fair Value | ||||||
| Lazard International Equity Portfolio (continued) | ||||||||
| Germany | 8.1% | ||||||||
| Continental AG | 232,211 | $ | 16,182,072 | |||||
| Infineon Technologies AG | 470,159 | 11,375,616 | ||||||
| Merck KGaA | 136,993 | 23,121,519 | ||||||
| MTU Aero Engines AG | 121,873 | 22,184,831 | ||||||
| Rheinmetall AG | 64,231 | 14,831,997 | ||||||
| Vonovia SE | 348,331 | 10,734,656 | ||||||
| 98,430,691 | ||||||||
| Hong Kong | 0.9% | ||||||||
| Prudential PLC | 901,566 | 11,214,565 | ||||||
| India | 1.3% | ||||||||
| Reliance Industries, Ltd. | 490,511 | 16,151,006 | ||||||
| Ireland | 3.3% | ||||||||
| ICON PLC (*) | 111,739 | 24,213,841 | ||||||
| Ryanair Holdings PLC Sponsored ADR (*) | 229,196 | 15,413,431 | ||||||
| 39,627,272 | ||||||||
| Israel | 1.4% | ||||||||
| Bank Leumi Le-Israel BM | 1,898,681 | 16,991,008 | ||||||
| Italy | 1.5% | ||||||||
| Enel SpA | 3,195,115 | 17,561,604 | ||||||
| Japan | 15.4% | ||||||||
| Asics Corp. | 925,900 | 16,757,204 | ||||||
| Bandai Namco Holdings, Inc. | 247,400 | 17,479,438 | ||||||
| Daikin Industries, Ltd. | 102,600 | 16,466,859 | ||||||
| Disco Corp. | 71,800 | 16,913,722 | ||||||
| Hitachi, Ltd. | 240,600 | 11,399,922 | ||||||
| Makita Corp. | 369,800 | 9,227,755 | ||||||
| MatsukiyoCocokara & Co. | 509,100 | 20,590,266 | ||||||
| Nexon Co., Ltd. | 519,082 | 10,635,471 | ||||||
The accompanying notes are an integral part of these financial statements.
Semi-Annual Report 79
| Description | Shares | Fair Value | ||||||
| Lazard International Equity Portfolio (continued) | ||||||||
| Olympus Corp. | 1,101,600 | $ | 22,154,025 | |||||
| Shimano, Inc. | 79,000 | 13,363,520 | ||||||
| Suzuki Motor Corp. | 485,100 | 15,262,471 | ||||||
| Yamaha Corp. | 401,500 | 16,526,188 | ||||||
| 186,776,841 | ||||||||
| Mexico | 1.4% | ||||||||
| Arca Continental SAB de CV | 2,489,912 | 16,405,845 | ||||||
| Netherlands | 6.1% | ||||||||
| Akzo Nobel NV | 286,117 | 18,903,368 | ||||||
| Koninklijke DSM NV | 125,419 | 18,117,739 | ||||||
| Universal Music Group NV | 906,098 | 18,306,973 | ||||||
| Wolters Kluwer NV | 196,506 | 19,116,415 | ||||||
| 74,444,495 | ||||||||
| Norway | 2.4% | ||||||||
| Equinor ASA | 439,940 | 15,303,502 | ||||||
| Telenor ASA | 1,063,689 | 14,169,477 | ||||||
| 29,472,979 | ||||||||
| Portugal | 1.4% | ||||||||
| Galp Energia SGPS SA | 1,484,520 | 17,401,613 | ||||||
| Singapore | 1.4% | ||||||||
| DBS Group Holdings, Ltd. | 797,520 | 17,070,438 | ||||||
| South Africa | 1.5% | ||||||||
| Anglo American PLC | 516,154 | 18,429,235 | ||||||
| South Korea | 1.6% | ||||||||
| Osstem Implant Co., Ltd. | 91,543 | 7,071,598 | ||||||
| SK Hynix, Inc. | 167,290 | 11,701,281 | ||||||
| 18,772,879 | ||||||||
The accompanying notes are an integral part of these financial statements.
80 Semi-Annual Report
| Description | Shares | Fair Value | ||||||
| Lazard International Equity Portfolio (continued) | ||||||||
| Spain | 1.2% | ||||||||
| Industria de Diseno Textil SA | 644,590 | $ | 14,598,310 | |||||
| Sweden | 1.0% | ||||||||
| Sandvik AB | 762,268 | 12,374,794 | ||||||
| Switzerland | 3.7% | ||||||||
| ABB, Ltd. | 854,666 | 22,841,848 | ||||||
| Roche Holding AG | 66,627 | 22,241,935 | ||||||
| 45,083,783 | ||||||||
| United Kingdom | 12.9% | ||||||||
| 3i Group PLC | 1,058,490 | 14,299,820 | ||||||
| Barclays PLC | 8,568,082 | 16,040,782 | ||||||
| BP PLC | 2,940,760 | 13,850,651 | ||||||
| Coca-Cola Europacific Partners PLC | 405,254 | 20,802,635 | ||||||
| Compass Group PLC | 826,850 | 16,927,978 | ||||||
| Petershill Partners PLC | 2,410,130 | 6,308,248 | ||||||
| RELX PLC | 1,221,461 | 32,984,297 | ||||||
| Smith & Nephew PLC | 1,172,724 | 16,395,995 | ||||||
| Unilever PLC | 420,315 | 19,130,283 | ||||||
| 156,740,689 | ||||||||
| United States | 4.5% | ||||||||
| Aon PLC, Class A | 119,232 | 32,154,486 | ||||||
| BRP, Inc. | 135,614 | 8,346,287 | ||||||
| Ferguson PLC | 120,329 | 13,473,390 | ||||||
| 53,974,163 | ||||||||
| Total Common Stocks (Cost $1,171,295,923) | 1,199,432,734 | |||||||
The accompanying notes are an integral part of these financial statements.
Semi-Annual Report 81
| Description | Shares | Fair Value | ||||||
| Lazard International Equity Portfolio (concluded) | ||||||||
| Short-Term Investments | 1.8% | ||||||||
| State Street Institutional Treasury Money Market Fund, Premier Class, 1.04% (7 day yield) (Cost $21,684,274) | 21,684,274 | $ | 21,684,274 | |||||
| Total Investments | 100.7% (Cost $1,192,980,197) | $ | 1,221,117,008 | ||||||
| Liabilities in Excess of Cash and Other Assets | (0.7)% | (7,927,652 | ) | ||||||
| Net Assets | 100.0% | $ | 1,213,189,356 | ||||||
The accompanying notes are an integral part of these financial statements.
82 Semi-Annual Report
The accompanying notes are an integral part of these financial statements.
Semi-Annual Report 83
| Description | Shares | Fair Value | ||||||
| Lazard International Equity Select Portfolio (continued) | ||||||||
| Germany | 5.9% | ||||||||
| Continental AG | 11,108 | $ | 774,083 | |||||
| Infineon Technologies AG | 18,573 | 449,378 | ||||||
| Merck KGaA | 7,147 | 1,206,262 | ||||||
| MTU Aero Engines AG | 5,109 | 930,003 | ||||||
| Vonovia SE | 15,008 | 462,508 | ||||||
| 3,822,234 | ||||||||
| Hong Kong | 2.9% | ||||||||
| AIA Group, Ltd. | 135,000 | 1,482,861 | ||||||
| Prudential PLC | 33,070 | 411,357 | ||||||
| 1,894,218 | ||||||||
| India | 4.1% | ||||||||
| ICICI Bank, Ltd. Sponsored ADR | 81,607 | 1,447,708 | ||||||
| Reliance Industries, Ltd. | 37,365 | 1,230,314 | ||||||
| 2,678,022 | ||||||||
| Indonesia | 2.3% | ||||||||
| PT Bank Mandiri (Persero) Tbk | 1,784,900 | 952,905 | ||||||
| PT Telkom Indonesia (Persero) Tbk ADR | 20,984 | 567,407 | ||||||
| 1,520,312 | ||||||||
| Ireland | 2.3% | ||||||||
| ICON PLC (*) | 3,764 | 815,659 | ||||||
| Ryanair Holdings PLC Sponsored ADR (*) | 10,411 | 700,140 | ||||||
| 1,515,799 | ||||||||
| Japan | 10.2% | ||||||||
| Bandai Namco Holdings, Inc. | 13,800 | 975,005 | ||||||
| Daikin Industries, Ltd. | 5,800 | 930,875 | ||||||
| Disco Corp. | 3,800 | 895,155 | ||||||
| Makita Corp. | 30,800 | 768,564 | ||||||
| Nomura Research Institute, Ltd. N Ap | 27,300 | 727,040 | ||||||
| Olympus Corp. | 60,400 | 1,214,691 | ||||||
The accompanying notes are an integral part of these financial statements.
84 Semi-Annual Report
| Description | Shares | Fair Value | ||||||
| Lazard International Equity Select Portfolio (continued) | ||||||||
| Shimano, Inc. | 4,300 | $ | 727,381 | |||||
| Suzuki Motor Corp. | 14,200 | 446,768 | ||||||
| 6,685,479 | ||||||||
| Mexico | 1.3% | ||||||||
| Grupo Financiero Banorte SAB de CV, Class O | 149,600 | 834,463 | ||||||
| Netherlands | 6.2% | ||||||||
| Akzo Nobel NV | 13,589 | 897,807 | ||||||
| IMCD NV | 2,354 | 325,225 | ||||||
| Koninklijke DSM NV | 7,525 | 1,087,044 | ||||||
| Universal Music Group NV | 39,368 | 795,398 | ||||||
| Wolters Kluwer NV | 9,768 | 950,247 | ||||||
| 4,055,721 | ||||||||
| Norway | 2.1% | ||||||||
| Equinor ASA | 20,145 | 700,752 | ||||||
| Telenor ASA | 50,126 | 667,732 | ||||||
| 1,368,484 | ||||||||
| Singapore | 1.3% | ||||||||
| DBS Group Holdings, Ltd. | 38,300 | 819,789 | ||||||
| South Africa | 1.8% | ||||||||
| Anglo American PLC | 18,104 | 646,402 | ||||||
| Mr Price Group, Ltd. | 46,201 | 504,713 | ||||||
| 1,151,115 | ||||||||
| South Korea | 2.6% | ||||||||
| KB Financial Group, Inc. | 22,469 | 834,252 | ||||||
| SK Hynix, Inc. | 12,050 | 842,850 | ||||||
| 1,677,102 | ||||||||
The accompanying notes are an integral part of these financial statements.
Semi-Annual Report 85
| Description | Shares | Fair Value | ||||||
| Lazard International Equity Select Portfolio (continued) | ||||||||
| Switzerland | 4.7% | ||||||||
| ABB, Ltd. | 43,430 | $ | 1,160,713 | |||||
| Cie Financiere Richemont SA, Class A | 5,355 | 570,286 | ||||||
| Roche Holding AG | 4,052 | 1,352,670 | ||||||
| 3,083,669 | ||||||||
| Taiwan | 1.9% | ||||||||
| Taiwan Semiconductor Manufacturing Co., Ltd. | 76,000 | 1,210,424 | ||||||
| United Kingdom | 10.9% | ||||||||
| Barclays PLC | 307,342 | 575,392 | ||||||
| BP PLC | 430,574 | 2,027,955 | ||||||
| Compass Group PLC | 56,725 | 1,161,323 | ||||||
| Linde PLC (*) | 1,756 | 504,123 | ||||||
| RELX PLC | 70,728 | 1,909,937 | ||||||
| Unilever PLC | 19,929 | 907,052 | ||||||
| 7,085,782 | ||||||||
| United States | 5.5% | ||||||||
| Accenture PLC, Class A | 3,182 | 883,482 | ||||||
| Aon PLC, Class A | 5,574 | 1,503,197 | ||||||
| Clarivate PLC (*) | 42,848 | 593,873 | ||||||
| Ferguson PLC | 5,736 | 642,267 | ||||||
| 3,622,819 | ||||||||
| Total Common Stocks (Cost $63,075,877) | 62,168,409 | |||||||
| Preferred Stocks | 0.2% | ||||||||
| Germany | 0.2% | ||||||||
| Volkswagen AG (Cost $147,351) | 938 | 125,256 | ||||||
The accompanying notes are an integral part of these financial statements.
86 Semi-Annual Report
| Description | Shares | Fair Value | ||||||
| Lazard International Equity Select Portfolio (concluded) | ||||||||
| Short-Term Investments | 4.2% | ||||||||
| State Street Institutional Treasury Money Market Fund, Premier Class, 1.04% (7 day yield) (Cost $2,745,664) | 2,745,664 | $ | 2,745,664 | |||||
| Total Investments | 99.6% (Cost $65,968,892) | $ | 65,039,329 | ||||||
| Cash and Other Assets in Excess of Liabilities | 0.4% | 284,476 | |||||||
| Net Assets | 100.0% | $ | 65,323,805 | ||||||
The accompanying notes are an integral part of these financial statements.
Semi-Annual Report 87
The accompanying notes are an integral part of these financial statements.
88 Semi-Annual Report
| Description | Shares | Fair Value | ||||||
| Lazard International Quality Growth Portfolio (continued) | ||||||||
| India | 3.2% | ||||||||
| HDFC Bank, Ltd. ADR | 66,786 | $ | 3,670,559 | |||||
| Israel | 2.4% | ||||||||
| Check Point Software Technologies, Ltd. (*) | 22,885 | 2,786,935 | ||||||
| Japan | 5.7% | ||||||||
| Pigeon Corp. | 45,400 | 623,188 | ||||||
| Shimano, Inc. | 8,100 | 1,370,184 | ||||||
| SMS Co., Ltd. | 84,700 | 1,671,796 | ||||||
| Toei Animation Co., Ltd. | 21,800 | 1,737,461 | ||||||
| Workman Co., Ltd. | 27,900 | 1,090,911 | ||||||
| 6,493,540 | ||||||||
| Netherlands | 8.3% | ||||||||
| ASML Holding NV | 9,719 | 4,690,661 | ||||||
| Universal Music Group NV | 107,491 | 2,171,768 | ||||||
| Wolters Kluwer NV | 27,144 | 2,640,611 | ||||||
| 9,503,040 | ||||||||
| Norway | 2.3% | ||||||||
| AutoStore Holdings, Ltd. | 490,401 | 701,911 | ||||||
| Gjensidige Forsikring ASA | 95,525 | 1,940,045 | ||||||
| 2,641,956 | ||||||||
| South Africa | 2.4% | ||||||||
| Clicks Group, Ltd. | 163,953 | 2,767,325 | ||||||
| Spain | 1.7% | ||||||||
| Industria de Diseno Textil SA | 86,937 | 1,968,900 | ||||||
| Sweden | 4.6% | ||||||||
| Assa Abloy AB, Class B | 126,900 | 2,715,653 | ||||||
| Hexagon AB, B Shares | 242,545 | 2,522,024 | ||||||
| 5,237,677 | ||||||||
The accompanying notes are an integral part of these financial statements.
Semi-Annual Report 89
| Description | Shares | Fair Value | ||||||
| Lazard International Quality Growth Portfolio (continued) | ||||||||
| Switzerland | 2.9% | ||||||||
| Partners Group Holding AG | 3,672 | $ | 3,312,532 | |||||
| Taiwan | 3.3% | ||||||||
| Taiwan Semiconductor Manufacturing Co., Ltd. Sponsored ADR | 46,197 | 3,776,605 | ||||||
| United Kingdom | 16.0% | ||||||||
| Dechra Pharmaceuticals PLC | 45,224 | 1,904,677 | ||||||
| Diageo PLC | 77,223 | 3,331,541 | ||||||
| Diploma PLC | 29,575 | 802,167 | ||||||
| Intertek Group PLC | 41,176 | 2,109,961 | ||||||
| London Stock Exchange Group PLC | 28,436 | 2,643,387 | ||||||
| RELX PLC | 160,479 | 4,356,203 | ||||||
| Unilever PLC | 69,278 | 3,154,015 | ||||||
| 18,301,951 | ||||||||
| United States | 5.7% | ||||||||
| Aon PLC, Class A | 17,003 | 4,585,369 | ||||||
| BRP, Inc. | 31,284 | 1,925,356 | ||||||
| 6,510,725 | ||||||||
| Total Common Stocks (Cost $132,028,158) | 109,541,794 | |||||||
| Preferred Stocks | 1.4% | ||||||||
| Germany | 1.4% | ||||||||
| Sartorius AG (Cost $1,837,103) | 4,592 | 1,604,015 | ||||||
| Short-Term Investments | 2.5% | ||||||||
| State Street Institutional Treasury Money Market Fund, Premier Class, 1.04% (7 day yield) (Cost $2,809,520) | 2,809,520 | 2,809,520 | ||||||
The accompanying notes are an integral part of these financial statements.
90 Semi-Annual Report
| Description | Shares | Fair Value | ||||||
| Lazard International Quality Growth Portfolio (concluded) | ||||||||
| Total Investments | 99.7% (Cost $136,674,781) | $ | 113,955,329 | ||||||
| Cash and Other Assets in Excess of Liabilities | 0.3% | 289,979 | |||||||
| Net Assets | 100.0% | $ | 114,245,308 | ||||||
The accompanying notes are an integral part of these financial statements.
Semi-Annual Report 91
The accompanying notes are an integral part of these financial statements.
92 Semi-Annual Report
| Description | Shares | Fair Value | ||||||
| Lazard International Small Cap Equity Portfolio (continued) | ||||||||
| France | 1.5% | ||||||||
| Gaztransport Et Technigaz SA | 2,210 | $ | 276,944 | |||||
| Germany | 9.7% | ||||||||
| Aroundtown SA | 34,688 | 110,296 | ||||||
| Covestro AG | 6,296 | 217,599 | ||||||
| CTS Eventim AG & Co. KGaA (*) | 3,057 | 160,181 | ||||||
| Dermapharm Holding SE | 4,025 | 200,420 | ||||||
| flatexDEGIRO AG (*) | 8,859 | 84,298 | ||||||
| Hensoldt AG | 10,587 | 267,405 | ||||||
| JOST Werke AG | 5,727 | 213,825 | ||||||
| LEG Immobilien SE | 2,234 | 185,204 | ||||||
| Sirius Real Estate, Ltd. | 164,040 | 178,163 | ||||||
| Stabilus SE | 2,919 | 142,756 | ||||||
| 1,760,147 | ||||||||
| Greece | 1.4% | ||||||||
| JUMBO SA | 17,327 | 252,394 | ||||||
| Ireland | 1.9% | ||||||||
| Dalata Hotel Group PLC (*) | 56,097 | 204,299 | ||||||
| Uniphar PLC | 45,243 | 137,480 | ||||||
| 341,779 | ||||||||
| Italy | 5.7% | ||||||||
| Ariston Holding NV | 18,572 | 152,224 | ||||||
| Banca Generali SpA | 5,845 | 166,217 | ||||||
| Italgas SpA | 52,616 | 307,263 | ||||||
| Sesa SpA | 1,379 | 175,229 | ||||||
| Tinexta Spa | 9,859 | 231,349 | ||||||
| 1,032,282 | ||||||||
| Japan | 24.7% | ||||||||
| Ariake Japan Co., Ltd. | 4,000 | 164,168 | ||||||
| ARTERIA Networks Corp. | 16,200 | 145,975 | ||||||
| Bell System24 Holdings, Inc. | 21,200 | 216,577 | ||||||
The accompanying notes are an integral part of these financial statements.
Semi-Annual Report 93
| Description | Shares | Fair Value | ||||||
| Lazard International Small Cap Equity Portfolio (continued) | ||||||||
| Daiseki Co., Ltd. | 7,720 | $ | 241,473 | |||||
| Digital Garage, Inc. | 6,700 | 181,423 | ||||||
| GMO internet, Inc. | 10,200 | 173,756 | ||||||
| Hulic Co., Ltd. | 28,400 | 219,971 | ||||||
| JAFCO Group Co., ltd. | 18,300 | 220,889 | ||||||
| MatsukiyoCocokara & Co. | 6,800 | �� | 275,022 | |||||
| Nihon Kohden Corp. | 9,200 | 188,235 | ||||||
| Nippon Gas Co., Ltd. | 18,000 | 255,367 | ||||||
| Nippon Shinyaku Co., Ltd. | 3,100 | 188,631 | ||||||
| Open House Group Co., Ltd. | 5,000 | 199,152 | ||||||
| Pigeon Corp. | 11,800 | 161,974 | ||||||
| Relo Group, Inc. | 14,800 | 238,861 | ||||||
| Roland Corp. | 6,600 | 196,378 | ||||||
| Rorze Corp. | 3,100 | 191,737 | ||||||
| TechnoPro Holdings, Inc. | 10,135 | 203,224 | ||||||
| Trend Micro, Inc. | 4,700 | 228,775 | ||||||
| Trusco Nakayama Corp. | 9,400 | 118,995 | ||||||
| USS Co., Ltd. | 14,200 | 245,462 | ||||||
| Zenkoku Hosho Co., Ltd. | 6,742 | 211,302 | ||||||
| 4,467,347 | ||||||||
| Jersey | 1.2% | ||||||||
| JTC PLC | 31,342 | 225,211 | ||||||
| Netherlands | 5.0% | ||||||||
| Aalberts NV | 6,292 | 247,393 | ||||||
| Arcadis NV | 8,902 | 301,507 | ||||||
| ASM International NV | 620 | 156,573 | ||||||
| Van Lanschot Kempen NV | 8,650 | 201,800 | ||||||
| 907,273 | ||||||||
| New Zealand | 0.9% | ||||||||
| Freightways, Ltd. | 27,757 | 158,465 | ||||||
| Norway | 1.3% | ||||||||
| Crayon Group Holding ASA (*) | 17,976 | 229,839 | ||||||
The accompanying notes are an integral part of these financial statements.
94 Semi-Annual Report
| Description | Shares | Fair Value | ||||||
| Lazard International Small Cap Equity Portfolio (continued) | ||||||||
| Portugal | 0.8% | ||||||||
| Galp Energia SGPS SA | 12,996 | $ | 152,340 | |||||
| Spain | 4.1% | ||||||||
| Bankinter SA | 85,992 | 537,011 | ||||||
| Linea Directa Aseguradora SA Cia de Seguros y Reaseguros | 156,896 | 206,970 | ||||||
| 743,981 | ||||||||
| Sweden | 2.2% | ||||||||
| Cibus Nordic Real Estate AB | 7,805 | 120,516 | ||||||
| Lindab International AB | 10,127 | 146,960 | ||||||
| Synsam AB | 23,307 | 135,844 | ||||||
| 403,320 | ||||||||
| Switzerland | 1.0% | ||||||||
| Logitech International SA | 3,609 | 187,890 | ||||||
| United Kingdom | 17.3% | ||||||||
| Auto Trader Group PLC | 25,991 | 175,757 | ||||||
| Britvic PLC | 20,873 | 206,239 | ||||||
| Bytes Technology Group PLC | 23,392 | 119,152 | ||||||
| ConvaTec Group PLC | 102,254 | 280,700 | ||||||
| Dr. Martens Plc | 56,086 | 162,331 | ||||||
| Genuit Group. PLC | 40,350 | 189,109 | ||||||
| IG Group Holdings PLC | 15,947 | 134,632 | ||||||
| JD Sports Fashion PLC | 116,067 | 163,240 | ||||||
| Jet2 PLC (*) | 18,470 | 203,911 | ||||||
| Life Science REIT PLC | 195,426 | 228,374 | ||||||
| Marlowe PLC (*) | 22,050 | 198,616 | ||||||
| Pennon Group PLC | 14,741 | 171,494 | ||||||
| RS GROUP PLC | 18,925 | 200,367 | ||||||
| Smart Metering Systems PLC | 18,810 | 187,543 | ||||||
| Synthomer PLC | 65,056 | 178,323 | ||||||
| Tate & Lyle PLC | 18,114 | 165,253 | ||||||
| Weir Group PLC | 10,045 | 166,683 | ||||||
| 3,131,724 | ||||||||
The accompanying notes are an integral part of these financial statements.
Semi-Annual Report 95
| Description | Shares | Fair Value | ||||||
| Lazard International Small Cap Equity Portfolio (concluded) | ||||||||
| United States | 0.8% | ||||||||
| BRP, Inc. | 2,486 | $ | 153,000 | |||||
| Total Common Stocks (Cost $20,338,782) | 17,512,813 | |||||||
| Short-Term Investments | 2.2% | ||||||||
| State Street Institutional Treasury Money Market Fund, Premier Class, 1.04% (7 day yield) (Cost $389,415) | 389,415 | 389,415 | ||||||
| Total Investments | 99.0% (Cost $20,728,197) | $ | 17,902,228 | ||||||
| Cash and Other Assets in Excess of Liabilities | 1.0% | 185,862 | |||||||
| Net Assets | 100.0% | $ | 18,088,090 | ||||||
The accompanying notes are an integral part of these financial statements.
96 Semi-Annual Report
The accompanying notes are an integral part of these financial statements.
Semi-Annual Report 97
| Description | Shares | Fair Value | ||||||
| Lazard International Strategic Equity Portfolio (continued) | ||||||||
| Germany | 5.7% | ||||||||
| Continental AG | 1,072,596 | $ | 74,745,925 | |||||
| Infineon Technologies AG | 3,385,761 | 81,919,344 | ||||||
| Merck KGaA | 430,918 | 72,729,837 | ||||||
| Vonovia SE | 1,710,511 | 52,713,503 | ||||||
| 282,108,609 | ||||||||
| India | 1.1% | ||||||||
| Housing Development Finance Corp., Ltd. | 2,030,275 | 55,965,127 | ||||||
| Ireland | 2.6% | ||||||||
| ICON PLC (*) | 254,991 | 55,256,550 | ||||||
| Ryanair Holdings PLC Sponsored ADR (*) | 1,072,044 | 72,094,959 | ||||||
| 127,351,509 | ||||||||
| Israel | 2.8% | ||||||||
| Bank Leumi Le-Israel BM | 15,289,198 | 136,820,711 | ||||||
| Italy | 1.2% | ||||||||
| Enel SpA | 11,142,395 | 61,242,970 | ||||||
| Japan | 11.1% | ||||||||
| BayCurrent Consulting, Inc. | 249,000 | 66,344,680 | ||||||
| Daikin Industries, Ltd. | 525,500 | 84,340,490 | ||||||
| Kobe Bussan Co., Ltd. | 2,218,000 | 54,294,398 | ||||||
| Makita Corp. | 839,071 | 20,937,647 | ||||||
| Olympus Corp. | 4,507,200 | 90,643,266 | ||||||
| Shimano, Inc. | 299,300 | 50,629,135 | ||||||
| Suzuki Motor Corp. | 1,493,272 | 46,982,107 | ||||||
| Tokyo Electron, Ltd. | 196,600 | 63,769,698 | ||||||
| Yamaha Corp. | 1,621,672 | 66,749,827 | ||||||
| 544,691,248 | ||||||||
| Mexico | 1.6% | ||||||||
| Arca Continental SAB de CV | 11,618,300 | 76,552,115 | ||||||
The accompanying notes are an integral part of these financial statements.
98 Semi-Annual Report
| Description | Shares | Fair Value | ||||||
| Lazard International Strategic Equity Portfolio (continued) | ||||||||
| Netherlands | 3.8% | ||||||||
| Akzo Nobel NV | 1,329,626 | $ | 87,846,616 | |||||
| Universal Music Group NV | 4,767,175 | 96,316,894 | ||||||
| 184,163,510 | ||||||||
| South Korea | 0.2% | ||||||||
| NHN KCP Corp. (*) | 927,255 | 8,954,663 | ||||||
| Spain | 3.8% | ||||||||
| Bankinter SA | 11,809,107 | 73,746,564 | ||||||
| Industria de Diseno Textil SA | 3,066,261 | 69,442,947 | ||||||
| Linea Directa Aseguradora SA Cia de Seguros y Reaseguros | 11,809,107 | 15,578,033 | ||||||
| Siemens Gamesa Renewable Energy SA (*) | 1,538,806 | 29,051,255 | ||||||
| 187,818,799 | ||||||||
| Sweden | 1.7% | ||||||||
| Hexagon AB, B Shares | 5,664,783 | 58,903,388 | ||||||
| Volvo Car AB, Class B | 3,743,752 | 24,856,226 | ||||||
| 83,759,614 | ||||||||
| Switzerland | 2.9% | ||||||||
| ABB, Ltd. | 4,632,508 | 123,808,652 | ||||||
| Idorsia, Ltd. (*) | 1,425,602 | 20,505,892 | ||||||
| 144,314,544 | ||||||||
| Taiwan | 0.8% | ||||||||
| Taiwan Semiconductor Manufacturing Co., Ltd. | 2,609,000 | 41,552,565 | ||||||
| United Kingdom | 13.4% | ||||||||
| Coca-Cola European Partners PLC | 2,936,473 | 150,736,023 | ||||||
| Compass Group PLC | 4,876,733 | 99,840,638 | ||||||
| Informa PLC (*) | 7,692,296 | 49,572,989 | ||||||
| Linde PLC (*) | 361,091 | 103,664,239 | ||||||
The accompanying notes are an integral part of these financial statements.
Semi-Annual Report 99
| Description | Shares | Fair Value | ||||||
| Lazard International Strategic Equity Portfolio (concluded) | ||||||||
| Petershill Partners PLC | 7,804,388 | $ | 20,427,120 | |||||
| RELX PLC | 6,195,105 | 167,292,435 | ||||||
| Smith & Nephew PLC | 4,749,347 | 66,401,189 | ||||||
| 657,934,633 | ||||||||
| United States | 8.3% | ||||||||
| Accenture PLC, Class A | 381,035 | 105,794,368 | ||||||
| Aon PLC, Class A | 773,629 | 208,632,269 | ||||||
| BRP, Inc. | 681,236 | 41,926,286 | ||||||
| Medtronic PLC | 550,804 | 49,434,659 | ||||||
| 405,787,582 | ||||||||
| Total Common Stocks (Cost $4,534,003,536) | 4,824,725,969 | |||||||
| Short-Term Investments | 1.1% | ||||||||
| State Street Institutional Treasury Money Market Fund, Premier Class, 1.04% (7 day yield) (Cost $54,373,698) | 54,373,698 | 54,373,698 | ||||||
| Total Investments | 99.3% (Cost $4,588,377,234) | $ | 4,879,099,667 | ||||||
| Cash and Other Assets in Excess of Liabilities | 0.7% | 35,663,608 | |||||||
| Net Assets | 100.0% | $ | 4,914,763,275 | ||||||
The accompanying notes are an integral part of these financial statements.
100 Semi-Annual Report
The accompanying notes are an integral part of these financial statements.
Semi-Annual Report 101
| Description | Shares | Fair Value | ||||||
| Lazard Managed Equity Volatility Portfolio (continued) | ||||||||
| Israel | 0.2% | ||||||||
| Bezeq The Israeli Telecommunication Corp., Ltd. | 37,332 | $ | 58,171 | |||||
| Japan | 13.0% | ||||||||
| Canon, Inc. | 3,200 | 72,800 | ||||||
| Daicel Corp. | 12,600 | 77,976 | ||||||
| Daiwa House Industry Co., Ltd. | 5,400 | 125,943 | ||||||
| Electric Power Development Co., Ltd. | 10,400 | 171,966 | ||||||
| ENEOS Holdings, Inc. | 17,200 | 64,930 | ||||||
| FUJIFILM Holdings Corp. | 1,700 | 91,285 | ||||||
| Hulic Co., Ltd. | 8,900 | 68,935 | ||||||
| Japan Post Bank Co., Ltd. | 38,000 | 295,560 | ||||||
| Japan Post Holdings Co., Ltd. | 61,200 | 437,264 | ||||||
| Japan Post Insurance Co., Ltd. | 5,000 | 80,021 | ||||||
| Japan Real Estate Investment Corp. REIT | 23 | 105,789 | ||||||
| Japan Tobacco, Inc. | 8,700 | 150,481 | ||||||
| Kaneka Corp. | 3,900 | 96,083 | ||||||
| KDDI Corp. | 7,400 | 234,000 | ||||||
| Lawson, Inc. | 1,900 | 63,174 | ||||||
| McDonald’s Holdings Co. Japan, Ltd. | 5,100 | 185,669 | ||||||
| Mitsubishi Electric Corp. | 6,400 | 68,503 | ||||||
| MS&AD Insurance Group Holdings, Inc. | 3,000 | 91,976 | ||||||
| Nihon Kohden Corp. | 4,400 | 90,026 | ||||||
| Nintendo Co., Ltd. | 100 | 43,219 | ||||||
| Nippon Building Fund, Inc. REIT | 13 | 64,684 | ||||||
| Nippon Telegraph & Telephone Corp. | 2,900 | 83,265 | ||||||
| Osaka Gas Co., Ltd. | 11,800 | 226,631 | ||||||
| Rengo Co., Ltd. | 10,900 | 59,031 | ||||||
| Softbank Corp. | 6,100 | 67,704 | ||||||
| The Hachijuni Bank, Ltd. | 22,100 | 81,478 | ||||||
| Tokyo Gas Co., Ltd. | 22,400 | 463,443 | ||||||
| Yamazaki Baking Co., Ltd. | 7,100 | 86,721 | ||||||
| 3,748,557 | ||||||||
The accompanying notes are an integral part of these financial statements.
102 Semi-Annual Report
| Description | Shares | Fair Value | ||||||
| Lazard Managed Equity Volatility Portfolio (continued) | ||||||||
| Netherlands | 2.0% | ||||||||
| Koninklijke KPN NV | 19,403 | $ | 69,213 | |||||
| Shell PLC | 5,802 | 151,406 | ||||||
| Wolters Kluwer NV | 3,472 | 337,761 | ||||||
| 558,380 | ||||||||
| New Zealand | 0.6% | ||||||||
| Spark New Zealand, Ltd. | 56,168 | 168,361 | ||||||
| Norway | 0.8% | ||||||||
| Orkla ASA | 20,469 | 163,841 | ||||||
| Telenor ASA | 4,197 | 55,908 | ||||||
| 219,749 | ||||||||
| Portugal | 0.2% | ||||||||
| Jeronimo Martins SGPS SA | 3,164 | 68,771 | ||||||
| Singapore | 0.8% | ||||||||
| Jardine Cycle & Carriage, Ltd. | 3,500 | 71,322 | ||||||
| Singapore Technologies Engineering, Ltd. | 50,100 | 147,411 | ||||||
| 218,733 | ||||||||
| Spain | 0.1% | ||||||||
| Corporacion Financiera Alba SA | 442 | 24,143 | ||||||
| Sweden | 0.6% | ||||||||
| Securitas AB, B Shares | 9,050 | 78,572 | ||||||
| Telefonaktiebolaget LM Ericsson, B Shares | 13,844 | 103,327 | ||||||
| 181,899 | ||||||||
| Switzerland | 2.7% | ||||||||
| PSP Swiss Property AG | 1,250 | 139,062 | ||||||
| Roche Holding AG | 1,043 | 348,183 | ||||||
| Swisscom AG | 522 | 288,941 | ||||||
| 776,186 | ||||||||
The accompanying notes are an integral part of these financial statements.
Semi-Annual Report 103
| Description | Shares | Fair Value | ||||||
| Lazard Managed Equity Volatility Portfolio (continued) | ||||||||
| United Kingdom | 4.0% | ||||||||
| Barclays PLC | 33,149 | $ | 62,060 | |||||
| Howden Joinery Group PLC | 6,549 | 48,353 | ||||||
| HSBC Holdings PLC | 15,137 | 98,751 | ||||||
| J Sainsbury PLC | 50,807 | 126,207 | ||||||
| National Grid PLC | 9,650 | 123,668 | ||||||
| Segro PLC REIT | 6,494 | 77,223 | ||||||
| SSE PLC | 6,171 | 122,001 | ||||||
| Unilever PLC | 8,980 | 408,717 | ||||||
| Vodafone Group PLC | 57,839 | 89,225 | ||||||
| 1,156,205 | ||||||||
| United States | 62.6% | ||||||||
| A-Mark Precious Metals, Inc. | 2,015 | 64,984 | ||||||
| Activision Blizzard, Inc. | 1,471 | 114,532 | ||||||
| Airbnb, Inc.,Class A (*) | 699 | 62,267 | ||||||
| Alleghany Corp. (*) | 110 | 91,641 | ||||||
| Allison Transmission Holdings, Inc. | 1,705 | 65,557 | ||||||
| Alphabet, Inc., Class C (*) | 131 | 286,556 | ||||||
| Altria Group, Inc. | 3,180 | 132,829 | ||||||
| Amdocs, Ltd. | 2,129 | 177,367 | ||||||
| AMERCO | 161 | 76,995 | ||||||
| Ameren Corp. | 2,021 | 182,618 | ||||||
| American Electric Power Co., Inc. | 2,276 | 218,359 | ||||||
| AmerisourceBergen Corp. | 1,148 | 162,419 | ||||||
| AMN Healthcare Services, Inc. (*) | 1,485 | 162,919 | ||||||
| Aon PLC, Class A | 727 | 196,057 | ||||||
| Assurant, Inc. | 577 | 99,734 | ||||||
| Automatic Data Processing, Inc. | 486 | 102,079 | ||||||
| AutoZone, Inc. (*) | 70 | 150,438 | ||||||
| Becton, Dickinson & Co. | 577 | 142,248 | ||||||
| BJ’s Wholesale Club Holdings, Inc. (*) | 1,225 | 76,342 | ||||||
| Bristol-Myers Squibb Co. | 3,037 | 233,849 | ||||||
| Cadence Design Systems, Inc. (*) | 814 | 122,124 | ||||||
| Cboe Global Markets, Inc. | 1,036 | 117,265 | ||||||
| Charter Communications, Inc., Class A (*) | 281 | 131,657 | ||||||
The accompanying notes are an integral part of these financial statements.
104 Semi-Annual Report
| Description | Shares | Fair Value | ||||||
| Lazard Managed Equity Volatility Portfolio (continued) | ||||||||
| Chubb, Ltd. | 492 | $ | 96,717 | |||||
| Cigna Corp. | 269 | 70,887 | ||||||
| CMS Energy Corp. | 1,842 | 124,335 | ||||||
| Colgate-Palmolive Co. | 5,037 | 403,665 | ||||||
| Comcast Corp., Class A | 4,722 | 185,291 | ||||||
| Corteva, Inc. | 1,454 | 78,720 | ||||||
| CorVel Corp. (*) | 570 | 83,944 | ||||||
| Costco Wholesale Corp. | 311 | 149,056 | ||||||
| Coterra Energy, Inc. | 4,008 | 103,366 | ||||||
| CSG Systems International, Inc. | 1,445 | 86,238 | ||||||
| CVS Health Corp. | 2,229 | 206,539 | ||||||
| Danaher Corp. | 240 | 60,845 | ||||||
| Digital Realty Trust, Inc. REIT | 959 | 124,507 | ||||||
| Duke Energy Corp. | 954 | 102,278 | ||||||
| Electronic Arts, Inc. | 535 | 65,083 | ||||||
| Eli Lilly & Co. | 775 | 251,278 | ||||||
| Everest Re Group, Ltd. | 288 | 80,721 | ||||||
| Exelon Corp. | 3,890 | 176,295 | ||||||
| Extra Space Storage, Inc. REIT | 747 | 127,080 | ||||||
| FactSet Research Systems, Inc. | 357 | 137,291 | ||||||
| Fiserv, Inc. (*) | 758 | 67,439 | ||||||
| Flowers Foods, Inc. | 10,233 | 269,333 | ||||||
| FOX Corp., Class B | 1,986 | 58,984 | ||||||
| General Mills, Inc. | 1,545 | 116,570 | ||||||
| Gilead Sciences, Inc. | 4,683 | 289,456 | ||||||
| Grand Canyon Education, Inc. (*) | 951 | 89,575 | ||||||
| GSK PLC | 6,369 | 136,949 | ||||||
| Henry Schein, Inc. (*) | 1,258 | 96,539 | ||||||
| Home Depot, Inc. | 257 | 70,487 | ||||||
| Houlihan Lokey, Inc. | 745 | 58,803 | ||||||
| Huntsman Corp. | 2,191 | 62,115 | ||||||
| Ingles Markets, Inc., Class A | 1,087 | 94,297 | ||||||
| Intel Corp. | 4,229 | 158,207 | ||||||
| Intercontinental Exchange, Inc. | 1,507 | 141,718 | ||||||
| Jack Henry & Associates, Inc. | 895 | 161,118 | ||||||
| JB Hunt Transport Services, Inc. | 592 | 93,222 | ||||||
The accompanying notes are an integral part of these financial statements.
Semi-Annual Report 105
| Description | Shares | Fair Value | ||||||
| Lazard Managed Equity Volatility Portfolio (continued) | ||||||||
| Johnson & Johnson | 2,272 | $ | 403,303 | |||||
| Jones Lang LaSalle, Inc. (*) | 340 | 59,452 | ||||||
| Kellogg Co. | 3,968 | 283,077 | ||||||
| Keysight Technologies, Inc. (*) | 1,312 | 180,859 | ||||||
| Kforce, Inc. | 1,035 | 63,487 | ||||||
| Kimberly-Clark Corp. | 3,337 | 450,996 | ||||||
| Life Storage, Inc. REIT | 1,329 | 148,396 | ||||||
| Lockheed Martin Corp. | 645 | 277,324 | ||||||
| Markel Corp. (*) | 61 | 78,888 | ||||||
| Matson, Inc. | 1,425 | 103,854 | ||||||
| McDonald’s Corp. | 1,382 | 341,188 | ||||||
| Merck & Co., Inc. | 4,800 | 437,616 | ||||||
| Micron Technology, Inc. | 1,049 | 57,989 | ||||||
| Microsoft Corp. | 942 | 241,934 | ||||||
| Monolithic Power Systems, Inc. | 417 | 160,145 | ||||||
| Motorola Solutions, Inc. | 421 | 88,242 | ||||||
| National Fuel Gas Co. | 2,747 | 181,439 | ||||||
| NiSource, Inc. | 5,325 | 157,034 | ||||||
| Northrop Grumman Corp. | 238 | 113,900 | ||||||
| NorthWestern Corp. | 1,200 | 70,716 | ||||||
| NVR, Inc. (*) | 21 | 84,087 | ||||||
| Omnicom Group, Inc. | 1,659 | 105,529 | ||||||
| Otter Tail Corp. | 1,565 | 105,058 | ||||||
| Paychex, Inc. | 1,586 | 180,598 | ||||||
| PepsiCo, Inc. | 1,924 | 320,654 | ||||||
| Pinnacle West Capital Corp. | 3,372 | 246,561 | ||||||
| Portland General Electric Co. | 1,557 | 75,250 | ||||||
| Power Integrations, Inc. | 726 | 54,457 | ||||||
| Premier, Inc., Class A | 2,125 | 75,820 | ||||||
| Public Storage REIT | 991 | 309,856 | ||||||
| QIAGEN NV. (*) | 1,591 | 74,718 | ||||||
| QUALCOMM, Inc. | 711 | 90,823 | ||||||
| QuidelOrtho Corp. (*) | 642 | 62,390 | ||||||
| Regeneron Pharmaceuticals, Inc. (*) | 167 | 98,719 | ||||||
| Republic Services, Inc. | 3,302 | 432,133 | ||||||
| Service Corp. International | 1,863 | 128,771 | ||||||
The accompanying notes are an integral part of these financial statements.
106 Semi-Annual Report
| Description | Shares | Fair Value | ||||||
| Lazard Managed Equity Volatility Portfolio (continued) | ||||||||
| Sirius XM Holdings, Inc. | 12,147 | $ | 74,461 | |||||
| SLM Corp. | 4,033 | 64,286 | ||||||
| Sturm Ruger & Co., Inc. | 1,391 | 88,537 | ||||||
| Synopsys, Inc. (*) | 518 | 157,317 | ||||||
| Tetra Tech, Inc. | 553 | 75,512 | ||||||
| Texas Roadhouse, Inc. | 934 | 68,369 | ||||||
| The Coca-Cola Co. | 1,203 | 75,681 | ||||||
| The Hershey Co. | 1,816 | 390,731 | ||||||
| The Interpublic Group of Cos., Inc. | 2,429 | 66,870 | ||||||
| The Kroger Co. | 1,324 | 62,665 | ||||||
| The Procter & Gamble Co. | 3,086 | 443,736 | ||||||
| The TJX Cos., Inc. | 1,075 | 60,039 | ||||||
| The Toro Co. | 739 | 56,009 | ||||||
| The Travelers Cos., Inc. | 404 | 68,328 | ||||||
| Tyson Foods, Inc., Class A | 1,817 | 156,371 | ||||||
| UnitedHealth Group, Inc. | 278 | 142,789 | ||||||
| Veeva Systems, Inc.,Class A (*) | 394 | 78,028 | ||||||
| Verizon Communications, Inc. | 9,005 | 457,004 | ||||||
| Vertex Pharmaceuticals, Inc. (*) | 582 | 164,002 | ||||||
| Virtu Financial, Inc., Class A | 2,405 | 56,301 | ||||||
| Visa, Inc., Class A | 944 | 185,864 | ||||||
| Washington Federal, Inc. | 4,964 | 149,019 | ||||||
| Waste Management, Inc. | 1,218 | 186,330 | ||||||
| WEC Energy Group, Inc. | 696 | 70,045 | ||||||
| Werner Enterprises, Inc. | 2,038 | 78,544 | ||||||
| Xcel Energy, Inc. | 2,074 | 146,756 | ||||||
| Zoetis, Inc. | 1,082 | 185,985 | ||||||
| 18,004,626 | ||||||||
| Total Common Stocks (Cost $28,397,325) | 28,164,623 | |||||||
The accompanying notes are an integral part of these financial statements.
Semi-Annual Report 107
| Description | Shares | Fair Value | ||||||
| Lazard Managed Equity Volatility Portfolio (concluded) | ||||||||
| Short-Term Investments | 1.6% | ||||||||
| State Street Institutional Treasury Money Market Fund, Premier Class, 1.04% (7 day yield) (Cost $470,792) | 470,792 | $ | 470,792 | |||||
| Total Investments | 99.6% | ||||||||
| (Cost $28,868,117) | $ | 28,635,415 | ||||||
| Cash and Other Assets in Excess of Liabilities | 0.4% | 109,876 | |||||||
| Net Assets | 100.0% | $ | 28,745,291 | ||||||
The accompanying notes are an integral part of these financial statements.
108 Semi-Annual Report
The accompanying notes are an integral part of these financial statements.
Semi-Annual Report 109
| Description | Shares | Fair Value | ||||||
| Lazard US Equity Concentrated Portfolio (continued) | ||||||||
| Interactive Media & Services | 9.2% | ||||||||
| Alphabet, Inc., Class A (*) | 60,207 | $ | 131,206,707 | |||||
| IT Services | 14.2% | ||||||||
| Fiserv, Inc. (*) | 1,146,284 | 101,984,888 | ||||||
| VeriSign, Inc. (*) | 312,107 | 52,224,864 | ||||||
| Visa, Inc., Class A | 239,860 | 47,226,035 | ||||||
| 201,435,787 | ||||||||
| Life Sciences Tools & Services | 1.5% | ||||||||
| Sotera Health Co. (*) | 1,093,552 | 21,422,684 | ||||||
| Machinery | 4.7% | ||||||||
| Otis Worldwide Corp. | 943,734 | 66,693,682 | ||||||
| Multiline Retail | 4.7% | ||||||||
| Dollar Tree, Inc. (*) | 430,868 | 67,150,778 | ||||||
| Professional Services | 2.3% | ||||||||
| Verisk Analytics, Inc., Class A | 185,342 | 32,080,847 | ||||||
| Semiconductors & Semiconductor Equipment | 11.9% | ||||||||
| Analog Devices, Inc. | 722,834 | 105,598,819 | ||||||
| Skyworks Solutions, Inc. | 695,843 | 64,462,896 | ||||||
| 170,061,715 | ||||||||
| Software | 1.8% | ||||||||
| Adobe, Inc. (*) | 69,205 | 25,333,182 | ||||||
| Specialty Retail | 3.2% | ||||||||
| Lowe’s Cos., Inc. | 238,024 | 41,575,652 | ||||||
| Warby Parker, Inc., Class A (*) | 389,971 | 4,391,073 | ||||||
| 45,966,725 | ||||||||
| Total Common Stocks (Cost $1,184,825,243) | 1,416,999,390 | |||||||
The accompanying notes are an integral part of these financial statements.
110 Semi-Annual Report
| Description | Shares | Fair Value | ||||||
| Lazard US Equity Concentrated Portfolio (concluded) | ||||||||
| Short-Term Investments | 1.2% | ||||||||
| State Street Institutional Treasury Money Market Fund, Premier Class, 1.04% (7 day yield) (Cost $17,519,949) | 17,519,949 | $ | 17,519,949 | |||||
| Total Investments | 100.8% (Cost $1,202,345,192) | $ | 1,434,519,339 | ||||||
| Liabilities in Excess of Cash and Other Assets | (0.8)% | (11,554,191 | ) | ||||||
| Net Assets | 100.0% | $ | 1,422,965,148 | ||||||
The accompanying notes are an integral part of these financial statements.
Semi-Annual Report 111
The accompanying notes are an integral part of these financial statements.
112 Semi-Annual Report
| Description | Shares | Fair Value | ||||||
| Lazard US Equity Focus Portfolio (continued) | ||||||||
| Industrial Conglomerates | 3.5% | ||||||||
| Honeywell International, Inc. | 14,988 | $ | 2,605,064 | |||||
| Insurance | 4.0% | ||||||||
| Marsh & McLennan Cos., Inc. | 19,348 | 3,003,777 | ||||||
| Interactive Media & Services | 6.6% | ||||||||
| Alphabet, Inc., Class A (*) | 2,256 | 4,916,410 | ||||||
| Internet & Direct Marketing Retail | 4.5% | ||||||||
| Amazon.com, Inc. (*) | 31,300 | 3,324,373 | ||||||
| IT Services | 5.1% | ||||||||
| Visa, Inc., Class A | 19,339 | 3,807,656 | ||||||
| Life Sciences Tools & Services | 6.8% | ||||||||
| Danaher Corp. | 12,409 | 3,145,930 | ||||||
| IQVIA Holdings, Inc. (*) | 8,702 | 1,888,247 | ||||||
| 5,034,177 | ||||||||
| Multiline Retail | 2.6% | ||||||||
| Dollar General Corp. | 7,992 | 1,961,556 | ||||||
| Pharmaceuticals | 5.4% | ||||||||
| Johnson & Johnson | 22,723 | 4,033,560 | ||||||
| Road & Rail | 3.9% | ||||||||
| Norfolk Southern Corp. | 12,731 | 2,893,629 | ||||||
| Semiconductors & Semiconductor Equipment | 5.0% | ||||||||
| Analog Devices, Inc. | 19,983 | 2,919,317 | ||||||
| Applied Materials, Inc. | 8,384 | 762,776 | ||||||
| 3,682,093 | ||||||||
The accompanying notes are an integral part of these financial statements.
Semi-Annual Report 113
| Description | Shares | Fair Value | ||||||
| Lazard US Equity Focus Portfolio (concluded) | ||||||||
| Software | 9.1% | ||||||||
| Microsoft Corp. | 20,145 | $ | 5,173,841 | |||||
| Salesforce, Inc. (*) | 9,508 | 1,569,200 | ||||||
| 6,743,041 | ||||||||
| Specialty Retail | 3.1% | ||||||||
| Lowe’s Cos., Inc. | 13,376 | 2,336,386 | ||||||
| Textiles, Apparel & Luxury Goods | 1.8% | ||||||||
| NIKE, Inc., Class B | 13,391 | 1,368,560 | ||||||
| Total Common Stocks (Cost $59,667,720) | 72,693,351 | |||||||
| Short-Term Investments | 2.3% | ||||||||
| State Street Institutional Treasury Money Market Fund, Premier Class, 1.04% (7 day yield) (Cost $1,683,227) | 1,683,227 | 1,683,227 | ||||||
| Total Investments | 100.0% (Cost $61,350,947) | $ | 74,376,578 | ||||||
| Liabilities in Excess of Cash and Other Assets | 0.0% | (8,781 | ) | ||||||
| Net Assets | 100.0% | $ | 74,367,797 | ||||||
The accompanying notes are an integral part of these financial statements.
114 Semi-Annual Report
The accompanying notes are an integral part of these financial statements.
Semi-Annual Report 115
| Description | Shares | Fair Value | ||||||
| Lazard US Small-Mid Cap Equity Portfolio (continued) | ||||||||
| Communications Equipment | 2.3% | ||||||||
| Ciena Corp. (*) | 18,437 | $ | 842,571 | |||||
| F5, Inc. (*) | 5,155 | 788,921 | ||||||
| 1,631,492 | ||||||||
| Construction Materials | 0.9% | ||||||||
| Eagle Materials, Inc. | 5,678 | 624,239 | ||||||
| Containers & Packaging | 2.9% | ||||||||
| Avery Dennison Corp. | 5,045 | 816,634 | ||||||
| Graphic Packaging Holding Co. | 59,495 | 1,219,648 | ||||||
| 2,036,282 | ||||||||
| Electrical Equipment | 4.0% | ||||||||
| Array Technologies, Inc. (*) | 46,249 | 509,202 | ||||||
| Atkore, Inc. (*) | 9,501 | 788,678 | ||||||
| EnerSys | 14,998 | 884,282 | ||||||
| GrafTech International, Ltd. | 85,763 | 606,344 | ||||||
| 2,788,506 | ||||||||
| Electronic Equipment, Instruments & Components | 1.9% | ||||||||
| Cognex Corp. | 17,590 | 747,927 | ||||||
| Littelfuse, Inc. | 2,352 | 597,502 | ||||||
| 1,345,429 | ||||||||
| Energy Equipment & Services | 2.1% | ||||||||
| Cactus, Inc., Class A | 14,315 | 576,465 | ||||||
| Liberty Energy, Inc. (*) | 67,987 | 867,514 | ||||||
| 1,443,979 | ||||||||
| Entertainment | 1.7% | ||||||||
| Take-Two Interactive Software, Inc. (*) | 9,688 | 1,187,071 | ||||||
| Equity Real Estate Investment Trusts (REITs) | 6.3% | ||||||||
| Alexandria Real Estate Equities, Inc. | 7,572 | 1,098,167 | ||||||
| Brixmor Property Group, Inc. | 46,306 | 935,844 | ||||||
The accompanying notes are an integral part of these financial statements.
116 Semi-Annual Report
| Description | Shares | Fair Value | ||||||
| Lazard US Small-Mid Cap Equity Portfolio (continued) | ||||||||
| Camden Property Trust | 7,869 | $ | 1,058,223 | |||||
| Hudson Pacific Properties, Inc. | 39,340 | 583,806 | ||||||
| Summit Hotel Properties, Inc. (*) | 104,851 | 762,267 | ||||||
| 4,438,307 | ||||||||
| Food & Staples Retailing | 1.0% | ||||||||
| US Foods Holding Corp. (*) | 23,199 | 711,745 | ||||||
| Food Products | 2.3% | ||||||||
| Hostess Brands, Inc. (*) | 39,066 | 828,590 | ||||||
| Utz Brands, Inc. | 56,549 | 781,507 | ||||||
| 1,610,097 | ||||||||
| Gas Utilities | 2.1% | ||||||||
| New Jersey Resources Corp. | 33,254 | 1,480,801 | ||||||
| Health Care Equipment & Supplies | 1.9% | ||||||||
| Nevro Corp. (*) | 8,303 | 363,921 | ||||||
| QuidelOrtho Corp. (*) | 9,800 | 952,364 | ||||||
| 1,316,285 | ||||||||
| Health Care Providers & Services | 1.4% | ||||||||
| Henry Schein, Inc. (*) | 12,962 | 994,704 | ||||||
| Health Care Technology | 1.1% | ||||||||
| Certara, Inc. (*) | 34,498 | 740,327 | ||||||
| Hotels, Restaurants & Leisure | 1.9% | ||||||||
| Brinker International, Inc. (*) | 25,879 | 570,114 | ||||||
| Wyndham Hotels & Resorts, Inc. | 11,582 | 761,169 | ||||||
| 1,331,283 | ||||||||
| Household Durables | 2.2% | ||||||||
| Leggett & Platt, Inc. | 27,078 | 936,357 | ||||||
| Newell Brands, Inc. | 32,534 | 619,448 | ||||||
| 1,555,805 | ||||||||
The accompanying notes are an integral part of these financial statements.
Semi-Annual Report 117
| Description | Shares | Fair Value | ||||||
| Lazard US Small-Mid Cap Equity Portfolio (continued) | ||||||||
| Insurance | 3.8% | ||||||||
| Brown & Brown, Inc. | 24,374 | $ | 1,421,979 | |||||
| Reinsurance Group of America, Inc. | 10,474 | 1,228,496 | ||||||
| 2,650,475 | ||||||||
| Interactive Media & Services | 2.1% | ||||||||
| Cars.com, Inc. (*) | 71,175 | 671,180 | ||||||
| Ziff Davis, Inc. (*) | 11,039 | 822,737 | ||||||
| 1,493,917 | ||||||||
| IT Services | 2.4% | ||||||||
| Amdocs, Ltd. | 10,308 | 858,760 | ||||||
| Remitly Global, Inc. (*) | 42,330 | 324,248 | ||||||
| Squarespace, Inc., Class A (*) | 22,883 | 478,712 | ||||||
| 1,661,720 | ||||||||
| Leisure Products | 2.5% | ||||||||
| Brunswick Corp. | 8,054 | 526,570 | ||||||
| Hasbro, Inc. | 15,134 | 1,239,172 | ||||||
| 1,765,742 | ||||||||
| Life Sciences Tools & Services | 4.5% | ||||||||
| AbCellera Biologics, Inc. (*) | 51,340 | 546,771 | ||||||
| Charles River Laboratories International, Inc. (*) | 1,590 | 340,212 | ||||||
| ICON PLC (*) | 4,829 | 1,046,444 | ||||||
| Sotera Health Co. (*) | 30,766 | 602,706 | ||||||
| Stevanato Group SpA | 38,207 | 604,053 | ||||||
| 3,140,186 | ||||||||
| Machinery | 4.4% | ||||||||
| Altra Industrial Motion Corp. | 20,993 | 740,003 | ||||||
| Columbus McKinnon Corp. | 26,930 | 764,004 | ||||||
| Gates Industrial Corp. PLC (*) | 48,348 | 522,642 | ||||||
| The Middleby Corp. (*) | 8,167 | 1,023,815 | ||||||
| 3,050,464 | ||||||||
The accompanying notes are an integral part of these financial statements.
118 Semi-Annual Report
| Description | Shares | Fair Value | ||||||
| Lazard US Small-Mid Cap Equity Portfolio (continued) | ||||||||
| Oil, Gas & Consumable Fuels | 3.1% | ||||||||
| Antero Resources Corp. (*) | 42,601 | $ | 1,305,721 | |||||
| Magnolia Oil & Gas Corp., Class A | 42,180 | 885,358 | ||||||
| 2,191,079 | ||||||||
| Paper & Forest Products | 1.0% | ||||||||
| Neenah, Inc. | 20,945 | 715,062 | ||||||
| Pharmaceuticals | 1.8% | ||||||||
| Catalent, Inc. (*) | 11,850 | 1,271,387 | ||||||
| Professional Services | 2.7% | ||||||||
| Leidos Holdings, Inc. | 12,262 | 1,234,906 | ||||||
| Sterling Check Corp. (*) | 39,814 | 649,366 | ||||||
| 1,884,272 | ||||||||
| Semiconductors & Semiconductor Equipment | 2.0% | ||||||||
| MKS Instruments, Inc. | 9,999 | 1,026,198 | ||||||
| ON Semiconductor Corp. (*) | 7,672 | 385,978 | ||||||
| 1,412,176 | ||||||||
| Software | 5.5% | ||||||||
| CyberArk Software, Ltd. (*) | 7,438 | 951,766 | ||||||
| Dolby Laboratories, Inc., Class A | 12,526 | 896,361 | ||||||
| LiveRamp Holdings, Inc. (*) | 20,450 | 527,815 | ||||||
| N-Able, Inc. (*) | 77,025 | 693,225 | ||||||
| PTC, Inc. (*) | 7,691 | 817,861 | ||||||
| 3,887,028 | ||||||||
| Specialty Retail | 2.5% | ||||||||
| Five Below, Inc. (*) | 5,869 | 665,721 | ||||||
| Leslie’s, Inc. (*) | 55,514 | 842,702 | ||||||
| Warby Parker, Inc., Class A (*) | 21,031 | 236,809 | ||||||
| 1,745,232 | ||||||||
The accompanying notes are an integral part of these financial statements.
Semi-Annual Report 119
| Description | Shares | Fair Value | ||||||
| Lazard US Small-Mid Cap Equity Portfolio (concluded) | ||||||||
| Textiles, Apparel & Luxury Goods | 1.1% | ||||||||
| Tapestry, Inc. | 25,359 | $ | 773,957 | |||||
| Total Common Stocks (Cost $65,508,793) | 68,911,113 | |||||||
| Total Investments | 98.4% (Cost $65,508,793) | $ | 68,911,113 | ||||||
| Cash and Other Assets in Excess of Liabilities | 1.6% | 1,134,261 | |||||||
| Net Assets | 100.0% | $ | 70,045,374 |
The accompanying notes are an integral part of these financial statements.
120 Semi-Annual Report
The accompanying notes are an integral part of these financial statements.
Semi-Annual Report 121
| Description | Shares | Fair Value | ||||||
| Lazard US Sustainable Equity Portfolio (continued) | ||||||||
| Electrical Equipment | 2.0% | ||||||||
| Rockwell Automation, Inc. | 1,232 | $ | 245,550 | |||||
| Electronic Equipment, Instruments & Components | 0.7% | ||||||||
| Cognex Corp. | 1,918 | 81,553 | ||||||
| Entertainment | 1.2% | ||||||||
| The Walt Disney Co. (*) | 1,494 | 141,034 | ||||||
| Equity Real Estate Investment Trusts (REITs) | 2.5% | ||||||||
| Prologis, Inc. | 2,615 | 307,655 | ||||||
| Food & Staples Retailing | 2.1% | ||||||||
| Sysco Corp. | 2,982 | 252,605 | ||||||
| Health Care Equipment & Supplies | 4.9% | ||||||||
| Boston Scientific Corp. (*) | 5,840 | 217,657 | ||||||
| Medtronic PLC | 4,237 | 380,270 | ||||||
| 597,927 | ||||||||
| Health Care Providers & Services | 6.4% | ||||||||
| Humana, Inc. | 447 | 209,228 | ||||||
| Laboratory Corp. of America Holdings | 773 | 181,160 | ||||||
| UnitedHealth Group, Inc. | 770 | 395,495 | ||||||
| 785,883 | ||||||||
| Hotels, Restaurants & Leisure | 1.0% | ||||||||
| Starbucks Corp. | 1,610 | 122,988 | ||||||
| Household Products | 2.7% | ||||||||
| The Procter & Gamble Co. | 2,266 | 325,828 | ||||||
| IT Services | 6.7% | ||||||||
| Accenture PLC, Class A | 1,419 | 393,985 | ||||||
| Visa, Inc., Class A | 2,164 | 426,070 | ||||||
| 820,055 | ||||||||
The accompanying notes are an integral part of these financial statements.
122 Semi-Annual Report
| Description | Shares | Fair Value | ||||||
| Lazard US Sustainable Equity Portfolio (continued) | ||||||||
| Life Sciences Tools & Services | 8.4% | ||||||||
| Agilent Technologies, Inc. | 1,417 | $ | 168,297 | |||||
| Danaher Corp. | 1,464 | 371,153 | ||||||
| IQVIA Holdings, Inc. (*) | 998 | 216,556 | ||||||
| Thermo Fisher Scientific, Inc. | 498 | 270,554 | ||||||
| 1,026,560 | ||||||||
| Machinery | 3.2% | ||||||||
| Deere & Co. | 795 | 238,079 | ||||||
| Watts Water Technologies, Inc., Class A | 696 | 85,496 | ||||||
| Xylem, Inc. | 865 | 67,626 | ||||||
| 391,201 | ||||||||
| Personal Products | 1.0% | ||||||||
| The Estee Lauder Cos., Inc., Class A | 476 | 121,223 | ||||||
| Pharmaceuticals | 5.3% | ||||||||
| Johnson & Johnson | 2,142 | 380,226 | ||||||
| Zoetis, Inc. | 1,521 | 261,445 | ||||||
| 641,671 | ||||||||
| Road & Rail | 2.3% | ||||||||
| Norfolk Southern Corp. | 1,245 | 282,976 | ||||||
| Semiconductors & Semiconductor Equipment | 4.4% | ||||||||
| Analog Devices, Inc. | 2,323 | 339,367 | ||||||
| Applied Materials, Inc. | 1,294 | 117,728 | ||||||
| ON Semiconductor Corp. (*) | 1,686 | 84,823 | ||||||
| 541,918 | ||||||||
| Software | 13.6% | ||||||||
| Adobe, Inc. (*) | 327 | 119,702 | ||||||
| CyberArk Software, Ltd. (*) | 705 | 90,212 | ||||||
| Intuit, Inc. | 423 | 163,041 | ||||||
| Microsoft Corp. | 4,010 | 1,029,888 | ||||||
| Salesforce, Inc. | 1,530 | 252,511 | ||||||
| 1,655,354 | ||||||||
The accompanying notes are an integral part of these financial statements.
Semi-Annual Report 123
| Description | Shares | Fair Value | ||||||
| Lazard US Sustainable Equity Portfolio (concluded) | ||||||||
| Specialty Retail | 2.8% | ||||||||
| Home Depot, Inc. | 1,261 | $ | 345,854 | |||||
| Textiles, Apparel & Luxury Goods | 1.3% | ||||||||
| NIKE, Inc., Class B | 1,494 | 152,687 | ||||||
| Total Common Stocks (Cost $10,336,521) | 11,646,006 | |||||||
| Short-Term Investments | 5.1% | ||||||||
| State Street Institutional Treasury Money Market Fund, Premier Class, 1.04% (7 day yield) (Cost $625,851) | 625,851 | 625,851 | ||||||
| Total Investments | 100.6% (Cost $10,962,372) | $ | 12,271,857 | ||||||
| Liabilities in Excess of Cash and Other Assets | (0.6)% | (69,831 | ) | ||||||
| Net Assets | 100.0% | $ | 12,202,026 | ||||||
The accompanying notes are an integral part of these financial statements.
124 Semi-Annual Report
The accompanying notes are an integral part of these financial statements.
Semi-Annual Report 125
| Description | Shares | Fair Value | ||||||
| Lazard US Systematic Small Cap Equity Portfolio (continued) | ||||||||
| Metrocity Bankshares, Inc. | 977 | $ | 19,843 | |||||
| Midland States Bancorp, Inc. | 1,864 | 44,811 | ||||||
| Parke Bancorp, Inc. | 959 | 20,101 | ||||||
| Peapack-Gladstone Financial Corp. | 1,366 | 40,570 | ||||||
| Popular, Inc. | 522 | 40,157 | ||||||
| QCR Holdings, Inc. | 1,020 | 55,070 | ||||||
| RBB Bancorp | 1,129 | 23,336 | ||||||
| Red River Bancshares, Inc. | 323 | 17,468 | ||||||
| The First Bancorp, Inc. | 400 | 12,052 | ||||||
| Umpqua Holdings Corp. | 2,756 | 46,218 | ||||||
| Unity Bancorp, Inc. | 977 | 25,871 | ||||||
| West BanCorp, Inc. | 588 | 14,312 | ||||||
| 723,599 | ||||||||
| Beverages | 1.0% | ||||||||
| Coca-Cola Consolidated, Inc. | 96 | 54,134 | ||||||
| National Beverage Corp. | 971 | 47,521 | ||||||
| Primo Water Corp. | 4,189 | 56,049 | ||||||
| The Boston Beer Co., Inc., Class A (*) | 85 | 25,753 | ||||||
| The Duckhorn Portfolio, Inc. (*) | 2,852 | 60,063 | ||||||
| 243,520 | ||||||||
| Biotechnology | 8.5% | ||||||||
| ADC Therapeutics SA (*) | 7,662 | 60,913 | ||||||
| Adicet Bio, Inc. (*) | 4,936 | 72,066 | ||||||
| ADMA Biologics, Inc. (*) | 37,858 | 74,959 | ||||||
| Affimed NV (*) | 13,413 | 37,154 | ||||||
| Agenus, Inc. (*) | 17,390 | 33,737 | ||||||
| Alector, Inc. (*) | 2,222 | 22,575 | ||||||
| Amicus Therapeutics, Inc. (*) | 4,766 | 51,187 | ||||||
| Avid Bioservices, Inc. (*) | 3,169 | 48,359 | ||||||
| Biohaven Pharmaceutical Holding Co., Ltd. (*) | 449 | 65,424 | ||||||
| CareDx, Inc. (*) | 2,538 | 54,516 | ||||||
| Catalyst Pharmaceuticals, Inc. (*) | 14,607 | 102,395 | ||||||
| CRISPR Therapeutics AG (*) | 1,020 | 61,985 | ||||||
| Denali Therapeutics, Inc. (*) | 2,544 | 74,870 | ||||||
The accompanying notes are an integral part of these financial statements.
126 Semi-Annual Report
| Description | Shares | Fair Value | ||||||
| Lazard US Systematic Small Cap Equity Portfolio (continued) | ||||||||
| Dynavax Technologies Corp. (*) | 4,717 | $ | 59,387 | |||||
| Eagle Pharmaceuticals, Inc. (*) | 2,014 | 89,482 | ||||||
| Editas Medicine, Inc. (*) | 3,442 | 40,719 | ||||||
| Exelixis, Inc. (*) | 1,808 | 37,643 | ||||||
| Fate Therapeutics, Inc. (*) | 1,773 | 43,935 | ||||||
| Ideaya Biosciences, Inc. (*) | 6,126 | 84,539 | ||||||
| Immatics NV (*) | 8,616 | 75,045 | ||||||
| ImmunoGen, Inc. (*) | 13,971 | 62,869 | ||||||
| Ironwood Pharmaceuticals, Inc. (*) | 5,543 | 63,911 | ||||||
| iTeos Therapeutics, Inc. (*) | 2,835 | 58,401 | ||||||
| Kiniksa Pharmaceuticals, Ltd., Class A (*) | 5,859 | 56,774 | ||||||
| MeiraGTx Holdings PLC (*) | 4,529 | 34,285 | ||||||
| Organogenesis Holdings, Inc. (*) | 7,067 | 34,487 | ||||||
| Radius Health, Inc. (*) | 7,231 | 74,985 | ||||||
| REGENXBIO, Inc. (*) | 3,654 | 90,254 | ||||||
| uniQure NV (*) | 4,632 | 86,340 | ||||||
| United Therapeutics Corp. (*) | 430 | 101,325 | ||||||
| Vanda Pharmaceuticals, Inc. (*) | 16 | 174 | ||||||
| Veracyte, Inc. (*) | 1,165 | 23,183 | ||||||
| Vericel Corp. (*) | 2,137 | 53,810 | ||||||
| XOMA Corp. (*) | 1,272 | 28,340 | ||||||
| Zymeworks, Inc. (*) | 8,992 | 47,658 | ||||||
| 2,007,686 | ||||||||
| Building Products | 2.8% | ||||||||
| A O Smith Corp. | 680 | 37,182 | ||||||
| Advanced Drainage Systems, Inc. | 461 | 41,522 | ||||||
| Builders FirstSource, Inc. (*) | 1,663 | 89,303 | ||||||
| Gibraltar Industries, Inc. (*) | 1,250 | 48,438 | ||||||
| Insteel Industries, Inc. | 2,820 | 94,950 | ||||||
| Owens Corning | 794 | 59,002 | ||||||
| Quanex Building Products Corp. | 3,372 | 76,713 | ||||||
| Simpson Manufacturing Co., Inc. | 364 | 36,622 | ||||||
| Tecnoglass, Inc. | 3,782 | 66,374 | ||||||
| The AZEK Co., Inc. (*) | 1,663 | 27,839 | ||||||
| UFP Industries, Inc. | 1,152 | 78,497 | ||||||
| 656,442 | ||||||||
The accompanying notes are an integral part of these financial statements.
Semi-Annual Report 127
| Description | Shares | Fair Value | ||||||
| Lazard US Systematic Small Cap Equity Portfolio (continued) | ||||||||
| Capital Markets | 1.3% | ||||||||
| Affiliated Managers Group, Inc. | 340 | $ | 39,644 | |||||
| Artisan Partners Asset Management, Inc. Class A | 418 | 14,868 | ||||||
| Cboe Global Markets, Inc. | 315 | 35,655 | ||||||
| CI Financial Corp. | 358 | 3,806 | ||||||
| Donnelley Financial Solutions, Inc. (*) | 2,313 | 67,748 | ||||||
| Janus Henderson Group PLC | 1,080 | 25,391 | ||||||
| Open Lending Corp.,Class A (*) | 1,718 | 17,575 | ||||||
| Oppenheimer Holdings, Inc.,Class A | 856 | 28,282 | ||||||
| Saratoga Investment Corp. | 1,862 | 44,632 | ||||||
| TriplePoint Venture Growth BDC Corp. | 3,175 | 40,449 | ||||||
| 318,050 | ||||||||
| Chemicals | 3.4% | ||||||||
| AdvanSix, Inc. | 2,970 | 99,317 | ||||||
| CF Industries Holdings, Inc. | 1,280 | 109,734 | ||||||
| Ecovyst, Inc. | 5,999 | 59,090 | ||||||
| FutureFuel Corp. | 10,249 | 74,613 | ||||||
| Huntsman Corp. | 1,669 | 47,316 | ||||||
| Olin Corp. | 2,525 | 116,857 | ||||||
| The Chemours Co. | 1,706 | 54,626 | ||||||
| Tredegar Corp. | 2,817 | 28,170 | ||||||
| Valhi, Inc. | 2,372 | 107,546 | ||||||
| Valvoline, Inc. | 1,548 | 44,629 | ||||||
| Westlake Corp. | 734 | 71,947 | ||||||
| 813,845 | ||||||||
| Commercial Services & Supplies | 2.7% | ||||||||
| ABM Industries, Inc. | 1,293 | 56,142 | ||||||
| Brady Corp.,Class A | 1,772 | 83,709 | ||||||
| Civeo Corp. (*) | 2,998 | 77,558 | ||||||
| Ennis, Inc. | 5,336 | 107,947 | ||||||
| Heritage-Crystal Clean, Inc. (*) | 3,919 | 105,656 | ||||||
| Li-Cycle Holdings Corp. (*) | 7,114 | 48,944 | ||||||
| NL Industries, Inc. | 789 | 7,788 | ||||||
| SP Plus Corp. (*) | 3,151 | 96,799 | ||||||
| Steelcase, Inc.,Class A | 4,927 | 52,867 | ||||||
| 637,410 | ||||||||
The accompanying notes are an integral part of these financial statements.
128 Semi-Annual Report
| Description | Shares | Fair Value | ||||||
| Lazard US Systematic Small Cap Equity Portfolio (continued) | ||||||||
| Communications Equipment | 1.2% | ||||||||
| Clearfield, Inc. (*) | 2,106 | $ | 130,467 | |||||
| Digi International, Inc. (*) | 3,691 | 89,396 | ||||||
| Ituran Location and Control, Ltd. | 2,061 | 50,474 | ||||||
| Juniper Networks, Inc. | 807 | 22,999 | ||||||
| 293,336 | ||||||||
| Construction & Engineering | 0.9% | ||||||||
| API Group Corp. (*) | 3,127 | 46,811 | ||||||
| Concrete Pumping Holdings, Inc. (*) | 5,091 | 30,851 | ||||||
| IES Holdings, Inc. (*) | 1,692 | 51,048 | ||||||
| MYR Group, Inc. (*) | 982 | 86,544 | ||||||
| 215,254 | ||||||||
| Construction Materials | 0.6% | ||||||||
| Eagle Materials, Inc. | 884 | 97,187 | ||||||
| United States Lime & Minerals, Inc. | 333 | 35,165 | ||||||
| 132,352 | ||||||||
| Consumer Finance | 0.2% | ||||||||
| OneMain Holdings, Inc. | 1,316 | 49,192 | ||||||
| Containers & Packaging | 0.6% | ||||||||
| Greif, Inc.,Class A | 1,771 | 110,475 | ||||||
| O-I Glass, Inc. (*) | 2,276 | 31,864 | ||||||
| 142,339 | ||||||||
| Distributors | 0.6% | ||||||||
| Funko, Inc.,Class A (*) | 5,166 | 115,305 | ||||||
| Weyco Group, Inc. | 1,188 | 29,047 | ||||||
| 144,352 | ||||||||
| Diversified Consumer Services | 0.7% | ||||||||
| American Public Education, Inc. (*) | 5,384 | 87,005 | ||||||
| Service Corp. International | 765 | 52,877 | ||||||
| Vitru, Ltd. (*) | 1,321 | 23,091 | ||||||
| 162,973 | ||||||||
The accompanying notes are an integral part of these financial statements.
Semi-Annual Report 129
| Description | Shares | Fair Value | ||||||
| Lazard US Systematic Small Cap Equity Portfolio (continued) | ||||||||
| Diversified Telecommunication Services | 0.6% | ||||||||
| Anterix, Inc. (*) | 1,602 | $ | 65,794 | |||||
| IDT Corp.,Class B (*) | 2,158 | 54,274 | ||||||
| Ooma, Inc. (*) | 2,362 | 27,966 | ||||||
| 148,034 | ||||||||
| Electric Utilities | 0.3% | ||||||||
| Otter Tail Corp. | 965 | 64,780 | ||||||
| Electrical Equipment | 1.5% | ||||||||
| Allied Motion Technologies, Inc. | 1,086 | 24,804 | ||||||
| Atkore, Inc. (*) | 1,018 | 84,504 | ||||||
| Encore Wire Corp. | 388 | 40,321 | ||||||
| GrafTech International, Ltd. | 9,112 | 64,422 | ||||||
| nVent Electric PLC | 2,094 | 65,605 | ||||||
| Preformed Line Products Co. | 1,133 | 69,680 | ||||||
| Thermon Group Holdings, Inc. (*) | 939 | 13,193 | ||||||
| 362,529 | ||||||||
| Electronic Equipment, Instruments & Components | 1.3% | ||||||||
| Arrow Electronics, Inc. (*) | 406 | 45,509 | ||||||
| Belden, Inc. | 1,201 | 63,977 | ||||||
| Kimball Electronics, Inc. (*) | 3,216 | 64,642 | ||||||
| ScanSource, Inc. (*) | 1,875 | 58,387 | ||||||
| TD SYNNEX Corp. | 298 | 27,148 | ||||||
| Vishay Intertechnology, Inc. | 2,872 | 51,179 | ||||||
| 310,842 | ||||||||
| Energy Equipment & Services | 0.1% | ||||||||
| North American Construction Group, Ltd. | 1,651 | 18,227 | ||||||
| Entertainment | 0.8% | ||||||||
| Liberty Media Corp-Liberty Braves ,Class C (*) | 3,982 | 95,568 | ||||||
| Sciplay Corp.,Class A (*) | 3,961 | 55,335 | ||||||
| Skillz, Inc. (*) | 24,943 | 30,930 | ||||||
| 181,833 | ||||||||
The accompanying notes are an integral part of these financial statements.
130 Semi-Annual Report
| Description | Shares | Fair Value | ||||||
| Lazard US Systematic Small Cap Equity Portfolio (continued) | ||||||||
| Equity Real Estate Investment Trusts (REITs) | 4.0% | ||||||||
| American Assets Trust, Inc. | 1,196 | $ | 35,521 | |||||
| Brixmor Property Group, Inc. | 1,973 | 39,874 | ||||||
| Broadstone Net Lease, Inc. | 2,726 | 55,910 | ||||||
| CatchMark Timber Trust, Inc. Class A | 6,594 | 66,336 | ||||||
| City Office REIT, Inc. | 3,212 | 41,595 | ||||||
| Community Healthcare Trust, Inc. | 1,171 | 42,402 | ||||||
| CTO Realty Growth, Inc. | 904 | 55,253 | ||||||
| Douglas Emmett, Inc. | 1,463 | 32,742 | ||||||
| EastGroup Properties, Inc. | 206 | 31,792 | ||||||
| Federal Realty OP LP | 364 | 34,849 | ||||||
| Global Medical REIT, Inc. | 2,926 | 32,859 | ||||||
| Healthcare Trust of America, Inc., Class A | 1,141 | 31,845 | ||||||
| JBG SMITH Properties | 1,718 | 40,614 | ||||||
| Kimco Realty Corp. | 1,961 | 38,769 | ||||||
| Kite Realty Group Trust | 1,754 | 30,327 | ||||||
| Life Storage, Inc. | 510 | 56,947 | ||||||
| NexPoint Residential Trust, Inc. | 588 | 36,756 | ||||||
| One Liberty Properties, Inc. | 1,876 | 48,738 | ||||||
| Park Hotels & Resorts, Inc. | 2,604 | 35,336 | ||||||
| Phillips Edison & Co., Inc. | 1,633 | 54,559 | ||||||
| Rayonier, Inc. | 1,396 | 52,182 | ||||||
| Urstadt Biddle Properties, Inc. Class A | 2,993 | 48,487 | ||||||
| 943,693 | ||||||||
| Food & Staples Retailing | 1.4% | ||||||||
| Albertsons Cos., Inc., Class A | 2,787 | 74,468 | ||||||
| BJ’s Wholesale Club Holdings, Inc. (*) | 1,068 | 66,558 | ||||||
| Casey’s General Stores, Inc. | 151 | 27,932 | ||||||
| HF Foods Group, Inc. (*) | 3,212 | 16,767 | ||||||
| Ingles Markets, Inc., Class A | 1,645 | 142,704 | ||||||
| 328,429 | ||||||||
| Food Products | 2.8% | ||||||||
| Adecoagro SA | 5,810 | 49,153 | ||||||
| Ingredion, Inc. | 576 | 50,780 | ||||||
The accompanying notes are an integral part of these financial statements.
Semi-Annual Report 131
| Description | Shares | Fair Value | ||||||
| Lazard US Systematic Small Cap Equity Portfolio (continued) | ||||||||
| John B Sanfilippo & Son, Inc. | 728 | $ | 52,773 | |||||
| Mission Produce, Inc. (*) | 5,858 | 83,476 | ||||||
| Pilgrim’s Pride Corp. (*) | 2,064 | 64,459 | ||||||
| Sanderson Farms, Inc. | 556 | 119,835 | ||||||
| Seaboard Corp. | 12 | 46,591 | ||||||
| Seneca Foods Corp.,Class A (*) | 1,607 | 89,253 | ||||||
| The Simply Good Foods Co. (*) | 1,542 | 58,241 | ||||||
| Whole Earth Brands, Inc. (*) | 8,840 | 54,808 | ||||||
| 669,369 | ||||||||
| Gas Utilities | 0.3% | ||||||||
| UGI Corp. | 1,863 | 71,930 | ||||||
| Health Care Equipment & Supplies | 4.4% | ||||||||
| AngioDynamics, Inc. (*) | 1,912 | 36,997 | ||||||
| Apollo Endosurgery, Inc. (*) | 5,701 | 20,809 | ||||||
| Axogen, Inc. (*) | 2,234 | 18,297 | ||||||
| Bioventus, Inc.,Class A (*) | 4,639 | 31,638 | ||||||
| Cerus Corp. (*) | 7,395 | 39,120 | ||||||
| Co-Diagnostics, Inc. (*) | 7,192 | 40,347 | ||||||
| CONMED Corp. | 425 | 40,698 | ||||||
| Cutera, Inc. (*) | 1,414 | 53,025 | ||||||
| Envista Holdings Corp. (*) | 1,341 | 51,682 | ||||||
| Globus Medical, Inc., Class A (*) | 594 | 33,347 | ||||||
| iRadimed Corp. | 2,798 | 94,964 | ||||||
| LeMaitre Vascular, Inc. | 1,026 | 46,734 | ||||||
| Masimo Corp. (*) | 388 | 50,700 | ||||||
| Meridian Bioscience, Inc. (*) | 2,422 | 73,677 | ||||||
| NuVasive, Inc. (*) | 1,032 | 50,733 | ||||||
| Omnicell, Inc. (*) | 285 | 32,419 | ||||||
| OrthoPediatrics Corp. (*) | 1,099 | 47,422 | ||||||
| Sanara Medtech, Inc. (*) | 748 | 15,603 | ||||||
| Senseonics Holdings, Inc. (*) | 55,194 | 56,850 | ||||||
| Shockwave Medical, Inc. (*) | 460 | 87,938 | ||||||
| Tandem Diabetes Care, Inc. (*) | 891 | 52,738 | ||||||
| Utah Medical Products, Inc. | 680 | 58,412 | ||||||
| 1,034,150 | ||||||||
The accompanying notes are an integral part of these financial statements.
132 Semi-Annual Report
| Description | Shares | Fair Value | ||||||
| Lazard US Systematic Small Cap Equity Portfolio (continued) | ||||||||
| Health Care Providers & Services | 1.9% | ||||||||
| agilon health, Inc. (*) | 3,600 | $ | 78,588 | |||||
| Apollo Medical Holdings, Inc. (*) | 1,797 | 69,346 | ||||||
| Cross Country Healthcare, Inc. (*) | 5,551 | 115,627 | ||||||
| DocGo, Inc. (*) | 7,079 | 50,544 | ||||||
| Innovage Holding Corp. (*) | 8,466 | 37,081 | ||||||
| Invitae Corp. (*) | 5,367 | 13,096 | ||||||
| ModivCare, Inc. (*) | 601 | 50,785 | ||||||
| Select Medical Holdings Corp. | 1,402 | 33,115 | ||||||
| 448,182 | ||||||||
| Health Care Technology | 1.0% | ||||||||
| Computer Programs and Systems, Inc. (*) | 1,438 | 45,973 | ||||||
| HealthStream, Inc. (*) | 837 | 18,171 | ||||||
| NextGen Healthcare, Inc. (*) | 3,479 | 60,674 | ||||||
| Phreesia, Inc. (*) | 1,623 | 40,591 | ||||||
| Schrodinger, Inc. (*) | 2,507 | 66,210 | ||||||
| Sharecare, Inc. (*) | 11,488 | 18,151 | ||||||
| 249,770 | ||||||||
| Hotels, Restaurants & Leisure | 1.4% | ||||||||
| Century Casinos, Inc. (*) | 4,850 | 34,920 | ||||||
| Dave & Buster’s Entertainment, Inc. (*) | 2,257 | 73,984 | ||||||
| Despegar.com Corp. (*) | 6,697 | 54,246 | ||||||
| Everi Holdings, Inc. (*) | 2,744 | 44,755 | ||||||
| RCI Hospitality Holdings, Inc. | 771 | 37,286 | ||||||
| Ruth’s Hospitality Group, Inc. | 2,447 | 39,788 | ||||||
| The Wendy’s Co. | 2,106 | 39,761 | ||||||
| 324,740 | ||||||||
| Household Durables | 1.9% | ||||||||
| Century Communities, Inc. | 783 | 35,212 | ||||||
| Ethan Allen Interiors, Inc. | 1,821 | 36,802 | ||||||
| KB Home | 1,949 | 55,469 | ||||||
| Landsea Homes Corp. (*) | 9,824 | 65,428 | ||||||
| Legacy Housing Corp. (*) | 2,907 | 37,936 | ||||||
The accompanying notes are an integral part of these financial statements.
Semi-Annual Report 133
| Description | Shares | Fair Value | ||||||
| Lazard US Systematic Small Cap Equity Portfolio (continued) | ||||||||
| M/I Homes, Inc. (*) | 1,541 | $ | 61,116 | |||||
| Meritage Homes Corp. (*) | 762 | 55,245 | ||||||
| The Lovesac Co. (*) | 1,872 | 51,480 | ||||||
| Tri Pointe Homes, Inc. (*) | 3,399 | 57,341 | ||||||
| 456,029 | ||||||||
| Household Products | 0.1% | ||||||||
| Oil-Dri Corp. of America | 425 | 13,026 | ||||||
| Independent Power &Renewable Electricity Producers | 0.3% | ||||||||
| TransAlta Corp. | 5,398 | 61,537 | ||||||
| Industrial Conglomerates | 0.1% | ||||||||
| Brookfield Business Corp.,Class A | 813 | 18,707 | ||||||
| Insurance | 1.0% | ||||||||
| Brookfield Asset Management Reinsurance Partners, Ltd. | 1,256 | 55,993 | ||||||
| Palomar Holdings, Inc. (*) | 922 | 59,377 | ||||||
| Stewart Information Services Corp. | 1,359 | 67,610 | ||||||
| The Hanover Insurance Group, Inc. | 352 | 51,480 | ||||||
| 234,460 | ||||||||
| Interactive Media & Services | 0.5% | ||||||||
| Cargurus, Inc. (*) | 2,294 | 49,298 | ||||||
| QuinStreet, Inc. (*) | 2,653 | 26,689 | ||||||
| Yelp, Inc. (*) | 1,934 | 53,707 | ||||||
| 129,694 | ||||||||
| Internet & Direct Marketing Retail | 0.5% | ||||||||
| Betterware de Mexico S.A.B. de C.V. | 904 | 7,811 | ||||||
| Liquidity Services, Inc. (*) | 5,033 | 67,643 | ||||||
| Stitch Fix, Inc.,Class A (*) | 8,628 | 42,622 | ||||||
| 118,076 | ||||||||
The accompanying notes are an integral part of these financial statements.
134 Semi-Annual Report
| Description | Shares | Fair Value | ||||||
| Lazard US Systematic Small Cap Equity Portfolio (continued) | ||||||||
| IT Services | 3.8% | ||||||||
| AvidXchange Holdings, Inc. (*) | 3,133 | $ | 19,237 | |||||
| Concentrix Corp. | 397 | 53,849 | ||||||
| CSG Systems International, Inc. | 1,523 | 90,893 | ||||||
| DigitalOcean Holdings, Inc. (*) | 1,026 | 42,435 | ||||||
| EVERTEC, Inc. | 1,481 | 54,619 | ||||||
| Exlservice Holdings, Inc. (*) | 552 | 81,326 | ||||||
| Grid Dynamics Holdings, Inc. (*) | 9,083 | 152,776 | ||||||
| I3 Verticals, Inc.,Class A (*) | 3,023 | 75,635 | ||||||
| IBEX Holdings, Ltd. (*) | 852 | 14,373 | ||||||
| Information Services Group, Inc. | 15,256 | 103,131 | ||||||
| International Money Express, Inc. (*) | 3,862 | 79,055 | ||||||
| Pagseguro Digital, Ltd., Class A (*) | 4,966 | 50,852 | ||||||
| Perficient, Inc. (*) | 425 | 38,968 | ||||||
| TTEC Holdings, Inc. | 740 | 50,239 | ||||||
| 907,388 | ||||||||
| Leisure Products | 0.9% | ||||||||
| Malibu Boats, Inc. ,Class A (*) | 1,160 | 61,144 | ||||||
| MasterCraft Boat Holdings, Inc. (*) | 3,227 | 67,928 | ||||||
| Smith & Wesson Brands, Inc. | 819 | 10,753 | ||||||
| Solo Brands, Inc.,Class A (*) | 9,563 | 38,826 | ||||||
| Vista Outdoor, Inc. (*) | 1,000 | 27,900 | ||||||
| 206,551 | ||||||||
| Life Sciences Tools & Services | 1.0% | ||||||||
| 10X Genomics, Inc.,Class A (*) | 1,262 | 57,106 | ||||||
| Harvard Bioscience, Inc. (*) | 4,869 | 17,528 | ||||||
| Medpace Holdings, Inc. (*) | 745 | 111,504 | ||||||
| Syneos Health, Inc. (*) | 752 | 53,903 | ||||||
| 240,041 | ||||||||
| Machinery | 2.6% | ||||||||
| AGCO Corp. | 552 | 54,482 | ||||||
| Allison Transmission Holdings, Inc. | 2,701 | 103,854 | ||||||
| Gates Industrial Corp. PLC (*) | 3,284 | 35,500 | ||||||
The accompanying notes are an integral part of these financial statements.
Semi-Annual Report 135
| Description | Shares | Fair Value | ||||||
| Lazard US Systematic Small Cap Equity Portfolio (continued) | ||||||||
| Helios Technologies, Inc. | 765 | $ | 50,681 | |||||
| Mueller Industries, Inc. | 1,590 | 84,731 | ||||||
| Pentair PLC | 1,815 | 83,073 | ||||||
| Proto Labs, Inc. (*) | 1,366 | 65,349 | ||||||
| REV Group, Inc. | 4,499 | 48,904 | ||||||
| Titan International, Inc. (*) | 5,385 | 81,314 | ||||||
| 607,888 | ||||||||
| Marine | 3.0% | ||||||||
| Costamare, Inc. | 4,256 | 51,497 | ||||||
| Diana Shipping, Inc. | 13,734 | 65,786 | ||||||
| Eagle Bulk Shipping, Inc. | 2,410 | 125,031 | ||||||
| Genco Shipping & Trading, Ltd. | 5,840 | 112,829 | ||||||
| Grindrod Shipping Holdings, Ltd. | 6,229 | 106,827 | ||||||
| Matson, Inc. | 1,043 | 76,014 | ||||||
| Safe Bulkers, Inc. | 13,534 | 51,700 | ||||||
| Star Bulk Carriers Corp. | 3,709 | 92,688 | ||||||
| ZIM Integrated Shipping Services, Ltd. | 449 | 21,206 | ||||||
| 703,578 | ||||||||
| Media | 1.3% | ||||||||
| Boston Omaha Corp.,Class A (*) | 4,304 | 88,878 | ||||||
| Entravision Communications Corp., Class A | 20,223 | 92,217 | ||||||
| iHeartMedia, Inc.,Class A (*) | 4,930 | 38,898 | ||||||
| Perion Network, Ltd. (*) | 1,402 | 25,488 | ||||||
| Scholastic Corp. | 1,530 | 55,034 | ||||||
| 300,515 | ||||||||
| Oil, Gas & Consumable Fuels | 2.0% | ||||||||
| Brigham Minerals, Inc.,Class A | 2,471 | 60,861 | ||||||
| Crescent Point Energy Corp. | 8,093 | 57,622 | ||||||
| DTE Midstream LLC (*) | 1,177 | 57,696 | ||||||
| Enerplus Corp. | 5,665 | 74,948 | ||||||
| Flex LNG, Ltd. (*) | 1,341 | 36,730 | ||||||
| Magnolia Oil &Gas Corp., Class A | 2,896 | 60,787 | ||||||
| Sabine Royalty Trust | 582 | 35,432 | ||||||
The accompanying notes are an integral part of these financial statements.
136 Semi-Annual Report
| Description | Shares | Fair Value | ||||||
| Lazard US Systematic Small Cap Equity Portfolio (continued) | ||||||||
| San Juan Basin Royalty Trust | 9,569 | $ | 83,059 | |||||
| World Fuel Services Corp. | 886 | 18,128 | ||||||
| 485,263 | ||||||||
| Paper & Forest Products | 0.9% | ||||||||
| Louisiana-Pacific Corp. | 1,571 | 82,336 | ||||||
| Resolute Forest Products, Inc. (*) | 10,077 | 128,583 | ||||||
| 210,919 | ||||||||
| Personal Products | 0.4% | ||||||||
| BellRing Brands, Inc. (*) | 680 | 16,925 | ||||||
| Herbalife Nutrition, Ltd. (*) | 494 | 10,102 | ||||||
| Medifast, Inc. | 266 | 48,016 | ||||||
| Nature’s Sunshine Products, Inc. (*) | 1,811 | 19,324 | ||||||
| 94,367 | ||||||||
| Pharmaceuticals | 1.5% | ||||||||
| Amphastar Pharmaceuticals, Inc. (*) | 1,518 | 52,811 | ||||||
| Arvinas, Inc. (*) | 1,518 | 63,893 | ||||||
| Atea Pharmaceuticals, Inc. (*) | 4,851 | 34,442 | ||||||
| Phibro Animal Health Corp., Class A | 3,376 | 64,583 | ||||||
| SIGA Technologies, Inc. | 7,818 | 90,532 | ||||||
| Supernus Pharmaceuticals, Inc. (*) | 1,748 | 50,552 | ||||||
| 356,813 | ||||||||
| Professional Services | 3.2% | ||||||||
| CRA International, Inc. | 1,473 | 131,568 | ||||||
| Franklin Covey Co. (*) | 1,948 | 89,959 | ||||||
| Heidrick & Struggles International, Inc. | 2,786 | 90,155 | ||||||
| HireQuest, Inc. | 1,675 | 23,601 | ||||||
| Kelly Services, Inc.,Class A | 3,454 | 68,493 | ||||||
| Korn Ferry | 1,460 | 84,709 | ||||||
| ManpowerGroup, Inc. | 497 | 37,976 | ||||||
| Resources Connection, Inc. | 5,787 | 117,881 | ||||||
| Science Applications International Corp. | 522 | 48,598 | ||||||
| TriNet Group, Inc. (*) | 831 | 64,502 | ||||||
| 757,442 | ||||||||
The accompanying notes are an integral part of these financial statements.
Semi-Annual Report 137
| Description | Shares | Fair Value | ||||||
| Lazard US Systematic Small Cap Equity Portfolio (continued) | ||||||||
| Real Estate Management & Development | 0.8% | ||||||||
| Forestar Group, Inc. (*) | 1,712 | $ | 23,437 | |||||
| Jones Lang LaSalle, Inc. (*) | 145 | 25,355 | ||||||
| Newmark Group, Inc., Class A | 4,566 | 44,153 | ||||||
| The RMR Group, Inc.,Class A | 1,463 | 41,476 | ||||||
| Zillow Group, Inc. Class A (*) | 1,469 | 46,729 | ||||||
| 181,150 | ||||||||
| Road & Rail | 0.9% | ||||||||
| AMERCO | 121 | 57,866 | ||||||
| ArcBest Corp. | 788 | 55,451 | ||||||
| Knight-Swift Transportation Holdings, Inc. | 1,020 | 47,216 | ||||||
| Ryder System, Inc. | 771 | 54,787 | ||||||
| 215,320 | ||||||||
| Semiconductors & Semiconductor Equipment | 2.5% | ||||||||
| Alpha & Omega Semiconductor, Ltd. (*) | 1,457 | 48,577 | ||||||
| Axcelis Technologies, Inc. (*) | 2,354 | 129,093 | ||||||
| Diodes, Inc. (*) | 582 | 37,580 | ||||||
| Kulicke & Soffa Industries, Inc. | 673 | 28,811 | ||||||
| Lattice Semiconductor Corp. (*) | 910 | 44,135 | ||||||
| Nova, Ltd. (*) | 576 | 50,993 | ||||||
| Onto Innovation, Inc. (*) | 607 | 42,332 | ||||||
| PDF Solutions, Inc. (*) | 2,483 | 53,409 | ||||||
| Semtech Corp. (*) | 1,095 | 60,192 | ||||||
| Tower Semiconductor, Ltd. (*) | 631 | 29,140 | ||||||
| Ultra Clean Holdings, Inc. (*) | 2,671 | 79,516 | ||||||
| 603,778 | ||||||||
| Software | 7.2% | ||||||||
| Absolute Software Corp. | 3,272 | 28,303 | ||||||
| Alarm.com Holdings, Inc. (*) | 491 | 30,373 | ||||||
| American Software, Inc.,Class A | 4,381 | 70,797 | ||||||
| Arteris, Inc. (*) | 5,359 | 37,352 | ||||||
| Blackbaud, Inc. (*) | 698 | 40,533 | ||||||
| Blackline, Inc. (*) | 418 | 27,839 | ||||||
The accompanying notes are an integral part of these financial statements.
138 Semi-Annual Report
| Description | Shares | Fair Value | ||||||
| Lazard US Systematic Small Cap Equity Portfolio (continued) | ||||||||
| Cerence, Inc. (*) | 704 | $ | 17,762 | |||||
| ChannelAdvisor Corp. (*) | 2,753 | 40,139 | ||||||
| Cognyte Software, Ltd. (*) | 8,950 | 38,037 | ||||||
| Coupa Software, Inc. (*) | 406 | 23,183 | ||||||
| Digital Turbine, Inc. (*) | 813 | 14,203 | ||||||
| Docebo, Inc. (*) | 1,014 | 29,071 | ||||||
| Dolby Laboratories, Inc., Class A | 854 | 61,112 | ||||||
| Domo, Inc.,Class B (*) | 534 | 14,845 | ||||||
| Elastic NV (*) | 759 | 51,362 | ||||||
| EngageSmart, Inc. (*) | 2,932 | 47,147 | ||||||
| Everbridge, Inc. (*) | 856 | 23,874 | ||||||
| EverCommerce, Inc. (*) | 5,398 | 48,798 | ||||||
| Gitlab, Inc.,Class A (*) | 916 | 48,676 | ||||||
| InterDigital, Inc. | 763 | 46,390 | ||||||
| Jamf Holding Corp. (*) | 1,791 | 44,363 | ||||||
| JFrog, Ltd. (*) | 1,347 | 28,381 | ||||||
| KnowBe4, Inc., Class A (*) | 3,072 | 47,985 | ||||||
| Magic Software Enterprises, Ltd. | 1,872 | 33,265 | ||||||
| nCino, Inc. (*) | 1,129 | 34,909 | ||||||
| PagerDuty, Inc. (*) | 1,584 | 39,252 | ||||||
| Progress Software Corp. | 1,881 | 85,209 | ||||||
| Q2 Holdings, Inc. (*) | 655 | 25,263 | ||||||
| Qualys, Inc. (*) | 394 | 49,699 | ||||||
| Rapid7, Inc. (*) | 953 | 63,660 | ||||||
| SEMrush Holdings, Inc.,Class A (*) | 2,835 | 36,657 | ||||||
| Smartsheet, Inc.,Class A (*) | 777 | 24,421 | ||||||
| Sprinklr, Inc. Class A (*) | 4,866 | 49,195 | ||||||
| Sprout Social, Inc.,Class A (*) | 771 | 44,772 | ||||||
| SPS Commerce, Inc. (*) | 757 | 85,579 | ||||||
| Tenable Holdings, Inc. (*) | 1,748 | 79,377 | ||||||
| The Descartes Systems Group, Inc. (*) | 1,072 | 66,528 | ||||||
| UserTesting, Inc. (*) | 10,541 | 52,916 | ||||||
| Verint Systems, Inc. (*) | 1,260 | 53,361 | ||||||
| Veritone, Inc. (*) | 2,088 | 13,635 | ||||||
| 1,698,223 | ||||||||
The accompanying notes are an integral part of these financial statements.
Semi-Annual Report 139
| Description | Shares | Fair Value | ||||||
| Lazard US Systematic Small Cap Equity Portfolio (continued) | ||||||||
| Specialty Retail | 2.7% | ||||||||
| Arhaus, Inc. (*) | 4,985 | $ | 22,432 | |||||
| AutoNation, Inc. (*) | 552 | 61,692 | ||||||
| Boot Barn Holdings, Inc. (*) | 485 | 33,421 | ||||||
| Five Below, Inc. (*) | 436 | 49,455 | ||||||
| Floor & Decor Holdings, Inc., Class A (*) | 649 | 40,861 | ||||||
| GameStop Corp.,Class A (*) | 440 | 53,812 | ||||||
| Group 1 Automotive, Inc. | 297 | 50,431 | ||||||
| MarineMax, Inc. (*) | 1,632 | 58,948 | ||||||
| Murphy USA, Inc. | 352 | 81,970 | ||||||
| RH (*) | 133 | 28,231 | ||||||
| Signet Jewelers, Ltd. | 795 | 42,501 | ||||||
| Sleep Number Corp. (*) | 935 | 28,938 | ||||||
| The Cato Corp.,Class A | 5,082 | 59,002 | ||||||
| Zumiez, Inc. (*) | 1,111 | 28,886 | ||||||
| 640,580 | ||||||||
| Technology Hardware, Storage & Peripherals | 0.5% | ||||||||
| Super Micro Computer, Inc. (*) | 2,288 | 92,321 | ||||||
| Xerox Holdings Corp. | 2,641 | 39,219 | ||||||
| 131,540 | ||||||||
| Textiles, Apparel & Luxury Goods | 2.0% | ||||||||
| Canada Goose Holdings, Inc. (*) | 2,817 | 50,734 | ||||||
| Crocs, Inc. (*) | 806 | 39,228 | ||||||
| Deckers Outdoor Corp. (*) | 175 | 44,686 | ||||||
| G-III Apparel Group, Ltd. (*) | 2,222 | 44,951 | ||||||
| Movado Group, Inc. | 2,933 | 90,718 | ||||||
| Oxford Industries, Inc. | 1,061 | 94,153 | ||||||
| Steven Madden, Ltd. | 1,420 | 45,738 | ||||||
| Tapestry, Inc. | 1,870 | 57,073 | ||||||
| 467,281 | ||||||||
The accompanying notes are an integral part of these financial statements.
140 Semi-Annual Report
| Description | Shares | Fair Value | ||||||
| Lazard US Systematic Small Cap Equity Portfolio (continued) | ||||||||
| Thrifts & Mortgage Finance | 1.2% | ||||||||
| Bridgewater Bancshares, Inc. (*) | 3,223 | $ | 52,019 | |||||
| Essent Group Ltd | 1,815 | 70,603 | ||||||
| Greene County Bancorp, Inc. | 552 | 25,000 | ||||||
| Guild Holdings Co.,Class A | 1,311 | 13,359 | ||||||
| Luther Burbank Corp. | 2,392 | 31,216 | ||||||
| Mr Cooper Group, Inc. (*) | 1,165 | 42,802 | ||||||
| TrustCo Bank Corp. NY | 1,402 | 43,238 | ||||||
| 278,237 | ||||||||
| Tobacco | 0.2% | ||||||||
| Vector Group, Ltd. | 3,691 | 38,756 | ||||||
| Trading Companies & Distributors | 3.7% | ||||||||
| BlueLinx Holdings, Inc. (*) | 886 | 59,194 | ||||||
| Boise Cascade Co. | 1,266 | 75,314 | ||||||
| Core & Main, Inc.,Class A (*) | 2,515 | 56,085 | ||||||
| GMS, Inc. (*) | 1,692 | 75,294 | ||||||
| Hudson Technologies, Inc. (*) | 4,651 | 34,929 | ||||||
| MRC Global, Inc. (*) | 7,098 | 70,696 | ||||||
| MSC Industrial Direct Co., Inc. Class A | 771 | 57,910 | ||||||
| NOW, Inc. (*) | 6,333 | 61,937 | ||||||
| SiteOne Landscape Supply, Inc. (*) | 709 | 84,279 | ||||||
| Titan Machinery, Inc. (*) | 2,857 | 64,025 | ||||||
| Triton International, Ltd. | 1,414 | 74,447 | ||||||
| Univar Solutions, Inc. (*) | 2,944 | 73,217 | ||||||
| Veritiv Corp. (*) | 739 | 80,218 | ||||||
| 867,545 | ||||||||
| Transportation Infrastructure | 0.1% | ||||||||
| Corp. America Airports SA (*) | 3,740 | 20,869 | ||||||
| Total Common Stocks (Cost $25,351,450) | 23,359,394 | |||||||
The accompanying notes are an integral part of these financial statements.
Semi-Annual Report 141
| Description | Shares | Fair Value | ||||||
| Lazard US Systematic Small Cap Equity Portfolio (concluded) | ||||||||
| Mortgage Real Estate Investment Trusts | 0.2% | ||||||||
| New Residential Investment Corp. (Cost $54,493) | 4,869 | $ | 45,379 | |||||
| Rights | 0.0% | ||||||||
| Biotechnology | 0.0% | ||||||||
| Adamas Pharmaceuticals, Inc. CVR | ||||||||
| Expires 2024 (¢) | 1,139 | 0 | ||||||
| Expires 2025 (¢) | 1,139 | 0 | ||||||
| Total Rights (Cost $137) | 0 | |||||||
| Short-Term Investments | 1.5% | ||||||||
| State Street Institutional Treasury Money Market Fund, Premier Class, 1.04% (7 day yield) (Cost $346,027) | 346,027 | 346,027 | ||||||
| Total Investments | 100.5% (Cost $25,752,107) | $ | 23,750,800 | ||||||
| Liabilities in Excess of Cash and Other Assets | (0.5)% | (110,298 | ) | ||||||
| Net Assets | 100.0% | $ | 23,640,502 | ||||||
The accompanying notes are an integral part of these financial statements.
142 Semi-Annual Report
The Lazard Funds, Inc. Notes to Portfolios of Investments
June 30, 2022 (unaudited)
| (*) | Non-income producing security. |
| (‡) | Security valued using Level 2 inputs, based on reference to a similar security which was trading on an active market, under GAAP hierarchy – see Note 9 in the Notes to Financial Statements. |
| (#) | Pursuant to Rule 144A under the Securities Act of 1933, these securities may only be traded among “qualified institutional buyers.” At June 30, 2022, these securities amounted to 1.7% of net assets of Lazard Emerging Markets Equity Advantage Portfolio. |
| (¢) | Security in which significant unobservable inputs (Level 3) were used in determining fair value. |
| (^) | Refer to Note 5 in the Notes to Financial Statements for further details related to holdings of 5% voting securities of portfolio companies. |
| (») | The Portfolio, at all times, maintains portfolio securities in sufficient amount to cover its obligations related to investments in forward currency contracts. |
Security Abbreviations:
| ADR | — | American Depositary Receipt |
| CVR | — | Contingent Value Rights |
| GDR | — | Global Depositary Receipt |
| NVDR | — | Non-Voting Depositary Receipt |
| PJSC | — | Public Joint Stock Company |
| REIT | — | Real Estate Investment Trust |
| Currency Abbreviations: | |||||
| AUD | — | Australian Dollar | GBP | — | British Pound Sterling |
| CAD | — | Canadian Dollar | HKD | — | Hong-Kong Dollar |
| CHF | — | Swiss Franc | USD | — | United States Dollar |
| EUR | — | Euro | |||
| Counterparty Abbreviations: | |||||
| BNP | — | BNP Paribas SA | MEL | — | The Bank of New York Mellon Corp. |
| CAN CIT | — — | Canadian Imperial Bank of Commerce Citibank NA | MSC RBC | — — | Morgan Stanley & Co. Royal Bank of Canada |
| HSB | — | HSBC Bank USA NA | SCB | — | Standard Chartered Bank |
| SSB | — | State Street Bank and Trust Co. | |||
The accompanying notes are an integral part of these financial statements.
Semi-Annual Report 143
Portfolio holdings by industry (as a percentage of net assets), for those Portfolios previously presented by country:
| Industry† | Lazard Developing Markets Equity Portfolio | Lazard Emerging Markets Core Equity Portfolio | Lazard Emerging Markets Equity Advantage Portfolio | Lazard Emerging Markets Equity Portfolio | |||||||||||||
| Common & Preferred Stocks | |||||||||||||||||
| Aerospace & Defense | — | % | — | % | — | % | — | % | |||||||||
| Air Freight & Logistics | 2.5 | — | — | — | |||||||||||||
| Airlines | — | — | 0.3 | — | |||||||||||||
| Auto Components | 1.0 | — | 0.3 | 2.0 | |||||||||||||
| Automobiles | 1.6 | 0.9 | 4.0 | 3.9 | |||||||||||||
| Banks | 16.2 | 14.8 | 16.5 | 20.1 | |||||||||||||
| Beverages | 3.6 | 2.3 | 1.9 | — | |||||||||||||
| Biotechnology | — | 0.8 | 0.2 | — | |||||||||||||
| Building Products | — | — | — | — | |||||||||||||
| Capital Markets | — | 1.1 | 1.3 | — | |||||||||||||
| Chemicals | 1.6 | 2.7 | 3.7 | 1.2 | |||||||||||||
| Commercial Services & Suppliers | — | — | — | — | |||||||||||||
| Communications Equipment | 0.8 | 0.6 | — | — | |||||||||||||
| Construction & Engineering | — | 1.2 | 1.3 | — | |||||||||||||
| Construction Materials | — | 1.1 | 0.2 | 2.3 | |||||||||||||
| Consumer Finance | 1.1 | — | 0.2 | — | |||||||||||||
| Containers & Packaging | — | — | — | — | |||||||||||||
| Diversified Consumer Services | — | — | — | — | |||||||||||||
| Diversified Financial Services | — | — | 1.0 | — | |||||||||||||
| Diversified Telecommunication Services | — | 1.3 | 2.3 | 3.3 | |||||||||||||
| Electric Utilities | — | 1.1 | 1.0 | — | |||||||||||||
| Electrical Equipment | 3.6 | — | 0.7 | — | |||||||||||||
| Electronic Equipment, Instruments & Components | 4.5 | 0.9 | 3.3 | 2.3 | |||||||||||||
| Energy Equipment & Services | — | 1.5 | — | — | |||||||||||||
| Entertainment | — | 2.8 | 1.5 | — | |||||||||||||
| Food & Staples Retailing | — | — | 1.1 | — | |||||||||||||
| Food Products | — | 0.8 | 1.9 | 1.5 | |||||||||||||
| Gas Utilities | — | — | 0.8 | 0.9 | |||||||||||||
| Health Care Equipment & Supplies | — | — | 0.2 | — | |||||||||||||
| Health Care Providers & Services | — | — | 0.6 | 3.3 | |||||||||||||
| Hotels, Restaurants & Leisure | 2.0 | 1.0 | 0.3 | 1.1 | |||||||||||||
| Household Durables | 2.0 | 1.7 | 0.9 | 2.7 | |||||||||||||
| Household Products | — | — | 0.6 | 0.9 | |||||||||||||
| Independent Power & Renewable Electricity Producers | — | — | 1.2 | 0.9 | |||||||||||||
| Industrial Conglomerates | — | 0.8 | 0.2 | 1.0 | |||||||||||||
| Insurance | 1.7 | 4.1 | 2.0 | 5.5 | |||||||||||||
| Interactive Media & Services | 9.6 | 5.9 | 5.5 | — | |||||||||||||
The accompanying notes are an integral part of these financial statements.
144 Semi-Annual Report
| Lazard Emerging Markets Strategic Equity Portfolio | Lazard Equity Franchise Portfolio | Lazard Global Equity Select Portfolio | Lazard Global Listed Infrastructure Portfolio | Lazard Global Strategic Equity Portfolio | ||||||||||||||||
| — | % | — | % | 1.2 | % | — | % | 0.6 | % | |||||||||||
| — | — | — | — | — | ||||||||||||||||
| — | — | — | — | 0.3 | ||||||||||||||||
| 1.0 | — | — | — | 0.9 | ||||||||||||||||
| 0.9 | — | — | — | 0.6 | ||||||||||||||||
| 20.4 | — | 3.8 | — | 3.2 | ||||||||||||||||
| 1.1 | 2.0 | 7.0 | — | 5.0 | ||||||||||||||||
| — | — | — | — | 2.3 | ||||||||||||||||
| — | — | 0.6 | — | — | ||||||||||||||||
| 1.1 | — | 6.1 | — | 6.3 | ||||||||||||||||
| 1.0 | — | — | — | 2.6 | ||||||||||||||||
| — | 4.0 | — | — | — | ||||||||||||||||
| — | 4.7 | 2.1 | — | — | ||||||||||||||||
| — | 6.7 | — | 12.2 | — | ||||||||||||||||
| 1.0 | — | — | — | — | ||||||||||||||||
| 0.8 | — | — | — | — | ||||||||||||||||
| — | — | 0.8 | — | — | ||||||||||||||||
| — | 3.1 | — | — | — | ||||||||||||||||
| — | — | — | — | — | ||||||||||||||||
| 1.2 | — | — | — | — | ||||||||||||||||
| — | — | — | 12.9 | 1.6 | ||||||||||||||||
| — | — | 3.1 | — | 3.1 | ||||||||||||||||
| 2.5 | — | 2.4 | — | 1.7 | ||||||||||||||||
| — | — | — | — | 1.8 | ||||||||||||||||
| 1.9 | — | 1.7 | — | 2.4 | ||||||||||||||||
| 1.1 | — | — | — | — | ||||||||||||||||
| — | — | — | — | — | ||||||||||||||||
| 1.5 | — | — | 9.0 | — | ||||||||||||||||
| — | 6.6 | 2.4 | — | 4.9 | ||||||||||||||||
| 2.2 | 16.2 | — | — | 3.5 | ||||||||||||||||
| 4.7 | 7.8 | 1.9 | — | — | ||||||||||||||||
| 2.8 | — | 0.6 | — | — | ||||||||||||||||
| 0.8 | — | 1.8 | — | — | ||||||||||||||||
| — | — | — | — | — | ||||||||||||||||
| — | — | — | — | — | ||||||||||||||||
| 2.8 | — | 3.4 | — | 4.5 | ||||||||||||||||
| 3.7 | — | 5.0 | — | 5.8 | ||||||||||||||||
The accompanying notes are an integral part of these financial statements.
Semi-Annual Report 145
Portfolio holdings by industry (as a percentage of net assets), for those Portfolios previously presented by country (continued):
| Industry† | Lazard Developing Markets Equity Portfolio | Lazard Emerging Markets Core Equity Portfolio | Lazard Emerging Markets Equity Advantage Portfolio | Lazard Emerging Markets Equity Portfolio | |||||||||||||
| Internet & Direct Marketing Retail | 6.3 | % | 7.5 | % | 7.3 | % | — | % | |||||||||
| IT Services | 1.3 | 2.8 | 3.3 | — | |||||||||||||
| Leisure Products | — | — | — | — | |||||||||||||
| Life Sciences Tools & Services | — | 0.8 | 0.6 | — | |||||||||||||
| Machinery | 2.7 | 2.6 | 0.8 | 1.6 | |||||||||||||
| Marine | — | — | 1.3 | — | |||||||||||||
| Media | — | — | 0.4 | — | |||||||||||||
| Metals & Mining | 1.0 | 3.3 | 3.4 | 3.9 | |||||||||||||
| Multiline Retail | — | 0.6 | — | — | |||||||||||||
| Multi-Utilities | — | — | — | — | |||||||||||||
| Oil, Gas & Consumable Fuels | 2.2 | 7.1 | 5.2 | 8.2 | |||||||||||||
| Paper & Forest Products | 0.8 | 1.4 | 0.1 | 0.6 | |||||||||||||
| Personal Products | — | 0.8 | — | 3.3 | |||||||||||||
| Pharmaceuticals | 1.2 | — | 2.0 | 0.9 | |||||||||||||
| Professional Services | — | — | — | — | |||||||||||||
| Real Estate Management & Development | — | — | 1.4 | 3.0 | |||||||||||||
| Road & Rail | 2.3 | 0.7 | — | — | |||||||||||||
| Semiconductors & Semiconductor Equipment | 13.0 | 11.6 | 9.1 | 10.0 | |||||||||||||
| Software | — | — | — | — | |||||||||||||
| Specialty Retail | 7.6 | 1.4 | 1.0 | 0.7 | |||||||||||||
| Technology Hardware, Storage & Peripherals | 6.0 | 4.9 | 4.6 | 7.6 | |||||||||||||
| Textiles, Apparel & Luxury Goods | 1.2 | 2.1 | 0.7 | — | |||||||||||||
| Tobacco | — | — | 0.5 | 0.9 | |||||||||||||
| Trading Companies & Distributors | — | — | — | — | |||||||||||||
| Transportation Infrastructure | 0.9 | 3.5 | 0.3 | 1.8 | |||||||||||||
| Water Utilities | — | — | — | — | |||||||||||||
| Wireless Telecommunication Services | — | 0.7 | 1.2 | 1.9 | |||||||||||||
| Subtotal | 98.3 | 99.2 | 98.2 | 97.3 | |||||||||||||
| Short-Term Investments | 1.4 | 0.5 | 1.4 | 1.9 | |||||||||||||
| Total Investments | 99.7 | % | 99.7 | % | 99.6 | % | 99.2 | % | |||||||||
| † | Industry classifications may be different than those used for compliance monitoring purposes. |
The accompanying notes are an integral part of these financial statements.
146 Semi-Annual Report
| Lazard Emerging Markets Strategic Equity Portfolio | Lazard Equity Franchise Portfolio | Lazard Global Equity Select Portfolio | Lazard Global Listed Infrastructure Portfolio | Lazard Global Strategic Equity Portfolio | ||||||||||||||||
| 4.5 | % | — | % | 3.8 | % | — | % | — | % | |||||||||||
| 3.8 | 13.5 | 4.6 | — | 4.7 | ||||||||||||||||
| — | — | 1.6 | — | — | ||||||||||||||||
| — | — | 5.9 | — | 5.7 | ||||||||||||||||
| 2.3 | — | 1.0 | — | — | ||||||||||||||||
| — | — | — | — | — | ||||||||||||||||
| — | 10.1 | 1.0 | 3.8 | 1.0 | ||||||||||||||||
| 5.4 | — | — | — | 1.2 | ||||||||||||||||
| — | — | 3.9 | — | 2.4 | ||||||||||||||||
| — | — | — | 17.8 | — | ||||||||||||||||
| 5.0 | — | — | — | — | ||||||||||||||||
| — | — | — | — | — | ||||||||||||||||
| 1.7 | — | 1.9 | — | 1.0 | ||||||||||||||||
| 1.1 | — | 5.1 | — | 6.3 | ||||||||||||||||
| — | 4.0 | 7.2 | — | 4.0 | ||||||||||||||||
| 1.3 | — | — | — | — | ||||||||||||||||
| — | 2.0 | 1.2 | 15.8 | 1.0 | ||||||||||||||||
| 9.5 | 4.7 | 4.6 | — | 6.6 | ||||||||||||||||
| — | — | 5.2 | — | 10.2 | ||||||||||||||||
| — | 3.9 | 2.4 | — | — | ||||||||||||||||
| 4.4 | — | — | — | — | ||||||||||||||||
| 1.4 | 5.9 | 3.7 | — | — | ||||||||||||||||
| 1.6 | — | — | — | — | ||||||||||||||||
| — | — | 1.5 | — | 1.7 | ||||||||||||||||
| — | — | — | 11.6 | — | ||||||||||||||||
| — | — | — | 9.3 | — | ||||||||||||||||
| 2.4 | — | — | — | — | ||||||||||||||||
| 96.9 | 95.2 | 98.5 | 92.4 | 96.9 | ||||||||||||||||
| 2.4 | 3.0 | 1.4 | 7.8 | 3.3 | ||||||||||||||||
| 99.3 | % | 98.2 | % | 99.9 | % | 100.2 | % | 100.2 | % | |||||||||||
The accompanying notes are an integral part of these financial statements.
Semi-Annual Report 147
Portfolio holdings by industry (as a percentage of net assets), for those Portfolios previously presented by country (continued):
| Industry† | Lazard International Equity Advantage Portfolio | Lazard International Equity Portfolio | Lazard International Equity Select Portfolio | Lazard International Quality Growth Portfolio | |||||||||||||
| Common & Preferred Stocks | |||||||||||||||||
| Aerospace & Defense | 1.0 | % | 5.4 | % | 3.7 | % | — | % | |||||||||
| Air Freight & Logistics | 1.7 | — | — | — | |||||||||||||
| Airlines | — | 1.3 | 1.1 | — | |||||||||||||
| Auto Components | — | 1.3 | 1.2 | — | |||||||||||||
| Automobiles | 3.6 | 1.2 | 0.9 | — | |||||||||||||
| Banks | 8.1 | 5.5 | 9.6 | 7.4 | |||||||||||||
| Beverages | — | 6.2 | 2.5 | 5.8 | |||||||||||||
| Biotechnology | 0.3 | — | — | 2.9 | |||||||||||||
| Building Products | 2.7 | 1.3 | 1.4 | 2.4 | |||||||||||||
| Capital Markets | 2.9 | 3.2 | — | 5.2 | |||||||||||||
| Chemicals | 2.0 | 5.1 | 5.6 | — | |||||||||||||
| Commercial Services & Suppliers | 0.9 | — | — | — | |||||||||||||
| Communications Equipment | 1.2 | — | — | — | |||||||||||||
| Construction & Engineering | 0.5 | — | — | — | |||||||||||||
| Construction Materials | — | — | — | — | |||||||||||||
| Consumer Finance | — | — | — | — | |||||||||||||
| Containers & Packaging | — | — | — | — | |||||||||||||
| Distributors | — | — | — | — | |||||||||||||
| Diversified Consumer Services | — | — | — | — | |||||||||||||
| Diversified Financial Services | 0.7 | — | — | — | |||||||||||||
| Diversified Telecommunication Services | 0.2 | 1.2 | 1.9 | — | |||||||||||||
| Electric Utilities | 3.1 | 1.4 | — | — | |||||||||||||
| Electrical Equipment | 1.5 | 2.5 | 4.4 | 1.9 | |||||||||||||
| Electronic Equipment, Instruments & Components | 0.1 | — | — | 2.2 | |||||||||||||
| Energy Equipment & Services | — | — | — | — | |||||||||||||
| Entertainment | 1.1 | 2.4 | 1.2 | 3.4 | |||||||||||||
| Equity Real Estate Investment Trusts (REITs) | 1.4 | — | — | — | |||||||||||||
| Food & Staples Retailing | 1.7 | 1.7 | — | 2.4 | |||||||||||||
| Food Products | 1.7 | — | — | — | |||||||||||||
| Gas Utilities | — | 1.3 | 1.7 | — | |||||||||||||
| Health Care Equipment & Supplies | 0.9 | 3.8 | 1.8 | 5.0 | |||||||||||||
| Health Care Providers & Services | — | — | — | — | |||||||||||||
| Health Care Technology | 0.1 | — | — | — | |||||||||||||
| Hotels, Restaurants & Leisure | 1.9 | 1.4 | 1.8 | — | |||||||||||||
| Household Durables | 1.3 | — | — | — | |||||||||||||
| Household Products | — | — | — | 0.5 | |||||||||||||
The accompanying notes are an integral part of these financial statements.
148 Semi-Annual Report
| Lazard International Small Cap Equity Portfolio | Lazard International Strategic Equity Portfolio | Lazard Managed Equity Volatility Portfolio | Lazard US Equity Concentrated Portfolio | Lazard US Equity Focus Portfolio | ||||||||||||||||
| 1.5 | % | 6.7 | % | 1.9 | % | — | % | — | % | |||||||||||
| 0.9 | — | — | — | — | ||||||||||||||||
| 1.1 | 1.5 | — | — | — | ||||||||||||||||
| 1.0 | 1.5 | — | — | 0.9 | ||||||||||||||||
| — | 1.5 | — | — | — | ||||||||||||||||
| 4.8 | 7.5 | 2.4 | — | 5.7 | ||||||||||||||||
| 2.6 | 9.1 | 1.4 | — | — | ||||||||||||||||
| — | 1.7 | 2.4 | — | — | ||||||||||||||||
| 1.9 | 1.7 | — | 2.1 | — | ||||||||||||||||
| 5.7 | 1.9 | 1.8 | 4.8 | 3.8 | ||||||||||||||||
| 4.1 | 3.9 | 1.1 | — | — | ||||||||||||||||
| 3.5 | — | 2.7 | 4.7 | 3.0 | ||||||||||||||||
| — | — | 0.7 | — | 2.5 | ||||||||||||||||
| 1.7 | — | — | — | — | ||||||||||||||||
| — | — | — | 2.7 | — | ||||||||||||||||
| — | — | 0.2 | — | 4.2 | ||||||||||||||||
| — | — | 0.2 | — | — | ||||||||||||||||
| — | — | — | 5.2 | — | ||||||||||||||||
| — | — | 0.8 | — | — | ||||||||||||||||
| 1.2 | — | 0.3 | — | — | ||||||||||||||||
| 0.8 | — | 5.1 | — | — | ||||||||||||||||
| — | 1.3 | 4.8 | — | — | ||||||||||||||||
| — | 5.0 | 0.2 | — | — | ||||||||||||||||
| 1.0 | 1.2 | 0.6 | — | — | ||||||||||||||||
| 0.7 | — | — | — | — | ||||||||||||||||
| 0.9 | 2.0 | 0.8 | 1.0 | — | ||||||||||||||||
| 2.3 | — | 4.3 | 7.4 | 1.9 | ||||||||||||||||
| 1.5 | 1.1 | 6.1 | 7.3 | 3.5 | ||||||||||||||||
| 1.8 | — | 5.5 | — | — | ||||||||||||||||
| 3.1 | — | 3.0 | — | — | ||||||||||||||||
| 3.4 | 4.2 | 1.0 | 6.7 | 4.9 | ||||||||||||||||
| 1.5 | — | 3.5 | — | 1.8 | ||||||||||||||||
| — | — | 0.3 | 1.5 | — | ||||||||||||||||
| 1.1 | 2.0 | 2.3 | 2.7 | 4.1 | ||||||||||||||||
| 1.9 | — | 0.3 | — | — | ||||||||||||||||
| 0.9 | — | 4.5 | — | — | ||||||||||||||||
The accompanying notes are an integral part of these financial statements.
Semi-Annual Report 149
Portfolio holdings by industry (as a percentage of net assets), for those Portfolios previously presented by country (continued):
| Industry† | Lazard International Equity Advantage Portfolio | Lazard International Equity Portfolio | Lazard International Equity Select Portfolio | Lazard International Quality Growth Portfolio | |||||||||||||
| Independent Power & Renewable Electricity Producers | 0.7 | % | 1.0 | % | 1.6 | % | — | % | |||||||||
| Industrial Conglomerates | 1.6 | 0.9 | — | — | |||||||||||||
| Insurance | 5.3 | 4.4 | 6.6 | 9.7 | |||||||||||||
| Interactive Media & Services | — | 0.9 | 2.8 | 4.7 | |||||||||||||
| Internet & Direct Marketing Retail | 0.1 | 1.6 | 1.9 | 2.3 | |||||||||||||
| IT Services | 2.5 | 1.7 | 2.4 | — | |||||||||||||
| Leisure Products | 1.0 | 4.6 | 2.6 | 2.9 | |||||||||||||
| Life Sciences Tools & Services | 0.4 | 2.0 | 1.2 | — | |||||||||||||
| Machinery | 0.3 | 1.8 | 1.2 | 0.6 | |||||||||||||
| Marine | 1.7 | — | — | — | |||||||||||||
| Media | 0.3 | — | — | — | |||||||||||||
| Metals & Mining | 4.2 | 1.5 | 1.0 | — | |||||||||||||
| Multiline Retail | — | — | — | 3.0 | |||||||||||||
| Multi-Utilities | — | 2.4 | 2.0 | — | |||||||||||||
| Oil, Gas & Consumable Fuels | 4.7 | 7.6 | 8.4 | — | |||||||||||||
| Personal Products | 3.1 | 1.6 | 1.4 | 2.8 | |||||||||||||
| Pharmaceuticals | 12.6 | 7.2 | 6.9 | 1.7 | |||||||||||||
| Professional Services | 1.9 | 4.3 | 6.4 | 9.4 | |||||||||||||
| Real Estate Management & Development | 1.2 | 2.2 | 1.8 | — | |||||||||||||
| Road & Rail | — | — | — | — | |||||||||||||
| Semiconductors & Semiconductor Equipment | 3.2 | 3.3 | 5.2 | 7.4 | |||||||||||||
| Software | 1.6 | — | — | 4.5 | |||||||||||||
| Specialty Retail | 2.0 | 1.2 | 0.8 | 2.7 | |||||||||||||
| Technology Hardware, Storage & Peripherals | 0.7 | — | — | — | |||||||||||||
| Textiles, Apparel & Luxury Goods | 1.3 | 1.4 | 0.9 | 3.3 | |||||||||||||
| Thrifts & Mortgage Finance | — | — | — | — | |||||||||||||
| Tobacco | 2.8 | — | — | — | |||||||||||||
| Trading Companies & Distributors | 2.2 | 1.1 | 1.5 | 3.1 | |||||||||||||
| Water Utilities | — | — | — | — | |||||||||||||
| Wireless Telecommunication Services | 2.7 | — | — | — | |||||||||||||
| Subtotal | 98.7 | 98.9 | 95.4 | 97.2 | |||||||||||||
| Short-Term Investments | 0.3 | 1.8 | 4.2 | 2.5 | |||||||||||||
| Total Investments | 99.0 | % | 100.7 | % | 99.6 | % | 99.7 | % | |||||||||
| † | Industry classifications may be different than those used for compliance monitoring purposes. |
The accompanying notes are an integral part of these financial statements.
150 Semi-Annual Report
| Lazard International Small Cap Equity Portfolio | Lazard International Strategic Equity Portfolio | Lazard Managed Equity Volatility Portfolio | Lazard US Equity Concentrated Portfolio | Lazard US Equity Focus Portfolio | ||||||||||||||||
| — | % | 1.5 | % | 0.6 | % | — | % | — | % | |||||||||||
| — | — | 0.5 | — | 3.5 | ||||||||||||||||
| 2.4 | 6.5 | 4.6 | — | 4.0 | ||||||||||||||||
| 1.0 | — | 1.0 | 9.2 | 6.6 | ||||||||||||||||
| — | — | — | — | 4.5 | ||||||||||||||||
| 3.2 | 2.3 | 3.3 | 14.2 | 5.1 | ||||||||||||||||
| 1.9 | 3.3 | 0.3 | — | — | ||||||||||||||||
| — | 1.1 | 0.5 | 1.5 | 6.8 | ||||||||||||||||
| 4.3 | 1.0 | 0.4 | 4.7 | — | ||||||||||||||||
| — | — | 0.4 | — | — | ||||||||||||||||
| — | 1.0 | 2.2 | — | — | ||||||||||||||||
| 1.5 | 1.8 | 0.7 | — | — | ||||||||||||||||
| — | — | — | 4.7 | 2.6 | ||||||||||||||||
| — | 2.3 | 2.5 | — | — | ||||||||||||||||
| 2.4 | 2.4 | 1.1 | — | — | ||||||||||||||||
| — | — | 1.4 | — | — | ||||||||||||||||
| 2.1 | 5.0 | 8.6 | — | 5.4 | ||||||||||||||||
| 4.3 | 5.8 | 1.4 | 2.3 | — | ||||||||||||||||
| 7.9 | 2.7 | 1.4 | — | — | ||||||||||||||||
| — | 1.4 | 0.9 | — | 3.9 | ||||||||||||||||
| 1.9 | 3.8 | 1.8 | 11.9 | 5.0 | ||||||||||||||||
| 4.0 | — | 1.8 | 1.8 | 9.1 | ||||||||||||||||
| 4.4 | 1.4 | 1.0 | 3.2 | 3.1 | ||||||||||||||||
| 1.0 | — | 0.6 | — | — | ||||||||||||||||
| 0.9 | — | 0.2 | — | 1.8 | ||||||||||||||||
| — | 1.1 | — | — | — | ||||||||||||||||
| — | — | 1.0 | — | — | ||||||||||||||||
| 1.8 | — | 0.2 | — | — | ||||||||||||||||
| 0.9 | — | — | — | — | ||||||||||||||||
| — | — | 1.4 | — | — | ||||||||||||||||
| 96.8 | 98.2 | 98.0 | 99.6 | 97.7 | ||||||||||||||||
| 2.2 | 1.1 | 1.6 | 1.2 | 2.3 | ||||||||||||||||
| 99.0 | % | 99.3 | % | 99.6 | % | 100.8 | % | 100.0 | % | |||||||||||
The accompanying notes are an integral part of these financial statements.
Semi-Annual Report 151
Portfolio holdings by industry (as a percentage of net assets), for those Portfolios previously presented by country (concluded):
| Industry† | Lazard US Small- Mid Cap Equity Portfolio | Lazard US Sustainable Equity Portfolio | Lazard US Systematic Small Cap Equity Portfolio | ||||||||||
| Common & Preferred Stocks | |||||||||||||
| Aerospace & Defense | 2.5 | % | — | % | 0.9 | % | |||||||
| Air Freight & Logistics | — | — | 0.7 | ||||||||||
| Airlines | 1.0 | — | — | ||||||||||
| Auto Components | — | 0.9 | 0.6 | ||||||||||
| Automobiles | — | — | 0.4 | ||||||||||
| Banks | 9.4 | 6.8 | 3.1 | ||||||||||
| Beverages | — | — | 1.0 | ||||||||||
| Biotechnology | 1.8 | 0.8 | 8.5 | ||||||||||
| Building Products | 4.5 | 0.5 | 2.8 | ||||||||||
| Capital Markets | 1.3 | 4.2 | 1.3 | ||||||||||
| Chemicals | 2.5 | 1.8 | 3.4 | ||||||||||
| Commercial Services & Suppliers | — | 3.2 | 2.7 | ||||||||||
| Communications Equipment | 2.3 | 1.8 | 1.2 | ||||||||||
| Construction & Engineering | — | — | 0.9 | ||||||||||
| Construction Materials | 0.9 | — | 0.6 | ||||||||||
| Consumer Finance | — | — | 0.2 | ||||||||||
| Containers & Packaging | 2.9 | 3.0 | 0.6 | ||||||||||
| Distributors | — | — | 0.6 | ||||||||||
| Diversified Consumer Services | — | — | 0.7 | ||||||||||
| Diversified Telecommunication Services | — | — | 0.6 | ||||||||||
| Electric Utilities | — | — | 0.3 | ||||||||||
| Electrical Equipment | 4.0 | 2.0 | 1.5 | ||||||||||
| Electronic Equipment, Instruments & Components | 1.9 | 0.7 | 1.3 | ||||||||||
| Energy Equipment & Services | 2.1 | — | 0.1 | ||||||||||
| Entertainment | 1.7 | 1.2 | 0.8 | ||||||||||
| Equity Real Estate Investment Trusts (REITs) | 6.3 | 2.5 | 4.0 | ||||||||||
| Food & Staples Retailing | 1.0 | 2.1 | 1.4 | ||||||||||
| Food Products | 2.3 | — | 2.8 | ||||||||||
| Gas Utilities | 2.1 | — | 0.3 | ||||||||||
| Health Care Equipment & Supplies | 1.9 | 4.9 | 4.4 | ||||||||||
| Health Care Providers & Services | 1.4 | 6.4 | 1.9 | ||||||||||
| Health Care Technology | 1.1 | — | 1.0 | ||||||||||
| Hotels, Restaurants & Leisure | 1.9 | 1.0 | 1.4 | ||||||||||
| Household Durables | 2.2 | — | 1.9 | ||||||||||
| Household Products | — | 2.7 | 0.1 | ||||||||||
| Independent Power & Renewable Electricity Producers | — | — | 0.3 | ||||||||||
| Industrial Conglomerates | — | — | 0.1 | ||||||||||
| Insurance | 3.8 | — | 1.0 | ||||||||||
The accompanying notes are an integral part of these financial statements.
152 Semi-Annual Report
| Industry† | Lazard US Small- Mid Cap Equity Portfolio | Lazard US Sustainable Equity Portfolio | Lazard US Systematic Small Cap Equity Portfolio | ||||||||||
| Interactive Media & Services | 2.1 | % | — | % | 0.5 | % | |||||||
| Internet & Direct Marketing Retail | — | — | 0.5 | ||||||||||
| IT Services | 2.4 | 6.7 | 3.8 | ||||||||||
| Leisure Products | 2.5 | — | 0.9 | ||||||||||
| Life Sciences Tools & Services | 4.5 | 8.4 | 1.0 | ||||||||||
| Machinery | 4.4 | 3.2 | 2.6 | ||||||||||
| Marine | — | — | 3.0 | ||||||||||
| Media | — | — | 1.3 | ||||||||||
| Mortgage Real Estate Investment Trusts (REITs) | — | — | 0.2 | ||||||||||
| Oil, Gas & Consumable Fuels | 3.1 | — | 2.0 | ||||||||||
| Paper & Forest Products | 1.0 | — | 0.9 | ||||||||||
| Personal Products | — | 1.0 | 0.4 | ||||||||||
| Pharmaceuticals | 1.8 | 5.3 | 1.5 | ||||||||||
| Professional Services | 2.7 | — | 3.2 | ||||||||||
| Real Estate Management & Development | — | — | 0.8 | ||||||||||
| Road & Rail | — | 2.3 | 0.9 | ||||||||||
| Semiconductors & Semiconductor Equipment | 2.0 | 4.4 | 2.5 | ||||||||||
| Software | 5.5 | 13.6 | 7.2 | ||||||||||
| Specialty Retail | 2.5 | 2.8 | 2.7 | ||||||||||
| Technology Hardware, Storage & Peripherals | — | — | 0.5 | ||||||||||
| Textiles, Apparel & Luxury Goods | 1.1 | 1.3 | 2.0 | ||||||||||
| Thrifts & Mortgage Finance | — | — | 1.2 | ||||||||||
| Tobacco | — | — | 0.2 | ||||||||||
| Trading Companies & Distributors | — | — | 3.7 | ||||||||||
| Transportation Infrastructure | — | — | 0.1 | ||||||||||
| Subtotal | 98.4 | 95.5 | 99.0 | ||||||||||
| Short-Term Investments | — | 5.1 | 1.5 | ||||||||||
| Total Investments | 98.4 | % | 100.6 | % | 100.5 | % | |||||||
| † | Industry classifications may be different than those used for compliance monitoring purposes. |
The accompanying notes are an integral part of these financial statements.
Semi-Annual Report 153
The Lazard Funds, Inc. Statements of Assets and Liabilities (unaudited)
| June 30, 2022 | Lazard Developing Markets Equity Portfolio | Lazard Emerging Markets Core Equity Portfolio | ||||||||
| ASSETS | ||||||||||
| Investments in securities, at fair value | $ | 116,153,312 | $ | 111,089,548 | ||||||
| Foreign currency, at fair value | 41,665 | 91,423 | ||||||||
| Receivables for: | ||||||||||
| Dividends | 520,757 | 511,749 | ||||||||
| Capital stock sold | 291,918 | 63,251 | ||||||||
| Investments sold | 207,607 | — | ||||||||
| Other assets | 3,972 | 2,709 | ||||||||
| Total assets | 117,219,231 | 111,758,680 | ||||||||
| LIABILITIES | ||||||||||
| Foreign currency due to custodian | — | 55,027 | ||||||||
| Payables for: | ||||||||||
| Management fees | 93,012 | 95,204 | ||||||||
| Foreign capital gains taxes | 153,488 | 105,829 | ||||||||
| Accrued custodian fees | 30,475 | 32,898 | ||||||||
| Accrued administration fees | 20,428 | 22,211 | ||||||||
| Accrued distribution fees | 1,147 | 286 | ||||||||
| Accrued professional services | 24,515 | 22,632 | ||||||||
| Accrued directors’ fees | 935 | 565 | ||||||||
| Capital stock redeemed | 63,744 | 10,208 | ||||||||
| Investments purchased | 333,144 | 98 | ||||||||
| Other accrued expenses and payables | 3,217 | 764 | ||||||||
| Total liabilities | 724,105 | 345,722 | ||||||||
| Net assets | $ | 116,495,126 | $ | 111,412,958 | ||||||
| NET ASSETS | ||||||||||
| Paid in capital | $ | 222,053,536 | $ | 123,197,141 | ||||||
| Distributable earnings (Accumulated loss) | (105,558,410 | ) | (11,784,183 | ) | ||||||
| Net assets | $ | 116,495,126 | $ | 111,412,958 | ||||||
| Institutional Shares | ||||||||||
| Net assets | $ | 109,901,411 | $ | 109,571,506 | ||||||
| Shares of capital stock outstanding* | 8,784,924 | 12,093,800 | ||||||||
| Net asset value, offering and redemption price per share | $ | 12.51 | $ | 9.06 | ||||||
| Open Shares | ||||||||||
| Net assets | $ | 6,593,715 | $ | 1,504,843 | ||||||
| Shares of capital stock outstanding* | 530,842 | 166,677 | ||||||||
| Net asset value, offering and redemption price per share | $ | 12.42 | $ | 9.03 | ||||||
| R6 Shares | ||||||||||
| Net assets | — | $ | 336,609 | |||||||
| Shares of capital stock outstanding* | — | 37,107 | ||||||||
| Net asset value, offering and redemption price per share | — | $ | 9.07 | |||||||
| Cost of investments in securities | $ | 110,194,506 | $ | 103,929,596 | ||||||
| Cost of foreign currency | $ | 41,717 | $ | 91,405 | ||||||
| * | $0.001 par value, 6,900,000,000 shares authorized for the Portfolios in total. |
The accompanying notes are an integral part of these financial statements.
154 Semi-Annual Report
| Lazard Emerging Markets Equity Advantage Portfolio | Lazard Emerging Markets Equity Portfolio | Lazard Emerging Markets Strategic Equity Portfolio | Lazard Equity Franchise Portfolio | Lazard Global Equity Select Portfolio | ||||||||||||||||||||
| $ | 53,320,878 | $ | 2,809,061,139 | $ | 48,778,674 | $ | 144,329,513 | $ | 95,286,142 | |||||||||||||||
| 39,257 | 3,419,337 | 43,038 | 24 | 29,162 | ||||||||||||||||||||
| 337,246 | 33,816,695 | 416,812 | 133,259 | 167,338 | ||||||||||||||||||||
| 200 | 3,122,889 | 21,709 | 42,785,001 | 30,393 | ||||||||||||||||||||
| — | — | — | 7,202 | — | ||||||||||||||||||||
| 17,352 | — | 17,545 | — | — | ||||||||||||||||||||
| 53,714,933 | 2,849,420,060 | 49,277,778 | 187,254,999 | 95,513,035 | ||||||||||||||||||||
| 2 | — | — | — | — | ||||||||||||||||||||
| 22,198 | 2,460,841 | 29,951 | 37,269 | 51,456 | ||||||||||||||||||||
| — | 905,494 | 16,501 | — | — | ||||||||||||||||||||
| 26,321 | 598,666 | 14,853 | 2,606 | 10,987 | ||||||||||||||||||||
| 15,573 | 246,726 | 14,541 | 17,588 | 18,358 | ||||||||||||||||||||
| 80 | 77,940 | 668 | 31 | 253 | ||||||||||||||||||||
| 35,311 | 52,307 | 64,030 | 24,718 | 25,977 | ||||||||||||||||||||
| — | 7,493 | 244 | — | — | ||||||||||||||||||||
| 611 | 13,120,608 | 24,692 | — | 33,535 | ||||||||||||||||||||
| 99,327 | 563,702 | 14 | 40,131,122 | 27 | ||||||||||||||||||||
| 934 | 118,007 | 1,553 | 2,607 | 679 | ||||||||||||||||||||
| 200,357 | 18,151,784 | 167,047 | 40,215,941 | 141,272 | ||||||||||||||||||||
| $ | 53,514,576 | $ | 2,831,268,276 | $ | 49,110,731 | $ | 147,039,058 | $ | 95,371,763 | |||||||||||||||
| $ | 65,717,119 | $ | 3,853,270,223 | $ | 103,128,068 | $ | 135,000,914 | $ | 77,830,676 | |||||||||||||||
| (12,202,543 | ) | (1,022,001,947 | ) | (54,017,337 | ) | 12,038,144 | 17,541,087 | |||||||||||||||||
| $ | 53,514,576 | $ | 2,831,268,276 | $ | 49,110,731 | $ | 147,039,058 | $ | 95,371,763 | |||||||||||||||
| $ | 53,324,747 | $ | 2,527,611,022 | $ | 46,498,753 | $ | 146,861,873 | $ | 94,143,799 | |||||||||||||||
| 5,023,529 | 164,233,260 | 4,394,676 | 14,679,929 | 6,302,544 | ||||||||||||||||||||
| $ | 10.61 | $ | 15.39 | $ | 10.58 | $ | 10.00 | $ | 14.94 | |||||||||||||||
| $ | 189,829 | $ | 296,249,421 | $ | 2,611,978 | $ | 177,185 | $ | 1,227,964 | |||||||||||||||
| 17,902 | 18,678,121 | 246,242 | 17,736 | 82,276 | ||||||||||||||||||||
| $ | 10.60 | $ | 15.86 | $ | 10.61 | $ | 9.99 | $ | 14.92 | |||||||||||||||
| — | $ | 7,407,833 | — | — | — | |||||||||||||||||||
| — | 481,060 | — | — | — | ||||||||||||||||||||
| — | $ | 15.40 | — | — | — | |||||||||||||||||||
| $ | 61,155,302 | $ | 2,869,520,472 | $ | 54,011,939 | $ | 149,267,734 | $ | 78,879,741 | |||||||||||||||
| $ | 39,260 | $ | 3,419,750 | $ | 43,051 | $ | 24 | $ | 28,988 | |||||||||||||||
Semi-Annual Report 155
| June 30, 2022 | Lazard Global Listed Infrastructure Portfolio | Lazard Global Strategic Equity Portfolio | ||||||||
| ASSETS | ||||||||||
| Investments in securities, at fair value | $ | 7,713,540,820 | $ | 12,447,001 | ||||||
| Non-controlled affiliated issuers, at fair value (Note 5) | 766,880,731 | — | ||||||||
| Foreign currency, at fair value | 5,697,429 | 35 | ||||||||
| Receivables for: | ||||||||||
| Dividends | 39,109,041 | 17,326 | ||||||||
| Tax reclaims | — | — | ||||||||
| Capital stock sold | 58,823,765 | — | ||||||||
| Amount due from Investment Manager (Note 3) | — | 5,566 | ||||||||
| Investments sold | 2,432,187 | — | ||||||||
| Gross unrealized appreciation on forward currency contracts | 42,562,258 | — | ||||||||
| Other assets | — | 4,730 | ||||||||
| Total assets | 8,629,046,231 | 12,474,658 | ||||||||
| LIABILITIES | ||||||||||
| Foreign currency due to custodian | — | 4 | ||||||||
| Payables for: | ||||||||||
| Management fees | 6,208,316 | — | ||||||||
| Accrued distribution fees | 74,844 | 33 | ||||||||
| Accrued directors’ fees | — | — | ||||||||
| Accrued custodian fees | 222,158 | 5,295 | ||||||||
| Accrued professional services | 102,222 | 25,421 | ||||||||
| Accrued administration fees | 477,253 | 11,859 | ||||||||
| Accrued registration fees | — | 6,722 | ||||||||
| Capital stock redeemed | 2,334,555 | 880 | ||||||||
| Investments purchased | 155,020,142 | — | ||||||||
| Gross unrealized depreciation on forward currency contracts | 4,374,932 | — | ||||||||
| Other accrued expenses and payables | 17,064 | 781 | ||||||||
| Total liabilities | 168,831,486 | 50,995 | ||||||||
| Net assets | $ | 8,460,214,745 | $ | 12,423,663 | ||||||
| NET ASSETS | ||||||||||
| Paid in capital | $ | 7,633,446,167 | $ | 13,972,413 | ||||||
| Distributable earnings (Accumulated loss) | 826,768,578 | (1,548,750 | ) | |||||||
| Net assets | $ | 8,460,214,745 | $ | 12,423,663 | ||||||
| Institutional Shares | ||||||||||
| Net assets | $ | 8,104,349,992 | $ | 12,261,145 | ||||||
| Shares of capital stock outstanding* | 503,839,190 | 1,173,865 | ||||||||
| Net asset value, offering and redemption price per share | $ | 16.09 | $ | 10.45 | ||||||
| Open Shares | ||||||||||
| Net assets | $ | 355,864,753 | $ | 162,518 | ||||||
| Shares of capital stock outstanding* | 22,111,775 | 15,713 | ||||||||
| Net asset value, offering and redemption price per share | $ | 16.09 | $ | 10.34 | ||||||
| R6 Shares | ||||||||||
| Net assets | — | — | ||||||||
| Shares of capital stock outstanding* | — | — | ||||||||
| Net asset value, offering and redemption price per share | — | — | ||||||||
| Cost of investments in securities | $ | 7,180,126,887 | $ | 13,669,653 | ||||||
| Cost of non-controlled affiliated issuers | $ | 1,023,694,562 | $ | — | ||||||
| Cost of foreign currency | $ | 5,693,474 | $ | 36 | ||||||
| * | $0.001 par value, 6,900,000,000 shares authorized for the Portfolios in total. |
The accompanying notes are an integral part of these financial statements.
156 Semi-Annual Report
| Lazard International Equity Advantage Portfolio | Lazard International Equity Portfolio | Lazard International Equity Select Portfolio | Lazard International Quality Growth Portfolio | Lazard International Small Cap Equity Portfolio | ||||||||||||||||||||
| $ | 2,395,118 | $ | 1,221,117,008 | $ | 65,039,329 | $ | 113,955,329 | $ | 17,902,228 | |||||||||||||||
| — | — | — | — | — | ||||||||||||||||||||
| 868 | 2,176,115 | 393,225 | 11,121 | 8,511 | ||||||||||||||||||||
| 11,766 | 8,609,951 | 287,979 | 194,715 | 159,647 | ||||||||||||||||||||
| — | 993,674 | — | — | — | ||||||||||||||||||||
| — | 1,654,595 | 242,608 | 91,367 | 1,502 | ||||||||||||||||||||
| 12,849 | — | — | — | — | ||||||||||||||||||||
| 26,273 | 596,143 | 510,657 | — | 86,958 | ||||||||||||||||||||
| — | — | — | — | — | ||||||||||||||||||||
| 18,463 | — | — | 87,673 | 5,059 | ||||||||||||||||||||
| 2,465,337 | 1,235,147,486 | 66,473,798 | 114,340,205 | 18,163,905 | ||||||||||||||||||||
| 1 | — | — | — | — | ||||||||||||||||||||
| — | 788,938 | 34,146 | 53,138 | 2,741 | ||||||||||||||||||||
| 23 | 14,388 | 598 | 55 | 2,243 | ||||||||||||||||||||
| — | 16,824 | — | — | 190 | ||||||||||||||||||||
| 7,930 | 175,978 | 21,502 | — | 12,021 | ||||||||||||||||||||
| 27,285 | 56,555 | 22,298 | 23,650 | 24,482 | ||||||||||||||||||||
| 10,803 | 135,055 | 16,068 | 17,917 | 12,170 | ||||||||||||||||||||
| — | — | — | — | 1,091 | ||||||||||||||||||||
| — | 1,931,477 | 49,609 | — | 3 | ||||||||||||||||||||
| 40 | 18,455,865 | 995,723 | 11 | 19,682 | ||||||||||||||||||||
| — | — | — | — | — | ||||||||||||||||||||
| 1,133 | 383,050 | 10,049 | 126 | 1,192 | ||||||||||||||||||||
| 47,215 | 21,958,130 | 1,149,993 | 94,897 | 75,815 | ||||||||||||||||||||
| $ | 2,418,122 | $ | 1,213,189,356 | $ | 65,323,805 | $ | 114,245,308 | $ | 18,088,090 | |||||||||||||||
| $ | 2,612,011 | $ | 1,121,366,151 | $ | 66,176,425 | $ | 135,557,958 | $ | 20,497,425 | |||||||||||||||
| (193,889 | ) | 91,823,205 | (852,620 | ) | (21,312,650 | ) | (2,409,335 | ) | ||||||||||||||||
| $ | 2,418,122 | $ | 1,213,189,356 | $ | 65,323,805 | $ | 114,245,308 | $ | 18,088,090 | |||||||||||||||
| $ | 2,307,796 | $ | 1,089,392,839 | $ | 62,192,959 | $ | 113,980,045 | $ | 7,616,310 | |||||||||||||||
| 252,321 | 73,336,052 | 6,514,030 | 8,822,560 | 963,671 | ||||||||||||||||||||
| $ | 9.15 | $ | 14.85 | $ | 9.55 | $ | 12.92 | $ | 7.90 | |||||||||||||||
| $ | 110,326 | $ | 58,568,365 | $ | 3,130,846 | $ | 265,263 | $ | 10,471,780 | |||||||||||||||
| 12,075 | 3,891,841 | 326,666 | 20,682 | 1,322,073 | ||||||||||||||||||||
| $ | 9.14 | $ | 15.05 | $ | 9.58 | $ | 12.83 | $ | 7.92 | |||||||||||||||
| — | $ | 65,228,152 | — | — | — | |||||||||||||||||||
| — | 4,397,927 | — | — | — | ||||||||||||||||||||
| — | $ | 14.83 | — | — | — | |||||||||||||||||||
| $ | 2,627,880 | $ | 1,192,980,197 | $ | 65,968,892 | $ | 136,674,781 | $ | 20,728,197 | |||||||||||||||
| $ | — | $ | — | $ | — | $ | — | $ | — | |||||||||||||||
| $ | 864 | $ | 2,174,716 | $ | 393,034 | $ | 11,046 | $ | 8,516 | |||||||||||||||
Semi-Annual Report 157
| June 30, 2022 | Lazard International Strategic Equity Portfolio | Lazard Managed Equity Volatility Portfolio | ||||||||
| ASSETS | ||||||||||
| Investments in securities, at fair value | $ | 4,879,099,667 | $ | 28,635,415 | ||||||
| Cash | — | — | ||||||||
| Foreign currency, at fair value | 6,053,883 | 5,790 | ||||||||
| Receivables for: | ||||||||||
| Capital stock sold | 18,656,417 | 48,169 | ||||||||
| Dividends | 16,498,500 | 81,492 | ||||||||
| Investments sold | 1,559,840 | — | ||||||||
| Amount due from Investment Manager (Note 3) | — | — | ||||||||
| Deferred offering costs (Note 2(f)) | — | — | ||||||||
| Other assets | — | 17,211 | ||||||||
| Total assets | 4,921,868,307 | 28,788,077 | ||||||||
| LIABILITIES | ||||||||||
| Payables for: | ||||||||||
| Management fees | 3,137,609 | 176 | ||||||||
| Foreign capital gains taxes | 583,451 | — | ||||||||
| Accrued administration fees | 376,663 | 12,807 | ||||||||
| Accrued custodian fees | 265,054 | 3,619 | ||||||||
| Accrued distribution fees | 77,867 | 21 | ||||||||
| Accrued professional services | 27,659 | 25,137 | ||||||||
| Accrued directors’ fees | — | — | ||||||||
| Offering costs (Note 2(f)) | — | — | ||||||||
| Capital stock redeemed | 2,582,283 | — | ||||||||
| Investments purchased | 6,676 | 5 | ||||||||
| Other accrued expenses and payables | 47,770 | 1,021 | ||||||||
| Total liabilities | 7,105,032 | 42,786 | ||||||||
| Net assets | $ | 4,914,763,275 | $ | 28,745,291 | ||||||
| NET ASSETS | ||||||||||
| Paid in capital | $ | 4,758,407,547 | $ | 28,552,879 | ||||||
| Distributable earnings (Accumulated loss) | 156,355,728 | 192,412 | ||||||||
| Net assets | $ | 4,914,763,275 | $ | 28,745,291 | ||||||
| Institutional Shares | ||||||||||
| Net assets | $ | 4,495,721,906 | $ | 28,666,976 | ||||||
| Shares of capital stock outstanding* | 339,501,193 | 2,422,439 | ||||||||
| Net asset value, offering and redemption price per share | $ | 13.24 | $ | 11.83 | ||||||
| Open Shares | ||||||||||
| Net assets | $ | 320,866,799 | $ | 78,315 | ||||||
| Shares of capital stock outstanding* | 24,021,905 | 6,631 | ||||||||
| Net asset value, offering and redemption price per share | $ | 13.36 | $ | 11.81 | ||||||
| R6 Shares | ||||||||||
| Net assets | $ | 98,174,570 | — | |||||||
| Shares of capital stock outstanding* | 7,406,905 | — | ||||||||
| Net asset value, offering and redemption price per share | $ | 13.25 | — | |||||||
| Cost of investments in securities | $ | 4,588,377,234 | $ | 28,868,117 | ||||||
| Cost of foreign currency | $ | 6,060,069 | $ | 5,758 | ||||||
| * | $0.001 par value, 6,900,000,000 shares authorized for the Portfolios in total. |
| † | Shares values are rounded for presentation purposes. |
The accompanying notes are an integral part of these financial statements.
158 Semi-Annual Report
| Lazard US Equity Concentrated Portfolio | Lazard US Equity Focus Portfolio | Lazard US Small-Mid Cap Equity Portfolio | Lazard US Sustainable Equity Portfolio | Lazard US Systematic Small Cap Equity Portfolio | ||||||||||||||||||||
| $ | 1,434,519,339 | $ | 74,376,578 | $ | 68,911,113 | $ | 12,271,857 | $ | 23,750,800 | |||||||||||||||
| — | — | 1,304,136 | — | 43 | ||||||||||||||||||||
| — | — | — | — | 7 | ||||||||||||||||||||
| 1,025,904 | 8 | 703 | — | — | ||||||||||||||||||||
| 1,455,003 | 64,147 | 60,636 | 7,705 | 13,823 | ||||||||||||||||||||
| 11,146,006 | — | — | — | 316,109 | ||||||||||||||||||||
| — | — | — | 6,991 | 5,063 | ||||||||||||||||||||
| — | — | — | — | 44,964 | ||||||||||||||||||||
| 33,079 | 4,710 | 3,316 | 15,515 | — | ||||||||||||||||||||
| 1,448,179,331 | 74,445,443 | 70,279,904 | 12,302,068 | 24,130,809 | ||||||||||||||||||||
| 847,337 | 25,198 | 46,033 | — | — | ||||||||||||||||||||
| — | — | — | — | — | ||||||||||||||||||||
| 142,967 | 18,411 | 17,237 | 14,271 | 14,019 | ||||||||||||||||||||
| 35,931 | 7,483 | 12,911 | 4,640 | 3,364 | ||||||||||||||||||||
| 6,191 | 257 | 1,805 | 92 | 22 | ||||||||||||||||||||
| 38,358 | 24,675 | 26,010 | 15,682 | 41,221 | ||||||||||||||||||||
| — | — | 46 | — | — | ||||||||||||||||||||
| — | — | — | — | 133,431 | ||||||||||||||||||||
| 2,338,788 | 1 | 128,637 | — | — | ||||||||||||||||||||
| 21,776,614 | — | — | 64,636 | 298,147 | ||||||||||||||||||||
| 27,997 | 1,621 | 1,851 | 721 | 103 | ||||||||||||||||||||
| 25,214,183 | 77,646 | 234,530 | 100,042 | 490,307 | ||||||||||||||||||||
| $ | 1,422,965,148 | $ | 74,367,797 | $ | 70,045,374 | $ | 12,202,026 | $ | 23,640,502 | |||||||||||||||
| $ | 1,042,815,837 | $ | 60,515,037 | $ | 64,110,796 | $ | 10,653,569 | $ | 25,860,851 | |||||||||||||||
| 380,149,311 | 13,852,760 | 5,934,578 | 1,548,457 | (2,220,349 | ) | |||||||||||||||||||
| $ | 1,422,965,148 | $ | 74,367,797 | $ | 70,045,374 | $ | 12,202,026 | $ | 23,640,502 | |||||||||||||||
| $ | 1,394,032,674 | $ | 36,604,569 | $ | 61,938,425 | $ | 11,707,400 | $ | 23,522,703 | |||||||||||||||
| 87,416,107 | 2,782,072 | 5,127,308 | 967,851 | 2,889,205 | ||||||||||||||||||||
| $ | 15.95 | $ | 13.16 | $ | 12.08 | $ | 12.10 | $ | 8.14 | |||||||||||||||
| $ | 26,726,402 | $ | 1,261,911 | $ | 8,105,935 | $ | 494,626 | $ | 117,799 | |||||||||||||||
| 1,663,058 | 95,494 | 742,024 | 40,904 | 14,455 | ||||||||||||||||||||
| $ | 16.07 | $ | 13.21 | $ | 10.92 | $ | 12.09 | $ | 8.15 | |||||||||||||||
| $ | 2,206,072 | $ | 36,501,317 | $ | 1,014 | $ | — | — | ||||||||||||||||
| 137,926 | 2,772,619 | 85 | † | — | — | |||||||||||||||||||
| $ | 15.99 | $ | 13.16 | $ | 11.88 | $ | — | — | ||||||||||||||||
| $ | 1,202,345,192 | $ | 61,350,947 | $ | 65,508,793 | $ | 10,962,372 | $ | 25,752,107 | |||||||||||||||
| $ | — | $ | — | $ | — | $ | — | $ | 7 | |||||||||||||||
Semi-Annual Report 159
The Lazard Funds, Inc. Statements of Operations (unaudited)
| For the Six Months Ended June 30, 2022 | Lazard Developing Markets Equity Portfolio | Lazard Emerging Markets Core Equity Portfolio | |||||||||
| Investment Income (Loss) | |||||||||||
| Income | |||||||||||
| Dividends | $ | 1,595,110 | $ | 1,525,270 | |||||||
| Non-cash dividends | 197,282 | 377,373 | |||||||||
| Total investment income* | 1,792,392 | 1,902,643 | |||||||||
| Expenses | |||||||||||
| Management fees (Note 3) | 680,340 | 675,545 | |||||||||
| Custodian fees | 49,650 | 52,584 | |||||||||
| Distribution fees (Open Shares) | 9,491 | 2,282 | |||||||||
| Administration fees | 17,525 | 18,962 | |||||||||
| Professional services | 32,798 | 32,118 | |||||||||
| Shareholders’ services | 10,599 | 8,304 | |||||||||
| Shareholders’ reports | 10,329 | 8,656 | |||||||||
| Directors’ fees and expenses | 7,182 | 7,127 | |||||||||
| Registration fees | 18,248 | 23,306 | |||||||||
| Other^ | 6,334 | 8,333 | |||||||||
| Total gross expenses | 842,496 | 837,217 | |||||||||
| Management fees waived and expenses reimbursed | (49,645 | ) | (3,309 | ) | |||||||
| Total net expenses | 792,851 | 833,908 | |||||||||
| Net investment income (loss) | 999,541 | 1,068,735 | |||||||||
| Net Realized and Unrealized Gain (Loss) | |||||||||||
| Net realized gain (loss) on: | |||||||||||
| Investments** | 1,775,062 | (2,630,655 | ) | ||||||||
| Foreign currency transactions | (4,832 | ) | (58,820 | ) | |||||||
| Total net realized gain (loss) | 1,770,230 | (2,689,475 | ) | ||||||||
| Net change in unrealized appreciation (depreciation) on: | |||||||||||
| Investments† | (31,215,456 | ) | (31,038,230 | ) | |||||||
| Foreign currency translations | (2,636 | ) | 1,440 | ||||||||
| Total net change in unrealized appreciation (depreciation) | (31,218,092 | ) | (31,036,790 | ) | |||||||
| Net realized and unrealized gain (loss) | (29,447,862 | ) | (33,726,265 | ) | |||||||
| Net increase (decrease) in net assets resulting from operations | $ | (28,448,321 | ) | $ | (32,657,530 | ) | |||||
| * | Net of foreign withholding taxes of | $ | 212,989 | $ | 167,886 | ||||||
| ** | Net of foreign capital gains taxes of | $ | 105,011 | $ | 1,674 | ||||||
| † | Includes net change in unrealized appreciation (depreciation) of foreign capital gains taxes of | $ | 240,141 | $ | 169,361 | ||||||
| ^ | Includes interest on line of credit of | $ | 216 | $ | 947 | ||||||
The accompanying notes are an integral part of these financial statements.
160 Semi-Annual Report
| Lazard Emerging Markets Equity Advantage Portfolio | Lazard Emerging Markets Equity Portfolio | Lazard Emerging Markets Strategic Equity Portfolio | Lazard Equity Franchise Portfolio | Lazard Global Equity Select Portfolio | ||||||||||||||||||||
| $ | 1,040,661 | $ | 95,388,461 | $ | 1,110,630 | $ | 1,096,872 | $ | 833,504 | |||||||||||||||
| 80,386 | — | — | — | — | ||||||||||||||||||||
| 1,121,047 | 95,388,461 | 1,110,630 | 1,096,872 | 833,504 | ||||||||||||||||||||
| 229,398 | 16,506,391 | 277,080 | 369,804 | 331,964 | ||||||||||||||||||||
| 47,388 | 534,383 | 35,137 | 27,460 | 30,031 | ||||||||||||||||||||
| 449 | 424,245 | 3,571 | 148 | 1,676 | ||||||||||||||||||||
| 12,844 | 184,611 | 12,485 | 14,799 | 15,405 | ||||||||||||||||||||
| 35,763 | 171,468 | 39,585 | 23,020 | 24,387 | ||||||||||||||||||||
| 6,044 | 142,006 | 8,364 | 6,419 | 7,094 | ||||||||||||||||||||
| 6,445 | 112,512 | 8,808 | 5,403 | 6,490 | ||||||||||||||||||||
| 4,212 | 108,926 | 4,287 | 5,359 | 5,344 | ||||||||||||||||||||
| 19,149 | 42,080 | 18,216 | 17,341 | 22,222 | ||||||||||||||||||||
| 6,097 | 75,571 | 4,639 | 5,498 | 5,034 | ||||||||||||||||||||
| 367,789 | 18,302,193 | 412,172 | 475,251 | 449,647 | ||||||||||||||||||||
| (89,982 | ) | (1,258 | ) | (89,879 | ) | (34,956 | ) | (2,158 | ) | |||||||||||||||
| 277,807 | 18,300,935 | 322,293 | 440,295 | 447,489 | ||||||||||||||||||||
| 843,240 | 77,087,526 | 788,337 | 656,577 | 386,015 | ||||||||||||||||||||
| (5,174,982 | ) | (13,694,033 | ) | (4,328,453 | ) | 14,927,233 | 1,010,182 | |||||||||||||||||
| (47,326 | ) | (485,637 | ) | (3,638 | ) | (34,324 | ) | (13,467 | ) | |||||||||||||||
| (5,222,308 | ) | (14,179,670 | ) | (4,332,091 | ) | 14,892,909 | 996,715 | |||||||||||||||||
| (7,533,779 | ) | (580,432,840 | ) | (7,341,512 | ) | (20,218,351 | ) | (24,927,141 | ) | |||||||||||||||
| (2,374 | ) | (138,418 | ) | (5,330 | ) | (5,487 | ) | (3,241 | ) | |||||||||||||||
| (7,536,153 | ) | (580,571,258 | ) | (7,346,842 | ) | (20,223,838 | ) | (24,930,382 | ) | |||||||||||||||
| (12,758,461 | ) | (594,750,928 | ) | (11,678,933 | ) | (5,330,929 | ) | (23,933,667 | ) | |||||||||||||||
| $ | (11,915,221 | ) | $ | (517,663,402 | ) | $ | (10,890,596 | ) | $ | (4,674,352 | ) | $ | (23,547,652 | ) | ||||||||||
| $ | 121,726 | $ | 10,358,229 | $ | 122,807 | $ | 78,571 | $ | 63,339 | |||||||||||||||
| $ | — | $ | 480,237 | $ | 1,055 | $ | — | $ | — | |||||||||||||||
| $ | — | $ | 1,607,691 | $ | 15,574 | $ | — | $ | — | |||||||||||||||
| $ | 1,789 | $ | 46 | $ | — | $ | 565 | $ | 21 | |||||||||||||||
Semi-Annual Report 161
| For the Six Months Ended June 30, 2022 | Lazard Global Listed Infrastructure Portfolio | Lazard Global Strategic Equity Portfolio | |||||||||
| Investment Income (Loss) | |||||||||||
| Income | |||||||||||
| Dividends# | |||||||||||
| Unaffiliated issuers | $ | 149,829,382 | $ | 94,757 | |||||||
| Non-controlled affiliated issuers (Note 5) | 20,351,279 | — | |||||||||
| Non-cash dividends | — | 5,544 | |||||||||
| Total investment income* | 170,180,661 | 100,301 | |||||||||
| Expenses | |||||||||||
| Custodian fees | 682,910 | 21,620 | |||||||||
| Management fees (Note 3) | 35,237,138 | 55,808 | |||||||||
| Professional services | 324,440 | 24,058 | |||||||||
| Registration fees | 104,326 | 18,098 | |||||||||
| Shareholders’ services | 265,160 | 4,695 | |||||||||
| Administration fees | 364,391 | 9,951 | |||||||||
| Shareholders’ reports | 182,681 | 5,242 | |||||||||
| Directors’ fees and expenses | 214,730 | 2,877 | |||||||||
| Distribution fees (Open Shares) | 393,285 | 226 | |||||||||
| Other^ | 143,876 | 3,365 | |||||||||
| Total gross expenses | 37,912,937 | 145,940 | |||||||||
| Management fees waived and expenses reimbursed | — | (74,986 | ) | ||||||||
| Total net expenses | 37,912,937 | 70,954 | |||||||||
| Net investment income (loss) | 132,267,724 | 29,347 | |||||||||
| Net Realized and Unrealized Gain (Loss) | |||||||||||
| Net realized gain (loss) on: | |||||||||||
| Investments** | 39,633,445 | (347,304 | ) | ||||||||
| Foreign currency transactions | 360,783 | 500 | |||||||||
| Forward currency contracts | 332,056,533 | — | |||||||||
| Total net realized gain (loss) | 372,050,761 | (346,804 | ) | ||||||||
| Net change in unrealized appreciation (depreciation) on: | |||||||||||
| Investments† | (711,287,073 | ) | (3,604,245 | ) | |||||||
| Non-controlled affiliated issuers | 36,436,188 | — | |||||||||
| Foreign currency translations | (1,280,549 | ) | (527 | ) | |||||||
| Forward currency contracts | 117,435,643 | — | |||||||||
| Total net change in unrealized appreciation (depreciation) | (558,695,791 | ) | (3,604,772 | ) | |||||||
| Net realized and unrealized gain (loss) | (186,645,030 | ) | (3,951,576 | ) | |||||||
| Net increase (decrease) in net assets resulting from operations | $ | (54,377,306 | ) | $ | (3,922,229 | ) | |||||
| * | Net of foreign withholding taxes of | $ | 10,902,744 | $ | 7,299 | ||||||
| ** | Net of foreign capital gains taxes of | $ | — | $ | — | ||||||
| † | Includes net change in unrealized appreciation (depreciation) of foreign capital gains taxes of | $ | — | $ | — | ||||||
| ^ | Includes interest on line of credit of | $ | — | $ | 17 | ||||||
| # | Dividend income for Lazard Global Listed Infrastructure Portfolio and Lazard International Equity Portfolio includes $2,478,832 and $2,119,742, respectively, of refunds received as a result of European Union dividend withholding tax reclaim filings. The amount of foreign withholding taxes without such refunds from European Union dividend withholding tax reclaim filings would have been $13,381,576 and 2,756,067, respectively. Refer to Note 2(b) in the Notes to Financial Statements for further information. |
The accompanying notes are an integral part of these financial statements.
162 Semi-Annual Report
| Lazard International Equity Advantage Portfolio | Lazard International Equity Portfolio | Lazard International Equity Select Portfolio | Lazard International Quality Growth Portfolio | Lazard International Small Cap Equity Portfolio | ||||||||||||||||||||
| $ | 58,811 | $ | 28,038,716 | $ | 1,221,365 | $ | 1,045,853 | $ | 396,425 | |||||||||||||||
| — | — | — | — | — | ||||||||||||||||||||
| 10,703 | — | — | — | — | ||||||||||||||||||||
| 69,514 | 28,038,716 | 1,221,365 | 1,045,853 | 396,425 | ||||||||||||||||||||
| 26,725 | 246,996 | 31,416 | 25,148 | 27,603 | ||||||||||||||||||||
| 8,825 | 5,787,562 | 241,067 | 376,152 | 84,199 | ||||||||||||||||||||
| 22,397 | 117,314 | 26,519 | 21,858 | 24,710 | ||||||||||||||||||||
| 19,390 | 40,946 | 12,918 | 42,968 | 16,583 | ||||||||||||||||||||
| 4,444 | 60,433 | 6,915 | 5,952 | 6,101 | ||||||||||||||||||||
| 9,191 | 100,083 | 13,657 | 15,290 | 10,424 | ||||||||||||||||||||
| 5,121 | 71,003 | 8,070 | 5,072 | 6,183 | ||||||||||||||||||||
| 2,554 | 58,987 | 4,769 | 4,268 | 3,277 | ||||||||||||||||||||
| 154 | 101,531 | 4,573 | 364 | 13,375 | ||||||||||||||||||||
| 13 | 51,597 | 4,708 | 4,030 | 4,320 | ||||||||||||||||||||
| 98,814 | 6,636,452 | 354,612 | 501,102 | 196,775 | ||||||||||||||||||||
| (86,447 | ) | (22,806 | ) | (15,872 | ) | (73,695 | ) | (56,086 | ) | |||||||||||||||
| 12,367 | 6,613,646 | 338,740 | 427,407 | 140,689 | ||||||||||||||||||||
| 57,147 | 21,425,070 | 882,625 | 618,446 | 255,736 | ||||||||||||||||||||
| (25,330 | ) | 3,569,949 | (846,985 | ) | 826,105 | (142,498 | ) | |||||||||||||||||
| (1,898 | ) | (544,243 | ) | (21,165 | ) | 22,230 | (14,336 | ) | ||||||||||||||||
| — | — | — | — | — | ||||||||||||||||||||
| (27,228 | ) | 3,025,706 | (868,150 | ) | 848,335 | (156,834 | ) | |||||||||||||||||
| (574,825 | ) | (319,326,821 | ) | (13,780,540 | ) | (26,188,701 | ) | (7,349,275 | ) | |||||||||||||||
| — | — | — | — | — | ||||||||||||||||||||
| (581 | ) | (502,672 | ) | (10,133 | ) | (928 | ) | (5,934 | ) | |||||||||||||||
| — | — | — | — | — | ||||||||||||||||||||
| (575,406 | ) | (319,829,493 | ) | (13,790,673 | ) | (26,189,629 | ) | (7,355,209 | ) | |||||||||||||||
| (602,634 | ) | (316,803,787 | ) | (14,658,823 | ) | (25,341,294 | ) | (7,512,043 | ) | |||||||||||||||
| $ | (545,487 | ) | $ | (295,378,717 | ) | $ | (13,776,198 | ) | $ | (24,722,848 | ) | $ | (7,256,307 | ) | ||||||||||
| $ | 7,063 | $ | 636,325 | $ | 148,248 | $ | 130,950 | $ | 39,863 | |||||||||||||||
| $ | — | $ | 53,713 | $ | 194 | $ | — | $ | — | |||||||||||||||
| $ | — | $ | (6,198 | ) | $ | 2,293 | $ | — | $ | — | ||||||||||||||
| $ | — | $ | 6,347 | $ | — | $ | 542 | $ | 318 | |||||||||||||||
Semi-Annual Report 163
| For the Six Months Ended June 30, 2022 | Lazard International Strategic Equity Portfolio | Lazard Managed Equity Volatility Portfolio | ||||||||||
| Investment Income (Loss) | ||||||||||||
| Income | ||||||||||||
| Dividends# | $ | 90,004,007 | $ | 412,627 | ||||||||
| Total investment income* | 90,004,007 | 412,627 | ||||||||||
| Expenses | ||||||||||||
| Management fees (Note 3) | 21,035,807 | 88,059 | ||||||||||
| Custodian fees | 636,917 | 31,960 | ||||||||||
| Distribution fees (Open Shares) | 478,491 | 102 | ||||||||||
| Administration fees | 277,051 | 10,856 | ||||||||||
| Professional services | 248,903 | 21,074 | ||||||||||
| Directors’ fees and expenses | 171,754 | 3,278 | ||||||||||
| Shareholders’ services | 153,932 | 5,109 | ||||||||||
| Shareholders’ reports | 88,137 | 5,288 | ||||||||||
| Registration fees | 85,874 | 17,346 | ||||||||||
| Amortization of offering costs (Note 2(f)) | — | — | ||||||||||
| Organization expenses (Note 2(f)) | — | — | ||||||||||
| Other^ | 119,135 | 3,707 | ||||||||||
| Total gross expenses | 23,296,001 | 186,779 | ||||||||||
| Management fees waived and expenses reimbursed | (1,993 | ) | (76,460 | ) | ||||||||
| Total net expenses | 23,294,008 | 110,319 | ||||||||||
| Net investment income (loss) | 66,709,999 | 302,308 | ||||||||||
| Net Realized and Unrealized Gain (Loss) | ||||||||||||
| Net realized gain (loss) on: | ||||||||||||
| Investments** | (140,786,778 | ) | (93,136 | ) | ||||||||
| Foreign currency transactions | 312,655 | (4,857 | ) | |||||||||
| Total net realized gain (loss) | (140,474,123 | ) | (97,993 | ) | ||||||||
| Net change in unrealized appreciation (depreciation) on: | ||||||||||||
| Investments† | (1,119,593,497 | ) | (3,374,175 | ) | ||||||||
| Foreign currency translations | (765,439 | ) | (2,119 | ) | ||||||||
| Total net change in unrealized appreciation (depreciation) | (1,120,358,936 | ) | (3,376,294 | ) | ||||||||
| Net realized and unrealized gain (loss) | (1,260,833,059 | ) | (3,474,287 | ) | ||||||||
| Net increase (decrease) in net assets resulting from operations | $ | (1,194,123,060 | ) | $ | (3,171,979 | ) | ||||||
| * | Net of foreign withholding taxes of | $ | 2,620,148 | $ | 25,221 | |||||||
| ** | Net of foreign capital gains taxes of | $ | 29,896 | $ | — | |||||||
| † | Includes net change in unrealized appreciation (depreciation) of foreign capital gains taxes of | $ | 1,245,919 | $ | — | |||||||
| ^ | Includes interest on line of credit of | $ | — | $ | 7 | |||||||
| # | Dividend income for Lazard International Strategic Equity Portfolio includes $8,402,420 of refunds received as a result of European Union dividend withholding ax reclaim filings. The amounts of foreign withholding taxes without such refunds from European Union dividend withholding tax reclaim filings would have been 11,022,568. Refer to Note 2(b) in the Notes to Financial statements further information. |
The accompanying notes are an integral part of these financial statements.
164 Semi-Annual Report
| Lazard US Equity Concentrated Portfolio | Lazard US Equity Focus Portfolio | Lazard US Small-Mid Cap Equity Portfolio | Lazard US Sustainable Equity Portfolio | Lazard US Systematic Small Cap Equity Portfolio | ||||||||||||||||||||
| $ | 11,468,630 | $ | 549,797 | $ | 435,334 | $ | 90,038 | $ | 86,656 | |||||||||||||||
| 11,468,630 | 549,797 | 435,334 | 90,038 | 86,656 | ||||||||||||||||||||
| 5,879,422 | 215,687 | 327,085 | 40,320 | 26,488 | ||||||||||||||||||||
| 176,072 | 25,783 | 31,892 | 15,309 | 27,633 | ||||||||||||||||||||
| 38,318 | 1,752 | 11,787 | 670 | 137 | ||||||||||||||||||||
| 106,907 | 15,420 | 14,165 | 11,772 | 10,573 | ||||||||||||||||||||
| 86,010 | 21,885 | 23,911 | 20,835 | 34,767 | ||||||||||||||||||||
| 53,880 | 4,492 | 5,299 | 2,856 | 2,558 | ||||||||||||||||||||
| 53,712 | 6,760 | 7,592 | 4,571 | 7,583 | ||||||||||||||||||||
| 64,839 | 5,585 | 7,643 | 4,874 | 6,377 | ||||||||||||||||||||
| 36,184 | 15,078 | 21,188 | 18,828 | 4,200 | ||||||||||||||||||||
| — | — | — | — | 66,167 | ||||||||||||||||||||
| — | — | — | — | 1,958 | ||||||||||||||||||||
| 43,093 | 5,039 | 5,717 | 1,513 | 13 | ||||||||||||||||||||
| 6,538,437 | 317,481 | 456,279 | 121,548 | 188,454 | ||||||||||||||||||||
| (1,378 | ) | (40,879 | ) | (633 | ) | (70,491 | ) | (154,073 | ) | |||||||||||||||
| 6,537,059 | 276,602 | 455,646 | 51,057 | 34,381 | ||||||||||||||||||||
| 4,931,571 | 273,195 | (20,312 | ) | 38,981 | 52,275 | |||||||||||||||||||
| 114,978,375 | 304,142 | 1,053,113 | 164,159 | (282,910 | ) | |||||||||||||||||||
| — | — | — | — | 2 | ||||||||||||||||||||
| 114,978,375 | 304,142 | 1,053,113 | 164,159 | (282,908 | ) | |||||||||||||||||||
| (475,962,564 | ) | (16,693,486 | ) | (19,476,627 | ) | (3,530,671 | ) | (2,063,197 | ) | |||||||||||||||
| — | — | — | — | (2 | ) | |||||||||||||||||||
| (475,962,564 | ) | (16,693,486 | ) | (19,476,627 | ) | (3,530,671 | ) | (2,063,199 | ) | |||||||||||||||
| (360,984,189 | ) | (16,389,344 | ) | (18,423,514 | ) | (3,366,512 | ) | (2,346,107 | ) | |||||||||||||||
| $ | (356,052,618 | ) | $ | (16,116,149 | ) | $ | (18,443,826 | ) | $ | (3,327,531 | ) | $ | (2,293,832 | ) | ||||||||||
| $ | — | $ | — | $ | 313 | $ | — | $ | 3,890 | |||||||||||||||
| $ | — | $ | — | $ | — | $ | — | $ | — | |||||||||||||||
| $ | — | $ | — | $ | — | $ | — | $ | — | |||||||||||||||
| $ | 5,178 | $ | — | $ | — | $ | — | $ | — | |||||||||||||||
Semi-Annual Report 165
The Lazard Funds, Inc. Statements of Changes in Net Assets
| Lazard Developing Markets Equity Portfolio | |||||||||
| Six Months Ended June 30, 2022 (unaudited) | Year Ended December 31, 2021 | ||||||||
| Increase (Decrease) in Net Assets | |||||||||
| Operations | |||||||||
| Net investment income (loss) | $ | 999,541 | $ | 535,821 | |||||
| Net realized gain (loss) | 1,770,230 | 2,234,077 | |||||||
| Net change in unrealized appreciation (depreciation) | (31,218,092 | ) | (23,292,772 | ) | |||||
| Net increase (decrease) in net assets resulting from operations | (28,448,321 | ) | (20,522,874 | ) | |||||
| Distributions to shareholders (Note 2(e)) | |||||||||
| Net investment income and net realized gains | |||||||||
| Institutional Shares | — | (1,516,068 | ) | ||||||
| Open Shares | — | (70,702 | ) | ||||||
| R6 Shares | — | — | |||||||
| Net decrease in net assets resulting from distributions | — | (1,586,770 | ) | ||||||
| Capital stock transactions | |||||||||
| Net proceeds from sales | |||||||||
| Institutional Shares | 13,755,773 | 52,260,422 | |||||||
| Open Shares | 734,754 | 4,865,685 | |||||||
| R6 Shares | — | — | |||||||
| Net proceeds from reinvestment of distributions | |||||||||
| Institutional Shares | — | 1,208,264 | |||||||
| Open Shares | — | 62,092 | |||||||
| R6 Shares | — | — | |||||||
| Cost of shares redeemed | |||||||||
| Institutional Shares | (25,412,202 | ) | (74,730,015 | ) | |||||
| Open Shares | (1,747,709 | ) | (4,547,349 | ) | |||||
| R6 Shares | — | — | |||||||
| Net increase (decrease) in net assets from capital stock transactions | (12,669,384 | ) | (20,880,901 | ) | |||||
| Total increase (decrease) in net assets | (41,117,705 | ) | (42,990,545 | ) | |||||
| Net assets at beginning of period | 157,612,831 | 200,603,376 | |||||||
| Net assets at end of period | $ | 116,495,126 | $ | 157,612,831 | |||||
The accompanying notes are an integral part of these financial statements.
166 Semi-Annual Report
| Lazard Emerging Markets Core Equity Portfolio | Lazard Emerging Markets Equity Advantage Portfolio | |||||||||||||||
| Six Months Ended June 30, 2022 (unaudited) | Year Ended December 31, 2021 | Six Months Ended June 30, 2022 (unaudited) | Year Ended December 31, 2021 | |||||||||||||
| $ | 1,068,735 | $ | 1,239,180 | $ | 843,240 | $ | 1,175,145 | |||||||||
| (2,689,475 | ) | 9,732,694 | (5,222,308 | ) | 3,733,999 | |||||||||||
| (31,036,790 | ) | (31,673,211 | ) | (7,536,153 | ) | (6,316,504 | ) | |||||||||
| (32,657,530 | ) | (20,701,337 | ) | (11,915,221 | ) | (1,407,360 | ) | |||||||||
| — | (1,210,128 | ) | — | (5,115,729 | ) | |||||||||||
| — | (9,228 | ) | — | (118,907 | ) | |||||||||||
| — | (3,617 | ) | — | — | ||||||||||||
| — | (1,222,973 | ) | — | (5,234,636 | ) | |||||||||||
| 18,647,531 | 50,845,441 | 7,595,543 | 47,141,565 | |||||||||||||
| 576,931 | 2,306,794 | 31,109 | 4,665,435 | |||||||||||||
| 98,993 | 36,357 | — | — | |||||||||||||
| — | 1,162,680 | — | 5,115,729 | |||||||||||||
| — | 8,896 | — | 118,907 | |||||||||||||
| — | 3,617 | — | — | |||||||||||||
| (33,231,191 | ) | (83,623,051 | ) | (10,948,463 | ) | (4,956,704 | ) | |||||||||
| (728,757 | ) | (2,488,441 | ) | (765,693 | ) | (4,699,211 | ||||||||||
| (667 | ) | (211,190 | ) | — | — | |||||||||||
| (14,637,160 | ) | (31,958,897 | ) | (4,087,504 | ) | 47,385,721 | ||||||||||
| (47,294,690 | ) | (53,883,207 | ) | (16,002,725 | ) | 40,743,725 | ||||||||||
| 158,707,648 | 212,590,855 | 69,517,301 | 28,773,576 | |||||||||||||
| $ | 111,412,958 | $ | 158,707,648 | $ | 53,514,576 | $ | 69,517,301 | |||||||||
Semi-Annual Report 167
| Lazard Developing Markets Equity Portfolio | |||||||||
| Six Months Ended June 30, 2022 (unaudited) | Year Ended December 31, 2021 | ||||||||
| Shares issued and redeemed | |||||||||
| Institutional Shares | |||||||||
| Shares outstanding at beginning of period | 9,637,932 | 11,013,865 | |||||||
| Shares sold | 1,002,087 | 2,988,029 | |||||||
| Shares issued to shareholders from reinvestment of distributions | — | 78,503 | |||||||
| Shares redeemed | (1,855,095 | ) | (4,442,465 | ) | |||||
| Net increase (decrease) | (853,008 | ) | (1,375,933 | ) | |||||
| Shares outstanding at end of period | 8,784,924 | 9,637,932 | |||||||
| Open Shares | |||||||||
| Shares outstanding at beginning of period | 600,534 | 575,985 | |||||||
| Shares sold | 55,442 | 295,291 | |||||||
| Shares issued to shareholders from reinvestment of distributions | — | 4,053 | |||||||
| Shares redeemed | (125,134 | ) | (274,795 | ) | |||||
| Net increase (decrease) | (69,692 | ) | 24,549 | ||||||
| Shares outstanding at end of period | 530,842 | 600,534 | |||||||
| R6 Shares | |||||||||
| Shares outstanding at beginning of period | — | — | |||||||
| Shares sold | — | — | |||||||
| Shares issued to shareholders from reinvestment of distributions | — | — | |||||||
| Shares redeemed | — | — | |||||||
| Net increase (decrease) | — | — | |||||||
| Shares outstanding at end of period | — | — | |||||||
The accompanying notes are an integral part of these financial statements.
168 Semi-Annual Report
| Lazard Emerging Markets Core Equity Portfolio | Lazard Emerging Markets Equity Advantage Portfolio | ||||||||||||||||
| Six Months Ended June 30, 2022 (unaudited) | Year Ended December 31, 2021 | Six Months Ended June 30, 2022 (unaudited) | Year Ended December 31, 2021 | ||||||||||||||
| 13,520,650 | 15,971,095 | 5,322,452 | 2,022,986 | ||||||||||||||
| 1,750,767 | 3,931,923 | 655,212 | 3,256,474 | ||||||||||||||
| — | 100,591 | — | 397,695 | ||||||||||||||
| (3,177,617 | ) | (6,482,959 | ) | (954,135 | ) | (354,703 | ) | ||||||||||
| (1,426,850 | ) | (2,450,445 | ) | (298,923 | ) | 3,299,466 | |||||||||||
| 12,093,800 | 13,520,650 | 5,023,529 | 5,322,452 | ||||||||||||||
| 183,190 | 194,354 | 76,021 | 63,491 | ||||||||||||||
| 53,964 | 176,646 | 2,506 | 329,650 | ||||||||||||||
| — | 768 | — | 9,268 | ||||||||||||||
| (70,477 | ) | (188,578 | ) | (60,625 | ) | (326,388 | ) | ||||||||||
| (16,513 | ) | (11,164 | ) | (58,119 | ) | 12,530 | |||||||||||
| 166,677 | 183,190 | 17,902 | 76,021 | ||||||||||||||
| 26,865 | 41,454 | — | — | ||||||||||||||
| 10,305 | 2,728 | — | — | ||||||||||||||
| — | 313 | — | — | ||||||||||||||
| (63 | ) | (17,630 | ) | — | — | ||||||||||||
| 10,242 | (14,589 | ) | — | — | |||||||||||||
| 37,107 | 26,865 | — | — | ||||||||||||||
Semi-Annual Report 169
| Lazard Emerging Markets Equity Portfolio | |||||||||
| Six Months Ended June 30, 2022 (unaudited) | Year Ended December 31, 2021 | ||||||||
| Increase (Decrease) in Net Assets | |||||||||
| Operations | |||||||||
| Net investment income (loss) | $ | 77,087,526 | $ | 120,592,475 | |||||
| Net realized gain (loss) | (14,179,670 | ) | 456,289,025 | ||||||
| Net change in unrealized appreciation (depreciation) | (580,571,258 | ) | (330,831,004 | ) | |||||
| Net increase (decrease) in net assets resulting from operations | (517,663,402 | ) | 246,050,496 | ||||||
| Distributions to shareholders (Note 2(e)) | |||||||||
| Net investment income and net realized gains | |||||||||
| Institutional Shares | — | (159,751,886 | ) | ||||||
| Open Shares | — | (16,684,053 | ) | ||||||
| R6 Shares | — | (689,358 | ) | ||||||
| Net decrease in net assets resulting from distributions | — | (177,125,297 | ) | ||||||
| Capital stock transactions | |||||||||
| Net proceeds from sales | |||||||||
| Institutional Shares | 436,865,038 | 956,710,099 | |||||||
| Open Shares | 9,657,995 | 68,488,391 | |||||||
| R6 Shares | 554,011 | 3,700,364 | |||||||
| Net proceeds from reinvestment of distributions | |||||||||
| Institutional Shares | — | 151,053,474 | |||||||
| Open Shares | — | 16,468,567 | |||||||
| R6 Shares | — | 299,282 | |||||||
| Cost of shares redeemed | |||||||||
| Institutional Shares | (717,932,022 | ) | (1,822,322,913 | ) | |||||
| Open Shares | (31,418,905 | ) | (141,191,852 | ) | |||||
| R6 Shares | (1,712,419 | ) | (18,710,896 | ) | |||||
| Net increase (decrease) in net assets from capital stock transactions | (303,986,302 | ) | (785,505,484 | ) | |||||
| Total increase (decrease) in net assets | (821,649,704 | ) | (716,580,285 | ) | |||||
| Net assets at beginning of period | 3,652,917,980 | 4,369,498,265 | |||||||
| Net assets at end of period | $ | 2,831,268,276 | $ | 3,652,917,980 | |||||
The accompanying notes are an integral part of these financial statements.
170 Semi-Annual Report
| Lazard Emerging Markets Strategic Equity Portfolio | Lazard Equity Franchise Portfolio | ||||||||||||||||
| Six Months Ended June 30, 2022 (unaudited) | Year Ended December 31, 2021 | Six Months Ended June 30, 2022 (unaudited) | Year Ended December 31, 2021 | ||||||||||||||
| $ | 788,337 | $ | 940,740 | $ | 656,577 | $ | 1,310,927 | ||||||||||
| (4,332,091 | ) | 9,963,488 | 14,892,909 | 17,439,556 | |||||||||||||
| (7,346,842 | ) | (14,182,731 | ) | (20,223,838 | ) | 1,976,572 | |||||||||||
| (10,890,596 | ) | (3,278,503 | ) | (4,674,352 | ) | 20,727,055 | |||||||||||
| — | (721,332 | ) | — | (14,253,601 | ) | ||||||||||||
| — | (29,982 | ) | — | (15,148 | ) | ||||||||||||
| — | — | — | — | ||||||||||||||
| — | (751,314 | ) | — | (14,268,749 | ) | ||||||||||||
| 4,479,776 | 8,602,187 | 89,130,435 | 8,142,721 | ||||||||||||||
| 1,508,084 | 999,414 | 119,271 | 89,499 | ||||||||||||||
| — | — | — | — | ||||||||||||||
| — | 707,559 | — | 14,253,601 | ||||||||||||||
| — | 29,167 | — | 15,148 | ||||||||||||||
| — | — | — | — | ||||||||||||||
| (4,909,127 | ) | (22,613,433 | ) | (43,036,877 | ) | (15,135,877 | ) | ||||||||||
| (1,295,206 | ) | (1,902,152 | ) | (20,990 | ) | (151,272 | ) | ||||||||||
| — | — | — | — | ||||||||||||||
| (216,473 | ) | (14,177,258 | ) | 46,191,839 | 7,213,820 | ||||||||||||
| (11,107,069 | ) | (18,207,075 | ) | 41,517,487 | 13,672,126 | ||||||||||||
| 60,217,800 | 78,424,875 | 105,521,571 | 91,849,445 | ||||||||||||||
| $ | 49,110,731 | $ | 60,217,800 | $ | 147,039,058 | $ | 105,521,571 | ||||||||||
Semi-Annual Report 171
| Lazard Emerging Markets Equity Portfolio | |||||||||
| Six Months Ended June 30, 2022 (unaudited) | Year Ended December 31, 2021 | ||||||||
| Shares issued and redeemed | |||||||||
| Institutional Shares | |||||||||
| Shares outstanding at beginning of period | 180,498,233 | 217,598,338 | |||||||
| Shares sold | 25,531,565 | 50,172,346 | |||||||
| Shares issued to shareholders from reinvestment of distributions | — | 8,290,244 | |||||||
| Shares redeemed | (41,796,538 | ) | (95,562,695 | ) | |||||
| Net increase (decrease) | (16,264,973 | ) | (37,100,105 | ) | |||||
| Shares outstanding at end of period | 164,233,260 | 180,498,233 | |||||||
| Open Shares | |||||||||
| Shares outstanding at beginning of period | 19,885,383 | 22,707,741 | |||||||
| Shares sold | 538,122 | 3,539,036 | |||||||
| Shares issued to shareholders from reinvestment of distributions | — | 876,315 | |||||||
| Shares redeemed | (1,745,384 | ) | (7,237,709 | ) | |||||
| Net increase (decrease) | (1,207,262 | ) | (2,822,358 | ) | |||||
| Shares outstanding at end of period | 18,678,121 | 19,885,383 | |||||||
| R6 Shares | |||||||||
| Shares outstanding at beginning of period | 544,810 | 1,310,139 | |||||||
| Shares sold | 32,025 | 196,315 | |||||||
| Shares issued to shareholders from reinvestment of distributions | — | 16,436 | |||||||
| Shares redeemed | (95,775 | ) | (978,080 | ) | |||||
| Net increase (decrease) | (63,750 | ) | (765,329 | ) | |||||
| Shares outstanding at end of period | 481,060 | 544,810 | |||||||
The accompanying notes are an integral part of these financial statements.
172 Semi-Annual Report
| Lazard Emerging Markets Strategic Equity Portfolio | Lazard Equity Franchise Portfolio | |||||||||||||||
| Six Months Ended June 30, 2022 (unaudited) | Year Ended December 31, 2021 | Six Months Ended June 30, 2022 (unaudited) | Year Ended December 31, 2021 | |||||||||||||
| 4,450,374 | 5,390,573 | 9,780,445 | 9,016,463 | |||||||||||||
| 360,898 | 616,289 | 8,833,134 | 719,088 | |||||||||||||
| — | 55,484 | — | 1,336,289 | |||||||||||||
| (416,596 | ) | (1,611,972 | ) | (3,933,650 | ) | (1,291,395 | ) | |||||||||
| (55,698 | ) | (940,199 | ) | 4,899,484 | 763,982 | |||||||||||
| 4,394,676 | 4,450,374 | 14,679,929 | 9,780,445 | |||||||||||||
| 228,303 | 290,075 | 8,621 | 12,708 | |||||||||||||
| 131,665 | 70,220 | 11,036 | 7,463 | |||||||||||||
| — | 2,278 | — | 1,421 | |||||||||||||
| (113,726 | ) | (134,270 | ) | (1,921 | ) | (12,971 | ) | |||||||||
| 17,939 | (61,772 | ) | 9,115 | (4,087 | ) | |||||||||||
| 246,242 | 228,303 | 17,736 | 8,621 | |||||||||||||
| — | — | — | — | |||||||||||||
| — | — | — | — | |||||||||||||
| — | — | — | — | |||||||||||||
| — | — | — | — | |||||||||||||
| — | — | — | — | |||||||||||||
| — | — | — | — | |||||||||||||
Semi-Annual Report 173
| Lazard Global Equity Select Portfolio | |||||||||
| Six Months Ended June 30, 2022 (unaudited) | Year Ended December 31, 2021 | ||||||||
| Increase (Decrease) in Net Assets | |||||||||
| Operations | |||||||||
| Net investment income (loss) | $ | 386,015 | $ | 522,451 | |||||
| Net realized gain (loss) | 996,715 | 3,093,668 | |||||||
| Net change in unrealized appreciation (depreciation) | (24,930,382 | ) | 15,157,447 | ||||||
| Net increase (decrease) in net assets resulting from operations | (23,547,652 | ) | 18,773,566 | ||||||
| Distributions to shareholders (Note 2(e)) | |||||||||
| Net investment income and net realized gains | |||||||||
| Institutional Shares | — | (4,303,883 | ) | ||||||
| Open Shares | — | (58,304 | ) | ||||||
| Net decrease in net assets resulting from distributions | — | (4,362,187 | ) | ||||||
| Capital stock transactions | |||||||||
| Net proceeds from sales | |||||||||
| Institutional Shares | 14,632,755 | 15,911,457 | |||||||
| Open Shares | 115,862 | 421,016 | |||||||
| Net proceeds from reinvestment of distributions | |||||||||
| Institutional Shares | — | 4,260,522 | |||||||
| Open Shares | — | 58,304 | |||||||
| Cost of shares redeemed | |||||||||
| Institutional Shares | (7,198,396 | ) | (16,880,543 | ) | |||||
| Open Shares | (116,792 | ) | (271,978 | ) | |||||
| Net increase (decrease) in net assets from capital stock transactions | 7,433,429 | 3,498,778 | |||||||
| Total increase (decrease) in net assets | (16,114,223 | ) | 17,910,157 | ||||||
| Net assets at beginning of period | 111,485,986 | 93,575,829 | |||||||
| Net assets at end of period | $ | 95,371,763 | $ | 111,485,986 | |||||
The accompanying notes are an integral part of these financial statements.
174 Semi-Annual Report
| Lazard Global Listed Infrastructure Portfolio | Lazard Global Strategic Equity Portfolio | |||||||||||||||
| Six Months Ended June 30, 2022 (unaudited) | Year Ended December 31, 2021 | Six Months Ended June 30, 2022 (unaudited) | Year Ended December 31, 2021 | |||||||||||||
| $ | 132,267,724 | $ | 306,182,281 | $ | 29,347 | $ | 274,422 | |||||||||
| 372,050,761 | 562,799,096 | (346,804 | ) | 450,537 | ||||||||||||
| (558,695,791 | ) | 564,898,117 | (3,604,772 | ) | 1,112,447 | |||||||||||
| (54,377,306 | ) | 1,433,879,494 | (3,922,229 | ) | 1,837,406 | |||||||||||
| (158,714,377 | ) | (445,280,768 | ) | — | (723,599 | ) | ||||||||||
| (6,292,520 | ) | (17,469,224 | ) | — | (8,321 | ) | ||||||||||
| (165,006,897 | ) | (462,749,992 | ) | — | (731,920 | ) | ||||||||||
| 1,800,869,364 | 2,105,406,878 | 6,624 | 13,182,269 | |||||||||||||
| 98,446,597 | 45,133,550 | — | 39,814 | |||||||||||||
| 128,616,908 | 367,039,859 | — | 723,599 | |||||||||||||
| 6,198,324 | 17,173,844 | — | 8,321 | |||||||||||||
| (924,250,752 | ) | (3,390,031,626 | ) | (1,372,645 | ) | (1,562,222 | ) | |||||||||
| (39,169,221 | ) | (104,401,284 | ) | — | (45,662 | ) | ||||||||||
| 1,070,711,220 | (959,678,779 | ) | (1,366,021 | ) | 12,346,119 | |||||||||||
| 851,327,017 | 11,450,723 | (5,288,250 | ) | 13,451,605 | ||||||||||||
| 7,608,887,728 | 7,597,437,005 | 17,711,913 | 4,260,308 | |||||||||||||
| $ | 8,460,214,745 | $ | 7,608,887,728 | $ | 12,423,663 | $ | 17,711,913 | |||||||||
Semi-Annual Report 175
| Lazard Global Equity Select Portfolio | |||||||||
| Six Months Ended June 30, 2022 (unaudited) | Year Ended December 31, 2021 | ||||||||
| Shares issued and redeemed | |||||||||
| Institutional Shares | |||||||||
| Shares outstanding at beginning of period | 5,857,479 | 5,662,503 | |||||||
| Shares sold | 880,675 | 893,399 | |||||||
| Shares issued to shareholders from reinvestment of distributions | — | 230,274 | |||||||
| Shares redeemed | (435,610 | ) | (928,697 | ) | |||||
| Net increase (decrease) | 445,065 | �� | 194,976 | ||||||
| Shares outstanding at end of period | 6,302,544 | 5,857,479 | |||||||
| Open Shares | |||||||||
| Shares outstanding at beginning of period | 82,179 | 70,899 | |||||||
| Shares sold | 7,051 | 22,810 | |||||||
| Shares issued to shareholders from reinvestment of distributions | — | 3,150 | |||||||
| Shares redeemed | (6,954 | ) | (14,680 | ) | |||||
| Net increase (decrease) | 97 | 11,280 | |||||||
| Shares outstanding at end of period | 82,276 | 82,179 | |||||||
The accompanying notes are an integral part of these financial statements.
176 Semi-Annual Report
| Lazard Global Listed Infrastructure Portfolio | Lazard Global Strategic Equity Portfolio | |||||||||||||||
| Six Months Ended June 30, 2022 (unaudited) | Year Ended December 31, 2021 | Six Months Ended June 30, 2022 (unaudited) | Year Ended December 31, 2021 | |||||||||||||
| 442,920,557 | 497,500,386 | 1,297,363 | 336,354 | |||||||||||||
| 109,531,504 | 135,453,262 | 591 | 1,024,819 | |||||||||||||
| 8,058,958 | 22,720,015 | — | 54,298 | |||||||||||||
| (56,671,829 | ) | (212,753,106 | ) | (124,089 | ) | (118,108 | ) | |||||||||
| 60,918,633 | (54,579,829 | ) | (123,498 | ) | 961,009 | |||||||||||
| 503,839,190 | 442,920,557 | 1,173,865 | 1,297,363 | |||||||||||||
| 18,194,277 | 20,993,761 | 15,713 | 15,347 | |||||||||||||
| 5,918,825 | 2,904,083 | — | 3,136 | |||||||||||||
| 388,387 | 1,061,731 | — | 630 | |||||||||||||
| (2,389,714 | ) | (6,765,298 | ) | — | (3,400 | ) | ||||||||||
| 3,917,498 | (2,799,484 | ) | — | 366 | ||||||||||||
| 22,111,775 | 18,194,277 | 15,713 | 15,713 | |||||||||||||
Semi-Annual Report 177
| Lazard International Equity Advantage Portfolio | |||||||||||
| Six Months Ended June 30, 2022 (unaudited) | Year Ended December 31, 2021 | ||||||||||
| Increase (Decrease) in Net Assets | |||||||||||
| Operations | |||||||||||
| Net investment income (loss) | $ | 57,147 | $ | 72,425 | |||||||
| Net realized gain (loss) | (27,228 | ) | 363,319 | ||||||||
| Net change in unrealized appreciation (depreciation) | (575,406 | ) | (74,508 | ) | |||||||
| Net increase (decrease) in net assets resulting from operations | (545,487 | ) | 361,236 | ||||||||
| Distributions to shareholders (Note 2(e)) | |||||||||||
| Net investment income and net realized gains | |||||||||||
| Institutional Shares | — | (136,304 | ) | ||||||||
| Open Shares | — | (6,138 | ) | ||||||||
| R6 Shares | — | — | |||||||||
| Net decrease in net assets resulting from distributions | — | (142,442 | ) | ||||||||
| Capital stock transactions | |||||||||||
| Net proceeds from sales | |||||||||||
| Institutional Shares | 2,793 | 40,901 | |||||||||
| Open Shares | — | 5 | |||||||||
| R6 Shares | — | — | |||||||||
| Net proceeds from reinvestment of distributions | |||||||||||
| Institutional Shares | — | 136,304 | |||||||||
| Open Shares | — | 6,138 | |||||||||
| R6 Shares | — | — | |||||||||
| Cost of shares redeemed | |||||||||||
| Institutional Shares | (29,313 | ) | (3,098 | ) | |||||||
| Open Shares | — | (5 | ) | ||||||||
| R6 Shares | — | — | |||||||||
| Net increase (decrease) in net assets from capital stock transactions | (26,520 | ) | 180,245 | ||||||||
| Total increase (decrease) in net assets | (572,007 | ) | 399,039 | ||||||||
| Net assets at beginning of period | 2,990,129 | 2,591,090 | |||||||||
| Net assets at end of period | $ | 2,418,122 | $ | 2,990,129 | |||||||
The accompanying notes are an integral part of these financial statements.
178 Semi-Annual Report
| Lazard International Equity Portfolio | Lazard International Equity Select Portfolio | |||||||||||||||
| Six Months Ended June 30, 2022 (unaudited) | Year Ended December 31, 2021 | Six Months Ended June 30, 2022 (unaudited) | Year Ended December 31, 2021 | |||||||||||||
| $ | 21,425,070 | $ | 81,041,750 | $ | 882,625 | $ | 2,286,078 | |||||||||
| 3,025,706 | 389,206,211 | (868,150 | ) | 4,405,810 | ||||||||||||
| (319,829,493 | ) | (306,922,993 | ) | (13,790,673 | ) | (3,727,110 | ) | |||||||||
| (295,378,717 | ) | 163,324,968 | (13,776,198 | ) | 2,964,778 | |||||||||||
| — | (253,995,902 | ) | — | (2,615,190 | ) | |||||||||||
| — | (15,297,137 | ) | — | (123,856 | ) | |||||||||||
| — | (17,839,297 | ) | — | — | ||||||||||||
| — | (287,132,336 | ) | — | (2,739,046 | ) | |||||||||||
| 138,535,053 | 383,144,673 | 8,105,120 | 18,472,160 | |||||||||||||
| 7,231,892 | 21,198,302 | 620,077 | 3,372,556 | |||||||||||||
| 12,048,406 | 42,310,511 | — | — | |||||||||||||
| — | 213,278,530 | — | 2,516,085 | |||||||||||||
| — | 11,284,238 | — | 122,927 | |||||||||||||
| — | 17,766,875 | — | — | |||||||||||||
| (355,229,767 | ) | (1,737,109,035 | ) | (11,598,733 | ) | (34,552,279 | ) | |||||||||
| (27,067,757 | ) | (51,535,133 | ) | (974,070 | ) | (2,198,410 | ) | |||||||||
| (43,443,449 | ) | (62,688,011 | ) | — | — | |||||||||||
| (267,925,622 | ) | (1,162,349,050 | ) | (3,847,606 | ) | (12,266,961 | ) | |||||||||
| (563,304,339 | ) | (1,286,156,418 | ) | (17,623,804 | ) | (12,041,229 | ) | |||||||||
| 1,776,493,695 | 3,062,650,113 | 82,947,609 | 94,988,838 | |||||||||||||
| $ | 1,213,189,356 | $ | 1,776,493,695 | $ | 65,323,805 | $ | 82,947,609 | |||||||||
Semi-Annual Report 179
| Lazard International Equity Advantage Portfolio | �� | ||||||||||
| Six Months Ended June 30, 2022 (unaudited) | Year Ended December 31, 2021 | ||||||||||
| Shares issued and redeemed | |||||||||||
| Institutional Shares | |||||||||||
| Shares outstanding at beginning of period | 255,051 | 239,526 | |||||||||
| Shares sold | 253 | 3,462 | |||||||||
| Shares issued to shareholders from reinvestment of distributions | — | 12,333 | |||||||||
| Shares redeemed | (2,983 | ) | (270 | ) | |||||||
| Net increase (decrease) | (2,730 | ) | 15,525 | ||||||||
| Shares outstanding at end of period | 252,321 | 255,051 | |||||||||
| Open Shares | |||||||||||
| Shares outstanding at beginning of period | 12,075 | 11,520 | |||||||||
| Shares sold | — | — | # | ||||||||
| Shares issued to shareholders from reinvestment of distributions | — | 555 | |||||||||
| Shares redeemed | — | — | # | ||||||||
| Net increase (decrease) | — | 555 | |||||||||
| Shares outstanding at end of period | 12,075 | 12,075 | |||||||||
| R6 Shares | |||||||||||
| Shares outstanding at beginning of period | — | — | |||||||||
| Shares sold | — | — | |||||||||
| Shares issued to shareholders from reinvestment of distributions | — | — | |||||||||
| Shares redeemed | — | — | |||||||||
| Net increase (decrease) | — | — | |||||||||
| Shares outstanding at end of period | — | — | |||||||||
| # | Shares values are less than 1 |
The accompanying notes are an integral part of these financial statements.
180 Semi-Annual Report
| Lazard International Equity Portfolio | Lazard International Equity Select Portfolio | |||||||||||||||
| Six Months Ended June 30, 2022 (unaudited) | Year Ended December 31, 2021 | Six Months Ended June 30, 2022 (unaudited) | Year Ended December 31, 2021 | |||||||||||||
| 87,137,715 | 140,490,643 | 6,846,470 | 7,993,045 | |||||||||||||
| 8,408,065 | 18,535,338 | 761,778 | 1,557,162 | |||||||||||||
| — | 11,911,077 | — | 221,097 | |||||||||||||
| (22,209,728 | ) | (83,799,343 | ) | (1,094,218 | ) | (2,924,834 | ) | |||||||||
| (13,801,663 | ) | (53,352,928 | ) | (332,440 | ) | (1,146,575 | ) | |||||||||
| 73,336,052 | 87,137,715 | 6,514,030 | 6,846,470 | |||||||||||||
| 5,114,581 | 5,960,372 | 360,195 | 247,615 | |||||||||||||
| 436,081 | 1,039,570 | 58,112 | 286,138 | |||||||||||||
| — | 621,271 | — | 10,745 | |||||||||||||
| (1,658,821 | ) | (2,506,632 | ) | (91,641 | ) | (184,303 | ) | |||||||||
| (1,222,740 | ) | (845,791 | ) | (33,529 | ) | 112,580 | ||||||||||
| 3,891,841 | 5,114,581 | 326,666 | 360,195 | |||||||||||||
| 6,472,435 | 6,473,822 | — | — | |||||||||||||
| 699,693 | 2,031,145 | — | — | |||||||||||||
| — | 995,068 | — | — | |||||||||||||
| (2,774,201 | ) | (3,027,600 | ) | — | — | |||||||||||
| (2,074,508 | ) | (1,387 | ) | — | — | |||||||||||
| 4,397,927 | 6,472,435 | — | — | |||||||||||||
Semi-Annual Report 181
| Lazard International Quality Growth Portfolio | |||||||||||
| Six Months Ended June 30, 2022 (unaudited) | Year Ended December 31, 2021 | ||||||||||
| Increase (Decrease) in Net Assets | |||||||||||
| Operations | |||||||||||
| Net investment income (loss) | $ | 618,446 | $ | 139,783 | |||||||
| Net realized gain (loss) | 848,335 | 1,114,601 | |||||||||
| Net change in unrealized appreciation (depreciation) | (26,189,629 | ) | 1,030,349 | ||||||||
| Net increase (decrease) in net assets resulting from operations | (24,722,848 | ) | 2,284,733 | ||||||||
| Distributions to shareholders (Note 2(e)) | |||||||||||
| Net investment income and net realized gains | |||||||||||
| Institutional Shares | — | (1,250,451 | ) | ||||||||
| Open Shares | — | (6,304 | ) | ||||||||
| R6 Shares | — | — | |||||||||
| Return of capital | |||||||||||
| Institutional Shares | — | — | |||||||||
| Open Shares | — | — | |||||||||
| R6 Shares | — | — | |||||||||
| Net decrease in net assets resulting from distributions | — | (1,256,755 | ) | ||||||||
| Capital stock transactions | |||||||||||
| Net proceeds from sales | |||||||||||
| Institutional Shares | 84,784,431 | 50,450,611 | |||||||||
| Open Shares | 12,556 | 94,898 | |||||||||
| R6 Shares | — | — | |||||||||
| Net proceeds from reinvestment of distributions | |||||||||||
| Institutional Shares | — | 1,250,451 | |||||||||
| Open Shares | — | 6,304 | |||||||||
| R6 Shares | — | — | |||||||||
| Cost of shares redeemed | |||||||||||
| Institutional Shares | (8,627,660 | ) | (713,404 | ) | |||||||
| Open Shares | (2,377 | ) | (79,883 | ) | |||||||
| R6 Shares | — | — | |||||||||
| Net increase (decrease) in net assets from capital stock transactions | 76,166,950 | 51,008,977 | |||||||||
| Total increase (decrease) in net assets | 51,444,102 | 52,036,955 | |||||||||
| Net assets at beginning of period | 62,801,206 | 10,764,251 | |||||||||
| Net assets at end of period | $ | 114,245,308 | $ | 62,801,206 | |||||||
The accompanying notes are an integral part of these financial statements.
182 Semi-Annual Report
| Lazard International Small Cap Equity Portfolio | Lazard International Strategic Equity Portfolio | |||||||||||||||
| Six Months Ended June 30, 2022 (unaudited) | Year Ended December 31, 2021 | Six Months Ended June 30, 2022 (unaudited) | Year Ended December 31, 2021 | |||||||||||||
| $ | 255,736 | $ | 439,882 | $ | 66,709,999 | $ | 200,921,129 | |||||||||
| (156,834 | ) | 9,107,856 | (140,474,123 | ) | 243,245,427 | |||||||||||
| (7,355,209 | ) | (4,940,101 | ) | (1,120,358,936 | ) | (100,750,072 | ) | |||||||||
| (7,256,307 | ) | 4,607,637 | (1,194,123,060 | ) | 343,416,484 | |||||||||||
| — | (4,264,944 | ) | — | (371,347,485 | ) | |||||||||||
| — | (3,483,346 | ) | — | (30,723,600 | ) | |||||||||||
| — | — | — | (7,937,887 | ) | ||||||||||||
| — | — | — | (101,625,202 | ) | ||||||||||||
| — | — | — | (8,228,846 | ) | ||||||||||||
| — | — | — | (2,172,377 | ) | ||||||||||||
| — | (7,748,290 | ) | — | (522,035,397 | ) | |||||||||||
| 1,597,611 | 4,617,643 | 496,769,845 | 1,150,537,246 | |||||||||||||
| 2,792,769 | 1,560,153 | 43,884,247 | 67,454,415 | |||||||||||||
| — | — | 2,945,373 | 7,162,815 | |||||||||||||
| — | 4,244,754 | — | 448,404,862 | |||||||||||||
| — | 3,417,384 | — | 36,546,493 | |||||||||||||
| — | — | — | 9,942,857 | |||||||||||||
| (4,724,880 | ) | (22,623,777 | ) | (625,746,460 | ) | (990,293,303 | ) | |||||||||
| (831,801 | ) | (3,519,994 | ) | (102,088,076 | ) | (168,625,826 | ) | |||||||||
| — | — | (5,771,544 | ) | (8,192,483 | ) | |||||||||||
| (1,166,301 | ) | (12,303,837 | ) | (190,006,615 | ) | 552,937,076 | ||||||||||
| (8,422,608 | ) | (15,444,490 | ) | (1,384,129,675 | ) | 374,318,163 | ||||||||||
| 26,510,698 | 41,955,188 | 6,298,892,950 | 5,924,574,787 | |||||||||||||
| $ | 18,088,090 | $ | 26,510,698 | $ | 4,914,763,275 | $ | 6,298,892,950 | |||||||||
Semi-Annual Report 183
| Lazard International Quality Growth Portfolio | |||||||||||
| Six Months Ended June 30, 2022 (unaudited) | Year Ended December 31, 2021 | ||||||||||
| Shares issued and redeemed | |||||||||||
| Institutional Shares | |||||||||||
| Shares outstanding at beginning of period | 3,718,473 | 671,884 | |||||||||
| Shares sold | 5,664,203 | 3,014,033 | |||||||||
| Shares issued to shareholders from reinvestment of distributions | — | 75,374 | |||||||||
| Shares redeemed | (560,116 | ) | (42,818 | ) | |||||||
| Net increase (decrease) | 5,104,087 | 3,046,589 | |||||||||
| Shares outstanding at end of period | 8,822,560 | 3,718,473 | |||||||||
| Open Shares | |||||||||||
| Shares outstanding at beginning of period | 19,946 | 18,777 | |||||||||
| Shares sold | 893 | 5,628 | |||||||||
| Shares issued to shareholders from reinvestment of distributions | — | 382 | |||||||||
| Shares redeemed | (157 | ) | (4,841 | ) | |||||||
| Net increase (decrease) | 736 | 1,169 | |||||||||
| Shares outstanding at end of period | 20,682 | 19,946 | |||||||||
| R6 Shares | |||||||||||
| Shares outstanding at beginning of period | — | — | |||||||||
| Shares sold | — | — | |||||||||
| Shares issued to shareholders from reinvestment of distributions | — | — | |||||||||
| Shares redeemed | — | — | |||||||||
| Net increase (decrease) | — | — | |||||||||
| Shares outstanding at end of period | — | — | |||||||||
The accompanying notes are an integral part of these financial statements.
184 Semi-Annual Report
| Lazard International Small Cap Equity Portfolio | Lazard International Strategic Equity Portfolio | |||||||||||||||
| Six Months Ended June 30, 2022 (unaudited) | Year Ended December 31, 2021 | Six Months Ended June 30, 2022 (unaudited) | Year Ended December 31, 2021 | |||||||||||||
| 1,322,884 | 2,175,223 | 349,026,972 | 313,114,237 | |||||||||||||
| 171,715 | 315,085 | 33,514,450 | 64,623,204 | |||||||||||||
| — | 387,502 | — | 27,801,571 | |||||||||||||
| (530,928 | ) | (1,554,926 | ) | (43,040,229 | ) | (56,512,040 | ) | |||||||||
| (359,213 | ) | (852,339 | ) | (9,525,779 | ) | 35,912,735 | ||||||||||
| 963,671 | 1,322,884 | 339,501,193 | 349,026,972 | |||||||||||||
| 1,085,347 | 931,724 | 27,877,105 | 31,509,845 | |||||||||||||
| 324,944 | 109,245 | 2,927,846 | 3,784,216 | |||||||||||||
| — | 312,163 | — | 2,243,494 | |||||||||||||
| (88,218 | ) | (267,785 | ) | (6,783,046 | ) | (9,660,450 | ) | |||||||||
| 236,726 | 153,623 | (3,855,200 | ) | (3,632,740 | ) | |||||||||||
| 1,322,073 | 1,085,347 | 24,021,905 | 27,877,105 | |||||||||||||
| — | — | 7,606,148 | 7,044,138 | |||||||||||||
| — | — | 201,274 | 405,424 | |||||||||||||
| — | — | — | 616,082 | |||||||||||||
| — | — | (400,517 | ) | (459,496 | ) | |||||||||||
| — | — | (199,243 | ) | 562,010 | ||||||||||||
| — | — | 7,406,905 | 7,606,148 | |||||||||||||
Semi-Annual Report 185
| Lazard Managed Equity Volatility Portfolio | |||||||||
| Six Months Ended June 30, 2022 (unaudited) | Year Ended December 31, 2021 | ||||||||
| Increase (Decrease) in Net Assets | |||||||||
| Operations | |||||||||
| Net investment income (loss) | $ | 302,308 | $ | 455,246 | |||||
| Net realized gain (loss) | (97,993 | ) | 2,837,261 | ||||||
| Net change in unrealized appreciation (depreciation) | (3,376,294 | ) | 1,446,592 | ||||||
| Net increase (decrease) in net assets resulting from operations | (3,171,979 | ) | 4,739,099 | ||||||
| Distributions to shareholders (Note 2(e)) | |||||||||
| Net investment income and net realized gains | |||||||||
| Institutional Shares | — | (1,898,603 | ) | ||||||
| Open Shares | — | (5,036 | ) | ||||||
| R6 Shares | — | — | |||||||
| Net decrease in net assets resulting from distributions | — | (1,903,639 | ) | ||||||
| Capital stock transactions | |||||||||
| Net proceeds from sales | |||||||||
| Institutional Shares | 2,052,755 | 7,970,630 | |||||||
| Open Shares | 25 | 955 | |||||||
| R6 Shares | — | — | |||||||
| Net proceeds from reinvestment of distributions | |||||||||
| Institutional Shares | — | 1,682,281 | |||||||
| Open Shares | — | 5,036 | |||||||
| R6 Shares | — | — | |||||||
| Cost of shares redeemed | |||||||||
| Institutional Shares | (1,263,074 | ) | (7,176,588 | ) | |||||
| Open Shares | (12 | ) | (3,910 | ) | |||||
| R6 Shares | — | — | |||||||
| Net increase (decrease) in net assets from capital stock transactions | 789,694 | 2,478,404 | |||||||
| Total increase (decrease) in net assets | (2,382,285 | ) | 5,313,864 | ||||||
| Net assets at beginning of period | 31,127,576 | 25,813,712 | |||||||
| Net assets at end of period | $ | 28,745,291 | $ | 31,127,576 | |||||
The accompanying notes are an integral part of these financial statements.
186 Semi-Annual Report
| Lazard US Equity Concentrated Portfolio | Lazard US Equity Focus Portfolio | |||||||||||||||
| Six Months Ended June 30, 2022 (unaudited) | Year Ended December 31, 2021 | Six Months Ended June 30, 2022 (unaudited) | Year Ended December 31, 2021 | |||||||||||||
| $ | 4,931,571 | $ | 7,375,860 | $ | 273,195 | $ | 371,416 | |||||||||
| 114,978,375 | 298,140,654 | 304,142 | 2,732,490 | |||||||||||||
| (475,962,564 | ) | 140,441,179 | (16,693,486 | ) | 13,333,759 | |||||||||||
| (356,052,618 | ) | 445,957,693 | (16,116,149 | ) | 16,437,665 | |||||||||||
| — | (262,821,100 | ) | — | (2,341,356 | ) | |||||||||||
| — | (4,727,403 | ) | — | (83,281 | ) | |||||||||||
| — | (363,056 | ) | — | (2,019,972 | ) | |||||||||||
| — | (267,911,559 | ) | — | (4,444,609 | ) | |||||||||||
| 221,367,268 | 321,688,811 | 2,676,839 | 5,400,355 | |||||||||||||
| 1,607,891 | 5,568,105 | 364 | 16,560 | |||||||||||||
| 4,483 | 6,623 | 16,590,108 | 16,666,565 | |||||||||||||
| — | 244,348,427 | — | 2,316,382 | |||||||||||||
| — | 4,618,990 | — | 82,695 | |||||||||||||
| — | 362,958 | — | 2,018,035 | |||||||||||||
| (421,628,611 | ) | (733,616,650 | ) | (807,999 | ) | (2,454,548 | ) | |||||||||
| (3,935,366 | ) | (12,293,864 | ) | (23,204 | ) | (75,448 | ) | |||||||||
| (154 | ) | (29,538 | ) | (8,341,071 | ) | (8,682,494 | ) | |||||||||
| (202,584,489 | ) | (169,346,138 | ) | 10,095,037 | 15,288,102 | |||||||||||
| (558,637,107 | ) | 8,699,996 | (6,021,112 | ) | 27,281,158 | |||||||||||
| 1,981,602,255 | 1,972,902,259 | 80,388,909 | 53,107,751 | |||||||||||||
| $ | 1,422,965,148 | $ | 1,981,602,255 | $ | 74,367,797 | $ | 80,388,909 | |||||||||
Semi-Annual Report 187
| Lazard Managed Equity Volatility Portfolio | |||||||||
| Six Months Ended June 30, 2022 (unaudited) | Year Ended December 31, 2021 | ||||||||
| Shares issued and redeemed | |||||||||
| Institutional Shares | |||||||||
| Shares outstanding at beginning of period | 2,357,213 | 2,184,318 | |||||||
| Shares sold | 166,457 | 614,142 | |||||||
| Shares issued to shareholders from reinvestment of distributions | — | 129,002 | |||||||
| Shares redeemed | (101,231 | ) | (570,249 | ) | |||||
| Net increase (decrease) | 65,226 | 172,895 | |||||||
| Shares outstanding at end of period | 2,422,439 | 2,357,213 | |||||||
| Open Shares | |||||||||
| Shares outstanding at beginning of period | 6,629 | 6,488 | |||||||
| Shares sold | 3 | 73 | |||||||
| Shares issued to shareholders from reinvestment of distributions | — | 387 | |||||||
| Shares redeemed | (1 | ) | (319 | ) | |||||
| Net increase (decrease) | 2 | 141 | |||||||
| Shares outstanding at end of period | 6,631 | 6,629 | |||||||
| R6 Shares | |||||||||
| Shares outstanding at beginning of period | — | — | |||||||
| Shares sold | — | — | |||||||
| Shares issued to shareholders from reinvestment of distributions | — | — | |||||||
| Shares redeemed | — | — | |||||||
| Net increase (decrease) | — | — | |||||||
| Shares outstanding at end of period | — | — | |||||||
The accompanying notes are an integral part of these financial statements.
188 Semi-Annual Report
| Lazard US Equity Concentrated Portfolio | Lazard US Equity Focus Portfolio | |||||||||||||||
| Six Months Ended June 30, 2022 (unaudited) | Year Ended December 31, 2021 | Six Months Ended June 30, 2022 (unaudited) | Year Ended December 31, 2021 | |||||||||||||
| 98,646,155 | 107,284,843 | 2,660,294 | 2,323,580 | |||||||||||||
| 12,342,208 | 15,965,414 | 179,309 | 356,108 | |||||||||||||
| — | 12,544,478 | — | 146,606 | |||||||||||||
| (23,572,256 | ) | (37,148,580 | ) | (57,531 | ) | (166,000 | ) | |||||||||
| (11,230,048 | ) | (8,638,688 | ) | 121,778 | 336,714 | |||||||||||
| 87,416,107 | 98,646,155 | 2,782,072 | 2,660,294 | |||||||||||||
| 1,793,445 | 1,888,783 | 97,056 | 95,597 | |||||||||||||
| 87,513 | 272,288 | 24 | 1,083 | |||||||||||||
| — | 234,873 | — | 5,208 | |||||||||||||
| (217,900 | ) | (602,499 | ) | (1,586 | ) | (4,832 | ) | |||||||||
| (130,387 | ) | (95,338 | ) | (1,562 | ) | 1,459 | ||||||||||
| 1,663,058 | 1,793,445 | 95,494 | 97,056 | |||||||||||||
| 137,684 | 120,303 | 2,242,997 | 1,550,718 | |||||||||||||
| 250 | 325 | 1,098,289 | 1,137,911 | |||||||||||||
| — | 18,578 | — | 127,643 | |||||||||||||
| (8 | ) | (1,522 | ) | (568,667 | ) | (573,275 | ) | |||||||||
| 242 | 17,381 | 529,622 | 692,279 | |||||||||||||
| 137,926 | 137,684 | 2,772,619 | 2,242,997 | |||||||||||||
Semi-Annual Report 189
| Lazard US Small-Mid Cap Equity Portfolio | |||||||||
| Six Months Ended June 30, 2022 (unaudited) | Year Ended December 31, 2021 | ||||||||
| Increase (Decrease) in Net Assets | |||||||||
| Operations | |||||||||
| Net investment income (loss) | $ | (20,312 | ) | $ | 19,235 | ||||
| Net realized gain (loss) | 1,053,113 | 22,249,252 | |||||||
| Net change in unrealized appreciation (depreciation) | (19,476,627 | ) | (2,365,273 | ) | |||||
| Net increase (decrease) in net assets resulting from operations | (18,443,826 | ) | 19,903,214 | ||||||
| Distributions to shareholders (Note 2(e)) | |||||||||
| Net investment income and net realized gains | |||||||||
| Institutional Shares | — | (13,165,718 | ) | ||||||
| Open Shares | — | (1,602,028 | ) | ||||||
| R6 Shares | — | (99,135 | ) | ||||||
| Net decrease in net assets resulting from distributions | — | (14,866,881 | ) | ||||||
| Capital stock transactions | |||||||||
| Net proceeds from sales | |||||||||
| Institutional Shares | 6,418,644 | 24,647,589 | |||||||
| Open Shares | 2,333,859 | 1,109,317 | |||||||
| R6 Shares | 9,242 | 151,641 | |||||||
| Net proceeds from reinvestment of distributions | |||||||||
| Institutional Shares | — | 12,992,400 | |||||||
| Open Shares | — | 1,540,062 | |||||||
| R6 Shares | — | 99,135 | |||||||
| Cost of shares redeemed | |||||||||
| Institutional Shares | (22,621,368 | ) | (39,607,630 | ) | |||||
| Open Shares | (2,993,300 | ) | (3,317,566 | ) | |||||
| R6 Shares | (690,327 | ) | (251,244 | ) | |||||
| Net increase (decrease) in net assets from capital stock transactions | (17,543,250 | ) | (2,636,296 | ) | |||||
| Total increase (decrease) in net assets | (35,987,076 | ) | 2,400,037 | ||||||
| Net assets at beginning of period | 106,032,450 | 103,632,413 | |||||||
| Net assets at end of period | $ | 70,045,374 | $ | 106,032,450 | |||||
| (a) | The Portfolio commenced operations on October 29, 2021 |
The accompanying notes are an integral part of these financial statements.
190 Semi-Annual Report
| Lazard US Sustainable Equity Portfolio | Lazard US Systematic Small Cap Equity Portfolio | |||||||||||||||
| Six Months Ended June 30, 2022 (unaudited) | Year Ended December 31, 2021 | Six Months Ended June 30, 2022 (unaudited) | Year Ended December 31, 2021(a) | |||||||||||||
| $ | 38,981 | $ | 57,578 | $ | 52,275 | $ | 8,620 | |||||||||
| 164,159 | 259,323 | (282,908 | ) | 11,440 | ||||||||||||
| (3,530,671 | ) | 3,120,821 | (2,063,199 | ) | 61,890 | |||||||||||
| (3,327,531 | ) | 3,437,722 | (2,293,832 | ) | 81,950 | |||||||||||
| — | (299,354 | ) | — | (8,515 | ) | |||||||||||
| — | (10,422 | ) | — | — | ||||||||||||
| — | — | — | — | |||||||||||||
| — | (309,776 | ) | — | (8,515 | ) | |||||||||||
| 210,000 | 12,000 | 21,810,500 | 3,903,086 | |||||||||||||
| 76,813 | 467,727 | 25,500 | 117,325 | |||||||||||||
| — | — | — | — | |||||||||||||
| — | 299,354 | — | 8,515 | |||||||||||||
| — | 10,422 | — | — | |||||||||||||
| — | — | — | — | |||||||||||||
| — | (147,812 | ) | (2,977 | ) | — | |||||||||||
| (99,519 | ) | (45,353 | ) | (1,050 | ) | — | ||||||||||
| — | — | — | — | |||||||||||||
| 187,294 | 596,338 | 21,831,973 | 4,028,926 | |||||||||||||
| (3,140,237 | ) | 3,724,284 | 19,538,141 | 4,102,361 | ||||||||||||
| 15,342,263 | 11,617,979 | 4,102,361 | — | |||||||||||||
| $ | 12,202,026 | $ | 15,342,263 | $ | 23,640,502 | $ | 4,102,361 | |||||||||
Semi-Annual Report 191
| Lazard US Small-Mid Cap Equity Portfolio | |||||||||
| Six Months Ended June 30, 2022 (unaudited) | Year Ended December 31, 2021 | ||||||||
| Shares issued and redeemed | |||||||||
| Institutional Shares | |||||||||
| Shares outstanding at beginning of period | 6,312,789 | 6,377,893 | |||||||
| Shares sold | 455,241 | 1,504,750 | |||||||
| Shares issued to shareholders from reinvestment of distributions | — | 882,683 | |||||||
| Shares redeemed | (1,640,722 | ) | (2,452,537 | ) | |||||
| Net increase (decrease) | (1,185,481 | ) | (65,104 | ) | |||||
| Shares outstanding at end of period | 5,127,308 | 6,312,789 | |||||||
| Open Shares | |||||||||
| Shares outstanding at beginning of period | 796,285 | 827,420 | |||||||
| Shares sold | 188,915 | 75,218 | |||||||
| Shares issued to shareholders from reinvestment of distributions | — | 115,620 | |||||||
| Shares redeemed | (243,176 | ) | (221,973 | ) | |||||
| Net increase (decrease) | (54,261 | ) | (31,135 | ) | |||||
| Shares outstanding at end of period | 742,024 | 796,285 | |||||||
| R6 Shares | |||||||||
| Shares outstanding at beginning of period | 47,929 | 47,409 | |||||||
| Shares sold | 655 | 9,060 | |||||||
| Shares issued to shareholders from reinvestment of distributions | — | 6,731 | |||||||
| Shares redeemed | (48,499 | ) | (15,271 | ) | |||||
| Net increase (decrease) | (47,844 | ) | 520 | ||||||
| Shares outstanding at end of period | 85 | 47,929 | |||||||
| (a) | The Portfolio commenced operations on October 29, 2021 |
The accompanying notes are an integral part of these financial statements.
192 Semi-Annual Report
| Lazard US Sustainable Equity Portfolio | Lazard US Systematic Small Cap Equity Portfolio | |||||||||||||||
| Six Months Ended June 30, 2022 (unaudited) | Year Ended December 31, 2021 | Six Months Ended June 30, 2022 (unaudited) | Year Ended December 31, 2021(a) | |||||||||||||
| 952,893 | 942,026 | 388,111 | — | |||||||||||||
| 14,958 | 780 | 2,501,417 | 387,263 | |||||||||||||
| — | �� | 19,972 | — | 848 | ||||||||||||
| — | (9,885 | ) | (323 | ) | — | |||||||||||
| 14,958 | 10,867 | 2,501,094 | 388,111 | |||||||||||||
| 967,851 | 952,893 | 2,889,205 | 388,111 | |||||||||||||
| 42,453 | 10,495 | 11,650 | — | |||||||||||||
| 5,843 | 34,512 | 2,916 | 11,650 | |||||||||||||
| — | 695 | — | — | |||||||||||||
| (7,392 | ) | (3,249 | ) | (111 | ) | — | ||||||||||
| (1,549 | ) | 31,958 | 2,805 | 11,650 | ||||||||||||
| 40,904 | 42,453 | 14,455 | 11,650 | |||||||||||||
| — | — | — | — | |||||||||||||
| — | — | — | — | |||||||||||||
| — | — | — | — | |||||||||||||
| — | — | — | — | |||||||||||||
| — | — | — | — | |||||||||||||
| — | — | — | — | |||||||||||||
Semi-Annual Report 193
The Lazard Funds, Inc. Financial Highlights (unaudited)
LAZARD DEVELOPING MARKETS EQUITY PORTFOLIO
| Selected data for a share of capital stock outstanding | Six Months Ended | Year Ended | |||||||||||||||||||||||
| throughout each period | 6/30/22† | 12/31/21 | 12/31/20 | 12/31/19 | 12/31/18 | 12/31/17 | |||||||||||||||||||
| Institutional Shares | |||||||||||||||||||||||||
| Net asset value, beginning of period | $ | 15.40 | $ | 17.31 | $ | 14.55 | $ | 11.42 | $ | 14.48 | $ | 10.28 | |||||||||||||
| Income (Loss) from investment operations: | |||||||||||||||||||||||||
| Net investment income (loss) (a) | 0.10 | 0.05 | 0.04 | 0.08 | 0.11 | 0.03 | |||||||||||||||||||
| Net realized and unrealized gain (loss) | (2.99 | ) | (1.81 | ) | 2.76 | 3.13 | (3.08 | ) | 4.20 | ||||||||||||||||
| Total from investment operations | (2.89 | ) | (1.76 | ) | 2.80 | 3.21 | (2.97 | ) | 4.23 | ||||||||||||||||
| Less distributions from: | |||||||||||||||||||||||||
| Net investment income | — | (0.15 | ) | (0.04 | ) | (0.08 | ) | (0.09 | ) | (0.03 | ) | ||||||||||||||
| Total distributions | — | (0.15 | ) | (0.04 | ) | (0.08 | ) | (0.09 | ) | (0.03 | ) | ||||||||||||||
| Net asset value, end of period | $ | 12.51 | $ | 15.40 | $ | 17.31 | $ | 14.55 | $ | 11.42 | $ | 14.48 | |||||||||||||
| Total Return (b) | -18.77 | % | -10.14 | % | 19.33 | % | 28.17 | % | -20.58 | % | 41.15 | % | |||||||||||||
| Ratios and Supplemental Data: | |||||||||||||||||||||||||
| Net assets, end of period (in thousands) | $ | 109,901 | $ | 148,419 | $ | 190,689 | $ | 226,067 | $ | 215,120 | $ | 268,730 | |||||||||||||
| Ratios to average net assets (c): | |||||||||||||||||||||||||
| Net expenses | 1.15 | % | 1.15 | % | 1.17 | % | 1.16 | % | 1.14 | % | 1.18 | % | |||||||||||||
| Gross expenses | 1.22 | % | 1.15 | % | 1.21 | % | 1.16 | % | 1.14 | % | 1.18 | % | |||||||||||||
| Net investment income (loss) | 1.48 | % | 0.28 | % | 0.33 | % | 0.63 | % | 0.83 | % | 0.24 | % | |||||||||||||
| Portfolio turnover rate | 22 | % | 39 | % | 57 | % | 55 | % | 63 | % | 46 | % | |||||||||||||
The accompanying notes are an integral part of these financial statements.
194 Semi-Annual Report
| Selected data for a share of capital stock outstanding | Six Months Ended | Year Ended | |||||||||||||||||||||||
| throughout each period | 6/30/22† | 12/31/21 | 12/31/20 | 12/31/19 | 12/31/18 | 12/31/17 | |||||||||||||||||||
| Open Shares | |||||||||||||||||||||||||
| Net asset value, beginning of period | $ | 15.31 | $ | 17.21 | $ | 14.51 | $ | 11.36 | $ | 14.45 | $ | 10.28 | |||||||||||||
| Income (Loss) from investment operations: | |||||||||||||||||||||||||
| Net investment income (loss) (a) | 0.08 | — | (d) | 0.01 | 0.05 | 0.06 | (0.02 | ) | |||||||||||||||||
| Net realized and unrealized gain (loss) | (2.97 | ) | (1.78 | ) | 2.73 | 3.11 | (3.06 | ) | 4.19 | ||||||||||||||||
| Total from investment operations | (2.89 | ) | (1.78 | ) | 2.74 | 3.16 | (3.00 | ) | 4.17 | ||||||||||||||||
| Less distributions from: | |||||||||||||||||||||||||
| Net investment income | — | (0.12 | ) | (0.04 | ) | (0.01 | ) | (0.09 | ) | — | |||||||||||||||
| Total distributions | — | (0.12 | ) | (0.04 | ) | (0.01 | ) | (0.09 | ) | — | |||||||||||||||
| Net asset value, end of period | $ | 12.42 | $ | 15.31 | $ | 17.21 | $ | 14.51 | $ | 11.36 | $ | 14.45 | |||||||||||||
| Total Return (b) | -18.88 | % | -10.37 | % | 18.97 | % | 27.79 | % | -20.83 | %# | 40.56 | % | |||||||||||||
| Ratios and Supplemental Data: | |||||||||||||||||||||||||
| Net assets, end of period (in thousands) | $ | 6,594 | $ | 9,193 | $ | 9,914 | $ | 9,341 | $ | 7,263 | $ | 12,569 | |||||||||||||
| Ratios to average net assets (c): | |||||||||||||||||||||||||
| Net expenses | 1.40 | % | 1.40 | % | 1.44 | % | 1.46 | % | 1.51 | % | 1.58 | % | |||||||||||||
| Gross expenses | 1.54 | % | 1.45 | % | 1.53 | % | 1.55 | % | 1.51 | % | 1.58 | % | |||||||||||||
| Net investment income (loss) | 1.23 | % | — | %(e) | 0.04 | % | 0.36 | % | 0.42 | % | -0.17 | % | |||||||||||||
| Portfolio turnover rate | 22 | % | 39 | % | 57 | % | 55 | % | 63 | % | 46 | % | |||||||||||||
| † | Unaudited. |
| # | The Portfolio received settlement proceeds from a foreign exchange trading class action lawsuit. The proceeds from the settlement represented a realized gain and were recorded in the period received. There was a 0.07% impact on the total return of the Portfolio’s Open Shares. |
| (a) | Net investment income (loss) has been computed using the average shares method. |
| (b) | Total returns reflect reinvestment of all dividends and distributions, if any. Certain expenses of the Portfolio may have been waived or reimbursed by the Investment Manager, State Street or DST; without such waiver/reimbursement of expenses, the Portfolio’s returns would have been lower. |
| (c) | Annualized for a period of less than one year. |
| (d) | Amount is less than $0.01 per share. |
| (e) | Amount is less than 0.005% |
The accompanying notes are an integral part of these financial statements.
Semi-Annual Report 195
LAZARD EMERGING MARKETS CORE EQUITY PORTFOLIO
| Selected data for a share of capital stock outstanding | Six Months Ended | Year Ended | |||||||||||||||||||||||
| throughout each period | 6/30/22† | 12/31/21 | 12/31/20 | 12/31/19 | 12/31/18 | 12/31/17 | |||||||||||||||||||
| Institutional Shares | |||||||||||||||||||||||||
| Net asset value, beginning of period | $ | 11.56 | $ | 13.12 | $ | 11.79 | $ | 9.89 | $ | 12.30 | $ | 8.83 | |||||||||||||
| Income (Loss) from investment operations: | |||||||||||||||||||||||||
| Net investment income (loss) (a) | 0.08 | 0.08 | 0.08 | 0.20 | 0.16 | 0.11 | |||||||||||||||||||
| Net realized and unrealized gain (loss) | (2.58 | ) | (1.55 | ) | 1.33 | 1.93 | (2.39 | ) | 3.45 | ||||||||||||||||
| Total from investment operations | (2.50 | ) | (1.47 | ) | 1.41 | 2.13 | (2.23 | ) | 3.56 | ||||||||||||||||
| Less distributions from: | |||||||||||||||||||||||||
| Net investment income | — | (0.09 | ) | (0.08 | ) | (0.23 | ) | (0.18 | ) | (0.09 | ) | ||||||||||||||
| Total distributions | — | (0.09 | ) | (0.08 | ) | (0.23 | ) | (0.18 | ) | (0.09 | ) | ||||||||||||||
| Net asset value, end of period | $ | 9.06 | $ | 11.56 | $ | 13.12 | $ | 11.79 | $ | 9.89 | $ | 12.30 | |||||||||||||
| Total Return (b) | -21.63 | % | -11.21 | % | 11.98 | % | 21.59 | % | -18.12 | % | 40.35 | % | |||||||||||||
| Ratios and Supplemental Data: | |||||||||||||||||||||||||
| Net assets, end of period (in thousands) | $ | 109,572 | $ | 156,284 | $ | 209,503 | $ | 197,213 | $ | 207,955 | $ | 230,343 | |||||||||||||
| Ratios to average net assets (c): | |||||||||||||||||||||||||
| Net expenses | 1.23 | % | 1.16 | % | 1.20 | % | 1.18 | % | 1.18 | % | 1.20 | % | |||||||||||||
| Gross expenses | 1.23 | % | 1.16 | % | 1.20 | % | 1.18 | % | 1.18 | % | 1.20 | % | |||||||||||||
| Net investment income (loss) | 1.59 | % | 0.64 | % | 0.70 | % | 1.83 | % | 1.44 | % | 0.98 | % | |||||||||||||
| Portfolio turnover rate | 17 | % | 31 | % | 23 | % | 19 | % | 30 | % | 15 | % | |||||||||||||
The accompanying notes are an integral part of these financial statements.
196 Semi-Annual Report
| Selected data for a share of capital stock outstanding | Six Months Ended | Year Ended | |||||||||||||||||||||||
| throughout each period | 6/30/22† | 12/31/21 | 12/31/20 | 12/31/19 | 12/31/18 | 12/31/17 | |||||||||||||||||||
| Open Shares | |||||||||||||||||||||||||
| Net asset value, beginning of period | $ | 11.53 | $ | 13.09 | $ | 11.76 | $ | 9.87 | $ | 12.27 | $ | 8.81 | |||||||||||||
| Income (Loss) from investment operations: | |||||||||||||||||||||||||
| Net investment income (loss) (a) | 0.07 | 0.04 | 0.04 | 0.16 | 0.11 | 0.06 | |||||||||||||||||||
| Net realized and unrealized gain (loss) | (2.57 | ) | (1.55 | ) | 1.33 | 1.92 | (2.37 | ) | 3.45 | ||||||||||||||||
| Total from investment operations | (2.50 | ) | (1.51 | ) | 1.37 | 2.08 | (2.26 | ) | 3.51 | ||||||||||||||||
| Less distributions from: | |||||||||||||||||||||||||
| Net investment income | — | (0.05 | ) | (0.04 | ) | (0.19 | ) | (0.14 | ) | (0.05 | ) | ||||||||||||||
| Total distributions | — | (0.05 | ) | (0.04 | ) | (0.19 | ) | (0.14 | ) | (0.05 | ) | ||||||||||||||
| Net asset value, end of period | $ | 9.03 | $ | 11.53 | $ | 13.09 | $ | 11.76 | $ | 9.87 | $ | 12.27 | |||||||||||||
| Total Return (b) | -21.68 | % | -11.53 | % | 11.66 | % | 21.08 | % | -18.43 | % | 39.80 | % | |||||||||||||
| Ratios and Supplemental Data: | |||||||||||||||||||||||||
| Net assets, end of period (in thousands) | $ | 1,505 | $ | 2,113 | $ | 2,544 | $ | 2,425 | $ | 1,853 | $ | 1,828 | |||||||||||||
| Ratios to average net assets (c): | |||||||||||||||||||||||||
| Net expenses | 1.50 | % | 1.50 | % | 1.50 | % | 1.55 | % | 1.58 | % | 1.60 | % | |||||||||||||
| Gross expenses | 1.66 | % | 1.55 | % | 1.62 | % | 1.90 | % | 2.00 | % | 2.45 | % | |||||||||||||
| Net investment income (loss) | 1.30 | % | 0.34 | % | 0.35 | % | 1.48 | % | 1.00 | % | 0.56 | % | |||||||||||||
| Portfolio turnover rate | 17 | % | 31 | % | 23 | % | 19 | % | 30 | % | 15 | % | |||||||||||||
The accompanying notes are an integral part of these financial statements.
Semi-Annual Report 197
| Selected data for a share of capital stock outstanding | Six Months Ended | Year Ended | For the Period 4/6/18* to | |||||||||||||||||||||||
| throughout each period | 6/30/22† | 12/31/21 | 12/31/20 | 12/31/19 | 12/31/18 | |||||||||||||||||||||
| R6 Shares | ||||||||||||||||||||||||||
| Net asset value, beginning of period | $ | 11.57 | $ | 13.13 | $ | 11.80 | $ | 9.89 | $ | 12.21 | ||||||||||||||||
| Income (Loss) from investment operations: | ||||||||||||||||||||||||||
| Net investment income (loss) (a) | 0.09 | 0.09 | 0.07 | 0.20 | 0.14 | |||||||||||||||||||||
| Net realized and unrealized gain (loss) | (2.59 | ) | (1.56 | ) | 1.34 | 1.94 | (2.28 | ) | ||||||||||||||||||
| Total from investment operations | (2.50 | ) | (1.47 | ) | 1.41 | 2.14 | (2.14 | ) | ||||||||||||||||||
| Less distributions from: | ||||||||||||||||||||||||||
| Net investment income | — | (0.09 | ) | (0.08 | ) | (0.23 | ) | (0.18 | ) | |||||||||||||||||
| Total distributions | — | (0.09 | ) | (0.08 | ) | (0.23 | ) | (0.18 | ) | |||||||||||||||||
| Net asset value, end of period | $ | 9.07 | $ | 11.57 | $ | 13.13 | $ | 11.80 | $ | 9.89 | ||||||||||||||||
| Total Return (b) | -21.61 | % | -11.19 | % | 11.97 | % | 21.69 | % | -17.52 | % | ||||||||||||||||
| Ratios and Supplemental Data: | ||||||||||||||||||||||||||
| Net assets, end of period (in thousands) | $ | 337 | $ | 311 | $ | 544 | $ | 597 | $ | 494 | ||||||||||||||||
| Ratios to average net assets (c): | ||||||||||||||||||||||||||
| Net expenses | 1.20 | % | 1.16 | % | 1.20 | % | 1.18 | % | 1.16 | % | ||||||||||||||||
| Gross expenses | 2.21 | % | 1.91 | % | 1.87 | % | 3.23 | % | 7.68 | % | ||||||||||||||||
| Net investment income (loss) | 1.81 | % | 0.66 | % | 0.63 | % | 1.80 | % | 1.71 | % | ||||||||||||||||
| Portfolio turnover rate | 17 | % | 31 | % | 23 | % | 19 | % | 30 | % | ||||||||||||||||
| † | Unaudited. |
| * | The inception date for the R6 Shares was April 6, 2018. |
| (a) | Net investment income (loss) has been computed using the average shares method. |
| (b) | Total returns reflect reinvestment of all dividends and distributions, if any. Certain expenses of the Portfolio may have been waived or reimbursed by the Investment Manager, State Street or DST; without such waiver/reimbursement of expenses, the Portfolio’s returns would have been lower. Returns for a period of less than one year are not annualized. |
| (c) | Annualized for a period of less than one year except for non-recurring expenses. |
The accompanying notes are an integral part of these financial statements.
198 Semi-Annual Report
LAZARD EMERGING MARKETS EQUITY ADVANTAGE PORTFOLIO
| Selected data for a share of capital stock outstanding | Six Months Ended | Year Ended | |||||||||||||||||||||||
| throughout each period | 6/30/22† | 12/31/21 | 12/31/20 | 12/31/19 | 12/31/18 | 12/31/17 | |||||||||||||||||||
| Institutional Shares | |||||||||||||||||||||||||
| Net asset value, beginning of period | $ | 12.88 | $ | 13.79 | $ | 11.84 | $ | 10.03 | $ | 12.27 | $ | 8.71 | |||||||||||||
| Income (Loss) from investment operations: | |||||||||||||||||||||||||
| Net investment income (loss) (a) | 0.16 | 0.27 | 0.10 | 0.24 | 0.19 | 0.12 | |||||||||||||||||||
| Net realized and unrealized gain (loss) | (2.43 | ) | (0.15 | ) | 1.97 | 1.80 | (2.19 | ) | 3.58 | ||||||||||||||||
| Total from investment operations | (2.27 | ) | 0.12 | 2.07 | 2.04 | (2.00 | ) | 3.70 | |||||||||||||||||
| Less distributions from: | |||||||||||||||||||||||||
| Net investment income | — | (0.22 | ) | (0.10 | ) | (0.23 | ) | (0.22 | ) | (0.13 | ) | ||||||||||||||
| Net realized gains | — | (0.81 | ) | (0.02 | ) | — | (0.00 | )(b) | — | ||||||||||||||||
| Return of capital | — | — | — | — | (0.02 | ) | (0.01 | ) | |||||||||||||||||
| Total distributions | — | (1.03 | ) | (0.12 | ) | (0.23 | ) | (0.24 | ) | (0.14 | ) | ||||||||||||||
| Net asset value, end of period | $ | 10.61 | $ | 12.88 | $ | 13.79 | $ | 11.84 | $ | 10.03 | $ | 12.27 | |||||||||||||
| Total Return (c) | -17.62 | % | 0.96 | % | 17.50 | % | 20.34 | % | -16.23 | % | 42.52 | % | |||||||||||||
| Ratios and Supplemental Data: | |||||||||||||||||||||||||
| Net assets, end of period (in thousands) | $ | 53,325 | $ | 68,538 | $ | 27,898 | $ | 9,190 | $ | 3,107 | $ | 4,191 | |||||||||||||
| Ratios to average net assets (d): | |||||||||||||||||||||||||
| Net expenses | 0.91 | % | 0.93 | % | 1.10 | % | 1.10 | % | 1.10 | % | 1.10 | % | |||||||||||||
| Gross expenses | 1.19 | % | 1.21 | % | 1.97 | % | 3.19 | % | 5.60 | % | 6.29 | % | |||||||||||||
| Net investment income (loss) | 2.76 | % | 1.90 | % | 0.87 | % | 2.15 | % | 1.59 | % | 1.15 | % | |||||||||||||
| Portfolio turnover rate | 41 | % | 88 | % | 91 | % | 59 | % | 61 | % | 52 | % | |||||||||||||
The accompanying notes are an integral part of these financial statements.
Semi-Annual Report 199
| Selected data for a share of capital stock outstanding | Six Months Ended | Year Ended | |||||||||||||||||||||||
| throughout each period | 6/30/22† | 12/31/21 | 12/31/20 | 12/31/19 | 12/31/18 | 12/31/17 | |||||||||||||||||||
| Open Shares | |||||||||||||||||||||||||
| Net asset value, beginning of period | $ | 12.88 | $ | 13.79 | $ | 11.85 | $ | 10.04 | $ | 12.27 | $ | 8.71 | |||||||||||||
| Income (Loss) from investment operations: | |||||||||||||||||||||||||
| Net investment income (loss) (a) | 0.11 | 0.12 | 0.09 | 0.21 | 0.16 | 0.08 | |||||||||||||||||||
| Net realized and unrealized gain (loss) | (2.39 | ) | (0.04 | ) | 1.93 | 1.79 | (2.18 | ) | 3.58 | ||||||||||||||||
| Total from investment operations | (2.28 | ) | 0.08 | 2.02 | 2.00 | (2.02 | ) | 3.66 | |||||||||||||||||
| Less distributions from: | |||||||||||||||||||||||||
| Net investment income | — | (0.18 | ) | (0.06 | ) | (0.19 | ) | (0.19 | ) | (0.09 | ) | ||||||||||||||
| Net realized gains | — | (0.81 | ) | (0.02 | ) | — | (0.00 | )(b) | — | ||||||||||||||||
| Return of capital | — | — | — | — | (0.02 | ) | (0.01 | ) | |||||||||||||||||
| Total distributions | — | (0.99 | ) | (0.08 | ) | (0.19 | ) | (0.21 | ) | (0.10 | ) | ||||||||||||||
| Net asset value, end of period | $ | 10.60 | $ | 12.88 | $ | 13.79 | $ | 11.85 | $ | 10.04 | $ | 12.27 | |||||||||||||
| Total Return (c) | -17.70 | % | 0.63 | % | 17.10 | % | 19.97 | % | -16.40 | % | 42.09 | % | |||||||||||||
| Ratios and Supplemental Data: | |||||||||||||||||||||||||
| Net assets, end of period (in thousands) | $ | 190 | $ | 979 | $ | 876 | $ | 1,162 | $ | 476 | $ | 356 | |||||||||||||
| Ratios to average net assets (d): | |||||||||||||||||||||||||
| Net expenses | 1.16 | % | 1.25 | % | 1.35 | % | 1.38 | % | 1.40 | % | 1.40 | % | |||||||||||||
| Gross expenses | 2.69 | % | 1.75 | % | 2.68 | % | 4.32 | % | 8.09 | % | 12.17 | % | |||||||||||||
| Net investment income (loss) | 1.79 | % | 0.80 | % | 0.76 | % | 1.87 | % | 1.35 | % | 0.72 | % | |||||||||||||
| Portfolio turnover rate | 41 | % | 88 | % | 91 | % | 59 | % | 61 | % | 52 | % | |||||||||||||
| † | Unaudited. |
| (a) | Net investment income (loss) has been computed using the average shares method. |
| (b) | Amount is less than $0.01 per share. |
| (c) | Total returns reflect reinvestment of all dividends and distributions, if any. Certain expenses of the Portfolio may have been waived or reimbursed by the Investment Manager, State Street or DST; without such waiver/reimbursement of expenses, the Portfolio’s returns would have been lower. Returns for a period of less than one year are not annualized. |
| (d) | Annualized for a period of less than one year. |
The accompanying notes are an integral part of these financial statements.
200 Semi-Annual Report
LAZARD EMERGING MARKETS EQUITY PORTFOLIO
| Selected data for a share of capital stock outstanding | Six Months Ended | Year Ended | |||||||||||||||||||||||
| throughout each period | 6/30/22† | 12/31/21 | 12/31/20 | 12/31/19 | 12/31/18 | 12/31/17 | |||||||||||||||||||
| Institutional Shares | |||||||||||||||||||||||||
| Net asset value, beginning of period | $ | 18.12 | $ | 18.03 | $ | 18.48 | $ | 16.06 | $ | 20.02 | $ | 15.96 | |||||||||||||
| Income (Loss) from investment operations: | |||||||||||||||||||||||||
| Net investment income (loss) (a) | 0.40 | 0.56 | 0.37 | 0.42 | 0.39 | 0.33 | |||||||||||||||||||
| Net realized and unrealized gain (loss) | (3.13 | ) | 0.42 | (0.44 | ) | 2.45 | (4.01 | ) | 4.13 | ||||||||||||||||
| Total from investment operations | (2.73 | ) | 0.98 | (0.07 | ) | 2.87 | (3.62 | ) | 4.46 | ||||||||||||||||
| Less distributions from: | |||||||||||||||||||||||||
| Net investment income | — | (0.89 | ) | (0.38 | ) | (0.45 | ) | (0.34 | ) | (0.40 | ) | ||||||||||||||
| Total distributions | — | (0.89 | ) | (0.38 | ) | (0.45 | ) | (0.34 | ) | (0.40 | ) | ||||||||||||||
| Net asset value, end of period | $ | 15.39 | $ | 18.12 | $ | 18.03 | $ | 18.48 | $ | 16.06 | $ | 20.02 | |||||||||||||
| Total Return (b) | -15.07 | % | 5.44 | % | -0.10 | % | 18.04 | % | -18.09 | % | 28.02 | % | |||||||||||||
| Ratios and Supplemental Data: | |||||||||||||||||||||||||
| Net assets, end of period (in thousands) | $ | 2,527,611 | $ | 3,271,175 | $ | 3,923,878 | $ | 6,645,429 | $ | 7,573,861 | $ | 11,285,358 | |||||||||||||
| Ratios to average net assets (c): | |||||||||||||||||||||||||
| Net expenses | 1.08 | % | 1.07 | % | 1.09 | % | 1.08 | % | 1.07 | % | 1.08 | % | |||||||||||||
| Gross expenses | 1.08 | % | 1.07 | % | 1.09 | % | 1.08 | % | 1.07 | % | 1.08 | % | |||||||||||||
| Net investment income (loss) | 4.69 | % | 2.93 | % | 2.36 | % | 2.42 | % | 2.12 | % | 1.82 | % | |||||||||||||
| Portfolio turnover rate | 12 | % | 34 | % | 39 | % | 20 | % | 16 | % | 14 | % | |||||||||||||
The accompanying notes are an integral part of these financial statements.
Semi-Annual Report 201
| Selected data for a share of capital stock outstanding | Six Months Ended | Year Ended | |||||||||||||||||||||||
| throughout each period | 6/30/22† | 12/31/21 | 12/31/20 | 12/31/19 | 12/31/18 | 12/31/17 | |||||||||||||||||||
| Open Shares | |||||||||||||||||||||||||
| Net asset value, beginning of period | $ | 18.70 | $ | 18.58 | $ | 19.03 | $ | 16.53 | $ | 20.60 | $ | 16.41 | |||||||||||||
| Income (Loss) from investment operations: | |||||||||||||||||||||||||
| Net investment income (loss) (a) | 0.40 | 0.53 | 0.34 | 0.39 | 0.35 | 0.29 | |||||||||||||||||||
| Net realized and unrealized gain (loss) | (3.24 | ) | 0.43 | (0.45 | ) | 2.52 | (4.12 | ) | 4.25 | ||||||||||||||||
| Total from investment operations | (2.84 | ) | 0.96 | (0.11 | ) | 2.91 | (3.77 | ) | 4.54 | ||||||||||||||||
| Less distributions from: | |||||||||||||||||||||||||
| Net investment income | — | (0.84 | ) | (0.34 | ) | (0.41 | ) | (0.30 | ) | (0.35 | ) | ||||||||||||||
| Total distributions | — | (0.84 | ) | (0.34 | ) | (0.41 | ) | (0.30 | ) | (0.35 | ) | ||||||||||||||
| Net asset value, end of period | $ | 15.86 | $ | 18.70 | $ | 18.58 | $ | 19.03 | $ | 16.53 | $ | 20.60 | |||||||||||||
| Total Return (b) | -15.19 | % | 5.19 | % | -0.34 | % | 17.73 | % | -18.32 | % | 27.73 | % | |||||||||||||
| Ratios and Supplemental Data: | |||||||||||||||||||||||||
| Net assets, end of period (in thousands) | $ | 296,249 | $ | 371,863 | $ | 421,990 | $ | 969,347 | $ | 1,004,569 | $ | 1,515,715 | |||||||||||||
| Ratios to average net assets (c): | |||||||||||||||||||||||||
| Net expenses | 1.34 | % | 1.32 | % | 1.34 | % | 1.34 | % | 1.32 | % | 1.34 | % | |||||||||||||
| Gross expenses | 1.34 | % | 1.32 | % | 1.34 | % | 1.34 | % | 1.32 | % | 1.34 | % | |||||||||||||
| Net investment income (loss) | 4.48 | % | 2.68 | % | 2.08 | % | 2.19 | % | 1.85 | % | 1.55 | % | |||||||||||||
| Portfolio turnover rate | 12 | % | 34 | % | 39 | % | 20 | % | 16 | % | 14 | % | |||||||||||||
The accompanying notes are an integral part of these financial statements.
202 Semi-Annual Report
| Selected data for a share of capital stock outstanding | Six Months Ended | Year Ended | |||||||||||||||||||||||
| throughout the period | 6/30/22† | 12/31/21 | 12/31/20 | 12/31/19 | 12/31/18 | 12/31/17 | |||||||||||||||||||
| R6 Shares | |||||||||||||||||||||||||
| Net asset value, beginning of period | $ | 18.13 | $ | 18.04 | $ | 18.47 | $ | 16.06 | $ | 20.02 | $ | 15.96 | |||||||||||||
| Income (Loss) from investment operations: | |||||||||||||||||||||||||
| Net investment income (loss) (a) | 0.40 | 0.54 | 0.40 | 0.40 | 0.40 | 0.35 | |||||||||||||||||||
| Net realized and unrealized gain (loss) | (3.13 | ) | 0.44 | (0.45 | ) | 2.46 | (4.02 | ) | 4.11 | ||||||||||||||||
| Total from investment operations | (2.73 | ) | 0.98 | (0.05 | ) | 2.86 | (3.62 | ) | 4.46 | ||||||||||||||||
| Less distributions from: | |||||||||||||||||||||||||
| Net investment income | — | (0.89 | ) | (0.38 | ) | (0.45 | ) | (0.34 | ) | (0.40 | ) | ||||||||||||||
| Total distributions | — | (0.89 | ) | (0.38 | ) | (0.45 | ) | (0.34 | ) | (0.40 | ) | ||||||||||||||
| Net asset value, end of period | $ | 15.40 | $ | 18.13 | $ | 18.04 | $ | 18.47 | $ | 16.06 | $ | 20.02 | |||||||||||||
| Total Return (b) | -15.06 | % | 5.44 | % | 0.01 | % | 17.98 | % | -18.09 | % | 28.02 | % | |||||||||||||
| Ratios and Supplemental Data: | |||||||||||||||||||||||||
| Net assets, end of period (in thousands) | $ | 7,408 | $ | 9,880 | $ | 23,631 | $ | 184,337 | $ | 232,507 | $ | 372,568 | |||||||||||||
| Ratios to average net assets (c): | |||||||||||||||||||||||||
| Net expenses | 1.09 | % | 1.06 | % | 1.08 | % | 1.08 | % | 1.07 | % | 1.08 | % | |||||||||||||
| Gross expenses | 1.12 | % | 1.08 | % | 1.09 | % | 1.08 | % | 1.07 | % | 1.08 | % | |||||||||||||
| Net investment income (loss) | 4.61 | % | 2.83 | % | 2.52 | % | 2.30 | % | 2.15 | % | 1.91 | % | |||||||||||||
| Portfolio turnover rate | 12 | % | 34 | % | 39 | % | 20 | % | 16 | % | 14 | % | |||||||||||||
| † | Unaudited. |
| (a) | Net investment income (loss) has been computed using the average shares method. |
| (b) | Total returns reflect reinvestment of all dividends and distributions, if any. Certain expenses of the Portfolio may have been waived or reimbursed by the Investment Manager, State Street or DST; without such waiver/reimbursement of expenses, the Portfolio’s returns would have been lower. Returns for a period of less than one year are not annualized. |
| (c) | Annualized for a period of less than one year. |
The accompanying notes are an integral part of these financial statements.
Semi-Annual Report 203
LAZARD EMERGING MARKETS STRATEGIC EQUITY PORTFOLIO
| Selected data for a share of capital stock outstanding | Six Months Ended | Year Ended | |||||||||||||||||||||||
| throughout each period | 6/30/22† | 12/31/21 | 12/31/20 | 12/31/19 | 12/31/18 | 12/31/17 | |||||||||||||||||||
| Institutional Shares | |||||||||||||||||||||||||
| Net asset value, beginning of period | $ | 12.87 | $ | 13.80 | $ | 12.18 | $ | 10.02 | $ | 12.93 | $ | 9.60 | |||||||||||||
| Income (Loss) from investment operations: | |||||||||||||||||||||||||
| Net investment income (loss) (a) | 0.17 | 0.19 | 0.13 | 0.13 | 0.17 | 0.10 | |||||||||||||||||||
| Net realized and unrealized gain (loss) | (2.46 | ) | (0.96 | ) | 1.66 | 2.29 | (2.89 | ) | 3.35 | ||||||||||||||||
| Total from investment operations | (2.29 | ) | (0.77 | ) | 1.79 | 2.42 | (2.72 | ) | 3.45 | ||||||||||||||||
| Less distributions from: | |||||||||||||||||||||||||
| Net investment income | — | (0.16 | ) | (0.17 | ) | (0.26 | ) | (0.19 | ) | (0.12 | ) | ||||||||||||||
| Total distributions | — | (0.16 | ) | (0.17 | ) | (0.26 | ) | (0.19 | ) | (0.12 | ) | ||||||||||||||
| Net asset value, end of period | $ | 10.58 | $ | 12.87 | $ | 13.80 | $ | 12.18 | $ | 10.02 | $ | 12.93 | |||||||||||||
| Total Return (b) | -17.79 | % | -5.54 | % | 14.74 | % | 24.21 | % | -21.05 | % | 35.98 | % | |||||||||||||
| Ratios and Supplemental Data: | |||||||||||||||||||||||||
| Net assets, end of period (in thousands) | $ | 46,499 | $ | 57,269 | $ | 74,406 | $ | 96,399 | $ | 291,404 | $ | 385,492 | |||||||||||||
| Ratios to average net assets (c): | |||||||||||||||||||||||||
| Net expenses | 1.15 | % | 1.18 | % | 1.22 | % | 1.26 | % | 1.15 | % | 1.21 | % | |||||||||||||
| Gross expenses | 1.47 | % | 1.33 | % | 1.46 | % | 1.26 | % | 1.15 | % | 1.21 | % | |||||||||||||
| Net investment income (loss) | 2.85 | % | 1.33 | % | 1.18 | % | 1.16 | % | 1.39 | % | 0.90 | % | |||||||||||||
| Portfolio turnover rate | 12 | % | 95 | % | 53 | % | 56 | % | 61 | % | 57 | % | |||||||||||||
The accompanying notes are an integral part of these financial statements.
204 Semi-Annual Report
| Selected data for a share of capital stock outstanding | Six Months Ended | Year Ended | |||||||||||||||||||||||
| throughout each period | 6/30/22† | 12/31/21 | 12/31/20 | 12/31/19 | 12/31/18 | 12/31/17 | |||||||||||||||||||
| Open Shares | |||||||||||||||||||||||||
| Net asset value, beginning of period | $ | 12.92 | $ | 13.85 | $ | 12.23 | $ | 10.03 | $ | 12.95 | $ | 9.62 | |||||||||||||
| Income (Loss) from investment operations: | |||||||||||||||||||||||||
| Net investment income (loss) (a) | 0.16 | 0.14 | 0.10 | 0.14 | 0.12 | 0.06 | |||||||||||||||||||
| Net realized and unrealized gain (loss) | (2.47 | ) | (0.94 | ) | 1.65 | 2.29 | (2.89 | ) | 3.34 | ||||||||||||||||
| Total from investment operations | (2.31 | ) | (0.80 | ) | 1.75 | 2.43 | (2.77 | ) | 3.40 | ||||||||||||||||
| Less distributions from: | |||||||||||||||||||||||||
| Net investment income | — | (0.13 | ) | (0.13 | ) | (0.23 | ) | (0.15 | ) | (0.07 | ) | ||||||||||||||
| Total distributions | — | (0.13 | ) | (0.13 | ) | (0.23 | ) | (0.15 | ) | (0.07 | ) | ||||||||||||||
| Net asset value, end of period | $ | 10.61 | $ | 12.92 | $ | 13.85 | $ | 12.23 | $ | 10.03 | $ | 12.95 | |||||||||||||
| Total Return (b) | -17.88 | % | -5.75 | % | 14.39 | % | 24.21 | % | -21.39 | % | 35.38 | % | |||||||||||||
| Ratios and Supplemental Data: | |||||||||||||||||||||||||
| Net assets, end of period (in thousands) | $ | 2,612 | $ | 2,949 | $ | 4,019 | $ | 5,977 | $ | 6,200 | $ | 9,728 | |||||||||||||
| Ratios to average net assets (c): | |||||||||||||||||||||||||
| Net expenses | 1.40 | % | 1.43 | % | 1.48 | % | 1.52 | % | 1.53 | % | 1.60 | % | |||||||||||||
| Gross expenses | 1.87 | % | 1.71 | % | 1.83 | % | 1.77 | % | 1.53 | % | 1.61 | % | |||||||||||||
| Net investment income (loss) | 2.73 | % | 1.01 | % | 0.88 | % | 1.27 | % | 1.01 | % | 0.50 | % | |||||||||||||
| Portfolio turnover rate | 12 | % | 95 | % | 53 | % | 56 | % | 61 | % | 57 | % | |||||||||||||
| † | Unaudited. |
| (a) | Net investment income (loss) has been computed using the average shares method. |
| (b) | Total returns reflect reinvestment of all dividends and distributions, if any. Certain expenses of the Portfolio may have been waived or reimbursed by the Investment Manager, State Street or DST; without such waiver/reimbursement of expenses, the Portfolio’s returns would have been lower. Returns for a period of less than one year are not annualized. |
| (c) | Annualized for a period of less than one year. |
The accompanying notes are an integral part of these financial statements.
Semi-Annual Report 205
LAZARD EQUITY FRANCHISE PORTFOLIO
| Selected data for a share of capital stock outstanding | Six Months Ended | Year Ended | For the Period 9/29/17* to | |||||||||||||||||||||||
| throughout each period | 6/30/22† | 12/31/21 | 12/31/20 | 12/31/19 | 12/31/18 | 12/31/17 | ||||||||||||||||||||
| Institutional Shares | ||||||||||||||||||||||||||
| Net asset value, beginning of period | $ | 10.78 | $ | 10.17 | $ | 10.17 | $ | 8.84 | $ | 10.38 | $ | 10.00 | ||||||||||||||
| Income (Loss) from investment operations: | ||||||||||||||||||||||||||
| Net investment income (loss) (a) | 0.08 | 0.15 | 0.10 | 0.19 | 0.20 | 0.03 | ||||||||||||||||||||
| Net realized and unrealized gain (loss) | (0.86 | ) | 2.14 | 0.02 | 1.73 | (0.75 | ) | 0.40 | ||||||||||||||||||
| Total from investment operations | (0.78 | ) | 2.29 | 0.12 | 1.92 | (0.55 | ) | 0.43 | ||||||||||||||||||
| Less distributions from: | ||||||||||||||||||||||||||
| Net investment income | — | (0.15 | ) | (0.07 | ) | (0.15 | ) | (0.21 | ) | (0.03 | ) | |||||||||||||||
| Net realized gains | — | (1.53 | ) | (0.05 | ) | (0.44 | ) | (0.78 | ) | (0.02 | ) | |||||||||||||||
| Total distributions | — | (1.68 | ) | (0.12 | ) | (0.59 | ) | (0.99 | ) | (0.05 | ) | |||||||||||||||
| Net asset value, end of period | $ | 10.00 | $ | 10.78 | $ | 10.17 | $ | 10.17 | $ | 8.84 | $ | 10.38 | ||||||||||||||
| Total Return (b) | -7.24 | % | 22.76 | % | 1.15 | % | 21.70 | % | -5.10 | % | 4.25 | % | ||||||||||||||
| Ratios and Supplemental Data: | ||||||||||||||||||||||||||
| Net assets, end of period (in thousands) | $ | 146,862 | $ | 105,429 | $ | 91,720 | $ | 39,878 | $ | 8,341 | $ | 5,566 | ||||||||||||||
| Ratios to average net assets (c): | ||||||||||||||||||||||||||
| Net expenses | 0.95 | % | 0.95 | % | 0.95 | % | 0.95 | % | 0.95 | % | 0.95 | % | ||||||||||||||
| Gross expenses | 1.02 | % | 0.98 | % | 1.11 | % | 1.36 | % | 3.42 | % | 3.21 | % | ||||||||||||||
| Net investment income (loss) | 1.42 | % | 1.29 | % | 1.09 | % | 1.95 | % | 1.94 | % | 1.26 | % | ||||||||||||||
| Portfolio turnover rate | 79 | % | 73 | % | 79 | % | 95 | % | 97 | % | 10 | % | ||||||||||||||
The accompanying notes are an integral part of these financial statements.
206 Semi-Annual Report
| Selected data for a share of capital stock outstanding | Six Months Ended | Year Ended | For the Period 9/29/17* to | |||||||||||||||||||||||
| throughout each period | 6/30/22† | 12/31/21 | 12/31/20 | 12/31/19 | 12/31/18 | 12/31/17 | ||||||||||||||||||||
| Open Shares | ||||||||||||||||||||||||||
| Net asset value, beginning of period | $ | 10.77 | $ | 10.17 | $ | 10.17 | $ | 8.84 | $ | 10.38 | $ | 10.00 | ||||||||||||||
| Income (Loss) from investment operations: | ||||||||||||||||||||||||||
| Net investment income (loss) (a) | 0.08 | 0.12 | 0.09 | 0.16 | 0.19 | 0.03 | ||||||||||||||||||||
| Net realized and unrealized gain (loss) | (0.86 | ) | 2.13 | — | (d) | 1.73 | (0.77 | ) | 0.39 | |||||||||||||||||
| Total from investment operations | (0.78 | ) | 2.25 | 0.09 | 1.89 | (0.58 | ) | 0.42 | ||||||||||||||||||
| Less distributions from: | ||||||||||||||||||||||||||
| Net investment income | — | (0.12 | ) | (0.04 | ) | (0.12 | ) | (0.18 | ) | (0.02 | ) | |||||||||||||||
| Net realized gains | — | (1.53 | ) | (0.05 | ) | (0.44 | ) | (0.78 | ) | (0.02 | ) | |||||||||||||||
| Total distributions | — | (1.65 | ) | (0.09 | ) | (0.56 | ) | (0.96 | ) | (0.04 | ) | |||||||||||||||
| Net asset value, end of period | $ | 9.99 | $ | 10.77 | $ | 10.17 | $ | 10.17 | $ | 8.84 | $ | 10.38 | ||||||||||||||
| Total Return (b) | -7.24 | % | 22.36 | % | 0.90 | % | 21.40 | % | -5.34 | % | 4.18 | % | ||||||||||||||
| Ratios and Supplemental Data: | ||||||||||||||||||||||||||
| Net assets, end of period (in thousands) | $ | 177 | $ | 93 | $ | 129 | $ | 312 | $ | 190 | $ | 111 | ||||||||||||||
| Ratios to average net assets (c): | ||||||||||||||||||||||||||
| Net expenses | 1.20 | % | 1.20 | % | 1.20 | % | 1.18 | % | 1.20 | % | 1.20 | % | ||||||||||||||
| Gross expenses | 5.00 | % | 4.45 | % | 3.64 | % | 5.78 | % | 10.19 | % | 23.62 | % | ||||||||||||||
| Net investment income (loss) | 1.48 | % | 1.05 | % | 1.00 | % | 1.64 | % | 1.75 | % | 1.14 | % | ||||||||||||||
| Portfolio turnover rate | 79 | % | 73 | % | 79 | % | 95 | % | 97 | % | 10 | % | ||||||||||||||
| † | Unaudited. |
| * | The Portfolio commenced operations on September 29, 2017. |
| (a) | Net investment income (loss) has been computed using the average shares method. |
| (b) | Total returns reflect reinvestment of all dividends and distributions, if any. Certain expenses of the Portfolio may have been waived or reimbursed by the Investment Manager, State Street or DST; without such waiver/reimbursement of expenses, the Portfolio’s returns would have been lower. Returns for a period of less than one year are not annualized. |
| (c) | Annualized for a period of less than one year except for non-recurring expenses. |
| (d) | Amount is less than $0.01 per share. |
The accompanying notes are an integral part of these financial statements.
Semi-Annual Report 207
LAZARD GLOBAL EQUITY SELECT PORTFOLIO
| Selected data for a share of capital stock outstanding | Six Months Ended | Year Ended | |||||||||||||||||||||||
| throughout each period | 6/30/22† | 12/31/21 | 12/31/20 | 12/31/19 | 12/31/18 | 12/31/17 | |||||||||||||||||||
| Institutional Shares | |||||||||||||||||||||||||
| Net asset value, beginning of period | $ | 18.77 | $ | 16.32 | $ | 14.56 | $ | 11.72 | $ | 13.04 | $ | 10.53 | |||||||||||||
| Income (Loss) from investment operations: | |||||||||||||||||||||||||
| Net investment income (loss) (a) | 0.06 | 0.09 | 0.07 | 0.11 | 0.09 | 0.07 | |||||||||||||||||||
| Net realized and unrealized gain (loss) | (3.89 | ) | 3.11 | 2.24 | 2.84 | (1.02 | ) | 2.93 | |||||||||||||||||
| Total from investment operations | (3.83 | ) | 3.20 | 2.31 | 2.95 | (0.93 | ) | 3.00 | |||||||||||||||||
| Less distributions from: | |||||||||||||||||||||||||
| Net investment income | — | (0.09 | ) | (0.05 | ) | (0.10 | ) | (0.06 | ) | (0.10 | ) | ||||||||||||||
| Net realized gains | — | (0.66 | ) | (0.50 | ) | — | (0.32 | ) | (0.39 | ) | |||||||||||||||
| Return of capital | — | — | — | (0.01 | ) | (0.01 | ) | — | |||||||||||||||||
| Total distributions | — | (0.75 | ) | (0.55 | ) | (0.11 | ) | (0.39 | ) | (0.49 | ) | ||||||||||||||
| Net asset value, end of period | $ | 14.94 | $ | 18.77 | $ | 16.32 | $ | 14.56 | $ | 11.72 | $ | 13.04 | |||||||||||||
| Total Return (b) | -20.40 | % | 19.75 | % | 15.97 | % | 25.20 | % | -7.12 | % | 28.52 | % | |||||||||||||
| Ratios and Supplemental Data: | |||||||||||||||||||||||||
| Net assets, end of period (in thousands) | $ | 94,144 | $ | 109,943 | $ | 92,418 | $ | 82,057 | $ | 65,382 | $ | 58,201 | |||||||||||||
| Ratios to average net assets (c): | |||||||||||||||||||||||||
| Net expenses | 0.87 | % | 0.84 | % | 0.90 | % | 1.01 | % | 1.05 | % | 1.05 | % | |||||||||||||
| Gross expenses | 0.87 | % | 0.84 | % | 0.95 | % | 1.08 | % | 1.08 | % | 1.30 | % | |||||||||||||
| Net investment income (loss) | 0.76 | % | 0.50 | % | 0.46 | % | 0.85 | % | 0.70 | % | 0.60 | % | |||||||||||||
| Portfolio turnover rate | 8 | % | 22 | % | 90 | % | 25 | % | 34 | % | 34 | % | |||||||||||||
The accompanying notes are an integral part of these financial statements.
208 Semi-Annual Report
| Selected data for a share of capital stock outstanding | Six Months Ended | Year Ended | |||||||||||||||||||||||
| throughout each period | 6/30/22† | 12/31/21 | 12/31/20 | 12/31/19 | 12/31/18 | 12/31/17 | |||||||||||||||||||
| Open Shares | |||||||||||||||||||||||||
| Net asset value, beginning of period | $ | 18.78 | $ | 16.33 | $ | 14.57 | $ | 11.73 | $ | 13.04 | $ | 10.54 | |||||||||||||
| Income (Loss) from investment operations: | |||||||||||||||||||||||||
| Net investment income (loss) (a) | 0.04 | 0.03 | 0.05 | 0.08 | 0.05 | 0.04 | |||||||||||||||||||
| Net realized and unrealized gain (loss) | (3.90 | ) | 3.11 | 2.22 | 2.83 | (1.01 | ) | 2.91 | |||||||||||||||||
| Total from investment operations | (3.86 | ) | 3.14 | 2.27 | 2.91 | (0.96 | ) | 2.95 | |||||||||||||||||
| Less distributions from: | |||||||||||||||||||||||||
| Net investment income | — | (0.03 | ) | (0.01 | ) | (0.07 | ) | (0.02 | ) | (0.06 | ) | ||||||||||||||
| Net realized gains | — | (0.66 | ) | (0.50 | ) | — | (0.32 | ) | (0.39 | ) | |||||||||||||||
| Return of capital | — | — | — | — | (d) | (0.01 | ) | — | |||||||||||||||||
| Total distributions | — | (0.69 | ) | (0.51 | ) | (0.07 | ) | (0.35 | ) | (0.45 | ) | ||||||||||||||
| Net asset value, end of period | $ | 14.92 | $ | 18.78 | $ | 16.33 | $ | 14.57 | $ | 11.73 | $ | 13.04 | |||||||||||||
| Total Return (b) | -20.55 | % | 19.37 | % | 15.67 | % | 24.82 | % | -7.33 | % | 28.01 | % | |||||||||||||
| Ratios and Supplemental Data: | |||||||||||||||||||||||||
| Net assets, end of period (in thousands) | $ | 1,228 | $ | 1,543 | $ | 1,158 | $ | 933 | $ | 763 | $ | 711 | |||||||||||||
| Ratios to average net assets (c): | |||||||||||||||||||||||||
| Net expenses | 1.15 | % | 1.15 | % | 1.15 | % | 1.30 | % | 1.35 | % | 1.35 | % | |||||||||||||
| Gross expenses | 1.47 | % | 1.40 | % | 1.74 | % | 2.36 | % | 2.80 | % | 3.70 | % | |||||||||||||
| Net investment income (loss) | 0.47 | % | 0.18 | % | 0.35 | % | 0.56 | % | 0.41 | % | 0.32 | % | |||||||||||||
| Portfolio turnover rate | 8 | % | 22 | % | 90 | % | 25 | % | 34 | % | 34 | % | |||||||||||||
| † | Unaudited. |
| (a) | Net investment income (loss) has been computed using the average shares method. |
| (b) | Total returns reflect reinvestment of all dividends and distributions, if any. Certain expenses of the Portfolio may have been waived or reimbursed by the Investment Manager, State Street or DST; without such waiver/reimbursement of expenses, the Portfolio’s returns would have been lower. Returns for a period of less than one year are not annualized. |
| (c) | Annualized for a period of less than one year. |
| (d) | Amount is less than $0.01 per share. |
The accompanying notes are an integral part of these financial statements.
Semi-Annual Report 209
LAZARD GLOBAL LISTED INFRASTRUCTURE PORTFOLIO
| Selected data for a share of capital stock outstanding | Six Months Ended | Year Ended | |||||||||||||||||||||||
| throughout each period | 6/30/22† | 12/31/21 | 12/31/20 | 12/31/19 | 12/31/18 | 12/31/17 | |||||||||||||||||||
| Institutional Shares | |||||||||||||||||||||||||
| Net asset value, beginning of period | $ | 16.50 | $ | 14.65 | $ | 15.78 | $ | 13.51 | $ | 15.99 | $ | 14.17 | |||||||||||||
| Income (Loss) from investment operations: | |||||||||||||||||||||||||
| Net investment income (loss) (a) | 0.27 | * | 0.61 | * | 0.27 | 0.40 | 0.41 | 0.39 | |||||||||||||||||
| Net realized and unrealized gain (loss) | (0.34 | ) | 2.27 | (1.02 | ) | 2.57 | (0.96 | ) | 2.54 | ||||||||||||||||
| Total from investment operations | (0.07 | ) | 2.88 | (0.75 | ) | 2.97 | (0.55 | ) | 2.93 | ||||||||||||||||
| Less distributions from: | |||||||||||||||||||||||||
| Net investment income | (0.34 | ) | (0.72 | ) | (0.04 | ) | (0.70 | ) | (0.72 | ) | (0.29 | ) | |||||||||||||
| Net realized gains | — | (0.31 | ) | (0.27 | ) | — | (1.21 | ) | (0.82 | ) | |||||||||||||||
| Return of capital | — | — | (0.07 | ) | — | — | — | ||||||||||||||||||
| Total distributions | (0.34 | ) | (1.03 | ) | (0.38 | ) | (0.70 | ) | (1.93 | ) | (1.11 | ) | |||||||||||||
| Net asset value, end of period | $ | 16.09 | $ | 16.50 | $ | 14.65 | $ | 15.78 | $ | 13.51 | $ | 15.99 | |||||||||||||
| Total Return (b) | -0.41 | %* | 19.87 | %* | -4.48 | % | 22.26 | % | -3.68 | % | 20.73 | % | |||||||||||||
| Ratios and Supplemental Data: | |||||||||||||||||||||||||
| Net assets, end of period (in thousands) | $ | 8,104,350 | $ | 7,308,516 | $ | 7,289,680 | $ | 7,277,512 | $ | 4,924,359 | $ | 4,778,042 | |||||||||||||
| Ratios to average net assets (c): | |||||||||||||||||||||||||
| Net expenses | 0.96 | % | 0.96 | % | 0.96 | % | 0.95 | % | 0.95 | % | 0.95 | % | |||||||||||||
| Gross expenses | 0.96 | % | 0.96 | % | 0.96 | % | 0.95 | % | 0.95 | % | 0.95 | % | |||||||||||||
| Net investment income (loss) | 3.38 | %* | 3.86 | %* | 1.87 | % | 2.63 | % | 2.65 | % | 2.44 | % | |||||||||||||
| Portfolio turnover rate | 9 | % | 28 | % | 42 | % | 33 | % | 49 | % | 33 | % | |||||||||||||
The accompanying notes are an integral part of these financial statements.
210 Semi-Annual Report
| Selected data for a share of capital stock outstanding | Six Months Ended | Year Ended | |||||||||||||||||||||||
| throughout each period | 6/30/22† | 12/31/21 | 12/31/20 | 12/31/19 | 12/31/18 | 12/31/17 | |||||||||||||||||||
| Open Shares | |||||||||||||||||||||||||
| Net asset value, beginning of period | $ | 16.51 | $ | 14.66 | $ | 15.79 | $ | 13.52 | $ | 16.01 | $ | 14.20 | |||||||||||||
| Income (Loss) from investment operations: | |||||||||||||||||||||||||
| Net investment income (loss) (a) | 0.27 | * | 0.55 | * | 0.23 | 0.36 | 0.37 | 0.35 | |||||||||||||||||
| Net realized and unrealized gain (loss) | (0.37 | ) | 2.29 | (1.01 | ) | 2.57 | (0.97 | ) | 2.55 | ||||||||||||||||
| Total from investment operations | (0.10 | ) | 2.84 | (0.78 | ) | 2.93 | (0.60 | ) | 2.90 | ||||||||||||||||
| Less distributions from: | |||||||||||||||||||||||||
| Net investment income | (0.32 | ) | (0.68 | ) | (0.03 | ) | (0.66 | ) | (0.68 | ) | (0.27 | ) | |||||||||||||
| Net realized gains | — | (0.31 | ) | (0.25 | ) | — | (1.21 | ) | (0.82 | ) | |||||||||||||||
| Return of capital | — | — | (0.07 | ) | — | — | — | ||||||||||||||||||
| Total distributions | (0.32 | ) | (0.99 | ) | (0.35 | ) | (0.66 | ) | (1.89 | ) | (1.09 | ) | |||||||||||||
| Net asset value, end of period | $ | 16.09 | $ | 16.51 | $ | 14.66 | $ | 15.79 | $ | 13.52 | $ | 16.01 | |||||||||||||
| Total Return (b) | -0.60 | %* | 19.56 | %* | -4.68 | % | 21.94 | % | -3.98 | % | 20.47 | % | |||||||||||||
| Ratios and Supplemental Data: | |||||||||||||||||||||||||
| Net assets, end of period (in thousands) | $ | 355,865 | $ | 300,372 | $ | 307,757 | $ | 448,387 | $ | 426,749 | $ | 633,243 | |||||||||||||
| Ratios to average net assets (c): | |||||||||||||||||||||||||
| Net expenses | 1.21 | % | 1.21 | % | 1.21 | % | 1.20 | % | 1.20 | % | 1.21 | % | |||||||||||||
| Gross expenses | 1.21 | % | 1.21 | % | 1.21 | % | 1.20 | % | 1.20 | % | 1.21 | % | |||||||||||||
| Net investment income (loss) | 3.28 | %* | 3.50 | %* | 1.57 | % | 2.39 | % | 2.36 | % | 2.16 | % | |||||||||||||
| Portfolio turnover rate | 9 | % | 28 | % | 42 | % | 33 | % | 49 | % | 33 | % | |||||||||||||
| † | Unaudited. |
| * | Includes $0.01 and $0.04 of refunds received as a result of European Union dividend withholding tax reclaims filings for the period ended June 30, 2022 and year ended December 31, 2021, respectively. There was a 0.06% and 0.29% impact on the total return of the Portfolio for period ended June 30, 2022 and year ended December 31, 2021, respectively. There was a 0.06% and 0.26% impact on the net investment income (loss) ratio of the Portfolio for the period ended June 30, 2022 and year ended December 31, 2021, respectively. Refer to Note 2(b) in the Notes to Financial Statements for further information. |
| (a) | Net investment income (loss) has been computed using the average shares method. |
| (b) | Total returns reflect reinvestment of all dividends and distributions, if any. Return for a period of less than one year is not annualized. |
| (c) | Annualized for a period of less than one year. |
The accompanying notes are an integral part of these financial statements.
Semi-Annual Report 211
LAZARD GLOBAL STRATEGIC EQUITY PORTFOLIO
| Selected data for a share of capital stock outstanding | Six Months Ended | Year Ended | |||||||||||||||||||||||
| throughout each period | 6/30/22† | 12/31/21 | 12/31/20* | 12/31/19* | 12/31/18* | 12/31/17* | |||||||||||||||||||
| Institutional Shares | |||||||||||||||||||||||||
| Net asset value, beginning of period | $ | 13.49 | $ | 12.12 | $ | 10.30 | $ | 8.20 | $ | 11.55 | $ | 47.95 | |||||||||||||
| Income (Loss) from investment operations: | |||||||||||||||||||||||||
| Net investment income (loss) (a) | 0.02 | 0.26 | 0.02 | 0.10 | 0.05 | 0.40 | |||||||||||||||||||
| Net realized and unrealized gain (loss) | (3.06 | ) | 1.69 | 2.17 | 2.30 | (0.90 | ) | 11.20 | |||||||||||||||||
| Total from investment operations | (3.04 | ) | 1.95 | 2.19 | 2.40 | (0.85 | ) | 11.60 | |||||||||||||||||
| Less distributions from: | |||||||||||||||||||||||||
| Net investment income | — | (0.22 | ) | (0.01 | ) | (0.10 | ) | (0.05 | ) | (1.00 | ) | ||||||||||||||
| Net realized gains | — | (0.36 | ) | (0.36 | ) | (0.20 | ) | (2.45 | ) | (47.00 | ) | ||||||||||||||
| Total distributions | — | (0.58 | ) | (0.37 | ) | (0.30 | ) | (2.50 | ) | (48.00 | ) | ||||||||||||||
| Net asset value, end of period | $ | 10.45 | $ | 13.49 | $ | 12.12 | $ | 10.30 | $ | 8.20 | $ | 11.55 | |||||||||||||
| Total Return (b) | -22.54 | % | 16.13 | % | 21.48 | % | 29.19 | % | -9.16 | % | 24.20 | % | |||||||||||||
| Ratios and Supplemental Data: | |||||||||||||||||||||||||
| Net assets, end of period (in thousands) | $ | 12,261 | $ | 17,502 | $ | 4,076 | $ | 3,185 | $ | 2,505 | $ | 2,750 | |||||||||||||
| Ratios to average net assets (c): | |||||||||||||||||||||||||
| Net expenses | 0.95 | % | 0.95 | % | 0.97 | % | 1.00 | % | 1.05 | % | 1.10 | % | |||||||||||||
| Gross expenses | 1.93 | % | 1.88 | % | 5.74 | % | 6.07 | % | 6.41 | % | 2.06 | % | |||||||||||||
| Net investment income (loss) | 0.40 | % | 1.97 | % | 0.23 | % | 1.01 | % | 0.60 | % | 0.76 | % | |||||||||||||
| Portfolio turnover rate | 18 | % | 40 | % | 59 | % | 49 | % | 46 | % | 65 | % | |||||||||||||
The accompanying notes are an integral part of these financial statements.
212 Semi-Annual Report
| Selected data for a share of capital stock outstanding | Six Months Ended | Year Ended | |||||||||||||||||||||||
| throughout each period | 6/30/22† | 12/31/21 | 12/31/20* | 12/31/19* | 12/31/18* | 12/31/17* | |||||||||||||||||||
| Open Shares | |||||||||||||||||||||||||
| Net asset value, beginning of period | $ | 13.38 | $ | 12.02 | $ | 10.25 | $ | 8.15 | $ | 11.50 | $ | 47.95 | |||||||||||||
| Income (Loss) from investment operations: | |||||||||||||||||||||||||
| Net investment income (loss) (a) | 0.01 | 0.19 | — | (d) | 0.05 | 0.05 | 0.15 | ||||||||||||||||||
| Net realized and unrealized gain (loss) | (3.05 | ) | 1.72 | 2.13 | 2.30 | (0.95 | ) | 11.25 | |||||||||||||||||
| Total from investment operations | (3.04 | ) | 1.91 | 2.13 | 2.35 | (0.90 | ) | 11.40 | |||||||||||||||||
| Less distributions from: | |||||||||||||||||||||||||
| Net investment income | — | (0.19 | ) | — | (d) | (0.05 | ) | — | (d) | (0.85 | ) | ||||||||||||||
| Net realized gains | — | (0.36 | ) | (0.36 | ) | (0.20 | ) | (2.45 | ) | (47.00 | ) | ||||||||||||||
| Total distributions | — | (0.55 | ) | (0.36 | ) | (0.25 | ) | (2.45 | ) | (47.85 | ) | ||||||||||||||
| Net asset value, end of period | $ | 10.34 | $ | 13.38 | $ | 12.02 | $ | 10.25 | $ | 8.15 | $ | 11.50 | |||||||||||||
| Total Return (b) | -22.72 | % | 15.90 | % | 20.96 | % | 29.01 | % | -9.39 | % | 23.72 | % | |||||||||||||
| Ratios and Supplemental Data: | |||||||||||||||||||||||||
| Net assets, end of period (in thousands) | $ | 163 | $ | 210 | $ | 184 | $ | 144 | $ | 131 | $ | 149 | |||||||||||||
| Ratios to average net assets (c): | |||||||||||||||||||||||||
| Net expenses | 1.20 | % | 1.20 | % | 1.22 | % | 1.29 | % | 1.35 | % | 1.41 | % | |||||||||||||
| Gross expenses | 4.57 | % | 4.09 | % | 8.76 | % | 13.26 | % | 14.05 | % | 12.33 | % | |||||||||||||
| Net investment income (loss) | 0.15 | % | 1.47 | % | -0.01 | % | 0.72 | % | 0.29 | % | 0.34 | % | |||||||||||||
| Portfolio turnover rate | 18 | % | 40 | % | 59 | % | 49 | % | 46 | % | 65 | % | |||||||||||||
| † | Unaudited. |
| * | On December 17, 2020, the Fund effected a 1:5 reverse share split. All per share data prior to December 17, 2020 has been adjusted to reflect the reverse share split. |
| (a) | Net investment income (loss) has been computed using the average shares method. |
| (b) | Total returns reflect reinvestment of all dividends and distributions, if any. Certain expenses of the Portfolio may have been waived or reimbursed by the Investment Manager, State Street or DST; without such waiver/reimbursement of expenses, the Portfolio’s returns would have been lower. Returns for a period of less than one year are not annualized. |
| (c) | Annualized for a period of less than one year. |
| (d) | Amount is less than $0.01 per share. |
The accompanying notes are an integral part of these financial statements.
Semi-Annual Report 213
LAZARD INTERNATIONAL EQUITY ADVANTAGE PORTFOLIO
| Selected data for a share of capital stock outstanding | Six Months Ended | Year Ended | |||||||||||||||||||||||
| throughout each period | 6/30/22† | 12/31/21 | 12/31/20 | 12/31/19 | 12/31/18 | 12/31/17 | |||||||||||||||||||
| Institutional Shares | |||||||||||||||||||||||||
| Net asset value, beginning of period | $ | 11.19 | $ | 10.32 | $ | 9.99 | $ | 8.70 | $ | 10.92 | $ | 8.91 | |||||||||||||
| Income (Loss) from investment operations: | |||||||||||||||||||||||||
| Net investment income (loss) (a) | 0.22 | 0.29 | 0.20 | 0.22 | 0.24 | 0.19 | |||||||||||||||||||
| Net realized and unrealized gain (loss) | (2.26 | ) | 1.15 | 0.33 | 1.29 | (2.01 | ) | 2.03 | |||||||||||||||||
| Total from investment operations | (2.04 | ) | 1.44 | 0.53 | 1.51 | (1.77 | ) | 2.22 | |||||||||||||||||
| Less distributions from: | |||||||||||||||||||||||||
| Net investment income | — | (0.29 | ) | (0.20 | ) | (0.22 | ) | (0.33 | ) | (0.21 | ) | ||||||||||||||
| Net realized gains | — | (0.28 | ) | — | — | (0.12 | ) | — | |||||||||||||||||
| Total distributions | — | (0.57 | ) | (0.20 | ) | (0.22 | ) | (0.45 | ) | (0.21 | ) | ||||||||||||||
| Net asset value, end of period | $ | 9.15 | $ | 11.19 | $ | 10.32 | $ | 9.99 | $ | 8.70 | $ | 10.92 | |||||||||||||
| Total Return (b) | -18.23 | % | 13.94 | % | 5.41 | % | 17.37 | % | -16.26 | % | 24.98 | % | |||||||||||||
| Ratios and Supplemental Data: | |||||||||||||||||||||||||
| Net assets, end of period (in thousands) | $ | 2,308 | $ | 2,855 | $ | 2,472 | $ | 2,408 | $ | 2,051 | $ | 2,508 | |||||||||||||
| Ratios to average net assets (c): | |||||||||||||||||||||||||
| Net expenses | 0.90 | % | 0.90 | % | 0.90 | % | 0.90 | % | 0.90 | % | 0.90 | % | |||||||||||||
| Gross expenses | 7.11 | % | 5.81 | % | 8.57 | % | 8.40 | % | 7.60 | % | 8.91 | % | |||||||||||||
| Net investment income (loss) | 4.22 | % | 2.54 | % | 2.24 | % | 2.30 | % | 2.29 | % | 1.89 | % | |||||||||||||
| Portfolio turnover rate | 43 | % | 99 | % | 109 | % | 66 | % | 72 | % | 88 | % | |||||||||||||
The accompanying notes are an integral part of these financial statements.
214 Semi-Annual Report
| Selected data for a share of capital stock outstanding | Six Months Ended | Year Ended | |||||||||||||||||||||||
| throughout each period | 6/30/22† | 12/31/21 | 12/31/20 | 12/31/19 | 12/31/18 | 12/31/17 | |||||||||||||||||||
| Open Shares | |||||||||||||||||||||||||
| Net asset value, beginning of period | $ | 11.20 | $ | 10.32 | $ | 9.99 | $ | 8.70 | $ | 10.92 | $ | 8.91 | |||||||||||||
| Income (Loss) from investment operations: | |||||||||||||||||||||||||
| Net investment income (loss) (a) | 0.20 | 0.26 | 0.18 | 0.19 | 0.21 | 0.16 | |||||||||||||||||||
| Net realized and unrealized gain (loss) | (2.26 | ) | 1.16 | 0.33 | 1.29 | (2.01 | ) | 2.03 | |||||||||||||||||
| Total from investment operations | (2.06 | ) | 1.42 | 0.51 | 1.48 | (1.80 | ) | 2.19 | |||||||||||||||||
| Less distributions from: | |||||||||||||||||||||||||
| Net investment income | — | (0.26 | ) | (0.18 | ) | (0.19 | ) | (0.30 | ) | (0.18 | ) | ||||||||||||||
| Net realized gains | — | (0.28 | ) | — | — | (0.12 | ) | — | |||||||||||||||||
| Total distributions | — | (0.54 | ) | (0.18 | ) | (0.19 | ) | (0.42 | ) | (0.18 | ) | ||||||||||||||
| Net asset value, end of period | $ | 9.14 | $ | 11.20 | $ | 10.32 | $ | 9.99 | $ | 8.70 | $ | 10.92 | |||||||||||||
| Total Return (b) | -18.39 | % | 13.75 | % | 5.14 | % | 17.03 | % | -16.52 | % | 24.60 | % | |||||||||||||
| Ratios and Supplemental Data: | |||||||||||||||||||||||||
| Net assets, end of period (in thousands) | $ | 110 | $ | 135 | $ | 119 | $ | 113 | $ | 97 | $ | 116 | |||||||||||||
| Ratios to average net assets (c): | |||||||||||||||||||||||||
| Net expenses | 1.15 | % | 1.15 | % | 1.15 | % | 1.18 | % | 1.20 | % | 1.20 | % | |||||||||||||
| Gross expenses | 10.78 | % | 9.38 | % | 12.55 | % | 17.72 | % | 17.67 | % | 20.85 | % | |||||||||||||
| Net investment income (loss) | 3.97 | % | 2.29 | % | 1.99 | % | 2.02 | % | 1.99 | % | 1.58 | % | |||||||||||||
| Portfolio turnover rate | 43 | % | 99 | % | 109 | % | 66 | % | 72 | % | 88 | % | |||||||||||||
| † | Unaudited. |
| (a) | Net investment income (loss) has been computed using the average shares method. |
| (b) | Total returns reflect reinvestment of all dividends and distributions, if any. Certain expenses of the Portfolio may have been waived or reimbursed by the Investment Manager, State Street or DST; without such waiver/reimbursement of expenses, the Portfolio’s returns would have been lower. Returns for a period of less than one year are not annualized. |
| (c) | Annualized for a period of less than one year. |
The accompanying notes are an integral part of these financial statements.
Semi-Annual Report 215
LAZARD INTERNATIONAL EQUITY PORTFOLIO
| Selected data for a share of capital stock outstanding | Six Months Ended | Year Ended | ||||||||||||||||||||||
| throughout each period | 6/30/22† | 12/31/21 | 12/31/20 | 12/31/19 | 12/31/18 | 12/31/17 | ||||||||||||||||||
| Institutional Shares | ||||||||||||||||||||||||
| Net asset value, beginning of period | $ | 17.98 | $ | 20.02 | $ | 18.61 | $ | 15.68 | $ | 19.61 | $ | 16.20 | ||||||||||||
| Income (Loss) from investment operations: | ||||||||||||||||||||||||
| Net investment income (loss) (a) | 0.23 | * | 0.67 | * | 0.21 | 0.37 | 0.37 | 0.26 | ||||||||||||||||
| Net realized and unrealized gain (loss) | (3.36 | ) | 0.49 | 1.41 | 2.95 | (3.06 | ) | 3.43 | ||||||||||||||||
| Total from investment operations | (3.13 | ) | 1.16 | 1.62 | 3.32 | (2.69 | ) | 3.69 | ||||||||||||||||
| Less distributions from: | ||||||||||||||||||||||||
| Net investment income | — | (1.07 | ) | (0.21 | ) | (0.39 | ) | (0.42 | ) | (0.28 | ) | |||||||||||||
| Net realized gains | — | (2.13 | ) | — | — | (0.82 | ) | — | ||||||||||||||||
| Total distributions | — | (3.20 | ) | (0.21 | ) | (0.39 | ) | (1.24 | ) | (0.28 | ) | |||||||||||||
| Net asset value, end of period | $ | 14.85 | $ | 17.98 | $ | 20.02 | $ | 18.61 | $ | 15.68 | $ | 19.61 | ||||||||||||
| Total Return (b) | -17.41 | %* | 6.00 | %* | 8.76 | % | 21.19 | % | -13.61 | %# | 22.81 | % | ||||||||||||
| Ratios and Supplemental Data: | ||||||||||||||||||||||||
| Net assets, end of period (in thousands) | $ | 1,089,393 | $ | 1,567,011 | $ | 2,812,450 | $ | 2,495,021 | $ | 2,102,735 | $ | 2,835,262 | ||||||||||||
| Ratios to average net assets (c): | ||||||||||||||||||||||||
| Net expenses | 0.85 | % | 0.82 | % | 0.82 | % | 0.82 | % | 0.81 | % | 0.81 | % | ||||||||||||
| Gross expenses | 0.85 | % | 0.82 | % | 0.82 | % | 0.82 | % | 0.81 | % | 0.81 | % | ||||||||||||
| Net investment income (loss) | 2.78 | %* | 3.21 | %* | 1.21 | % | 2.13 | % | 1.94 | % | 1.44 | % | ||||||||||||
| Portfolio turnover rate | 18 | % | 34 | % | 38 | % | 37 | % | 36 | % | 31 | % | ||||||||||||
The accompanying notes are an integral part of these financial statements.
216 Semi-Annual Report
| Selected data for a share of capital stock outstanding | Six Months Ended | Year Ended | ||||||||||||||||||||||
| throughout each period | 6/30/22† | 12/31/21 | 12/31/20 | 12/31/19 | 12/31/18 | 12/31/17 | ||||||||||||||||||
| Open Shares | ||||||||||||||||||||||||
| Net asset value, beginning of period | $ | 18.24 | $ | 20.26 | $ | 18.84 | $ | 15.87 | $ | 19.83 | $ | 16.38 | ||||||||||||
| Income (Loss) from investment operations: | ||||||||||||||||||||||||
| Net investment income (loss) (a) | 0.22 | * | 0.63 | * | 0.17 | 0.33 | 0.32 | 0.30 | ||||||||||||||||
| Net realized and unrealized gain (loss) | (3.41 | ) | 0.50 | 1.41 | 2.98 | (3.08 | ) | 3.38 | ||||||||||||||||
| Total from investment operations | (3.19 | ) | 1.13 | 1.58 | 3.31 | (2.76 | ) | 3.68 | ||||||||||||||||
| Less distributions from: | ||||||||||||||||||||||||
| Net investment income | — | (1.02 | ) | (0.16 | ) | (0.34 | ) | (0.38 | ) | (0.23 | ) | |||||||||||||
| Net realized gains | — | (2.13 | ) | — | — | (0.82 | ) | — | ||||||||||||||||
| Total distributions | — | (3.15 | ) | (0.16 | ) | (0.34 | ) | (1.20 | ) | (0.23 | ) | |||||||||||||
| Net asset value, end of period | $ | 15.05 | $ | 18.24 | $ | 20.26 | $ | 18.84 | $ | 15.87 | $ | 19.83 | ||||||||||||
| Total Return (b) | -17.49 | %* | 5.76 | %* | 8.43 | % | 20.89 | % | -13.83 | %# | 22.50 | % | ||||||||||||
| Ratios and Supplemental Data: | ||||||||||||||||||||||||
| Net assets, end of period (in thousands) | $ | 58,568 | $ | 93,296 | $ | 120,781 | $ | 257,308 | $ | 227,483 | $ | 275,014 | ||||||||||||
| Ratios to average net assets (c): | ||||||||||||||||||||||||
| Net expenses | 1.10 | % | 1.07 | % | 1.08 | % | 1.07 | % | 1.06 | % | 1.06 | % | ||||||||||||
| Gross expenses | 1.10 | % | 1.07 | % | 1.08 | % | 1.07 | % | 1.06 | % | 1.06 | % | ||||||||||||
| Net investment income (loss) | 2.61 | %* | 2.98 | %* | 0.97 | % | 1.84 | % | 1.67 | % | 1.69 | % | ||||||||||||
| Portfolio turnover rate | 18 | % | 34 | % | 38 | % | 37 | % | 36 | % | 31 | % | ||||||||||||
The accompanying notes are an integral part of these financial statements.
Semi-Annual Report 217
| Selected data for a share of capital stock outstanding | Six Months Ended | Year Ended | ||||||||||||||||||||||
| throughout the period | 6/30/22† | 12/31/21 | 12/31/20 | 12/31/19 | 12/31/18 | 12/31/17 | ||||||||||||||||||
| R6 Shares | ||||||||||||||||||||||||
| Net asset value, beginning of period | $ | 17.95 | $ | 19.99 | $ | 18.58 | $ | 15.66 | $ | 19.59 | $ | 16.18 | ||||||||||||
| Income (Loss) from investment operations: | ||||||||||||||||||||||||
| Net investment income (loss) (a) | 0.23 | * | 0.67 | * | 0.21 | 0.38 | 0.36 | 0.31 | ||||||||||||||||
| Net realized and unrealized gain (loss) | (3.35 | ) | 0.50 | 1.41 | 2.93 | (3.05 | ) | 3.38 | ||||||||||||||||
| Total from investment operations | (3.12 | ) | 1.17 | 1.62 | 3.31 | (2.69 | ) | 3.69 | ||||||||||||||||
| Less distributions from: | ||||||||||||||||||||||||
| Net investment income | — | (1.08 | ) | (0.21 | ) | (0.39 | ) | (0.42 | ) | (0.28 | ) | |||||||||||||
| Net realized gains | — | (2.13 | ) | — | — | (0.82 | ) | — | ||||||||||||||||
| Total distributions | — | (3.21 | ) | (0.21 | ) | (0.39 | ) | (1.24 | ) | (0.28 | ) | |||||||||||||
| Net asset value, end of period | $ | 14.83 | $ | 17.95 | $ | 19.99 | $ | 18.58 | $ | 15.66 | $ | 19.59 | ||||||||||||
| Total Return (b) | -17.38 | %* | 6.03 | %* | 8.79 | % | 21.17 | % | -13.62 | %# | 22.85 | % | ||||||||||||
| Ratios and Supplemental Data: | ||||||||||||||||||||||||
| Net assets, end of period (in thousands) | $ | 65,228 | $ | 116,187 | $ | 129,419 | $ | 107,574 | $ | 106,516 | $ | 693,744 | ||||||||||||
| Ratios to average net assets (c): | ||||||||||||||||||||||||
| Net expenses | 0.80 | % | 0.80 | % | 0.81 | % | 0.80 | % | 0.80 | % | 0.80 | % | ||||||||||||
| Gross expenses | 0.85 | % | 0.82 | % | 0.83 | % | 0.82 | % | 0.81 | % | 0.81 | % | ||||||||||||
| Net investment income (loss) | 2.85 | %* | 3.20 | %* | 1.21 | % | 2.19 | % | 1.84 | % | 1.68 | % | ||||||||||||
| Portfolio turnover rate | 18 | % | 34 | % | 38 | % | 37 | % | 36 | % | 31 | % | ||||||||||||
The accompanying notes are an integral part of these financial statements.
218 Semi-Annual Report
| † | Unaudited. |
| * | Includes $0.02 and $0.07 of refunds as a result of European Union dividend withholding tax reclaims filings for the period ended June 30, 2022 and year ended December 31, 2021, respectively. There was a 0.11% impact on the total return of the Portfolio for period ended June 30, 2022 and 0.42% impact to the Institutional and R6 Share Class and a 0.40% impact to the Open Class on the total return of the Portfolio for the year ended December 31, 2021, respectively. There was a 0.27% and 0.31% impact on the net investment income (loss) ratio of the Portfolio for the period ended June 30, 2022 and year ended December 31, 2021, respectively. Refer to Note 2(b) in the Notes to Financial Statements for further information. |
| # | The Portfolio received settlement proceeds from a foreign exchange trading class action lawsuit. The proceeds from the settlement represent a realized gain and were recorded in the period received. There was a 0.16%, 0.16% and 0.33% impact on the total return of the Portfolio’s Institutional, Open and R6 Shares, respectively. |
| (a) | Net investment income (loss) has been computed using the average shares method. |
| (b) | Total returns reflect reinvestment of all dividends and distributions, if any. Certain expenses of the Portfolio may have been waived or reimbursed by the Investment Manager, State Street or DST; without such waiver/reimbursement of expenses, the Portfolio’s returns would have been lower. Returns for a period of less than one year are not annualized. |
| (c) | Annualized for a period of less than one year. |
The accompanying notes are an integral part of these financial statements.
Semi-Annual Report 219
LAZARD INTERNATIONAL EQUITY SELECT PORTFOLIO
| Selected data for a share of capital stock outstanding | Six Months Ended | Year Ended | ||||||||||||||||||||||
| throughout each period | 6/30/22† | 12/31/21 | 12/31/20 | 12/31/19 | 12/31/18 | 12/31/17 | ||||||||||||||||||
| Institutional Shares | ||||||||||||||||||||||||
| Net asset value, beginning of period | $ | 11.51 | $ | 11.53 | $ | 10.75 | $ | 9.13 | $ | 11.02 | $ | 8.65 | ||||||||||||
| Income (Loss) from investment operations: | ||||||||||||||||||||||||
| Net investment income (loss) (a) | 0.13 | 0.31 | 0.11 | 0.23 | 0.18 | 0.13 | ||||||||||||||||||
| Net realized and unrealized gain (loss) | (2.09 | ) | 0.06 | 0.78 | 1.62 | (1.82 | ) | 2.31 | ||||||||||||||||
| Total from investment operations | (1.96 | ) | 0.37 | 0.89 | 1.85 | (1.64 | ) | 2.44 | ||||||||||||||||
| Less distributions from: | ||||||||||||||||||||||||
| Net investment income | — | (0.32 | ) | (0.11 | ) | (0.23 | ) | (0.25 | ) | (0.07 | ) | |||||||||||||
| Net realized gains | — | (0.07 | ) | — | — | — | — | |||||||||||||||||
| Total distributions | — | (0.39 | ) | (0.11 | ) | (0.23 | ) | (0.25 | ) | (0.07 | ) | |||||||||||||
| Net asset value, end of period | $ | 9.55 | $ | 11.51 | $ | 11.53 | $ | 10.75 | $ | 9.13 | $ | 11.02 | ||||||||||||
| Total Return (b) | -17.03 | % | 3.24 | % | 8.33 | % | 20.32 | % | -14.90 | % | 28.31 | % | ||||||||||||
| Ratios and Supplemental Data: | ||||||||||||||||||||||||
| Net assets, end of period (in thousands) | $ | 62,193 | $ | 78,782 | $ | 92,121 | $ | 93,586 | $ | 74,582 | $ | 53,929 | ||||||||||||
| Ratios to average net assets (c): | ||||||||||||||||||||||||
| Net expenses | 0.90 | % | 0.87 | % | 0.90 | % | 0.97 | % | 1.05 | % | 1.05 | % | ||||||||||||
| Gross expenses | 0.94 | % | 0.87 | % | 0.95 | % | 0.99 | % | 1.05 | % | 1.31 | % | ||||||||||||
| Net investment income (loss) | 2.39 | % | 2.60 | % | 1.10 | % | 2.29 | % | 1.73 | % | 1.27 | % | ||||||||||||
| Portfolio turnover rate | 24 | % | 35 | % | 34 | % | 42 | % | 32 | % | 30 | % | ||||||||||||
The accompanying notes are an integral part of these financial statements.
220 Semi-Annual Report
| Selected data for a share of capital stock outstanding | Six Months Ended | Year Ended | ||||||||||||||||||||||
| throughout each period | 6/30/22† | 12/31/21 | 12/31/20 | 12/31/19 | 12/31/18 | 12/31/17 | ||||||||||||||||||
| Open Shares | ||||||||||||||||||||||||
| Net asset value, beginning of period | $ | 11.57 | $ | 11.58 | $ | 10.80 | $ | 9.17 | $ | 11.03 | $ | 8.66 | ||||||||||||
| Income (Loss) from investment operations: | ||||||||||||||||||||||||
| Net investment income (loss) (a) | 0.11 | 0.24 | 0.08 | 0.19 | 0.15 | 0.10 | ||||||||||||||||||
| Net realized and unrealized gain (loss) | (2.10 | ) | 0.11 | 0.78 | 1.64 | (1.82 | ) | 2.31 | ||||||||||||||||
| Total from investment operations | (1.99 | ) | 0.35 | 0.86 | 1.83 | (1.67 | ) | 2.41 | ||||||||||||||||
| Less distributions from: | ||||||||||||||||||||||||
| Net investment income | — | (0.29 | ) | (0.08 | ) | (0.20 | ) | (0.19 | ) | (0.04 | ) | |||||||||||||
| Net realized gains | — | (0.07 | ) | — | — | — | — | |||||||||||||||||
| Total distributions | — | (0.36 | ) | (0.08 | ) | (0.20 | ) | (0.19 | ) | (0.04 | ) | |||||||||||||
| Net asset value, end of period | $ | 9.58 | $ | 11.57 | $ | 11.58 | $ | 10.80 | $ | 9.17 | $ | 11.03 | ||||||||||||
| Total Return (b) | -17.20 | % | 3.03 | % | 8.02 | % | 19.97 | % | -15.16 | % | 27.89 | % | ||||||||||||
| Ratios and Supplemental Data: | ||||||||||||||||||||||||
| Net assets, end of period (in thousands) | $ | 3,131 | $ | 4,166 | $ | 2,868 | $ | 2,502 | $ | 1,502 | $ | 2,831 | ||||||||||||
| Ratios to average net assets (c): | ||||||||||||||||||||||||
| Net expenses | 1.15 | % | 1.15 | % | 1.15 | % | 1.28 | % | 1.35 | % | 1.35 | % | ||||||||||||
| Gross expenses | 1.31 | % | 1.26 | % | 1.38 | % | 1.74 | % | 1.83 | % | 2.07 | % | ||||||||||||
| Net investment income (loss) | 2.15 | % | 2.03 | % | 0.80 | % | 1.87 | % | 1.42 | % | 1.01 | % | ||||||||||||
| Portfolio turnover rate | 24 | % | 35 | % | 34 | % | 42 | % | 32 | % | 30 | % | ||||||||||||
| † | Unaudited. |
| (a) | Net investment income (loss) has been computed using the average shares method. |
| (b) | Total returns reflect reinvestment of all dividends and distributions, if any. Certain expenses of the Portfolio may have been waived or reimbursed by the Investment Manager, State Street or DST; without such waiver/reimbursement of expenses, the Portfolio’s returns would have been lower. Returns for a period of less than one year are not annualized. |
| (c) | Annualized for a period of less than one year. |
The accompanying notes are an integral part of these financial statements.
Semi-Annual Report 221
LAZARD INTERNATIONAL QUALITY GROWTH PORTFOLIO
| Selected data for a share of capital stock outstanding | Six Months Ended | Year Ended | For the Period 12/31/18* to | |||||||||||||||||||||||
| throughout each period | 6/30/22† | 12/31/21 | 12/31/20 | 12/31/19 | 12/31/18 | |||||||||||||||||||||
| Institutional Shares | ||||||||||||||||||||||||||
| Net asset value, beginning of period | $ | 16.80 | $ | 15.59 | $ | 12.69 | $ | 9.98 | $ | 10.00 | ||||||||||||||||
| Income (Loss) from investment operations: | ||||||||||||||||||||||||||
| Net investment income (loss) (a) | 0.09 | 0.07 | 0.03 | 0.08 | — | |||||||||||||||||||||
| Net realized and unrealized gain (loss) | (3.97 | ) | 1.48 | 3.01 | 2.95 | (0.02 | ) | |||||||||||||||||||
| Total from investment operations | (3.88 | ) | 1.55 | 3.04 | 3.03 | (0.02 | ) | |||||||||||||||||||
| Less distributions from: | ||||||||||||||||||||||||||
| Net investment income | — | (0.03 | ) | (0.01 | ) | (0.27 | ) | — | ||||||||||||||||||
| Net realized gains | — | (0.31 | ) | (0.13 | ) | (0.05 | ) | — | ||||||||||||||||||
| Total distributions | — | (0.34 | ) | (0.14 | ) | (0.32 | ) | — | ||||||||||||||||||
| Net asset value, end of period | $ | 12.92 | $ | 16.80 | $ | 15.59 | $ | 12.69 | $ | 9.98 | ||||||||||||||||
| Total Return (b) | -23.10 | % | 9.99 | % | 23.95 | % | 30.32 | % | -0.20 | % | ||||||||||||||||
| Ratios and Supplemental Data: | ||||||||||||||||||||||||||
| Net assets, end of period (in thousands) | $ | 113,980 | $ | 62,468 | $ | 10,473 | $ | 3,958 | $ | 149 | ||||||||||||||||
| Ratios to average net assets (c): | ||||||||||||||||||||||||||
| Net expenses | 0.85 | % | 0.85 | % | 0.85 | % | 0.85 | % | 0.00 | % | ||||||||||||||||
| Gross expenses | 0.99 | % | 1.24 | % | 3.58 | % | 8.16 | % | 8.45 | % | ||||||||||||||||
| Net investment income (loss) | 1.23 | % | 0.44 | % | 0.24 | % | 0.65 | % | 0.00 | % | ||||||||||||||||
| Portfolio turnover rate | 10 | % | 7 | % | 12 | % | 20 | % | 0 | % | ||||||||||||||||
The accompanying notes are an integral part of these financial statements.
222 Semi-Annual Report
| Selected data for a share of capital stock outstanding | Six Months Ended | Year Ended | For the Period 12/31/18* to | |||||||||||||||||||||||
| throughout each period | 6/30/22† | 12/31/21 | 12/31/20 | 12/31/19 | 12/31/18 | |||||||||||||||||||||
| Open Shares | ||||||||||||||||||||||||||
| Net asset value, beginning of period | $ | 16.70 | $ | 15.51 | $ | 12.65 | $ | 10.00 | $ | 10.00 | ||||||||||||||||
| Income (Loss) from investment operations: | ||||||||||||||||||||||||||
| Net investment income (loss) (a) | 0.06 | 0.03 | (0.02 | ) | 0.07 | — | ||||||||||||||||||||
| Net realized and unrealized gain (loss) | (3.93 | ) | 1.47 | 3.01 | 2.90 | — | (d) | |||||||||||||||||||
| Total from investment operations | (3.87 | ) | 1.50 | 2.99 | 2.97 | — | (d) | |||||||||||||||||||
| Less distributions from: | ||||||||||||||||||||||||||
| Net investment income | — | — | — | (0.27 | ) | — | ||||||||||||||||||||
| Net realized gains | — | (0.31 | ) | (0.13 | ) | (0.05 | ) | — | ||||||||||||||||||
| Total distributions | — | (0.31 | ) | (0.13 | ) | (0.32 | ) | — | ||||||||||||||||||
| Net asset value, end of period | $ | 12.83 | $ | 16.70 | $ | 15.51 | $ | 12.65 | $ | 10.00 | ||||||||||||||||
| Total Return (b) | -23.17 | % | 9.69 | % | 23.63 | % | 29.66 | % | 0.00 | % | ||||||||||||||||
| Ratios and Supplemental Data: | ||||||||||||||||||||||||||
| Net assets, end of period (in thousands) | $ | 265 | $ | 333 | $ | 291 | $ | 10 | $ | 1 | ||||||||||||||||
| Ratios to average net assets (c): | ||||||||||||||||||||||||||
| Net expenses | 1.10 | % | 1.10 | % | 1.10 | % | 1.10 | % | 0.00 | % | ||||||||||||||||
| Gross expenses | 2.74 | % | 2.76 | % | 9.57 | % | 142.50 | % | 0.40 | % | ||||||||||||||||
| Net investment income (loss) | 0.81 | % | 0.18 | % | -0.15 | % | 0.60 | % | 0.00 | % | ||||||||||||||||
| Portfolio turnover rate | 10 | % | 7 | % | 12 | % | 20 | % | 0 | % | ||||||||||||||||
| † | Unaudited. |
| * | The Portfolio commenced operations on December 31, 2018. |
| (a) | Net investment income (loss) has been computed using the average shares method. |
| (b) | Total returns reflect reinvestment of all dividends and distributions, if any. Certain expenses of the Portfolio may have been waived or reimbursed by the Investment Manager, State Street or DST; without such waiver/reimbursement of expenses, the Portfolio’s returns would have been lower. Returns for a period of less than one year are not annualized. |
| (c) | Annualized for a period of less than one year except for non-recurring expenses. |
| (d) | Amount is less than $0.01 per share. |
The accompanying notes are an integral part of these financial statements.
Semi-Annual Report 223
LAZARD INTERNATIONAL SMALL CAP EQUITY PORTFOLIO
| Selected data for a share of capital stock outstanding | Six Months Ended | Year Ended | |||||||||||||||||||||||
| throughout each period | 6/30/22† | 12/31/21 | 12/31/20 | 12/31/19 | 12/31/18 | 12/31/17 | |||||||||||||||||||
| Institutional Shares | |||||||||||||||||||||||||
| Net asset value, beginning of period | $ | 10.99 | $ | 13.50 | $ | 12.19 | $ | 9.95 | $ | 13.79 | $ | 10.10 | |||||||||||||
| Income (Loss) from investment operations: | |||||||||||||||||||||||||
| Net investment income (loss) (a) | 0.11 | 0.20 | * | 0.06 | 0.13 | 0.12 | 0.10 | ||||||||||||||||||
| Net realized and unrealized gain (loss) | (3.20 | ) | 1.33 | 1.53 | 2.42 | (3.51 | ) | 3.59 | |||||||||||||||||
| Total from investment operations | (3.09 | ) | 1.53 | 1.59 | 2.55 | (3.39 | ) | 3.69 | |||||||||||||||||
| Less distributions from: | |||||||||||||||||||||||||
| Net investment income | — | (0.56 | ) | (0.28 | ) | (0.05 | ) | (0.27 | ) | — | |||||||||||||||
| Net realized gains | — | (3.48 | ) | — | (0.26 | ) | (0.18 | ) | — | ||||||||||||||||
| Total distributions | — | (4.04 | ) | (0.28 | ) | (0.31 | ) | (0.45 | ) | — | |||||||||||||||
| Net asset value, end of period | $ | 7.90 | $ | 10.99 | $ | 13.50 | $ | 12.19 | $ | 9.95 | $ | 13.79 | |||||||||||||
| Total Return (b) | -28.12 | % | 11.83 | %* | 13.44 | % | 26.01 | % | -24.88 | %# | 36.53 | % | |||||||||||||
| Ratios and Supplemental Data: | |||||||||||||||||||||||||
| Net assets, end of period (in thousands) | $ | 7,616 | $ | 14,542 | $ | 29,374 | $ | 37,677 | $ | 35,121 | $ | 41,267 | |||||||||||||
| Ratios to average net assets (c): | |||||||||||||||||||||||||
| Net expenses | 1.13 | % | 1.12 | % | 1.15 | % | 1.14 | % | 1.08 | % | 1.09 | % | |||||||||||||
| Gross expenses | 1.63 | % | 1.24 | % | 1.29 | % | 1.15 | % | 1.08 | % | 1.09 | % | |||||||||||||
| Net investment income (loss) | 2.22 | % | 1.34 | %* | 0.57 | % | 1.14 | % | 0.96 | % | 0.85 | % | |||||||||||||
| Portfolio turnover rate | 25 | % | 47 | % | 50 | % | 37 | % | 59 | % | 35 | % | |||||||||||||
The accompanying notes are an integral part of these financial statements.
224 Semi-Annual Report
| Selected data for a share of capital stock outstanding | Six Months Ended | Year Ended | |||||||||||||||||||||||
| throughout each period | 6/30/22† | 12/31/21 | 12/31/20 | 12/31/19 | 12/31/18 | 12/31/17 | |||||||||||||||||||
| Open Shares | |||||||||||||||||||||||||
| Net asset value, beginning of period | $ | 11.03 | $ | 13.50 | $ | 12.19 | $ | 9.97 | $ | 13.82 | $ | 10.15 | |||||||||||||
| Income (Loss) from investment operations: | |||||||||||||||||||||||||
| Net investment income (loss) (a) | 0.11 | 0.15 | * | 0.04 | 0.10 | 0.11 | 0.07 | ||||||||||||||||||
| Net realized and unrealized gain (loss) | (3.22 | ) | 1.35 | 1.52 | 2.43 | (3.54 | ) | 3.60 | |||||||||||||||||
| Total from investment operations | (3.11 | ) | 1.50 | 1.56 | 2.53 | (3.43 | ) | 3.67 | |||||||||||||||||
| Less distributions from: | |||||||||||||||||||||||||
| Net investment income | — | (0.49 | ) | (0.25 | ) | (0.05 | ) | (0.24 | ) | — | |||||||||||||||
| Net realized gains | — | (3.48 | ) | — | (0.26 | ) | (0.18 | ) | — | ||||||||||||||||
| Total distributions | — | (3.97 | ) | (0.25 | ) | (0.31 | ) | (0.42 | ) | — | |||||||||||||||
| Net asset value, end of period | $ | 7.92 | $ | 11.03 | $ | 13.50 | $ | 12.19 | $ | 9.97 | $ | 13.82 | |||||||||||||
| Total Return (b) | -28.20 | % | 11.61 | %* | 13.15 | % | 25.76 | % | -25.09 | %# | 36.16 | % | |||||||||||||
| Ratios and Supplemental Data: | |||||||||||||||||||||||||
| Net assets, end of period (in thousands) | $ | 10,472 | $ | 11,969 | $ | 12,581 | $ | 19,780 | $ | 20,265 | $ | 42,362 | |||||||||||||
| Ratios to average net assets (c): | |||||||||||||||||||||||||
| Net expenses | 1.38 | % | 1.37 | % | 1.40 | % | 1.39 | % | 1.34 | % | 1.34 | % | |||||||||||||
| Gross expenses | 1.88 | % | 1.51 | % | 1.56 | % | 1.43 | % | 1.34 | % | 1.34 | % | |||||||||||||
| Net investment income (loss) | 2.34 | % | 1.05 | %* | 0.33 | % | 0.86 | % | 0.83 | % | 0.61 | % | |||||||||||||
| Portfolio turnover rate | 25 | % | 47 | % | 50 | % | 37 | % | 59 | % | 35 | % | |||||||||||||
The accompanying notes are an integral part of these financial statements.
Semi-Annual Report 225
| † | Unaudited. |
| * | Includes $0.03 of refunds received as a result of European Union dividend withholding tax reclaims filings. There was a 0.31% impact on the total return of the Portfolio. There was a 0.17% impact on the net investment income (loss) ratio of the Portfolio. Refer to Note 2(b) in the Notes to Financial Statements for further information. |
| # | The Portfolio received settlement proceeds from a foreign exchange trading class action lawsuit. The proceeds from the settlement represented a realized gain and were recorded in the period received. There was a 0.46% and 0.53% impact on the total return of the Portfolio’s Institutional and Open Shares, respectively. |
| (a) | Net investment income (loss) has been computed using the average shares method. |
| (b) | Total returns reflect reinvestment of all dividends and distributions, if any. Certain expenses of the Portfolio may have been waived or reimbursed by the Investment Manager, State Street or DST; without such waiver/reimbursement of expenses, the Portfolio’s returns would have been lower. Returns for a period of less than one year are not annualized. |
| (c) | Annualized for a period of less than one year. |
The accompanying notes are an integral part of these financial statements.
226 Semi-Annual Report
LAZARD INTERNATIONAL STRATEGIC EQUITY PORTFOLIO
| Selected data for a share of capital stock outstanding | Six Months Ended | Year Ended | |||||||||||||||||||||||
| throughout each period | 6/30/22† | 12/31/21 | 12/31/20 | 12/31/19 | 12/31/18 | 12/31/17 | |||||||||||||||||||
| Institutional Shares | |||||||||||||||||||||||||
| Net asset value, beginning of period | $ | 16.37 | $ | 16.83 | $ | 15.38 | $ | 12.89 | $ | 15.70 | $ | 12.44 | |||||||||||||
| Income (Loss) from investment operations: | |||||||||||||||||||||||||
| Net investment income (loss) (a) | 0.18 | * | 0.56 | * | 0.17 | 0.24 | 0.21 | 0.17 | |||||||||||||||||
| Net realized and unrealized gain (loss) | (3.31 | ) | 0.42 | 1.45 | 2.53 | (1.85 | ) | 3.29 | |||||||||||||||||
| Total from investment operations | (3.13 | ) | 0.98 | 1.62 | 2.77 | (1.64 | ) | 3.46 | |||||||||||||||||
| Less distributions from: | |||||||||||||||||||||||||
| Net investment income | — | (0.62 | ) | (0.17 | ) | (0.28 | ) | (0.21 | ) | (0.20 | ) | ||||||||||||||
| Net realized gains | — | (0.51 | ) | — | — | (0.96 | ) | — | |||||||||||||||||
| Return of capital | — | (0.31 | ) | — | — | — | — | ||||||||||||||||||
| Total distributions | — | (1.44 | ) | (0.17 | ) | (0.28 | ) | (1.17 | ) | (0.20 | ) | ||||||||||||||
| Net asset value, end of period | $ | 13.24 | $ | 16.37 | $ | 16.83 | $ | 15.38 | $ | 12.89 | $ | 15.70 | |||||||||||||
| Total Return (b) | -19.12 | %* | 5.99 | %* | 10.58 | % | 21.55 | % | -10.35 | % | 27.85 | % | |||||||||||||
| Ratios and Supplemental Data: | |||||||||||||||||||||||||
| Net assets, end of period (in thousands) | $ | 4,495,722 | $ | 5,713,405 | $ | 5,270,611 | $ | 5,505,271 | $ | 4,630,334 | $ | 5,911,184 | |||||||||||||
| Ratios to average net assets (c): | |||||||||||||||||||||||||
| Net expenses | 0.81 | % | 0.80 | % | 0.81 | % | 0.80 | % | 0.80 | % | 0.80 | % | |||||||||||||
| Gross expenses | 0.81 | % | 0.80 | % | 0.81 | % | 0.80 | % | 0.80 | % | 0.80 | % | |||||||||||||
| Net investment income (loss) | 2.40 | %* | 3.15 | %* | 1.18 | % | 1.66 | % | 1.36 | % | 1.20 | % | |||||||||||||
| Portfolio turnover rate | 18 | % | 31 | % | 37 | % | 36 | % | 40 | % | 44 | % | |||||||||||||
The accompanying notes are an integral part of these financial statements.
Semi-Annual Report 227
| Selected data for a share of capital stock outstanding | Six Months Ended | Year Ended | |||||||||||||||||||||||
| throughout each period | 6/30/22† | 12/31/21 | 12/31/20 | 12/31/19 | 12/31/18 | 12/31/17 | |||||||||||||||||||
| Open Shares | |||||||||||||||||||||||||
| Net asset value, beginning of period | $ | 16.53 | $ | 16.99 | $ | 15.52 | $ | 13.01 | $ | 15.83 | $ | 12.55 | |||||||||||||
| Income (Loss) from investment operations: | |||||||||||||||||||||||||
| Net investment income (loss) (a) | 0.15 | * | 0.52 | * | 0.14 | 0.21 | 0.17 | 0.14 | |||||||||||||||||
| Net realized and unrealized gain (loss) | (3.32 | ) | 0.42 | 1.46 | 2.55 | (1.86 | ) | 3.30 | |||||||||||||||||
| Total from investment operations | (3.17 | ) | 0.94 | 1.60 | 2.76 | (1.69 | ) | 3.44 | |||||||||||||||||
| Less distributions from: | |||||||||||||||||||||||||
| Net investment income | — | (0.60 | ) | (0.13 | ) | (0.25 | ) | (0.17 | ) | (0.16 | ) | ||||||||||||||
| Net realized gains | — | (0.51 | ) | — | — | (0.96 | ) | — | |||||||||||||||||
| Return of capital | — | (0.29 | ) | — | — | — | — | ||||||||||||||||||
| Total distributions | — | (1.40 | ) | (0.13 | ) | (0.25 | ) | (1.13 | ) | (0.16 | ) | ||||||||||||||
| Net asset value, end of period | $ | 13.36 | $ | 16.53 | $ | 16.99 | $ | 15.52 | $ | 13.01 | $ | 15.83 | |||||||||||||
| Total Return (b) | -19.18 | %* | 5.67 | %* | 10.34 | % | 21.21 | % | -10.55 | % | 27.44 | % | |||||||||||||
| Ratios and Supplemental Data: | |||||||||||||||||||||||||
| Net assets, end of period (in thousands) | $ | 320,867 | $ | 460,862 | $ | 535,285 | $ | 682,035 | $ | 832,548 | $ | 1,216,861 | |||||||||||||
| Ratios to average net assets (c): | |||||||||||||||||||||||||
| Net expenses | 1.07 | % | 1.06 | % | 1.06 | % | 1.06 | % | 1.05 | % | 1.06 | % | |||||||||||||
| Gross expenses | 1.07 | % | 1.06 | % | 1.06 | % | 1.06 | % | 1.05 | % | 1.06 | % | |||||||||||||
| Net investment income (loss) | 2.05 | %* | 2.88 | %* | 0.94 | % | 1.47 | % | 1.10 | % | 0.97 | % | |||||||||||||
| Portfolio turnover rate | 18 | % | 31 | % | 37 | % | 36 | % | 40 | % | 44 | % | |||||||||||||
The accompanying notes are an integral part of these financial statements.
228 Semi-Annual Report
| Selected data for a share of capital stock outstanding | Six Months Ended | Year Ended | |||||||||||||||||||||||
| throughout each period | 6/30/22† | 12/31/21 | 12/31/20 | 12/31/19 | 12/31/18 | 12/31/17 | |||||||||||||||||||
| R6 Shares | |||||||||||||||||||||||||
| Net asset value, beginning of period | $ | 16.38 | $ | 16.85 | $ | 15.39 | $ | 12.90 | $ | 15.71 | $ | 12.45 | |||||||||||||
| Income (Loss) from investment operations: | |||||||||||||||||||||||||
| Net investment income (loss) (a) | 0.18 | * | 0.56 | * | 0.17 | 0.23 | 0.21 | 0.16 | |||||||||||||||||
| Net realized and unrealized gain (loss) | (3.31 | ) | 0.41 | 1.46 | 2.54 | (1.85 | ) | 3.30 | |||||||||||||||||
| Total from investment operations | (3.13 | ) | 0.97 | 1.63 | 2.77 | (1.64 | ) | 3.46 | |||||||||||||||||
| Less distributions from: | |||||||||||||||||||||||||
| Net investment income | — | (0.62 | ) | (0.17 | ) | (0.28 | ) | (0.21 | ) | (0.20 | ) | ||||||||||||||
| Net realized gains | — | (0.51 | ) | — | — | (0.96 | ) | — | |||||||||||||||||
| Return of capital | — | (0.31 | ) | — | — | — | — | ||||||||||||||||||
| Total distributions | — | (1.44 | ) | (0.17 | ) | (0.28 | ) | (1.17 | ) | (0.20 | ) | ||||||||||||||
| Net asset value, end of period | $ | 13.25 | $ | 16.38 | $ | 16.85 | $ | 15.39 | $ | 12.90 | $ | 15.71 | |||||||||||||
| Total Return (b) | -19.11 | %* | 5.93 | %* | 10.64 | % | 21.54 | % | -10.35 | % | 27.82 | % | |||||||||||||
| Ratios and Supplemental Data: | |||||||||||||||||||||||||
| Net assets, end of period (in thousands) | $ | 98,175 | $ | 124,625 | $ | 118,678 | $ | 120,118 | $ | 97,394 | $ | 110,383 | |||||||||||||
| Ratios to average net assets (c): | |||||||||||||||||||||||||
| Net expenses | 0.81 | % | 0.80 | % | 0.81 | % | 0.80 | % | 0.80 | % | 0.80 | % | |||||||||||||
| Gross expenses | 0.82 | % | 0.81 | % | 0.82 | % | 0.81 | % | 0.81 | % | 0.82 | % | |||||||||||||
| Net investment income (loss) | 2.39 | %* | 3.16 | %* | 1.16 | % | 1.61 | % | 1.34 | % | 1.15 | % | |||||||||||||
| Portfolio turnover rate | 18 | % | 31 | % | 37 | % | 36 | % | 40 | % | 44 | % | |||||||||||||
The accompanying notes are an integral part of these financial statements.
Semi-Annual Report 229
| † | Unaudited. |
| * | Includes $0.02 and $0.06 of refunds received as a result of European Union dividend withholding tax reclaims filings for the period ended June 30, 2022 and year ended December 31, 2021, respectively. There was a 0.12% impact on the total return of the Portfolio for period ended June 30, 2022 and 0.39% impact to the Institutional Share Class and R6 Share Class and a 0.38% impact to the Open Share Class on the total return of the Portfolio for the year ended December 31, 2021. There was a 0.30% and 0.33% impact on the net investment income (loss) ratio of the Portfolio for the period ended June 30, 2022 and year ended December 31, 2021, respectively. Refer to Note 2(b) in the Notes to Financial Statements for further information. |
| (a) | Net investment income (loss) has been computed using the average shares method. |
| (b) | Total returns reflect reinvestment of all dividends and distributions, if any. Certain expenses of the Portfolio may have been waived or reimbursed by the Investment Manager, State Street or DST; without such waiver/reimbursement of expenses, the Portfolio’s returns would have been lower. Returns for a period of less than one year are not annualized. |
| (c) | Annualized for a period of less than one year. |
The accompanying notes are an integral part of these financial statements.
230 Semi-Annual Report
LAZARD MANAGED EQUITY VOLATILITY PORTFOLIO
| Selected data for a share of capital stock outstanding | Six Months Ended | Year Ended | |||||||||||||||||||||||
| throughout each period | 6/30/22† | 12/31/21 | 12/31/20 | 12/31/19 | 12/31/18 | 12/31/17 | |||||||||||||||||||
| Institutional Shares | |||||||||||||||||||||||||
| Net asset value, beginning of period | $ | 13.17 | $ | 11.78 | $ | 12.66 | $ | 10.55 | $ | 11.57 | $ | 9.99 | |||||||||||||
| Income (Loss) from investment operations: | |||||||||||||||||||||||||
| Net investment income (loss) (a) | 0.13 | 0.21 | 0.21 | 0.21 | 0.19 | 0.19 | |||||||||||||||||||
| Net realized and unrealized gain (loss) | (1.47 | ) | 2.01 | (0.87 | ) | 2.08 | (1.03 | ) | 1.87 | ||||||||||||||||
| Total from investment operations | (1.34 | ) | 2.22 | (0.66 | ) | 2.29 | (0.84 | ) | 2.06 | ||||||||||||||||
| Less distributions from: | |||||||||||||||||||||||||
| Net investment income | — | (0.39 | ) | (0.09 | ) | (0.18 | ) | (0.16 | ) | (0.17 | ) | ||||||||||||||
| Net realized gains | — | (0.44 | ) | (0.13 | ) | — | (b) | (0.02 | ) | (0.31 | ) | ||||||||||||||
| Total distributions | — | (0.83 | ) | (0.22 | ) | (0.18 | ) | (0.18 | ) | (0.48 | ) | ||||||||||||||
| Net asset value, end of period | $ | 11.83 | $ | 13.17 | $ | 11.78 | $ | 12.66 | $ | 10.55 | $ | 11.57 | |||||||||||||
| Total Return (c) | -10.17 | % | 19.00 | % | -5.18 | % | 21.69 | % | -7.21 | % | 20.57 | % | |||||||||||||
| Ratios and Supplemental Data: | |||||||||||||||||||||||||
| Net assets, end of period (in thousands) | $ | 28,667 | $ | 31,040 | $ | 25,737 | $ | 34,354 | $ | 20,709 | $ | 4,180 | |||||||||||||
| Ratios to average net assets (d): | |||||||||||||||||||||||||
| Net expenses | 0.75 | % | 0.75 | % | 0.75 | % | 0.75 | % | 0.75 | % | 0.75 | % | |||||||||||||
| Gross expenses | 1.26 | % | 1.20 | % | 1.23 | % | 1.36 | % | 1.64 | % | 6.51 | % | |||||||||||||
| Net investment income (loss) | 2.06 | % | 1.62 | % | 1.83 | % | 1.72 | % | 1.66 | % | 1.71 | % | |||||||||||||
| Portfolio turnover rate | 51 | % | 110 | % | 138 | % | 103 | % | 122 | % | 87 | % | |||||||||||||
The accompanying notes are an integral part of these financial statements.
Semi-Annual Report 231
| Selected data for a share of capital stock outstanding | Six Months Ended | Year Ended | |||||||||||||||||||||||
| throughout each period | 6/30/22† | 12/31/21 | 12/31/20 | 12/31/19 | 12/31/18 | 12/31/17 | |||||||||||||||||||
| Open Shares | |||||||||||||||||||||||||
| Net asset value, beginning of period | $ | 13.16 | $ | 11.78 | $ | 12.65 | $ | 10.54 | $ | 11.56 | $ | 9.99 | |||||||||||||
| Income (Loss) from investment operations: | |||||||||||||||||||||||||
| Net investment income (loss) (a) | 0.11 | 0.18 | 0.19 | 0.17 | 0.15 | 0.16 | |||||||||||||||||||
| Net realized and unrealized gain (loss) | (1.46 | ) | 2.00 | (0.87 | ) | 2.08 | (1.02 | ) | 1.85 | ||||||||||||||||
| Total from investment operations | (1.35 | ) | 2.18 | (0.68 | ) | 2.25 | (0.87 | ) | 2.01 | ||||||||||||||||
| Less distributions from: | |||||||||||||||||||||||||
| Net investment income | — | (0.36 | ) | (0.06 | ) | (0.14 | ) | (0.13 | ) | (0.13 | ) | ||||||||||||||
| Net realized gains | — | (0.44 | ) | (0.13 | ) | — | (b) | (0.02 | ) | (0.31 | ) | ||||||||||||||
| Total distributions | — | (0.80 | ) | (0.19 | ) | (0.14 | ) | (0.15 | ) | (0.44 | ) | ||||||||||||||
| Net asset value, end of period | $ | 11.81 | $ | 13.16 | $ | 11.78 | $ | 12.65 | $ | 10.54 | $ | 11.56 | |||||||||||||
| Total Return (c) | -10.26 | % | 18.62 | % | -5.34 | % | 21.36 | % | -7.50 | % | 20.11 | % | |||||||||||||
| Ratios and Supplemental Data: | |||||||||||||||||||||||||
| Net assets, end of period (in thousands) | $ | 78 | $ | 87 | $ | 76 | $ | 231 | $ | 183 | $ | 315 | |||||||||||||
| Ratios to average net assets (d): | |||||||||||||||||||||||||
| Net expenses | 1.00 | % | 1.00 | % | 1.00 | % | 1.03 | % | 1.05 | % | 1.05 | % | |||||||||||||
| Gross expenses | 6.92 | % | 6.85 | % | 4.39 | % | 5.81 | % | 5.86 | % | 12.07 | % | |||||||||||||
| Net investment income (loss) | 1.81 | % | 1.39 | % | 1.63 | % | 1.46 | % | 1.28 | % | 1.42 | % | |||||||||||||
| Portfolio turnover rate | 51 | % | 110 | % | 138 | % | 103 | % | 122 | % | 87 | % | |||||||||||||
| † | Unaudited. |
| (a) | Net investment income (loss) has been computed using the average shares method. |
| (b) | Amount is less than $0.01 per share. |
| (c) | Total returns reflect reinvestment of all dividends and distributions, if any. Certain expenses of the Portfolio may have been waived or reimbursed by the Investment Manager, State Street or DST; without such waiver/reimbursement of expenses, the Portfolio’s returns would have been lower. Returns for a period of less than one year are not annualized. |
| (d) | Annualized for a period of less than one year. |
The accompanying notes are an integral part of these financial statements.
232 Semi-Annual Report
LAZARD US EQUITY CONCENTRATED PORTFOLIO
| Selected data for a share of capital stock | Six Months | ||||||||||||||||||||||||
| outstanding | Ended | Year Ended | |||||||||||||||||||||||
| throughout each period | 6/30/22† | 12/31/21 | 12/31/20 | 12/31/19 | 12/31/18 | 12/31/17 | |||||||||||||||||||
| Institutional Shares | |||||||||||||||||||||||||
| Net asset value, beginning of period | $ | 19.70 | $ | 18.05 | $ | 16.84 | $ | 12.89 | $ | 15.31 | $ | 14.16 | |||||||||||||
| Income (Loss) from investment operations: | |||||||||||||||||||||||||
| Net investment income (loss) (a) | 0.05 | 0.08 | 0.12 | 0.13 | 0.18 | 0.14 | |||||||||||||||||||
| Net realized and unrealized gain (loss) | (3.80 | ) | 4.55 | 1.39 | 3.96 | (1.11 | ) | 2.05 | |||||||||||||||||
| Total from investment operations | (3.75 | ) | 4.63 | 1.51 | 4.09 | (0.93 | ) | 2.19 | |||||||||||||||||
| Less distributions from: | |||||||||||||||||||||||||
| Net investment income | — | (0.08 | ) | (0.11 | ) | (0.14 | ) | (0.20 | ) | (0.14 | ) | ||||||||||||||
| Net realized gains | — | (2.90 | ) | (0.19 | ) | — | (1.29 | ) | (0.90 | ) | |||||||||||||||
| Total distributions | — | (2.98 | ) | (0.30 | ) | (0.14 | ) | (1.49 | ) | (1.04 | ) | ||||||||||||||
| Net asset value, end of period | $ | 15.95 | $ | 19.70 | $ | 18.05 | $ | 16.84 | $ | 12.89 | $ | 15.31 | |||||||||||||
| Total Return (b) | -19.04 | % | 26.02 | % | 8.98 | % | 31.72 | % | -6.07 | % | 15.49 | % | |||||||||||||
| Ratios and Supplemental Data: | |||||||||||||||||||||||||
| Net assets, end of period (in thousands) | $ | 1,394,033 | $ | 1,943,232 | $ | 1,936,367 | $ | 1,271,509 | $ | 1,040,851 | $ | 1,508,581 | |||||||||||||
| Ratios to average net assets (c): | |||||||||||||||||||||||||
| Net expenses | 0.77 | % | 0.76 | % | 0.76 | % | 0.76 | % | 0.75 | % | 0.75 | % | |||||||||||||
| Gross expenses | 0.77 | % | 0.76 | % | 0.76 | % | 0.76 | % | 0.75 | % | 0.75 | % | |||||||||||||
| Net investment income (loss) | 0.59 | % | 0.38 | % | 0.72 | % | 0.85 | % | 1.14 | % | 0.90 | % | |||||||||||||
| Portfolio turnover rate | 23 | % | 32 | % | 43 | % | 33 | % | 69 | % | 86 | % | |||||||||||||
The accompanying notes are an integral part of these financial statements.
Semi-Annual Report 233
| Selected data for a share of capital stock outstanding | Six Months Ended | Year Ended | |||||||||||||||||||||||
| throughout each period | 6/30/22† | 12/31/21 | 12/31/20 | 12/31/19 | 12/31/18 | 12/31/17 | |||||||||||||||||||
| Open Shares | |||||||||||||||||||||||||
| Net asset value, beginning of period | $ | 19.88 | $ | 18.19 | $ | 16.98 | $ | 12.99 | $ | 15.42 | $ | 14.25 | |||||||||||||
| Income (Loss) from investment operations: | |||||||||||||||||||||||||
| Net investment income (loss) (a) | 0.03 | 0.03 | 0.08 | 0.09 | 0.13 | 0.10 | |||||||||||||||||||
| Net realized and unrealized gain (loss) | (3.84 | ) | 4.58 | 1.38 | 3.99 | (1.11 | ) | 2.07 | |||||||||||||||||
| Total from investment operations | (3.81 | ) | 4.61 | 1.46 | 4.08 | (0.98 | ) | 2.17 | |||||||||||||||||
| Less distributions from: | |||||||||||||||||||||||||
| Net investment income | — | (0.02 | ) | (0.06 | ) | (0.09 | ) | (0.16 | ) | (0.10 | ) | ||||||||||||||
| Net realized gains | — | (2.90 | ) | (0.19 | ) | — | (1.29 | ) | (0.90 | ) | |||||||||||||||
| Total distributions | — | (2.92 | ) | (0.25 | ) | (0.09 | ) | (1.45 | ) | (1.00 | ) | ||||||||||||||
| Net asset value, end of period | $ | 16.07 | $ | 19.88 | $ | 18.19 | $ | 16.98 | $ | 12.99 | $ | 15.42 | |||||||||||||
| Total Return (b) | -19.16 | % | 25.72 | % | 8.63 | % | 31.42 | % | -6.35 | % | 15.22 | % | |||||||||||||
| Ratios and Supplemental Data: | |||||||||||||||||||||||||
| Net assets, end of period (in thousands) | $ | 26,726 | $ | 35,649 | $ | 34,358 | $ | 46,840 | $ | 50,981 | $ | 87,603 | |||||||||||||
| Ratios to average net assets (c): | |||||||||||||||||||||||||
| Net expenses | 1.04 | % | 1.02 | % | 1.02 | % | 1.04 | % | 1.03 | % | 1.03 | % | |||||||||||||
| Gross expenses | 1.04 | % | 1.02 | % | 1.02 | % | 1.04 | % | 1.03 | % | 1.03 | % | |||||||||||||
| Net investment income (loss) | 0.33 | % | 0.13 | % | 0.47 | % | 0.55 | % | 0.85 | % | 0.62 | % | |||||||||||||
| Portfolio turnover rate | 23 | % | 32 | % | 43 | % | 33 | % | 69 | % | 86 | % | |||||||||||||
The accompanying notes are an integral part of these financial statements.
234 Semi-Annual Report
| Selected data for a share of capital stock outstanding | Six Months Ended | Year Ended | |||||||||||||||||||||||
| throughout each period | 6/30/22† | 12/31/21 | 12/31/20 | 12/31/19 | 12/31/18 | 12/31/17 | |||||||||||||||||||
| R6 Shares | |||||||||||||||||||||||||
| Net asset value, beginning of period | $ | 19.76 | $ | 18.09 | $ | 16.89 | $ | 12.92 | $ | 15.34 | $ | 14.18 | |||||||||||||
| Income (Loss) from investment operations: | |||||||||||||||||||||||||
| Net investment income (loss) (a) | 0.05 | 0.08 | 0.12 | 0.13 | 0.17 | 0.14 | |||||||||||||||||||
| Net realized and unrealized gain (loss) | (3.82 | ) | 4.56 | 1.38 | 3.98 | (1.10 | ) | 2.06 | |||||||||||||||||
| Total from investment operations | (3.77 | ) | 4.64 | 1.50 | 4.11 | (0.93 | ) | 2.20 | |||||||||||||||||
| Less distributions from: | |||||||||||||||||||||||||
| Net investment income | — | (0.07 | ) | (0.11 | ) | (0.14 | ) | (0.20 | ) | (0.14 | ) | ||||||||||||||
| Net realized gains | — | (2.90 | ) | (0.19 | ) | — | (1.29 | ) | (0.90 | ) | |||||||||||||||
| Total distributions | — | (2.97 | ) | (0.30 | ) | (0.14 | ) | (1.49 | ) | (1.04 | ) | ||||||||||||||
| Net asset value, end of period | $ | 15.99 | $ | 19.76 | $ | 18.09 | $ | 16.89 | $ | 12.92 | $ | 15.34 | |||||||||||||
| Total Return (b) | -19.08 | % | 26.06 | % | 8.90 | % | 31.79 | % | -6.08 | % | 15.52 | % | |||||||||||||
| Ratios and Supplemental Data: | |||||||||||||||||||||||||
| Net assets, end of period (in thousands) | $ | 2,206 | $ | 2,720 | $ | 2,177 | $ | 2,091 | $ | 1,900 | $ | 361 | |||||||||||||
| Ratios to average net assets (c): | |||||||||||||||||||||||||
| Net expenses | 0.78 | % | 0.76 | % | 0.76 | % | 0.76 | % | 0.75 | % | 0.75 | % | |||||||||||||
| Gross expenses | 0.90 | % | 0.87 | % | 0.92 | % | 1.20 | % | 2.16 | % | 8.34 | % | |||||||||||||
| Net investment income (loss) | 0.60 | % | 0.40 | % | 0.73 | % | 0.83 | % | 1.15 | % | 0.91 | % | |||||||||||||
| Portfolio turnover rate | 23 | % | 32 | % | 43 | % | 33 | % | 69 | % | 86 | % | |||||||||||||
| † | Unaudited. |
| (a) | Net investment income (loss) has been computed using the average shares method. |
| (b) | Total returns reflect reinvestment of all dividends and distributions, if any. Certain expenses of the Portfolio may have been waived or reimbursed by the Investment Manager, State Street or DST; without such waiver/reimbursement of expenses, the Portfolio’s returns would have been lower. Returns for a period of less than one year are not annualized. |
| (c) | Annualized for a period of less than one year except for non-recurring expenses. |
The accompanying notes are an integral part of these financial statements.
Semi-Annual Report 235
LAZARD US EQUITY FOCUS PORTFOLIO
| Selected data for a share of capital stock outstanding | Six Months Ended | Year Ended | |||||||||||||||||||||||
| throughout each period | 6/30/22† | 12/31/21 | 12/31/20 | 12/31/19 | 12/31/18 | 12/31/17 | |||||||||||||||||||
| Institutional Shares | |||||||||||||||||||||||||
| Net asset value, beginning of period | $ | 16.07 | $ | 13.37 | $ | 12.03 | $ | 10.23 | $ | 12.43 | $ | 11.63 | |||||||||||||
| Income (Loss) from investment operations: | |||||||||||||||||||||||||
| Net investment income (loss) (a) | 0.05 | 0.08 | 0.11 | 0.13 | 0.14 | 0.14 | |||||||||||||||||||
| Net realized and unrealized gain (loss) | (2.96 | ) | 3.54 | 1.94 | 3.11 | (0.55 | ) | 1.94 | |||||||||||||||||
| Total from investment operations | (2.91 | ) | 3.62 | 2.05 | 3.24 | (0.41 | ) | 2.08 | |||||||||||||||||
| Less distributions from: | |||||||||||||||||||||||||
| Net investment income | — | (0.05 | ) | (0.10 | ) | (0.23 | ) | (0.29 | ) | (0.21 | ) | ||||||||||||||
| Net realized gains | — | (0.87 | ) | (0.61 | ) | (1.21 | ) | (1.50 | ) | (1.07 | ) | ||||||||||||||
| Total distributions | — | (0.92 | ) | (0.71 | ) | (1.44 | ) | (1.79 | ) | (1.28 | ) | ||||||||||||||
| Net asset value, end of period | $ | 13.16 | $ | 16.07 | $ | 13.37 | $ | 12.03 | $ | 10.23 | $ | 12.43 | |||||||||||||
| Total Return (b) | -18.11 | % | 27.36 | % | 17.29 | % | 31.67 | % | -3.12 | % | 18.17 | % | |||||||||||||
| Ratios and Supplemental Data: | |||||||||||||||||||||||||
| Net assets, end of period (in thousands) | $ | 36,605 | $ | 42,755 | $ | 31,075 | $ | 32,661 | $ | 60,629 | $ | 72,958 | |||||||||||||
| Ratios to average net assets (c): | |||||||||||||||||||||||||
| Net expenses | 0.70 | % | 0.70 | % | 0.70 | % | 0.75 | % | 0.75 | % | 0.75 | % | |||||||||||||
| Gross expenses | 0.80 | % | 0.76 | % | 1.26 | % | 0.92 | % | 0.92 | % | 0.95 | % | |||||||||||||
| Net investment income (loss) | 0.70 | % | 0.54 | % | 0.91 | % | 1.07 | % | 1.10 | % | 1.10 | % | |||||||||||||
| Portfolio turnover rate | 16 | % | 27 | % | 54 | % | 45 | % | 62 | % | 74 | % | |||||||||||||
The accompanying notes are an integral part of these financial statements.
236 Semi-Annual Report
| Selected data for a share of capital stock outstanding | Six Months Ended | Year Ended | |||||||||||||||||||||||
| throughout each period | 6/30/22† | 12/31/21 | 12/31/20 | 12/31/19 | 12/31/18 | 12/31/17 | |||||||||||||||||||
| Open Shares | |||||||||||||||||||||||||
| Net asset value, beginning of period | $ | 16.16 | $ | 13.45 | $ | 12.09 | $ | 10.28 | $ | 12.48 | $ | 11.68 | |||||||||||||
| Income (Loss) from investment operations: | |||||||||||||||||||||||||
| Net investment income (loss) (a) | 0.03 | 0.04 | 0.08 | 0.10 | 0.10 | 0.10 | |||||||||||||||||||
| Net realized and unrealized gain (loss) | (2.98 | ) | 3.55 | 1.96 | 3.11 | (0.54 | ) | 1.94 | |||||||||||||||||
| Total from investment operations | (2.95 | ) | 3.59 | 2.04 | 3.21 | (0.44 | ) | 2.04 | |||||||||||||||||
| Less distributions from: | |||||||||||||||||||||||||
| Net investment income | — | (0.01 | ) | (0.07 | ) | (0.19 | ) | (0.26 | ) | (0.17 | ) | ||||||||||||||
| Net realized gains | — | (0.87 | ) | (0.61 | ) | (1.21 | ) | (1.50 | ) | (1.07 | ) | ||||||||||||||
| Total distributions | — | (0.88 | ) | (0.68 | ) | (1.40 | ) | (1.76 | ) | (1.24 | ) | ||||||||||||||
| Net asset value, end of period | $ | 13.21 | $ | 16.16 | $ | 13.45 | $ | 12.09 | $ | 10.28 | $ | 12.48 | |||||||||||||
| Total Return (b) | -18.25 | % | 26.96 | % | 17.08 | % | 31.25 | % | -3.40 | % | 17.75 | % | |||||||||||||
| Ratios and Supplemental Data: | |||||||||||||||||||||||||
| Net assets, end of period (in thousands) | $ | 1,262 | $ | 1,569 | $ | 1,285 | $ | 1,117 | $ | 881 | $ | 1,013 | |||||||||||||
| Ratios to average net assets (c): | |||||||||||||||||||||||||
| Net expenses | 0.95 | % | 0.95 | % | 0.95 | % | 1.03 | % | 1.05 | % | 1.05 | % | |||||||||||||
| Gross expenses | 1.28 | % | 1.22 | % | 1.79 | % | 2.14 | % | 2.33 | % | 2.30 | % | |||||||||||||
| Net investment income (loss) | 0.44 | % | 0.29 | % | 0.67 | % | 0.79 | % | 0.80 | % | 0.79 | % | |||||||||||||
| Portfolio turnover rate | 16 | % | 27 | % | 54 | % | 45 | % | 62 | % | 74 | % | |||||||||||||
The accompanying notes are an integral part of these financial statements.
Semi-Annual Report 237
| Selected data for a share of capital stock outstanding | Six Months Ended | Year Ended | |||||||||||||||||||||||
| throughout each period | 6/30/22† | 12/31/21 | 12/31/20 | 12/31/19 | 12/31/18 | 12/31/17 | |||||||||||||||||||
| R6 Shares | |||||||||||||||||||||||||
| Net asset value, beginning of period | $ | 16.08 | $ | 13.38 | $ | 12.04 | $ | 10.23 | $ | 12.43 | $ | 11.63 | |||||||||||||
| Income (Loss) from investment operations: | |||||||||||||||||||||||||
| Net investment income (loss) (a) | 0.05 | 0.08 | 0.11 | 0.13 | 0.14 | 0.14 | |||||||||||||||||||
| Net realized and unrealized gain (loss) | (2.97 | ) | 3.54 | 1.94 | 3.12 | (0.55 | ) | 1.94 | |||||||||||||||||
| Total from investment operations | (2.92 | ) | 3.62 | 2.05 | 3.25 | (0.41 | ) | 2.08 | |||||||||||||||||
| Less distributions from: | |||||||||||||||||||||||||
| Net investment income | — | (0.05 | ) | (0.10 | ) | (0.23 | ) | (0.29 | ) | (0.21 | ) | ||||||||||||||
| Net realized gains | — | (0.87 | ) | (0.61 | ) | (1.21 | ) | (1.50 | ) | (1.07 | ) | ||||||||||||||
| Total distributions | — | (0.92 | ) | (0.71 | ) | (1.44 | ) | (1.79 | ) | (1.28 | ) | ||||||||||||||
| Net asset value, end of period | $ | 13.16 | $ | 16.08 | $ | 13.38 | $ | 12.04 | $ | 10.23 | $ | 12.43 | |||||||||||||
| Total Return (b) | -18.16 | % | 27.34 | % | 17.28 | % | 31.76 | % | -3.13 | % | 18.16 | % | |||||||||||||
| Ratios and Supplemental Data: | |||||||||||||||||||||||||
| Net assets, end of period (in thousands) | $ | 36,501 | $ | 36,066 | $ | 20,747 | $ | 10,609 | $ | 10,056 | $ | 11,394 | |||||||||||||
| Ratios to average net assets (c): | |||||||||||||||||||||||||
| Net expenses | 0.70 | % | 0.70 | % | 0.70 | % | 0.74 | % | 0.75 | % | 0.75 | % | |||||||||||||
| Gross expenses | 0.80 | % | 0.76 | % | 1.27 | % | 1.00 | % | 1.01 | % | 1.05 | % | |||||||||||||
| Net investment income (loss) | 0.71 | % | 0.52 | % | 0.91 | % | 1.09 | % | 1.10 | % | 1.12 | % | |||||||||||||
| Portfolio turnover rate | 16 | % | 27 | % | 54 | % | 45 | % | 62 | % | 74 | % | |||||||||||||
| † | Unaudited. |
| (a) | Net investment income (loss) has been computed using the average shares method. |
| (b) | Total returns reflect reinvestment of all dividends and distributions, if any. Certain expenses of the Portfolio may have been waived or reimbursed by the Investment Manager, State Street or DST; without such waiver/reimbursement of expenses, the Portfolio’s returns would have been lower. Returns for a period of less than one year are not annualized. |
| (c) | Annualized for a period of less than one year. |
The accompanying notes are an integral part of these financial statements.
238 Semi-Annual Report
LAZARD US SMALL-MID CAP EQUITY PORTFOLIO
| Selected data for a share of capital stock outstanding | Six Months Ended | Year Ended | ||||||||||||||||||||||||
| throughout each period | 6/30/22† | 12/31/21 | 12/31/20 | 12/31/19 | 12/31/18 | 12/31/17 | ||||||||||||||||||||
| Institutional Shares | ||||||||||||||||||||||||||
| Net asset value, beginning of period | $ | 14.97 | $ | 14.42 | $ | 13.64 | $ | 10.83 | $ | 14.65 | $ | 14.50 | ||||||||||||||
| Income (Loss) from investment operations: | ||||||||||||||||||||||||||
| Net investment income (loss) (a) | — | 0.01 | 0.04 | 0.06 | 0.05 | 0.06 | ||||||||||||||||||||
| Net realized and unrealized gain (loss) | (2.89 | ) | 2.81 | 0.82 | 3.19 | (2.00 | ) | 1.95 | ||||||||||||||||||
| Total from investment operations | (2.89 | ) | 2.82 | 0.86 | 3.25 | (1.95 | ) | 2.01 | ||||||||||||||||||
| Less distributions from: | ||||||||||||||||||||||||||
| Net investment income | — | (0.03 | ) | (0.02 | ) | (0.03 | ) | (0.04 | ) | (0.09 | ) | |||||||||||||||
| Net realized gains | — | (2.24 | ) | (0.06 | ) | (0.41 | ) | (1.83 | ) | (1.77 | ) | |||||||||||||||
| Total distributions | — | (2.27 | ) | (0.08 | ) | (0.44 | ) | (1.87 | ) | (1.86 | ) | |||||||||||||||
| Net asset value, end of period | $ | 12.08 | $ | 14.97 | $ | 14.42 | $ | 13.64 | $ | 10.83 | $ | 14.65 | ||||||||||||||
| Total Return (b) | -19.31 | % | 19.91 | % | 6.44 | % | 30.00 | % | -13.27 | % | 14.12 | % | ||||||||||||||
| Ratios and Supplemental Data: | ||||||||||||||||||||||||||
| Net assets, end of period (in thousands) | $ | 61,938 | $ | 94,517 | $ | 91,984 | $ | 108,112 | $ | 113,677 | $ | 176,975 | ||||||||||||||
| Ratios to average net assets (c): | ||||||||||||||||||||||||||
| Net expenses | 1.01 | % | 0.94 | % | 0.98 | % | 0.92 | % | 0.87 | % | 0.87 | % | ||||||||||||||
| Gross expenses | 1.01 | % | 0.94 | % | 0.98 | % | 0.92 | % | 0.87 | % | 0.87 | % | ||||||||||||||
| Net investment income (loss) | -0.02 | % | 0.05 | % | 0.31 | % | 0.46 | % | 0.35 | % | 0.39 | % | ||||||||||||||
| Portfolio turnover rate | 22 | % | 66 | % | 80 | % | 90 | % | 81 | % | 79 | % | ||||||||||||||
The accompanying notes are an integral part of these financial statements.
Semi-Annual Report 239
| Selected data for a share of capital stock outstanding | Six Months Ended | Year Ended | ||||||||||||||||||||||||
| throughout each period | 6/30/22† | 12/31/21 | 12/31/20 | 12/31/19 | 12/31/18 | 12/31/17 | ||||||||||||||||||||
| Open Shares | ||||||||||||||||||||||||||
| Net asset value, beginning of period | $ | 13.56 | $ | 13.25 | $ | 12.58 | $ | 10.03 | $ | 13.72 | $ | 13.68 | ||||||||||||||
| Income (Loss) from investment operations: | ||||||||||||||||||||||||||
| Net investment income (loss) (a) | (0.02 | ) | (0.04 | ) | — | (d) | 0.01 | 0.01 | 0.01 | |||||||||||||||||
| Net realized and unrealized gain (loss) | (2.62 | ) | 2.59 | 0.75 | 2.95 | (1.87 | ) | 1.84 | ||||||||||||||||||
| Total from investment operations | (2.64 | ) | 2.55 | 0.75 | 2.96 | (1.86 | ) | 1.85 | ||||||||||||||||||
| Less distributions from: | ||||||||||||||||||||||||||
| Net investment income | — | — | (d) | (0.02 | ) | — | — | (d) | (0.04 | ) | ||||||||||||||||
| Net realized gains | — | (2.24 | ) | (0.06 | ) | (0.41 | ) | (1.83 | ) | (1.77 | ) | |||||||||||||||
| Total distributions | — | (2.24 | ) | (0.08 | ) | (0.41 | ) | (1.83 | ) | (1.81 | ) | |||||||||||||||
| Net asset value, end of period | $ | 10.92 | $ | 13.56 | $ | 13.25 | $ | 12.58 | $ | 10.03 | $ | 13.72 | ||||||||||||||
| Total Return (b) | -19.47 | % | 19.59 | % | 6.10 | % | 29.51 | % | -13.49 | % | 13.82 | % | ||||||||||||||
| Ratios and Supplemental Data: | ||||||||||||||||||||||||||
| Net assets, end of period (in thousands) | $ | 8,106 | $ | 10,798 | $ | 10,965 | $ | 14,643 | $ | 13,726 | $ | 25,973 | ||||||||||||||
| Ratios to average net assets (c): | ||||||||||||||||||||||||||
| Net expenses | 1.31 | % | 1.22 | % | 1.28 | % | 1.25 | % | 1.18 | % | 1.17 | % | ||||||||||||||
| Gross expenses | 1.31 | % | 1.22 | % | 1.28 | % | 1.25 | % | 1.18 | % | 1.17 | % | ||||||||||||||
| Net investment income (loss) | -0.30 | % | -0.24 | % | — | %(e) | 0.11 | % | 0.04 | % | 0.09 | % | ||||||||||||||
| Portfolio turnover rate | 22 | % | 66 | % | 80 | % | 90 | % | 81 | % | 79 | % | ||||||||||||||
The accompanying notes are an integral part of these financial statements.
240 Semi-Annual Report
| Selected data for a share of capital stock outstanding | Six Months Ended | Year Ended | For the Period 1/8/2020* | |||||||||||||
| throughout each period | 6/30/22† | 12/31/21 | to 12/31/20 | |||||||||||||
| R6 Shares | ||||||||||||||||
| Net asset value, beginning of period | $ | 14.98 | $ | 14.42 | $ | 13.62 | ||||||||||
| Income (Loss) from investment operations: | ||||||||||||||||
| Net investment income (loss) (a) | (0.02 | ) | 0.01 | 0.04 | ||||||||||||
| Net realized and unrealized gain (loss) | (3.08 | ) | 2.82 | 0.84 | ||||||||||||
| Total from investment operations | (3.10 | ) | 2.83 | 0.88 | ||||||||||||
| Less distributions from: | ||||||||||||||||
| Net investment income | — | (0.03 | ) | (0.02 | ) | |||||||||||
| Net realized gains | — | (2.24 | ) | (0.06 | ) | |||||||||||
| Total distributions | — | (2.27 | ) | (0.08 | ) | |||||||||||
| Net asset value, end of period | $ | 11.88 | $ | 14.98 | $ | 14.42 | ||||||||||
| Total Return (b) | -20.69 | % | 19.95 | % | 6.59 | % | ||||||||||
| Ratios and Supplemental Data: | ||||||||||||||||
| Net assets, end of period (in thousands) | $ | 1 | $ | 718 | $ | 684 | ||||||||||
| Ratios to average net assets (c): | ||||||||||||||||
| Net expenses | 1.03 | % | 0.94 | % | 0.96 | % | ||||||||||
| Gross expenses | 1.53 | % | 2.53 | % | 1.65 | % | ||||||||||
| Net investment income (loss) | -0.33 | % | 0.05 | % | 0.34 | % | ||||||||||
| Portfolio turnover rate | 22 | % | 66 | % | 80 | % | ||||||||||
| † | Unaudited. |
| * | The inception date for the R6 shares was January 8, 2020. |
| (a) | Net investment income (loss) has been computed using the average shares method. |
| (b) | Total returns reflect reinvestment of all dividends and distributions, if any. Certain expenses of the Portfolio may have been waived or reimbursed by the Investment Manager, State Street or DST; without such waiver/reimbursement of expenses, the Portfolio’s returns would have been lower. Returns for a period of less than one year are not annualized. |
| (c) | Annualized for a period of less than one year except for non-recurring expenses. |
| (d) | Amount is less than $0.01 per share. |
| (e) | Amount is less than 0.005%. |
The accompanying notes are an integral part of these financial statements.
Semi-Annual Report 241
LAZARD US SUSTAINABLE EQUITY PORTFOLIO
| Selected data for a share of capital stock outstanding | Six Months Ended | Year Ended | For the Period 6/30/20* | |||||||||||||
| throughout each period | 6/30/22† | 12/31/21 | to 12/31/20 | |||||||||||||
| Institutional Shares | ||||||||||||||||
| Net asset value, beginning of period | $ | 15.41 | $ | 12.20 | $ | 10.00 | ||||||||||
| Income (Loss) from investment operations: | ||||||||||||||||
| Net investment income (loss) (a) | 0.04 | 0.06 | 0.04 | |||||||||||||
| Net realized and unrealized gain (loss) | (3.35 | ) | 3.47 | 2.23 | ||||||||||||
| Total from investment operations | (3.31 | ) | 3.53 | 2.27 | ||||||||||||
| Less distributions from: | ||||||||||||||||
| Net investment income | — | (0.08 | ) | (0.04 | ) | |||||||||||
| Net realized gains | — | (0.24 | ) | (0.03 | ) | |||||||||||
| Total distributions | — | (0.32 | ) | (0.07 | ) | |||||||||||
| Net asset value, end of period | $ | 12.10 | $ | 15.41 | $ | 12.20 | ||||||||||
| Total Return (b) | -21.48 | % | 29.01 | % | 22.69 | % | ||||||||||
| Ratios and Supplemental Data: | ||||||||||||||||
| Net assets, end of period (in thousands) | $ | 11,707 | $ | 14,687 | $ | 11,490 | ||||||||||
| Ratios to average net assets (c): | ||||||||||||||||
| Net expenses | 0.75 | % | 0.75 | % | 0.75 | % | ||||||||||
| Gross expenses | 1.77 | % | 2.08 | % | 2.49 | % | ||||||||||
| Net investment income (loss) | 0.59 | % | 0.43 | % | 0.65 | % | ||||||||||
| Portfolio turnover rate | 9 | % | 8 | % | 5 | % | ||||||||||
The accompanying notes are an integral part of these financial statements.
242 Semi-Annual Report
| Selected data for a share of capital stock outstanding | Six Months Ended | Year Ended | For the Period 6/30/20* | |||||||||||||
| throughout each period | 6/30/22† | 12/31/21 | to 12/31/20 | |||||||||||||
| Open Shares | ||||||||||||||||
| Net asset value, beginning of period | $ | 15.43 | $ | 12.21 | $ | 10.00 | ||||||||||
| Income (Loss) from investment operations: | ||||||||||||||||
| Net investment income (loss) (a) | 0.02 | 0.02 | 0.02 | |||||||||||||
| Net realized and unrealized gain (loss) | (3.36 | ) | 3.48 | 2.23 | ||||||||||||
| Total from investment operations | (3.34 | ) | 3.50 | 2.25 | ||||||||||||
| Less distributions from: | ||||||||||||||||
| Net investment income | — | (0.04 | ) | (0.01 | ) | |||||||||||
| Net realized gains | — | (0.24 | ) | (0.03 | ) | |||||||||||
| Total distributions | — | (0.28 | ) | (0.04 | ) | |||||||||||
| Net asset value, end of period | $ | 12.09 | $ | 15.43 | $ | 12.21 | ||||||||||
| Total Return (b) | -21.65 | % | 28.75 | % | 22.48 | % | ||||||||||
| Ratios and Supplemental Data: | ||||||||||||||||
| Net assets, end of period (in thousands) | $ | 495 | $ | 655 | $ | 128 | ||||||||||
| Ratios to average net assets (c): | ||||||||||||||||
| Net expenses | 1.00 | % | 1.00 | % | 1.00 | % | ||||||||||
| Gross expenses | 2.79 | % | 3.15 | % | 5.31 | % | ||||||||||
| Net investment income (loss) | 0.34 | % | 0.17 | % | 0.43 | % | ||||||||||
| Portfolio turnover rate | 9 | % | 8 | % | 5 | % | ||||||||||
| † | Unaudited. |
| * | The Portfolio commenced operations on June 30, 2020. |
| (a) | Net investment income (loss) has been computed using the average shares method. |
| (b) | Total returns reflect reinvestment of all dividends and distributions, if any. Certain expenses of the Portfolio may have been waived or reimbursed by the Investment Manager, State Street or DST; without such waiver/reimbursement of expenses, the Portfolio’s returns would have been lower. Returns for a period of less than one year are not annualized. |
| (c) | Annualized for a period of less than one year except for non-recurring expenses. |
The accompanying notes are an integral part of these financial statements.
Semi-Annual Report 243
LAZARD US SYSTEMATIC SMALL CAP EQUITY PORTFOLIO
| Selected data for a | |||||||||
| share of capital stock | Six Months | For the Period | |||||||
| outstanding | Ended | 10/29/21* | |||||||
| throughout each period | 6/30/22† | to 12/31/21 | |||||||
| Institutional Shares | |||||||||
| Net asset value, beginning of period | $ | 10.26 | $ | 10.00 | |||||
| Income (Loss) from investment operations: | |||||||||
| Net investment income (loss) (a) | 0.06 | 0.02 | |||||||
| Net realized and unrealized gain (loss) | (2.18 | ) | 0.26 | ||||||
| Total from investment operations | (2.12 | ) | 0.28 | ||||||
| Less distributions from: | |||||||||
| Net investment income | — | (0.02 | ) | ||||||
| Total distributions | — | (0.02 | ) | ||||||
| Net asset value, end of period | $ | 8.14 | $ | 10.26 | |||||
| Total Return (b) | -20.66 | % | 2.83 | % | |||||
| Ratios and Supplemental Data: | |||||||||
| Net assets, end of period (in thousands) | $ | 23,523 | $ | 3,983 | |||||
| Ratios to average net assets (c): | |||||||||
| Net expenses | 0.91 | % | 0.90 | % | |||||
| Gross expenses | 4.84 | % | 5.13 | % | |||||
| Net investment income (loss) | 1.39 | % | 1.39 | % | |||||
| Portfolio turnover rate | 26 | % | 22 | % | |||||
The accompanying notes are an integral part of these financial statements.
244 Semi-Annual Report
| Selected data for a | |||||||||
| share of capital stock | Six Months | For the Period | |||||||
| outstanding | Ended | 10/29/21* | |||||||
| throughout each period | 6/30/22† | to 12/31/21 | |||||||
| Open Shares | |||||||||
| Net asset value, beginning of period | $ | 10.28 | $ | 10.00 | |||||
| Income (Loss) from investment operations: | |||||||||
| Net investment income (loss) (a) | 0.03 | 0.02 | |||||||
| Net realized and unrealized gain (loss) | (2.16 | ) | 0.26 | ||||||
| Total from investment operations | (2.13 | ) | 0.28 | ||||||
| Net asset value, end of period | $ | 8.15 | $ | 10.28 | |||||
| Total Return (b) | -20.72 | % | 2.80 | % | |||||
| Ratios and Supplemental Data: | |||||||||
| Net assets, end of period (in thousands) | $ | 118 | $ | 120 | |||||
| Ratios to average net assets (c): | |||||||||
| Net expenses | 1.15 | % | 1.15 | % | |||||
| Gross expenses | 14.34 | % | 13.16 | % | |||||
| Net investment income (loss) | 0.73 | % | 1.14 | % | |||||
| Portfolio turnover rate | 26 | % | 22 | % | |||||
| † | Unaudited. |
| * | The Portfolio commenced operations on October 29, 2021. |
| (a) | Net investment income (loss) has been computed using the average shares method. |
| (b) | Total returns reflect reinvestment of all dividends and distributions, if any. Certain expenses of the Portfolio may have been waived or reimbursed by the Investment Manager, State Street or DST; without such waiver/reimbursement of expenses, the Portfolio’s returns would have been lower. Returns for a period of less than one year are not annualized. |
| (c) | Annualized for a period of less than one year except for non-recurring expenses. |
The accompanying notes are an integral part of these financial statements.
Semi-Annual Report 245
The Lazard Funds, Inc. Notes to Financial Statements
June 30, 2022 (unaudited)
1. Organization
The Lazard Funds, Inc. was incorporated in Maryland on May 17, 1991 and is registered under the Investment Company Act of 1940, as amended (the “1940 Act”), as an open-end management investment company. As of June 30, 2022, the Fund was comprised of twenty nine no-load portfolios (each referred to as a “Portfolio”). This report includes only the financial statements of the Lazard Developing Markets Equity Portfolio (“Developing Markets Equity”), Lazard Emerging Markets Core Equity Portfolio (“Emerging Markets Core Equity”), Lazard Emerging Markets Equity Advantage Portfolio (“Emerging Markets Equity Advantage”), Lazard Emerging Markets Equity Portfolio (“Emerging Markets Equity”), Lazard Emerging Markets Strategic Equity Portfolio (“Emerging Markets Strategic Equity”), Lazard Equity Franchise Portfolio (“Equity Franchise”), Lazard Global Equity Select Portfolio (“Global Equity Select”), Lazard Global Listed Infrastructure Portfolio (“Global Listed Infrastructure”), Lazard Global Strategic Equity Portfolio (“Global Strategic Equity”), Lazard International Equity Advantage Portfolio (“International Equity Advantage”), Lazard International Equity Portfolio (“International Equity”), Lazard International Equity Select Portfolio (“International Equity Select”), Lazard International Small Cap Equity Portfolio (“International Small Cap Equity”), Lazard International Quality Growth Portfolio (“International Quality Growth”), Lazard International Strategic Equity Portfolio (“International Strategic Equity”), Lazard Managed Equity Volatility Portfolio (“Managed Equity Volatility”), Lazard US Equity Concentrated Portfolio (“US Equity Concentrated”), Lazard US Equity Focus Portfolio (“US Equity Focus”), Lazard US Small-Mid Cap Equity Portfolio (“US Small-Mid Cap Equity”), Lazard US Sustainable Equity Portfolio (“US Sustainable Equity”), and Lazard US Systematic Small Cap Equity Portfolio (“US Systematic Small Cap Equity”). The financial statements of the other eight Portfolios are presented separately.
The Portfolios, other than Equity Franchise, US Equity Concentrated and US Equity Focus, are operated as “diversified” funds, as defined in the 1940 Act.
246 Semi-Annual Report
Each Portfolio currently offers Institutional Shares and Open Shares, and certain Portfolios offer R6 Shares. Each share class is identical except as to minimum investment requirements; eligibility requirements for R6 Shares; the services offered to, and expenses borne by, each class; and the availability of Service Payments (as defined in the Portfolios’ prospectus).
2. Significant Accounting Policies
The accompanying financial statements are presented in conformity with GAAP. The Fund is an investment company and therefore applies specialized accounting guidance in accordance with Accounting Standards Codification Topic 946. The following is a summary of significant accounting policies consistently followed by the Fund in the preparation of the financial statements:
(a) Valuation of Investments—Equity securities traded on a securities exchange or market, including exchange-traded option contracts, rights and warrants, are valued at the last reported sales price (for US listed equity securities) or the closing price (for non-US listed equity securities) on the exchange or market on which the security is principally traded or, for securities trading on the Nasdaq, the Nasdaq Official Closing Price. If there is no available closing price for a non-US listed equity security, the last reported sales price is used. If there are no reported sales of a security on the valuation date, the security is valued at the most recent quoted bid price on such date reported by such principal exchange or market. Forward currency contracts generally are valued using quotations from an independent pricing service. Investments in money market funds are valued at the fund’s net asset value (“NAV”) per share.
Calculation of a Portfolio’s NAV may not take place contemporaneously with the determination of the prices of portfolio assets used in such calculation. Trading on certain non-US securities exchanges or markets, such as those in Europe and Asia, ordinarily may be completed before the close of business on each business day in New York (i.e., a day on which the New York Stock Exchange (the “NYSE”) is open). In addition, securities trading in a particular non-US country or countries,
Semi-Annual Report 247
may not take place on all business days in New York and on which the NAV of a Portfolio is calculated.
If a significant event materially affecting the value of securities occurs between the close of the exchange or market on which the security is principally traded and the time when a Portfolio’s NAV is calculated, or when current market quotations otherwise are determined not to be readily available or reliable (including restricted or other illiquid securities such as certain derivative instruments), such securities will be valued at their fair value as determined by, or in accordance with procedures approved by, the Fund’s Board of Directors (the “Board”). The fair value of non-US equity securities may be determined with the assistance of an independent pricing service using correlations between the movement of prices of such securities and indices of US securities and other appropriate indicators, such as closing market prices of relevant ADRs or futures contracts. Certain non-US securities may trade on days when a Portfolio is not open for business, thus affecting the value of the Portfolio’s assets on days when Portfolio shareholders may not be able to buy or sell Portfolio shares.
The Valuation Committee of the Investment Manager, which is subject to the oversight of the Board, may evaluate a variety of factors to determine the fair value of securities for which market quotations are determined not to be readily available or reliable. These factors include, but are not limited to, the type of security, the value of comparable securities, observations from financial institutions and relevant news events. Input from the Investment Manager’s portfolio management team also will be considered.
The effect of using fair value pricing is that the NAV of a Portfolio will reflect the affected securities’ values as determined in the judgment of the Board or its designee instead of being determined by the market. Using a fair value pricing methodology to price securities may result in a value that is different from the most recent closing price of a security and from the prices used by other investment companies to calculate their portfolios’ NAVs.
248 Semi-Annual Report
(b) Portfolio Securities Transactions and Investment Income—Portfolio securities transactions are accounted for on trade date. Realized gain (loss) on sales of investments are recorded on a specific identification basis. Dividend income is recorded on the ex-dividend date except for certain dividends from non-US securities where the dividend rate is not available. In such cases, the dividend is recorded as soon as the information is received by a Portfolio. Interest income, if any, is accrued daily.
A Portfolio may be subject to taxes imposed by non-US countries in which it invests. Such taxes are generally based upon income earned or capital gains (realized and/or unrealized). An affected Portfolio accrues and applies such taxes to net investment income, net realized gains and net unrealized gains concurrent with the recognition of income earned or capital gains (realized and/or unrealized) from the applicable portfolio securities.
As a result of several court cases in certain countries across the European Union, some Portfolios have filed tax reclaims for previously withheld taxes on dividends earned in certain European Union countries. These filings are subject to various administrative proceedings by the local jurisdictions’ tax authorities within the European Union, as well as a number of related judicial proceedings. Uncertainty exists as to the ultimate resolution of these proceedings, the likelihood of receipt of these claims, and the potential timing of payment, and accordingly no amounts are reflected in the financial statements until a positive decision has been awarded, at which time the amount will be recorded within dividend income on the Statement of Operations. Such amounts, if and when recorded, could result in an increase in a Portfolio’s NAV per share.
(c) Foreign Currency Translation and Forward Currency Contracts—The accounting records of the Fund are maintained in US dollars. Portfolio securities and other assets and liabilities denominated in a foreign currency are translated daily into US dollars at the prevailing rates of exchange. Purchases and sales of securities, income receipts and expense payments are translated into US
Semi-Annual Report 249
dollars at the prevailing exchange rates on the respective transaction dates.
The Portfolios do not isolate the portion of operations resulting from changes in foreign exchange rates on investments from the fluctuations arising from changes in their market prices. Such fluctuations are included in net realized and unrealized gain (loss) on investments.
A forward currency contract is an agreement between two parties to buy or sell currency at a set price on a future date. Daily fluctuations in the value of forward currency contracts are recorded as unrealized appreciation (depreciation) on forward currency contracts. When the contract is closed, the Portfolio records a realized gain (loss) equal to the difference between the value at the time it was opened and the value at the time it was closed. Net realized gain (loss) on foreign currency transactions and forward currency contracts represent net foreign currency gain (loss) from forward currency contracts, disposition of foreign currencies, currency gain (loss) realized between the trade and settlement dates on securities transactions, and the difference between the amount of dividends, interest and foreign withholding taxes recorded on the Portfolios’ accounting records and the US dollar equivalent amounts actually received or paid. Net change in unrealized appreciation (depreciation) on foreign currency translations reflects the impact of changes in exchange rates on the value of assets and liabilities, other than investments in securities, during the period.
During the period ended June 30, 2022, the Global Listed Infrastructure Portfolio traded in forward currency contracts.
(d) Federal Income Taxes—The Fund’s policy is for each Portfolio to qualify as a regulated investment company under Subchapter M of the Internal Revenue Code of 1986, as amended (the “Code”), and to distribute all of its taxable income, including any net realized capital gains, to shareholders. Therefore, no federal income tax provision is required.
250 Semi-Annual Report
At December 31, 2021, the following Portfolios had unused realized capital loss carryovers which, for federal income tax purposes, could be used to offset future realized capital gains with no expiration date as follows:
| Portfolio | Short-Term | Long-Term | ||||||
| Developing Markets Equity | $ | 61,027,132 | $ | 51,531,574 | ||||
| Emerging Markets Core Equity | 6,876,277 | 9,280,949 | ||||||
| Emerging Markets Equity | 178,253,778 | 818,167,769 | ||||||
| Emerging Markets Strategic Equity | 9,706,202 | 34,953,494 | ||||||
During the year ended December 31, 2021, the following Portfolios utilized realized capital loss carryovers from previous years as follows:
| Portfolio | Amounts | |||
| Developing Markets Equity | $ | 1,462,501 | ||
| Emerging Markets Core Equity | 9,749,820 | |||
| Emerging Markets Equity | 462,868,679 | |||
| Emerging Markets Strategic Equity | 9,813,141 | |||
| International Equity Advantage | 274,902 | |||
| International Equity | 63,023,310 | |||
| International Equity Select | 3,555,561 | |||
| International Small Cap Equity | 1,090,853 | |||
| International Strategic Equity | 68,613,914 | |||
| Managed Equity Volatility | 1,476,429 | |||
| US Small-Mid Cap Equity | 4,100,216 | |||
Under current tax law, post-October capital losses or certain late-year ordinary losses, as defined by the Code, within the taxable year may be deferred and treated as occurring on the first day of the following tax year. For the tax year ended December 31, 2021, the following Portfolios elected to defer such losses as follows:
Semi-Annual Report 251
| Portfolio | Post-October Capital Loss Deferral | Late-Year Ordinary Loss Deferral | ||||||
| Developing Markets Equity | $ | — | $ | 126,847 | ||||
| Emerging Markets Equity | — | 356,726 | ||||||
| Emerging Markets Strategic Equity | — | 13,726 | ||||||
| Global Equity Select | 3,363 | 1,312 | ||||||
| International Quality Growth | — | 6,730 | ||||||
| International Small Cap Equity | — | 19,273 | ||||||
| International Strategic Equity | 14,948,987 | 7,408,056 | ||||||
For federal income tax purposes, the aggregate cost, aggregate gross unrealized appreciation, aggregate gross unrealized depreciation and the net unrealized appreciation (depreciation) were as follows:
| Portfolio | Aggregate Cost | Aggregate Gross Unrealized Appreciation | Aggregate Gross Unrealized Depreciation | Net Unrealized Appreciation (Depreciation) | ||||||||||||
| Developing Markets Equity | $ | 110,194,506 | $ | 18,663,127 | $ | 12,704,321 | $ | 5,958,806 | ||||||||
| Emerging Markets Core Equity | 103,929,596 | 22,541,398 | 15,381,446 | 7,159,952 | ||||||||||||
| Emerging Markets Equity Advantage | 61,155,302 | 1,871,790 | 9,706,214 | (7,834,424 | ) | |||||||||||
| Emerging Markets Equity | 2,869,520,472 | 345,155,545 | 405,614,878 | (60,459,333 | ) | |||||||||||
| Emerging Markets Strategic Equity | 54,011,939 | 3,472,087 | 8,705,352 | (5,233,265 | ) | |||||||||||
| Equity Franchise | 149,267,734 | 2,346,873 | 7,285,094 | (4,938,221 | ) | |||||||||||
| Global Equity Select | 78,879,741 | 22,003,812 | 5,597,411 | 16,406,401 | ||||||||||||
| Global Listed Infrastructure | 8,203,821,449 | 781,503,807 | 466,716,379 | 314,787,428 | ||||||||||||
| Global Strategic Equity | 13,669,653 | 445,309 | 1,667,961 | (1,222,652 | ) | |||||||||||
| International Equity Advantage | 2,627,880 | 123,496 | 356,258 | (232,762 | ) | |||||||||||
| International Equity | 1,192,980,197 | 163,737,102 | 135,600,291 | 28,136,811 | ||||||||||||
| International Equity Select | 65,968,892 | 7,199,597 | 8,129,160 | (929,563 | ) | |||||||||||
| International Quality Growth | 136,674,781 | 580,058 | 23,299,510 | (22,719,452 | ) | |||||||||||
252 Semi-Annual Report
| Portfolio | Aggregate Cost | Aggregate Gross Unrealized Appreciation | Aggregate Gross Unrealized Depreciation | Net Unrealized Appreciation (Depreciation) | ||||||||||||
| International Small Cap Equity | $ | 20,728,197 | $ | 879,228 | $ | 3,705,197 | $ | (2,825,969 | ) | |||||||
| International Strategic Equity | 4,588,377,234 | 813,535,259 | 522,812,826 | 290,722,433 | ||||||||||||
| Managed Equity Volatility | 28,868,117 | 1,666,024 | 1,898,726 | (232,702 | ) | |||||||||||
| US Equity Concentrated | 1,202,345,192 | 278,979,465 | 46,805,318 | 232,174,147 | ||||||||||||
| US Equity Focus | 61,350,947 | 16,069,092 | 3,043,461 | 13,025,631 | ||||||||||||
| US Small-Mid Cap Equity | 65,508,793 | 12,400,474 | 8,998,154 | 3,402,320 | ||||||||||||
| US Sustainable Equity | 10,962,372 | 1,694,977 | 385,492 | 1,309,485 | ||||||||||||
| US Systematic Small Cap Equity | 25,752,107 | 535,015 | 2,536,322 | (2,001,307 | ) | |||||||||||
Management has analyzed the Portfolios’ tax positions, and has concluded that no liability for unrecognized tax benefits should be recorded related to uncertain tax positions taken on tax returns filed for any open tax years (or expected to be taken on future tax returns). Open tax years are those that remain subject to examination and are based on each tax jurisdiction’s statute of limitations. Each Portfolio files a US federal income tax return annually after its fiscal year-end, which is subject to examination by the Internal Revenue Service for a period of three years from the date of filing.
(e) Dividends and Distributions—For each Portfolio, income dividends are normally declared each business day and paid monthly during any particular year, except that the Global Listed Infrastructure Portfolio’s dividends from net investment income (if any), will be declared and paid quarterly. During any particular year, net realized gains from investment transactions in excess of available capital loss carryforwards would be taxable to the Portfolios, if not distributed. The Portfolios intend to declare and distribute these amounts, at least annually, to shareholders, but may be distributed more frequently. Differences in per share distributions, by class, are generally due to differences in class specific expenses.
Semi-Annual Report 253
The Global Strategic Equity, US Equity Concentrated, International Equity, International Small Cap Equity, US Small-Mid Cap Equity, Emerging Markets Equity Advantage and Equity Franchise Portfolios, intend, on their 2021 tax returns, to elect to treat as a distribution of investment company taxable income and net capital gain the portion of redemption proceeds paid to redeeming shareholders that represents the redeeming shareholders’ portion of the Portfolios’ undistributed investment company taxable income and net capital gain. This practice, which involves the use of equalization accounting, will have the effect of reducing the amount of income and gains that the Portfolios would otherwise be required to distribute as dividends to shareholders in order for the Portfolios to avoid federal income and excise taxes. This practice reduces the amount of distributions required to be made to non-redeeming shareholders and defers the recognition of taxable income by such shareholders. However, since the amount of any undistributed income will be reflected in the value of the Portfolios’ shares, the total return on a shareholder’s investment is not affected by the Portfolios’ use of equalization.
Real estate investment trust (“REIT”) distributions received by a Portfolio are generally comprised of ordinary income, long-term capital gains and a return of REIT capital. However, as the actual character of such distributions received are not known until after the calendar year end, distributions made by a Portfolio during the year are subject to re-characterization that may result in some portion of the distributions being reclassified as a return of capital distribution to Portfolio shareholders.
Income and capital gains distributions are determined in accordance with federal income tax regulations which may differ from GAAP. These book/tax differences, which may result in distribution reclassifications, are primarily due to differing treatments of foreign currency translations, wash sales, passive foreign investment companies, expiring capital loss carryovers, certain expenses, foreign capital gains taxes, non-deductible organization expenses, REIT basis adjustments, distributions in excess of current earnings, equalization accounting (as described above), non-REIT non-taxable dividend adjustment to income,
254 Semi-Annual Report
distributions redesignations, adjustments in relation to merger, return of capital distributions, receivable from tax reclaim and distributions from real estate investment trusts and partnerships. The book/tax differences relating to shareholder distributions may result in reclassifications among certain capital accounts.
(f) Offering and Organizational Costs—Costs incurred by the Fund in connection with the offering of shares of a new Portfolio or share class of a Portfolio are deferred and amortized on a straight line basis over a twelve-month period from the date of commencement of operations of the Portfolio or share class. Organizational costs are expensed as incurred.
(g) Allocation of Expenses—Expenses common to the Fund, Lazard Retirement Series, Inc., and Lazard Global Total Return and Income Fund, Inc. (each a “Lazard Fund” and collectively, the “Lazard Fund Complex”), each a registered management investment company advised by the Investment Manager, not directly chargeable to one or more specific Lazard Funds are allocated to the Fund and among its Portfolios primarily on the basis of relative net assets. Expenses of the Fund not directly chargeable to one or more Portfolios are similarly allocated among the Portfolios primarily on the basis of relative net assets. Portfolios accrue distribution and service (12b-1) fees to Open Shares. Each Portfolio’s income, expenses (other than class specific expenses) and realized and unrealized gains and losses are allocated proportionally each day between the classes based upon the relative net assets of each class.
(h) Estimates—The preparation of financial statements in conformity with GAAP requires management to make estimates and assumptions that affect the reported amounts of assets and liabilities and disclosure of contingent assets and liabilities at the date of the financial statements and the reported amounts of increases and decreases in net assets resulting from operations during the reporting period. Actual results could differ from those estimates.
Semi-Annual Report 255
(i) Net Asset Value—The NAV per share for each class of each Portfolio is determined each day the NYSE is open for trading as of the close of regular trading on the NYSE (generally 4:00 p.m. Eastern time). The Fund will not treat an intraday unscheduled disruption in NYSE trading as a closure of the NYSE, and will price its shares as of 4:00 p.m., if the particular disruption directly affects only the NYSE. The NAV per share of a class is determined by dividing the value of the total assets of the Portfolio represented by such class, less all liabilities, by the total number of Portfolio shares of such class outstanding.
3. Investment Management, Administration, Custody, Distribution and Transfer Agency Agreements
The Fund, on behalf of the Portfolios, has entered into a management agreement (the “Management Agreement”) with the Investment Manager. Pursuant to the Management Agreement, the Investment Manager manages the investment operations of each Portfolio and the assets of each Portfolio including the purchase, retention and disposition thereof, in accordance with the Portfolio’s investment objectives, policies, and restrictions, and provides the Portfolios with administrative, operational and compliance assistance services. For its services provided to the Portfolios, the Investment Manager earns a management fee, accrued daily as a percentage of each Portfolio’s average daily net assets and payable by each Portfolio monthly, at the annual rate set forth below:
| Portfolio | Annual Rate | |||
| Developing Markets Equity | 1.00 | % | ||
| Emerging Markets Core Equity | 1.00 | |||
| Emerging Markets Equity Advantage | 0.75 | |||
| Emerging Markets Equity | 1.00 | |||
| Emerging Markets Strategic Equity | 1.00 | |||
| Equity Franchise | 0.80 | |||
| Global Equity Select | 0.65 | |||
| Global Listed Infrastructure | 0.90 | |||
| Global Strategic Equity | 0.75 | |||
| International Equity Advantage | 0.65 | |||
| International Equity | 0.75 | |||
| International Equity Select | 0.65 | |||
256 Semi-Annual Report
| Portfolio | Annual Rate | |||
| International Quality Growth | 0.75 | % | ||
| International Small Cap Equity | 0.75 | |||
| International Strategic Equity | 0.75 | |||
| Managed Equity Volatility | 0.60 | |||
| US Equity Concentrated | 0.70 | |||
| US Equity Focus | 0.55 | |||
| US Small-Mid Cap Equity | 0.75 | |||
| US Sustainable Equity | 0.60 | |||
| US Systematic Small Cap Equity | 0.70 | |||
The Investment Manager has voluntarily agreed to waive its fees and, if necessary, reimburse a Portfolio until April 29, 2023 (or such other date as indicated below) if the aggregate direct expenses of the Portfolio, exclusive of taxes, brokerage, interest on borrowings, fees and expenses of “Acquired Funds” (as defined in Form N-1A), fees and expenses related to filing foreign tax reclaims and extraordinary expenses, exceed an applicable percentage of the value of the Portfolio’s average daily net assets set forth opposite the Portfolio’s name in the table below. The Fund, on behalf of the Portfolio, may deduct from the payment to be made to the Investment Manager under the Management Agreement, or the Investment Manager will bear, such excess expenses.
| Portfolio | Institutional Shares | Open Shares | R6 Shares | |||||||||
| Developing Markets Equity | 1.15 | % | 1.40 | % | N/A | % | ||||||
| Emerging Markets Core Equity | 1.20 | 1.45 | 1.15 | |||||||||
| Emerging Markets Equity Advantage | 0.90 | 1.15 | N/A | |||||||||
| Emerging Markets Equity | 1.20 | 1.45 | 1.15 | |||||||||
| Emerging Markets Strategic Equity | 1.10 | 1.35 | N/A | |||||||||
| Equity Franchise | 0.95 | 1.20 | N/A | |||||||||
| Global Equity Select | 0.90 | 1.15 | N/A | |||||||||
| Global Listed Infrastructure (a) | 1.20 | 1.45 | N/A | |||||||||
| Global Strategic Equity | 0.90 | 1.15 | N/A | |||||||||
| International Equity Advantage | 0.80 | 1.05 | N/A | |||||||||
| International Equity | 0.85 | 1.10 | 0.80 | |||||||||
| International Equity Select (b) | 0.90 | 1.15 | N/A | |||||||||
| International Quality Growth (e) | 0.85 | 1.10 | N/A | |||||||||
| International Small Cap Equity | 1.13 | 1.38 | N/A | |||||||||
| International Strategic Equity | 1.05 | 1.30 | 1.00 | |||||||||
| Managed Equity Volatility | 0.75 | 1.00 | N/A | |||||||||
| US Equity Concentrated (c) | 0.90 | 1.15 | 0.85 | |||||||||
| US Equity Focus | 0.70 | 0.95 | 0.70 | |||||||||
| US Small-Mid Cap Equity | 1.05 | 1.30 | 1.00 | |||||||||
| US Sustainable Equity | 0.75 | 1.00 | N/A | |||||||||
| US Systematic Small Cap Equity (d) | 0.90 | 1.15 | N/A | |||||||||
Semi-Annual Report 257
| (a) | This agreement will continue in effect until April 29, 2032. |
| (b) | This agreement will continue in effect until April 29, 2023 and from April 29, 2023 until April 29, 2032 at levels of 1.15%, 1.40% and 1.10%, respectively. |
| (c) | This agreement will continue in effect until April 29, 2023 and from April 29, 2023 until April 29, 2032 at levels of 1.10%, 1.35% and 1.05%, respectively. |
| (d) | This agreement will continue in effect until October 29, 2023. |
| (e) | This agreement will continue in effect until April 29, 2023 for Institutional Shares and until April 29, 2032 for Open Shares. |
In addition, until April 29, 2023, to the extent the “Total Annual Fund Operating Expenses” (as used in Form N-1A) of the R6 Shares of a Portfolio exceed the Total Annual Fund Operating Expenses of the Portfolio’s Institutional Shares (in each case, not including management fees, custodial fees or other expenses related to the management of the Portfolio’s assets), the Investment Manager will bear the expenses of the R6 Shares in the amount of such excess.
During the period ended June 30, 2022, the Investment Manager waived its management fees and reimbursed the following Portfolios for other expenses as follows:
| Institutional Shares | Open Shares | ||||||||||||||||
| Portfolio | Management Fees Waived | Expenses Reimbursed | Management Fees Waived | Expenses Reimbursed | |||||||||||||
| Developing Markets Equity | $ | 44,370 | $ | — | $ | 5,275 | $ | — | |||||||||
| Emerging Markets Core Equity | 340 | — | 1,473 | — | |||||||||||||
| Emerging Markets Equity Advantage | 87,226 | — | 1,348 | 1,408 | |||||||||||||
| Emerging Markets Strategic Equity | 83,141 | — | 6,738 | — | |||||||||||||
| Equity Franchise | 32,707 | — | 474 | 1,775 | |||||||||||||
| Global Equity Select | — | — | 2,158 | — | |||||||||||||
| Global Strategic Equity | 55,129 | 16,808 | 679 | 2,370 | |||||||||||||
| International Equity Advantage | 8,425 | 72,095 | 400 | 5,527 | |||||||||||||
| International Equity Select | 12,954 | — | 2,918 | — | |||||||||||||
| International Quality Growth | 71,313 | — | 1,091 | 1,291 | |||||||||||||
| International Small Cap Equity | 29,397 | — | 26,689 | — | |||||||||||||
| Managed Equity Volatility | 74,040 | — | 245 | 2,175 | |||||||||||||
| US Equity Focus | 20,409 | — | 2,288 | — | |||||||||||||
| US Small-Mid Cap Equity | 39 | — | 44 | — | |||||||||||||
| US Sustainable Equity | 38,713 | 26,971 | 1,607 | 3,200 | |||||||||||||
| US Systematic Small Cap Equity | 26,104 | 120,726 | 384 | 6,859 | |||||||||||||
258 Semi-Annual Report
| R6 Shares | |||||||||
| Portfolio | Management Fees Waived | Expenses Reimbursed | |||||||
| Emerging Markets Core Equity | $ | 1,491 | $ | 5 | |||||
| Emerging Markets Equity | 1,258 | — | |||||||
| International Equity | 22,806 | — | |||||||
| International Strategic Equity | 1,993 | — | |||||||
| US Equity Concentrated | 1,378 | — | |||||||
| US Equity Focus | 18,182 | — | |||||||
| US Small-Mid Cap Equity | 550 | — | |||||||
The aforementioned waivers and/or reimbursements are not subject to recoupment by the Investment Manager.
State Street serves as the Fund’s custodian and provides the Fund with certain administrative services.
The Fund has a distribution agreement with Lazard Asset Management Securities LLC (the “Distributor”), a wholly-owned subsidiary of the Investment Manager, to serve as the distributor for shares of each Portfolio. The Distributor bears, amongst other expenses, the cost of preparing and distributing materials used by the Distributor in connection with its offering Portfolio shares and other advertising and promotional expenses.
Under a distribution and servicing plan adopted pursuant to Rule 12b-1 under the 1940 Act, each Portfolio pays a monthly fee to the Distributor, at an annual rate of 0.25% of the average daily net assets of its Open Shares, for certain distribution activities and providing services to holders of the Portfolio’s Open Shares. The Distributor may make payments to third parties such as financial institutions, securities dealers and other industry professionals in respect of these services.
DST is the Fund’s transfer agent and dividend disbursing agent.
4. Directors’ Compensation
Certain Directors of the Fund are officers of the Investment Manager. Effective January 2022, the annual compensation for each Director who is not an affiliated person of the Investment Manager or any of its affiliates, that is payable by all of the funds
Semi-Annual Report 259
in the Lazard Fund Complex, is comprised of: (1) an annual fee of $245,000, (2) an additional annual fee of $35,000 to the lead Independent Director, and (3) an additional annual fee of $25,000 to the Audit Committee Chair. The Independent Directors (an “Independent Director” is a Director who is not an “interested person” (as defined in the 1940 Act) of the Fund) also may be paid additional compensation for participation on ad hoc committees or other work performed on behalf of the Board. The Independent Directors are also reimbursed for travel and other out-of-pocket expenses for attending Board and Committee meetings. The Directors do not receive benefits from the Fund pursuant to any pension, retirement or similar arrangement. Independent Directors’ fees and expenses are allocated among the active Portfolios in the Lazard Fund Complex at a rate of $5,000 per active portfolio with the remainder allocated among the active portfolios on the basis of relative net assets. The Statements of Operations show the Independent Directors’ fees and expenses paid by each Portfolio.
5. Securities Transactions and Transactions with Affiliates
Purchases and sales of portfolio securities (excluding short-term investments) for the period ended June 30, 2022 were as follows:
| Portfolio | Purchases | Sales | ||||||
| Developing Markets Equity | $ | 29,492,512 | $ | 39,127,748 | ||||
| Emerging Markets Core Equity | 23,498,805 | 35,600,086 | ||||||
| Emerging Markets Equity Advantage | 25,155,680 | 28,313,721 | ||||||
| Emerging Markets Equity | 379,880,321 | 586,011,963 | ||||||
| Emerging Markets Strategic Equity | 6,556,499 | 6,499,162 | ||||||
| Equity Franchise | 124,490,029 | 78,041,500 | ||||||
| Global Equity Select | 15,753,364 | 8,010,308 | ||||||
| Global Listed Infrastructure | 2,100,439,468 | 650,376,820 | ||||||
| Global Strategic Equity | 2,638,882 | 4,357,670 | ||||||
| International Equity Advantage | 1,169,446 | 1,190,826 | ||||||
| International Equity | 265,449,719 | 468,507,901 | ||||||
| International Equity Select | 17,467,278 | 19,207,549 | ||||||
| International Quality Growth | 84,497,848 | 9,808,267 | ||||||
| International Small Cap Equity | 5,463,725 | 6,865,949 | ||||||
| International Strategic Equity | 1,005,078,283 | 1,101,401,333 | ||||||
| Managed Equity Volatility | 15,421,033 | 15,184,869 | ||||||
| US Equity Concentrated | 393,880,901 | 576,970,553 | ||||||
| US Equity Focus | 23,251,536 | 12,801,856 | ||||||
260 Semi-Annual Report
| Portfolio | Purchases | Sales | ||||||
| US Small-Mid Cap Equity | $ | 18,994,610 | $ | 34,654,274 | ||||
| US Sustainable Equity | 1,244,147 | 1,241,325 | ||||||
| US Systematic Small Cap Equity | 24,271,353 | 2,572,819 | ||||||
For the period ended June 30, 2022, the Portfolios did not engage in any cross-trades in accordance with Rule 17a-7 under the 1940 Act, and no brokerage commissions were paid to affiliates of the Investment Manager or other affiliates of the Fund for portfolio transactions executed on behalf of the Fund.
At June 30, 2022, the Investment Manager owned 21.03%, 92.01%, 13.70%, 50.92% and 93.47% of the outstanding shares of the Global Strategic Equity, International Equity Advantage, International Quality Growth, US Sustainable Equity and US Systematic Small Cap Equity Portfolio, respectively.
Holdings of 5% Voting Securities of Portfolio Companies
The 1940 Act defines “affiliated persons” to include a portfolio company in which a Portfolio owns 5% or more of the outstanding voting securities. Investments in “affiliated persons” for the Global Listed Infrastructure Portfolio for the period ended June 30, 2022 were as follows:
| Value at | Purchase | Sales | Realized | ||||||||||||||
| Issue | December 31, 2021 | cost | proceeds | gain (loss) | |||||||||||||
| Global Listed Infrastructure | |||||||||||||||||
| Atlas Arteria, Ltd. | $ | 249,880,072 | $ | — | $ | — | $ | — | |||||||||
| Eutelsat Communications SA | 142,933,220 | 5,225,241 | — | — | |||||||||||||
| SES SA | 163,718,030 | 4,386,455 | — | — | |||||||||||||
| NorthWestern Corp. | 94,352,412 | 69,949,113 | — | — | |||||||||||||
| Total Securities | $ | 650,883,734 | $ | 79,560,809 | $ | — | $ | — | |||||||||
Semi-Annual Report 261
| Change in unrealized | Shares at | Values at | |||||||||||||||
| appreciation | Dividend | June 30, | June 30, | ||||||||||||||
| Issue | (depreciation) | income | 2022 | 2022 | |||||||||||||
| Atlas Arteria, Ltd. | $ | 25,902,309 | $ | 7,565,209 | 49,611,421 | $ | 275,782,381 | ||||||||||
| Eutelsat Communications SA | (11,095,958 | ) | — | 12,131,887 | 137,062,503 | ||||||||||||
| SES SA | 17,495,397 | 9,454,960 | 21,119,089 | 185,599,882 | |||||||||||||
| NorthWestern Corp. | 4,134,440 | 3,331,110 | 2,858,238 | 168,435,965 | |||||||||||||
| Total Securities | $ | 36,436,188 | $ | 20,351,279 | 85,720,635 | $ | 766,880,731 | ||||||||||
6. Line of Credit
The Fund has a $100 million committed line of credit pursuant to an Amended and Restated Loan Agreement (the “Agreement”) with State Street, primarily for temporary or emergency purposes, including the meeting of redemption requests that otherwise might require the untimely disposition of securities. Interest on borrowings is payable at 1.00% plus the “Applicable Rate,” which is the higher of (a) the Federal Funds Rate plus 10 basis points and (b) the Overnight Bank Funding Rate (OBFR) plus 10 basis points, on an annualized basis. Under the Agreement, the Fund has agreed to pay a 0.20% per annum fee on the unused portion of the commitment, payable quarterly in arrears. The Fund has also agreed to pay an upfront fee of 0.05% of the committed line amount. During the period ended June 30, 2022, the following Portfolios had borrowings under the Agreement as follows:
| Weighted | Number | |||||||||||||||
| Average | Maximum | Average | of Days | |||||||||||||
| Daily Loan | Daily Loan | Interest | Borrowings | |||||||||||||
| Portfolio | Balance* | Outstanding | Rate | were Outstanding | ||||||||||||
| Developing Markets Equity | $ | 835,225 | $ | 2,406,000 | 1.27 | % | 8 | |||||||||
| Emerging Markets Core Equity | 613,235 | 2,785,000 | 1.57 | 17 | ||||||||||||
| Emerging Markets Equity Advantage | 1,621,436 | 4,150,800 | 1.54 | 22 | ||||||||||||
| Equity Franchise | 7,110,000 | 7,110,000 | 1.43 | 2 | ||||||||||||
| Global Strategic Equity | 323,000 | 323,000 | 1.93 | 1 | ||||||||||||
| International Equity | 5,765,982 | 18,689,100 | 1.88 | 17 | ||||||||||||
| International Quality Growth | 4,136,600 | 4,136,600 | 1.18 | 4 | ||||||||||||
| International Small Cap Equity | 479,550 | 543,400 | 1.93 | 4 | ||||||||||||
| Managed Equity Volatility | 163,700 | 256,100 | 1.69 | 5 | ||||||||||||
| US Equity Concentrated | 7,119,320 | 15,903,500 | 1.24 | 5 | ||||||||||||
| * | For days borrowings were outstanding. |
262 Semi-Annual Report
Management believes that the fair value of the liabilities under the Agreement is equivalent to the recorded amount based on its short-term maturity and interest rate, which fluctuates with the Applicable Rate. A Portfolio’s outstanding balance under the Agreement, if any, would be categorized as Level 2.
7. Investment Risks
Not all risks described below apply to all Portfolios, or may not apply to the same degree for one or more Portfolios compared to one or more other Portfolios. In addition, not all risks applicable to an investment in a Portfolio are described below. Please see the current summary prospectus for the relevant Portfolio(s) or a current Portfolio prospectus for further information regarding a Portfolio’s investment strategy and related risks.
(a) Market Risk—Portfolio may incur losses due to declines in one or more markets in which it invests. These declines may be the result of, among other things, political, regulatory, market, economic or social developments affecting the relevant market(s). To the extent that such developments impact specific industries, market sectors, countries or geographic regions, a Portfolio’s investments in such industries, market sectors, countries and/or geographic regions can be expected to be particularly affected, especially if such investments are a significant portion of its investment portfolio. In addition, turbulence in financial markets and reduced liquidity in equity, credit and/or fixed income markets may negatively affect many issuers, which could adversely affect a Portfolio. Global economies and financial markets are increasingly interconnected, and conditions and events in one country, region or financial market may adversely impact issuers worldwide. As a result, local, regional or global events such as war, acts of terrorism, the spread of infectious illness or other public health issues, recessions or other events could have a significant negative impact on global economic and market conditions. The coronavirus disease 2019 (COVID-19) global pandemic and the aggressive responses taken by many governments or voluntarily imposed by private parties, including closing borders, restricting travel and imposing prolonged quarantines or similar restrictions, as well as the closure of,
Semi-Annual Report 263
or operational changes to, many retail and other businesses, has had negative impacts, and in many cases severe negative impacts, on markets worldwide. It is not known how long the effects of such impacts, or any future impacts of other significant events described above, will or would last, but there could be a prolonged period of global economic slowdown, which may be expected to impact a Portfolio and its investments.
(b) Non-US Securities Risk—A Portfolio’s performance will be influenced by political, social and economic factors affecting the non-US countries and companies in which the Portfolio invests. Non-US securities carry special risks, such as less developed or less efficient trading markets, political instability, a lack of company information, differing auditing and legal standards, and, potentially, less liquidity.
(c) Emerging Market Risk—Emerging market countries generally have economic structures that are less diverse and mature, and political systems that are less stable, than those of developed countries. The economies of countries with emerging markets may be based predominantly on only a few industries, may be highly vulnerable to changes in local or global trade conditions, and may suffer from extreme debt burdens or volatile inflation rates. The securities markets of emerging market countries have historically been extremely volatile and less liquid than more developed markets. These market conditions may continue or worsen. Investments in these countries may be subject to political, economic, legal, market and currency risks. Significant devaluation of emerging market currencies against the US dollar may occur subsequent to acquisition of investments denominated in emerging market currencies.
(d) Foreign Currency Risk—Investments denominated in currencies other than US dollars may experience a decline in value, in US dollar terms, due solely to fluctuations in currency exchange rates. A Portfolio’s investments denominated in such currencies (particularly currencies of emerging markets countries), as well as any investments in currencies themselves, could be adversely affected by delays in, or a refusal to grant, repatriation of funds or conversion of currencies. Irrespective of any foreign currency
264 Semi-Annual Report
exposure hedging, a Portfolio may experience a decline in the value of its portfolio securities, in US dollar terms, due solely to fluctuations in currency exchange rates.
(e) Forward Currency Contracts and Currency Hedging Risk—Forward currency contracts, including those entered into for hedging purposes (i.e., seeking to protect Portfolio investments), may increase volatility, reduce returns, limit gains or magnify losses, perhaps substantially, particularly since forward currency contracts, like most derivative instruments, have a leverage component that provides investment exposure in excess of the amount invested. Forward currency contracts are subject to the risks of the creditworthiness of and default by the counterparty and consequently may lose all of a portion of their value due solely to the creditworthiness of or default by the counterparty. Forward currency contracts also may be illiquid. Changes in liquidity may result in significant, rapid and unpredictable changes in the value of such contracts. Forward currency contracts are subject to many of the risks of, and can be highly sensitive to changes in the value of, the related currencies. As such, a small investment could have a potentially large impact on a Portfolio’s performance. Forward currency contracts incur costs, which reduce returns, and costs of engaging in such transactions may outweigh any gains or any losses averted from hedging activities. Successful use of forward currency contracts, whether for hedging or for other investment purposes, is subject to the Investment Manager’s ability to accurately predict movements in currency exchange rates and, for hedging transactions, there may be imperfect correlations between movements in exchange rates that could cause a Portfolio to incur significant losses. Use of forward currency contracts, even if entered into for hedging purposes, may cause a Portfolio to experience losses greater than if the Portfolio had not engaged in such transactions. New Securities and Exchange Commission (the “SEC”) Rule 18f-4 under the 1940 Act, with which investment companies must comply beginning in August 2022, will regulate and, in some cases limit, the use of derivatives for certain funds and may require a Portfolio to alter, perhaps materially, its use of derivatives.
Semi-Annual Report 265
(f) Country Risk—Implementation of certain Portfolios’ investment strategies may, during certain periods, result in the investment of a significant portion of such Portfolios’ assets in a particular country, such as China or Japan, and a Portfolio would be expected to be affected by political, regulatory, market, economic and social developments affecting that country.
Specific risks associated with investments in China include exposure to currency fluctuations, less liquidity, expropriation, confiscatory taxation, nationalization, exchange control regulations (including currency blockage), trading halts, imposition of tariffs, limitations on repatriation and differing legal standards. Certain Portfolios may invest in eligible renminbi-denominated class A shares of equity securities that are listed and traded on certain Chinese stock exchanges (“China A-Shares”) through Hong Kong Stock Connect Program (“Stock Connect”). While Stock Connect is not subject to individual investment quotas, daily and aggregate investment quotas apply to all Stock Connect participants, which may restrict or preclude a Portfolio’s ability to invest in China A-Shares (although the Portfolio would be permitted to sell China A-Shares regardless of the quota balance). Stock Connect is also subject to trading, clearance, settlement and operational risks.
Certain Portfolios may obtain exposure to companies based or operated in China by investing through legal structures known as variable interest entities (“VIEs”). Instead of directly owning the equity securities of a Chinese company, a VIE enters into service and other contracts with the Chinese company. Although the VIE has no equity ownership of the Chinese company, the contractual arrangements permit the VIE to consolidate the Chinese company into its financial statements. VIE investments are subject to the risk that any breach of these contractual arrangements will be subject to Chinese law and jurisdiction, that Chinese law may be interpreted or change in a way that affects the enforceability of the VIE’s arrangements, or that contracts between the Chinese company and the VIE may otherwise not be enforceable under Chinese law. VIE structures also could face delisting or other ramifications for failure to meet the requirements of the SEC, the
266 Semi-Annual Report
Public Company Accounting Oversight Board or other United States regulators. If these risks materialize, the value of investments in VIEs could be adversely affected and the Portfolios could incur significant losses with no recourse available.
Over the last few decades, Japan’s economic growth rate had remained relatively low compared to that of its Asian neighbors and other major developed economies mainly due to deflation. Japan has few natural resources and limited land area and is reliant on imports for its commodity needs. Fluctuations or shortages in relevant commodity markets could have a negative impact on Japan’s economy. The Japanese economy also can be adversely affected by trade tariffs, other protectionist measures, competition from emerging economies, and the economic conditions of its trading partners. Japan has a growing economic relationship with China and other Southeast Asian countries, and economic, political or social instability in those countries could have an adverse effect on Japan’s economy. The Japanese yen has fluctuated widely at times, and any increase in the yen’s value may cause a decline in Japan’s exports.
(g) Sector Risk—Implementation of certain Portfolios’ investment strategies may, during certain periods, result in the investment of a significant portion of such Portfolios’ assets in a particular market sector, and a Portfolio would be expected to be affected by developments in that sector.
(h) Franchise Companies Risk—Changes in the worldwide economy, consumer spending, competition, demographics and consumer preferences, government regulation and economic conditions may adversely affect franchise companies individually or across an industry and may negatively impact a Portfolio to a greater extent than if the Portfolio’s assets were invested more broadly in a number of types of companies.
(i) Infrastructure Companies Risk—Securities and instruments of infrastructure companies, which consist of utilities, pipelines, toll roads, airports, railroads, ports, telecommunications and other infrastructure companies, are more susceptible to adverse economic or regulatory occurrences affecting their industries.
Semi-Annual Report 267
Infrastructure companies may be subject to a variety of factors that may adversely affect their business or operations, including high interest costs in connection with capital construction programs, high leverage, costs associated with environmental and other regulations, the effects of economic slowdown, surplus capacity, increased competition from other providers of services, uncertainties concerning the availability of fuel at reasonable prices, the effects of energy conservation policies and other factors. Infrastructure companies also may be affected by or subject to, among other factors, regulation by various government authorities, including rate regulation and service interruption due to environmental, operational or other mishaps.
(j) Sustainable Investing Risk—A Portfolio’s performance is dependent upon, among other things, the success of its investment strategy as implemented by the Investment Manager (i.e., the performance of the investments purchased pursuant to the investment strategy). A Portfolio’s investment strategy which focuses on investing in companies that satisfy the criteria for being considered a Sustainable Company (as described in the Prospectus), which may cause the Investment Manager to forgo investments for the Portfolio that the Investment Manager otherwise believes may be attractive but that are not considered to be Sustainable Companies.
(k) Other Equity Securities Risk—Investments in rights and warrants involve certain risks, including the possible lack of a liquid market for resale, price fluctuations and the failure of the price of the underlying security to reach a level at which the right or warrant can be prudently exercised, in which case the right or warrant may expire without being exercised and result in a loss of a Portfolio’s entire investment.
(l) Depositary Receipts Risk—ADRs and similar depositary receipts typically will be subject to certain of the risks associated with direct investments in the securities of non-US companies, because their values depend on the performance of the underlying non-US securities. However, currency fluctuations will impact investments in depositary receipts differently than direct investments in non-US dollar-denominated non-US securities, because a depositary receipt will not appreciate in value solely as
268 Semi-Annual Report
a result of appreciation in the currency in which the underlying non-US dollar security is denominated.
(m) REIT Risk—REITs are subject to similar risks as an investment in a realty-related company. Consequently, investments in REITs could lead to investment results that may be significantly different from investments in broader securities markets. The risks related to investments in realty-related companies include, but are not limited to: adverse changes in general economic and local market conditions; adverse developments in employment; changes in supply or demand for similar or competing properties; unfavorable changes in applicable taxes, governmental regulations and interest rates; operating or development expenses; and lack of available financing. Due to certain special considerations that apply to REITs, investments in REITs may carry additional risks not necessarily present in investments in other securities. REIT securities (including those trading on national exchanges) typically have trading volumes that are less than those of securities of other types of companies, which may affect a Portfolio’s ability to trade or liquidate those securities. An investment in a REIT may be adversely affected if the REIT fails to comply with applicable laws and regulations, including failing to qualify as a REIT under the Code. Failure to qualify with any of these requirements could jeopardize a company’s status as a REIT. A Portfolio generally will have no control over the operations and policies of a REIT, including qualification as a REIT.
(n) ETF Risk—Shares of exchange-traded funds (“ETFs”) may trade at prices that vary from their net asset values, sometimes significantly. The shares of ETFs may trade at prices at, below or above their most recent net asset value. In addition, the performance of an ETF pursuing a passive index-based strategy may diverge from the performance of the index. A Portfolio’s investments in ETFs are subject to the risks of the ETF’s investments, as well as to the general risks of investing in ETFs. A Portfolio investing in ETFs will bear not only the Portfolio’s management fees and operating expenses, but also the Portfolio’s proportional share of the management fees and operating expenses of the ETFs in which the Portfolio invests. Although Section 12 of the 1940 Act limits the amount of a Portfolio’s assets that may be invested in one or more ETFs (subject to certain exceptions). Rule 12d1-4 under the 1940 Act
Semi-Annual Report 269
allows a Portfolio to acquire the securities of another investment company, including ETFs, in excess of the limitations imposed by Section 12, subject to certain limitations and conditions.
(o) Non-Diversification Risk—The net asset value of a Portfolio that is classified as “non-diversified” may be more vulnerable to changes in the market value of a single issuer or group of issuers and may be relatively more susceptible to adverse effects from any single corporate, industry, economic, market, political or regulatory occurrence than if the Portfolio’s investments consisted of securities issued by a larger number of issuers.
(p) Quantitative Model Risk—The success of certain Portfolios’ investment strategy depends largely upon the effectiveness of the Investment Manager’s quantitative model. A quantitative model, such as the risk and other models used by the Investment Manager for certain Portfolios requires adherence to a systematic, disciplined process. The Investment Manager’s ability to monitor and, if necessary, adjust its quantitative model could be adversely affected by various factors including incorrect or outdated market and other data inputs. Factors that affect a security’s value can change over time, and these changes may not be reflected in the quantitative model. In addition, factors used in quantitative analysis and the weight placed on those factors may not be predictive of a security’s value.
(q) Cybersecurity Risk—The Portfolios and their service providers are susceptible to operational and information security and related risks of cybersecurity incidents. Cybersecurity attacks include, but are not limited to, gaining unauthorized access to digital systems (e.g., through “hacking” or malicious software coding) for purposes of misappropriating assets or sensitive information, corrupting data or causing operational disruption. Cybersecurity incidents affecting the Investment Manager, transfer agent or custodian or other service providers such as financial intermediaries have the ability to cause disruptions and impact business operations, potentially resulting in financial losses, including by impediments to a Portfolio’s investment trading; the inability of Portfolio shareholders to purchase and redeem Portfolio shares; interference with a Portfolio’s ability to
270 Semi-Annual Report
calculate its NAV; violations of applicable privacy, data security or other laws; regulatory fines and penalties; reputational damage;
reimbursement or other compensation or remediation costs; legal fees; or additional compliance costs. Similar adverse consequences could result from cybersecurity incidents affecting issuers of securities in which a Portfolio invests; counterparties with which a Portfolio engages in transactions; governmental and other regulatory authorities, exchange and other financial market operators; and banks, brokers, dealers, insurance companies and other financial institutions and other parties. There are inherent limitations in any cybersecurity risk management systems or business continuity plans, including the possibility that certain risks have not been identified.
(r) Geopolitical Risk—As a result of the ongoing armed conflict between Russia and Ukraine, the United States, the United Kingdom, the European Union, and several other nations have announced a broad array of new or expanded sanctions, export controls, and other measures against Russia, as well as upon certain banks, companies, government officials, and other individuals in or affiliated with Russia and Belarus. The ongoing conflict and the evolving response measures may continue to have a negative impact on the economy and business activity globally (including in the countries in which the Portfolios invest), and therefore, could adversely affect the performance of the Portfolios’ investments. The severity and duration of the conflict is unknown and could continue to impact global economic and market conditions adversely. Management will continue to seek to assess the potential impacts on valuation and liquidity and will take any actions needed in accordance with procedures already approved by the Board of Directors.
8. Contractual Obligations
The Fund enters into contracts in the normal course of business that contain a variety of indemnification provisions. A Portfolio’s maximum exposure under these arrangements is unknown. Management has reviewed the Fund’s existing contracts and expects the risk of loss to be remote.
Semi-Annual Report 271
9. Fair Value Measurements
Fair value is defined as the price that a Portfolio would receive to sell an asset, or would pay to transfer a liability, in an orderly transaction between market participants at the date of measurement. The Fair Value Measurements and Disclosures provisions of GAAP also establish a framework for measuring fair value, and a three-level hierarchy for fair value measurement that is based upon the transparency of inputs to the valuation of an asset or liability. Inputs may be observable or unobservable and refer, broadly, to the assumptions that market participants would use in pricing the asset or liability. Observable inputs reflect the assumptions that market participants would use in pricing the asset or liability based on market data obtained from sources independent of the Fund. Unobservable inputs reflect the Fund’s own assumptions about the assumptions that market participants would use in pricing the asset or liability, developed based on the best information available in the circumstances. The fair value measurement level within the fair value hierarchy for the assets and liabilities of the Fund is based on the lowest level of any input that is significant to the overall fair value measurement. The three-level hierarchy of inputs is summarized below:
| ● | Level 1 – unadjusted quoted prices in active markets for identical assets and liabilities |
| ● | Level 2 – other significant observable inputs (including unadjusted quoted prices for similar assets and liabilities, interest rates, prepayment speeds, credit risk, etc.) |
| ● | Level 3 – significant unobservable inputs (including the Fund’s own assumptions in determining the fair value of assets and liabilities) |
Changes in valuation methodology or input may result in transfers into or out of the current assigned level within the hierarchy.
The inputs or methodology used for valuing securities are not necessarily an indication of the risks associated with investing in these securities.
272 Semi-Annual Report
The following table summarizes the valuation of the Portfolios’ assets and liabilities by each fair value hierarchy level as of June 30, 2022:
| Description | Unadjusted Quoted Prices in Active Markets for Identical Assets and Liabilities (Level 1) | Significant Other Observable Inputs (Level 2) | Significant Unobservable Inputs (Level 3) | Balance as of June 30, 2022 | ||||||||||||||||
| Developing Markets Equity Portfolio | ||||||||||||||||||||
| Common Stocks* | ||||||||||||||||||||
| Brazil | $ | 4,629,842 | $ | — | $ | — | $ | 4,629,842 | ||||||||||||
| China | 9,859,557 | 35,345,539 | — | 45,205,096 | ||||||||||||||||
| Colombia | 724,659 | — | — | 724,659 | ||||||||||||||||
| Hong Kong | — | 1,087,294 | — | 1,087,294 | ||||||||||||||||
| Hungary | — | 1,459,061 | — | 1,459,061 | ||||||||||||||||
| India | 5,745,497 | 6,486,405 | — | 12,231,902 | ||||||||||||||||
| Indonesia | — | 3,940,864 | — | 3,940,864 | ||||||||||||||||
| Mexico | 2,277,241 | — | — | 2,277,241 | ||||||||||||||||
| Peru | 997,411 | — | — | 997,411 | ||||||||||||||||
| Philippines | — | 2,586,420 | — | 2,586,420 | ||||||||||||||||
| Poland | — | 864,205 | — | 864,205 | ||||||||||||||||
| South Africa | — | 4,017,888 | — | 4,017,888 | ||||||||||||||||
| South Korea | — | 13,181,782 | — | 13,181,782 | ||||||||||||||||
| Taiwan | 1,650,229 | 16,091,028 | — | 17,741,257 | ||||||||||||||||
| United States | — | 2,304,633 | — | 2,304,633 | ||||||||||||||||
| Zambia | 1,229,044 | — | — | 1,229,044 | ||||||||||||||||
| Short-Term Investments | 1,674,713 | — | — | 1,674,713 | ||||||||||||||||
| Total | $ | 28,788,193 | $ | 87,365,119 | $ | — | $ | 116,153,312 | ||||||||||||
Semi-Annual Report 273
| Description | Unadjusted Quoted Prices in Active Markets for Identical Assets and Liabilities (Level 1) | Significant Other Observable Inputs (Level 2) | Significant Unobservable Inputs (Level 3) | Balance as of June 30, 2022 | ||||||||||||||||
| Emerging Markets Core Equity Portfolio | ||||||||||||||||||||
| Common Stocks* | ||||||||||||||||||||
| Austria | $ | — | $ | 1,562,893 | $ | — | $ | 1,562,893 | ||||||||||||
| Brazil | 8,495,610 | — | — | 8,495,610 | ||||||||||||||||
| Canada | 1,578,586 | — | — | 1,578,586 | ||||||||||||||||
| China | 7,797,819 | 24,007,532 | — | 31,805,351 | ||||||||||||||||
| Hong Kong | — | 1,029,773 | — | 1,029,773 | ||||||||||||||||
| India | 6,870,827 | 7,395,104 | — | 14,265,931 | ||||||||||||||||
| Indonesia | 1,476,519 | 1,735,025 | — | 3,211,544 | ||||||||||||||||
| Malaysia | — | 1,120,606 | — | 1,120,606 | ||||||||||||||||
| Mexico | 5,302,248 | — | — | 5,302,248 | ||||||||||||||||
| Philippines | — | 1,696,756 | — | 1,696,756 | ||||||||||||||||
| Poland | — | 1,574,297 | — | 1,574,297 | ||||||||||||||||
| Qatar | — | 1,124,484 | — | 1,124,484 | ||||||||||||||||
| South Africa | — | 2,603,564 | — | 2,603,564 | ||||||||||||||||
| South Korea | — | 12,236,958 | — | 12,236,958 | ||||||||||||||||
| Taiwan | 10,095,716 | 4,417,615 | — | 14,513,331 | ||||||||||||||||
| Thailand | — | 3,593,951 | — | 3,593,951 | ||||||||||||||||
| United Arab Emirates | — | 3,088,568 | — | 3,088,568 | ||||||||||||||||
| United Kingdom | 896,481 | — | — | 896,481 | ||||||||||||||||
| United States | 841,116 | — | — | 841,116 | ||||||||||||||||
| Short-Term Investments | 547,500 | — | — | 547,500 | ||||||||||||||||
| Total | $ | 43,902,422 | $ | 67,187,126 | $ | — | $ | 111,089,548 | ||||||||||||
274 Semi-Annual Report
| Description | Unadjusted Quoted Prices in Active Markets for Identical Assets and Liabilities (Level 1) | Significant Other Observable Inputs (Level 2) | Significant Unobservable Inputs (Level 3) | Balance as of June 30, 2022 | ||||||||||||||||
| Emerging Markets Equity Advantage Portfolio | ||||||||||||||||||||
| Common Stocks* | ||||||||||||||||||||
| Brazil | $ | 1,363,039 | $ | — | $ | — | $ | 1,363,039 | ||||||||||||
| Chile | 239,982 | — | — | 239,982 | ||||||||||||||||
| China | 1,047,294 | 17,898,549 | — | 18,945,843 | ||||||||||||||||
| Colombia | 226,570 | — | — | 226,570 | ||||||||||||||||
| Czech Republic | — | 227,479 | — | 227,479 | ||||||||||||||||
| Greece | — | 284,849 | — | 284,849 | ||||||||||||||||
| Hong Kong | — | 146,300 | — | 146,300 | ||||||||||||||||
| Hungary | — | 220,318 | — | 220,318 | ||||||||||||||||
| India | 4,307,339 | 1,849,896 | — | 6,157,235 | ||||||||||||||||
| Indonesia | 132,469 | 1,881,986 | — | 2,014,455 | ||||||||||||||||
| Malaysia | — | 789,897 | — | 789,897 | ||||||||||||||||
| Mexico | 1,409,532 | — | — | 1,409,532 | ||||||||||||||||
| Philippines | — | 304,616 | — | 304,616 | ||||||||||||||||
| Poland | — | 228,123 | — | 228,123 | ||||||||||||||||
| Russia | — | — | — | — | ||||||||||||||||
| Saudi Arabia | — | 2,158,686 | — | 2,158,686 | ||||||||||||||||
| South Africa | 217,802 | 1,507,384 | — | 1,725,186 | ||||||||||||||||
| South Korea | — | 6,638,931 | — | 6,638,931 | ||||||||||||||||
| Taiwan | — | 7,733,380 | — | 7,733,380 | ||||||||||||||||
| Thailand | — | 1,149,663 | — | 1,149,663 | ||||||||||||||||
| United States | 162,977 | 38,356 | — | 201,333 | ||||||||||||||||
| Preferred Stocks* | ||||||||||||||||||||
| Brazil | 417,548 | — | — | 417,548 | ||||||||||||||||
| Short-Term Investments | 737,913 | — | — | 737,913 | ||||||||||||||||
| Total | $ | 10,262,465 | $ | 43,058,413 | $ | — | $ | 53,320,878 | ||||||||||||
Semi-Annual Report 275
| Description | Unadjusted Quoted Prices in Active Markets for Identical Assets and Liabilities (Level 1) | Significant Other Observable Inputs (Level 2) | Significant Unobservable Inputs (Level 3) | Balance as of June 30, 2022 | ||||||||||||||||
| Emerging Markets Equity Portfolio | ||||||||||||||||||||
| Common Stocks* | ||||||||||||||||||||
| Austria | $ | — | $ | 18,128,817 | $ | — | $ | 18,128,817 | ||||||||||||
| Brazil | 324,885,851 | — | — | 324,885,851 | ||||||||||||||||
| China | — | 741,235,413 | — | 741,235,413 | ||||||||||||||||
| Egypt | — | 25,212,744 | — | 25,212,744 | ||||||||||||||||
| Greece | — | 31,894,451 | — | 31,894,451 | ||||||||||||||||
| Hong Kong | — | 31,419,592 | — | 31,419,592 | ||||||||||||||||
| Hungary | — | 32,205,595 | — | 32,205,595 | ||||||||||||||||
| India | — | 200,322,289 | — | 200,322,289 | ||||||||||||||||
| Indonesia | 34,674,960 | 87,966,271 | — | 122,641,231 | ||||||||||||||||
| Mexico | 139,586,096 | — | — | 139,586,096 | ||||||||||||||||
| Portugal | — | 73,490,084 | — | 73,490,084 | ||||||||||||||||
| Russia | — | — | 18 | 18 | ||||||||||||||||
| South Africa | — | 213,972,584 | — | 213,972,584 | ||||||||||||||||
| South Korea | — | 405,354,385 | — | 405,354,385 | ||||||||||||||||
| Taiwan | — | 301,661,404 | — | 301,661,404 | ||||||||||||||||
| Thailand | — | 48,816,379 | — | 48,816,379 | ||||||||||||||||
| United Kingdom | — | 44,175,881 | — | 44,175,881 | ||||||||||||||||
| Short-Term Investments | 54,058,325 | — | — | 54,058,325 | ||||||||||||||||
| Total | $ | 553,205,232 | $ | 2,255,855,889 | $ | 18 | $ | 2,809,061,139 | ||||||||||||
276 Semi-Annual Report
| Description | Unadjusted Quoted Prices in Active Markets for Identical Assets and Liabilities (Level 1) | Significant Other Observable Inputs (Level 2) | Significant Unobservable Inputs (Level 3) | Balance as of June 30, 2022 | ||||||||||||||||
| Emerging Markets Strategic Equity Portfolio | ||||||||||||||||||||
| Common Stocks* | ||||||||||||||||||||
| Brazil | $ | 3,103,567 | $ | — | $ | — | $ | 3,103,567 | ||||||||||||
| China | 4,698,965 | 9,437,308 | — | 14,136,273 | ||||||||||||||||
| France | 530,824 | — | — | 530,824 | ||||||||||||||||
| Greece | — | 375,697 | — | 375,697 | ||||||||||||||||
| Hong Kong | — | 635,448 | — | 635,448 | ||||||||||||||||
| India | — | 6,952,835 | — | 6,952,835 | ||||||||||||||||
| Indonesia | 573,005 | 1,323,311 | — | 1,896,316 | ||||||||||||||||
| Macau | — | 353,582 | — | 353,582 | ||||||||||||||||
| Mexico | 2,357,424 | — | — | 2,357,424 | ||||||||||||||||
| Russia | — | — | — | — | ||||||||||||||||
| Saudi Arabia | — | 1,233,182 | — | 1,233,182 | ||||||||||||||||
| South Africa | — | 2,150,818 | — | 2,150,818 | ||||||||||||||||
| South Korea | — | 5,388,335 | — | 5,388,335 | ||||||||||||||||
| Taiwan | — | 6,552,427 | — | 6,552,427 | ||||||||||||||||
| Thailand | 564,801 | — | — | 564,801 | ||||||||||||||||
| United Kingdom | — | 851,399 | — | 851,399 | ||||||||||||||||
| Preferred Stocks* | ||||||||||||||||||||
| Brazil | 531,797 | — | — | 531,797 | ||||||||||||||||
| Short-Term Investments | 1,163,949 | — | — | 1,163,949 | ||||||||||||||||
| Total | $ | 13,524,332 | $ | 35,254,342 | $ | — | $ | 48,778,674 | ||||||||||||
| Lazard Equity Franchise Portfolio | ||||||||||||||||||||
| Common Stocks* | ||||||||||||||||||||
| Belgium | $ | — | $ | 2,932,639 | $ | — | $ | 2,932,639 | ||||||||||||
| France | — | 2,924,757 | — | 2,924,757 | ||||||||||||||||
| Germany | — | 6,863,968 | — | 6,863,968 | ||||||||||||||||
| Japan | — | 5,921,937 | — | 5,921,937 | ||||||||||||||||
| Luxembourg | — | 5,872,776 | — | 5,872,776 | ||||||||||||||||
| Spain | — | 6,957,176 | — | 6,957,176 | ||||||||||||||||
| United States | 108,384,779 | — | — | 108,384,779 | ||||||||||||||||
| Short-Term Investments | 4,471,481 | — | — | 4,471,481 | ||||||||||||||||
| Total | $ | 112,856,260 | $ | 31,473,253 | $ | — | $ | 144,329,513 | ||||||||||||
Semi-Annual Report 277
| Description | Unadjusted Quoted Prices in Active Markets for Identical Assets and Liabilities (Level 1) | Significant Other Observable Inputs (Level 2) | Significant Unobservable Inputs (Level 3) | Balance as of June 30, 2022 | ||||||||||||||||
| Global Equity Select Portfolio | ||||||||||||||||||||
| Common Stocks* | ||||||||||||||||||||
| Brazil | $ | 802,583 | $ | — | $ | — | $ | 802,583 | ||||||||||||
| Canada | 5,720,709 | — | — | 5,720,709 | ||||||||||||||||
| China | 2,030,495 | 1,159,089 | — | 3,189,584 | ||||||||||||||||
| Denmark | — | 853,126 | — | 853,126 | ||||||||||||||||
| France | — | 4,117,935 | — | 4,117,935 | ||||||||||||||||
| Germany | — | 937,229 | — | 937,229 | ||||||||||||||||
| Hong Kong | — | 1,289,353 | — | 1,289,353 | ||||||||||||||||
| India | 1,256,660 | — | — | 1,256,660 | ||||||||||||||||
| Japan | — | 4,698,457 | — | 4,698,457 | ||||||||||||||||
| Netherlands | — | 2,565,705 | — | 2,565,705 | ||||||||||||||||
| Spain | — | 687,780 | — | 687,780 | �� | |||||||||||||||
| Sweden | — | 1,866,635 | — | 1,866,635 | ||||||||||||||||
| Switzerland | — | 3,502,571 | — | 3,502,571 | ||||||||||||||||
| Taiwan | 1,695,086 | — | — | 1,695,086 | ||||||||||||||||
| United Kingdom | 1,154,774 | 5,182,517 | — | 6,337,291 | ||||||||||||||||
| United States | 54,468,339 | — | — | 54,468,339 | ||||||||||||||||
| Short-Term Investments | 1,297,099 | — | — | 1,297,099 | ||||||||||||||||
| Total | $ | 68,425,745 | $ | 26,860,397 | $ | — | $ | 95,286,142 | ||||||||||||
| Global Listed Infrastructure Portfolio | ||||||||||||||||||||
| Assets: | ||||||||||||||||||||
| Common Stocks* | ||||||||||||||||||||
| Australia | $ | — | $ | 477,681,844 | $ | — | $ | 477,681,844 | ||||||||||||
| Canada | 168,172,483 | — | — | 168,172,483 | ||||||||||||||||
| France | — | 527,398,626 | — | 527,398,626 | ||||||||||||||||
| Hong Kong | — | 314,116,538 | — | 314,116,538 | ||||||||||||||||
| Italy | — | 1,680,659,104 | — | 1,680,659,104 | ||||||||||||||||
| Luxembourg | — | 185,599,882 | — | 185,599,882 | ||||||||||||||||
| Portugal | — | 73,954,442 | — | 73,954,442 | ||||||||||||||||
| Spain | — | 638,267,557 | — | 638,267,557 | ||||||||||||||||
| Switzerland | — | 129,033,776 | — | 129,033,776 | ||||||||||||||||
| United Kingdom | — | 1,434,176,791 | — | 1,434,176,791 | ||||||||||||||||
| United States | 2,188,779,878 | — | — | 2,188,779,878 | ||||||||||||||||
| Short-Term Investments | 662,580,630 | — | — | 662,580,630 | ||||||||||||||||
| Other Financial Instruments† | ||||||||||||||||||||
| Forward Currency Contracts | — | 42,562,258 | — | 42,562,258 | ||||||||||||||||
| Total | $ | 3,019,532,991 | $ | 5,503,450,818 | $ | — | $ | 8,522,983,809 | ||||||||||||
| Liabilities: | ||||||||||||||||||||
| Other Financial Instruments† | ||||||||||||||||||||
| Forward Currency Contracts | $ | — | $ | (4,374,932 | ) | $ | — | $ | (4,374,932 | ) | ||||||||||
278 Semi-Annual Report
| Description | Unadjusted Quoted Prices in Active Markets for Identical Assets and Liabilities (Level 1) | Significant Other Observable Inputs (Level 2) | Significant Unobservable Inputs (Level 3) | Balance as of June 30, 2022 | ||||||||||||||||
| Global Strategic Equity Portfolio | ||||||||||||||||||||
| Common Stocks* | ||||||||||||||||||||
| Canada | $ | 474,283 | $ | — | $ | — | $ | 474,283 | ||||||||||||
| China | — | 131,699 | — | 131,699 | ||||||||||||||||
| Denmark | — | 206,300 | — | 206,300 | ||||||||||||||||
| France | — | 354,095 | — | 354,095 | ||||||||||||||||
| Germany | — | 561,814 | — | 561,814 | ||||||||||||||||
| Hong Kong | — | 213,093 | — | 213,093 | ||||||||||||||||
| India | 174,663 | — | — | 174,663 | ||||||||||||||||
| Japan | — | 544,416 | — | 544,416 | ||||||||||||||||
| Netherlands | — | 390,994 | — | 390,994 | ||||||||||||||||
| Portugal | — | 202,894 | — | 202,894 | ||||||||||||||||
| South Africa | — | 149,247 | — | 149,247 | ||||||||||||||||
| South Korea | 193,972 | — | — | 193,972 | ||||||||||||||||
| Sweden | — | 68,791 | — | 68,791 | ||||||||||||||||
| Switzerland | — | 312,173 | — | 312,173 | ||||||||||||||||
| Taiwan | — | 238,899 | — | 238,899 | ||||||||||||||||
| United Kingdom | — | 754,533 | — | 754,533 | ||||||||||||||||
| United States | 7,066,073 | — | — | 7,066,073 | ||||||||||||||||
| Short-Term Investments | 409,062 | — | — | 409,062 | ||||||||||||||||
| Total | $ | 8,318,053 | $ | 4,128,948 | $ | — | $ | 12,447,001 | ||||||||||||
Semi-Annual Report 279
| Description | Unadjusted Quoted Prices in Active Markets for Identical Assets and Liabilities (Level 1) | Significant Other Observable Inputs (Level 2) | Significant Unobservable Inputs (Level 3) | Balance as of June 30, 2022 | ||||||||||||||||
| International Equity Advantage Portfolio | ||||||||||||||||||||
| Common Stocks* | ||||||||||||||||||||
| Australia | $ | — | $ | 209,109 | $ | — | $ | 209,109 | ||||||||||||
| Belgium | — | 3,682 | — | 3,682 | ||||||||||||||||
| China | — | 31,505 | — | 31,505 | ||||||||||||||||
| Denmark | — | 97,994 | — | 97,994 | ||||||||||||||||
| Finland | 10,257 | 1,832 | — | 12,089 | ||||||||||||||||
| France | — | 246,451 | — | 246,451 | ||||||||||||||||
| Germany | — | 135,612 | — | 135,612 | ||||||||||||||||
| Hong Kong | — | 52,571 | — | 52,571 | ||||||||||||||||
| Israel | 10,541 | — | — | 10,541 | ||||||||||||||||
| Italy | — | 25,048 | — | 25,048 | ||||||||||||||||
| Japan | 49,516 | 482,202 | — | 531,718 | ||||||||||||||||
| Luxembourg | — | 4,506 | — | 4,506 | ||||||||||||||||
| Malta | — | 1,106 | — | 1,106 | ||||||||||||||||
| Netherlands | — | 203,290 | — | 203,290 | ||||||||||||||||
| New Zealand | — | 1,607 | — | 1,607 | ||||||||||||||||
| Norway | — | 9,446 | — | 9,446 | ||||||||||||||||
| Portugal | — | 18,606 | — | 18,606 | ||||||||||||||||
| Singapore | 3,276 | 32,487 | — | 35,763 | ||||||||||||||||
| South Africa | — | 16,031 | — | 16,031 | ||||||||||||||||
| Spain | — | 111,750 | — | 111,750 | ||||||||||||||||
| Sweden | — | 40,320 | 15,757 | 56,077 | ||||||||||||||||
| Switzerland | — | 172,138 | — | 172,138 | ||||||||||||||||
| United Kingdom | 9,441 | 229,909 | — | 239,350 | ||||||||||||||||
| United States | 6,236 | 141,654 | — | 147,890 | ||||||||||||||||
| Preferred Stocks* | ||||||||||||||||||||
| Germany | — | 14,762 | — | 14,762 | ||||||||||||||||
| Short-Term Investments | 6,476 | — | — | 6,476 | ||||||||||||||||
| Total | $ | 95,743 | $ | 2,283,618 | $ | 15,757 | $ | 2,395,118 | ||||||||||||
280 Semi-Annual Report
| Description | Unadjusted Quoted Prices in Active Markets for Identical Assets and Liabilities (Level 1) | Significant Other Observable Inputs (Level 2) | Significant Unobservable Inputs (Level 3) | Balance as of June 30, 2022 | ||||||||||||||||
| International Equity Portfolio | ||||||||||||||||||||
| Common Stocks* | ||||||||||||||||||||
| Canada | $ | 58,932,257 | $ | — | $ | — | $ | 58,932,257 | ||||||||||||
| China | 11,153,280 | 62,900,906 | — | 74,054,186 | ||||||||||||||||
| Denmark | — | 27,076,413 | — | 27,076,413 | ||||||||||||||||
| Finland | — | 26,665,546 | — | 26,665,546 | ||||||||||||||||
| France | — | 151,182,122 | — | 151,182,122 | ||||||||||||||||
| Germany | — | 98,430,691 | — | 98,430,691 | ||||||||||||||||
| Hong Kong | — | 11,214,565 | — | 11,214,565 | ||||||||||||||||
| India | — | 16,151,006 | — | 16,151,006 | ||||||||||||||||
| Ireland | 39,627,272 | — | — | 39,627,272 | ||||||||||||||||
| Israel | — | 16,991,008 | — | 16,991,008 | ||||||||||||||||
| Italy | — | 17,561,604 | — | 17,561,604 | ||||||||||||||||
| Japan | — | 186,776,841 | — | 186,776,841 | ||||||||||||||||
| Mexico | 16,405,845 | — | — | 16,405,845 | ||||||||||||||||
| Netherlands | — | 74,444,495 | — | 74,444,495 | ||||||||||||||||
| Norway | — | 29,472,979 | — | 29,472,979 | ||||||||||||||||
| Portugal | — | 17,401,613 | — | 17,401,613 | ||||||||||||||||
| Singapore | — | 17,070,438 | — | 17,070,438 | ||||||||||||||||
| South Africa | — | 18,429,235 | — | 18,429,235 | ||||||||||||||||
| South Korea | 7,071,598 | 11,701,281 | — | 18,772,879 | ||||||||||||||||
| Spain | — | 14,598,310 | — | 14,598,310 | ||||||||||||||||
| Sweden | — | 12,374,794 | — | 12,374,794 | ||||||||||||||||
| Switzerland | — | 45,083,783 | — | 45,083,783 | ||||||||||||||||
| United Kingdom | — | 156,740,689 | — | 156,740,689 | ||||||||||||||||
| United States | 40,500,773 | 13,473,390 | — | 53,974,163 | ||||||||||||||||
| Short-Term Investments | 21,684,274 | — | — | 21,684,274 | ||||||||||||||||
| Total | $ | 195,375,299 | $ | 1,025,741,709 | $ | — | $ | 1,221,117,008 | ||||||||||||
Semi-Annual Report 281
| Description | Unadjusted Quoted Prices in Active Markets for Identical Assets and Liabilities (Level 1) | Significant Other Observable Inputs (Level 2) | Significant Unobservable Inputs (Level 3) | Balance as of June 30, 2022 | ||||||||||||||||
| International Equity Select Portfolio | ||||||||||||||||||||
| Common Stocks* | ||||||||||||||||||||
| Brazil | $ | 808,180 | $ | — | $ | — | $ | 808,180 | ||||||||||||
| Canada | 1,529,658 | — | — | 1,529,658 | ||||||||||||||||
| China | 585,663 | 5,841,021 | — | 6,426,684 | ||||||||||||||||
| Denmark | — | 1,260,635 | — | 1,260,635 | ||||||||||||||||
| Finland | — | 916,194 | — | 916,194 | ||||||||||||||||
| France | — | 8,201,626 | — | 8,201,626 | ||||||||||||||||
| Germany | — | 3,822,234 | — | 3,822,234 | ||||||||||||||||
| Hong Kong | — | 1,894,218 | — | 1,894,218 | ||||||||||||||||
| India | 1,447,708 | 1,230,314 | — | 2,678,022 | ||||||||||||||||
| Indonesia | 567,407 | 952,905 | — | 1,520,312 | ||||||||||||||||
| Ireland | 1,515,799 | — | — | 1,515,799 | ||||||||||||||||
| Japan | — | 6,685,479 | — | 6,685,479 | ||||||||||||||||
| Mexico | 834,463 | — | — | 834,463 | ||||||||||||||||
| Netherlands | — | 4,055,721 | — | 4,055,721 | ||||||||||||||||
| Norway | — | 1,368,484 | — | 1,368,484 | ||||||||||||||||
| Singapore | — | 819,789 | — | 819,789 | ||||||||||||||||
| South Africa | — | 1,151,115 | — | 1,151,115 | ||||||||||||||||
| South Korea | — | 1,677,102 | — | 1,677,102 | ||||||||||||||||
| Switzerland | — | 3,083,669 | — | 3,083,669 | ||||||||||||||||
| Taiwan | — | 1,210,424 | — | 1,210,424 | ||||||||||||||||
| United Kingdom | — | 7,085,782 | — | 7,085,782 | ||||||||||||||||
| United States | 2,980,552 | 642,267 | — | 3,622,819 | ||||||||||||||||
| Preferred Stocks* | ||||||||||||||||||||
| Germany | — | 125,256 | — | 125,256 | ||||||||||||||||
| Short-Term Investments | 2,745,664 | — | — | 2,745,664 | ||||||||||||||||
| Total | $ | 13,015,094 | $ | 52,024,235 | $ | — | $ | 65,039,329 | ||||||||||||
282 Semi-Annual Report
| Description | Unadjusted Quoted Prices in Active Markets for Identical Assets and Liabilities (Level 1) | Significant Other Observable Inputs (Level 2) | Significant Unobservable Inputs (Level 3) | Balance as of June 30, 2022 | ||||||||||||||||
| Lazard International Quality Growth Portfolio | ||||||||||||||||||||
| Common Stocks* | ||||||||||||||||||||
| Brazil | $ | 2,115,218 | $ | — | $ | — | $ | 2,115,218 | ||||||||||||
| Canada | 8,903,604 | — | — | 8,903,604 | ||||||||||||||||
| China | 2,644,993 | 3,160,779 | — | 5,805,772 | ||||||||||||||||
| Denmark | — | 7,418,423 | — | 7,418,423 | ||||||||||||||||
| France | — | 9,151,393 | — | 9,151,393 | ||||||||||||||||
| Germany | — | 4,650,329 | — | 4,650,329 | ||||||||||||||||
| Hong Kong | — | 4,525,310 | — | 4,525,310 | ||||||||||||||||
| India | 3,670,559 | — | — | 3,670,559 | ||||||||||||||||
| Israel | 2,786,935 | — | — | 2,786,935 | ||||||||||||||||
| Japan | — | 6,493,540 | — | 6,493,540 | ||||||||||||||||
| Netherlands | — | 9,503,040 | — | 9,503,040 | ||||||||||||||||
| Norway | — | 2,641,956 | — | 2,641,956 | ||||||||||||||||
| South Africa | — | 2,767,325 | — | 2,767,325 | ||||||||||||||||
| Spain | — | 1,968,900 | — | 1,968,900 | ||||||||||||||||
| Sweden | — | 5,237,677 | — | 5,237,677 | ||||||||||||||||
| Switzerland | — | 3,312,532 | — | 3,312,532 | ||||||||||||||||
| Taiwan | 3,776,605 | — | — | 3,776,605 | ||||||||||||||||
| United Kingdom | — | 18,301,951 | — | 18,301,951 | ||||||||||||||||
| United States | 6,510,725 | — | — | 6,510,725 | ||||||||||||||||
| Preferred Stocks* | ||||||||||||||||||||
| Germany | — | 1,604,015 | — | 1,604,015 | ||||||||||||||||
| Short-Term Investments | 2,809,520 | — | — | 2,809,520 | ||||||||||||||||
| Total | $ | 33,218,159 | $ | 80,737,170 | $ | — | $ | 113,955,329 | ||||||||||||
Semi-Annual Report 283
| Description | Unadjusted Quoted Prices in Active Markets for Identical Assets and Liabilities (Level 1) | Significant Other Observable Inputs (Level 2) | Significant Unobservable Inputs (Level 3) | Balance as of June 30, 2022 | ||||||||||||||||
| International Small Cap Equity Portfolio | ||||||||||||||||||||
| Common Stocks* | ||||||||||||||||||||
| Australia | $ | — | $ | 895,041 | $ | — | $ | 895,041 | ||||||||||||
| Austria | — | 468,494 | — | 468,494 | ||||||||||||||||
| Belgium | — | 523,835 | — | 523,835 | ||||||||||||||||
| Canada | 607,347 | — | — | 607,347 | ||||||||||||||||
| China | — | 154,805 | — | 154,805 | ||||||||||||||||
| Denmark | — | 265,854 | — | 265,854 | ||||||||||||||||
| Finland | — | 173,501 | — | 173,501 | ||||||||||||||||
| France | — | 276,944 | — | 276,944 | ||||||||||||||||
| Germany | — | 1,760,147 | — | 1,760,147 | ||||||||||||||||
| Greece | — | 252,394 | — | 252,394 | ||||||||||||||||
| Ireland | — | 341,779 | — | 341,779 | ||||||||||||||||
| Italy | — | 1,032,282 | — | 1,032,282 | ||||||||||||||||
| Japan | — | 4,467,347 | — | 4,467,347 | ||||||||||||||||
| Jersey | — | 225,211 | — | 225,211 | ||||||||||||||||
| Netherlands | — | 907,273 | — | 907,273 | ||||||||||||||||
| New Zealand | — | 158,465 | — | 158,465 | ||||||||||||||||
| Norway | — | 229,839 | — | 229,839 | ||||||||||||||||
| Portugal | — | 152,340 | — | 152,340 | ||||||||||||||||
| Spain | — | 743,981 | — | 743,981 | ||||||||||||||||
| Sweden | — | 403,320 | — | 403,320 | ||||||||||||||||
| Switzerland | — | 187,890 | — | 187,890 | ||||||||||||||||
| United Kingdom | — | 3,131,724 | — | 3,131,724 | ||||||||||||||||
| United States | 153,000 | — | — | 153,000 | ||||||||||||||||
| Short-Term Investments | 389,415 | — | — | 389,415 | ||||||||||||||||
| Total | $ | 1,149,762 | $ | 16,752,466 | $ | — | $ | 17,902,228 | ||||||||||||
284 Semi-Annual Report
| Description | Unadjusted Quoted Prices in Active Markets for Identical Assets and Liabilities (Level 1) | Significant Other Observable Inputs (Level 2) | Significant Unobservable Inputs (Level 3) | Balance as of June 30, 2022 | ||||||||||||||||
| Lazard International Strategic Equity Portfolio | ||||||||||||||||||||
| Common Stocks* | ||||||||||||||||||||
| Australia | $ | — | $ | 90,100,815 | $ | — | $ | 90,100,815 | ||||||||||||
| Canada | 535,400,336 | — | — | 535,400,336 | ||||||||||||||||
| China | — | 279,091,266 | — | 279,091,266 | ||||||||||||||||
| Denmark | — | 193,048,229 | — | 193,048,229 | ||||||||||||||||
| Finland | — | 125,534,184 | — | 125,534,184 | ||||||||||||||||
| France | — | 602,532,940 | — | 602,532,940 | ||||||||||||||||
| Germany | — | 282,108,609 | — | 282,108,609 | ||||||||||||||||
| India | — | 55,965,127 | — | 55,965,127 | ||||||||||||||||
| Ireland | 127,351,509 | — | — | 127,351,509 | ||||||||||||||||
| Israel | — | 136,820,711 | — | 136,820,711 | ||||||||||||||||
| Italy | — | 61,242,970 | — | 61,242,970 | ||||||||||||||||
| Japan | — | 544,691,248 | — | 544,691,248 | ||||||||||||||||
| Mexico | 76,552,115 | — | — | 76,552,115 | ||||||||||||||||
| Netherlands | — | 184,163,510 | — | 184,163,510 | ||||||||||||||||
| South Korea | — | 8,954,663 | — | 8,954,663 | ||||||||||||||||
| Spain | — | 187,818,799 | — | 187,818,799 | ||||||||||||||||
| Sweden | — | 83,759,614 | — | 83,759,614 | ||||||||||||||||
| Switzerland | — | 144,314,544 | — | 144,314,544 | ||||||||||||||||
| Taiwan | — | 41,552,565 | — | 41,552,565 | ||||||||||||||||
| United Kingdom | — | 657,934,633 | — | 657,934,633 | ||||||||||||||||
| United States | 405,787,582 | — | — | 405,787,582 | ||||||||||||||||
| Short-Term Investments | 54,373,698 | — | — | 54,373,698 | ||||||||||||||||
| Total | $ | 1,199,465,240 | $ | 3,679,634,427 | $ | — | $ | 4,879,099,667 | ||||||||||||
Semi-Annual Report 285
| Description | Unadjusted Quoted Prices in Active Markets for Identical Assets and Liabilities (Level 1) | Significant Other Observable Inputs (Level 2) | Significant Unobservable Inputs (Level 3) | Balance as of June 30, 2022 | ||||||||||||||||
| Managed Equity Volatility Portfolio | ||||||||||||||||||||
| Common Stocks* | ||||||||||||||||||||
| Australia | $ | — | $ | 580,238 | $ | — | $ | 580,238 | ||||||||||||
| Belgium | — | 62,048 | — | 62,048 | ||||||||||||||||
| Canada | 1,310,391 | — | — | 1,310,391 | ||||||||||||||||
| Denmark | — | 472,379 | — | 472,379 | ||||||||||||||||
| France | — | 265,249 | — | 265,249 | ||||||||||||||||
| Germany | — | 93,682 | — | 93,682 | ||||||||||||||||
| Hong Kong | — | 196,855 | — | 196,855 | ||||||||||||||||
| Israel | — | 58,171 | — | 58,171 | ||||||||||||||||
| Japan | — | 3,748,557 | — | 3,748,557 | ||||||||||||||||
| Netherlands | — | 558,380 | — | 558,380 | ||||||||||||||||
| New Zealand | — | 168,361 | — | 168,361 | ||||||||||||||||
| Norway | — | 219,749 | — | 219,749 | ||||||||||||||||
| Portugal | — | 68,771 | — | 68,771 | ||||||||||||||||
| Singapore | — | 218,733 | — | 218,733 | ||||||||||||||||
| Spain | — | 24,143 | — | 24,143 | ||||||||||||||||
| Sweden | — | 181,899 | — | 181,899 | ||||||||||||||||
| Switzerland | — | 776,186 | — | 776,186 | ||||||||||||||||
| United Kingdom | — | 1,156,205 | — | 1,156,205 | ||||||||||||||||
| United States | 17,792,959 | 211,667 | — | 18,004,626 | ||||||||||||||||
| Short-Term Investments | 470,792 | — | — | 470,792 | ||||||||||||||||
| Total | $ | 19,574,142 | $ | 9,061,273 | $ | — | $ | 28,635,415 | ||||||||||||
| US Equity Concentrated Portfolio | ||||||||||||||||||||
| Common Stocks* | $ | 1,416,999,390 | $ | — | $ | — | $ | 1,416,999,390 | ||||||||||||
| Short-Term Investments | 17,519,949 | — | — | 17,519,949 | ||||||||||||||||
| Total | $ | 1,434,519,339 | $ | — | $ | — | $ | 1,434,519,339 | ||||||||||||
| US Equity Focus Portfolio | ||||||||||||||||||||
| Common Stocks* | $ | 72,693,351 | $ | — | $ | — | $ | 72,693,351 | ||||||||||||
| Short-Term Investments | 1,683,227 | — | — | 1,683,227 | ||||||||||||||||
| Total | $ | 74,376,578 | $ | — | $ | — | $ | 74,376,578 | ||||||||||||
| US Small-Mid Cap Equity Portfolio | ||||||||||||||||||||
| Common Stocks* | $ | 68,911,113 | $ | — | $ | — | $ | 68,911,113 | ||||||||||||
| Total | $ | 68,911,113 | $ | — | $ | — | $ | 68,911,113 | ||||||||||||
| US Sustainable Equity Portfolio | ||||||||||||||||||||
| Common Stocks* | $ | 11,646,006 | $ | — | $ | — | $ | 11,646,006 | ||||||||||||
| Short-Term Investments | 625,851 | — | — | 625,851 | ||||||||||||||||
| Total | $ | 12,271,857 | $ | — | $ | — | $ | 12,271,857 | ||||||||||||
| US Systematic Small Cap Equity Portfolio | ||||||||||||||||||||
| Common Stocks* | $ | 23,359,394 | $ | — | $ | — | $ | 23,359,394 | ||||||||||||
| Mortgage Real Estate Investment Trusts* | 45,379 | — | — | 45,379 | ||||||||||||||||
| Short-Term Investments | 346,027 | — | — | 346,027 | ||||||||||||||||
| Total | $ | 23,750,800 | $ | — | $ | — | $ | 23,750,800 | ||||||||||||
286 Semi-Annual Report
| * | Please refer to Portfolios of Investments and Notes to Portfolios of Investments for portfolio holdings by country and industry. |
| † | Other financial instruments are derivative instruments which are valued at their respective unrealized appreciation (depreciation). |
Certain equity securities to which footnote (‡) in the Notes to Portfolios of Investments applies are included in Level 2 and were valued based on reference to similar securities that were trading on active markets.
10. Derivative Instruments
The Global Listed Infrastructure Portfolio used derivative instruments, including forward currency contracts.
The Global Listed Infrastructure Portfolio uses forward currency contracts primarily for hedging purposes.
During the period ended June 30, 2022, the approximate average monthly notional exposure for derivative instruments was as follows:
| Forward currency contracts: | ||||
| Average amounts purchased | $ | 118,800,000 | ||
| Average amounts sold | $ | 5,502,700,000 | ||
The following table summarizes the fair value of derivative instruments on the Statement of Assets and Liabilities as of June 30, 2022:
| Assets – Derivative Financial Instruments | Total | |||||
| Forward currency contracts | Unrealized appreciation on forward currency contracts | $ | 42,562,258 | |||
| Liabilities – Derivative Financial Instruments | Total | |||||
| Forward currency contracts | Unrealized depreciation on forward currency contracts | $ | 4,374,932 | |||
The effect of derivative instruments on the Statement of Operations for the period ended June 30, 2022 was:
| Net Realized Gain (Loss) from: | Total | |||
| Forward currency contracts | $ | 332,056,533 | ||
| Net Change in Unrealized Appreciation (Depreciation) on: | Total | |||
| Forward currency contracts | $ | 117,435,643 | ||
Semi-Annual Report 287
None of the other presented portfolios traded in derivative instruments during the period ended June 30, 2022.
As of June 30, 2022, the Global Listed Infrastructure Portfolio held derivative instruments that are eligible for offset in its Statement of Assets and Liabilities and are subject to master netting arrangements. A master netting arrangement is an agreement between two counterparties who have multiple contracts with each other that provides for the net settlement of all contracts, as well as any cash collateral, through a single payment in the event of default on, or termination of, any one contract.
The required information for the affected Portfolio is presented in the below table, as of June 30, 2022:
Global Listed Infrastructure Portfolio
| Description | Gross Amounts of Recognized Assets | Gross Amounts Offset in the Statement of Assets and Liabilities | Net Amounts of Assets Presented in the Statement of Assets and Liabilities | ||||||||||||||
| Forward Currency Contracts | $ | 42,562,258 | $ | — | $ | 42,562,258 | |||||||||||
| Amounts Not Offset in the Statement of Assets and Liabilities | ||||||||||||||||||
| Counterparty | Net Amounts of Assets Presented in the Statement of Assets and Liabilities | Financial Instruments | Collateral Received | Net Amounts of Derivative Assets | ||||||||||||||
| BNP Paribas SA | $ | 2,937,414 | $ | (404,776 | ) | $ | — | $ 2,532,638 | ||||||||||
| Canadian Imperial Bank of Commerce | 6,705,831 | — | — | 6,705,831 | ||||||||||||||
| Citibank NA | 6,015,090 | (508,340 | ) | — | 5,506,750 | |||||||||||||
| HSBC Bank USA NA | 4,620,760 | (2,457,671 | ) | — | 2,163,089 | |||||||||||||
| Morgan Stanley & Co. | 3,008,139 | (46,675 | ) | — | 2,961,464 | |||||||||||||
| Royal Bank of Canada | 7,552,823 | — | — | 7,552,823 | ||||||||||||||
| State Street Bank and Trust Co. | 8,905,789 | (569,790 | ) | — | 8,335,999 | |||||||||||||
| The Bank of New York Mellon Corp. | 2,816,412 | — | — | 2,816,412 | ||||||||||||||
| Total | $ | 42,562,258 | $ | (3,987,252 | ) | $ | — | $38,575,006 | ||||||||||
288 Semi-Annual Report
| Description | Gross Amounts of Recognized Liabilities | Gross Amounts Offset in the Statement of Assets and Liabilities | Net Amounts of Liabilities Presented in the Statement of Assets and Liabilities | ||||||||||||||
| Forward Currency Contracts | $ | 4,374,932 | $ | — | $ | 4,374,932 | |||||||||||
| Amounts Not Offset in the Statement of Assets and Liabilities | ||||||||||||||||||
| Counterparty | Net Amounts of Liabilities Presented in the Statement of Assets and Liabilities | Financial Instruments | Collateral Pledged | Net Amounts of Derivative Liabilities | ||||||||||||||
| BNP Paribas SA | $ | 404,776 | $ | (404,776 | ) | $ | — | $ — | ||||||||||
| Citibank NA | 508,340 | (508,340 | ) | — | — | |||||||||||||
| HSBC Bank USA NA | 2,457,671 | (2,457,671 | ) | — | — | |||||||||||||
| Morgan Stanley & Co. | 46,675 | (46,675 | ) | — | — | |||||||||||||
| Standard Chartered Bank | 387,680 | — | — | 387,680 | ||||||||||||||
| State Street Bank and Trust Co. | 569,790 | (569,790 | ) | — | — | |||||||||||||
| Total | $ | 4,374,932 | $ | (3,987,252 | ) | $ | — | $ 387,680 | ||||||||||
11. Accounting Pronouncements
On March 12, 2020, the Financial Accounting Standards Board concluded its reference rate reform project with the issuance of Accounting Standards Update No. 2020-04, Reference Rate Reform (Topic 848) - Facilitation of the Effects of Reference Rate Reform on Financial Reporting (“ASU No. 2020-04”). ASU No. 2020-04 provides elective temporary financial reporting relief from the effect of certain types of contract modifications due to the planned discontinuation of the London Interbank Offered Rate (LIBOR) and other interbank offered reference rates as of the end of 2021. ASU No. 2020-04 was initially intended to be effective for certain reference rate-related contract modifications that have occurred since March 12, 2020 and that will continue to occur, through December 31, 2022, but FASB has voted to extend the grace period for complete adoption of ASU No. 2020-04 to December 31, 2024, after the UK Financial Conduct Authority delayed the intended cessation date of certain tenors of USD LIBOR to June 30, 2023. Management has adopted ASU No. 2020-04.
Semi-Annual Report 289
12. Subsequent Events
Management has evaluated subsequent events potentially affecting the Portfolios through the issuance of the financial statements and has determined that there were no subsequent events that required adjustment or disclosure.
290 Semi-Annual Report
The Lazard Funds, Inc.
Proxy Voting
A description of the policies and procedures used to determine how proxies relating to Fund portfolio securities are voted is available (1) without charge, upon request, by calling (800) 823-6300 or (2) on the Securities and Exchange Commission (the “SEC”) website at https://www.sec.gov.
The Fund’s proxy voting record for the most recent 12-month period ended June 30 is available (1) without charge, upon request, by calling (800) 823-6300 or (2) on the SEC’s website at https://www.sec.gov. Information as of June 30 each year will generally be available by the following August 31.
Schedule of Portfolio Holdings
The Fund files the complete schedule of each Portfolio’s holdings with the SEC for the first and third quarters of each fiscal year as an exhibit to its reports on Form N-PORT. The Fund’s Form N-PORT reports are available on the SEC’s website at https://www.sec.gov.
Board Consideration of Management Agreement
All Portfolios except Lazard International Equity Value Portfolio1
At meetings of the Board held on June 1, 2022 and June 28, 2022, the Board considered the approval, for an additional annual period, of the Management Agreement between the Fund, on behalf of each of the Portfolios, and the Investment Manager. The Independent Directors were assisted in their review by independent legal counsel, who advised the Board on relevant legal standards and met with the Independent Directors in executive sessions separate from representatives of the Investment Manager.
| 1 | Developing Markets Equity, Emerging Markets Core Equity, Emerging Markets Equity, Emerging Markets Equity Advantage, Emerging Markets Strategic Equity, Equity Franchise, Global Equity Select, Global Listed Infrastructure, Global Strategic Equity, International Equity, International Equity Advantage, International Equity Concentrated, International Equity Select, International Quality Growth, International Small Cap Equity, International Strategic Equity, Managed Equity Volatility, US Equity Concentrated, US Equity Focus, US Small-Mid Cap Equity and US Sustainable Equity Portfolios. The Board previously had approved liquidation of the International Equity Value Portfolio on June 29, 2022, prior to the end of the term of the then-current Management Agreement for the Portfolio on June 30, 2022. |
Semi-Annual Report 291
Representatives of the Investment Manager discussed with the Board the Investment Manager’s written materials provided in advance of the meetings, including, at the June 28, 2022 meeting, additional information requested by the Independent Directors at the June 1, 2022 meeting.
Services Provided
The Investment Manager’s materials addressed, among other matters, the nature, extent and quality of services that the Investment Manager provides the Fund, including a discussion of the Investment Manager and its clients. As of March 31, 2022, the Lazard Funds complex of 35 active funds comprised approximately $23 billion of the approximately $253 billion of total assets under the management of the Investment Manager and its global affiliates.
The Board considered the various services provided by the Investment Manager including the Investment Manager’s research, portfolio management and trading capabilities and oversight of day-to-day operations, including supervision of fund accounting and administration-related services and assistance in meeting legal and regulatory requirements, as well as regular reporting to, and support of, the Board. The Investment Manager’s representatives stated that the Investment Manager believes that the Fund and its shareholders continue to be able to obtain significant benefits as a result of the resources and support of the Investment Manager’s global research, portfolio management, trading, operations, risk management, technology and legal and compliance infrastructure. The Board also considered information provided by the Investment Manager regarding its resources relevant to providing services pursuant to the Management Agreement; the qualifications, experience and other information regarding senior management and key professional personnel responsible for providing services to the Portfolios; trends in recent years in the number of personnel involved in providing services to the Portfolios and the adequacy of the Investment Manager’s staffing to provide services pursuant to the Management Agreement; the Fund’s distribution channels and the relationships with various intermediaries; marketing and
292 Semi-Annual Report
shareholder servicing activities on behalf of the Portfolios; Portfolio asset flows and the growth or decline in asset levels; and the Investment Manager’s financial condition. The Board accepted the assertion of representatives of the Investment Manager that the Fund benefits from the services and infrastructure provided by the Investment Manager and that such services and infrastructure are greater than those typically provided to a $23 billion fund complex not managed by a large, global firm such as the Investment Manager.
Comparative Fee, Expense Ratio and Performance Information
Strategic Insight Advisory Fee and Expense Ratio Comparisons. The Board reviewed, for each Portfolio, information prepared by Strategic Insight, an independent provider of investment company data, including, among other information, each Portfolio’s contractual advisory fee (i.e., without giving effect to any fee waivers) and net expense ratio (i.e., after giving effect to the Portfolio’s expense limitation agreed to by the Investment Manager) to those of:
| ● | a group of funds not advised by the Investment Manager that were selected by Strategic Insight as comparable to the Portfolio, for expense comparison purposes, based on Strategic Insight’s methodology (the “Expense Peer Group”); and |
| ● | the funds within the broad category of funds to which the Portfolio has been assigned by Morningstar, Inc., an independent third party service that ranks and rates funds (“Morningstar”), with certain exclusions as specified by Strategic Insight (the “Expense Category”). |
Representatives of the Investment Manager discussed the results of the Strategic Insight advisory fee and net expense ratio comparisons with the Board, which showed that the Portfolios’ advisory fees were generally competitive within each Portfolio’s respective Expense Peer Group. For the Emerging Markets Core Equity, Emerging Markets Strategic Equity and Global Strategic Equity Portfolios, the Investment Manager proposed to lower the current expense limitation by 0.05%, and, for the International Equity Advantage and US Small-Mid Cap Equity Portfolios, the
Semi-Annual Report 293
Investment Manager proposed to lower the current expense limitation by 0.10%. After giving effect to the proposed expense limitation reductions, the results of the Strategic Insight comparisons showed that the net expense ratios of the Portfolios were generally competitive within each Portfolio’s respective Expense Peer Group. The Board considered the comparisons, additional perspectives in information prepared by, and in discussions with, representatives of the Investment Manager and that the Investment Manager continues to voluntarily enter into expense limitation agreements for all of the Portfolios, pursuant to which the Investment Manager was currently waiving advisory fees and/or reimbursing expenses for certain of the Portfolios. The Board also received a description of Strategic Insight’s methodology for its construction of Expense Peer Groups and a summary of how the methodology was applied.
Other Accounts Advisory Fee Comparisons. The Board also considered the actual advisory fees paid to the Investment Manager by other accounts of the Investment Manager that are comparable to each Portfolio in terms of investment objectives, strategies and policies, if any (including other investment companies and other pooled investment vehicles, “Other Accounts”). Representatives of the Investment Manager discussed the nature of the Other Accounts and the significant differences in services provided by the Investment Manager to the different types of Other Accounts as compared to the services provided to the Portfolios. The Board considered the relevance of the fee information provided for Other Accounts, in light of the Investment Manager’s discussion of the significant differences in services provided, to evaluate the advisory fees of the relevant Portfolios.
Strategic Insight Performance Comparisons. The Board reviewed, among other performance information provided to the Board on a quarterly basis, information prepared by Strategic Insight including, among other information, each Portfolio’s performance for the one-, three-, five- and ten-year periods ended March 31, 2022, as applicable, compared to performance for the same time periods to that of:
294 Semi-Annual Report
| ● | a group of funds not advised by the Investment Manager that were selected by Strategic Insight as comparable to the Portfolio, for performance comparison purposes, based on Strategic Insight’s methodology (the “Performance Peer Group”); |
| ● | the funds within the broad category of funds to which the Portfolio has been assigned by Morningstar (the “Performance Category”); and |
| ● | the Portfolio’s benchmark index. |
The Board also received a description of Strategic Insight’s methodology for its construction of Performance Peer Groups and a summary of how the methodology was applied, including, for certain Portfolios, deviations from Strategic Insights’ stated methodology and the reasons therefor.
When evaluating the performance of each Portfolio, the Board considered Strategic Insight’s performance analysis along with other information provided by the Investment Manager, including additional information regarding performance expectations, as well as additional perspectives in information prepared by, and in discussions with, representatives of the Investment Manager. The Board also received and would continue to receive regular updates and/or additional information from the Investment Manager in respect of Portfolios with relative underperformance in certain periods and Portfolios which otherwise are not performing in accordance with expectations, as well as any other Portfolios for which the Board requested additional information.
Investment Manager Profitability and Economies of Scale
The Board reviewed information prepared by the Investment Manager for each Portfolio concerning the estimated profitability percentage of the Management Agreement to the Investment Manager and its affiliates for the calendar year ended December 31, 2021 and the Investment Manager’s cost allocation methodology to compute an estimate of each Portfolio’s costs to the Investment Manager. The Investment Manager’s representatives reviewed with the Board information provided on the Investment Manager’s brokerage practices and the Portfolios’
Semi-Annual Report 295
brokerage allocation, commission payments and soft dollar commissions and benefits. The Investment Manager’s representatives stated that neither the Investment Manager nor its affiliates receive any other significant benefits from the Investment Manager acting as investment manager to the Portfolios. The representatives of the Investment Manager reminded the Board that the Investment Manager is continuing to support distribution relationships through direct payments from its or its affiliates’ own resources to third parties in connection with distribution and shareholder servicing and/or administrative and recordkeeping services, and noted that the Fund does not bear any related costs other than the 0.25% 12b-1 fee pursuant to the Distribution and Servicing Plan adopted for the Portfolios’ Open Shares.
The profitability percentages were below or within ranges determined by relevant court cases not to be so disproportionately large that they bore no reasonable relationship to the services rendered. The Board (1) considered the Investment Manager’s estimated profitability percentage with respect to each Portfolio as part of their evaluation of the Portfolio’s fee under the Management Agreement, considered in relation to the mix of services provided by the Investment Manager (including the nature, extent and quality of such services), and (2) evaluated the profitability percentage in light of the relevant circumstances for each Portfolio. Representatives of the Investment Manager and the Board discussed ways economies of scale could be realized and how they could be shared, including the Investment Manager’s reinvestment of profits back into its business, waiving or reducing Portfolio management fees and/or reimbursing expenses, adding discounts to a Portfolio’s management fee schedule as a Portfolio’s assets increase or by instituting management fees at inception that account for future scale. As the assets of most of the Portfolios as of the end of the most recently completed calendar year had either decreased (or not increased significantly) from Portfolio assets as of the end of the previous calendar year and/or had not reached a significant size, the potential that the Investment Manager may have realized any material economies of scale with respect to these Portfolios was reduced.
296 Semi-Annual Report
Conclusions and Determinations
At the conclusion of these discussions, the Board expressed the opinion that it had been furnished with such information as may reasonably be necessary to make an informed business decision with respect to evaluation of the renewal of the Management Agreement. Based on its discussions and considerations as described above, with the assistance of independent legal counsel and in the exercise of its business judgment, the Board made the following conclusions and determinations.
| ● | The Board concluded that the nature, extent and quality of the services provided by the Investment Manager are adequate and appropriate, noting the benefits of the significant services and infrastructure associated with an approximately $253 billion global asset management business. |
| ● | The Board concluded that each Portfolio’s fee paid to the Investment Manager was appropriate under the circumstances and in light of the factors and the totality of the services provided. |
| ● | The Board, after considering the information provided and the totality of the relevant circumstances for each Portfolio, concluded that the investment performance of each Portfolio was acceptable or that, for any Portfolios that were not performing in accordance with expectations, the Board accepted that the Investment Manager was taking steps intended to improve performance and the Board would continue to monitor performance. |
| ● | The Board recognized that economies of scale may be realized, particularly as the assets of the Portfolios increase, and determined that it would continue to consider potential material economies of scale. |
In evaluating the Management Agreement, the Board relied on the information described above, in addition to other information provided by the Investment Manager throughout the year relating to the operations of the Fund and the investment management and other services provided under the Management Agreement.
Semi-Annual Report 297
Such other information included the investment performance of the Portfolios in comparison to similar mutual funds and benchmark performance indices over various time periods; the expected pattern of performance for the Portfolios in different market conditions; general market outlook as applicable to the Portfolios; and compliance reports. The Board also relied on its previous knowledge, gained through meetings and other interactions with the Investment Manager, of the Investment Manager and the services provided to the Fund by the Investment Manager. The Board considered these conclusions and determinations in their totality and determined to approve the Fund’s Management Agreement for each Portfolio. In deciding whether to vote to approve the Management Agreement for each Portfolio, each Director may have accorded different weights to different factors so that each Director may have had a different basis for his or her decision.
Statement Regarding Liquidity Risk Management Program
The Fund has adopted a liquidity risk management program (the “LRMP”) pursuant to the requirements of Rule 22e-4 under the 1940 Act, which requires registered open-end funds (other than money market funds) to adopt and implement a written liquidity risk management program that is reasonably designed to assess and manage liquidity risk. The rule is designed to promote effective liquidity risk management and reduce liquidity risk—i.e., the risk that a fund could not meet requests to redeem shares issued by the fund without significant dilution of remaining investors’ interests in the fund.
The Board approved the Investment Manager to administer the LRMP (the “Program Administrator”). As Program Administrator, the Investment Manager delegates the day-to-day activities required by the LRMP to a Valuation and Liquidity Committee comprised of various Fund officers and senior personnel of the Investment Manager. In addition, the Fund has contracted with a third party liquidity assessment vendor to support the classification of Portfolio investments.
Pursuant to the requirements of Rule 22e-4, the Board must review, no less frequently than annually, a written report prepared
298 Semi-Annual Report
by the Program Administrator that, among other things, addresses the operation of the LRMP and assesses its adequacy and effectiveness of implementation and any material changes to the LRMP. The Board received a written report in June 2022 (the “Annual Report”). The Annual Report included, among other things, a statement that the Investment Manager, as the Program Administrator, acting primarily through the Valuation and Liquidity Committee, has reviewed the operation of the LRMP and believes that the LRMP is reasonably designed to assess and manage the Portfolios’ liquidity risk and is adequate and effective in its implementation. There were no material compliance matters relating to compliance with Rule 22e-4 identified in the Annual Report.
Semi-Annual Report 299
The Lazard Funds, Inc.
30 Rockefeller Plaza
New York, New York 10112-6300
Telephone: 800-823-6300
www.lazardassetmanagement.com
Investment Manager
Lazard Asset Management LLC
30 Rockefeller Plaza
New York, New York 10112-6300
Telephone: 800-823-6300
Distributor
Lazard Asset Management Securities LLC
30 Rockefeller Plaza
New York, New York 10112-6300
Custodian
State Street Bank and Trust Company
One Iron Street
Boston, Massachusetts 02210-1641
Transfer Agent and Dividend Disbursing Agent
DST Asset Manager Solutions, Inc.
2000 Crown Colony Drive
Quincy, Massachusetts 02169-0953
Telephone: 617-483-7000
Independent Registered Public Accounting Firm
Deloitte & Touche LLP
30 Rockefeller Plaza
New York, New York 10112-0015
Legal Counsel
Proskauer Rose LLP
Eleven Times Square
New York, New York 10036-8299
www.proskauer.com


| Lazard Asset Management LLC • 30 Rockefeller Plaza • New York, NY 10112 • www. lazardassetmanagement.com | |
| Performance information as of the most recent month end is available online at www. lazardassetmanagement.com.
LZDPS020 |  |
![]()
Lazard Funds
Semi-Annual Report
June 30, 2022
Fixed Income Funds
Lazard Emerging Markets Debt Portfolio
Lazard Global Fixed Income Portfolio
Lazard US Corporate Income Portfolio
Lazard US Short Duration Fixed Income Portfolio
The Lazard Funds, Inc. Table of Contents
Please consider a Portfolio’s investment objective, risks, charges and expenses carefully before investing. For more complete information about The Lazard Funds, Inc. (the “Fund”), you may obtain a prospectus or a Portfolio’s summary prospectus by calling 800-823-6300, or online, at www.lazardassetmanagement.com. Read the prospectus or the Portfolio’s summary prospectus carefully before you invest. The prospectus and the Portfolio’s summary prospectus contain the investment objective, risks, charges, expenses and other information about the Portfolio, which are not detailed in this report.
Distributed by Lazard Asset Management Securities LLC.
Semi-Annual Report 1
The Lazard Funds, Inc. A Message from Lazard (unaudited)
Dear Shareholder:
The first six months of 2022 were a turbulent period for financial markets, as optimism about the global economic outlook, which remained resilient throughout 2021, gave way to growing anxiety about worsening inflationary pressure.
Events during the period conspired to create stiff macro headwinds for markets. The economic fallout from Russia’s invasion of Ukraine and the harsh retaliatory sanctions imposed by Western countries rippled across financial markets and the wider global economy because of Russia’s stature as one of the world’s largest producers of oil, natural gas, and other commodities. Energy prices rose sharply, and supply chains bottlenecks worsened due to shortages of Russian industrial metals. Supply chains were further snarled when the Chinese government imposed harsh lockdowns on some of China’s most important cities, including those that serve as global manufacturing hubs, in an attempt to stamp out a rapidly spreading coronavirus outbreak.
With inflation reaching levels not seen in decades, the global monetary landscape shifted dramatically in the period, as policymakers sought to rein in soaring prices by pulling back from the ultra-low interest-rate-policies they implemented to contain the economic fallout from the coronavirus pandemic. In all, central banks from at least 45 countries raised interest rates in the first six months of 2022. At the same time, investors grew nervous that interest rates hikes, especially from major central banks, would tip the fragile global economy into a recession. In the US, the Federal Reserve (the “Fed”) adopted an increasingly aggressive posture during the period, raising its benchmark short-term interest rate by 25 basis points (bps), 50 bps, and 75 bps in March, May, and June, respectively, with more hikes likely, as domestic inflation reached a 40-year high. The Fed also began reducing its $9 trillion balance sheet of Treasury and mortgage bonds in June, which further tightened financial conditions. Across the Atlantic, the European Central Bank stated that it was prepared to raise interest rates in July for the first time in over a decade amid soaring inflation in the euro zone. Elsewhere in Europe, the Bank of England increased its benchmark interest rate four times in the six-month period, as inflation in the UK reached a level not seen since 1982.
2 Semi-Annual Report
Against this backdrop, global equity markets, as measured by the MSCI All Country World Index, fell 20.2% in the period, as stock investors fretted about the impact soaring inflation would have on corporate earnings. Notably, the S&P 500 Index recorded its worst first-half performance since 1970.The Fed’s aggressive rate-hike campaign also drove up the yields of risk-free US Treasury bonds, which undercut the appeal of stocks.
Meanwhile, global bond markets also came under pressure as many central banks transitioned from ultra-accommodative monetary policies to tighter regimes to tame increasing inflationary pressures. Sovereign rates rose amid the faster-than-expected acceleration of central bank interest rate hikes and, in the case of the Fed, balance sheet shrinking. Although credit spreads initially did well in the first quarter of the year, the second quarter saw both investment grade and high yield spreads generally widen compared to historical levels. Consequently, many bond markets around the world suffered losses, with many indices posting outsized year-to-date negative returns through mid-year. Notable among this group of indices was the Bloomberg Global Aggregate Bond Index, which fell 13.9% in the period. Underscoring the high level of risk aversion in the markets, the US dollar continued to strengthen, asserting itself as the safe-haven global currency and further supported by a hawkish central bank determined to regain its inflation fighting credibility.
The challenging market conditions in 2022 are a reminder of the importance of active portfolio management. Turbulent markets are likely to differentiate winners from losers. We remain confident that fundamental analysis and security selection will be crucial drivers of performance going forward. We are privileged that you have turned to Lazard for your investment needs and value your continued confidence in our investment management capabilities.
Sincerely,
Lazard Asset Management LLC
Semi-Annual Report 3
The Lazard Funds, Inc. Performance Overviews (unaudited)
Please see the “Notes to the Performance Overviews” for important information about the calculation of total returns, performance information generally, performance differences between Institutional Shares, Open Shares and R6 Shares, and the indexes shown below.
Lazard Emerging Markets Debt Portfolio
Comparison of Changes in Value of $10,000 Investment in the Institutional Shares of Lazard Emerging Markets Debt Portfolio, the JPMorgan EMBI Global Diversified® Index, the JPMorgan GBI-EM Global Diversified® Index and the Global Diversified Index
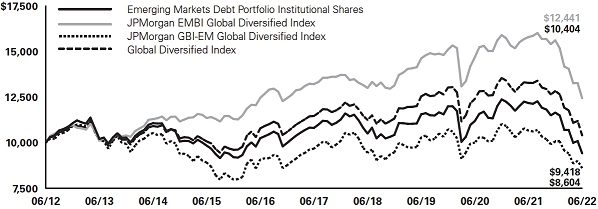
Average Annual Total Returns
Periods Ended June 30, 2022
| One Year | Five Years | Ten Years | Since Inception | † | |||||
| Institutional Shares | –22.64% | –2.72% | –0.60% | 0.25% | |||||
| Open Shares | –22.78% | –2.88% | –0.84% | 0.00% | |||||
| R6 Shares | –22.61% | –2.60% | N/A | –1.41% | |||||
| JP Morgan EMBI Global Diversified Index | –21.22% | –1.19% | 2.21% | 3.24% (Institutional and Open Shares) –0.30% (R6 Shares) | |||||
| JP Morgan GBI-EM Global Diversified Index | –19.28% | –2.31% | –1.49% | –0.88% (Institutional and Open Shares) –0.85% (R6 Shares) | |||||
| Global Diversified Index | –20.23% | –1.70% | 0.40% | 1.23% (Institutional and Open Shares) –0.53% (R6 Shares) |
| † | The inception date for the Institutional and Open Shares was February 28, 2011 and for the R6 Shares was July 28, 2016. |
4 Semi-Annual Report
Lazard Global Fixed Income Portfolio
Comparison of Changes in Value of $10,000 Investment in the Institutional Shares of Lazard Global Fixed Income Portfolio and the Bloomberg Barclays Global Aggregate® Index

Average Annual Total Returns
Periods Ended June 30, 2022
| One Year | Five Years | Ten Years | |||||
| Institutional Shares | –19.22% | –1.87% | –0.88% | ||||
| Open Shares | –19.40% | –2.13% | –1.16% | ||||
| Bloomberg Global Aggregate Index | –15.25% | –0.55% | 0.11% |
Semi-Annual Report 5
Lazard US Corporate Income Portfolio
Comparison of Changes in Value of $10,000 Investment in the Institutional Shares of Lazard US Corporate Income Portfolio and Cash Pay Index

Average Annual Total Returns
Periods Ended June 30, 2022
| One Year | Five Years | Ten Years | Since Inception | † | |||||
| Institutional Shares | –11.45% | 1.23% | 3.38% | 3.74% | |||||
| Open Shares | –11.70% | 0.93% | 3.07% | 3.27% | |||||
| R6 Shares | –11.45% | 0.75% | N/A | 1.50% | |||||
| Cash Pay Index | –12.14% | 2.12% | 4.36% | 5.66% (Institutional Shares) 5.61% (Open Shares) 2.99% (R6 Shares) |
| † | The inception date for the Institutional Shares was January 2, 1998, for the Open Shares was February 24, 1998 and for the R6 Shares was November 3, 2016. |
6 Semi-Annual Report
Lazard US Short Duration Fixed Income Portfolio
Comparison of Changes in Value of $10,000 Investment in the Institutional Shares of Lazard US Short Duration Fixed Income Portfolio and the ICE BofAML 1-3 Year US Treasury® Index

Average Annual Total Returns
Periods Ended June 30, 2022
| One Year | Five Years | Ten Years | |||||
| Institutional Shares | –2.59% | 0.80% | 0.57% | ||||
| Open Shares | –2.58% | 0.56% | 0.42% | ||||
| ICE BofAML 1-3 Year US Treasury Index | –3.30% | 0.94% | 0.79% |
Notes to Performance Overviews:
Information About Portfolio Performance Shown Above
Total returns reflect reinvestment of all dividends and distributions, if any. Certain expenses of a Portfolio may have been waived or reimbursed by Lazard Asset Management LLC, the Fund’s investment manager (the “Investment Manager”), State Street Bank and Trust Company, the Fund’s administrator (“State Street”), or DST Asset Manager Solutions, Inc., the Fund’s transfer agent and dividend disbursing agent (“DST”); without such waiver/reimbursement of expenses, the Portfolio’s returns would have been lower.
Performance results do not include adjustments made for financial reporting purposes in accordance with US Generally Accepted Accounting Principles (“GAAP”), if any, and also exclude one-time adjustments related to the receipt of settlement proceeds by the US Corporate Income Portfolio from a class action lawsuit which impacted the total return of R6 Shares but did not impact that of Institutional or Open; amounts may differ from amounts reported in the financial highlights.
The performance quoted represents past performance. Current performance may be lower or higher than the performance quoted. Past performance is not indicative, or a guarantee, of future results; the investment return and principal value of an investment in a Portfolio will fluctuate, so that Portfolio shares, when redeemed, may be worth more or less than their original cost. Within the longer periods illustrated there may have been short-term fluctuations, counter to the overall trend of investment results, and no single period of any length may be taken as typical of what may be expected in future periods. The graphs and tables above do not reflect the deduction of taxes that a shareholder would pay on a Portfolio’s distributions or the redemption of Portfolio shares.
Semi-Annual Report 7
The performance of Institutional Shares, Open Shares and R6 Shares, as applicable, may vary, primarily based on the differences in fees borne by shareholders investing in different classes of a Portfolio.
Information About Index Performance Shown Above
The performance data of the indices have been prepared from sources and data that the Investment Manager believes to be reliable, but no representation is made as to their accuracy. The indices are unmanaged, have no fees or costs and are not available for investment.
The Bloomberg Global Aggregate Index provides a broad-based measure of global investment-grade fixed-income debt markets, including government related debt, corporate debt, securitized debt and global Treasury.
The JPMorgan Emerging Markets Bond Index (“EMBI”) Global Diversified Index is an unmanaged index of debt instruments of emerging countries. The JPMorgan Government Bond Index-Emerging Markets (“GBI-EM”) Global Diversified Index is a comprehensive Emerging Markets index that consists of regularly traded, liquid, fixed-rate, domestic currency government bonds to which international investors can gain exposure. These indices limit the weights of those index countries with larger debt stocks by only including specified portions of these countries’ eligible current face amounts of debt outstanding. The same countries are covered in both indices.
The Global Diversified Index is an unmanaged index created by the Investment Manager and is a 50/50 blend of the JPMorgan EMBI Global Diversified Index and the JPMorgan GBI-EM Global Diversified Index.
The government-related debt, corporate debt, and securitized debt provides a broad-based measure of global investment-grade fixed-income debt markets, including government-related debt, corporate debt and securitized debt.
The Cash Pay Index is The ICE Bank of America Merrill Lynch High Yield (“BofAML”) BB-B US Cash Pay Non-Distressed High Yield® Index. It is constructed to mirror the BB-B non-distressed sector of the public high yield corporate debt market and is a subset of the ICE BofAML High Yield Cash Pay® Index.
The ICE BofAML 1-3 Year US Treasury Index tracks the performance of the direct sovereign debt of the US government having a maturity of at least one year and less than three years.
8 Semi-Annual Report
The Lazard Funds, Inc.
Information About Your Portfolio’s Expenses (unaudited)
Expense Example
As a shareholder in a Portfolio, you incur ongoing costs, including management fees, distribution and service (12b-1) fees (Open Shares only), and other expenses. This Example is intended to help you understand your ongoing costs (in dollars) of investing in a Portfolio and to compare these costs with the ongoing costs of investing in other mutual funds. The Example is based on an investment of $1,000 invested at the beginning of the six month period from January 1, 2022 through June 30, 2022 and held for the entire period.
Actual Expenses
For each share class of the Portfolios, the first line of the accompanying table provides information about actual account values and actual expenses. You may use the information in this line, together with the amount you invested, to estimate the expenses that you paid over the period. Simply divide your account value by $1,000 (for example, an $8,600 account value divided by $1,000=8.6), then multiply the result by the number in the first line under the heading entitled “Expenses Paid During Period” to estimate the expenses you paid on your account during this period.
Hypothetical Example for Comparison Purposes
For each share class of the Portfolios, the second line of the accompanying table provides information about hypothetical account values and hypothetical expenses based on the class’ actual expense ratio and an assumed rate of return of 5% per year before expenses, which is not the Portfolio’s actual return. The hypothetical account values and expenses may not be used to estimate the actual ending account balance or expenses you paid for the period. You may use this information to compare the ongoing costs of investing in the Portfolio and other mutual funds. To do so, compare this 5% hypothetical example with the 5% hypothetical examples that appear in the shareholder reports of other mutual funds.
Semi-Annual Report 9
| Portfolio | Beginning Account Value 1/1/22 | Ending Account Value 6/30/22 | Expenses Paid During Period* 1/1/22 - 6/30/22 | Annualized Expense Ratio During Period 1/1/22 - 6/30/22 | |||||
| Emerging Markets Debt | |||||||||
| Institutional Shares | |||||||||
| Actual | $1,000.00 | $ 808.40 | $3.81 | 0.85% | |||||
| Hypothetical (5% Return Before Expenses) | $1,000.00 | $1,020.58 | $4.26 | 0.85% | |||||
| Open Shares | |||||||||
| Actual | $1,000.00 | $ 808.40 | $4.71 | 1.05% | |||||
| Hypothetical (5% Return Before Expenses) | $1,000.00 | $1,019.59 | $5.26 | 1.05% | |||||
| R6 Shares | |||||||||
| Actual | $1,000.00 | $ 808.50 | $3.59 | 0.80% | |||||
| Hypothetical (5% Return Before Expenses) | $1,000.00 | $1,020.83 | $4.01 | 0.80% | |||||
| Global Fixed Income | |||||||||
| Institutional Shares | |||||||||
| Actual | $1,000.00 | $ 841.20 | $3.20 | 0.70% | |||||
| Hypothetical (5% Return Before Expenses) | $1,000.00 | $1,021.32 | $3.51 | 0.70% | |||||
| Open Shares | |||||||||
| Actual | $1,000.00 | $ 839.50 | $4.33 | 0.95% | |||||
| Hypothetical (5% Return Before Expenses) | $1,000.00 | $1,020.08 | $4.76 | 0.95% | |||||
| US Corporate Income | |||||||||
| Institutional Shares | |||||||||
| Actual | $1,000.00 | $ 877.00 | $2.56 | 0.55% | |||||
| Hypothetical (5% Return Before Expenses) | $1,000.00 | $1,022.07 | $2.76 | 0.55% | |||||
| Open Shares | |||||||||
| Actual | $1,000.00 | $ 876.00 | $3.72 | 0.80% | |||||
| Hypothetical (5% Return Before Expenses) | $1,000.00 | $1,020.83 | $4.01 | 0.80% | |||||
| R6 Shares | |||||||||
| Actual | $1,000.00 | $ 877.40 | $2.56 | 0.55% | |||||
| Hypothetical (5% Return Before Expenses) | $1,000.00 | $1,022.07 | $2.76 | 0.55% |
10 Semi-Annual Report
| Portfolio | Beginning Account Value 1/1/22 | Ending Account Value 6/30/22 | Expenses Paid During Period* 1/1/22 - 6/30/22 | Annualized Expense Ratio During Period 1/1/22 - 6/30/22 | |||||
| US Short Duration Fixed Income | |||||||||
| Institutional Shares | |||||||||
| Actual | $1,000.00 | $ 978.00 | $1.96 | 0.40% | |||||
| Hypothetical (5% Return Before Expenses) | $1,000.00 | $1,022.81 | $2.01 | 0.40% | |||||
| Open Shares | |||||||||
| Actual | $1,000.00 | $ 977.10 | $2.89 | 0.59% | |||||
| Hypothetical (5% Return Before Expenses) | $1,000.00 | $1,021.87 | $2.96 | 0.59% |
| * | Expenses are equal to the annualized expense ratio, net of expenses waivers and reimbursements, of each share class multiplied by the average account value over the period, multiplied by 181/365 (to reflect one-half year period). |
Semi-Annual Report 11
The Lazard Funds, Inc. Portfolio Holdings Presented by
Assets Class/Credit Rating and Region June 30, 2022 (unaudited)
| Asset Class/S&P Credit Rating* | Lazard Emerging Markets Debt Portfolio | Lazard Global Fixed Income Portfolio | Lazard US Corporate Income Portfolio | Lazard US Short Duration Fixed Income Portfolio | ||||||
| Fixed Income | ||||||||||
| AAA | 0.1 | % | 26.7 | % | — | % | 87.7 | % | ||
| AA+ | — | 4.8 | — | — | ||||||
| AA | — | 0.4 | — | — | ||||||
| AA- | 1.8 | 4.8 | — | — | ||||||
| A+ | 0.1 | 12.0 | — | — | ||||||
| A | 3.3 | 5.2 | — | — | ||||||
| A- | 0.2 | 12.6 | — | 3.9 | ||||||
| BBB+ | 6.4 | 10.1 | — | 8.0 | ||||||
| BBB | 12.2 | 5.4 | 1.9 | — | ||||||
| BBB- | 2.7 | 2.0 | 7.9 | — | ||||||
| BB+ | 1.3 | 2.8 | 19.7 | — | ||||||
| BB | 7.3 | 1.2 | 18.8 | — | ||||||
| BB- | 12.5 | — | 15.4 | — | ||||||
| B+ | 2.7 | 1.0 | 11.5 | — | ||||||
| B | 0.7 | — | 5.7 | — | ||||||
| B- | 3.5 | — | 4.5 | — | ||||||
| CCC+ | 0.9 | — | 1.1 | — | ||||||
| CCC | — | — | — | — | ||||||
| CCC- | — | — | 0.2 | — | ||||||
| C | 0.1 | — | — | — | ||||||
| D | 1.4 | — | — | — | ||||||
| Not Applicable | 37.1 | 9.9 | 9.2 | — | ||||||
| Short-Term Investments | 5.7 | 1.1 | 4.1 | 0.4 | ||||||
| Total Investments | 100.0 | % | 100.0 | % | 100.0 | % | 100.0 | % | ||
| * | Represents percentage of total investments. |
12 Semi-Annual Report
The Lazard Funds, Inc. Portfolios of Investments
June 30, 2022 (unaudited)
The accompanying notes are an integral part of these financial statements.
Semi-Annual Report 13
| Description | Security Currency | Principal Amount (000) | Fair Value | |||||||
| Lazard Emerging Markets Debt Portfolio (continued) | ||||||||||
| Argentina | 0.5% | ||||||||||
| Republic of Argentina: | ||||||||||
| 0.500%, 07/09/30 (Ø) | USD | 94 | $ | 20,539 | ||||||
| 1.125%, 07/09/35 (Ø) | USD | 100 | 20,875 | |||||||
| 2.000%, 01/09/38 (Ø) | USD | 63 | 18,335 | |||||||
| 2.500%, 07/09/41 (Ø) | USD | 72 | 18,540 | |||||||
| 78,289 | ||||||||||
| Bahamas | 0.2% | ||||||||||
| Commonwealth of Bahamas, 8.950%, 10/15/32 | USD | 50 | 34,650 | |||||||
| Bahrain | 1.4% | ||||||||||
| Bahrain Government International Bonds, 6.750%, 09/20/29 | USD | 230 | 219,621 | |||||||
| Barbados | 0.1% | ||||||||||
| Barbados Government International Bonds, 6.500%, 10/01/29 (#) | USD | 10 | 9,592 | |||||||
| Brazil | 7.6% | ||||||||||
| Brazil Letras do Tesouro Nacional: | ||||||||||
| 0.000%, 07/01/23 | BRL | 900 | 151,164 | |||||||
| 0.000%, 04/01/24 | BRL | 2,020 | 310,412 | |||||||
| Brazil NTN-F: | ||||||||||
| 10.000%, 01/01/25 | BRL | 420 | 71,570 | |||||||
| 10.000%, 01/01/27 | BRL | 330 | 57,218 | |||||||
| 10.000%, 01/01/29 | BRL | 860 | 143,879 | |||||||
| 10.000%, 01/01/31 | BRL | 590 | 96,102 | |||||||
| Federal Republic of Brazil: | ||||||||||
| 4.500%, 05/30/29 | USD | 25 | 22,403 | |||||||
| 3.875%, 06/12/30 | USD | 155 | 129,890 | |||||||
| 5.625%, 01/07/41 | USD | 110 | 88,536 | |||||||
| 5.000%, 01/27/45 | USD | 80 | 57,365 | |||||||
| 4.750%, 01/14/50 | USD | 40 | 27,145 | |||||||
| 1,155,684 | ||||||||||
The accompanying notes are an integral part of these financial statements.
14 Semi-Annual Report
| Description | Security Currency | Principal Amount (000) | Fair Value | |||||||
| Lazard Emerging Markets Debt Portfolio (continued) | ||||||||||
| Chile | 2.8% | ||||||||||
| Bonos de la Tesoreria de la Republica en pesos: | ||||||||||
| 4.500%, 03/01/26 | CLP | 65,000 | $ | 66,476 | ||||||
| 2.300%, 10/01/28 | CLP | 25,000 | 21,509 | |||||||
| 5.000%, 10/01/28 | CLP | 80,000 | 80,615 | |||||||
| 6.000%, 01/01/43 | CLP | 10,000 | 10,457 | |||||||
| Chile Government International Bond: | ||||||||||
| 2.750%, 01/31/27 | USD | 75 | 70,125 | |||||||
| 4.000%, 01/31/52 | USD | 210 | 173,985 | |||||||
| 423,167 | ||||||||||
| China | 4.3% | ||||||||||
| China Development Bank, 3.500%, 08/13/26 | CNY | 1,910 | 292,146 | |||||||
| China Government Bonds: | ||||||||||
| 3.120%, 12/05/26 | CNY | 610 | 93,068 | |||||||
| 2.680%, 05/21/30 | CNY | 1,360 | 199,908 | |||||||
| 3.810%, 09/14/50 | CNY | 460 | 73,896 | |||||||
| 659,018 | ||||||||||
| Colombia | 4.3% | ||||||||||
| Colombian Titulos De Tesoreria: | ||||||||||
| 6.250%, 11/26/25 | COP | 301,300 | 63,477 | |||||||
| 7.500%, 08/26/26 | COP | 757,000 | 161,749 | |||||||
| 5.750%, 11/03/27 | COP | 798,000 | 150,982 | |||||||
| 6.000%, 04/28/28 | COP | 217,800 | 40,901 | |||||||
| 7.000%, 06/30/32 | COP | 240,000 | 42,370 | |||||||
| Republic of Colombia: | ||||||||||
| 4.500%, 03/15/29 | USD | 100 | 86,394 | |||||||
| 3.125%, 04/15/31 | USD | 45 | 33,379 | |||||||
| 5.000%, 06/15/45 | USD | 125 | 83,656 | |||||||
| 662,908 | ||||||||||
| Costa Rica | 0.7% | ||||||||||
| Republic of Costa Rica: | ||||||||||
| 4.250%, 01/26/23 | USD | 25 | 24,879 | |||||||
| 4.375%, 04/30/25 | USD | 15 | 14,487 | |||||||
| 6.125%, 02/19/31 | USD | 5 | 4,651 | |||||||
| 7.000%, 04/04/44 | USD | 70 | 60,104 | |||||||
| 104,121 | ||||||||||
The accompanying notes are an integral part of these financial statements.
Semi-Annual Report 15
| Description | Security Currency | Principal Amount (000) | Fair Value | |||||||
| Lazard Emerging Markets Debt Portfolio (continued) | ||||||||||
| Czech Republic | 0.9% | ||||||||||
| Czech Republic: | ||||||||||
| 2.500%, 08/25/28 | CZK | 2,280 | $ | 82,805 | ||||||
| 2.000%, 10/13/33 | CZK | 480 | 15,311 | |||||||
| 4.200%, 12/04/36 | CZK | 1,120 | 44,021 | |||||||
| 142,137 | ||||||||||
| Dominican Republic | 2.0% | ||||||||||
| Dominican Republic: | ||||||||||
| 5.500%, 01/27/25 | USD | 25 | 24,802 | |||||||
| 5.950%, 01/25/27 | USD | 10 | 9,549 | |||||||
| 5.500%, 02/22/29 (#) | USD | 45 | 39,102 | |||||||
| 4.500%, 01/30/30 (#) | USD | 120 | 95,760 | |||||||
| 6.000%, 02/22/33 (#) | USD | 85 | 70,699 | |||||||
| 7.450%, 04/30/44 | USD | 15 | 12,814 | |||||||
| 6.850%, 01/27/45 | USD | 20 | 15,897 | |||||||
| 6.400%, 06/05/49 | USD | 50 | 37,181 | |||||||
| 305,804 | ||||||||||
| Ecuador | 1.2% | ||||||||||
| Ecuador Government International Bonds: | ||||||||||
| 0.000%, 07/31/30 | USD | 356 | 151,367 | |||||||
| 5.000%, 07/31/30 (Ø) | USD | 37 | 24,230 | |||||||
| 175,597 | ||||||||||
| Egypt | 1.0% | ||||||||||
| Arab Republic of Egypt, 7.500%, 01/31/27 | USD | 200 | 155,500 | |||||||
| Gabon | 0.9% | ||||||||||
| Gabon Government International Bond, 7.000%, 11/24/31 (#) | USD | 200 | 144,500 | |||||||
| Guatemala | 0.4% | ||||||||||
| Republic of Guatemala: | ||||||||||
| 4.875%, 02/13/28 | USD | 25 | 23,364 | |||||||
| 5.375%, 04/24/32 (#) | USD | 10 | 9,208 | |||||||
| 5.375%, 04/24/32 | USD | 10 | 9,208 | |||||||
| 6.125%, 06/01/50 (#) | USD | 15 | 12,580 | |||||||
| 54,360 | ||||||||||
The accompanying notes are an integral part of these financial statements.
16 Semi-Annual Report
| Description | Security Currency | Principal Amount (000) | Fair Value | |||||||
| Lazard Emerging Markets Debt Portfolio (continued) | ||||||||||
| Hungary | 0.9% | ||||||||||
| Hungary Government Bonds: | ||||||||||
| 3.000%, 10/27/27 | HUF | 34,330 | $ | 70,556 | ||||||
| 2.250%, 04/20/33 | HUF | 18,510 | 29,314 | |||||||
| 3.000%, 04/25/41 | HUF | 3,940 | 5,512 | |||||||
| Hungary Government International Bond, 5.500%, 06/16/34 (#) | USD | 40 | 38,805 | |||||||
| 144,187 | ||||||||||
| Indonesia | 6.0% | ||||||||||
| Indonesia Government International Bonds: | ||||||||||
| 2.150%, 07/28/31 | USD | 350 | 287,038 | |||||||
| 3.550%, 03/31/32 | USD | 55 | 49,987 | |||||||
| 3.050%, 03/12/51 | USD | 50 | 37,943 | |||||||
| 3.350%, 03/12/71 | USD | 60 | 42,082 | |||||||
| Indonesia Treasury Bonds: | ||||||||||
| 8.375%, 09/15/26 | IDR | 386,000 | 28,009 | |||||||
| 9.000%, 03/15/29 | IDR | 818,000 | 60,537 | |||||||
| 8.250%, 05/15/29 | IDR | 1,545,000 | 110,294 | |||||||
| 7.000%, 09/15/30 | IDR | 1,032,000 | 68,650 | |||||||
| 8.750%, 05/15/31 | IDR | 324,000 | 23,619 | |||||||
| 8.375%, 03/15/34 | IDR | 912,000 | 65,106 | |||||||
| 8.250%, 05/15/36 | IDR | 648,000 | 45,890 | |||||||
| 8.375%, 04/15/39 | IDR | 920,000 | 65,708 | |||||||
| Perusahaan Penerbit SBSN Indonesia III, 4.400%, 06/06/27 (#) | USD | 35 | 34,737 | |||||||
| 919,600 | ||||||||||
| Iraq | 1.3% | ||||||||||
| Republic of Iraq, 6.752%, 03/09/23 | USD | 200 | 194,850 | |||||||
| Ivory Coast | 1.0% | ||||||||||
| Ivory Coast, 6.125%, 06/15/33 | USD | 200 | 155,787 | |||||||
| Kazakhstan | 1.3% | ||||||||||
| Republic of Kazakhstan, 6.500%, 07/21/45 | USD | 200 | 199,000 | |||||||
The accompanying notes are an integral part of these financial statements.
Semi-Annual Report 17
| Description | Security Currency | Principal Amount (000) | Fair Value | |||||||
| Lazard Emerging Markets Debt Portfolio (continued) | ||||||||||
| Lebanon | 0.4% | ||||||||||
| Lebanese Republic: | ||||||||||
| 6.375%, 03/09/20 («) | USD | 97 | $ | 6,354 | ||||||
| 8.250%, 04/12/21 («) | USD | 106 | 6,545 | |||||||
| 6.000%, 01/27/23 («) | USD | 67 | 4,116 | |||||||
| 6.650%, 04/22/24 («) | USD | 87 | 5,671 | |||||||
| 6.250%, 11/04/24 («) | USD | 49 | 3,041 | |||||||
| 6.200%, 02/26/25 («) | USD | 37 | 2,273 | |||||||
| 6.600%, 11/27/26 («) | USD | 104 | 6,390 | |||||||
| 6.850%, 03/23/27 («) | USD | 61 | 3,595 | |||||||
| 6.750%, 11/29/27 («) | USD | 41 | 2,532 | |||||||
| 6.650%, 02/26/30 («) | USD | 55 | 3,242 | |||||||
| 7.000%, 03/23/32 («) | USD | 49 | 3,026 | |||||||
| 7.050%, 11/02/35 («) | USD | 60 | 3,686 | |||||||
| 7.250%, 03/23/37 («) | USD | 44 | 2,428 | |||||||
| 52,899 | ||||||||||
| Malaysia | 4.8% | ||||||||||
| Malaysia Government Bonds: | ||||||||||
| 3.418%, 08/15/22 | MYR | 80 | 18,179 | |||||||
| 3.795%, 09/30/22 | MYR | 1,009 | 229,759 | |||||||
| 3.906%, 07/15/26 | MYR | 120 | 27,158 | |||||||
| 3.899%, 11/16/27 | MYR | 1,017 | 228,136 | |||||||
| 4.498%, 04/15/30 | MYR | 350 | 80,220 | |||||||
| 3.844%, 04/15/33 | MYR | 330 | 69,908 | |||||||
| 3.828%, 07/05/34 | MYR | 20 | 4,187 | |||||||
| 4.893%, 06/08/38 | MYR | 330 | 75,291 | |||||||
| 732,838 | ||||||||||
| Mexico | 6.1% | ||||||||||
| Mexican Bonos: | ||||||||||
| 5.750%, 03/05/26 | MXN | 5,220 | 230,701 | |||||||
| 7.500%, 06/03/27 | MXN | 1,990 | 92,449 | |||||||
| 8.500%, 05/31/29 | MXN | 2,998 | 144,798 | |||||||
| 10.000%, 11/20/36 | MXN | 1,250 | 67,055 | |||||||
| 7.750%, 11/13/42 | MXN | 3,100 | 134,862 | |||||||
| Mexico Government International Bonds: 5.750%, 10/12/10 | USD | 88 | 73,661 | |||||||
The accompanying notes are an integral part of these financial statements.
18 Semi-Annual Report
| Description | Security Currency | Principal Amount (000) | Fair Value | |||||||
| Lazard Emerging Markets Debt Portfolio (continued) | ||||||||||
| 2.659%, 05/24/31 | USD | 25 | $ | 20,575 | ||||||
| 3.500%, 02/12/34 | USD | 125 | 103,375 | |||||||
| 4.280%, 08/14/41 | USD | 45 | 35,629 | |||||||
| 5.000%, 04/27/51 | USD | 20 | 16,566 | |||||||
| 4.400%, 02/12/52 | USD | 16 | 12,040 | |||||||
| 931,711 | ||||||||||
| Nigeria | 1.0% | ||||||||||
| Republic of Nigeria, 8.747%, 01/21/31 | USD | 200 | 148,500 | |||||||
| Oman | 2.8% | ||||||||||
| Oman Government International Bonds: | ||||||||||
| 4.750%, 06/15/26 | USD | 245 | 232,750 | |||||||
| 6.250%, 01/25/31 | USD | 200 | 193,250 | |||||||
| 426,000 | ||||||||||
| Panama | 1.9% | ||||||||||
| Republic of Panama: | ||||||||||
| 3.160%, 01/23/30 | USD | 105 | 93,535 | |||||||
| 3.298%, 01/19/33 | USD | 5 | 4,285 | |||||||
| 4.500%, 05/15/47 | USD | 10 | 8,258 | |||||||
| 4.500%, 04/16/50 | USD | 30 | 24,512 | |||||||
| 4.500%, 04/01/56 | USD | 75 | 59,733 | |||||||
| 3.870%, 07/23/60 | USD | 60 | 42,574 | |||||||
| 4.500%, 01/19/63 | USD | 80 | 61,880 | |||||||
| 294,777 | ||||||||||
| Paraguay | 0.9% | ||||||||||
| Republic of Paraguay: | ||||||||||
| 5.000%, 04/15/26 | USD | 25 | 24,544 | |||||||
| 4.700%, 03/27/27 | USD | 35 | 33,574 | |||||||
| 3.849%, 06/28/33 (#) | USD | 53 | 43,288 | |||||||
| 6.100%, 08/11/44 | USD | 40 | 34,707 | |||||||
| 136,113 | ||||||||||
| Peru | 4.5% | ||||||||||
| Republic of Peru: | ||||||||||
| 3.230%, 07/28/21 | USD | 60 | 36,892 | |||||||
| 6.350%, 08/12/28 | PEN | 650 | 160,102 | |||||||
The accompanying notes are an integral part of these financial statements.
Semi-Annual Report 19
| Description | Security Currency | Principal Amount (000) | Fair Value | |||||||
| Lazard Emerging Markets Debt Portfolio (continued) | ||||||||||
| 5.940%, 02/12/29 | PEN | 80 | $ | 19,091 | ||||||
| 2.844%, 06/20/30 | USD | 100 | 87,175 | |||||||
| 2.783%, 01/23/31 | USD | 130 | 110,646 | |||||||
| 6.950%, 08/12/31 | PEN | 75 | 18,557 | |||||||
| 6.900%, 08/12/37 | PEN | 730 | 172,189 | |||||||
| 5.350%, 08/12/40 | PEN | 55 | 10,748 | |||||||
| 3.300%, 03/11/41 | USD | 85 | 64,005 | |||||||
| 679,405 | ||||||||||
| Philippines | 2.1% | ||||||||||
| Republic of Philippines: | ||||||||||
| 3.750%, 01/14/29 | USD | 105 | 101,862 | |||||||
| 3.556%, 09/29/32 | USD | 40 | 36,904 | |||||||
| 3.950%, 01/20/40 | USD | 35 | 30,323 | |||||||
| 3.700%, 03/01/41 | USD | 35 | 28,923 | |||||||
| 3.700%, 02/02/42 | USD | 35 | 28,923 | |||||||
| 2.950%, 05/05/45 | USD | 55 | 39,262 | |||||||
| 2.650%, 12/10/45 | USD | 40 | 27,404 | |||||||
| 3.200%, 07/06/46 | USD | 40 | 29,804 | |||||||
| 323,405 | ||||||||||
| Poland | 1.8% | ||||||||||
| Republic of Poland Government Bonds: | ||||||||||
| 2.500%, 07/25/26 | PLN | 190 | 35,325 | |||||||
| 3.750%, 05/25/27 | PLN | 92 | 17,601 | |||||||
| 2.500%, 07/25/27 | PLN | 790 | 141,177 | |||||||
| 2.750%, 04/25/28 | PLN | 300 | 53,643 | |||||||
| 1.250%, 10/25/30 | PLN | 220 | 32,158 | |||||||
| 279,904 | ||||||||||
| Qatar | 1.8% | ||||||||||
| Qatar Government International Bond, 6.400%, 01/20/40 | USD | 235 | 278,475 | |||||||
| Romania | 0.5% | ||||||||||
| Romanian Government Bonds: | ||||||||||
| 5.800%, 07/26/27 | RON | 170 | 31,754 | |||||||
| 4.150%, 01/26/28 | RON | 220 | 37,356 | |||||||
| 69,110 | ||||||||||
The accompanying notes are an integral part of these financial statements.
20 Semi-Annual Report
| Description | Security Currency | Principal Amount (000) | Fair Value | |||||||
| Lazard Emerging Markets Debt Portfolio (continued) | ||||||||||
| Saudi Arabia | 2.3% | ||||||||||
| Saudi Government International Bond, 2.250%, 02/02/33 | USD | 415 | $ | 344,450 | ||||||
| Senegal | 1.0% | ||||||||||
| Republic of Senegal, 6.250%, 05/23/33 | USD | 200 | 151,000 | |||||||
| South Africa | 7.3% | ||||||||||
| Republic of South Africa: | ||||||||||
| 4.850%, 09/27/27 | USD | 60 | 54,686 | |||||||
| 4.850%, 09/30/29 | USD | 10 | 8,536 | |||||||
| 8.000%, 01/31/30 | ZAR | 4,660 | 248,847 | |||||||
| 5.875%, 06/22/30 | USD | 55 | 49,665 | |||||||
| 8.250%, 03/31/32 | ZAR | 1,510 | 77,692 | |||||||
| 8.875%, 02/28/35 | ZAR | 1,520 | 78,272 | |||||||
| 8.500%, 01/31/37 | ZAR | 6,840 | 332,104 | |||||||
| 5.375%, 07/24/44 | USD | 115 | 78,617 | |||||||
| 5.000%, 10/12/46 | USD | 25 | 16,200 | |||||||
| 5.650%, 09/27/47 | USD | 30 | 20,481 | |||||||
| 8.750%, 02/28/48 | ZAR | 1,445 | 68,398 | |||||||
| 6.300%, 06/22/48 | USD | 25 | 18,606 | |||||||
| 5.750%, 09/30/49 | USD | 90 | 61,650 | |||||||
| 1,113,754 | ||||||||||
| Sri Lanka | 0.2% | ||||||||||
| Republic of Sri Lanka: | ||||||||||
| 5.750%, 04/18/23 | USD | 15 | 4,662 | |||||||
| 6.125%, 06/03/25 | USD | 10 | 3,242 | |||||||
| 6.825%, 07/18/26 | USD | 5 | 1,642 | |||||||
| 6.200%, 05/11/27 | USD | 50 | 14,005 | |||||||
| 6.750%, 04/18/28 | USD | 35 | 9,804 | |||||||
| 7.850%, 03/14/29 | USD | 15 | 4,202 | |||||||
| 37,557 | ||||||||||
| Suriname | 0.1% | ||||||||||
| Republic of Suriname, 9.250%, 10/26/26 | USD | 10 | 7,074 | |||||||
The accompanying notes are an integral part of these financial statements.
Semi-Annual Report 21
| Description | Security Currency | Principal Amount (000) | Fair Value | |||||||
| Lazard Emerging Markets Debt Portfolio (continued) | ||||||||||
| Thailand | 0.7% | ||||||||||
| Thailand Government Bonds: | ||||||||||
| 3.400%, 06/17/36 | THB | 1,330 | $ | 37,081 | ||||||
| 3.300%, 06/17/38 | THB | 2,690 | 72,882 | |||||||
| 109,963 | ||||||||||
| Turkey | 1.7% | ||||||||||
| Hazine Mustesarligi Varlik Kiralama AS, 7.250%, 02/24/27 (#) | USD | 125 | 117,172 | |||||||
| Republic of Turkey: | ||||||||||
| 7.375%, 02/05/25 | USD | 95 | 88,130 | |||||||
| 5.750%, 05/11/47 | USD | 95 | 58,384 | |||||||
| 263,686 | ||||||||||
| Ukraine | 0.4% | ||||||||||
| Ukraine Government Bonds: | ||||||||||
| 9.750%, 11/01/28 | USD | 200 | 49,000 | |||||||
| 0.000%, 05/31/40 (§) | USD | 36 | 8,820 | |||||||
| 57,820 | ||||||||||
| United Arab Emirates | 2.6% | ||||||||||
| United Arab Emirates International, 4.050%, 07/07/32 | USD | 400 | 402,500 | |||||||
| Uruguay | 1.6% | ||||||||||
| Republica Orient Uruguay: | ||||||||||
| 4.375%, 10/27/27 | USD | 30 | 30,343 | |||||||
| 4.375%, 01/23/31 | USD | 55 | 55,595 | |||||||
| 4.125%, 11/20/45 | USD | 30 | 27,493 | |||||||
| 5.100%, 06/18/50 | USD | 85 | 85,255 | |||||||
| 4.975%, 04/20/55 | USD | 50 | 49,290 | |||||||
| 247,976 | ||||||||||
| Uzbekistan | 0.9% | ||||||||||
| Republic of Uzbekistan International Bond, 3.900%, 10/19/31 (#) | USD | 200 | 141,500 | |||||||
| Zambia | 0.8% | ||||||||||
| Republic of Zambia, 8.500%, 04/14/24 | USD | 200 | 120,000 | |||||||
| Total Foreign Government Obligations (Cost $16,357,231) | 13,472,539 | |||||||||
The accompanying notes are an integral part of these financial statements.
22 Semi-Annual Report
| Description | Security Currency | Principal Amount (000) | Fair Value | |||||||
| Lazard Emerging Markets Debt Portfolio (continued) | ||||||||||
| Quasi Government Bonds | 0.2% | ||||||||||
| Mexico | 0.1% | ||||||||||
| Petroleos Mexicanos, 6.750%, 09/21/47 | USD | 16 | $ | 9,800 | ||||||
| Venezuela | 0.1% | ||||||||||
| Petroleos de Venezuela SA: | ||||||||||
| 6.000%, 11/15/26 («) | USD | 124 | 6,820 | |||||||
| 5.500%, 04/12/37 («) | USD | 100 | 5,500 | |||||||
| 12,320 | ||||||||||
| Total Quasi Government Bonds (Cost $91,818) | 22,120 | |||||||||
| Supranational Bonds | 0.1% | ||||||||||
| International Finance Corp., 8.000%, 10/09/23 (Cost $14,152) | IDR | 200,000 | 13,832 | |||||||
| Description | Shares | Fair Value | ||||||||
| Short-Term Investments | 5.7% | ||||||||||
| State Street Institutional Treasury Money Market Fund, Premier Class, 1.04% (7 day yield) (Cost $870,528) | 870,528 | $ | 870,528 | |||||||
| Total Investments | 99.5% (Cost $18,314,203) (») | $ | 15,194,490 | ||||||||
| Cash and Other Assets in Excess of Liabilities | 0.5% | 81,951 | |||||||||
| Net Assets | 100.0% | $ | 15,276,441 | ||||||||
The accompanying notes are an integral part of these financial statements.
Semi-Annual Report 23
Lazard Emerging Markets Debt Portfolio (continued)
Forward Currency Contracts open at June 30, 2022:
| Currency Purchased | Quantity | Currency Sold | Quantity | Counterparty | Settlement Date | Unrealized Appreciation | Unrealized Depreciation | |||||||||||||||||
| BRL | 19,924 | USD | 4,112 | BOA | 07/05/22 | $ | — | $ | 305 | |||||||||||||||
| BRL | 613,956 | USD | 119,377 | BOA | 07/05/22 | — | 2,063 | |||||||||||||||||
| BRL | 191,440 | USD | 36,548 | BRC | 07/05/22 | 32 | — | |||||||||||||||||
| BRL | 210,860 | USD | 40,000 | BRC | 08/02/22 | — | 54 | |||||||||||||||||
| BRL | 442,440 | USD | 84,467 | SCB | 07/05/22 | 73 | — | |||||||||||||||||
| CLP | 73,728,000 | USD | 80,000 | BOA | 08/08/22 | — | 264 | |||||||||||||||||
| CNY | 413,637 | USD | 61,603 | BOA | 07/20/22 | 185 | — | |||||||||||||||||
| CNY | 413,637 | USD | 61,591 | BRC | 07/20/22 | 198 | — | |||||||||||||||||
| CNY | 133,771 | USD | 20,000 | SCB | 07/20/22 | — | 18 | |||||||||||||||||
| COP | 164,800,000 | USD | 40,000 | BOA | 07/13/22 | — | 360 | |||||||||||||||||
| COP | 276,710,000 | USD | 70,000 | CIT | 07/13/22 | — | 3,442 | |||||||||||||||||
| CZK | 5,285,261 | USD | 223,194 | BRC | 07/20/22 | 269 | — | |||||||||||||||||
| CZK | 237,019 | USD | 10,000 | SCB | 07/20/22 | 21 | — | |||||||||||||||||
| HUF | 48,125,110 | USD | 130,935 | BOA | 07/20/22 | — | 4,037 | |||||||||||||||||
| HUF | 3,729,518 | USD | 10,000 | SCB | 07/20/22 | — | 166 | |||||||||||||||||
| IDR | 438,000,000 | USD | 30,000 | BRC | 07/19/22 | — | 604 | |||||||||||||||||
| IDR | 1,618,104,400 | USD | 110,000 | SCB | 07/19/22 | — | 1,401 | |||||||||||||||||
| IDR | 6,545,809,710 | USD | 445,991 | SCB | 07/19/22 | — | 6,668 | |||||||||||||||||
| IDR | 144,300,000 | USD | 10,000 | SCB | 09/02/22 | — | 324 | |||||||||||||||||
| MXN | 1,922,757 | USD | 93,051 | BOA | 07/20/22 | 2,305 | — | |||||||||||||||||
| MXN | 1,419,460 | USD | 70,000 | BRC | 07/20/22 | 395 | — | |||||||||||||||||
| MXN | 1,922,757 | USD | 93,052 | UBS | 07/20/22 | 2,304 | — | |||||||||||||||||
| MYR | 582,354 | USD | 134,285 | BOA | 08/23/22 | — | 2,142 | |||||||||||||||||
| PEN | 76,650 | USD | 20,000 | BRC | 07/18/22 | — | 8 | |||||||||||||||||
| PLN | 582,043 | USD | 129,461 | BOA | 07/20/22 | 145 | — | |||||||||||||||||
| PLN | 582,043 | USD | 129,443 | UBS | 07/20/22 | 163 | — | |||||||||||||||||
| RON | 611,955 | USD | 127,885 | BRC | 07/20/22 | 1,520 | — | |||||||||||||||||
| RON | 232,475 | USD | 50,000 | CIT | 07/20/22 | — | 841 | |||||||||||||||||
| THB | 23,539,078 | USD | 675,585 | CIT | 08/29/22 | — | 8,179 | |||||||||||||||||
| USD | 3,804 | BRL | 19,924 | BOA | 07/05/22 | — | 3 | |||||||||||||||||
| USD | 117,212 | BRL | 613,956 | BOA | 07/05/22 | — | 102 | |||||||||||||||||
| USD | 118,425 | BRL | 613,956 | BOA | 08/02/22 | 2,116 | — | |||||||||||||||||
| USD | 40,000 | BRL | 191,440 | BRC | 07/05/22 | 3,420 | — | |||||||||||||||||
| USD | 90,000 | BRL | 442,440 | SCB | 07/05/22 | 5,459 | — | |||||||||||||||||
| USD | 28,118 | CLP | 24,574,921 | UBS | 08/08/22 | 1,541 | — | |||||||||||||||||
| USD | 60,000 | CNY | 402,342 | SCB | 07/20/22 | — | 101 | |||||||||||||||||
| USD | 117,220 | COP | 469,689,860 | BOA | 07/13/22 | 4,245 | — | |||||||||||||||||
The accompanying notes are an integral part of these financial statements.
24 Semi-Annual Report
Lazard Emerging Markets Debt Portfolio (concluded)
Forward Currency Contracts open at June 30, 2022:
| Currency Purchased | Quantity | Currency Sold | Quantity | Counterparty | Settlement Date | Unrealized Appreciation | Unrealized Depreciation | |||||||||||||||||
| USD | 40,000 | COP | 161,680,000 | BRC | 07/25/22 | $ | 1,198 | $ | — | |||||||||||||||
| USD | 117,283 | COP | 469,689,838 | UBS | 07/13/22 | 4,307 | — | |||||||||||||||||
| USD | 10,000 | CZK | 232,202 | SCB | 07/20/22 | 182 | — | |||||||||||||||||
| USD | 20,000 | HUF | 7,608,799 | SCB | 07/20/22 | — | 63 | |||||||||||||||||
| USD | 141,700 | IDR | 2,091,492,000 | BRC | 07/19/22 | 1,329 | — | |||||||||||||||||
| USD | 30,000 | IDR | 447,690,000 | SCB | 07/19/22 | — | 47 | |||||||||||||||||
| USD | 38,300 | IDR | 565,346,300 | SCB | 07/19/22 | 357 | — | |||||||||||||||||
| USD | 39,573 | IDR | 580,819,966 | SCB | 07/19/22 | 592 | — | |||||||||||||||||
| USD | 80,000 | IDR | 1,175,600,000 | SCB | 07/19/22 | 1,099 | — | |||||||||||||||||
| USD | 48,041 | MXN | 985,816 | BRC | 07/20/22 | — | 849 | |||||||||||||||||
| USD | 50,000 | MXN | 994,975 | BRC | 07/20/22 | 656 | — | |||||||||||||||||
| USD | 30,000 | MYR | 131,493 | SCB | 08/23/22 | 163 | — | |||||||||||||||||
| USD | 90,000 | MYR | 396,090 | SCB | 08/23/22 | 122 | — | |||||||||||||||||
| USD | 95,644 | PEN | 367,789 | BOA | 07/18/22 | — | 283 | |||||||||||||||||
| USD | 30,000 | PEN | 111,630 | BRC | 07/18/22 | 885 | — | |||||||||||||||||
| USD | 95,073 | PEN | 367,789 | BRC | 07/18/22 | — | 854 | |||||||||||||||||
| USD | 50,000 | PLN | 225,273 | SCB | 07/20/22 | — | 162 | |||||||||||||||||
| USD | 10,000 | RON | 46,501 | SCB | 07/20/22 | 167 | — | |||||||||||||||||
| USD | 30,000 | THB | 1,058,775 | SCB | 08/29/22 | — | 20 | |||||||||||||||||
| USD | 44,177 | ZAR | 709,824 | BRC | 07/20/22 | 612 | — | |||||||||||||||||
| USD | 44,197 | ZAR | 709,824 | UBS | 07/20/22 | 633 | — | |||||||||||||||||
| UYU | 353,959 | USD | 8,688 | HSB | 09/06/22 | 161 | — | |||||||||||||||||
| Total gross unrealized appreciation/depreciation on Forward Currency Contracts | $ | 36,854 | $ | 33,360 | ||||||||||||||||||||
The accompanying notes are an integral part of these financial statements.
Semi-Annual Report 25
The accompanying notes are an integral part of these financial statements.
26 Semi-Annual Report
| Description | Security Currency | Principal Amount (000) | Fair Value | |||||||
| Lazard Global Fixed Income Portfolio (continued) | ||||||||||
| Ball Corp., 4.875%, 03/15/26 | USD | 25 | $ | 24,594 | ||||||
| Bank of America Corp.: | ||||||||||
| 1.486% (SOFR + 1.460%), 05/19/24 (§) | USD | 50 | 48,862 | |||||||
| 1.978% (CDOR 3 Month + 0.600%), 09/15/27 (§) | CAD | 85 | 58,756 | |||||||
| Citigroup, Inc., 1.281% (SOFR + 0.528%), 11/03/25 (§) | USD | 95 | 88,206 | |||||||
| Clean Harbors, Inc., 4.875%, 07/15/27 | USD | 25 | 22,875 | |||||||
| Dell International LLC, 5.300%, 10/01/29 | USD | 65 | 64,079 | |||||||
| John Deere Financial, Inc., 2.410%, 01/14/25 | CAD | 80 | 59,428 | |||||||
| Johnson Controls International PLC, 1.750%, 09/15/30 | USD | 75 | 60,979 | |||||||
| JPMorgan Chase & Co., 3.540% (USD LIBOR 3 Month + 1.380%), 05/01/28 (§) | USD | 95 | 90,070 | |||||||
| Kimberly-Clark Corp., 3.200%, 04/25/29 | USD | 45 | 42,684 | |||||||
| McDonald’s Corp., 3.125%, 03/04/25 | CAD | 70 | 52,957 | |||||||
| Microsoft Corp., 3.500%, 11/15/42 | USD | 25 | 22,133 | |||||||
| Morgan Stanley, 3.625%, 01/20/27 | USD | 55 | 53,271 | |||||||
| Mueller Water Products, Inc., 4.000%, 06/15/29 (#) | USD | 15 | 13,085 | |||||||
| PepsiCo, Inc., 2.875%, 10/15/49 | USD | 35 | 27,789 | |||||||
| Pfizer, Inc., 2.625%, 04/01/30 | USD | 65 | 59,350 | |||||||
| Prologis LP REIT, 1.250%, 10/15/30 | USD | 120 | 94,859 | |||||||
The accompanying notes are an integral part of these financial statements.
Semi-Annual Report 27
| Description | Security Currency | Principal Amount (000) | Fair Value | |||||||
| Lazard Global Fixed Income Portfolio (continued) | ||||||||||
| Service Corp. International, 4.625%, 12/15/27 | USD | 30 | $ | 28,200 | ||||||
| Starbucks Corp., 4.450%, 08/15/49 | USD | 25 | 22,414 | |||||||
| The Goldman Sachs Group, Inc., 1.992% (SOFR + 1.090%), 01/27/32 (§) | USD | 75 | 59,246 | |||||||
| The Home Depot, Inc., 5.875%, 12/16/36 | USD | 40 | 45,991 | |||||||
| The Procter & Gamble Co., 1.200%, 10/29/30 | USD | 35 | 28,581 | |||||||
| Toyota Motor Credit Corp., 2.150%, 02/13/30 | USD | 65 | 56,271 | |||||||
| United Rentals North America, Inc., 4.875%, 01/15/28 | USD | 30 | 28,364 | |||||||
| Verizon Communications, Inc., 3.875%, 02/08/29 | USD | 90 | 87,074 | |||||||
| Visa, Inc., 0.750%, 08/15/27 | USD | 35 | 30,363 | |||||||
| 1,524,415 | ||||||||||
| Total Corporate Bonds (Cost $2,215,637) | 1,913,166 | |||||||||
| Foreign Government Obligations | 46.7% | ||||||||||
| Australia | 2.6% | ||||||||||
| New South Wales Treasury Corp., 1.250%, 11/20/30 | AUD | 100 | 54,993 | |||||||
| Queensland Treasury Corp., 1.250%, 03/10/31 | AUD | 160 | 87,366 | |||||||
| 142,359 | ||||||||||
| Bahamas | 1.0% | ||||||||||
| Commonwealth of Bahamas, 6.950%, 11/20/29 | USD | 73 | 52,939 | |||||||
The accompanying notes are an integral part of these financial statements.
28 Semi-Annual Report
| Description | Security Currency | Principal Amount (000) | Fair Value | |||||||
| Lazard Global Fixed Income Portfolio (continued) | ||||||||||
| Bermuda | 3.5% | ||||||||||
| Government of Bermuda, 3.717%, 01/25/27 | USD | 200 | $ | 192,913 | ||||||
| Canada | 4.6% | ||||||||||
| City of Vancouver, 2.900%, 11/20/25 | CAD | 80 | 60,978 | |||||||
| Export Development Canada, 1.650%, 07/31/24 | CAD | 90 | 67,596 | |||||||
| Province of British Columbia Canada, 3.200%, 06/18/44 | CAD | 55 | 36,537 | |||||||
| Province of Quebec, 1.850%, 02/13/27 | CAD | 115 | 83,104 | |||||||
| 248,215 | ||||||||||
| Chile | 3.5% | ||||||||||
| Bonos de la Tesoreria de la Republica en pesos: | ||||||||||
| 5.800%, 06/01/24 | CLP | 50,000 | 53,029 | |||||||
| 2.300%, 10/01/28 | CLP | 65,000 | 55,923 | |||||||
| Republic of Chile, 0.830%, 07/02/31 | EUR | 100 | 81,661 | |||||||
| 190,613 | ||||||||||
| Colombia | 0.5% | ||||||||||
| Republic of Colombia, 9.850%, 06/28/27 | COP | 126,000 | 29,030 | |||||||
| Czech Republic | 1.8% | ||||||||||
| Czech Republic, 1.000%, 06/26/26 | CZK | 2,780 | 98,731 | |||||||
| France | ��0.5% | ||||||||||
| Government of France, 1.750%, 06/25/39 | EUR | 30 | 29,277 | |||||||
The accompanying notes are an integral part of these financial statements.
Semi-Annual Report 29
| Description | Security Currency | Principal Amount (000) | Fair Value | |||||||
| Lazard Global Fixed Income Portfolio (continued) | ||||||||||
| Hungary | 1.3% | ||||||||||
| Hungary Government Bonds, 2.750%, 12/22/26 | HUF | 20,780 | $ | 43,653 | ||||||
| Hungary Government International Bond, 1.750%, 06/05/35 | EUR | 35 | 25,888 | |||||||
| 69,541 | ||||||||||
| Ireland | 0.6% | ||||||||||
| Ireland Government Bonds, 1.350%, 03/18/31 | EUR | 30 | 30,295 | |||||||
| Japan | 3.6% | ||||||||||
| Japan International Cooperation Agency, 3.250%, 05/25/27 | USD | 200 | 197,396 | |||||||
| Mexico | 2.6% | ||||||||||
| Mexican Bonos: | ||||||||||
| 8.000%, 09/05/24 | MXN | 1,110 | 53,697 | |||||||
| 7.500%, 06/03/27 | MXN | 1,220 | 56,677 | |||||||
| United Mexican States, 6.750%, 02/06/24 | GBP | 25 | 31,475 | |||||||
| 141,849 | ||||||||||
| Morocco | 1.3% | ||||||||||
| Morocco Government International Bond, 1.500%, 11/27/31 | EUR | 100 | 69,446 | |||||||
| New Zealand | 6.5% | ||||||||||
| Housing New Zealand, Ltd. MTN, 3.420%, 10/18/28 | NZD | 120 | 70,980 | |||||||
| New Zealand Local Government Funding Agency Bonds: | ||||||||||
| 2.250%, 04/15/24 | NZD | 190 | 114,996 | |||||||
| 1.500%, 04/20/29 | NZD | 210 | 108,917 | |||||||
| 2.000%, 04/15/37 | NZD | 130 | 56,625 | |||||||
| 351,518 | ||||||||||
The accompanying notes are an integral part of these financial statements.
30 Semi-Annual Report
| Description | Security Currency | Principal Amount (000) | Fair Value | |||||||
| Lazard Global Fixed Income Portfolio (continued) | ||||||||||
| Norway | 1.8% | ||||||||||
| Oslo Kommune, 2.350%, 09/04/24 | NOK | 1,000 | $ | 99,002 | ||||||
| Panama | 2.2% | ||||||||||
| Republic of Panama, 8.875%, 09/30/27 | USD | 100 | 117,769 | |||||||
| Peru | 2.0% | ||||||||||
| Peru Government Bonds: | ||||||||||
| 6.150%, 08/12/32 (#) | PEN | 250 | 57,601 | |||||||
| 3.000%, 01/15/34 | USD | 65 | 53,333 | |||||||
| 110,934 | ||||||||||
| Poland | 1.0% | ||||||||||
| Poland Government Bonds, 6.680% ((WIBOR 6 Month),), 05/25/28 (§) | PLN | 255 | 53,587 | |||||||
| Portugal | 1.1% | ||||||||||
| Portugal Obrigacoes do Tesouro OT, 1.650%, 07/16/32 | EUR | 60 | 58,445 | |||||||
| Singapore | 1.0% | ||||||||||
| Singapore Government Bond, 3.375%, 09/01/33 | SGD | 75 | 55,766 | |||||||
| Spain | 1.0% | ||||||||||
| Spain Government Bond, 1.000%, 07/30/42 | EUR | 75 | 56,046 | |||||||
| Thailand | 1.2% | ||||||||||
| Thailand Government Bonds, 1.585%, 12/17/35 | THB | 2,745 | 62,672 | |||||||
The accompanying notes are an integral part of these financial statements.
Semi-Annual Report 31
| Description | Security Currency | Principal Amount (000) | Fair Value | |||||||
| Lazard Global Fixed Income Portfolio (continued) | ||||||||||
| United Kingdom | 1.5% | ||||||||||
| United Kingdom Gilt: | ||||||||||
| 0.875%, 07/31/33 | GBP | 55 | $ | 57,246 | ||||||
| 1.500%, 07/22/47 | GBP | 25 | 24,145 | |||||||
| 81,391 | ||||||||||
| Total Foreign Government Obligations (Cost $3,086,393) | 2,539,734 | |||||||||
| Quasi Government Bonds | 1.3% | ||||||||||
| Germany | 1.3% | ||||||||||
| Kreditanstalt fuer Wiederaufbau, 1.750%, 09/14/29 (Cost $79,685) | USD | 78 | 70,958 | |||||||
| Supranational Bonds | 11.3% | ||||||||||
| Asian Development Bank, 2.125%, 03/19/25 | USD | 50 | 48,738 | |||||||
| European Investment Bank, 1.000%, 01/28/28 | CAD | 80 | 54,537 | |||||||
| Inter-American Development Bank, 7.875%, 03/14/23 | IDR | 1,140,000 | 77,801 | |||||||
| Inter-American Investment Corp., 1.100%, 06/30/26 | AUD | 41 | 25,129 | |||||||
| International Bank for Reconstruction & Development: | ||||||||||
| 1.900%, 01/16/25 | CAD | 115 | 86,122 | |||||||
| 2.900%, 11/26/25 | AUD | 100 | 66,889 | |||||||
| 1.250%, 03/16/26 | NOK | 660 | 62,572 | |||||||
| 1.125%, 09/13/28 | USD | 35 | 30,910 | |||||||
| International Finance Corp.: | ||||||||||
| 2.125%, 04/07/26 | USD | 105 | 101,085 | |||||||
| 1.500%, 04/15/35 | AUD | 132 | 62,519 | |||||||
| Total Supranational Bonds (Cost $703,559) | 616,302 | |||||||||
The accompanying notes are an integral part of these financial statements.
32 Semi-Annual Report
| Description | Security Currency | Principal Amount (000) | Fair Value | |||||||
| Lazard Global Fixed Income Portfolio (continued) | ||||||||||
| US Municipal Bonds | 1.6% | ||||||||||
| California | 1.6% | ||||||||||
| State of California: | ||||||||||
| 4.500%, 04/01/33 | USD | 45 | $ | 46,082 | ||||||
| 7.550%, 04/01/39 | USD | 30 | 40,695 | |||||||
| 86,777 | ||||||||||
| Total US Municipal Bonds (Cost $95,564) | 86,777 | |||||||||
| US Treasury Securities | 2.2% | ||||||||||
| U.S. Treasury Bond, 1.750%, 08/15/41 (Cost $134,180) | USD | 160 | 121,706 | |||||||
| Description | Shares | Fair Value | ||||||||
| Short-Term Investments | 1.1% | ||||||||||
| State Street Institutional Treasury Money Market Fund, Premier Class, 1.04% (7 day yield) (Cost $57,844) | 57,844 | $ | 57,844 | |||||||
| Total Investments | 99.4% (Cost $6,372,862) (») | $ | 5,406,487 | ||||||||
| Cash and Other Assets in Excess of Liabilities | 0.6% | 31,511 | |||||||||
| Net Assets | 100.0% | $ | 5,437,998 | ||||||||
The accompanying notes are an integral part of these financial statements.
Semi-Annual Report 33
Lazard Global Fixed Income Portfolio (continued)
Forward Currency Contracts open at June 30, 2022:
| Currency Purchased | Quantity | Currency Sold | Quantity | Counterparty | Settlement Date | Unrealized Appreciation | Unrealized Depreciation | ||||||||||||
| HUF | 930,237 | USD | 2,511 | JPM | 07/13/22 | $ | — | $ 56 | |||||||||||
| IDR | 637,120,000 | USD | 44,119 | JPM | 07/22/22 | — | 1,360 | ||||||||||||
| JPY | 37,770,641 | USD | 302,194 | CIT | 07/13/22 | — | 23,692 | ||||||||||||
| JPY | 2,498,163 | USD | 19,600 | HSB | 07/13/22 | — | 1,180 | ||||||||||||
| JPY | 78,485,624 | USD | 627,954 | HSB | 07/13/22 | — | 49,238 | ||||||||||||
| JPY | 1,774,771 | USD | 13,900 | JPM | 07/13/22 | — | 814 | ||||||||||||
| JPY | 8,613,645 | USD | 66,700 | JPM | 07/13/22 | — | 3,187 | ||||||||||||
| KRW | 39,988,220 | USD | 31,600 | JPM | 07/22/22 | — | 795 | ||||||||||||
| KRW | 99,026,720 | USD | 79,806 | JPM | 07/22/22 | — | 3,521 | ||||||||||||
| MXN | 432,023 | USD | 21,063 | HSB | 07/13/22 | 389 | — | ||||||||||||
| MXN | 818,881 | USD | 40,423 | HSB | 07/13/22 | 240 | — | ||||||||||||
| MXN | 138,509 | USD | 7,023 | JPM | 07/13/22 | — | 146 | ||||||||||||
| MXN | 575,740 | USD | 28,300 | JPM | 07/13/22 | 289 | — | ||||||||||||
| NOK | 37,943 | USD | 4,043 | HSB | 07/13/22 | — | 190 | ||||||||||||
| NOK | 997,874 | USD | 103,733 | JPM | 07/13/22 | — | 2,413 | ||||||||||||
| NZD | 47,328 | USD | 30,789 | HSB | 11/10/22 | — | 1,277 | ||||||||||||
| NZD | 68,353 | USD | 43,917 | HSB | 11/10/22 | — | 1,295 | ||||||||||||
| PEN | 32,052 | USD | 8,552 | JPM | 10/28/22 | — | 275 | ||||||||||||
| PLN | 14,424 | USD | 3,347 | JPM | 07/13/22 | — | 132 | ||||||||||||
| PLN | 53,351 | USD | 12,042 | JPM | 07/13/22 | — | 149 | ||||||||||||
| RON | 77,070 | USD | 16,300 | HSB | 07/13/22 | 16 | — | ||||||||||||
| RON | 157,463 | USD | 34,900 | HSB | 07/13/22 | — | 1,565 | ||||||||||||
| RON | 167,390 | USD | 36,500 | HSB | 07/13/22 | — | 1,063 | ||||||||||||
| SEK | 390,439 | USD | 41,272 | JPM | 07/13/22 | — | 3,096 | ||||||||||||
| SGD | 21,184 | USD | 15,311 | JPM | 07/13/22 | — | 63 | ||||||||||||
| SGD | 5,272 | USD | 3,835 | JPM | 10/12/22 | — | 37 | ||||||||||||
| USD | 94,191 | AUD | 126,128 | CIT | 07/13/22 | 7,129 | — | ||||||||||||
| USD | 28,291 | AUD | 41,102 | HSB | 07/13/22 | — | 80 | ||||||||||||
| USD | 50,039 | AUD | 67,006 | HSB | 07/13/22 | 3,787 | — | ||||||||||||
| USD | 8,143 | AUD | 11,036 | JPM | 07/13/22 | 525 | — | ||||||||||||
| USD | 14,106 | AUD | 18,887 | JPM | 07/13/22 | 1,069 | — | ||||||||||||
| USD | 19,763 | AUD | 26,614 | JPM | 07/13/22 | 1,392 | — | ||||||||||||
| USD | 66,634 | AUD | 89,222 | MSC | 07/13/22 | 5,047 | — | ||||||||||||
| USD | 190,516 | CAD | 239,796 | CIT | 07/13/22 | 4,216 | — | ||||||||||||
| USD | 25,900 | CAD | 33,431 | HSB | 07/13/22 | — | 72 | ||||||||||||
| USD | 245,536 | CAD | 309,029 | HSB | 07/13/22 | 5,448 | — | ||||||||||||
| USD | 176,414 | CAD | 222,039 | JPM | 07/13/22 | 3,910 | — | ||||||||||||
| USD | 46,300 | CHF | 43,466 | HSB | 07/13/22 | 749 | — | ||||||||||||
The accompanying notes are an integral part of these financial statements.
34 Semi-Annual Report
Lazard Global Fixed Income Portfolio (concluded)
Forward Currency Contracts open at June 30, 2022:
| Currency Purchased | Quantity | Currency Sold | Quantity | Counterparty | Settlement Date | Unrealized Appreciation | Unrealized Depreciation | ||||||||||||
| USD | 130,099 | CLP | 107,058,110 | CIT | 07/13/22 | $ | 13,613 | $ — | |||||||||||
| USD | 21,500 | CNH | 143,793 | HSB | 07/13/22 | 16 | — | ||||||||||||
| USD | 30,100 | CNH | 192,932 | HSB | 07/13/22 | 1,274 | — | ||||||||||||
| USD | 32,600 | CNH | 216,723 | HSB | 07/13/22 | 219 | — | ||||||||||||
| USD | 62,189 | COP | 248,214,491 | HSB | 07/28/22 | 2,653 | — | ||||||||||||
| USD | 141,848 | CZK | 3,211,306 | JPM | 07/13/22 | 5,938 | — | ||||||||||||
| USD | 59,616 | EUR | 56,579 | HSB | 07/13/22 | 294 | — | ||||||||||||
| USD | 75,000 | EUR | 69,723 | HSB | 07/13/22 | 1,897 | — | ||||||||||||
| USD | 95,000 | EUR | 89,708 | HSB | 07/13/22 | 943 | — | ||||||||||||
| USD | 251,303 | EUR | 229,900 | HSB | 07/13/22 | 10,258 | — | ||||||||||||
| USD | 17,200 | GBP | 13,912 | HSB | 07/13/22 | 263 | — | ||||||||||||
| USD | 21,700 | GBP | 17,285 | HSB | 07/13/22 | 657 | — | ||||||||||||
| USD | 122,716 | GBP | 94,163 | JPM | 07/13/22 | 8,081 | — | ||||||||||||
| USD | 6,666 | HUF | 2,351,239 | HSB | 07/13/22 | 459 | — | ||||||||||||
| USD | 25,860 | HUF | 9,126,355 | JPM | 07/13/22 | 1,768 | — | ||||||||||||
| USD | 32,288 | IDR | 464,944,448 | JPM | 07/22/22 | 1,084 | — | ||||||||||||
| USD | 32,700 | IDR | 478,728,000 | JPM | 07/22/22 | 572 | — | ||||||||||||
| USD | 54,305 | JPY | 6,787,525 | CIT | 07/13/22 | 4,257 | — | ||||||||||||
| USD | 39,900 | JPY | 5,261,872 | HSB | 07/13/22 | 1,101 | — | ||||||||||||
| USD | 45,300 | JPY | 5,893,625 | HSB | 07/13/22 | 1,843 | — | ||||||||||||
| USD | 50,000 | JPY | 6,812,050 | JPM | 07/13/22 | — | 229 | ||||||||||||
| USD | 56,000 | JPY | 7,366,688 | JPM | 07/13/22 | 1,682 | — | ||||||||||||
| USD | 39,200 | KRW | 50,027,040 | JPM | 07/22/22 | 662 | — | ||||||||||||
| USD | 128,036 | MXN | 2,593,743 | HSB | 07/13/22 | — | 760 | ||||||||||||
| USD | 37,100 | MXN | 751,044 | JPM | 07/13/22 | — | 194 | ||||||||||||
| USD | 32,700 | NOK | 307,750 | HSB | 07/13/22 | 1,452 | — | ||||||||||||
| USD | 31,400 | NOK | 310,884 | JPM | 07/13/22 | — | 166 | ||||||||||||
| USD | 226,139 | NOK | 1,990,995 | JPM | 07/13/22 | 23,980 | — | ||||||||||||
| USD | 74,749 | NZD | 116,322 | CIT | 11/10/22 | 2,215 | — | ||||||||||||
| USD | 185,018 | NZD | 287,965 | HSB | 11/10/22 | 5,456 | — | ||||||||||||
| USD | 135,247 | NZD | 210,497 | JPM | 11/10/22 | 3,990 | — | ||||||||||||
| USD | 67,409 | PEN | 262,186 | JPM | 10/28/22 | — | 292 | ||||||||||||
| USD | 45,899 | PLN | 197,946 | HSB | 07/13/22 | 1,776 | — | ||||||||||||
| USD | 8,552 | SGD | 11,641 | HSB | 10/12/22 | 166 | — | ||||||||||||
| USD | 58,856 | SGD | 80,127 | JPM | 10/12/22 | 1,134 | — | ||||||||||||
| USD | 45,477 | THB | 1,515,972 | HSB | 10/12/22 | 2,392 | — | ||||||||||||
| Total gross unrealized appreciation/depreciation on Forward Currency Contracts | $ | 138,638 | $177,656 | ||||||||||||||||
The accompanying notes are an integral part of these financial statements.
Semi-Annual Report 35
| Description | Principal Amount (000) | Fair Value | ||||||
| Lazard US Corporate Income Portfolio | ||||||||
| Corporate Bonds | 86.8% | ||||||||
| Aerospace & Defense | 1.2% | ||||||||
| Howmet Aerospace, Inc., 3.000%, 01/15/29 | $ | 1,500 | $ | 1,242,360 | ||||
| The Boeing Co., 4.875%, 05/01/25 | 1,500 | 1,494,463 | ||||||
| Triumph Group, Inc., 6.250%, 09/15/24 (#) | 500 | 445,920 | ||||||
| 3,182,743 | ||||||||
| Airlines | 0.4% | ||||||||
| United Airlines Pass Through Trust ,Series A, 4.150%, 10/11/25 | 1,114 | 1,093,323 | ||||||
| Auto Components | 1.3% | ||||||||
| Tenneco, Inc., 5.000%, 07/15/26 | 2,100 | 1,963,500 | ||||||
| The Goodyear Tire & Rubber Co., | ||||||||
| 5.000%, 05/31/26 | 250 | 230,216 | ||||||
| 5.250%, 07/15/31 | 1,500 | 1,205,625 | ||||||
| 3,399,341 | ||||||||
| Automobiles | 1.1% | ||||||||
| Jaguar Land Rover Automotive PLC, 4.500%, 10/01/27 (#) | 1,000 | 749,540 | ||||||
| Stellantis NV, 5.250%, 04/15/23 | 2,000 | 2,013,720 | ||||||
| 2,763,260 | ||||||||
| Building Products | 1.2% | ||||||||
| Builders FirstSource, Inc., 4.250%, 02/01/32 (#) | 2,000 | 1,522,340 | ||||||
| Griffon Corp., 5.750%, 03/01/28 | 1,750 | 1,588,545 | ||||||
| 3,110,885 | ||||||||
The accompanying notes are an integral part of these financial statements.
36 Semi-Annual Report
The accompanying notes are an integral part of these financial statements.
Semi-Annual Report 37
| Description | Principal Amount (000) | Fair Value | ||||||
| Lazard US Corporate Income Portfolio (continued) | ||||||||
| KAR Auction Services, Inc., 5.125%, 06/01/25 (#) | $ | 1,800 | $ | 1,711,638 | ||||
| Pitney Bowes, Inc., 6.875%, 03/15/27 (#) | 2,000 | 1,588,427 | ||||||
| Prime Security Services Borrower LLC, 3.375%, 08/31/27 (#) | 1,500 | 1,235,625 | ||||||
| The ADT Security Corp.: | ||||||||
| 4.125%, 06/15/23 | 500 | 491,120 | ||||||
| 4.125%, 08/01/29 (#) | 250 | 202,891 | ||||||
| 13,882,008 | ||||||||
| Construction Materials | 0.6% | ||||||||
| James Hardie International Finance DAC, 5.000%, 01/15/28 (#) | 1,760 | 1,566,400 | ||||||
| Consumer Finance | 0.7% | ||||||||
| Ford Motor Credit Co. LLC: | ||||||||
| 2.700%, 08/10/26 | 1,000 | 852,150 | ||||||
| 4.125%, 08/17/27 | 1,000 | 880,500 | ||||||
| 1,732,650 | ||||||||
| Containers & Packaging | 3.3% | ||||||||
| Ardagh Metal Packaging Finance USA LLC, 4.000%, 09/01/29 (#) | 1,200 | 963,000 | ||||||
| Ardagh Packaging Finance PLC, 4.125%, 08/15/26 (#) | 1,200 | 1,016,652 | ||||||
| Ball Corp., 4.000%, 11/15/23 | 2,100 | 2,083,589 | ||||||
| Crown Americas LLC, 4.250%, 09/30/26 | 500 | 461,250 | ||||||
| Graphic Packaging International LLC, 3.500%, 03/15/28 (#) | 1,600 | 1,376,020 | ||||||
| Silgan Holdings, Inc., 4.125%, 02/01/28 | 1,996 | 1,789,873 | ||||||
| Smurfit Kappa Treasury Funding DAC, 7.500%, 11/20/25 | 750 | 818,046 | ||||||
| 8,508,430 | ||||||||
The accompanying notes are an integral part of these financial statements.
38 Semi-Annual Report
| Description | Principal Amount (000) | Fair Value | ||||||
| Lazard US Corporate Income Portfolio (continued) | ||||||||
| Diversified Consumer Services | 0.7% | ||||||||
| Service Corp. International, 4.625%, 12/15/27 | $ | 2,000 | $ | 1,880,000 | ||||
| Diversified Financial Services | 1.2% | ||||||||
| Level 3 Financing, Inc.: | ||||||||
| 4.250%, 07/01/28 (#) | 1,000 | 801,250 | ||||||
| 3.625%, 01/15/29 (#) | 1,000 | 771,052 | ||||||
| Suburban Propane Partners LP, 5.000%, 06/01/31 (#) | 1,750 | 1,488,156 | ||||||
| 3,060,458 | ||||||||
| Diversified Telecommunication Services | 2.2% | ||||||||
| Connect Finco SARL, 6.750%, 10/01/26 (#) | 1,500 | 1,347,945 | ||||||
| Hughes Satellite Systems Corp., 5.250%, 08/01/26 | 2,091 | 1,923,720 | ||||||
| Lumen Technologies, Inc., 4.000%, 02/15/27 (#) | 1,100 | 930,325 | ||||||
| Zayo Group Holdings, Inc., 4.000%, 03/01/27 (#) | 2,000 | 1,659,180 | ||||||
| 5,861,170 | ||||||||
| Electric Utilities | 0.4% | ||||||||
| NRG Energy, Inc., 3.625%, 02/15/31 (#) | 1,500 | 1,175,985 | ||||||
| Electrical Equipment | 1.5% | ||||||||
| Rackspace Technology Global, Inc., 3.500%, 02/15/28 (#) | 2,000 | 1,566,970 | ||||||
| Sensata Technologies, Inc.: | ||||||||
| 4.375%, 02/15/30 (#) | 1,100 | 936,295 | ||||||
| 3.750%, 02/15/31 (#) | 250 | 200,365 | ||||||
| Vistra Operations Co. LLC, 4.375%, 05/01/29 (#) | 1,500 | 1,254,945 | ||||||
| 3,958,575 | ||||||||
The accompanying notes are an integral part of these financial statements.
Semi-Annual Report 39
| Description | Principal Amount (000) | Fair Value | ||||||
| Lazard US Corporate Income Portfolio (continued) | ||||||||
| Energy Equipment & Services | 0.3% | ||||||||
| DCP Midstream Operating LP, 3.250%, 02/15/32 | $ | 1,050 | $ | 823,599 | ||||
| Entertainment | 1.9% | ||||||||
| Cinemark USA, Inc., 5.250%, 07/15/28 (#) | 1,500 | 1,205,475 | ||||||
| Live Nation Entertainment, Inc.: | ||||||||
| 4.875%, 11/01/24 (#) | 1,550 | 1,480,250 | ||||||
| 3.750%, 01/15/28 (#) | 500 | 431,250 | ||||||
| Netflix, Inc., 4.375%, 11/15/26 | 500 | 481,755 | ||||||
| WMG Acquisition Corp., 3.000%, 02/15/31 (#) | 1,800 | 1,396,188 | ||||||
| 4,994,918 | ||||||||
| Equity Real Estate Investment Trusts (REITs) | 3.3% | ||||||||
| HAT Holdings I LLC, 3.375%, 06/15/26 (#) | 1,500 | 1,290,000 | ||||||
| Iron Mountain, Inc.: | ||||||||
| 4.875%, 09/15/29 (#) | 500 | 424,965 | ||||||
| 4.500%, 02/15/31 (#) | 1,250 | 1,021,431 | ||||||
| Park Intermediate Holdings LLC, 4.875%, 05/15/29 (#) | 1,500 | 1,287,998 | ||||||
| RHP Hotel Properties LP, 4.500%, 02/15/29 (#) | 1,750 | 1,483,823 | ||||||
| VICI Properties LP, | ||||||||
| 4.500%, 09/01/26 (#) | 1,800 | 1,656,000 | ||||||
| 4.250%, 12/01/26 (#) | 1,500 | 1,369,965 | ||||||
| 8,534,182 | ||||||||
| Food & Staples Retailing | 2.4% | ||||||||
| Albertsons Cos, Inc., 3.500%, 03/15/29 (#) | 1,500 | 1,213,971 | ||||||
| Kraft Heinz Foods Co., 4.250%, 03/01/31 | 2,350 | 2,234,618 | ||||||
The accompanying notes are an integral part of these financial statements.
40 Semi-Annual Report
| Description | Principal Amount (000) | Fair Value | ||||||
| Lazard US Corporate Income Portfolio (continued) | ||||||||
| Performance Food Group, Inc., 4.250%, 08/01/29 (#) | $ | 1,800 | $ | 1,503,000 | ||||
| US Foods, Inc., 4.625%, 06/01/30 (#) | 1,500 | 1,264,562 | ||||||
| 6,216,151 | ||||||||
| Food Products | 3.1% | ||||||||
| B&G Foods, Inc., 5.250%, 04/01/25 | 1,500 | 1,383,300 | ||||||
| Darling Ingredients, Inc., 6.000%, 06/15/30 (#) | 2,000 | 1,993,300 | ||||||
| Lamb Weston Holdings, Inc., 4.125%, 01/31/30 (#) | 2,000 | 1,731,120 | ||||||
| Post Holdings, Inc., 4.500%, 09/15/31 (#) | 2,000 | 1,635,700 | ||||||
| TreeHouse Foods, Inc., 4.000%, 09/01/28 | 1,750 | 1,425,795 | ||||||
| 8,169,215 | ||||||||
| Gas Utilities | 0.6% | ||||||||
| AmeriGas Partners LP, 5.625%, 05/20/24 | 1,550 | 1,495,636 | ||||||
| Health Care Equipment & Supplies | 1.7% | ||||||||
| Avantor Funding, Inc., 3.875%, 11/01/29 (#) | 1,500 | 1,311,975 | ||||||
| Hologic, Inc., 4.625%, 02/01/28 (#) | 2,000 | 1,871,500 | ||||||
| Medline Borrower LP, 3.875%, 04/01/29 (#) | 1,500 | 1,277,565 | ||||||
| 4,461,040 | ||||||||
| Health Care Providers & Services | 5.0% | ||||||||
| Centene Corp., 3.375%, 02/15/30 | 1,500 | 1,272,075 | ||||||
The accompanying notes are an integral part of these financial statements.
Semi-Annual Report 41
| Description | Principal Amount (000) | Fair Value | ||||||
| Lazard US Corporate Income Portfolio (continued) | ||||||||
| DaVita, Inc., 4.625%, 06/01/30 (#) | $ | 2,000 | $ | 1,559,724 | ||||
| Encompass Health Corp., 4.625%, 04/01/31 | 1,849 | 1,497,181 | ||||||
| HCA, Inc., 3.500%, 09/01/30 | 2,000 | 1,701,420 | ||||||
| Legacy LifePoint Health LLC, 4.375%, 02/15/27 (#) | 1,250 | 1,071,025 | ||||||
| Molina Healthcare, Inc., 3.875%, 05/15/32 (#) | 1,750 | 1,467,526 | ||||||
| PRA Health Sciences, Inc., 2.875%, 07/15/26 (#) | 200 | 178,000 | ||||||
| Tenet Healthcare Corp.: | ||||||||
| 4.625%, 07/15/24 | 309 | 296,556 | ||||||
| 4.875%, 01/01/26 (#) | 1,000 | 920,000 | ||||||
| 4.375%, 01/15/30 (#) | 1,500 | 1,269,045 | ||||||
| Teva Pharmaceutical Finance Netherlands III BV, 7.125%, 01/31/25 | 1,900 | 1,851,803 | ||||||
| 13,084,355 | ||||||||
| Hotels, Restaurants & Leisure | 6.9% | ||||||||
| 1011778 BC ULC, 3.875%, 01/15/28 (#) | 2,100 | 1,822,632 | ||||||
| Boyd Gaming Corp.: | ||||||||
| 4.750%, 12/01/27 | 850 | 769,250 | ||||||
| 4.750%, 06/15/31 (#) | 1,250 | 1,056,275 | ||||||
| Brinker International, Inc., 5.000%, 10/01/24 (#) | 2,000 | 1,873,140 | ||||||
| Cedar Fair LP, 5.375%, 04/15/27 | 1,550 | 1,468,904 | ||||||
| Hilton Domestic Operating Co., Inc., 3.625%, 02/15/32 (#) | 2,000 | 1,588,750 | ||||||
| International Game Technology PLC, 4.125%, 04/15/26 (#) | 1,500 | 1,357,500 | ||||||
| MGM Resorts International, 4.625%, 09/01/26 | 800 | 710,129 | ||||||
The accompanying notes are an integral part of these financial statements.
42 Semi-Annual Report
| Description | Principal Amount (000) | Fair Value | ||||||
| Lazard US Corporate Income Portfolio (continued) | ||||||||
| Six Flags Entertainment Corp., 4.875%, 07/31/24 (#) | $ | 1,850 | $ | 1,756,519 | ||||
| Station Casinos LLC, 4.625%, 12/01/31 (#) | 1,750 | 1,365,000 | ||||||
| Travel + Leisure Co., 4.500%, 12/01/29 (#) | 1,500 | 1,160,386 | ||||||
| Wynn Las Vegas LLC, 5.500%, 03/01/25 (#) | 2,000 | 1,830,000 | ||||||
| Yum! Brands, Inc., 4.625%, 01/31/32 | 1,500 | 1,325,250 | ||||||
| 18,083,735 | ||||||||
| Household Durables | 0.5% | ||||||||
| Tempur Sealy International, Inc., 4.000%, 04/15/29 (#) | 1,750 | 1,409,695 | ||||||
| Household Products | 1.0% | ||||||||
| Energizer Holdings, Inc., 4.750%, 06/15/28 (#) | 1,200 | 952,464 | ||||||
| Spectrum Brands, Inc., 5.750%, 07/15/25 | 1,800 | 1,777,325 | ||||||
| 2,729,789 | ||||||||
| Independent Power & Renewable Electricity Producers | 1.1% | ||||||||
| Calpine Corp., 4.500%, 02/15/28 (#) | 1,500 | 1,361,816 | ||||||
| NextEra Energy Operating Partners LP, 4.500%, 09/15/27 (#) | 1,750 | 1,620,998 | ||||||
| 2,982,814 | ||||||||
| Interactive Media & Services | 1.3% | ||||||||
| Twitter Inc, | ||||||||
| 3.875%, 12/15/27 (#) | 1,250 | 1,178,444 | ||||||
| 5.000%, 03/01/30 (#) | 1,000 | 948,750 | ||||||
| Ziff Davis, Inc., 4.625%, 10/15/30 (#) | 1,500 | 1,278,667 | ||||||
| 3,405,861 | ||||||||
The accompanying notes are an integral part of these financial statements.
Semi-Annual Report 43
| Description | Principal Amount (000) | Fair Value | ||||||
| Lazard US Corporate Income Portfolio (continued) | ||||||||
| IT Services | 0.4% | ||||||||
| Block, Inc., 3.500%, 06/01/31 (#) | $ | 1,450 | $ | 1,155,447 | ||||
| Machinery | 2.8% | ||||||||
| Allison Transmission, Inc., 4.750%, 10/01/27 (#) | 1,795 | 1,641,849 | ||||||
| Amsted Industries, Inc.: | ||||||||
| 5.625%, 07/01/27 (#) | 750 | 705,000 | ||||||
| 4.625%, 05/15/30 (#) | 1,000 | 852,500 | ||||||
| Mueller Water Products, Inc., 4.000%, 06/15/29 (#) | 2,000 | 1,744,680 | ||||||
| Terex Corp., 5.000%, 05/15/29 (#) | 1,000 | 850,000 | ||||||
| Vertiv Group Corp., 4.125%, 11/15/28 (#) | 1,750 | 1,420,860 | ||||||
| 7,214,889 | ||||||||
| Media | 9.6% | ||||||||
| AMC Networks, Inc., 4.250%, 02/15/29 | 1,000 | 810,190 | ||||||
| CCO Holdings LLC: | ||||||||
| 5.125%, 05/01/27 (#) | 500 | 471,875 | ||||||
| 4.750%, 03/01/30 (#) | 1,500 | 1,282,875 | ||||||
| Clear Channel Worldwide Holdings, Inc., 5.125%, 08/15/27 (#) | 2,000 | 1,688,660 | ||||||
| CSC Holdings LLC: | ||||||||
| 7.500%, 04/01/28 (#) | 1,690 | 1,411,150 | ||||||
| 4.500%, 11/15/31 (#) | 1,000 | 771,150 | ||||||
| DISH DBS Corp.: | ||||||||
| 5.250%, 12/01/26 (#) | 1,000 | 783,840 | ||||||
| 5.750%, 12/01/28 (#) | 750 | 555,308 | ||||||
| GCI LLC, 4.750%, 10/15/28 (#) | 250 | 216,612 | ||||||
| Gray Escrow II, Inc., 5.375%, 11/15/31 (#) | 1,000 | 801,230 | ||||||
The accompanying notes are an integral part of these financial statements.
44 Semi-Annual Report
Lazard Global Fixed Income Portfolio (continued)
Forward Currency Contracts open at June 30, 2022:
| Currency Purchased | Quantity | Currency Sold | Quantity | Counterparty | Settlement Date | Unrealized Appreciation | Unrealized Depreciation | |||||||||||||||||
| AUD | 13,254 | USD | 9,200 | HSB | 07/13/22 | $ | — | $ | 51 | |||||||||||||||
| AUD | 8,118 | USD | 5,868 | JPM | 07/13/22 | — | 264 | |||||||||||||||||
| AUD | 15,845 | USD | 10,939 | JPM | 07/13/22 | — | 2 | |||||||||||||||||
| AUD | 18,050 | USD | 13,400 | JPM | 07/13/22 | — | 941 | |||||||||||||||||
| CAD | 2,515 | USD | 2,000 | HSB | 07/13/22 | — | 46 | |||||||||||||||||
| CAD | 17,717 | USD | 13,778 | HSB | 07/13/22 | — | 14 | |||||||||||||||||
| CAD | 19,328 | USD | 15,200 | HSB | 07/13/22 | — | 184 | |||||||||||||||||
| CAD | 25,406 | USD | 19,669 | HSB | 07/13/22 | 69 | — | |||||||||||||||||
| CAD | 26,900 | USD | 21,475 | HSB | 07/13/22 | — | 576 | |||||||||||||||||
| CAD | 48,629 | USD | 38,592 | HSB | 07/13/22 | — | 811 | |||||||||||||||||
| CAD | 65,004 | USD | 50,058 | HSB | 07/13/22 | 445 | — | |||||||||||||||||
| CAD | 77,882 | USD | 61,906 | JPM | 07/13/22 | — | 1,398 | |||||||||||||||||
| CHF | 20,804 | USD | 22,436 | HSB | 07/13/22 | — | 634 | |||||||||||||||||
| CHF | 56,032 | USD | 60,411 | JPM | 07/13/22 | — | 1,691 | |||||||||||||||||
| CLP | 4,892,747 | USD | 5,976 | CIT | 07/13/22 | — | 652 | |||||||||||||||||
| CLP | 8,746,600 | USD | 10,100 | CIT | 07/13/22 | — | 583 | |||||||||||||||||
| CLP | 27,727,010 | USD | 33,400 | CIT | 07/13/22 | — | 3,231 | |||||||||||||||||
| CNH | 422,530 | USD | 62,000 | HSB | 07/13/22 | 1,131 | — | |||||||||||||||||
| CNH | 2,063,676 | USD | 322,208 | HSB | 07/13/22 | — | 13,872 | |||||||||||||||||
| CNH | 1,154,651 | USD | 171,776 | HSB | 08/31/22 | 662 | — | |||||||||||||||||
| COP | 36,244,930 | USD | 8,711 | HSB | 07/28/22 | — | 17 | |||||||||||||||||
| COP | 38,284,000 | USD | 10,062 | HSB | 07/28/22 | — | 879 | |||||||||||||||||
| COP | 49,415,560 | USD | 11,994 | HSB | 07/28/22 | — | 141 | |||||||||||||||||
| CZK | 128,463 | USD | 5,549 | JPM | 07/13/22 | — | 112 | |||||||||||||||||
| CZK | 1,579,672 | USD | 69,777 | JPM | 07/13/22 | — | 2,921 | |||||||||||||||||
| EUR | 105,834 | USD | 115,691 | CIT | 07/13/22 | — | 4,727 | |||||||||||||||||
| EUR | 14,093 | USD | 14,866 | HSB | 07/13/22 | — | 90 | |||||||||||||||||
| EUR | 15,254 | USD | 15,963 | HSB | 07/13/22 | 30 | — | |||||||||||||||||
| EUR | 898,785 | USD | 982,461 | HSB | 07/13/22 | — | 40,105 | |||||||||||||||||
| EUR | 16,142 | USD | 17,324 | JPM | 07/13/22 | — | 400 | |||||||||||||||||
| EUR | 8,439 | USD | 9,225 | MSC | 07/13/22 | — | 376 | |||||||||||||||||
| GBP | 4,126 | USD | 5,158 | HSB | 07/13/22 | — | 135 | |||||||||||||||||
| GBP | 4,329 | USD | 5,412 | HSB | 07/13/22 | — | 141 | |||||||||||||||||
| GBP | 6,700 | USD | 8,400 | HSB | 07/13/22 | — | 244 | |||||||||||||||||
| GBP | 59,210 | USD | 77,164 | JPM | 07/13/22 | — | 5,081 | |||||||||||||||||
The accompanying notes are an integral part of these financial statements.
Semi-Annual Report 45
| Description | Principal Amount (000) | Fair Value | ||||||
| Lazard US Corporate Income Portfolio (continued) | ||||||||
| Lamar Media Corp., 3.625%, 01/15/31 | $ | 1,500 | $ | 1,227,630 | ||||
| Nexstar Media, Inc., 5.625%, 07/15/27 (#) | 1,500 | 1,368,750 | ||||||
| Outfront Media Capital LLC, 5.000%, 08/15/27 (#) | 2,300 | 2,009,625 | ||||||
| Scripps Escrow II, Inc., 3.875%, 01/15/29 (#) | 1,500 | 1,257,060 | ||||||
| Sinclair Television Group, Inc.: | ||||||||
| 5.125%, 02/15/27 (#) | 1,750 | 1,475,468 | ||||||
| 4.125%, 12/01/30 (#) | 1,000 | 793,165 | ||||||
| Sirius XM Radio, Inc.: | ||||||||
| 5.000%, 08/01/27 (#) | 1,750 | 1,623,160 | ||||||
| 3.875%, 09/01/31 (#) | 1,000 | 796,250 | ||||||
| TEGNA, Inc., 5.000%, 09/15/29 | 1,750 | 1,655,238 | ||||||
| Univision Communications, Inc., 5.125%, 02/15/25 (#) | 2,000 | 1,882,000 | ||||||
| Videotron, Ltd., 5.125%, 04/15/27 (#) | 500 | 465,330 | ||||||
| Virgin Media Secured Finance PLC, 4.500%, 08/15/30 (#) | 2,000 | 1,643,420 | ||||||
| 24,989,986 | ||||||||
| Metals & Mining | 2.5% | ||||||||
| Anglo American Capital PLC, 4.875%, 05/14/25 (#) | 1,650 | 1,661,135 | ||||||
| FMG Resources August 2006 Pty, Ltd., 4.500%, 09/15/27 (#) | 1,750 | 1,561,875 | ||||||
| Freeport-McMoRan, Inc., 4.550%, 11/14/24 | 2,200 | 2,189,242 | ||||||
| Novelis Corp., 4.750%, 01/30/30 (#) | 1,500 | 1,246,770 | ||||||
| 6,659,022 | ||||||||
The accompanying notes are an integral part of these financial statements.
46 Semi-Annual Report
| Description | Principal Amount (000) | Fair Value | ||||||
| Lazard US Corporate Income Portfolio (continued) | ||||||||
| Mortgage Real Estate Investment Trusts (REITs) | 0.6% | ||||||||
| Starwood Property Trust, Inc., 3.625%, 07/15/26 (#) | $ | 1,743 | $ | 1,477,193 | ||||
| Oil, Gas & Consumable Fuels | 6.6% | ||||||||
| Buckeye Partners LP, 4.500%, 03/01/28 (#) | 1,500 | 1,263,186 | ||||||
| Cheniere Energy Partners L.P., 3.250%, 01/31/32 (#) | 1,750 | 1,378,125 | ||||||
| DT Midstream, Inc., 4.375%, 06/15/31 (#) | 1,350 | 1,130,625 | ||||||
| EQT Corp., 3.625%, 05/15/31 (#) | 1,750 | 1,512,105 | ||||||
| Hess Midstream Operations LP, 4.250%, 02/15/30 (#) | 1,850 | 1,549,310 | ||||||
| Holly Energy Partners LP, 5.000%, 02/01/28 (#) | 1,000 | 856,440 | ||||||
| Murphy Oil Corp.: | ||||||||
| 6.875%, 08/15/24 | 117 | 116,854 | ||||||
| 5.875%, 12/01/27 | 500 | 466,625 | ||||||
| Occidental Petroleum Corp., 3.400%, 04/15/26 | 1,750 | 1,592,500 | ||||||
| Range Resources Corp., 4.750%, 02/15/30 (#) | 1,750 | 1,569,452 | ||||||
| Southwestern Energy Co.: | ||||||||
| 5.950%, 01/23/25 | 1,800 | 1,778,202 | ||||||
| 4.750%, 02/01/32 | 250 | 213,631 | ||||||
| Sunoco LP, 4.500%, 04/30/30 (#) | 2,000 | 1,614,767 | ||||||
| Tallgrass Energy Partners LP, 5.500%, 01/15/28 (#) | 1,250 | 1,062,713 | ||||||
| Targa Resources Partners LP, 4.000%, 01/15/32 | 1,500 | 1,283,640 | ||||||
| 17,388,175 | ||||||||
The accompanying notes are an integral part of these financial statements.
Semi-Annual Report 47
| Description | Principal Amount (000) | Fair Value | ||||||
| Lazard US Corporate Income Portfolio (continued) | ||||||||
| Pharmaceuticals | 0.3% | ||||||||
| Bausch Health Cos., Inc., 5.000%, 02/15/29 (#) | $ | 1,500 | $ | 780,000 | ||||
| Professional Services | 0.7% | ||||||||
| Nielsen Finance LLC: | ||||||||
| 5.625%, 10/01/28 (#) | 1,000 | 928,700 | ||||||
| 5.875%, 10/01/30 (#) | 1,000 | 918,160 | ||||||
| 1,846,860 | ||||||||
| Software | 1.5% | ||||||||
| Clarivate Science Holdings Corp., 3.875%, 07/01/28 (#) | 1,200 | 1,002,610 | ||||||
| Crowdstrike Holdings, Inc., 3.000%, 02/15/29 | 1,500 | 1,297,500 | ||||||
| NCR Corp.: | ||||||||
| 5.750%, 09/01/27 (#) | 1,000 | 887,530 | ||||||
| 5.125%, 04/15/29 (#) | 750 | 634,305 | ||||||
| 3,821,945 | ||||||||
| Specialty Retail | 2.2% | ||||||||
| Asbury Automotive Group, Inc.: | ||||||||
| 4.500%, 03/01/28 | 987 | 856,223 | ||||||
| 5.000%, 02/15/32 (#) | 750 | 613,125 | ||||||
| Group 1 Automotive, Inc., 4.000%, 08/15/28 (#) | 1,000 | 835,783 | ||||||
| Penske Automotive Group, Inc., 3.750%, 06/15/29 | 1,750 | 1,457,155 | ||||||
| QVC, Inc., 4.750%, 02/15/27 | 1,250 | 987,500 | ||||||
| The Gap, Inc., 3.625%, 10/01/29 (#) | 1,500 | 1,053,300 | ||||||
| 5,803,086 | ||||||||
The accompanying notes are an integral part of these financial statements.
48 Semi-Annual Report
| Description | Principal Amount (000) | Fair Value | ||||||
| Lazard US Corporate Income Portfolio (continued) | ||||||||
| Technology Hardware, Storage & Peripherals | 1.4% | ||||||||
| Seagate HDD Cayman, 4.091%, 06/01/29 | $ | 2,083 | $ | 1,780,965 | ||||
| Western Digital Corp., 4.750%, 02/15/26 | 2,000 | 1,908,220 | ||||||
| 3,689,185 | ||||||||
| Textiles, Apparel & Luxury Goods | 0.7% | ||||||||
| Hanesbrands, Inc., 4.625%, 05/15/24 (#) | 1,750 | 1,713,093 | ||||||
| Trading Companies & Distributors | 2.5% | ||||||||
| American Builders & Contractors Supply Co., Inc., 4.000%, 01/15/28 (#) | 1,100 | 942,161 | ||||||
| Avis Budget Car Rental LLC, 5.750%, 07/15/27 (#) | 1,500 | 1,343,250 | ||||||
| Herc Holdings, Inc., 5.500%, 07/15/27 (#) | 1,500 | 1,369,351 | ||||||
| Standard Industries, Inc., 3.375%, 01/15/31 (#) | 2,000 | 1,475,236 | ||||||
| United Rentals North America, Inc.: | ||||||||
| 5.500%, 05/15/27 | 500 | 490,333 | ||||||
| 3.875%, 11/15/27 | 1,100 | 1,023,000 | ||||||
| 6,643,331 | ||||||||
| Wireless Telecommunication Services | 0.9% | ||||||||
| Sprint Corp., 7.125%, 06/15/24 | 500 | 513,125 | ||||||
| T-Mobile USA, Inc., 3.500%, 04/15/31 | 2,000 | 1,726,860 | ||||||
| 2,239,985 | ||||||||
| Total Corporate Bonds (Cost $261,034,328) | 227,227,889 | |||||||
The accompanying notes are an integral part of these financial statements.
Semi-Annual Report 49
| Fair | ||||||||
| Description | Shares | Value | ||||||
| Lazard US Corporate Income Portfolio (concluded) | ||||||||
| Exchange-Traded Funds | 7.9% | ||||||||
| Invesco Fundamental High Yield Corporate Bond ETF (Cost $23,042,937) | 1,222,805 | $ | 20,604,265 | |||||
| Short-Term Investments | 4.1% | ||||||||
| State Street Institutional Treasury Money Market Fund, Premier Class, 1.04% (7 day yield) (Cost $10,663,019) | 10,663,019 | 10,663,019 | ||||||
| Total Investments | 98.8% (Cost $294,740,284) | $ | 258,495,173 | ||||||
| Cash and Other Assets in Excess of Liabilities | 1.2% | 3,176,922 | |||||||
| Net Assets | 100.0% | $ | 261,672,095 |
The accompanying notes are an integral part of these financial statements.
50 Semi-Annual Report
The accompanying notes are an integral part of these financial statements.
Semi-Annual Report 51
| Description | Principal Amount (000) | Fair Value | ||||||
| Lazard US Short Duration Fixed Income Portfolio (concluded) | ||||||||
| US Treasury Securities | 86.8% | ||||||||
| U.S. Treasury Notes: | ||||||||
| 0.875%, 01/31/24 | $ | 35,335 | $ | 34,192,134 | ||||
| 1.500%, 02/29/24 | 8,070 | 7,879,914 | ||||||
| 2.250%, 03/31/24 | 17,155 | 16,939,222 | ||||||
| 2.500%, 04/30/24 | 795 | 788,075 | ||||||
| Total US Treasury Securities (Cost $60,846,709) | 59,799,345 | |||||||
| Fair | ||||||||
| Description | Shares | Value | ||||||
| Short-Term Investments | 0.4% | ||||||||
| State Street Institutional Treasury Money Market Fund, Premier Class, 1.04% (7 day yield) (Cost $280,363) | 280,363 | $ | 280,363 | |||||
| Total Investments | 99.5% (Cost $69,762,826) | $ | 68,584,994 | ||||||
| Cash and Other Assets in Excess of Liabilities | 0.5% | 330,574 | |||||||
| Net Assets | 100.0% | $ | 68,915,568 | ||||||
The accompanying notes are an integral part of these financial statements.
52 Semi-Annual Report
The Lazard Funds, Inc. Notes to Portfolios of Investments
June 30, 2022 (unaudited)
| (§) | Variable and floating rate securities are securities for which interest rate changes are based on changes in a designated base rate. The rates shown are those in effect on June 30, 2022. |
| (¶) | Date shown is the next perpetual call date. |
| (#) | Pursuant to Rule 144A under the Securities Act of 1933, these securities may only be traded among “qualified institutional buyers.” At June 30, 2022, these securities amounted to the percentage of net assets for each Portfolio was as follows: |
| Portfolio | Percentage of Net Assets | ||||
| Emerging Markets Debt | 5.4 | % | |||
| Global Fixed Income | 1.3 | % | |||
| U.S. Corporate Income | 60.1 | % | |||
| (Ø) | Step up bonds are securities which increase the interest payment rate at a specified point in time. Rate shown reflects rate in effect at June 30, 2022 which may step up at a future date. |
| («) | Issue in default. |
| (») | The portfolio, at all times, maintains portfolio securities in sufficient amount to cover its obligations related to investments in forward currency contracts. |
Security Abbreviations:
| CDOR | — | Canadian Dollar Offered Rate |
| CMT | — | Constant Maturity Treasury |
| NTN- F | — | Brazil Sovereign “Nota do Tesouro Nacional” Series F |
| SOFR | — | Secured Overnight Financing Rate |
| SONIA | — | Sterling Overnight Index Average |
| LIBOR | — | London Interbank Offered Rate |
| WIBOR | — | Warsaw Interbank Offered Rate |
| Currency Abbreviations: | |||||
| AUD | — | Australian Dollar | KRW | — | South Korean Won |
| BRL | — | Brazilian Real | MXN | — | Mexican New Peso |
| CAD | — | Canadian Dollar | MYR | — | Malaysian Ringgit |
| CHF | — | Swiss Franc | NOK | — | Norwegian Krone |
| CLP | — | Chilean Peso | NZD | — | New Zealand Dollar |
| CNH | — | Chinese Yuan Renminbi | PEN | — | Peruvian Nuevo Sol |
| CNY | — | Chinese Yuan | PLN | — | Polish Zloty |
| COP | — | Colombian Peso | RON | — | New Romanian Leu |
| CZK | — | Czech Koruna | SEK | — | Swedish Krona |
| EUR | — | Euro | SGD | — | Singapore Dollar |
| GBP | — | British Pound Sterling | THB | — | Thai Baht |
| HUF | — | Hungarian Forint | USD | — | United States Dollar |
| IDR | — | Indonesian Rupiah | UYU | — | Uruguyan Peso |
| JPY | — | Japanese Yen | ZAR | — | South African Rand |
| Counterparty Abbreviations: | |||||
| BOA | — | Bank of America NA | JPM | — | JPMorgan Chase Bank NA |
| BRC | — | Barclays Bank PLC | MSC | — | Morgan Stanley & Co. |
| CIT | — | Citibank NA | SCB | — | Standard Chartered Bank |
| HSB | — | HSBC Bank USA NA | UBS | — | UBS AG |
The accompanying notes are an integral part of these financial statements.
Semi-Annual Report 53
Portfolio holdings by industry (as a percentage of net assets), for the Portfolio previously presented by country:
| Industry† | Lazard Emerging Markets Debt Portfolio | Lazard Global Fixed Income Portfolio | ||||||
| Corporate & Quasi Government Bonds | ||||||||
| Automobiles | — | % | 2.2 | % | ||||
| Banks | 2.4 | 10.3 | ||||||
| Beverages | — | 0.5 | ||||||
| Biotechnology | — | 1.0 | ||||||
| Building Products | — | 1.1 | ||||||
| Capital Markets | — | 2.1 | ||||||
| Commercial Services & Suppliers | — | 0.4 | ||||||
| Consumer Finance | — | 1.1 | ||||||
| Containers & Packaging | — | 0.5 | ||||||
| Diversified Consumer Services | — | 0.5 | ||||||
| Diversified Telecommunication Services | — | 1.6 | ||||||
| Electronic Equipment, Instruments & Components | — | 0.4 | ||||||
| Equity Real Estate Investment Trusts (REITs) | — | 1.7 | ||||||
| Food & Staples Retailing | — | 2.0 | ||||||
| Hotels, Restaurants & Leisure | — | 1.4 | ||||||
| Household Products | — | 1.3 | ||||||
| Interactive Media & Services | — | 0.5 | ||||||
| Internet & Direct Marketing Retail | — | 0.4 | ||||||
| IT Services | — | 0.6 | ||||||
| Machinery | — | 1.3 | ||||||
| Oil, Gas & Consumable Fuels | 2.4 | — | ||||||
| Pharmaceuticals | — | 1.1 | ||||||
| Real Estate Management & Development | 0.7 | — | ||||||
| Software | — | 1.5 | ||||||
| Specialty Retail | — | 0.8 | ||||||
| Technology Hardware, Storage & Peripherals | — | 1.7 | ||||||
| Trading Companies & Distributors | — | 0.5 | ||||||
| Subtotal | 5.5 | 36.5 | ||||||
| Foreign Government Obligations | 88.2 | 46.7 | ||||||
| Supranational Bonds | 0.1 | 11.3 | ||||||
| US Municipal Bonds | — | 1.6 | ||||||
| US Treasury Securities | — | 2.2 | ||||||
| Short-Term Investments | 5.7 | 1.1 | ||||||
| Total Investments | 99.5 | % | 99.4 | % | ||||
| † | Industry classifications may be different than those used for compliance monitoring purposes. |
The accompanying notes are an integral part of these financial statements.
54 Semi-Annual Report
[This page intentionally left blank]
Semi-Annual Report 55
The Lazard Funds, Inc. Statements of Assets and Liabilities (unaudited)
| June 30, 2022 | Lazard Emerging Markets Debt Portfolio | Lazard Global Fixed Income Portfolio | ||||||
| ASSETS | ||||||||
| Investments in securities, at fair value | $ | 15,194,490 | $ | 5,406,487 | ||||
| Cash | — | 20,822 | ||||||
| Foreign currency, at fair value | 41,651 | 14,458 | ||||||
| Receivables for: | ||||||||
| Dividends and interest | 306,642 | 52,006 | ||||||
| Capital stock sold | 27 | — | ||||||
| Investments sold | 192,680 | 10,938 | ||||||
| Amount due from Investment Manager (Note 3) | 7,393 | 11,551 | ||||||
| Gross unrealized appreciation on forward currency contracts | 36,854 | 138,638 | ||||||
| Other assets | 9,385 | 9,830 | ||||||
| Total assets | 15,789,122 | 5,664,730 | ||||||
| LIABILITIES | ||||||||
| Foreign currency due to custodian | — | 765 | ||||||
| Payables for: | ||||||||
| Management fees | — | — | ||||||
| Accrued administration fees | 13,622 | 11,092 | ||||||
| Accrued professional services | 32,627 | 27,420 | ||||||
| Accrued custodian fees | 23,731 | 8,767 | ||||||
| Accrued distribution fees | 74 | 9 | ||||||
| Capital stock redeemed | 2,436 | 251 | ||||||
| Dividends | 4,726 | — | ||||||
| Investments purchased | 400,000 | — | ||||||
| Gross unrealized depreciation on forward currency contracts | 33,360 | 177,656 | ||||||
| Other accrued expenses and payables | 2,105 | 772 | ||||||
| Total liabilities | 512,681 | 226,732 | ||||||
| Net assets | $ | 15,276,441 | $ | 5,437,998 | ||||
| NET ASSETS | ||||||||
| Paid in capital | $ | 60,317,352 | $ | 7,093,060 | ||||
| Distributable earnings (Accumulated loss) | (45,040,911 | ) | (1,655,062 | ) | ||||
| Net assets | $ | 15,276,441 | $ | 5,437,998 | ||||
The accompanying notes are an integral part of these financial statements.
56 Semi-Annual Report
| Lazard US Corporate Income Portfolio | Lazard US Short Duration Fixed Income Portfolio | ||||||
| $ | 258,495,173 | $ | 68,584,994 | ||||
| — | — | ||||||
| — | — | ||||||
| 3,401,150 | 359,134 | ||||||
| 19,826 | — | ||||||
| — | — | ||||||
| — | 27,840 | ||||||
| — | — | ||||||
| 8,851 | 9,282 | ||||||
| 261,925,000 | 68,981,250 | ||||||
| — | — | ||||||
| 90,155 | — | ||||||
| 33,194 | 15,913 | ||||||
| 29,790 | 27,267 | ||||||
| 18,191 | 11,554 | ||||||
| 465 | — | ||||||
| 55,241 | 9,054 | ||||||
| 25,447 | 628 | ||||||
| — | — | ||||||
| — | — | ||||||
| 422 | 1,266 | ||||||
| 252,905 | 65,682 | ||||||
| $ | 261,672,095 | $ | 68,915,568 | ||||
| $ | 306,874,485 | $ | 71,196,987 | ||||
| (45,202,390 | ) | (2,281,419 | ) | ||||
| $ | 261,672,095 | $ | 68,915,568 | ||||
The accompanying notes are an integral part of these financial statements.
Semi-Annual Report 57
| June 30, 2022 | Lazard Emerging Markets Debt Portfolio | Lazard Global Fixed Income Portfolio | ||||||
| Institutional Shares | ||||||||
| Net assets | $ | 14,962,446 | $ | 5,402,116 | ||||
| Shares of capital stock outstanding* | 1,302,789 | 764,531 | ||||||
| Net asset value, offering and redemption price per share | $ | 11.48 | $ | 7.07 | ||||
| Open Shares | ||||||||
| Net assets | $ | 313,061 | $ | 35,882 | ||||
| Shares of capital stock outstanding* | 26,975 | 5,062 | ||||||
| Net asset value, offering and redemption price per share | $ | 11.61 | $ | 7.09 | ||||
| R6 Shares | ||||||||
| Net assets | $ | 934 | — | |||||
| Shares of capital stock outstanding* | 76 | † | — | |||||
| Net asset value, offering and redemption price per share* | $ | 12.30 | — | |||||
| Cost of investments in securities | $ | 18,314,203 | $ | 6,372,862 | ||||
| Cost of foreign currency | $ | 42,482 | $ | 14,784 | ||||
| * | $0.001 par value, 6,900,000,000 shares authorized for the Portfolios in total. |
| † | Shares values are rounded for presentation purposes. |
The accompanying notes are an integral part of these financial statements.
58 Semi-Annual Report
| Lazard US Corporate Income Portfolio | Lazard US Short Duration Fixed Income Portfolio | ||||||
| $ | 258,715,190 | $ | 68,899,650 | ||||
| 15,328,768 | 7,199,448 | ||||||
| $ | 16.88 | $ | 9.57 | ||||
| $ | 2,955,816 | $ | 15,918 | ||||
| 174,325 | 1,662 | ||||||
| $ | 16.96 | $ | 9.58 | ||||
| $ | 1,089 | — | |||||
| 64 | † | — | |||||
| $ | 16.93 | — | |||||
| $ | 294,740,284 | $ | 69,762,826 | ||||
| $ | — | $ | — | ||||
The accompanying notes are an integral part of these financial statements.
Semi-Annual Report 59
The Lazard Funds, Inc. Statements of Operations (unaudited)
| For the Six Months Ended June 30, 2022 | Lazard Emerging Markets Debt Portfolio | Lazard Global Fixed Income Portfolio | |||||||
| Investment Income (Loss) | |||||||||
| Income | |||||||||
| Interest | $ | 461,707 | $ | 85,336 | |||||
| Dividends | — | — | |||||||
| Total investment income* | 461,707 | 85,336 | |||||||
| Expenses | |||||||||
| Management fees (Note 3) | 61,014 | 17,584 | |||||||
| Custodian fees | 51,867 | 23,219 | |||||||
| Professional services | 29,692 | 22,552 | |||||||
| Administration fees | 11,403 | 9,254 | |||||||
| Registration fees | 14,082 | 21,462 | |||||||
| Shareholders’ services | 5,388 | 4,582 | |||||||
| Directors’ fees and expenses | 3,026 | 2,710 | |||||||
| Shareholders’ reports | 4,238 | 5,153 | |||||||
| Distribution fees (Open Shares) | 435 | 48 | |||||||
| Other^ | 3,528 | 70 | |||||||
| Total gross expenses | 184,673 | 106,634 | |||||||
| Management fees waived and expenses reimbursed | (110,102 | ) | (81,899 | ) | |||||
| Total net expenses | 74,571 | 24,735 | |||||||
| Net investment income (loss) | 387,136 | 60,601 | |||||||
| Net Realized and Unrealized Gain (Loss) | |||||||||
| Net realized gain (loss) on: | |||||||||
| Investments** | (2,264,291 | ) | (466,407 | ) | |||||
| Foreign currency transactions | (24,529 | ) | 4,638 | ||||||
| Forward currency contracts | (117,104 | ) | (98,543 | ) | |||||
| Total net realized gain (loss) | (2,405,924 | ) | (560,312 | ) | |||||
| Net change in unrealized appreciation (depreciation) on: | |||||||||
| Investments† | (1,730,875 | ) | (648,144 | ) | |||||
| Foreign currency translations | 2,756 | (1,062 | ) | ||||||
| Forward currency contracts | 27,413 | (75,285 | ) | ||||||
| Total net change in unrealized appreciation (depreciation) | (1,700,706 | ) | (724,491 | ) | |||||
| Net realized and unrealized gain (loss) | (4,106,630 | ) | (1,284,803 | ) | |||||
| Net increase (decrease) in net assets resulting from operations | $ | (3,719,494 | ) | $ | (1,224,202 | ) | |||
| * | Net of foreign withholding taxes of | $ | 3,668 | $ | 120 | ||||
| ** | Net of foreign capital gains taxes of | $ | 214 | $ | — | ||||
| † | Includes net change in unrealized appreciation (depreciation) of foreign capital gains taxes of | $ | 2,016 | $ | — | ||||
| ^ | Includes interest on line of credit of | $ | 34 | $ | 31 | ||||
The accompanying notes are an integral part of these financial statements.
60 Semi-Annual Report
| Lazard US Corporate Income Portfolio | Lazard US Short Duration Fixed Income Portfolio | ||||||
| $ | 5,928,828 | $ | 466,337 | ||||
| 355,164 | — | ||||||
| 6,283,992 | 466,337 | ||||||
| 775,589 | 90,615 | ||||||
| 58,610 | 24,752 | ||||||
| 33,147 | 24,306 | ||||||
| 27,940 | 13,346 | ||||||
| 18,789 | 14,680 | ||||||
| 11,277 | 6,015 | ||||||
| 10,704 | 4,656 | ||||||
| 9,983 | 6,325 | ||||||
| 4,012 | 22 | ||||||
| 8,582 | 4,644 | ||||||
| 958,633 | 189,361 | ||||||
| (177,681 | ) | (44,605 | ) | ||||
| 780,952 | 144,756 | ||||||
| 5,503,040 | 321,581 | ||||||
| (349,940 | ) | (924,138 | ) | ||||
| — | — | ||||||
| — | — | ||||||
| (349,940 | ) | (924,138 | ) | ||||
| (42,441,273 | ) | (1,056,676 | ) | ||||
| — | — | ||||||
| — | — | ||||||
| (42,441,273 | ) | (1,056,676 | ) | ||||
| (42,791,213 | ) | (1,980,814 | ) | ||||
| $ | (37,288,173 | ) | $ | (1,659,233 | ) | ||
| $ | — | $ | — | ||||
| $ | — | $ | — | ||||
| $ | — | $ | — | ||||
| $ | — | $ | — | ||||
The accompanying notes are an integral part of these financial statements.
Semi-Annual Report 61
The Lazard Funds, Inc. Statements of Changes in Net Assets
| Lazard Emerging Markets Debt Portfolio | ||||||||||
| Six Months Ended June 30, 2022 (unaudited) | Year Ended December 31, 2021 | |||||||||
| Increase (Decrease) in Net Assets | ||||||||||
| Operations | ||||||||||
| Net investment income (loss) | $ | 387,136 | $ | 822,719 | ||||||
| Net realized gain (loss) | (2,405,924 | ) | (218,170 | ) | ||||||
| Net change in unrealized appreciation (depreciation) | (1,700,706 | ) | (1,907,964 | ) | ||||||
| Net increase (decrease) in net assets resulting from operations | (3,719,494 | ) | (1,303,415 | ) | ||||||
| Distributions to shareholders (Note 2(h)) | ||||||||||
| Net investment income and net realized gains | ||||||||||
| Institutional Shares | (384,052 | ) | (266,178 | ) | ||||||
| Open Shares | (7,510 | ) | (4,732 | ) | ||||||
| R6 Shares | (23 | ) | (16 | ) | ||||||
| Return of capital | ||||||||||
| Institutional Shares | — | (533,368 | ) | |||||||
| Open Shares | — | (9,482 | ) | |||||||
| R6 Shares | — | (33 | ) | |||||||
| Net decrease in net assets resulting from distributions | (391,585 | ) | (813,809 | ) | ||||||
| Capital stock transactions | ||||||||||
| Net proceeds from sales | ||||||||||
| Institutional Shares | 201,508 | 2,366,868 | ||||||||
| Open Shares | 13,709 | 24,820 | ||||||||
| Net proceeds from reinvestment of distributions | ||||||||||
| Institutional Shares | 357,435 | 766,007 | ||||||||
| Open Shares | 6,501 | 12,197 | ||||||||
| R6 Shares | 23 | 49 | ||||||||
| Cost of shares redeemed | ||||||||||
| Institutional Shares | (1,478,349 | ) | (3,023,406 | ) | ||||||
| Open Shares | (9,382 | ) | (11,890 | ) | ||||||
| Net increase (decrease) in net assets from capital stock transactions | (908,555 | ) | 134,645 | |||||||
| Total increase (decrease) in net assets | (5,019,634 | ) | (1,982,579 | ) | ||||||
| Net assets at beginning of period | 20,296,075 | 22,278,654 | ||||||||
| Net assets at end of period | $ | 15,276,441 | $ | 20,296,075 | ||||||
The accompanying notes are an integral part of these financial statements.
62 Semi-Annual Report
| Lazard Global Fixed Income Portfolio | Lazard US Corporate Income Portfolio | |||||||||||||||
| Six Months Ended June 30, 2022 (unaudited) | Year Ended December 31, 2021 | Six Months Ended June 30, 2022 (unaudited) | Year Ended December 31, 2021 | |||||||||||||
| $ | 60,601 | $ | 126,182 | $ | 5,503,040 | $ | 11,005,178 | |||||||||
| (560,312 | ) | (14,110 | ) | (349,940 | ) | 719,953 | ||||||||||
| (724,491 | ) | (835,078 | ) | (42,441,273 | ) | (3,278,734 | ) | |||||||||
| (1,224,202 | ) | (723,006 | ) | (37,288,173 | ) | 8,446,397 | ||||||||||
| (61,240 | ) | (368,209 | ) | (5,475,346 | ) | (11,000,996 | ) | |||||||||
| (292 | ) | (1,362 | ) | (58,869 | ) | (127,773 | ) | |||||||||
| — | — | (23 | ) | (45 | ) | |||||||||||
| — | — | — | — | |||||||||||||
| — | — | — | — | |||||||||||||
| — | — | — | — | |||||||||||||
| (61,532 | ) | (369,571 | ) | (5,534,238 | ) | (11,128,814 | ) | |||||||||
| 102,539 | 2,233,371 | 7,471,205 | 29,161,114 | |||||||||||||
| 10,542 | 54,481 | 816,465 | 279,336 | |||||||||||||
| 61,208 | 368,163 | 5,334,717 | 10,709,114 | |||||||||||||
| 292 | 1,362 | 50,924 | 104,457 | |||||||||||||
| — | — | 23 | 45 | |||||||||||||
| (1,955,928 | ) | (2,539,178 | ) | (11,249,291 | ) | (36,335,702 | ) | |||||||||
| (449 | ) | (66,257 | ) | (872,511 | ) | (662,564 | ) | |||||||||
| (1,781,796 | ) | 51,942 | 1,551,532 | 3,255,800 | ||||||||||||
| (3,067,530 | ) | (1,040,635 | ) | (41,270,879 | ) | 573,383 | ||||||||||
| 8,505,528 | 9,546,163 | 302,942,974 | 302,369,591 | |||||||||||||
| $ | 5,437,998 | $ | 8,505,528 | $ | 261,672,095 | $ | 302,942,974 | |||||||||
The accompanying notes are an integral part of these financial statements.
Semi-Annual Report 63
| Lazard Emerging Markets Debt Portfolio | ||||||||||
| Six Months Ended June 30, 2022 (unaudited) | Year Ended December 31, 2021 | |||||||||
| Shares issued and redeemed | ||||||||||
| Institutional Shares | ||||||||||
| Shares outstanding at beginning of period | 1,370,241 | 1,364,341 | ||||||||
| Shares sold | 15,247 | 153,783 | ||||||||
| Shares issued to shareholders from reinvestment of distributions | 28,126 | 50,324 | ||||||||
| Shares redeemed | (110,825 | ) | (198,207 | ) | ||||||
| Net increase (decrease) | (67,452 | ) | 5,900 | |||||||
| Shares outstanding at end of period | 1,302,789 | 1,370,241 | ||||||||
| Open Shares | ||||||||||
| Shares outstanding at beginning of period | 26,157 | 24,524 | ||||||||
| Shares sold | 1,059 | 1,610 | ||||||||
| Shares issued to shareholders from reinvestment of distributions | 507 | 793 | ||||||||
| Shares redeemed | (748 | ) | (770 | ) | ||||||
| Net increase (decrease) | 818 | 1,633 | ||||||||
| Shares outstanding at end of period | 26,975 | 26,157 | ||||||||
| R6 Shares | ||||||||||
| Shares outstanding at beginning of period | 74 | 71 | ||||||||
| Shares issued to shareholders from reinvestment of distributions | 2 | 3 | ||||||||
| Net increase (decrease) | 2 | 3 | ||||||||
| Shares outstanding at end of period | 76 | 74 | ||||||||
The accompanying notes are an integral part of these financial statements.
64 Semi-Annual Report
| Lazard Global Fixed Income Portfolio | Lazard US Corporate Income Portfolio | |||||||||||||||
| Six Months Ended June 30, 2022 (unaudited) | Year Ended December 31, 2021 | Six Months Ended June 30, 2022 (unaudited) | Year Ended December 31, 2021 | |||||||||||||
| 999,178 | 989,793 | 15,258,202 | 15,080,446 | |||||||||||||
| 13,068 | 245,212 | 406,649 | 1,480,230 | |||||||||||||
| 7,997 | 41,364 | 294,188 | 544,180 | |||||||||||||
| (255,712 | ) | (277,191 | ) | (630,271 | ) | (1,846,654 | ) | |||||||||
| (234,647 | ) | 9,385 | 70,566 | 177,756 | ||||||||||||
| 764,531 | 999,178 | 15,328,768 | 15,258,202 | |||||||||||||
| 3,828 | 5,032 | 173,575 | 187,617 | |||||||||||||
| 1,257 | 5,704 | 46,300 | 14,131 | |||||||||||||
| 38 | 153 | 2,795 | 5,283 | |||||||||||||
| (61 | ) | (7,061 | ) | (48,345 | ) | (33,456 | ) | |||||||||
| 1,234 | (1,204 | ) | 750 | (14,042 | ) | |||||||||||
| 5,062 | 3,828 | 174,325 | 173,575 | |||||||||||||
| — | — | 63 | 61 | |||||||||||||
| — | — | 1 | 2 | |||||||||||||
| — | — | 1 | 2 | |||||||||||||
| — | — | 64 | 63 | |||||||||||||
The accompanying notes are an integral part of these financial statements.
Semi-Annual Report 65
| Lazard US Short Duration Fixed Income Portfolio | |||||||||
| Six Months Ended June 30, 2022 (unaudited) | Year Ended December 31, 2021 | ||||||||
| Increase (Decrease) in Net Assets | |||||||||
| Operations | |||||||||
| Net investment income (loss) | $ | 321,581 | $ | 183,895 | |||||
| Net realized gain (loss) | (924,138 | ) | 228,109 | ||||||
| Net change in unrealized appreciation (depreciation) | (1,056,676 | ) | (745,938 | ) | |||||
| Net increase (decrease) in net assets resulting from operations | (1,659,233 | ) | (333,934 | ) | |||||
| Distributions to shareholders (Note 2(h)) | |||||||||
| Net investment income and net realized gains | |||||||||
| Institutional Shares | (322,432 | ) | (183,904 | ) | |||||
| Open Shares | (58 | ) | (29 | ) | |||||
| Net decrease in net assets resulting from distributions | (322,490 | ) | (183,933 | ) | |||||
| Capital stock transactions | |||||||||
| Net proceeds from sales | |||||||||
| Institutional Shares | 1,066,326 | 6,528,316 | |||||||
| Open Shares | 2,220 | 4,339 | |||||||
| Net proceeds from reinvestment of distributions | |||||||||
| Institutional Shares | 318,123 | 167,563 | |||||||
| Open Shares | 57 | 27 | |||||||
| Cost of shares redeemed | |||||||||
| Institutional Shares | (9,750,697 | ) | (14,676,561 | ) | |||||
| Open Shares | (8,341 | ) | (11,122 | ) | |||||
| Net increase (decrease) in net assets from capital stock transactions | (8,372,312 | ) | (7,987,438 | ) | |||||
| Total increase (decrease) in net assets | (10,354,035 | ) | (8,505,305 | ) | |||||
| Net assets at beginning of period | 79,269,603 | 87,774,908 | |||||||
| Net assets at end of period | $ | 68,915,568 | $ | 79,269,603 | |||||
The accompanying notes are an integral part of these financial statements.
66 Semi-Annual Report
| Lazard US Short Duration Fixed Income Portfolio | |||||||||
| Six Months Ended June 30, 2022 (unaudited) | Year Ended December 31, 2021 | ||||||||
| Shares issued and redeemed | |||||||||
| Institutional Shares | |||||||||
| Shares outstanding at beginning of period | 8,058,991 | 8,867,736 | |||||||
| Shares sold | 109,482 | 661,464 | |||||||
| Shares issued to shareholders from reinvestment of distributions | 33,047 | 16,960 | |||||||
| Shares redeemed | (1,002,072 | ) | (1,487,169 | ) | |||||
| Net increase (decrease) | (859,543 | ) | (808,745 | ) | |||||
| Shares outstanding at end of period | 7,199,448 | 8,058,991 | |||||||
| Open Shares | |||||||||
| Shares outstanding at beginning of period | 2,279 | 2,964 | |||||||
| Shares sold | 230 | 439 | |||||||
| Shares issued to shareholders from reinvestment of distributions | 6 | 3 | |||||||
| Shares redeemed | (853 | ) | (1,127 | ) | |||||
| Net increase (decrease) | (617 | ) | (685 | ) | |||||
| Shares outstanding at end of period | 1,662 | 2,279 | |||||||
The accompanying notes are an integral part of these financial statements.
Semi-Annual Report 67
The Lazard Funds, Inc. Financial Highlights (unaudited)
LAZARD EMERGING MARKETS DEBT PORTFOLIO
| Selected data for a share of capital stock outstanding throughout | Six Months Ended | Year Ended | ||||||||||||||||||||||
| each period | 6/30/22† | 12/31/21 | 12/31/20* | 12/31/19* | 12/31/18* | 12/31/17* | ||||||||||||||||||
| Institutional Shares | ||||||||||||||||||||||||
| Net asset value, beginning of period | $ | 14.53 | $ | 16.04 | $ | 16.10 | $ | 14.72 | $ | 16.86 | $ | 15.80 | ||||||||||||
| Income (Loss) from investment operations: | ||||||||||||||||||||||||
| Net investment income (loss) (a) | 0.29 | 0.59 | 0.64 | 0.80 | 0.92 | 0.92 | ||||||||||||||||||
| Net realized and unrealized gain (loss) | (3.05 | ) | (1.51 | ) | (0.18 | ) | 1.36 | (2.14 | ) | 1.06 | ||||||||||||||
| Total from investment operations | (2.76 | ) | (0.92 | ) | 0.46 | 2.16 | (1.22 | ) | 1.98 | |||||||||||||||
| Less distributions from: | ||||||||||||||||||||||||
| Net investment income | (0.29 | ) | (0.20 | ) | — | (0.38 | ) | (0.44 | ) | (0.86 | ) | |||||||||||||
| Return of capital | — | (0.39 | ) | (0.52 | ) | (0.40 | ) | (0.48 | ) | (0.06 | ) | |||||||||||||
| Total distributions | (0.29 | ) | (0.59 | ) | (0.52 | ) | (0.78 | ) | (0.92 | ) | (0.92 | ) | ||||||||||||
| Net asset value, end of period | $ | 11.48 | $ | 14.53 | $ | 16.04 | $ | 16.10 | $ | 14.72 | $ | 16.86 | ||||||||||||
| Total Return (b) | –19.16 | % | –5.86 | % | 3.19 | % | 15.03 | % | –7.45 | % | 12.69 | % | ||||||||||||
| Ratios and Supplemental Data: | ||||||||||||||||||||||||
| Net assets, end of period (in thousands) | $ | 14,962 | $ | 19,911 | $ | 21,880 | $ | 90,858 | $ | 143,015 | $ | 280,808 | ||||||||||||
| Ratios to average net assets (c): | ||||||||||||||||||||||||
| Net expenses | 0.85 | % | 0.85 | % | 0.92 | % | 0.98 | % | 0.93 | % | 0.93 | % | ||||||||||||
| Gross expenses | 2.08 | % | 1.83 | % | 1.57 | % | 1.08 | % | 0.93 | % | 0.93 | % | ||||||||||||
| Net investment income (loss) | 4.45 | % | 3.88 | % | 4.24 | % | 5.15 | % | 5.78 | % | 5.52 | % | ||||||||||||
| Portfolio turnover rate | 49 | % | 81 | % | 133 | % | 106 | % | 97 | % | 88 | % | ||||||||||||
The accompanying notes are an integral part of these financial statements.
68 Semi-Annual Report
| Selected data for a share of capital stock outstanding throughout | Six Months Ended | Year Ended | ||||||||||||||||||||||
| each period | 6/30/22† | 12/31/21 | 12/31/20* | 12/31/19* | 12/31/18* | 12/31/17* | ||||||||||||||||||
| Open Shares | ||||||||||||||||||||||||
| Net asset value, beginning of period | $ | 14.68 | $ | 16.21 | $ | 16.26 | $ | 14.86 | $ | 17.00 | $ | 15.96 | ||||||||||||
| Income (Loss) from investment operations: | ||||||||||||||||||||||||
| Net investment income (loss) (a) | 0.28 | 0.57 | 0.61 | 0.78 | 0.94 | 0.88 | ||||||||||||||||||
| Net realized and unrealized gain (loss) | (3.07 | ) | (1.54 | ) | (0.15 | ) | 1.38 | (2.20 | ) | 1.02 | ||||||||||||||
| Total from investment operations | (2.79 | ) | (0.97 | ) | 0.46 | 2.16 | (1.26 | ) | 1.90 | |||||||||||||||
| Less distributions from: | ||||||||||||||||||||||||
| Net investment income | (0.28 | ) | (0.19 | ) | — | (0.38 | ) | (0.40 | ) | (0.80 | ) | |||||||||||||
| Return of capital | — | (0.37 | ) | (0.51 | ) | (0.38 | ) | (0.48 | ) | (0.06 | ) | |||||||||||||
| Total distributions | (0.28 | ) | (0.56 | ) | (0.51 | ) | (0.76 | ) | (0.88 | ) | (0.86 | ) | ||||||||||||
| Net asset value, end of period | $ | 11.61 | $ | 14.68 | $ | 16.21 | $ | 16.26 | $ | 14.86 | $ | 17.00 | ||||||||||||
| Total Return (b) | –19.16 | % | –6.07 | % | 3.11 | % | 14.85 | % | –7.59 | % | 12.16 | % | ||||||||||||
| Ratios and Supplemental Data: | ||||||||||||||||||||||||
| Net assets, end of period (in thousands) | $ | 313 | $ | 384 | $ | 397 | $ | 532 | $ | 670 | $ | 6,520 | ||||||||||||
| Ratios to average net assets (c): | ||||||||||||||||||||||||
| Net expenses | 1.05 | % | 1.05 | % | 1.02 | % | 1.18 | % | 1.20 | % | 1.22 | % | ||||||||||||
| Gross expenses | 3.23 | % | 2.84 | % | 2.59 | % | 2.91 | % | 1.62 | % | 1.36 | % | ||||||||||||
| Net investment income (loss) | 4.26 | % | 3.68 | % | 4.05 | % | 4.91 | % | 5.49 | % | 5.21 | % | ||||||||||||
| Portfolio turnover rate | 49 | % | 81 | % | 133 | % | 106 | % | 97 | % | 88 | % | ||||||||||||
The accompanying notes are an integral part of these financial statements.
Semi-Annual Report 69
| Selected data for a share of capital stock outstanding throughout | Six Months Ended | Year Ended | ||||||||||||||||||||||
| each period | 6/30/22† | 12/31/21 | 12/31/20* | 12/31/19* | 12/31/18* | 12/31/17* | ||||||||||||||||||
| R6 Shares | ||||||||||||||||||||||||
| Net asset value, beginning of period | $ | 15.56 | $ | 17.19 | $ | 17.28 | $ | 15.76 | $ | 17.76 | $ | 15.80 | ||||||||||||
| Income (Loss) from investment operations: | ||||||||||||||||||||||||
| Net investment income (loss) (a) | 0.33 | 0.67 | 0.41 | 0.86 | 0.96 | 0.90 | ||||||||||||||||||
| Net realized and unrealized gain (loss) | (3.28 | ) | (1.63 | ) | 0.09 | 1.50 | (2.24 | ) | 1.08 | |||||||||||||||
| Total from investment operations | (2.95 | ) | (0.96 | ) | 0.50 | 2.36 | (1.28 | ) | 1.98 | |||||||||||||||
| Less distributions from: | ||||||||||||||||||||||||
| Net investment income | (0.31 | ) | (0.22 | ) | — | (0.40 | ) | (0.22 | ) | (0.02 | ) | |||||||||||||
| Return of capital | — | (0.45 | ) | (0.59 | ) | (0.44 | ) | (0.50 | ) | — | (d) | |||||||||||||
| Total distributions | (0.31 | ) | (0.67 | ) | (0.59 | ) | (0.84 | ) | (0.72 | ) | (0.02 | ) | ||||||||||||
| Net asset value, end of period | $ | 12.30 | $ | 15.56 | $ | 17.19 | $ | 17.28 | $ | 15.76 | $ | 17.76 | ||||||||||||
| Total Return (b) | –19.15 | % | –5.67 | % | 3.30 | % | 15.22 | % | –7.24 | % | 12.61 | % | ||||||||||||
| Ratios and Supplemental Data: | ||||||||||||||||||||||||
| Net assets, end of period (in thousands) | $ | 1 | $ | 1 | $ | 1 | $ | 1 | $ | 99,952 | $ | 1 | ||||||||||||
| Ratios to average net assets (c): | ||||||||||||||||||||||||
| Net expenses | 0.80 | % | 0.80 | % | 0.86 | % | 0.93 | % | 0.90 | % | 0.90 | % | ||||||||||||
| Gross expenses | 284.98 | % | 245.32 | % | 265.72 | % | 1.09 | % | 0.94 | % | 43.88 | % | ||||||||||||
| Net investment income (loss) | 4.82 | % | 4.06 | % | 2.60 | % | 5.18 | % | 5.97 | % | 5.71 | % | ||||||||||||
| Portfolio turnover rate | 49 | % | 81 | % | 133 | % | 106 | % | 97 | % | 88 | % | ||||||||||||
| † | Unaudited. |
| * | On November 17, 2020, the Portfolio effected a 1:2 reverse share split. All per share data prior to November 17, 2020 has been adjusted to reflect the reverse share split. |
| (a) | Net investment income (loss) has been computed using the average shares method. |
| (b) | Total returns reflect reinvestment of all dividends and distributions, if any. Certain expenses of the Portfolio may have been waived or reimbursed by the Investment Manager, State Street or DST; without such waiver/reimbursement of expenses, the Portfolio’s returns would have been lower. Returns for a period of less than one year are not annualized. |
| (c) | Annualized for a period of less than one year. |
| (d) | Amount is less than $0.01 per share. |
The accompanying notes are an integral part of these financial statements.
70 Semi-Annual Report
LAZARD GLOBAL FIXED INCOME PORTFOLIO
| Selected data for a share of capital stock outstanding throughout | Six Months Ended | Year Ended | ||||||||||||||||||||||
| each period | 6/30/22† | 12/31/21 | 12/31/20 | 12/31/19 | 12/31/18 | 12/31/17 | ||||||||||||||||||
| Institutional Shares | ||||||||||||||||||||||||
| Net asset value, beginning of period | $ | 8.48 | $ | 9.60 | $ | 9.08 | $ | 8.65 | $ | 9.04 | $ | 8.57 | ||||||||||||
| Income (Loss) from investment operations: | ||||||||||||||||||||||||
| Net investment income (loss) (a) | 0.07 | 0.12 | 0.14 | 0.19 | 0.20 | 0.20 | ||||||||||||||||||
| Net realized and unrealized gain (loss) | (1.41 | ) | (0.87 | ) | 0.72 | 0.43 | (0.38 | ) | 0.47 | |||||||||||||||
| Total from investment operations | (1.34 | ) | (0.75 | ) | 0.86 | 0.62 | (0.18 | ) | 0.67 | |||||||||||||||
| Less distributions from: | ||||||||||||||||||||||||
| Net investment income | (0.07 | ) | (0.26 | ) | (0.15 | ) | (0.06 | ) | (0.10 | ) | — | |||||||||||||
| Net realized gains | — | (0.11 | ) | (0.19 | ) | — | — | — | ||||||||||||||||
| Return of capital | — | — | — | (0.13 | ) | (0.11 | ) | (0.20 | ) | |||||||||||||||
| Total distributions | (0.07 | ) | (0.37 | ) | (0.34 | ) | (0.19 | ) | (0.21 | ) | (0.20 | ) | ||||||||||||
| Net asset value, end of period | $ | 7.07 | $ | 8.48 | $ | 9.60 | $ | 9.08 | $ | 8.65 | $ | 9.04 | ||||||||||||
| Total Return (b) | –15.88 | % | –7.95 | % | 9.51 | % | 7.25 | % | –2.06 | % | 7.87 | % | ||||||||||||
| Ratios and Supplemental Data: | ||||||||||||||||||||||||
| Net assets, end of period (in thousands) | $ | 5,402 | $ | 8,473 | $ | 9,498 | $ | 6,456 | $ | 5,495 | $ | 4,705 | ||||||||||||
| Ratios to average net assets (c): | ||||||||||||||||||||||||
| Net expenses | 0.70 | % | 0.70 | % | 0.70 | % | 0.70 | % | 0.70 | % | 0.72 | % | ||||||||||||
| Gross expenses | 2.97 | % | 2.34 | % | 2.73 | % | 3.51 | % | 3.61 | % | 4.39 | % | ||||||||||||
| Net investment income (loss) | 1.72 | % | 1.38 | % | 1.53 | % | 2.14 | % | 2.33 | % | 2.23 | % | ||||||||||||
| Portfolio turnover rate | 19 | % | 59 | % | 65 | % | 65 | % | 60 | % | 42 | % | ||||||||||||
The accompanying notes are an integral part of these financial statements.
Semi-Annual Report 71
| Selected data for a share of capital stock outstanding throughout | Six Months Ended | Year Ended | ||||||||||||||||||||||
| each period | 6/30/22† | 12/31/21 | 12/31/20 | 12/31/19 | 12/31/18 | 12/31/17 | ||||||||||||||||||
| Open Shares | ||||||||||||||||||||||||
| Net asset value, beginning of period | $ | 8.51 | $ | 9.60 | $ | 9.08 | $ | 8.65 | $ | 9.04 | $ | 8.57 | ||||||||||||
| Income (Loss) from investment operations: | ||||||||||||||||||||||||
| Net investment income (loss) (a) | 0.06 | 0.10 | 0.12 | 0.17 | 0.18 | 0.17 | ||||||||||||||||||
| Net realized and unrealized gain (loss) | (1.42 | ) | (0.87 | ) | 0.71 | 0.43 | (0.39 | ) | 0.47 | |||||||||||||||
| Total from investment operations | (1.36 | ) | (0.77 | ) | 0.83 | 0.60 | (0.21 | ) | 0.64 | |||||||||||||||
| Less distributions from: | ||||||||||||||||||||||||
| Net investment income | (0.06 | ) | (0.21 | ) | (0.12 | ) | (0.06 | ) | (0.08 | ) | — | |||||||||||||
| Net realized gains | — | (0.11 | ) | (0.19 | ) | — | — | — | ||||||||||||||||
| Return of capital | — | — | — | (0.11 | ) | (0.10 | ) | (0.17 | ) | |||||||||||||||
| Total distributions | (0.06 | ) | (0.32 | ) | (0.31 | ) | (0.17 | ) | (0.18 | ) | (0.17 | ) | ||||||||||||
| Net asset value, end of period | $ | 7.09 | $ | 8.51 | $ | 9.60 | $ | 9.08 | $ | 8.65 | $ | 9.04 | ||||||||||||
| Total Return (b) | –16.05 | % | –8.13 | % | 9.23 | % | 6.98 | % | –2.31 | % | 7.55 | % | ||||||||||||
| Ratios and Supplemental Data: | ||||||||||||||||||||||||
| Net assets, end of period (in thousands) | $ | 36 | $ | 33 | $ | 48 | $ | 59 | $ | 33 | $ | 34 | ||||||||||||
| Ratios to average net assets (c): | ||||||||||||||||||||||||
| Net expenses | 0.95 | % | 0.95 | % | 0.95 | % | 0.95 | % | 0.98 | % | 1.02 | % | ||||||||||||
| Gross expenses | 14.58 | % | 12.84 | % | 10.32 | % | 27.52 | % | 38.42 | % | 42.88 | % | ||||||||||||
| Net investment income (loss) | 1.49 | % | 1.12 | % | 1.31 | % | 1.88 | % | 2.08 | % | 1.95 | % | ||||||||||||
| Portfolio turnover rate | 19 | % | 59 | % | 65 | % | 65 | % | 60 | % | 42 | % | ||||||||||||
| † | Unaudited. |
| (a) | Net investment income (loss) has been computed using the average shares method. |
| (b) | Total returns reflect reinvestment of all dividends and distributions, if any. Certain expenses of the Portfolio may have been waived or reimbursed by the Investment Manager, State Street or DST; without such waiver/reimbursement of expenses, the Portfolio’s returns would have been lower. Returns for a period of less than one year are not annualized. |
| (c) | Annualized for a period of less than one year. |
The accompanying notes are an integral part of these financial statements.
72 Semi-Annual Report
LAZARD US CORPORATE INCOME PORTFOLIO
| Selected data for a share of capital stock outstanding throughout | Six Months Ended | Year Ended | ||||||||||||||||||||||
| each period | 6/30/22† | 12/31/21 | 12/31/20* | 12/31/19* | 12/31/18* | 12/31/17* | ||||||||||||||||||
| Institutional Shares | ||||||||||||||||||||||||
| Net asset value, beginning of period | $ | 19.63 | $ | 19.80 | $ | 19.68 | $ | 18.16 | $ | 19.56 | $ | 19.48 | ||||||||||||
| Income (Loss) from investment operations: | ||||||||||||||||||||||||
| Net investment income (loss) (a) | 0.35 | 0.72 | 0.80 | 0.88 | 0.88 | 0.88 | ||||||||||||||||||
| Net realized and unrealized gain (loss) | (2.74 | ) | (0.17 | ) | 0.13 | 1.52 | (1.40 | ) | 0.08 | |||||||||||||||
| Total from investment operations | (2.39 | ) | 0.55 | 0.93 | 2.40 | (0.52 | ) | 0.96 | ||||||||||||||||
| Less distributions from: | ||||||||||||||||||||||||
| Net investment income | (0.36 | ) | (0.72 | ) | (0.81 | ) | (0.88 | ) | (0.88 | ) | (0.88 | ) | ||||||||||||
| Total distributions | (0.36 | ) | (0.72 | ) | (0.81 | ) | (0.88 | ) | (0.88 | ) | (0.88 | ) | ||||||||||||
| Net asset value, end of period | $ | 16.88 | $ | 19.63 | $ | 19.80 | $ | 19.68 | $ | 18.16 | $ | 19.56 | ||||||||||||
| Total Return (b) | –12.30 | % | 2.86 | % | 4.96 | % | 13.34 | % | –2.73 | % | 5.09 | % | ||||||||||||
| Ratios and Supplemental Data: | ||||||||||||||||||||||||
| Net assets, end of period (in thousands) | $ | 258,715 | $ | 299,518 | $ | 298,636 | $ | 297,219 | $ | 308,285 | $ | 344,508 | ||||||||||||
| Ratios to average net assets (c): | ||||||||||||||||||||||||
| Net expenses | 0.55 | % | 0.55 | % | 0.55 | % | 0.55 | % | 0.55 | % | 0.55 | % | ||||||||||||
| Gross expenses | 0.67 | % | 0.66 | % | 0.67 | % | 0.67 | % | 0.64 | % | 0.67 | % | ||||||||||||
| Net investment income (loss) | 3.91 | % | 3.64 | % | 4.17 | % | 4.47 | % | 4.65 | % | 4.57 | % | ||||||||||||
| Portfolio turnover rate | 7 | % | 30 | % | 26 | % | 21 | % | 16 | % | 21 | % | ||||||||||||
The accompanying notes are an integral part of these financial statements.
Semi-Annual Report 73
| Selected data for a share of capital stock outstanding throughout | Six Months Ended | Year Ended | ||||||||||||||||||||||
| each period | 6/30/22† | 12/31/21 | 12/31/20* | 12/31/19* | 12/31/18* | 12/31/17* | ||||||||||||||||||
| Open Shares | ||||||||||||||||||||||||
| Net asset value, beginning of period | $ | 19.72 | $ | 19.90 | $ | 19.76 | $ | 18.28 | $ | 19.64 | $ | 19.56 | ||||||||||||
| Income (Loss) from investment operations: | ||||||||||||||||||||||||
| Net investment income (loss) (a) | 0.33 | 0.67 | 0.75 | 0.80 | 0.84 | 0.84 | ||||||||||||||||||
| Net realized and unrealized gain (loss) | (2.75 | ) | (0.17 | ) | 0.15 | 1.48 | (1.36 | ) | 0.08 | |||||||||||||||
| Total from investment operations | (2.42 | ) | 0.50 | 0.90 | 2.28 | (0.52 | ) | 0.92 | ||||||||||||||||
| Less distributions from: | ||||||||||||||||||||||||
| Net investment income | (0.34 | ) | (0.68 | ) | (0.76 | ) | (0.80 | ) | (0.84 | ) | (0.84 | ) | ||||||||||||
| Total distributions | (0.34 | ) | (0.68 | ) | (0.76 | ) | (0.80 | ) | (0.84 | ) | (0.84 | ) | ||||||||||||
| Net asset value, end of period | $ | 16.96 | $ | 19.72 | $ | 19.90 | $ | 19.76 | $ | 18.28 | $ | 19.64 | ||||||||||||
| Total Return (b) | –12.40 | % | 2.55 | % | 4.80 | % | 12.74 | % | –2.78 | % | 4.77 | % | ||||||||||||
| Ratios and Supplemental Data: | ||||||||||||||||||||||||
| Net assets, end of period (in thousands) | $ | 2,956 | $ | 3,423 | $ | 3,733 | $ | 4,170 | $ | 4,314 | $ | 5,708 | ||||||||||||
| Ratios to average net assets (c): | ||||||||||||||||||||||||
| Net expenses | 0.80 | % | 0.80 | % | 0.80 | % | 0.83 | % | 0.85 | % | 0.85 | % | ||||||||||||
| Gross expenses | 1.03 | % | 1.00 | % | 1.03 | % | 1.19 | % | 1.11 | % | 1.13 | % | ||||||||||||
| Net investment income (loss) | 3.65 | % | 3.39 | % | 3.94 | % | 4.18 | % | 4.34 | % | 4.28 | % | ||||||||||||
| Portfolio turnover rate | 7 | % | 30 | % | 26 | % | 21 | % | 16 | % | 21 | % | ||||||||||||
The accompanying notes are an integral part of these financial statements.
74 Semi-Annual Report
| Selected data for a share of capital stock outstanding throughout | Six Months Ended | Year Ended | ||||||||||||||||||||||
| each period | 6/30/22† | 12/31/21 | 12/31/20* | 12/31/19* | 12/31/18* | 12/31/17* | ||||||||||||||||||
| R6 Shares | ||||||||||||||||||||||||
| Net asset value, beginning of period | $ | 19.69 | $ | 19.88 | $ | 19.76 | $ | 18.68 | $ | 19.56 | $ | 19.48 | ||||||||||||
| Income (Loss) from investment operations: | ||||||||||||||||||||||||
| Net investment income (loss) (a) | 0.38 | 0.73 | 0.81 | 0.92 | 0.92 | 0.88 | ||||||||||||||||||
| Net realized and unrealized gain (loss) | (2.77 | ) | (0.18 | ) | 0.11 | 1.04 | (1.40 | ) | 0.08 | |||||||||||||||
| Total from investment operations | (2.39 | ) | 0.55 | 0.92 | 1.96 | (0.48 | ) | 0.96 | ||||||||||||||||
| Less distributions from: | ||||||||||||||||||||||||
| Net investment income | (0.37 | ) | (0.74 | ) | (0.80 | ) | (0.88 | ) | (0.40 | ) | (0.88 | ) | ||||||||||||
| Total distributions | (0.37 | ) | (0.74 | ) | (0.80 | ) | (0.88 | ) | (0.40 | ) | (0.88 | ) | ||||||||||||
| Net asset value, end of period | $ | 16.93 | $ | 19.69 | $ | 19.88 | $ | 19.76 | $ | 18.68 | $ | 19.56 | ||||||||||||
| Total Return (b) | –12.26 | % | 2.80 | % | 4.89 | % | 10.67 | % | –2.43 | %(d) | 5.09 | % | ||||||||||||
| Ratios and Supplemental Data: | ||||||||||||||||||||||||
| Net assets, end of period (in thousands) | $ | 1 | $ | 1 | $ | 1 | $ | 1 | $ | 1 | $ | 1,783 | ||||||||||||
| Ratios to average net assets (c): | ||||||||||||||||||||||||
| Net expenses | 0.55 | % | 0.55 | % | 0.55 | % | 0.55 | % | 0.55 | % | 0.55 | % | ||||||||||||
| Gross expenses | 247.69 | % | 231.95 | % | 256.05 | % | 858.55 | % | 4.62 | % | 1.69 | % | ||||||||||||
| Net investment income (loss) | 4.15 | % | 3.66 | % | 4.22 | % | 4.55 | % | 4.61 | % | 4.58 | % | ||||||||||||
| Portfolio turnover rate | 7 | % | 30 | % | 26 | % | 21 | % | 16 | % | 21 | % | ||||||||||||
| † | Unaudited. |
| * | On November 17, 2020, the Portfolio effected a 1:4 reverse share split. All per share data prior to November 17, 2020 has been adjusted to reflect the reverse share split. |
| (a) | Net investment income (loss) has been computed using the average shares method. |
| (b) | Total returns reflect reinvestment of all dividends and distributions, if any. Certain expenses of the Portfolio may have been waived or reimbursed by the Investment Manager, State Street or DST; without such waiver/reimbursement of expenses, the Portfolio’s returns would have been lower. Returns for a period of less than one year are not annualized. |
| (c) | Annualized for a period of less than one year. |
| (d) | The Portfolio received settlement proceeds from a foreign exchange trading class action lawsuit. The proceeds from the settlement represented a realized gain and were recorded in the period received. There was a 0.62% impact on the total return of the Portfolio’s R6 Shares. |
The accompanying notes are an integral part of these financial statements.
Semi-Annual Report 75
LAZARD US SHORT DURATION FIXED INCOME PORTFOLIO
| Selected data for a share of capital stock outstanding throughout | Six Months Ended | Year Ended | ||||||||||||||||||||||
| each period | 6/30/22† | 12/31/21 | 12/31/20 | 12/31/19 | 12/31/18 | 12/31/17 | ||||||||||||||||||
| Institutional Shares | ||||||||||||||||||||||||
| Net asset value, beginning of period | $ | 9.83 | $ | 9.89 | $ | 9.77 | $ | 9.70 | $ | 9.79 | $ | 9.86 | ||||||||||||
| Income (Loss) from investment operations: | ||||||||||||||||||||||||
| Net investment income (loss) (a) | 0.04 | 0.02 | 0.12 | 0.21 | 0.19 | 0.14 | ||||||||||||||||||
| Net realized and unrealized gain (loss) | (0.26 | ) | (0.06 | ) | 0.12 | 0.07 | (0.09 | ) | (0.07 | ) | ||||||||||||||
| Total from investment operations | (0.22 | ) | (0.04 | ) | 0.24 | 0.28 | 0.10 | 0.07 | ||||||||||||||||
| Less distributions from: | ||||||||||||||||||||||||
| Net investment income | (0.04 | ) | (0.02 | ) | (0.12 | ) | (0.20 | ) | (0.17 | ) | (0.11 | ) | ||||||||||||
| Return of capital | — | — | — | (0.01 | ) | (0.02 | ) | (0.03 | ) | |||||||||||||||
| Total distributions | (0.04 | ) | (0.02 | ) | (0.12 | ) | (0.21 | ) | (0.19 | ) | (0.14 | ) | ||||||||||||
| Net asset value, end of period | $ | 9.57 | $ | 9.83 | $ | 9.89 | $ | 9.77 | $ | 9.70 | $ | 9.79 | ||||||||||||
| Total Return (b) | –2.20 | % | –0.39 | % | 2.46 | % | 2.93 | % | 1.08 | % | 0.72 | % | ||||||||||||
| Ratios and Supplemental Data: | ||||||||||||||||||||||||
| Net assets, end of period (in thousands) | $ | 68,900 | $ | 79,247 | $ | 87,746 | $ | 96,096 | $ | 116,276 | $ | 100,390 | ||||||||||||
| Ratios to average net assets (c): | ||||||||||||||||||||||||
| Net expenses | 0.40 | % | 0.36 | % | 0.40 | % | 0.40 | % | 0.40 | % | 0.40 | % | ||||||||||||
| Gross expenses | 0.52 | % | 0.48 | % | 0.47 | % | 0.45 | % | 0.43 | % | 0.43 | % | ||||||||||||
| Net investment income (loss) | 0.89 | % | 0.22 | % | 1.21 | % | 2.18 | % | 2.00 | % | 1.43 | % | ||||||||||||
| Portfolio turnover rate | 102 | % | 100 | % | 97 | % | 175 | % | 170 | % | 108 | % | ||||||||||||
The accompanying notes are an integral part of these financial statements.
76 Semi-Annual Report
| Selected data for a share of capital stock outstanding throughout | Six Months Ended | Year Ended | ||||||||||||||||||||||
| each period | 6/30/22† | 12/31/21 | 12/31/20 | 12/31/19 | 12/31/18 | 12/31/17 | ||||||||||||||||||
| Open Shares | ||||||||||||||||||||||||
| Net asset value, beginning of period | $ | 9.84 | $ | 9.90 | $ | 9.78 | $ | 9.71 | $ | 9.79 | $ | 9.87 | ||||||||||||
| Income (Loss) from investment operations: | ||||||||||||||||||||||||
| Net investment income (loss) (a) | 0.03 | 0.01 | 0.09 | 0.19 | 0.16 | 0.11 | ||||||||||||||||||
| Net realized and unrealized gain (loss) | (0.26 | ) | (0.06 | ) | 0.12 | 0.06 | (0.08 | ) | (0.08 | ) | ||||||||||||||
| Total from investment operations | (0.23 | ) | (0.05 | ) | 0.21 | 0.25 | 0.08 | 0.03 | ||||||||||||||||
| Less distributions from: | ||||||||||||||||||||||||
| Net investment income | (0.03 | ) | (0.01 | ) | (0.09 | ) | (0.17 | ) | (0.14 | ) | (0.09 | ) | ||||||||||||
| Return of capital | — | — | — | (0.01 | ) | (0.02 | ) | (0.02 | ) | |||||||||||||||
| Total distributions | (0.03 | ) | (0.01 | ) | (0.09 | ) | (0.18 | ) | (0.16 | ) | (0.11 | ) | ||||||||||||
| Net asset value, end of period | $ | 9.58 | $ | 9.84 | $ | 9.90 | $ | 9.78 | $ | 9.71 | $ | 9.79 | ||||||||||||
| Total Return (b) | –2.29 | % | –0.50 | % | 2.20 | % | 2.64 | % | 0.88 | % | 0.32 | % | ||||||||||||
| Ratios and Supplemental Data: | ||||||||||||||||||||||||
| Net assets, end of period (in thousands) | $ | 16 | $ | 22 | $ | 29 | $ | 16 | $ | 37 | $ | 25 | ||||||||||||
| Ratios to average net assets (c): | ||||||||||||||||||||||||
| Net expenses | 0.59 | % | 0.48 | % | 0.65 | % | 0.69 | % | 0.70 | % | 0.70 | % | ||||||||||||
| Gross expenses | 26.53 | % | 18.10 | % | 14.74 | % | 51.53 | % | 38.00 | % | 33.88 | % | ||||||||||||
| Net investment income (loss) | 0.65 | % | 0.12 | % | 0.96 | % | 1.91 | % | 1.68 | % | 1.13 | % | ||||||||||||
| Portfolio turnover rate | 102 | % | 100 | % | 97 | % | 175 | % | 170 | % | 108 | % | ||||||||||||
| † | Unaudited. |
| (a) | Net investment income (loss) has been computed using the average shares method. |
| (b) | Total returns reflect reinvestment of all dividends and distributions, if any. Certain expenses of the Portfolio may have been waived or reimbursed by the Investment Manager, State Street or DST; without such waiver/reimbursement of expenses, the Portfolio’s returns would have been lower. Returns for a period of less than one year are not annualized. |
| (c) | Annualized for a period of less than one year. |
The accompanying notes are an integral part of these financial statements.
Semi-Annual Report 77
The Lazard Funds, Inc. Notes to Financial Statements
June 30, 2022 (unaudited)
1. Organization
The Lazard Funds, Inc. was incorporated in Maryland on May 17, 1991 and is registered under the Investment Company Act of 1940, as amended (the “1940 Act”), as an open-end management investment company. As of June 30, 2022, the Fund was comprised of twenty-nine no-load portfolios (each referred to as a “Portfolio”). This report includes only the financial statements of the Lazard Emerging Markets Debt Portfolio (“Emerging Markets Debt”), the Lazard Global Fixed Income Portfolio (“Global Fixed Income”), the Lazard US Corporate Income Portfolio (“US Corporate Income”), and the Lazard US Short Duration Fixed Income Portfolio (“US Short Duration Fixed Income”).The financial statements of the other twenty-five Portfolios are presented separately.
The Portfolios, other than the Emerging Markets Debt Portfolio, are operated as “diversified” funds, as defined in the 1940 Act.
Each Portfolio currently offers Institutional Shares and Open Shares, and certain Portfolios offer R6 Shares. Each share class is identical except as to minimum investment requirements; eligibility requirements for R6 Shares; the services offered to, and expenses borne by, each class; and the availability of Service Payments (as defined in the Fund’s prospectus).
2. Significant Accounting Policies
The accompanying financial statements are presented in conformity with GAAP. The Fund is an investment company and therefore applies specialized accounting guidance in accordance with Accounting Standards Codification Topic 946.The following is a summary of significant accounting policies consistently followed by the Fund in the preparation of the financial statements:
(a) Valuation of Investments—Bonds and other fixed-income securities that are not exchange-traded are valued on the basis of prices provided by independent pricing services which are based on, among other things, trading in securities with similar characteristics, brokers’ quotations and/or a matrix system which
78 Semi-Annual Report
considers such factors as other security prices, yields and maturities. Equity securities traded on a securities exchange or market, including exchange-traded option contracts, rights and warrants, are valued at the last reported sales price (for US listed equity securities) or the closing price (for non-US listed equity securities) on the exchange or market on which the security is principally traded or, for securities trading on the Nasdaq, the Nasdaq Official Closing Price. Over the counter swap agreements are valued by an independent pricing service and centrally cleared swaps are valued at the last reported sale on the clearing exchange. Forward currency contracts generally are valued using quotations from an independent pricing service. Investments in money market funds are valued at the fund’s net asset value (“NAV”) per share.
Calculation of a Portfolio’s NAV may not take place contemporaneously with the determination of the prices of portfolio assets used in such calculation. Trading on certain non-US securities exchanges or markets, such as those in Europe and Asia, ordinarily may be completed before the close of business on each business day in New York (i.e., a day on which the New York Stock Exchange (the “NYSE”) is open). In addition, securities trading in a particular non-US country or countries, may not take place on all business days in New York and on which the NAV of a Portfolio is calculated.
If a significant event materially affecting the value of securities occurs between the close of the exchange or market on which the security is principally traded and the time when a Portfolio’s NAV is calculated, or when current market quotations otherwise are determined not to be readily available or reliable (including restricted or other illiquid securities such as certain derivative instruments), such securities will be valued at their fair value as determined by, or in accordance with procedures approved by, the Fund’s Board of Directors (the “Board”). Certain non-US securities may trade on days when a Portfolio is not open for business, thus affecting the value of the Portfolio’s assets on days when Portfolio shareholders may not be able to buy or sell Portfolio shares.
Semi-Annual Report 79
The Valuation Committee of the Investment Manager, which is subject to the oversight of the Board, may evaluate a variety of factors to determine the fair value of securities for which market quotations are determined not to be readily available or reliable. These factors include, but are not limited to, the type of security, the value of comparable securities, observations from financial institutions and relevant news events. Input from the Investment Manager’s portfolio management team also will be considered.
The effect of using fair value pricing is that the NAV of a Portfolio will reflect the affected securities’ values as determined in the judgment of the Board or its designee instead of being determined by the market. Using a fair value pricing methodology to price securities may result in a value that is different from the most recent closing price of a security and from the prices used by other investment companies to calculate their portfolios’ NAVs.
(b) Portfolio Securities Transactions and Investment Income—Portfolio securities transactions are accounted for on trade date. Realized gain (loss) on sales of investments are recorded on a specific identification basis. Interest income is accrued daily. A Portfolio amortizes premiums and accretes discounts on fixed-income securities using the effective yield method and mortgage-backed securities using the level yield method.
A Portfolio may be subject to taxes imposed by non-US countries in which it invests. Such taxes are generally based upon income earned or capital gains (realized and/or unrealized). An affected Portfolio accrues and applies such taxes to net investment income, net realized gains and net unrealized gains concurrent with the recognition of income earned or capital gains (realized and/or unrealized) from the applicable portfolio securities.
(c) Foreign Currency Translation and Forward Currency Contracts—The accounting records of the Fund are maintained in US dollars. Portfolio securities and other assets and liabilities denominated in a foreign currency are translated daily into US dollars at the prevailing rates of exchange. Purchases and sales of securities, income receipts and expense payments are translated into US dollars at the prevailing exchange rates on the respective transaction dates.
80 Semi-Annual Report
The Portfolios do not isolate the portion of operations resulting from changes in foreign exchange rates on investments from the fluctuations arising from changes in their market prices. Such fluctuations are included in net realized and unrealized gain (loss) on investments.
A forward currency contract is an agreement between two parties to buy or sell currency at a set price on a future date. Daily fluctuations in the value of forward currency contracts are recorded as unrealized appreciation (depreciation) on forward currency contracts. When the contract is closed, the Portfolio records a realized gain (loss) equal to the difference between the value at the time it was opened and the value at the time it was closed. Net realized gain (loss) on foreign currency transactions and forward currency contracts represent net foreign currency gain (loss) from forward currency contracts, disposition of foreign currencies, currency gain (loss) realized between the trade and settlement dates on securities transactions, and the difference between the amount of interest and foreign withholding taxes recorded on the Portfolios’ accounting records and the US dollar equivalent amounts actually received or paid. Net change in unrealized appreciation (depreciation) on foreign currency translations reflects the impact of changes in exchange rates on the value of assets and liabilities, other than investments in securities, during the period.
During the period ended June 30, 2022, the Emerging Markets Debt and Global Fixed Income Portfolios traded in forward currency contracts.
(d) Futures Contracts—Futures contracts are purchased or sold to gain exposure to, or manage exposure from, changes in the value of equity securities or foreign currencies and changes in interest rates.
Futures contracts are exchange-traded agreements between a Portfolio and a counter-party to buy or sell a specific quantity of an underlying instrument at a specified price and on a specified date. Depending on the terms of a contract, it is settled either through physical delivery of the underlying instrument on the settlement date or by payment of a cash amount on the settlement date. Upon
Semi-Annual Report 81
entering into a futures contract, a Portfolio is required to deposit initial margin with the broker in the form of cash or securities in an amount that varies depending on a contract’s size and risk profile. The initial margin deposit must then be maintained at an established level over the life of the contract. Amounts pledged, which are considered restricted, are included in cash collateral pledged for futures contracts in the Statement of Assets and Liabilities.
Securities may be deposited as initial margin. If applicable, any cash deposited and held on margin is shown as cash pledged for futures contracts in the Statement of Assets and Liabilities. Pursuant to the contract, a Portfolio agrees to receive from or pay to the broker an amount of cash equal to the daily fluctuation in market value of the contract (“variation margin”). Variation margin is recorded as unrealized appreciation (depreciation) and, if any, shown as receivables (or payables) for variation margin on open futures contracts in the Statement of Assets and Liabilities. When the contract is closed, a realized gain or loss is recorded in the Statement of Operations equal to the difference between the notional amount of the contract at the time it was opened and the notional amount of the contract at the time it was closed. The use of futures contracts involves the risk of an imperfect correlation in the movements in the price of futures contracts and interest rates, foreign currency exchange rates or underlying assets.
During the period ended June 30, 2022, none of the portfolios traded in futures contracts.
(e) Options Transactions—Put and call options purchased are accounted for in the same manner as portfolio securities and other assets. Certain options may be written with premiums to be determined on a future date. The premiums for these options are based upon implied volatility parameters at specified terms. When a Portfolio writes an option, the premium received by the Portfolio is recorded as a liability and is subsequently adjusted to the current market value of the option written. When a Portfolio writes a call option, such option is typically “covered,” meaning that it holds the underlying instrument subject to being called by the option counterparty. When the Portfolio writes a put option, cash is segregated in an amount sufficient to cover the obligation.
82 Semi-Annual Report
These amounts, which are considered restricted, are included in cash collateral in the Statement of Assets and Liabilities. If a Portfolio writes an option, it bears the market risk of an unfavorable change in the price of the security underlying the written option. The risk of loss is unlimited for uncovered written call options. For uncovered written put options, the risk of loss is limited to the difference between the strike price of the option and the premiums received upon writing the option.
During the period ended June 30, 2022, none of the portfolios traded in options transactions.
(f) Swap Agreements—Interest rate swap agreements involve the exchange by a Portfolio with another party of their respective commitments to pay or receive interest with respect to the notional amount of principal. Certain forms of interest rate swap agreements may include: (i) interest rate caps, under which, in return for a premium, one party agrees to make payments to the other to the extent that interest rates exceed a specified rate, or “cap,” (ii) interest rate floors, under which, in return for a premium, one party agrees to make payments to the other to the extent that interest rates fall below a specified rate, or “floor,” (iii) interest rate collars, under which a party sells a cap and purchases a floor or vice versa in an attempt to protect itself against interest rate movements exceeding given minimum or maximum levels, (iv) callable interest rate swaps, under which the counterparty may terminate the swap transaction in whole at zero cost by a predetermined date and time prior to the maturity date, (v) spread locks, which allow the interest rate swap users to lock in the forward differential (or spread) between the interest rate swap rate and specified benchmark, or (vi) basis swaps, under which two parties can exchange variable interest rates based on different money markets. The change in value, if any, on swap agreements is recorded as unrealized appreciation (depreciation) on swap agreements in a Portfolio’s accompanying Statement of Assets and Liabilities. Once the interim payments are settled in cash, the net amount is recorded as realized gain (loss) on swap agreements in a Portfolio’s accompanying Statement of Operations, in addition to any realized gain (loss) recorded upon the termination of swap agreements.
Semi-Annual Report 83
Upon entering into a centrally cleared swap, the Portfolio is required to deposit initial margin with the broker in the form of cash or securities in an amount that varies depending on the size and risk profile of the particular swap. Securities deposited as initial margin are designated in the Portfolio of Investments and cash deposited is shown as cash collateral for swaps in the Statement of Assets and Liabilities. On these transactions, the Portfolio agrees to receive from or pay to the broker variation margin. Variation margin is recorded as unrealized appreciation (depreciation) and shown as variation margin receivable (or payable) on swaps in the Statement of Assets and Liabilities. Payments received from (paid to) the counterparty, including at termination, are recorded as realized gains (losses) in the Statement of Operations.
During the period ended June 30, 2022, none of the portfolios traded in swap agreements.
(g) Federal Income Taxes—The Fund’s policy is for each Portfolio to qualify as a regulated investment company under Subchapter M of the Internal Revenue Code of 1986, as amended (the “Code”), and to distribute all of its taxable income, including any net realized capital gains, to shareholders. Therefore, no federal income tax provision is required.
At December 31, 2021, the following Portfolios had unused realized capital loss carryovers which, for federal income tax purposes, could be used to offset future realized capital gains with no expiration date as follows:
| Portfolio | Short-Term | Long-Term | ||||||
| Emerging Markets Debt | $ | 18,945,566 | $ | 19,545,754 | ||||
| US Corporate Income | 4,140,402 | 4,329,460 | ||||||
| US Short Duration Fixed Income | 36,430 | 124,436 | ||||||
During the year ended December 31, 2021, the following Portfolios utilized realized capital loss carryovers from previous years as follows:
| Portfolio | Amounts | |||
| US Corporate Income | $ | 495,418 | ||
| US Short Duration Fixed Income | 239,997 | |||
84 Semi-Annual Report
Under current tax law, post-October capital losses or certain late-year ordinary losses, as defined by the Code, within the taxable year may be deferred and treated as occurring on the first day of the following tax year. For the tax year ended December 31, 2021, the following Portfolios elected to defer such losses as follows:
| Portfolio | Post October Capital Loss Deferral | Late Year Ordinary Loss Deferral | |||||||
| Emerging Markets Debt | $ | — | $ | 22,933 | |||||
| Global Fixed Income | 12,869 | 2,811 | |||||||
| US Short Duration Fixed Income | — | 1,758 | |||||||
For federal income tax purposes, the aggregate cost, aggregate gross unrealized appreciation, aggregate gross unrealized depreciation and the net unrealized appreciation (depreciation) were as follows:
| Portfolio | Aggregate Cost | Aggregate Gross Unrealized Appreciation | Aggregate Gross Unrealized Depreciation | Net Unrealized Appreciation (Depreciation) | ||||||||||||
| Emerging Markets Debt | $ | 18,314,203 | $ | 98,658 | $ | 3,214,877 | $ | (3,116,219 | ) | |||||||
| Global Fixed Income | 6,372,862 | 144,754 | 1,150,147 | (1,005,393 | ) | |||||||||||
| US Corporate Income | 294,740,284 | 442,305 | 36,687,416 | (36,245,111 | ) | |||||||||||
| US Short Duration Fixed Income | 69,762,826 | 1,766 | 1,179,598 | (1,177,832 | ) | |||||||||||
Management has analyzed the Portfolios’ tax positions, and has concluded that no liability for unrecognized tax benefits should be recorded related to uncertain tax positions taken on tax returns filed for any open tax years (or expected to be taken on future tax returns). Open tax years are those that remain subject to examination and are based on each tax jurisdiction’s statute of limitations. Each Portfolio files a US federal income tax return annually after its fiscal year-end, which is subject to examination by the Internal Revenue Service for a period of three years from the date of filing.
(h) Dividends and Distributions—For each Portfolio, income dividends are normally declared each business day and paid monthly. During any particular year, net realized gains from
Semi-Annual Report 85
investment transactions in excess of available capital loss carryforwards would be taxable to the Portfolios, if not distributed. The Portfolios intend to declare and distribute these amounts, at least annually, to shareholders, but may be distributed more frequently. Differences in per share distributions, by class, are generally due to differences in class specific expenses.
Income and capital gains distributions are determined in accordance with federal income tax regulations which may differ from GAAP. These book/tax differences, which may result in distribution reclassifications, are primarily due to differing treatments of foreign currency and fixed-income transactions, distribution redesignations, certain fixed-income securities and expenses, derivatives, wash sales, return of capital distributions, currency straddles and paydown gain/loss. The book/tax differences relating to shareholder distributions may result in reclassifications among certain capital accounts.
(i) Allocation of Expenses—Expenses common to the Fund, Lazard Retirement Series, Inc., and Lazard Global Total Return and Income Fund, Inc. (each a “Lazard Fund” and collectively, the “Lazard Fund Complex”), each a registered management investment company advised by the Investment Manager, not directly chargeable to one or more specific Lazard Funds are allocated to the Fund and among its Portfolios primarily on the basis of relative net assets. Expenses of the Fund not directly chargeable to one or more Portfolios are similarly allocated among the Portfolios primarily on the basis of relative net assets. The Portfolios accrue distribution and service (12b-1) fees to Open Shares. Each Portfolio’s income, expenses (other than class specific expenses) and realized and unrealized gains and losses are allocated proportionally each day between its classes based upon the relative net assets of each class.
(j) Estimates—The preparation of financial statements in conformity with GAAP requires management to make estimates and assumptions that affect the reported amounts of assets and liabilities and disclosure of contingent assets and liabilities at the date of the financial statements and the reported amounts of increases and decreases in net assets resulting from operations during the reporting period. Actual results could differ from those estimates.
86 Semi-Annual Report
(k) Net Asset Value—The NAV per share for each class of each Portfolio is determined each day the NYSE is open for trading as of the close of regular trading on the NYSE (generally 4:00 p.m. Eastern time).The Fund will not treat an intraday unscheduled disruption in NYSE trading as a closure of the NYSE, and will price its shares as of 4:00 p.m., if the particular disruption directly affects only the NYSE. The NAV per share of a class is determined by dividing the value of the total assets of the Portfolio represented by such class, less all liabilities, by the total number of Portfolio shares of such class outstanding.
3. Investment Management, Administration, Custody, Distribution and Transfer Agency Agreements
The Fund, on behalf of the Portfolios, has entered into a management agreement (the “Management Agreement”) with the Investment Manager. Pursuant to the Management Agreement, the Investment Manager manages the investment operations of each Portfolio and the assets of each Portfolio including the purchase, retention and disposition thereof, in accordance with the Portfolio’s investment objectives, policies, and restrictions, and provides the Portfolios with administrative, operational and compliance assistance services. For its services provided to the Portfolios, the Investment Manager earns a management fee, accrued daily as a percentage of each Portfolio’s average daily net assets and payable by each Portfolio monthly, at the annual rate set forth below:
| Portfolio | Annual Rate | |||
| Emerging Markets Debt | 0.70 | % | ||
| Global Fixed Income | 0.50 | |||
| US Corporate Income | 0.55 | |||
| US Short Duration Fixed Income | 0.25 | |||
The Investment Manager has voluntarily agreed to waive its fees and, if necessary, reimburse a Portfolio until April 29, 2023 (or such other date as indicated below) if the aggregate direct expenses of each Portfolio, exclusive of taxes, brokerage, interest on borrowings, fees and expenses of “Acquired Fund” (as defined in Form N-1A), fees and expenses related to filing foreign tax reclaims and extraordinary expenses, exceed an applicable
Semi-Annual Report 87
percentage of the value of the Portfolio’s average daily net assets set forth opposite the Portfolio’s name in the table below. The Fund, on behalf of the Portfolio, may deduct from the payment to be made to the Investment Manager under the Management Agreement, or the Investment Manager will bear, such excess expenses.
| Portfolio | Institutional Shares | Open Shares | R6 Shares | ||||||||||
| Emerging Markets Debt (a) | 0.85 | % | 1.05 | % | 0.80 | % | |||||||
| Global Fixed Income | 0.70 | 0.95 | N/A | ||||||||||
| US Corporate Income (b) | 0.55 | 0.80 | 0.55 | ||||||||||
| US Short Duration Fixed Income (c) | 0.40 | 0.65 | N/A | ||||||||||
| (a) | From April 29, 2023 until April 29, 2032, the annual rates are 1.10%, 1.35%, and 1.05%, respectively. |
| (b) | This agreement will continue in effect until April 29, 2032 for the R6 Shares. |
| (c) | This agreement will continue in effect until April 29, 2032 for Open Shares. |
In addition, until April 29, 2023, to the extent the “Total Annual Fund Operating Expenses” (as used in Form N-1A) of the R6 Shares of a Portfolio exceed the Total Annual Fund Operating Expenses of the Portfolio’s Institutional Shares (in each case, not including management fees, custodial fees or other expenses related to the management of the Portfolio’s assets), the Investment Manager will bear the expenses of the R6 Shares in the amount of such excess. Further, the Investment Manager will bear the daily expenses incurred in excess of any income produced for the US Short Duration Fixed Income Portfolio.
During the period ended June 30, 2022, the Investment Manager waived its management fees and reimbursed the following Portfolios for other expenses as follows:
| Institutional Shares | Open Shares | ||||||||||||||||
| Portfolio | Management Fees Waived | Expenses Reimbursed | Management Fees Waived | Expenses Reimbursed | |||||||||||||
| Emerging Markets Debt | $ | 59,792 | $ | 45,037 | $ | 1,218 | $ | 2,581 | |||||||||
| Global Fixed Income | 17,487 | 61,777 | 97 | 2,538 | |||||||||||||
| US Corporate Income | 172,545 | — | 3,707 | — | |||||||||||||
| US Short Duration Fixed Income | 42,377 | — | 22 | 2,206 | |||||||||||||
88 Semi-Annual Report
| R6 Shares | |||||||||
| Portfolio | Management Fees Waived | Expenses Reimbursed | |||||||
| Emerging Markets Debt | $ | 4 | $ | 1,470 | |||||
| US Corporate Income | 3 | 1,426 | |||||||
The aforementioned waivers and/or reimbursements are not subject to recoupment by the Investment Manager.
State Street serves as the Fund’s custodian and provides the Fund with certain administrative services.
The Fund has a distribution agreement with Lazard Asset Management Securities LLC (the “Distributor”), a wholly-owned subsidiary of the Investment Manager, to serve as the distributor for shares of each Portfolio. The Distributor bears, amongst other expenses, the cost of preparing and distributing materials used by the Distributor in connection with its offering Portfolio shares and other advertising and promotional expenses.
Under a distribution and servicing plan adopted pursuant to Rule 12b-1 under the 1940 Act, each Portfolio pays a monthly fee to the Distributor, at an annual rate of 0.25% of the average daily net assets of its Open Shares, for certain distribution activities and providing services to holders of the Portfolio’s Open Shares. The Distributor may make payments to third parties such as financial institutions, securities dealers and other industry professionals in respect of these services.
DST is the Fund’s transfer agent and dividend disbursing agent.
4. Directors’ Compensation
Certain Directors of the Fund are officers of the Investment Manager. Effective January 2022, the annual compensation for each Director who is not an affiliated person of the Investment Manager or any of its affiliates, that is payable by all of the funds in the Lazard Fund Complex, is comprised of: (1) an annual fee of $245,000, (2) an additional annual fee of $35,000 to the lead
Semi-Annual Report 89
Independent Director, and (3) an additional annual fee of $25,000 to the Audit Committee Chair. The Independent Directors (an “Independent Director” is a Director who is not an “interested person” (as defined in the 1940 Act) of the Fund) also may be paid additional compensation for participation on ad hoc committees or other work performed on behalf of the Board. The Independent Directors are reimbursed for travel and other out-of-pocket expenses for attending Board and committee meetings or incurred in connection with work performed on behalf of Board. The Directors do not receive benefits from the Fund pursuant to any pension, retirement or similar arrangement. Independent Directors’ fees and expenses are allocated among the active portfolios in the Lazard Fund Complex at a rate of $5,000 per active portfolio with the remainder allocated among the active portfolios on the basis of relative net assets. The Statements of Operations show the Independent Directors’ fees and expenses paid by each Portfolio.
5. Securities Transactions and Transactions with Affiliates
Purchases and sales of portfolio securities (excluding short-term investments) for the period ended June 30, 2022 were as follows:
| Portfolio | Purchases | Sales | ||||||
| Emerging Markets Debt | $ | 7,958,974 | $ | 8,254,492 | ||||
| Global Fixed Income | 1,121,646 | 3,078,810 | ||||||
| US Corporate Income | 18,430,468 | 17,733,797 | ||||||
| US Short Duration Fixed Income | 340,151 | 1,319,738 | ||||||
| US Government and Treasury Securities | ||||||||
| Portfolio | Purchases | Sales | ||||||
| Global Fixed Income | $ | 252,134 | $ | 184,988 | ||||
| US Short Duration Fixed Income | 73,764,333 | 81,350,340 | ||||||
For the period ended June 30, 2022, the Portfolios did not engage in any cross-trades in accordance with Rule 17a-7 under the 1940 Act, and no brokerage commissions were paid to affiliates of the Investment Manager or other affiliates of the Fund for portfolio transactions executed on behalf of the Fund.
90 Semi-Annual Report
6. Line of Credit
The Fund has a $100 million committed line of credit pursuant to an Amended and Restated Loan Agreement (the “Agreement”) with State Street, primarily for temporary or emergency purposes, including the meeting of redemption requests that otherwise might require the untimely disposition of securities. Interest on borrowings is payable at 1.00% plus the “Applicable Rate,” which is the higher of (a) the Federal Funds Rate plus 10 basis points and (b) the Overnight Bank Funding Rate (OBFR) plus 10 basis points, on an annualized basis. Under the Agreement, the Fund has agreed to pay a 0.20% per annum fee on the unused portion of the commitment, payable quarterly in arrears. The Fund has also agreed to pay an upfront fee of 0.05% of the committed line amount. During the period ended June 30, 2022, the following Portfolios had borrowings under the Agreement as follows:
| Portfolio | Average Daily Loan Balance* | Maximum Daily Loan Outstanding | Weighted Average Interest Rate | Number of Days Borrowings were Outstanding | ||||||||||||
| Emerging Markets Debt | $ | 205,300 | $ | 273,500 | 1.18 | % | 5 | |||||||||
| Global Fixed Income | 82,943 | 274,500 | 1.57 | 16 | ||||||||||||
| * | For days borrowings were outstanding. |
Management believes that the fair value of the liabilities under the Agreement is equivalent to the recorded amount based on its short-term maturity and interest rate, which fluctuates with the Applicable Rate. A Portfolio’s outstanding balance under the Agreement, if any, would be categorized as Level 2.
7. Investment Risks
Not all risks described below apply to all Portfolios, or may not apply to the same degree for one or more Portfolios compared to one or more other Portfolios. In addition, not all risks applicable to an investment in a Portfolio are described below. Please see the current summary prospectus for the relevant Portfolio(s) or a current Portfolio prospectus for further information regarding a Portfolio’s investment strategy and related risks.
Semi-Annual Report 91
(a) Market Risk—A Portfolio may incur losses due to declines in one or more markets in which it invests. These declines may be the result of, among other things, political, regulatory, market, economic or social developments affecting the relevant market(s). To the extent that such developments impact specific industries, market sectors, countries or geographic regions, a Portfolio’s investments in such industries, market sectors, countries and/or geographic regions can be expected to be particularly affected, especially if such investments are a significant portion of its investment portfolio. In addition, turbulence in financial markets and reduced liquidity in equity, credit and/or fixed income markets may negatively affect many issuers, which could adversely affect a Portfolio. Global economies and financial markets are increasingly interconnected, and conditions and events in one country, region or financial market may adversely impact issuers worldwide. As a result, local, regional or global events such as war, acts of terrorism, the spread of infectious illness or other public health issues, recessions or other events could have a significant negative impact on global economic and market conditions. The coronavirus disease 2019 (COVID-19) global pandemic and the aggressive responses taken by many governments or voluntarily imposed by private parties, including closing borders, restricting travel and imposing prolonged quarantines or similar restrictions, as well as the closure of, or operational changes to, many retail and other businesses, has had negative impacts, and in many cases severe negative impacts, on markets worldwide. It is not known how long the effects of such impacts, or any future impacts of other significant events described above, will or would last, but there could be a prolonged period of global economic slowdown, which may be expected to impact a Portfolio and its investments.
(b) Fixed-Income and Debt Securities Risk—The market value of a debt security may decline due to general market conditions that are not specifically related to a particular company, such as real or perceived adverse economic conditions, changes in the outlook for corporate earnings, changes in interest or currency rates or adverse investor sentiment generally. The debt securities market can be susceptible to increases in volatility and decreases in liquidity. Liquidity can decline unpredictably in response to overall economic conditions or credit tightening.
92 Semi-Annual Report
Prices of bonds and other debt securities tend to move inversely with changes in interest rates. Interest rate risk is usually greater for fixed-income securities with longer maturities or durations. A rise in interest rates (or the expectation of a rise in interest rates) may result in periods of volatility, decreased liquidity and increased redemptions, and, as a result, the Portfolio may have to liquidate portfolio securities at disadvantageous prices.
A Portfolio’s investments in lower-rated, higher-yielding securities (“junk bonds”) are subject to greater credit risk than its higher-rated investments. Credit risk is the risk that the issuer will not make interest or principal payments, or will not make payments on a timely basis. Non-investment grade securities tend to be more volatile, less liquid and are considered speculative. If there is a decline, or perceived decline, in the credit quality of a debt security (or any guarantor of payment on such security), the security’s value could fall, potentially lowering a Portfolio’s share price. The prices of non-investment grade securities, unlike investment grade debt securities, may fluctuate unpredictably and not necessarily inversely with changes in interest rates. The market for these securities may be less liquid and therefore these securities may be harder to value or sell at an acceptable price, especially during times of market volatility or decline.
Some debt securities may give the issuer the option to call, or redeem, the securities before their maturity, and during a time of declining interest rates, a Portfolio may have to reinvest the proceeds of called or redeemed securities in an investment offering a lower yield (and the Portfolio may not fully benefit from any increase in the value of its portfolio holdings as a result of declining interest rates).
Adjustable rate securities provide a Portfolio with a certain degree of protection against rises in interest rates or inflation rates, respectively, although adjustable rate securities will participate in any declines in interest rates and inflation-linked securities can also decline in value based on changes in the relevant periodic
Semi-Annual Report 93
adjustment rate. Certain adjustable rate securities, such as those with interest rates that fluctuate directly or indirectly based on multiples of a stated index, are designed to be highly sensitive to changes in interest rates and can subject the holders thereof to extreme reductions of yield and possibly loss of principal. Certain fixed-income securities may be issued at a discount from their face value (such as zero coupon securities) or purchased at a price less than their stated face amount or at a price less than their issue price plus the portion of “original issue discount” previously accrued thereon, i.e., purchased at a “market discount. “The amount of original issue discount and/or market discount on certain obligations may be significant, and accretion of market discount together with original issue discount will cause a Portfolio to realize income prior to the receipt of cash payments with respect to these securities.
(c) Non-US Securities Risk—A Portfolio’s performance will be influenced by political, social and economic factors affecting the non-US countries and companies in which the Portfolio invests. Non-US securities carry special risks, such as less developed or less efficient trading markets, political instability, a lack of company information, differing auditing and legal standards, and, potentially, less liquidity.
(d) Emerging Market Risk—Emerging market countries generally have economic structures that are less diverse and mature, and political systems that are less stable, than those of developed countries. The economies of countries with emerging markets may be based predominantly on only a few industries, may be highly vulnerable to changes in local or global trade conditions, and may suffer from extreme debt burdens or volatile inflation rates. The securities markets of emerging market countries have historically been extremely volatile and less liquid than more developed markets. These market conditions may continue or worsen. Investments in these countries may be subject to political, economic, legal, market and currency risks. Significant devaluation of emerging market currencies against the US dollar may occur subsequent to acquisition of investments denominated in emerging market currencies.
94 Semi-Annual Report
(e) Foreign Currency Risk—Investments denominated in currencies other than US dollars may experience a decline in value, in US dollar terms, due solely to fluctuations in currency exchange rates. A Portfolio’s investments denominated in such currencies (particularly currencies of emerging markets countries), as well as any investments in currencies themselves, could be adversely affected by delays in, or a refusal to grant, repatriation of funds or conversion of emerging market currencies. Irrespective of any foreign currency exposure hedging, a Portfolio may experience a decline in the value of its portfolio securities, in US dollar terms, due solely to fluctuations in currency exchange rates.
(f) Derivatives and Hedging Risk—Derivatives transactions, including those entered into for hedging purposes (i.e., seeking to protect Portfolio investments), may increase volatility, reduce returns, limit gains or magnify losses, perhaps substantially, particularly since most derivatives have a leverage component that provides investment exposure in excess of the amount invested. Swap agreements; forward currency contracts; structured products; over-the-counter options on currencies and swap agreements; and other over-the-counter derivatives transactions are subject to the risks of the creditworthiness of, and default, by the counterparty and consequently may lose all or a portion of their value due solely to the creditworthiness of, or default by, the counterparty. Over-the-counter derivatives frequently may be illiquid and difficult to value. Changes in liquidity may result in significant, rapid and unpredictable changes in the prices for derivatives. These derivatives transactions, as well as the exchange-traded futures and options in which a Portfolio may invest, are subject to many of the risks of, and can be highly sensitive to changes in the value of, the related reference asset, index or rate. As such, a small investment could have a potentially large impact on a Portfolio’s performance. Purchasing options will reduce returns by the amount of premiums paid for options that are not exercised. In fact, many derivatives may be subject to greater risks than those associated with investing directly in the underlying or other reference asset. Derivatives transactions incur costs, either explicitly or implicitly, which reduce returns, and
Semi-Annual Report 95
costs of engaging in such transactions may outweigh any gains or any losses averted from hedging activities. Successful use of derivatives, whether for hedging or for other investment purposes, is subject to the Investment Manager’s ability to predict correctly movements in the direction of the relevant reference asset or market and, for hedging activities, correlation of the derivative instruments used with the investments seeking to be hedged. Use of derivatives transactions, even if entered into for hedging purposes, may cause a Portfolio to experience losses greater than if the Portfolio had not engaged in such transactions. When the Portfolio enters into derivatives transactions, it may be required to segregate liquid assets or enter into offsetting positions or otherwise cover its obligations, in accordance with applicable regulations while the positions are open. New SEC Rule 18f-4 under the 1940 Act, with which investment companies must comply beginning in August 2022, relates to the use of derivatives and certain other transactions by registered investment companies, and will rescind and withdraw applicable guidance and relief regarding these asset segregation and coverage practices. Rule 18f-4 will regulate and, in some cases limit, the use of derivatives for certain Portfolios and may require a Portfolio to alter, perhaps materially, its use of derivatives.
(g) Structured Products Risk—Structured notes and other structured products are privately negotiated debt instruments where the principal and/or interest is determined by reference to a specified asset, market or rate, or the differential performance of two assets or markets. Structured products can have risks of both fixed-income securities and derivatives transactions. Derivatives transactions may increase volatility or reduce returns, perhaps substantially, particularly since most derivatives have a leverage component that provides investment exposure in excess of the amount invested, and they are subject to many of the risks of, and can be highly sensitive to changes in the value of, the related reference asset, market or rate. As such, a small investment could have a potentially large impact on a Portfolio’s performance. Use of derivatives transactions may cause a Portfolio to experience losses greater than if a Portfolio had not engaged in such transactions.
96 Semi-Annual Report
(h) Mortgage-Related and Asset-Backed Securities Risk—Mortgage-related securities are complex instruments, subject to both credit and prepayment risk, and may be more volatile and less liquid, and more difficult to price accurately, than more traditional debt securities. Mortgage-related securities generally are subject to credit risks associated with the performance of the underlying mortgage properties. Prepayment risk can lead to fluctuations in value of the mortgage-related security which may be pronounced. As with other interest-bearing securities, the prices of certain mortgage-related securities are inversely affected by changes in interest rates. However, although the value of a mortgage-related security may decline when interest rates rise, the converse is not necessarily true, since during periods of declining interest rates the mortgages underlying the security are more likely to be prepaid.
The risks of asset-backed securities are similar to those of mortgage-related securities. However, asset-backed securities present certain risks that are not presented by mortgage-related securities. Primarily, these securities may provide a Portfolio with a less effective security interest in the related collateral than do mortgage-related securities.
(i) Preferred Securities Risk—There are various risks associated with investing in preferred securities. In addition, unlike common stock, participation in the growth of an issuer may be limited.
| ● | Credit risk is the risk that a security held by the Portfolio will decline in price or the issuer of the security will fail to make dividend, interest or principal payments when due because the issuer experiences a decline in its financial status. |
| ● | Interest rate risk is the risk that securities will decline in value because of changes in market interest rates. When market interest rates rise, the market value of such securities generally will fall. |
| ● | Preferred securities may include provisions that permit the issuer, at its discretion, to defer or omit distributions for a stated period without any adverse consequences to the issuer. |
Semi-Annual Report 97
| ● | Preferred securities are generally subordinated to bonds and other debt instruments in an issuer’s capital structure in terms of having priority to corporate income, claims to corporate assets and liquidation payments, and therefore will be subject to greater credit risk than more senior debt instruments. |
| ● | During periods of declining interest rates, an issuer may be able to exercise an option to call, or redeem its issue at par earlier than the scheduled maturity. If this occurs during a time of lower or declining interest rates, the Portfolio may have to reinvest the proceeds in lower yielding securities (and the Portfolio may not benefit from any increase in the value of its portfolio holdings as a result of declining interest rates). |
| ● | Certain preferred securities may be substantially less liquid than many other securities, such as common stocks or US government securities. Illiquid securities involve the risk that the securities will not be able to be sold at the time desired by the Portfolio or at prices approximating the value at which the Portfolio is carrying the securities on its books. |
(j) Non-Diversification Risk—A Portfolio that is classified as “non-diversified” may be more vulnerable to changes in the market value of a single issuer or group of issuers and may be relatively more susceptible to adverse effects from any single corporate, industry, economic, market, political or regulatory occurrence than if the Portfolio’s investments consisted of securities issued by a larger number of issuers.
(k) Government Securities Risk—Not all obligations of the US government, its agencies and instrumentalities are backed by the full faith and credit of the US Treasury. Some obligations are backed only by the credit of the issuing agency or instrumentality, and in some cases there may be some risk of default by the issuer. Any guarantee by the US government or its agencies or instrumentalities of a security held by a Portfolio does not apply to the market value of such security or to shares of the Portfolio itself. A security backed by the US Treasury or the full faith and credit of the United States is guaranteed only as to the timely payment of interest and principal when held to maturity.
98 Semi-Annual Report
(l) Cybersecurity Risk—The Portfolios and their service providers are susceptible to operational and information security and related risks of cybersecurity incidents. Cybersecurity attacks include, but are not limited to, gaining unauthorized access to digital systems (e.g., through “hacking” or malicious software coding) for purposes of misappropriating assets or sensitive information, corrupting data or causing operational disruption. Cybersecurity incidents affecting the Investment Manager, transfer agent or custodian or other service providers such as financial intermediaries have the ability to cause disruptions and impact business operations, potentially resulting in financial losses, including by impediments to a Portfolio’s investment trading; the inability of Portfolio shareholders to purchase and redeem Portfolio shares; interference with a Portfolio’s ability to calculate its NAV; violations of applicable privacy, data security or other laws; regulatory fines and penalties; reputational damage; reimbursement or other compensation or remediation costs; legal fees; or additional compliance costs. Similar adverse consequences could result from cybersecurity incidents affecting issuers of securities in which a Portfolio invests; counterparties with which a Portfolio engages in transactions; governmental and other regulatory authorities, exchange and other financial market operators; and banks, brokers, dealers, insurance companies and other financial institutions and other parties. There are inherent limitations in any cybersecurity risk management systems or business continuity plans, including the possibility that certain risks have not been identified.
(m) Geopolitical Risk—As a result of the ongoing armed conflict between Russia and Ukraine, the United States, the United Kingdom, the European Union, and several other nations have announced a broad array of new or expanded sanctions, export controls, and other measures against Russia, as well as upon certain banks, companies, government officials, and other individuals in or affiliated with Russia and Belarus. The ongoing conflict and the evolving response measures may continue to have a negative impact on the economy and business activity globally (including in the countries in which the Portfolios invest), and therefore, could adversely affect the performance of the
Semi-Annual Report 99
Portfolios’ investments. The severity and duration of the conflict is unknown and could continue to impact global economic and market conditions adversely. Management will continue to seek to assess the potential impacts on valuation and liquidity and will take any actions needed in accordance with procedures already approved by the Board of Directors.
8. Contractual Obligations
The Fund enters into contracts in the normal course of business that contain a variety of indemnification provisions. A Portfolio’s maximum exposure under these arrangements is unknown. Management has reviewed the Fund’s existing contracts and expects the risk of loss to be remote.
9. Fair Value Measurements
Fair value is defined as the price that a Portfolio would receive to sell an asset, or would pay to transfer a liability, in an orderly transaction between market participants at the date of measurement. The Fair Value Measurements and Disclosures provisions of GAAP also establish a framework for measuring fair value, and a three-level hierarchy for fair value measurement that is based upon the transparency of inputs to the valuation of an asset or liability. Inputs may be observable or unobservable and refer, broadly, to the assumptions that market participants would use in pricing the asset or liability. Observable inputs reflect the assumptions that market participants would use in pricing the asset or liability based on market data obtained from sources independent of the Fund. Unobservable inputs reflect the Fund’s own assumptions about the assumptions that market participants would use in pricing the asset or liability, developed based on the best information available in the circumstances. The fair value measurement level within the fair value hierarchy for the assets and liabilities of the Fund is based on the lowest level of any input that is significant to the overall fair value measurement. The three-level hierarchy of inputs is summarized below:
| ● | Level 1 – unadjusted quoted prices in active markets for identical assets and liabilities |
100 Semi-Annual Report
| ● | Level 2 – other significant observable inputs (including unadjusted quoted prices for similar assets and liabilities, interest rates, prepayment speeds, credit risk, etc.) |
| ● | Level 3 – significant unobservable inputs (including the Fund’s own assumptions in determining the fair value of assets and liabilities) |
Changes in valuation methodology or inputs may result in transfers into or out of the current assigned level within the hierarchy.
The inputs or methodology used for valuing securities are not necessarily an indication of the risks associated with investing in these securities.
The following table summarizes the valuation of the Portfolios’ assets and liabilities by each fair value hierarchy level as of June 30, 2022:
| Description | Unadjusted Quoted Prices in Active Markets for Identical Assets and Liabilities (Level 1) | Significant Other Observable Inputs (Level 2) | Significant Unobservable Inputs (Level 3) | Balance as of June 30, 2022 | |||||||||||||
| Emerging Markets Debt Portfolio | |||||||||||||||||
| Assets: | |||||||||||||||||
| Corporate Bonds* | $ | — | $ | 815,471 | $ | — | $ | 815,471 | |||||||||
| Foreign Government Obligations* | — | 13,472,539 | — | 13,472,539 | |||||||||||||
| Quasi Government Bonds* | — | 22,120 | — | 22,120 | |||||||||||||
| Supranational Bonds | — | 13,832 | — | 13,832 | |||||||||||||
| Short-Term Investments | 870,528 | — | — | 870,528 | |||||||||||||
| Other Financial Instruments† | |||||||||||||||||
| Forward Currency Contracts | — | 36,854 | — | 36,854 | |||||||||||||
| Total | $ | 870,528 | $ | 14,360,816 | $ | — | $ | 15,231,344 | |||||||||
| Liabilities: | |||||||||||||||||
| Other Financial Instruments† | |||||||||||||||||
| Forward Currency Contracts | $ | — | $ | (33,360 | ) | $ | — | $ | (33,360 | ) | |||||||
Semi-Annual Report 101
| Description | Unadjusted Quoted Prices in Active Markets for Identical Assets and Liabilities (Level 1) | Significant Other Observable Inputs (Level 2) | Significant Unobservable Inputs (Level 3) | Balance as of June 30, 2022 | |||||||||||||
| Global Fixed Income Portfolio | |||||||||||||||||
| Assets: | |||||||||||||||||
| Corporate Bonds* | $ | — | $ | 1,913,166 | $ | — | $ | 1,913,166 | |||||||||
| Foreign Government Obligations* | — | 2,539,734 | — | 2,539,734 | |||||||||||||
| Quasi Government Bonds* | — | 70,958 | — | 70,958 | |||||||||||||
| Supranational Bonds | — | 616,302 | — | 616,302 | |||||||||||||
| US Municipal Bonds | — | 86,777 | — | 86,777 | |||||||||||||
| US Treasury Securities | — | 121,706 | — | 121,706 | |||||||||||||
| Short-Term Investments | 57,844 | — | — | 57,844 | |||||||||||||
| Other Financial Instruments† | |||||||||||||||||
| Forward Currency Contracts | — | 138,638 | — | 138,638 | |||||||||||||
| Total | $ | 57,844 | $ | 5,487,281 | $ | — | $ | 5,545,125 | |||||||||
| Liabilities: | |||||||||||||||||
| Other Financial Instruments† | |||||||||||||||||
| Forward Currency Contracts | $ | — | $ | (177,656 | ) | $ | — | $ | (177,656 | ) | |||||||
| US Corporate Income Portfolio | |||||||||||||||||
| Corporate Bonds* | $ | — | $ | 227,227,889 | $ | — | $ | 227,227,889 | |||||||||
| Exchange-Traded Funds | 20,604,265 | — | — | 20,604,265 | |||||||||||||
| Short-Term Investments | 10,663,019 | — | — | 10,663,019 | |||||||||||||
| Total | $ | 31,267,284 | $ | 227,227,889 | $ | — | $ | 258,495,173 | |||||||||
| US Short Duration Fixed Income Portfolio | |||||||||||||||||
| Asset-Backed Securities | $ | — | $ | 347,048 | $ | — | $ | 347,048 | |||||||||
| Corporate Bonds* | — | 8,158,238 | — | 8,158,238 | |||||||||||||
| US Treasury Securities | — | 59,799,345 | — | 59,799,345 | |||||||||||||
| Short-Term Investments | 280,363 | — | — | 280,363 | |||||||||||||
| Total | $ | 280,363 | $ | 68,304,631 | $ | — | $ | 68,584,994 | |||||||||
| * | Please refer to Portfolios of Investments and Notes to Portfolios of Investments for portfolio holdings by country and industry. |
| † | Other financial instruments are derivative instruments which are valued at their respective unrealized appreciation (depreciation). |
102 Semi-Annual Report
10. Derivative Instruments
Certain portfolios may use derivative instruments, including forward currency contracts.
Forward currency contracts may be used for hedging purposes or to seek to increase returns.
During the period ended June 30, 2022, the approximate average monthly notional exposure for derivative instruments was as follows:
| Derivative Instruments | Emerging Markets Debt Portfolio | Global Fixed Income Portfolio | ||||||
| Forward currency contracts: | ||||||||
| Average amounts purchased | $ | 4,300,000 | $ | 3,900,000 | ||||
| Average amounts sold | $ | 2,900,000 | $ | 3,400,000 | ||||
The following table summarizes the fair value of derivative instruments on the Statement of Assets and Liabilities as of June 30, 2022:
Emerging Markets Debt Portfolio
| Assets – Derivative Financial Instruments | Total | |||||
| Forward currency contracts | Unrealized appreciation on forward currency contracts | $ | 36,854 | |||
| Liabilities – Derivative Financial Instruments | Total | |||||
| Forward currency contracts | Unrealized depreciation on forward currency contracts | $ | 33,360 | |||
Global Fixed Income Portfolio
| Assets – Derivative Financial Instruments | Total | |||||
| Forward currency contracts | Unrealized appreciation on forward currency contracts | $ | 138,638 | |||
| Liabilities – Derivative Financial Instruments | Total | |||||
| Forward currency contracts | Unrealized depreciation on forward currency contracts | $ | 177,656 | |||
Semi-Annual Report 103
The effect of derivative instruments on the Statement of Operations for the period ended June 30, 2022 was:
Emerging Markets Debt Portfolio
| Net Realized Gain (Loss) from: | Total | |||||
| Forward currency contracts | $ | (117,104 | ) | |||
| Net Change in Unrealized Appreciation (Depreciation) on: | ||||||
| Forward currency contracts | $ | 27,413 | ||||
Global Fixed Income Portfolio
| Net Realized Gain (Loss) from: | Total | |||||
| Forward currency contracts | $ | (98,543 | ) | |||
| Net Change in Unrealized Appreciation (Depreciation) on: | Total | |||||
| Forward currency contracts | $ | (75,285 | ) | |||
As of June 30, 2022, the Emerging Markets Debt and Global Fixed Income Portfolios held derivative instruments that are eligible for offset in their Statements of Assets and Liabilities and are subject to master netting arrangements. A master netting arrangement is an agreement between two counterparties who have multiple contracts with each other that provides for the net settlement of all contracts, as well as any cash collateral, through a single payment in the event of default on, or termination of, any one contract.
104 Semi-Annual Report
The required information for the affected Portfolios is presented in the below table, as of June 30, 2022:
Emerging Markets Debt Portfolio
| Description | Gross Amounts of Recognized Assets | Gross Amounts Offset in the Statement of Assets and Liabilities | Net Amounts of Assets Presented in the Statement of Assets and Liabilities | |||||||||||||
| Forward Currency Contracts | $ | 36,854 | $ | — | $ | 36,854 | ||||||||||
| Amounts Not Offset in the Statement of Assets and Liabilities | ||||||||||||||||||
| Counterparty | Net Amounts of Assets Presented in the Statement of Assets and Liabilities | Financial Instruments | Collateral Received | Net Amounts of Derivative Assets | ||||||||||||||
| Bank of America NA | $ | 8,996 | $ | (8,996 | ) | $ | — | $ | — | |||||||||
| Barclays Bank PLC | 10,514 | (2,369 | ) | — | 8,145 | |||||||||||||
| HSBC Bank USA NA | 161 | — | — | 161 | ||||||||||||||
| Standard Chartered Bank | 8,235 | (8,235 | ) | — | — | |||||||||||||
| UBS AG | 8,948 | — | — | 8,948 | ||||||||||||||
| Total | $ | 36,854 | $ | (19,600 | ) | $ | — | $ | 17,254 | |||||||||
| Description | Gross Amounts of Recognized Liabilities | Gross Amounts Offset in the Statement of Assets and Liabilities | Net Amounts of Liabilities Presented in the Statement of Assets and Liabilities | |||||||||||||
| Forward Currency Contracts | $ | 33,360 | $ | — | $ | 33,360 | ||||||||||
| Amounts Not Offset in the Statement of Assets and Liabilities | ||||||||||||||||||
| Counterparty | Net Amounts of Liabilities Presented in the Statement of Assets and Liabilities | Financial Instruments | Collateral Pledged | Net Amounts of Derivative Liabilities | ||||||||||||||
| Bank of America NA | $ | 9,559 | $ | (8,996 | ) | $ | — | $ | 563 | |||||||||
| Barclays Bank PLC | 2,369 | (2,369 | ) | — | — | |||||||||||||
| Citibank NA | 12,462 | — | — | 12,462 | ||||||||||||||
| Standard Chartered Bank | 8,970 | (8,235 | ) | — | 735 | |||||||||||||
| Total | $ | 33,360 | $ | (19,600 | ) | $ | — | $ | 13,760 | |||||||||
Semi-Annual Report 105
Global Fixed Income Portfolio
| Description | Gross Amounts of Recognized Assets | Gross Amounts Offset in the Statement of Assets and Liabilities | Net Amounts of Assets Presented in the Statement of Assets and Liabilities | |||||||||||||
| Forward Currency Contracts | $ | 138,638 | $ | — | $ | 138,638 | ||||||||||
| Amounts Not Offset in the Statement of Assets and Liabilities | ||||||||||||||||||
| Counterparty | Net Amounts of Assets Presented in the Statement of Assets and Liabilities | Financial Instruments | Collateral Received | Net Amounts of Derivative Assets | ||||||||||||||
| Citibank NA | $ | 31,430 | $ | (31,430 | ) | $ | — | $ | — | |||||||||
| HSBC Bank USA NA | 46,085 | (46,085 | ) | — | — | |||||||||||||
| JPMorgan Chase Bank NA | 56,076 | (29,735 | ) | — | 26,341 | |||||||||||||
| Morgan Stanley & Co. | 5,047 | (376 | ) | — | 4,671 | |||||||||||||
| Total | $ | 138,638 | $ | (107,626 | ) | $ | — | $ | 31,012 | |||||||||
| Description | Gross Amounts of Recognized Liabilities | Gross Amounts Offset in the Statement of Assets and Liabilities | Net Amounts of Liabilities Presented in the Statement of Assets and Liabilities | |||||||||||||
| Forward Currency Contracts | $ | 177,656 | $ | — | $ | 177,656 | ||||||||||
| Amounts Not Offset in the Statement of Assets and Liabilities | ||||||||||||||||||
| Counterparty | Net Amounts of Liabilities Presented in the Statement of Assets and Liabilities | Financial Instruments | Collateral Pledged | Net Amounts of Derivative Liabilities | ||||||||||||||
| Citibank NA | $ | 32,885 | $ | (31,430 | ) | $ | — | $ | 1,455 | |||||||||
| HSBC Bank USA NA | 114,660 | (46,085 | ) | — | 68,575 | |||||||||||||
| JPMorgan Chase Bank NA | 29,735 | (29,735 | ) | — | — | |||||||||||||
| Morgan Stanley & Co. | 376 | (376 | ) | — | — | |||||||||||||
| Total | $ | 177,656 | $ | (107,626 | ) | $ | — | $ | 70,030 | |||||||||
106 Semi-Annual Report
11. Accounting Pronouncements
On March 12, 2020, the Financial Accounting Standards Board concluded its reference rate reform project with the issuance of Accounting Standards Update No. 2020-04, Reference Rate Reform (Topic 848) - Facilitation of the Effects of Reference Rate Reform on Financial Reporting (“ASU No. 2020-04”). ASU No. 2020-04 provides elective temporary financial reporting relief from the effect of certain types of contract modifications due to the planned discontinuation of the London Interbank Offered Rate (LIBOR) and other interbank offered reference rates as of the end of 2021. ASU No. 2020-04 was initially intended to be effective for certain reference rate-related contract modifications that have occurred since March 12, 2020 and that will continue to occur, through December 31, 2022, but FASB has voted to extend the grace period for complete adoption of ASU No. 2020-04 to December 31, 2024, after the UK Financial Conduct Authority delayed the intended cessation date of certain tenors of USD LIBOR to June 30, 2023. Management has adopted ASU No. 2020-04.
12. Subsequent Events
Management has evaluated subsequent events potentially affecting the Portfolios through the issuance of the financial statements and has determined that there were no subsequent events that required adjustment or disclosure.
Semi-Annual Report 107
The Lazard Funds, Inc. Other Information (unaudited)
Tax Information
Year Ended December 31, 2021
The following tax information represents year end disclosures of the tax benefits passed through to shareholders for 2021:
Of the dividends paid by the Portfolios, none are qualified dividend income.
Of the dividends paid by the Portfolios, no dividends qualify for the dividends received deduction available to corporate shareholders.
The Portfolios intend to pass through to shareholders foreign source income and foreign taxes paid, or up to the maximum amount allowable, as a foreign tax credit.
Pursuant to Section 871 of the Code, the Portfolios have no designated qualified short-term gains for purposes of exempting withholding of tax on such distributions to US nonresident shareholders.
Proxy Voting
A description of the policies and procedures used to determine how proxies relating to Fund portfolio securities are voted is available (1) without charge, upon request, by calling (800) 823-6300 or (2) on the Securities and Exchange Commission (the “SEC”) website at https://www.sec.gov.
The Fund’s proxy voting record for the most recent 12-month period ended June 30 is available (1) without charge, upon request, by calling (800) 823-6300 or (2) on the SEC’s website at https://www.sec.gov. Information as of June 30 each year will generally be available by the following August 31.
Schedule of Portfolio Holdings
The Fund files the complete schedule of each portfolio holdings with the SEC for the first and third quarters of each fiscal year as an exhibit to its reports on Form N-PORT. The Fund’s Form N-PORT reports are available on the SEC’s website at https://www.sec.gov.
108 Semi-Annual Report
Board Consideration of Management Agreement
At meetings of the Board held on June 1, 2022 and June 28, 2022, the Board considered the approval, for an additional annual period, of the Management Agreement between the Fund, on behalf of each of the Portfolios, and the Investment Manager. The Independent Directors were assisted in their review by independent legal counsel, who advised the Board on relevant legal standards and met with the Independent Directors in executive sessions separate from representatives of the Investment Manager.
Representatives of the Investment Manager discussed with the Board the Investment Manager’s written materials provided in advance of the meetings, including, at the June 28, 2022 meeting, additional information requested by the Independent Directors at the June 1, 2022 meeting.
Services Provided
The Investment Manager’s materials addressed, among other matters, the nature, extent and quality of services that the Investment Manager provides the Fund, including a discussion of the Investment Manager and its clients. As of March 31, 2022, the Lazard Funds complex of 35 active funds comprised approximately $23 billion of the approximately $253 billion of total assets under the management of the Investment Manager and its global affiliates.
The Board considered the various services provided by the Investment Manager including the Investment Manager’s research, portfolio management and trading capabilities and oversight of day-to-day operations, including supervision of fund accounting and administration-related services and assistance in meeting legal and regulatory requirements, as well as regular reporting to, and support of, the Board. The Investment Manager’s representatives stated that the Investment Manager believes that the Fund and its shareholders continue to be able to obtain significant benefits as a result of the resources and support of the Investment Manager’s global research, portfolio management, trading, operations, risk management, technology and legal and compliance infrastructure. The Board also considered information provided by the Investment Manager regarding its resources relevant to providing services pursuant to the Management Agreement; the qual-
Semi-Annual Report 109
ifications, experience and other information regarding senior management and key professional personnel responsible for providing services to the Portfolios; trends in recent years in the number of personnel involved in providing services to the Portfolios and the adequacy of the Investment Manager’s staffing to provide services pursuant to the Management Agreement; the Fund’s distribution channels and the relationships with various intermediaries; marketing and shareholder servicing activities on behalf of the Portfolios; Portfolio asset flows and the growth or decline in asset levels; and the Investment Manager’s financial condition. The Board accepted the assertion of representatives of the Investment Manager that the Fund benefits from the services and infrastructure provided by the Investment Manager and that such services and infrastructure are greater than those typically provided to a $23 billion fund complex not managed by a large, global firm such as the Investment Manager.
Comparative Fee, Expense Ratio and Performance Information
Strategic Insight Advisory Fee and Expense Ratio Comparisons. The Board reviewed, for each Portfolio, information prepared by Strategic Insight, an independent provider of investment company data, including, among other information, each Portfolio’s contractual advisory fee (i.e., without giving effect to any fee waivers) and net expense ratio (i.e., after giving effect to the Portfolio’s expense limitation agreed to by the Investment Manager) to those of:
| ● | a group of funds not advised by the Investment Manager that were selected by Strategic Insight as comparable to the Portfolio, for expense comparison purposes, based on Strategic Insight’s methodology (the “Expense Peer Group”); and |
| ● | the funds within the broad category of funds to which the Portfolio has been assigned by Morningstar, Inc., an independent third party service that ranks and rates funds (“Morningstar”), with certain exclusions as specified by Strategic Insight (the “Expense Category”). |
Representatives of the Investment Manager discussed the results of the Strategic Insight advisory fee and net expense ratio compar-
110 Semi-Annual Report
isons with the Board, which showed that the advisory fees and net expense ratios of the Portfolios were competitive within each Portfolio’s respective Expense Peer Group. The Board considered the comparisons, additional perspectives in information prepared by, and in discussions with, representatives of the Investment Manager and that the Investment Manager continues to voluntarily enter into expense limitation agreements for all of the Portfolios, pursuant to which the Investment Manager was currently waiving advisory fees and/or reimbursing expenses. The Board also received a description of Strategic Insight’s methodology for its construction of Expense Peer Groups and a summary of how the methodology was applied.
Other Accounts Advisory Fee Comparisons. The Board also considered the actual advisory fees paid to the Investment Manager by other accounts of the Investment Manager that are comparable to each Portfolio in terms of investment objectives, strategies and policies, if any (including other investment companies and other pooled investment vehicles, “Other Accounts”). Representatives of the Investment Manager discussed the nature of the Other Accounts and the significant differences in services provided by the Investment Manager to the different types of Other Accounts as compared to the services provided to the Portfolios. The Board considered the relevance of the fee information provided for Other Accounts, in light of the Investment Manager’s discussion of the significant differences in services provided, to evaluate the advisory fees of the relevant Portfolios.
Strategic Insight Performance Comparisons. The Board reviewed, among other performance information provided to the Board on a quarterly basis, information prepared by Strategic Insight including, among other information, each Portfolio’s performance for the one-, three-, five- and ten-year periods ended March 31, 2022, as applicable, compared to performance for the same time periods to that of:
| ● | a group of funds not advised by the Investment Manager that were selected by Strategic Insight as comparable to the Portfolio, for performance comparison purposes, based on Strategic Insight’s methodology (the “Performance Peer Group”); |
Semi-Annual Report 111
| ● | the funds within the broad category of funds to which the Portfolio has been assigned by Morningstar (the “Performance Category”); and |
| ● | the Portfolio’s benchmark index. |
The Board also received a description of Strategic Insight’s methodology for its construction of Performance Peer Groups and a summary of how the methodology was applied, including, for certain Portfolios, deviations from Strategic Insights’ stated methodology and the reasons therefor.
When evaluating the performance of each Portfolio, the Board considered Strategic Insight’s performance analysis along with other information provided by the Investment Manager, including additional information regarding performance expectations, as well as additional perspectives in information prepared by, and in discussions with, representatives of the Investment Manager. The Board also received and would continue to receive regular updates and/or additional information from the Investment Manager in respect of the Portfolios’ relative underperformance in light of the Investment Manager’s performance expectations.
Investment Manager Profitability and Economies of Scale
The Board reviewed information prepared by the Investment Manager for each Portfolio concerning the estimated profitability percentage of the Management Agreement to the Investment Manager and its affiliates for the calendar year ended December 31, 2021 and the Investment Manager’s cost allocation methodology to compute an estimate of each Portfolio’s costs to the Investment Manager. The Investment Manager’s representatives stated that neither the Investment Manager nor its affiliates receive any significant benefits from the Investment Manager acting as investment manager to the Portfolios. The representatives of the Investment Manager reminded the Board that the Investment Manager is continuing to support distribution relationships through direct payments from its or its affiliates’ own resources to third parties in connection with distribution and shareholder servicing and/or administrative and recordkeeping services, and noted
112 Semi-Annual Report
that the Fund does not bear any related costs other than the 0.25% 12b-1 fee pursuant to the Distribution and Servicing Plan adopted for the Portfolios’ Open Shares.
The profitability percentages were below ranges determined by relevant court cases not to be so disproportionately large that they bore no reasonable relationship to the services rendered. The Board (1) considered the Investment Manager’s estimated profitability percentage with respect to each Portfolio as part of their evaluation of the Portfolio’s fee under the Management Agreement, considered in relation to the mix of services provided by the Investment Manager (including the nature, extent and quality of such services), and (2) evaluated the profitability percentage in light of the relevant circumstances for each Portfolio. Representatives of the Investment Manager and the Board discussed ways economies of scale could be realized and how they could be shared, including the Investment Manager’s reinvestment of profits back into its business, waiving or reducing Portfolio management fees and/or reimbursing expenses, adding discounts to a Portfolio’s management fee schedule as a Portfolio’s assets increase or by instituting management fees at inception that account for future scale. As the assets of each Portfolio as of the most recently completed calendar year had either decreased (or not increased significantly) from the Portfolio’s assets as of the end of the previous calendar year and/or had not reached a significant size, the potential that the Investment Manager may have realized any material economies of scale was reduced.
Conclusions and Determinations
At the conclusion of these discussions, the Board expressed the opinion that it had been furnished with such information as may reasonably be necessary to make an informed business decision with respect to evaluation of the renewal of the Management Agreement. Based on its discussions and considerations as described above, with the assistance of independent legal counsel and in the exercise of its business judgment, the Board made the following conclusions and determinations.
Semi-Annual Report 113
| ● | The Board concluded that the nature, extent and quality of the services provided by the Investment Manager are adequate and appropriate, noting the benefits of the significant services and infrastructure associated with an approximately $253 billion global asset management business. |
| ● | The Board concluded that each Portfolio’s fee paid to the Investment Manager was appropriate under the circumstances and in light of the factors and the totality of the services provided. |
| ● | The Board, after considering the information provided and the totality of the relevant circumstances for each Portfolio, concluded that the investment performance of each Portfolio was acceptable or that, for any Portfolios that were not performing in accordance with expectations, the Board accepted that the Investment Manager was taking steps intended to improve performance and the Board would continue to monitor performance. |
| ● | The Board recognized that economies of scale may be realized, particularly as the assets of the Portfolios increase, and determined that it would continue to consider potential material economies of scale. |
In evaluating the Management Agreement, the Board relied on the information described above, in addition to other information provided by the Investment Manager throughout the year relating to the operations of the Fund and the investment management and other services provided under the Management Agreement. Such other information included the investment performance of the Portfolios in comparison to similar mutual funds and benchmark performance indices over various time periods; the expected pattern of performance for the Portfolios in different market conditions; general market outlook as applicable to the Portfolios; and compliance reports. The Board also relied on its previous knowledge, gained through meetings and other interactions with the Investment Manager, of the Investment Manager and the services provided to the Fund by the Investment Manager. The Board considered these conclusions and determinations in their totality and determined to approve the Fund’s Management Agreement for each Portfolio. In deciding whether to vote to approve the Man-
114 Semi-Annual Report
agement Agreement for each Portfolio, each Director may have accorded different weights to different factors so that each Director may have had a different basis for his or her decision.
Statement Regarding Liquidity Risk Management Program
The Fund has adopted a liquidity risk management program (the “LRMP”) pursuant to the requirements of Rule 22e-4 under the 1940 Act, which requires registered open-end funds (other than money market funds) to adopt and implement a written liquidity risk management program that is reasonably designed to assess and manage liquidity risk. The rule is designed to promote effective liquidity risk management and reduce liquidity risk—i.e., the risk that a fund could not meet requests to redeem shares issued by the fund without significant dilution of remaining investors’ interests in the fund.
The Board approved the Investment Manager to administer the LRMP (the “Program Administrator”). As Program Administrator, the Investment Manager delegates the day-to-day activities required by the LRMP to a Valuation and Liquidity Committee comprised of various Fund officers and senior personnel of the Investment Manager. In addition, the Fund has contracted with a third party liquidity assessment vendor to support the classification of Portfolio investments.
Pursuant to the requirements of Rule 22e-4, the Board must review, no less frequently than annually, a written report prepared by the Program Administrator that, among other things, addresses the operation of the LRMP and assesses its adequacy and effectiveness of implementation and any material changes to the LRMP. The Board received a written report in June 2022 (the “Annual Report”).The Annual Report included, among other things, a statement that the Investment Manager, as the Program Administrator, acting primarily through the Valuation and Liquidity Committee, has reviewed the operation of the LRMP and believes that the LRMP is reasonably designed to assess and manage the Portfolios’ liquidity risk and is adequate and effective in its implementation. There were no material compliance matters relating to compliance with Rule 22e-4 identified in the Annual Report.
Semi-Annual Report 115
The Lazard Funds, Inc.
30 Rockefeller Plaza
New York, New York 10112-6300
Telephone: 800-823-6300
www.lazardassetmanagement.com
Investment Manager
Lazard Asset Management LLC
30 Rockefeller Plaza
New York, New York 10112-6300
Telephone: 800-823-6300
Distributor
Lazard Asset Management Securities LLC
30 Rockefeller Plaza
New York, New York 10112-6300
Custodian
State Street Bank and Trust Company
One Iron Street
Boston, Massachusetts 02210-1641
Transfer Agent and Dividend Disbursing Agent
DST Asset Manager Solutions, Inc.
2000 Crown Colony Drive
Quincy, Massachusetts 02169-0953
Telephone: 617-483-7000
Independent Registered Public Accounting Firm
Deloitte & Touche LLP
30 Rockefeller Plaza
New York, New York 10112-0015
Legal Counsel
Proskauer Rose LLP
Eleven Times Square
New York, New York 10036-8299
www.proskauer.com


| Lazard Asset Management LLC • 30 Rockefeller Plaza • New York, NY 10112 • www. lazardassetmanagement.com | ||
| Performance information as of the most recent month end is available online at www. lazardassetmanagement.com. |  | |
| LZDPS026 |
![]()
Lazard Funds
Semi-Annual Report
June 30, 2022
Multi-Asset Funds
Lazard Enhanced Opportunities Portfolio
Lazard Global Dynamic Multi-Asset Portfolio
Lazard Opportunistic Strategies Portfolio
Lazard Real Assets Portfolio
The Lazard Funds, Inc. Table of Contents
Please consider a Portfolio’s investment objective, risks, charges and expenses carefully before investing. For more complete information about The Lazard Funds, Inc. (the “Fund”), you may obtain a prospectus or the Portfolio’s summary prospectus by calling 800-823-6300, or online, at www.lazardassetmanagement.com. Read the prospectus or the Portfolio’s summary prospectus carefully before you invest. The prospectus and a Portfolio’s summary prospectus contain the investment objective, risks, charges, expenses and other information about the Portfolio, which are not detailed in this report.
Distributed by Lazard Asset Management Securities LLC.
Semi-Annual Report 1
The Lazard Funds, Inc. A Message from Lazard (unaudited)
Dear Shareholder:
The first six months of 2022 were a turbulent period for financial markets, as optimism about the global economic outlook, which remained resilient throughout 2021, gave way to growing anxiety about worsening inflationary pressure.
Events during the period conspired to create stiff macro headwinds for markets. The economic fallout from Russia’s invasion of Ukraine and the harsh retaliatory sanctions imposed by Western countries rippled across financial markets and the wider global economy because of Russia’s stature as one of the world’s largest producers of oil, natural gas, and other commodities. Energy prices rose sharply, and supply chains bottlenecks worsened due to shortages of Russian industrial metals. Supply chains were further snarled when the Chinese government imposed harsh lockdowns on some of China’s most important cities, including those that serve as global manufacturing hubs, in an attempt to stamp out a rapidly spreading coronavirus outbreak.
With inflation reaching levels not seen in decades, the global monetary landscape shifted dramatically in the period, as policymakers sought to rein in soaring prices by pulling back from the ultra-low interest-rate-policies they implemented to contain the economic fallout from the coronavirus pandemic. In all, central banks from at least 45 countries raised interest rates in the first six months of 2022. At the same time, investors grew nervous that interest rates hikes, especially from major central banks, would tip the fragile global economy into a recession. In the US, the Federal Reserve (the “Fed”) adopted an increasingly aggressive posture during the period, raising its benchmark short-term interest rate by 25 basis points (bps), 50 bps, and 75 bps in March, May, and June, respectively, with more hikes likely, as domestic inflation reached a 40-year high. The Fed also began reducing its $9 trillion balance sheet of Treasury and mortgage bonds in June, which further tightened financial conditions. Across the Atlantic, the European Central Bank stated that it was prepared to raise interest rates in July for the first time in over a decade amid soaring inflation in the euro zone. Elsewhere in Europe, the Bank of England increased its benchmark interest rate four times in the six-month period, as inflation in the UK reached a level not seen since 1982.
2 Semi-Annual Report
Against this backdrop, global equity markets, as measured by the MSCI All Country World Index, fell 20.2% in the period, as stock investors fretted about the impact soaring inflation would have on corporate earnings. Notably, the S&P 500 Index recorded its worst first-half performance since 1970. The Fed’s aggressive rate-hike campaign also drove up the yields of risk-free US Treasury bonds, which undercut the appeal of stocks.
Meanwhile, global bond markets also came under pressure as many central banks transitioned from ultra-accommodative monetary policies to tighter regimes to tame increasing inflationary pressures. Sovereign rates rose amid the faster-than-expected acceleration of central bank interest rate hikes and, in the case of the Fed, balance sheet shrinking. Although credit spreads initially did well in the first quarter of the year, the second quarter saw both investment grade and high yield spreads generally widen compared to historical levels. Consequently, many bond markets around the world suffered losses, with many indices posting outsized year-to-date negative returns through mid-year. Notable among this group of indices was the Bloomberg Global Aggregate Bond Index, which fell 13.9% in the period. Underscoring the high level of risk aversion in the markets, the US dollar continued to strengthen, asserting itself as the safe-haven global currency and further supported by a hawkish central bank determined to regain its inflation fighting credibility.
The challenging market conditions in 2022 are a reminder of the importance of active portfolio management. Turbulent markets are likely to differentiate winners from losers. We remain confident that fundamental analysis and security selection will be crucial drivers of performance going forward. We are privileged that you have turned to Lazard for your investment needs and value your continued confidence in our investment management capabilities.
Sincerely,
Lazard Asset Management LLC
Semi-Annual Report 3
The Lazard Funds, Inc. Performance Overviews (unaudited)
Please see the “Notes to the Performance Overviews” for important information about the calculation of total returns, performance information generally, performance differences between Institutional Shares and Open Shares, and the indexes shown below.
Lazard Enhanced Opportunities Portfolio
Comparison of Changes in Value of $10,000 Investment in the Institutional Shares of Lazard Enhanced Opportunities Portfolio, the ICE BofAML U.S. Convertible ex Mandatory® Index and the HFRX Global Hedge Fund® Index*
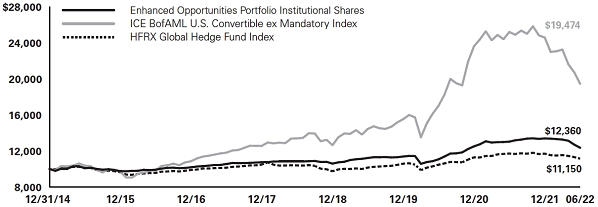
| Average Annual Total Returns | ||||||||||||
| Periods Ended June 30, 2022 | ||||||||||||
| One Year | Five Year | Since Inception | † | |||||||||
| Institutional Shares | –5.15% | 3.21% | 2.87% | |||||||||
| Open Shares | –5.38% | 2.98% | 2.61% | |||||||||
| ICE BofAML U.S. Convertible ex Mandatory Index | –22.73% | 10.51% | 9.29% | |||||||||
| HFRX Global Hedge Fund Index | –5.12% | 1.94% | 1.46% | |||||||||
| † | The inception date for the Portfolio was December 31, 2014. |
4 Semi-Annual Report
Lazard Global Dynamic Multi-Asset Portfolio
Comparison of Changes in Value of $10,000 Investment in the Institutional Shares of Lazard Global Dynamic Multi-Asset Portfolio, the MSCI® World Index and GDMA Index
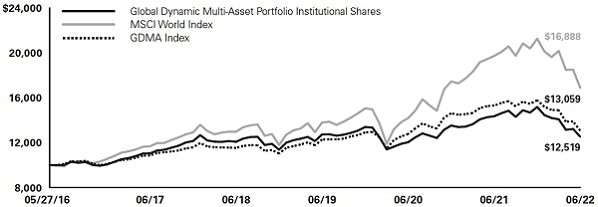
Average Annual Total Returns
Periods Ended June 30, 2022
| One Year | Five Year | Since Inception | † | |||||||||
| Institutional Shares | –12.72% | 2.55% | 3.75% | |||||||||
| Open Shares | –12.92% | 2.28% | 3.47% | |||||||||
| MSCI World Index | –14.34% | 7.67% | 8.99% | |||||||||
| GDMA Index | –14.62% | 3.77% | 4.48% |
| † | The inception date for the Portfolio was May 27, 2016. |
Lazard Opportunistic Strategies Portfolio
Comparison of Changes in Value of $10,000 Investment in the Institutional Shares of Lazard Opportunistic Strategies Portfolio, MSCI World Index and Global Asset Allocation Blended Index
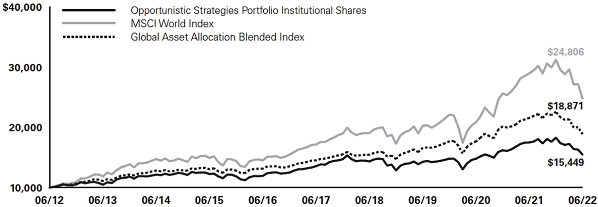
Average Annual Total Returns
Periods Ended June 30, 2022
| One Year | Five Year | Ten Year | ||||||||||
| Institutional Shares | –11.61% | 2.65% | 4.45% | |||||||||
| Open Shares | –11.90% | 2.37% | 4.11% | |||||||||
| MSCI World Index | –14.34% | 7.67% | 9.51% | |||||||||
| Global Asset Allocation Blended Index | –12.51% | 5.39% | 6.56% |
Semi-Annual Report 5
Lazard Real Assets Portfolio
Comparison of Changes in Value of $10,000 Investment in the Institutional Shares of Lazard Real Assets Portfolio, MSCI World Index and Real Assets Index, Real Assets Custom Index and Real Assets Linked Custom Index
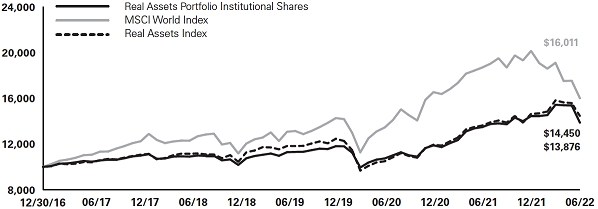
Average Annual Total Returns
Periods Ended June 30, 2022
| One Year | Five Year | Since Inception | † | |||||||||
| Institutional Shares | 3.07% | 5.83% | 6.13% | |||||||||
| Open Shares | 2.72% | 5.56% | 5.83% | |||||||||
| MSCI World Index | –14.34% | 7.67% | 8.94% (Institutional Shares) 8.68% (Open Shares)) | |||||||||
| Real Assets Index | 5.19% | 6.80% | 6.92% (Institutional Shares) 6.91% (Open Shares) |
| † | The inception date for the Institutional Shares was December 30, 2016 and for the Open Shares was January 9, 2017. |
Notes to Performance Overviews:
Information About Portfolio Performance Shown Above
Total returns reflect reinvestment of all dividends and distributions, if any. Certain expenses of the Portfolio may have been waived or reimbursed by Lazard Asset Management LLC, the Fund’s investment manager (the “Investment Manager”), State Street Bank and Trust Company, the Fund’s administrator (“State Street”), or DST Asset Manager Solutions, Inc., the Fund’s transfer agent and dividend disbursing agent (“DST”); without such waiver/reimbursement of expenses, the Portfolio’s returns would have been lower.
6 Semi-Annual Report
Performance results do not include adjustments made for financial reporting purposes in accordance with US Generally Accepted Accounting Principles (“GAAP”), if any, and may differ from amounts reported in the financial highlights. For the Lazard Enhanced Opportunity Portfolio, a voluntary reimbursement by State Street increased the total return ratio by 0.11%, for year ended December 31, 2021 and 0.49% for year ended December 31, 2017.
The performance quoted represents past performance. Current performance may be lower or higher than the performance quoted. Past performance is not indicative, or a guarantee, of future results; the investment return and principal value of an investment in a Portfolio will fluctuate, so that Portfolio shares, when redeemed, may be worth more or less than their original cost. Within the longer periods illustrated, there may have been short-term fluctuations, counter to the overall trend of investment results, and no single period of any length may be taken as typical of what may be expected in future periods. The graphs and tables above do not reflect the deduction of taxes that a shareholder would pay on a Portfolio’s distributions or the redemption of Portfolio shares.
The performance of Institutional Shares, Open Shares and R6 Shares, as applicable, may vary, primarily based on the differences in fees borne by shareholders investing in different classes of a Portfolio.
Information About Portfolio Performance Shown Above
The performance data of the indices have been prepared from sources and data that the Investment Manager believes to be reliable, but no representation is made as to their accuracy. The indices are unmanaged, have no fees or costs and are not available for investment.
The MSCI World Index is a free-float-adjusted market capitalization index that is designed to measure global developed markets equity performance. The MSCI World Index consists of 23 developed markets country indices.
The GDMA Index is a blended index constructed by the Investment Manager that is comprised of 50% MSCI World Index and 50% Bloomberg Global Aggregate® Index and is rebalanced monthly. The Bloomberg Global Aggregate Index provides a broad-based measure of global investment-grade fixed-income debt markets, including government-related debt, corporate debt, securitized debt and sovereign debt.
The Global Asset Allocation Blended Index is a blended index constructed by the Investment Manager that is comprised of 60% MSCI World Index and 40% Bloomberg Barclays US Aggregate Index and is rebalanced quarterly. The Bloomberg Barclays US Aggregate Index covers the investment-grade, US dollar-denominated, fixed-rate taxable bond market, including US Treasuries, government-related and corporate securities, mortgage-backed securities, asset-backed securities, and commercial mortgage-backed securities, with maturities of no less than one year.
The Real Assets Index is an index constructed by the Investment Manager that is comprised of 33.3% MSCI World Core Infrastructure USD Hedged Index, 33.3% MSCI ACWI IMI Core Real Estate Index, and 33.3% Bloomberg Barclays Commodity Total Return Index. The Real Assets Index was constructed by the Investment Manager for comparison to the performance of the Lazard Real Assets Portfolio pursuant to its investment strategy effective September 1, 2020. The Real Assets Index will replace the Real Assets Custom Index, which was created by the Investment Manager for comparison to the Portfolio’s performance pursuant to its investment strategy prior to September 1, 2020.
Semi-Annual Report 7
The Infrastructure Index captures large and mid-cap securities across the 23 developed market countries of the MSCI World Index and is designed to represent the performance of listed companies within the developed markets that are engaged in core industrial infrastructure activities. Note that the Investment Manager invests in a range of companies globally, not specifically developed markets countries. The MSCI ACWI IMI Core Real Estate Index is a free float-adjusted market capitalization index that consists of large, mid and small-cap stocks across 23 developed markets and 24 emerging markets countries engaged in the ownership, development and management of specific core property type real estate. The index excludes companies, such as real estate services and real estate financing companies, that do not own properties. The Bloomberg Commodity Total Return index is composed of futures contracts and reflects the returns on a fully collateralized investment in the Bloomberg Commodity Indices (the “BCOM”). This combines the returns of the BCOM with the returns on cash collateral invested in 13 week (3 Month) U.S. Treasury Bills. The Bloomberg Barclays World Government Inflation-Linked Bond 1–10 Year Index measures the performance of investment grade, government inflation-linked debt from 12 different developed market countries.
The ICE BofAML U.S. Convertible ex Mandatory Index measures the performance of convertible securities of all corporate sectors with a par amount of $25 million or more and a maturity of at least one year and excludes preferred equity redemption stocks and converted securities.
The HFRX Global Hedge Fund Index is designed to be representative of the overall composition of the hedge fund universe. It is comprised of all eligible hedge fund strategies, including but not limited to convertible arbitrage, distressed securities, equity hedge, equity market neutral, event-driven, macro, merger arbitrage, and relative value arbitrage. The strategies are asset weighted based on the distribution of assets in the hedge fund industry.
8 Semi-Annual Report
The Lazard Funds, Inc.
Information About Your Portfolio’s Expenses (unaudited)
Expense Example
As a shareholder in a Portfolio, you incur ongoing costs, including management fees, distribution and service (12b-1) fees (Open Shares only), and other expenses. This Example is intended to help you understand your ongoing costs (in dollars) of investing in a Portfolio and to compare these costs with the ongoing costs of investing in other mutual funds. The Example is based on an investment of $1,000 invested at the beginning of the six month period from January 1, 2022 through June 30, 2022 and held for the entire period.
Actual Expenses
For each share class of the Portfolios, the first line of the accompanying table provides information about actual account values and actual expenses. You may use the information in this line, together with the amount you invested, to estimate the expenses that you paid over the period. Simply divide your account value by $1,000 (for example, an $8,600 account value divided by $1,000=8.6), then multiply the result by the number in the first line under the heading entitled “Expenses Paid During Period” to estimate the expenses you paid on your account during this period.
Hypothetical Example for Comparison Purposes
For each share class of the Portfolios, the second line of the accompanying table provides information about hypothetical account values and hypothetical expenses based on the class’ actual expense ratio and an assumed rate of return of 5% per year before expenses, which is not the Portfolio’s actual return. The hypothetical account values and expenses may not be used to estimate the actual ending account balance or expenses you paid for the period. You may use this information to compare the ongoing costs of investing in the Portfolio and other mutual funds. To do so, compare this 5% hypothetical example with the 5% hypothetical examples that appear in the shareholder reports of other mutual funds.
Semi-Annual Report 9
| Portfolio | Beginning Account Value 1/1/22 | Ending Account Value 6/30/22 | Expenses Paid During Period 1/1/22 - 6/30/22 | *
| Annualized Expense Ratio During Period 1/1/22 - 6/30/22 | |||||||||||
| Enhanced Opportunities | ||||||||||||||||
| Institutional Shares | ||||||||||||||||
| Actual | $1,000.00 | $ 924.10 | $ 9.40 | 1.97% | ||||||||||||
| Hypothetical (5% Return Before Expenses) | $1,000.00 | $1,015.03 | $ 9.84 | 1.97% | ||||||||||||
| Open Shares | ||||||||||||||||
| Actual | $1,000.00 | $ 922.10 | $10.82 | 2.27% | ||||||||||||
| Hypothetical (5% Return Before Expenses) | $1,000.00 | $1,013.54 | $11.33 | 2.27% | ||||||||||||
| Global Dynamic Multi-Asset | ||||||||||||||||
| Institutional Shares | ||||||||||||||||
| Actual | $1,000.00 | $ 825.60 | $ 4.07 | 0.90% | ||||||||||||
| Hypothetical (5% Return Before Expenses) | $1,000.00 | $1,020.33 | $ 4.51 | 0.90% | ||||||||||||
| Open Shares | ||||||||||||||||
| Actual | $1,000.00 | $ 825.00 | $ 5.20 | 1.15% | ||||||||||||
| Hypothetical (5% Return Before Expenses) | $1,000.00 | $1,019.09 | $ 5.76 | 1.15% | ||||||||||||
| Opportunistic Strategies | ||||||||||||||||
| Institutional Shares | ||||||||||||||||
| Actual | $1,000.00 | $ 845.40 | $ 4.76 | 1.04% | ||||||||||||
| Hypothetical (5% Return Before Expenses) | $1,000.00 | $1,019.64 | $ 5.21 | 1.04% | ||||||||||||
| Open Shares | ||||||||||||||||
| Actual | $1,000.00 | $ 844.50 | $ 5.90 | 1.29% | ||||||||||||
| Hypothetical (5% Return Before Expenses) | $1,000.00 | $1,018.40 | $ 6.46 | 1.29% | ||||||||||||
| Real Assets | ||||||||||||||||
| Institutional Shares | ||||||||||||||||
| Actual | $1,000.00 | $ 961.70 | $ 3.89 | 0.80% | ||||||||||||
| Hypothetical (5% Return Before Expenses) | $1,000.00 | $1,020.83 | $ 4.01 | 0.80% | ||||||||||||
| Open Shares | ||||||||||||||||
| Actual | $1,000.00 | $ 960.60 | $ 5.10 | 1.05% | ||||||||||||
| Hypothetical (5% Return Before Expenses) | $1,000.00 | $1,019.59 | $ 5.26 | 1.05% | ||||||||||||
| * | Expenses are equal to the annualized expense ratio, net of expenses waivers and reimbursements, of each share class multiplied by the average account value over the period, multiplied by 181/365 (to reflect one-half year period). |
10 Semi-Annual Report
The Lazard Funds, Inc. Portfolio Holdings
Presented by Sector and Region June 30, 2022 (unaudited)
| Lazard Enhanced Opportunities Portfolio | ||||||||||
| Asset Class/Sector | Long | ^ | Short | † | ||||||
| Convertible Corporate Bonds | ||||||||||
| Communication Services | 11.4 | % | — | % | ||||||
| Consumer Discretionary | 10.7 | — | ||||||||
| Consumer Staples | 3.4 | — | ||||||||
| Energy | 2.5 | — | ||||||||
| Financials | 12.6 | — | ||||||||
| Health Care | 15.9 | — | ||||||||
| Industrials | 7.1 | — | ||||||||
| Information Technology | 12.9 | — | ||||||||
| Materials | 5.1 | — | ||||||||
| Real Estate | 2.7 | — | ||||||||
| Equity | ||||||||||
| Communication Services | 0.1 | –4.7 | ||||||||
| Consumer Discretionary | 0.0 | # | –5.7 | |||||||
| Consumer Staples | — | –2.4 | ||||||||
| Energy | — | –3.0 | ||||||||
| Financials | 0.4 | –2.6 | ||||||||
| Health Care | 0.1 | –19.4 | ||||||||
| Industrials | 0.0 | # | –12.1 | |||||||
| Information Technology | 0.1 | –11.7 | ||||||||
| Materials | 0.0 | # | –7.3 | |||||||
| Real Estate | — | –1.7 | ||||||||
| Exchange Traded Funds | — | –13.8 | ||||||||
| Purchased Option | 0.1 | — | ||||||||
| US Treasury Securities | — | –15.6 | ||||||||
| Short-Term Investments | 14.9 | — | ||||||||
| Total Investments | 100.0 | % | –100.0 | % | ||||||
| ^ | Represents percentage of total investments excluding securities sold short. |
| † | Represents percentage of total securities sold short. |
| # | Amount is less than 0.05%. |
Semi-Annual Report 11
| Asset Class/Sector* | Lazard Global Dynamic Multi-Asset Portfolio | ** | Lazard Opportunistic Strategies Portfolio | ** | Lazard Real Assets Portfolio | ||||||||
| Equity | |||||||||||||
| Communication Services | 4.8 | % | 2.2 | % | 0.1 | % | |||||||
| Consumer Discretionary | 7.1 | 3.7 | 0.8 | ||||||||||
| Consumer Staples | 5.7 | 11.5 | — | ||||||||||
| Energy | 1.6 | 1.7 | 4.9 | ||||||||||
| Financials | 12.5 | 5.3 | — | ||||||||||
| Health Care | 7.8 | 14.2 | — | ||||||||||
| Industrials | 7.9 | 4.8 | 7.9 | ||||||||||
| Information Technology | 10.1 | 13.0 | — | ||||||||||
| Materials | 1.7 | 1.6 | 0.8 | ||||||||||
| Real Estate | 2.1 | 1.1 | 32.5 | ||||||||||
| Utilities | 2.1 | 4.3 | 13.9 | ||||||||||
| Commodity | — | 9.0 | — | ||||||||||
| Exchange Traded Funds | — | — | 5.4 | ||||||||||
| Fixed Income | — | 12.1 | — | ||||||||||
| Foreign Government Obligations | 23.0 | — | — | ||||||||||
| Sovereign Debt | 6.1 | — | — | ||||||||||
| Specialty | — | 3.7 | — | ||||||||||
| US Municipal Bonds | 1.1 | — | — | ||||||||||
| US Treasury Securities | 1.8 | — | — | ||||||||||
| Short-Term Investments | 4.6 | 11.8 | 33.7 | ||||||||||
| Total Investments | 100.0 | % | 100.0 | % | 100.0 | % | |||||||
| * | Represents percentage of total investments. |
| ** | Equity sector breakdown is based upon the underlying holdings of exchange- traded funds held by the Portfolio. |
12 Semi-Annual Report
The Lazard Funds, Inc. Portfolios of Investments
June 30, 2022 (unaudited)
| Principal | ||||||||||
| Security | Amount | Fair | ||||||||
| Description | Currency | (000) | Value | |||||||
| Convertible Corporate Bonds | 125.8% | ||||||||||
| Australia | 0.1% | ||||||||||
| Zip Co., Ltd., 0.000%, 04/23/28 (±) | AUD | 300 | $ | 67,299 | ||||||
The accompanying notes are an integral part of these financial statements.
Semi-Annual Report 13
| Principal | ||||||||||
| Security | Amount | Fair | ||||||||
| Description | Currency | (000) | Value | |||||||
| Lazard Enhanced Opportunities Portfolio (continued) | ||||||||||
| Austria | 0.7% | ||||||||||
| ams-OSRAM AG, 2.125%, 11/03/27 (±) | EUR | 500 | $ | 382,701 | ||||||
| Brazil | 1.0% | ||||||||||
| GOL Equity Finance SA, 3.750%, 07/15/24 (#), (±) | USD | 705 | 521,175 | |||||||
| Canada | 2.6% | ||||||||||
| Aurora Cannabis, Inc., 5.500%, 02/28/24 (±) | USD | 221 | 201,110 | |||||||
| Dye & Durham, Ltd., 3.750%, 03/01/26 | CAD | 636 | 405,158 | |||||||
| Ivanhoe Mines, Ltd., 2.500%, 04/15/26 (±) | USD | 293 | 302,523 | |||||||
| Lithium Americas Corp., 1.750%, 01/15/27 (±) | USD | 236 | 196,706 | |||||||
| Osisko Gold Royalties, Ltd., 4.000%, 12/31/22 | CAD | 385 | 299,024 | |||||||
| 1,404,521 | ||||||||||
| China | 2.5% | ||||||||||
| NIO Inc., 0.000%, 02/01/26 (±) | USD | 644 | 543,858 | |||||||
| Li Auto, Inc., 0.250%, 05/01/28 (±) | USD | 527 | 787,736 | |||||||
| 1,331,594 | ||||||||||
| Hong Kong | 0.5% | ||||||||||
| Cathay Pacific Finance III, Ltd., 2.750%, 02/05/26 (±) | HKD | 2,000 | 276,355 | |||||||
| Netherlands | 0.5% | ||||||||||
| Pharming Group NV, 3.000%, 01/21/25 (±) | EUR | 300 | 274,760 | |||||||
| Panama | 1.2% | ||||||||||
| Copa Holdings SA, 4.500%, 04/15/25 (±) | USD | 449 | 639,151 | |||||||
The accompanying notes are an integral part of these financial statements.
14 Semi-Annual Report
| Principal | ||||||||||
| Security | Amount | Fair | ||||||||
| Description | Currency | (000) | Value | |||||||
| Lazard Enhanced Opportunities Portfolio (continued) | ||||||||||
| Singapore | 1.0% | ||||||||||
| Sea, Ltd., 0.250%, 09/15/26 (±) | USD | 729 | $ | 535,815 | ||||||
| South Korea | 0.6% | ||||||||||
| Delivery Hero SE: | ||||||||||
| 1.000%, 04/30/26 (±) | EUR | 200 | 136,619 | |||||||
| 1.500%, 01/15/28 (±) | EUR | 300 | 189,841 | |||||||
| 326,460 | ||||||||||
| United Kingdom | 0.3% | ||||||||||
| Just Eat Takeaway.com NV, 1.250%, 04/30/26 (±) | EUR | 200 | 139,357 | |||||||
| United States | 114.8% | ||||||||||
| Aerie Pharmaceuticals, Inc., 1.500%, 10/01/24 (±) | USD | 440 | 375,465 | |||||||
| Affirm Holdings, Inc., 0.000%, 11/15/26 (±) | USD | 464 | 265,533 | |||||||
| Airbnb Inc., 0.000%, 03/15/26 (±) | USD | 150 | 125,400 | |||||||
| Altair Engineering, Inc., 1.750%, 06/15/27 (±) | USD | 81 | 78,732 | |||||||
| Alteryx, Inc., 0.500%, 08/01/24 (±) | USD | 403 | 355,648 | |||||||
| American Airlines Group, Inc., 6.500%, 07/01/25 (±) | USD | 329 | 347,319 | |||||||
| Amyris, Inc., 1.500%, 11/15/26 (±) | USD | 700 | 290,150 | |||||||
| Anywhere Real Estate, Inc., 0.250%, 06/15/26 (±) | USD | 445 | 325,963 | |||||||
| Arbor Realty Trust, Inc., 4.750%, 11/01/22 (±) | USD | 783 | 774,935 | |||||||
| Array Technologies, Inc., 1.000%, 12/01/28 (±) | USD | 240 | 170,880 | |||||||
| Avadel Finance Cayman Ltd., 4.500%, 10/02/23 (±) | USD | 610 | 427,000 | |||||||
The accompanying notes are an integral part of these financial statements.
Semi-Annual Report 15
| Principal | ||||||||||
| Security | Amount | Fair | ||||||||
| Description | Currency | (000) | Value | |||||||
| Lazard Enhanced Opportunities Portfolio (continued) | ||||||||||
| Avadel Finance Cayman, Ltd., 4.500%, 02/01/23 (±) | USD | 426 | $ | 379,406 | ||||||
| Avid SPV LLC, 1.250%, 03/15/26 (±) | USD | 416 | 412,100 | |||||||
| Bandwidth, Inc. , 0.500%, 04/01/28 (±) | USD | 363 | 216,711 | |||||||
| Bentley Systems, Inc., 0.375%, 07/01/27 (±) | USD | 351 | 273,780 | |||||||
| Blackline Inc., 0.000%, 03/15/26 (±) | USD | 248 | 197,656 | |||||||
| Bloom Energy Corp., 2.500%, 08/15/25 (±) | USD | 253 | 314,201 | |||||||
| Braemar Hotels + Resorts , 4.500%, 06/01/26 (±) | USD | 499 | 506,984 | |||||||
| Century Aluminum Co., 2.750%, 05/01/28 (±) | USD | 221 | 168,623 | |||||||
| Chegg, Inc., 0.000%, 09/01/26 (±) | USD | 419 | 313,622 | |||||||
| Cinemark Holdings, Inc., 4.500%, 08/15/25 (±) | USD | 490 | 633,325 | |||||||
| CNX Resources Corp., 2.250%, 05/01/26 (±) | USD | 98 | 143,717 | |||||||
| Coherus Biosciences, Inc., 1.500%, 04/15/26 (±) | USD | 376 | 246,092 | |||||||
| Collegium Pharmaceutical, Inc., 2.625%, 02/15/26 (±) | USD | 295 | 259,979 | |||||||
| Coupa Software, Inc.: | ||||||||||
| 0.125%, 06/15/25 (±) | USD | 336 | 279,048 | |||||||
| 0.375%, 06/15/26 (±) | USD | 391 | 295,205 | |||||||
| Cutera Inc., | ||||||||||
| 2.250%, 03/15/26 (±) | USD | 175 | 230,686 | |||||||
| 2.250%, 06/01/28 (±) | USD | 270 | 256,502 | |||||||
| Danimer Scientific, Inc., 3.250%, 12/15/26 (±) | USD | 642 | 456,462 | |||||||
The accompanying notes are an integral part of these financial statements.
16 Semi-Annual Report
| Principal | ||||||||||
| Security | Amount | Fair | ||||||||
| Description | Currency | (000) | Value | |||||||
| Lazard Enhanced Opportunities Portfolio (continued) | ||||||||||
| DigitalOcean Holdings, Inc., 0.000%, 12/01/26 (±) | USD | 792 | $ | 595,505 | ||||||
| DISH Network Corp.: | ||||||||||
| 0.000%, 12/15/25 (±) | USD | 109 | 76,856 | |||||||
| 3.375%, 08/15/26 (±) | USD | 317 | 214,926 | |||||||
| Dynavax Technologies Corp., 2.500%, 05/15/26 (±) | USD | 1,272 | 1,856,484 | |||||||
| Eagle Bulk Shipping, Inc., 5.000%, 08/01/24 (±) | USD | 284 | 463,817 | |||||||
| Envestnet, Inc., 0.750%, 08/15/25 (±) | USD | 129 | 110,682 | |||||||
| Envista Holdings Corp., 2.375%, 06/01/25 (±) | USD | 459 | 878,755 | |||||||
| Everbridge, Inc., 0.125%, 12/15/24 (±) | USD | 511 | 446,826 | |||||||
| Evolent Health Inc., 3.500%, 12/01/24 (±) | USD | 207 | 367,942 | |||||||
| EZCORP, Inc., 2.875%, 07/01/24 (±) | USD | 1,108 | 1,157,306 | |||||||
| Fisker, Inc., 2.500%, 09/15/26 (±) | USD | 1,721 | 1,032,600 | |||||||
| Fiverr International, Ltd., 0.000%, 11/01/25 (±) | USD | 780 | 591,240 | |||||||
| fuboTV, Inc., 3.250%, 02/15/26 (±) | USD | 686 | 217,462 | |||||||
| Global Blood Therapeutics, Inc., 1.875%, 12/15/28 (±) | USD | 82 | 96,965 | |||||||
| Gossamer Bio, Inc., 5.000%, 06/01/27 (±) | USD | 165 | 123,338 | |||||||
| Granite Construction, Inc., 2.750%, 11/01/24 (±) | USD | 195 | 214,354 | |||||||
| Groupon, Inc., 1.125%, 03/15/26 (±) | USD | 565 | 360,187 | |||||||
| Guess?, Inc., 2.000%, 04/15/24 (±) | USD | 876 | 862,239 | |||||||
The accompanying notes are an integral part of these financial statements.
Semi-Annual Report 17
| Principal | ||||||||||
| Security | Amount | Fair | ||||||||
| Description | Currency | (000) | Value | |||||||
| Lazard Enhanced Opportunities Portfolio (continued) | ||||||||||
| Hat Holdings I LLC, 0.000%, 05/01/25 (±) | USD | 161 | $ | 154,459 | ||||||
| Hci Group, Inc., 4.750%, 06/01/42 (±) | USD | 228 | 235,752 | |||||||
| Helix Energy Solutions Group, Inc., 6.750%, 02/15/26 (±) | USD | 1,302 | 1,251,222 | |||||||
| Herbalife Nutrition, Ltd., 2.625%, 03/15/24 (±) | USD | 886 | 788,097 | |||||||
| Hope Bancorp, Inc., 2.000%, 05/15/38 (±) | USD | 921 | 900,830 | |||||||
| i3 Verticals LLC, 1.000%, 02/15/25 (±) | USD | 542 | 516,255 | |||||||
| Innoviva, Inc., | ||||||||||
| 2.125%, 01/15/23 (±) | USD | 185 | 183,011 | |||||||
| 2.125%, 03/15/28 (±) | USD | 272 | 232,016 | |||||||
| Inotiv, Inc., 3.250%, 10/15/27 (±) | USD | 428 | 264,080 | |||||||
| Insmed, Inc., 0.750%, 06/01/28 (±) | USD | 538 | 450,306 | |||||||
| Intercept Pharmaceuticals, Inc., 3.500%, 02/15/26 (±) | USD | 514 | 491,512 | |||||||
| Ionis Pharmaceuticals, Inc., 0.000%, 04/01/26 (±) | USD | 127 | 116,116 | |||||||
| JetBlue Airways Corp., 0.500%, 04/01/26 (±) | USD | 73 | 54,057 | |||||||
| Kaman Corp., 3.250%, 05/01/24 (±) | USD | 1,174 | 1,103,560 | |||||||
| Karyopharm Therapeutics, Inc., 3.000%, 10/15/25 (±) | USD | 301 | 221,409 | |||||||
| KKR Real Estate Finance Trust, Inc., 6.125%, 05/15/23 (±) | USD | 300 | 297,938 | |||||||
| LendingTree, Inc., 0.500%, 07/15/25 (±) | USD | 635 | 431,165 | |||||||
The accompanying notes are an integral part of these financial statements.
18 Semi-Annual Report
| Principal | ||||||||||
| Security | Amount | Fair | ||||||||
| Description | Currency | (000) | Value | |||||||
| Lazard Enhanced Opportunities Portfolio (continued) | ||||||||||
| Liberty Broadband Corp.: | ||||||||||
| 1.250%, 09/30/50 (±) | USD | 850 | $ | 798,150 | ||||||
| 2.750%, 09/30/50 (±) | USD | 607 | 578,885 | |||||||
| Liberty Interactive LLC: | ||||||||||
| 4.000%, 11/15/29 (±) | USD | 1,333 | 606,515 | |||||||
| 3.750%, 02/15/30 (±) | USD | 1,974 | 898,170 | |||||||
| Liberty Media Corp.: | ||||||||||
| 2.125%, 03/31/48 (±) | USD | 843 | 814,338 | |||||||
| 2.750%, 12/01/49 (±) | USD | 534 | 499,290 | |||||||
| Livent Corp., 4.125%, 07/15/25 (±) | USD | 459 | 1,254,676 | |||||||
| Lucid Group, Inc., 1.250%, 12/15/26 (±) | USD | 1,149 | 679,404 | |||||||
| Luminar Technologies, Inc., 1.250%, 12/15/26 (±) | USD | 182 | 103,558 | |||||||
| Magnite Inc., 0.250%, 03/15/26 (±) | USD | 146 | 106,580 | |||||||
| MannKind Corp., 2.500%, 03/01/26 (±) | USD | 640 | 649,009 | |||||||
| Mesa Laboratories, Inc., 1.375%, 08/15/25 (±) | USD | 167 | 156,145 | |||||||
| Mitek Systems, Inc., 0.750%, 02/01/26 (±) | USD | 582 | 485,388 | |||||||
| MP Materials Corp., 0.250%, 04/01/26 (±) | USD | 301 | 292,534 | |||||||
| NCL Corp., Ltd., | ||||||||||
| 1.125%, 02/15/27 (±) | USD | 752 | 490,680 | |||||||
| 2.500%, 02/15/27 (±) | USD | 200 | 138,000 | |||||||
| Nutanix, Inc., 0.250%, 10/01/27 (±) | USD | 218 | 151,793 | |||||||
| NuVasive, Inc.: | ||||||||||
| 1.000%, 06/01/23 (±) | USD | 948 | 918,375 | |||||||
| 0.375%, 03/15/25 (±) | USD | 274 | 244,374 | |||||||
| Omeros Corp., 5.250%, 02/15/26 (±) | USD | 200 | 116,740 | |||||||
The accompanying notes are an integral part of these financial statements.
Semi-Annual Report 19
| Principal | ||||||||||
| Security | Amount | Fair | ||||||||
| Description | Currency | (000) | Value | |||||||
| Lazard Enhanced Opportunities Portfolio (continued) | ||||||||||
| Opendoor Technologies, Inc., 0.250%, 08/15/26 (±) | USD | 692 | $ | 399,738 | ||||||
| OSI Systems, Inc., 1.250%, 09/01/22 (±) | USD | 363 | 364,270 | |||||||
| Pacira BioSciences, Inc., 0.750%, 08/01/25 (±) | USD | 118 | 122,484 | |||||||
| Palo Alto Networks, Inc., 0.750%, 07/01/23 (±) | USD | 944 | 1,757,170 | |||||||
| PAR Technology Corp., 1.500%, 10/15/27 (±) | USD | 954 | 772,424 | |||||||
| Parsons Corp., 0.250%, 08/15/25 (±) | USD | 86 | 90,773 | |||||||
| Patrick Industries, Inc., 1.000%, 02/01/23 (±) | USD | 211 | 208,679 | |||||||
| Peabody Energy Corp., 3.250%, 03/01/28 (±) | USD | 487 | 643,327 | |||||||
| Pebblebrook Hotel Trust, 1.750%, 12/15/26 (±) | USD | 522 | 467,451 | |||||||
| PennyMac Corp., | ||||||||||
| 5.500%, 11/01/24 (±) | USD | 669 | 649,766 | |||||||
| 5.500%, 03/15/26 (±) | USD | 692 | 609,860 | |||||||
| PetIQ, Inc., 4.000%, 06/01/26 (±) | USD | 290 | 278,545 | |||||||
| Plug Power, Inc., 3.750%, 06/01/25 (±) | USD | 581 | 1,943,619 | |||||||
| Porch Group, Inc., 0.750%, 09/15/26 (±) | USD | 877 | 470,839 | |||||||
| PRA Group, Inc., 3.500%, 06/01/23 (±) | USD | 937 | 946,956 | |||||||
| Radius Global Infrastructure, Inc., 2.500%, 09/15/26 (±) | USD | 345 | 335,728 | |||||||
| Redfin Corp., 0.500%, 04/01/27 (±) | USD | 721 | 343,557 | |||||||
| Redwood Trust, Inc., | ||||||||||
| 4.750%, 08/15/23 (±) | USD | 2,114 | 2,010,942 | |||||||
| 7.750%, 06/15/27 (±) | USD | 176 | 155,056 | |||||||
The accompanying notes are an integral part of these financial statements.
20 Semi-Annual Report
| Principal | ||||||||||
| Security | Amount | Fair | ||||||||
| Description | Currency | (000) | Value | |||||||
| Lazard Enhanced Opportunities Portfolio (continued) | ||||||||||
| Repay Holdings Corp., 0.000%, 02/01/26 (±) | USD | 526 | $ | 408,307 | ||||||
| Revance Therapeutics, Inc., 1.750%, 02/15/27 (±) | USD | 656 | 533,820 | |||||||
| RingCentral, Inc., 0.000%, 03/01/25 (±) | USD | 306 | 251,685 | |||||||
| Royal Caribbean Cruises, Ltd., 2.875%, 11/15/23 (±) | USD | 696 | 632,929 | |||||||
| Shift Technologies, Inc., 4.750%, 05/15/26 (±) | USD | 850 | 245,508 | |||||||
| Snap Inc., 0.000%, 05/01/27 (±) | USD | 163 | 113,693 | |||||||
| Snap Inc., 0.125%, 03/01/28 (±) | USD | 864 | 605,232 | |||||||
| SPOTIFY USA, Inc.,Co., 0.000%, 03/15/26 (±) | USD | 363 | 288,222 | |||||||
| Starwood Property Trust, Inc., 4.375%, 04/01/23 (±) | USD | 337 | 334,473 | |||||||
| Summit Hotel Properties, Inc., 1.500%, 02/15/26 (±) | USD | 150 | 127,500 | |||||||
| SunPower Corp., 4.000%, 01/15/23 (±) | USD | 368 | 382,168 | |||||||
| Tandem Diabetes Care, Inc., 1.500%, 05/01/25 (±) | USD | 255 | 237,405 | |||||||
| TechTarget, Inc., 0.000%, 12/15/26 (±) | USD | 557 | 449,753 | |||||||
| The Beauty Health Co., 1.250%, 10/01/26 (±) | USD | 802 | 648,016 | |||||||
| The Chefs’ Warehouse, Inc., 1.875%, 12/01/24 (±) | USD | 1,169 | 1,297,590 | |||||||
| The Greenbrier Cos., Inc., 2.875%, 04/15/28 (±) | USD | 31 | 28,985 | |||||||
| The Marcus Corp., 5.000%, 09/15/25 (±) | USD | 718 | 1,145,659 | |||||||
The accompanying notes are an integral part of these financial statements.
Semi-Annual Report 21
| Principal | ||||||||||
| Security | Amount | Fair | ||||||||
| Description | Currency | (000) | Value | |||||||
| Lazard Enhanced Opportunities Portfolio (continued) | ||||||||||
| ’ | ||||||||||
| Travere Therapeutics Inc., 2.250%, 03/01/29 (±) | USD | 395 | $ | 396,185 | ||||||
| Two Harbors Investment Corp., 6.250%, 01/15/26 (±) | USD | 354 | 317,977 | |||||||
| United States Steel Corp., 5.000%, 11/01/26 (±) | USD | 554 | 867,010 | |||||||
| Upstart Holdings, Inc., 0.250%, 08/15/26 (±) | USD | 409 | 230,676 | |||||||
| Upwork, Inc., 0.250%, 08/15/26 (±) | USD | 280 | 214,550 | |||||||
| Varex Imaging Corp., 4.000%, 06/01/25 (±) | USD | 592 | 719,640 | |||||||
| Veeco Instruments Inc., 3.750%, 06/01/27 (±) | USD | 430 | 688,559 | |||||||
| Veritone, Inc., 1.750%, 11/15/26 (±) | USD | 855 | 547,938 | |||||||
| Virgin Galactic Holdings Inc., 2.500%, 02/01/27 (±) | USD | 190 | 122,004 | |||||||
| Vishay Intertechnology, Inc., 2.250%, 06/15/25 (±) | USD | 409 | 388,059 | |||||||
| Wayfair, Inc., 0.625%, 10/01/25 (±) | USD | 296 | 196,988 | |||||||
| Xometry Inc., 1.000%, 02/01/27 (±) | USD | 319 | 272,107 | |||||||
| 61,726,819 | ||||||||||
| Total Convertible Corporate Bonds (Cost $79,533,439) | 67,626,007 | |||||||||
The accompanying notes are an integral part of these financial statements.
22 Semi-Annual Report
| Number of | Exercise | Notional | Fair | |||||||||||||||||
| Description | Counterparty | Contracts | Price | Amount | Value | |||||||||||||||
| Lazard Enhanced Opportunities Portfolio (continued) | ||||||||||||||||||||
| Purchased Options | 0.2% | ||||||||||||||||||||
| Put | ||||||||||||||||||||
| American Airlines Group, Inc., Expires 07/01/22 | MSC | 29 | $ | 11 | $ | 2,900 | $ | 58 | ||||||||||||
| American Airlines Group, Inc., Expires 07/01/22 | MSC | 15 | 12 | 1,500 | 75 | |||||||||||||||
| American Airlines Group, Inc., Expires 01/20/23 | MSC | 7 | 10 | 700 | 903 | |||||||||||||||
| Danimer Scientific, Inc., Expires 11/18/22 | MSC | 15 | 2.5 | 1,500 | 300 | |||||||||||||||
| Invesco QQQ Trust, Expires 7/29/22 | MSC | 19 | 282 | 1,900 | 22,629 | |||||||||||||||
| iShares Russell 2000 ETF, Expires 7/29/22 | MSC | 77 | 166 | 7,700 | 35,343 | |||||||||||||||
| Redfin Corp., Expires 11/18/22 | MSC | 22 | 5 | 2,200 | 1,628 | |||||||||||||||
| SPDR S&P 500 ETF Trust, Expires 7/29/22 | MSC | 19 | 380 | 1,900 | 24,054 | |||||||||||||||
| Total Purchased Options (Cost $71,337) | 84,990 | |||||||||||||||||||
| Fair | |||||||||
| Description | Shares | Value | |||||||
| Short-Term Investments | 22.3% | |||||||||
| State Street Institutional Treasury Money Market Fund, Premier Class, 1.04% (7 day yield) (Cost $11,987,212) | 11,987,212 | $ | 11,987,212 | ||||||
| Total Investments excluding Securities Sold Short | 149.4% (Cost $92,234,445) | $ | 80,317,032 | |||||||
The accompanying notes are an integral part of these financial statements.
Semi-Annual Report 23
| Fair | ||||||||
| Description | Shares | Value | ||||||
| Lazard Enhanced Opportunities Portfolio (continued) | ||||||||
| Securities Sold Short | (56.8)% | ||||||||
| Common Stocks | (40.1)% | ||||||||
| Australia | 0.0% | ||||||||
| Zip Co., Ltd. | (8,817 | ) | $ | (2,683 | ) | |||
| Austria | (0.1)% | ||||||||
| ams-OSRAM AG | (8,078 | ) | (72,867 | ) | ||||
| Brazil | 0.0% | ||||||||
| Gol Linhas Aereas Inteligentes SA ADR | (1,598 | ) | (5,449 | ) | ||||
| Canada | (0.5)% | ||||||||
| Canopy Growth Corp. | (565 | ) | (1,606 | ) | ||||
| Dye & Durham, Ltd. | (2,988 | ) | (50,489 | ) | ||||
| Ivanhoe Mines, Ltd., Class A | (26,826 | ) | (154,429 | ) | ||||
| Lithium Americas Corp. | (3,115 | ) | (62,705 | ) | ||||
| (269,229 | ) | |||||||
| China | (1.2)% | ||||||||
| Li Auto, Inc. ADR | (15,830 | ) | (606,447 | ) | ||||
| NIO, Inc. ADR | (1,668 | ) | (36,229 | ) | ||||
| (642,676 | ) | |||||||
| Hong Kong | (0.4)% | ||||||||
| Cathay Pacific Airways, Ltd. | (181,800 | ) | (199,316 | ) | ||||
| Netherlands | 0.0% | ||||||||
| Pharming Group NV | (18,981 | ) | (15,024 | ) | ||||
| Panama | (0.9)% | ||||||||
| Copa Holdings SA, Class A | (7,102 | ) | (450,054 | ) | ||||
| Singapore | 0.0% | ||||||||
| Sea, Ltd. ADR | (295 | ) | (19,724 | ) | ||||
The accompanying notes are an integral part of these financial statements.
24 Semi-Annual Report
| Fair | ||||||||
| Description | Shares | Value | ||||||
| Lazard Enhanced Opportunities Portfolio (continued) | ||||||||
| South Korea | (0.1)% | ||||||||
| Delivery Hero SE | (904 | ) | $ | (33,887 | ) | |||
| United Kingdom | 0.0% | ||||||||
| Just Eat Takeaway.com NV | (196 | ) | (3,134 | ) | ||||
| United States | (36.9)% | ||||||||
| Aerie Pharmaceuticals, Inc. | (4,225 | ) | (31,687 | ) | ||||
| Affirm Holdings, Inc. | (639 | ) | (11,540 | ) | ||||
| Airbnb, Inc., Class A | (53 | ) | (4,721 | ) | ||||
| Altair Engineering, Inc., Class A | (757 | ) | (39,742 | ) | ||||
| Alteryx, Inc., Class A | (240 | ) | (11,621 | ) | ||||
| American Airlines Group, Inc. | (14,821 | ) | (187,930 | ) | ||||
| Amyris, Inc. | (42,507 | ) | (78,638 | ) | ||||
| Anywhere Real Estate, Inc. | (8,880 | ) | (87,290 | ) | ||||
| Array Technologies, Inc. | (8,549 | ) | (94,124 | ) | ||||
| Avadel Pharmaceuticals PLC ADR | (53,781 | ) | (131,226 | ) | ||||
| Avid Bioservices, Inc. | (13,388 | ) | (204,301 | ) | ||||
| Bandwidth, Inc., Class A | (676 | ) | (12,722 | ) | ||||
| Bentley Systems, Inc., Class B | (993 | ) | (33,067 | ) | ||||
| Blackline, Inc. | (562 | ) | (37,429 | ) | ||||
| Bloom Energy Corp. | (12,231 | ) | (201,811 | ) | ||||
| Braemar Hotels & Resorts, Inc. REIT | (55,473 | ) | (237,979 | ) | ||||
| Century Aluminum Co. | (8,153 | ) | (60,088 | ) | ||||
| Chegg, Inc. | (1,011 | ) | (18,987 | ) | ||||
| Cinemark Holdings, Inc. | (7,631 | ) | (114,618 | ) | ||||
| CNX Resources Corp. | (6,394 | ) | (105,245 | ) | ||||
| Coherus Biosciences, Inc. | (9,760 | ) | (70,662 | ) | ||||
| Collegium Pharmaceutical, Inc. | (6,580 | ) | (116,598 | ) | ||||
| Coupa Software, Inc. | (1,147 | ) | (65,494 | ) | ||||
| Cutera, Inc. | (8,389 | ) | (314,587 | ) | ||||
| Cytokinetics, Inc. | (4,934 | ) | (193,857 | ) | ||||
| Danimer Scientific, Inc. | (26,744 | ) | (121,953 | ) | ||||
| DigitalOcean Holdings, Inc. | (2,130 | ) | (88,097 | ) | ||||
| DISH Network Corp., Class A | (3,378 | ) | (60,568 | ) | ||||
| Dynavax Technologies Corp. | (100,398 | ) | (1,264,011 | ) | ||||
The accompanying notes are an integral part of these financial statements.
Semi-Annual Report 25
| Fair | ||||||||
| Description | Shares | Value | ||||||
| Lazard Enhanced Opportunities Portfolio (continued) | ||||||||
| Eagle Bulk Shipping, Inc. | (7,641 | ) | $ | (396,415 | ) | |||
| Envestnet, Inc. | (344 | ) | (18,153 | ) | ||||
| Envista Holdings Corp. | (20,347 | ) | (784,173 | ) | ||||
| Everbridge, Inc. | (628 | ) | (17,515 | ) | ||||
| Evolent Health, Inc., Class A | (10,263 | ) | (315,177 | ) | ||||
| EZCORP, Inc. Class A | (54,789 | ) | (411,465 | ) | ||||
| Fisker, Inc. | (26,828 | ) | (229,916 | ) | ||||
| Fiverr International, Ltd. | (445 | ) | (15,304 | ) | ||||
| fuboTV, Inc. | (1,514 | ) | (3,740 | ) | ||||
| Global Blood Therapeutics, Inc. | (2,163 | ) | (69,108 | ) | ||||
| Gossamer Bio, Inc. | (9,607 | ) | (80,411 | ) | ||||
| Granite Construction, Inc. | (3,640 | ) | (106,070 | ) | ||||
| Groupon, Inc. | (3,443 | ) | (38,906 | ) | ||||
| Hannon Armstrong Sustainable Infrastructure Capital, Inc. REIT | (1,096 | ) | (41,495 | ) | ||||
| HCI Group, Inc. | (2,118 | ) | (143,516 | ) | ||||
| Helix Energy Solutions Group, Inc. | (111,151 | ) | (344,568 | ) | ||||
| Herbalife Nutrition, Ltd. | (142 | ) | (2,904 | ) | ||||
| I3 Verticals, Inc., Class A | (7,189 | ) | (179,869 | ) | ||||
| Innoviva, Inc. | (8,232 | ) | (121,504 | ) | ||||
| Inotiv, Inc. | (2,788 | ) | (26,765 | ) | ||||
| Insmed, Inc. | (12,316 | ) | (242,871 | ) | ||||
| Intercept Pharmaceuticals, Inc. | (18,830 | ) | (260,042 | ) | ||||
| Ionis Pharmaceuticals, Inc. | (1,299 | ) | (48,089 | ) | ||||
| JetBlue Airways Corp. | (302 | ) | (2,528 | ) | ||||
| Kaman Corp. | (2,041 | ) | (63,781 | ) | ||||
| Karyopharm Therapeutics, Inc. | (9,586 | ) | (43,233 | ) | ||||
| LendingTree, Inc. | (75 | ) | (3,286 | ) | ||||
| Livent Corp. | (49,947 | ) | (1,133,297 | ) | ||||
| Lucid Group, Inc. | (11,358 | ) | (194,903 | ) | ||||
| Luminar Technologies, Inc. | (6,081 | ) | (36,060 | ) | ||||
| Magnite, Inc. | (707 | ) | (6,278 | ) | ||||
| MannKind Corp. | (88,363 | ) | (336,663 | ) | ||||
| Mitek Systems, Inc. | (11,751 | ) | (108,579 | ) | ||||
| Norwegian Cruise Line Holdings, Ltd. | (14,669 | ) | (163,119 | ) | ||||
| Nutanix, Inc., Class A | (187 | ) | (2,736 | ) | ||||
The accompanying notes are an integral part of these financial statements.
26 Semi-Annual Report
| Fair | ||||||||
| Description | Shares | Value | ||||||
| Lazard Enhanced Opportunities Portfolio (continued) | ||||||||
| NuVasive, Inc. | (2,449 | ) | $ | (120,393 | ) | |||
| Omeros Corp. | (8,325 | ) | (22,894 | ) | ||||
| Opendoor Technologies, Inc. | (22,069 | ) | (103,945 | ) | ||||
| OSI Systems, Inc. | (22 | ) | (1,880 | ) | ||||
| Pacira BioSciences, Inc. | (1,048 | ) | (61,098 | ) | ||||
| Palo Alto Networks, Inc. | (3,399 | ) | (1,678,902 | ) | ||||
| PAR Technology Corp. | (8,694 | ) | (325,938 | ) | ||||
| Parsons Corp. | (472 | ) | (19,078 | ) | ||||
| Peabody Energy Corp. | (21,804 | ) | (465,079 | ) | ||||
| Pebblebrook Hotel Trust REIT | (996 | ) | (16,504 | ) | ||||
| PetIQ, Inc. | (5,517 | ) | (92,630 | ) | ||||
| Plug Power, Inc. | (111,521 | ) | (1,847,903 | ) | ||||
| Porch Group, Inc. | (21,046 | ) | (53,878 | ) | ||||
| PRA Group, Inc. | (3,867 | ) | (140,604 | ) | ||||
| Radius Global Infrastructure, Inc. | (10,580 | ) | (161,451 | ) | ||||
| Redfin Corp. | (2,786 | ) | (22,957 | ) | ||||
| Redwood Trust, Inc. REIT | (4,939 | ) | (38,080 | ) | ||||
| Repay Holdings Corp. | (6,618 | ) | (85,041 | ) | ||||
| Revance Therapeutics, Inc. | (13,502 | ) | (186,598 | ) | ||||
| RingCentral, Inc., Class A | (90 | ) | (4,703 | ) | ||||
| Royal Caribbean Cruises, Ltd. | (1,947 | ) | (67,970 | ) | ||||
| Shift Technologies, Inc. | (109,031 | ) | (73,389 | ) | ||||
| Snap, Inc., Class A | (4,375 | ) | (57,444 | ) | ||||
| Spotify Technology SA | (124 | ) | (11,635 | ) | ||||
| Summit Hotel Properties, Inc. REIT (±) | (7,133 | ) | (51,857 | ) | ||||
| SunPower Corp. | (4,086 | ) | (64,600 | ) | ||||
| Tandem Diabetes Care, Inc. | (999 | ) | (59,131 | ) | ||||
| TechTarget, Inc. | (2,309 | ) | (151,747 | ) | ||||
| The Beauty Health Co. | (1,959 | ) | (25,193 | ) | ||||
| The Chefs’ Warehouse, Inc. | (18,129 | ) | (705,037 | ) | ||||
| The Marcus Corp. | (57,742 | ) | (852,849 | ) | ||||
| Travere Therapeutics, Inc. | (10,127 | ) | (245,377 | ) | ||||
| United States Steel Corp. | (34,662 | ) | (620,796 | ) | ||||
| Upstart Holdings, Inc. | (103 | ) | (3,257 | ) | ||||
| Upwork, Inc. | (1,310 | ) | (27,091 | ) | ||||
| Varex Imaging Corp. | (22,177 | ) | (474,366 | ) | ||||
The accompanying notes are an integral part of these financial statements.
Semi-Annual Report 27
| Fair | ||||||||
| Description | Shares | Value | ||||||
| Lazard Enhanced Opportunities Portfolio (continued) | ||||||||
| Veeco Instruments, Inc. | (27,381 | ) | $ | (531,191 | ) | |||
| Veritone, Inc. | (14,192 | ) | (92,674 | ) | ||||
| Virgin Galactic Holdings, Inc. | (13,307 | ) | (80,108 | ) | ||||
| Vishay Intertechnology, Inc. | (2,074 | ) | (36,959 | ) | ||||
| Wayfair, Inc., Class A | (212 | ) | (9,235 | ) | ||||
| Xometry, Inc. | (4,466 | ) | (151,531 | ) | ||||
| (19,836,025 | ) | |||||||
| Total Common Stock (Proceeds $25,157,332) | (21,550,068 | ) | ||||||
| Exchange-Traded Funds | (7.8)% | ||||||||
| United States | (7.8)% | ||||||||
| iShares iBoxx High Yield Corporate Bond ETF (Proceeds $4,327,609) | (57,045 | ) | (4,199,082 | ) | ||||
| Principal | ||||||||||
| Security | Amount | Fair | ||||||||
| Description | Currency | (000) | Value | |||||||
| US Treasury Securities | (8.9)% | ||||||||||
| U.S. Treasury Note | ||||||||||
| 2.500%, 04/30/24 | USD | (4,005,000 | ) | $ | (3,970,113 | ) | ||||
| 2.750%, 04/30/27 | USD | (805,000 | ) | (794,120 | ) | |||||
| (Proceeds $4,786,851) | (4,764,233 | ) | ||||||||
| Total Securities Sold Short (Proceeds $34,271,792) | (30,513,383 | ) | ||||||||
| Total Investments | 92.6% (Cost and short proceeds $57,962,653) (») | 49,803,649 | |||||||||
| Cash and Other Assets in Excess of Liabilities | 7.4% | 3,956,784 | |||||||||
| Net Assets | 100.0% | $ | 53,760,433 | ||||||||
The accompanying notes are an integral part of these financial statements.
28 Semi-Annual Report
Lazard Enhanced Opportunities Portfolio (continued)
Forward Currency Contracts open at June 30, 2022:
| Currency | Currency | Settlement | Unrealized | Unrealized | |||||||||||||||
| Purchased | Quantity | Sold | Quantity | Counterparty | Date | Appreciation | Depreciation | ||||||||||||
| USD | 320,539 | AUD | 462,000 | SSB | 09/28/22 | $ 1,418 | $ | — | |||||||||||
| USD | 1,849,349 | CAD | 2,381,000 | SSB | 09/28/22 | — | 661 | ||||||||||||
| USD | 1,123,393 | EUR | 1,053,000 | SSB | 09/28/22 | 13,179 | — | ||||||||||||
| USD | 118,185 | HKD | 925,000 | SSB | 09/28/22 | 24 | — | ||||||||||||
Total gross unrealized appreciation/depreciation on Forward Currency Contracts | $14,621 | $ | 661 | ||||||||||||||||
Written Options open at June 30, 2022:
| Number of | Strike | Expiration | Notional | Fair | ||||||||||||||||||||
| Description | Counterparty | Contracts | Price | Date | Amount | Premiums | Value | |||||||||||||||||
| Put | ||||||||||||||||||||||||
| Invesco QQQ Trust | MSC | 39 | $ | 272 | 07/29/2022 | $ | 3,900 | $ | 19,323 | $ | (32,994 | ) | ||||||||||||
| Ishares Russell 2000 ETF | MSC | 77 | 156 | 07/29/2022 | 7,700 | 15,310 | (14,861 | ) | ||||||||||||||||
| SPDR S&P 500 ETF Trust MSC | 39 | 370 | 07/29/2022 | 3,900 | 19,986 | (31,200 | ) | |||||||||||||||||
| Total Written Options | 155 | $ | 54,619 | $ | (79,055 | ) | ||||||||||||||||||
The accompanying notes are an integral part of these financial statements.
Semi-Annual Report 29
Lazard Enhanced Opportunities Portfolio (concluded)
Total Return Swap Agreements open at June 30, 2022:
| Notional | Expiration | Unrealized | Unrealized | |||||||||||||||||||
| Currency | Counterparty | Amount | Date | Reference Entity^ | Rate | * | Appreciation | Depreciation | ||||||||||||||
| USD | BOA | $ | 239,919 | 05/31/23 | Arbor Realty Trust, Inc. | 0.08 | % | $ | 81,996 | $ — | ||||||||||||
| USD | BOA | 177,280 | 05/31/23 | The Beauty Health Co. | 0.08 | 89,485 | — | |||||||||||||||
| USD | BOA | 54,078 | 05/31/23 | Bentley Systems, Inc. | 0.08 | 23,176 | — | |||||||||||||||
| USD | BOA | 368,258 | 05/31/23 | Cinemark Holdings, Inc. | 0.08 | 74,678 | — | |||||||||||||||
| USD | BOA | 253,109 | 05/31/23 | Fisker, Inc. | 0.08 | 105,019 | — | |||||||||||||||
| USD | BOA | 58,394 | 05/31/23 | Gol Linhas Aereas Inteligentes SA ADR | 0.08 | 34,162 | — | |||||||||||||||
| USD | BOA | 15,941 | 05/31/23 | The Greenbrier Cos., Inc. | 0.08 | 3,128 | — | |||||||||||||||
| USD | BOA | 345,527 | 05/31/23 | Guess?, Inc. | 0.08 | 56,461 | — | |||||||||||||||
| USD | BOA | 96,762 | 05/31/23 | Hope Bancorp, Inc. | 0.08 | 4,186 | — | |||||||||||||||
| USD | BOA | 663,355 | 05/31/23 | iShares iBoxx High Yield Corporate Bond ETF | 0.08 | 59,458 | — | |||||||||||||||
| USD | BOA | 67,657 | 05/31/23 | KKR Real Estate Finance Trust, Inc. | 0.08 | 14,429 | — | |||||||||||||||
| USD | BOA | 175,490 | 05/31/23 | Mesa Laboratories, Inc. | 0.08 | 58,225 | — | |||||||||||||||
| USD | BOA | 173,545 | 05/31/23 | MP Materials Corp. | 0.08 | 794 | — | |||||||||||||||
| USD | BOA | 33,272 | 05/31/23 | Patrick Industries, Inc. | 0.08 | 11,551 | — | |||||||||||||||
| USD | BOA | 249,979 | 05/31/23 | Pebblebrook Hotel Trust | 0.08 | 64,515 | — | |||||||||||||||
| USD | BOA | 245,917 | 05/31/23 | PennyMac Mortgage Investment Trust | 0.08 | 41,911 | — | |||||||||||||||
| USD | BOA | 36,832 | 05/31/23 | Redwood Trust, Inc. | 0.08 | 16,470 | — | |||||||||||||||
| USD | BOA | 223,785 | 05/31/23 | Sirius XM Holdings, Inc. | 0.08 | — | 824 | |||||||||||||||
| USD | BOA | 87,004 | 05/31/23 | Starwood Property Trust, Inc. | 0.08 | 14,731 | — | |||||||||||||||
| USD | BOA | 101,934 | 05/31/23 | Two Harbors Investment Corp. | 0.08 | 26,702 | — | |||||||||||||||
| USD | BOA | 24,440 | 05/31/23 | Vishay Intertechnology, Inc. | 0.08 | 2,664 | — | |||||||||||||||
| Total gross unrealized appreciation/depreciation on Total Return Swap Agreements | $ | 783,741 | $824 | |||||||||||||||||||
| ^ | The Portfolio receives depreciation of the referenced entity. |
| * | The Portfolio pays appreciation and dividends, as well as financing charges at the referenced rate. |
The accompanying notes are an integral part of these financial statements.
30 Semi-Annual Report
The accompanying notes are an integral part of these financial statements.
Semi-Annual Report 31
| Description | Shares | Fair Value | ||||||
| Lazard Global Dynamic Multi-Asset Portfolio (continued) | ||||||||
| The Toronto-Dominion Bank | 391 | $ | 25,642 | |||||
| Tourmaline Oil Corp. | 227 | 11,803 | ||||||
| 255,750 | ||||||||
| China | 0.2% | ||||||||
| NXP Semiconductors NV | 145 | 21,464 | ||||||
| SITC International Holdings Co., Ltd. | 2,000 | 5,667 | ||||||
| Yangzijiang Shipbuilding Holdings, Ltd. | 5,400 | 3,619 | ||||||
| 30,750 | ||||||||
| Denmark | 0.6% | ||||||||
| AP Moller-Maersk A/S, Class B | 4 | 9,395 | ||||||
| Carlsberg A/S, Class B Sponsored ADR | 812 | 20,771 | ||||||
| Novo Nordisk A/S, Class B | 553 | 61,378 | ||||||
| 91,544 | ||||||||
| France | 0.8% | ||||||||
| Bureau Veritas SA ADR (*) | 297 | 15,215 | ||||||
| Cie de Saint-Gobain | 293 | 12,727 | ||||||
| Cie Generale des Etablissements Michelin SCA | 100 | 2,750 | ||||||
| Hermes International | 3 | 3,389 | ||||||
| Legrand SA ADR | 865 | 12,716 | ||||||
| LVMH Moet Hennessy Louis Vuitton SE ADR | 151 | 18,455 | ||||||
| Orange SA | 1,049 | 12,336 | ||||||
| Pernod Ricard SA Sponsored ADR | 475 | 17,442 | ||||||
| Societe Generale SA | 505 | 11,075 | ||||||
| Thales SA ADR | 832 | 20,376 | ||||||
| TotalEnergies SE | 121 | 6,378 | ||||||
| 132,859 | ||||||||
| Germany | 0.5% | ||||||||
| Daimler Truck Holding AG (*) | 158 | 4,124 | ||||||
| Deutsche Bank AG | 567 | 4,940 | ||||||
| Deutsche Post AG | 834 | 31,246 | ||||||
| Mercedes-Benz Group AG | 68 | 3,935 | ||||||
| Merck KGaA Sponsored ADR | 518 | 17,446 | ||||||
| Nemetschek SE | 62 | 3,753 | ||||||
| Telefonica Deutschland Holding AG | 1,916 | 5,503 | ||||||
| 70,947 | ||||||||
The accompanying notes are an integral part of these financial statements.
32 Semi-Annual Report
| Description | Shares | Fair Value | ||||||
| Lazard Global Dynamic Multi-Asset Portfolio (continued) | ||||||||
| Hong Kong | 0.3% | ||||||||
| AIA Group, Ltd. Sponsored ADR | 465 | $ | 20,376 | |||||
| Jardine Matheson Holdings, Ltd. | 100 | 5,263 | ||||||
| Swire Pacific, Ltd., Class A | 500 | 3,005 | ||||||
| WH Group, Ltd. | 16,500 | 12,766 | ||||||
| 41,410 | ||||||||
| Israel | 0.1% | ||||||||
| Bezeq The Israeli Telecommunication Corp., Ltd. | 5,499 | 8,568 | ||||||
| Perion Network, Ltd. (*) | 351 | 6,381 | ||||||
| ZIM Integrated Shipping Services, Ltd. | 142 | 6,707 | ||||||
| 21,656 | ||||||||
| Italy | 0.0% | ||||||||
| UniCredit SpA | 448 | 4,296 | ||||||
| Japan | 3.0% | ||||||||
| Advantest Corp. | 100 | 5,313 | ||||||
| AGC, Inc. | 100 | 3,519 | ||||||
| Canon, Inc. | 100 | 2,275 | ||||||
| Cosmo Energy Holdings Co., Ltd. | 100 | 2,778 | ||||||
| Dai-ichi Life Holdings, Inc. | 600 | 11,076 | ||||||
| Daicel Corp. | 800 | 4,951 | ||||||
| Daiwa House Industry Co., Ltd. | 700 | 16,326 | ||||||
| Electric Power Development Co., Ltd. | 2,000 | 33,070 | ||||||
| ENEOS Holdings, Inc. | 3,900 | 14,722 | ||||||
| FUJIFILM Holdings Corp. | 100 | 5,370 | ||||||
| H.U. Group Holdings, Inc. | 300 | 6,517 | ||||||
| Hulic Co., Ltd. | 500 | 3,873 | ||||||
| Japan Post Bank Co., Ltd. | 3,100 | 24,111 | ||||||
| Japan Post Holdings Co., Ltd. | 8,400 | 60,017 | ||||||
| Japan Post Insurance Co., Ltd. | 900 | 14,404 | ||||||
| Japan Real Estate Investment Corp. REIT | 1 | 4,600 | ||||||
| Japan Tobacco, Inc. | 500 | 8,648 | ||||||
| Kaneka Corp. | 200 | 4,927 | ||||||
| KDDI Corp. | 400 | 12,649 | ||||||
| Lawson, Inc. | 100 | 3,325 | ||||||
| McDonald’s Holdings Co. Japan, Ltd. | 300 | 10,922 | ||||||
The accompanying notes are an integral part of these financial statements.
Semi-Annual Report 33
| Description | Shares | Fair Value | ||||||
| Lazard Global Dynamic Multi-Asset Portfolio (continued) | ||||||||
| Mitsubishi Electric Corp. | 400 | $ | 4,281 | |||||
| Mitsui & Co., Ltd. | 200 | 4,417 | ||||||
| Mitsui Chemicals, Inc. | 200 | 4,264 | ||||||
| Mizuho Financial Group, Inc. | 1,700 | 19,331 | ||||||
| MS&AD Insurance Group Holdings, Inc. | 600 | 18,395 | ||||||
| NGK Spark Plug Co., Ltd. | 300 | 5,451 | ||||||
| Nihon Kohden Corp. | 300 | 6,138 | ||||||
| Nintendo Co., Ltd. ADR | 430 | 23,143 | ||||||
| Nippon Building Fund, Inc. REIT | 1 | 4,976 | ||||||
| Nippon Telegraph & Telephone Corp. | 100 | 2,871 | ||||||
| Nisshinbo Holdings, Inc. | 1,200 | 9,036 | ||||||
| Olympus Corp. Sponsored ADR | 1,001 | 20,140 | ||||||
| Osaka Gas Co., Ltd. | 900 | 17,285 | ||||||
| Rengo Co., Ltd. | 700 | 3,791 | ||||||
| Shimano, Inc. ADR | 833 | 14,069 | ||||||
| Softbank Corp. | 300 | 3,330 | ||||||
| Sumco Corp. | 300 | 3,860 | ||||||
| Sumitomo Chemical Co., Ltd. | 2,700 | 10,540 | ||||||
| Sumitomo Mitsui Financial Group, Inc. | 200 | 5,940 | ||||||
| The Hachijuni Bank, Ltd. | 1,300 | 4,793 | ||||||
| The Shizuoka Bank, Ltd. | 700 | 4,206 | ||||||
| Tokyo Gas Co., Ltd. | 1,300 | 26,896 | ||||||
| Tokyu Fudosan Holdings Corp. | 900 | 4,740 | ||||||
| Toshiba Corp. | 100 | 4,067 | ||||||
| Yamazaki Baking Co., Ltd. | 400 | 4,886 | ||||||
| 484,239 | ||||||||
| Malta | 0.0% | ||||||||
| Kindred Group PLC | 452 | 3,760 | ||||||
| Netherlands | 0.9% | ||||||||
| Adyen NV (*) | 5 | 7,350 | ||||||
| ASML Holding NV | 18 | 8,687 | ||||||
| Eurocommercial Properties NV REIT | 384 | 8,313 | ||||||
| EXOR NV | 113 | 7,092 | ||||||
| ING Groep NV | 463 | 4,595 | ||||||
| Koninklijke KPN NV | 1,154 | 4,117 | ||||||
The accompanying notes are an integral part of these financial statements.
34 Semi-Annual Report
| Description | Shares | Fair Value | ||||||
| Lazard Global Dynamic Multi-Asset Portfolio (continued) | ||||||||
| NN Group NV | 106 | $ | 4,848 | |||||
| Shell PLC | 1,631 | 42,562 | ||||||
| Wolters Kluwer NV | 207 | 20,137 | ||||||
| Wolters Kluwer NV Sponsored ADR | 443 | 43,117 | ||||||
| 150,818 | ||||||||
| New Zealand | 0.1% | ||||||||
| Spark New Zealand, Ltd. | 3,290 | 9,862 | ||||||
| Norway | 0.1% | ||||||||
| Orkla ASA | 1,218 | 9,749 | ||||||
| Telenor ASA | 248 | 3,304 | ||||||
| 13,053 | ||||||||
| Portugal | 0.0% | ||||||||
| Jeronimo Martins SGPS SA | 187 | 4,064 | ||||||
| Puerto Rico | 0.0% | ||||||||
| OFG Bancorp | 185 | 4,699 | ||||||
| Singapore | 0.1% | ||||||||
| Jardine Cycle & Carriage, Ltd. | 200 | 4,075 | ||||||
| Singapore Technologies Engineering, Ltd. | 3,000 | 8,827 | ||||||
| 12,902 | ||||||||
| Spain | 0.3% | ||||||||
| Banco Santander SA | 7,069 | 19,934 | ||||||
| Corporacion Financiera Alba SA | 27 | 1,475 | ||||||
| Iberdrola SA | 1,333 | 13,832 | ||||||
| Industria de Diseno Textil SA ADR | 1,076 | 12,170 | ||||||
| 47,411 | ||||||||
| Sweden | 0.6% | ||||||||
| Assa Abloy AB ADR | 1,257 | 13,349 | ||||||
| Epiroc AB ADR | 1,768 | 27,298 | ||||||
| Hexagon AB ADR | 2,276 | 23,511 | ||||||
| Lundin Energy AB | 349 | 238 | ||||||
| Lundin Energy MergerCo AB (*), (¢) | 349 | 13,544 | ||||||
| Securitas AB, B Shares | 533 | 4,628 | ||||||
| Telefonaktiebolaget LM Ericsson, B Shares | 813 | 6,068 | ||||||
| 88,636 | ||||||||
The accompanying notes are an integral part of these financial statements.
Semi-Annual Report 35
| Description | Shares | Fair Value | ||||||
| Lazard Global Dynamic Multi-Asset Portfolio (continued) | ||||||||
| Switzerland | 0.9% | ||||||||
| ABB, Ltd. Sponsored ADR | 850 | $ | 22,721 | |||||
| PSP Swiss Property AG | 74 | 8,232 | ||||||
| Roche Holding AG | 220 | 73,442 | ||||||
| Swatch Group AG ADR | 1,755 | 20,832 | ||||||
| Swisscom AG | 31 | 17,159 | ||||||
| 142,386 | ||||||||
| United Kingdom | 1.6% | ||||||||
| Barclays PLC | 4,773 | 8,936 | ||||||
| BP PLC | 1,333 | 6,278 | ||||||
| Coca-Cola Europacific Partners PLC | 405 | 20,902 | ||||||
| Diageo PLC Sponsored ADR | 198 | 34,476 | ||||||
| Howden Joinery Group PLC | 388 | 2,865 | ||||||
| HSBC Holdings PLC | 890 | 5,806 | ||||||
| J Sainsbury PLC | 2,978 | 7,397 | ||||||
| National Grid PLC | 566 | 7,253 | ||||||
| Natwest Group PLC | 5,146 | 13,689 | ||||||
| RELX PLC Sponsored ADR | 1,255 | 33,810 | ||||||
| Segro PLC REIT | 382 | 4,543 | ||||||
| SSE PLC | 740 | 14,630 | ||||||
| Standard Chartered PLC | 3,558 | 26,827 | ||||||
| Unilever PLC | 534 | 24,305 | ||||||
| Unilever PLC Sponsored ADR | 688 | 31,531 | ||||||
| Virgin Money UK PLC | 3,097 | 4,723 | ||||||
| Vodafone Group PLC | 3,401 | 5,246 | ||||||
| 253,217 | ||||||||
| United States | 26.9% | ||||||||
| A-Mark Precious Metals, Inc. | 120 | 3,870 | ||||||
| Academy Sports & Outdoors, Inc. | 141 | 5,011 | ||||||
| Accenture PLC, Class A | 175 | 48,589 | ||||||
| Activision Blizzard, Inc. | 84 | 6,540 | ||||||
| Adobe, Inc. (*) | 12 | 4,393 | ||||||
| AGCO Corp. | 42 | 4,145 | ||||||
| Airbnb, Inc.,Class A (*) | 42 | 3,741 | ||||||
| Akamai Technologies, Inc. (*) | 45 | 4,110 | ||||||
| Albertsons Cos., Inc., Class A | 201 | 5,371 | ||||||
The accompanying notes are an integral part of these financial statements.
36 Semi-Annual Report
| Description | Shares | Fair Value | ||||||
| Lazard Global Dynamic Multi-Asset Portfolio (continued) | ||||||||
| Alleghany Corp. (*) | 6 | $ | 4,999 | |||||
| Allison Transmission Holdings, Inc. | 101 | 3,883 | ||||||
| Alphabet, Inc., Class A (*) | 28 | 61,019 | ||||||
| Alphabet, Inc., Class C (*) | 35 | 76,561 | ||||||
| Altria Group, Inc. | 835 | 34,878 | ||||||
| Amazon.com, Inc. (*) | 460 | 48,857 | ||||||
| Amdocs, Ltd. | 127 | 10,580 | ||||||
| AMERCO | 9 | 4,304 | ||||||
| Ameren Corp. | 120 | 10,843 | ||||||
| American Electric Power Co., Inc. | 330 | 31,660 | ||||||
| American Express Co. | 86 | 11,921 | ||||||
| American International Group, Inc. | 141 | 7,209 | ||||||
| AmerisourceBergen Corp. | 101 | 14,289 | ||||||
| AMN Healthcare Services, Inc. (*) | 139 | 15,250 | ||||||
| Amphenol Corp., Class A | 413 | 26,589 | ||||||
| Antero Resources Corp. (*) | 151 | 4,628 | ||||||
| Aon PLC, Class A | 177 | 47,733 | ||||||
| APA Corp. | 164 | 5,724 | ||||||
| Apple, Inc. | �� | 1,397 | 190,998 | |||||
| Assurant, Inc. | 90 | 15,556 | ||||||
| Automatic Data Processing, Inc. | 59 | 12,392 | ||||||
| AutoZone, Inc. (*) | 14 | 30,088 | ||||||
| Avery Dennison Corp. | 88 | 14,245 | ||||||
| Bank of America Corp. | 679 | 21,137 | ||||||
| Becton, Dickinson & Co. | 34 | 8,382 | ||||||
| Berkshire Hathaway, Inc., Class B (*) | 25 | 6,826 | ||||||
| BJ’s Wholesale Club Holdings, Inc. (*) | 196 | 12,215 | ||||||
| BlueLinx Holdings, Inc. (*) | 72 | 4,810 | ||||||
| Booking Holdings, Inc. (*) | 5 | 8,745 | ||||||
| Booz Allen Hamilton Holding Corp. | 354 | 31,987 | ||||||
| Boston Scientific Corp. (*) | 580 | 21,617 | ||||||
| Bristol-Myers Squibb Co. | 410 | 31,570 | ||||||
| Broadcom, Inc. | 78 | 37,893 | ||||||
| BRP, Inc. | 276 | 16,977 | ||||||
| Brunswick Corp. | 75 | 4,904 | ||||||
| Cadence Design Systems, Inc. (*) | 323 | 48,460 | ||||||
The accompanying notes are an integral part of these financial statements.
Semi-Annual Report 37
| Description | Shares | Fair Value | ||||||
| Lazard Global Dynamic Multi-Asset Portfolio (continued) | ||||||||
| Cboe Global Markets, Inc. | 239 | $ | 27,052 | |||||
| CF Industries Holdings, Inc. | 161 | 13,803 | ||||||
| Charter Communications, Inc., Class A (*) | 28 | 13,119 | ||||||
| Chipotle Mexican Grill, Inc. (*) | 3 | 3,922 | ||||||
| Chubb, Ltd. | 54 | 10,615 | ||||||
| Cigna Corp. | 67 | 17,656 | ||||||
| Citigroup, Inc. | 277 | 12,739 | ||||||
| Citizens Financial Group, Inc. | 68 | 2,427 | ||||||
| CMS Energy Corp. | 109 | 7,358 | ||||||
| Coca-Cola Consolidated, Inc. | 9 | 5,075 | ||||||
| Cognizant Technology Solutions Corp., Class A | 455 | 30,708 | ||||||
| Colgate-Palmolive Co. | 297 | 23,802 | ||||||
| Comcast Corp., Class A | 1,030 | 40,417 | ||||||
| Corteva, Inc. | 199 | 10,774 | ||||||
| CorVel Corp. (*) | 34 | 5,007 | ||||||
| Costco Wholesale Corp. | 18 | 8,627 | ||||||
| Coterra Energy, Inc. | 236 | 6,086 | ||||||
| Crowdstrike Holdings, Inc., Class A (*) | 29 | 4,888 | ||||||
| CSG Systems International, Inc. | 85 | 5,073 | ||||||
| Cushman & Wakefield PLC (*) | 401 | 6,111 | ||||||
| CVS Health Corp. | 501 | 46,423 | ||||||
| D.R. Horton, Inc. | 42 | 2,780 | ||||||
| Danaher Corp. | 14 | 3,549 | ||||||
| Darden Restaurants, Inc. | 50 | 5,656 | ||||||
| Darling Ingredients, Inc. (*) | 75 | 4,485 | ||||||
| Dave & Buster’s Entertainment, Inc. (*) | 116 | 3,802 | ||||||
| Deere & Co. | 56 | 16,770 | ||||||
| Diamondback Energy, Inc. | 97 | 11,752 | ||||||
| Dick’s Sporting Goods, Inc. | 50 | 3,769 | ||||||
| Digital Realty Trust, Inc. REIT | 57 | 7,400 | ||||||
| DocuSign, Inc. (*) | 36 | 2,066 | ||||||
| Dollar General Corp. | 155 | 38,043 | ||||||
| Dow, Inc. | 341 | 17,599 | ||||||
| Duke Energy Corp. | 57 | 6,111 | ||||||
| Electronic Arts, Inc. | 32 | 3,893 | ||||||
| Elevance Health, Inc. | 69 | 33,298 | ||||||
The accompanying notes are an integral part of these financial statements.
38 Semi-Annual Report
| Description | Shares | Fair Value | ||||||
| Lazard Global Dynamic Multi-Asset Portfolio (continued) | ||||||||
| Eli Lilly & Co. | 210 | $ | 68,088 | |||||
| Emerson Electric Co. | 56 | 4,454 | ||||||
| EnLink Midstream LLC | 460 | 3,910 | ||||||
| EOG Resources, Inc. | 60 | 6,626 | ||||||
| EPAM Systems, Inc. (*) | 30 | 8,843 | ||||||
| Equitable Holdings, Inc. | 163 | 4,249 | ||||||
| Everest Re Group, Ltd. | 61 | 17,097 | ||||||
| Evergy, Inc. | 145 | 9,461 | ||||||
| Exelon Corp. | 636 | 28,824 | ||||||
| Expedia Group, Inc. (*) | 130 | 12,328 | ||||||
| Extra Space Storage, Inc. REIT | 44 | 7,485 | ||||||
| FactSet Research Systems, Inc. | 21 | 8,076 | ||||||
| Fidelity National Financial, Inc. | 168 | 6,209 | ||||||
| Fiserv, Inc. (*) | 45 | 4,004 | ||||||
| Flagstar Bancorp, Inc. | 143 | 5,069 | ||||||
| Flowers Foods, Inc. | 601 | 15,818 | ||||||
| FNB Corp. | 616 | 6,690 | ||||||
| Fortinet, Inc. (*) | 288 | 16,295 | ||||||
| FOX Corp., Class B | 118 | 3,505 | ||||||
| Freeport-McMoRan, Inc. | 237 | 6,935 | ||||||
| Gartner, Inc. (*) | 19 | 4,595 | ||||||
| General Mills, Inc. | 91 | 6,866 | ||||||
| Gilead Sciences, Inc. | 279 | 17,245 | ||||||
| GoDaddy, Inc., Class A (*) | 63 | 4,382 | ||||||
| Grand Canyon Education, Inc. (*) | 56 | 5,275 | ||||||
| GSK PLC | 2,578 | 55,433 | ||||||
| HCA Healthcare, Inc. | 51 | 8,571 | ||||||
| Henry Schein, Inc. (*) | 171 | 13,123 | ||||||
| Home Depot, Inc. | 15 | 4,114 | ||||||
| Houlihan Lokey, Inc. | 44 | 3,473 | ||||||
| Huntsman Corp. | 285 | 8,080 | ||||||
| Ingles Markets, Inc., Class A | 64 | 5,552 | ||||||
| Intel Corp. | 439 | 16,423 | ||||||
| Intercontinental Exchange, Inc. | 456 | 42,882 | ||||||
| International Game Technology PLC | 227 | 4,213 | ||||||
| IQVIA Holdings, Inc. (*) | 225 | 48,823 | ||||||
The accompanying notes are an integral part of these financial statements.
Semi-Annual Report 39
| Description | Shares | Fair Value | ||||||
| Lazard Global Dynamic Multi-Asset Portfolio (continued) | ||||||||
| Jack Henry & Associates, Inc. | 51 | $ | 9,181 | |||||
| Jackson Financial, Inc., Class A | 242 | 6,474 | ||||||
| JB Hunt Transport Services, Inc. | 135 | 21,258 | ||||||
| Johnson & Johnson | 464 | 82,365 | ||||||
| Jones Lang LaSalle, Inc. (*) | 21 | 3,672 | ||||||
| JPMorgan Chase & Co. | 56 | 6,306 | ||||||
| Kellogg Co. | 233 | 16,622 | ||||||
| Keysight Technologies, Inc. (*) | 260 | 35,841 | ||||||
| Kforce, Inc. | 62 | 3,803 | ||||||
| Kimberly-Clark Corp. | 197 | 26,625 | ||||||
| KLA Corp. | 17 | 5,424 | ||||||
| Lattice Semiconductor Corp. (*) | 187 | 9,070 | ||||||
| Life Storage, Inc. REIT | 119 | 13,288 | ||||||
| Lockheed Martin Corp. | 168 | 72,233 | ||||||
| Lowe’s Cos., Inc. | 212 | 37,030 | ||||||
| LPL Financial Holdings, Inc. | 28 | 5,165 | ||||||
| LyondellBasell Industries NV, Class A | 46 | 4,023 | ||||||
| Magnolia Oil & Gas Corp., Class A | 349 | 7,326 | ||||||
| Marathon Oil Corp. | 367 | 8,250 | ||||||
| Markel Corp. (*) | 3 | 3,880 | ||||||
| Masco Corp. | 296 | 14,978 | ||||||
| MasterCard, Inc., Class A | 47 | 14,828 | ||||||
| Matson, Inc. | 84 | 6,122 | ||||||
| MaxLinear, Inc. (*) | 106 | 3,602 | ||||||
| McDonald’s Corp. | 236 | 58,264 | ||||||
| Medtronic PLC | 93 | 8,347 | ||||||
| Merck & Co., Inc. | 910 | 82,965 | ||||||
| Meta Platforms, Inc., Class A (*) | 110 | 17,737 | ||||||
| MetLife, Inc. | 281 | 17,644 | ||||||
| Micron Technology, Inc. | 62 | 3,427 | ||||||
| Microsoft Corp. | 833 | 213,939 | ||||||
| Molina Healthcare, Inc. (*) | 20 | 5,592 | ||||||
| Monolithic Power Systems, Inc. | 37 | 14,209 | ||||||
| Motorola Solutions, Inc. | 238 | 49,885 | ||||||
| National Fuel Gas Co. | 354 | 23,382 | ||||||
| NetApp, Inc. | 98 | 6,394 | ||||||
The accompanying notes are an integral part of these financial statements.
40 Semi-Annual Report
| Description | Shares | Fair Value | ||||||
| Lazard Global Dynamic Multi-Asset Portfolio (continued) | ||||||||
| NIKE, Inc., Class B | 227 | $ | 23,199 | |||||
| NiSource, Inc. | 312 | 9,201 | ||||||
| Northrop Grumman Corp. | 14 | 6,700 | ||||||
| NorthWestern Corp. | 71 | 4,184 | ||||||
| NRG Energy, Inc. | 62 | 2,367 | ||||||
| Nucor Corp. | 86 | 8,979 | ||||||
| NVIDIA Corp. | 135 | 20,465 | ||||||
| NVR, Inc. (*) | 1 | 4,004 | ||||||
| O’Reilly Automotive, Inc. (*) | 38 | 24,007 | ||||||
| Oasis Petroleum, Inc. | 39 | 4,744 | ||||||
| Occidental Petroleum Corp. | 128 | 7,537 | ||||||
| Old Dominion Freight Line, Inc. | 10 | 2,563 | ||||||
| Omnicom Group, Inc. | 98 | 6,234 | ||||||
| Otter Tail Corp. | 92 | 6,176 | ||||||
| Ovintiv, Inc. | 222 | 9,810 | ||||||
| Owens Corning | 70 | 5,202 | ||||||
| Paychex, Inc. | 266 | 30,289 | ||||||
| Paycom Software, Inc. (*) | 15 | 4,202 | ||||||
| PepsiCo, Inc. | 113 | 18,833 | ||||||
| Pfizer, Inc. | 705 | 36,963 | ||||||
| Piedmont Office Realty Trust, Inc. REIT Class A | 386 | 5,064 | ||||||
| Pinnacle West Capital Corp. | 338 | 24,715 | ||||||
| Portland General Electric Co. | 92 | 4,446 | ||||||
| Power Integrations, Inc. | 43 | 3,225 | ||||||
| Premier, Inc., Class A | 126 | 4,496 | ||||||
| PTC, Inc. (*) | 221 | 23,501 | ||||||
| Public Storage REIT | 58 | 18,135 | ||||||
| QIAGEN NV | 94 | 4,415 | ||||||
| QUALCOMM, Inc. | 318 | 40,621 | ||||||
| QuidelOrtho Corp. (*) | 38 | 3,693 | ||||||
| Regeneron Pharmaceuticals, Inc. (*) | 10 | 5,911 | ||||||
| Regions Financial Corp. | 367 | 6,881 | ||||||
| Republic Services, Inc. | 368 | 48,160 | ||||||
| Rockwell Automation, Inc. | 88 | 17,539 | ||||||
| S&P Global, Inc. | 98 | 33,032 | ||||||
| SBA Communications Corp. REIT | 30 | 9,602 | ||||||
The accompanying notes are an integral part of these financial statements.
Semi-Annual Report 41
| Description | Shares | Fair Value | ||||||
| Lazard Global Dynamic Multi-Asset Portfolio (continued) | ||||||||
| Sempra Energy | 49 | $ | 7,363 | |||||
| Service Corp. International | 110 | 7,603 | ||||||
| Sirius XM Holdings, Inc. | 716 | 4,389 | ||||||
| Six Flags Entertainment Corp. (*) | 209 | 4,535 | ||||||
| SLM Corp. | 238 | 3,794 | ||||||
| Southwestern Energy Co. (*) | 544 | 3,400 | ||||||
| SpartanNash Co. | 153 | 4,616 | ||||||
| State Street Corp. | 66 | 4,069 | ||||||
| Steel Dynamics, Inc. | 106 | 7,012 | ||||||
| Stellantis NV | 1,436 | 17,883 | ||||||
| Sturm Ruger & Co., Inc. | 82 | 5,219 | ||||||
| Synopsys, Inc. (*) | 237 | 71,977 | ||||||
| Target Corp. | 17 | 2,401 | ||||||
| Tesla, Inc. (*) | 73 | 49,160 | ||||||
| Tetra Tech, Inc. | 32 | 4,370 | ||||||
| Texas Instruments, Inc. | 186 | 28,579 | ||||||
| Texas Pacific Land Corp. | 3 | 4,464 | ||||||
| Texas Roadhouse, Inc. | 133 | 9,736 | ||||||
| The Charles Schwab Corp. | 385 | 24,324 | ||||||
| The Coca-Cola Co. | 792 | 49,825 | ||||||
| The Goldman Sachs Group, Inc. | 33 | 9,802 | ||||||
| The Hartford Financial Services Group, Inc. | 73 | 4,776 | ||||||
| The Hershey Co. | 152 | 32,704 | ||||||
| The Interpublic Group of Cos., Inc. | 317 | 8,727 | ||||||
| The Kroger Co. | 79 | 3,739 | ||||||
| The Mosaic Co. | 230 | 10,863 | ||||||
| The Procter & Gamble Co. | 459 | 66,000 | ||||||
| The TJX Cos., Inc. | 147 | 8,210 | ||||||
| The Toro Co. | 43 | 3,259 | ||||||
| The Travelers Cos., Inc. | 23 | 3,890 | ||||||
| Thermo Fisher Scientific, Inc. | 90 | 48,895 | ||||||
| TopBuild Corp. (*) | 61 | 10,197 | ||||||
| Tractor Supply Co. | 70 | 13,569 | ||||||
| Tyson Foods, Inc., Class A | 198 | 17,040 | ||||||
| Ulta Beauty, Inc. (*) | 32 | 12,335 | ||||||
| UMH Properties, Inc. REIT | 237 | 4,185 | ||||||
The accompanying notes are an integral part of these financial statements.
42 Semi-Annual Report
| Description | Shares | Fair Value | ||||||
| Lazard Global Dynamic Multi-Asset Portfolio (continued) | ||||||||
| UnitedHealth Group, Inc. | 133 | $ | 68,313 | |||||
| Valero Energy Corp. | 103 | 10,947 | ||||||
| Veeva Systems, Inc.,Class A (*) | 23 | 4,555 | ||||||
| Verizon Communications, Inc. | 1,207 | 61,255 | ||||||
| Vertex Pharmaceuticals, Inc. (*) | 34 | 9,581 | ||||||
| Virtu Financial, Inc., Class A | 141 | 3,301 | ||||||
| Visa, Inc., Class A | 237 | 46,663 | ||||||
| Vistra Corp. | 204 | 4,661 | ||||||
| Warner Music Group Corp., Class A | 345 | 8,404 | ||||||
| Washington Federal, Inc. | 373 | 11,197 | ||||||
| Waste Management, Inc. | 72 | 11,015 | ||||||
| WEC Energy Group, Inc. | 41 | 4,126 | ||||||
| Wells Fargo & Co. | 576 | 22,562 | ||||||
| Werner Enterprises, Inc. | 119 | 4,586 | ||||||
| Westlake Corp. | 40 | 3,921 | ||||||
| Weyerhaeuser Co. REIT | 270 | 8,942 | ||||||
| WW Grainger, Inc. | 20 | 9,089 | ||||||
| Xcel Energy, Inc. | 123 | 8,703 | ||||||
| Zoetis, Inc. | 222 | 38,160 | ||||||
| 4,302,307 | ||||||||
| Total Common Stocks (Cost $5,567,577) | 6,300,689 | |||||||
| Description | Security Currency | Principal Amount (000) | Fair Value | |||||||
| Corporate Bonds | 22.0% | ||||||||||
| Australia | 0.8% | ||||||||||
| Telstra Corp., Ltd. MTN, 4.000%, 04/19/27 | AUD | 200 | $ | 132,963 | ||||||
| Canada | 1.0% | ||||||||||
| Canadian Imperial Bank of Commerce, 0.950%, 10/23/25 | USD | 175 | 157,851 | |||||||
The accompanying notes are an integral part of these financial statements.
Semi-Annual Report 43
| Description | Security Currency | Principal Amount (000) | Fair Value | |||||||
| Lazard Global Dynamic Multi-Asset Portfolio (continued) | ||||||||||
| Germany | 0.6% | ||||||||||
| Mercedes-Benz Group AG, 0.750%, 09/10/30 | EUR | 110 | $ | 96,137 | ||||||
| Netherlands | 0.6% | ||||||||||
| ING Groep NV MTN, 1.125% (SONIA + 0.905%), 12/07/28 (§) | GBP | 100 | 101,816 | |||||||
| Switzerland | 0.3% | ||||||||||
| ABB Finance USA, Inc., 4.375%, 05/08/42 | USD | 57 | 53,043 | |||||||
| United States | 18.7% | ||||||||||
| Adobe, Inc., 2.300%, 02/01/30 | USD | 125 | 110,386 | |||||||
| Alphabet, Inc., 1.100%, 08/15/30 | USD | 60 | 49,243 | |||||||
| Amazon.com, Inc., 3.150%, 08/22/27 | USD | 50 | 48,614 | |||||||
| American Express Co., 4.050%, 05/03/29 | USD | 100 | 98,045 | |||||||
| Amgen, Inc., 3.000%, 02/22/29 | USD | 115 | 106,073 | |||||||
| Apple, Inc., 3.000%, 06/20/27 | USD | 50 | 48,884 | |||||||
| Ball Corp., 4.875%, 03/15/26 | USD | 70 | 68,863 | |||||||
| Bank of America Corp.: 1.486% (SOFR + 1.460%), 05/19/24 (§) | USD | 70 | 68,407 | |||||||
| 1.978% (CDOR 3 Month + 0.600%), 09/15/27 (§) | CAD | 150 | 103,688 | |||||||
| Citigroup, Inc., 1.281% (SOFR + 0.528%), 11/03/25 (§) | USD | 160 | 148,557 | |||||||
The accompanying notes are an integral part of these financial statements.
44 Semi-Annual Report
| Description | Security Currency | Principal Amount (000) | Fair Value | |||||||
| Lazard Global Dynamic Multi-Asset Portfolio (continued) | ||||||||||
| Clean Harbors, Inc., 4.875%, 07/15/27 | USD | 70 | $ | 64,050 | ||||||
| Dell International LLC, 5.300%, 10/01/29 | USD | 95 | 93,654 | |||||||
| John Deere Financial, Inc., 2.410%, 01/14/25 | CAD | 180 | 133,713 | |||||||
| Johnson Controls International PLC, 1.750%, 09/15/30 | USD | 125 | 101,632 | |||||||
| JPMorgan Chase & Co., 3.540% (USD LIBOR 3 Month + 1.380%), 05/01/28 (§) | USD | 155 | 146,956 | |||||||
| Kimberly-Clark Corp., 3.200%, 04/25/29 | USD | 113 | 107,185 | |||||||
| McDonald’s Corp., 3.125%, 03/04/25 | CAD | 110 | 83,219 | |||||||
| Microsoft Corp., 3.500%, 11/15/42 | USD | 55 | 48,693 | |||||||
| Morgan Stanley, 3.625%, 01/20/27 | USD | 125 | 121,070 | |||||||
| Mueller Water Products, Inc., 4.000%, 06/15/29 (#) | USD | 80 | 69,787 | |||||||
| PepsiCo, Inc., 2.875%, 10/15/49 | USD | 65 | 51,608 | |||||||
| Pfizer, Inc., 2.625%, 04/01/30 | USD | 115 | 105,004 | |||||||
| Prologis LP REIT, 1.250%, 10/15/30 | USD | 190 | 150,193 | |||||||
| Schneider Electric SE, 0.875%, 12/13/26 | EUR | 100 | 98,711 | |||||||
| Service Corp. International, 4.625%, 12/15/27 | USD | 75 | 70,500 | |||||||
| Starbucks Corp., 4.450%, 08/15/49 | USD | 55 | 49,311 | |||||||
| The Goldman Sachs Group, Inc., 1.992% (SOFR + 1.090%), 01/27/32 (§) | USD | 145 | 114,541 | |||||||
The accompanying notes are an integral part of these financial statements.
Semi-Annual Report 45
| Description | Security Currency | Principal Amount (000) | Fair Value | |||||||
| Lazard Global Dynamic Multi-Asset Portfolio (continued) | ||||||||||
| The Home Depot, Inc., 5.875%, 12/16/36 | USD | 55 | $ | 63,238 | ||||||
| The Procter & Gamble Co., 1.200%, 10/29/30 | USD | 70 | 57,161 | |||||||
| Toyota Motor Credit Corp., 2.150%, 02/13/30 | USD | 125 | 108,214 | |||||||
| United Rentals North America, Inc., 4.875%, 01/15/28 | USD | 70 | 66,184 | |||||||
| Verizon Communications, Inc., 3.875%, 02/08/29 | USD | 149 | 144,156 | |||||||
| Visa, Inc., 0.750%, 08/15/27 | USD | 95 | 82,414 | |||||||
| 2,981,954 | ||||||||||
| Total Corporate Bonds (Cost $3,886,093) | 3,523,764 | |||||||||
| Description | Shares | Fair Value | ||||||||
| Exchange-Traded Funds | 1.1% | ||||||||||
| iShares MSCI World ETF (Cost $134,914) | 1,601 | $ | 171,115 | |||||||
| Description | Security Currency | Principal Amount (000) | Fair Value | |||||||
| Foreign Government Obligations | 23.1% | ||||||||||
| Australia | 1.5% | ||||||||||
| New South Wales Treasury Corp., 1.250%, 11/20/30 | AUD | 165 | $ | 90,738 | ||||||
| Queensland Treasury Corp., 1.250%, 03/10/31 | AUD | 260 | 141,970 | |||||||
| 232,708 | ||||||||||
The accompanying notes are an integral part of these financial statements.
46 Semi-Annual Report
| Description | Security Currency | Principal Amount (000) | Fair Value | |||||||
| Lazard Global Dynamic Multi-Asset Portfolio (continued) | ||||||||||
| Bahamas | 0.4% | ||||||||||
| Commonwealth of Bahamas, 6.950%, 11/20/29 | USD | 95 | $ | 68,893 | ||||||
| Canada | 3.6% | ||||||||||
| City of Vancouver, 2.900%, 11/20/25 | CAD | 115 | 87,656 | |||||||
| Export Development Canada, 1.650%, 07/31/24 | CAD | 180 | 135,191 | |||||||
| Province of British Columbia Canada, 3.200%, 06/18/44 | CAD | 135 | 89,682 | |||||||
| Province of Quebec: 2.500%, 04/20/26 | USD | 115 | 111,666 | |||||||
| 1.850%, 02/13/27 | CAD | 210 | 151,756 | |||||||
| 575,951 | ||||||||||
| Chile | 1.5% | ||||||||||
| Bonos de la Tesoreria de la Republica en pesos: | ||||||||||
| 5.800%, 06/01/24 | CLP | 75,000 | 79,543 | |||||||
| 2.300%, 10/01/28 | CLP | 100,000 | 86,035 | |||||||
| Republic of Chile, 0.830%, 07/02/31 | EUR | 100 | 81,662 | |||||||
| 247,240 | ||||||||||
| Colombia | 0.3% | ||||||||||
| Republic of Colombia, 9.850%, 06/28/27 | COP | 205,000 | 47,231 | |||||||
| Czech Republic | 1.0% | ||||||||||
| Czech Republic, 1.000%, 06/26/26 | CZK | 4,620 | 164,078 | |||||||
| France | 0.3% | ||||||||||
| Government of France, 1.750%, 06/25/39 | EUR | 45 | 43,916 | |||||||
The accompanying notes are an integral part of these financial statements.
Semi-Annual Report 47
| Description | Security Currency | Principal Amount (000) | Fair Value | |||||||
| Lazard Global Dynamic Multi-Asset Portfolio (continued) | ||||||||||
| Hungary | 0.7% | ||||||||||
| Hungary Government Bonds, 2.750%, 12/22/26 | HUF | 31,740 | $ | 66,676 | ||||||
| Hungary Government International Bond, 1.750%, 06/05/35 | EUR | 50 | 36,983 | |||||||
| 103,659 | ||||||||||
| Ireland | 0.3% | ||||||||||
| Ireland Government Bonds, 1.350%, 03/18/31 | EUR | 45 | 45,443 | |||||||
| Japan | 1.2% | ||||||||||
| Japan International Cooperation Agency, 3.250%, 05/25/27 | USD | 200 | 197,396 | |||||||
| Mexico | 1.3% | ||||||||||
| Mexican Bonos: | ||||||||||
| 8.000%, 09/05/24 | MXN | 2,110 | 102,073 | |||||||
| 7.500%, 06/03/27 | MXN | 2,260 | 104,992 | |||||||
| United Mexican States, 6.750%, 02/06/24 | GBP | 5 | 6,295 | |||||||
| 213,360 | ||||||||||
| Morocco | 0.4% | ||||||||||
| Morocco Government International Bond, 1.500%, 11/27/31 | EUR | 100 | 69,446 | |||||||
| New Zealand | 3.7% | ||||||||||
| Housing New Zealand, Ltd. MTN, 3.420%, 10/18/28 | NZD | 130 | 76,895 | |||||||
| New Zealand Local Government Funding Agency Bonds: | ||||||||||
| 2.250%, 04/15/24 | NZD | 430 | 260,255 | |||||||
| 1.500%, 04/20/29 | NZD | 340 | 176,342 | |||||||
| 2.000%, 04/15/37 | NZD | 190 | 82,759 | |||||||
| 596,251 | ||||||||||
| Norway | 0.6% | ||||||||||
| Oslo Kommune, 2.350%, 09/04/24 | NOK | 1,000 | 99,002 | |||||||
The accompanying notes are an integral part of these financial statements.
48 Semi-Annual Report
| Description | Security Currency | Principal Amount (000) | Fair Value | |||||||
| Lazard Global Dynamic Multi-Asset Portfolio (continued) | ||||||||||
| Panama | 1.1% | ||||||||||
| Republic of Panama, 8.875%, 09/30/27 | USD | 145 | $ | 170,765 | ||||||
| Peru | 1.2% | ||||||||||
| Peru Government Bonds: | ||||||||||
| 6.150%, 08/12/32 | PEN | 394 | 90,780 | |||||||
| 3.000%, 01/15/34 | USD | 115 | 94,357 | |||||||
| 185,137 | ||||||||||
| Poland | 0.6% | ||||||||||
| Poland Government Bonds, 6.680% (WIBOR 6 Month), 05/25/28 (§) | PLN | 450 | 94,566 | |||||||
| Portugal | 0.6% | ||||||||||
| Portugal Obrigacoes do Tesouro OT, 1.650%, 07/16/32 | EUR | 100 | 97,409 | |||||||
| Singapore | 0.6% | ||||||||||
| Singapore Government Bond, 3.375%, 09/01/33 | SGD | 125 | 92,942 | |||||||
| Spain | 0.7% | ||||||||||
| Spain Government Bond, 1.000%, 07/30/42 | EUR | 140 | 104,619 | |||||||
| Thailand | 0.6% | ||||||||||
| Thailand Government Bonds, 1.585%, 12/17/35 | THB | 4,265 | 97,375 | |||||||
| United Kingdom | 0.9% | ||||||||||
| United Kingdom Gilt: | ||||||||||
| 0.875%, 07/31/33 | GBP | 90 | 93,676 | |||||||
| 1.500%, 07/22/47 | GBP | 50 | 48,290 | |||||||
| 141,966 | ||||||||||
| Total Foreign Government Obligations (Cost $4,266,409) | 3,689,353 | |||||||||
The accompanying notes are an integral part of these financial statements.
Semi-Annual Report 49
| Description | Security Currency | Principal Amount (000) | Fair Value | |||||||
| Lazard Global Dynamic Multi-Asset Portfolio (continued) | ||||||||||
| Quasi Government Bonds | 1.0% | ||||||||||
| Germany | 1.0% | ||||||||||
| Kreditanstalt fuer Wiederaufbau, 1.750%, 09/14/29 (Cost $165,131) | USD | 165 | $ | 150,104 | ||||||
| Supranational Bonds | 6.1% | ||||||||||
| Asian Development Bank, 2.125%, 03/19/25 | USD | 103 | 100,400 | |||||||
| European Investment Bank, 1.000%, 01/28/28 | CAD | 170 | 115,891 | |||||||
| Inter-American Development Bank, 7.875%, 03/14/23 | IDR | 2,370,000 | 161,744 | |||||||
| Inter-American Investment Corp., 1.100%, 06/30/26 | AUD | 62 | 38,000 | |||||||
| International Bank for Reconstruction & Development: | ||||||||||
| 1.900%, 01/16/25 | CAD | 205 | 153,522 | |||||||
| 2.900%, 11/26/25 | AUD | 135 | 90,300 | |||||||
| 1.250%, 03/16/26 | NOK | 990 | 93,858 | |||||||
| 1.125%, 09/13/28 | USD | 62 | 54,755 | |||||||
| International Finance Corp.: | ||||||||||
| 2.125%, 04/07/26 | USD | 90 | 86,645 | |||||||
| 1.500%, 04/15/35 | AUD | 172 | 81,464 | |||||||
| Total Supranational Bonds (Cost $1,072,908) | 976,579 | |||||||||
| US Municipal Bonds | 1.1% | ||||||||||
| California | 0.9% | ||||||||||
| State of California, 7.550%, 04/01/39 | USD | 105 | 142,432 | |||||||
The accompanying notes are an integral part of these financial statements.
50 Semi-Annual Report
| Description | Security Currency | Principal Amount (000) | Fair Value | |||||||
| Lazard Global Dynamic Multi-Asset Portfolio (continued) | ||||||||||
| New York | 0.2% | ||||||||||
| New York State Urban Development Corp., Series B, 3.900%, 03/15/33 | USD | 40 | $ | 39,031 | ||||||
| Total US Municipal Bonds (Cost $214,398) | 181,463 | |||||||||
| US Treasury Securities | 1.8% | ||||||||||
| U.S. Treasury Bond, 1.750%, 08/15/41 (Cost $334,077) | USD | 375 | 285,249 | |||||||
| Description | Shares | Fair Value | ||||||
| Short-Term Investments | 4.6% | ||||||||
| State Street Institutional Treasury Money Market Fund, Premier Class, 1.04% (7 day yield) (Cost $738,918) | 738,918 | $ | 738,918 | |||||
| Total Investments | 100.2% (Cost $16,380,425) (») | $ | 16,017,234 | ||||||
| Liabilities in Excess of Cash and Other Assets l (0.2)% | (26,679 | ) | ||||||
| Net Assets | 100.0% | $ | 15,990,555 | ||||||
The accompanying notes are an integral part of these financial statements.
Semi-Annual Report 51
Lazard Global Dynamic Multi-Asset Portfolio (continued)
Forward Currency Contracts open at June 30, 2022:
| Currency Purchased | Quantity | Currency Sold | Quantity | Counterparty | Settlement Date | Unrealized Appreciation | Unrealized Depreciation | |||||||||||||||
| AUD | 10,948 | USD | 7,600 | HSB | 07/13/22 | $ | — | $ | 43 | |||||||||||||
| AUD | 51,289 | USD | 35,600 | HSB | 07/13/22 | — | 197 | |||||||||||||||
| AUD | 40,545 | USD | 30,100 | JPM | 07/13/22 | — | 2,113 | |||||||||||||||
| CAD | 14,837 | USD | 11,800 | HSB | 07/13/22 | — | 273 | |||||||||||||||
| CAD | 17,942 | USD | 13,900 | HSB | 07/13/22 | 39 | — | |||||||||||||||
| CAD | 26,703 | USD | 21,000 | HSB | 07/13/22 | — | 254 | |||||||||||||||
| CAD | 604,507 | USD | 480,292 | JPM | 07/13/22 | — | 10,644 | |||||||||||||||
| CHF | 2,682 | USD | 2,800 | HSB | 07/13/22 | 11 | — | |||||||||||||||
| CHF | 99,973 | USD | 107,817 | HSB | 07/13/22 | — | 3,047 | |||||||||||||||
| CHF | 7,328 | USD | 7,904 | MSC | 07/13/22 | — | 224 | |||||||||||||||
| CLP | 16,021,000 | USD | 18,500 | CIT | 07/13/22 | — | 1,068 | |||||||||||||||
| CLP | 40,096,245 | USD | 48,300 | CIT | 07/13/22 | — | 4,673 | |||||||||||||||
| CNH | 269,439 | USD | 40,300 | HSB | 07/13/22 | — | 43 | |||||||||||||||
| CNH | 675,367 | USD | 99,100 | HSB | 07/13/22 | 1,807 | — | |||||||||||||||
| CNH | 1,806,087 | USD | 281,990 | HSB | 07/13/22 | — | 12,140 | |||||||||||||||
| CNH | 1,428,430 | USD | 212,505 | HSB | 08/31/22 | 818 | — | |||||||||||||||
| CNH | 1,143,653 | USD | 178,566 | JPM | 07/13/22 | — | 7,692 | |||||||||||||||
| COP | 25,092,644 | USD | 6,030 | HSB | 07/28/22 | — | 12 | |||||||||||||||
| COP | 73,631,560 | USD | 17,872 | HSB | 07/28/22 | — | 211 | |||||||||||||||
| CZK | 65,771 | USD | 2,800 | HSB | 07/13/22 | — | 16 | |||||||||||||||
| EUR | 623,533 | USD | 681,609 | CIT | 07/13/22 | — | 27,848 | |||||||||||||||
| EUR | 14,318 | USD | 14,984 | HSB | 07/13/22 | 28 | — | |||||||||||||||
| EUR | 88,642 | USD | 93,600 | HSB | 07/13/22 | — | 661 | |||||||||||||||
| EUR | 887,718 | USD | 970,364 | HSB | 07/13/22 | — | 39,611 | |||||||||||||||
| EUR | 28,688 | USD | 30,871 | JPM | 08/24/22 | — | 704 | |||||||||||||||
| EUR | 57,335 | USD | 60,873 | JPM | 09/28/22 | — | 423 | |||||||||||||||
| GBP | 10,321 | USD | 13,450 | HSB | 07/13/22 | — | 885 | |||||||||||||||
| GBP | 19,550 | USD | 24,000 | HSB | 07/13/22 | — | 200 | |||||||||||||||
| GBP | 25,443 | USD | 31,900 | HSB | 07/13/22 | — | 925 | |||||||||||||||
| GBP | 63,491 | USD | 82,743 | JPM | 07/13/22 | — | 5,449 | |||||||||||||||
| GBP | 77,000 | USD | 100,149 | JPM | 07/13/22 | — | 6,408 | |||||||||||||||
| IDR | 468,175,562 | USD | 31,322 | JPM | 07/22/22 | — | 23 | |||||||||||||||
| JPY | 29,935,769 | USD | 239,509 | CIT | 07/13/22 | — | 18,777 | |||||||||||||||
| JPY | 6,028,730 | USD | 47,300 | HSB | 07/13/22 | — | 2,847 | |||||||||||||||
The accompanying notes are an integral part of these financial statements.
52 Semi-Annual Report
Lazard Global Dynamic Multi-Asset Portfolio (continued)
| Currency Purchased | Quantity | Currency Sold | Quantity | Counterparty | Settlement Date | Unrealized Appreciation | Unrealized Depreciation | |||||||||||||||
| JPY | 8,550,652 | USD | 63,300 | HSB | 07/13/22 | $ | — | $ | 252 | |||||||||||||
| JPY | 104,307,425 | USD | 834,551 | HSB | 07/13/22 | — | 65,438 | |||||||||||||||
| JPY | 6,115,939 | USD | 47,900 | JPM | 07/13/22 | — | 2,804 | |||||||||||||||
| JPY | 12,449,106 | USD | 96,400 | JPM | 07/13/22 | — | 4,606 | |||||||||||||||
| JPY | 20,371,752 | USD | 162,975 | JPM | 07/13/22 | — | 12,764 | |||||||||||||||
| KRW | 59,855,785 | USD | 47,300 | JPM | 07/22/22 | — | 850 | |||||||||||||||
| KRW | 143,045,217 | USD | 115,280 | JPM | 07/22/22 | — | 4,272 | |||||||||||||||
| MXN | 65,770 | USD | 3,300 | HSB | 07/13/22 | — | 34 | |||||||||||||||
| MXN | 899,213 | USD | 44,200 | JPM | 07/13/22 | 452 | — | |||||||||||||||
| NOK | 742,645 | USD | 84,350 | JPM | 07/13/22 | — | 8,945 | |||||||||||||||
| NZD | 4,441 | USD | 2,800 | HSB | 11/10/22 | — | 31 | |||||||||||||||
| NZD | 109,986 | USD | 70,666 | HSB | 11/10/22 | — | 2,084 | |||||||||||||||
| PLN | 8,460 | USD | 1,900 | HSB | 07/13/22 | — | 14 | |||||||||||||||
| RON | 35,669 | USD | 7,600 | HSB | 07/13/22 | — | 49 | |||||||||||||||
| RON | 185,347 | USD | 39,200 | HSB | 07/13/22 | 38 | — | |||||||||||||||
| RON | 226,043 | USD | 50,100 | HSB | 07/13/22 | — | 2,247 | |||||||||||||||
| RON | 245,812 | USD | 53,600 | HSB | 07/13/22 | — | 1,562 | |||||||||||||||
| SEK | 24,297 | USD | 2,400 | HSB | 07/13/22 | — | 24 | |||||||||||||||
| SEK | 408,915 | USD | 43,240 | HSB | 07/13/22 | — | 3,257 | |||||||||||||||
| SEK | 73,529 | USD | 7,773 | JPM | 07/13/22 | — | 583 | |||||||||||||||
| THB | 46,523 | USD | 1,395 | JPM | 10/12/22 | — | 73 | |||||||||||||||
| USD | 45,265 | AUD | 65,762 | HSB | 07/13/22 | — | 128 | |||||||||||||||
| USD | 135,060 | AUD | 180,854 | HSB | 07/13/22 | 10,222 | — | |||||||||||||||
| USD | 11,535 | AUD | 15,634 | JPM | 07/13/22 | 744 | — | |||||||||||||||
| USD | 27,259 | AUD | 36,709 | JPM | 07/13/22 | 1,920 | — | |||||||||||||||
| USD | 307,018 | AUD | 411,085 | JPM | 07/13/22 | 23,260 | — | |||||||||||||||
| USD | 466,879 | CAD | 587,646 | CIT | 07/13/22 | 10,332 | — | |||||||||||||||
| USD | 15,781 | CAD | 20,397 | CIT | 09/28/22 | — | 67 | |||||||||||||||
| USD | 3,809 | CAD | 4,901 | HSB | 07/13/22 | 1 | — | |||||||||||||||
| USD | 39,574 | CAD | 51,039 | JPM | 07/13/22 | — | 79 | |||||||||||||||
| USD | 805,942 | CAD | 1,014,379 | JPM | 07/13/22 | 17,862 | — | |||||||||||||||
| USD | 1,942 | CHF | 1,801 | HSB | 07/13/22 | 55 | — | |||||||||||||||
| USD | 61,200 | CHF | 57,454 | HSB | 07/13/22 | 989 | — | |||||||||||||||
| USD | 6,768 | CHF | 6,443 | SSB | 09/28/22 | — | 23 | |||||||||||||||
| USD | 177,416 | CLP | 145,995,590 | CIT | 07/13/22 | 18,565 | — | |||||||||||||||
| USD | 73,267 | COP | 292,428,820 | HSB | 07/28/22 | 3,125 | — | |||||||||||||||
The accompanying notes are an integral part of these financial statements.
Semi-Annual Report 53
Lazard Global Dynamic Multi-Asset Portfolio (continued)
| Currency Purchased | Quantity | Currency Sold | Quantity | Counterparty | Settlement Date | Unrealized Appreciation | Unrealized Depreciation | |||||||||||||||
| USD | 42,575 | CZK | 1,000,287 | HSB | 07/13/22 | $ | 240 | $ | — | |||||||||||||
| USD | 56,955 | CZK | 1,288,880 | HSB | 07/13/22 | 2,406 | — | |||||||||||||||
| USD | 15,930 | CZK | 360,641 | JPM | 07/13/22 | 667 | — | |||||||||||||||
| USD | 11,276 | DKK | 79,017 | SSB | 09/28/22 | 74 | — | |||||||||||||||
| USD | 243,243 | EUR | 222,518 | CIT | 07/13/22 | 9,938 | — | |||||||||||||||
| USD | 45,400 | EUR | 43,276 | HSB | 07/13/22 | 26 | — | |||||||||||||||
| USD | 74,386 | EUR | 70,519 | HSB | 07/13/22 | 448 | — | |||||||||||||||
| USD | 189,292 | EUR | 179,651 | HSB | 07/13/22 | 932 | — | |||||||||||||||
| USD | 19,703 | GBP | 16,122 | HSB | 07/13/22 | 77 | — | |||||||||||||||
| USD | 23,736 | GBP | 19,314 | SSB | 09/28/22 | 186 | — | |||||||||||||||
| USD | 17,200 | HUF | 6,066,830 | HSB | 07/13/22 | 1,184 | — | |||||||||||||||
| USD | 30,209 | HUF | 10,661,070 | JPM | 07/13/22 | 2,066 | — | |||||||||||||||
| USD | 47,200 | IDR | 691,008,000 | JPM | 07/22/22 | 1,003 | — | |||||||||||||||
| USD | 49,813 | IDR | 717,302,082 | JPM | 07/22/22 | 1,858 | — | |||||||||||||||
| USD | 73,000 | JPY | 9,945,593 | JPM | 07/13/22 | — | 334 | |||||||||||||||
| USD | 77,400 | JPY | 10,181,815 | JPM | 07/13/22 | 2,324 | — | |||||||||||||||
| USD | 28,268 | JPY | 3,584,394 | JPM | 08/24/22 | 1,764 | — | |||||||||||||||
| USD | 72,487 | JPY | 9,740,434 | JPM | 09/28/22 | 262 | — | |||||||||||||||
| USD | 15,229 | JPY | 2,046,351 | SSB | 09/28/22 | 55 | — | |||||||||||||||
| USD | 56,700 | KRW | 72,360,540 | JPM | 07/22/22 | 546 | — | |||||||||||||||
| USD | 79,209 | MXN | 1,604,607 | HSB | 07/13/22 | — | 470 | |||||||||||||||
| USD | 11,162 | MXN | 222,379 | JPM | 07/13/22 | 120 | — | |||||||||||||||
| USD | 47,421 | MXN | 961,266 | JPM | 07/13/22 | — | 313 | |||||||||||||||
| USD | 49,200 | MXN | 995,993 | JPM | 07/13/22 | — | 257 | |||||||||||||||
| USD | 47,200 | NOK | 444,215 | HSB | 07/13/22 | 2,096 | — | |||||||||||||||
| USD | 5,674 | NOK | 56,251 | JPM | 07/13/22 | — | 37 | |||||||||||||||
| USD | 44,500 | NOK | 440,584 | JPM | 07/13/22 | — | 235 | |||||||||||||||
| USD | 187,865 | NOK | 1,654,019 | JPM | 07/13/22 | 19,921 | — | |||||||||||||||
| USD | 401,472 | NZD | 624,858 | HSB | 11/10/22 | 11,839 | — | |||||||||||||||
| USD | 15,166 | NZD | 24,348 | JPM | 11/10/22 | — | 17 | |||||||||||||||
| USD | 207,800 | NZD | 323,419 | JPM | 11/10/22 | 6,130 | — | |||||||||||||||
| USD | 40,738 | PEN | 158,498 | CIT | 10/28/22 | — | 189 | |||||||||||||||
| USD | 42,610 | PEN | 165,520 | HSB | 10/28/22 | — | 129 | |||||||||||||||
| USD | 3,188 | PLN | 14,212 | HSB | 07/13/22 | 20 | — | |||||||||||||||
| USD | 42,517 | PLN | 183,360 | HSB | 07/13/22 | 1,645 | — | |||||||||||||||
| USD | 19,899 | PLN | 85,888 | JPM | 07/13/22 | 755 | — | |||||||||||||||
The accompanying notes are an integral part of these financial statements.
54 Semi-Annual Report
Lazard Global Dynamic Multi-Asset Portfolio (concluded)
| Currency Purchased | Quantity | Currency Sold | Quantity | Counterparty | Settlement Date | Unrealized Appreciation | Unrealized Depreciation | |||||||||||||||||
| USD | 6,832 | SGD | 9,300 | HSB | 10/12/22 | $ | 132 | $ | — | |||||||||||||||
| USD | 78,115 | SGD | 106,346 | JPM | 10/12/22 | 1,505 | — | |||||||||||||||||
| USD | 69,982 | THB | 2,332,848 | HSB | 10/12/22 | 3,681 | — | |||||||||||||||||
| Total gross unrealized appreciation/depreciation on Forward Currency Contracts | $ | 164,168 | $ | 259,578 | ||||||||||||||||||||
The accompanying notes are an integral part of these financial statements.
Semi-Annual Report 55
The accompanying notes are an integral part of these financial statements.
56 Semi-Annual Report
| Description | Shares | Fair Value | ||||||
| Lazard Opportunistic Strategies Portfolio (continued) | ||||||||
| Short-Term Investments | 11.9% | ||||||||
| State Street Institutional Treasury Money Market Fund, Premier Class, 1.04% (7 day yield) (Cost $7,480,422) | 7,480,422 | $ | 7,480,422 | |||||
| Total Investments | 100.9% (Cost $61,676,857) | $ | 63,456,289 | ||||||
| Liabilities in Excess of Cash and Other Assets | (0.9)% | (593,042 | ) | ||||||
| Net Assets | 100.0% | $ | 62,863,247 | ||||||
The accompanying notes are an integral part of these financial statements.
Semi-Annual Report 57
Lazard Opportunistic Strategies Portfolio (continued)
Total Return Swap Agreements open at June 30, 2022:
| Currency | Counterparty | Notional Amount | Expiration Date | Receive | Pay | Payable | Payment Frequency | Unrealized Depreciation | ||||||||||||
| USD | GSC | $716,961 | 05/01/23 | Appreciation, and dividends paid, on securities in a custom momentum basket | SOFR +0.29bps | Depreciation, and dividend expense (if applicable), on securities in a custom momentum basket | Upon Maturity(a) | $315,127 | ||||||||||||
| USD | GSC | 706,956 | 05/01/23 | Appreciation, and dividends paid, on securities in a custom momentum basket | SOFR +0.34bps | Depreciation, and dividend expense (if applicable), on securities in a custom momentum basket | Upon Maturity(a) | 225,288 | ||||||||||||
| Total gross unrealized depreciation on Total Return Swap Agreements | $540,415 | * | ||||||||||||||||||
(a) For swap agreements, the net settlement will occur on the expiration date.
* Include accrued dividends and financing charges of $3,413.
The following tables represent the shares of the individual securities and related fair values underlying the custom total return basket swap agreements with GSC, as of June 30, 2022:
| Securities within GSCBLZCL (SOFR+0.29bps) | Shares | Fair Value | ||||||
| Bill.com Holdings Inc | 3,021 | $ | 23,637 | |||||
| Cloudflare Inc., Class A | 5,836 | 18,200 | ||||||
| Crowdstrike Holdings Inc., Class A | 3,197 | 38,432 | ||||||
| Datadog Inc., Class A | 4,693 | 31,810 | ||||||
| DocuSign Inc | 6,832 | 27,887 | ||||||
| Elastic NV | 7,719 | 37,219 | ||||||
| HubSpot Inc | 1,506 | 32,170 | ||||||
| MongoDB Inc | 1,700 | 31,400 | ||||||
| Okta Inc | 4,943 | 31,821 | ||||||
| Shopify Inc., Class A | 10,134 | 22,555 | ||||||
| Snowflake Inc., Class A | 3,138 | 31,010 | ||||||
| Twilio Inc., A Shares | 4,411 | 26,316 | ||||||
| Unity Software Inc | 7,159 | 18,778 | ||||||
| Zscaler Inc | 3,029 | 32,294 | ||||||
| Total Fair Value | $ | 403,529 | ||||||
The accompanying notes are an integral part of these financial statements.
58 Semi-Annual Report
Lazard Opportunistic Strategies Portfolio (continued)
| Securities within GSCBLZIP (SOFR+0.34bps) | Shares | Fair Value | ||||||
| Affirm Holdings Inc | 4,634 | $ | 6,032 | |||||
| Alkami Technology Inc | 14,830 | 14,835 | ||||||
| Bentley Systems Inc., Class B | 4,946 | 11,855 | ||||||
| BigCommerce Holdings Inc | 9,490 | 11,065 | ||||||
| Chewy Inc., Class A | 4,523 | 11,319 | ||||||
| CI&T Inc | 11,878 | 8,627 | ||||||
| Cloudflare Inc., Class A | 1,696 | 5,338 | ||||||
| Coinbase Global Inc., Class A | 1,092 | 3,715 | ||||||
| Confluent Inc., Class A | 4,883 | 8,180 | ||||||
| DoorDash Inc, A Shares | 1,807 | 8,342 | ||||||
| Doximity Inc., Class A | 4,147 | 10,411 | ||||||
| Duck Creek Technologies Inc | 9,335 | 9,979 | ||||||
| Enfusion Inc, Class A | 13,641 | 10,026 | ||||||
| Expensify Inc., A Shares | 11,477 | 14,693 | ||||||
| Fiverr International Ltd | 2,735 | 6,775 | ||||||
| ForgeRock Inc., A Shares | 10,007 | 15,422 | ||||||
| Freshworks Inc., Class A | 10,615 | 10,047 | ||||||
| HireRight Holdings Corp | 12,660 | 12,960 | ||||||
| JFrog Ltd | 8,243 | 12,495 | ||||||
| Lyft Inc., A Shares | 5,327 | 5,100 | ||||||
| Marqeta Inc., A Shares | 17,160 | 10,016 | ||||||
| MeridianLink Inc | 11,085 | 13,327 | ||||||
| Monday.com Ltd | 1,231 | 9,181 | ||||||
| nCino Inc | 4,535 | 10,111 | ||||||
| Nuvei Corp | 2,828 | 7,379 | ||||||
| Paya Holdings Inc | 34,837 | 16,478 | ||||||
| Payoneer Global Inc | 45,633 | 12,881 | ||||||
| Pinterest Inc., Class A | 7,883 | 10,313 | ||||||
| Poshmark Inc., Class A | 14,694 | 10,696 | ||||||
| PowerSchool Holdings Inc., A Shares | 11,960 | 10,375 | ||||||
| Procore Technologies Inc | 3,445 | 11,257 | ||||||
| Qualtrics International Inc., Class A | 7,106 | 6,405 | ||||||
| Remitly Global Inc | 21,383 | 11,796 | ||||||
| Riskified Ltd., A Shares | 32,291 | 10,323 | ||||||
| Robinhood Markets Inc., A Shares | 16,020 | 9,478 | ||||||
| Rocket Cos Inc., Class A | 19,066 | 10,105 | ||||||
| SentinelOne Inc., Class A | 4,899 | 8,235 | ||||||
| Shift4 Payments Inc., Class A | 3,394 | 8,067 | ||||||
The accompanying notes are an integral part of these financial statements.
Semi-Annual Report 59
Lazard Opportunistic Strategies Portfolio (concluded)
| Securities within GSCBLZIP (SOFR+0.34bps) | Shares | Fair Value | ||||||
| SoFi Technologies Inc | 2,1924 | $ | 8,321 | |||||
| Squarespace Inc., Class A | 7,853 | 11,820 | ||||||
| Thoughtworks Holding Inc | 10,079 | 10,244 | ||||||
| Toast Inc., Class A | 10,381 | 9,666 | ||||||
| Uber Technologies Inc | 5,983 | 8,818 | ||||||
| UiPath Inc., Class A | 6,926 | 9,077 | ||||||
| Unity Software Inc | 2,082 | 5,523 | ||||||
| Upstart Holdings Inc | 1,799 | 4,111 | ||||||
| Vertex Inc., Class A | 14,096 | 11,500 | ||||||
| Vimeo Inc | 16,374 | 7,098 | ||||||
| Zoom Video Communications Inc., A Shares | 1,763 | 13,712 | ||||||
| Total Fair Value | $ | 483,529 | ||||||
The accompanying notes are an integral part of these financial statements.
60 Semi-Annual Report
The accompanying notes are an integral part of these financial statements.
Semi-Annual Report 61
| Description | Shares | Fair Value | ||||||
| Lazard Real Assets Portfolio (●) (continued) | ||||||||
| France | 1.8% | ||||||||
| Eutelsat Communications SA | 2,044 | $ | 23,092 | |||||
| ICADE REIT | 1,055 | 51,826 | ||||||
| Vinci SA | 6,771 | 608,310 | ||||||
| 683,228 | ||||||||
| Hong Kong | 0.8% | ||||||||
| CK Infrastructure Holdings, Ltd. | 27,500 | 168,957 | ||||||
| Kerry Properties, Ltd. | 31,500 | 87,582 | ||||||
| Power Assets Holdings, Ltd. | 6,500 | 40,941 | ||||||
| 297,480 | ||||||||
| Italy | 2.6% | ||||||||
| Atlantia SpA | 5,218 | 122,468 | ||||||
| Enel SpA | 12,875 | 70,766 | ||||||
| Hera SpA | 35,860 | 104,088 | ||||||
| Italgas SpA | 6,591 | 38,490 | ||||||
| Snam SpA | 20,771 | 109,019 | ||||||
| Terna - Rete Elettrica Nazionale | 66,469 | 522,423 | ||||||
| 967,254 | ||||||||
| Japan | 1.8% | ||||||||
| Daiwa House Industry Co., Ltd. | 4,500 | 104,952 | ||||||
| Frontier Real Estate Investment Corp. REIT | 27 | 104,088 | ||||||
| GLP J-REIT | 63 | 76,999 | ||||||
| Japan Real Estate Investment Corp. REIT | 11 | 50,595 | ||||||
| Katitas Co., Ltd. | 2,500 | 53,898 | ||||||
| Nippon Building Fund, Inc. REIT | 14 | 69,660 | ||||||
| Osaka Gas Co., Ltd. | 11,800 | 226,631 | ||||||
| 686,823 | ||||||||
| Luxembourg | 0.1% | ||||||||
| SES SA | 2,483 | 21,821 | ||||||
| Singapore | 0.2% | ||||||||
| Parkway Life REIT | 24,400 | 85,569 | ||||||
| Spain | 2.6% | ||||||||
| Ferrovial SA | 20,939 | 533,953 | ||||||
| Iberdrola SA | 41,368 | 429,268 | ||||||
| 963,221 | ||||||||
The accompanying notes are an integral part of these financial statements.
62 Semi-Annual Report
| Description | Shares | Fair Value | ||||||
| Lazard Real Assets Portfolio (●) (continued) | ||||||||
| Sweden | 0.3% | ||||||||
| Catena AB | 1,288 | $ | 46,769 | |||||
| Fastighets AB Balder, B Shares (*) | 14,966 | 71,766 | ||||||
| 118,535 | ||||||||
| Switzerland | 0.1% | ||||||||
| Flughafen Zurich AG (*) | 225 | 34,039 | ||||||
| United Kingdom | 4.3% | ||||||||
| Big Yellow Group PLC REIT | 3,837 | 61,326 | ||||||
| National Grid PLC | 41,558 | 532,577 | ||||||
| Pennon Group PLC | 2,522 | 29,340 | ||||||
| Safestore Holdings PLC REIT | 7,884 | 101,899 | ||||||
| Segro PLC REIT | 12,366 | 147,049 | ||||||
| Severn Trent PLC | 1,348 | 44,638 | ||||||
| SSE PLC | 25,824 | 510,543 | ||||||
| Tritax Big Box REIT PLC | 54,748 | 121,015 | ||||||
| United Utilities Group PLC | 5,477 | 68,031 | ||||||
| 1,616,418 | ||||||||
| United States | 35.9% | ||||||||
| Alexandria Real Estate Equities, Inc. | 2,355 | 341,546 | ||||||
| Ameren Corp. | 1,487 | 134,365 | ||||||
| American Electric Power Co., Inc. | 2,897 | 277,938 | ||||||
| American Homes 4 Rent, Class A REIT | 1,768 | 62,658 | ||||||
| American Tower Corp. REIT | 1,357 | 346,836 | ||||||
| AvalonBay Communities, Inc. REIT | 3,235 | 628,399 | ||||||
| Brixmor Property Group, Inc. REIT | 3,110 | 62,853 | ||||||
| Camden Property Trust REIT | 1,416 | 190,424 | ||||||
| CBRE Group, Inc., Class A (*) | 842 | 61,980 | ||||||
| CF Industries Holdings, Inc. | 1,750 | 150,027 | ||||||
| Consolidated Edison, Inc. | 582 | 55,348 | ||||||
| Cousins Properties, Inc. REIT | 1,959 | 57,262 | ||||||
| Crown Castle International Corp. REIT | 2,063 | 347,368 | ||||||
| CSX Corp. | 14,856 | 431,715 | ||||||
| Digital Realty Trust, Inc. REIT | 2,705 | 351,190 | ||||||
| Dominion Energy, Inc. | 5,792 | 462,260 | ||||||
| Duke Realty Corp. REIT | 10,945 | 601,428 | ||||||
| EastGroup Properties, Inc.REIT | 366 | 56,485 | ||||||
The accompanying notes are an integral part of these financial statements.
Semi-Annual Report 63
| Description | Shares | Fair Value | ||||||
| Lazard Real Assets Portfolio (●) (continued) | ||||||||
| Energy Transfer Equity LP | 28,837 | $ | 287,793 | |||||
| Enterprise Products Partners LP | 15,965 | 389,067 | ||||||
| Equinix, Inc. REIT | 521 | 342,307 | ||||||
| Equity Lifestyle Properties, Inc. REIT | 1,202 | 84,705 | ||||||
| Equity Residential REIT | 1,975 | 142,635 | ||||||
| Essex Property Trust, Inc. REIT | 343 | 89,698 | ||||||
| Exelon Corp. | 1,437 | 65,125 | ||||||
| Extra Space Storage, Inc. REIT | 2,548 | 433,466 | ||||||
| First Industrial Realty Trust, Inc. REIT | 1,396 | 66,282 | ||||||
| Healthcare Trust of America, Inc. REIT, Class A | 1,500 | 41,865 | ||||||
| Highwoods Properties, Inc. REIT | 2,240 | 76,586 | ||||||
| Hilton Worldwide Holdings, Inc. | 2,750 | 306,460 | ||||||
| Innovative Industrial Properties, Inc. REIT | 752 | 82,622 | ||||||
| Invitation Homes, Inc., REIT | 5,211 | 185,407 | ||||||
| Iron Mountain, Inc. REIT | 2,150 | 104,684 | ||||||
| Kimco Realty Corp. REIT | 15,444 | 305,328 | ||||||
| Life Storage, Inc. REIT | 2,529 | 282,388 | ||||||
| Mid-America Apartment Communities, Inc. REIT | 3,063 | 535,014 | ||||||
| NiSource, Inc. | 2,100 | 61,929 | ||||||
| Norfolk Southern Corp. | 1,182 | 268,657 | ||||||
| NorthWestern Corp. | 451 | 26,577 | ||||||
| NRG Energy, Inc. | 4,008 | 152,985 | ||||||
| Pinnacle West Capital Corp. | 8,129 | 594,392 | ||||||
| Prologis, Inc. REIT | 5,522 | 649,663 | ||||||
| PS Business Parks, Inc. REIT | 494 | 92,452 | ||||||
| Public Storage REIT | 1,647 | 514,967 | ||||||
| SBA Communications Corp. REIT | 2,540 | 812,927 | ||||||
| Simon Property Group, Inc. REIT | 5,541 | 525,952 | ||||||
| SITE Centers Corp. REIT | 4,560 | 61,423 | ||||||
| SL Green Realty Corp. REIT | 6,453 | 297,806 | ||||||
| Sun Communities, Inc. REIT | 395 | 62,947 | ||||||
| Targa Resources Corp. | 8,700 | 519,129 | ||||||
| UDR, Inc. REIT | 1,564 | 72,007 | ||||||
| Union Pacific Corp. | 1,122 | 239,300 | ||||||
| 13,394,627 | ||||||||
| Total Common Stocks (Cost $22,838,102) | 21,978,313 | |||||||
The accompanying notes are an integral part of these financial statements.
64 Semi-Annual Report
| Description | Shares | Fair Value | ||||||
| Lazard Real Assets Portfolio (●) (continued) | ||||||||
| Exchange-Traded Funds | 5.2% | ||||||||
| Aberdeen Standard Physical Silver Shares ETF (Δ) | 15,700 | $ | 305,679 | |||||
| SPDR Gold Shares (Δ) | 9,724 | 1,638,105 | ||||||
| Total Exchange-Traded Funds (Cost $2,068,735) | 1,943,784 | |||||||
| Short-Term Investments | 32.6% | ||||||||
| State Street Institutional Treasury Money Market Fund, Premier Class, 1.04% (7 day yield) (Δ) (Cost $12,148,491) | 12,148,491 | 12,148,491 | ||||||
| Total Investments | 96.7% (Cost $37,055,328) (») | $ | 36,070,588 | ||||||
| Cash and Other Assets in Excess of Liabilities | 3.3% | 1,243,376 | |||||||
| Net Assets | 100.0% | $ | 37,313,964 | ||||||
The accompanying notes are an integral part of these financial statements.
Semi-Annual Report 65
Lazard Real Assets Portfolio (●) (continued)
Forward Currency Contracts open at June 30, 2022:
| Currency Purchased | Quantity | Currency Sold | Quantity | Counterparty | Settlement Date | Unrealized Appreciation | Unrealized Depreciation | |||||||||||||
| AUD | 21,504 | USD | 14,927 | HSB | 09/28/22 | $ | — | $ | 74 | |||||||||||
| GBP | 13,539 | USD | 16,642 | JPM | 09/28/22 | — | 133 | |||||||||||||
| HKD | 25,275 | USD | 3,230 | JPM | 09/28/22 | — | 1 | |||||||||||||
| USD | 5,143 | AUD | 7,351 | HSB | 09/28/22 | 66 | — | |||||||||||||
| USD | 84,762 | AUD | 121,147 | HSB | 09/28/22 | 1,081 | — | |||||||||||||
| USD | 9,639 | CAD | 12,470 | HSB | 09/28/22 | — | 50 | |||||||||||||
| USD | 6,528 | CAD | 8,446 | JPM | 09/28/22 | — | 34 | |||||||||||||
| USD | 14,566 | CAD | 18,845 | JPM | 09/28/22 | — | 77 | |||||||||||||
| USD | 35,167 | CHF | 33,638 | SSB | 09/28/22 | — | 286 | |||||||||||||
| USD | 47,807 | EUR | 44,979 | JPM | 09/28/22 | 384 | — | |||||||||||||
| USD | 547,930 | EUR | 515,381 | SSB | 09/28/22 | 4,546 | — | |||||||||||||
| USD | 30,924 | GBP | 25,125 | JPM | 09/28/22 | 289 | — | |||||||||||||
| USD | 255,271 | GBP | 207,688 | SSB | 09/28/22 | 2,037 | — | |||||||||||||
| USD | 7,966 | HKD | 62,400 | JPM | 09/28/22 | — | 5 | |||||||||||||
| USD | 54,146 | HKD | 424,125 | SSB | 09/28/22 | — | 33 | |||||||||||||
| Total gross unrealized appreciation/depreciation on Forward Currency Contracts | $ | 8,403 | $ | 693 | ||||||||||||||||
The accompanying notes are an integral part of these financial statements.
66 Semi-Annual Report
Lazard Real Assets Portfolio (●) (continued)
Futures Contracts open at June 30, 2022 (Δ):
| Type | Number of Contracts | Notional Amount | Expiration Date | Notional Cost | Fair Value | Unrealized Appreciation | Unrealized Depreciation | ||||||||||||||||||
| Natural Gas | 28 | $280,000 | 08/29/2022 | $2,394,787 | $1,509,760 | $ | — | $ | 885,027 | ||||||||||||||||
| Low Sulphur Gasoil | 6 | 600 | 09/12/2022 | 617,106 | 661,200 | 44,094 | — | ||||||||||||||||||
| Sugar 11 (World) | 4 | 448,000 | 09/30/2022 | 86,297 | 82,880 | — | 3,417 | ||||||||||||||||||
| Cotton No. 2 | 3 | 150,000 | 12/07/2022 | 184,199 | 148,260 | — | 35,939 | ||||||||||||||||||
| Soyabean Oil | 1 | 60,000 | 12/14/2022 | 44,787 | 38,676 | — | 6,111 | ||||||||||||||||||
| Total gross unrealized appreciation/depreciation on Futures Contracts | $ | 44,094 | $ | 930,495 | |||||||||||||||||||||
Total Return Swap Agreements open at June 30, 2022 (Δ):
| Currency | Counterparty | Notional Amount | Expiration Date | Receive | Pay | Payable | Payment Frequency | Unrealized Appreciation | ||||||||||||
| USD | GSC | $9,355,567 | 10/22/22 | Appreciation, and dividends | 0.00% | Depreciation, and dividend | Upon | $1,546,327 | ||||||||||||
| paid, on commodities in a custom momentum basket | expense (if applicable), on commodities in a custom momentum basket | Maturity(a) | ||||||||||||||||||
| (a) | For swap agreements, the net settlement will occur on the expiration date. |
The accompanying notes are an integral part of these financial statements.
Semi-Annual Report 67
Lazard Real Assets Portfolio (●) (concluded)
The following table represents the commodity exposure expressed as a percentage of the notional amount of the individual commodity underlying the custom total return basket swap agreements with GSC, as of June 30, 2022:
| Commodity | Commodity Index Ticker Symbol | Commodity Exposure Expressed as a Percentage of Notional Amount | |||||
| Aluminum | BCOMAL | 5.06 | % | ||||
| Bean Oil | BCOMBO | 4.73 | |||||
| Brent Crude | BCOMCO | 13.06 | |||||
| Coffee | BCOMKC | 3.43 | |||||
| Copper | BCOMHG | 5.35 | |||||
| Corn | BCOMCN | 8.27 | |||||
| Cotton | BCOMCT | 0.02 | |||||
| Crude Oil | BCOMCO | 14.74 | |||||
| Gasoline (RBOB) | BCOMRB | 2.95 | |||||
| Gold | BCOMGC | 0.20 | |||||
| Heating Oil | BCOMHO | 4.22 | |||||
| Kansas Wheat | BCOMKW | 3.36 | |||||
| Lean Hogs | BCOMLH | 1.35 | |||||
| Live Cattle | BCOMLC | 3.72 | |||||
| Natural Gas | BCOMNG | 1.49 | |||||
| Nickel | BCOMNI | 3.22 | |||||
| Silver | BCOMSI | 1.32 | |||||
| Soy Meal | BCOMSM | 3.72 | |||||
| Soybeans | BCOMSY | 8.02 | |||||
| Sugar | BCOMSB | 3.60 | |||||
| Wheat | BCOMWH | 5.45 | |||||
| Zinc | BCOMZS | 2.72 | |||||
| Total | 100.00 | % | |||||
The accompanying notes are an integral part of these financial statements.
68 Semi-Annual Report
The Lazard Funds, Inc. Notes to Portfolios of Investments
June 30, 2022 (unaudited)
| (*) | Non-income producing security. |
| (±) | Some or all of this security position has been pledged to cover collateral requirements on securities sold short. |
| (¢) | Security in which significant unobservable inputs (Level 3) were used in determining fair value. |
| (#) | Pursuant to Rule 144A under the Securities Act of 1933, these securities may only be traded among “qualified institutional buyers.” At June 30, 2022, these securities amounted to 1.0% of net assets of Lazard Enhanced Opportunities Portfolio and 0.4% of net assets of Lazard Global Dynamic Multi-Asset Portfolio. |
| (») | The portfolio, at all times, maintains portfolio securities in sufficient amount to cover its obligations related to investments in forward currency contracts. |
| (§) | Variable and floating rate securities are securities for which interest rate changes are based on changes in a designated base rate. The rates shown are those in effect on June 30, 2022. |
| (●) | Lazard Real Assets Portfolio’s Portfolio of Investments and accompanying notes are presented on a consolidated basis. |
| (Δ) | The security is owned by Lazard Real Assets Portfolio Ltd., a wholly-owned subsidiary of the Portfolio. |
Security Abbreviations:
| ADR | — | American Depositary Receipt |
| CDOR | — | Canadian Dollar Offered Rate |
| ETF | — | Exchange-Traded Fund |
| LIBOR | — | London Interbank Offered Rate |
| REIT | — | Real Estate Investment Trust |
| SOFR | — | Secured Overnight Financing Rate |
| SONIA | — | Sterling Overnight Index Average |
| WIBOR | — | Warsaw Interbank Offered Rate |
| Currency Abbreviations: | ||||
| AUD | — Australian Dollar | JPY | — Japanese Yen | |
| CAD | — Canadian Dollar | KRW | — South Korean Won | |
| CHF | — Swiss Franc | MXN | — Mexican New Peso | |
| CLP | — Chilean Peso | NOK | — Norwegian Krone | |
| CNH | — Chinese Yuan Renminbi | NZD | — New Zealand Dollar | |
| COP | — Colombian Peso | PEN | — Peruvian Nuevo Sol | |
| CZK | — Czech Koruna | PLN | — Polish Zloty | |
| DKK | — Danish Krone | RON | — Polish Zloty | |
| EUR | — Euro | SEK | — Swedish Krona | |
| GBP | — British Pound Sterling | SGD | — Singapore Dollar | |
| HKD | — Hong Kong Dollar | THB | — Thai Baht | |
| HUF | — Hungarian Forint | USD | — United States Dollar | |
| IDR | — Indonesian Rupiah | |||
The accompanying notes are an integral part of these financial statements.
Semi-Annual Report 69
| Counterparty Abbreviations: | |
| BOA | — Bank of America NA |
| CIT | — Citibank NA |
| GSC | — Goldman Sachs International |
| HSB | — HSBC Bank USA NA |
| JPM | — JPMorgan Chase Bank NA |
| MSC | — Morgan Stanley & Co. |
| SSB | — State Street Bank and Trust Co. |
The accompanying notes are an integral part of these financial statements.
70 Semi-Annual Report
Portfolio holdings by industry (as a percentage of net assets), for the Portfolio previously presented by country:
| Lazard Enhanced Opportunities Portfolio | |||||||||
| Industry† | Long | Short | |||||||
| Common Stocks and Convertible Corporate Bonds | |||||||||
| Aerospace & Defense | 2.4 | % | –0.3 | % | |||||
| Airlines | 2.9 | –1.6 | |||||||
| Auto Components | 0.6 | –0.1 | |||||||
| Automobiles | 5.7 | –2.0 | |||||||
| Banks | 2.6 | — | |||||||
| Biotechnology | 9.9 | –5.7 | |||||||
| Chemicals | 3.7 | –2.5 | |||||||
| Construction & Engineering | 0.4 | –0.2 | |||||||
| Consumer Finance | 5.3 | –1.0 | |||||||
| Diversified Consumer Services | 0.6 | — | |||||||
| Diversified Telecommunication Services | 1.0 | –0.3 | |||||||
| Electrical Equipments | 4.5 | –4.0 | |||||||
| Electronic Equipment, Instruments & Components | 2.8 | –0.7 | |||||||
| Energy Equipment & Services | 2.3 | –0.6 | |||||||
| Entertainment | 4.8 | –1.9 | |||||||
| Equity Real Estate Investment Trusts (REITs) | 2.0 | –0.6 | |||||||
| Food & Staples Retailing | 2.4 | –1.3 | |||||||
| Health Care Equipment & Supplies | 6.9 | –3.3 | |||||||
| Health Care Providers & Services | 0.5 | –0.2 | |||||||
| Health Care Technology | 0.7 | –0.6 | |||||||
| Hotels, Restaurants & Leisure | 1.4 | –0.4 | |||||||
| Insurance | 0.4 | –0.3 | |||||||
| Interactive Media & Services | 1.7 | –0.1 | |||||||
| Internet & Direct Marketing Retail | 4.4 | –0.6 | |||||||
| IT Services | 3.3 | –0.7 | |||||||
| Leisure Products | 1.2 | — | |||||||
| Life Sciences Tools & Services | 0.5 | — | |||||||
| Machinery | 0.1 | — | |||||||
| Marine | 0.9 | –0.7 | |||||||
| Media | 9.5 | –0.4 | |||||||
| Metals & Mining | 4.0 | –1.7 | |||||||
| Mortgage Real Estate Investment Trusts (REITs) | 10.1 | –0.1 | |||||||
| Oil, Gas & Consumable Fuels | 1.5 | –1.1 | |||||||
| Personal Products | 2.7 | –0.1 | |||||||
| Pharmaceuticals | 5.4 | –1.3 | |||||||
| Professional Services | 0.4 | — | |||||||
| Real Estate Management & Development | 2.0 | –0.4 | |||||||
| Semiconductors & Semiconductor Equipment | 2.8 | –1.2 | |||||||
| Software | 10.5 | –4.0 | |||||||
| Specialty Retail | 2.1 | –0.1 | |||||||
| Subtotal | 126.9 | –40.1 | |||||||
The accompanying notes are an integral part of these financial statements.
Semi-Annual Report 71
| Lazard Enhanced Opportunities Portfolio | |||||||||
| Industry† | Long | Short | |||||||
| Exchange Traded Funds | — | % | –7.8 | % | |||||
| Purchased Options | 0.2 | — | |||||||
| US Treasury Securities | — | –8.9 | |||||||
| Short-Term Investments | 22.3 | — | |||||||
| Total Investments | 149.4 | % | –56.8 | % | |||||
| † | Industry classifications may be different than those used for compliance monitoring purposes. |
The accompanying notes are an integral part of these financial statements.
72 Semi-Annual Report
| Industry† | Lazard Global Dynamic Multi-Asset Portfolio | Lazard Real Assets Portfolio | |||||||
| Common Stocks and Corporate & Quasi Government Bonds | |||||||||
| Aerospace & Defense | 0.7 | % | — | % | |||||
| Air Freight & Logistics | 0.2 | — | |||||||
| Auto Components | 0.1 | — | |||||||
| Automobiles | 1.7 | — | |||||||
| Banks | 7.3 | — | |||||||
| Beverages | 1.4 | — | |||||||
| Biotechnology | 1.0 | — | |||||||
| Building Products | 0.9 | — | |||||||
| Capital Markets | 2.5 | — | |||||||
| Chemicals | 0.6 | 0.4 | |||||||
| Commercial Services & Suppliers | 0.8 | — | |||||||
| Communications Equipment | 0.3 | — | |||||||
| Construction & Engineering | — | 3.1 | |||||||
| Consumer Finance | 0.7 | — | |||||||
| Containers & Packaging | 0.5 | — | |||||||
| Diversified Consumer Services | 0.5 | — | |||||||
| Diversified Financial Services | 0.2 | — | |||||||
| Diversified Telecommunication Services | 2.5 | — | |||||||
| Electric Utilities | 1.0 | 7.8 | |||||||
| Electrical Equipment | 1.0 | — | |||||||
| Electronic Equipment, Instruments & Components | 0.9 | — | |||||||
| Entertainment | 0.3 | — | |||||||
| Equity Real Estate Investment Trusts (REITs) | 1.8 | 30.1 | |||||||
| Food & Staples Retailing | 1.1 | — | |||||||
| Food Products | 0.8 | — | |||||||
| Gas Utilities | 0.4 | 1.0 | |||||||
| Health Care Equipment & Supplies | 0.4 | — | |||||||
| Health Care Providers & Services | 1.5 | — | |||||||
| Hotels, Restaurants & Leisure | 1.7 | 0.8 | |||||||
| Household Durables | 0.1 | — | |||||||
| Household Products | 1.8 | — | |||||||
| Independent Power & Renewable Electricity Producers | 0.2 | — | |||||||
| Industrial Conglomerates | 0.1 | — | |||||||
| Insurance | 1.7 | — | |||||||
| Interactive Media & Services | 1.3 | — | |||||||
| Internet & Direct Marketing Retail | 0.7 | — | |||||||
| IT Services | 2.0 | — | |||||||
| Leisure Products | 0.3 | — | |||||||
| Life Sciences Tools & Services | 0.7 | — | |||||||
| Machinery | 1.7 | — | |||||||
The accompanying notes are an integral part of these financial statements.
Semi-Annual Report 73
| Industry† | Lazard Global Dynamic Multi-Asset Portfolio | Lazard Real Assets Portfolio | |||||||
| Marine | 0.2 | % | — | % | |||||
| Media | 0.5 | 0.1 | |||||||
| Metals & Mining | 0.6 | 0.3 | |||||||
| Multiline Retail | 0.2 | — | |||||||
| Multi-Utilities | 0.3 | 4.3 | |||||||
| Oil, Gas & Consumable Fuels | 1.5 | 4.7 | |||||||
| Personal Products | 0.3 | — | |||||||
| Pharmaceuticals | 4.1 | — | |||||||
| Professional Services | 0.9 | — | |||||||
| Real Estate Management & Development | 0.3 | 1.3 | |||||||
| Road & Rail | 0.4 | 4.0 | |||||||
| Semiconductors & Semiconductor Equipment | 1.4 | — | |||||||
| Software | 3.5 | — | |||||||
| Specialty Retail | 1.3 | — | |||||||
| Technology Hardware, Storage & Peripherals | 2.2 | — | |||||||
| Textiles, Apparel & Luxury Goods | 0.4 | — | |||||||
| Tobacco | 0.3 | — | |||||||
| Trading Companies & Distributors | 0.5 | — | |||||||
| Transportation Infrastructure | — | 0.6 | |||||||
| Water Utilities | — | 0.4 | |||||||
| Wireless Telecommunication Services | 0.1 | — | |||||||
| Subtotal | 62.4 | 58.9 | |||||||
| Exchange Traded Funds | 1.1 | 5.2 | |||||||
| Foreign Government Obligations | 23.1 | — | |||||||
| Supranationals | 6.1 | — | |||||||
| US Municipal Bonds | 1.1 | — | |||||||
| US Treasury Securities | 1.8 | — | |||||||
| Short-Term Investments | 4.6 | 32.6 | |||||||
| Total Investments | 100.2 | % | 96.7 | % | |||||
| † | Industry classifications may be different than those used for compliance monitoring purposes. |
The accompanying notes are an integral part of these financial statements.
74 Semi-Annual Report
[This page intentionally left blank]
Semi-Annual Report 75
The Lazard Funds, Inc. Statements of Assets and Liabilities (unaudited)
| June 30, 2022 | Lazard Enhanced Opportunities Portfolio | Lazard Global Dynamic Multi-Asset Portfolio | ||||||
| ASSETS | ||||||||
| Investments in securities, at fair value | $ | 80,317,032 | $ | 16,017,234 | ||||
| Cash | — | 4,556 | ||||||
| Foreign currency, at fair value | 66,902 | 5,877 | ||||||
| Receivables for: | ||||||||
| Investments sold | 5,315,201 | 31,388 | ||||||
| Dividends and interest | 471,132 | 113,901 | ||||||
| Capital stock sold | 320,616 | — | ||||||
| Terminated swap | 127,052 | — | ||||||
| Amount due from Investment Manager (Note 3) | — | 6,001 | ||||||
| Cash collateral due from broker on options, future contracts and swap agreements | 4,655,000 | — | ||||||
| Gross unrealized appreciation on: | ||||||||
| Forward currency contracts | 14,621 | 164,168 | ||||||
| Swap agreements | 783,741 | — | ||||||
| Other assets | — | 13,691 | ||||||
| Total assets | 92,071,297 | 16,356,816 | ||||||
| LIABILITIES | ||||||||
| Securities sold short, at fair value | 30,513,383 | — | ||||||
| Foreign currency due to custodian | 12,130 | — | ||||||
| Due to custodian | 250 | — | ||||||
| Cash collateral due to broker on swap agreements | — | — | ||||||
| Payables for: | ||||||||
| Accrued custodian fees | 62,088 | 26,017 | ||||||
| Management fees | 40,902 | — | ||||||
| Accrued professional services | 24,586 | 31,178 | ||||||
| Accrued distribution fees | 6 | 40 | ||||||
| Accrued directors’ fees | — | 444 | ||||||
| Investments purchased | 7,398,474 | 43,648 | ||||||
| Capital stock redeemed | 125,104 | — | ||||||
| Dividends on securities sold short | 14,711 | — | ||||||
| Variation margin on open futures contracts | — | — | ||||||
| Gross unrealized depreciation on: | ||||||||
| Forward currency contracts | 661 | 259,578 | ||||||
| Swap agreements | 824 | — | ||||||
| Written options, at fair value | 79,055 | — | ||||||
| Other accrued expenses and payables | 38,690 | 5,356 | ||||||
| Total liabilities | 38,310,864 | 366,261 | ||||||
| Net assets | $ | 53,760,433 | $ | 15,990,555 | ||||
The accompanying notes are an integral part of these financial statements.
76 Semi-Annual Report
| Lazard Opportunistic Strategies Portfolio | Lazard Real Assets Portfolio (a) | ||||||
| $ | 63,456,289 | $ | 36,070,588 | ||||
| — | — | ||||||
| — | 6,231 | ||||||
| — | 171,059 | ||||||
| 12,930 | 71,267 | ||||||
| — | 158,589 | ||||||
| — | — | ||||||
| — | — | ||||||
| — | 282,098 | ||||||
| — | 8,403 | ||||||
| — | 1,546,327 | ||||||
| 6,062 | 7,104 | ||||||
| 63,475,281 | 38,321,666 | ||||||
| — | — | ||||||
| — | — | ||||||
| — | 7,843 | ||||||
| — | 390,000 | ||||||
| 5,842 | 8,925 | ||||||
| 37,309 | 5,865 | ||||||
| 26,305 | 28,372 | ||||||
| — | 252 | ||||||
| — | — | ||||||
| — | 238,238 | ||||||
| — | — | ||||||
| — | — | ||||||
| — | 325,936 | ||||||
| — | 693 | ||||||
| 540,415 | — | ||||||
| — | — | ||||||
| 2,163 | 1,578 | ||||||
| 612,034 | 1,007,702 | ||||||
| $ | 62,863,247 | $ | 37,313,964 | ||||
Semi-Annual Report 77
| June 30, 2022 | Lazard Enhanced Opportunities Portfolio | Lazard Global Dynamic Multi-Asset Portfolio | ||||||
| NET ASSETS | ||||||||
| Paid in capital | $ | 61,755,319 | $ | 15,747,675 | ||||
| Distributable earnings (Accumulated loss) | (7,994,886 | ) | 242,880 | |||||
| Net assets | $ | 53,760,433 | $ | 15,990,555 | ||||
| Institutional Shares | ||||||||
| Net assets | $ | 53,556,798 | $ | 15,812,056 | ||||
| Shares of capital stock outstanding* | 6,191,105 | 1,898,581 | ||||||
| Net asset value, offering and redemption price per share | $ | 8.65 | $ | 8.33 | ||||
| Open Shares | ||||||||
| Net assets | $ | 203,635 | $ | 178,499 | ||||
| Shares of capital stock outstanding* | 23,530 | 21,517 | ||||||
| Net asset value, offering and redemption price per share | $ | 8.65 | $ | 8.30 | ||||
| Cost of investments in securities | $ | 92,234,445 | $ | 16,380,425 | ||||
| Proceeds received from securities sold short | $ | 34,271,792 | $ | — | ||||
| Proceeds received from written options | $ | 54,619 | $ | — | ||||
| Cost of foreign currency | $ | 66,890 | $ | 5,878 | ||||
| * | $0.001 par value, 6,900,000,000 shares authorized for the Portfolios in total. |
| (a) | Consolidated Statement of Assets and Liabilities. |
The accompanying notes are an integral part of these financial statements.
78 Semi-Annual Report
| Lazard Opportunistic Strategies Portfolio | Lazard Real Assets Portfolio (a) | ||||||
| $ | 57,817,383 | $ | 38,614,648 | ||||
| 5,045,864 | (1,300,684 | ) | |||||
| $ | 62,863,247 | $ | 37,313,964 | ||||
| $ | 62,726,574 | $ | 36,019,626 | ||||
| 6,477,761 | 3,364,128 | ||||||
| $ | 9.68 | $ | 10.71 | ||||
| $ | 136,673 | $ | 1,294,338 | ||||
| 14,215 | 120,769 | ||||||
| $ | 9.61 | $ | 10.72 | ||||
| $ | 61,676,857 | $ | 37,055,328 | ||||
| $ | — | $ | — | ||||
| $ | — | $ | — | ||||
| $ | — | $ | 6,220 | ||||
Semi-Annual Report 79
The Lazard Funds, Inc. Statements of Operations (unaudited)
| For the Period Ended June 30, 2022 | Lazard Enhanced Opportunities Portfolio | Lazard Global Dynamic Multi-Asset Portfolio | |||||||
| Investment Income (Loss) | |||||||||
| Income | |||||||||
| Interest | $ | 2,216,110 | $ | 108,436 | |||||
| Dividends | 10,815 | 100,614 | |||||||
| Total investment income* | 2,226,925 | 209,050 | |||||||
| Expenses | |||||||||
| Management fees (Note 3) | 508,637 | 67,564 | |||||||
| Custodian fees | 67,616 | 49,168 | |||||||
| Professional services | 25,346 | 29,359 | |||||||
| Registration fees | 23,080 | 16,651 | |||||||
| Administration fees | 15,507 | 10,077 | |||||||
| Shareholders’ services | 7,307 | 4,749 | |||||||
| Directors’ fees and expenses | 5,567 | 3,085 | |||||||
| Shareholders’ reports | 3,691 | 6,771 | |||||||
| Distribution fees (Open Shares) | 478 | 243 | |||||||
| Other^ | 4,195 | 3,238 | |||||||
| Total gross expenses before expenses on securities sold short | 661,424 | 190,905 | |||||||
| Broker expense on securities sold short | 288,427 | — | |||||||
| Dividend expense on securities sold short | 108,617 | — | |||||||
| Total gross expenses | 1,058,468 | 190,905 | |||||||
| Management fees waived and expenses reimbursed | (2,179 | ) | (114,563 | ) | |||||
| Voluntary reimbursement by administrator | — | — | |||||||
| Total net expenses | 1,056,289 | 76,342 | |||||||
| Net investment income (loss) | 1,170,636 | 132,708 | |||||||
| Net Realized and Unrealized Gain (Loss) | |||||||||
| Net realized gain (loss) on: | |||||||||
| Investments | (10,367,724 | ) | 740,873 | ||||||
| Securities sold short | 8,418,510 | — | |||||||
| Foreign currency transactions | (26,680 | ) | 257 | ||||||
| Forward currency contracts | 324,089 | (146,052 | ) | ||||||
| Futures contracts | — | — | |||||||
| Written options | 35,466 | — | |||||||
| Swap agreements | 262,758 | — | |||||||
| Total net realized gain (loss) | (1,353,581 | ) | 595,078 | ||||||
| Net change in unrealized appreciation (depreciation) on: | |||||||||
| Investments | (6,833,612 | ) | (3,931,862 | ) | |||||
| Securities sold short | 356,412 | — | |||||||
| Foreign currency translations | 700 | (3,309 | ) | ||||||
| Forward currency contracts | 83,737 | (101,177 | ) | ||||||
| Futures contracts | — | — | |||||||
| Written options | (21,806 | ) | — | ||||||
| Swap agreements | 775,220 | — | |||||||
| Total net change in unrealized appreciation (depreciation) | (5,639,349 | ) | (4,036,348 | ) | |||||
| Net realized and unrealized gain (loss) | (6,992,930 | ) | (3,441,270 | ) | |||||
| Net increase (decrease) in net assets resulting from operations | $ | (5,822,294 | ) | $ | (3,308,562 | ) | |||
| * | Net of foreign withholding taxes of | $ | 20 | $ | 6,229 | ||||
| ^ | Includes interest on line of credit of | $ | — | $ | — | ||||
| (a) | Consolidated Statement of Operations. | ||||||||
The accompanying notes are an integral part of these financial statements.
80 Semi-Annual Report
| Lazard Opportunistic Strategies Portfolio | Lazard Real Assets Portfolio (a) | ||||||
| $ | 12,017 | $ | 19,236 | ||||
| 355,789 | 330,245 | ||||||
| 367,806 | 349,481 | ||||||
| 349,970 | 123,217 | ||||||
| 18,741 | 35,682 | ||||||
| 24,378 | 27,966 | ||||||
| 16,682 | 14,101 | ||||||
| 13,396 | 11,391 | ||||||
| 6,151 | 5,025 | ||||||
| 4,599 | 8,389 | ||||||
| 8,314 | 6,448 | ||||||
| 182 | 758 | ||||||
| 4,574 | 5,882 | ||||||
| 446,987 | 238,859 | ||||||
| 2,866 | — | ||||||
| 2,186 | — | ||||||
| 452,039 | 238,859 | ||||||
| (89,479 | ) | (85,928 | ) | ||||
| — | (739 | ) | |||||
| 362,560 | 152,192 | ||||||
| 5,246 | 197,289 | ||||||
| 2,464,253 | 665,892 | ||||||
| 105,837 | — | ||||||
| — | (7,783 | ) | |||||
| — | 126,717 | ||||||
| — | 1,698,310 | ||||||
| — | — | ||||||
| — | (110,415 | ) | |||||
| 2,570,090 | 2,372,721 | ||||||
| (13,818,914 | ) | (5,097,918 | ) | ||||
| (13,426 | ) | — | |||||
| — | (1,581 | ) | |||||
| — | 108,209 | ||||||
| — | (913,426 | ) | |||||
| — | — | ||||||
| (540,415 | ) | 1,738,903 | |||||
| (14,372,755 | ) | (4,165,813 | ) | ||||
| (11,802,665 | ) | (1,793,092 | ) | ||||
| $ | (11,797,419 | ) | $ | (1,595,803 | ) | ||
| $ | — | $ | 20,162 | ||||
| $ | — | $ | 369 | ||||
Semi-Annual Report 81
The Lazard Funds, Inc. Statements of Changes in Net Assets (unaudited)
| Lazard Enhanced Opportunities Portfolio | ||||||||||
| Six Months Ended June 30, 2022 (unaudited) | Year Ended December 31, 2021 | |||||||||
| Increase (Decrease) in Net Assets | ||||||||||
| Operations | ||||||||||
| Net investment income (loss) | $ | 1,170,636 | $ | 750,640 | ||||||
| Net realized gain (loss) | (1,353,581 | ) | 4,011,613 | |||||||
| Net change in unrealized appreciation (depreciation) | (5,639,349 | ) | (3,002,835 | ) | ||||||
| Net increase (decrease) in net assets resulting from operations | (5,822,294 | ) | 1,759,418 | |||||||
| Distributions to shareholders (Note 2(i)) | ||||||||||
| Net investment income and net realized gains | ||||||||||
| Institutional Shares | — | (3,894,678 | ) | |||||||
| Open Shares | — | (25,718 | ) | |||||||
| Net decrease in net assets resulting from distributions | — | (3,920,396 | ) | |||||||
| Capital stock transactions | ||||||||||
| Net proceeds from sales | ||||||||||
| Institutional Shares | 40,463,754 | 144,578,146 | ||||||||
| Open Shares | 82,179 | 1,339,923 | ||||||||
| Net proceeds from reinvestment of distributions | ||||||||||
| Institutional Shares | — | 3,833,497 | ||||||||
| Open Shares | — | 25,718 | ||||||||
| Cost of shares redeemed | ||||||||||
| Institutional Shares | (126,948,273 | ) | (19,956,225 | ) | ||||||
| Open Shares | (625,981 | ) | (754,032 | ) | ||||||
| Net increase (decrease) in net assets from capital stock transactions | (87,028,321 | ) | 129,067,027 | |||||||
| Total increase (decrease) in net assets | (92,850,615 | ) | 126,906,049 | |||||||
| Net assets at beginning of period | 146,611,048 | 19,704,999 | ||||||||
| Net assets at end of period | $ | 53,760,433 | $ | 146,611,048 | ||||||
The accompanying notes are an integral part of these financial statements.
82 Semi-Annual Report
| Lazard Global Dynamic Multi-Asset Portfolio | Lazard Opportunistic Strategies Portfolio | |||||||||||||||
| Six Months Ended June 30, 2022 (unaudited) | Year Ended December 31, 2021 | Six Months Ended June 30, 2022 (unaudited) | Year Ended December 31, 2021 | |||||||||||||
| $ | 132,708 | $ | 242,193 | $ | 5,246 | $ | 322,031 | |||||||||
| 595,078 | 5,855,715 | 2,570,090 | 4,566,934 | |||||||||||||
| (4,036,348 | ) | (3,742,606 | ) | (14,372,755 | ) | 4,904,007 | ||||||||||
| (3,308,562 | ) | 2,355,302 | (11,797,419 | ) | 9,792,972 | |||||||||||
| — | (2,767,564 | ) | — | (3,330,657 | ) | |||||||||||
| — | (33,860 | ) | — | (6,195 | ) | |||||||||||
| — | (2,801,424 | ) | — | (3,336,852 | ) | |||||||||||
| 3,095,787 | 1,620,610 | 81,275 | 6,166,257 | |||||||||||||
| 842 | 15,330 | 4,066 | 29,890 | |||||||||||||
| — | 2,767,530 | — | 3,164,811 | |||||||||||||
| — | 33,860 | — | 5,712 | |||||||||||||
| (1,630,089 | ) | (44,259,435 | ) | (4,229,377 | ) | (15,244,058 | ) | |||||||||
| — | (60,231 | ) | — | (43,911 | ) | |||||||||||
| 1,466,540 | (39,882,336 | ) | (4,144,036 | ) | (5,921,299 | ) | ||||||||||
| (1,842,022 | ) | (40,328,458 | ) | (15,941,455 | ) | 534,821 | ||||||||||
| 17,832,577 | 58,161,035 | 78,804,702 | 78,269,881 | |||||||||||||
| $ | 15,990,555 | $ | 17,832,577 | $ | 62,863,247 | $ | 78,804,702 | |||||||||
Semi-Annual Report 83
| Lazard Enhanced Opportunities Portfolio | ||||||||||
| Six Months Ended June 30, 2022 (unaudited) | Year Ended December 31, 2021 | |||||||||
| Shares issued and redeemed | ||||||||||
| Institutional Shares | ||||||||||
| Shares outstanding at beginning of period | 15,584,880 | 2,140,850 | ||||||||
| Shares sold | 4,385,941 | 15,129,383 | ||||||||
| Shares issued to shareholders from reinvestment of distributions | — | 409,533 | ||||||||
| Shares redeemed | (13,779,716 | ) | (2,094,886 | ) | ||||||
| Net increase (decrease) | (9,393,775 | ) | 13,444,030 | |||||||
| Shares outstanding at end of period | 6,191,105 | 15,584,880 | ||||||||
| Open Shares | ||||||||||
| Shares outstanding at beginning of period | 82,674 | 18,359 | ||||||||
| Shares sold | 8,864 | 140,785 | ||||||||
| Shares issued to shareholders from reinvestment of distributions | — | 2,738 | ||||||||
| Shares redeemed | (68,008 | ) | (79,208 | ) | ||||||
| Net increase (decrease) | (59,144 | ) | 64,315 | |||||||
| Shares outstanding at end of period | 23,530 | 82,674 | ||||||||
The accompanying notes are an integral part of these financial statements.
84 Semi-Annual Report
| Lazard Global Dynamic Multi-Asset Portfolio | Lazard Opportunistic Strategies Portfolio | |||||||||||||||
| Six Months Ended June 30, 2022 (unaudited) | Year Ended December 31, 2021 | Six Months Ended June 30, 2022 (unaudited) | Year Ended December 31, 2021 | |||||||||||||
| 1,746,408 | 5,427,381 | 6,871,003 | 7,380,473 | |||||||||||||
| 331,713 | 148,571 | 7,815 | 552,009 | |||||||||||||
| — | 274,538 | — | 279,824 | |||||||||||||
| (179,540 | ) | (4,104,082 | ) | (401,057 | ) | (1,341,303 | ) | |||||||||
| 152,173 | (3,680,973 | ) | (393,242 | ) | (509,470 | ) | ||||||||||
| 1,898,581 | 1,746,408 | 6,477,761 | 6,871,003 | |||||||||||||
| 21,426 | 22,108 | 13,824 | 14,614 | |||||||||||||
| 91 | 1,341 | 391 | 2,747 | |||||||||||||
| — | 3,369 | — | 508 | |||||||||||||
| — | (5,392 | ) | — | (4,045 | ) | |||||||||||
| 91 | (682 | ) | 391 | (790 | ) | |||||||||||
| 21,517 | 21,426 | 14,215 | 13,824 | |||||||||||||
Semi-Annual Report 85
| Lazard Real Assets Portfolio (a) | |||||||||
| Six Months Ended June 30, 2022 (unaudited) | Year Ended December 31, 2021 | ||||||||
| Increase (Decrease) in Net Assets | |||||||||
| Operations | |||||||||
| Net investment income (loss) | $ | 197,289 | $ | 474,505 | |||||
| Net realized gain (loss) | 2,372,721 | 3,723,742 | |||||||
| Net change in unrealized appreciation (depreciation) | (4,165,813 | ) | 1,889,765 | ||||||
| Net increase (decrease) in net assets resulting from operations | (1,595,803 | ) | 6,088,012 | ||||||
| Distributions to shareholders (Note 2(i)) | |||||||||
| Net investment income and net realized gains | |||||||||
| Institutional Shares | (245,110 | ) | (3,880,176 | ) | |||||
| Open Shares | (4,940 | ) | (15,779 | ) | |||||
| Net decrease in net assets resulting from distributions | (250,050 | ) | (3,895,955 | ) | |||||
| Capital stock transactions | |||||||||
| Net proceeds from sales | |||||||||
| Institutional Shares | 2,298,835 | 9,676,948 | |||||||
| Open Shares | 1,679,630 | 94,863 | |||||||
| Net proceeds from reinvestment of distributions | |||||||||
| Institutional Shares | 227,354 | 3,565,581 | |||||||
| Open Shares | 4,940 | 15,779 | |||||||
| Cost of shares redeemed | |||||||||
| Institutional Shares | (823,047 | ) | (3,364,570 | ) | |||||
| Open Shares | (398,975 | ) | (83,834 | ) | |||||
| Net increase (decrease) in net assets from capital stock transactions | 2,988,737 | 9,904,767 | |||||||
| Total increase (decrease) in net assets | 1,142,884 | 12,096,824 | |||||||
| Net assets at beginning of period | 36,171,080 | 24,074,256 | |||||||
| Net assets at end of period | $ | 37,313,964 | $ | 36,171,080 | |||||
The accompanying notes are an integral part of these financial statements.
86 Semi-Annual Report
| Lazard Real Assets Portfolio (a) | |||||||||
| Six Months Ended June 30, 2022 (unaudited) | Year Ended December 31, 2021 | ||||||||
| Shares issued and redeemed | |||||||||
| Institutional Shares | |||||||||
| Shares outstanding at beginning of period | 3,212,708 | 2,319,287 | |||||||
| Shares sold | 202,402 | 875,067 | |||||||
| Shares issued to shareholders from reinvestment of distributions | 20,182 | 320,239 | |||||||
| Shares redeemed | (71,164 | ) | (301,885 | ) | |||||
| Net increase (decrease) | 151,420 | 893,421 | |||||||
| Shares outstanding at end of period | 3,364,128 | 3,212,708 | |||||||
| Open Shares | |||||||||
| Shares outstanding at beginning of period | 12,859 | 11,188 | |||||||
| Shares sold | 142,736 | 8,039 | |||||||
| Shares issued to shareholders from reinvestment of distributions | 449 | 1,417 | |||||||
| Shares redeemed | (35,275 | ) | (7,785 | ) | |||||
| Net increase (decrease) | 107,910 | 1,671 | |||||||
| Shares outstanding at end of period | 120,769 | 12,859 | |||||||
| (a) Consolidated Statements of Changes in Net Assets. | |||||||||
The accompanying notes are an integral part of these financial statements.
Semi-Annual Report 87
The Lazard Funds, Inc. Financial Highlights (unaudited)
LAZARD ENHANCED OPPORTUNITIES PORTFOLIO
| Selected data for a share of capital stock outstanding throughout | Six Months Ended | Year Ended | |||||||||||||||||||||||
| each period | 6/30/22† | 12/31/21 | 12/31/20 | 12/31/19 | 12/31/18 | 12/31/17 | |||||||||||||||||||
| Institutional Shares | |||||||||||||||||||||||||
| Net asset value, beginning of period | $ | 9.36 | $ | 9.13 | $ | 8.84 | $ | 8.31 | $ | 8.67 | $ | 9.16 | |||||||||||||
| Income (Loss) from investment operations: | |||||||||||||||||||||||||
| Net investment income (loss) (a) | 0.10 | 0.14 | # | 0.20 | 0.10 | 0.06 | 0.11 | ^ | |||||||||||||||||
| Net realized and unrealized gain (loss) | (0.81 | ) | 0.48 | 0.69 | 0.52 | (0.20 | ) | 0.40 | |||||||||||||||||
| Total from investment operations | (0.71 | ) | 0.62 | 0.89 | 0.62 | (0.14 | ) | 0.51 | |||||||||||||||||
| Less distributions from: | |||||||||||||||||||||||||
| Net investment income | — | (0.05 | ) | (0.22 | ) | — | (0.10 | ) | (0.17 | ) | |||||||||||||||
| Net realized gains | — | (0.34 | ) | (0.38 | ) | (0.09 | ) | (0.12 | ) | (0.83 | ) | ||||||||||||||
| Total distributions | — | (0.39 | ) | (0.60 | ) | (0.09 | ) | (0.22 | ) | (1.00 | ) | ||||||||||||||
| Net asset value, end of period | $ | 8.65 | $ | 9.36 | $ | 9.13 | $ | 8.84 | $ | 8.31 | $ | 8.67 | |||||||||||||
| Total Return (b) | –7.59 | % | 6.81 | %# | 10.11 | % | 7.44 | % | –1.66 | % | 5.56 | %^ | |||||||||||||
| Ratios and Supplemental Data: | |||||||||||||||||||||||||
| Net assets, end of period (in thousands) | $ | 53,557 | $ | 145,836 | $ | 19,537 | $ | 9,223 | $ | 16,184 | $ | 15,206 | |||||||||||||
| Ratios to average net assets (c): | |||||||||||||||||||||||||
| Net expenses | 1.97 | % | 1.70 | %# | 2.23 | % | 2.71 | % | 2.36 | % | 2.78 | %^ | |||||||||||||
| Gross expenses | 1.97 | % | 2.05 | % | 3.79 | % | 5.52 | % | 3.80 | % | 5.02 | %^ | |||||||||||||
| Gross expenses, excluding expenses on securities sold short | 1.23 | % | 1.54 | % | 2.82 | % | 4.06 | % | 2.71 | % | 3.45 | % | |||||||||||||
| Net investment income (loss) | 2.19 | % | 1.47 | %# | 2.22 | % | 1.19 | % | 0.73 | % | 1.20 | %^ | |||||||||||||
| Portfolio turnover rate: | |||||||||||||||||||||||||
| Excluding securities sold short | 141 | % | 168 | % | 167 | % | 272 | % | 312 | % | 210 | % | |||||||||||||
| Including securities sold short | 162 | % | 341 | % | 241 | % | 354 | % | 409 | % | 310 | % | |||||||||||||
The accompanying notes are an integral part of these financial statements.
88 Semi-Annual Report
| Selected data for a share of capital stock outstanding throughout | Six Months Ended | Year Ended | |||||||||||||||||||||||
| each period | 6/30/22† | 12/31/21 | 12/31/20 | 12/31/19 | 12/31/18 | 12/31/17 | |||||||||||||||||||
| Open Shares | |||||||||||||||||||||||||
| Net asset value, beginning of period | $ | 9.37 | $ | 9.13 | $ | 8.82 | $ | 8.30 | $ | 8.65 | $ | 9.15 | |||||||||||||
| Income (Loss) from investment operations: | |||||||||||||||||||||||||
| Net investment income (loss) (a) | 0.09 | 0.13 | # | 0.16 | 0.10 | 0.04 | 0.10 | ^ | |||||||||||||||||
| Net realized and unrealized gain (loss) | (0.81 | ) | 0.47 | 0.70 | 0.51 | (0.19 | ) | 0.37 | |||||||||||||||||
| Total from investment operations | (0.72 | ) | 0.60 | 0.86 | 0.61 | (0.15 | ) | 0.47 | |||||||||||||||||
| Less distributions from: | |||||||||||||||||||||||||
| Net investment income | — | (0.02 | ) | (0.17 | ) | — | (0.08 | ) | (0.14 | ) | |||||||||||||||
| Net realized gains | — | (0.34 | ) | (0.38 | ) | (0.09 | ) | (0.12 | ) | (0.83 | ) | ||||||||||||||
| Total distributions | — | (0.36 | ) | (0.55 | ) | (0.09 | ) | (0.20 | ) | (0.97 | ) | ||||||||||||||
| Net asset value, end of period | $ | 8.65 | $ | 9.37 | $ | 9.13 | $ | 8.82 | $ | 8.30 | $ | 8.65 | |||||||||||||
| Total Return (b) | –7.79 | % | 6.55 | %# | 9.83 | % | 7.33 | % | –1.80 | % | 5.16 | %^ | |||||||||||||
| Ratios and Supplemental Data: | |||||||||||||||||||||||||
| Net assets, end of period (in thousands) | $ | 204 | $ | 775 | $ | 168 | $ | 123 | $ | 105 | $ | 117 | |||||||||||||
| Ratios to average net assets (c): | |||||||||||||||||||||||||
| Net expenses | 2.27 | % | 1.92 | %# | 2.45 | % | 2.83 | % | 2.60 | % | 3.01 | %^ | |||||||||||||
| Gross expenses | 3.41 | % | 2.99 | % | 4.94 | % | 13.76 | % | 14.49 | % | 16.40 | %^ | |||||||||||||
| Gross expenses, excluding expenses on securities sold short | 2.64 | % | 2.52 | % | 3.99 | % | 12.30 | % | 13.40 | % | 14.85 | % | |||||||||||||
| Net investment income (loss) | 1.98 | % | 1.42 | %# | 1.75 | % | 1.10 | % | 0.48 | % | 1.06 | %^ | |||||||||||||
| Portfolio turnover rate: | |||||||||||||||||||||||||
| Excluding securities sold short | 141 | % | 168 | % | 167 | % | 272 | % | 312 | % | 210 | % | |||||||||||||
| Including securities sold short | 162 | % | 341 | % | 241 | % | 354 | % | 409 | % | 310 | % | |||||||||||||
The accompanying notes are an integral part of these financial statements.
Semi-Annual Report 89
| † | Unaudited. |
| # | A one-time voluntary reimbursement by the administrator increased the net investment income per share amount of $0.01 per share. For Institutional Shares and Open Shares, the one-time voluntary reimbursement by the administrator increased the total return ratio by 0.11%, decreased the net expense ratios by 0.07% and 0.06% respectively, and increased the net investment income (loss) ratio by 0.06%. |
| ^ | A one-time voluntary reimbursement by the administrator increased the net investment income per share amount of $0.04 per share. For Institutional Shares and Open Shares, the one-time voluntary reimbursement by the administrator increased the total return ratio by 0.49%, decreased the gross expense and net expense ratios by 0.44% and increased the net investment income (loss) ratio by 0.44%. |
| (a) | Net investment income (loss) has been computed using the average shares method. |
| (b) | Total returns reflect reinvestment of all dividends and distributions, if any. Certain expenses of the Portfolio may have been waived or reimbursed by the Investment Manager, State Street or DST; without such waiver/reimbursement of expenses, the Portfolio’s returns would have been lower. Returns for a period of less than one year are not annualized. |
| (c) | Annualized for a period of less than one year. |
The accompanying notes are an integral part of these financial statements.
90 Semi-Annual Report
LAZARD GLOBAL DYNAMIC MULTI-ASSET PORTFOLIO
| Selected data for a share of capital stock outstanding throughout | Six Month Ended | Year Ended | |||||||||||||||||||||||
| the period | 6/30/22† | 12/31/21 | 12/31/20 | 12/31/19 | 12/31/18 | 12/31/17 | |||||||||||||||||||
| Institutional Shares | |||||||||||||||||||||||||
| Net asset value, beginning of period | $ | 10.09 | $ | 10.67 | $ | 10.78 | $ | 9.27 | $ | 11.49 | $ | 10.00 | |||||||||||||
| Income (Loss) from investment operations: | |||||||||||||||||||||||||
| Net investment income (loss) (a) | 0.07 | 0.10 | 0.08 | 0.14 | 0.16 | 0.15 | |||||||||||||||||||
| Net realized and unrealized gain (loss) | (1.83 | ) | 1.18 | 0.02 | 1.51 | (0.92 | ) | 1.92 | |||||||||||||||||
| Total from investment operations | (1.76 | ) | 1.28 | 0.10 | 1.65 | (0.76 | ) | 2.07 | |||||||||||||||||
| Less distributions from: | |||||||||||||||||||||||||
| Net investment income | — | (0.16 | ) | (0.21 | ) | (0.14 | ) | (0.20 | ) | (0.14 | ) | ||||||||||||||
| Net realized gains | — | (1.70 | ) | — | — | (1.26 | ) | (0.44 | ) | ||||||||||||||||
| Total distributions | — | (1.86 | ) | (0.21 | ) | (0.14 | ) | (1.46 | ) | (0.58 | ) | ||||||||||||||
| Net asset value, end of period | $ | 8.33 | $ | 10.09 | $ | 10.67 | $ | 10.78 | $ | 9.27 | $ | 11.49 | |||||||||||||
| Total Return (b) | –17.44 | % | 12.17 | % | 1.00 | % | 17.80 | % | –6.35 | % | 20.69 | % | |||||||||||||
| Ratios and Supplemental Data: | |||||||||||||||||||||||||
| Net assets, end of period (in thousands) | $ | 15,812 | $ | 17,617 | $ | 57,925 | $ | 47,481 | $ | 42,577 | $ | 68,761 | |||||||||||||
| Ratios to average net assets (c): | |||||||||||||||||||||||||
| Net expenses | 0.90 | % | 0.90 | % | 0.90 | % | 0.90 | % | 0.90 | % | 0.90 | % | |||||||||||||
| Gross expenses | 2.23 | % | 1.70 | % | 1.32 | % | 1.45 | % | 1.34 | % | 1.42 | % | |||||||||||||
| Net investment income (loss) | 1.57 | % | 0.91 | % | 0.84 | % | 1.36 | % | 1.36 | % | 1.40 | % | |||||||||||||
| Portfolio turnover rate | 64 | % | 83 | % | 173 | % | 125 | % | 120 | % | 102 | % | |||||||||||||
The accompanying notes are an integral part of these financial statements.
Semi-Annual Report 91
| Selected data for a share of capital stock outstanding throughout | Six Months Ended | Year Ended | |||||||||||||||||||||||
| the period | 6/30/22† | 12/31/21 | 12/31/20 | 12/31/19 | 12/31/18 | 12/31/17 | |||||||||||||||||||
| Open Shares | |||||||||||||||||||||||||
| Net asset value, beginning of period | $ | 10.06 | $ | 10.68 | $ | 10.78 | $ | 9.27 | $ | 11.49 | $ | 10.00 | |||||||||||||
| Income (Loss) from investment operations: | |||||||||||||||||||||||||
| Net investment income (loss) (a) | 0.06 | 0.08 | 0.06 | 0.11 | 0.12 | 0.12 | |||||||||||||||||||
| Net realized and unrealized gain (loss) | (1.82 | ) | 1.16 | 0.03 | 1.51 | (0.91 | ) | 1.91 | |||||||||||||||||
| Total from investment operations | (1.76 | ) | 1.24 | 0.09 | 1.62 | (0.79 | ) | 2.03 | |||||||||||||||||
| Less distributions from: | |||||||||||||||||||||||||
| Net investment income | — | (0.16 | ) | (0.19 | ) | (0.11 | ) | (0.17 | ) | (0.10 | ) | ||||||||||||||
| Net realized gains | — | (1.70 | ) | — | — | (1.26 | ) | (0.44 | ) | ||||||||||||||||
| Total distributions | — | (1.86 | ) | (0.19 | ) | (0.11 | ) | (1.43 | ) | (0.54 | ) | ||||||||||||||
| Net asset value, end of period | $ | 8.30 | $ | 10.06 | $ | 10.68 | $ | 10.78 | $ | 9.27 | $ | 11.49 | |||||||||||||
| Total Return (b) | –17.50 | % | 11.78 | % | 0.84 | % | 17.46 | % | –6.64 | % | 20.33 | % | |||||||||||||
| Ratios and Supplemental Data: | |||||||||||||||||||||||||
| Net assets, end of period (in thousands) | $ | 178 | $ | 216 | $ | 236 | $ | 293 | $ | 225 | $ | 414 | |||||||||||||
| Ratios to average net assets (c): | |||||||||||||||||||||||||
| Net expenses | 1.15 | % | 1.15 | % | 1.15 | % | 1.18 | % | 1.20 | % | 1.20 | % | |||||||||||||
| Gross expenses | 4.74 | % | 3.95 | % | 3.09 | % | 5.45 | % | 4.20 | % | 5.79 | % | |||||||||||||
| Net investment income (loss) | 1.30 | % | 0.69 | % | 0.61 | % | 1.10 | % | 1.07 | % | 1.09 | % | |||||||||||||
| Portfolio turnover rate | 64 | % | 83 | % | 173 | % | 125 | % | 120 | % | 102 | % | |||||||||||||
| † | Unaudited. |
| (a) | Net investment income (loss) has been computed using the average shares method. |
| (b) | Total returns reflect reinvestment of all dividends and distributions, if any. Certain expenses of the Portfolio may have been waived or reimbursed by the Investment Manager, State Street or DST; without such waiver/reimbursement of expenses, the Portfolio’s returns would have been lower. Returns for a period of less than one year are not annualized. |
| (c) | Annualized for a period of less than one year. |
The accompanying notes are an integral part of these financial statements.
92 Semi-Annual Report
LAZARD OPPORTUNISTIC STRATEGIES PORTFOLIO
| Selected data for a share of capital stock outstanding throughout | Six Months Ended | Year Ended | |||||||||||||||||||||||
| each period | 6/30/22† | 12/31/21 | 12/31/20 | 12/31/19 | 12/31/18 | 12/31/17 | |||||||||||||||||||
| Institutional Shares | |||||||||||||||||||||||||
| Net asset value, beginning of period | $ | 11.45 | $ | 10.58 | $ | 9.87 | $ | 8.74 | $ | 10.60 | $ | 9.70 | |||||||||||||
| Income (Loss) from investment operations: | |||||||||||||||||||||||||
| Net investment income (loss) (a) | — | (b) | 0.05 | 0.05 | 0.10 | 0.14 | 0.10 | ||||||||||||||||||
| Net realized and unrealized gain (loss) | (1.77 | ) | 1.32 | 0.88 | 1.23 | (1.48 | ) | 1.62 | |||||||||||||||||
| Total from investment operations | (1.77 | ) | 1.37 | 0.93 | 1.33 | (1.34 | ) | 1.72 | |||||||||||||||||
| Less distributions from: | |||||||||||||||||||||||||
| Net investment income | — | (0.04 | ) | (0.05 | ) | (0.12 | ) | (0.02 | ) | (0.14 | ) | ||||||||||||||
| Net realized gains | — | (0.46 | ) | (0.17 | ) | (0.08 | ) | (0.48 | ) | (0.68 | ) | ||||||||||||||
| Return of capital | — | — | — | — | (0.02 | ) | — | ||||||||||||||||||
| Total distributions | — | (0.50 | ) | (0.22 | ) | (0.20 | ) | (0.52 | ) | (0.82 | ) | ||||||||||||||
| Net asset value, end of period | $ | 9.68 | $ | 11.45 | $ | 10.58 | $ | 9.87 | $ | 8.74 | $ | 10.60 | |||||||||||||
| Total Return (c) | –15.46 | % | 12.96 | % | 9.47 | % | 15.16 | % | –12.72 | % | 17.74 | % | |||||||||||||
| Ratios and Supplemental Data: | |||||||||||||||||||||||||
| Net assets, end of period (in thousands) | $ | 62,727 | $ | 78,647 | $ | 78,116 | $ | 83,509 | $ | 102,783 | $ | 151,767 | |||||||||||||
| Ratios to average net assets (d): | |||||||||||||||||||||||||
| Net expenses | 1.04 | % | 1.11 | % | 1.04 | % | 1.22 | % | 1.02 | % | 1.05 | % | |||||||||||||
| Gross expenses | 1.28 | % | 1.28 | % | 1.30 | % | 1.43 | % | 1.15 | % | 1.18 | % | |||||||||||||
| Gross expenses, excluding expenses on securities sold short | 1.27 | % | 1.19 | % | 1.29 | % | 1.23 | % | 1.15 | %* | 1.15 | % | |||||||||||||
| Net investment income (loss) | 0.02 | % | 0.40 | % | 0.55 | % | 1.08 | % | 1.32 | % | 0.99 | % | |||||||||||||
| Portfolio turnover rate: | |||||||||||||||||||||||||
| Excluding securities sold short | 59 | % | 65 | % | 88 | % | 82 | % | 227 | % | 142 | % | |||||||||||||
| Including securities sold short | 61 | % | 65 | % | 94 | % | 99 | % | NA | %* | 153 | % | |||||||||||||
The accompanying notes are an integral part of these financial statements.
Semi-Annual Report 93
| Selected data for a share of capital stock outstanding throughout | Six Months Ended | Year Ended | |||||||||||||||||||||||
| each period | 6/30/22† | 12/31/21 | 12/31/20 | 12/31/19 | 12/31/18 | 12/31/17 | |||||||||||||||||||
| Open Shares | |||||||||||||||||||||||||
| Net asset value, beginning of period | $ | 11.38 | $ | 10.52 | $ | 9.82 | $ | 8.69 | $ | 10.55 | $ | 9.65 | |||||||||||||
| Income (Loss) from investment operations: | |||||||||||||||||||||||||
| Net investment income (loss) (a) | (0.01 | ) | 0.02 | 0.03 | 0.07 | 0.10 | 0.05 | ||||||||||||||||||
| Net realized and unrealized gain (loss) | (1.76 | ) | 1.31 | 0.86 | 1.23 | (1.46 | ) | 1.64 | |||||||||||||||||
| Total from investment operations | (1.77 | ) | 1.33 | 0.89 | 1.30 | (1.36 | ) | 1.69 | |||||||||||||||||
| Less distributions from: | |||||||||||||||||||||||||
| Net investment income | — | (0.01 | ) | (0.02 | ) | (0.09 | ) | — | (0.11 | ) | |||||||||||||||
| Net realized gains | — | (0.46 | ) | (0.17 | ) | (0.08 | ) | (0.48 | ) | (0.68 | ) | ||||||||||||||
| Return of capital | — | — | — | — | (0.02 | ) | — | ||||||||||||||||||
| Total distributions | — | (0.47 | ) | (0.19 | ) | (0.17 | ) | (0.50 | ) | (0.79 | ) | ||||||||||||||
| Net asset value, end of period | $ | 9.61 | $ | 11.38 | $ | 10.52 | $ | 9.82 | $ | 8.69 | $ | 10.55 | |||||||||||||
| Total Return (c) | –15.55 | % | 12.65 | % | 9.14 | % | 14.91 | % | –13.05 | % | 17.48 | % | |||||||||||||
| Ratios and Supplemental Data: | |||||||||||||||||||||||||
| Net assets, end of period (in thousands) | $ | 137 | $ | 157 | $ | 154 | $ | 208 | $ | 286 | $ | 428 | |||||||||||||
| Ratios to average net assets (d): | |||||||||||||||||||||||||
| Net expenses | 1.29 | % | 1.36 | % | 1.28 | % | 1.51 | % | 1.32 | % | 1.34 | % | |||||||||||||
| Gross expenses | 4.62 | % | 4.06 | % | 7.75 | % | 3.78 | % | 4.22 | % | 3.87 | % | |||||||||||||
| Gross expenses, excluding expenses on securities sold short | 4.60 | % | 3.97 | % | 7.74 | % | 3.58 | % | 4.22 | %* | 3.85 | % | |||||||||||||
| Net investment income (loss) | –0.21 | % | 0.15 | % | 0.31 | % | 0.76 | % | 1.00 | % | 0.53 | % | |||||||||||||
| Portfolio turnover rate: | |||||||||||||||||||||||||
| Excluding securities sold short | 59 | % | 65 | % | 88 | % | 82 | % | 227 | % | 142 | % | |||||||||||||
| Including securities sold short | 61 | % | 65 | % | 94 | % | 99 | % | NA | %* | 153 | % | |||||||||||||
The accompanying notes are an integral part of these financial statements.
94 Semi-Annual Report
| † | Unaudited. |
| * | No securities sold short during the year. |
| (a) | Net investment income (loss) has been computed using the average shares method. |
| (b) | Amount is less than $0.01 per share. |
| (c) | Total returns reflect reinvestment of all dividends and distributions, if any. Certain expenses of the Portfolio may have been waived or reimbursed by the Investment Manager, State Street or DST; without such waiver/reimbursement of expenses, the Portfolio’s returns would have been lower. Returns for a period of less than one year are not annualized. |
| (d) | Annualized for a period of less than one year. |
The accompanying notes are an integral part of these financial statements.
Semi-Annual Report 95
LAZARD REAL ASSETS PORTFOLIO^
| Selected data for a share of capital stock outstanding throughout | Six Months Ended | Year Ended | |||||||||||||||||||||||
| each period | 6/30/22† | 12/31/21 | 12/31/20 | 12/31/19 | 12/31/18 | 12/31/17 | |||||||||||||||||||
| Institutional Shares | |||||||||||||||||||||||||
| Net asset value, beginning of period | $ | 11.21 | $ | 10.33 | $ | 10.69 | $ | 9.42 | $ | 10.71 | $ | 10.00 | |||||||||||||
| Income (Loss) from investment operations: | |||||||||||||||||||||||||
| Net investment income (loss) (a) | 0.06 | 0.17 | 0.17 | 0.16 | 0.16 | 0.19 | |||||||||||||||||||
| Net realized and unrealized gain (loss) | (0.49 | ) | 2.04 | (0.12 | ) | 1.35 | (0.96 | ) | 0.78 | ||||||||||||||||
| Total from investment operations | (0.43 | ) | 2.21 | 0.05 | 1.51 | (0.80 | ) | 0.97 | |||||||||||||||||
| Less distributions from: | |||||||||||||||||||||||||
| Net investment income | (0.07 | ) | (1.26 | ) | (0.20 | ) | (0.24 | ) | (0.25 | ) | (0.13 | ) | |||||||||||||
| Net realized gains | — | (0.07 | ) | (0.21 | ) | — | (b) | (0.24 | ) | (0.13 | ) | ||||||||||||||
| Total distributions | (0.07 | ) | (1.33 | ) | (0.41 | ) | (0.24 | ) | (0.49 | ) | (0.26 | ) | |||||||||||||
| Net asset value, end of period | $ | 10.71 | $ | 11.21 | $ | 10.33 | $ | 10.69 | $ | 9.42 | $ | 10.71 | |||||||||||||
| Total Return (c) | –3.83 | % | 21.60 | % | 0.61 | % | 16.07 | % | –7.47 | % | 9.80 | % | |||||||||||||
| Ratios and Supplemental Data: | |||||||||||||||||||||||||
| Net assets, end of period (in thousands) | $ | 36,020 | $ | 36,027 | $ | 23,959 | $ | 17,515 | $ | 16,164 | $ | 17,812 | |||||||||||||
| Ratios to average net assets (d): | |||||||||||||||||||||||||
| Net expenses | 0.80 | % | 0.80 | % | 0.86 | % | 0.90 | % | 0.90 | % | 0.90 | % | |||||||||||||
| Gross expenses | 1.24 | % | 1.29 | % | 2.13 | % | 2.20 | % | 2.04 | % | 3.13 | % | |||||||||||||
| Net investment income (loss) | 1.03 | % | 1.49 | % | 1.73 | % | 1.59 | % | 1.53 | % | 1.79 | % | |||||||||||||
| Portfolio turnover rate | 61 | % | 35 | % | 109 | % | 44 | % | 72 | % | 76 | % | |||||||||||||
The accompanying notes are an integral part of these financial statements.
96 Semi-Annual Report
| Selected data for a | Year Ended | ||||||||||||||||||||||||
| share of capital stock outstanding throughout each period | Six Months Ended 6/30/22† | 12/31/21 | 12/31/20 | 12/31/19 | 12/31/18 | For the Period 1/9/17* to 12/31/17 | |||||||||||||||||||
| Open Shares | |||||||||||||||||||||||||
| Net asset value, beginning of period | $ | 11.22 | $ | 10.34 | $ | 10.67 | $ | 9.41 | $ | 10.70 | $ | 10.03 | |||||||||||||
| Income (Loss) from investment operations: | |||||||||||||||||||||||||
| Net investment income (loss) (a) | 0.08 | 0.13 | 0.17 | 0.14 | 0.14 | 0.18 | |||||||||||||||||||
| Net realized and unrealized gain (loss) | (0.52 | ) | 2.05 | (0.14 | ) | 1.33 | (0.96 | ) | 0.74 | ||||||||||||||||
| Total from investment operations | (0.44 | ) | 2.18 | 0.03 | 1.47 | (0.82 | ) | 0.92 | |||||||||||||||||
| Less distributions from: | |||||||||||||||||||||||||
| Net investment income | (0.06 | ) | (1.23 | ) | (0.15 | ) | (0.21 | ) | (0.23 | ) | (0.12 | ) | |||||||||||||
| Net realized gains | — | (0.07 | ) | (0.21 | ) | — | (b) | (0.24 | ) | (0.13 | ) | ||||||||||||||
| Total distributions | (0.06 | ) | (1.30 | ) | (0.36 | ) | (0.21 | ) | (0.47 | ) | (0.25 | ) | |||||||||||||
| Net asset value, end of period | $ | 10.72 | $ | 11.22 | $ | 10.34 | $ | 10.67 | $ | 9.41 | $ | 10.70 | |||||||||||||
| Total Return (c) | –3.94 | % | 21.28 | % | 0.42 | % | 15.70 | % | –7.70 | % | 9.17 | % | |||||||||||||
| Ratios and Supplemental Data: | |||||||||||||||||||||||||
| Net assets, end of period (in thousands) | $ | 1,294 | $ | 144 | $ | 116 | $ | 65 | $ | 43 | $ | 135 | |||||||||||||
| Ratios to average net assets (d): | |||||||||||||||||||||||||
| Net expenses | 1.05 | % | 1.05 | % | 1.13 | % | 1.10 | % | 1.15 | % | 1.15 | % | |||||||||||||
| Gross expenses | 2.21 | % | 5.90 | % | 4.64 | % | 23.75 | % | 13.72 | % | 20.65 | % | |||||||||||||
| Net investment income (loss) | 1.34 | % | 1.16 | % | 1.77 | % | 1.39 | % | 1.29 | % | 1.69 | % | |||||||||||||
| Portfolio turnover rate | 61 | % | 35 | % | 109 | % | 44 | % | 72 | % | 76 | % | |||||||||||||
| ^ | Consolidated Financial Highlights. |
| † | Unaudited. |
| * | The inception date for the Open Shares was January 9, 2017. |
| (a) | Net investment income (loss) has been computed using the average shares method. |
| (b) | Amount is less than $0.01 per share. |
| (c) | Total returns reflect reinvestment of all dividends and distributions, if any. Certain expenses of the Portfolio may have been waived or reimbursed by the Investment Manager, State Street or DST; without such waiver/reimbursement of expenses, the Portfolio’s returns would have been lower. Returns for a period of less than one year are not annualized. |
| (d) | Annualized for a period of less than one year except for non-recurring expenses. |
The accompanying notes are an integral part of these financial statements.
Semi-Annual Report 97
The Lazard Funds, Inc. Notes to Financial Statements
June 30, 2022 (unaudited)
1. Organization
The Lazard Funds, Inc. was incorporated in Maryland on May 17, 1991 and is registered under the Investment Company Act of 1940, as amended (the “1940 Act”), as an open-end management investment company. As of June 30, 2022, the Fund was comprised of twenty nine no-load portfolios (each referred to as a “Portfolio”). This report includes only the financial statements of the Lazard Enhanced Opportunities Portfolio (“Enhanced Opportunities”), the Lazard Global Dynamic Multi-Asset Portfolio (“Global Dynamic Multi-Asset”), the Lazard Opportunistic Strategies Portfolio (“Opportunistic Strategies”) and Lazard Real Assets Portfolio (“Real Assets”). The financial statements of the other twenty-five Portfolios are presented separately.
The Global Dynamic Multi-Asset, Opportunistic Strategies, and Real Assets Portfolios are operated as “diversified” funds, as defined in the 1940 Act. The Lazard Enhanced Opportunities Portfolio is operated as a “non-diversified” fund, as defined in the 1940 Act.
Each Portfolio currently offers Institutional Shares and Open Shares. Each share class is identical except as to minimum investment requirements; the services offered to, and expenses borne by, each class; and the availability of Service Payments (as defined in the Fund’s prospectus).
Lazard Real Assets Portfolio has a wholly-owned subsidiary, Lazard Real Assets Portfolio, Ltd. (the “Subsidiary”), organized under the laws of the Cayman Islands. The Subsidiary acts as an investment vehicle for the Portfolio in order to effect certain investments on behalf of the Portfolio, consistent with its investment objective and policies as described in its prospectus. In addition to investing directly in commodity-linked instruments, the Portfolio may gain exposure to the commodities markets by investing up to 25% of its total assets in the Subsidiary. The financial statements of the Portfolio have been consolidated and include the accounts of both the Portfolio and the Subsidiary. All inter-company balances and transactions have been eliminated in consolidation. As of June 30, 2022, net assets of the Portfolio
98 Semi-Annual Report
were $37,313,964 of which $6,389,169, or 17.12%, represented the Portfolio’s ownership of all issued shares and voting rights of the Subsidiary.
2. Significant Accounting Policies
The accompanying financial statements are presented in conformity with GAAP. The Portfolio is an investment company and therefore applies specialized accounting guidance in accordance with Accounting Standards Codification Topic 946. The following is a summary of significant accounting policies consistently followed by the Fund in the preparation of the financial statements:
(a) Valuation of Investments—Equity securities traded on a securities exchange or market, including exchange-traded option contracts, rights and warrants, are valued at the last reported sales price (for US listed equity securities) or the closing price (for non-US listed equity securities) on the exchange or market on which the security is principally traded or, for securities trading on the Nasdaq, the Nasdaq Official Closing Price. If there is no available closing price for a non-US listed equity security, the last reported sales price is used. If there are no reported sales of a security on the valuation date, the security is valued at the most recent quoted bid price on such date reported by such principal exchange or market. Futures contracts are valued at the settlement price on the exchange on which the contract is principally traded. Over the counter swap agreements are valued by an independent pricing service and centrally cleared swaps are valued at the last reported sale on the clearing exchange. Forward currency contracts generally are valued using quotations from an independent pricing service. Investments in money market funds are valued at the fund’s net asset value (“NAV”) per share.
Bonds and other fixed-income securities that are not exchange-traded are valued on the basis of prices provided by independent pricing services which are based on, among other things, trading in securities with similar characteristics, brokers’ quotations and/or a matrix system which considers such factors as other security prices, yields and maturities.
Semi-Annual Report 99
Calculation of a Portfolio’s NAV may not take place contemporaneously with the determination of the prices of portfolio assets used in such calculation. Trading on certain non-US securities exchanges or markets, such as those in Europe and Asia, ordinarily may be completed before the close of business on each business day in New York (i.e., a day on which the New York Stock Exchange (the “NYSE”) is open). In addition, securities trading in a particular non-US country or countries, may not take place on all business days in New York and on which the NAV of a Portfolio is calculated.
If a significant event materially affecting the value of securities occurs between the close of the exchange or market on which the security is principally traded and the time when a Portfolio’s NAV is calculated, or when current market quotations otherwise are determined not to be readily available or reliable (including restricted or other illiquid securities such as certain derivative instruments), such securities will be valued at their fair value as determined by, or in accordance with procedures approved by, the Fund’s Board of Directors (the “Board”). The fair value of non-US securities may be determined with the assistance of an independent pricing service using correlations between the movement of prices of such securities and indices of US securities and other appropriate indicators, such as closing market prices of relevant ADRs or futures contracts. Certain non-US securities may trade on days when a Portfolio is not open for business, thus affecting the value of the Portfolio’s assets on days when Portfolio shareholders may not be able to buy or sell Portfolio shares.
The Valuation Committee of the Investment Manager, which is subject to the oversight of the Board, may evaluate a variety of factors to determine the fair value of securities for which market quotations are determined not to be readily available or reliable. These factors include, but are not limited to, the type of security, the value of comparable securities, observations from financial institutions and relevant news events. Input from the Investment Manager’s portfolio management team also will be considered.
100 Semi-Annual Report
The effect of using fair value pricing is that the NAV of a Portfolio will reflect the affected securities’ values as determined in the judgment of the Board or its designee instead of being determined by the market. Using a fair value pricing methodology to price securities may result in a value that is different from the most recent closing price of a security and from the prices used by other investment companies to calculate their portfolios’ NAVs.
(b) Portfolio Securities Transactions and Investment Income—Portfolio securities transactions are accounted for on trade date. Realized gain (loss) on sales of investments are recorded on a specific identification basis. Dividend income and dividend expenses on short sales are recorded on the ex-dividend date except for certain dividends from non-US securities where the dividend rate is not available. In such cases, the dividend is recorded as soon as the information is received by a Portfolio. Interest income, if any, is accrued daily. A Portfolio amortizes premiums and accretes discounts on fixed-income securities using the effective yield method.
A Portfolio may be subject to taxes imposed by non-US countries in which it invests. Such taxes are generally based upon income earned or capital gains (realized and/or unrealized). An affected Portfolio accrues and applies such taxes to net investment income, net realized gains and net unrealized gains concurrent with the recognition of income earned or capital gains (realized and/or unrealized) from the applicable Portfolio securities.
(c) Foreign Currency Translation and Forward Currency Contracts—The accounting records of the Fund are maintained in US dollars. Portfolio securities and other assets and liabilities denominated in a foreign currency are translated daily into US dollars at the prevailing rates of exchange. Purchases and sales of securities, income receipts and expense payments are translated into US dollars at the prevailing exchange rates on the respective transaction dates.
The Portfolios do not isolate the portion of operations resulting from changes in foreign exchange rates on investments from the
Semi-Annual Report 101
fluctuations arising from changes in their market prices. Such fluctuations are included in net realized and unrealized gain (loss) on investments.
A forward currency contract is an agreement between two parties to buy or sell currency at a set price on a future date. Daily fluctuations in the value of forward currency contracts are recorded as unrealized appreciation (depreciation) on forward currency contracts. When the contract is closed, the Portfolio records a realized gain (loss) equal to the difference between the value at the time it was opened and the value at the time it was closed. Net realized gain (loss) on foreign currency transactions and forward currency contracts represent net foreign currency gain (loss) from forward currency contracts, disposition of foreign currencies, currency gain (loss) realized between the trade and settlement dates on securities transactions, and the difference between the amount of dividends, interest and foreign withholding taxes recorded on the Portfolios’ accounting records and the US dollar equivalent amounts actually received or paid. Net change in unrealized appreciation (depreciation) on foreign currency translations reflects the impact of changes in exchange rates on the value of assets and liabilities, other than investments in securities, during the period.
During the period ended June 30, 2022, the Enhanced Opportunities, Global Dynamic Multi-Asset and Real Assets Portfolios traded in forward currency contracts.
(d) Futures Contracts—Futures contracts are purchased or sold to gain exposure to, or manage exposure from, changes in the value of equity securities or foreign currencies and changes in interest rates.
Futures contracts are exchange-traded agreements between a Portfolio and a counter-party to buy or sell a specific quantity of an underlying instrument at a specified price and on a specified date. Depending on the terms of a contract, it is settled either through physical delivery of the underlying instrument on the settlement date or by payment of a cash amount on the settlement date. Upon entering into a futures contract, a Portfolio is required to
102 Semi-Annual Report
deposit initial margin with the broker in the form of cash or securities in an amount that varies depending on a contract’s size and risk profile. The initial margin deposit must then be maintained at an established level over the life of the contract. Amounts pledged, which are considered restricted, are included in cash collateral pledged for futures contracts in the Statement of Assets and Liabilities.
Securities may be deposited as initial margin. If applicable, any cash deposited and held on margin is shown as cash pledged for futures contracts in the Statement of Assets and Liabilities. Pursuant to the contract, a Portfolio agrees to receive from or pay to the broker an amount of cash equal to the daily fluctuation in market value of the contract (“variation margin”). Variation margin is recorded as unrealized appreciation (depreciation) and, if any, shown as receivables (or payables) for variation margin on open futures contracts in the Statement of Assets and Liabilities. When the contract is closed, a realized gain or loss is recorded in the Statement of Operations equal to the difference between the notional amount of the contract at the time it was opened and the notional amount of the contract at the time it was closed. The use of futures contracts involves the risk of an imperfect correlation in the movements in the price of futures contracts and interest rates, foreign currency exchange rates or underlying assets.
During the period ended June 30, 2022, the Real Assets Portfolio traded in futures contracts.
(e) Swap Agreements—Swap agreements on equity securities involve commitments to pay interest in exchange for a market linked return based on a notional amount. The counterparty pays out the total return of the equity security or basket of equity securities and, in return, receives a regular stream of payments, based on an agreed-upon interest rate. To the extent the total return of the security or basket of securities underlying the transaction exceeds (or falls short of) the offsetting interest rate obligation, a Portfolio will receive a payment from (or make a payment to) the counterparty.
Semi-Annual Report 103
Commodity-linked swap agreements involve commitments to pay interest in exchange for a commodity-linked return based on a notional amount. To the extent the return of the reference commodity or commodity index or basket of reference commodities or commodity indexes underlying the transaction exceeds (or falls short of) the offsetting interest rate obligation, a Portfolio will receive a payment from (or make a payment to) the counterparty.
Swap agreements generally are valued by an independent pricing service, and the change in value, if any, is recorded as unrealized appreciation (depreciation) on swap agreements in a Portfolio’s accompanying Statement of Assets and Liabilities. Once the interim payments are settled in cash, the net amount is recorded as realized gain (loss) on swap agreements in a Portfolio’s accompanying Statement of Operations, in addition to any realized gain (loss) recorded upon the termination of swap agreements.
During the period ended June 30, 2022, the Enhanced Opportunities, Opportunistic Strategies and Real Assets Portfolios traded in swap agreements.
(f) Options Transactions—Put and call options purchased are accounted for in the same manner as portfolio securities. Certain options may be written with premiums to be determined on a future date. The premiums for these options are based upon implied volatility parameters at specified terms. When a Portfolio writes an option, the premium received by the Portfolio is recorded as a liability and is subsequently adjusted to the current market value of the option written. When a Portfolio writes a call option, such option is typically “covered,” meaning that it holds the underlying instrument subject to being called by the option counterparty. When the Portfolio writes a put option, cash is segregated in an amount sufficient to cover the obligation. These amounts, which are considered restricted, are included in cash collateral in the Statement of Assets and Liabilities. If a Portfolio writes an option, it bears the market risk of an unfavorable change in the price of the security underlying the written option.
104 Semi-Annual Report
The risk of loss is unlimited for uncovered written call options. For uncovered written put options, the risk of loss is limited to the difference between the strike price of the option and the premiums received upon writing the option.
During the period ended June 30, 2022, the Enhanced Opportunities Portfolio traded in options.
(g) Short Sales—A short sale is a transaction in which a Portfolio sells securities it does not own but has borrowed in anticipation of a decline in the market price of the securities. The initial amount of a short sale is recorded as a liability which is marked-to-market daily. Fluctuations in the value of the short liability are recorded as unrealized gains or losses. A Portfolio realizes a gain or loss upon closing of the short sale (returning the security to the counterparty by way of purchase or delivery of a long position owned). Short sales by a Portfolio involve certain risks and special considerations. Possible losses from short sales differ from losses that could be incurred from a purchase of a security because losses from short sales may be unlimited, whereas losses from purchases cannot exceed the total amount invested. The Portfolio may have to pay a fee to borrow the particular security and is liable to the buyer for any dividends or interest payable on securities while those securities are in a short position. These dividends and interest amounts are an expense of the Portfolio. The Portfolio designates collateral consisting of cash, US government securities or other liquid assets sufficient to collateralize the market value of short positions.
Proceeds from short sales are generally retained in cash accounts or invested in securities that are cash equivalents. With regard to securities borrowed as of June 30, 2022, pursuant to short sale arrangements, a Portfolio has a right to set off any assets held (including the borrowed securities) or obligations owed to the lender (State Street), in the event of the lender’s default, against any obligations owed by the lender to the Portfolio under any agreement or collateral document. At June 30, 2022, the
Semi-Annual Report 105
Enhanced Opportunities Portfolio had pledged $66,543,143 of securities held long as collateral under such arrangements.
For the period ended June 30, 2022, the following Portfolios received proceeds from securities sold short and purchases to cover short positions as follows:
| Portfolio | Proceeds from Securities Sold Short | Purchased to Cover Short Positions | ||||||
| Enhanced Opportunities | $ | 217,051,724 | $ | 94,369,973 | ||||
| Opportunistic Strategies | — | 1,542,866 | ||||||
(h) Federal Income Taxes—The Fund’s policy is for each Portfolio to qualify as a regulated investment company under Subchapter M of the Internal Revenue Code of 1986, as amended (the “Code”), and to distribute all of its taxable income, including any net realized capital gains, to shareholders. Therefore, no federal income tax provision is required.
At December 31, 2021, the Portfolios had no unused short-term realized capital loss carryovers which, for federal income tax purposes, could be used to offset future realized capital gains.
Under current tax law, post-October capital losses or certain late-year ordinary losses, as defined by the Code, within the taxable year may be deferred and treated as occurring on the first day of the following tax year. For the tax year ended December 31, 2021, the following Portfolios elected to defer such losses as follows:
| Portfolio | Post-October Capital Loss Deferral | Late-Year Ordinary Loss Deferral | ||||||
| Opportunistic Strategies | $ | 314,631 | $ | — | ||||
| Real Assets | 7,593 | — | ||||||
For federal income tax purposes, the aggregate cost, aggregate gross unrealized appreciation, aggregate gross unrealized depreciation and the net unrealized appreciation (depreciation) were as follows:
106 Semi-Annual Report
| Portfolio | Aggregate Cost | Aggregate Gross Unrealized Appreciation | Aggregate Gross Unrealized Depreciation | Net Unrealized Appreciation (Depreciation) | ||||||||||||
| Enhanced Opportunities | $ | 57,908,034 | $ | 5,893,968 | $ | 13,280,531 | $ | (7,386,563 | ) | |||||||
| Global Dynamic Multi-Asset | 16,380,425 | 1,317,080 | 1,775,681 | (458,601 | ) | |||||||||||
| Opportunistic Strategies | 61,676,857 | 4,597,959 | 3,358,942 | 1,239,017 | ||||||||||||
| Real Assets | 37,055,328 | 2,473,268 | 2,790,372 | (317,104 | ) | |||||||||||
Management has analyzed the Portfolios, tax positions, and has concluded that no liability for unrecognized tax benefits should be recorded related to uncertain tax positions taken on tax returns filed for any open tax years (or expected to be taken on future tax returns). Open tax years are those that remain subject to examination and are based on each tax jurisdiction’s statute of limitations. Each Portfolio files a US federal income tax return annually after its fiscal year-end, which is subject to examination by the Internal Revenue Service for a period of three years from the date of filing.
(i) Dividends and Distributions—For each Portfolio, income dividends are normally declared each business day and paid annually, except that the Real Assets Portfolio’s dividends from net investment income (if any), will be declared and paid quarterly. During any particular year, net realized gains from investment transactions in excess of available capital loss carryforwards would be taxable to the Portfolios, if not distributed. The Portfolios intend to declare and distribute these amounts, at least annually, to shareholders, but may be distributed more frequently. Differences in per share distributions, by class, are generally due to differences in class specific expenses.
Net income and realized gains from investments held by the Subsidiary are treated as ordinary income for tax purposes. If a net loss is realized by the Subsidiary in any taxable year, the loss will generally not be available to offset the Real Assets Portfolio’s ordinary income and/or capital gains for that year, or any future tax year.
Semi-Annual Report 107
The Lazard Global Dynamic Multi-Asset Portfolio used equalization during the year on its 2021 tax return, and has elected to treat as a distribution of investment company taxable income and net capital gain the portion of redemption proceeds paid to redeeming shareholders that represents the redeeming shareholders’ portion of the Portfolio’s undistributed investment company taxable income and net capital gain. This practice, which involves the use of equalization accounting, will have the effect of reducing the amount of income and gains that the Portfolio would otherwise be required to distribute as dividends to shareholders in order for the Portfolio to avoid federal income and excise taxes. This practice reduces the amount of distributions required to be made to non-redeeming shareholders and defers the recognition of taxable income by such shareholders. However, since the amount of any undistributed income will be reflected in the value of the Portfolio’s shares, the total return on a shareholder’s investment is not affected by the Portfolio’s use of equalization.
Income and capital gains distributions are determined in accordance with federal income tax regulations which may differ from GAAP. These book/tax differences, which may result in distribution reclassifications, are primarily due to differing treatments of foreign currency transactions, wash sales, distributions redesignations, Treasury Inflation-Protected Securities, currency straddles, passive foreign investment company gains and losses, deemed dividends on convertible debt, equalization accounting (as described above), straddles, certain fixed-income securities, expenses, derivatives, return of capital distributions and distributions from real estate investment trusts (“REITs”).
The book/tax differences relating to shareholder distributions may result in reclassifications among certain capital accounts.
(j) Allocation of Expenses—Expenses common to the Fund, Lazard Retirement Series, Inc. and Lazard Global Total Return and Income Fund, Inc. (each a “Lazard Fund” and collectively, the “Lazard Fund Complex”), each a registered management investment company advised by the Investment Manager, not directly chargeable to one or more specific Lazard Funds are allocated to
108 Semi-Annual Report
the Fund and among its Portfolios primarily on the basis of relative net assets. Expenses of the Fund not directly chargeable to one or more Portfolios are similarly allocated among the Portfolios primarily on the basis of relative net assets. The Portfolios accrue distribution and service (12b-1) fees to Open Shares. Each Portfolio’s income, expenses (other than class specific expenses) and realized and unrealized gains and losses are allocated proportionally each day between its classes based upon the relative net assets of each class.
(k) Estimates—The preparation of financial statements in conformity with GAAP requires management to make estimates and assumptions that affect the reported amounts of assets and liabilities and disclosure of contingent assets and liabilities at the date of the financial statements and the reported amounts of increases and decreases in net assets resulting from operations during the reporting period. Actual results could differ from those estimates.
(l) Net Asset Value—The NAV per share for each class of each Portfolio is determined each day the NYSE is open for trading as of the close of regular trading on the NYSE (generally 4:00 p.m. Eastern time). The Fund will not treat an intraday unscheduled disruption in NYSE trading as a closure of the NYSE, and will price its shares as of 4:00 p.m., if the particular disruption directly affects only the NYSE. The Fund values securities and other assets for which market quotations are readily available at market value. Securities and other assets for which current market quotations are not readily available are valued at fair value as determined in good faith in accordance with procedures approved by the Board.
3. Investment Management, Administration, Custody, Distribution and Transfer Agency Agreements
The Fund, on behalf of the Portfolios, has entered into a management agreement (the “Management Agreement”) with the Investment Manager. Pursuant to the Management Agreement, the Investment Manager manages the investment
Semi-Annual Report 109
operations of each Portfolio and the assets of each Portfolio including the purchase, retention and disposition thereof, in accordance with the Portfolio’s investment objectives, policies, and restrictions, and provides the Portfolios with administrative, operational and compliance assistance services. For its services provided to the Portfolios, the Investment Manager earns a management fee, accrued daily as a percentage of each Portfolio’s average daily net assets and payable by each Portfolio monthly, at the annual rate set forth below:
| Portfolio | Annual Rate | |||
| Enhanced Opportunities | 0.95 | % | ||
| Global Dynamic Multi-Asset | 0.80 | |||
| Opportunistic Strategies | 1.00 | |||
| Real Assets | 0.65 | |||
The Investment Manager provides investment management and other services to the Subsidiary. The Investment Manager does not receive separate compensation from the Subsidiary for providing such services. However, the Real Assets Portfolio pays the Investment Manager based on its net assets, which include the assets of the Subsidiary.
The Investment Manager has voluntarily agreed to waive its fees and, if necessary, reimburse each Portfolio until April 29, 2023 if the aggregate direct expenses of a Portfolio, exclusive of taxes, brokerage, interest on borrowings, dividend and interest expenses on securities sold short, fees and expenses of “Acquired Funds” (as defined in Form N-1A), fees and expenses related to filing foreign tax reclaims and extraordinary expenses, exceed an applicable percentage of the value of the Portfolio’s average daily net assets set forth opposite the Portfolio’s name in the table below. The Fund, on behalf of the Portfolio, may deduct from the payment to be made to the Investment Manager under the Management Agreement, or the Investment Manager will bear, such excess expenses.
110 Semi-Annual Report
| Portfolio | Institutional Shares | Open Shares | ||||||
| Enhanced Opportunities | 1.25 | % | 1.50 | % | ||||
| Global Dynamic Multi-Asset | 0.90 | 1.15 | ||||||
| Opportunistic Strategies | 1.02 | 1.27 | ||||||
| Real Assets | 0.80 | 1.05 | ||||||
During the period ended June 30, 2022, the Investment Manager waived its management fees and reimbursed the following Portfolios for other expenses as follows:
| Institutional Shares | Open Shares | |||||||||||||||
| Portfolio | Management Fees Waived | Expenses Reimbursed | Management Fees Waived | Expenses Reimbursed | ||||||||||||
| Enhanced Opportunities | $ | — | $ | — | $ | 1,817 | $ | 362 | ||||||||
| Global Dynamic Multi-Asset | 66,788 | 44,292 | 776 | 2,707 | ||||||||||||
| Opportunistic Strategies | 87,054 | — | 728 | 1,697 | ||||||||||||
| Real Assets | 82,421 | — | 1,970 | 1,537 | ||||||||||||
The aforementioned waivers and/or reimbursements are not subject to recoupment by the Investment Manager.
State Street serves as the Fund’s custodian and provides the Fund with certain administrative services.
The Fund has a distribution agreement with Lazard Asset Management Securities LLC (the “Distributor”), a wholly-owned subsidiary of the Investment Manager, to serve as the distributor for shares of each Portfolio. The Distributor bears, amongst other expenses, the cost of preparing and distributing materials used by the Distributor in connection with its offering Portfolio shares and other advertising and promotional expenses.
Under a distribution and servicing plan adopted pursuant to Rule 12b-1 under the 1940 Act, each Portfolio pays a monthly fee to the Distributor, at an annual rate of 0.25% of the average daily net assets of its Open Shares, for certain distribution activities and providing services to holders of the Portfolio’s Open Shares. The Distributor may make payments to third parties such as financial institutions, securities dealers and other industry professionals in respect of these services.
Semi-Annual Report 111
DST is the Fund’s transfer agent and dividend disbursing agent.
4. Directors’ Compensation
Certain Directors of the Fund are officers of the Investment Manager. Effective January 2022, the annual compensation for each Director who is not an affiliated person of the Investment Manager or any of its affiliates, that is payable by all of the funds in the Lazard Fund Complex, is comprised of: (1) an annual fee of $245,000, (2) an additional annual fee of $35,000 to the lead Independent Director, and (3) an additional annual fee of $25,000 to the Audit Committee Chair. The Independent Directors (an “Independent Director” is a Director who is not an “interested person” (as defined in the 1940 Act) of the Fund) also may be paid additional fees for participation on ad hoc committees or other work performed on behalf of the Board. The Independent Directors are reimbursed for travel and other out-of-pocket expenses for attending Board and committee meetings or incurred in connection with work performed on behalf of the Board. The Directors do not receive benefits from the Fund pursuant to any pension, retirement or similar arrangement. Independent Directors’ fees and expenses are allocated among the active portfolios in the Lazard Fund Complex at a rate of $5,000 per active portfolio with the remainder allocated among the active portfolios on the basis of relative net assets. The Statements of Operations shows the Independent Directors’ compensation and expenses paid by each Portfolio.
5. Securities Transactions and Transactions with Affiliates
Purchases and sales of portfolio securities (excluding short-term investments and short sales) for the period ended June 30, 2022 were as follows:
| Portfolio | Purchases | Sales | ||||||
| Enhanced Opportunities | $ | 185,984,162 | $ | 256,303,544 | ||||
| Global Dynamic Multi-Asset | 11,062,896 | 10,464,510 | ||||||
| Opportunistic Strategies | 38,509,957 | 50,004,503 | ||||||
| Real Assets | 18,746,231 | 14,927,838 | ||||||
| US Treasury Securities | ||||||||
| Portfolio | Purchases | Sales | ||||||
| Global Dynamic Multi-Asset | $304,471 | $32,412 | ||||||
112 Semi-Annual Report
At June 30, 2022, the Investment Manager owned 30.25% of the outstanding shares of the Global Dynamic Multi-Asset Portfolio.
For the period ended June 30, 2022, the Portfolios did not engage in any cross-trades in accordance with Rule 17a-7 under the 1940 Act, and no brokerage commissions were paid to affiliates of the Investment Manager or other affiliates of the Fund for portfolio transactions executed on behalf of the Fund.
6. Line of Credit
The Fund has a $100 million committed line of credit pursuant to an Amended and Restated Loan Agreement (the “Agreement”) with State Street, primarily for temporary or emergency purposes, including the meeting of redemption requests that otherwise might require the untimely disposition of securities. Interest on borrowings is payable at 1.00% plus the “Applicable Rate,” which is the higher of (a) the Federal Funds Rate plus 10 basis points and (b) the Overnight Bank Funding Rate (OBFR) plus 10 basis points, on an annualized basis. Under the Agreement, the Fund has agreed to pay a 0.20% per annum fee on the unused portion of the commitment, payable quarterly in arrears. The Fund has also agreed to pay an upfront fee of 0.05% of the committed line amount. During the period ended June 30, 2022, the following Portfolios had borrowings under the Agreement as follows:
| Portfolio | Average Daily Loan Balance* | Maximum Daily Loan Outstanding | Weighted Average Interest Rate | Number of Days Borrowings were Outstanding | ||||||||||||
| Real Assets | $ | 461,000 | $ | 461,000 | 1.43 | % | 1 | |||||||||
| * | For days borrowings were outstanding. |
Management believes that the fair value of the liabilities under the Agreement is equivalent to the recorded amount based on its short-term maturity and interest rate, which fluctuates with the Applicable rate. A Portfolio’s outstanding balance under the Agreement, if any, would be categorized as Level 2.
Semi-Annual Report 113
7. Investment Risks
Not all risks described below apply to all Portfolios, or may not apply to the same degree for one or more Portfolios compared to one or more other Portfolios. In addition, not all risks applicable to an investment in a Portfolio are described below. Please see the current summary prospectus for the relevant Portfolio(s) or a current Portfolio prospectus for further information regarding a Portfolio’s investment strategy and related risks.
(a) Market Risk—A Portfolio may incur losses due to declines in one or more markets in which it invests. These declines may be the result of, among other things, political, regulatory, market, economic or social developments affecting the relevant market(s). To the extent that such developments impact specific industries, market sectors, countries or geographic regions, a Portfolio’s investments in such industries, market sectors, countries and/or geographic regions can be expected to be particularly affected, especially if such investments are a significant portion of its investment portfolio. In addition, turbulence in financial markets and reduced liquidity in equity, credit and/or fixed income markets may negatively affect many issuers, which could adversely affect a Portfolio. Global economies and financial markets are increasingly interconnected, and conditions and events in one country, region or financial market may adversely impact issuers worldwide. As a result, local, regional or global events such as war, acts of terrorism, the spread of infectious illness or other public health issues, recessions or other events could have a significant negative impact on global economic and market conditions. The coronavirus disease 2019 (COVID-19) global pandemic and the aggressive responses taken by many governments or voluntarily imposed by private parties, including closing borders, restricting travel and imposing prolonged quarantines or similar restrictions, as well as the closure of, or operational changes to, many retail and other businesses, has had negative impacts, and in many cases severe negative impacts, on markets worldwide. It is not known how long the effects of such impacts, or any future impacts of other significant events described above, will or would last, but there could be a
114 Semi-Annual Report
prolonged period of global economic slowdown, which may be expected to impact a Portfolio and its investments.
(b) Convertible Securities Risk—The market value of convertible securities may perform like that of non-convertible fixed income securities; that is, their prices move inversely with changes in interest rates (i.e., as interest rates go up, prices go down). In addition, convertible securities are subject to the risk that the issuer will not make interest or principal payments, or will not make payments on a timely basis. Since it derives a portion of its value from the common stock into which it may be converted, a convertible security also is subject to the same types of market and issuer risks that apply to the underlying common stock.
(c) Fixed-Income and Debt Securities Risk—The market value of a debt security may decline due to general market conditions that are not specifically related to a particular company, such as real or perceived adverse economic conditions, changes in the outlook for corporate earnings, changes in interest or currency rates or adverse investor sentiment generally. The debt securities market can be susceptible to increases in volatility and decreases in liquidity. Liquidity can decline unpredictably in response to overall economic conditions or credit tightening.
Prices of bonds and other debt securities tend to move inversely with changes in interest rates. Interest rate risk is usually greater for fixed-income securities with longer maturities or durations. A rise in interest rates (or the expectation of a rise in interest rates) may result in periods of volatility, decreased liquidity and increased redemptions, and, as a result, a Portfolio may have to liquidate portfolio securities at disadvantageous prices.
A Portfolio’s investments in lower-rated, higher-yielding securities (“junk bonds”) are subject to greater credit risk than its higher rated investments. Credit risk is the risk that the issuer will not make interest or principal payments, or will not make payments on a timely basis. Non-investment grade securities tend to be more volatile, less liquid and are considered speculative. If there is a decline, or perceived decline, in the credit quality of a debt
Semi-Annual Report 115
security (or any guarantor of payment on such security), the security’s value could fall, potentially lowering a Portfolio’s share price. The prices of non-investment grade securities, unlike investment grade debt securities, may fluctuate unpredictably and not necessarily inversely with changes in interest rates. The market for these securities may be less liquid and therefore these securities may be harder to value or sell at an acceptable price, especially during times of market volatility or decline.
Some debt securities may give the issuer the option to call, or redeem, the securities before their maturity, and, during a time of declining interest rates, a Portfolio may have to reinvest the proceeds of called or redeemed securities in an investment offering a lower yield (and the Portfolio may not fully benefit from any increase in the value of its portfolio holdings as a result of declining interest rates).
Structured notes are privately negotiated debt instruments where the principal and/or interest is determined by reference to a specified asset, market or rate, or the differential performance of two assets or markets. Structured notes can have risks of both debt securities and derivatives transactions.
Adjustable rate securities provide a Portfolio with a certain degree of protection against rises in interest rates, although adjustable rate securities will participate in any declines in interest rates. Certain adjustable rate securities, such as those with interest rates that fluctuate directly or indirectly based on multiples of a stated index, are designed to be highly sensitive to changes in interest rates and can subject the holders thereof to extreme reductions of yield and possibly loss of principal. Certain fixed-income securities may be issued at a discount from their face value (such as zero coupon securities) or purchased at a price less than their stated face amount or at a price less than their issue price plus the portion of “original issue discount” previously accrued thereon, i.e., purchased at a “market discount.” The amount of original issue discount and/or market discount on certain obligations may be significant, and accretion of market discount
116 Semi-Annual Report
together with original issue discount will cause a Portfolio to realize income prior to the receipt of cash payments with respect to these securities.
(d) Preferred Securities Risk—There are various risks associated with investing in preferred securities. In addition, unlike common stock, participation in the growth of an issuer may be limited.
| ● | Credit risk is the risk that a security held by a Portfolio will decline in price or the issuer of the security will fail to make dividend, interest or principal payments when due because the issuer experiences a decline in its financial status. |
| ● | Interest rate risk is the risk that securities will decline in value because of changes in market interest rates. When market interest rates rise, the market value of such securities generally will fall. |
| ● | Preferred securities may include provisions that permit the issuer, at its discretion, to defer or omit distributions for a stated period without any adverse consequences to the issuer. |
| ● | Preferred securities are generally subordinated to bonds and other debt instruments in an issuer’s capital structure in terms of having priority to corporate income, claims to corporate assets and liquidation payments, and therefore will be subject to greater credit risk than more senior debt instruments. |
| ● | During periods of declining interest rates, an issuer may be able to exercise an option to call, or redeem its issue at par earlier than the scheduled maturity. If this occurs during a time of lower or declining interest rates, a Portfolio may have to reinvest the proceeds in lower yielding securities (and the Portfolio may not benefit from any increase in the value of its portfolio holdings as a result of declining interest rates). |
| ● | Certain preferred securities may be substantially less liquid than many other securities, such as common stocks or US government securities. Illiquid securities involve the risk that the securities will not be able to be sold at the time desired by a |
Semi-Annual Report 117
| Portfolio or at prices approximating the value at which the Portfolio is carrying the securities on its books. |
(e) Non-US Securities Risk—A Portfolio’s performance will be influenced by political, social and economic factors affecting the non-US countries and companies in which the Portfolio invests. Non-US securities carry special risks, such as less developed or less efficient trading markets, political instability, a lack of company information, differing auditing and legal standards, and, potentially, less liquidity.
(f) Emerging Market Risk—Emerging market countries generally have economic structures that are less diverse and mature, and political systems that are less stable, than those of developed countries. The economies of countries with emerging markets may be based predominantly on only a few industries, may be highly vulnerable to changes in local or global trade conditions, and may suffer from extreme debt burdens or volatile inflation rates. The securities markets of emerging market countries have historically been extremely volatile. These market conditions may continue or worsen. Significant devaluation of emerging market currencies against the US dollar may occur subsequent to acquisition of investments denominated in emerging market currencies.
(g) Foreign Currency Risk—Investments denominated in currencies other than US dollars may experience a decline in value, in US dollar terms, due solely to fluctuations in currency exchange rates. A Portfolio’s investments could be adversely affected by delays in, or a refusal to grant, repatriation of funds or conversion of emerging market currencies.
(h) Short Position Risk—Short positions may involve substantial risks. If a short position appreciates in value during the period of a Portfolio’s investment, there will be a loss to the Portfolio that could be substantial. Short positions involve more risk than long positions because the maximum sustainable loss on a security purchased is limited to the amount paid for the security plus the transaction costs. However, a Portfolio’s potential loss on a short
118 Semi-Annual Report
position is unlimited because, theoretically, there is no limit to the potential price increase of a security. In addition, a Portfolio’s short sales transactions are dependent on counterparties to its securities borrowing transactions and are subject to the risk of default by a counterparty, which could result in a loss of Portfolio assets used as collateral or the loss of monies owed to the Portfolio by a counterparty.
(i) Derivatives and Hedging Risk—Derivatives transactions, including those entered into for hedging purposes (i.e., seeking to protect Portfolio investments), may increase volatility, reduce returns, limit gains or magnify losses, perhaps substantially, particularly since most derivatives have a leverage component that provides investment exposure in excess of the amount invested. Swap agreements; forward currency contracts; over-the-counter options on securities, indexes, currencies and structured notes; and other over-the-counter derivatives transactions are subject to the risks of the creditworthiness of, and default by, the counterparty and consequently may lose all or a portion of their value due solely to the creditworthiness of, or default by, the counterparty. Over-the-counter derivatives frequently may be illiquid and difficult to value. Changes in liquidity may result in significant, rapid and unpredictable changes in the prices for derivatives. These derivatives transactions, as well as the exchange-traded futures and options in which a Portfolio may invest, are subject to many of the risks of, and can be highly sensitive to changes in the value of the related reference asset, index or rate. As such, a small investment could have a potentially large impact on a Portfolio’s performance. In fact, many derivatives may be subject to greater risks than those associated with investing directly in the underlying or other reference asset. Derivatives transactions incur costs, either explicitly or implicitly, which reduce returns, and costs of engaging in such transactions may outweigh any gains or any losses averted from hedging activities. Successful use of derivatives, whether for hedging or for other investment purposes, is subject to the Investment Manager’s ability to predict correctly movements in the direction of the relevant reference
Semi-Annual Report 119
asset or market and, for hedging activities, correlation of the derivative instruments used with the investments seeking to be hedged. Use of derivatives transactions, even if entered into for hedging purposes, may cause a Portfolio to experience losses greater than if the Portfolio had not engaged in such transactions. When the Portfolio enters into derivatives transactions, it may be required to segregate liquid assets or enter into offsetting positions or otherwise cover its obligations, in accordance with applicable regulations while the positions are open. The same risks, as applicable, apply to derivative transactions by the Subsidiary. New Securities and Exchange Commission (the “SEC”) Rule 18f-4 under the 1940 Act, with which investment companies must comply beginning in August 2022, relates to the use of derivatives and certain other transactions by registered investment companies, and will rescind and withdraw applicable guidance and relief regarding these asset segregation and coverage practices. Rule 18f-4 will regulate and, in some cases limit, the use of derivatives for certain funds and may require a Portfolio to alter, perhaps materially, its use of derivatives.
(j) Natural Resources Risk—Investments related to natural resources may be affected by numerous factors, including events occurring in nature, inflationary pressures and domestic and international politics. For example, events occurring in nature (such as earthquakes or fires in prime natural resource areas) and political events (such as coups or military confrontations) can affect the overall supply of a natural resource and the value of companies involved in such natural resource. Political risks and other risks to which non-US companies are subject also may affect US companies if they have significant operations or investments in non-US countries. In addition, interest rates, prices of raw materials and other commodities, international economic developments, energy conservation, tax and other government regulations (both US and non-US) may affect the supply of and demand for natural resources, which can affect the profitability and value of securities issued by companies in the natural resources category. Securities of companies within specific natural resources sub-categories can perform differently than the overall market. This may be due to changes in such things as the
120 Semi-Annual Report
regulatory or competitive environment or to changes in investor perceptions.
(k) Real Estate Investments Risk—A Portfolio’s investments in Real Estate Investments (as defined in the prospectus) could lose money due to the performance of real estate-related securities even if securities markets generally are experiencing positive results. The performance of Real Estate Investments may be determined to a great extent by the current status of the real estate industry in general, or by other factors that may affect the real estate industry, even if other industries would not be so affected. Consequently, Real Estate Investments could lead to investment results that may be significantly different from investments in other real assets categories or investments in the broader securities markets. The risks related to investments in Real Estate Investments include, but are not limited to: adverse changes in general economic and local market conditions; adverse developments in employment; changes in supply or demand for similar or competing properties; unfavorable changes in applicable taxes, governmental regulations and interest rates; operating or development expenses; and lack of available financing.
Due to certain special considerations that apply to REITs, investments in REITs may carry additional risks not necessarily present in investments in other securities. REIT securities (including those trading on national exchanges) typically have trading volumes that are less than those of securities of other types of companies which may affect a Portfolio’s ability to trade or liquidate those securities. An investment in a REIT may be adversely affected if the REIT fails to comply with applicable laws and regulations, including failing to qualify as a REIT under the Code. Failure to qualify with any of these requirements could jeopardize a company’s status as a REIT. A Portfolio generally will have no control over the operations and policies of a REIT, including qualification as a REIT.
(l) Infrastructure Companies Risk—Securities and instruments of infrastructure companies, which consist of utilities, pipelines, toll
Semi-Annual Report 121
roads, airports, railroads, ports, telecommunications and other infrastructure companies, are more susceptible to adverse economic or regulatory occurrences affecting their industries. Infrastructure companies may be subject to a variety of factors that may adversely affect their business or operations, including high interest costs in connection with capital construction programs, high leverage, costs associated with environmental and other regulations, the effects of economic slowdown, surplus capacity, increased competition from other providers of services, uncertainties concerning the availability of fuel at reasonable prices, the effects of energy conservation policies and other factors. Infrastructure companies also may be affected by or subject to, among other factors, regulation by various government authorities, including rate regulation and service interruption due to environmental, operational or other mishaps.
(m) Commodities-Related Investments Risk—Exposure to the commodities markets may subject a Portfolio to greater volatility than other types of investments. The values of commodities and commodity-linked derivative instruments are affected by events that may have less impact on the values of equity and fixed income securities. Investments linked to the prices of commodities are considered speculative. Because the value of a commodity-linked derivative instrument, such as a futures contract on a physical commodity, typically is based upon the price movements of the underlying reference asset, index or rate, the value of these instruments will rise or fall in response to changes in the underlying reference asset, index or rate. Prices of commodities and commodity-linked investments may fluctuate significantly over short periods for a variety of factors, including: changes in supply and demand relationships; weather; agricultural or livestock markets; agricultural or livestock disease or pestilence; trade relationships; fiscal, monetary and exchange control programs; and embargoes, tariffs, terrorism and international economic, political, military and regulatory developments.
(n) Subsidiary and Tax Status Risk—The Real Assets Portfolio invests in the Subsidiary, which is not registered as an investment company under the 1940 Act. A regulatory change in the US or the Cayman Islands, under which the Portfolio and the Subsidiary,
122 Semi-Annual Report
respectively, are organized, that impacts the Subsidiary or how the Portfolio invests in the Subsidiary, such as a change in tax law, could adversely affect the Portfolio. By investing in the Subsidiary, the Portfolio is exposed to the risks associated with the Subsidiary’s investments, which generally include the risks of investing in commodity-related derivative instruments.
Income and gains from commodities or certain commodity-linked derivative instruments do not constitute “qualifying income” to the Real Assets Portfolio for purposes of qualification as a “regulated investment company” for federal income tax purposes. Without such qualification, the Portfolio could be subject to tax. The tax treatment of the Portfolio’s investments in the Subsidiary and commodity-linked derivative instruments could affect whether income derived from such investment is “qualifying income” under the Code, or otherwise affect the character, timing and/or amount of the Portfolio’s taxable income or any gains and distributions made by the Portfolio.
(o) Closed-End Funds and ETFs Risk—Shares of closed-end funds and ETFs in which a Portfolio may invest may trade at prices that vary from their net asset values, sometimes significantly. The shares of closed-end funds and ETFs may trade at prices at, below or above their net asset value. Shares of closed-end funds, in particular, frequently trade at persistent discounts to their net asset value. In addition, the performance of an ETF pursuing a passive index-based strategy may diverge from the performance of the index. A Portfolio’s investments in closed-end funds and ETFs are subject to the risks of the closed-end funds’ and ETFs’ investments, as well as to the general risks of investing in closed-end funds and ETFs, respectively. A Portfolio investing in closed-end funds or ETFs will bear not only the Portfolio’s management fees and operating expenses, but also the Portfolio’s proportional share of the management fees and operating expenses of the closed-end funds and/or ETFs in which the Portfolio invests. Although Section 12 of the 1940 Act limits the amount of a Portfolio’s assets that may be invested in one or more closed-end funds and/or ETFs (subject to certain exceptions), Rule 12d1-4 under the 1940 Act allows a Portfolio to acquire the securities of
Semi-Annual Report 123
another investment company, including ETFs, in excess of the limitations imposed by Section 12, subject to certain limitations and conditions.
(p) Government Securities Risk—Not all obligations of the US government, its agencies and instrumentalities are backed by the full faith and credit of the US Treasury. Some obligations are backed only by the credit of the issuing agency or instrumentality, and in some cases there may be some risk of default by the issuer. Any guarantee by the US government or its agencies or instrumentalities of a security held by a Portfolio does not apply to the market value of such security or to shares of the Portfolio itself. A security backed by the US Treasury or the full faith and credit of the United States is guaranteed only as to the timely payment of interest and principal when held to maturity.
(q) Cybersecurity Risk—The Portfolios and their service providers are susceptible to operational and information security and related risks of cybersecurity incidents. Cybersecurity attacks include, but are not limited to, gaining unauthorized access to digital systems (e.g., through “hacking” or malicious software coding) for purposes of misappropriating assets or sensitive information, corrupting data or causing operational disruption. Cybersecurity incidents affecting the Investment Manager, transfer agent or custodian or other service providers such as financial intermediaries have the ability to cause disruptions and impact business operations, potentially resulting in financial losses, including by impediments to a Portfolio’s investment trading; the inability of Portfolio shareholders to purchase and redeem Portfolio shares; interference with a Portfolio’s ability to calculate its NAV; violations of applicable privacy, data security or other laws; regulatory fines and penalties; reputational damage; reimbursement or other compensation or remediation costs; legal fees; or additional compliance costs. Similar adverse consequences could result from cybersecurity incidents affecting issuers of securities in which a Portfolio invests; counterparties with which a Portfolio engages in transactions; governmental and other regulatory authorities, exchange and other financial market operators; and banks, brokers, dealers, insurance companies and
124 Semi-Annual Report
other financial institutions and other parties. There are inherent limitations in any cybersecurity risk management systems or business continuity plans, including the possibility that certain risks have not been identified.
(r) Non-Diversification Risk—For a Portfolio that is classified as “non-diversified” under the 1940 Act, the Portfolio’s net asset value may be more vulnerable to changes in the market value of a single issuer or group of issuers and may be relatively more susceptible to adverse effects from any single corporate, industry, economic, market, political or regulatory occurrence than if the Portfolio’s investments consisted of securities issued by a larger number of issuers.
(s) Geopolitical Risk—As a result of the ongoing armed conflict between Russia and Ukraine, the United States, the United Kingdom, the European Union, and several other nations have announced a broad array of new or expanded sanctions, export controls, and other measures against Russia, as well as upon certain banks, companies, government officials, and other individuals in or affiliated with Russia and Belarus. The ongoing conflict and the evolving response measures may continue to have a negative impact on the economy and business activity globally (including in the countries in which the Portfolios invest), and therefore, could adversely affect the performance of the Portfolios’ investments. The severity and duration of the conflict is unknown and could continue to impact global economic and market conditions adversely. Management will continue to seek to assess the potential impacts on valuation and liquidity and will take any actions needed in accordance with procedures already approved by the Board of Directors.
8. Contractual Obligations
The Fund enters into contracts in the normal course of business that contain a variety of indemnification provisions. A Portfolio’s maximum exposure under these arrangements is unknown. Management has reviewed the Fund’s existing contracts and expects the risk of loss to be remote.
Semi-Annual Report 125
9. Fair Value Measurements
Fair value is defined as the price that a Portfolio would receive to sell an asset, or would pay to transfer a liability, in an orderly transaction between market participants at the date of measurement. The Fair Value Measurements and Disclosures provisions of GAAP also establish a framework for measuring fair value, and a three-level hierarchy for fair value measurement that is based upon the transparency of inputs to the valuation of an asset or liability. Inputs may be observable or unobservable and refer, broadly, to the assumptions that market participants would use in pricing the asset or liability. Observable inputs reflect the assumptions that market participants would use in pricing the asset or liability based on market data obtained from sources independent of the Fund. Unobservable inputs reflect the Fund’s own assumptions about the assumptions that market participants would use in pricing the asset or liability, developed based on the best information available in the circumstances. The fair value measurement level within the fair value hierarchy for the assets and liabilities of a Portfolio is based on the lowest level of any input that is significant to the overall fair value measurement. The three-level hierarchy of inputs is summarized below:
| ● | Level 1 – unadjusted quoted prices in active markets for identical assets and liabilities |
| ● | Level 2 – other significant observable inputs (including unadjusted quoted prices for similar assets and liabilities, interest rates, prepayment speeds, credit risk, etc.) |
| ● | Level 3 – significant unobservable inputs (including the Fund’s own assumptions in determining the fair value of assets and liabilities) |
Changes in valuation methodology or inputs may result in transfers into or out of the current assigned level within the hierarchy.
The inputs or methodology used for valuing securities are not necessarily an indication of the risks associated with investing in these securities.
126 Semi-Annual Report
The following table summarizes the valuation of the Portfolios’ assets and liabilities by each fair value hierarchy level as of June 30, 2022:
| Description | Unadjusted Quoted Prices in Active Markets for Identical Assets and Liabilities (Level 1) | Significant Other Observable Inputs (Level 2) | Significant Unobservable Inputs (Level 3) | Balance as of June 30, 2022 | ||||||||||||
| Enhanced Opportunities Portfolio | ||||||||||||||||
| Assets: | ||||||||||||||||
| Common Stocks* | ||||||||||||||||
| Austria | $ | — | $ | 51,928 | $ | — | $ | 51,928 | ||||||||
| Canada | 23,188 | — | — | 23,188 | ||||||||||||
| United States | 516,049 | — | 27,658 | 543,707 | ||||||||||||
| Convertible Corporate Bonds | — | 67,626,007 | — | 67,626,007 | ||||||||||||
| Short-Term Investments | 11,987,212 | — | — | 11,987,212 | ||||||||||||
| Purchased Options | 84,990 | — | — | 84,990 | ||||||||||||
| Other Financial Instruments† | ||||||||||||||||
| Forward Currency Contracts | — | 14,621 | — | 14,621 | ||||||||||||
| Total Return Swap Agreements | — | 783,741 | — | 783,741 | ||||||||||||
| Total | $ | 12,611,439 | $ | 68,476,297 | $ | 27,658 | $ | 81,115,394 | ||||||||
| Liabilities: | ||||||||||||||||
| Securities Sold Short | ||||||||||||||||
| Common Stocks* | ||||||||||||||||
| Australia | $ | — | $ | (2,683 | ) | $ | — | $ | (2,683 | ) | ||||||
| Austria | — | (72,867 | ) | — | (72,867 | ) | ||||||||||
| Brazil | (5,449 | ) | — | — | (5,449 | ) | ||||||||||
| Canada | (269,229 | ) | — | — | (269,229 | ) | ||||||||||
| China | (642,676 | ) | — | — | (642,676 | ) | ||||||||||
| Hong Kong | — | (199,316 | ) | — | (199,316 | ) | ||||||||||
| Netherlands | — | (15,024 | ) | — | (15,024 | ) | ||||||||||
| Panama | (450,054 | ) | — | — | (450,054 | ) | ||||||||||
| Singapore | (19,724 | ) | — | — | (19,724 | ) | ||||||||||
| South Korea | — | (33,887 | ) | — | (33,887 | ) | ||||||||||
| United Kingdom | — | (3,134 | ) | — | (3,134 | ) | ||||||||||
| United States | (19,836,025 | ) | — | — | (19,836,025 | ) | ||||||||||
| Exchange-Traded Funds United States | (4,199,082 | ) | — | — | (4,199,082 | ) | ||||||||||
| US Treasury Securities | — | (4,764,233 | ) | — | (4,764,233 | ) | ||||||||||
| Other Financial Instruments† | ||||||||||||||||
| Forward Currency Contracts | $ | — | $ | (661 | ) | $ | — | $ | (661 | ) | ||||||
| Total Return Swap Agreements | — | (824 | ) | — | (824 | ) | ||||||||||
| Written Options | (79,055 | ) | — | — | (79,055 | ) | ||||||||||
| Total | $ | (25,501,294 | ) | $ | (5,092,629 | ) | $ | — | $ | (30,593,923 | ) | |||||
Semi-Annual Report 127
| Description | Unadjusted Quoted Prices in Active Markets for Identical Assets and Liabilities (Level 1) | Significant Other Observable Inputs (Level 2) | Significant Unobservable Inputs (Level 3) | Balance as of June 30, 2022 | ||||||||||||
| Global Dynamic Multi-Asset Portfolio | ||||||||||||||||
| Assets: | ||||||||||||||||
| Common Stocks* | ||||||||||||||||
| Australia | $ | — | $ | 126,231 | $ | — | $ | 126,231 | ||||||||
| Austria | — | 4,242 | — | 4,242 | ||||||||||||
| Belgium | — | 3,650 | — | 3,650 | ||||||||||||
| Canada | 255,750 | — | — | 255,750 | ||||||||||||
| China | 21,464 | 9,286 | — | 30,750 | ||||||||||||
| Denmark | 20,771 | 70,773 | — | 91,544 | ||||||||||||
| France | 84,204 | 48,655 | — | 132,859 | ||||||||||||
| Germany | 17,446 | 53,501 | — | 70,947 | ||||||||||||
| Hong Kong | 20,376 | 21,034 | — | 41,410 | ||||||||||||
| Israel | 13,088 | 8,568 | — | 21,656 | ||||||||||||
| Italy | — | 4,296 | — | 4,296 | ||||||||||||
| Japan | 57,352 | 426,887 | — | 484,239 | ||||||||||||
| Malta | — | 3,760 | — | 3,760 | ||||||||||||
| Netherlands | 43,117 | 107,701 | — | 150,818 | ||||||||||||
| New Zealand | — | 9,862 | — | 9,862 | ||||||||||||
| Norway | — | 13,053 | — | 13,053 | ||||||||||||
| Portugal | — | 4,064 | — | 4,064 | ||||||||||||
| Puerto Rico | 4,699 | — | — | 4,699 | ||||||||||||
| Singapore | — | 12,902 | — | 12,902 | ||||||||||||
| Spain | 12,170 | 35,241 | — | 47,411 | ||||||||||||
| Sweden | 64,158 | 10,934 | 13,544 | 88,636 | ||||||||||||
| Switzerland | 43,553 | 98,833 | — | 142,386 | ||||||||||||
| United Kingdom | 120,719 | 132,498 | — | 253,217 | ||||||||||||
| United States | 4,224,576 | 77,731 | — | 4,302,307 | ||||||||||||
| Corporate Bonds* | — | 3,523,764 | — | 3,523,764 | ||||||||||||
| Exchange-Traded Funds | 171,115 | — | — | 171,115 | ||||||||||||
| Foreign Government Obligations* | — | 3,689,353 | — | 3,689,353 | ||||||||||||
| Quasi Government Bonds* | — | 150,104 | — | 150,104 | ||||||||||||
| Supranational Bonds | — | 976,579 | — | 976,579 | ||||||||||||
| US Municipal Bonds | — | 181,463 | — | 181,463 | ||||||||||||
| US Treasury Securities | — | 285,249 | — | 285,249 | ||||||||||||
| Short-Term Investments | 738,918 | — | — | 738,918 | ||||||||||||
| Other Financial Instruments† | ||||||||||||||||
| Forward Currency Contracts | — | 164,168 | — | 164,168 | ||||||||||||
| Total | $ | 5,913,476 | $ | 10,254,382 | $ | 13,544 | $ | 16,181,402 | ||||||||
| Liabilities: | ||||||||||||||||
| Other Financial Instruments† | ||||||||||||||||
| Forward Currency Contracts | $ | — | $ | (259,578 | ) | $ | — | $ | (259,578 | ) | ||||||
128 Semi-Annual Report
| Description | Unadjusted Quoted Prices in Active Markets for Identical Assets and Liabilities (Level 1) | Significant Other Observable Inputs (Level 2) | Significant Unobservable Inputs (Level 3) | Balance as of June 30, 2022 | ||||||||||||
| Opportunistic Strategies Portfolio | ||||||||||||||||
| Assets: | ||||||||||||||||
| Exchange-Traded Funds | $ | 55,975,867 | $ | — | $ | — | $ | 55,975,867 | ||||||||
| Short-Term Investments | 7,480,422 | — | — | 7,480,422 | ||||||||||||
| Total | $ | 63,456,289 | $ | — | $ | — | $ | 63,456,289 | ||||||||
| Liabilities: | ||||||||||||||||
| Other Financial Instruments† | ||||||||||||||||
| Total Return Swap Agreements | $ | — | $ | (540,415 | ) | $ | — | $ | (540,415 | ) | ||||||
| Real Assets Portfolio | ||||||||||||||||
| Assets: | ||||||||||||||||
| Common Stocks* | ||||||||||||||||
| Australia | $ | — | $ | 475,885 | $ | — | $ | 475,885 | ||||||||
| Belgium | — | 56,101 | — | 56,101 | ||||||||||||
| Brazil | 61,235 | — | — | 61,235 | ||||||||||||
| Canada | 2,516,077 | — | — | 2,516,077 | ||||||||||||
| France | — | 683,228 | — | 683,228 | ||||||||||||
| Hong Kong | — | 297,480 | — | 297,480 | ||||||||||||
| Italy | — | 967,254 | — | 967,254 | ||||||||||||
| Japan | — | 686,823 | — | 686,823 | ||||||||||||
| Luxembourg | — | 21,821 | — | 21,821 | ||||||||||||
| Singapore | — | 85,569 | — | 85,569 | ||||||||||||
| Spain | — | 963,221 | — | 963,221 | ||||||||||||
| Sweden | — | 118,535 | — | 118,535 | ||||||||||||
| Switzerland | — | 34,039 | — | 34,039 | ||||||||||||
| United Kingdom | — | 1,616,418 | — | 1,616,418 | ||||||||||||
| United States | 13,394,627 | — | — | 13,394,627 | ||||||||||||
| Exchange-Traded Funds | 1,943,784 | — | — | 1,943,784 | ||||||||||||
| Short-Term Investments | 12,148,491 | — | — | 12,148,491 | ||||||||||||
| Other Financial Instruments† | ||||||||||||||||
| Forward Currency Contracts | — | 8,403 | — | 8,403 | ||||||||||||
| Futures Contracts | 44,094 | — | — | 44,094 | ||||||||||||
| Total Return Swap Agreements | — | 1,546,327 | — | 1,546,327 | ||||||||||||
| Total | $ | 30,108,308 | $ | 7,561,104 | $ | — | $ | 37,669,412 | ||||||||
| Liabilities: | ||||||||||||||||
| Other Financial Instruments† | ||||||||||||||||
| Forward Currency Contracts | $ | — | $ | (693 | ) | $ | — | $ | (693 | ) | ||||||
| Futures Contracts | (930,495 | ) | — | — | (930,495 | ) | ||||||||||
| Total | $ | (930,495 | ) | $ | (693 | ) | $ | — | $ | (931,188 | ) | |||||
| * | Please refer to Portfolios of Investments and Notes to Portfolios of Investments for portfolio holdings by country and industry. |
| † | Other financial instruments are derivative instruments which are valued at their respective unrealized appreciation (depreciation). |
Semi-Annual Report 129
10. Derivative Instruments
Certain Portfolios may use derivative instruments, including forward currency contracts, options contracts, futures contracts or swap agreements.
Forward currency contracts may be used for hedging purposes or to seek to increase returns.
A Portfolio may write or purchase a call or put option to seek to realize, through the receipt of premiums or changes in market value, a greater return than would be realized on the underlying securities alone, or to seek to protect the Portfolio from losses.
A Portfolio may enter into futures transactions to hedge against changes in interest rates, securities prices, and/or currency exchange rates, to increase total return, or to otherwise gain access or attain exposure to certain markets or other underliers.
A Portfolio enters into swap agreements in an attempt to obtain a particular exposure when it is considered desirable to do so, possibly at a lower cost to such Portfolio than if it had invested directly in the asset that yielded the desired exposure.
During the period ended June 30, 2022, the approximate average monthly notional exposure for derivative instruments was as follows:
| Enhanced | Global Dynamic | Opportunistic | ||||||||||||||
| Opportunities | Multi-Asset | Strategic | Real Assets | |||||||||||||
| Derivative Instruments | Portfolio | Portfolio | Portfolio | Portfolio | ||||||||||||
| Forward currency contracts: | ||||||||||||||||
| Average amounts purchased | $3,200,000 | * | $5,300,000 | $ | — | $4,600,000 | # | |||||||||
| Average amounts sold | 7,500,000 | 4,400,000 | — | 7,100,000 | ||||||||||||
| Futures contracts: | ||||||||||||||||
| Average notional value of contracts – long | — | — | — | 2,200,000 | ||||||||||||
| Total return swap agreements: | ||||||||||||||||
| Average notional value | 8,500,000 | † | — | 1,400,000 | * | 9,300,000 | ||||||||||
| * | Represents average monthly notional exposure for three months the derivative instrument was open during the period. |
| # | Represents average monthly notional exposure for five months the derivative instrument was open during the period. |
| † | Represents average monthly notional exposure for less than one month the derivative instrument was open during the period. |
130 Semi-Annual Report
The Enhanced Opportunities Portfolio also purchased options having an average monthly notional exposure of less than $50,000. The Enhanced Opportunities Portfolio also wrote options having an average monthly notional exposure of less than $50,000.
The following table summarizes the fair value of derivative instruments on the Statement of Assets and Liabilities as of June 30,2022:
Enhanced Opportunities Portfolio
| Foreign | ||||||||||||
| Currency | ||||||||||||
| Equity | Exchange | |||||||||||
| Assets – Derivative Financial Instruments | Contracts | Contracts | Total | |||||||||
| Forward currency contracts | ||||||||||||
| Unrealized appreciation on forward currency contracts | $ | –– | $ | 14,621 | $ | 14,621 | ||||||
| Swap agreements | ||||||||||||
| Unrealized appreciation on swap agreements | 783,741 | –– | 783,741 | |||||||||
| Purchased options | ||||||||||||
| Investment in securities, at fair value | 84,990 | –– | 84,990 | |||||||||
| Total | $ | 868,731 | $ | 14,621 | $ | 883,352 | ||||||
| Foreign | ||||||||||||
| Currency | ||||||||||||
| Equity | Exchange | |||||||||||
| Liabilities – Derivative Financial Instruments | Contracts | Contracts | Total | |||||||||
| Forward currency contracts | ||||||||||||
| Unrealized appreciation on forward currency contracts | $ | –– | $ | 661 | $ | 661 | ||||||
| Swap agreements | ||||||||||||
| Unrealized appreciation on swap agreements | 824 | –– | 824 | |||||||||
| Written options | ||||||||||||
| Written options, at fair value | 79,055 | –– | 79,055 | |||||||||
| Total | $ | 79,879 | $ | 661 | $ | 80,540 | ||||||
Global Dynamic Multi-Asset Portfolio
| Assets – Derivative Financial Instruments | Total | |||||
| Forward currency contracts | Unrealized appreciation on forward currency contracts | $ | 164,168 | |||
| Liabilities – Derivative Financial Instruments | Total | |||||
| Forward currency contracts | Unrealized depreciation on forward currency contracts | $ | 259,578 | |||
Semi-Annual Report 131
Opportunistic Strategies Portfolio
| Assets – Derivative Financial Instruments | Total | |||||
| Swap Agreements | Unrealized appreciation on swap agreements | $ | –– | |||
| Liabilities – Derivative Financial Instruments | Total | |||||
| Swap Agreements | Unrealized depreciation on swap agreements | $ | 540,415 | |||
Real Assets Portfolio
| Foreign | ||||||||||||
| Currency | ||||||||||||
| Commodity | Exchange | |||||||||||
| Assets – Derivative Financial Instruments | Contracts | Contracts | Total | |||||||||
| Forward currency contracts | ||||||||||||
| Unrealized appreciation on forward currency contracts | $ | –– | $ | 8,403 | $ | 8,403 | ||||||
| Swap agreements | ||||||||||||
| Unrealized appreciation on swap agreements | 1,546,327 | –– | 1,546,327 | |||||||||
| Total | $ | 1,546,327 | $ | 8,403 | $ | 1,554,730 | ||||||
| Foreign | ||||||||||||
| Currency | ||||||||||||
| Commodity | Exchange | |||||||||||
| Liabilities – Derivative Financial Instruments | Contracts | Contracts | Total | |||||||||
| Forward currency contracts | ||||||||||||
| Unrealized depreciation on forward currency contracts | $ | –– | $ | 693 | $ | 693 | ||||||
| Future Contracts | ||||||||||||
| Variation margin on open futures contracts (a) | 325,936 | –– | 325,936 | |||||||||
| Total | $ | 325,936 | $ | 693 | $ | 326,629 | ||||||
| (a) | Net cumulative unrealized appreciation (depreciation) on futures contracts if any, are reported in the Schedule of Investments. In the Statements of Assets and Liabilities, only current day’s variation margin is reported in receivables or payables and the net cumulative unrealized appreciation (depreciation) is included in accumulated earnings (loss). |
132 Semi-Annual Report
The effect of derivative instruments on the Statement of Operations for the period ended June 30, 2022 was:
Enhanced Opportunities Portfolio
| Foreign | ||||||||||||
| Currency | ||||||||||||
| Equity | Exchange | |||||||||||
| Net Realized Gain (Loss) from: | Contracts | Contracts | Total | |||||||||
| Forward currency contracts | $ | –– | $ | 324,089 | $ | 324,089 | ||||||
| Purchased options* | 418,718 | –– | 418,718 | |||||||||
| Swap agreements | 262,758 | –– | 262,758 | |||||||||
| Written options | 35,466 | –– | 35,466 | |||||||||
| Total | $ | 716,942 | $ | 324,089 | $ | 1,041,031 | ||||||
| * | Purchased options are included under realized gain/loss on investments on Statement of Operations. |
| Foreign | ||||||||||||
| Currency | ||||||||||||
| Equity | Exchange | |||||||||||
| Net Change in Unrealized Appreciation (Depreciation) on: | Contracts | Contracts | Total | |||||||||
| Forward currency contracts | $ | –– | $ | 83,737 | $ | 83,737 | ||||||
| Purchased options* | 55,486 | –– | 55,486 | |||||||||
| Swap agreements | 775,220 | –– | 775,220 | |||||||||
| Written options | (21,806 | ) | –– | (21,806 | ) | |||||||
| Total | $ | 808,900 | $ | 83,737 | $ | 892,637 | ||||||
| * | Purchased options are included under unrealized gain/loss on investments on Statement of Operations. |
Global Dynamic Multi-Asset Portfolio
| Net Realized Gain (Loss) from: | Total | |||||
| Forward currency contracts | $ | (146,052) | ||||
| Net Change in Unrealized Appreciation (Depreciation) on: | Total | |||||
| Forward currency contracts | $ | (101,177) | ||||
Opportunistic Strategies Portfolio
| Net Realized Gain (Loss) from: | Total | |||||
| Swap Agreements | $ | –– | ||||
| Net Change in Unrealized Appreciation (Depreciation) on: | Total | |||||
| Swap Agreements | $ | (540,415) | ||||
Semi-Annual Report 133
Real Assets Portfolio
| Foreign | ||||||||||||
| Currency | ||||||||||||
| Commodity | Exchange | |||||||||||
| Net Realized Gain (Loss) from: | Contracts | Contracts | Total | |||||||||
| Forward currency contracts | $ | –– | $ | 126,717 | $ | 126,717 | ||||||
| Futures Contracts | 1,698,310 | –– | 1,698,310 | |||||||||
| Swap agreements | (110,415 | ) | –– | (110,415 | ) | |||||||
| Total | $ | 1,587,895 | $ | 126,717 | $ | 1,714,612 | ||||||
| Foreign | ||||||||||||
| Currency | ||||||||||||
| Commodity | Exchange | |||||||||||
| Net Change in Unrealized Appreciation (Depreciation) on: | Contracts | Contracts | Total | |||||||||
| Forward currency contracts | $ | –– | $ | 108,209 | $ | 108,209 | ||||||
| Futures Contracts | (913,426 | ) | –– | (913,426 | ) | |||||||
| Swap agreements | 1,738,903 | –– | 1,738,903 | |||||||||
| Total | $ | 825,477 | $ | 108,209 | $ | 933,686 | ||||||
As of June 30, 2022, the Enhanced Opportunities, Global Dynamic Multi-Asset, Opportunistic Strategies and Real Assets Portfolios held derivative instruments that are eligible for offset in their Statements of Assets and Liabilities and are subject to master netting arrangements. A master netting arrangement is an agreement between two counterparties who have multiple contracts with each other that provides for the net settlement of all contracts, as well as any cash collateral, through a single payment in the event of default on, or termination of, any one contract.
The required information for the affected Portfolios is presented in the below table, as of June 30, 2022:
Enhanced Opportunities Portfolio
| Net Amounts of | |||||||||||||||||
| Gross Amounts Offset | Assets Presented | ||||||||||||||||
| Gross Amounts of | in the Statement of | in the Statement of | |||||||||||||||
| Description | Recognized Assets | Assets and Liabilities | Assets and Liabilities | ||||||||||||||
| Forward Currency Contracts | $ | 14,621 | $ | — | $ | 14,621 | |||||||||||
| Total Return Swap Agreements | 783,741 | — | 783,741 | ||||||||||||||
| Total | $ | 798,362 | $ | — | $ | 798,362 | |||||||||||
134 Semi-Annual Report
| Amounts Not Offset | |||||||||||||||||||||||||
| in the Statement of | |||||||||||||||||||||||||
| Assets and Liabilities | |||||||||||||||||||||||||
| Net Amounts of | |||||||||||||||||||||||||
| Assets Presented | |||||||||||||||||||||||||
| in the Statement of | Financial | Collateral | Net Amounts of | ||||||||||||||||||||||
| Counterparty | Assets and Liabilities | Instruments | Received | Derivative Assets | |||||||||||||||||||||
| Bank of America NA | $ | 783,741 | $ | (824 | ) | $ | — | $ | 782,917 | ||||||||||||||||
| State Street Bank and Trust Co. | 14,621 | (661 | ) | — | 13,960 | ||||||||||||||||||||
| Total | $ | 798,362 | $ | (1,485 | ) | $ | — | $ | 796,877 | ||||||||||||||||
| Net Amounts of | |||||||||||||||||
| Gross Amounts Offset | Liabilities Presented | ||||||||||||||||
| Gross Amounts of | in the Statement of | in the Statement of | |||||||||||||||
| Description | Recognized Liabilities | Assets and Liabilities | Assets and Liabilities | ||||||||||||||
| Forward Currency Contracts | $ | 661 | $ | — | $ | 661 | |||||||||||
| Total Return Swap Agreements | 824 | — | 824 | ||||||||||||||
| Total | $ | 1,485 | $ | — | $ | 1,485 | |||||||||||
| Amounts Not Offset | |||||||||||||||||||||||||
| in the Statement of | |||||||||||||||||||||||||
| Assets and Liabilities | |||||||||||||||||||||||||
| Net Amounts of | |||||||||||||||||||||||||
| Liabilities Presented | |||||||||||||||||||||||||
| in the Statement of | Financial | Collateral | Net Amounts of | ||||||||||||||||||||||
| Counterparty | Assets and Liabilities | Instruments | Pledged | Derivative Liabilities | |||||||||||||||||||||
| Bank of America NA | $ | 824 | $ | (824 | ) | $ | — | $ | — | ||||||||||||||||
| State Street Bank and Trust Co. | 661 | (661 | ) | — | — | ||||||||||||||||||||
| Total | $ | 1,485 | $ | (1,485 | ) | $ | — | $ | — | ||||||||||||||||
Global Dynamic Multi-Asset Portfolio
| Net Amounts of | |||||||||||||||||
| Gross Amounts Offset | Assets Presented | ||||||||||||||||
| Gross Amounts of | in the Statement of | in the Statement of | |||||||||||||||
| Description | Recognized Assets | Assets and Liabilities | Assets and Liabilities | ||||||||||||||
| Forward Currency Contracts | $ | 164,168 | $ | — | $ | 164,168 | |||||||||||
Semi-Annual Report 135
| Amounts Not Offset | |||||||||||||||||||||||||
| in the Statement of | |||||||||||||||||||||||||
| Assets and Liabilities | |||||||||||||||||||||||||
| Net Amounts of | |||||||||||||||||||||||||
| Assets Presented | |||||||||||||||||||||||||
| in the Statement of | Financial | Collateral | Net Amounts of | ||||||||||||||||||||||
| Counterparty | Assets and Liabilities | Instruments | Received | Derivative Assets | |||||||||||||||||||||
| Citibank NA | $ | 38,835 | $ | (38,835 | ) | $ | — | $ | — | ||||||||||||||||
| HSBC Bank USA NA | 41,859 | (41,859 | ) | — | — | ||||||||||||||||||||
| JPMorgan Chase Bank NA | 83,159 | (69,625 | ) | — | 13,534 | ||||||||||||||||||||
| State Street Bank and Trust Co. | 315 | (23 | ) | — | 292 | ||||||||||||||||||||
| Total | $ | 164,168 | $ | (150,342 | ) | $ | — | $ | 13,826 | ||||||||||||||||
| Net Amounts of | |||||||||||||||||
| Gross Amounts Offset | Liabilities Presented | ||||||||||||||||
| Gross Amounts of | in the Statement of | in the Statement of | |||||||||||||||
| Description | Recognized Liabilities | Assets and Liabilities | Assets and Liabilities | ||||||||||||||
| Forward Currency Contracts | $ | 259,578 | $ | — | $ | 259,578 | |||||||||||
| Amounts Not Offset | |||||||||||||||||||||||||
| in the Statement of | |||||||||||||||||||||||||
| Assets and Liabilities | |||||||||||||||||||||||||
| Net Amounts of | |||||||||||||||||||||||||
| Liabilities Presented | |||||||||||||||||||||||||
| in the Statement of | Financial | Collateral | Net Amounts of | ||||||||||||||||||||||
| Counterparty | Assets and Liabilities | Instruments | Pledged | Derivative Liabilities | |||||||||||||||||||||
| Citibank NA | $ | 52,622 | $ | (38,835 | ) | $ | — | $ | 13,787 | ||||||||||||||||
| HSBC Bank USA NA | 137,084 | (41,859 | ) | — | 95,225 | ||||||||||||||||||||
| JPMorgan Chase Bank NA | 69,625 | (69,625 | ) | — | — | ||||||||||||||||||||
| Morgan Stanley & Co. | 224 | — | — | 224 | |||||||||||||||||||||
| State Street Bank and Trust Co. | 23 | (23 | ) | — | — | ||||||||||||||||||||
| Total | $ | 259,578 | $ | (150,342 | ) | $ | — | $ | 109,236 | ||||||||||||||||
136 Semi-Annual Report
Opportunistic Strategies Portfolio
| Net Amounts of | |||||||||||||||||
| Gross Amounts Offset | Liabilities Presented | ||||||||||||||||
| Gross Amounts of | in the Statement of | in the Statement of | |||||||||||||||
| Description | Recognized Liabilities | Assets and Liabilities | Assets and Liabilities | ||||||||||||||
| Total Return Swap Agreements | $ | 540,415 | $ | — | $ | 540,415 | |||||||||||
| Amounts Not Offset | |||||||||||||||||||||||||
| in the Statement of | |||||||||||||||||||||||||
| Assets and Liabilities | |||||||||||||||||||||||||
| Net Amounts of | |||||||||||||||||||||||||
| Liabilities Presented | |||||||||||||||||||||||||
| in the Statement of | Financial | Collateral | Net Amounts of | ||||||||||||||||||||||
| Counterparty | Assets and Liabilities | Instruments | Pledge | Derivative Liabilities | |||||||||||||||||||||
| Goldman Sachs International | $ | 540,415 | $ | — | $ | — | $ | 540,415 | |||||||||||||||||
Real Assets Portfolio
| Net Amounts of | |||||||||||||||||
| Gross Amounts Offset | Assets Presented | ||||||||||||||||
| Gross Amounts of | in the Statement of | in the Statement of | |||||||||||||||
| Description | Recognized Assets | Assets and Liabilities | Assets and Liabilities | ||||||||||||||
| Forward Currency Contracts | $ | 8,403 | $ | — | $ | 8,403 | |||||||||||
| Total Return Swap Agreements | 1,546,327 | — | 1,546,327 | ||||||||||||||
| Total | $ | 1,554,730 | $ | — | $ | 1,554,730 | |||||||||||
| Amounts Not Offset | |||||||||||||||||||||||||
| in the Statement of | |||||||||||||||||||||||||
| Assets and Liabilities | |||||||||||||||||||||||||
| Net Amounts of | |||||||||||||||||||||||||
| Assets Presented | |||||||||||||||||||||||||
| in the Statement of | Financial | Collateral | Net Amounts of | ||||||||||||||||||||||
| Counterparty | Assets and Liabilities | Instruments | Received (a) | Derivative Assets | |||||||||||||||||||||
| Goldman Sachs International | $ | 1,546,327 | $ | — | $ | (390,000 | ) | $ | 1,156,327 | ||||||||||||||||
| HSBC Bank USA NA | 1,147 | (124 | ) | — | 1,023 | ||||||||||||||||||||
| JPMorgan Chase Bank NA | 673 | (250 | ) | — | 423 | ||||||||||||||||||||
| State Street Bank and Trust Co. | 6,583 | (319 | ) | — | 6,264 | ||||||||||||||||||||
| Total | $ | 1,554,730 | $ | (693 | ) | $ | (390,000 | ) | $ | 1,164,037 | |||||||||||||||
| (a) | Collateral amounts disclosed in the table above may be adjusted due to the requirement to limit collateral amounts to avoid the effect of over-collateralization. Actual collateral received and/or pledged may be more than the amounts disclosed herein. |
Semi-Annual Report 137
| Net Amounts of | |||||||||||||||||
| Gross Amounts Offset | Liabilities Presented | ||||||||||||||||
| Gross Amounts of | in the Statement of | in the Statement of | |||||||||||||||
| Description | Recognized Liabilities | Assets and Liabilities | Assets and Liabilities | ||||||||||||||
| Forward Currency Contracts | $ | 693 | $ | — | $ | 693 | |||||||||||
| Amounts Not Offset | |||||||||||||||||||||||||
| in the Statement of | |||||||||||||||||||||||||
| Assets and Liabilities | |||||||||||||||||||||||||
| Net Amounts of | |||||||||||||||||||||||||
| Liabilities Presented | |||||||||||||||||||||||||
| in the Statement of | Financial | Collateral | Net Amounts of | ||||||||||||||||||||||
| Counterparty | Assets and Liabilities | Instruments | Pledged | Derivative Liabilities | |||||||||||||||||||||
| HSBC Bank USA NA | $ | 124 | $ | (124 | ) | $ | — | $ | — | ||||||||||||||||
| JPMorgan Chase Bank NA | 250 | (250 | ) | — | — | ||||||||||||||||||||
| State Street Bank and Trust Co. | 319 | (319 | ) | — | — | ||||||||||||||||||||
| Total | $ | 693 | $ | (693 | ) | $ | — | $ | — | ||||||||||||||||
11. Accounting Pronouncements
On March 12, 2020, the Financial Accounting Standards Board concluded its reference rate reform project with the issuance of Accounting Standards Update No. 2020- 04, Reference Rate Reform (Topic 848) — Facilitation of the Effects of Reference Rate Reform on Financial Reporting (“ASU No. 2020-04”). ASU No. 2020-04 provides elective temporary financial reporting relief from the effect of certain types of contract modifications due to the planned discontinuation of the London Interbank Offered Rate (LIBOR) and other interbank offered reference rates as of the end of 2021. ASU No. 2020-04 was initially intended to be effective for certain reference rate-related contract modifications that have occurred since March 12, 2020 and that will continue to occur, through December 31, 2022, but FASB has voted to extend the grace period for complete adoption of ASU No. 2020-04 to December 31, 2024, after the UK Financial Conduct Authority delayed the intended cessation date of certain tenors of USD LIBOR to June 30, 2023. Management has adopted ASU No. 2020-04.
138 Semi-Annual Report
12. Subsequent Events
Management has evaluated subsequent events potentially affecting the Portfolios through the issuance of the financial statements and, other than the following, no subsequent events require adjustment or disclosure. Management began to offer the R6 Shares in the Real Assets Portfolio on July 22, 2022. Each share class of this Portfolio is identical except as to minimum investment requirements; eligibility requirements for R6 Shares; the services offered to, and expenses borne by, each class; and the availability of Service Payments (as defined in the Fund’s prospectus).
Semi-Annual Report 139
The Lazard Funds, Inc.
Proxy Voting
A description of the policies and procedures used to determine how proxies relating to Fund portfolio securities are voted is available (1) without charge, upon request, by calling (800) 823-6300 or (2) on the Securities and Exchange Commission (the “SEC”) website at https://www.sec.gov.The Fund’s proxy voting record for the most recent 12-month period ended June 30 is available (1) without charge, upon request, by calling (800) 823-6300 or (2) on the SEC’s website at https://www.sec.gov. Information as of June 30 each year will generally be available by the following August 31.
Schedule of Portfolio Holdings
The Fund files the complete schedule of each Portfolio’s holdings with the SEC for the first and third quarters of each fiscal year as an exhibit to its reports on Form N-PORT. The Fund’s Form N-PORT reports are available on the SEC’s website at https://www.sec.gov.
Board Consideration of Management Agreement
At meetings of the Board held on June 1, 2022 and June 28, 2022, the Board considered the approval, for an additional annual period, of the Management Agreement between the Fund, on behalf of each of the Portfolios, and the Investment Manager. The Independent Directors were assisted in their review by independent legal counsel, who advised the Board on relevant legal standards and met with the Independent Directors in executive sessions separate from representatives of the Investment Manager.
Representatives of the Investment Manager discussed with the Board the Investment Manager’s written materials provided in advance of the meetings, including, at the June 28, 2022 meeting, additional information requested by the Independent Directors at the June 1, 2022 meeting.
Services Provided
The Investment Manager’s materials addressed, among other matters, the nature, extent and quality of services that the Investment Manager provides the Fund, including a discussion of the Investment Manager and its clients. As of March 31, 2022, the
140 Semi-Annual Report
Lazard Funds complex of 35 active funds comprised approximately $23 billion of the approximately $253 billion of total assets under the management of the Investment Manager and its global affiliates.
The Board considered the various services provided by the Investment Manager including the Investment Manager’s research, portfolio management and trading capabilities and oversight of day-to-day operations, including supervision of fund accounting and administration-related services and assistance in meeting legal and regulatory requirements, as well as regular reporting to, and support of, the Board. The Investment Manager’s representatives stated that the Investment Manager believes that the Fund and its shareholders continue to be able to obtain significant benefits as a result of the resources and support of the Investment Manager’s global research, portfolio management, trading, operations, risk management, technology and legal and compliance infrastructure. The Board also considered information provided by the Investment Manager regarding its resources relevant to providing services pursuant to the Management Agreement; the qualifications, experience and other information regarding senior management and key professional personnel responsible for providing services to the Portfolios; trends in recent years in the number of personnel involved in providing services to the Portfolios and the adequacy of the Investment Manager’s staffing to provide services pursuant to the Management Agreement; the Fund’s distribution channels and the relationships with various intermediaries; marketing and shareholder servicing activities on behalf of the Portfolios; Portfolio asset flows and the growth or decline in asset levels; and the Investment Manager’s financial condition. The Board accepted the assertion of representatives of the Investment Manager that the Fund benefits from the services and infrastructure provided by the Investment Manager and that such services and infrastructure are greater than those typically provided to a $23 billion fund complex not managed by a large, global firm such as the Investment Manager.
Semi-Annual Report 141
Comparative Fee, Expense Ratio and Performance Information
Strategic Insight Advisory Fee and Expense Ratio Comparisons. The Board reviewed, for each Portfolio, information prepared by Strategic Insight, an independent provider of investment company data, including, among other information, each Portfolio’s contractual advisory fee (i.e., without giving effect to any fee waivers) and net expense ratio (i.e., after giving effect to the Portfolio’s expense limitation agreed to by the Investment Manager) to those of:
| ● | a group of funds not advised by the Investment Manager that were selected by Strategic Insight as comparable to the Portfolio, for expense comparison purposes, based on Strategic Insight’s methodology (the “Expense Peer Group”); and |
| ● | the funds within the broad category of funds to which the Portfolio has been assigned by Morningstar, Inc., an independent third party service that ranks and rates funds (“Morningstar”), with certain exclusions as specified by Strategic Insight (the “Expense Category”). |
Representatives of the Investment Manager discussed the results of the Strategic Insight advisory fee and net expense ratio comparisons with the Board, which showed that the advisory fees and net expense ratios of the Portfolios were competitive within each Portfolio’s respective Expense Peer Group. The Board considered the comparisons, additional perspectives in information prepared by, and in discussions with, representatives of the Investment Manager and that the Investment Manager continues to voluntarily enter into expense limitation agreements for all of the Portfolios, pursuant to which the Investment Manager was currently waiving advisory fees and/or reimbursing expenses. The Board also received a description of Strategic Insight’s methodology for its construction of Expense Peer Groups and a summary of how the methodology was applied.
Other Accounts Advisory Fee Comparisons. The Board also considered the actual advisory fees paid to the Investment Manager by other accounts of the Investment Manager that are comparable to each Portfolio in terms of investment objectives,
142 Semi-Annual Report
strategies and policies, if any (including other investment companies and other pooled investment vehicles, “Other Accounts”). Representatives of the Investment Manager discussed the nature of the Other Accounts and the significant differences in services provided by the Investment Manager to the different types of Other Accounts as compared to the services provided to the Portfolios. The Board considered the relevance of the fee information provided for Other Accounts, in light of the Investment Manager’s discussion of the significant differences in services provided, to evaluate the advisory fees of the relevant Portfolios.
Strategic Insight Performance Comparisons. The Board reviewed, among other performance information provided to the Board on a quarterly basis, information prepared by Strategic Insight including, among other information, each Portfolio’s performance for the one-, three-, five- and ten-year periods ended March 31, 2022, as applicable, compared to performance for the same time periods to that of:
| ● | a group of funds not advised by the Investment Manager that were selected by Strategic Insight as comparable to the Portfolio, for performance comparison purposes, based on Strategic Insight’s methodology (the “Performance Peer Group”); |
| ● | the funds within the broad category of funds to which the Portfolio has been assigned by Morningstar (the “Performance Category”); and |
| ● | the Portfolio’s benchmark index. |
The Board also received a description of Strategic Insight’s methodology for its construction of Performance Peer Groups and a summary of how the methodology was applied, including, for each Portfolio, deviations from Strategic Insights’ stated methodology and the reasons therefor.
When evaluating the performance of each Portfolio, the Board considered Strategic Insight’s performance analysis along with
Semi-Annual Report 143
other information provided by the Investment Manager, including additional information regarding performance expectations, as well as additional perspectives in information prepared by, and in discussions with, representatives of the Investment Manager. The Board also received and would continue to receive regular updates and/or additional information from the Investment Manager in respect of Portfolios with relative underperformance in certain periods and Portfolios which otherwise are not performing in accordance with expectations, as well as any other Portfolios for which the Board requested additional information.
Investment Manager Profitability and Economies of Scale
The Board reviewed information prepared by the Investment Manager for each Portfolio concerning the estimated profitability percentage of the Management Agreement to the Investment Manager and its affiliates for the calendar year ended December 31, 2021 and the Investment Manager’s cost allocation methodology to compute an estimate of each Portfolio’s costs to the Investment Manager. The Investment Manager’s representatives reviewed with the Board information provided on the Investment Manager’s brokerage practices and the Portfolios’ brokerage allocation, commission payments and soft dollar commissions and benefits. The Investment Manager’s representatives stated that neither the Investment Manager nor its affiliates receive any other significant benefits from the Investment Manager acting as investment manager to the Portfolios. The representatives of the Investment Manager reminded the Board that the Investment Manager is continuing to support distribution relationships through direct payments from its or its affiliates’ own resources to third parties in connection with distribution and shareholder servicing and/or administrative and recordkeeping services, and noted that the Fund does not bear any related costs other than the 0.25% 12b-1 fee pursuant to the Distribution and Servicing Plan adopted for the Portfolios’ Open Shares.
The profitability percentages were below ranges determined by relevant court cases not to be so disproportionately large that they bore no reasonable relationship to the services rendered. The
144 Semi-Annual Report
Board (1) considered the Investment Manager’s estimated profitability percentage with respect to each Portfolio as part of their evaluation of the Portfolio’s fee under the Management Agreement, considered in relation to the mix of services provided by the Investment Manager (including the nature, extent and quality of such services), and (2) evaluated the profitability percentage in light of the relevant circumstances for each Portfolio. Representatives of the Investment Manager and the Board discussed ways economies of scale could be realized and how they could be shared, including the Investment Manager’s reinvestment of profits back into its business, waiving or reducing Portfolio management fees and/or reimbursing expenses, adding discounts to a Portfolio’s management fee schedule as a Portfolio’s assets increase or by instituting management fees at inception that account for future scale. As the average assets of each Portfolio over the most recently completed calendar year had either decreased (or not increased significantly) from the Portfolio’s assets as of the end of the previous calendar year and/or had not reached a significant size, the potential that the Investment Manager may have realized any material economies of scale was reduced.
Conclusions and Determinations
At the conclusion of these discussions, the Board expressed the opinion that it had been furnished with such information as may reasonably be necessary to make an informed business decision with respect to evaluation of the renewal of the Management Agreement. Based on its discussions and considerations as described above, with the assistance of independent legal counsel and in the exercise of its business judgment, the Board made the following conclusions and determinations.
| ● | The Board concluded that the nature, extent and quality of the services provided by the Investment Manager are adequate and appropriate, noting the benefits of the significant services and infrastructure associated with an approximately $253 billion global asset management business. |
Semi-Annual Report 145
| ● | The Board concluded that each Portfolio’s fee paid to the Investment Manager was appropriate under the circumstances and in light of the factors and the totality of the services provided. |
| ● | The Board, after considering the information provided and the totality of the relevant circumstances for each Portfolio, concluded that the investment performance of each Portfolio was acceptable or that, for any Portfolios that were not performing in accordance with expectations, the Board accepted that the Investment Manager was taking steps intended to improve performance and the Board would continue to monitor performance. |
| ● | The Board recognized that economies of scale may be realized, particularly as the assets of the Portfolios increase, and determined that it would continue to consider potential material economies of scale. |
In evaluating the Management Agreement, the Board relied on the information described above, in addition to other information provided by the Investment Manager throughout the year relating to the operations of the Fund and the investment management and other services provided under the Management Agreement. Such other information included the investment performance of the Portfolios in comparison to similar mutual funds and benchmark performance indices over various time periods; the expected pattern of performance for the Portfolios in different market conditions; general market outlook as applicable to the Portfolios; and compliance reports. The Board also relied on its previous knowledge, gained through meetings and other interactions with the Investment Manager, of the Investment Manager and the services provided to the Fund by the Investment Manager. The Board considered these conclusions and determinations in their totality and determined to approve the Fund’s Management Agreement for each Portfolio. In deciding whether to vote to approve the Management Agreement for each Portfolio, each Director may have accorded different weights to
146 Semi-Annual Report
different factors so that each Director may have had a different basis for his or her decision.
Statement Regarding Liquidity Risk Management Program
The Fund has adopted a liquidity risk management program (the “LRMP”) pursuant to the requirements of Rule 22e-4 under the 1940 Act, which requires registered open-end funds (other than money market funds) to adopt and implement a written liquidity risk management program that is reasonably designed to assess and manage liquidity risk. The rule is designed to promote effective liquidity risk management and reduce liquidity risk—i.e., the risk that a fund could not meet requests to redeem shares issued by the fund without significant dilution of remaining investors’ interests in the fund.
The Board approved the Investment Manager to administer the LRMP (the “Program Administrator”). As Program Administrator, the Investment Manager delegates the day-to-day activities required by the LRMP to a Valuation and Liquidity Committee comprised of various Fund officers and senior personnel of the Investment Manager. In addition, the Fund has contracted with a third party liquidity assessment vendor to support the classification of Portfolio investments.
Pursuant to the requirements of Rule 22e-4, the Board must review, no less frequently than annually, a written report prepared by the Program Administrator that, among other things, addresses the operation of the LRMP and assesses its adequacy and effectiveness of implementation and any material changes to the LRMP. The Board received a written report in June 2022 (the “Annual Report”). The Annual Report included, among other things, a statement that the Investment Manager, as the Program Administrator, acting primarily through the Valuation and Liquidity Committee, has reviewed the operation of the LRMP and believes that the LRMP is reasonably designed to assess and manage the Portfolios’ liquidity risk and is adequate and effective in its implementation. There were no material compliance matters relating to compliance with Rule 22e-4 identified in the Annual Report.
Semi-Annual Report 147
The Lazard Funds, Inc.
30 Rockefeller Plaza
New York, New York 10112-6300
Telephone: 800-823-6300
www.lazardassetmanagement.com
Investment Manager
Lazard Asset Management LLC
30 Rockefeller Plaza
New York, New York 10112-6300
Telephone: 800-823-6300
Distributor
Lazard Asset Management Securities LLC
30 Rockefeller Plaza
New York, New York 10112-6300
Custodian
State Street Bank and Trust Company
One Iron Street
Boston, Massachusetts 02210-1641
Transfer Agent and Dividend Disbursing Agent
DST Asset Manager Solutions, Inc.
2000 Crown Colony Drive
Quincy, Massachusetts 02169-0953
Telephone: 617-483-7000
Independent Registered Public Accounting Firm
Deloitte & Touche LLP
30 Rockefeller Plaza
New York, New York 10112-0015
Legal Counsel
Proskauer Rose LLP
Eleven Times Square
New York, New York 10036-8299
www.proskauer.com
![]()

Lazard Asset Management LLC • 30 Rockefeller Plaza • New York, NY 10112 • www.lazardassetmanagement.com
Performance information as of the most recent month end is available online at www.lazardassetmanagement.com. LZDPS030 |  | We Recycle This document is printed on recycled paper. |
ITEM 2. CODE OF ETHICS.
Not applicable.
ITEM 3. AUDIT COMMITTEE FINANCIAL EXPERT.
Not applicable.
ITEM 4. PRINCIPAL ACCOUNTANT FEES AND SERVICES.
Not applicable.
ITEM 5. AUDIT COMMITTEE OF LISTED REGISTRANTS.
Not applicable.
ITEM 6. INVESTMENTS
Not applicable.
ITEM 7. DISCLOSURE OF PROXY VOTING POLICIES AND PROCEDURES FOR CLOSED END MANAGEMENT INVESTMENT COMPANIES.
Not applicable.
ITEM 8. PORTFOLIO MANAGERS OF CLOSED-END MANAGEMENT INVESTMENT COMPANIES.
Not applicable.
ITEM 9. PURCHASES OF EQUITY SECURITIES BY CLOSED-END MANAGEMENT INVESTMENT COMPANY AND AFFILIATED PURCHASERS.
Not applicable.
ITEM 10. SUBMISSION OF MATTERS TO A VOTE OF SECURITY HOLDERS.
There were no material changes to the procedures by which shareholders may recommend nominees to the Registrant’s Board of Directors during the period covered by this report.
ITEM 11. CONTROLS AND PROCEDURES.
(a) The Registrant’s principal executive and principal financial officers have concluded, based on their evaluation of the Registrant’s disclosure controls and procedures as of a date within 90 days of the filing date of this report, that the Registrant’s disclosure controls and procedures are reasonably designed to ensure that information required to be disclosed by the Registrant on Form N-CSR is recorded, processed, summarized and reported within the required time periods and that information required to be disclosed by the Registrant in the reports that it files or submits on Form
N-CSR is accumulated and communicated to the Registrant’s management, including its principal executive and principal financial officers, as appropriate to allow timely decisions regarding required disclosure.
(b) There were no changes to the Registrant’s internal control over financial reporting that occurred during the period covered by this report that have materially affected, or are reasonably likely to materially affect, the Registrant’s internal control over financial reporting.
ITEM 12. DISCLOSURE OF SECURITIES LENDING ACTIVITIES FOR CLOSED-END MANAGEMENT INVESTMENT COMPANIES.
Not applicable.
ITEM 13. EXHIBITS.
(a)(1) Not applicable.
(a)(3) Not applicable.
SIGNATURES
Pursuant to the requirements of the Securities Exchange Act of 1934 and the Investment Company Act of 1940, the Registrant has duly caused this report to be signed on its behalf by the undersigned, thereunto duly authorized.
The Lazard Funds, Inc.
By /s/ Nathan A. Paul
Nathan A. Paul
Chief Executive Officer
Date August 23, 2022
Pursuant to the requirements of the Securities Exchange Act of 1934 and the Investment Company Act of 1940, this report has been signed below by the following persons on behalf of the Registrant and in the capacities and on the dates indicated.
By /s/ Nathan A. Paul
Nathan A. Paul
Chief Executive Officer
Date August 23, 2022
By /s/ Christopher Snively
Christopher Snively
Chief Financial Officer
Date August 23, 2022