UNITED STATES
SECURITIES AND EXCHANGE COMMISSION
Washington, D.C. 20549
FORM N-CSR
CERTIFIED SHAREHOLDER REPORT OF REGISTERED
MANAGEMENT INVESTMENT COMPANIES
Investment Company Act file number: 811-06318
MORGAN STANLEY PATHWAY FUNDS
(Exact name of registrant as specified in charter)
2000 Westchester Avenue
Purchase, NY 10577
(Address of principal executive offices)(Zip code)
CT Corp
155 Federal Street Suite 700
Boston, MA 02110
(Name and address of agent for service)
Registrant’s telephone number, including area code: (888) 454-3965
Date of fiscal year end: August 31
Date of reporting period: August 31, 2021
Form N-CSR is to be used by management investment companies to file reports with the Commission not later than 10 days after the transmission to stockholders of any report that is required to be transmitted to stockholders under Rule 30e-1 under the Investment Company Act of 1940 (17 CFR 270.30e-1). The Commission may use the information provided on Form N-CSR in its regulatory, disclosure review, inspection, and policymaking rules.
A registrant is required to disclose the information specified by Form N-CSR, and the Commission will make this information public. A registrant is not required to respond to the collection of information contained in Form N-CSR unless the Form displays a currently valid Office of Management and Budget (“OMB”) control number. Please direct comments concerning the accuracy of the information collection burden estimate and any suggestions for reducing the burden to Secretary, Securities and Exchange Commission, 450 Fifth Street, NW, Washington, DC 20549-0609. The OMB has reviewed this collection of information under clearance requirements of 44 U.S.C. § 3507.
ITEM 1. REPORTS TO STOCKHOLDERS


Morgan Stanley
Pathway Funds
Annual Report
| » | August 31, 2021 |
| • | Large Cap Equity Fund |
| • | Small-Mid Cap Equity Fund |
| • | International Equity Fund |
| • | Emerging Markets Equity Fund |
| • | Core Fixed Income Fund |
| • | High Yield Fund |
| • | International Fixed Income Fund |
| • | Municipal Bond Fund |
| • | Inflation-Linked Fixed Income Fund |
| • | Ultra-Short Term Fixed Income Fund |
| • | Alternative Strategies Fund |
INVESTMENT PRODUCTS: NOT FDIC INSURED • NO BANK GUARANTEE • MAY LOSE VALUE
| I | ||||
| 1 | ||||
| 4 | ||||
| 7 | ||||
| 10 | ||||
| 12 | ||||
| 14 | ||||
| 16 | ||||
| 18 | ||||
| 20 | ||||
| 22 | ||||
| 24 | ||||
| 30 | ||||
| 32 | ||||
| 298 | ||||
| 300 | ||||
| 302 | ||||
| 306 | ||||
| 307 | ||||
| 318 | ||||
| 358 | ||||
BOARD APPROVALOF MANAGEMENT AGREEMENTAND INVESTMENT ADVISORY AGREEMENTS | 360 | |||
| 366 | ||||
| 371 | ||||
DEAR SHAREHOLDER,
Global equity markets were positive during the twelve-month period ending August 31, 2021. U.S. markets as measured by the S&P 500® Index i gained 31.17%, while developed international markets represented by the MSCI EAFE® Index (Net) viii gained 26.12% and emerging markets as measured by the MSCI Emerging Markets Index (Net) xi 21.12%.
During the trailing 12 months ending August 31, 2021, growth stocks underperformed value, both domestically and abroad. The U.S. large-cap Russell 1000® Growth Index iii gained 28.53% compared to the Russell 1000® Value Index iv which gained 36.44%. The U.S. small-cap Russell 2000® Growth Index vi gained 35.61% compared to a gain of 59.49% for the Russell 2000® Value Index vii. In developed international markets the MSCI EAFE® Growth Index ix gained 24.95% compared to a gain of 26.99% for the MSCI EAFE® Value Index x. Within emerging markets, the MSCI Emerging Markets Growth Index (Net) xii gained 13.79% compared to a gain of 29.34% for the MSCI Emerging Markets Value Index (Net) xiii.
Within the United States, all eleven S&P 500® Index i sectors posted positive results. The returns were as follows: Financials (+56.48%), Energy (+42.94%), Communication Services (+38.56%), Materials (+38.14%), Industrials (+36.36%), Real Estate (+36.35%), Information Technology (+29.47%), Health Care (+26.97%), Utilities (+19.66%), Consumer Discretionary (+17.85%) and Consumer Staples (+14.44%).
Fixed income markets produced mixed returns during the same twelve-month period. Broad investment grade indices such as the Bloomberg U.S. Aggregate BondTM Index xv declined slightly returning -0.08% and the Bloomberg Global Aggregate Bond Index xvi returned 0.52%. U.S. high yield performed well with the Bloomberg U.S. Corporate High Yield Bond Index xvii gaining 10.14%.
Morgan Stanley & Co. economists expect U.S. real GDP to grow 7.1% in 2021 and 4.9% in 2022. The forecast for global real GDP is to grow 6.5% in 2021 and 4.9% in 2022.
Morgan Stanley Pathway Funds
(Returns are for the fiscal one-year period ending August 31, 2021)
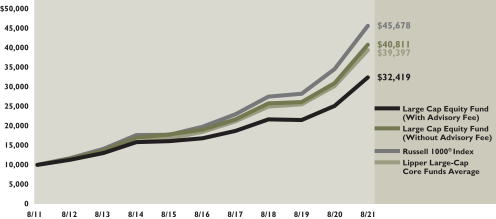
The Large Cap Equity Fund returned 31.79% compared to 32.25% for Russell 1000® Index ii. The return of the Lipper Large-Cap Core Funds Average xxii investment category was 30.42%. The Fund’s positioning within information technology and industrials had the largest positive impact on relative performance while positioning within health care and financials had the largest negative impact. Top contributors included Alphabet, Facebook and Microsoft, while the top detractors included Alibaba Group Holding, Amazon and Splunk.
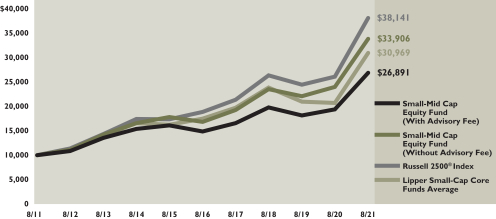
The Small-Mid Cap Equity Fund returned 41.14% compared to 45.87% for Russell 2500® Index v. The return of the Lipper Small-Cap Core Funds Average xxiii investment category was 49.50%. The Fund’s positioning within materials and communication services had the largest positive impact on relative performance while positioning within health care and consumer discretionary had the largest negative impact. Top contributors included Charles River Laboratories International, Acadia Healthcare Company and Bio-Techne, while the top detractors included Palomar Holdings, Global Blood Therapeutics and Invitae Corp.
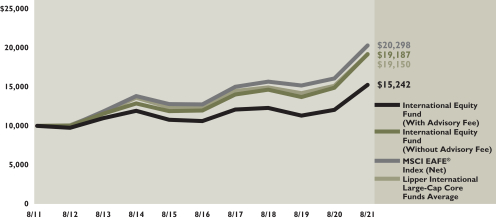
The International Equity Fund returned 28.93% compared to 26.12% for the MSCI EAFE® Index (Net) viii. The return of the Lipper International Large-Cap Core Funds Average xxiv was 26.43%. The Fund’s positioning within industrials and financials had the largest positive impact on relative performance, while the positioning within materials had a negative impact. Top contributors included Volkswagen, Banco Bilbao Vizcaya Argentaria and ING Groep, while the top detractors included Alibaba Group Holding, Sands China and Takeda Pharmaceutical.
I
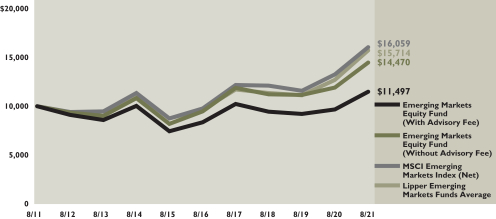
The Emerging Markets Equity Fund returned 21.28% compared to 21.12% for the MSCI Emerging Markets Index (Net) xi. The return of the Lipper Emerging Markets Funds Average xxv was 23.65%. The Fund’s positioning within financials and communication services had the largest positive impact on relative performance, while the positioning within materials and consumer staples had the largest negative impact. Top contributors included OTP Bank Nyrt, Taiwan Semiconductor Manufacturing and Samsung Electronics, while the top detractors included Tencent Holdings, Alibaba Group Holding, Ping An Insurance Group Company of China.
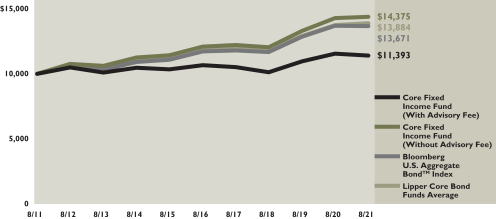
The Core Fixed Income Fund returned 0.58% compared to -0.08% for the Bloomberg U.S. Aggregate BondTM Index xv. The return of the Lipper Core Bond Funds Average xxvi was 1.11%.
The High Yield Fund returned 8.61% compared to 10.14% for the Bloomberg U.S. Corporate High Yield Bond Index xvii. The return of the Lipper High Yield Funds Average xxvii was 9.90%.
The International Fixed Income Fund returned 1.86% compared to 0.85% for the FTSE Non-USD World Government Bond Index (USD) Hedged xx. The return of the Lipper International Income Funds Average xxviii was 1.40%.
The Municipal Bond Fund returned 3.07% compared to 3.40% for the Bloomberg U.S. Municipal Bond Index xix. The return of the Lipper General & Insured Municipal Debt Funds Average xxix was 4.73%.
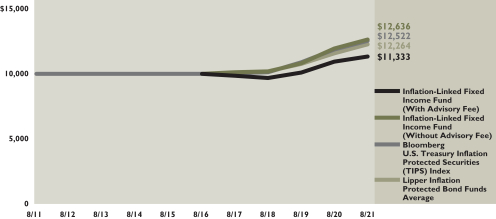
The Inflation-Linked Fixed Income Fund returned 5.87% compared to 5.56% for the Bloomberg U.S. Treasury Inflation Protected Securities (TIPS) Index xviii. The return of the Lipper Inflation Protected Bond Funds Average xxx was 6.01%.
The Ultra-Short Term Fixed Income Fund returned 0.61% compared to 0.06% for the FTSE 3-Month U.S. Treasury Bill Index xiv. The return of the Lipper Ultra-Short Obligations Funds Average xxxi was 0.63%.
The Alternative Strategies Fund returned 10.39% compared to a gain 9.10% for the HFRX Global Hedge Fund Index xxi. The return of the Lipper Alternative Multi-Strategy Funds Average xxxii was 9.37%.
Additional information regarding the investment managers of the Morgan Stanley Pathway Funds and commentary specific to each individual Sub-adviser is available in the Annual Report following this Shareholder Letter.
We thank you for your continued confidence in Morgan Stanley Wealth Management and support as shareholders of the Morgan Stanley Pathway Funds.
Sincerely,

Paul Ricciardelli
Chief Executive Officer
II
Although the statements of fact and data contained herein have been obtained from, and are based upon, sources the firm believes reliable, we do not guarantee their accuracy, and any such information may be incomplete or condensed. All opinions included in this report constitute the firm’s judgment as of the date herein, and are subject to change without notice. This material is for informational purposes only, and is not intended as an offer or solicitation with respect to the purchase or sale of any security. This report may contain forward-looking statements, and there can be no guarantee that they will come to pass. The index returns shown are preliminary and subject to change. Past performance is not a guarantee of future results.
Risk Considerations
Equity securities may fluctuate in response to news on companies, industries, market conditions, and general economic environment.
Investing in foreign markets entails risks not typically associated with domestic markets, such as currency fluctuations and controls, restrictions on foreign investments, less governmental supervision and regulation, and the potential for political instability. These risks may be magnified in countries with emerging markets and frontier markets, since these countries may have relatively unstable governments and less established markets and economies.
Investing in small- to medium-sized companies entails special risks, such as limited product lines, markets, and financial resources, and greater volatility than securities of larger, more established companies.
The value of fixed income securities will fluctuate and, upon a sale, may be worth more or less than their original cost or maturity value. Bonds are subject to interest rate risk, call risk, reinvestment risk, liquidity risk, and credit risk of the issuer.
High yield bonds (bonds rated below investment grade) may have speculative characteristics and present significant risks beyond those of other securities, including greater credit risk, price volatility, and limited liquidity in the secondary market. High yield bonds should comprise only a limited portion of a balanced portfolio.
Yields are subject to change with economic conditions. Yield is only one factor that should be considered when making an investment decision.
Asset allocation and diversification do not assure a profit or protect against loss in declining financial markets.
The indices are unmanaged. An investor cannot invest directly in an index. They are shown for illustrative purposes only and do not represent the performance of any specific investment.
Because of their narrow focus, sector investments tend to be more volatile than investments that diversify across many sectors and companies.
Growth investing does not guarantee a profit or eliminate risk. The stocks of these companies can have relatively high valuations. Because of these high valuations, an investment in a growth stock can be more risky than an investment in a company with more modest growth expectations.
Value investing does not guarantee a profit or eliminate risk. Not all companies whose stocks are considered to be value stocks are able to turn their business around or successfully employ corrective strategies which would result in stock prices that do not rise as initially expected.
III
Performance of the Morgan Stanley Pathway Funds For the Year Ended August 31, 2021†* | ||||
| Large Cap Equity Fund | 31.79 | % | ||
Russell 1000® Index (ii) | 32.25 | % | ||
| Small-Mid Cap Equity Fund | 41.14 | % | ||
Russell 2500® Index (v) | 45.87 | % | ||
| International Equity Fund | 28.93 | % | ||
MSCI EAFE® Index (Net) (viii) | 26.12 | % | ||
| Emerging Markets Equity Fund | 21.28 | % | ||
MSCI Emerging Markets Index (Net) (xi) | 21.12 | % | ||
| Core Fixed Income Fund | 0.58 | % | ||
Bloomberg U.S. Aggregate BondTM Index (xv) | -0.08 | % | ||
| High Yield Fund | 8.61 | % | ||
Bloomberg U.S. Corporate High Yield Bond Index (xvii) | 10.14 | % | ||
| International Fixed Income Fund | 1.86 | % | ||
FTSE Non-USD World Government Bond Index (USD) Hedged (xx) | 0.85 | % | ||
| Municipal Bond Fund | 3.07 | % | ||
Bloomberg U.S. Municipal Bond Index (xix) | 3.40 | % | ||
| Inflation-Linked Fixed Income Fund | 5.87 | % | ||
Bloomberg U.S. Treasury Inflation Protected Securities (TIPS) Index (xviii) | 5.56 | % | ||
| Ultra-Short Term Fixed Income Fund | 0.61 | % | ||
FTSE 3-Month U.S. Treasury Bill Index (xiv) | 0.06 | % | ||
| Alternative Strategies Fund | 10.39 | % | ||
HFRX Global Hedge Fund Index (xxi) | 9.10 | % | ||
See pages 25 through 29 for all footnotes.
IV

| ABOUTTHE SUB-ADVISERS |
• ClearBridge Investments, LLC (“ClearBridge”) |
| ClearBridge is a wholly-owned subsidiary of Legg Mason, Inc., a financial services holding company. The Portfolio Managers for the ClearBridge Large Cap Growth strategy utilize a fundamental, bottom-up research approach that emphasizes company analysis, management and stock selection. ClearBridge invests in large capitalization companies that it believes are dominant in their industries due to product, distribution or service strength. ClearBridge emphasizes individual security selection while diversifying the Fund’s investments across industries, which may help to reduce risk. ClearBridge attempts to identify established large capitalization companies with the highest growth potential, then analyze each company in detail, ranking its management, strategy and competitive market position. The Portfolio Managers pursue a collaborative approach in which both they and the research analysts propose companies with attractive business models and good long-term growth prospects for further review. The team is particularly valuation conscious, gravitating toward “controversy”, or companies that are temporarily inefficiently priced. |
• Columbia Management Investment Advisers, LLC (“Columbia”) |
| Columbia uses a combination of fundamental and quantitative analysis with risk management, including cross-correlation analysis, in identifying investment opportunities and constructing it’s portion of the Fund’s portfolio. In selecting investments, Columbia considers, among other factors: |
| · overall economic and market conditions; and |
| · the financial condition and management of a company, including its competitive position, the quality of its balance sheet and earnings, its future prospects, and the potential for growth and stock price appreciation. |
| Columbia may sell a security when the security’s price reaches a target set by Columbia; if Columbia believes that there is deterioration in the issuer’s financial circumstances or fundamental prospects; if other investments are more attractive; or for other reasons. |
• BlackRock Financial Management, Inc. (“BlackRock”) |
| BlackRock employs a “passive” management approach, attempting to invest in a portfolio |
As of August 31, 2021 the Sub-advisers for Morgan Stanley Pathway Large Cap Equity Fund (“Fund”) were BlackRock Financial Management, Inc. (“BlackRock”), Columbia Management Investment Advisers, LLC (“Columbia”), Lazard Asset Management, LLC (“Lazard”), Delaware Investments Fund Advisers (“MIM”), Lyrical Asset Management LP (“Lyrical”) and ClearBridge Investments, LLC (“ClearBridge”).
For the fiscal year ending August 31, 2021, the Fund returned 31.79% compared to 32.25% for Russell 1000® Index ii. The Fund’s positioning within information technology and industrials had the largest positive impact on relative performance while positioning within health care and financials had the largest negative impact. Top contributors included Alphabet, Facebook and Microsoft, while the top detractors included Alibaba Group Holding, Amazon and Splunk.
The Fund’s dividend yield was 1.13%, slightly less than the benchmark’s 1.23% dividend yield. The Fund’s one year forward price to earnings ratio (P/E) was 21.2, less than the benchmark which was 22.1. The estimated earnings per share growth over the next 3-5 years was 16.4%, slightly less than the benchmark’s 16.6% growth rate. The top 10 positions accounted for 21% of the Fund’s holdings and included Apple, Microsoft, Amazon, Facebook, Alphabet, Visa, NVIDIA, Adobe, and Medtronic.
During the fiscal one year period, BlackRock performed in-line with the Russell 1000® Index ii, which matched its passive mandate to track the index.
The portion of the Fund managed by Lazard underperformed their benchmark during the fiscal one year period. The top contributing sector was financials, while the largest detractor was communication services. The top five contributors were Alphabet, Medtronic, Analog Devices, Vulcan Materials and Public Storage, while the top five detractors were Electronic Arts, Dollar Tree, Baxter International, Sotera Health and LiveRamp Holdings. As of August 31, 2021, Lazard’s top ten positions represented 59% of their portfolio.
The portion of the Fund managed by MIM trailed their benchmark during the fiscal one year period. The top contributing sector was information technology, while health care was the largest detractor. The top five contributors were ConocoPhillips, American International Group, Discover Financial Services, Truist Financial and Caterpillar, while the top five detractors were Conagra Brands, Marsh & McLennan, Viatris, Merck & Co. and Fidelity National Information Services. As of August 31, 2021, MIM’s top ten positions represented 31% of their portfolio.
The portion of the Fund managed by Lyrical outperformed their benchmark during the fiscal one year period. The top contributing sector was information technology, while energy was the largest detractor. The top five contributors were Ameriprise Financial, Lincoln National, HCA Healthcare, United Rentals and Quanta Services, while the top five detractors were Lithia Motors, Qurate Retail, EOG Resources, Cigna Corp and NortonLifeLock. As of August 31, 2021, Lyrical’s top ten positions represented 46% of their portfolio.
The portion of the Fund managed by ClearBridge trailed their benchmark during the fiscal one year period. The top contributing sector was industrials, while information
1
| of assets whose performance is expected to match approximately the performance of the Russell 1000® Index. The Fund will be substantially invested in securities in the Russell 1000® Index, and will invest, under normal circumstances, at least 80% of its assets in securities or other financial instruments that are components of or have economic characteristics similar to the securities included in the Russell 1000® Index. |
• Lazard Asset Management, LLC (“Lazard”) |
| Lazard, an indirect, wholly-owned subsidiary of Lazard Ltd., is known for its global perspective on investing and years of experience with global, regional and domestic portfolios. With more than 300 investment personnel worldwide, Lazard offers investors of all types an array of equity, fixed income, and alternative investment solutions from its network of local offices in ten different countries. Its team-based approach to portfolio management helps Lazard to deliver robust and consistent performance over time, and strong client relationships allow them to understand how to employ their capabilities to its clients’ advantage. Lazard manages an all cap, concentrated strategy designed to leverage the best collection of ideas from the U.S. Equity team. It is benchmark-agnostic, seeking to outperform any broad-based market index (i.e., S&P 500® Index, Russell 1000® Index, Russell 3000® Index) by investing in companies that compound earnings and capital and by taking advantage of valuation anomalies. |
• Delaware Investments Fund Advisers, a member of Macquarie Investment Management Business Trust (“MIM”) |
| MIM will invest under normal circumstances, at least 80% of its net assets, plus the amount of any borrowings for investment purposes, in securities of large-capitalization companies. MIM invests primarily in securities of largecapitalization companies that the Manager believes have long-term capital appreciation potential. MIM currently defines large-capitalization stocks as those with market capitalizations of $5 billion or greater at the time of purchase. Typically, the Manager seeks to select securities that it believes are undervalued in relation to their intrinsic value, as indicated by multiple factors, including the earnings and cash flow potential or the asset value of the respective issuers. The Manager also considers a company’s plans for future operations on a selective basis. The Manager may sell a security if it no longer believes the security will contribute to meeting the investment objective of the Fund. |
• Lyrical Asset Management LP (“Lyrical”) |
| Lyrical employs a deep value style with a high quality focus. Lyrical employs a value investing philosophy and believes that a portfolio of companies with low valuations relative to their long-term normalized earnings power will outperform the overall market over time and unlike some traditional value investors who |
technology was their largest detractor. The top five contributors were Facebook, UnitedHealth Group, NVIDIA, Microsoft and Palo Alto Networks, while the top five detractors were Alibaba Group Holding, Amazon, Amgen, Splunk and Fidelity National Information Services. As of August 31, 2021, ClearBridge’s top ten positions represented 46% of their portfolio.
The portion of the Fund managed by Columbia outperformed their benchmark during the fiscal one year period. Positioning was strongest within health care and weakest within consumer discretionary. The top five contributors were Nike, MSCI Inc. Align Technology, NVIDIA and Applied Materials, while the top five detractors were Alibaba Group Holding, Chewy, Inc., Sarepta Therapeutics, Splunk and RingCentral. As of August 31, 2021, Columbia’s top ten positons represented 42% of their portfolio.
2
| are willing to own any business at the right price, Lyrical’s philosophy is to invest only in businesses that it believes are of good quality. Lyrical invests only in the common stock of companies within its investable universe, which is the top 1,000 U.S. listed stocks by market capitalization. |
The following graph depicts the performance of the Russell 1000® Indexii vs. the Lipper Large-Cap Core Funds Averagexxii
HISTORICAL PERFORMANCE FOR THE TEN-YEAR PERIOD ENDED AUGUST 31, 2021 LARGE CAP EQUITY FUND Comparison of $10,000 Investment in the Fund with the Russell 1000® Index |
The performance shown above and below represents past performance. Past performance is no guarantee of future results and current performance may be higher or lower than the performance shown above and below. Performance figures may reflect voluntary fee waivers and/or expense reimbursements. In the absence of voluntary fee waivers and/or expense reimbursements, the total return would have been lower. Principal value and investment returns will fluctuate and investors’ shares, when redeemed, may be worth more or less than their original cost. To obtain performance data current to the most recent month-end, please visit our website at www.morganstanley.com/wealth-investmentsolutions/cgcm.
The graph above and returns shown below do not reflect the deduction of taxes that a shareholder would pay on fund distributions or the redemption of fund shares.
LARGE CAP EQUITY FUND Average Annual Total Returns for the Period Ended August 31, 2021† | |||||||||||||||||||||||
| Without Annual Advisory Program Fee | With Annual Advisory Program Fee* | Russell 1000® Index** | Lipper Large-Cap Core Funds Average** | ||||||||||||||||||||
| Since inception 11/18/1991 | 9.44 | % | 7.28 | % | 10.92 | % | 10.31 | % | |||||||||||||||
| 10 years | 15.10 | 12.87 | 16.40 | 14.99 | |||||||||||||||||||
| 5 years | 16.53 | 14.29 | 18.24 | 16.81 | |||||||||||||||||||
| 3 years | 16.64 | 14.43 | 18.42 | 17.01 | |||||||||||||||||||
| 1 year | 31.79 | 29.23 | 32.25 | 30.42 | |||||||||||||||||||
See pages 25 through 29 for all footnotes.
3
| ABOUTTHE SUB-ADVISERS |
• Neuberger Berman Investment Advisers LLC (“Neuberger”) |
| Neuberger employs in-depth research to identify out-of-favor small cap companies selling at a significant discount to intrinsic value, where there is a dynamic plan or event that is expected to both enhance value and narrow the price/value gap. Neuberger’s analysts seek to invest when there is a true disconnect between reality and market perception — something that occurs regularly in particular types of companies. For example, we believe the market tends to demonstrate inefficiency in pricing companies with complex corporate structures since many investors will not take the time to understand them. Neuberger’s valuation approach resembles the due diligence effort that Neuberger’s a private equity firm might employ to evaluate the purchase of an entire company. Neuberger’s analysts also focus on investing in businesses where management has a significant ownership stake as, in our view, such companies tend to be more aligned with shareholders’ interests. |
• Westfield Capital Management Company, L.P. (“Westfield”) |
| Westfield favors investing in earnings growth stocks given a conviction that stock prices follow earnings progress and that they offer the best opportunity for superior real rates of return. Reasonably priced stocks of companies with high foreseen earnings potential are best identified through in-depth, fundamental research. It is Westfield’s belief that the small capitalization portion of the market is under-researched, and therefore less efficient, than the large capitalization sector. |
• BlackRock Financial Management, Inc. (“BlackRock”) |
| BlackRock Financial Management, Inc. employs a “passive” management approach, attempting to invest in a portfolio of assets whose performance is expected to match approximately the performance of the Russell 2500® Index. The Fund will be substantially invested in securities in the Russell 2500® Index, and will invest, under normal circumstances, at least 80% of its assets in securities or other financial instruments that are components of or have economic characteristics similar to the securities included in the Russell 2500® Index. |
As of August 31, 2021, the Sub-advisers for the Morgan Stanley Pathway Small-Mid Cap Equity (“Fund”) were BlackRock Financial Management, Inc. (“BlackRock”), Aristotle Capital Boston, LLC (“Aristotle”), D.F. Dent & Company, Inc. (“DF Dent”), Neuberger Berman Investment Advisers LLC (“Neuberger”), Nuance Invesments, LLC (“Nuance”), Westfield Capital Management Company, L.P. (“Westfield”).
For the fiscal year ending August 31, 2021, the Fund returned 41.14% compared to 45.87% for Russell 2500® Index v. The Fund’s positioning within materials and communication services had the largest positive impact on relative performance while positioning within health care and consumer discretionary had the largest negative impact. Top contributors included Charles River Laboratories International, Acadia Healthcare Company and Bio-Techne, while the top detractors included Palomar Holdings, Global Blood Therapeutics and Invitae Corp.
The Fund’s dividend yield was 0.85%, less than the benchmark’s 1.02% yield. The Fund’s forward P/E was 19.1, higher than the benchmark which was 17.1. The estimated earnings per share growth over the next 3-5 years was 16.3%, slightly less than the benchmark’s 16.5% growth rate. The top 10 positons accounted for 6% of the Fund’s holdings and included Charles River Laboratories International, Beiersdorf AG, Travelers Companies, Equity Commonwealth, Sanderson Farms, Baxter International, SBA Communications, Bio-Techne, Cable One and Smith & Nephew PLC.
During the fiscal one year period, BlackRock performed in-line with the Russell 2500® Index v, which matched its passive mandate to track the index.
The portion of the Fund managed by Neuberger outperformed their benchmark during the fiscal one year period. Their positioning was strongest in industrials and weakest in information technology. The top five contributors were Criteo SA, Charles River Laboratories International, Resideo Technologies, Nuance Communications and Avery Dennison, while the top five detractors were Dril-Quip, Fluidigm Corp., Mercury Systems, Ciena Corp and Quantum Corp. As of August 31, 2021, Neuberger’s top ten positions represented 26% of their portfolio.
The portion of the Fund managed by Westfield outperformed their benchmark during the fiscal one year period. Their positioning was strongest in information technology and weakest in health care. The top five contributors were MyoKardia, Advanced Drainage Systems, Nuance Communications, Silicon Motion Technology and NCR Corp., while the top five detractors were Palomar Holdings, Invitae Corp, Global Blood Therapeutics, Mersana Therapeutics and Amedisys. As of August 31, 2021, Westfield’s top ten positions represented 24% of their portfolio.
The portion of the Fund managed by Aristotle trailed their benchmark during the fiscal one year period. Their positioning was strongest in financials and weakest in industrials. The top five contributors were Signature Bank, Charles River Laboratories International, Acadia Healthcare Company, MACOM Technology Solutions Holdings and Kraton Corp. while the top five detractors were eHealth, Chemed, PetIQ, Bottomline Technologies and Alamos Gold. As of August 31, 2021, Aristotle’s top ten positions represented 19% of their portfolio.
4
• D.F. Dent & Company, Inc (“DF Dent”) |
| DF Dent employs a bottom-up, fundamental process that seeks companies that are consistent growers, have strong management and are unrecognized and under-researched. The strategy looks for companies with above-average EPS growth expectations, high returns on investment, sustainable free cash flow growth, a competitive advantage and attractive relative valuations. |
• Nuance Investments, LLC (“Nuance”) |
| Nuance seeks to invest in companies with leading and sustainable market share positions and above-average financial strength that are trading at discounts to Nuance’s calculation of intrinsic value. Through analysis of companies’ financial statements, management strategy, and competitive positioning, Nuance attempts to provide excess returns over time. |
• Aristotle Capital Boston, LLC (“Aristotle”) |
| Aristotle seeks to deliver a diversified, high quality portfolio that can deliver attractive risk-adjusted results primarily driven by stock selection. They focus on companies they believe have low expectations, can create shareholder value, and have high potential for improved growth and profitability. |
The portion of the Fund managed by DF Dent underperformed their benchmark during the fiscal one year period. Positioning was strongest in real estate and weakest in information technology. The top five contributors were Bio-Techne, Brooks Automation, BlackLine, Vulcan Materials and CBRE Group, while the top five detractors were Teleflex, WillScot Mobile Mini Holdings, Black Knight, Envestnet and Coupa Software. As of August 31, 2021, DF Dent’s top ten positions represented 41% of their portfolio.
The portion of the Fund managed by Nuance underperformed their benchmark during the fiscal one year period. Positioning was strongest in industrials and weakest in health care. The top five contributors were Sanderson Farms, Travelers Companies, Northern Trust, Chubb Limited and Dentsply Sirona, while the top five detractors were Cal-Maine Foods, Baxter International, Zimmer Biomet Holdings, Smith & Nephew PLC and Equity Commonwealth. As of August 31, 2021, Nuance’s top ten positions represented 45% of their portfolio.
5
The following graph depicts performance of the Russell 2500® Indexv vs. the Lipper Small-Cap Core Funds Averagexxiii
HISTORICAL PERFORMANCE FOR THE TEN-YEAR PERIOD ENDED AUGUST 31, 2021 SMALL-MID CAP EQUITY FUND Comparison of $10,000 Investment in the Fund with the Russell 2500® Index |
The performance shown above and below represents past performance. Past performance is no guarantee of future results and current performance may be higher or lower than the performance shown above and below. Performance figures may reflect voluntary fee waivers and/or expense reimbursements. In the absence of voluntary fee waivers and/or expense reimbursements, the total return would have been lower. Principal value and investment returns will fluctuate and investors’ shares, when redeemed, may be worth more or less than their original cost. To obtain performance data current to the most recent month-end, please visit our website at www.morganstanley.com/wealth-investmentsolutions/cgcm.
The graph above and returns shown below do not reflect the deduction of taxes that a shareholder would pay on fund distributions or the redemption of fund shares.
SMALL-MID CAP EQUITY FUND Average Annual Total Returns for the Period Ended August 31, 2021† | |||||||||||||||||||||||
| Without Annual Advisory Program Fee | With Annual Advisory Program Fee* | Russell 2500® Index** | Lipper Small-Cap Core Funds Average** | ||||||||||||||||||||
| Since inception 11/18/1991 | 9.86 | % | 7.68 | % | 11.48 | % | 10.96 | % | |||||||||||||||
| 10 years | 12.99 | 10.78 | 14.32 | 12.33 | |||||||||||||||||||
| 5 years | 15.02 | 12.81 | 15.10 | 12.10 | |||||||||||||||||||
| 3 years | 12.91 | 10.76 | 13.09 | 9.11 | |||||||||||||||||||
| 1 year | 41.14 | 38.42 | 45.87 | 49.50 | |||||||||||||||||||
See pages 25 through 29 for all footnotes.
6
| ABOUTTHE SUB-ADVISERS |
• Victory Capital Management, Inc. (“Victory Capital”) |
| Victory Capital’s investment franchise, Trivalent Investments, employs a bottom-up investment approach that emphasizes individual stock selection. The investment process uses a combination of quantitative and traditional qualitative, fundamental analysis to identify stocks with low relative price multiples and positive trends in earnings forecasts. The stock selection process is designed to produce a diversified portfolio that, relative to the S&P Developed ex-U.S. Small Cap Index, tends to have a below average price-to-earnings ratio and an above average earnings growth trend. |
• Causeway Capital Management LLC (“Causeway”) |
| Causeway’s international developed market investment philosophy is based on a long-term value strategy and the investment team applies an active, bottom-up, research-intensive approach towards stock selection. Causeway’s investment approach seeks to identify under-priced stocks of high quality companies believed to be exhibiting superior financial strength as compared to peers. In addition to fundamental analysis, quantitative research is considered an integral part of the process and is used for screenings of investment candidates as well as risk management. Portfolio managers work as a team to make investment decisions and are supported by the firm’s dedicated fundamental and quantitative research analysts. Analysts and portfolio managers are assigned global industryspecific research responsibilities. Fundamental research is further organized into six research clusters: financials/materials, consumer, industrial/ manufacturing, energy, technology and health care. Causeway’s unconstrained, international established market value equity approach invests in a variety of market capitalization ranges, but primarily in large- and midcapitalization non-U.S. developed market companies. Causeway can also invest in smallcap issues and less developed emerging markets. Value-driven security characteristics may include low price/earnings ratio, low price/ book ratio, low price/cash flow ratio and high dividend yield, but may also include outof- favor companies that may have high rates of growth of earnings. Sector and regional weights are byproducts of the investment process. |
As of August 31, 2021, the Sub-advisers for the Morgan Stanley Pathway International Equity Fund (“Fund”) were BlackRock Financial Management Inc. (“BlackRock”), Causeway Capital Management, LLC (“Causeway”), Schroders Investment Management North America, Inc. (“Schroders”), Victory Capital Management Inc. (“Victory Capital”) and Walter Scott & Partners Limited (“Walter Scott”).
For the fiscal year ending August 31, 2021, the Fund returned 28.93% compared to 26.12% for the MSCI EAFE® Index (Net) viii. The Fund’s positioning within industrials and financials had the largest positive impact on relative performance, while the positioning within materials had a negative impact. Top contributors included Volkswagen, Banco Bilbao Vizcaya Argentaria and ING Groep, while the top detractors included Alibaba Group Holding, Sands China and Takeda Pharmaceutical.
The Fund’s holdings offered a dividend yield of 2.1% compared to the benchmark of 2.3%. On a valuation basis, the Fund’s forward P/E was 16.5, slightly less than the benchmark which was 15.8. The estimated earnings per share growth over the next 3-5 years was 18.1%, compared to the benchmark of 16.6%. The top ten individual positions by weight accounted for 14% of the Fund and included Roche Holdings, Novartis AG, SAP SE, ASML Holdings, Nestle, Murata Manufacturing, AstraZeneca, Rolls-Royce Holdings, TotalEnergies SE and Sanofi.
During the fiscal one-year period ending August 31, 2021, BlackRock performed in-line with the MSCI EAFE® Index (Net) viii, which matched its passive mandate to track the index.
The portion of the Fund managed by Causeway outperformed their benchmark during the fiscal one-year period. Overall positioning was strongest in financials and weakest in health care. The top five positions contributing to performance included Volkswagen, Banco Bilbao Vizcaya Argentaria, ING Groep, Rolls-Royce Holdings and Samsung Electronics, while the top detractors included Sands China, Takeda Pharmaceutical, Bayer AG and Alstom SA. As of August 31, 2021, Causeway’s top ten positions represented 31% of their portfolio.
The portion of the Fund managed by Schroders outperformed their benchmark during the fiscal one year period. Overall positioning was strongest in information technology and weakest in financials. The top five positions contributing to performance were Compagnie Financiere Richemont, Royal Dutch Shell Plc, Banco Bilbao Vizcaya Argentaria, Schneider Electric and ASML Holding, while the top five detractors included Alibaba Group Holding, Reckitt Benckiser Group, Santen Pharmaceutical, Alstom and SAP SE. As of August 31, 2021, Schroders’ top ten positions represented 22% of their portfolio.
The portion of the Fund managed by Victory Capital underperformed their benchmark during the fiscal one year period. Overall positioning was strongest in communication services and weakest in materials. The top five positions contributing to performance included InMode, Osstem Implant, BayCurrent Consulting, TFI International and ASM International, while the top five detractors included Seegene, United Laboratories International, Silver Lake Resources, Centamin PLC and Real Matters. As of August 31, 2021, Victory Capital’s top ten positions represented 11% of their portfolio.
7
• BlackRock Financial Management, Inc. (“BlackRock”) |
| BlackRock Financial Management, Inc. employs a “passive” management approach, attempting to invest in a portfolio of assets whose performance is expected to match approximately the performance of the MSCI EAFE® Index (Net). The Fund will be substantially invested in securities in the MSCI EAFE® Index (Net), and will invest, under normal circumstances, at least 80% of its assets in securities or other financial instruments that are components of or have economic characteristics similar to the securities included in the MSCI EAFE® Index (Net). |
• Schroder Investment Management North America, Inc. (“Schroders”) |
| Schroders uses a bottom-up growth oriented approach towards stock selection and employs a fundamental, research driven process to identify quality growth companies with attractive medium-term growth and valuation, quality management and financial position, and a sustainable competitive advantage. Schroders “best ideas” portfolio blends both core and opportunistic holdings. |
• Walter Scott & Partners Limited (“Walter Scott”) |
| Walter Scott is considered growth-oriented strategy focusing on long-term high-quality growth companies. The root of the process lies with the team’s ability to identify companies capable of sustaining what it believes are exceptional rates of internal and external wealth generation through intensive fundamental research. Portfolio shape is a result of stock selection in high-conviction businesses with a long-term time horizon. |
Walter Scott began managing their portion of the portfolio on March 22, 2021. Since their inception through fiscal year-end they outperformed their benchmark. Overall positioning was strongest in health care and weakest in real estate. The top five positions contributing to performance included Novo Nordisk A/S, Hoya Corp., ASML Holdings, Keyence and Dassault Systemes, while the top five detractors included Alibaba Group Holding, Flutter Entertainment, Reckitt Benckiser Group, Jardine Matheson Holdings and Fanuc Corp. As of August 31, 2021, Walter Scott’s top ten positions represented 26% of their portfolio.
8
The following graph depicts the performance of MSCI EAFE® Index (Net)viii vs. the Lipper International Large-Cap Core Funds Averagexxiv
HISTORICAL PERFORMANCE FOR THE TEN-YEAR PERIOD ENDED AUGUST 31, 2021 INTERNATIONAL EQUITY FUND Comparison of $10,000 Investment in the Fund with the Morgan Stanley Capital International Europe, Australasia, Far |
The performance shown above and below represents past performance. Past performance is no guarantee of future results and current performance may be higher or lower than the performance shown above and below. Performance figures may reflect voluntary fee waivers and/or expense reimbursements. In the absence of voluntary fee waivers and/or expense reimbursements, the total return would have been lower. Principal value and investment returns will fluctuate and investors’ shares, when redeemed, may be worth more or less than their original cost. To obtain performance data current to the most recent month-end, please visit our website at www.morganstanley.com/wealth-investmentsolutions/cgcm.
The graph above and returns shown below do not reflect the deduction of taxes that a shareholder would pay on fund distributions or the redemption of fund shares.
INTERNATIONAL EQUITY FUND Average Annual Total Returns for the Period Ended August 31, 2021† | |||||||||||||||||||||||
| Without Annual Advisory Program Fee | With Annual Advisory Program Fee* | MSCI EAFE® Index (Net)** | Lipper International Large-Cap Core Funds Average** | ||||||||||||||||||||
| Since inception 11/18/1991 | 5.82 | % | 3.73 | % | 5.48 | % | 6.20 | % | |||||||||||||||
| 10 years | 6.73 | 4.67 | 7.34 | 6.48 | |||||||||||||||||||
| 5 years | 9.86 | 7.75 | 9.72 | 9.01 | |||||||||||||||||||
| 3 years | 9.47 | 7.39 | 9.00 | 8.76 | |||||||||||||||||||
| 1 year | 28.93 | 26.42 | 26.12 | 26.43 | |||||||||||||||||||
See pages 25 through 29 for all footnotes.
9
| ABOUTTHE SUB-ADVISERS |
• Van Eck Associates Corporation (“VanEck”) |
| VanEck is privately held global asset management firm founded in 1955. VanEck’s mission is to develop and offer investors forward-looking, intelligently designed investment strategies that strengthen a long-term portfolio. VanEck’s Emerging Markets Equity Strategy (“Strategy”) seeks long-term competitive risk-adjusted returns through investments that demonstrate structural growth at a reasonable price. The Strategy seeks to uncover structural growth opportunities wherever they exist within emerging markets, and employs a fundamentally driven stock selection and research process with the flexibility to invest across the market capitalization spectrum. |
• BlackRock Financial Management, Inc. (“BlackRock”) |
| BlackRock Financial Management, Inc. employs a “passive” management approach, attempting to invest in a portfolio of assets whose performance is expected to match approximately the performance of the MSCI Emerging Market Index (Net). The Fund will be substantially invested in securities in the MSCI Emerging Market Index (Net), and will invest, under normal circumstances, at least 80% of its assets in securities or other financial instruments that are components of or have economic characteristics similar to the securities included in the MSCI Emerging Market Index (Net). |
• Lazard Asset Management LLC (“Lazard”) |
| Lazard, an indirect, wholly-owned subsidiary of Lazard Ltd., is known for its global perspective on investing and years of experience with global, regional and domestic portfolios. With more than 300 investment personnel worldwide, Lazard offers investors of all types an array of equity, fixed income, and alternative investment solutions from its network of local offices in ten different countries. Its team-based approach to portfolio management helps Lazard to deliver robust and consistent performance over time, and strong client relationships allow them to understand how to employ their capabilities to its clients’ advantage. |
| Lazard manages a relative value strategy (“Value Strategy”) and invests primarily in equity securities, principally common stocks, of non-U.S. companies whose principal activities are located in emerging or developing market countries. In the Value |
As of August 31, 2021, the Sub-advisers for the Morgan Stanley Pathway Emerging Markets Equity Fund (“Fund”) were BlackRock Financial Management, Inc. (“BlackRock”), Van Eck Associates Corporation (“VanEck”), Lazard Asset Management, LLC (“Lazard”) and Martin Currie Inc. (“Martin Currie”).
For the fiscal year ending August 31, 2021, the Fund returned 21.28% compared to 21.12% for the MSCI Emerging Markets Index (Net) xi. The Fund’s positioning within financials and communication services had the largest positive impact on relative performance, while the positioning within materials and consumer staples had the largest negative impact. Top contributors included OTP Bank Nyrt, Taiwan Semiconductor Manufacturing and Samsung Electronics, while the top detractors included Tencent Holdings, Alibaba Group Holding, Ping An Insurance Group Company of China.
The Fund’s holdings offered a dividend yield of 1.9%, less than the MSCI Emerging Market’s Index (Net) xi yield of 2.0%. On a valuation basis, the Fund’s forward P/E was 13.7 compared to the benchmark which was 12.7. The estimated earnings per share growth over the next 3-5 years was 19.5%, compared to the benchmark of 17.6%. The top ten individual positions by weight accounted for 24% of the Fund and included Samsung Electronics, Tencent Holdings, Taiwan Semiconductor Manufacturing, Alibaba Group Holding, Reliance Industries, Meituan, OTP Bank Nyrt and LG Chem.
For the fiscal year ending August 31, 2021 BlackRock performed in-line with the MSCI Emerging Markets Index (Net) xi, which matched its passive mandate to track the index.
The portion of the Fund managed by VanEck underperformed their benchmark during the fiscal one year period. Overall positioning was strongest in financials and weakest in information technology. The top five positions contributing to performance included Sea Ltd., Transaction Capital, Cholamandalam Investment and Finance Co., Wuxi Biologics Inc. and Samsung SDI, Co., while the top five detractors included Alibaba Group Holding, New Oriental Education & Technology Group, Alibaba Health Information Technology, OneConnect Financial Technology Co. and A-Living Smart City Services. As of August 31, 2021, VanEck’s top ten positions represented 30% of their portfolio.
The portion of the Fund managed by Lazard outperformed their benchmark during the fiscal one year period. Overall positioning was strongest in consumer discretionary and weakest in consumer staples. The top five positions contributing to performance included Baidu Inc., OTP Bank Nyrt, China Merchants Bank, Samsung Electronics and SK Hynix, while the top five detractors included China Mobile Limited, Hengan International group, Ping An Insurance Group Company of China, CRRC Corp. and Anhui Conch Cement. As of August 31, 2021, Lazard’s top ten positions represented 27% of their portfolio.
Martin Currie began managing their portion of the portfolio on March 22, 2021. Since their inception through fiscal year-end they underperformed their benchmark. Overall positioning was strongest in information technology and weakest in financials. The top five positions contributing to performance included Titan
10
| Strategy, assets are invested in companies that are believed to be undervalued based on their earnings, cash flow or asset values. Lazard’s approach consists of an analytical framework, accounting validation, fundamental analysis and portfolio construction parameters and its selection process focuses on growth and considers the sustainability of growth and the tradeoff between valuation and growth. |
• Martin Currie Inc. (“Martin Currie”) |
Martin Currie is a core active strategy that strives to identify mispriced businesses through fundamental research. Martin Currie seeks high-quality companies with strong growth opportunities while employing a disciplined approach to valuation. The strategy has a long-term investment horizon focusing on stock selection that drives its sector/country allocations. |
The following graph depicts the performance of MSCI Emerging Markets Index (Net)xi vs. the Lipper Emerging Markets Funds Averagexxv
Company Limited, OTP Bank Nyrt, Shanghai Fosun Pharmaceutical, EPAM Systems and Taiwan Semiconductor Manufacturing, while the top five detractors included Tencent Holdings, Alibaba Group Holding, Meituan, Ping An Insurance Group Company of China and Samsung Electronics. As of August 31, 2021, Martin Curre’s top ten positions represented 45% of their portfolio.
HISTORICAL PERFORMANCE FOR THE TEN-YEAR PERIOD ENDED AUGUST 31, 2021 EMERGING MARKETS EQUITY FUND Comparison of $10,000 Investment in the Fund with the MSCI Emerging Markets Index |
The performance shown above and below represents past performance. Past performance is no guarantee of future results and current performance may be higher or lower than the performance shown above and below. Performance figures may reflect voluntary fee waivers and/or expense reimbursements. In the absence of voluntary fee waivers and/or expense reimbursements, the total return would have been lower. Principal value and investment returns will fluctuate and investors’ shares, when redeemed, may be worth more or less than their original cost. To obtain performance data current to the most recent month-end, please visit our website at www.morganstanley.com/wealth-investmentsolutions/cgcm.
The graph above and returns shown below do not reflect the deduction of taxes that a shareholder would pay on fund distributions or the redemption of fund shares.
EMERGING MARKETS EQUITY FUND Average Annual Total Returns for the Period Ended August 31, 2021† | |||||||||||||||||||||||
| Without Annual Advisory Program Fee | With Annual Advisory Program Fee* | MSCI Emerging Markets Index (Net)** | Lipper Emerging Markets Funds Average** | ||||||||||||||||||||
| Since inception 4/20/1994 | 5.17 | % | 3.11 | % | N/A | 6.63 | % | ||||||||||||||||
| 10 years | 3.76 | 1.76 | 4.85 | % | 5.32 | ||||||||||||||||||
| 5 years | 8.85 | 6.76 | 10.40 | 10.77 | |||||||||||||||||||
| 3 years | 8.86 | 6.77 | 9.87 | 11.81 | |||||||||||||||||||
| 1 year | 21.28 | 18.92 | 21.12 | 23.65 | |||||||||||||||||||
See pages 25 through 29 for all footnotes.
11
| ABOUTTHE SUB-ADVISERS |
• Metropolitan West Asset Management LLC (“MetWest”) |
| MetWest seeks to achieve consistent outperformance through the measured and diversified application of five fixed income management strategies, including: (i) duration management; (ii) yield curve positioning; (iii) sector allocation; (iv) security selection; and (v) opportunistic execution. Predicated on a long-term economic outlook, MetWest employs a value-oriented approach to managing fixed income that recognizes the periodic inefficient nature of over-the-counter markets and the mean-reverting characteristics of the investable universe. |
• Western Asset Management Company (“Western”) |
| Western combines traditional analysis with innovative technology applied to all sectors of the market. Western believes inefficiencies exist in the fixed-income market and attempts to add incremental value by exploiting these inefficiencies across all eligible market sectors. The key areas of focus are: (i) sector and subsector allocation; (ii) issue selection; (iii) duration; and (iv) term structure. |
• BlackRock Financial Management, Inc. (“BlackRock”) |
| BlackRock’s Customized Core strategy employs a fundamental, diversified, relativevalue approach that seeks alpha by strategically allocating among three alpha sources — macro strategies, sector allocation and security selection — based on best and highest information ratio ideas, and aims to provide superior long-term performance relative to the benchmark index by creating a diversified portfolio of investment grade securities. A disciplined and risk-budgeted risk management framework which consists of determining interest rate risk, yield curve risk, cash flow risk, credit risk and liquidity risk of all securities. |
As of August 31, 2021, the Sub-advisers for the Morgan Stanley Pathway Core Fixed Income Fund (“Fund”) were Metropolitan West Asset Management, LLC (“MetWest”), Western Asset Management Company (“Western”) and BlackRock Financial Management, Inc. (“BlackRock”).
For the fiscal year ending August 31, 2021, the Fund returned 0.58% compared to -0.08% for the Bloomberg U.S. Aggregate BondTM Indexxv. The return of the Lipper Core Bond Funds Average xxvi was 1.11%.
The portion of the Fund managed by MetWest outperformed the benchmark during the fiscal one year period. Outperformance was bolstered by credit issue selection amid the spread compression, particularly among those selected within finance companies, municipals, high yield, and emerging market debt with these sectors performing well during this timeframe. Modestly holding back returns, however, was a defensive credit positioning, as those with more market risk such as energy and cyclicals were among frontrunners in the Index. Delivering an additional boost to returns was issue selection among residential mortgage-backed securities (MBS), with legacy non-agency issues benefiting from a strong housing backdrop characterized by scant home supply, strong consumer demand given low rates, and double-digit house price appreciation. And, the bias for production (low) coupon TBAs in the agency MBS space further contributed owing to significant Fed sponsorship, though a small drag came from an overweight to agency MBS due to tapering concerns toward the latter part of the period. Meanwhile, commercial mortgage-backed securities (CMBS) and asset-backed securities (ABS) added on the margin, as fundamentals continued to improve amid favorable government support (including stimulus money to Americans that stoked spending) and sponsorship for these sectors remained robust in light of investor’s reach for yield. Finally, portfolio’s short duration profile further rewarded portfolio’s relative returns against the higher rate environment.
The portion of the Fund managed BlackRock outperformed the benchmark during the fiscal one year period. The relative outperformance was spread across a diverse set of factors. The main contributors to performance were positioning within credit, securitized asset positioning and yield curve positioning. The portfolio generally held an overweight position across spread sectors given the attractive valuations alongside support in the form of both fiscal and monetary policy. This benefitted performance as most spread sectors continued to recover late last year and continued to tighten in 2021 as the economy reopened. The portfolio had an underweight to duration but also held a flattening bias later in the period which contributed to performance. Modestly offsetting this was the portfolio’s agency mortgage and investment grade credit selection.
The portion of the Fund managed by Western outperformed the benchmark during the fiscal one year period. Yield Curve Positioning contributed to performance as the yield curve modestly flattened. Corporate bond exposure, including both investment-grade and high-yield credit, was largest contributor to performance. The Fund’s overweight position benefitted as investment-grade and high-yield credit spreads tightened during the 12-month period. Emerging Markets Debt also contributed, driven by tighter spreads for USD-denominated sovereigns and corporates as well as local currency positions as EM currencies largely strengthened against the U.S. dollar. Structured product positions, in aggregate, also added to
12
The following graph depicts the performance of Bloomberg U.S. Aggregate BondTM Indexxv vs. the Lipper Core Bond Funds Averagexxvi
performance as spreads generally tightened for the structured sectors, including non-agency RMBS, CMBS and ABS. TIPS exposures were positive for performance as break-even inflation rates rose. Developed Non-U.S. positions were also additive as rates exposures proved beneficial and currency positions modestly strengthened against the U.S. Dollar. Duration Positioning was the main detractor to performance. The Fund’s overweight duration positioning focused on the back end of the yield curve detracted as rates increased during the 12-month period.
HISTORICAL PERFORMANCE FOR THE TEN-YEAR PERIOD ENDED AUGUST 31, 2021 CORE FIXED INCOME FUND Comparison of $10,000 Investment in the Fund with the Bloomberg U.S. Aggregate BondTM |
The performance shown above and below represents past performance. Past performance is no guarantee of future results and current performance may be higher or lower than the performance shown above and below. Performance figures may reflect voluntary fee waivers and/or expense reimbursements. In the absence of voluntary fee waivers and/or expense reimbursements, the total return would have been lower. Principal value and investment returns will fluctuate and investors’ shares, when redeemed, may be worth more or less than their original cost. To obtain performance data current to the most recent month-end, please visit our website at www.morganstanley.com/wealth-investmentsolutions/cgcm.
The graph above and returns shown below do not reflect the deduction of taxes that a shareholder would pay on fund distributions or the redemption of fund shares.
CORE FIXED INCOME FUND Average Annual Total Returns for the Period Ended August 31, 2021† | |||||||||||||||||||||||
| Without Annual Advisory Program Fee | With Annual Advisory Program Fee* | Bloomberg U.S. Aggregate BondTM Index** | Lipper Bond | ||||||||||||||||||||
| Since inception 11/18/1991 | 5.30 | % | 3.22 | % | 5.48 | % | 5.40 | % | |||||||||||||||
| 10 years | 3.70 | 1.67 | 3.18 | 3.39 | |||||||||||||||||||
| 5 years | 3.53 | 1.52 | 3.11 | 3.32 | |||||||||||||||||||
| 3 years | 6.06 | 4.04 | 5.43 | 5.64 | |||||||||||||||||||
| 1 year | 0.58 | -1.41 | -0.08 | 1.11 | |||||||||||||||||||
See pages 25 through 29 for all footnotes.
13
| ABOUTTHE SUB-ADVISERS |
• Western Asset Management Company (“Western”) |
| Western combines traditional analysis with innovative technology applied to all sectors of the market. Western believes inefficiencies exist in the fixed-income market and attempts to add incremental value by exploiting these inefficiencies across all eligible market sectors. The key areas of focus are: (i) sector and subsector allocation; (ii) issue selection; (iii) duration; and (iv) term structure. |
• PineBridge Investments LLC (“PineBridge”) |
| PineBridge is a strategy seeking total return through a combination of high current income and capital appreciation. The strategy focuses on security selection to drive excess return and is generally overweight the higher quality segment of the high yield market. |
As of August 31, 2021, the Sub-advisers for the Morgan Stanley Pathway High Yield Fund (“Fund”) were Western Asset Management Company (“Western”) and PineBridge Investments LLC (“PineBridge”).
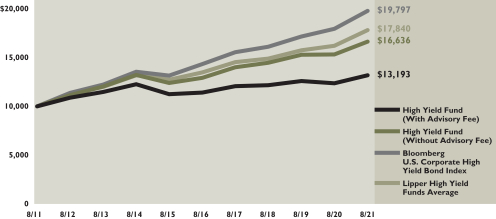
For the fiscal year ending August 31, 2021, the Fund returned 8.61% compared to its benchmark, the Bloomberg U.S. Corporate High Yield Bond Index xvii which returned 10.14%.
The portion of the Fund managed by Western outperformed the benchmark during the fiscal one year period. Asset class allocation detracted from relative performance largely due to opportunistic exposure to bank loans and collateralized loan obligations (CLOs), which generally underperformed high yield during the period. Rating positioning detracted from relative performance given the strategy’s underweight to outperforming cash conversion cycles (CCCs). Industry allocations was a contributor to relative performance largely due to the overweight to the outperforming banking and transportation sectors. Issue selection was the largest contributor during the period due to issuer tilts within the energy and technology sectors.
PineBridge began managing their portion of the portfolio on February 24, 2021. Since inception through fiscal year-end the portfolio performed in-line with their benchmark. The Portfolio benefitted from sector selection during the period including having an overweight to energy, which continues to be the top performing sector in 2021. Security selection detracted from performance mostly due to the impact of an underweight to the highest beta credits in the energy space. Outside of energy, the portfolio benefitted from credit selections in real estate investment trusts (REITS), capital goods and transportation while consumer cyclical credits detracted. Energy was volatile during the period and the contribution to return in the sector was neutral overall; the asset allocation contribution of our overweight position was offset by negative security selection due to a higher quality bias in our holdings vs. benchmark. Away from these outliers we saw neutral to positive contributions across a majority of sectors due to security selection.
14
The following graph depicts the performance of the Bloomberg U.S. Corporate High Yield Bond Indexxvii vs. the Lipper High Yield Funds Averagexxvii
HISTORICAL PERFORMANCE FOR THE TEN-YEAR PERIOD ENDED AUGUST 31, 2021 HIGH YIELD FUND Comparison of $10,000 Investment in the Fund with the Bloomberg U.S. Corporate High Yield Bond Index and the |
The performance shown above and below represents past performance. Past performance is no guarantee of future results and current performance may be higher or lower than the performance shown above and below. Performance figures may reflect voluntary fee waivers and/or expense reimbursements. In the absence of voluntary fee waivers and/or expense reimbursements, the total return would have been lower. Principal value and investment returns will fluctuate and investors’ shares, when redeemed, may be worth more or less than their original cost. To obtain performance data current to the most recent month-end, please visit our website at www.morganstanley.com/wealth-investmentsolutions/cgcm.
The graph above and returns shown below do not reflect the deduction of taxes that a shareholder would pay on fund distributions or the redemption of fund shares.
HIGH YIELD FUND Average Annual Total Returns for the Period Ended August 31, 2021† | |||||||||||||||||||||||
| Without Annual Advisory Program Fee | With Annual Advisory Program Fee* | Bloomberg U.S. Corporate High Yield Bond Index** | Lipper High Yield Funds Average** | ||||||||||||||||||||
| Since inception 7/13/1998 | 4.58 | % | 2.53 | % | 6.65 | % | 5.53 | % | |||||||||||||||
| 10 years | 5.22 | 3.17 | 7.07 | 6.10 | |||||||||||||||||||
| 5 years | 5.19 | 3.14 | 6.66 | 5.79 | |||||||||||||||||||
| 3 years | 4.72 | 2.70 | 7.11 | 6.14 | |||||||||||||||||||
| 1 year | 8.61 | 6.47 | 10.14 | 9.90 | |||||||||||||||||||
See pages 25 through 29 for all footnotes.
15
International Fixed Income Fund
| ABOUTTHE SUB-ADVISER |
• Pacific Investment Management Company LLC (“PIMCO”) |
| PIMCO is a leading global investment management firm, with offices in 11 countries throughout North America, Europe and Asia. Founded in 1971, PIMCO offers a wide range of innovative solutions to help millions of investors worldwide meet their needs. Our goal is to provide attractive returns while maintaining a strong culture of risk management and long-term discipline. PIMCO’s investment philosophy revolves around the principle of diversification. PIMCO believes that no single risk should dominate returns. PIMCO seeks to add value through the use of “top-down” strategies such as our exposure to interest rates, or duration, changing volatility, yield curve positioning and sector rotation. PIMCO also employs “bottom-up” strategies involving analysis and selection of specific securities. |
As of August 31, 2021, the Sub-adviser for the Morgan Stanley Pathway International Fixed Income Fund (“Fund”) was Pacific Investment Management Company LLC (“PIMCO”).
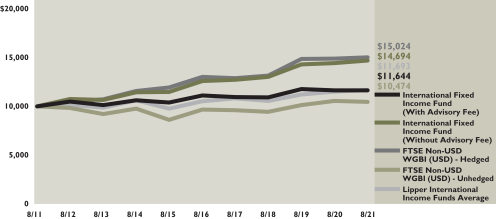
For the fiscal year ending August 31, 2021, the Fund returned 1.86% compared to its benchmark, the FTSE Non-USD World Government Bond Index (USD) Hedged xx which returned 0.85%.
Overall interest rate strategies added to performance. Tactical exposure to U.S. duration, including overall short exposure to intermediate and long-end rates, added to performance as the U.S. yield curve steepened during the period. Outside the U.S., an overweight to Italian interest rates added to performance while an overweight to Australian duration detracted from performance. Within emerging markets, exposure to select local rates, including Brazil, Argentina, and Peru, detracted from performance. Spread strategies overall contributed to performance, particularly security selection in non-Agency and Agency mortgage-backed securities. An overall underweight to investment grade corporate credit detracted from performance while an allocation to high yield credit added to performance as credit spreads tightened during the period. Lastly, overall currency strategies contributed to performance, including modest exposure to a basket of high-carry emerging market currencies.
16
The following graph depicts the performance of the FTSE Non-USD World Government Bond Index (USD) - Hedgedxx vs. the FTSE Non-USD World Government Bond Index (USD) - Unhedgedxx and the Lipper International Income Funds Averagexxviii
HISTORICAL PERFORMANCE FOR THE TEN-YEAR PERIOD ENDED AUGUST 31, 2021 INTERNATIONAL FIXED INCOME FUND Comparison of $10,000 Investment in the Fund with the FTSE Non-USD World Government Bond Index (USD) Hedged, |
The performance shown above and below represents past performance. Past performance is no guarantee of future results and current performance may be higher or lower than the performance shown above and below. Performance figures may reflect voluntary fee waivers and/or expense reimbursements. In the absence of voluntary fee waivers and/or expense reimbursements, the total return would have been lower. Principal value and investment returns will fluctuate and investors’ shares, when redeemed, may be worth more or less than their original cost. To obtain performance data current to the most recent month-end, please visit our website at www.morganstanley.com/wealth-investmentsolutions/cgcm.
The graph above and returns shown below do not reflect the deduction of taxes that a shareholder would pay on fund distributions or the redemption of fund shares.
INTERNATIONAL FIXED INCOME FUND Average Annual Total Returns for the Period Ended August 31, 2021† | ||||||||||||||||||||||||||||
| Without Annual Advisory Program Fee | With Annual Advisory Program Fee* | FTSE Non-USD WGBI (USD) Hedged** | FTSE Non-USD WGBI (USD) Unhedged** | Lipper International Income Funds Average** | ||||||||||||||||||||||||
| Since inception 11/18/1991 | 5.57 | % | 3.48 | % | 5.79 | % | 4.96 | % | 5.40 | % | ||||||||||||||||||
| 10 years | 3.92 | 1.89 | 4.15 | 0.46 | 1.40 | |||||||||||||||||||||||
| 5 years | 3.11 | 1.11 | 2.91 | 1.57 | 1.98 | |||||||||||||||||||||||
| 3 years | 4.13 | 2.14 | 4.51 | 3.54 | 3.40 | |||||||||||||||||||||||
| 1 year | 1.86 | -0.16 | 0.85 | -0.90 | 1.40 | |||||||||||||||||||||||
See pages 25 through 29 for all footnotes.
17
| ABOUTTHE SUB-ADVISER |
• BlackRock Financial Management, Inc. (“BlackRock”) |
| BlackRock seeks to build a high quality municipal bond portfolio that offers an attractive level of tax free income and capital preservation while providing stability and consistency throughout full market cycles. By way of comprehensive sector analysis, a rigorous credit review and sophisticated risk management technology, BlackRock’s seasoned portfolio managers strive to capture market inefficiencies. |
As of August 31, 2021, the Sub-adviser for the Morgan Stanley Pathway Municipal Bond Fund (“Fund”) was BlackRock Financial Management, Inc. (“BlackRock”).
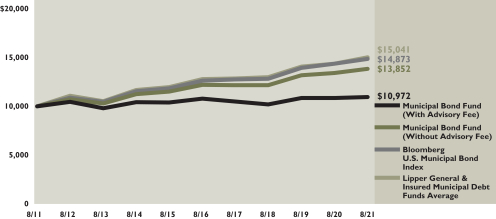
For the fiscal year ending August 31, 2021, the Fund returned 3.07% compared to its benchmark, the Bloomberg U.S. Municipal Bond Index xix which returned 3.40%.
An underweight sector allocation to tax-backed state and local sectors hindered performance. Curve positioning, particularly underweight exposure to 10-15 and 20+ year maturities also detracted on a relative performance basis. Security selection within education, corporate and tobacco credits and duration management via hedges were the largest contributors to performance. Within credit, overweight exposure to High Yield credits (NR, BB and B) was also additive to performance.
18
The following graph depicts the performance of the Bloomberg U.S. Municipal Bond Indexxix vs. the Lipper General & Insured Municipal Debt Funds Averagexxix
HISTORICAL PERFORMANCE FOR THE TEN-YEAR PERIOD ENDED AUGUST 31, 2021 MUNICIPAL BOND FUND Comparison of $10,000 Investment in the Fund with the Bloomberg U.S. Municipal Bond Index |
The performance shown above and below represents past performance. Past performance is no guarantee of future results and current performance may be higher or lower than the performance shown above and below. Performance figures may reflect voluntary fee waivers and/or expense reimbursements. In the absence of voluntary fee waivers and/or expense reimbursements, the total return would have been lower. Principal value and investment returns will fluctuate and investors’ shares, when redeemed, may be worth more or less than their original cost. To obtain performance data current to the most recent month-end, please visit our website at www.morganstanley.com/wealth-investmentsolutions/cgcm.
The graph above and returns shown below do not reflect the deduction of taxes that a shareholder would pay on fund distributions or the redemption of fund shares.
MUNICIPAL BOND FUND Average Annual Total Returns for the Period Ended August 31, 2021† | |||||||||||||||||||||||
| Without Annual Advisory Program Fee | With Annual Advisory Program Fee* | Bloomberg U.S. Municipal Bond Index** | Lipper General & Insured Municipal Debt Funds Average** | ||||||||||||||||||||
Since Inception 11/18/1991 | 4.57 | % | 2.51 | % | 5.35 | % | 4.95 | % | |||||||||||||||
| 10 years | 3.31 | 1.29 | 4.05 | 4.22 | |||||||||||||||||||
| 5 years | 2.55 | 0.56 | 3.30 | 3.25 | |||||||||||||||||||
| 3 years | 4.44 | 2.44 | 5.09 | 5.02 | |||||||||||||||||||
| 1 year | 3.07 | 1.04 | 3.40 | 4.73 | |||||||||||||||||||
See pages 25 through 29 for all footnotes.
19
Inflation-Linked Fixed Income Fund
| ABOUTTHE SUB-ADVISER |
• Pacific Investment Management Company LLC (“PIMCO”) |
| PIMCO is a leading global investment management firm, with offices in 11 countries throughout North America, Europe and Asia. Founded in 1971, PIMCO offers a wide range of innovative solutions to help millions of investors worldwide meet their needs. Our goal is to provide attractive returns while maintaining a strong culture of risk management and long-term discipline. PIMCO’s investment philosophy revolves around the principle of diversification. PIMCO believes that no single risk should dominate returns. PIMCO seeks to add value through the use of “top-down” strategies such as our exposure to interest rates, or duration, changing volatility, yield curve positioning and sector rotation. PIMCO also employs “bottom-up” strategies involving analysis and selection of specific securities. |
As of August 31, 2021, the Sub-adviser for the Morgan Stanley Pathway Inflation-Linked Fixed Income Fund (“Fund”) was Pacific Investment Management Company LLC (“PIMCO”).
For the fiscal year ending August 31, 2021, the Fund returned 5.87% compared to its benchmark, the Bloomberg U.S. Treasury Inflation Protected Securities (TIPS) Index xviii which returned 5.56%.
An overall underweight to U.S. nominal duration added to performance as U.S. Treasury yields rose over the period. An overweight to U.S. breakeven inflation contributed to performance as inflation expectations increased during the period. Outside the U.S., short exposure to United Kingdom breakevens detracted from performance as United Kingdom breakeven levels rose while tactical exposure to Italian breakevens contributed to performance. Overall spread sector strategies added to performance, including holdings of select non-Agency and Agency mortgage-backed securities. Lastly, holdings of select higher carry emerging market currencies contributed to performance.
20
The following graph depicts the performance of the Bloomberg U.S. Treasury Inflation Protected Securities (TIPS) Indexxviii vs. the Lipper Inflation Protected Bond Funds Averagexxx
HISTORICAL PERFORMANCE FOR THE TEN-YEAR PERIOD ENDED AUGUST 31, 2021 INFLATION-LINKED FIXED INCOME FUND^ Comparison of $10,000 Investment in the Fund with the Bloomberg U.S. Treasury Inflation Protected Securities (TIPS) |
| ^ | Since inception March 9, 2016. |
The performance shown above and below represents past performance. Past performance is no guarantee of future results and current performance may be higher or lower than the performance shown above and below. Performance figures may reflect voluntary fee waivers and/or expense reimbursements. In the absence of voluntary fee waivers and/or expense reimbursements, the total return would have been lower. Principal value and investment returns will fluctuate and investors’ shares, when redeemed, may be worth more or less than their original cost. To obtain performance data current to the most recent month-end, please visit our website at www.morganstanley.com/wealth-investmentsolutions/cgcm.
The graph above and returns shown below do not reflect the deduction of taxes that a shareholder would pay on fund distributions or the redemption of fund shares.
INFLATION-LINKED FIXED INCOME FUND Average Annual Total Returns for the Period Ended August 31, 2021† | |||||||||||||||||||||||
| Without Annual Advisory Program Fee | With Annual Advisory Program Fee* | Bloomberg U.S. Treasury Inflation Protected Securities (TIPS) Index** | Lipper Inflation Protected Bond Funds Average** | ||||||||||||||||||||
| Since inception 3/9/2016 | 5.22 | % | 3.14 | % | 4.91 | % | 4.55 | % | |||||||||||||||
| 10 years | N/A | N/A | 3.17 | 2.50 | |||||||||||||||||||
| 5 years | 4.79 | 2.74 | 4.60 | 4.12 | |||||||||||||||||||
| 3 years | 7.54 | 5.45 | 7.33 | 6.36 | |||||||||||||||||||
| 1 year | 5.87 | 3.78 | 5.56 | 6.01 | |||||||||||||||||||
See pages 25 through 29 for all footnotes.
21
Ultra-Short Term Fixed Income Fund
| ABOUTTHE SUB-ADVISER |
• Pacific Investment Management Company LLC (“PIMCO”) |
| PIMCO is a leading global investment management firm, with offices in 11 countries throughout North America, Europe and Asia. Founded in 1971, PIMCO offers a wide range of innovative solutions to help millions of investors worldwide meet their needs. Our goal is to provide attractive returns while maintaining a strong culture of risk management and long-term discipline. PIMCO’s investment philosophy revolves around the principle of diversification. PIMCO believes that no single risk should dominate returns. PIMCO seeks to add value through the use of “top-down” strategies such as our exposure to interest rates, or duration, changing volatility, yield curve positioning and sector rotation. PIMCO also employs “bottom-up” strategies involving analysis and selection of specific securities. |
As of August 31, 2021, the Sub-adviser for the Morgan Stanley Pathway Ultra-Short Term Fixed Income Fund (“Fund”) was Pacific Investment Management Company LLC (“PIMCO”).
For the fiscal year ending August 31, 2021, the Fund returned 0.61% compared to its benchmark, the FTSE 3-Month U.S. Treasury Bill Index xiv which returned 0.06%.
Overall interest rate strategies were positive for performance. A short exposure to U.S. duration contributed to performance as U.S. interest rates rose over the period. This was partially offset by exposure to Canadian interest rates as yields in Canada rose over the period. Overall spread sector strategies were positive for performance. Overall credit strategies were positive for performance, including security and sector selection within the investment grade corporate credit. Tactical positioning within high yield corporate credit detracted from performance as high yield spreads tightened. Select holdings of securitized credit, including non-Agency mortgage-backed securities and CMBS, were positive for performance. Overall currency strategies were neutral for performance.
22
The following graph depicts the performance of the FTSE 3-Month U.S. Treasury Bill Indexxiv vs. the Lipper Ultra-Short Obligations Funds Averagexxxi
HISTORICAL PERFORMANCE FOR THE TEN-YEAR PERIOD ENDED AUGUST 31, 2021 ULTRA-SHORT TERM FIXED INCOME FUND^ Comparison of $10,000 Investment in the Fund with the FTSE 3-Month U.S. Treasury Bill Index and the Lipper |
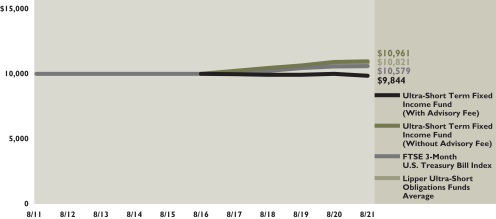
| ^ | Since inception March 9, 2016. |
The performance shown above and below represents past performance. Past performance is no guarantee of future results and current performance may be higher or lower than the performance shown above and below. Performance figures may reflect voluntary fee waivers and/or expense reimbursements. In the absence of voluntary fee waivers and/or expense reimbursements, the total return would have been lower. Principal value and investment returns will fluctuate and investors’ shares, when redeemed, may be worth more or less than their original cost. To obtain performance data current to the most recent month-end, please visit our website at www.morganstanley.com/wealth-investmentsolutions/cgcm.
The graph above and returns shown below do not reflect the deduction of taxes that a shareholder would pay on fund distributions or the redemption of fund shares.
ULTRA-SHORT TERM FIXED INCOME FUND Average Annual Total Returns for the Period Ended August 31, 2021† | |||||||||||||||||||||||
| Without Annual Advisory Program Fee | With Annual Advisory Program Fee* | FTSE 3-Month U.S. Treasury Bill Index** | Lipper Ultra- Short Obligations Funds Average** | ||||||||||||||||||||
| Since inception 3/9/2016 | 1.85 | % | -0.15 | % | 1.05 | % | 1.75 | % | |||||||||||||||
| 10 years | N/A | N/A | 0.60 | 1.15 | |||||||||||||||||||
| 5 years | 1.85 | -0.12 | 1.13 | 1.58 | |||||||||||||||||||
| 3 years | 1.68 | -0.25 | 1.20 | 1.69 | |||||||||||||||||||
| 1 year | 0.61 | -1.38 | 0.06 | 0.63 | |||||||||||||||||||
See pages 25 through 29 for all footnotes.
23
| ABOUTTHE MANAGER |
• Consulting Group Advisory Services, LLC |
| Consulting Group Advisory Services, LLC is a business of Morgan Stanley Wealth Management (“MSWM”). MSWM is one of the largest financial services firms in the U.S. with branch offices in all 50 states and the District of Columbia. MSWM’s advisory services are provided by its Consulting Group and Wealth Management Investment Resources business units. |
During the fiscal one year period ending August 31, 2021, the Morgan Stanley Pathway Alternative Strategies Fund (“Fund”) returned 10.39% compared to its benchmark, the HFRX Global Hedge Fund Index xxi which returned 9.10%. Contributing to performance were exposures to strategies including commodity, event-driven and long short equity while exposures to market neutral and relative value detracted from relative performance.
HISTORICAL PERFORMANCE FOR THE TEN-YEAR PERIOD ENDED AUGUST 31, 2021 ALTERNATIVE STRATEGIES FUND^ Comparison of $10,000 Investment in the Fund with the HFRX Global Hedge Fund Index |
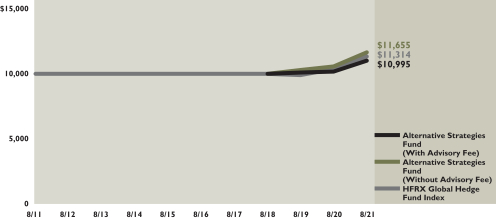
| ^ | Since inception February 15, 2018. |
The performance shown above and below represents past performance. Past performance is no guarantee of future results and current performance may be higher or lower than the performance shown above and below. Performance figures may reflect voluntary fee waivers and/or expense reimbursements. In the absence of voluntary fee waivers and/or expense reimbursements, the total return would have been lower. Principal value and investment returns will fluctuate and investors’ shares, when redeemed, may be worth more or less than their original cost. To obtain performance data current to the most recent month-end, please visit our website at www.morganstanley.com/wealth-investmentsolutions/cgcm.
The graph above and returns shown below do not reflect the deduction of taxes that a shareholder would pay on fund distributions or the redemption of fund shares.
ALTERNATIVE STRATEGIES FUND Average Annual Total Returns for the Period Ended August 31, 2021† | ||||||||||||||||||
| Without Annual Advisory Program Fee | With Annual Advisory Program Fee* | HFRX Global Hedge Fund Index | ||||||||||||||||
| Since inception 2/15/2018 | 4.07 | % | 2.01 | % | 2.65 | % | ||||||||||||
| 10 years | N/A | N/A | 2.25 | |||||||||||||||
| 5 years | N/A | N/A | 3.94 | |||||||||||||||
| 3 years | 5.24 | 3.21 | 4.20 | |||||||||||||||
| 1 year | 10.39 | 8.22 | 9.10 | |||||||||||||||
See pages 25 through 29 for all footnotes.
24
| † | All figures represent past performance and are not a guarantee of future results. Investment return and principal value of an investment will fluctuate so that an investor’s shares, when redeemed, may be worth more or less than their original cost. The returns shown do not reflect the deduction of taxes that a shareholder would pay on fund distributions or the redemptions of fund shares. Performance figures may reflect fee waivers and/or expense reimbursements. In the absence of fee waivers and/or expense reimbursements, the total return would have been lower. To obtain performance data current to the most recent month-end, please visit our website at https://www.morganstanley.com/wealth-investmentsolutions/cgcm/. |
| * | The Funds are available only to investors participating in Morgan Stanley approved advisory programs. These programs charge an annual fee, which may be up to 2.00%. |
| ** | Inception returns of the market indices and Lipper investment category averages are calculated from the end of the inception month. |
| i. | The S&P 500® Index tracks the performance of 500 widely held, large- capitalization US stocks. Please note that an investor cannot invest directly in an index. |
| ii. | The Russell 1000® Index measures the performance of the 1,000 largest US companies based on the market capitalization. Please note that an investor cannot invest directly in an index. |
| iii. | The U.S. large-cap Russell 1000® Growth Index measures the performance of those Russell 1000® Index companies with higher price-to-book ratios and higher forecasted growth values. Because the index is not a managed portfolio, there are no advisory fees or internal management expenses reflected in the index’s performance. Please note that an investor cannot invest directly in an index. |
| iv. | The Russell 1000® Value Index measures the performance of those Russell 1000® Index companies with lower price-to-book ratios and lower forecasted growth values. Because the index is not a managed portfolio, there are no advisory fees or internal management expenses reflected in the index’s performance. Please note that an investor cannot invest directly in an index. |
| v. | The Russell 2500® Index includes the smallest 2,500 US companies out of the Russell 3000® Index universe. Because the index is not a managed portfolio, there are no advisory fees or internal management expenses reflected in the index’s performance. Please note that an investor cannot invest directly in an index. |
| vi. | The U.S. small-cap Russell 2000® Growth Index measures the performance of those Russell 2000® Index companies with higher price-to-book ratios and higher forecasted growth values. Because the index is not a managed portfolio, there are no advisory fees or internal management expenses reflected in the index’s performance. Please note that an investor cannot invest directly in an index. |
| vii. | The Russell 2000® Value Index measures the performance of those Russell 2000® Index companies with lower price-to-book ratios and lower forecasted growth values. Because the index is not a managed portfolio, there are no advisory fees or internal management expenses reflected in the index’s performance. Please note that an investor cannot invest directly in an index. |
| viii. | The Morgan Stanley Capital International Europe, Australasia, Far East (MSCI EAFE®) Index (Net) is a free float-adjusted market capitalization index that is designed to measure the equity market performance of developed markets, excluding the US & Canada. The MSCI EAFE® Index (Net) consists of the following 21 developed market country indexes: Australia, Austria, Belgium, Denmark, Finland, France, Germany, Hong Kong, Ireland, Israel, Italy, Japan, the Netherlands, New Zealand, Norway, Portugal, Singapore, Spain, Sweden, Switzerland, and the United Kingdom. Net total return indexes reinvest dividends after the deduction of withholding taxes, using (for international indexes) a tax rate applicable to non-resident institutional investors who do not benefit from double taxation treaties. Because the index is not a managed portfolio, there are no advisory fees or internal management expenses reflected in the index’s performance. Please note that an investor cannot invest directly in an index. |
| ix. | The MSCI EAFE® Growth Index captures large and mid-cap securities exhibiting overall growth style characteristics across Developed Markets countries* around the world, excluding the US and Canada. The growth investment style characteristics for index construction are defined using five variables: long-term forward EPS growth rate, short-term forward EPS growth rate, current internal |
25
| growth rate and long-term historical EPS growth trend and long-term historical sales per share growth trend. Please note that an investor cannot invest directly in an index. |
| x. | The MSCI EAFE® Value Index captures large and mid-cap securities exhibiting overall value style characteristics across Developed Markets countries* around the world, excluding the US and Canada. The value investment style characteristics for index construction are defined using three variables: book value to price, 12-month forward earnings to price and dividend yield. Please note that an investor cannot invest directly in an index. |
| xi. | The MSCI Emerging Markets Index (Net) is a free float-adjusted market capitalization index that is designed to measure equity market performance of emerging markets. The MSCI Emerging Markets Index (Net) consists of the following 26 emerging market country indexes: Argentina, Brazil, Chile, China, Colombia, Czech Republic, Egypt, Greece, Hungary, India, Indonesia, South Korea, Malaysia, Mexico, Pakistan, Peru, Philippines, Poland, Qatar, Russia, Saudi Arabia, South Africa, Taiwan, Thailand, Turkey and United Emirates. Net total return indexes reinvest dividends after the deduction of withholding taxes, using (for international indexes) a tax rate applicable to nonresident institutional investors who do not benefit from double taxation treaties. Because the index is not a managed portfolio, there are no advisory fees or internal management expenses reflected in the index’s performance. Please note that an investor cannot invest directly in an index. |
| xii. | The MSCI Emerging Markets Growth Index (Net) is a free float-adjusted market capitalization index that is designed to measure equity market performance of emerging markets. The MSCI Emerging Markets Index (Net) consists of the following 26 emerging market country indexes: Argentina, Brazil, Chile, China, Colombia, Czech Republic, Egypt, Greece, Hungary, India, Indonesia, South Korea, Malaysia, Mexico, Pakistan, Peru, Philippines, Poland, Qatar, Russia, Saudi Arabia, South Africa, Taiwan, Thailand, Turkey and United Emirates. The growth investment style characteristics for index construction are defined using five variables: long-term forward EPS growth rate, short-term forward EPS growth rate, current internal growth rate and long-term historical EPS growth trend and long-term historical sales per share growth trend. Net total return indexes reinvest dividends after the deduction of withholding taxes, using (for international indexes) a tax rate applicable to nonresident institutional investors who do not benefit from double taxation treaties. Because the index is not a managed portfolio, there are no advisory fees or internal management expenses reflected in the index’s performance. Please note that an investor cannot invest directly in an index. |
| xiii. | The MSCI Emerging Markets Value Index (Net) is a free float-adjusted market capitalization index that is designed to measure equity market performance of emerging markets. The MSCI Emerging Markets Index (Net) consists of the following 26 emerging market country indexes: Argentina, Brazil, Chile, China, Colombia, Czech Republic, Egypt, Greece, Hungary, India, Indonesia, South Korea, Malaysia, Mexico, Pakistan, Peru, Philippines, Poland, Qatar, Russia, Saudi Arabia, South Africa, Taiwan, Thailand, Turkey and United Emirates. The value investment style characteristics for index construction are defined using three variables: book value to price, 12-month forward earnings to price and dividend yield. Net total return indexes reinvest dividends after the deduction of withholding taxes, using (for international indexes) a tax rate applicable to nonresident institutional investors who do not benefit from double taxation treaties. Because the index is not a managed portfolio, there are no advisory fees or internal management expenses reflected in the index’s performance. Please note that an investor cannot invest directly in an index. |
| xiv. | The FTSE 3-Month U.S. Treasury Bill Index — Equal dollar amounts of three-month Treasury bills are purchased at the beginning of each of three consecutive months. As each bill matures, all proceeds are rolled over or reinvested in a new three-month bill. The income used to calculate the monthly return is derived by subtracting the original amount invested from the maturity value. The yield curve average is the basis for calculating the return on the index. The index is rebalanced monthly by market capitalization. Please note that an investor cannot invest directly in an index. |
| xv. | The Bloomberg U.S. Aggregate BondTM Index is a broad-based index that measures the investment grade, US dollar-denominated, fixed-rate taxable bond market, including Treasuries, government-related, and corporate securities, MBS |
26
| (agency fixed-rate and hybrid ARM pass-throughs), ABS, and CMBS. Because the index is not a managed portfolio, there are no advisory fees or internal management expenses reflected in the index’s performance. Please note that an investor cannot invest directly in an index. |
| xvi. | The Bloomberg Global Aggregate Bond Index is a flagship measure of global investment grade debt from twenty-four local currency markets. This multi-currency benchmark includes treasury, government-related, corporate and securitized fixed-rate bonds from both developed and emerging markets issuers. Please note that an investor cannot invest directly in an index. |
| xvii. | The Bloomberg U.S. Corporate High Yield Bond Index measures the market of US dollar-denominated, non-investment grade, fixed rate, taxable corporate bonds. Because the index is not a managed portfolio, there are no advisory fees or internal management expenses reflected in the index’s performance. Please note that an investor cannot invest directly in an index. |
| xviii. | The Bloomberg U.S. Treasury Inflation Protected Securities (TIPS) Index is an unmanaged market index comprised of all US Treasury Inflation Protected Securities rated investment grade (Baa3/BBB- or better), have at least one year to final maturity, and at least $250 million par amount outstanding. Please note that an investor cannot invest directly in an index. |
| xix. | The Bloomberg U.S. Municipal Bond Index covers the US dollar-denominated long-term tax exempt bond market. The index has four main sectors: state and local general obligation bonds, revenue bonds, insured bonds, and pre-refunded bonds. Because the index is not a managed portfolio, there are no advisory fees or internal management expenses reflected in the index’s performance. Please note that an investor cannot invest directly in an index. |
| xx. | The FTSE Non-USD World Government Bond Index (USD) Hedged and Unhedged are each sub-indices of the FTSE World Government Bond Index (WGBI), which is comprised of the global sovereign debt of over 20 countries representative in the Americas, EMEA, EMU, Asia Pacific, and Japan regions. The Non-US Dollar WGBI includes all WGBI markets except the United States and is stated in US dollar hedged or unhedged base currency terms. Because the index is not a managed portfolio, there are no advisory fees or internal management expenses reflected in the index’s performance. Please note that an investor cannot invest directly in an index. |
| xxi. | The HFRX Global Hedge Fund Index is designed to be representative of the overall composition of the hedge fund universe. It is comprised of all eligible hedge fund strategies; including but not limited to convertible arbitrage, distressed securities, equity hedge, equity market neutral, event driven, macro, merger arbitrage, and relative value arbitrage. The strategies are asset weighted based on the distribution of assets in the hedge fund industry. Hedge Fund Research, Inc. (HFR) utilizes a UCITSIII compliant methodology to construct the HFRX Hedge Fund Indices. The methodology is based on defined and predetermined rules and objective criteria to select and rebalance components to maximize representation of the Hedge Fund Universe. HFRX Indices utilize state-of-the-art quantitative techniques and analysis; multi-level screening, cluster analysis, Monte-Carlo simulations and optimization techniques ensure that each Index is a pure representation of its corresponding investment focus. |
| xxii. | The Lipper Large-Cap Core Funds Average are equally weighted total returns using all the active funds available within the category of funds that, by portfolio practice, invest at least 75% of their equity assets in companies with market capitalizations (on a three-year weighted basis) greater than 300% of the dollar weighted median market capitalization of the middle 1,000 securities of the S&P SuperComposite 1500® Index. Large-cap core funds have more latitude in the companies in which they invest. These funds typically have an average price-to-earnings ratio, price-to-book ratio, and three-year sales-per-share growth value, compared to the S&P 500® Index. The total return of the Lipper Funds Average does not include the effect of sales charges. Please note that an investor cannot invest directly in a mutual funds classification average or an index. |
| xxiii. | The Lipper Small-Cap Core Funds Average are equally weighted total returns using all the active funds available within the category of funds that, by portfolio practice, invest at least 75% of their equity assets in companies with market capitalizations (on a three-year weighted basis) less than 250% of the dollar weighted median of the smallest 500 of the middle 1,000 securities of the |
27
| S&P SuperComposite 1500® Index. Small-cap core funds have more latitude in the companies in which they invest. These funds typically have an average price-to-earnings ratio, price-to-book ratio, and three-year sales-per-share growth value, compared to the S&P SmallCap 600® Index. The total return of the Lipper Funds Average does not include the effect of sales charges. Please note that an investor cannot invest directly in a mutual funds classification average or an index. |
| xxiv. | The Lipper International Large-Cap Core Funds Average is an equally weighted average of all active funds available within the investment category. The classification includes funds that, by portfolio practice, invest at least 75% of their equity assets in companies outside of the US with market capitalizations (on a three-year weighted basis) above Lipper’s international large-cap floor. International large-cap core funds typically have average characteristics compared to their large-cap-specific subset of the MSCI EAFE® Index (Net). The total return of the Lipper Funds Average does not include the effect of sales charges. Please note that an investor cannot invest directly in a mutual funds classification average or an index. |
| xxv. | The Lipper Emerging Markets Funds Average is an equally weighted average of all active funds available within the investment category. The classification includes funds that seek long-term capital appreciation by investing at least 65% of total assets in emerging market equity securities, where “emerging market” is defined by a country’s GNP per capita or other economic measures. The total return of the Lipper Funds Average does not include the effect of sales charges. Please note that an investor cannot invest directly in a mutual funds classification average or an index. |
| xxvi. | The Lipper Core Bond Funds Average is an equally weighted average of all active funds available within the investment category. The classification includes funds that invest at least 85% of their assets in domestic investment-grade debt issues (rated in top four grades) with any remaining in investment in non-benchmark sectors such as high-yield, global, and emerging market debt. These funds maintain dollar-weighted average maturities of five to ten years. The total return of the Lipper Funds Average does not include the effect of sales charges. Please note that an investor cannot invest directly in a mutual funds classification average or an index. |
| xxvii. | The Lipper High Yield Funds Average is an equally weighted average of all active funds available within the investment category. The classification includes funds that aim at high (relative) current yield from fixed income securities, have no quality or maturity restrictions, and tend to invest in lower grade debt issues. The total return of the Lipper Funds Average does not include the effect of sales charges. Please note that an investor cannot invest directly in a mutual funds classification average or an index. |
| xxviii. | The Lipper International Income Funds Average is an equally weighted average of all active funds available within the investment category. The classification includes funds that state in their prospectus that they invest primarily in US dollar and non-US dollar debt securities of issuers located in at least three countries, excluding the United States, except in periods of market weakness. The total return of the Lipper Funds Average does not include the effect of sales charges. Please note that an investor cannot invest directly in a mutual funds classification average or an index. |
| xxix. | The Lipper General & Insured Municipal Debt Funds Average is an equally weighted average of all active funds available within the investment category. The classification includes funds that either invest primarily in municipal debt issues rated in the top four credit ratings or invest primarily in municipal debt issues insured as to timely payment. The total return of the Lipper Funds Average does not include the effect of sales charges. Please note that an investor cannot invest directly in a mutual funds classification average or an index. |
| xxx. | The Lipper Inflation Protected Bond Funds Average — These are equally weighted total returns using all the active funds available within the category. Lipper analytical averages are an average of all funds in the specified investment objective’s universe. Averages include all funds in the group in existence for the period. The number of component funds always changes. Inflation protected bond funds invest primarily in inflation-indexed fixed income securities issued in the United States. Inflation-indexed bonds are fixed income securities that are structured to provide protection against inflation. |
28
| xxxi. | The Lipper Ultra-Short Obligations Funds Average — These are equally weighted total returns using all the active funds available within the category. Lipper analytical averages are an average of all funds in the specified investment objective’s universe. Averages include all funds in the group in existence for the period. The number of component funds always changes. Ultra short obligations funds invest primarily in investment-grade debt issues or better and maintain a portfolio dollar-weighted average maturity between 91 days and 365 days. |
29
| Fund Expenses |
Example
As a shareholder of a Fund, you may incur two types of costs: (1) annual advisory program fees, which may be up to 2.00%; and (2) ongoing costs, including management fees and other Fund expenses. This example is intended to help you understand your ongoing costs (in dollars) of investing in a Fund and to compare these costs with the ongoing costs of investing in other mutual funds. This example is based on an investment of $1,000 invested on March 1, 2021 and held for the six months ended August 31, 2021.
Actual Expenses
The table below titled “Based on Actual Total Return” provides information about actual account values and actual expenses. You may use the information provided in this table, together with the amount you invested, to estimate the expenses that you paid over the period. To estimate the expenses you paid on your account during this period, divide your account value by $1,000 (for example, an $8,600 account value divided by $1,000 = 8.6), then multiply the result by the number under the heading entitled “Expense Paid During the Period”.
| Based on Actual Total Return(1) | |||||||||||||||||||||||||
| Fund | Total Return Without Annual Advisory Program Fees(2) | Beginning Account Value | Ending Account Value | Annualized Expense Ratios(3) | Expense Paid During the Period(4) | ||||||||||||||||||||
Large Cap Equity Fund | 17.26 | % | $ | 1,000.00 | $ | 1,172.60 | 0.47 | % | $ | 2.57 | |||||||||||||||
Small-Mid Cap Equity Fund | 8.27 | % | 1,000.00 | 1,082.70 | 0.57 | % | 2.99 | ||||||||||||||||||
International Equity Fund | 10.06 | % | 1,000.00 | 1,100.60 | 0.63 | % | 3.34 | ||||||||||||||||||
Emerging Markets Equity Fund | -0.63 | % | 1,000.00 | 993.70 | 0.80 | % | 4.02 | ||||||||||||||||||
Core Fixed Income Fund | 1.79 | % | 1,000.00 | 1,017.90 | 0.53 | % | 2.70 | ||||||||||||||||||
High Yield Fund | 3.05 | % | 1,000.00 | 1,030.50 | 0.74 | % | 3.79 | ||||||||||||||||||
International Fixed Income Fund | 1.00 | % | 1,000.00 | 1,010.00 | 0.88 | % | 4.46 | ||||||||||||||||||
Municipal Bond Fund | 2.12 | % | 1,000.00 | 1,021.20 | 0.69 | % | 3.52 | ||||||||||||||||||
Inflation-Linked Fixed Income Fund | 6.09 | % | 1,000.00 | 1,060.90 | 0.84 | % | 4.36 | ||||||||||||||||||
Ultra-Short Term Fixed Income Fund | 0.00 | % | 1,000.00 | 1,000.00 | 0.60 | % | 3.02 | ||||||||||||||||||
Alternative Strategies Fund | 4.07 | % | 1,000.00 | 1,040.70 | 0.52 | % | 2.67 | ||||||||||||||||||
| (1) | For the six months ended August 31, 2021. |
| (2) | Assumes reinvestment of all distributions, including returns of capital, if any, at net asset value and does not reflect the deduction of the applicable advisory program charge, which may be up to 2.00% depending on the particular program through which you invest. Total return is not annualized as it may not be representative of the total return for the year. Performance figure may reflect fee waivers and/or expense reimbursements. Past performance is no guarantee of future results. In the absence of fee waivers and/or expense reimbursements, the total return would have been lower. |
| (3) | Annualized Expense Ratios are based on the most recent 6-month expense ratios, which may differ from net expense ratios in the Financial Highlights. |
| (4) | Expenses (net of fee waivers and/or expense reimbursements) are equal to each Fund’s respective annualized expense ratio multiplied by the average account value over the period, multiplied by the number of days (184 days) in the most recent fiscal half-year, then divided by 365 (to reflect the one-half year period). |
30
| Fund Expenses |
| (continued) |
Hypothetical Example for Comparison Purposes
The table below titled “Based on Hypothetical Total Return” provides information about hypothetical account values and hypothetical expenses based on each Fund’s actual expense ratio and an assumed rate of return of 5.00% per year/period before expenses, which is not each Fund’s actual return. The hypothetical account values and expenses may not be used to estimate the actual ending account balances or expenses you paid for the period. You may use the information provided in this table to compare the ongoing costs of investing in each Fund and other funds. To do so, compare the 5.00% hypothetical example relating to a Fund with the 5.00% hypothetical examples that appear in the shareholder reports of the other funds.
Please note that the expenses shown in the table below are meant to highlight your ongoing costs only and do not reflect any advisory program annual fees. Therefore, the table is useful in comparing ongoing costs only, and will not help you determine the relative total costs of owning different funds. In addition, if these advisory program annual fees were included, your costs would have been higher.
| Based on Hypothetical Return(1) | |||||||||||||||||||||||||
| Fund | Hypothetical Annualized | Beginning Account Value | Ending Account Value | Annualized Expense Ratios(2) | Expense Paid During the Period(3) | ||||||||||||||||||||
Large Cap Equity Fund | 5.00 | % | $ | 1,000.00 | $ | 1,022.84 | 0.47 | % | $ | 2.40 | |||||||||||||||
Small-Mid Cap Equity Fund | 5.00 | % | 1,000.00 | 1,022.33 | 0.57 | % | 2.91 | ||||||||||||||||||
International Equity Fund | 5.00 | % | 1,000.00 | 1,022.03 | 0.63 | % | 3.21 | ||||||||||||||||||
Emerging Markets Equity Fund | 5.00 | % | 1,000.00 | 1,021.17 | 0.80 | % | 4.08 | ||||||||||||||||||
Core Fixed Income Fund | 5.00 | % | 1,000.00 | 1,022.53 | 0.53 | % | 2.70 | ||||||||||||||||||
High Yield Fund | 5.00 | % | 1,000.00 | 1,021.48 | 0.74 | % | 3.77 | ||||||||||||||||||
International Fixed Income Fund | 5.00 | % | 1,000.00 | 1,020.77 | 0.88 | % | 4.48 | ||||||||||||||||||
Municipal Bond Fund | 5.00 | % | 1,000.00 | 1,021.73 | 0.69 | % | 3.52 | ||||||||||||||||||
Inflation-Linked Fixed Income Fund | 5.00 | % | 1,000.00 | 1,020.97 | 0.84 | % | 4.28 | ||||||||||||||||||
Ultra-Short Term Fixed Income Fund | 5.00 | % | 1,000.00 | 1,022.18 | 0.60 | % | 3.06 | ||||||||||||||||||
Alternative Strategies Fund | 5.00 | % | 1,000.00 | 1,022.58 | 0.52 | % | 2.65 | ||||||||||||||||||
| (1) | For the six months ended August 31, 2021. |
| (2) | Annualized Expense Ratios are based on the most recent 6-month expense ratios, which may differ from net expense ratios in the Financial Highlights. |
| (3) | Expenses (net of fee waivers and/or expense reimbursements) are equal to each Fund’s respective annualized expense ratio multiplied by the average account value over the period, multiplied by the number of days (184 days) in the most recent fiscal half-year, then divided 365 (to reflect the one-half year period). |
31
| Schedules of Investments |
| August 31, 2021 |
| Large Cap Equity Fund | ||||||||
| Shares/Units | Security | Value | ||||||
COMMON STOCKS — 97.1% | ||||||||
COMMUNICATION SERVICES — 9.8% | ||||||||
Diversified Telecommunication Services — 1.1% | ||||||||
| 188,432 | AT&T Inc. | $ | 5,166,805 | |||||
| 186,738 | Liberty Global PLC, Class C Shares* | 5,411,667 | ||||||
| 28,892 | Lumen Technologies Inc. | 355,372 | ||||||
| 232,115 | Verizon Communications Inc. | 12,766,325 | ||||||
|
| |||||||
| Total Diversified Telecommunication Services | 23,700,169 | |||||||
|
| |||||||
Entertainment — 2.0% | ||||||||
| 57,982 | Activision Blizzard Inc. | 4,775,977 | ||||||
| 16,555 | Electronic Arts Inc. | 2,403,952 | ||||||
| 736 | Liberty Media Corp-Liberty Formula One, Class A Shares* | 33,628 | ||||||
| 5,764 | Liberty Media Corp-Liberty Formula One, Class C Shares* | 291,313 | ||||||
| 3,391 | Live Nation Entertainment Inc.* | 294,000 | ||||||
| 600 | Madison Square Garden Sports Corp., Class A Shares* | 108,468 | ||||||
| 17,391 | Netflix Inc.* | 9,898,783 | ||||||
| 2,011 | Playtika Holding Corp.* | 53,070 | ||||||
| 3,037 | Roku Inc., Class A Shares* | 1,070,239 | ||||||
| 9,070 | Sea Ltd., ADR* | 3,068,562 | ||||||
| 7,758 | Skillz Inc., Class A Shares*(a) | 91,312 | ||||||
| 3,669 | Spotify Technology SA* | 859,793 | ||||||
| 3,011 | Take-Two Interactive Software Inc.* | 485,433 | ||||||
| 107,203 | Walt Disney Co. (The)* | 19,435,904 | ||||||
| 1,268 | World Wrestling Entertainment Inc., Class A Shares(a) | 66,075 | ||||||
| 28,483 | Zynga Inc., Class A Shares* | 252,075 | ||||||
|
| |||||||
| Total Entertainment | 43,188,584 | |||||||
|
| |||||||
Interactive Media & Services — 5.6% | ||||||||
| 14,547 | Alphabet Inc., Class A Shares* | 42,098,291 | ||||||
| 7,482 | Alphabet Inc., Class C Shares* | 21,766,934 | ||||||
| 125,829 | Facebook Inc., Class A Shares* | 47,737,006 | ||||||
| 2,002 | IAC/InterActiveCorp* | 264,364 | ||||||
| 46,923 | Match Group Inc.* | 6,449,097 | ||||||
| 14,406 | Pinterest Inc., Class A Shares* | 800,541 | ||||||
| 2,723 | TripAdvisor Inc.* | 95,305 | ||||||
| 20,559 | Twitter Inc.* | 1,326,056 | ||||||
| 3,250 | Vimeo Inc.* | 123,890 | ||||||
| 1,606 | Zillow Group Inc., Class A Shares* | 153,534 | ||||||
| 4,320 | Zillow Group Inc., Class C Shares*(a) | 413,726 | ||||||
|
| |||||||
| Total Interactive Media & Services | 121,228,744 | |||||||
|
| |||||||
Media — 1.0% | ||||||||
| 5,683 | Altice USA Inc., Class A Shares* | 155,942 | ||||||
| 134 | Cable One Inc. | 281,345 | ||||||
| 3,468 | Charter Communications Inc., Class A Shares* | 2,832,177 | ||||||
| 234,125 | Comcast Corp., Class A Shares | 14,206,705 | ||||||
| 4,326 | Discovery Inc., Class A Shares*(a) | 124,762 | ||||||
| 8,917 | Discovery Inc., Class C Shares*(a) | 246,020 | ||||||
| 6,757 | DISH Network Corp., Class A Shares* | 294,538 | ||||||
| 7,986 | Fox Corp., Class A Shares | 298,996 | ||||||
| 3,779 | Fox Corp., Class B Shares | 130,867 | ||||||
| 10,180 | Interpublic Group of Cos., Inc. (The) | 379,001 | ||||||
| 661 | Liberty Broadband Corp., Class A Shares* | 122,794 | ||||||
| 3,998 | Liberty Broadband Corp., Class C Shares* | 764,897 | ||||||
| 2,263 | Liberty Media Corp-Liberty SiriusXM, Class A Shares* | 112,018 | ||||||
| 4,349 | Liberty Media Corp-Liberty SiriusXM, Class C Shares* | 214,623 | ||||||
See Notes to Financial Statements.
32
| Schedules of Investments |
| (continued) |
| Large Cap Equity Fund | ||||||||
| Shares/Units | Security | Value | ||||||
COMMUNICATION SERVICES — 9.8% — (continued) | ||||||||
Media — 1.0% — (continued) | ||||||||
| 4,823 | New York Times Co. (The), Class A Shares | $ | 244,912 | |||||
| 10,057 | News Corp., Class A Shares | 225,981 | ||||||
| 3,589 | News Corp., Class B Shares | 79,066 | ||||||
| 1,013 | Nexstar Media Group Inc., Class A Shares | 151,697 | ||||||
| 5,541 | Omnicom Group Inc. | 405,712 | ||||||
| 23,588 | Sirius XM Holdings Inc.(a) | 147,897 | ||||||
| 181 | ViacomCBS Inc., Class A Shares | 8,322 | ||||||
| 15,181 | ViacomCBS Inc., Class B Shares | 629,252 | ||||||
|
| |||||||
| Total Media | 22,057,524 | |||||||
|
| |||||||
Wireless Telecommunication Services — 0.1% | ||||||||
| 15,539 | T-Mobile US Inc.* | 2,129,154 | ||||||
|
| |||||||
| TOTAL COMMUNICATION SERVICES | 212,304,175 | |||||||
|
| |||||||
CONSUMER DISCRETIONARY — 12.6% | ||||||||
Auto Components — 0.3% | ||||||||
| 39,752 | Adient PLC* | 1,563,844 | ||||||
| 27,384 | Aptiv PLC* | 4,167,571 | ||||||
| 6,333 | BorgWarner Inc. | 270,292 | ||||||
| 7,182 | Gentex Corp. | 221,206 | ||||||
| 1,483 | Lear Corp. | 237,191 | ||||||
| 3,063 | QuantumScape Corp., Class A Shares*(a) | 67,386 | ||||||
|
| |||||||
| Total Auto Components | 6,527,490 | |||||||
|
| |||||||
Automobiles — 0.9% | ||||||||
| 102,877 | Ford Motor Co.* | 1,340,487 | ||||||
| 36,261 | General Motors Co.* | 1,777,152 | ||||||
| 3,718 | Harley-Davidson Inc. | 146,973 | ||||||
| 20,457 | Tesla Inc.* | 15,050,624 | ||||||
| 1,368 | Thor Industries Inc. | 155,172 | ||||||
|
| |||||||
| Total Automobiles | 18,470,408 | |||||||
|
| |||||||
Distributors — 0.4% | ||||||||
| 3,698 | Genuine Parts Co. | 451,859 | ||||||
| 126,602 | LKQ Corp.* | 6,670,659 | ||||||
| 1,024 | Pool Corp. | 506,163 | ||||||
|
| |||||||
| Total Distributors | 7,628,681 | |||||||
|
| |||||||
Diversified Consumer Services — 0.1% | ||||||||
| 1,570 | Bright Horizons Family Solutions Inc.* | 228,843 | ||||||
| 3,896 | Chegg Inc.* | 324,225 | ||||||
| 2,473 | Frontdoor Inc.* | 107,873 | ||||||
| 1,049 | Grand Canyon Education Inc.* | 93,508 | ||||||
| 4,105 | H&R Block Inc. | 105,293 | ||||||
| 4,272 | Service Corp. International | 268,111 | ||||||
| 3,121 | Terminix Global Holdings Inc.* | 129,927 | ||||||
|
| |||||||
| Total Diversified Consumer Services | 1,257,780 | |||||||
|
| |||||||
Hotels, Restaurants & Leisure — 1.8% | ||||||||
| 5,755 | Aramark | 200,216 | ||||||
| 5,057 | Booking Holdings Inc.* | 11,629,431 | ||||||
| 2,162 | Boyd Gaming Corp.* | 132,682 | ||||||
| 5,254 | Caesars Entertainment Inc.* | 533,964 | ||||||
| 22,446 | Carnival Corp.* | 541,846 | ||||||
| 759 | Chipotle Mexican Grill Inc., Class A Shares* | 1,444,627 | ||||||
| 983 | Choice Hotels International Inc. | 117,331 | ||||||
| 971 | Churchill Downs Inc. | 204,396 | ||||||
See Notes to Financial Statements.
33
| Schedules of Investments |
| (continued) |
| Large Cap Equity Fund | ||||||||
| Shares/Units | Security | Value | ||||||
CONSUMER DISCRETIONARY — 12.6% — (continued) | ||||||||
Hotels, Restaurants & Leisure — 1.8% — (continued) | ||||||||
| 3,435 | Darden Restaurants Inc. | $ | 517,483 | |||||
| 1,029 | Domino’s Pizza Inc. | 531,880 | ||||||
| 8,002 | DraftKings Inc., Class A Shares*(a) | 474,439 | ||||||
| 3,839 | Expedia Group Inc.* | 554,736 | ||||||
| 7,206 | Hilton Worldwide Holdings Inc.* | 899,741 | ||||||
| 1,062 | Hyatt Hotels Corp., Class A Shares* | 78,153 | ||||||
| 8,771 | Las Vegas Sands Corp.* | 391,274 | ||||||
| 7,100 | Marriott International Inc., Class A Shares* | 959,494 | ||||||
| 1,097 | Marriott Vacations Worldwide Corp.* | 164,056 | ||||||
| 51,444 | McDonald’s Corp. | 12,215,892 | ||||||
| 10,753 | MGM Resorts International | 458,293 | ||||||
| 9,909 | Norwegian Cruise Line Holdings Ltd.*(a) | 256,049 | ||||||
| 4,113 | Penn National Gaming Inc.*(a) | 333,564 | ||||||
| 2,292 | Planet Fitness Inc., Class A Shares* | 186,340 | ||||||
| 5,792 | Royal Caribbean Cruises Ltd.* | 479,172 | ||||||
| 2,187 | Six Flags Entertainment Corp.* | 92,379 | ||||||
| 31,015 | Starbucks Corp. | 3,643,952 | ||||||
| 2,115 | Travel + Leisure Co. | 115,817 | ||||||
| 1,001 | Vail Resorts Inc.* | 305,155 | ||||||
| 3,860 | Wendy’s Co. (The) | 88,857 | ||||||
| 2,660 | Wyndham Hotels & Resorts Inc. | 193,382 | ||||||
| 2,828 | Wynn Resorts Ltd.* | 287,579 | ||||||
| 11,091 | Yum China Holdings Inc. | 682,762 | ||||||
| 7,688 | Yum! Brands Inc. | 1,007,359 | ||||||
|
| |||||||
| Total Hotels, Restaurants & Leisure | 39,722,301 | |||||||
|
| |||||||
Household Durables — 0.5% | ||||||||
| 8,813 | DR Horton Inc. | 842,699 | ||||||
| 3,840 | Garmin Ltd. | 669,811 | ||||||
| 3,903 | Leggett & Platt Inc. | 188,866 | ||||||
| 7,148 | Lennar Corp., Class A Shares | 767,052 | ||||||
| 460 | Lennar Corp., Class B Shares | 40,259 | ||||||
| 1,523 | Mohawk Industries Inc.* | 301,188 | ||||||
| 9,936 | Newell Brands Inc. | 252,474 | ||||||
| 83 | NVR Inc.* | 429,935 | ||||||
| 7,062 | PulteGroup Inc. | 380,359 | ||||||
| 4,371 | Tempur Sealy International Inc. | 195,384 | ||||||
| 2,748 | Toll Brothers Inc. | 176,037 | ||||||
| 869 | TopBuild Corp.* | 190,129 | ||||||
| 27,042 | Whirlpool Corp. | 5,990,614 | ||||||
|
| |||||||
| Total Household Durables | 10,424,807 | |||||||
|
| |||||||
Internet & Direct Marketing Retail — 3.9% | ||||||||
| 16,960 | Alibaba Group Holding Ltd., ADR* | 2,832,150 | ||||||
| 19,295 | Amazon.com Inc.* | 66,968,893 | ||||||
| 32,384 | Chewy Inc., Class A Shares*(a) | 2,853,678 | ||||||
| 2,210 | DoorDash Inc., Class A Shares*(a) | 422,994 | ||||||
| 123,545 | eBay Inc. | 9,480,843 | ||||||
| 3,337 | Etsy Inc.* | 721,660 | ||||||
| 182,929 | Qurate Retail Inc., Class A Shares | 2,017,707 | ||||||
| 1,985 | Wayfair Inc., Class A Shares*(a) | 557,289 | ||||||
|
| |||||||
| Total Internet & Direct Marketing Retail | 85,855,214 | |||||||
|
| |||||||
Leisure Products — 0.1% | ||||||||
| 1,995 | Brunswick Corp. | 193,256 | ||||||
See Notes to Financial Statements.
34
| Schedules of Investments |
| (continued) |
| Large Cap Equity Fund | ||||||||
| Shares/Units | Security | Value | ||||||
CONSUMER DISCRETIONARY — 12.6% — (continued) | ||||||||
Leisure Products — 0.1% — (continued) | ||||||||
| 3,355 | Hasbro Inc. | $ | 329,830 | |||||
| 1,316 | Hayward Holdings Inc.*(a) | 27,570 | ||||||
| 8,897 | Mattel Inc.* | 189,951 | ||||||
| 6,986 | Peloton Interactive Inc., Class A Shares* | 699,927 | ||||||
| 1,695 | Polaris Inc. | 202,993 | ||||||
| 2,254 | YETI Holdings Inc.* | 223,913 | ||||||
|
| |||||||
| Total Leisure Products | 1,867,440 | |||||||
|
| |||||||
Multiline Retail — 1.1% | ||||||||
| 35,279 | Dollar General Corp. | 7,864,042 | ||||||
| 145,482 | Dollar Tree Inc.* | 13,171,940 | ||||||
| 3,789 | Kohl’s Corp.(a) | 217,489 | ||||||
| 3,084 | Nordstrom Inc.*(a) | 88,233 | ||||||
| 1,893 | Ollie’s Bargain Outlet Holdings Inc.*(a) | 137,015 | ||||||
| 13,114 | Target Corp. | 3,238,896 | ||||||
|
| |||||||
| Total Multiline Retail | 24,717,615 | |||||||
|
| |||||||
Specialty Retail — 2.6% | ||||||||
| 15,457 | Advance Auto Parts Inc. | 3,135,452 | ||||||
| 1,226 | AutoNation Inc.* | 133,744 | ||||||
| 578 | AutoZone Inc.* | 895,409 | ||||||
| 6,489 | Bath & Body Works Inc. | 437,878 | ||||||
| 6,589 | Best Buy Co., Inc. | 767,684 | ||||||
| 1,716 | Burlington Stores Inc.* | 513,925 | ||||||
| 4,354 | CarMax Inc.* | 545,164 | ||||||
| 2,032 | Carvana Co., Class A Shares* | 666,618 | ||||||
| 1,527 | Dick’s Sporting Goods Inc. | 215,017 | ||||||
| 1,385 | Five Below Inc.* | 294,742 | ||||||
| 2,781 | Floor & Decor Holdings Inc., Class A Shares* | 342,897 | ||||||
| 2,365 | Foot Locker Inc. | 134,072 | ||||||
| 1,558 | GameStop Corp., Class A Shares*(a) | 340,018 | ||||||
| 5,906 | Gap Inc. (The) | 157,867 | ||||||
| 46,158 | Home Depot Inc. (The) | 15,055,816 | ||||||
| 2,516 | Leslie’s Inc.*(a) | 60,686 | ||||||
| 11,101 | Lithia Motors Inc., Class A Shares | 3,677,761 | ||||||
| 80,237 | Lowe’s Cos., Inc. | 16,359,522 | ||||||
| 1,794 | O’Reilly Automotive Inc.* | 1,065,780 | ||||||
| 558 | Penske Automotive Group Inc. | 50,181 | ||||||
| 1,115 | Petco Health & Wellness Co., Inc., Class A Shares*(a) | 24,006 | ||||||
| 452 | RH* | 316,703 | ||||||
| 9,231 | Ross Stores Inc. | 1,092,950 | ||||||
| 31,694 | TJX Cos., Inc. (The) | 2,304,788 | ||||||
| 19,672 | Tractor Supply Co. | 3,821,286 | ||||||
| 11,568 | Ulta Beauty Inc.* | 4,480,402 | ||||||
| 2,162 | Victoria’s Secret & Co.*(a) | 143,341 | ||||||
| 3,509 | Vroom Inc.*(a) | 94,252 | ||||||
| 2,028 | Williams-Sonoma Inc. | 378,628 | ||||||
|
| |||||||
| Total Specialty Retail | 57,506,589 | |||||||
|
| |||||||
Textiles, Apparel & Luxury Goods — 0.9% | ||||||||
| 4,136 | Capri Holdings Ltd.* | 233,725 | ||||||
| 977 | Carter’s Inc. | 100,025 | ||||||
| 1,166 | Columbia Sportswear Co. | 118,944 | ||||||
| 735 | Deckers Outdoor Corp.* | 307,561 | ||||||
| 165,945 | Hanesbrands Inc. | 3,099,853 | ||||||
See Notes to Financial Statements.
35
| Schedules of Investments |
| (continued) |
| Large Cap Equity Fund | ||||||||
| Shares/Units | Security | Value | ||||||
CONSUMER DISCRETIONARY — 12.6% — (continued) | ||||||||
Textiles, Apparel & Luxury Goods — 0.9% — (continued) | ||||||||
| 3,001 | lululemon athletica Inc.* | $ | 1,200,910 | |||||
| 78,744 | NIKE Inc., Class B Shares | 12,972,286 | ||||||
| 1,682 | PVH Corp.* | 176,257 | ||||||
| 1,066 | Ralph Lauren Corp., Class A Shares | 123,795 | ||||||
| 3,281 | Skechers USA Inc., Class A Shares*(a) | 165,461 | ||||||
| 7,279 | Tapestry Inc.* | 293,489 | ||||||
| 5,350 | Under Armour Inc., Class A Shares* | 123,799 | ||||||
| 5,519 | Under Armour Inc., Class C Shares* | 110,711 | ||||||
| 8,845 | VF Corp. | 676,377 | ||||||
|
| |||||||
| Total Textiles, Apparel & Luxury Goods | 19,703,193 | |||||||
|
| |||||||
| TOTAL CONSUMER DISCRETIONARY | 273,681,518 | |||||||
|
| |||||||
CONSUMER STAPLES — 4.4% | ||||||||
Beverages — 0.9% | ||||||||
| 26,460 | Anheuser-Busch InBev SA, ADR(a) | 1,620,675 | ||||||
| 265 | Boston Beer Co., Inc. (The), Class A Shares* | 151,106 | ||||||
| 1,309 | Brown-Forman Corp., Class A Shares | 86,656 | ||||||
| 4,770 | Brown-Forman Corp., Class B Shares | 334,949 | ||||||
| 102,421 | Coca-Cola Co. (The) | 5,767,327 | ||||||
| 4,252 | Constellation Brands Inc., Class A Shares | 897,767 | ||||||
| 17,846 | Keurig Dr Pepper Inc. | 636,567 | ||||||
| 4,392 | Molson Coors Beverage Co., Class B Shares | 208,752 | ||||||
| 44,734 | Monster Beverage Corp.* | 4,364,696 | ||||||
| 36,447 | PepsiCo Inc. | 5,699,946 | ||||||
|
| |||||||
| Total Beverages | 19,768,441 | |||||||
|
| |||||||
Food & Staples Retailing — 1.2% | ||||||||
| 3,185 | Albertsons Cos., Inc., Class A Shares(a) | 96,697 | ||||||
| 1,084 | Casey’s General Stores Inc. | 221,743 | ||||||
| 23,195 | Costco Wholesale Corp. | 10,565,091 | ||||||
| 2,977 | Grocery Outlet Holding Corp.* | 77,491 | ||||||
| 19,208 | Kroger Co. (The) | 884,144 | ||||||
| 106,850 | Sysco Corp. | 8,510,602 | ||||||
| 5,735 | US Foods Holding Corp.* | 194,990 | ||||||
| 18,914 | Walgreens Boots Alliance Inc. | 959,886 | ||||||
| 37,842 | Walmart Inc. | 5,604,400 | ||||||
|
| |||||||
| Total Food & Staples Retailing | 27,115,044 | |||||||
|
| |||||||
Food Products — 1.1% | ||||||||
| 129,435 | Archer-Daniels-Midland Co. | 7,766,100 | ||||||
| 1,687 | Beyond Meat Inc.*(a) | 201,833 | ||||||
| 3,929 | Bunge Ltd. | 297,464 | ||||||
| 5,118 | Campbell Soup Co.(a) | 213,574 | ||||||
| 214,872 | Conagra Brands Inc.(a) | 7,116,561 | ||||||
| 4,257 | Darling Ingredients Inc.* | 317,146 | ||||||
| 4,855 | Flowers Foods Inc. | 117,151 | ||||||
| 1,075 | Freshpet Inc.* | 137,750 | ||||||
| 16,043 | General Mills Inc. | 927,446 | ||||||
| 1,756 | Hain Celestial Group Inc. (The)*(a) | 65,692 | ||||||
| 3,897 | Hershey Co. (The) | 692,497 | ||||||
| 7,165 | Hormel Foods Corp. | 326,294 | ||||||
| 1,567 | Ingredion Inc. | 137,677 | ||||||
| 2,669 | J.M. Smucker Co. (The) | 330,075 | ||||||
| 6,630 | Kellogg Co. | 418,618 | ||||||
| 17,744 | Kraft Heinz Co. (The) | 638,606 | ||||||
See Notes to Financial Statements.
36
| Schedules of Investments |
| (continued) |
| Large Cap Equity Fund | ||||||||
| Shares/Units | Security | Value | ||||||
CONSUMER STAPLES — 4.4% — (continued) | ||||||||
Food Products — 1.1% — (continued) | ||||||||
| 3,819 | Lamb Weston Holdings Inc. | $ | 248,808 | |||||
| 6,551 | McCormick & Co., Inc. | 565,286 | ||||||
| 36,781 | Mondelez International Inc., Class A Shares | 2,282,997 | ||||||
| 1,576 | Pilgrim’s Pride Corp.* | 43,876 | ||||||
| 1,623 | Post Holdings Inc.* | 181,630 | ||||||
| 8 | Seaboard Corp. | 34,037 | ||||||
| 7,594 | Tyson Foods Inc., Class A Shares | 596,281 | ||||||
|
| |||||||
| Total Food Products | 23,657,399 | |||||||
|
| |||||||
Household Products — 0.6% | ||||||||
| 6,561 | Church & Dwight Co., Inc. | 548,893 | ||||||
| 3,315 | Clorox Co. (The) | 557,086 | ||||||
| 22,021 | Colgate-Palmolive Co. | 1,716,537 | ||||||
| 8,732 | Kimberly-Clark Corp. | 1,203,357 | ||||||
| 64,228 | Procter & Gamble Co. (The) | 9,145,425 | ||||||
| 1,441 | Reynolds Consumer Products Inc. | 40,752 | ||||||
| 1,140 | Spectrum Brands Holdings Inc. | 88,988 | ||||||
|
| |||||||
| Total Household Products | 13,301,038 | |||||||
|
| |||||||
Personal Products — 0.3% | ||||||||
| 8,462 | Coty Inc., Class A Shares* | 82,674 | ||||||
| 18,079 | Estee Lauder Cos., Inc. (The), Class A Shares | 6,155,718 | ||||||
| 3,068 | Herbalife Nutrition Ltd.* | 157,511 | ||||||
|
| |||||||
| Total Personal Products | 6,395,903 | |||||||
|
| |||||||
Tobacco — 0.3% | ||||||||
| 48,842 | Altria Group Inc. | 2,453,334 | ||||||
| 41,077 | Philip Morris International Inc. | 4,230,931 | ||||||
|
| |||||||
| Total Tobacco | 6,684,265 | |||||||
|
| |||||||
| TOTAL CONSUMER STAPLES | 96,922,090 | |||||||
|
| |||||||
ENERGY — 1.7% | ||||||||
Energy Equipment & Services — 0.1% | ||||||||
| 19,424 | Baker Hughes Co., Class A Shares | 442,479 | ||||||
| 23,431 | Halliburton Co. | 468,151 | ||||||
| 9,006 | NOV Inc.* | 118,609 | ||||||
| 37,678 | Schlumberger NV | 1,056,491 | ||||||
|
| |||||||
| Total Energy Equipment & Services | 2,085,730 | |||||||
|
| |||||||
Oil, Gas & Consumable Fuels — 1.6% | ||||||||
| 8,284 | Antero Midstream Corp. | 79,609 | ||||||
| 9,979 | APA Corp. | 194,391 | ||||||
| 11,611 | Cabot Oil & Gas Corp.(a) | 184,499 | ||||||
| 6,482 | Cheniere Energy Inc.* | 566,916 | ||||||
| 51,034 | Chevron Corp. | 4,938,560 | ||||||
| 2,379 | Cimarex Energy Co. | 152,779 | ||||||
| 159,803 | ConocoPhillips | 8,873,861 | ||||||
| 1,596 | Continental Resources Inc.(a) | 62,691 | ||||||
| 17,768 | Devon Energy Corp. | 525,044 | ||||||
| 4,901 | Diamondback Energy Inc. | 378,063 | ||||||
| 2,537 | DT Midstream Inc.* | 117,894 | ||||||
| 15,395 | EOG Resources Inc. | 1,039,470 | ||||||
| 7,745 | EQT Corp.* | 141,966 | ||||||
| 111,715 | Exxon Mobil Corp. | 6,090,702 | ||||||
| 7,252 | Hess Corp. | 498,575 | ||||||
| 3,742 | HollyFrontier Corp. | 120,979 | ||||||
See Notes to Financial Statements.
37
| Schedules of Investments |
| (continued) |
| Large Cap Equity Fund | ||||||||
| Shares/Units | Security | Value | ||||||
ENERGY — 1.7% — (continued) | ||||||||
Oil, Gas & Consumable Fuels — 1.6% — (continued) | ||||||||
| 51,415 | Kinder Morgan Inc. | $ | 836,522 | |||||
| 19,544 | Marathon Oil Corp. | 229,642 | ||||||
| 17,074 | Marathon Petroleum Corp. | 1,011,976 | ||||||
| 807 | New Fortress Energy Inc., Class A Shares(a) | 23,702 | ||||||
| 21,699 | Occidental Petroleum Corp. | 557,447 | ||||||
| 11,704 | ONEOK Inc. | 614,694 | ||||||
| 11,532 | Phillips 66 | 819,810 | ||||||
| 5,689 | Pioneer Natural Resources Co. | 851,473 | ||||||
| 167,125 | Suncor Energy Inc. | 3,116,881 | ||||||
| 5,528 | Targa Resources Corp. | 242,790 | ||||||
| 155 | Texas Pacific Land Corp. | 210,760 | ||||||
| 10,756 | Valero Energy Corp. | 713,230 | ||||||
| 31,821 | Williams Cos., Inc. (The) | 785,661 | ||||||
|
| |||||||
| Total Oil, Gas & Consumable Fuels | 33,980,587 | |||||||
|
| |||||||
| TOTAL ENERGY | 36,066,317 | |||||||
|
| |||||||
FINANCIALS — 9.6% | ||||||||
Banks — 2.7% | ||||||||
| 198,932 | Bank of America Corp. | 8,305,411 | ||||||
| 1,161 | Bank of Hawaii Corp. | 97,303 | ||||||
| 3,100 | Bank OZK(a) | 131,533 | ||||||
| 603 | BOK Financial Corp. | 53,094 | ||||||
| 54,520 | Citigroup Inc. | 3,920,533 | ||||||
| 11,312 | Citizens Financial Group Inc. | 495,352 | ||||||
| 3,476 | Comerica Inc. | 256,911 | ||||||
| 3,087 | Commerce Bancshares Inc. | 218,313 | ||||||
| 1,428 | Cullen/Frost Bankers Inc. | 163,106 | ||||||
| 3,655 | East West Bancorp Inc. | 268,058 | ||||||
| 17,935 | Fifth Third Bancorp | 696,954 | ||||||
| 167 | First Citizens BancShares Inc., Class A Shares(a) | 149,916 | ||||||
| 4,133 | First Hawaiian Inc. | 115,352 | ||||||
| 14,584 | First Horizon Corp. | 239,032 | ||||||
| 4,738 | First Republic Bank | 942,578 | ||||||
| 7,759 | FNB Corp. | 90,625 | ||||||
| 38,886 | Huntington Bancshares Inc. | 603,900 | ||||||
| 79,341 | JPMorgan Chase & Co. | 12,690,593 | ||||||
| 25,539 | KeyCorp | 518,952 | ||||||
| 3,435 | M&T Bank Corp. | 480,934 | ||||||
| 3,217 | PacWest Bancorp | 136,883 | ||||||
| 10,351 | People’s United Financial Inc. | 170,067 | ||||||
| 2,185 | Pinnacle Financial Partners Inc. | 211,770 | ||||||
| 11,191 | PNC Financial Services Group Inc. (The) | 2,138,600 | ||||||
| 2,467 | Popular Inc. | 187,344 | ||||||
| 2,130 | Prosperity Bancshares Inc. | 148,844 | ||||||
| 25,232 | Regions Financial Corp. | 515,490 | ||||||
| 1,412 | Signature Bank | 366,174 | ||||||
| 4,477 | Sterling Bancorp | 102,479 | ||||||
| 1,425 | SVB Financial Group* | 797,288 | ||||||
| 3,860 | Synovus Financial Corp. | 166,366 | ||||||
| 156,825 | Truist Financial Corp. | 8,948,435 | ||||||
| 4,955 | Umpqua Holdings Corp. | 96,474 | ||||||
| 156,603 | US Bancorp | 8,987,446 | ||||||
| 2,233 | Webster Financial Corp. | 112,811 | ||||||
| 109,123 | Wells Fargo & Co. | 4,986,921 | ||||||
| 2,755 | Western Alliance Bancorp | 268,778 | ||||||
| 1,618 | Wintrust Financial Corp. | 121,091 | ||||||
See Notes to Financial Statements.
38
| Schedules of Investments |
| (continued) |
| Large Cap Equity Fund | ||||||||
| Shares/Units | Security | Value | ||||||
FINANCIALS — 9.6% — (continued) | ||||||||
Banks — 2.7% — (continued) | ||||||||
| 4,423 | Zions Bancorp NA | $ | 256,092 | |||||
|
| |||||||
| Total Banks | 59,157,803 | |||||||
|
| |||||||
Capital Markets — 3.4% | ||||||||
| 20,994 | Affiliated Managers Group Inc. | 3,571,289 | ||||||
| 34,357 | Ameriprise Financial Inc. | 9,376,369 | ||||||
| 4,761 | Apollo Global Management Inc., Class A Shares | 284,613 | ||||||
| 3,623 | Ares Management Corp., Class A Shares | 279,623 | ||||||
| 21,108 | Bank of New York Mellon Corp. (The) | 1,165,584 | ||||||
| 3,771 | BlackRock Inc., Class A Shares | 3,557,147 | ||||||
| 17,959 | Blackstone Inc. | 2,257,985 | ||||||
| 4,276 | Carlyle Group Inc. (The) | 211,149 | ||||||
| 2,785 | Cboe Global Markets Inc. | 351,328 | ||||||
| 41,377 | Charles Schwab Corp. (The) | 3,014,314 | ||||||
| 9,385 | CME Group Inc., Class A Shares | 1,893,142 | ||||||
| 1,126 | Evercore Inc., Class A Shares | 157,235 | ||||||
| 970 | FactSet Research Systems Inc. | 368,813 | ||||||
| 7,826 | Franklin Resources Inc. | 253,875 | ||||||
| 8,705 | Goldman Sachs Group Inc. (The) | 3,599,604 | ||||||
| 2,142 | Interactive Brokers Group Inc., Class A Shares | 138,459 | ||||||
| 87,524 | Intercontinental Exchange Inc. | 10,461,744 | ||||||
| 8,491 | Invesco Ltd. | 214,992 | ||||||
| 2,189 | Janus Henderson Group PLC | 94,915 | ||||||
| 5,894 | Jefferies Financial Group Inc. | 217,842 | ||||||
| 14,905 | KKR & Co., Inc. | 958,242 | ||||||
| 3,171 | Lazard Ltd., Class A Shares | 150,305 | ||||||
| 2,161 | LPL Financial Holdings Inc. | 319,504 | ||||||
| 966 | MarketAxess Holdings Inc. | 459,739 | ||||||
| 4,279 | Moody’s Corp. | 1,629,315 | ||||||
| 36,623 | Morgan Stanley(b) | 3,824,540 | ||||||
| 638 | Morningstar Inc. | 170,978 | ||||||
| 13,454 | MSCI Inc., Class A Shares | 8,537,639 | ||||||
| 3,022 | Nasdaq Inc. | 591,647 | ||||||
| 5,410 | Northern Trust Corp. | 641,193 | ||||||
| 3,241 | Raymond James Financial Inc. | 453,416 | ||||||
| 25,868 | S&P Global Inc. | 11,480,736 | ||||||
| 2,886 | SEI Investments Co. | 181,270 | ||||||
| 9,248 | State Street Corp. | 859,232 | ||||||
| 2,687 | Stifel Financial Corp.(a) | 185,672 | ||||||
| 5,977 | T. Rowe Price Group Inc. | 1,338,071 | ||||||
| 2,818 | Tradeweb Markets Inc., Class A Shares | 245,194 | ||||||
| 2,668 | Virtu Financial Inc., Class A Shares | 65,313 | ||||||
|
| |||||||
| Total Capital Markets | 73,562,028 | |||||||
|
| |||||||
Consumer Finance — 0.7% | ||||||||
| 9,865 | Ally Financial Inc. | 521,858 | ||||||
| 17,191 | American Express Co. | 2,853,018 | ||||||
| 11,821 | Capital One Financial Corp. | 1,961,931 | ||||||
| 201 | Credit Acceptance Corp.*(a) | 116,516 | ||||||
| 61,103 | Discover Financial Services | 7,834,627 | ||||||
| 2,455 | OneMain Holdings Inc., Class A Shares | 141,973 | ||||||
| 1,291 | Santander Consumer USA Holdings Inc.(a) | 53,873 | ||||||
| 8,157 | SLM Corp. | 152,944 | ||||||
| 15,108 | Synchrony Financial | 751,623 | ||||||
| 168 | Upstart Holdings Inc.*(a) | 38,492 | ||||||
|
| |||||||
| Total Consumer Finance | 14,426,855 | |||||||
|
| |||||||
See Notes to Financial Statements.
39
| Schedules of Investments |
| (continued) |
| Large Cap Equity Fund | ||||||||
| Shares/Units | Security | Value | ||||||
FINANCIALS — 9.6% — (continued) | ||||||||
Diversified Financial Services — 0.7% | ||||||||
| 49,474 | Berkshire Hathaway Inc., Class B Shares* | $ | 14,138,185 | |||||
| 9,408 | Equitable Holdings Inc. | 291,742 | ||||||
| 2,974 | Voya Financial Inc. | 193,251 | ||||||
|
| |||||||
| Total Diversified Financial Services | 14,623,178 | |||||||
|
| |||||||
Insurance — 2.1% | ||||||||
| 17,500 | Aflac Inc. | 991,900 | ||||||
| 355 | Alleghany Corp.* | 240,225 | ||||||
| 7,771 | Allstate Corp. (The) | 1,051,261 | ||||||
| 1,836 | American Financial Group Inc. | 253,258 | ||||||
| 148,485 | American International Group Inc. | 8,101,342 | ||||||
| 5,900 | Aon PLC, Class A Shares | 1,692,474 | ||||||
| 10,384 | Arch Capital Group Ltd.* | 426,782 | ||||||
| 5,344 | Arthur J. Gallagher & Co. | 767,505 | ||||||
| 25,391 | Assurant Inc. | 4,319,263 | ||||||
| 1,927 | Assured Guaranty Ltd. | 96,080 | ||||||
| 3,331 | Athene Holding Ltd., Class A Shares* | 223,077 | ||||||
| 1,644 | Axis Capital Holdings Ltd. | 84,124 | ||||||
| 1,952 | Brighthouse Financial Inc.* | 95,570 | ||||||
| 6,159 | Brown & Brown Inc. | 357,530 | ||||||
| 11,806 | Chubb Ltd. | 2,171,360 | ||||||
| 3,954 | Cincinnati Financial Corp. | 487,924 | ||||||
| 826 | CNA Financial Corp. | 36,633 | ||||||
| 717 | Erie Indemnity Co., Class A Shares | 126,974 | ||||||
| 1,126 | Everest Re Group Ltd. | 298,277 | ||||||
| 7,281 | Fidelity National Financial Inc. | 355,531 | ||||||
| 2,597 | First American Financial Corp. | 183,166 | ||||||
| 2,716 | Globe Life Inc. | 260,926 | ||||||
| 2,807 | GoHealth Inc., Class A Shares* | 13,642 | ||||||
| 830 | Hanover Insurance Group Inc. (The) | 117,287 | ||||||
| 9,442 | Hartford Financial Services Group Inc. (The) | 634,691 | ||||||
| 1,386 | Kemper Corp. | 95,080 | ||||||
| 1,212 | Lemonade Inc.*(a) | 91,554 | ||||||
| 90,280 | Lincoln National Corp. | 6,197,722 | ||||||
| 5,467 | Loews Corp. | 305,441 | ||||||
| 357 | Markel Corp.* | 453,479 | ||||||
| 13,377 | Marsh & McLennan Cos., Inc. | 2,102,864 | ||||||
| 827 | Mercury General Corp. | 49,380 | ||||||
| 130,825 | MetLife Inc. | 8,111,150 | ||||||
| 6,738 | Old Republic International Corp. | 175,188 | ||||||
| 1,056 | Primerica Inc. | 161,505 | ||||||
| 6,910 | Principal Financial Group Inc. | 461,657 | ||||||
| 15,406 | Progressive Corp. (The) | 1,484,214 | ||||||
| 10,433 | Prudential Financial Inc. | 1,104,646 | ||||||
| 1,634 | Reinsurance Group of America Inc., Class A Shares | 189,250 | ||||||
| 1,287 | RenaissanceRe Holdings Ltd. | 201,712 | ||||||
| 6,683 | Travelers Cos., Inc. (The) | 1,067,342 | ||||||
| 5,702 | Unum Group | 151,787 | ||||||
| 85 | White Mountains Insurance Group Ltd. | 95,269 | ||||||
| 3,399 | Willis Towers Watson PLC | 750,227 | ||||||
| 3,925 | WR Berkley Corp. | 295,592 | ||||||
|
| |||||||
| Total Insurance | 46,931,861 | |||||||
|
| |||||||
See Notes to Financial Statements.
40
| Schedules of Investments |
| (continued) |
| Large Cap Equity Fund | ||||||||
| Shares/Units | Security | Value | ||||||
FINANCIALS — 9.6% — (continued) | ||||||||
Mortgage Real Estate Investment Trusts (REITs) — 0.0% | ||||||||
| 14,044 | AGNC Investment Corp. | $ | 229,058 | |||||
| 37,037 | Annaly Capital Management Inc. | 321,852 | ||||||
| 9,809 | New Residential Investment Corp. | 107,114 | ||||||
| 7,983 | Starwood Property Trust Inc. | 205,961 | ||||||
|
| |||||||
| Total Mortgage Real Estate Investment Trusts (REITs) | 863,985 | |||||||
|
| |||||||
Thrifts & Mortgage Finance — 0.0% | ||||||||
| 7,432 | MGIC Investment Corp. | 113,487 | ||||||
| 13,789 | New York Community Bancorp Inc. | 172,638 | ||||||
| 4,414 | Rocket Cos., Inc., Class A Shares(a) | 76,583 | ||||||
| 1,501 | TFS Financial Corp. | 30,005 | ||||||
| 3,552 | UWM Holdings Corp.(a) | 26,107 | ||||||
|
| |||||||
| Total Thrifts & Mortgage Finance | 418,820 | |||||||
|
| |||||||
| TOTAL FINANCIALS | 209,984,530 | |||||||
|
| |||||||
HEALTH CARE — 13.6% | ||||||||
Biotechnology — 1.6% | ||||||||
| 46,606 | AbbVie Inc. | 5,629,073 | ||||||
| 1,377 | Acceleron Pharma Inc.* | 184,353 | ||||||
| 3,048 | Alnylam Pharmaceuticals Inc.* | 613,959 | ||||||
| 15,160 | Amgen Inc. | 3,419,035 | ||||||
| 3,928 | Biogen Inc.* | 1,331,238 | ||||||
| 64,668 | BioMarin Pharmaceutical Inc.* | 5,445,692 | ||||||
| 1,399 | CureVac NV*(a) | 92,096 | ||||||
| 41,369 | Exact Sciences Corp.* | 4,318,096 | ||||||
| 7,868 | Exelixis Inc.* | 150,829 | ||||||
| 33,115 | Gilead Sciences Inc. | 2,410,110 | ||||||
| 5,751 | Horizon Therapeutics PLC* | 621,626 | ||||||
| 4,864 | Incyte Corp.* | 372,047 | ||||||
| 4,049 | Ionis Pharmaceuticals Inc.* | 160,988 | ||||||
| 4,411 | Iovance Biotherapeutics Inc.* | 106,173 | ||||||
| 1,034 | Mirati Therapeutics Inc.* | 175,501 | ||||||
| 8,923 | Moderna Inc.* | 3,361,205 | ||||||
| 2,062 | Natera Inc.* | 244,203 | ||||||
| 2,458 | Neurocrine Biosciences Inc.* | 234,002 | ||||||
| 1,946 | Novavax Inc.*(a) | 464,199 | ||||||
| 2,682 | Regeneron Pharmaceuticals Inc.* | 1,806,059 | ||||||
| 1,478 | Sage Therapeutics Inc.* | 68,298 | ||||||
| 22,339 | Sarepta Therapeutics Inc.* | 1,745,123 | ||||||
| 3,527 | Seagen Inc.* | 591,125 | ||||||
| 1,698 | Ultragenyx Pharmaceutical Inc.* | 163,500 | ||||||
| 1,081 | United Therapeutics Corp.* | 232,285 | ||||||
| 6,833 | Vertex Pharmaceuticals Inc.* | 1,368,581 | ||||||
|
| |||||||
| Total Biotechnology | 35,309,396 | |||||||
|
| |||||||
Health Care Equipment & Supplies — 3.9% | ||||||||
| 45,820 | Abbott Laboratories | 5,790,273 | ||||||
| 13,101 | ABIOMED Inc.* | 4,768,240 | ||||||
| 39,270 | Alcon Inc. | 3,238,597 | ||||||
| 10,484 | Align Technology Inc.* | 7,433,156 | ||||||
| 64,473 | Baxter International Inc. | 4,914,132 | ||||||
| 7,621 | Becton Dickinson and Co. | 1,918,206 | ||||||
| 37,413 | Boston Scientific Corp.* | 1,689,197 | ||||||
| 1,251 | Cooper Cos., Inc. (The) | 563,838 | ||||||
| 16,647 | Danaher Corp. | 5,396,292 | ||||||
| 5,737 | DENTSPLY SIRONA Inc. | 353,973 | ||||||
See Notes to Financial Statements.
41
| Schedules of Investments |
| (continued) |
| Large Cap Equity Fund | ||||||||
| Shares/Units | Security | Value | ||||||
HEALTH CARE — 13.6% — (continued) | ||||||||
Health Care Equipment & Supplies — 3.9% — (continued) | ||||||||
| 2,541 | DexCom Inc.* | $ | 1,345,256 | |||||
| 55,041 | Edwards Lifesciences Corp.* | 6,449,704 | ||||||
| 4,641 | Envista Holdings Corp.* | 198,588 | ||||||
| 2,160 | Globus Medical Inc., Class A Shares* | 176,256 | ||||||
| 1,652 | Hill-Rom Holdings Inc. | 240,498 | ||||||
| 6,351 | Hologic Inc.* | 502,682 | ||||||
| 426 | ICU Medical Inc.* | 84,923 | ||||||
| 7,976 | IDEXX Laboratories Inc.* | 5,373,910 | ||||||
| 1,732 | Insulet Corp.* | 515,807 | ||||||
| 1,619 | Integra LifeSciences Holdings Corp.* | 121,797 | ||||||
| 5,347 | Intuitive Surgical Inc.* | 5,633,385 | ||||||
| 1,407 | Masimo Corp.* | 382,057 | ||||||
| 158,648 | Medtronic PLC | 21,176,335 | ||||||
| 2,783 | Novocure Ltd.* | 373,506 | ||||||
| 910 | Penumbra Inc.* | 250,205 | ||||||
| 1,074 | Quidel Corp.*(a) | 138,492 | ||||||
| 3,786 | ResMed Inc. | 1,099,947 | ||||||
| 2,588 | STERIS PLC | 556,446 | ||||||
| 9,168 | Stryker Corp. | 2,540,453 | ||||||
| 1,410 | Tandem Diabetes Care Inc.* | 158,160 | ||||||
| 1,227 | Teleflex Inc. | 485,229 | ||||||
| 1,938 | West Pharmaceutical Services Inc. | 875,240 | ||||||
| 5,473 | Zimmer Biomet Holdings Inc. | 823,413 | ||||||
|
| |||||||
| Total Health Care Equipment & Supplies | 85,568,193 | |||||||
|
| |||||||
Health Care Providers & Services — 3.5% | ||||||||
| 2,475 | Acadia Healthcare Co., Inc.* | 163,647 | ||||||
| 1,321 | agilon health Inc.*(a) | 46,235 | ||||||
| 830 | Amedisys Inc.* | 152,263 | ||||||
| 3,849 | AmerisourceBergen Corp., Class A Shares | 470,386 | ||||||
| 6,461 | Anthem Inc. | 2,423,715 | ||||||
| 136,826 | Cardinal Health Inc. | 7,181,997 | ||||||
| 101,979 | Centene Corp.* | 6,422,637 | ||||||
| 421 | Chemed Corp. | 200,691 | ||||||
| 63,464 | Cigna Corp. | 13,432,156 | ||||||
| 115,126 | CVS Health Corp. | 9,945,735 | ||||||
| 1,871 | DaVita Inc.* | 244,671 | ||||||
| 2,467 | Encompass Health Corp. | 193,536 | ||||||
| 2,487 | Guardant Health Inc.* | 316,520 | ||||||
| 34,923 | HCA Healthcare Inc. | 8,834,821 | ||||||
| 3,736 | Henry Schein Inc.* | 282,404 | ||||||
| 3,401 | Humana Inc. | 1,378,833 | ||||||
| 2,528 | Laboratory Corp. of America Holdings* | 766,945 | ||||||
| 4,207 | McKesson Corp. | 858,817 | ||||||
| 1,552 | Molina Healthcare Inc.* | 417,131 | ||||||
| 2,407 | Oak Street Health Inc.*(a) | 112,479 | ||||||
| 3,170 | Premier Inc., Class A Shares | 117,861 | ||||||
| 3,282 | Quest Diagnostics Inc. | 501,588 | ||||||
| 227 | Signify Health Inc., Class A Shares* | 5,900 | ||||||
| 48,445 | UnitedHealth Group Inc. | 20,166,200 | ||||||
| 2,091 | Universal Health Services Inc., Class B Shares | 325,694 | ||||||
|
| |||||||
| Total Health Care Providers & Services | 74,962,862 | |||||||
|
| |||||||
See Notes to Financial Statements.
42
| Schedules of Investments |
| (continued) |
| Large Cap Equity Fund | ||||||||
| Shares/Units | Security | Value | ||||||
HEALTH CARE — 13.6% — (continued) | ||||||||
Health Care Technology — 0.1% | ||||||||
| 7,944 | Cerner Corp. | $ | 606,524 | |||||
| 847 | Certara Inc.* | 28,434 | ||||||
| 6,869 | Change Healthcare Inc.* | 149,950 | ||||||
| 3,863 | Teladoc Health Inc.*(a) | 557,894 | ||||||
| 3,677 | Veeva Systems Inc., Class A Shares* | 1,220,691 | ||||||
|
| |||||||
| Total Health Care Technology | 2,563,493 | |||||||
|
| |||||||
Life Sciences Tools & Services — 1.4% | ||||||||
| 2,203 | 10X Genomics Inc., Class A Shares* | 387,552 | ||||||
| 2,867 | Adaptive Biotechnologies Corp.* | 104,130 | ||||||
| 8,060 | Agilent Technologies Inc. | 1,414,288 | ||||||
| 15,277 | Avantor Inc.* | 602,525 | ||||||
| 596 | Bio-Rad Laboratories Inc., Class A Shares* | 479,673 | ||||||
| 982 | Bio-Techne Corp. | 490,156 | ||||||
| 3,044 | Bruker Corp. | 268,816 | ||||||
| 1,290 | Charles River Laboratories International Inc.* | 572,579 | ||||||
| 13,345 | Illumina Inc.* | 6,100,800 | ||||||
| 5,023 | IQVIA Holdings Inc.* | 1,304,624 | ||||||
| 1,757 | Maravai LifeSciences Holdings Inc., Class A Shares* | 103,979 | ||||||
| 610 | Mettler-Toledo International Inc.* | 947,226 | ||||||
| 3,109 | PerkinElmer Inc. | 574,543 | ||||||
| 3,780 | PPD Inc.* | 175,052 | ||||||
| 5,898 | QIAGEN NV* | 329,226 | ||||||
| 1,371 | Repligen Corp.* | 387,966 | ||||||
| 113,064 | Sotera Health Co.* | 2,765,546 | ||||||
| 2,680 | Syneos Health Inc., Class A Shares* | 248,650 | ||||||
| 21,034 | Thermo Fisher Scientific Inc. | 11,672,818 | ||||||
| 1,616 | Waters Corp.* | 669,056 | ||||||
|
| |||||||
| Total Life Sciences Tools & Services | 29,599,205 | |||||||
|
| |||||||
Pharmaceuticals — 3.1% | ||||||||
| 58,927 | Bristol-Myers Squibb Co. | 3,939,859 | ||||||
| 4,195 | Catalent Inc.* | 547,196 | ||||||
| 11,827 | Elanco Animal Health Inc.* | 394,785 | ||||||
| 33,447 | Eli Lilly & Co. | 8,639,025 | ||||||
| 1,528 | Jazz Pharmaceuticals PLC* | 201,253 | ||||||
| 107,806 | Johnson & Johnson | 18,664,453 | ||||||
| 153,630 | Merck & Co., Inc. | 11,720,433 | ||||||
| 5,112 | Nektar Therapeutics, Class A Shares*(a) | 79,134 | ||||||
| 6,683 | Organon & Co. | 226,487 | ||||||
| 3,555 | Perrigo Co. PLC | 145,577 | ||||||
| 147,267 | Pfizer Inc. | 6,784,591 | ||||||
| 8,624 | Royalty Pharma PLC, Class A Shares | 333,317 | ||||||
| 493,071 | Viatris Inc. | 7,213,629 | ||||||
| 40,194 | Zoetis Inc., Class A Shares | 8,222,085 | ||||||
|
| |||||||
| Total Pharmaceuticals | 67,111,824 | |||||||
|
| |||||||
| TOTAL HEALTH CARE | 295,114,973 | |||||||
|
| |||||||
INDUSTRIALS — 9.5% | ||||||||
Aerospace & Defense — 1.5% | ||||||||
| 1,650 | Axon Enterprise Inc.* | 300,086 | ||||||
| 14,126 | Boeing Co. (The)* | 3,100,657 | ||||||
| 2,831 | BWX Technologies Inc. | 162,584 | ||||||
| 911 | Curtiss-Wright Corp. | 110,942 | ||||||
| 6,632 | General Dynamics Corp. | 1,328,456 | ||||||
See Notes to Financial Statements.
43
| Schedules of Investments |
| (continued) |
| Large Cap Equity Fund | ||||||||
| Shares/Units | Security | Value | ||||||
INDUSTRIALS — 9.5% — (continued) | ||||||||
Aerospace & Defense — 1.5% — (continued) | ||||||||
| 1,318 | HEICO Corp. | $ | 167,149 | |||||
| 2,086 | HEICO Corp., Class A Shares | 238,305 | ||||||
| 1,987 | Hexcel Corp.*(a) | 112,683 | ||||||
| 10,331 | Howmet Aerospace Inc. | 328,009 | ||||||
| 994 | Huntington Ingalls Industries Inc. | 202,945 | ||||||
| 5,388 | L3Harris Technologies Inc. | 1,255,458 | ||||||
| 6,533 | Lockheed Martin Corp. | 2,350,573 | ||||||
| 1,616 | Mercury Systems Inc.* | 81,414 | ||||||
| 22,781 | Northrop Grumman Corp. | 8,376,574 | ||||||
| 157,386 | Raytheon Technologies Corp. | 13,340,037 | ||||||
| 2,933 | Spirit AeroSystems Holdings Inc., Class A Shares | 115,091 | ||||||
| 5,812 | Textron Inc. | 422,358 | ||||||
| 1,347 | TransDigm Group Inc.* | 818,262 | ||||||
| 3,784 | Virgin Galactic Holdings Inc.*(a) | 102,584 | ||||||
|
| |||||||
| Total Aerospace & Defense | 32,914,167 | |||||||
|
| |||||||
Air Freight & Logistics — 0.7% | ||||||||
| 3,482 | CH Robinson Worldwide Inc. | 313,589 | ||||||
| 4,458 | Expeditors International of Washington Inc. | 555,645 | ||||||
| 6,466 | FedEx Corp. | 1,717,952 | ||||||
| 48,223 | GXO Logistics Inc.* | 3,944,159 | ||||||
| 44,737 | United Parcel Service Inc., Class B Shares | 8,751,899 | ||||||
|
| |||||||
| Total Air Freight & Logistics | 15,283,244 | |||||||
|
| |||||||
Airlines — 0.1% | ||||||||
| 3,030 | Alaska Air Group Inc.* | 173,740 | ||||||
| 16,990 | American Airlines Group Inc.*(a) | 338,781 | ||||||
| 893 | Copa Holdings SA, Class A Shares* | 67,198 | ||||||
| 16,841 | Delta Air Lines Inc.* | 681,050 | ||||||
| 7,862 | JetBlue Airways Corp.* | 118,952 | ||||||
| 15,569 | Southwest Airlines Co.* | 775,025 | ||||||
| 8,748 | United Airlines Holdings Inc.* | 406,870 | ||||||
|
| |||||||
| Total Airlines | 2,561,616 | |||||||
|
| |||||||
Building Products — 0.7% | ||||||||
| 1,482 | Advanced Drainage Systems Inc. | 169,170 | ||||||
| 2,374 | Allegion PLC | 341,832 | ||||||
| 3,615 | AO Smith Corp. | 262,883 | ||||||
| 46,875 | Armstrong World Industries Inc. | 4,871,719 | ||||||
| 2,837 | AZEK Co., Inc. (The), Class A Shares* | 120,544 | ||||||
| 5,399 | Builders FirstSource Inc.* | 287,713 | ||||||
| 1,283 | Carlisle Cos., Inc. | 270,380 | ||||||
| 22,940 | Carrier Global Corp. | 1,321,344 | ||||||
| 3,636 | Fortune Brands Home & Security Inc. | 354,037 | ||||||
| 18,873 | Johnson Controls International PLC | 1,411,700 | ||||||
| 893 | Lennox International Inc.(a) | 299,316 | ||||||
| 6,636 | Masco Corp. | 402,938 | ||||||
| 2,601 | Owens Corning | 248,526 | ||||||
| 26,744 | Trane Technologies PLC | 5,308,684 | ||||||
| 3,320 | Trex Co., Inc.* | 364,403 | ||||||
|
| |||||||
| Total Building Products | 16,035,189 | |||||||
|
| |||||||
Commercial Services & Supplies — 0.7% | ||||||||
| 5,993 | ADT Inc. | 51,300 | ||||||
| 2,332 | Cintas Corp. | 922,936 | ||||||
| 1,107 | Clean Harbors Inc.* | 113,600 | ||||||
See Notes to Financial Statements.
44
| Schedules of Investments |
| (continued) |
| Large Cap Equity Fund | ||||||||
| Shares/Units | Security | Value | ||||||
INDUSTRIALS — 9.5% — (continued) | ||||||||
Commercial Services & Supplies — 0.7% — (continued) | ||||||||
| 5,665 | Copart Inc.* | $ | 817,573 | |||||
| 1,107 | Driven Brands Holdings Inc.*(a) | 33,077 | ||||||
| 3,928 | IAA Inc.* | 208,655 | ||||||
| 852 | MSA Safety Inc. | 138,740 | ||||||
| 5,536 | Republic Services Inc., Class A Shares | 687,184 | ||||||
| 6,568 | Rollins Inc. | 255,627 | ||||||
| 2,749 | Stericycle Inc.* | 191,330 | ||||||
| 73,621 | Waste Management Inc. | 11,419,353 | ||||||
|
| |||||||
| Total Commercial Services & Supplies | 14,839,375 | |||||||
|
| |||||||
Construction & Engineering — 0.0% | ||||||||
| 3,849 | AECOM* | 252,340 | ||||||
| 1,479 | MasTec Inc.* | 135,240 | ||||||
| 3,481 | Quanta Services Inc. | 355,410 | ||||||
| 457 | Valmont Industries Inc. | 113,729 | ||||||
|
| |||||||
| Total Construction & Engineering | 856,719 | |||||||
|
| |||||||
Electrical Equipment — 0.6% | ||||||||
| 861 | Acuity Brands Inc. | 158,880 | ||||||
| 5,977 | AMETEK Inc. | 812,693 | ||||||
| 105,955 | Bloom Energy Corp., Class A Shares*(a) | 2,269,556 | ||||||
| 3,296 | ChargePoint Holdings Inc.*(a) | 69,710 | ||||||
| 30,049 | Eaton Corp. PLC | 5,059,050 | ||||||
| 15,736 | Emerson Electric Co. | 1,660,148 | ||||||
| 1,631 | Generac Holdings Inc.* | 712,714 | ||||||
| 1,395 | Hubbell Inc., Class B Shares | 287,524 | ||||||
| 4,394 | nVent Electric PLC | 150,978 | ||||||
| 13,187 | Plug Power Inc.*(a) | 343,653 | ||||||
| 1,029 | Regal Beloit Corp.(a) | 153,753 | ||||||
| 3,062 | Rockwell Automation Inc. | 996,528 | ||||||
| 4,172 | Sensata Technologies Holding PLC* | 246,899 | ||||||
| 2,140 | Shoals Technologies Group Inc., Class A Shares* | 69,700 | ||||||
| 5,252 | Sunrun Inc.* | 232,401 | ||||||
| 7,408 | Vertiv Holdings Co., Class A Shares | 208,683 | ||||||
|
| |||||||
| Total Electrical Equipment | 13,432,870 | |||||||
|
| |||||||
Industrial Conglomerates — 0.9% | ||||||||
| 15,257 | 3M Co. | 2,971,148 | ||||||
| 28,781 | General Electric Co. | 3,033,805 | ||||||
| 48,074 | Honeywell International Inc. | 11,148,841 | ||||||
| 2,752 | Roper Technologies Inc. | 1,329,987 | ||||||
|
| |||||||
| Total Industrial Conglomerates | 18,483,781 | |||||||
|
| |||||||
Machinery — 1.2% | ||||||||
| 1,599 | AGCO Corp. | 220,054 | ||||||
| 2,505 | Allison Transmission Holdings Inc.(a) | 92,635 | ||||||
| 14,500 | Caterpillar Inc. | 3,057,615 | ||||||
| 3,538 | Colfax Corp.*(a) | 170,425 | ||||||
| 1,067 | Crane Co. | 108,589 | ||||||
| 3,851 | Cummins Inc. | 908,759 | ||||||
| 7,436 | Deere & Co. | 2,811,031 | ||||||
| 3,119 | Donaldson Co., Inc. | 211,312 | ||||||
| 43,092 | Dover Corp. | 7,513,521 | ||||||
| 4,009 | Flowserve Corp.(a) | 155,830 | ||||||
| 8,610 | Fortive Corp. | 636,021 | ||||||
See Notes to Financial Statements.
45
| Schedules of Investments |
| (continued) |
| Large Cap Equity Fund | ||||||||
| Shares/Units | Security | Value | ||||||
INDUSTRIALS — 9.5% — (continued) | ||||||||
Machinery — 1.2% — (continued) | ||||||||
| 1,535 | Gates Industrial Corp. PLC* | $ | 25,143 | |||||
| 4,347 | Graco Inc. | 340,892 | ||||||
| 1,989 | IDEX Corp. | 445,536 | ||||||
| 8,296 | Illinois Tool Works Inc. | 1,931,807 | ||||||
| 9,881 | Ingersoll Rand Inc.* | 523,891 | ||||||
| 2,266 | ITT Inc. | 216,788 | ||||||
| 1,386 | Lincoln Electric Holdings Inc. | 193,500 | ||||||
| 1,510 | Middleby Corp. (The)* | 276,239 | ||||||
| 1,613 | Nordson Corp. | 384,862 | ||||||
| 1,965 | Oshkosh Corp. | 225,150 | ||||||
| 11,472 | Otis Worldwide Corp. | 1,057,948 | ||||||
| 8,961 | PACCAR Inc. | 733,637 | ||||||
| 3,494 | Parker-Hannifin Corp. | 1,036,565 | ||||||
| 4,262 | Pentair PLC | 328,856 | ||||||
| 1,334 | Snap-on Inc. | 300,083 | ||||||
| 4,254 | Stanley Black & Decker Inc. | 822,171 | ||||||
| 1,488 | Timken Co. (The) | 109,428 | ||||||
| 2,795 | Toro Co. (The) | 307,282 | ||||||
| 4,684 | Westinghouse Air Brake Technologies Corp. | 420,576 | ||||||
| 1,377 | Woodward Inc. | 166,534 | ||||||
| 4,724 | Xylem Inc. | 643,928 | ||||||
|
| |||||||
| Total Machinery | 26,376,608 | |||||||
|
| |||||||
Marine — 0.0% | ||||||||
| 1,722 | Kirby Corp.* | 92,282 | ||||||
|
| |||||||
Professional Services — 0.9% | ||||||||
| 3,882 | Booz Allen Hamilton Holding Corp., Class A Shares | 317,975 | ||||||
| 585 | CACI International Inc., Class A Shares* | 150,661 | ||||||
| 10,857 | Clarivate PLC* | 273,488 | ||||||
| 54,553 | CoStar Group Inc.* | 4,622,821 | ||||||
| 4,458 | Dun & Bradstreet Holdings Inc.* | 81,715 | ||||||
| 3,127 | Equifax Inc. | 851,357 | ||||||
| 866 | FTI Consulting Inc.* | 120,989 | ||||||
| 46,031 | IHS Markit Ltd. | 5,551,339 | ||||||
| 3,396 | Jacobs Engineering Group Inc. | 458,324 | ||||||
| 3,793 | Leidos Holdings Inc. | 372,131 | ||||||
| 1,459 | ManpowerGroup Inc. | 177,152 | ||||||
| 8,892 | Nielsen Holdings PLC | 190,822 | ||||||
| 2,978 | Robert Half International Inc. | 307,925 | ||||||
| 1,327 | Science Applications International Corp. | 111,773 | ||||||
| 5,017 | TransUnion | 609,716 | ||||||
| 26,259 | Verisk Analytics Inc., Class A Shares | 5,298,016 | ||||||
|
| |||||||
| Total Professional Services | 19,496,204 | |||||||
|
| |||||||
Road & Rail — 1.1% | ||||||||
| 252 | AMERCO | 166,610 | ||||||
| 59,727 | CSX Corp. | 1,942,919 | ||||||
| 2,236 | JB Hunt Transport Services Inc. | 396,666 | ||||||
| 2,394 | Kansas City Southern | 671,924 | ||||||
| 4,236 | Knight-Swift Transportation Holdings Inc., Class A Shares | 219,975 | ||||||
| 898 | Landstar System Inc. | 150,891 | ||||||
| 7,389 | Lyft Inc., Class A Shares* | 351,790 | ||||||
| 19,481 | Norfolk Southern Corp. | 4,939,213 | ||||||
| 2,791 | Old Dominion Freight Line Inc. | 805,818 | ||||||
| 1,485 | Ryder System Inc. | 118,043 | ||||||
See Notes to Financial Statements.
46
| Schedules of Investments |
| (continued) |
| Large Cap Equity Fund | ||||||||
| Shares/Units | Security | Value | ||||||
INDUSTRIALS — 9.5% — (continued) | ||||||||
Road & Rail — 1.2% — (continued) | ||||||||
| 1,656 | Schneider National Inc., Class B Shares | $ | 37,326 | |||||
| 944 | TuSimple Holdings Inc., Class A Shares*(a) | 39,516 | ||||||
| 229,088 | Uber Technologies Inc.* | 8,966,504 | ||||||
| 17,524 | Union Pacific Corp. | 3,799,904 | ||||||
| 2,383 | XPO Logistics Inc.* | 207,107 | ||||||
|
| |||||||
| Total Road & Rail | 22,814,206 | |||||||
|
| |||||||
Trading Companies & Distributors — 1.1% | ||||||||
| 71,575 | AerCap Holdings NV* | 3,860,040 | ||||||
| 59,120 | Air Lease Corp., Class A Shares | 2,349,429 | ||||||
| 15,045 | Fastenal Co. | 840,263 | ||||||
| 993 | MSC Industrial Direct Co., Inc., Class A Shares | 83,620 | ||||||
| 1,161 | SiteOne Landscape Supply Inc.* | 232,316 | ||||||
| 26,388 | United Rentals Inc.* | 9,305,728 | ||||||
| 85,398 | Univar Solutions Inc.* | 2,016,247 | ||||||
| 826 | Watsco Inc. | 229,975 | ||||||
| 9,510 | WW Grainger Inc. | 4,124,487 | ||||||
|
| |||||||
| Total Trading Companies & Distributors | 23,042,105 | |||||||
|
| |||||||
| TOTAL INDUSTRIALS | 206,228,366 | |||||||
|
| |||||||
INFORMATION TECHNOLOGY — 28.7% | ||||||||
Communications Equipment — 1.1% | ||||||||
| 1,639 | Arista Networks Inc.* | 605,660 | ||||||
| 4,418 | Ciena Corp.* | 252,400 | ||||||
| 227,779 | Cisco Systems Inc. | 13,443,517 | ||||||
| 77,087 | CommScope Holding Co., Inc.* | 1,217,975 | ||||||
| 1,507 | F5 Networks Inc.*(a) | 306,780 | ||||||
| 8,703 | Juniper Networks Inc. | 252,213 | ||||||
| 2,060 | Lumentum Holdings Inc.* | 178,478 | ||||||
| 32,842 | Motorola Solutions Inc. | 8,020,673 | ||||||
| 142 | Ubiquiti Inc. | 46,201 | ||||||
| 1,717 | ViaSat Inc.*(a) | 88,666 | ||||||
|
| |||||||
| Total Communications Equipment | 24,412,563 | |||||||
|
| |||||||
Electronic Equipment, Instruments & Components — 1.1% | ||||||||
| 15,422 | Amphenol Corp., Class A Shares | 1,181,788 | ||||||
| 36,061 | Arrow Electronics Inc.* | 4,371,314 | ||||||
| 2,133 | Avnet Inc. | 86,301 | ||||||
| 16,647 | CDW Corp. | 3,339,555 | ||||||
| 4,393 | Cognex Corp. | 389,308 | ||||||
| 573 | Coherent Inc.* | 144,780 | ||||||
| 20,610 | Corning Inc. | 824,194 | ||||||
| 203,645 | Flex Ltd.* | 3,783,724 | ||||||
| 1,049 | IPG Photonics Corp.* | 179,043 | ||||||
| 3,660 | Jabil Inc. | 226,115 | ||||||
| 4,884 | Keysight Technologies Inc.* | 876,092 | ||||||
| 672 | Littelfuse Inc. | 191,789 | ||||||
| 4,017 | National Instruments Corp. | 167,991 | ||||||
| 22,901 | SYNNEX Corp. | 2,910,030 | ||||||
| 1,200 | Teledyne Technologies Inc.* | 556,056 | ||||||
| 6,586 | Trimble Inc.* | 620,533 | ||||||
| 4,395 | Vontier Corp. | 159,846 | ||||||
| 8,240 | Zebra Technologies Corp., Class A Shares* | 4,838,281 | ||||||
|
| |||||||
| Total Electronic Equipment, Instruments & Components | 24,846,740 | |||||||
|
| |||||||
See Notes to Financial Statements.
47
| Schedules of Investments |
| (continued) |
| Large Cap Equity Fund | ||||||||
| Shares/Units | Security | Value | ||||||
INFORMATION TECHNOLOGY — 28.7% — (continued) | ||||||||
IT Services — 6.5% | ||||||||
| 16,776 | Accenture PLC, Class A Shares | $ | 5,646,131 | |||||
| 23,638 | Akamai Technologies Inc.* | 2,677,003 | ||||||
| 26,878 | Alliance Data Systems Corp. | 2,637,001 | ||||||
| 3,412 | Amdocs Ltd. | 262,826 | ||||||
| 11,219 | Automatic Data Processing Inc. | 2,345,220 | ||||||
| 3,027 | Broadridge Financial Solutions Inc. | 521,310 | ||||||
| 6,623 | Cloudflare Inc., Class A Shares* | 799,661 | ||||||
| 101,605 | Cognizant Technology Solutions Corp., Class A Shares | 7,753,478 | ||||||
| 22,943 | Concentrix Corp.* | 3,978,087 | ||||||
| 7,317 | DXC Technology Co.* | 268,680 | ||||||
| 1,476 | EPAM Systems Inc.* | 934,028 | ||||||
| 1,459 | Euronet Worldwide Inc.* | 194,383 | ||||||
| 2,785 | Fastly Inc., Class A Shares*(a) | 121,426 | ||||||
| 91,781 | Fidelity National Information Services Inc. | 11,726,858 | ||||||
| 155,041 | Fiserv Inc.* | 18,262,279 | ||||||
| 2,114 | FleetCor Technologies Inc.* | 556,574 | ||||||
| 2,131 | Gartner Inc.* | 657,925 | ||||||
| 4,386 | Genpact Ltd. | 227,546 | ||||||
| 7,733 | Global Payments Inc. | 1,257,695 | ||||||
| 935 | Globant SA* | 301,332 | ||||||
| 4,421 | GoDaddy Inc., Class A Shares* | 324,103 | ||||||
| 23,573 | International Business Machines Corp. | 3,308,235 | ||||||
| 1,998 | Jack Henry & Associates Inc. | 352,407 | ||||||
| 61,025 | LiveRamp Holdings Inc.* | 2,990,225 | ||||||
| 23,082 | MasterCard Inc., Class A Shares | 7,991,681 | ||||||
| 1,355 | MongoDB Inc., Class A Shares* | 530,930 | ||||||
| 3,273 | Okta Inc., Class A Shares* | 862,763 | ||||||
| 8,472 | Paychex Inc. | 969,790 | ||||||
| 57,093 | PayPal Holdings Inc.* | 16,480,465 | ||||||
| 8,127 | Paysafe Ltd.*(a) | 68,754 | ||||||
| 7,975 | Sabre Corp.* | 89,559 | ||||||
| 1,131 | Shift4 Payments Inc., Class A Shares* | 96,938 | ||||||
| 3,147 | Snowflake Inc., Class A Shares* | 957,789 | ||||||
| 646 | SolarWinds Corp. | 11,027 | ||||||
| 27,861 | Square Inc., Class A Shares* | 7,468,698 | ||||||
| 5,826 | StoneCo Ltd., Class A Shares* | 271,142 | ||||||
| 3,785 | Switch Inc., Class A Shares | 93,906 | ||||||
| 4,269 | Twilio Inc., Class A Shares* | 1,523,862 | ||||||
| 15,973 | VeriSign Inc.* | 3,454,321 | ||||||
| 135,948 | Visa Inc., Class A Shares | 31,145,687 | ||||||
| 10,789 | Western Union Co. (The) | 233,474 | ||||||
| 1,273 | WEX Inc.* | 233,685 | ||||||
| 1,405 | Wix.com Ltd.* | 312,022 | ||||||
|
| |||||||
| Total IT Services | 140,900,906 | |||||||
|
| |||||||
Semiconductors & Semiconductor Equipment — 5.8% | ||||||||
| 31,683 | Advanced Micro Devices Inc.* | 3,507,942 | ||||||
| 2,193 | Allegro MicroSystems Inc.* | 65,900 | ||||||
| 89,780 | Analog Devices Inc. | 14,629,651 | ||||||
| 24,148 | Applied Materials Inc. | 3,263,119 | ||||||
| 4,070 | ASML Holding NV, ADR | 3,390,473 | ||||||
| 38,703 | Broadcom Inc. | 19,243,519 | ||||||
| 1,928 | Brooks Automation Inc. | 163,803 | ||||||
| 1,290 | Cirrus Logic Inc.* | 107,934 | ||||||
| 3,205 | Cree Inc.*(a) | 272,361 | ||||||
See Notes to Financial Statements.
48
| Schedules of Investments |
| (continued) |
| Large Cap Equity Fund | ||||||||
| Shares/Units | Security | Value | ||||||
INFORMATION TECHNOLOGY — 28.7% — (continued) | ||||||||
Semiconductors & Semiconductor Equipment — 5.8% — (continued) | ||||||||
| 23,556 | Enphase Energy Inc.* | $ | 4,092,384 | |||||
| 3,537 | Entegris Inc. | 424,935 | ||||||
| 2,973 | First Solar Inc.* | 279,462 | ||||||
| 106,627 | Intel Corp. | 5,764,256 | ||||||
| 4,043 | KLA Corp. | 1,374,458 | ||||||
| 3,757 | Lam Research Corp. | 2,272,309 | ||||||
| 21,280 | Marvell Technology Inc. | 1,302,123 | ||||||
| 6,599 | Microchip Technology Inc. | 1,038,419 | ||||||
| 29,383 | Micron Technology Inc.* | 2,165,527 | ||||||
| 1,609 | MKS Instruments Inc. | 236,813 | ||||||
| 1,138 | Monolithic Power Systems Inc. | 563,230 | ||||||
| 137,608 | NVIDIA Corp. | 30,803,551 | ||||||
| 21,287 | NXP Semiconductors NV | 4,579,472 | ||||||
| 11,589 | ON Semiconductor Corp.* | 514,088 | ||||||
| 2,887 | Qorvo Inc.* | 542,842 | ||||||
| 64,668 | QUALCOMM Inc. | 9,486,149 | ||||||
| 52,595 | Skyworks Solutions Inc. | 9,649,079 | ||||||
| 4,212 | Teradyne Inc. | 511,505 | ||||||
| 24,365 | Texas Instruments Inc. | 4,651,522 | ||||||
| 1,113 | Universal Display Corp. | 232,161 | ||||||
| 6,701 | Xilinx Inc. | 1,042,608 | ||||||
|
| |||||||
| Total Semiconductors & Semiconductor Equipment | 126,171,595 | |||||||
|
| |||||||
Software — 10.0% | ||||||||
| 37,147 | Adobe Inc.* | 24,654,464 | ||||||
| 1,521 | Alteryx Inc., Class A Shares* | 112,508 | ||||||
| 3,742 | Anaplan Inc.* | 224,445 | ||||||
| 2,358 | ANSYS Inc.* | 861,519 | ||||||
| 1,753 | Aspen Technology Inc.* | 227,013 | ||||||
| 15,938 | Atlassian Corp. PLC, Class A Shares* | 5,850,202 | ||||||
| 5,799 | Autodesk Inc.* | 1,798,212 | ||||||
| 2,297 | Avalara Inc.* | 412,771 | ||||||
| 3,552 | Bentley Systems Inc., Class B Shares | 229,068 | ||||||
| 2,064 | Bill.com Holdings Inc.*(a) | 566,341 | ||||||
| 3,891 | Black Knight Inc.* | 294,432 | ||||||
| 348 | C3.ai Inc., Class A Shares*(a) | 17,936 | ||||||
| 7,283 | Cadence Design Systems Inc.* | 1,190,625 | ||||||
| 2,882 | CDK Global Inc. | 119,891 | ||||||
| 3,522 | Ceridian HCM Holding Inc.* | 395,697 | ||||||
| 3,255 | Citrix Systems Inc. | 334,842 | ||||||
| 2,010 | Coupa Software Inc.* | 492,068 | ||||||
| 4,228 | Crowdstrike Holdings Inc., Class A Shares* | 1,188,068 | ||||||
| 5,972 | Datadog Inc., Class A Shares* | 822,942 | ||||||
| 24 | Datto Holding Corp.* | 612 | ||||||
| 20,952 | DocuSign Inc., Class A Shares* | 6,206,820 | ||||||
| 1,598 | Dolby Laboratories Inc., Class A Shares | 158,378 | ||||||
| 788 | DoubleVerify Holdings Inc.* | 28,628 | ||||||
| 8,031 | Dropbox Inc., Class A Shares* | 254,663 | ||||||
| 1,889 | Duck Creek Technologies Inc.* | 88,084 | ||||||
| 4,749 | Dynatrace Inc.* | 326,399 | ||||||
| 1,680 | Elastic NV* | 268,044 | ||||||
| 1,028 | Everbridge Inc.* | 161,365 | ||||||
| 739 | Fair Isaac Corp.* | 339,748 | ||||||
| 5,842 | FireEye Inc.* | 106,266 | ||||||
| 1,780 | Five9 Inc.* | 281,649 | ||||||
See Notes to Financial Statements.
49
| Schedules of Investments |
| (continued) |
| Large Cap Equity Fund | ||||||||
| Shares/Units | Security | Value | ||||||
INFORMATION TECHNOLOGY — 28.7% — (continued) | ||||||||
Software — 10.0% — (continued) | ||||||||
| 3,512 | Fortinet Inc.* | $ | 1,106,772 | |||||
| 2,122 | Guidewire Software Inc.* | 251,372 | ||||||
| 1,174 | HubSpot Inc.* | 803,568 | ||||||
| 18,544 | Intuit Inc. | 10,497,944 | ||||||
| 1,614 | Jamf Holding Corp.* | 56,732 | ||||||
| 1,575 | Manhattan Associates Inc.* | 256,709 | ||||||
| 1,105 | McAfee Corp., Class A Shares | 29,349 | ||||||
| 3,394 | Medallia Inc.* | 114,615 | ||||||
| 239,112 | Microsoft Corp. | 72,183,131 | ||||||
| 646 | N-Able Inc.* | 8,740 | ||||||
| 1,158 | nCino Inc.* | 71,808 | ||||||
| 2,949 | NCR Corp.* | 125,274 | ||||||
| 1,533 | New Relic Inc.* | 122,594 | ||||||
| 238,261 | NortonLifeLock Inc. | 6,328,212 | ||||||
| 7,347 | Nuance Communications Inc.* | 404,452 | ||||||
| 29,312 | Nutanix Inc., Class A Shares* | 1,081,906 | ||||||
| 122,321 | Oracle Corp. | 10,902,471 | ||||||
| 42,812 | Palantir Technologies Inc., Class A Shares* | 1,127,668 | ||||||
| 15,638 | Palo Alto Networks Inc.* | 7,209,744 | ||||||
| 1,396 | Paycom Software Inc.* | 682,504 | ||||||
| 1,000 | Paylocity Holding Corp.* | 269,200 | ||||||
| 936 | Pegasystems Inc. | 128,822 | ||||||
| 1,431 | Proofpoint Inc.*(c) | 251,713 | ||||||
| 2,755 | PTC Inc.* | 362,723 | ||||||
| 21,904 | RingCentral Inc., Class A Shares* | 5,525,503 | ||||||
| 71,333 | salesforce.com Inc.* | 18,922,505 | ||||||
| 15,671 | ServiceNow Inc.* | 10,086,482 | ||||||
| 3,277 | Smartsheet Inc., Class A Shares* | 260,751 | ||||||
| 52,324 | Splunk Inc.* | 7,998,770 | ||||||
| 5,933 | SS&C Technologies Holdings Inc. | 448,891 | ||||||
| 3,995 | Synopsys Inc.* | 1,327,299 | ||||||
| 2,455 | Teradata Corp.*(a) | 134,264 | ||||||
| 11,420 | Trade Desk Inc. (The), Class A Shares* | 914,171 | ||||||
| 1,104 | Tyler Technologies Inc.* | 536,213 | ||||||
| 20,980 | UiPath Inc., Class A Shares*(a) | 1,325,936 | ||||||
| 3,877 | Unity Software Inc.* | 491,410 | ||||||
| 7,791 | VMware Inc., Class A Shares*(a) | 1,159,846 | ||||||
| 16,288 | Workday Inc., Class A Shares* | 4,449,230 | ||||||
| 3,048 | Zendesk Inc.* | 376,733 | ||||||
| 5,629 | Zoom Video Communications Inc., Class A Shares* | 1,629,595 | ||||||
| 2,054 | Zscaler Inc.* | 571,710 | ||||||
|
| |||||||
| Total Software | 218,551,032 | |||||||
|
| |||||||
Technology Hardware, Storage & Peripherals — 4.2% | ||||||||
| 484,957 | Apple Inc. | 73,631,021 | ||||||
| 90,937 | Dell Technologies Inc., Class C Shares* | 8,862,720 | ||||||
| 35,890 | Hewlett Packard Enterprise Co. | 554,859 | ||||||
| 32,876 | HP Inc. | 977,732 | ||||||
| 5,651 | NetApp Inc. | 502,544 | ||||||
| 6,763 | Pure Storage Inc., Class A Shares* | 174,688 | ||||||
| 86,236 | Western Digital Corp.* | 5,450,115 | ||||||
| 4,044 | Xerox Holdings Corp. | 91,031 | ||||||
|
| |||||||
| Total Technology Hardware, Storage & Peripherals | 90,244,710 | |||||||
|
| |||||||
| TOTAL INFORMATION TECHNOLOGY | 625,127,546 | |||||||
|
| |||||||
See Notes to Financial Statements.
50
| Schedules of Investments |
| (continued) |
| Large Cap Equity Fund | ||||||||
| Shares/Units | Security | Value | ||||||
MATERIALS — 2.5% | ||||||||
Chemicals — 1.1% | ||||||||
| 5,830 | Air Products & Chemicals Inc. | $ | 1,571,243 | |||||
| 3,207 | Albemarle Corp. | 759,225 | ||||||
| 1,389 | Ashland Global Holdings Inc.(a) | 126,552 | ||||||
| 5,230 | Axalta Coating Systems Ltd.* | 159,724 | ||||||
| 3,004 | Celanese Corp., Class A Shares | 476,434 | ||||||
| 5,243 | CF Industries Holdings Inc. | 238,137 | ||||||
| 3,899 | Chemours Co. (The) | 130,656 | ||||||
| 19,076 | Corteva Inc. | 838,772 | ||||||
| 1,845 | Diversey Holdings Ltd.* | 32,232 | ||||||
| 19,616 | Dow Inc. | 1,233,846 | ||||||
| 106,166 | DuPont de Nemours Inc. | 7,858,407 | ||||||
| 3,799 | Eastman Chemical Co. | 429,895 | ||||||
| 18,742 | Ecolab Inc. | 4,223,697 | ||||||
| 6,430 | Element Solutions Inc. | 146,154 | ||||||
| 3,630 | FMC Corp. | 339,877 | ||||||
| 5,644 | Huntsman Corp. | 149,171 | ||||||
| 6,579 | International Flavors & Fragrances Inc. | 996,719 | ||||||
| 7,025 | LyondellBasell Industries NV, Class A Shares | 704,959 | ||||||
| 8,986 | Mosaic Co. (The) | 289,170 | ||||||
| 206 | NewMarket Corp. | 72,044 | ||||||
| 3,734 | Olin Corp. | 186,103 | ||||||
| 6,220 | PPG Industries Inc. | 992,401 | ||||||
| 3,358 | RPM International Inc. | 276,330 | ||||||
| 1,063 | Scotts Miracle-Gro Co. (The) | 166,710 | ||||||
| 6,432 | Sherwin-Williams Co. (The) | 1,953,205 | ||||||
| 4,290 | Valvoline Inc. | 129,386 | ||||||
| 645 | Westlake Chemical Corp. | 56,341 | ||||||
| 1,628 | WR Grace & Co. | 113,374 | ||||||
|
| |||||||
| Total Chemicals | 24,650,764 | |||||||
|
| |||||||
Construction Materials — 0.4% | ||||||||
| 976 | Eagle Materials Inc. | 153,076 | ||||||
| 1,641 | Martin Marietta Materials Inc. | 625,631 | ||||||
| 40,102 | Vulcan Materials Co. | 7,456,165 | ||||||
|
| |||||||
| Total Construction Materials | 8,234,872 | |||||||
|
| |||||||
Containers & Packaging — 0.7% | ||||||||
| 39,152 | Amcor PLC | 503,103 | ||||||
| 1,869 | AptarGroup Inc. | 251,941 | ||||||
| 532 | Ardagh Group SA, Class A Shares | 13,976 | ||||||
| 2,198 | Avery Dennison Corp. | 495,407 | ||||||
| 8,394 | Ball Corp. | 805,488 | ||||||
| 69,152 | Berry Global Group Inc.* | 4,644,940 | ||||||
| 55,137 | Crown Holdings Inc. | 6,053,491 | ||||||
| 8,029 | Graphic Packaging Holding Co. | 164,755 | ||||||
| 10,385 | International Paper Co. | 624,035 | ||||||
| 73,167 | O-I Glass Inc.* | 1,107,017 | ||||||
| 2,379 | Packaging Corp. of America | 360,894 | ||||||
| 4,081 | Sealed Air Corp. | 249,064 | ||||||
| 2,255 | Silgan Holdings Inc.(a) | 95,680 | ||||||
| 2,530 | Sonoco Products Co. | 165,209 | ||||||
| 6,829 | WestRock Co. | 355,381 | ||||||
|
| |||||||
| Total Containers & Packaging | 15,890,381 | |||||||
|
| |||||||
See Notes to Financial Statements.
51
| Schedules of Investments |
| (continued) |
| Large Cap Equity Fund | ||||||||
| Shares/Units | Security | Value | ||||||
MATERIALS — 2.5% — (continued) | ||||||||
Metals & Mining — 0.3% | ||||||||
| 4,920 | Alcoa Corp.* | $ | 218,300 | |||||
| 12,002 | Cleveland-Cliffs Inc.*(a) | 281,687 | ||||||
| 38,187 | Freeport-McMoRan Inc. | 1,389,625 | ||||||
| 21,139 | Newmont Corp. | 1,225,851 | ||||||
| 7,958 | Nucor Corp. | 935,542 | ||||||
| 1,729 | Reliance Steel & Aluminum Co. | 259,419 | ||||||
| 1,907 | Royal Gold Inc. | 212,306 | ||||||
| 2,488 | Southern Copper Corp. | 155,724 | ||||||
| 5,185 | Steel Dynamics Inc. | 349,936 | ||||||
| 7,044 | United States Steel Corp. | 188,427 | ||||||
|
| |||||||
| Total Metals & Mining | 5,216,817 | |||||||
|
| |||||||
Paper & Forest Products — 0.0% | ||||||||
| 2,685 | Louisiana-Pacific Corp. | 170,336 | ||||||
|
| |||||||
| TOTAL MATERIALS | 54,163,170 | |||||||
|
| |||||||
REAL ESTATE — 2.9% | ||||||||
Equity Real Estate Investment Trusts (REITs) — 2.8% | ||||||||
| 3,855 | Alexandria Real Estate Equities Inc. | 795,556 | ||||||
| 3,252 | American Campus Communities Inc. | 165,364 | ||||||
| 7,498 | American Homes 4 Rent, Class A Shares | 314,466 | ||||||
| 11,905 | American Tower Corp. | 3,478,284 | ||||||
| 6,551 | Americold Realty Trust | 240,684 | ||||||
| 4,211 | Apartment Income REIT Corp. | 214,003 | ||||||
| 3,662 | AvalonBay Communities Inc. | 840,722 | ||||||
| 4,108 | Boston Properties Inc. | 464,163 | ||||||
| 7,025 | Brixmor Property Group Inc. | 164,736 | ||||||
| 2,331 | Camden Property Trust | 349,743 | ||||||
| 1,145 | CoreSite Realty Corp. | 169,884 | ||||||
| 4,384 | Cousins Properties Inc. | 169,047 | ||||||
| 51,268 | Crown Castle International Corp. | 9,981,367 | ||||||
| 5,512 | CubeSmart | 294,892 | ||||||
| 3,446 | CyrusOne Inc. | 265,273 | ||||||
| 7,378 | Digital Realty Trust Inc. | 1,209,328 | ||||||
| 4,687 | Douglas Emmett Inc. | 154,718 | ||||||
| 10,280 | Duke Realty Corp. | 539,803 | ||||||
| 1,544 | EPR Properties(a) | 78,358 | ||||||
| 6,480 | Equinix Inc. | 5,465,556 | ||||||
| 4,552 | Equity LifeStyle Properties Inc. | 387,239 | ||||||
| 92,635 | Equity Residential | 7,787,824 | ||||||
| 1,722 | Essex Property Trust Inc. | 569,534 | ||||||
| 3,514 | Extra Space Storage Inc. | 656,802 | ||||||
| 1,863 | Federal Realty Investment Trust | 226,858 | ||||||
| 3,495 | First Industrial Realty Trust Inc. | 195,685 | ||||||
| 6,025 | Gaming and Leisure Properties Inc. | 297,032 | ||||||
| 5,203 | Healthcare Trust of America Inc., Class A Shares | 157,807 | ||||||
| 14,215 | Healthpeak Properties Inc. | 511,740 | ||||||
| 2,392 | Highwoods Properties Inc. | 109,290 | ||||||
| 19,896 | Host Hotels & Resorts Inc.* | 329,478 | ||||||
| 4,611 | Hudson Pacific Properties Inc.(a) | 121,638 | ||||||
| 14,954 | Invitation Homes Inc. | 615,806 | ||||||
| 7,439 | Iron Mountain Inc. | 355,212 | ||||||
| 3,749 | JBG SMITH Properties | 112,957 | ||||||
| 2,816 | Kilroy Realty Corp.(a) | 184,870 | ||||||
| 13,705 | Kimco Realty Corp. | 298,632 | ||||||
| 2,474 | Lamar Advertising Co., Class A Shares | 281,615 | ||||||
See Notes to Financial Statements.
52
| Schedules of Investments |
| (continued) |
| Large Cap Equity Fund | ||||||||
| Shares/Units | Security | Value | ||||||
REAL ESTATE — 2.9% — (continued) | ||||||||
Equity Real Estate Investment Trusts (REITs) — 2.8% — (continued) | ||||||||
| 2,020 | Life Storage Inc. | $ | 251,369 | |||||
| 16,606 | Medical Properties Trust Inc. | 340,091 | ||||||
| 2,986 | Mid-America Apartment Communities Inc. | 574,417 | ||||||
| 4,949 | National Retail Properties Inc. | 235,622 | ||||||
| 6,439 | Omega Healthcare Investors Inc. | 215,900 | ||||||
| 5,285 | Park Hotels & Resorts Inc.* | 101,155 | ||||||
| 19,442 | Prologis Inc. | 2,618,060 | ||||||
| 32,605 | Public Storage | 10,551,304 | ||||||
| 3,920 | Rayonier Inc. | 144,178 | ||||||
| 9,940 | Realty Income Corp. | 717,867 | ||||||
| 4,804 | Regency Centers Corp. | 329,650 | ||||||
| 3,653 | Rexford Industrial Realty Inc. | 226,230 | ||||||
| 2,820 | SBA Communications Corp., Class A Shares | 1,012,295 | ||||||
| 8,639 | Simon Property Group Inc. | 1,161,514 | ||||||
| 1,970 | SL Green Realty Corp.(a) | 138,058 | ||||||
| 3,020 | Spirit Realty Capital Inc. | 156,345 | ||||||
| 6,651 | STORE Capital Corp. | 239,902 | ||||||
| 2,979 | Sun Communities Inc. | 600,239 | ||||||
| 7,735 | UDR Inc. | 417,845 | ||||||
| 9,569 | Ventas Inc. | 535,290 | ||||||
| 6,465 | VEREIT Inc. | 326,676 | ||||||
| 14,169 | VICI Properties Inc.(a) | 437,964 | ||||||
| 5,005 | Vornado Realty Trust | 209,609 | ||||||
| 11,046 | Welltower Inc. | 966,856 | ||||||
| 19,731 | Weyerhaeuser Co. | 710,316 | ||||||
| 4,750 | WP Carey Inc. | 371,070 | ||||||
|
| |||||||
| Total Equity Real Estate Investment Trusts (REITs) | 62,145,788 | |||||||
|
| |||||||
Real Estate Management & Development — 0.1% | ||||||||
| 8,676 | CBRE Group Inc., Class A Shares* | 835,499 | ||||||
| 1,168 | Howard Hughes Corp. (The)* | 105,739 | ||||||
| 1,315 | Jones Lang LaSalle Inc.* | 318,795 | ||||||
| 9,134 | Opendoor Technologies Inc.*(a) | 161,946 | ||||||
|
| |||||||
| Total Real Estate Management & Development | 1,421,979 | |||||||
|
| |||||||
| TOTAL REAL ESTATE | 63,567,767 | |||||||
|
| |||||||
UTILITIES — 1.8% | ||||||||
Electric Utilities — 1.3% | ||||||||
| 6,596 | Alliant Energy Corp. | 400,971 | ||||||
| 13,128 | American Electric Power Co., Inc. | 1,175,875 | ||||||
| 1,630 | Avangrid Inc.(a) | 89,079 | ||||||
| 20,295 | Duke Energy Corp. | 2,124,075 | ||||||
| 125,270 | Edison International | 7,245,617 | ||||||
| 5,306 | Entergy Corp. | 586,897 | ||||||
| 5,978 | Evergy Inc. | 409,194 | ||||||
| 9,046 | Eversource Energy | 820,744 | ||||||
| 25,712 | Exelon Corp. | 1,260,402 | ||||||
| 14,317 | FirstEnergy Corp. | 556,502 | ||||||
| 2,283 | Hawaiian Electric Industries Inc. | 99,539 | ||||||
| 1,429 | IDACORP Inc. | 150,545 | ||||||
| 51,729 | NextEra Energy Inc. | 4,344,719 | ||||||
| 105,453 | NRG Energy Inc. | 4,816,038 | ||||||
| 4,805 | OGE Energy Corp. | 170,145 | ||||||
| 40,254 | PG&E Corp.* | 369,129 | ||||||
| 2,875 | Pinnacle West Capital Corp. | 221,087 | ||||||
| 20,356 | PPL Corp. | 597,449 | ||||||
See Notes to Financial Statements.
53
| Schedules of Investments |
| (continued) |
| Large Cap Equity Fund | ||||||||
| Shares/Units | Security | Value | ||||||
UTILITIES — 1.8% — (continued) | ||||||||
Electric Utilities — 1.3% — (continued) | ||||||||
| 27,899 | Southern Co. (The) | $ | 1,833,801 | |||||
| 14,369 | Xcel Energy Inc. | 987,869 | ||||||
|
| |||||||
| Total Electric Utilities | 28,259,677 | |||||||
|
| |||||||
Gas Utilities — 0.0% | ||||||||
| 3,419 | Atmos Energy Corp. | 333,386 | ||||||
| 2,437 | National Fuel Gas Co. | 126,261 | ||||||
| 5,280 | UGI Corp. | 244,517 | ||||||
|
| |||||||
| Total Gas Utilities | 704,164 | |||||||
|
| |||||||
Independent Power & Renewable Electricity Producers — 0.0% | ||||||||
| 17,459 | AES Corp. (The) | 416,746 | ||||||
| 3,364 | Brookfield Renewable Corp., Class A Shares | 147,377 | ||||||
| 12,544 | Vistra Corp. | 239,465 | ||||||
|
| |||||||
| Total Independent Power & Renewable Electricity Producers | 803,588 | |||||||
|
| |||||||
Multi-Utilities — 0.4% | ||||||||
| 6,895 | Ameren Corp. | 604,829 | ||||||
| 15,312 | CenterPoint Energy Inc. | 384,178 | ||||||
| 7,774 | CMS Energy Corp. | 498,547 | ||||||
| 8,935 | Consolidated Edison Inc. | 674,146 | ||||||
| 21,245 | Dominion Energy Inc. | 1,653,711 | ||||||
| 5,074 | DTE Energy Co. | 610,605 | ||||||
| 5,142 | MDU Resources Group Inc. | 165,418 | ||||||
| 10,108 | NiSource Inc. | 249,162 | ||||||
| 13,348 | Public Service Enterprise Group Inc. | 853,471 | ||||||
| 8,321 | Sempra Energy | 1,101,368 | ||||||
| 8,280 | WEC Energy Group Inc. | 782,294 | ||||||
|
| |||||||
| Total Multi-Utilities | 7,577,729 | |||||||
|
| |||||||
Water Utilities — 0.1% | ||||||||
| 4,787 | American Water Works Co., Inc. | 872,431 | ||||||
| 5,667 | Essential Utilities Inc. | 281,253 | ||||||
|
| |||||||
| Total Water Utilities | 1,153,684 | |||||||
|
| |||||||
| TOTAL UTILITIES | 38,498,842 | |||||||
|
| |||||||
| TOTAL COMMON STOCKS (Cost — $984,236,460) | 2,111,659,294 | |||||||
|
| |||||||
CLOSED END MUTUAL FUND SECURITY — 0.9% | ||||||||
FINANCIALS — 0.9% | ||||||||
Capital Markets — 0.9% | ||||||||
| 278,711 | iShares® Core S&P U.S. Value ETF, Common Class Shares(a) (Cost — $15,841,905) | 20,554,936 | ||||||
|
| |||||||
| TOTAL INVESTMENTS IN SECURITIES BEFORE SHORT-TERM INVESTMENTS (Cost — $1,000,078,365) | 2,132,214,230 | |||||||
|
| |||||||
See Notes to Financial Statements.
54
| Schedules of Investments |
| (continued) |
| Large Cap Equity Fund | ||||||||
| Face Amount† | Security | Value | ||||||
SHORT-TERM INVESTMENTS (d) — 2.8% | ||||||||
MONEY MARKET FUND — 1.1% | ||||||||
| $ | 24,409,909 | Invesco STIT — Government & Agency Portfolio, 0.026%, Institutional Class(e) (Cost — $24,409,909) | $ | 24,409,909 | ||||
|
| |||||||
TIME DEPOSITS — 1.7% | ||||||||
| 29,803 | CAD | BBH — Grand Cayman, 0.010% due 9/1/21 | 23,626 | |||||
| 11,199,817 | BNP Paribas — Paris, 0.005% due 9/1/21 | 11,199,817 | ||||||
| 24,398,052 | Skandinaviska Enskilda Banken AB — Stockholm, 0.005% due 9/1/21 | 24,398,052 | ||||||
| 1,588 | Sumitomo Mitsui Banking Corp. — Tokyo, 0.005% due 9/1/21 | 1,588 | ||||||
|
| |||||||
| TOTAL TIME DEPOSITS (Cost — $35,623,083) | 35,623,083 | |||||||
|
| |||||||
| TOTAL SHORT-TERM INVESTMENTS (Cost — $60,032,992) | 60,032,992 | |||||||
|
| |||||||
| TOTAL INVESTMENTS — 100.8% (Cost — $1,060,111,357) | 2,192,247,222 | |||||||
|
| |||||||
| Liabilities in Excess of Other Assets — (0.8)% | (17,530,417 | ) | ||||||
|
| |||||||
| TOTAL NET ASSETS — 100.0% | $ | 2,174,716,805 | ||||||
|
| |||||||
| † | Amount denominated in U.S. dollars, unless otherwise noted. |
| * | Non-income producing security. |
| (a) | All or a portion of this security is on loan (See Note 1). |
| (b) | Affiliated security (See Note 2). As of August 31, 2021, total cost and total market value of affiliated securities amounted to $868,742 and $3,824,540, respectively. |
| (c) | Security is valued in good faith at fair value by or under the direction of the Board of Trustees. |
| (d) | Inclusive of all short-term holdings, including investments of collateral received from securities lending transactions. Excluding such collateral, the percentage of portfolio holdings would be 1.7%. |
| (e) | Represents investments of collateral received from securities lending transactions. |
At August 31, 2021, for Large Cap Equity Fund the aggregate cost of investments, the aggregate gross unrealized appreciation and depreciation of all investments for federal income tax purposes were as follows:
| Fund | Aggregate Cost For Federal Income Tax Purposes | Gross Unrealized Appreciation | Gross Unrealized (Depreciation) | Net | ||||||||||||
Large Cap Equity Fund | $ | 1,072,735,130 | $ | 1,158,106,533 | $ | (37,573,881 | ) | $ | 1,120,532,652 | |||||||
Abbreviations used in this schedule: | ||
| ADR | — American Depositary Receipts | |
| PLC | — Public Limited Company | |
| REIT | — Real Estate Investment Trust | |
See Notes to Financial Statements.
55
| Schedules of Investments |
| (continued) |
Large Cap Equity Fund
| ||||
| Summary of Investments by Security Sector^ | ||||
Information Technology | 28.8 | % | ||
Health Care | 13.6 | |||
Consumer Discretionary | 12.6 | |||
Financials | 10.6 | |||
Communication Services | 9.8 | |||
Industrials | 9.5 | |||
Consumer Staples | 4.5 | |||
Real Estate | 2.9 | |||
Materials | 2.5 | |||
Utilities | 1.8 | |||
Energy | 1.7 | |||
Short-Term Investments | 1.7 | |||
|
| |||
| 100.0 | %+ | |||
|
| |||
| ^ | As a percentage of total investments. |
| + | Does not reflect investments of collateral received from securities lending transactions. |
At August 31, 2021, Large Cap Equity Fund had open exchange-traded futures contracts as described below.
The unrealized appreciation on the open contracts reflected in the accompanying financial statements were as follows:
| Open Futures Contracts | Number of Contracts | Expiration Date (Month/Year) | Notional Amount | Market Value | Unrealized Appreciation | |||||||||||||||
| Contracts to Buy: | ||||||||||||||||||||
S&P 500 E-mini Index September Futures | 78 | 9/21 | $ | 16,639,009 | $ | 17,629,950 | $ | 990,941 | ||||||||||||
S&P MidCap 400 E-mini Index September Futures | 5 | 9/21 | 1,347,231 | 1,376,000 | 28,769 | |||||||||||||||
|
| |||||||||||||||||||
| $ | 1,019,710 | |||||||||||||||||||
|
| |||||||||||||||||||
At August 31, 2021, Large Cap Equity Fund had deposited cash of $974,984 with a broker or brokers as margin collateral on an open exchange-traded futures contracts.
Currency Abbreviation used in this schedule: | ||
| CAD | — Canadian Dollar | |
See Notes to Financial Statements.
56
| Schedules of Investments |
| (continued) |
| Small-Mid Cap Equity Fund | ||||||||||
| Shares/Units | Security | Value | ||||||||
COMMON STOCKS — 96.0% | ||||||||||
COMMUNICATION SERVICES — 2.2% | ||||||||||
Diversified Telecommunication Services — 0.1% | ||||||||||
| 476 | Anterix Inc.* | $ | 28,093 | |||||||
| 490 | ATN International Inc. | 22,339 | ||||||||
| 975 | Bandwidth Inc., Class A Shares* | 100,327 | ||||||||
| 1,942 | Cincinnati Bell Inc.* | 30,082 | ||||||||
| 1,760 | Cogent Communications Holdings Inc. | 127,741 | ||||||||
| 3,155 | Consolidated Communications Holdings Inc.* | 29,247 | ||||||||
| 24,758 | Globalstar Inc.*(a) | 49,268 | ||||||||
| 820 | IDT Corp., Class B Shares* | 35,654 | ||||||||
| 4,925 | Iridium Communications Inc.* | 219,212 | ||||||||
| 1,068 | Liberty Latin America Ltd., Class A Shares* | 15,230 | ||||||||
| 7,017 | Liberty Latin America Ltd., Class C Shares* | 100,975 | ||||||||
| 940 | Ooma Inc.* | 17,860 | ||||||||
| 3,170 | ORBCOMM Inc.* | 36,423 | ||||||||
| 1,782 | Radius Global Infrastructure Inc., Class A Shares* | 31,862 | ||||||||
|
| |||||||||
| Total Diversified Telecommunication Services | 844,313 | |||||||||
|
| |||||||||
Entertainment — 0.6% | ||||||||||
| 16,776 | AMC Entertainment Holdings Inc., Class A Shares*(a) | 790,653 | ||||||||
| 467 | Chicken Soup For The Soul Entertainment Inc., Class A Shares*(a) | 11,330 | ||||||||
| 4,458 | Cinemark Holdings Inc.*(a) | 79,486 | ||||||||
| 1,058 | CuriosityStream Inc.*(a) | 13,225 | ||||||||
| 12,661 | Eros STX Global Corp.* | 10,129 | ||||||||
| 2,082 | IMAX Corp.* | 32,708 | ||||||||
| 409 | Liberty Media Corp-Liberty Braves, Class A Shares* | 10,634 | ||||||||
| 1,501 | Liberty Media Corp-Liberty Braves, Class C Shares* | 38,801 | ||||||||
| 954 | Liberty Media Corp-Liberty Formula One, Class A Shares* | 43,588 | ||||||||
| 8,299 | Liberty Media Corp-Liberty Formula One, Class C Shares* | 419,432 | ||||||||
| 2,158 | Lions Gate Entertainment Corp., Class A Shares* | 27,881 | ||||||||
| 5,022 | Lions Gate Entertainment Corp., Class B Shares* | 59,059 | ||||||||
| 2,144 | LiveXLive Media Inc.* | 7,354 | ||||||||
| 980 | Madison Square Garden Entertainment Corp.* | 78,586 | ||||||||
| 809 | Madison Square Garden Sports Corp., Class A Shares* | 146,251 | ||||||||
| 962 | Marcus Corp. (The)* | 15,007 | ||||||||
| 3,128 | Playtika Holding Corp.* | 82,548 | ||||||||
| 12,547 | Skillz Inc., Class A Shares*(a) | 147,678 | ||||||||
| 13,439 | World Wrestling Entertainment Inc., Class A Shares(a) | 700,306 | ||||||||
| 160,174 | Zynga Inc., Class A Shares* | 1,417,540 | ||||||||
|
| |||||||||
| Total Entertainment | 4,132,196 | |||||||||
|
| |||||||||
Interactive Media & Services — 0.2% | ||||||||||
| 3,841 | Cargurus Inc., Class A Shares*(a) | 116,690 | ||||||||
| 2,792 | Cars.com Inc.* | 35,514 | ||||||||
| 3,085 | Eventbrite Inc., Class A Shares* | 54,543 | ||||||||
| 770 | EverQuote Inc., Class A Shares* | 15,161 | ||||||||
| 5,604 | fuboTV Inc.*(a) | 163,357 | ||||||||
| 3,362 | Liberty TripAdvisor Holdings Inc., Class A Shares* | 12,574 | ||||||||
| 847 | MediaAlpha Inc., Class A Shares* | 18,786 | ||||||||
| 2,041 | QuinStreet Inc.* | 36,554 | ||||||||
| 4,221 | TripAdvisor Inc.* | 147,735 | ||||||||
| 4,209 | TrueCar Inc.* | 17,678 | ||||||||
| 5,300 | Vimeo Inc.* | 202,036 | ||||||||
| 2,986 | Yelp Inc., Class A Shares* | 114,991 | ||||||||
|
| |||||||||
| Total Interactive Media & Services | 935,619 | |||||||||
|
| |||||||||
See Notes to Financial Statements.
57
| Schedules of Investments |
| (continued) |
| Small-Mid Cap Equity Fund | ||||||||||
| Shares/Units | Security | Value | ||||||||
COMMUNICATION SERVICES — 2.2% — (continued) | ||||||||||
Media — 1.3% | ||||||||||
| 3,111 | Advantage Solutions Inc.* | $ | 27,097 | |||||||
| 1,210 | AMC Networks Inc., Class A Shares*(a) | 57,511 | ||||||||
| 714 | Boston Omaha Corp., Class A Shares* | 25,525 | ||||||||
| 1,700 | Cable One Inc. | 3,569,303 | ||||||||
| 1,316 | Cardlytics Inc.* | 119,466 | ||||||||
| 14,778 | Clear Channel Outdoor Holdings Inc., Class A Shares* | 38,866 | ||||||||
| 2,881 | comScore Inc.* | 11,178 | ||||||||
| 63,576 | Criteo SA, ADR* | 2,386,007 | ||||||||
| 52 | Daily Journal Corp.* | 17,680 | ||||||||
| 930 | Emerald Holding Inc.* | 4,631 | ||||||||
| 4,856 | Entercom Communications Corp., Class A Shares* | 17,239 | ||||||||
| 2,331 | Entravision Communications Corp., Class A Shares | 16,247 | ||||||||
| 2,421 | EW Scripps Co. (The), Class A Shares | 44,885 | ||||||||
| 2,051 | Fluent Inc.* | 5,579 | ||||||||
| 5,751 | Gannett Co., Inc.* | 36,519 | ||||||||
| 3,508 | Gray Television Inc. | 79,772 | ||||||||
| 634 | Hemisphere Media Group Inc., Class A Shares* | 7,811 | ||||||||
| 4,604 | iHeartMedia Inc., Class A Shares* | 114,547 | ||||||||
| 16,316 | Interpublic Group of Cos., Inc. (The) | 607,445 | ||||||||
| 1,868 | John Wiley & Sons Inc., Class A Shares(a) | 108,531 | ||||||||
| 553 | Loral Space & Communications Inc. | 23,232 | ||||||||
| 4,334 | Magnite Inc.*(a) | 125,773 | ||||||||
| 1,746 | Meredith Corp.*(a) | 75,095 | ||||||||
| 2,403 | National CineMedia Inc. | 6,152 | ||||||||
| 6,836 | New York Times Co. (The), Class A Shares | 347,132 | ||||||||
| 16,177 | News Corp., Class A Shares | 363,497 | ||||||||
| 5,253 | News Corp., Class B Shares | 115,724 | ||||||||
| 1,708 | Nexstar Media Group Inc., Class A Shares | 255,773 | ||||||||
| 1,199 | Scholastic Corp. | 39,855 | ||||||||
| 1,906 | Sinclair Broadcast Group Inc., Class A Shares(a) | 57,199 | ||||||||
| 2,480 | Stagwell Inc.* | 17,310 | ||||||||
| 1,034 | TechTarget Inc.* | 87,456 | ||||||||
| 9,123 | TEGNA Inc. | 161,660 | ||||||||
| 240 | Thryv Holdings Inc.* | 7,438 | ||||||||
| 2,348 | WideOpenWest Inc.* | 49,825 | ||||||||
|
| |||||||||
| Total Media | 9,028,960 | |||||||||
|
| |||||||||
Wireless Telecommunication Services — 0.0% | ||||||||||
| 2,361 | Gogo Inc.* | 31,755 | ||||||||
| 1,988 | Shenandoah Telecommunications Co. | 59,302 | ||||||||
| 4,161 | Telephone & Data Systems Inc. | 84,551 | ||||||||
| 629 | United States Cellular Corp.* | 20,097 | ||||||||
|
| |||||||||
| Total Wireless Telecommunication Services | 195,705 | |||||||||
|
| |||||||||
| TOTAL COMMUNICATION SERVICES | 15,136,793 | |||||||||
|
| |||||||||
CONSUMER DISCRETIONARY — 8.8% | ||||||||||
Auto Components — 0.4% | ||||||||||
| 3,904 | Adient PLC* | 153,583 | ||||||||
| 4,554 | American Axle & Manufacturing Holdings Inc.* | 40,394 | ||||||||
| 9,940 | BorgWarner Inc. | 424,239 | ||||||||
| 697 | Cooper-Standard Holdings Inc.* | 16,226 | ||||||||
| 5,998 | Dana Inc. | 139,513 | ||||||||
| 1,102 | Dorman Products Inc.* | 103,434 | ||||||||
| 1,735 | Fox Factory Holding Corp.* | 266,617 | ||||||||
| 10,039 | Gentex Corp. | 309,201 | ||||||||
See Notes to Financial Statements.
58
| Schedules of Investments |
| (continued) |
| Small-Mid Cap Equity Fund | ||||||||||
| Shares/Units | Security | Value | ||||||||
CONSUMER DISCRETIONARY — 8.8% — (continued) | ||||||||||
Auto Components — 0.4% — (continued) | ||||||||||
| 1,358 | Gentherm Inc.* | $ | 116,544 | |||||||
| 11,390 | Goodyear Tire & Rubber Co. (The)* | 180,418 | ||||||||
| 1,022 | LCI Industries | 144,777 | ||||||||
| 2,520 | Lear Corp. | 403,049 | ||||||||
| 2,059 | Modine Manufacturing Co.* | 25,614 | ||||||||
| 833 | Motorcar Parts of America Inc.* | 16,510 | ||||||||
| 935 | Patrick Industries Inc. | 76,305 | ||||||||
| 4,821 | QuantumScape Corp., Class A Shares*(a) | 106,062 | ||||||||
| 889 | Standard Motor Products Inc. | 38,129 | ||||||||
| 1,115 | Stoneridge Inc.* | 25,980 | ||||||||
| 2,903 | Tenneco Inc., Class A Shares* | 45,287 | ||||||||
| 1,192 | Visteon Corp.* | 125,971 | ||||||||
| 1,550 | XL Fleet Corp.*(a) | 10,540 | ||||||||
| 743 | XPEL Inc.* | 56,453 | ||||||||
|
| |||||||||
| Total Auto Components | 2,824,846 | |||||||||
|
| |||||||||
Automobiles — 0.1% | ||||||||||
| 1,123 | Arcimoto Inc.*(a) | 13,948 | ||||||||
| 3,255 | Canoo Inc.*(a) | 23,468 | ||||||||
| 6,841 | Fisker Inc.*(a) | 95,432 | ||||||||
| 6,475 | Harley-Davidson Inc. | 255,957 | ||||||||
| 4,601 | Lordstown Motors Corp., Class A Shares*(a) | 30,275 | ||||||||
| 2,207 | Thor Industries Inc.(a) | 250,340 | ||||||||
| 1,318 | Winnebago Industries Inc. | 91,759 | ||||||||
| 5,082 | Workhorse Group Inc.*(a) | 49,854 | ||||||||
|
| |||||||||
| Total Automobiles | 811,033 | |||||||||
|
| |||||||||
Distributors — 0.1% | ||||||||||
| 1,841 | Core-Mark Holding Co., Inc. | 84,686 | ||||||||
| 1,089 | Funko Inc., Class A Shares* | 21,715 | ||||||||
| 421 | Greenlane Holdings Inc., Class A Shares* | 1,069 | ||||||||
| 1,630 | Pool Corp. | 805,709 | ||||||||
|
| |||||||||
| Total Distributors | 913,179 | |||||||||
|
| |||||||||
Diversified Consumer Services — 0.8% | ||||||||||
| 15,425 | 2U Inc.* | 571,188 | ||||||||
| 2,034 | Adtalem Global Education Inc.* | 75,258 | ||||||||
| 753 | American Public Education Inc.* | 19,804 | ||||||||
| 13,958 | Bright Horizons Family Solutions Inc.* | 2,034,518 | ||||||||
| 722 | Carriage Services Inc., Class A Shares | 33,378 | ||||||||
| 5,867 | Chegg Inc.* | 488,252 | ||||||||
| 496 | Coursera Inc.* | 19,081 | ||||||||
| 3,555 | Frontdoor Inc.* | 155,069 | ||||||||
| 168 | Graham Holdings Co., Class B Shares | 103,624 | ||||||||
| 1,902 | Grand Canyon Education Inc.* | 169,544 | ||||||||
| 7,552 | H&R Block Inc. | 193,709 | ||||||||
| 5,228 | Houghton Mifflin Harcourt Co.* | 70,421 | ||||||||
| 4,353 | Laureate Education Inc., Class A Shares* | 69,343 | ||||||||
| 30,270 | Mister Car Wash Inc.*(a) | 580,881 | ||||||||
| 2,159 | OneSpaWorld Holdings Ltd.* | 22,669 | ||||||||
| 2,953 | Perdoceo Education Corp.* | 32,424 | ||||||||
| 888 | Regis Corp.* | 4,813 | ||||||||
| 6,793 | Service Corp. International | 426,329 | ||||||||
| 1,195 | StoneMor Inc.* | 3,465 | ||||||||
| 1,017 | Strategic Education Inc. | 79,611 | ||||||||
See Notes to Financial Statements.
59
| Schedules of Investments |
| (continued) |
| Small-Mid Cap Equity Fund | ||||||||||
| Shares/Units | Security | Value | ||||||||
CONSUMER DISCRETIONARY — 8.8% — (continued) | ||||||||||
Diversified Consumer Services — 0.8% — (continued) | ||||||||||
| 1,807 | Stride Inc.* | $ | 61,872 | |||||||
| 5,336 | Terminix Global Holdings Inc.* | 222,138 | ||||||||
| 3,769 | Vivint Smart Home Inc.* | 45,982 | ||||||||
| 2,163 | WW International Inc.* | 46,829 | ||||||||
|
| |||||||||
| Total Diversified Consumer Services | 5,530,202 | |||||||||
|
| |||||||||
Hotels, Restaurants & Leisure — 1.8% | ||||||||||
| 2,216 | Accel Entertainment Inc., Class A Shares* | 25,528 | ||||||||
| 9,649 | Aramark | 335,689 | ||||||||
| 1,339 | Bally’s Corp.* | 67,271 | ||||||||
| 43 | Biglari Holdings Inc., Class B Shares* | 7,519 | ||||||||
| 937 | BJ’s Restaurants Inc.* | 40,066 | ||||||||
| 3,609 | Bloomin’ Brands Inc.* | 96,685 | ||||||||
| 629 | Bluegreen Vacations Holding Corp., Class A Shares* | 14,398 | ||||||||
| 3,490 | Boyd Gaming Corp.* | 214,181 | ||||||||
| 1,872 | Brinker International Inc.*(a) | 99,721 | ||||||||
| 1,399 | Carrols Restaurant Group Inc. | 5,806 | ||||||||
| 1,124 | Century Casinos Inc.* | 15,028 | ||||||||
| 21,772 | Cheesecake Factory Inc. (The)* | 1,015,664 | ||||||||
| 1,440 | Choice Hotels International Inc. | 171,878 | ||||||||
| 7,576 | Churchill Downs Inc. | 1,594,748 | ||||||||
| 783 | Chuy’s Holdings Inc.* | 25,260 | ||||||||
| 978 | Cracker Barrel Old Country Store Inc. | 140,421 | ||||||||
| 1,780 | Dave & Buster’s Entertainment Inc.* | 66,608 | ||||||||
| 1,338 | Del Taco Restaurants Inc. | 11,774 | ||||||||
| 2,550 | Denny’s Corp.* | 42,177 | ||||||||
| 1,898 | Diamond Resorts International Inc.*#(b) | – | ||||||||
| 717 | Dine Brands Global Inc.* | 59,310 | ||||||||
| 3,295 | Drive Shack Inc.* | 8,995 | ||||||||
| 756 | El Pollo Loco Holdings Inc.* | 13,714 | ||||||||
| 131 | Esports Technologies Inc.*(a) | 4,256 | ||||||||
| 3,502 | Everi Holdings Inc.* | 79,671 | ||||||||
| 689 | Fiesta Restaurant Group Inc.* | 8,275 | ||||||||
| 1,323 | Full House Resorts Inc.* | 11,351 | ||||||||
| 1,648 | GAN Ltd.* | 28,181 | ||||||||
| 726 | Golden Entertainment Inc.* | 34,645 | ||||||||
| 1,293 | Golden Nugget Online Gaming Inc.* | 27,929 | ||||||||
| 2,191 | Hall of Fame Resort & Entertainment Co.* | 7,362 | ||||||||
| 3,650 | Hilton Grand Vacations Inc.* | 159,469 | ||||||||
| 1,664 | Hyatt Hotels Corp., Class A Shares* | 122,454 | ||||||||
| 70,452 | International Game Technology PLC* | 1,514,013 | ||||||||
| 946 | Jack in the Box Inc.(a) | 100,238 | ||||||||
| 164 | Kura Sushi USA Inc., Class A Shares* | 8,333 | ||||||||
| 1,296 | Lindblad Expeditions Holdings Inc.* | 19,064 | ||||||||
| 1,731 | Marriott Vacations Worldwide Corp.* | 258,871 | ||||||||
| 550 | Monarch Casino & Resort Inc.* | 34,853 | ||||||||
| 142 | Nathan’s Famous Inc. | 9,376 | ||||||||
| 232 | NEOGAMES SA* | 9,561 | ||||||||
| 1,665 | Noodles & Co., Class A Shares* | 20,962 | ||||||||
| 15,309 | Norwegian Cruise Line Holdings Ltd.*(a) | 395,585 | ||||||||
| 786 | ONE Group Hospitality Inc.(The)* | 8,764 | ||||||||
| 1,403 | Papa John’s International Inc. | 178,925 | ||||||||
| 6,542 | Penn National Gaming Inc.*(a) | 530,556 | ||||||||
| 3,445 | Planet Fitness Inc., Class A Shares* | 280,078 | ||||||||
| 112,280 | Playa Hotels & Resorts NV* | 820,767 | ||||||||
See Notes to Financial Statements.
60
| Schedules of Investments |
| (continued) |
| Small-Mid Cap Equity Fund | ||||||||||
| Shares/Units | Security | Value | ||||||||
CONSUMER DISCRETIONARY — 8.8% — (continued) | ||||||||||
Hotels, Restaurants & Leisure — 1.8% — (continued) | ||||||||||
| 1,121 | PlayAGS Inc.* | $ | 9,181 | |||||||
| 360 | RCI Hospitality Holdings Inc. | 23,260 | ||||||||
| 612 | Red Robin Gourmet Burgers Inc.* | 14,982 | ||||||||
| 2,542 | Red Rock Resorts Inc., Class A Shares*(a) | 118,991 | ||||||||
| 2,127 | Rush Street Interactive Inc.* | 31,650 | ||||||||
| 1,380 | Ruth’s Hospitality Group Inc.* | 28,276 | ||||||||
| 4,041 | Scientific Games Corp., Class A Shares* | 292,366 | ||||||||
| 12,667 | SeaWorld Entertainment Inc.* | 623,090 | ||||||||
| 1,592 | Shake Shack Inc., Class A Shares* | 138,106 | ||||||||
| 3,318 | Six Flags Entertainment Corp.* | 140,152 | ||||||||
| 1,394 | Target Hospitality Corp.* | 5,548 | ||||||||
| 2,934 | Texas Roadhouse Inc., Class A Shares | 278,730 | ||||||||
| 3,524 | Travel + Leisure Co. | 192,974 | ||||||||
| 1,656 | Vail Resorts Inc.* | 504,832 | ||||||||
| 7,608 | Wendy’s Co. (The) | 175,136 | ||||||||
| 1,228 | Wingstop Inc. | 211,130 | ||||||||
| 3,803 | Wyndham Hotels & Resorts Inc. | 276,478 | ||||||||
|
| |||||||||
| Total Hotels, Restaurants & Leisure | 11,810,862 | |||||||||
|
| |||||||||
Household Durables — 1.3% | ||||||||||
| 803 | Aterian Inc.*(a) | 4,786 | ||||||||
| 372 | Bassett Furniture Industries Inc. | 7,994 | ||||||||
| 1,251 | Beazer Homes USA Inc.* | 23,406 | ||||||||
| 1,304 | Casper Sleep Inc.* | 6,494 | ||||||||
| 379 | Cavco Industries Inc.* | 96,834 | ||||||||
| 1,245 | Century Communities Inc. | 87,274 | ||||||||
| 978 | Ethan Allen Interiors Inc. | 23,492 | ||||||||
| 263 | Flexsteel Industries Inc. | 9,184 | ||||||||
| 5,205 | GoPro Inc., Class A Shares* | 51,894 | ||||||||
| 1,313 | Green Brick Partners Inc.* | 32,812 | ||||||||
| 302 | Hamilton Beach Brands Holding Co., Class A Shares | 5,134 | ||||||||
| 1,007 | Helen of Troy Ltd.* | 240,864 | ||||||||
| 530 | Hooker Furniture Corp. | 16,515 | ||||||||
| 208 | Hovnanian Enterprises Inc., Class A Shares* | 22,612 | ||||||||
| 1,011 | Installed Building Products Inc. | 125,546 | ||||||||
| 1,139 | iRobot Corp.*(a) | 92,396 | ||||||||
| 12,313 | KB Home | 529,828 | ||||||||
| 1,893 | La-Z-Boy Inc. | 66,274 | ||||||||
| 368 | Legacy Housing Corp.* | 7,213 | ||||||||
| 5,630 | Leggett & Platt Inc. | 272,436 | ||||||||
| 914 | LGI Homes Inc.* | 146,542 | ||||||||
| 500 | Lifetime Brands Inc. | 9,175 | ||||||||
| 525 | Lovesac Co. (The)* | 29,694 | ||||||||
| 1,164 | M/I Homes Inc.* | 74,950 | ||||||||
| 2,395 | MDC Holdings Inc. | 125,139 | ||||||||
| 1,591 | Meritage Homes Corp.* | 177,460 | ||||||||
| 2,373 | Mohawk Industries Inc.* | 469,284 | ||||||||
| 48,045 | Newell Brands Inc. | 1,220,823 | ||||||||
| 10,960 | PulteGroup Inc. | 590,306 | ||||||||
| 2,062 | Purple Innovation Inc., Class A Shares* | 50,313 | ||||||||
| 2,163 | Skyline Champion Corp.* | 135,663 | ||||||||
| 5,110 | Sonos Inc.* | 203,020 | ||||||||
| 5,134 | Taylor Morrison Home Corp., Class A Shares* | 144,214 | ||||||||
| 36,354 | Tempur Sealy International Inc. | 1,625,024 | ||||||||
| 4,742 | Toll Brothers Inc. | 303,773 | ||||||||
See Notes to Financial Statements.
61
| Schedules of Investments |
| (continued) |
| Small-Mid Cap Equity Fund | ||||||||||
| Shares/Units | Security | Value | ||||||||
CONSUMER DISCRETIONARY — 8.8% — (continued) | ||||||||||
Household Durables — 1.3% — (continued) | ||||||||||
| 6,918 | TopBuild Corp.* | $ | 1,513,589 | |||||||
| 4,804 | Tri Pointe Homes Inc.* | 114,191 | ||||||||
| 1,994 | Tupperware Brands Corp.* | 47,597 | ||||||||
| 574 | Universal Electronics Inc.* | 28,998 | ||||||||
| 659 | VOXX International Corp., Class A Shares* | 6,900 | ||||||||
| 2,416 | Vuzix Corp.* | 31,964 | ||||||||
|
| |||||||||
| Total Household Durables | 8,771,607 | |||||||||
|
| |||||||||
Internet & Direct Marketing Retail — 0.4% | ||||||||||
| 24,685 | 1-800-Flowers.com Inc., Class A Shares*(a) | 783,996 | ||||||||
| 1,949 | CarParts.com Inc.* | 33,659 | ||||||||
| 708 | Duluth Holdings Inc., Class B Shares* | 11,016 | ||||||||
| 929 | Groupon Inc., Class A Shares* | 23,011 | ||||||||
| 617 | Lands’ End Inc.* | 20,885 | ||||||||
| 1,146 | Liquidity Services Inc.* | 27,962 | ||||||||
| 1,772 | Overstock.com Inc.* | 127,850 | ||||||||
| 809 | PetMed Express Inc. | 22,280 | ||||||||
| 652 | Porch Group Inc.* | 13,040 | ||||||||
| 4,044 | Quotient Technology Inc.* | 29,359 | ||||||||
| 15,427 | Qurate Retail Inc., Class A Shares | 170,160 | ||||||||
| 3,232 | RealReal Inc. (The)* | 40,206 | ||||||||
| 1,476 | Revolve Group Inc., Class A Shares* | 84,811 | ||||||||
| 964 | Shutterstock Inc. | 111,111 | ||||||||
| 751 | Stamps.com Inc.* | 247,004 | ||||||||
| 2,525 | Stitch Fix Inc., Class A Shares*(a) | 105,823 | ||||||||
| 3,669 | Wayfair Inc., Class A Shares*(a) | 1,030,072 | ||||||||
|
| |||||||||
| Total Internet & Direct Marketing Retail | 2,882,245 | |||||||||
|
| |||||||||
Leisure Products — 0.4% | ||||||||||
| 1,500 | Acushnet Holdings Corp. | 74,940 | ||||||||
| 597 | American Outdoor Brands Inc.* | 16,615 | ||||||||
| 2,708 | AMMO Inc.* | 19,904 | ||||||||
| 10,830 | BRP Inc. | 905,388 | ||||||||
| 3,230 | Brunswick Corp. | 312,890 | ||||||||
| 4,923 | Callaway Golf Co.* | 138,139 | ||||||||
| 989 | Clarus Corp. | 26,792 | ||||||||
| 425 | Escalade Inc. | 9,818 | ||||||||
| 11,385 | Genius Brands International Inc.* | 19,013 | ||||||||
| 1,555 | Hayward Holdings Inc.*(a) | 32,577 | ||||||||
| 228 | Johnson Outdoors Inc., Class A Shares | 26,172 | ||||||||
| 922 | Latham Group Inc.* | 20,256 | ||||||||
| 847 | Malibu Boats Inc., Class A Shares* | 60,645 | ||||||||
| 338 | Marine Products Corp. | 4,793 | ||||||||
| 798 | MasterCraft Boat Holdings Inc.* | 19,902 | ||||||||
| 14,469 | Mattel Inc.* | 308,913 | ||||||||
| 1,281 | Nautilus Inc.* | 14,603 | ||||||||
| 2,392 | Polaris Inc. | 286,466 | ||||||||
| 2,190 | Smith & Wesson Brands Inc. | 52,845 | ||||||||
| 773 | Sturm Ruger & Co., Inc. | 60,441 | ||||||||
| 2,536 | Vista Outdoor Inc.* | 103,596 | ||||||||
| 3,548 | YETI Holdings Inc.* | 352,458 | ||||||||
|
| |||||||||
| Total Leisure Products | 2,867,166 | |||||||||
|
| |||||||||
See Notes to Financial Statements.
62
| Schedules of Investments |
| (continued) |
| Small-Mid Cap Equity Fund | ||||||||||
| Shares/Units | Security | Value | ||||||||
CONSUMER DISCRETIONARY — 8.8% — (continued) | ||||||||||
Multiline Retail — 0.2% | ||||||||||
| 1,514 | Big Lots Inc.(a) | $ | 73,671 | |||||||
| 260 | Dillard’s Inc., Class A Shares | 49,520 | ||||||||
| 1,165 | Franchise Group Inc. | 40,461 | ||||||||
| 6,596 | Kohl’s Corp.(a) | 378,610 | ||||||||
| 12,948 | Macy’s Inc.* | 289,906 | ||||||||
| 4,733 | Nordstrom Inc.*(a) | 135,411 | ||||||||
| 2,700 | Ollie’s Bargain Outlet Holdings Inc.*(a) | 195,426 | ||||||||
|
| |||||||||
| Total Multiline Retail | 1,163,005 | |||||||||
|
| |||||||||
Specialty Retail — 2.3% | ||||||||||
| 1,439 | Aaron’s Co., Inc. (The) | 38,162 | ||||||||
| 2,532 | Abercrombie & Fitch Co., Class A Shares* | 90,544 | ||||||||
| 2,676 | Academy Sports & Outdoors Inc.* | 118,467 | ||||||||
| 6,279 | American Eagle Outfitters Inc.(a) | 191,635 | ||||||||
| 245 | America’s Car-Mart Inc.* | 31,686 | ||||||||
| 780 | Arko Corp.* | 8,065 | ||||||||
| 823 | Asbury Automotive Group Inc.* | 153,275 | ||||||||
| 2,110 | AutoNation Inc.* | 230,180 | ||||||||
| 1,564 | Barnes & Noble Education Inc.* | 12,762 | ||||||||
| 4,523 | Bed Bath & Beyond Inc.*(a) | 124,563 | ||||||||
| 855 | Big 5 Sporting Goods Corp.(a) | 23,769 | ||||||||
| 1,241 | Boot Barn Holdings Inc.*(a) | 110,796 | ||||||||
| 1,246 | Buckle Inc. (The)(a) | 48,258 | ||||||||
| 12,600 | Caleres Inc.(a) | 309,834 | ||||||||
| 1,755 | Camping World Holdings Inc., Class A Shares(a) | 70,095 | ||||||||
| 1,721 | CarLotz Inc.*(a) | 7,073 | ||||||||
| 13,282 | CarMax Inc.* | 1,663,039 | ||||||||
| 904 | Cato Corp. (The), Class A Shares | 15,603 | ||||||||
| 44,614 | Chico’s FAS Inc.*(a) | 230,654 | ||||||||
| 6,333 | Children’s Place Inc. (The)* | 549,958 | ||||||||
| 369 | Citi Trends Inc.* | 31,786 | ||||||||
| 707 | Conn’s Inc.* | 17,392 | ||||||||
| 1,274 | Container Store Group Inc. (The)* | 14,778 | ||||||||
| 33,497 | Designer Brands Inc., Class A Shares* | 485,706 | ||||||||
| 2,658 | Dick’s Sporting Goods Inc. | 374,273 | ||||||||
| 7,746 | Five Below Inc.* | 1,648,426 | ||||||||
| 4,263 | Floor & Decor Holdings Inc., Class A Shares* | 525,628 | ||||||||
| 3,737 | Foot Locker Inc. | 211,851 | ||||||||
| 2,453 | GameStop Corp., Class A Shares*(a) | 535,343 | ||||||||
| 8,348 | Gap Inc. (The) | 223,142 | ||||||||
| 621 | Genesco Inc.* | 38,521 | ||||||||
| 724 | Group 1 Automotive Inc. | 119,779 | ||||||||
| 2,226 | GrowGeneration Corp.*(a) | 71,210 | ||||||||
| 1,703 | Guess? Inc. | 41,196 | ||||||||
| 706 | Haverty Furniture Cos., Inc. | 25,155 | ||||||||
| 655 | Hibbett Inc. | 62,677 | ||||||||
| 452 | JOANN Inc. | 6,197 | ||||||||
| 569 | Kirkland’s Inc.* | 10,879 | ||||||||
| 289 | Lazydays Holdings Inc.* | 7,101 | ||||||||
| 4,508 | Leslie’s Inc.*(a) | 108,733 | ||||||||
| 1,200 | Lithia Motors Inc., Class A Shares | 397,560 | ||||||||
| 1,222 | Lumber Liquidators Holdings Inc.* | 25,491 | ||||||||
| 865 | MarineMax Inc.* | 42,056 | ||||||||
| 18,685 | Monro Inc.(a) | 1,063,363 | ||||||||
| 1,034 | Murphy USA Inc. | 160,560 | ||||||||
See Notes to Financial Statements.
63
| Schedules of Investments |
| (continued) |
| Small-Mid Cap Equity Fund | ||||||||||
| Shares/Units | Security | Value | ||||||||
CONSUMER DISCRETIONARY — 8.8% — (continued) | ||||||||||
Specialty Retail — 2.3% — (continued) | ||||||||||
| 32,154 | National Vision Holdings Inc.*(a) | $ | 1,928,597 | |||||||
| 26,172 | ODP Corp. (The)* | 1,234,533 | ||||||||
| 396 | OneWater Marine Inc., Class A Shares | 16,034 | ||||||||
| 4,525 | Party City Holdco Inc.* | 30,815 | ||||||||
| 1,327 | Penske Automotive Group Inc. | 119,337 | ||||||||
| 3,078 | Petco Health & Wellness Co., Inc., Class A Shares*(a) | 66,269 | ||||||||
| 2,811 | Rent-A-Center Inc. | 177,318 | ||||||||
| 718 | RH* | 503,081 | ||||||||
| 4,866 | Sally Beauty Holdings Inc.* | 90,459 | ||||||||
| 2,516 | Shift Technologies Inc.*(a) | 18,719 | ||||||||
| 716 | Shoe Carnival Inc. | 27,408 | ||||||||
| 2,150 | Signet Jewelers Ltd. | 170,280 | ||||||||
| 987 | Sleep Number Corp.* | 91,307 | ||||||||
| 899 | Sonic Automotive Inc., Class A Shares | 45,435 | ||||||||
| 1,786 | Sportsman’s Warehouse Holdings Inc.* | 31,684 | ||||||||
| 945 | Tilly’s Inc., Class A Shares | 14,714 | ||||||||
| 505 | TravelCenters of America Inc.* | 21,195 | ||||||||
| 2,827 | Urban Outfitters Inc.* | 93,348 | ||||||||
| 4,770 | Vroom Inc.*(a) | 128,122 | ||||||||
| 3,138 | Williams-Sonoma Inc. | �� | 585,865 | |||||||
| 138 | Winmark Corp. | 28,929 | ||||||||
| 908 | Zumiez Inc.* | 36,493 | ||||||||
|
| |||||||||
| Total Specialty Retail | 15,737,163 | |||||||||
|
| |||||||||
Textiles, Apparel & Luxury Goods — 1.0% | ||||||||||
| 6,214 | Capri Holdings Ltd.* | 351,153 | ||||||||
| 14,324 | Carter’s Inc.(a) | 1,466,491 | ||||||||
| 1,647 | Columbia Sportswear Co. | 168,010 | ||||||||
| 2,663 | Crocs Inc.* | 380,330 | ||||||||
| 1,157 | Deckers Outdoor Corp.* | 484,147 | ||||||||
| 1,945 | Fossil Group Inc.* | 26,063 | ||||||||
| 1,957 | G-III Apparel Group Ltd.* | 60,530 | ||||||||
| 14,406 | Hanesbrands Inc. | 269,104 | ||||||||
| 2,230 | Kontoor Brands Inc. | 120,331 | ||||||||
| 613 | Movado Group Inc. | 22,154 | ||||||||
| 669 | Oxford Industries Inc. | 60,411 | ||||||||
| 445 | PLBY Group Inc.* | 11,058 | ||||||||
| 2,993 | PVH Corp.* | 313,636 | ||||||||
| 1,961 | Ralph Lauren Corp., Class A Shares | 227,731 | ||||||||
| 279 | Rocky Brands Inc. | 13,861 | ||||||||
| 5,566 | Skechers USA Inc., Class A Shares*(a) | 280,693 | ||||||||
| 3,385 | Steven Madden Ltd. | 136,991 | ||||||||
| 468 | Superior Group of Cos., Inc. | 11,157 | ||||||||
| 11,590 | Tapestry Inc.* | 467,309 | ||||||||
| 7,745 | Under Armour Inc., Class A Shares* | 179,219 | ||||||||
| 8,309 | Under Armour Inc., Class C Shares* | 166,679 | ||||||||
| 548 | Unifi Inc.* | 12,735 | ||||||||
| 1,143 | Vera Bradley Inc.* | 13,099 | ||||||||
| 36,650 | Wolverine World Wide Inc. | 1,314,269 | ||||||||
|
| |||||||||
| Total Textiles, Apparel & Luxury Goods | 6,557,161 | |||||||||
|
| |||||||||
| TOTAL CONSUMER DISCRETIONARY | 59,868,469 | |||||||||
|
| |||||||||
See Notes to Financial Statements.
64
| Schedules of Investments |
| (continued) |
| Small-Mid Cap Equity Fund | ||||||||||
| Shares/Units | Security | Value | ||||||||
CONSUMER STAPLES — 4.1% | ||||||||||
Beverages — 0.1% | ||||||||||
| 386 | Boston Beer Co., Inc. (The), Class A Shares* | $ | 220,101 | |||||||
| 2,728 | Brown-Forman Corp., Class B Shares | 191,560 | ||||||||
| 1,875 | Celsius Holdings Inc.* | 153,300 | ||||||||
| 206 | Coca-Cola Consolidated Inc. | 83,669 | ||||||||
| 815 | Duckhorn Portfolio Inc.(The)* | 17,514 | ||||||||
| 579 | MGP Ingredients Inc. | 37,809 | ||||||||
| 946 | National Beverage Corp. | 44,036 | ||||||||
| 5,343 | NewAge Inc.* | 9,404 | ||||||||
| 6,483 | Primo Water Corp. | 115,138 | ||||||||
|
| |||||||||
| Total Beverages | 872,531 | |||||||||
|
| |||||||||
Food & Staples Retailing — 0.3% | ||||||||||
| 6,447 | Albertsons Cos., Inc., Class A Shares(a) | 195,731 | ||||||||
| 1,347 | Andersons Inc. (The) | 40,922 | ||||||||
| 5,645 | BJ’s Wholesale Club Holdings Inc.* | 319,846 | ||||||||
| 1,556 | Casey’s General Stores Inc. | 318,295 | ||||||||
| 1,288 | Chefs’ Warehouse Inc. (The)* | 38,936 | ||||||||
| 3,761 | Grocery Outlet Holding Corp.* | 97,899 | ||||||||
| 1,410 | HF Foods Group Inc.* | 8,291 | ||||||||
| 571 | Ingles Markets Inc., Class A Shares | 38,765 | ||||||||
| 450 | MedAvail Holdings Inc.* | 1,503 | ||||||||
| 321 | Natural Grocers by Vitamin Cottage Inc. | 3,881 | ||||||||
| 5,548 | Performance Food Group Co.* | 278,621 | ||||||||
| 976 | PriceSmart Inc. | 82,579 | ||||||||
| 2,325 | Rite Aid Corp.* | 41,246 | ||||||||
| 1,492 | SpartanNash Co. | 32,078 | ||||||||
| 5,085 | Sprouts Farmers Market Inc.* | 126,616 | ||||||||
| 2,298 | United Natural Foods Inc.*(a) | 84,566 | ||||||||
| 9,159 | US Foods Holding Corp.* | 311,406 | ||||||||
| 334 | Village Super Market Inc., Class A Shares | 7,478 | ||||||||
| 667 | Weis Markets Inc. | 37,986 | ||||||||
|
| |||||||||
| Total Food & Staples Retailing | 2,066,645 | |||||||||
|
| |||||||||
Food Products — 2.0% | ||||||||||
| 1,963 | AppHarvest Inc.*(a) | 16,489 | ||||||||
| 2,643 | B&G Foods Inc.(a) | 80,241 | ||||||||
| 2,415 | Beyond Meat Inc.*(a) | 288,931 | ||||||||
| 5,707 | Bunge Ltd. | 432,077 | ||||||||
| 14,201 | Calavo Growers Inc. | 666,311 | ||||||||
| 73,315 | Cal-Maine Foods Inc. | 2,651,070 | ||||||||
| 6,780 | Darling Ingredients Inc.* | 505,110 | ||||||||
| 7,886 | Flowers Foods Inc. | 190,289 | ||||||||
| 1,376 | Fresh Del Monte Produce Inc. | 45,243 | ||||||||
| 1,697 | Freshpet Inc.* | 217,454 | ||||||||
| 24,183 | Hain Celestial Group Inc. (The)*(a) | 904,686 | ||||||||
| 5,274 | Hostess Brands Inc., Class A Shares* | 84,173 | ||||||||
| 2,844 | Ingredion Inc. | 249,874 | ||||||||
| 1,161 | J&J Snack Foods Corp. | 190,125 | ||||||||
| 397 | John B Sanfilippo & Son Inc. | 33,741 | ||||||||
| 247 | Laird Superfood Inc.*(a) | 4,923 | ||||||||
| 6,051 | Lamb Weston Holdings Inc. | 394,223 | ||||||||
| 789 | Lancaster Colony Corp.(a) | 139,842 | ||||||||
| 954 | Landec Corp.* | 10,332 | ||||||||
| 584 | Limoneira Co. | 9,607 | ||||||||
| 21,385 | Mission Produce Inc.*(a) | 443,525 | ||||||||
See Notes to Financial Statements.
65
| Schedules of Investments |
| (continued) |
| Small-Mid Cap Equity Fund | ||||||||||
| Shares/Units | Security | Value | ||||||||
CONSUMER STAPLES — 4.1% — (continued) | ||||||||||
Food Products — 2.0% — (continued) | ||||||||||
| 1,979 | Pilgrim’s Pride Corp.* | $ | 55,095 | |||||||
| 2,432 | Post Holdings Inc.* | 272,165 | ||||||||
| 20,366 | Sanderson Farms Inc. | 4,001,919 | ||||||||
| 11 | Seaboard Corp. | 46,801 | ||||||||
| 272 | Seneca Foods Corp., Class A Shares* | 13,320 | ||||||||
| 3,515 | Simply Good Foods Co. (The)* | 125,204 | ||||||||
| 1,916 | Tattooed Chef Inc.*(a) | 40,562 | ||||||||
| 626 | Tootsie Roll Industries Inc. | 19,813 | ||||||||
| 34,603 | TreeHouse Foods Inc.* | 1,296,574 | ||||||||
| 2,631 | Utz Brands Inc.(a) | 51,094 | ||||||||
| 1,002 | Vital Farms Inc.* | 18,016 | ||||||||
| 1,493 | Whole Earth Brands Inc.* | 18,722 | ||||||||
|
| |||||||||
| Total Food Products | 13,517,551 | |||||||||
|
| |||||||||
Household Products — 0.6% | ||||||||||
| 409 | Central Garden & Pet Co.* | 18,835 | ||||||||
| 1,669 | Central Garden & Pet Co., Class A Shares* | 69,547 | ||||||||
| 1,272 | Clorox Co. (The)(a) | 213,760 | ||||||||
| 2,800 | Energizer Holdings Inc. | 110,152 | ||||||||
| 26,253 | Henkel AG & Co. KGaA, ADR | 592,137 | ||||||||
| 17,540 | Kimberly-Clark Corp. | 2,417,187 | ||||||||
| 205 | Oil-Dri Corp. of America | 7,314 | ||||||||
| 2,239 | Reynolds Consumer Products Inc. | 63,319 | ||||||||
| 1,739 | Spectrum Brands Holdings Inc. | 135,746 | ||||||||
| 563 | WD-40 Co. | 134,912 | ||||||||
|
| |||||||||
| Total Household Products | 3,762,909 | |||||||||
|
| |||||||||
Personal Products — 1.1% | ||||||||||
| 1,902 | Beauty Health Co.* | 48,900 | ||||||||
| 181,448 | Beiersdorf AG, ADR | 4,394,671 | ||||||||
| 1,626 | BellRing Brands Inc., Class A Shares*(a) | 54,910 | ||||||||
| 11,979 | Coty Inc., Class A Shares* | 117,035 | ||||||||
| 2,357 | Edgewell Personal Care Co.(a) | 99,701 | ||||||||
| 1,866 | elf Beauty Inc.* | 57,753 | ||||||||
| 25,768 | Herbalife Nutrition Ltd.* | 1,322,929 | ||||||||
| 1,001 | Honest Co., Inc.(The)* | 10,190 | ||||||||
| 749 | Inter Parfums Inc. | 54,333 | ||||||||
| 498 | Medifast Inc. | 113,494 | ||||||||
| 462 | Nature’s Sunshine Products Inc. | 7,909 | ||||||||
| 15,928 | Nu Skin Enterprises Inc., Class A Shares(a) | 806,275 | ||||||||
| 325 | Revlon Inc., Class A Shares*(a) | 3,708 | ||||||||
| 522 | USANA Health Sciences Inc.* | 50,650 | ||||||||
| 2,601 | Veru Inc.* | 23,201 | ||||||||
|
| |||||||||
| Total Personal Products | 7,165,659 | |||||||||
|
| |||||||||
Tobacco — 0.0% | ||||||||||
| 6,185 | 22nd Century Group Inc.* | 22,080 | ||||||||
| 592 | Turning Point Brands Inc. | 29,458 | ||||||||
| 1,087 | Universal Corp. | 55,002 | ||||||||
| 5,940 | Vector Group Ltd. | 89,219 | ||||||||
|
| |||||||||
| Total Tobacco | 195,759 | |||||||||
|
| |||||||||
| TOTAL CONSUMER STAPLES | 27,581,054 | |||||||||
|
| |||||||||
See Notes to Financial Statements.
66
| Schedules of Investments |
| (continued) |
| Small-Mid Cap Equity Fund | ||||||||||
| Shares/Units | Security | Value | ||||||||
ENERGY — 2.0% | ||||||||||
Energy Equipment & Services — 0.4% | ||||||||||
| 5,482 | Archrock Inc. | $ | 42,102 | |||||||
| 928 | Aspen Aerogels Inc.* | 40,600 | ||||||||
| 284 | Bristow Group Inc.* | 8,963 | ||||||||
| 2,243 | Cactus Inc., Class A Shares | 84,135 | ||||||||
| 8,349 | ChampionX Corp.* | 194,782 | ||||||||
| 759 | DMC Global Inc.* | 30,489 | ||||||||
| 11,489 | Dril-Quip Inc.* | 279,183 | ||||||||
| 6,718 | Frank’s International NV* | 19,348 | ||||||||
| 354 | FTS International Inc., Class A Shares* | 7,862 | ||||||||
| 5,833 | Helix Energy Solutions Group Inc.* | 21,932 | ||||||||
| 4,352 | Helmerich & Payne Inc. | 117,156 | ||||||||
| 7,187 | ION Geophysical Corp.*(a) | 9,271 | ||||||||
| 3,535 | Liberty Oilfield Services Inc., Class A Shares* | 36,128 | ||||||||
| 302 | Nabors Industries Ltd.* | 25,471 | ||||||||
| 1,206 | National Energy Services Reunited Corp.* | 13,688 | ||||||||
| 3,902 | Newpark Resources Inc.* | 10,223 | ||||||||
| 76,743 | NexTier Oilfield Solutions Inc.* | 276,275 | ||||||||
| 16,135 | NOV Inc.* | 212,498 | ||||||||
| 29,154 | Oceaneering International Inc.* | 358,594 | ||||||||
| 49,160 | Oil States International Inc.*(a) | 288,078 | ||||||||
| 25,802 | Patterson-UTI Energy Inc. | 200,223 | ||||||||
| 3,491 | ProPetro Holding Corp.* | 27,020 | ||||||||
| 2,530 | RPC Inc.* | 9,690 | ||||||||
| 2,584 | Select Energy Services Inc., Class A Shares* | 13,824 | ||||||||
| 1,342 | Solaris Oilfield Infrastructure Inc., Class A Shares | 9,971 | ||||||||
| 36,190 | TETRA Technologies Inc.* | 117,256 | ||||||||
| 1,765 | Tidewater Inc.* | 20,297 | ||||||||
| 3,142 | US Silica Holdings Inc.* | 27,587 | ||||||||
|
| |||||||||
| Total Energy Equipment & Services | 2,502,646 | |||||||||
|
| |||||||||
Oil, Gas & Consumable Fuels — 1.6% | ||||||||||
| 979 | Aemetis Inc.*(a) | 10,886 | ||||||||
| 2,981 | Alto Ingredients Inc.* | 15,173 | ||||||||
| 133 | Altus Midstream Co., Class A Shares | 8,669 | ||||||||
| 13,884 | Antero Midstream Corp. | 133,425 | ||||||||
| 11,791 | Antero Resources Corp.* | 161,773 | ||||||||
| 15,646 | APA Corp. | 304,784 | ||||||||
| 647 | Arch Resources Inc.* | 48,971 | ||||||||
| 3,034 | Berry Corp.(a) | 18,204 | ||||||||
| 1,272 | Bonanza Creek Energy Inc. | 49,455 | ||||||||
| 1,816 | Brigham Minerals Inc., Class A Shares | 34,722 | ||||||||
| 16,265 | Cabot Oil & Gas Corp.(a) | 258,451 | ||||||||
| 3,649 | California Resources Corp.* | 124,905 | ||||||||
| 1,639 | Callon Petroleum Co.*(a) | 56,005 | ||||||||
| 7,432 | Centennial Resource Development Inc., Class A Shares* | 37,903 | ||||||||
| 384 | Centrus Energy Corp., Class A Shares* | 11,101 | ||||||||
| 4,061 | Chesapeake Energy Corp. | 226,644 | ||||||||
| 4,261 | Cimarex Energy Co. | 273,641 | ||||||||
| 5,798 | Clean Energy Fuels Corp.* | 45,978 | ||||||||
| 9,019 | CNX Resources Corp.* | 102,456 | ||||||||
| 3,716 | Comstock Resources Inc.* | 21,962 | ||||||||
| 1,409 | CONSOL Energy Inc.* | 32,167 | ||||||||
| 6,026 | Contango Oil & Gas Co.* | 21,874 | ||||||||
| 2,713 | Continental Resources Inc.(a) | 106,567 | ||||||||
| 1,267 | CVR Energy Inc. | 18,245 | ||||||||
| 2,745 | Delek US Holdings Inc. | 46,967 | ||||||||
See Notes to Financial Statements.
67
| Schedules of Investments |
| (continued) |
| Small-Mid Cap Equity Fund | ||||||||||
| Shares/Units | Security | Value | ||||||||
ENERGY — 2.0% — (continued) | ||||||||||
Oil, Gas & Consumable Fuels — 1.6% — (continued) | ||||||||||
| 2,155 | Denbury Inc.* | $ | 151,561 | |||||||
| 68,031 | Devon Energy Corp. | 2,010,316 | ||||||||
| 5,969 | DHT Holdings Inc. | 33,009 | ||||||||
| 14,204 | Diamondback Energy Inc. | 1,095,697 | ||||||||
| 1,250 | Dorian LPG Ltd. | 16,525 | ||||||||
| 988 | Earthstone Energy Inc., Class A Shares* | 8,171 | ||||||||
| 6,577 | Energy Fuels Inc.*(a) | 35,582 | ||||||||
| 11,553 | EQT Corp.* | 211,767 | ||||||||
| 16,913 | Equitrans Midstream Corp. | 147,651 | ||||||||
| 641 | Extraction Oil & Gas Inc.* | 29,185 | ||||||||
| 1,579 | Falcon Minerals Corp. | 7,011 | ||||||||
| 5,392 | Frontline Ltd. | 38,930 | ||||||||
| 8,068 | Gevo Inc.*(a) | 50,264 | ||||||||
| 4,589 | Golar LNG Ltd.* | 51,626 | ||||||||
| 1,457 | Green Plains Inc.* | 51,141 | ||||||||
| 287 | HighPeak Energy Inc. | 2,775 | ||||||||
| 6,271 | HollyFrontier Corp. | 202,741 | ||||||||
| 1,714 | International Seaways Inc. | 29,481 | ||||||||
| 16,500 | Kosmos Energy Ltd.* | 38,940 | ||||||||
| 516 | Laredo Petroleum Inc.* | 27,879 | ||||||||
| 5,739 | Magnolia Oil & Gas Corp., Class A Shares | 89,988 | ||||||||
| 33,025 | Marathon Oil Corp. | 388,044 | ||||||||
| 4,570 | Matador Resources Co. | 131,388 | ||||||||
| 6,054 | Murphy Oil Corp. | 128,708 | ||||||||
| 1,095 | New Fortress Energy Inc., Class A Shares(a) | 32,160 | ||||||||
| 6,391 | Nordic American Tankers Ltd. | 15,147 | ||||||||
| 1,962 | Northern Oil & Gas Inc. | 32,569 | ||||||||
| 827 | Oasis Petroleum Inc. | 71,610 | ||||||||
| 10,999 | Ovintiv Inc. | 299,833 | ||||||||
| 1,868 | Par Pacific Holdings Inc.* | 30,803 | ||||||||
| 3,940 | PBF Energy Inc., Class A Shares* | 40,976 | ||||||||
| 26,366 | PDC Energy Inc. | 1,100,781 | ||||||||
| 3,181 | Peabody Energy Corp.* | 50,832 | ||||||||
| 589 | Penn Virginia Corp.* | 12,192 | ||||||||
| 51,621 | Range Resources Corp.*(a) | 754,699 | ||||||||
| 1,832 | Renewable Energy Group Inc.* | 88,705 | ||||||||
| 219 | REX American Resources Corp.* | 18,562 | ||||||||
| 359 | Riley Exploration Permian Inc. | 7,252 | ||||||||
| 1,980 | Scorpio Tankers Inc. | 32,096 | ||||||||
| 4,265 | SFL Corp., Ltd. | 34,248 | ||||||||
| 5,017 | SM Energy Co. | 95,825 | ||||||||
| 28,069 | Southwestern Energy Co.* | 127,714 | ||||||||
| 1,504 | Talos Energy Inc.* | 18,650 | ||||||||
| 9,470 | Targa Resources Corp. | 415,922 | ||||||||
| 2,758 | Teekay Corp.* | 8,357 | ||||||||
| 971 | Teekay Tankers Ltd., Class A Shares* | 11,118 | ||||||||
| 13,031 | Tellurian Inc.* | 41,569 | ||||||||
| 244 | Texas Pacific Land Corp. | 331,777 | ||||||||
| 8,473 | Uranium Energy Corp.* | 21,267 | ||||||||
| 7,355 | Ur-Energy Inc.* | 9,562 | ||||||||
| 844 | Vine Energy Inc., Class A Shares* | 12,550 | ||||||||
| 4,209 | W&T Offshore Inc.* | 13,721 | ||||||||
| 1,618 | Whiting Petroleum Corp.* | 75,965 | ||||||||
| 2,765 | World Fuel Services Corp. | 89,475 | ||||||||
|
| |||||||||
| Total Oil, Gas & Consumable Fuels | 11,045,245 | |||||||||
|
| |||||||||
| TOTAL ENERGY | 13,547,891 | |||||||||
|
| |||||||||
See Notes to Financial Statements.
68
| Schedules of Investments |
| (continued) |
| Small-Mid Cap Equity Fund | ||||||||||
| Shares/Units | Security | Value | ||||||||
FINANCIALS — 12.6% | ||||||||||
Banks — 4.9% | ||||||||||
| 692 | 1st Source Corp. | $ | 32,524 | |||||||
| 821 | Allegiance Bancshares Inc. | 30,517 | ||||||||
| 730 | Altabancorp | 30,310 | ||||||||
| 634 | Amalgamated Financial Corp. | 9,859 | ||||||||
| 924 | Amerant Bancorp Inc., Class A Shares* | 24,551 | ||||||||
| 450 | American National Bankshares Inc. | 15,381 | ||||||||
| 2,753 | Ameris Bancorp | 135,558 | ||||||||
| 563 | Arrow Financial Corp. | 20,747 | ||||||||
| 6,310 | Associated Banc-Corp. | 130,112 | ||||||||
| 874 | Atlantic Capital Bancshares Inc.* | 21,177 | ||||||||
| 3,247 | Atlantic Union Bankshares Corp. | 120,139 | ||||||||
| 1,925 | Banc of California Inc. | 34,592 | ||||||||
| 727 | BancFirst Corp. | 41,119 | ||||||||
| 2,162 | Bancorp Inc. (The)* | 53,315 | ||||||||
| 4,200 | BancorpSouth Bank | 123,186 | ||||||||
| 292 | Bank First Corp. | 20,732 | ||||||||
| 1,698 | Bank of Hawaii Corp.(a) | 142,309 | ||||||||
| 518 | Bank of Marin Bancorp | 18,752 | ||||||||
| 2,063 | Bank of NT Butterfield & Son Ltd. (The) | 68,719 | ||||||||
| 5,243 | Bank OZK(a) | 222,461 | ||||||||
| 70,626 | BankUnited Inc.(a) | 2,968,411 | ||||||||
| 7,062 | Banner Corp. | 403,946 | ||||||||
| 672 | Bar Harbor Bankshares | 18,413 | ||||||||
| 24,996 | Berkshire Hills Bancorp Inc. | 640,647 | ||||||||
| 659 | Blue Ridge Bankshares Inc. | 11,697 | ||||||||
| 1,282 | BOK Financial Corp. | 112,880 | ||||||||
| 3,251 | Brookline Bancorp Inc. | 48,667 | ||||||||
| 783 | Bryn Mawr Bank Corp. | 31,946 | ||||||||
| 797 | Business First Bancshares Inc. | 19,064 | ||||||||
| 1,089 | Byline Bancorp Inc. | 26,789 | ||||||||
| 5,048 | Cadence BanCorp, Class A Shares | 108,582 | ||||||||
| 317 | Cambridge Bancorp | 27,180 | ||||||||
| 655 | Camden National Corp. | 30,569 | ||||||||
| 297 | Capital Bancorp Inc. | 7,045 | ||||||||
| 632 | Capital City Bank Group Inc. | 14,656 | ||||||||
| 779 | Capstar Financial Holdings Inc. | 16,390 | ||||||||
| 946 | Carter Bankshares Inc.* | 11,532 | ||||||||
| 3,316 | Cathay General Bancorp | 131,910 | ||||||||
| 674 | CBTX Inc. | 18,346 | ||||||||
| 1,125 | Central Pacific Financial Corp. | 28,474 | ||||||||
| 121 | Century Bancorp Inc., Class A Shares | 13,834 | ||||||||
| 4,092 | CIT Group Inc. | 226,779 | ||||||||
| 722 | Citizens & Northern Corp. | 18,115 | ||||||||
| 639 | City Holding Co. | 49,778 | ||||||||
| 563 | Civista Bancshares Inc. | 13,242 | ||||||||
| 656 | CNB Financial Corp. | 16,124 | ||||||||
| 367 | Coastal Financial Corp.* | 10,779 | ||||||||
| 2,974 | Columbia Banking System Inc. | 108,135 | ||||||||
| 22,029 | Comerica Inc. | 1,628,163 | ||||||||
| 4,415 | Commerce Bancshares Inc. | 312,229 | ||||||||
| 2,202 | Community Bank System Inc. | 162,948 | ||||||||
| 589 | Community Trust Bancorp Inc. | 24,538 | ||||||||
| 1,564 | ConnectOne Bancorp Inc. | 44,746 | ||||||||
| 1,918 | CrossFirst Bankshares Inc.* | 25,356 | ||||||||
See Notes to Financial Statements.
69
| Schedules of Investments |
| (continued) |
| Small-Mid Cap Equity Fund | ||||||||||
| Shares/Units | Security | Value | ||||||||
FINANCIALS — 12.6% — (continued) | ||||||||||
Banks — 4.9% — (continued) | ||||||||||
| 2,427 | Cullen/Frost Bankers Inc.(a) | $ | 277,212 | |||||||
| 1,255 | Customers Bancorp Inc.* | 51,970 | ||||||||
| 5,348 | CVB Financial Corp. | 108,885 | ||||||||
| 1,447 | Dime Community Bancshares Inc. | 47,751 | ||||||||
| 1,334 | Eagle Bancorp Inc. | 76,972 | ||||||||
| 5,862 | East West Bancorp Inc. | 429,919 | ||||||||
| 7,310 | Eastern Bankshares Inc. | 144,592 | ||||||||
| 403 | Enterprise Bancorp Inc. | 13,601 | ||||||||
| 1,453 | Enterprise Financial Services Corp. | 65,254 | ||||||||
| 542 | Equity Bancshares Inc., Class A Shares* | 17,387 | ||||||||
| 1,023 | Farmers National Banc Corp. | 15,959 | ||||||||
| 1,484 | FB Financial Corp. | 61,126 | ||||||||
| 171 | Fidelity D&D Bancorp Inc. | 9,225 | ||||||||
| 660 | Financial Institutions Inc. | 20,962 | ||||||||
| 10,010 | First Bancorp | 158,664 | ||||||||
| 488 | First Bancorp Inc. (The) | 14,489 | ||||||||
| 846 | First Bancshares Inc. (The) | 34,280 | ||||||||
| 727 | First Bank | 9,684 | ||||||||
| 2,010 | First Busey Corp. | 47,637 | ||||||||
| 2,300 | First Citizens BancShares Inc., Class A Shares(a) | 2,064,710 | ||||||||
| 3,394 | First Commonwealth Financial Corp. | 45,887 | ||||||||
| 744 | First Community Bancshares Inc. | 23,243 | ||||||||
| 4,054 | First Financial Bancorp | 95,310 | ||||||||
| 5,468 | First Financial Bankshares Inc. | 260,386 | ||||||||
| 507 | First Financial Corp. | 20,498 | ||||||||
| 1,618 | First Foundation Inc. | 38,881 | ||||||||
| 5,427 | First Hawaiian Inc. | 151,468 | ||||||||
| 23,138 | First Horizon Corp. | 379,232 | ||||||||
| 357 | First Internet Bancorp | 10,610 | ||||||||
| 1,659 | First Interstate BancSystem Inc., Class A Shares | 73,096 | ||||||||
| 2,273 | First Merchants Corp. | 93,534 | ||||||||
| 677 | First Mid Bancshares Inc. | 27,689 | ||||||||
| 4,706 | First Midwest Bancorp Inc. | 88,143 | ||||||||
| 905 | First of Long Island Corp. (The) | 19,186 | ||||||||
| 155 | Five Star Bancorp | 3,701 | ||||||||
| 1,312 | Flushing Financial Corp. | 30,084 | ||||||||
| 13,624 | FNB Corp. | 159,128 | ||||||||
| 25,752 | Fulton Financial Corp. | 408,169 | ||||||||
| 1,003 | German American Bancorp Inc. | 37,472 | ||||||||
| 3,956 | Glacier Bancorp Inc. | 210,697 | ||||||||
| 438 | Great Southern Bancorp Inc. | 23,858 | ||||||||
| 2,279 | Great Western Bancorp Inc. | 70,558 | ||||||||
| 344 | Guaranty Bancshares Inc. | 11,806 | ||||||||
| 3,577 | Hancock Whitney Corp. | 164,399 | ||||||||
| 1,156 | Hanmi Financial Corp. | 22,288 | ||||||||
| 2,106 | HarborOne Bancorp Inc. | 29,758 | ||||||||
| 538 | HBT Financial Inc. | 8,796 | ||||||||
| 1,715 | Heartland Financial USA Inc. | 80,656 | ||||||||
| 2,501 | Heritage Commerce Corp. | 28,186 | ||||||||
| 1,474 | Heritage Financial Corp. | 37,513 | ||||||||
| 2,664 | Hilltop Holdings Inc. | 89,164 | ||||||||
| 6,327 | Home BancShares Inc. | 140,143 | ||||||||
| 632 | HomeTrust Bancshares Inc. | 17,582 | ||||||||
| 5,073 | Hope Bancorp Inc. | 69,957 | ||||||||
See Notes to Financial Statements.
70
| Schedules of Investments |
| (continued) |
| Small-Mid Cap Equity Fund | ||||||||||
| Shares/Units | Security | Value | ||||||||
FINANCIALS — 12.6% — (continued) | ||||||||||
Banks — 4.9% — (continued) | ||||||||||
| 1,926 | Horizon Bancorp Inc. | $ | 34,379 | |||||||
| 590 | Howard Bancorp Inc.* | 11,741 | ||||||||
| 128,459 | Huntington Bancshares Inc. | 1,994,968 | ||||||||
| 829 | Independent Bank Corp. | 17,359 | ||||||||
| 1,350 | Independent Bank Corp.(a) | 103,545 | ||||||||
| 1,610 | Independent Bank Group Inc. | 113,392 | ||||||||
| 2,338 | International Bancshares Corp. | 97,915 | ||||||||
| 9,414 | Investors Bancorp Inc. | 134,714 | ||||||||
| 2,149 | Lakeland Bancorp Inc. | 36,275 | ||||||||
| 995 | Lakeland Financial Corp. | 66,078 | ||||||||
| 1,376 | Live Oak Bancshares Inc. | 84,225 | ||||||||
| 1,475 | Macatawa Bank Corp. | 12,110 | ||||||||
| 604 | Mercantile Bank Corp. | 18,845 | ||||||||
| 785 | Metrocity Bankshares Inc. | 16,257 | ||||||||
| 305 | Metropolitan Bank Holding Corp.* | 23,882 | ||||||||
| 367 | Mid Penn Bancorp Inc. | 9,759 | ||||||||
| 906 | Midland States Bancorp Inc. | 22,922 | ||||||||
| 647 | MidWestOne Financial Group Inc. | 18,996 | ||||||||
| 396 | MVB Financial Corp. | 15,658 | ||||||||
| 30,620 | National Bank Holdings Corp., Class A Shares | 1,148,250 | ||||||||
| 1,750 | NBT Bancorp Inc. | 62,755 | ||||||||
| 364 | Nicolet Bankshares Inc.* | 27,813 | ||||||||
| 197 | Northrim BanCorp Inc. | 8,268 | ||||||||
| 2,417 | OceanFirst Financial Corp. | 51,385 | ||||||||
| 2,056 | OFG Bancorp | 48,953 | ||||||||
| 6,836 | Old National Bancorp | 113,888 | ||||||||
| 1,045 | Old Second Bancorp Inc. | 12,289 | ||||||||
| 938 | Origin Bancorp Inc. | 38,599 | ||||||||
| 454 | Orrstown Financial Services Inc. | 10,832 | ||||||||
| 31,985 | Pacific Premier Bancorp Inc. | 1,278,121 | ||||||||
| 25,102 | PacWest Bancorp | 1,068,090 | ||||||||
| 593 | Park National Corp. | 69,523 | ||||||||
| 732 | Peapack Gladstone Financial Corp. | 24,383 | ||||||||
| 771 | Peoples Bancorp Inc. | 24,086 | ||||||||
| 314 | Peoples Financial Services Corp. | 14,472 | ||||||||
| 17,704 | People’s United Financial Inc. | 290,877 | ||||||||
| 3,088 | Pinnacle Financial Partners Inc. | 299,289 | ||||||||
| 3,519 | Popular Inc. | 267,233 | ||||||||
| 567 | Preferred Bank | 36,226 | ||||||||
| 581 | Premier Financial Bancorp Inc. | 10,464 | ||||||||
| 950 | Primis Financial Corp. | 14,241 | ||||||||
| 3,706 | Prosperity Bancshares Inc. | 258,975 | ||||||||
| 631 | QCR Holdings Inc. | 32,780 | ||||||||
| 632 | RBB Bancorp | 16,268 | ||||||||
| 148 | Red River Bancshares Inc. | 7,424 | ||||||||
| 693 | Reliant Bancorp Inc. | 20,097 | ||||||||
| 2,293 | Renasant Corp. | 80,484 | ||||||||
| 442 | Republic Bancorp Inc., Class A Shares | 22,157 | ||||||||
| 1,597 | Republic First Bancorp Inc.* | 5,334 | ||||||||
| 1,604 | S&T Bancorp Inc. | 47,799 | ||||||||
| 1,944 | Sandy Spring Bancorp Inc. | 84,700 | ||||||||
| 2,235 | Seacoast Banking Corp. of Florida | 71,386 | ||||||||
| 2,072 | ServisFirst Bancshares Inc. | 152,126 | ||||||||
| 651 | Sierra Bancorp | 16,548 | ||||||||
See Notes to Financial Statements.
71
| Schedules of Investments |
| (continued) |
| Small-Mid Cap Equity Fund | ||||||||||
| Shares/Units | Security | Value | ||||||||
FINANCIALS — 12.6% — (continued) | ||||||||||
Banks — 4.9% — (continued) | ||||||||||
| 7,411 | Signature Bank | $ | 1,921,895 | |||||||
| 943 | Silvergate Capital Corp., Class A Shares* | 106,540 | ||||||||
| 4,448 | Simmons First National Corp., Class A Shares | 129,214 | ||||||||
| 475 | SmartFinancial Inc. | 11,866 | ||||||||
| 359 | South Plains Financial Inc. | 8,329 | ||||||||
| 2,992 | South State Corp. | 205,191 | ||||||||
| 351 | Southern First Bancshares Inc.* | 17,894 | ||||||||
| 1,335 | Southside Bancshares Inc. | 50,316 | ||||||||
| 628 | Spirit of Texas Bancshares Inc. | 14,852 | ||||||||
| 7,959 | Sterling Bancorp | 182,182 | ||||||||
| 842 | Stock Yards Bancorp Inc. | 43,430 | ||||||||
| 512 | Summit Financial Group Inc. | 12,257 | ||||||||
| 6,133 | Synovus Financial Corp. | 264,332 | ||||||||
| 30,745 | Texas Capital Bancshares Inc.* | 2,090,353 | ||||||||
| 621 | Tompkins Financial Corp. | 49,425 | ||||||||
| 9,477 | Towne Bank | 288,764 | ||||||||
| 1,139 | TriCo Bancshares | 45,047 | ||||||||
| 1,191 | TriState Capital Holdings Inc.* | 24,070 | ||||||||
| 967 | Triumph Bancorp Inc.* | 79,507 | ||||||||
| 2,612 | Trustmark Corp. | 82,591 | ||||||||
| 8,734 | UMB Financial Corp. | 799,860 | ||||||||
| 9,511 | Umpqua Holdings Corp. | 185,179 | ||||||||
| 5,166 | United Bankshares Inc. | 187,681 | ||||||||
| 3,338 | United Community Banks Inc. | 100,707 | ||||||||
| 1,083 | Univest Financial Corp. | 29,328 | ||||||||
| 62,188 | Valley National Bancorp | 810,932 | ||||||||
| 1,969 | Veritex Holdings Inc. | 70,746 | ||||||||
| 736 | Washington Trust Bancorp Inc. | 39,199 | ||||||||
| 3,743 | Webster Financial Corp. | 189,096 | ||||||||
| 2,707 | WesBanco Inc. | 92,038 | ||||||||
| 691 | West Bancorporation Inc. | 21,138 | ||||||||
| 1,078 | Westamerica Bancorporation | 61,166 | ||||||||
| 4,193 | Western Alliance Bancorp | 409,069 | ||||||||
| 2,353 | Wintrust Financial Corp. | 176,099 | ||||||||
| 6,718 | Zions Bancorp NA | 388,972 | ||||||||
|
| |||||||||
| Total Banks | 33,027,727 | |||||||||
|
| |||||||||
Capital Markets — 2.3% | ||||||||||
| 1,724 | Affiliated Managers Group Inc. | 293,270 | ||||||||
| 5,820 | Ares Management Corp., Class A Shares | 449,188 | ||||||||
| 2,457 | Artisan Partners Asset Management Inc., Class A Shares | 127,666 | ||||||||
| 797 | Assetmark Financial Holdings Inc.* | 21,415 | ||||||||
| 56 | Associated Capital Group Inc., Class A Shares | 2,065 | ||||||||
| 837 | B. Riley Financial Inc. | 54,857 | ||||||||
| 13,720 | BGC Partners Inc., Class A Shares | 70,658 | ||||||||
| 2,083 | Blucora Inc.* | 34,182 | ||||||||
| 2,434 | Brightsphere Investment Group Inc. | 66,180 | ||||||||
| 6,790 | Carlyle Group Inc. (The) | 335,290 | ||||||||
| 4,467 | Cboe Global Markets Inc. | 563,512 | ||||||||
| 14,972 | Cohen & Steers Inc. | 1,313,194 | ||||||||
| 1,094 | Cowen Inc., Class A Shares | 39,428 | ||||||||
| 142 | Diamond Hill Investment Group Inc. | 25,990 | ||||||||
| 1,194 | Donnelley Financial Solutions Inc.* | 39,820 | ||||||||
| 6,125 | Evercore Inc., Class A Shares | 855,295 | ||||||||
| 1,580 | FactSet Research Systems Inc.(a) | 600,748 | ||||||||
See Notes to Financial Statements.
72
| Schedules of Investments |
| (continued) |
| Small-Mid Cap Equity Fund | ||||||||||
| Shares/Units | Security | Value | ||||||||
FINANCIALS — 12.6% — (continued) | ||||||||||
Capital Markets — 2.3% — (continued) | ||||||||||
| 4,099 | Federated Hermes Inc., Class B Shares | $ | 138,669 | |||||||
| 2,141 | Focus Financial Partners Inc., Class A Shares* | 111,075 | ||||||||
| 205 | GAMCO Investors Inc., Class A Shares | 5,599 | ||||||||
| 1,354 | GCM Grosvenor Inc., Class A Shares(a) | 15,056 | ||||||||
| 659 | Greenhill & Co., Inc. | 9,714 | ||||||||
| 1,419 | Hamilton Lane Inc., Class A Shares | 122,133 | ||||||||
| 2,248 | Houlihan Lokey Inc., Class A Shares | 202,770 | ||||||||
| 13,935 | Invesco Ltd. | 352,834 | ||||||||
| 5,132 | Janus Henderson Group PLC | 222,524 | ||||||||
| 9,150 | Jefferies Financial Group Inc. | 338,184 | ||||||||
| 4,297 | Lazard Ltd., Class A Shares | 203,678 | ||||||||
| 3,360 | LPL Financial Holdings Inc. | 496,776 | ||||||||
| 2,555 | Moelis & Co., Class A Shares | 158,282 | ||||||||
| 4,772 | Moody’s Corp. | 1,817,034 | ||||||||
| 976 | Morningstar Inc. | 261,558 | ||||||||
| 6,154 | Nasdaq Inc. | 1,204,830 | ||||||||
| 23,316 | Northern Trust Corp. | 2,763,412 | ||||||||
| 4,399 | Open Lending Corp., Class A Shares* | 162,631 | ||||||||
| 410 | Oppenheimer Holdings Inc., Class A Shares | 19,102 | ||||||||
| 746 | Piper Sandler Cos. | 106,618 | ||||||||
| 1,001 | PJT Partners Inc., Class A Shares | 79,059 | ||||||||
| 805 | Pzena Investment Management Inc., Class A Shares | 8,783 | ||||||||
| 914 | Sculptor Capital Management Inc., Class A Shares | 25,866 | ||||||||
| 4,693 | SEI Investments Co. | 294,767 | ||||||||
| 41,123 | SLR Investment Corp. | 771,468 | ||||||||
| 1,548 | StepStone Group Inc., Class A Shares(a) | 74,103 | ||||||||
| 4,229 | Stifel Financial Corp.(a) | 292,224 | ||||||||
| 719 | StoneX Group Inc.* | 50,107 | ||||||||
| 3,892 | Virtu Financial Inc., Class A Shares(a) | 95,276 | ||||||||
| 316 | Virtus Investment Partners Inc. | 98,813 | ||||||||
| 6,054 | WisdomTree Investments Inc. | 38,201 | ||||||||
|
| |||||||||
| Total Capital Markets | 15,433,904 | |||||||||
|
| |||||||||
Consumer Finance — 0.3% | ||||||||||
| 216 | Atlanticus Holdings Corp.* | 13,867 | ||||||||
| 388 | Credit Acceptance Corp.*(a) | 224,916 | ||||||||
| 874 | Curo Group Holdings Corp. | 14,307 | ||||||||
| 1,287 | Encore Capital Group Inc.* | 63,333 | ||||||||
| 1,477 | Enova International Inc.* | 48,711 | ||||||||
| 2,154 | EZCORP Inc., Class A Shares* | 14,841 | ||||||||
| 1,677 | FirstCash Inc. | 143,702 | ||||||||
| 2,178 | Green Dot Corp., Class A Shares* | 113,779 | ||||||||
| 3,985 | LendingClub Corp.* | 123,774 | ||||||||
| 479 | LendingTree Inc.*(a) | 79,816 | ||||||||
| 7,342 | Navient Corp. | 170,408 | ||||||||
| 708 | Nelnet Inc., Class A Shares | 57,263 | ||||||||
| 3,785 | OneMain Holdings Inc., Class A Shares | 218,887 | ||||||||
| 1,045 | Oportun Financial Corp.* | 26,386 | ||||||||
| 1,918 | PRA Group Inc.* | 80,556 | ||||||||
| 2,764 | PROG Holdings Inc. | 130,793 | ||||||||
| 359 | Regional Management Corp. | 21,335 | ||||||||
| 2,563 | Santander Consumer USA Holdings Inc.(a) | 106,954 | ||||||||
| 13,472 | SLM Corp. | 252,600 | ||||||||
| 514 | Upstart Holdings Inc.*(a) | 117,768 | ||||||||
| 181 | World Acceptance Corp.* | 34,367 | ||||||||
|
| |||||||||
| Total Consumer Finance | 2,058,363 | |||||||||
|
| |||||||||
See Notes to Financial Statements.
73
| Schedules of Investments |
| (continued) |
| Small-Mid Cap Equity Fund | ||||||||||
| Shares/Units | Security | Value | ||||||||
FINANCIALS — 12.6% — (continued) | ||||||||||
Diversified Financial Services — 0.2% | ||||||||||
| 699 | Alerus Financial Corp. | $ | 20,872 | |||||||
| 356 | A-Mark Precious Metals Inc. | 17,270 | ||||||||
| 1,362 | Banco Latinoamericano de Comercio Exterior SA, Class E Shares | 23,236 | ||||||||
| 3,556 | Cannae Holdings Inc.* | 113,507 | ||||||||
| 329 | Marlin Business Services Corp. | 7,320 | ||||||||
| 14,736 | Voya Financial Inc. | 957,545 | ||||||||
|
| |||||||||
| Total Diversified Financial Services | 1,139,750 | |||||||||
|
| |||||||||
Insurance — 4.2% | ||||||||||
| 2,347 | Alleghany Corp.* | 1,588,191 | ||||||||
| 1,955 | Ambac Financial Group Inc.* | 27,546 | ||||||||
| 3,515 | American Equity Investment Life Holding Co. | 111,390 | ||||||||
| 2,817 | American Financial Group Inc. | 388,577 | ||||||||
| 320 | American National Group Inc. | 61,600 | ||||||||
| 786 | AMERISAFE Inc. | 45,234 | ||||||||
| 1,308 | Argo Group International Holdings Ltd.(a) | 69,193 | ||||||||
| 2,498 | Assurant Inc. | 424,935 | ||||||||
| 3,017 | Assured Guaranty Ltd. | 150,428 | ||||||||
| 4,790 | Athene Holding Ltd., Class A Shares* | 320,786 | ||||||||
| 3,220 | Axis Capital Holdings Ltd. | 164,767 | ||||||||
| 3,685 | Brighthouse Financial Inc.* | 180,418 | ||||||||
| 9,885 | Brown & Brown Inc. | 573,824 | ||||||||
| 48,534 | BRP Group Inc., Class A Shares* | 1,827,305 | ||||||||
| 11,789 | Chubb Ltd. | 2,168,233 | ||||||||
| 2,289 | Citizens Inc., Class A Shares* | 13,665 | ||||||||
| 5,436 | CNO Financial Group Inc. | 132,965 | ||||||||
| 698 | Crawford & Co., Class A Shares | 6,959 | ||||||||
| 558 | Donegal Group Inc., Class A Shares | 8,404 | ||||||||
| 8,925 | eHealth Inc.* | 344,951 | ||||||||
| 1,059 | Employers Holdings Inc. | 43,599 | ||||||||
| 581 | Enstar Group Ltd.* | 134,019 | ||||||||
| 1,042 | Erie Indemnity Co., Class A Shares | 184,528 | ||||||||
| 11,247 | Everest Re Group Ltd. | 2,979,330 | ||||||||
| 4,420 | First American Financial Corp. | 311,743 | ||||||||
| 20,741 | Genworth Financial Inc., Class A Shares* | 77,779 | ||||||||
| 4,295 | Globe Life Inc. | 412,621 | ||||||||
| 1,888 | GoHealth Inc., Class A Shares* | 9,176 | ||||||||
| 728 | Goosehead Insurance Inc., Class A Shares | 106,856 | ||||||||
| 1,274 | Greenlight Capital Re Ltd., Class A Shares* | 10,740 | ||||||||
| 1,485 | Hanover Insurance Group Inc. (The) | 209,845 | ||||||||
| 11,770 | Hartford Financial Services Group Inc. (The) | 791,179 | ||||||||
| 237 | HCI Group Inc. | 26,463 | ||||||||
| 931 | Heritage Insurance Holdings Inc. | 6,517 | ||||||||
| 1,699 | Horace Mann Educators Corp. | 69,659 | ||||||||
| 214 | Independence Holding Co. | 10,696 | ||||||||
| 67 | Investors Title Co. | 12,855 | ||||||||
| 1,352 | James River Group Holdings Ltd. | 49,740 | ||||||||
| 2,527 | Kemper Corp. | 173,352 | ||||||||
| 910 | Kinsale Capital Group Inc.(a) | 165,484 | ||||||||
| 1,584 | Lemonade Inc.*(a) | 119,655 | ||||||||
| 2,760 | Maiden Holdings Ltd.* | 8,639 | ||||||||
| 2,349 | Markel Corp.* | 2,983,817 | ||||||||
| 1,900 | MBIA Inc.* | 21,261 | ||||||||
| 1,116 | Mercury General Corp. | 66,636 | ||||||||
| 13,328 | MetLife Inc. | 826,336 | ||||||||
See Notes to Financial Statements.
74
| Schedules of Investments |
| (continued) |
| Small-Mid Cap Equity Fund | ||||||||||
| Shares/Units | Security | Value | ||||||||
FINANCIALS — 12.6% — (continued) | ||||||||||
Insurance — 4.2% — (continued) | ||||||||||
| 1,474 | MetroMile Inc.*(a) | $ | 5,896 | |||||||
| 103 | National Western Life Group Inc., Class A Shares | 22,831 | ||||||||
| 380 | NI Holdings Inc.* | 7,418 | ||||||||
| 11,915 | Old Republic International Corp. | 309,790 | ||||||||
| 9,125 | Palomar Holdings Inc., Class A Shares* | 819,425 | ||||||||
| 7,992 | Primerica Inc. | 1,222,297 | ||||||||
| 2,166 | ProAssurance Corp. | 55,233 | ||||||||
| 9,245 | Reinsurance Group of America Inc., Class A Shares | 1,070,756 | ||||||||
| 2,030 | RenaissanceRe Holdings Ltd. | 318,162 | ||||||||
| 1,697 | RLI Corp.(a) | 185,363 | ||||||||
| 614 | Safety Insurance Group Inc. | 49,924 | ||||||||
| 2,456 | Selective Insurance Group Inc. | 205,248 | ||||||||
| 5,529 | Selectquote Inc.* | 52,802 | ||||||||
| 3,721 | SiriusPoint Ltd.* | 36,503 | ||||||||
| 755 | State Auto Financial Corp. | 38,188 | ||||||||
| 1,123 | Stewart Information Services Corp. | 70,693 | ||||||||
| 845 | Tiptree Inc. | 8,543 | ||||||||
| 27,087 | Travelers Cos., Inc. (The) | 4,326,065 | ||||||||
| 758 | Trean Insurance Group Inc.* | 7,739 | ||||||||
| 1,566 | Trupanion Inc.* | 143,414 | ||||||||
| 843 | United Fire Group Inc. | 21,884 | ||||||||
| 904 | United Insurance Holdings Corp. | 3,444 | ||||||||
| 1,145 | Universal Insurance Holdings Inc. | 16,305 | ||||||||
| 8,521 | Unum Group | 226,829 | ||||||||
| 129 | White Mountains Insurance Group Ltd. | 144,585 | ||||||||
| 11,011 | WR Berkley Corp. | 829,238 | ||||||||
|
| |||||||||
| Total Insurance | 28,620,471 | |||||||||
|
| |||||||||
Mortgage Real Estate Investment Trusts (REITs) — 0.3% | ||||||||||
| 302 | AFC Gamma Inc. | 6,436 | ||||||||
| 22,065 | AGNC Investment Corp. | 359,880 | ||||||||
| 5,818 | Apollo Commercial Real Estate Finance Inc. | 90,470 | ||||||||
| 5,234 | Arbor Realty Trust Inc. | 95,678 | ||||||||
| 1,519 | Ares Commercial Real Estate Corp. | 23,970 | ||||||||
| 2,760 | ARMOUR Residential REIT Inc. | 29,974 | ||||||||
| 5,867 | Blackstone Mortgage Trust Inc., Class A Shares | 192,496 | ||||||||
| 3,471 | BrightSpire Capital Inc., Class A Shares | 34,779 | ||||||||
| 5,335 | Broadmark Realty Capital Inc. | 56,071 | ||||||||
| 4,242 | Capstead Mortgage Corp. | 29,227 | ||||||||
| 9,756 | Chimera Investment Corp. | 149,462 | ||||||||
| 1,234 | Dynex Capital Inc. | 21,916 | ||||||||
| 1,694 | Ellington Financial Inc. | 31,373 | ||||||||
| 2,266 | Granite Point Mortgage Trust Inc. | 31,180 | ||||||||
| 885 | Great Ajax Corp. | 12,505 | ||||||||
| 3,166 | Hannon Armstrong Sustainable Infrastructure Capital Inc.(a) | 191,131 | ||||||||
| 11,351 | Invesco Mortgage Capital Inc.(a) | 35,415 | ||||||||
| 1,358 | KKR Real Estate Finance Trust Inc. | 28,966 | ||||||||
| 4,606 | Ladder Capital Corp., Class A Shares | 52,554 | ||||||||
| 18,264 | MFA Financial Inc. | 87,667 | ||||||||
| 17,974 | New Residential Investment Corp. | 196,276 | ||||||||
| 15,576 | New York Mortgage Trust Inc. | 68,846 | ||||||||
| 3,629 | Orchid Island Capital Inc., Class A Shares(a) | 18,218 | ||||||||
| 4,032 | PennyMac Mortgage Investment Trust | 78,261 | ||||||||
| 2,381 | Ready Capital Corp. | 36,453 | ||||||||
See Notes to Financial Statements.
75
| Schedules of Investments |
| (continued) |
| Small-Mid Cap Equity Fund | ||||||||||
| Shares/Units | Security | Value | ||||||||
FINANCIALS — 12.6% — (continued) | ||||||||||
Mortgage Real Estate Investment Trusts (REITs) — 0.3% — (continued) | ||||||||||
| 4,668 | Redwood Trust Inc. | $ | 58,210 | |||||||
| 11,434 | Starwood Property Trust Inc. | 294,997 | ||||||||
| 2,578 | TPG RE Finance Trust Inc. | 32,483 | ||||||||
| 12,726 | Two Harbors Investment Corp.(a) | 83,992 | ||||||||
|
| |||||||||
| Total Mortgage Real Estate Investment Trusts (REITs) | 2,428,886 | |||||||||
|
| |||||||||
Thrifts & Mortgage Finance — 0.4% | ||||||||||
| 2,350 | Axos Financial Inc.*(a) | 113,928 | ||||||||
| 835 | Bridgewater Bancshares Inc.* | 13,652 | ||||||||
| 5,359 | Capitol Federal Financial Inc. | 61,843 | ||||||||
| 1,667 | Columbia Financial Inc.* | 30,056 | ||||||||
| 4,673 | Essent Group Ltd. | 220,005 | ||||||||
| 400 | Federal Agricultural Mortgage Corp., Class C Shares | 39,160 | ||||||||
| 1,390 | Finance Of America Cos Inc., Class A Shares* | 7,645 | ||||||||
| 2,124 | Flagstar Bancorp Inc. | 105,053 | ||||||||
| 342 | FS Bancorp Inc. | 11,686 | ||||||||
| 67 | Hingham Institution for Savings | 21,742 | ||||||||
| 274 | Home Bancorp Inc. | 10,253 | ||||||||
| 437 | Home Point Capital Inc. | 1,731 | ||||||||
| 818 | HomeStreet Inc. | 33,415 | ||||||||
| 2,979 | Kearny Financial Corp. | 37,804 | ||||||||
| 760 | Luther Burbank Corp. | 9,857 | ||||||||
| 391 | Merchants Bancorp | 14,338 | ||||||||
| 1,925 | Meridian Bancorp Inc. | 40,002 | ||||||||
| 1,274 | Meta Financial Group Inc. | 62,668 | ||||||||
| 14,393 | MGIC Investment Corp. | 219,781 | ||||||||
| 2,953 | Mr Cooper Group Inc.* | 114,813 | ||||||||
| 19,225 | New York Community Bancorp Inc. | 240,697 | ||||||||
| 3,492 | NMI Holdings Inc., Class A Shares* | 78,814 | ||||||||
| 1,944 | Northfield Bancorp Inc. | 32,854 | ||||||||
| 4,687 | Northwest Bancshares Inc. | 61,025 | ||||||||
| 321 | Ocwen Financial Corp.* | 9,084 | ||||||||
| 584 | PCSB Financial Corp. | 10,646 | ||||||||
| 1,455 | PennyMac Financial Services Inc. | 96,830 | ||||||||
| 545 | Pioneer Bancorp Inc.* | 6,698 | ||||||||
| 1,490 | Premier Financial Corp. | 45,296 | ||||||||
| 580 | Provident Bancorp Inc. | 9,413 | ||||||||
| 3,105 | Provident Financial Services Inc. | 68,527 | ||||||||
| 7,920 | Radian Group Inc. | 187,150 | ||||||||
| 324 | Southern Missouri Bancorp Inc. | 14,619 | ||||||||
| 2,351 | TFS Financial Corp. | 46,996 | ||||||||
| 818 | TrustCo Bank Corp. NY | 26,250 | ||||||||
| 1,781 | UWM Holdings Corp.(a) | 13,090 | ||||||||
| 342 | Velocity Financial Inc.* | 4,402 | ||||||||
| 1,201 | Walker & Dunlop Inc. | 133,371 | ||||||||
| 2,970 | Washington Federal Inc. | 98,901 | ||||||||
| 896 | Waterstone Financial Inc. | 18,171 | ||||||||
| 10,132 | WSFS Financial Corp. | 460,094 | ||||||||
|
| |||||||||
| Total Thrifts & Mortgage Finance | 2,832,360 | |||||||||
|
| |||||||||
| TOTAL FINANCIALS | 85,541,461 | |||||||||
|
| |||||||||
See Notes to Financial Statements.
76
| Schedules of Investments |
| (continued) |
| Small-Mid Cap Equity Fund | ||||||||||
| Shares/Units | Security | Value | ||||||||
HEALTH CARE — 17.4% | ||||||||||
Biotechnology — 4.2% | ||||||||||
| 365 | 4D Molecular Therapeutics Inc.* | $ | 11,151 | |||||||
| 438 | 89bio Inc.* | 8,107 | ||||||||
| 4,929 | ACADIA Pharmaceuticals Inc.* | 86,307 | ||||||||
| 13,930 | Acceleron Pharma Inc.* | 1,864,948 | ||||||||
| 825 | Adicet Bio Inc.* | 6,889 | ||||||||
| 870 | Aduro Biotech*(b)(c) | 2,610 | ||||||||
| 3,265 | Adverum Biotechnologies Inc.* | 7,934 | ||||||||
| 1,772 | Aeglea BioTherapeutics Inc.* | 12,847 | ||||||||
| 4,791 | Affimed NV* | 33,729 | ||||||||
| 8,092 | Agenus Inc.* | 49,928 | ||||||||
| 2,540 | Agios Pharmaceuticals Inc.* | 113,487 | ||||||||
| 6,518 | Akebia Therapeutics Inc.* | 19,163 | ||||||||
| 1,055 | Akero Therapeutics Inc.* | 25,046 | ||||||||
| 989 | Akouos Inc.* | 11,759 | ||||||||
| 720 | Albireo Pharma Inc.* | 21,996 | ||||||||
| 1,990 | Aldeyra Therapeutics Inc.* | 18,885 | ||||||||
| 2,369 | Alector Inc.* | 64,034 | ||||||||
| 769 | Aligos Therapeutics Inc.* | 13,111 | ||||||||
| 6,803 | Alkermes PLC*(a) | 212,662 | ||||||||
| 1,500 | Allakos Inc.* | 133,740 | ||||||||
| 2,797 | Allogene Therapeutics Inc.* | 66,708 | ||||||||
| 1,255 | Allovir Inc.* | 24,159 | ||||||||
| 460 | Alpine Immune Sciences Inc.* | 4,375 | ||||||||
| 1,330 | Altimmune Inc.* | 19,937 | ||||||||
| 741 | ALX Oncology Holdings Inc.* | 51,870 | ||||||||
| 10,896 | Amicus Therapeutics Inc.* | 124,105 | ||||||||
| 800 | AnaptysBio Inc.* | 20,488 | ||||||||
| 2,562 | Anavex Life Sciences Corp.*(a) | 49,933 | ||||||||
| 599 | Anika Therapeutics Inc.* | 25,835 | ||||||||
| 1,278 | Annexon Inc.* | 20,895 | ||||||||
| 2,752 | Apellis Pharmaceuticals Inc.* | 181,219 | ||||||||
| 1,013 | Applied Molecular Transport Inc.* | 30,461 | ||||||||
| 730 | Applied Therapeutics Inc.* | 11,468 | ||||||||
| 2,125 | AquaBounty Technologies Inc.* | 9,839 | ||||||||
| 3,139 | Arbutus Biopharma Corp.* | 10,767 | ||||||||
| 854 | Arcturus Therapeutics Holdings Inc.* | 46,808 | ||||||||
| 1,909 | Arcus Biosciences Inc.*(a) | 55,686 | ||||||||
| 1,135 | Arcutis Biotherapeutics Inc.* | 24,028 | ||||||||
| 3,557 | Ardelyx Inc.* | 5,015 | ||||||||
| 2,517 | Arena Pharmaceuticals Inc.* | 133,200 | ||||||||
| 4,254 | Arrowhead Pharmaceuticals Inc.* | 285,528 | ||||||||
| 8,640 | Ascendis Pharma, ADR* | 1,354,147 | ||||||||
| 3,396 | Atara Biotherapeutics Inc.* | 50,872 | ||||||||
| 3,372 | Athenex Inc.* | 12,308 | ||||||||
| 8,338 | Athersys Inc.*(a) | 14,008 | ||||||||
| 4,796 | Atossa Therapeutics Inc.*(a) | 18,225 | ||||||||
| 1,027 | Atreca Inc., Class A Shares* | 6,028 | ||||||||
| 2,649 | Avid Bioservices Inc.* | 64,212 | ||||||||
| 1,298 | Avidity Biosciences Inc.* | 29,646 | ||||||||
| 975 | Avita Medical Inc.* | 19,705 | ||||||||
| 1,397 | Avrobio Inc.* | 9,304 | ||||||||
| 1,937 | Beam Therapeutics Inc.*(a) | 214,852 | ||||||||
| 995 | Beyondspring Inc.*(a) | 31,153 | ||||||||
| 451 | BioAtla Inc.* | 18,532 | ||||||||
See Notes to Financial Statements.
77
| Schedules of Investments |
| (continued) |
| Small-Mid Cap Equity Fund | ||||||||||
| Shares/Units | Security | Value | ||||||||
HEALTH CARE — 17.4% — (continued) | ||||||||||
Biotechnology — 4.2% — (continued) | ||||||||||
| 7,334 | BioCryst Pharmaceuticals Inc.* | $ | 116,757 | |||||||
| 2,226 | Biohaven Pharmaceutical Holding Co., Ltd.* | 292,140 | ||||||||
| 336 | Biomea Fusion Inc.*(a) | 4,687 | ||||||||
| 654 | Bioxcel Therapeutics Inc.* | 19,260 | ||||||||
| 922 | Black Diamond Therapeutics Inc.* | 9,312 | ||||||||
| 2,811 | Bluebird Bio Inc.* | 51,441 | ||||||||
| 16,757 | Blueprint Medicines Corp.*(a) | 1,562,925 | ||||||||
| 427 | Bolt Biotherapeutics Inc.* | 7,584 | ||||||||
| 17,849 | Bridgebio Pharma Inc.* | 894,413 | ||||||||
| 971 | Brooklyn ImmunoTherapeutics Inc.* | 11,720 | ||||||||
| 1,415 | C4 Therapeutics Inc.*(a) | 56,784 | ||||||||
| 1,472 | Cardiff Oncology Inc.* | 10,790 | ||||||||
| 2,071 | CareDx Inc.* | 151,763 | ||||||||
| 4,160 | Catalyst Pharmaceuticals Inc.* | 22,922 | ||||||||
| 320 | Celcuity Inc.* | 7,040 | ||||||||
| 1,612 | Celldex Therapeutics Inc.* | 84,872 | ||||||||
| 1,447 | CEL-SCI Corp.* | 16,756 | ||||||||
| 1,631 | Cerevel Therapeutics Holdings Inc.* | 51,637 | ||||||||
| 2,504 | ChemoCentryx Inc.* | 39,588 | ||||||||
| 3,006 | Chimerix Inc.* | 21,343 | ||||||||
| 1,280 | Chinook Therapeutics Inc.* | 17,357 | ||||||||
| 900 | Clene Inc.* | 7,200 | ||||||||
| 4,071 | Clovis Oncology Inc.* | 19,622 | ||||||||
| 637 | Codiak Biosciences Inc.* | 10,956 | ||||||||
| 1,507 | Cogent Biosciences Inc.* | 12,478 | ||||||||
| 44,520 | Coherus Biosciences Inc.*(a) | 711,430 | ||||||||
| 820 | Cortexyme Inc.*(a) | 78,966 | ||||||||
| 1,490 | Crinetics Pharmaceuticals Inc.* | 35,119 | ||||||||
| 1,143 | Cue Biopharma Inc.* | 13,705 | ||||||||
| 595 | Cullinan Oncology Inc.* | 16,791 | ||||||||
| 3,554 | Curis Inc.* | 31,453 | ||||||||
| 3,216 | Cytokinetics Inc.*(a) | 106,032 | ||||||||
| 2,753 | CytomX Therapeutics Inc.* | 14,095 | ||||||||
| 1,625 | Deciphera Pharmaceuticals Inc.* | 51,187 | ||||||||
| 3,824 | Denali Therapeutics Inc.* | 203,437 | ||||||||
| 975 | DermTech Inc.* | 36,270 | ||||||||
| 543 | Design Therapeutics Inc.* | 8,536 | ||||||||
| 2,870 | Dicerna Pharmaceuticals Inc.* | 59,065 | ||||||||
| 4,551 | Dynavax Technologies Corp.*(a) | 88,562 | ||||||||
| 1,231 | Dyne Therapeutics Inc.* | 20,841 | ||||||||
| 545 | Eagle Pharmaceuticals Inc.* | 29,087 | ||||||||
| 2,826 | Editas Medicine Inc., Class A Shares*(a) | 179,705 | ||||||||
| 1,397 | Eiger BioPharmaceuticals Inc.* | 11,372 | ||||||||
| 10,844 | Emergent BioSolutions Inc.* | 684,040 | ||||||||
| 817 | Enanta Pharmaceuticals Inc.* | 46,732 | ||||||||
| 3,809 | Epizyme Inc.* | 19,654 | ||||||||
| 1,296 | Evelo Biosciences Inc.* | 14,736 | ||||||||
| 13,138 | Exelixis Inc.* | 251,855 | ||||||||
| 12,105 | Fate Therapeutics Inc.* | 886,691 | ||||||||
| 3,498 | FibroGen Inc.* | 40,682 | ||||||||
| 290 | Finch Therapeutics Group Inc.* | 4,103 | ||||||||
| 1,872 | Flexion Therapeutics Inc.* | 11,195 | ||||||||
| 784 | Foghorn Therapeutics Inc.* | 10,176 | ||||||||
| 1,285 | Forma Therapeutics Holdings Inc.* | 30,879 | ||||||||
See Notes to Financial Statements.
78
| Schedules of Investments |
| (continued) |
| Small-Mid Cap Equity Fund | ||||||||||
| Shares/Units | Security | Value | ||||||||
HEALTH CARE — 17.4% — (continued) | ||||||||||
Biotechnology — 4.2% — (continued) | ||||||||||
| 457 | Forte Biosciences Inc.* | $ | 13,445 | |||||||
| 3,102 | Fortress Biotech Inc.* | 10,206 | ||||||||
| 1,265 | Frequency Therapeutics Inc.* | 9,766 | ||||||||
| 1,609 | G1 Therapeutics Inc.* | 24,328 | ||||||||
| 875 | Gemini Therapeutics Inc., Class A Shares* | 4,305 | ||||||||
| 1,819 | Generation Bio Co.* | 45,475 | ||||||||
| 11,885 | Geron Corp.* | 17,233 | ||||||||
| 2,445 | Global Blood Therapeutics Inc.* | 70,147 | ||||||||
| 2,509 | Gossamer Bio Inc.* | 24,939 | ||||||||
| 162 | Greenwich Lifesciences Inc.* | 6,483 | ||||||||
| 1,646 | Gritstone bio Inc.* | 15,143 | ||||||||
| 972 | GT Biopharma Inc.* | 8,641 | ||||||||
| 5,802 | Halozyme Therapeutics Inc.* | 243,626 | ||||||||
| 764 | Harpoon Therapeutics Inc.* | 7,243 | ||||||||
| 3,843 | Heron Therapeutics Inc.* | 44,848 | ||||||||
| 1,849 | Homology Medicines Inc.* | 13,294 | ||||||||
| 627 | Hookipa Pharma Inc.* | 4,320 | ||||||||
| 1,841 | Humanigen Inc.* | 30,524 | ||||||||
| 9,151 | iBio Inc.*(a) | 11,622 | ||||||||
| 1,149 | Ideaya Biosciences Inc.* | 27,001 | ||||||||
| 376 | IGM Biosciences Inc.* | 26,775 | ||||||||
| 621 | Immunic Inc.* | 6,117 | ||||||||
| 2,754 | ImmunityBio Inc.* | 31,341 | ||||||||
| 8,260 | ImmunoGen Inc.* | 49,973 | ||||||||
| 1,922 | Immunovant Inc.* | 16,645 | ||||||||
| 339 | Impel Neuropharma Inc.* | 6,438 | ||||||||
| 3,573 | Infinity Pharmaceuticals Inc.* | 12,648 | ||||||||
| 1,138 | Inhibrx Inc.* | 32,456 | ||||||||
| 8,498 | Inovio Pharmaceuticals Inc.*(a) | 73,423 | ||||||||
| 606 | Inozyme Pharma Inc.* | 9,345 | ||||||||
| 4,282 | Insmed Inc.* | 120,067 | ||||||||
| 708 | Instil Bio Inc.* | 13,346 | ||||||||
| 2,824 | Intellia Therapeutics Inc.* | 453,337 | ||||||||
| 1,096 | Intercept Pharmaceuticals Inc.* | 16,341 | ||||||||
| 45,377 | Invitae Corp.*(a) | 1,344,521 | ||||||||
| 5,937 | Ionis Pharmaceuticals Inc.* | 236,055 | ||||||||
| 6,020 | Iovance Biotherapeutics Inc.* | 144,901 | ||||||||
| 99,413 | Ironwood Pharmaceuticals Inc., Class A Shares* | 1,302,310 | ||||||||
| 842 | iTeos Therapeutics Inc.* | 23,871 | ||||||||
| 3,427 | IVERIC bio Inc.* | 36,223 | ||||||||
| 1,329 | Jounce Therapeutics Inc.* | 8,266 | ||||||||
| 6,965 | Kadmon Holdings Inc.* | 38,168 | ||||||||
| 871 | KalVista Pharmaceuticals Inc.* | 17,803 | ||||||||
| 913 | Karuna Therapeutics Inc.* | 108,556 | ||||||||
| 3,010 | Karyopharm Therapeutics Inc.* | 17,458 | ||||||||
| 641 | Keros Therapeutics Inc.* | 21,563 | ||||||||
| 1,305 | Kezar Life Sciences Inc.* | 9,944 | ||||||||
| 1,280 | Kiniksa Pharmaceuticals Ltd., Class A Shares* | 16,102 | ||||||||
| 528 | Kinnate Biopharma Inc.* | 11,679 | ||||||||
| 1,393 | Kodiak Sciences Inc.* | 131,193 | ||||||||
| 1,591 | Kronos Bio Inc.* | 33,268 | ||||||||
| 735 | Krystal Biotech Inc.* | 42,586 | ||||||||
| 2,621 | Kura Oncology Inc.* | 48,384 | ||||||||
| 1,188 | Kymera Therapeutics Inc.* | 73,822 | ||||||||
See Notes to Financial Statements.
79
| Schedules of Investments |
| (continued) |
| Small-Mid Cap Equity Fund | ||||||||||
| Shares/Units | Security | Value | ||||||||
HEALTH CARE — 17.4% — (continued) | ||||||||||
Biotechnology — 4.2% — (continued) | ||||||||||
| 2,519 | Lexicon Pharmaceuticals Inc.* | $ | 11,890 | |||||||
| 651 | Ligand Pharmaceuticals Inc.* | 86,127 | ||||||||
| 4,915 | Lineage Cell Therapeutics Inc.* | 12,386 | ||||||||
| 2,578 | MacroGenics Inc.* | 60,867 | ||||||||
| 467 | Madrigal Pharmaceuticals Inc.* | 38,644 | ||||||||
| 1,217 | Magenta Therapeutics Inc.* | 7,789 | ||||||||
| 10,292 | MannKind Corp.*(a) | 49,402 | ||||||||
| 4,472 | MEI Pharma Inc.* | 12,522 | ||||||||
| 1,279 | MeiraGTx Holdings PLC* | 16,000 | ||||||||
| 2,828 | Mersana Therapeutics Inc.* | 39,394 | ||||||||
| 4,556 | MiMedx Group Inc.*(a) | 67,247 | ||||||||
| 1,662 | Mirati Therapeutics Inc.* | 282,091 | ||||||||
| 194 | Mirum Pharmaceuticals Inc.* | 3,152 | ||||||||
| 1,501 | Molecular Templates Inc.* | 9,787 | ||||||||
| 854 | Morphic Holding Inc.* | 53,811 | ||||||||
| 2,796 | Mustang Bio Inc.* | 8,500 | ||||||||
| 3,152 | Myriad Genetics Inc.* | 112,779 | ||||||||
| 3,248 | Natera Inc.* | 384,661 | ||||||||
| 1,619 | Neoleukin Therapeutics Inc.* | 13,195 | ||||||||
| 3,877 | Neurocrine Biosciences Inc.* | 369,090 | ||||||||
| 312 | NexImmune Inc.* | 4,393 | ||||||||
| 14,414 | Nkarta Inc.*(a) | 466,149 | ||||||||
| 5,338 | Novavax Inc.*(a) | 1,273,327 | ||||||||
| 1,287 | Nurix Therapeutics Inc.* | 41,429 | ||||||||
| 7,597 | Ocugen Inc.*(a) | 57,661 | ||||||||
| 477 | Olema Pharmaceuticals Inc.* | 14,272 | ||||||||
| 3,030 | Oncocyte Corp.* | 12,423 | ||||||||
| 829 | Oncorus Inc.* | 8,564 | ||||||||
| 1,804 | Oncternal Therapeutics Inc.*(c) | 8,087 | ||||||||
| 16,163 | OPKO Health Inc.*(a) | 62,389 | ||||||||
| 1,569 | Organogenesis Holdings Inc., Class A Shares* | 26,767 | ||||||||
| 1,203 | ORIC Pharmaceuticals Inc.* | 26,574 | ||||||||
| 3,559 | Outlook Therapeutics Inc.* | 9,823 | ||||||||
| 452 | Oyster Point Pharma Inc.* | 5,957 | ||||||||
| 1,516 | Passage Bio Inc.* | 18,222 | ||||||||
| 1,076 | PMV Pharmaceuticals Inc.* | 32,657 | ||||||||
| 144 | Portage Biotech Inc.* | 2,925 | ||||||||
| 1,232 | Poseida Therapeutics Inc.* | 10,644 | ||||||||
| 998 | Praxis Precision Medicines Inc.* | 19,830 | ||||||||
| 3,881 | Precigen Inc.* | 23,480 | ||||||||
| 1,991 | Precision BioSciences Inc.* | 25,027 | ||||||||
| 477 | Prelude Therapeutics Inc.* | 17,024 | ||||||||
| 456 | Prometheus Biosciences Inc.* | 9,950 | ||||||||
| 1,703 | Protagonist Therapeutics Inc.* | 82,595 | ||||||||
| 1,406 | Prothena Corp. PLC* | 94,371 | ||||||||
| 2,853 | PTC Therapeutics Inc.* | 124,533 | ||||||||
| 1,278 | Puma Biotechnology Inc.* | 9,674 | ||||||||
| 1,936 | Radius Health Inc.* | 26,833 | ||||||||
| 737 | RAPT Therapeutics Inc.* | 24,100 | ||||||||
| 866 | Recursion Pharmaceuticals Inc., Class A Shares*(a) | 21,841 | ||||||||
| 1,637 | REGENXBIO Inc.* | 52,875 | ||||||||
| 2,407 | Relay Therapeutics Inc.*(a) | 77,096 | ||||||||
| 303 | Reneo Pharmaceuticals Inc.* | 3,354 | ||||||||
| 1,103 | Replimune Group Inc.* | 35,031 | ||||||||
See Notes to Financial Statements.
80
| Schedules of Investments |
| (continued) |
| Small-Mid Cap Equity Fund | ||||||||||
| Shares/Units | Security | Value | ||||||||
HEALTH CARE — 17.4% — (continued) | ||||||||||
Biotechnology — 4.2% — (continued) | ||||||||||
| 2,444 | REVOLUTION Medicines Inc.* | $ | 71,096 | |||||||
| 1,808 | Rhythm Pharmaceuticals Inc.* | 23,522 | ||||||||
| 7,258 | Rigel Pharmaceuticals Inc.* | 27,580 | ||||||||
| 21,761 | Rocket Pharmaceuticals Inc.* | 744,444 | ||||||||
| 1,858 | Rubius Therapeutics Inc.* | 40,356 | ||||||||
| 2,236 | Sage Therapeutics Inc.* | 103,326 | ||||||||
| 1,085 | Sana Biotechnology Inc.* | 26,029 | ||||||||
| 4,881 | Sangamo Therapeutics Inc.* | 48,371 | ||||||||
| 3,238 | Sarepta Therapeutics Inc.* | 252,953 | ||||||||
| 1,178 | Scholar Rock Holding Corp.* | 46,566 | ||||||||
| 3,649 | Selecta Biosciences Inc.* | 15,837 | ||||||||
| 424 | Sensei Biotherapeutics Inc.* | 4,571 | ||||||||
| 2,866 | Seres Therapeutics Inc.* | 18,371 | ||||||||
| 7,036 | Sesen Bio Inc.* | 6,669 | ||||||||
| 1,091 | Shattuck Labs Inc.* | 23,053 | ||||||||
| 312 | Sigilon Therapeutics Inc.* | 1,853 | ||||||||
| 529 | Silverback Therapeutics Inc.*(a) | 11,638 | ||||||||
| 2,460 | Solid Biosciences Inc.* | 6,667 | ||||||||
| 11,219 | Sorrento Therapeutics Inc.*(a) | 100,971 | ||||||||
| 6,187 | Spectrum Pharmaceuticals Inc.* | 14,539 | ||||||||
| 983 | Spero Therapeutics Inc.* | 18,923 | ||||||||
| 1,203 | SpringWorks Therapeutics Inc.* | 90,345 | ||||||||
| 396 | Spruce Biosciences Inc.* | 3,037 | ||||||||
| 931 | SQZ Biotechnologies Co.* | 12,382 | ||||||||
| 784 | Stoke Therapeutics Inc.* | 20,525 | ||||||||
| 888 | Summit Therapeutics Inc.* | 7,077 | ||||||||
| 1,332 | Surface Oncology Inc.* | 8,432 | ||||||||
| 1,782 | Sutro Biopharma Inc.* | 38,705 | ||||||||
| 1,847 | Syndax Pharmaceuticals Inc.* | 32,304 | ||||||||
| 2,249 | Syros Pharmaceuticals Inc.* | 11,920 | ||||||||
| 350 | Talaris Therapeutics Inc.* | 4,064 | ||||||||
| 910 | Taysha Gene Therapies Inc.* | 18,091 | ||||||||
| 1,204 | TCR2 Therapeutics Inc.* | 20,191 | ||||||||
| 5,414 | TG Therapeutics Inc.* | 146,557 | ||||||||
| 13,159 | Tonix Pharmaceuticals Holding Corp.* | 9,289 | ||||||||
| 2,826 | Translate Bio Inc.*(a) | 105,692 | ||||||||
| 2,312 | Travere Therapeutics Inc., * | 50,471 | ||||||||
| 6,599 | Trevena Inc.* | 8,711 | ||||||||
| 4,002 | Trillium Therapeutics Inc.* | 68,954 | ||||||||
| 21,613 | Turning Point Therapeutics Inc.* | 1,664,633 | ||||||||
| 1,990 | Twist Bioscience Corp.*(a) | 225,288 | ||||||||
| 2,722 | Ultragenyx Pharmaceutical Inc.* | 262,101 | ||||||||
| 1,858 | United Therapeutics Corp.* | 399,247 | ||||||||
| 820 | UroGen Pharma Ltd.*(a) | 14,448 | ||||||||
| 2,288 | Vanda Pharmaceuticals Inc.* | 38,301 | ||||||||
| 4,918 | Vaxart Inc.*(a) | 44,016 | ||||||||
| 1,625 | Vaxcyte Inc.* | 42,624 | ||||||||
| 7,731 | VBI Vaccines Inc.* | 27,909 | ||||||||
| 2,805 | Veracyte Inc.* | 134,949 | ||||||||
| 7,310 | Verastem Inc.* | 19,371 | ||||||||
| 1,927 | Vericel Corp.*(a) | 104,386 | ||||||||
| 2,765 | Viking Therapeutics Inc.* | 18,277 | ||||||||
| 223 | Vincerx Pharma Inc.* | 3,497 | ||||||||
| 2,477 | Vir Biotechnology Inc.* | 127,665 | ||||||||
See Notes to Financial Statements.
81
| Schedules of Investments |
| (continued) |
| Small-Mid Cap Equity Fund | ||||||||||
| Shares/Units | Security | Value | ||||||||
HEALTH CARE — 17.4% — (continued) | ||||||||||
Biotechnology — 4.2% — (continued) | ||||||||||
| 1,466 | Viracta Therapeutics Inc.* | $ | 13,517 | |||||||
| 7,834 | VistaGen Therapeutics Inc.* | 23,815 | ||||||||
| 545 | Vor BioPharma Inc.* | 8,006 | ||||||||
| 293 | Werewolf Therapeutics Inc.* | 5,215 | ||||||||
| 528 | XBiotech Inc. | 8,432 | ||||||||
| 2,323 | Xencor Inc.* | 78,680 | ||||||||
| 235 | XOMA Corp.* | 7,313 | ||||||||
| 1,434 | Y-mAbs Therapeutics Inc.* | 44,139 | ||||||||
| 1,369 | Zentalis Pharmaceuticals Inc.* | 93,352 | ||||||||
| 9,102 | ZIOPHARM Oncology Inc.*(a) | 14,836 | ||||||||
|
| |||||||||
| Total Biotechnology | 28,186,216 | |||||||||
|
| |||||||||
Health Care Equipment & Supplies — 5.3% | ||||||||||
| 1,322 | Accelerate Diagnostics Inc.* | 8,262 | ||||||||
| 113,235 | Accuray Inc.* | 460,866 | ||||||||
| 687 | Acutus Medical Inc.* | 8,787 | ||||||||
| 2,838 | Alphatec Holdings Inc.* | 41,094 | ||||||||
| 1,579 | AngioDynamics Inc.* | 44,686 | ||||||||
| 1,433 | Apyx Medical Corp.* | 16,924 | ||||||||
| 9,551 | Asensus Surgical Inc.* | 21,012 | ||||||||
| 3,198 | Aspira Women’s Health Inc.* | 12,184 | ||||||||
| 12,106 | AtriCure Inc.* | 891,244 | ||||||||
| 63 | Atrion Corp. | 43,726 | ||||||||
| 17,420 | Avanos Medical Inc.*(a) | 574,860 | ||||||||
| 1,595 | AxoGen Inc.* | 27,211 | ||||||||
| 1,712 | Axonics Inc.*(a) | 128,366 | ||||||||
| 48,464 | Baxter International Inc. | 3,693,926 | ||||||||
| 1,002 | BioLife Solutions Inc.* | 58,477 | ||||||||
| 15,169 | Bioventus Inc., Class A Shares* | 220,102 | ||||||||
| 1,331 | Butterfly Network Inc.*(a) | 16,451 | ||||||||
| 8,391 | Cardiovascular Systems Inc.* | 300,314 | ||||||||
| 7,046 | Cerus Corp.* | 45,447 | ||||||||
| 766 | ClearPoint Neuro Inc.* | 14,454 | ||||||||
| 1,195 | CONMED Corp. | 156,951 | ||||||||
| 1,619 | CryoLife Inc.* | 42,483 | ||||||||
| 1,739 | CryoPort Inc.*(a) | 110,548 | ||||||||
| 740 | Cutera Inc.* | 36,808 | ||||||||
| 28,290 | CytoSorbents Corp.* | 270,735 | ||||||||
| 543 | DarioHealth Corp.* | 7,325 | ||||||||
| 20,451 | DENTSPLY SIRONA Inc. | 1,261,827 | ||||||||
| 792 | Eargo Inc.* | 15,848 | ||||||||
| 6,681 | Envista Holdings Corp.* | 285,880 | ||||||||
| 1,851 | Glaukos Corp.* | 110,375 | ||||||||
| 3,211 | Globus Medical Inc., Class A Shares* | 262,018 | ||||||||
| 39,944 | Haemonetics Corp.* | 2,506,486 | ||||||||
| 393 | Heska Corp.* | 104,263 | ||||||||
| 2,757 | Hill-Rom Holdings Inc. | 401,364 | ||||||||
| 15,756 | ICU Medical Inc.* | 3,140,959 | ||||||||
| 1,229 | IDEXX Laboratories Inc.* | 828,051 | ||||||||
| 1,452 | Inari Medical Inc.* | 118,861 | ||||||||
| 823 | Inogen Inc.* | 48,713 | ||||||||
| 1,352 | Integer Holdings Corp.* | 133,564 | ||||||||
| 3,075 | Integra LifeSciences Holdings Corp.*(a) | 231,332 | ||||||||
| 27,417 | Intersect ENT Inc.* | 746,017 | ||||||||
| 1,242 | Intuitive Surgical Inc.* | 1,308,521 | ||||||||
See Notes to Financial Statements.
82
| Schedules of Investments |
| (continued) |
| Small-Mid Cap Equity Fund | ||||||||||
| Shares/Units | Security | Value | ||||||||
HEALTH CARE — 17.4% — (continued) | ||||||||||
Health Care Equipment & Supplies — 5.3% — (continued) | ||||||||||
| 1,367 | Invacare Corp.* | $ | 11,565 | |||||||
| 290 | iRadimed Corp.* | 9,790 | ||||||||
| 1,223 | iRhythm Technologies Inc.* | 58,459 | ||||||||
| 2,822 | Lantheus Holdings Inc.* | 74,416 | ||||||||
| 764 | LeMaitre Vascular Inc. | 43,258 | ||||||||
| 2,087 | LivaNova PLC* | 172,574 | ||||||||
| 6,082 | Masimo Corp.* | 1,651,506 | ||||||||
| 1,801 | Meridian Bioscience Inc.* | 36,452 | ||||||||
| 27,806 | Merit Medical Systems Inc.* | 1,995,637 | ||||||||
| 197 | Mesa Laboratories Inc. | 52,583 | ||||||||
| 532 | Misonix Inc.* | 13,513 | ||||||||
| 1,445 | Natus Medical Inc.* | 38,321 | ||||||||
| 4,470 | Neogen Corp.* | 195,697 | ||||||||
| 1,019 | Neuronetics Inc.* | 6,848 | ||||||||
| 271 | NeuroPace Inc.* | 5,756 | ||||||||
| 1,423 | Nevro Corp.* | 173,606 | ||||||||
| 2,208 | NuVasive Inc.*(a) | 137,205 | ||||||||
| 43,000 | OraSure Technologies Inc.*(a) | 470,850 | ||||||||
| 3,627 | Ortho Clinical Diagnostics Holdings PLC* | 74,136 | ||||||||
| 808 | Orthofix Medical Inc.* | 34,259 | ||||||||
| 561 | OrthoPediatrics Corp.* | 39,326 | ||||||||
| 1,876 | Outset Medical Inc.* | 92,468 | ||||||||
| 2,936 | PAVmed Inc.* | 21,433 | ||||||||
| 1,404 | Penumbra Inc.*(a) | 386,030 | ||||||||
| 1,041 | Pulmonx Corp.* | 41,838 | ||||||||
| 553 | Pulse Biosciences Inc.* | 14,323 | ||||||||
| 4,060 | Quidel Corp.*(a) | 523,537 | ||||||||
| 3,288 | Quotient Ltd.* | 10,094 | ||||||||
| 776 | Retractable Technologies Inc.*(a) | 9,995 | ||||||||
| 1,300 | SeaSpine Holdings Corp.* | 21,814 | ||||||||
| 17,061 | Senseonics Holdings Inc.*(a) | 68,415 | ||||||||
| 1,391 | Shockwave Medical Inc.* | 297,966 | ||||||||
| 1,320 | SI-BONE Inc.* | 32,221 | ||||||||
| 2,343 | Sientra Inc.* | 14,245 | ||||||||
| 1,390 | Silk Road Medical Inc.*(a) | 82,399 | ||||||||
| 92,355 | Smith & Nephew PLC, ADR(a) | 3,540,891 | ||||||||
| 364 | Soliton Inc.* | 7,655 | ||||||||
| 1,942 | STAAR Surgical Co.* | 299,981 | ||||||||
| 2,068 | Stereotaxis Inc.* | 14,600 | ||||||||
| 583 | Surmodics Inc.* | 35,021 | ||||||||
| 783 | Tactile Systems Technology Inc.* | 34,828 | ||||||||
| 529 | Talis Biomedical Corp.* | 4,264 | ||||||||
| 13,764 | Tandem Diabetes Care Inc.* | 1,543,908 | ||||||||
| 6,161 | Teleflex Inc. | 2,436,429 | ||||||||
| 1,065 | TransMedics Group Inc.* | 34,804 | ||||||||
| 435 | Treace Medical Concepts Inc.* | 10,984 | ||||||||
| 154 | Utah Medical Products Inc. | 13,644 | ||||||||
| 933 | Vapotherm Inc.* | 25,797 | ||||||||
| 20,197 | Varex Imaging Corp.* | 589,146 | ||||||||
| 5,597 | ViewRay Inc.* | 33,806 | ||||||||
| 11,973 | Zimmer Biomet Holdings Inc. | 1,801,338 | ||||||||
| 737 | Zynex Inc.*(a) | 9,883 | ||||||||
|
| |||||||||
| Total Health Care Equipment & Supplies | 36,106,836 | |||||||||
|
| |||||||||
See Notes to Financial Statements.
83
| Schedules of Investments |
| (continued) |
| Small-Mid Cap Equity Fund | ||||||||||
| Shares/Units | Security | Value | ||||||||
HEALTH CARE — 17.4% — (continued) | ||||||||||
Health Care Providers & Services — 2.9% | ||||||||||
| 4,977 | 1Life Healthcare Inc.* | $ | 121,986 | |||||||
| 51,587 | Acadia Healthcare Co., Inc.* | 3,410,932 | ||||||||
| 2,069 | Accolade Inc.* | 98,029 | ||||||||
| 3,281 | AdaptHealth Corp., Class A Shares* | 78,875 | ||||||||
| 631 | Addus HomeCare Corp.* | 56,740 | ||||||||
| 892 | Agiliti Inc.* | 19,026 | ||||||||
| 2,052 | agilon health Inc.*(a) | 71,820 | ||||||||
| 1,051 | Alignment Healthcare Inc.* | 18,571 | ||||||||
| 7,750 | Amedisys Inc.* | 1,421,738 | ||||||||
| 1,994 | AMN Healthcare Services Inc.* | 226,359 | ||||||||
| 1,491 | Apollo Medical Holdings Inc.*(a) | 113,182 | ||||||||
| 287 | Apria Inc.* | 10,237 | ||||||||
| 1,522 | Aveanna Healthcare Holdings Inc.* | 14,368 | ||||||||
| 480 | Biodesix Inc.* | 4,330 | ||||||||
| 7,524 | Brookdale Senior Living Inc.* | 54,925 | ||||||||
| 875 | Castle Biosciences Inc.* | 67,139 | ||||||||
| 3,076 | Chemed Corp. | 1,466,329 | ||||||||
| 5,114 | Community Health Systems Inc.* | 62,953 | ||||||||
| 364 | CorVel Corp.* | 59,991 | ||||||||
| 4,278 | Covetrus Inc.*(a) | 96,640 | ||||||||
| 1,464 | Cross Country Healthcare Inc.* | 31,842 | ||||||||
| 13,461 | Encompass Health Corp. | 1,056,015 | ||||||||
| 2,217 | Ensign Group Inc. (The) | 181,062 | ||||||||
| 487 | Exagen Inc.* | 6,867 | ||||||||
| 892 | Fulgent Genetics Inc.*(a) | 81,386 | ||||||||
| 3,766 | Guardant Health Inc.* | 479,299 | ||||||||
| 1,597 | Hanger Inc.* | 38,136 | ||||||||
| 14,319 | HealthEquity Inc.* | 918,850 | ||||||||
| 5,905 | Henry Schein Inc.* | 446,359 | ||||||||
| 783 | InfuSystem Holdings Inc.* | 11,158 | ||||||||
| 722 | Innovage Holding Corp.* | 10,852 | ||||||||
| 567 | Joint Corp. (The)* | 57,930 | ||||||||
| 1,283 | LHC Group Inc.* | 239,613 | ||||||||
| 974 | Magellan Health Inc.* | 92,160 | ||||||||
| 26,874 | MEDNAX Inc.* | 862,924 | ||||||||
| 516 | ModivCare Inc.* | 101,786 | ||||||||
| 6,952 | Molina Healthcare Inc.* | 1,868,489 | ||||||||
| 497 | National HealthCare Corp. | 36,703 | ||||||||
| 603 | National Research Corp. | 32,562 | ||||||||
| 379 | Ontrak Inc.*(a) | 4,594 | ||||||||
| 66,701 | Option Care Health Inc.* | 1,784,252 | ||||||||
| 2,990 | Owens & Minor Inc.(a) | 111,467 | ||||||||
| 19,450 | Patterson Cos., Inc.(a) | 595,948 | ||||||||
| 1,085 | Pennant Group Inc. (The)* | 33,168 | ||||||||
| 16,683 | PetIQ Inc., Class A Shares*(a) | 432,924 | ||||||||
| 5,031 | Premier Inc., Class A Shares | 187,053 | ||||||||
| 791 | Privia Health Group Inc.* | 23,580 | ||||||||
| 2,687 | Progyny Inc.* | 150,123 | ||||||||
| 5,649 | R1 RCM Inc.* | 111,398 | ||||||||
| 1,863 | RadNet Inc.*(a) | 58,517 | ||||||||
| 4,543 | Select Medical Holdings Corp. | 157,052 | ||||||||
| 501 | Sharps Compliance Corp.* | 4,504 | ||||||||
| 999 | Signify Health Inc., Class A Shares* | 25,964 | ||||||||
| 1,615 | SOC Telemed Inc., Class A Shares* | 4,377 | ||||||||
See Notes to Financial Statements.
84
| Schedules of Investments |
| (continued) |
| Small-Mid Cap Equity Fund | ||||||||||
| Shares/Units | Security | Value | ||||||||
HEALTH CARE — 17.4% — (continued) | ||||||||||
Health Care Providers & Services — 2.9% — (continued) | ||||||||||
| 1,304 | Surgery Partners Inc.* | $ | 64,157 | |||||||
| 4,375 | Tenet Healthcare Corp.* | 329,656 | ||||||||
| 1,849 | Tivity Health Inc.* | 42,989 | ||||||||
| 937 | Triple-S Management Corp., Class B Shares* | 33,264 | ||||||||
| 9,000 | Universal Health Services Inc., Class B Shares | 1,401,840 | ||||||||
| 525 | US Physical Therapy Inc. | 61,635 | ||||||||
| 1,562 | Viemed Healthcare Inc.* | 10,012 | ||||||||
|
| |||||||||
| Total Health Care Providers & Services | 19,656,637 | |||||||||
|
| |||||||||
Health Care Technology — 0.5% | ||||||||||
| 5,785 | Allscripts Healthcare Solutions Inc.*(a) | 88,858 | ||||||||
| 7,998 | American Well Corp., Class A Shares*(a) | 85,659 | ||||||||
| 4,753 | Castlight Health Inc., Class B Shares* | 8,603 | ||||||||
| 1,402 | Certara Inc.* | 47,065 | ||||||||
| 10,218 | Change Healthcare Inc.* | 223,059 | ||||||||
| 536 | Computer Programs & Systems Inc.* | 19,065 | ||||||||
| 3,215 | Evolent Health Inc., Class A Shares* | 78,960 | ||||||||
| 728 | Forian Inc.* | 8,889 | ||||||||
| 1,838 | Health Catalyst Inc.*(a) | 100,373 | ||||||||
| 1,012 | HealthStream Inc.* | 30,755 | ||||||||
| 954 | iCAD Inc.* | 11,505 | ||||||||
| 3,086 | Inovalon Holdings Inc., Class A Shares* | 126,063 | ||||||||
| 1,109 | Inspire Medical Systems Inc.* | 247,928 | ||||||||
| 16,376 | Multiplan Corp.*(a) | 98,256 | ||||||||
| 1,523 | NantHealth Inc.* | 3,351 | ||||||||
| 2,385 | NextGen Healthcare Inc.* | 36,395 | ||||||||
| 1,776 | Omnicell Inc.* | 275,759 | ||||||||
| 714 | OptimizeRx Corp.* | 47,252 | ||||||||
| 1,572 | Phreesia Inc.* | 112,477 | ||||||||
| 1,937 | Schrodinger Inc.* | 115,619 | ||||||||
| 647 | Simulations Plus Inc. | 28,662 | ||||||||
| 1,018 | Tabula Rasa HealthCare Inc.* | 31,874 | ||||||||
| 5,316 | Veeva Systems Inc., Class A Shares* | 1,764,806 | ||||||||
| 1,404 | Vocera Communications Inc.* | 68,080 | ||||||||
|
| |||||||||
| Total Health Care Technology | 3,659,313 | |||||||||
|
| |||||||||
Life Sciences Tools & Services — 3.0% | ||||||||||
| 3,496 | 10X Genomics Inc., Class A Shares* | 615,016 | ||||||||
| 4,506 | Adaptive Biotechnologies Corp.* | 163,658 | ||||||||
| 291 | Akoya Biosciences Inc.* | 4,647 | ||||||||
| 24,261 | Avantor Inc.* | 956,854 | ||||||||
| 1,969 | Berkeley Lights Inc.* | 70,018 | ||||||||
| 11,552 | Bionano Genomics Inc.*(a) | 67,348 | ||||||||
| 1,595 | Bio-Rad Laboratories Inc., Class A Shares* | 1,283,688 | ||||||||
| 7,165 | Bio-Techne Corp. | 3,576,338 | ||||||||
| 4,251 | Bruker Corp. | 375,406 | ||||||||
| 11,064 | Charles River Laboratories International Inc.* | 4,910,867 | ||||||||
| 2,085 | ChromaDex Corp.* | 17,785 | ||||||||
| 2,449 | Codexis Inc.* | 66,172 | ||||||||
| 93,737 | Fluidigm Corp.*(a) | 675,844 | ||||||||
| 1,622 | Harvard Bioscience Inc.* | 13,398 | ||||||||
| 5,259 | Illumina Inc.* | 2,404,204 | ||||||||
| 526 | Inotiv Inc.* | 13,692 | ||||||||
| 3,255 | Maravai LifeSciences Holdings Inc., Class A Shares* | 192,631 | ||||||||
| 1,195 | Medpace Holdings Inc.* | 217,908 | ||||||||
See Notes to Financial Statements.
85
| Schedules of Investments |
| (continued) |
| Small-Mid Cap Equity Fund | ||||||||||
| Shares/Units | Security | Value | ||||||||
HEALTH CARE — 17.4% — (continued) | ||||||||||
Life Sciences Tools & Services — 3.0% — (continued) | ||||||||||
| 1,872 | NanoString Technologies Inc.* | $ | 108,950 | |||||||
| 4,782 | NeoGenomics Inc.* | 232,501 | ||||||||
| 32,481 | Pacific Biosciences of California Inc.* | 1,016,980 | ||||||||
| 4,690 | PerkinElmer Inc. | 866,712 | ||||||||
| 1,461 | Personalis Inc.* | 30,944 | ||||||||
| 6,759 | PPD Inc.* | 313,009 | ||||||||
| 9,417 | QIAGEN NV* | 525,657 | ||||||||
| 1,270 | Quanterix Corp.* | 64,834 | ||||||||
| 2,295 | Repligen Corp.* | 649,439 | ||||||||
| 635 | Seer Inc., Class A Shares* | 25,387 | ||||||||
| 3,245 | Sotera Health Co.* | 79,373 | ||||||||
| 4,265 | Syneos Health Inc., Class A Shares* | 395,707 | ||||||||
|
| |||||||||
| Total Life Sciences Tools & Services | 19,934,967 | |||||||||
|
| |||||||||
Pharmaceuticals — 1.5% | ||||||||||
| 8,548 | 9 Meters Biopharma Inc.* | 11,112 | ||||||||
| 5,051 | Achillion Pharmaceuticals Inc.*(b) | 2,323 | ||||||||
| 1,785 | Aclaris Therapeutics Inc.* | 28,935 | ||||||||
| 1,732 | Aerie Pharmaceuticals Inc.* | 25,824 | ||||||||
| 77,873 | Amneal Pharmaceuticals Inc.* | 439,204 | ||||||||
| 1,481 | Amphastar Pharmaceuticals Inc.* | 29,116 | ||||||||
| 7,774 | Ampio Pharmaceuticals Inc.*(a) | 12,749 | ||||||||
| 328 | Angion Biomedica Corp.* | 3,611 | ||||||||
| 356 | ANI Pharmaceuticals Inc.* | 10,797 | ||||||||
| 7,153 | Antares Pharma Inc.* | 28,183 | ||||||||
| 1,799 | Arvinas Inc.* | 155,092 | ||||||||
| 2,648 | Atea Pharmaceuticals Inc.*(a) | 78,699 | ||||||||
| 1,315 | Athira Pharma Inc.* | 13,926 | ||||||||
| 2,121 | Avalo Therapeutics Inc.* | 6,575 | ||||||||
| 1,134 | Axsome Therapeutics Inc.* | 29,121 | ||||||||
| 3,954 | BioDelivery Sciences International Inc.* | 15,262 | ||||||||
| 1,848 | Cara Therapeutics Inc.* | 29,161 | ||||||||
| 1,576 | Cassava Sciences Inc.*(a) | 89,596 | ||||||||
| 21,027 | Catalent Inc.* | 2,742,762 | ||||||||
| 4,646 | Citius Pharmaceuticals Inc.* | 10,454 | ||||||||
| 1,426 | Collegium Pharmaceutical Inc.* | 29,276 | ||||||||
| 3,983 | Corcept Therapeutics Inc.* | 84,758 | ||||||||
| 1,684 | CorMedix Inc.* | 10,879 | ||||||||
| 2,827 | Cymabay Therapeutics Inc.* | 11,195 | ||||||||
| 9,078 | Durect Corp.* | 12,618 | ||||||||
| 499 | Edgewise Therapeutics Inc.*(a) | 7,904 | ||||||||
| 9,636 | Endo International PLC* | 22,066 | ||||||||
| 1,091 | Esperion Therapeutics Inc.*(a) | 14,205 | ||||||||
| 1,328 | Evolus Inc.* | 14,077 | ||||||||
| 826 | EyePoint Pharmaceuticals Inc.* | 9,036 | ||||||||
| 958 | Fulcrum Therapeutics Inc.* | 28,453 | ||||||||
| 910 | Harmony Biosciences Holdings Inc.* | 30,840 | ||||||||
| 351 | Ikena Oncology Inc.*(a) | 4,517 | ||||||||
| 93,706 | Innoviva Inc.* | 1,429,954 | ||||||||
| 2,912 | Intra-Cellular Therapies Inc.* | 96,678 | ||||||||
| 2,457 | Jazz Pharmaceuticals PLC* | 323,611 | ||||||||
| 2,157 | Kala Pharmaceuticals Inc.*(a) | 7,291 | ||||||||
| 854 | Kaleido Biosciences Inc.* | 5,244 | ||||||||
| 1,168 | KemPharm Inc.*(a) | 10,862 | ||||||||
| 246 | Landos Biopharma Inc.* | 3,267 | ||||||||
See Notes to Financial Statements.
86
| Schedules of Investments |
| (continued) |
| Small-Mid Cap Equity Fund | ||||||||||
| Shares/Units | Security | Value | ||||||||
HEALTH CARE — 17.4% — (continued) | ||||||||||
Pharmaceuticals — 1.5% — (continued) | ||||||||||
| 1,518 | Marinus Pharmaceuticals Inc.* | $ | 18,762 | |||||||
| 13,235 | Mind Medicine MindMed Inc.*(a) | 38,249 | ||||||||
| 7,371 | Nektar Therapeutics, Class A Shares*(a) | 114,103 | ||||||||
| 1,297 | NGM Biopharmaceuticals Inc.* | 28,314 | ||||||||
| 1,447 | Nuvation Bio Inc.* | 13,356 | ||||||||
| 3,098 | Ocular Therapeutix Inc.* | 32,715 | ||||||||
| 2,503 | Omeros Corp.* | 40,799 | ||||||||
| 1,092 | Oramed Pharmaceuticals Inc.*(a) | 21,491 | ||||||||
| 10,648 | Organon & Co. | 360,861 | ||||||||
| 23,778 | Pacira BioSciences Inc.* | 1,409,798 | ||||||||
| 2,064 | Paratek Pharmaceuticals Inc.* | 11,476 | ||||||||
| 5,539 | Perrigo Co. PLC | 226,822 | ||||||||
| 828 | Phathom Pharmaceuticals Inc.* | 29,469 | ||||||||
| 885 | Phibro Animal Health Corp., Class A Shares | 21,497 | ||||||||
| 1,027 | Pliant Therapeutics Inc.* | 18,732 | ||||||||
| 14,950 | Prestige Consumer Healthcare Inc.* | 857,980 | ||||||||
| 3,674 | Progenics Pharmaceuticals Inc.*#(b) | – | ||||||||
| 2,318 | Provention Bio Inc.* | 15,554 | ||||||||
| 295 | Rain Therapeutics Inc.*(a) | 5,171 | ||||||||
| 1,173 | Reata Pharmaceuticals Inc., Class A Shares*(a) | 124,936 | ||||||||
| 604 | Relmada Therapeutics Inc.* | 14,442 | ||||||||
| 2,889 | Revance Therapeutics Inc.* | 77,367 | ||||||||
| 3,088 | Seelos Therapeutics Inc.* | 6,794 | ||||||||
| 1,907 | SIGA Technologies Inc.* | 12,453 | ||||||||
| 27,624 | Supernus Pharmaceuticals Inc.* | 760,489 | ||||||||
| 377 | Tarsus Pharmaceuticals Inc.* | 9,991 | ||||||||
| 378 | Terns Pharmaceuticals Inc.* | 5,088 | ||||||||
| 15,457 | TherapeuticsMD Inc.* | 12,288 | ||||||||
| 2,181 | Theravance Biopharma Inc.* | 18,102 | ||||||||
| 471 | Verrica Pharmaceuticals Inc.* | 5,275 | ||||||||
| 1,508 | WaVe Life Sciences Ltd.* | 9,546 | ||||||||
| 2,252 | Zogenix Inc.* | 33,352 | ||||||||
|
| |||||||||
| Total Pharmaceuticals | 10,274,505 | |||||||||
|
| |||||||||
| TOTAL HEALTH CARE | 117,818,474 | |||||||||
|
| |||||||||
INDUSTRIALS — 15.9% | ||||||||||
Aerospace & Defense — 1.9% | ||||||||||
| 1,377 | AAR Corp.* | 46,611 | ||||||||
| 12,027 | Aerojet Rocketdyne Holdings Inc.(a) | 499,361 | ||||||||
| 971 | Aerovironment Inc.* | 99,392 | ||||||||
| 337 | AerSale Corp.* | 4,560 | ||||||||
| 1,028 | Astronics Corp.* | 13,734 | ||||||||
| 2,678 | Axon Enterprise Inc.* | 487,048 | ||||||||
| 4,030 | BWX Technologies Inc. | 231,443 | ||||||||
| 437 | Byrna Technologies Inc.* | 12,795 | ||||||||
| 1,697 | Curtiss-Wright Corp. | 206,661 | ||||||||
| 467 | Ducommun Inc.* | 24,611 | ||||||||
| 24,785 | HEICO Corp., Class A Shares | 2,831,438 | ||||||||
| 24,437 | Hexcel Corp.*(a) | 1,385,822 | ||||||||
| 16,426 | Howmet Aerospace Inc. | 521,526 | ||||||||
| 1,636 | Huntington Ingalls Industries Inc. | 334,022 | ||||||||
| 1,153 | Kaman Corp. | 45,059 | ||||||||
| 5,042 | Kratos Defense & Security Solutions Inc.* | 124,638 | ||||||||
| 2,946 | Maxar Technologies Inc. | 93,653 | ||||||||
See Notes to Financial Statements.
87
| Schedules of Investments |
| (continued) |
| Small-Mid Cap Equity Fund | ||||||||||
| Shares/Units | Security | Value | ||||||||
INDUSTRIALS — 15.9% — (continued) | ||||||||||
Aerospace & Defense — 1.9% — (continued) | ||||||||||
| 13,745 | Mercury Systems Inc.* | $ | 692,473 | |||||||
| 1,185 | Moog Inc., Class A Shares | 94,136 | ||||||||
| 223 | National Presto Industries Inc. | 18,629 | ||||||||
| 3,347 | Northrop Grumman Corp. | 1,230,692 | ||||||||
| 31,839 | PAE Inc.* | 213,003 | ||||||||
| 809 | Park Aerospace Corp. | 11,795 | ||||||||
| 1,068 | Parsons Corp.* | 37,839 | ||||||||
| 14,777 | Spirit AeroSystems Holdings Inc., Class A Shares | 579,850 | ||||||||
| 9,449 | Textron Inc. | 686,659 | ||||||||
| 3,200 | TransDigm Group Inc.* | 1,943,904 | ||||||||
| 2,169 | Triumph Group Inc.* | 40,040 | ||||||||
| 496 | Vectrus Inc.* | 24,954 | ||||||||
| 6,117 | Virgin Galactic Holdings Inc.*(a) | 165,832 | ||||||||
|
| |||||||||
| Total Aerospace & Defense | 12,702,180 | |||||||||
|
| |||||||||
Air Freight & Logistics — 0.1% | ||||||||||
| 2,483 | Air Transport Services Group Inc.* | 68,009 | ||||||||
| 1,182 | Atlas Air Worldwide Holdings Inc.* | 86,487 | ||||||||
| 1,067 | Echo Global Logistics Inc.* | 35,083 | ||||||||
| 1,130 | Forward Air Corp. | 99,632 | ||||||||
| 4,055 | GXO Logistics Inc.* | 331,658 | ||||||||
| 1,363 | Hub Group Inc., Class A Shares* | 95,683 | ||||||||
| 1,467 | Radiant Logistics Inc.* | 10,049 | ||||||||
|
| |||||||||
| Total Air Freight & Logistics | 726,601 | |||||||||
|
| |||||||||
Airlines — 0.2% | ||||||||||
| 5,171 | Alaska Air Group Inc.* | 296,505 | ||||||||
| 652 | Allegiant Travel Co.* | 125,471 | ||||||||
| 26,718 | American Airlines Group Inc.*(a) | 532,757 | ||||||||
| 1,299 | Copa Holdings SA, Class A Shares* | 97,750 | ||||||||
| 1,416 | Frontier Group Holdings Inc.* | 21,707 | ||||||||
| 2,036 | Hawaiian Holdings Inc.* | 41,168 | ||||||||
| 13,189 | JetBlue Airways Corp.* | 199,550 | ||||||||
| 1,325 | Mesa Air Group Inc.* | 10,573 | ||||||||
| 2,030 | SkyWest Inc.* | 94,699 | ||||||||
| 4,062 | Spirit Airlines Inc.* | 99,641 | ||||||||
| 702 | Sun Country Airlines Holdings Inc.* | 22,738 | ||||||||
|
| |||||||||
| Total Airlines | 1,542,559 | |||||||||
|
| |||||||||
Building Products — 1.8% | ||||||||||
| 1,785 | AAON Inc. | 121,576 | ||||||||
| 17,096 | Advanced Drainage Systems Inc. | 1,951,508 | ||||||||
| 3,763 | Allegion PLC | 541,834 | ||||||||
| 697 | American Woodmark Corp.* | 49,111 | ||||||||
| 5,495 | AO Smith Corp. | 399,597 | ||||||||
| 1,036 | Apogee Enterprises Inc. | 44,527 | ||||||||
| 1,971 | Armstrong World Industries Inc. | 204,846 | ||||||||
| 4,521 | AZEK Co., Inc. (The), Class A Shares* | 192,097 | ||||||||
| 8,501 | Builders FirstSource Inc.* | 453,018 | ||||||||
| 897 | Caesarstone Ltd. | 11,661 | ||||||||
| 6,591 | Carlisle Cos., Inc. | 1,388,987 | ||||||||
| 2,232 | Cornerstone Building Brands Inc.* | 37,096 | ||||||||
| 563 | CSW Industrials Inc. | 74,761 | ||||||||
| 5,797 | Fortune Brands Home & Security Inc. | 564,454 | ||||||||
| 1,418 | Gibraltar Industries Inc.* | 105,868 | ||||||||
See Notes to Financial Statements.
88
| Schedules of Investments |
| (continued) |
| Small-Mid Cap Equity Fund | ||||||||||
| Shares/Units | Security | Value | ||||||||
INDUSTRIALS — 15.9% — (continued) | ||||||||||
Building Products — 1.8% — (continued) | ||||||||||
| 1,864 | Griffon Corp. | $ | 45,109 | |||||||
| 801 | Insteel Industries Inc. | 29,637 | ||||||||
| 3,438 | JELD-WEN Holding Inc.* | 94,683 | ||||||||
| 1,411 | Lennox International Inc.(a) | 472,939 | ||||||||
| 1,055 | Masonite International Corp.* | 126,262 | ||||||||
| 4,326 | Owens Corning | 413,349 | ||||||||
| 2,438 | PGT Innovations Inc.* | 51,759 | ||||||||
| 1,347 | Quanex Building Products Corp. | 31,735 | ||||||||
| 79,858 | Resideo Technologies Inc.* | 2,574,622 | ||||||||
| 1,841 | Simpson Manufacturing Co., Inc. | 208,309 | ||||||||
| 15,218 | Trex Co., Inc.* | 1,670,328 | ||||||||
| 2,482 | UFP Industries Inc. | 186,349 | ||||||||
| 3,456 | View Inc.*(a) | 17,315 | ||||||||
|
| |||||||||
| Total Building Products | 12,063,337 | |||||||||
|
| |||||||||
Commercial Services & Supplies — 1.8% | ||||||||||
| 2,775 | ABM Industries Inc. | 137,418 | ||||||||
| 4,019 | ACCO Brands Corp. | 37,658 | ||||||||
| 6,587 | ADT Inc. | 56,385 | ||||||||
| 1,940 | Brady Corp., Class A Shares | 103,460 | ||||||||
| 1,703 | BrightView Holdings Inc.* | 26,107 | ||||||||
| 2,069 | Brink’s Co. (The) | 161,713 | ||||||||
| 2,016 | Casella Waste Systems Inc., Class A Shares* | 149,164 | ||||||||
| 1,390 | CECO Environmental Corp.* | 10,494 | ||||||||
| 722 | Cimpress PLC* | 68,576 | ||||||||
| 9,987 | Clean Harbors Inc.* | 1,024,866 | ||||||||
| 5,379 | CoreCivic Inc.* | 52,284 | ||||||||
| 5,160 | Covanta Holding Corp. | 103,458 | ||||||||
| 1,829 | Deluxe Corp. | 70,142 | ||||||||
| 1,553 | Driven Brands Holdings Inc.*(a) | 46,404 | ||||||||
| 1,025 | Ennis Inc. | 19,895 | ||||||||
| 125,103 | Harsco Corp.*(a) | 2,281,879 | ||||||||
| 3,089 | Healthcare Services Group Inc. | 80,808 | ||||||||
| 708 | Heritage-Crystal Clean Inc.* | 20,914 | ||||||||
| 3,062 | Herman Miller Inc. | 128,696 | ||||||||
| 1,836 | HNI Corp. | 69,566 | ||||||||
| 5,663 | IAA Inc.* | 300,819 | ||||||||
| 2,333 | Interface Inc., Class A Shares | 33,549 | ||||||||
| 28,744 | KAR Auction Services Inc.* | 486,061 | ||||||||
| 1,576 | Kimball International Inc., Class B Shares | 19,653 | ||||||||
| 23,761 | Matthews International Corp., Class A Shares | 879,870 | ||||||||
| 916 | Montrose Environmental Group Inc.* | 45,800 | ||||||||
| 5,542 | MSA Safety Inc.(a) | 902,459 | ||||||||
| 157 | NL Industries Inc. | 1,074 | ||||||||
| 7,395 | Pitney Bowes Inc. | 55,241 | ||||||||
| 2,877 | RR Donnelley & Sons Co.* | 14,126 | ||||||||
| 997 | SP Plus Corp.* | 32,293 | ||||||||
| 3,660 | Steelcase Inc., Class A Shares | 51,569 | ||||||||
| 21,744 | Stericycle Inc.* | 1,513,382 | ||||||||
| 51,199 | Team Inc.* | 229,371 | ||||||||
| 2,223 | Tetra Tech Inc. | 319,756 | ||||||||
| 620 | UniFirst Corp. | 142,023 | ||||||||
| 1,269 | US Ecology Inc.* | 45,494 | ||||||||
| 866 | Viad Corp.* | 37,402 | ||||||||
| 430 | VSE Corp. | 21,496 | ||||||||
See Notes to Financial Statements.
89
| Schedules of Investments |
| (continued) |
| Small-Mid Cap Equity Fund | ||||||||||
| Shares/Units | Security | Value | ||||||||
INDUSTRIALS — 15.9% — (continued) | ||||||||||
Commercial Services & Supplies — 1.8% — (continued) | ||||||||||
| 18,651 | Waste Connections Inc. | $ | 2,409,896 | |||||||
|
| |||||||||
| Total Commercial Services & Supplies | 12,191,221 | |||||||||
|
| |||||||||
Construction & Engineering — 1.0% | ||||||||||
| 5,794 | AECOM* | 379,855 | ||||||||
| 1,343 | Ameresco Inc., Class A Shares* | 92,869 | ||||||||
| 7,662 | API Group Corp.*(d) | 177,682 | ||||||||
| 1,994 | Arcosa Inc. | 101,335 | ||||||||
| 634 | Argan Inc. | 29,354 | ||||||||
| 1,470 | Comfort Systems USA Inc. | 111,691 | ||||||||
| 1,176 | Concrete Pumping Holdings Inc.* | 9,773 | ||||||||
| 1,202 | Construction Partners Inc., Class A Shares* | 40,231 | ||||||||
| 18,321 | Dycom Industries Inc.*(a) | 1,380,121 | ||||||||
| 2,230 | EMCOR Group Inc. | 270,945 | ||||||||
| 6,118 | Fluor Corp.* | 101,926 | ||||||||
| 1,886 | Granite Construction Inc. | 76,458 | ||||||||
| 2,601 | Great Lakes Dredge & Dock Corp.* | 39,301 | ||||||||
| 2,212 | HC2 Holdings Inc.* | 8,361 | ||||||||
| 359 | IES Holdings Inc.* | 17,555 | ||||||||
| 836 | Infrastructure & Energy Alternatives Inc.* | 10,726 | ||||||||
| 2,331 | MasTec Inc.* | 213,147 | ||||||||
| 1,079 | Matrix Service Co.* | 12,171 | ||||||||
| 684 | MYR Group Inc.* | 71,143 | ||||||||
| 394 | Northwest Pipe Co.* | 10,213 | ||||||||
| 522 | NV5 Global Inc.* | 55,149 | ||||||||
| 2,182 | Primoris Services Corp. | 56,077 | ||||||||
| 5,743 | Quanta Services Inc. | 586,360 | ||||||||
| 1,202 | Sterling Construction Co., Inc.* | 27,718 | ||||||||
| 1,739 | Tutor Perini Corp.* | 25,076 | ||||||||
| 3,099 | Valmont Industries Inc. | 771,217 | ||||||||
| 66,747 | WillScot Mobile Mini Holdings Corp.* | 1,975,711 | ||||||||
|
| |||||||||
| Total Construction & Engineering | 6,652,165 | |||||||||
|
| |||||||||
Electrical Equipment — 1.2% | ||||||||||
| 1,466 | Acuity Brands Inc. | 270,521 | ||||||||
| 667 | Advent Technologies Holdings Inc.*(a) | 4,936 | ||||||||
| 494 | Allied Motion Technologies Inc. | 17,073 | ||||||||
| 1,360 | American Superconductor Corp.* | 20,264 | ||||||||
| 5,580 | Array Technologies Inc.* | 106,411 | ||||||||
| 23,126 | Atkore Inc.* | 2,145,399 | ||||||||
| 12,718 | AZZ Inc. | 681,049 | ||||||||
| 128,759 | Babcock & Wilcox Enterprises Inc.*(a) | 939,941 | ||||||||
| 360 | Beam Global*(a) | 11,210 | ||||||||
| 1,501 | Blink Charging Co.* | 48,677 | ||||||||
| 23,389 | Bloom Energy Corp., Class A Shares*(a) | 500,992 | ||||||||
| 5,729 | ChargePoint Holdings Inc.*(a) | 121,168 | ||||||||
| 817 | Encore Wire Corp. | 69,453 | ||||||||
| 1,767 | EnerSys | 149,471 | ||||||||
| 709 | Eos Energy Enterprises Inc.* | 9,160 | ||||||||
| 737 | FTC Solar Inc.* | 7,996 | ||||||||
| 13,354 | FuelCell Energy Inc.*(a) | 83,329 | ||||||||
| 7,012 | GrafTech International Ltd.(a) | 77,623 | ||||||||
| 2,287 | Hubbell Inc., Class B Shares(a) | 471,374 | ||||||||
| 6,896 | nVent Electric PLC | 236,947 | ||||||||
| 20,939 | Plug Power Inc.*(a) | 545,670 | ||||||||
See Notes to Financial Statements.
90
| Schedules of Investments |
| (continued) |
| Small-Mid Cap Equity Fund | ||||||||||
| Shares/Units | Security | Value | ||||||||
INDUSTRIALS — 15.9% — (continued) | ||||||||||
Electrical Equipment — 1.2% — (continued) | ||||||||||
| 332 | Powell Industries Inc. | $ | 8,400 | |||||||
| 128 | Preformed Line Products Co. | 8,975 | ||||||||
| 1,683 | Regal Beloit Corp.(a) | 251,474 | ||||||||
| 1,689 | Romeo Power Inc.*(a) | 8,225 | ||||||||
| 6,539 | Sensata Technologies Holding PLC* | 386,978 | ||||||||
| 4,237 | Shoals Technologies Group Inc., Class A Shares* | 137,999 | ||||||||
| 2,578 | Stem Inc.*(a) | 64,424 | ||||||||
| 8,361 | Sunrun Inc.* | 369,974 | ||||||||
| 1,364 | Thermon Group Holdings Inc.* | 22,779 | ||||||||
| 1,467 | TPI Composites Inc.* | 53,267 | ||||||||
| 11,826 | Vertiv Holdings Co., Class A Shares | 333,138 | ||||||||
| 864 | Vicor Corp.* | 106,592 | ||||||||
|
| |||||||||
| Total Electrical Equipment | 8,270,889 | |||||||||
|
| |||||||||
Industrial Conglomerates — 0.0% | ||||||||||
| 1,555 | Raven Industries Inc.* | 90,734 | ||||||||
|
| |||||||||
Machinery — 3.1% | ||||||||||
| 2,591 | AGCO Corp. | 356,573 | ||||||||
| 2,731 | AgEagle Aerial Systems Inc.*(a) | 9,668 | ||||||||
| 407 | Alamo Group Inc. | 63,089 | ||||||||
| 14,694 | Albany International Corp., Class A Shares(a) | 1,150,981 | ||||||||
| 4,510 | Allison Transmission Holdings Inc.(a) | 166,780 | ||||||||
| 22,282 | Altra Industrial Motion Corp. | 1,304,834 | ||||||||
| 1,000 | Astec Industries Inc. | 61,140 | ||||||||
| 14,509 | Barnes Group Inc. | 691,644 | ||||||||
| 679 | Blue Bird Corp.* | 14,700 | ||||||||
| 1,506 | Chart Industries Inc.* | 283,700 | ||||||||
| 772 | CIRCOR International Inc.* | 27,599 | ||||||||
| 4,948 | Colfax Corp.*(a) | 238,345 | ||||||||
| 1,127 | Columbus McKinnon Corp. | 51,898 | ||||||||
| 1,298 | Commercial Vehicle Group Inc.* | 13,642 | ||||||||
| 2,042 | Crane Co. | 207,814 | ||||||||
| 3,428 | Desktop Metal Inc., Class A Shares* | 28,452 | ||||||||
| 5,235 | Donaldson Co., Inc. | 354,671 | ||||||||
| 919 | Douglas Dynamics Inc. | 36,521 | ||||||||
| 1,729 | Energy Recovery Inc.* | 35,323 | ||||||||
| 21,547 | Enerpac Tool Group Corp., Class A Shares | 542,123 | ||||||||
| 858 | EnPro Industries Inc. | 73,368 | ||||||||
| 1,048 | ESCO Technologies Inc. | 94,446 | ||||||||
| 4,922 | Evoqua Water Technologies Corp.* | 191,564 | ||||||||
| 696 | ExOne Co. (The)*(a) | 17,087 | ||||||||
| 2,484 | Federal Signal Corp. | 100,925 | ||||||||
| 19,291 | Flowserve Corp.(a) | 749,841 | ||||||||
| 1,917 | Franklin Electric Co., Inc. | 162,907 | ||||||||
| 2,865 | Gates Industrial Corp. PLC* | 46,929 | ||||||||
| 1,026 | Gorman-Rupp Co. (The) | 35,982 | ||||||||
| 7,094 | Graco Inc. | 556,311 | ||||||||
| 1,314 | Greenbrier Cos., Inc. (The) | 57,947 | ||||||||
| 1,331 | Helios Technologies Inc. | 108,636 | ||||||||
| 3,195 | Hillenbrand Inc. | 148,312 | ||||||||
| 461 | Hydrofarm Holdings Group Inc.* | 23,308 | ||||||||
| 4,802 | Hyliion Holdings Corp.*(a) | 42,402 | ||||||||
| 408 | Hyster-Yale Materials Handling Inc. | 23,913 | ||||||||
| 16,747 | Ideanomics Inc.*(a) | 42,035 | ||||||||
See Notes to Financial Statements.
91
| Schedules of Investments |
| (continued) |
| Small-Mid Cap Equity Fund | ||||||||||
| Shares/Units | Security | Value | ||||||||
INDUSTRIALS — 15.9% — (continued) | ||||||||||
Machinery — 3.1% — (continued) | ||||||||||
| 4,550 | IDEX Corp. | $ | 1,019,200 | |||||||
| 16,595 | ITT Inc. | 1,587,644 | ||||||||
| 1,294 | John Bean Technologies Corp. | 188,782 | ||||||||
| 481 | Kadant Inc. | 100,587 | ||||||||
| 3,437 | Kennametal Inc. | 127,788 | ||||||||
| 10,941 | Lincoln Electric Holdings Inc. | 1,527,473 | ||||||||
| 447 | Lindsay Corp. | 73,643 | ||||||||
| 1,226 | Luxfer Holdings PLC ,ADR | 26,175 | ||||||||
| 740 | Lydall Inc.* | 45,865 | ||||||||
| 1,462 | Manitowoc Co., Inc. (The)* | 35,453 | ||||||||
| 396 | Mayville Engineering Co., Inc.* | 5,908 | ||||||||
| 3,083 | Meritor Inc.* | 73,129 | ||||||||
| 2,285 | Middleby Corp. (The)* | 418,018 | ||||||||
| 467 | Miller Industries Inc. | 17,382 | ||||||||
| 2,412 | Mueller Industries Inc. | 107,599 | ||||||||
| 80,948 | Mueller Water Products Inc., Class A Shares | 1,345,356 | ||||||||
| 8,597 | Nikola Corp.*(a) | 89,667 | ||||||||
| 1,713 | NN Inc.* | 9,319 | ||||||||
| 2,436 | Nordson Corp. | 581,230 | ||||||||
| 134 | Omega Flex Inc. | 20,368 | ||||||||
| 2,836 | Oshkosh Corp. | 324,949 | ||||||||
| 384 | Park-Ohio Holdings Corp. | 9,899 | ||||||||
| 6,868 | Pentair PLC | 529,935 | ||||||||
| 1,191 | Proto Labs Inc.* | 88,325 | ||||||||
| 1,046 | RBC Bearings Inc.* | 242,170 | ||||||||
| 1,248 | REV Group Inc. | 20,292 | ||||||||
| 4,944 | Rexnord Corp. | 300,397 | ||||||||
| 1,409 | Shyft Group Inc. (The) | 62,010 | ||||||||
| 2,242 | Snap-on Inc. | 504,338 | ||||||||
| 1,867 | SPX Corp.* | 116,650 | ||||||||
| 1,739 | SPX FLOW Inc. | 140,042 | ||||||||
| 503 | Standex International Corp. | 49,918 | ||||||||
| 740 | Tennant Co. | 54,745 | ||||||||
| 2,917 | Terex Corp. | 148,913 | ||||||||
| 19,080 | Timken Co. (The) | 1,403,143 | ||||||||
| 2,057 | Titan International Inc.* | 17,094 | ||||||||
| 4,456 | Toro Co. (The) | 489,893 | ||||||||
| 1,783 | TriMas Corp.* | 57,252 | ||||||||
| 3,573 | Trinity Industries Inc.(a) | 103,724 | ||||||||
| 6,097 | Twin Disc Inc.* | 76,212 | ||||||||
| 2,140 | Wabash National Corp. | 33,256 | ||||||||
| 1,136 | Watts Water Technologies Inc., Class A Shares | 194,904 | ||||||||
| 5,601 | Welbilt Inc.* | 131,063 | ||||||||
| 2,954 | Westinghouse Air Brake Technologies Corp. | 265,240 | ||||||||
| 2,381 | Woodward Inc. | 287,958 | ||||||||
|
| |||||||||
| Total Machinery | 21,168,318 | |||||||||
|
| |||||||||
Marine — 0.1% | ||||||||||
| 2,182 | Costamare Inc. | 31,377 | ||||||||
| 341 | Eagle Bulk Shipping Inc.* | 16,842 | ||||||||
| 1,324 | Genco Shipping & Trading Ltd. | 25,805 | ||||||||
| 2,467 | Kirby Corp.* | 132,207 | ||||||||
| 1,772 | Matson Inc. | 140,289 | ||||||||
| 2,124 | Safe Bulkers Inc.* | 8,581 | ||||||||
|
| |||||||||
| Total Marine | 355,101 | |||||||||
|
| |||||||||
See Notes to Financial Statements.
92
| Schedules of Investments |
| (continued) |
| Small-Mid Cap Equity Fund | ||||||||||
| Shares/Units | Security | Value | ||||||||
INDUSTRIALS — 15.9% — (continued) | ||||||||||
Professional Services — 2.5% | ||||||||||
| 1,975 | Acacia Research Corp.* | $ | 12,028 | |||||||
| 17,287 | ASGN Inc.* | 1,939,429 | ||||||||
| 504 | Atlas Technical Consultants Inc.* | 5,100 | ||||||||
| 335 | Barrett Business Services Inc. | 25,962 | ||||||||
| 5,684 | Booz Allen Hamilton Holding Corp., Class A Shares | 465,576 | ||||||||
| 982 | CACI International Inc., Class A Shares* | 252,904 | ||||||||
| 2,050 | CBIZ Inc.* | 69,925 | ||||||||
| 22,266 | CoStar Group Inc.* | 1,886,821 | ||||||||
| 288 | CRA International Inc. | 26,781 | ||||||||
| 6,656 | Dun & Bradstreet Holdings Inc.* | 122,004 | ||||||||
| 2,193 | Exponent Inc. | 256,362 | ||||||||
| 493 | Forrester Research Inc.* | 23,442 | ||||||||
| 523 | Franklin Covey Co.* | 22,735 | ||||||||
| 13,214 | FTI Consulting Inc.* | 1,846,128 | ||||||||
| 467 | GP Strategies Corp.* | 9,658 | ||||||||
| 838 | Heidrick & Struggles International Inc. | 36,218 | ||||||||
| 184 | HireQuest Inc. | 3,413 | ||||||||
| 16,886 | Huron Consulting Group Inc.* | 833,662 | ||||||||
| 763 | ICF International Inc. | 71,463 | ||||||||
| 1,494 | Insperity Inc. | 164,848 | ||||||||
| 5,436 | Jacobs Engineering Group Inc. | 733,643 | ||||||||
| 65,682 | KBR Inc. | 2,557,657 | ||||||||
| 1,483 | Kelly Services Inc., Class A Shares | 28,830 | ||||||||
| 830 | Kforce Inc. | 48,489 | ||||||||
| 2,206 | Korn Ferry | 155,942 | ||||||||
| 2,256 | ManpowerGroup Inc. | 273,924 | ||||||||
| 1,179 | ManTech International Corp., Class A Shares | 93,341 | ||||||||
| 729 | Mistras Group Inc.* | 7,735 | ||||||||
| 15,026 | Nielsen Holdings PLC | 322,458 | ||||||||
| 1,464 | Resources Connection Inc. | 23,131 | ||||||||
| 4,618 | Robert Half International Inc. | 477,501 | ||||||||
| 2,402 | Science Applications International Corp. | 202,320 | ||||||||
| 1,667 | TriNet Group Inc.* | 153,497 | ||||||||
| 1,429 | TrueBlue Inc.* | 39,055 | ||||||||
| 10,855 | Upwork Inc.* | 485,327 | ||||||||
| 14,718 | Verisk Analytics Inc., Class A Shares | 2,969,504 | ||||||||
| 454 | Willdan Group Inc.* | 17,166 | ||||||||
|
| |||||||||
| Total Professional Services | 16,663,979 | |||||||||
|
| |||||||||
Road & Rail — 1.0% | ||||||||||
| 373 | AMERCO | 246,609 | ||||||||
| 1,118 | ArcBest Corp. | 74,604 | ||||||||
| 10,710 | Avis Budget Group Inc.* | 971,933 | ||||||||
| 479 | Covenant Logistics Group Inc., Class A Shares* | 11,669 | ||||||||
| 1,688 | Daseke Inc.* | 15,952 | ||||||||
| 1,963 | Heartland Express Inc. | 32,939 | ||||||||
| 721 | HyreCar Inc.* | 8,104 | ||||||||
| 19,546 | Knight-Swift Transportation Holdings Inc., Class A Shares | 1,015,024 | ||||||||
| 1,621 | Landstar System Inc. | 272,377 | ||||||||
| 2,542 | Marten Transport Ltd. | 39,630 | ||||||||
| 4,249 | Old Dominion Freight Line Inc. | 1,226,771 | ||||||||
| 164 | PAM Transportation Services Inc.* | 5,735 | ||||||||
| 6,727 | Ryder System Inc. | 534,729 | ||||||||
| 7,211 | Saia Inc.* | 1,731,577 | ||||||||
| 2,169 | Schneider National Inc., Class B Shares | 48,889 | ||||||||
See Notes to Financial Statements.
93
| Schedules of Investments |
| (continued) |
| Small-Mid Cap Equity Fund | ||||||||||
| Shares/Units | Security | Value | ||||||||
INDUSTRIALS — 15.9% — (continued) | ||||||||||
Road & Rail — 1.0% — (continued) | ||||||||||
| 1,476 | TuSimple Holdings Inc., Class A Shares*(a) | $ | 61,785 | |||||||
| 346 | Universal Logistics Holdings Inc. | 7,567 | ||||||||
| 1,527 | US Xpress Enterprises Inc., Class A Shares* | 13,346 | ||||||||
| 7,242 | Werner Enterprises Inc. | 341,533 | ||||||||
| 4,055 | XPO Logistics Inc.* | 352,420 | ||||||||
| 2,027 | Yellow Corp.* | 12,344 | ||||||||
|
| |||||||||
| Total Road & Rail | 7,025,537 | |||||||||
|
| |||||||||
Trading Companies & Distributors — 1.2% | ||||||||||
| 45,104 | AerCap Holdings NV* | 2,432,459 | ||||||||
| 4,434 | Air Lease Corp., Class A Shares | 176,207 | ||||||||
| 713 | Alta Equipment Group Inc.* | 9,454 | ||||||||
| 1,656 | Applied Industrial Technologies Inc. | 147,069 | ||||||||
| 2,370 | Beacon Roofing Supply Inc.* | 122,008 | ||||||||
| 365 | BlueLinx Holdings Inc.* | 21,009 | ||||||||
| 1,717 | Boise Cascade Co. | 99,328 | ||||||||
| 663 | CAI International Inc. | 37,108 | ||||||||
| 603 | Custom Truck One Source Inc.*(a) | 5,168 | ||||||||
| 753 | DXP Enterprises Inc.* | 22,575 | ||||||||
| 210 | EVI Industries Inc.*(a) | 5,107 | ||||||||
| 32,052 | Fastenal Co. | 1,790,104 | ||||||||
| 1,452 | GATX Corp. | 133,119 | ||||||||
| 533 | Global Industrial Co. | 20,515 | ||||||||
| 1,736 | GMS Inc.* | 85,776 | ||||||||
| 1,319 | H&E Equipment Services Inc. | 44,912 | ||||||||
| 1,039 | Herc Holdings Inc.* | 136,577 | ||||||||
| 144 | Karat Packaging Inc.* | 3,380 | ||||||||
| 197 | Lawson Products Inc.* | 10,392 | ||||||||
| 1,016 | McGrath RentCorp | 70,897 | ||||||||
| 3,391 | MRC Global Inc.* | 27,806 | ||||||||
| 1,925 | MSC Industrial Direct Co., Inc., Class A Shares | 162,104 | ||||||||
| 4,690 | NOW Inc.* | 36,019 | ||||||||
| 1,723 | Rush Enterprises Inc., Class A Shares | 75,984 | ||||||||
| 288 | Rush Enterprises Inc., Class B Shares | 12,208 | ||||||||
| 6,117 | SiteOne Landscape Supply Inc.* | 1,224,012 | ||||||||
| 1,939 | Textainer Group Holdings Ltd.* | 64,414 | ||||||||
| 793 | Titan Machinery Inc.* | 22,775 | ||||||||
| 309 | Transcat Inc.* | 20,938 | ||||||||
| 2,749 | Triton International Ltd. | 150,425 | ||||||||
| 6,934 | Univar Solutions Inc.* | 163,712 | ||||||||
| 658 | Veritiv Corp.* | 59,003 | ||||||||
| 1,357 | Watsco Inc. | 377,816 | ||||||||
| 1,838 | WESCO International Inc.* | 215,083 | ||||||||
| 120 | Willis Lease Finance Corp.* | 4,518 | ||||||||
|
| |||||||||
| Total Trading Companies & Distributors | 7,989,981 | |||||||||
|
| |||||||||
Transportation Infrastructure — 0.0% | ||||||||||
| 3,048 | Macquarie Infrastructure Corp. | 121,463 | ||||||||
|
| |||||||||
| TOTAL INDUSTRIALS | 107,564,065 | |||||||||
|
| |||||||||
INFORMATION TECHNOLOGY — 18.5% | ||||||||||
Communications Equipment — 1.4% | ||||||||||
| 1,950 | ADTRAN Inc. | 40,287 | ||||||||
| 274 | Aviat Networks Inc.* | 9,711 | ||||||||
| 55,248 | CalAmp Corp.* | 626,512 | ||||||||
See Notes to Financial Statements.
94
| Schedules of Investments |
| (continued) |
| Small-Mid Cap Equity Fund | ||||||||||
| Shares/Units | Security | Value | ||||||||
INFORMATION TECHNOLOGY — 18.5% — (continued) | ||||||||||
Communications Equipment — 1.4% — (continued) | ||||||||||
| 2,343 | Calix Inc.* | $ | 109,184 | |||||||
| 368 | Cambium Networks Corp.* | 13,789 | ||||||||
| 1,434 | Casa Systems Inc.* | 10,095 | ||||||||
| 51,176 | Ciena Corp.* | 2,923,685 | ||||||||
| 468 | Clearfield Inc.* | 21,205 | ||||||||
| 8,387 | CommScope Holding Co., Inc.* | 132,515 | ||||||||
| 1,061 | Comtech Telecommunications Corp. | 27,077 | ||||||||
| 1,420 | Digi International Inc.* | 31,212 | ||||||||
| 734 | DZS Inc.* | 10,137 | ||||||||
| 1,700 | EchoStar Corp., Class A Shares* | 45,900 | ||||||||
| 43,776 | EMCORE Corp.* | 327,444 | ||||||||
| 5,076 | Extreme Networks Inc.* | 54,973 | ||||||||
| 2,492 | F5 Networks Inc.*(a) | 507,296 | ||||||||
| 3,661 | Harmonic Inc.* | 33,828 | ||||||||
| 100,338 | Infinera Corp.* | 849,863 | ||||||||
| 3,423 | Inseego Corp.*(a) | 28,753 | ||||||||
| 13,635 | Juniper Networks Inc. | 395,142 | ||||||||
| 659 | KVH Industries Inc.* | 6,966 | ||||||||
| 3,138 | Lumentum Holdings Inc.* | 271,876 | ||||||||
| 1,248 | NETGEAR Inc.* | 44,591 | ||||||||
| 2,887 | NetScout Systems Inc.* | 79,161 | ||||||||
| 1,406 | Plantronics Inc.* | 41,871 | ||||||||
| 7,772 | Radware Ltd.* | 266,424 | ||||||||
| 67,617 | Ribbon Communications Inc.*(a) | 441,539 | ||||||||
| 22,195 | ViaSat Inc.*(a) | 1,146,150 | ||||||||
| 62,294 | Viavi Solutions Inc.* | 1,014,769 | ||||||||
|
| |||||||||
| Total Communications Equipment | 9,511,955 | |||||||||
|
| |||||||||
Electronic Equipment, Instruments & Components — 2.6% | ||||||||||
| 294 | 908 Devices Inc.* | 10,584 | ||||||||
| 15,066 | Advanced Energy Industries Inc. | 1,358,652 | ||||||||
| 1,012 | Aeva Technologies Inc.* | 9,928 | ||||||||
| 1,778 | Akoustis Technologies Inc.* | 17,638 | ||||||||
| 15,736 | Amphenol Corp., Class A Shares | 1,205,850 | ||||||||
| 3,412 | Arlo Technologies Inc.* | 21,154 | ||||||||
| 3,049 | Arrow Electronics Inc.* | 369,600 | ||||||||
| 4,094 | Avnet Inc. | 165,643 | ||||||||
| 1,203 | Badger Meter Inc. | 128,829 | ||||||||
| 19,721 | Belden Inc. | 1,129,027 | ||||||||
| 1,447 | Benchmark Electronics Inc. | 39,112 | ||||||||
| 7,164 | Cognex Corp. | 634,874 | ||||||||
| 1,014 | Coherent Inc.* | 256,207 | ||||||||
| 1,435 | CTS Corp. | 50,340 | ||||||||
| 1,375 | Daktronics Inc.* | 8,374 | ||||||||
| 557 | ePlus Inc.* | 60,278 | ||||||||
| 1,578 | Fabrinet* | 162,566 | ||||||||
| 762 | FARO Technologies Inc.* | 52,532 | ||||||||
| 838 | Identiv Inc.* | 14,883 | ||||||||
| 9,195 | II-VI Inc.*(a) | 579,101 | ||||||||
| 1,440 | Insight Enterprises Inc.* | 148,162 | ||||||||
| 5,903 | IPG Photonics Corp.*(a) | 1,007,524 | ||||||||
| 1,907 | Iteris Inc.* | 10,870 | ||||||||
| 32,792 | Itron Inc.* | 2,754,856 | ||||||||
| 6,113 | Jabil Inc. | 377,661 | ||||||||
| 906 | Kimball Electronics Inc.* | 21,898 | ||||||||
See Notes to Financial Statements.
95
| Schedules of Investments |
| (continued) |
| Small-Mid Cap Equity Fund | ||||||||||
| Shares/Units | Security | Value | ||||||||
INFORMATION TECHNOLOGY — 18.5% — (continued) | ||||||||||
Electronic Equipment, Instruments & Components — 2.6% — (continued) | ||||||||||
| 50,569 | Knowles Corp.* | $ | 1,011,380 | |||||||
| 997 | Littelfuse Inc. | 284,544 | ||||||||
| 1,326 | Luna Innovations Inc.* | 14,281 | ||||||||
| 1,561 | Methode Electronics Inc. | 72,696 | ||||||||
| 6,521 | MicroVision Inc.*(a) | 96,054 | ||||||||
| 611 | Napco Security Technologies Inc.* | 23,908 | ||||||||
| 5,471 | National Instruments Corp. | 228,797 | ||||||||
| 1,747 | nLight Inc.* | 48,235 | ||||||||
| 1,458 | Novanta Inc.* | 223,395 | ||||||||
| 7,126 | OSI Systems Inc.* | 705,046 | ||||||||
| 1,190 | Ouster Inc.*(a) | 9,996 | ||||||||
| 976 | PAR Technology Corp.*(a) | 66,300 | ||||||||
| 492 | PC Connection Inc. | 23,818 | ||||||||
| 1,167 | Plexus Corp.*(a) | 107,166 | ||||||||
| 7,372 | Rogers Corp.* | 1,565,886 | ||||||||
| 2,644 | Sanmina Corp.* | 104,385 | ||||||||
| 1,015 | ScanSource Inc.* | 36,114 | ||||||||
| 1,728 | SYNNEX Corp. | 219,577 | ||||||||
| 3,048 | Teledyne Technologies Inc.* | 1,412,382 | ||||||||
| 4,370 | TTM Technologies Inc.* | 61,180 | ||||||||
| 2,888 | Velodyne Lidar Inc.*(a) | 19,061 | ||||||||
| 5,715 | Vishay Intertechnology Inc. | 125,559 | ||||||||
| 525 | Vishay Precision Group Inc.* | 19,619 | ||||||||
| 7,128 | Vontier Corp. | 259,245 | ||||||||
|
| |||||||||
| Total Electronic Equipment, Instruments & Components | 17,334,767 | |||||||||
|
| |||||||||
IT Services — 2.7% | ||||||||||
| 8,189 | Alliance Data Systems Corp. | 803,423 | ||||||||
| 5,444 | Amdocs Ltd. | 419,351 | ||||||||
| 2,010 | BigCommerce Holdings Inc.* | 119,675 | ||||||||
| 136 | BM Technologies Inc.* | 1,325 | ||||||||
| 1,715 | Brightcove Inc.* | 19,482 | ||||||||
| 2,385 | Cantaloupe Inc.* | 24,422 | ||||||||
| 642 | Cass Information Systems Inc. | 28,941 | ||||||||
| 1,779 | Concentrix Corp.* | 308,461 | ||||||||
| 239,367 | Conduent Inc.* | 1,747,379 | ||||||||
| 1,351 | CSG Systems International Inc. | 65,132 | ||||||||
| 527 | DigitalOcean Holdings Inc.* | 32,505 | ||||||||
| 10,656 | DXC Technology Co.* | 391,288 | ||||||||
| 9,397 | Euronet Worldwide Inc.* | 1,251,962 | ||||||||
| 2,474 | EVERTEC Inc. | 114,423 | ||||||||
| 1,954 | Evo Payments Inc., Class A Shares* | 49,710 | ||||||||
| 1,351 | ExlService Holdings Inc.* | 166,362 | ||||||||
| 4,383 | Fastly Inc., Class A Shares*(a) | 191,099 | ||||||||
| 4,655 | Gartner Inc.* | 1,437,185 | ||||||||
| 7,680 | Genpact Ltd. | 398,438 | ||||||||
| 1,637 | Globant SA* | 527,572 | ||||||||
| 714 | GreenBox POS*(a) | 6,962 | ||||||||
| 3,045 | GreenSky Inc., Class A Shares* | 24,208 | ||||||||
| 1,287 | Grid Dynamics Holdings Inc.* | 34,453 | ||||||||
| 1,042 | Hackett Group Inc. (The) | 20,423 | ||||||||
| 841 | I3 Verticals Inc., Class A Shares* | 24,313 | ||||||||
| 220 | IBEX Holdings Ltd.* | 3,956 | ||||||||
| 1,199 | International Money Express Inc.* | 21,870 | ||||||||
| 3,099 | Jack Henry & Associates Inc. | 546,602 | ||||||||
See Notes to Financial Statements.
96
| Schedules of Investments |
| (continued) |
| Small-Mid Cap Equity Fund | ||||||||||
| Shares/Units | Security | Value | ||||||||
INFORMATION TECHNOLOGY — 18.5% — (continued) | ||||||||||
IT Services — 2.7% — (continued) | ||||||||||
| 6,589 | Limelight Networks Inc.* | $ | 17,790 | |||||||
| 2,681 | LiveRamp Holdings Inc.* | 131,369 | ||||||||
| 2,582 | Maximus Inc. | 224,866 | ||||||||
| 3,168 | MoneyGram International Inc.* | 28,480 | ||||||||
| 2,211 | MongoDB Inc., Class A Shares* | 866,336 | ||||||||
| 3,263 | Okta Inc., Class A Shares* | 860,127 | ||||||||
| 3,312 | Paya Holdings Inc.* | 31,961 | ||||||||
| 12,733 | Paysafe Ltd.*(a) | 107,721 | ||||||||
| 1,344 | Perficient Inc.* | 160,232 | ||||||||
| 482 | Priority Technology Holdings Inc.* | 2,906 | ||||||||
| 2,205 | Rackspace Technology Inc.*(a) | 30,804 | ||||||||
| 3,155 | Repay Holdings Corp., Class A Shares* | 72,597 | ||||||||
| 13,169 | Sabre Corp.* | 147,888 | ||||||||
| 14,198 | Shift4 Payments Inc., Class A Shares* | 1,216,911 | ||||||||
| 1,438 | SolarWinds Corp. | 24,547 | ||||||||
| 675 | StarTek Inc.* | 4,097 | ||||||||
| 4,727 | Switch Inc., Class A Shares | 117,277 | ||||||||
| 779 | TTEC Holdings Inc. | 82,153 | ||||||||
| 379 | Tucows Inc., Class A Shares* | 28,088 | ||||||||
| 2,339 | Twilio Inc., Class A Shares* | 834,929 | ||||||||
| 81,313 | Unisys Corp.* | 1,968,588 | ||||||||
| 5,508 | Verra Mobility Corp., Class A Shares* | 85,429 | ||||||||
| 17,109 | Western Union Co. (The) | 370,239 | ||||||||
| 7,607 | WEX Inc.* | 1,396,417 | ||||||||
| 10,770 | WNS Holdings Ltd., ADR* | 893,264 | ||||||||
|
| |||||||||
| Total IT Services | 18,485,938 | |||||||||
|
| |||||||||
Semiconductors & Semiconductor Equipment — 3.3% | ||||||||||
| 2,129 | Allegro MicroSystems Inc.* | 63,976 | ||||||||
| 829 | Alpha & Omega Semiconductor Ltd.* | 24,082 | ||||||||
| 1,437 | Ambarella Inc.* | 148,830 | ||||||||
| 4,227 | Amkor Technology Inc. | 116,116 | ||||||||
| 785 | Atomera Inc.*(a) | 19,366 | ||||||||
| 1,348 | Axcelis Technologies Inc.* | 67,009 | ||||||||
| 1,631 | AXT Inc.* | 15,185 | ||||||||
| 28,106 | Brooks Automation Inc. | 2,387,886 | ||||||||
| 923 | CEVA Inc.* | 44,535 | ||||||||
| 2,456 | Cirrus Logic Inc.* | 205,493 | ||||||||
| 5,167 | CMC Materials Inc. | 685,248 | ||||||||
| 1,969 | Cohu Inc.* | 70,254 | ||||||||
| 4,837 | Cree Inc.*(a) | 411,048 | ||||||||
| 1,785 | Diodes Inc.* | 172,842 | ||||||||
| 986 | DSP Group Inc.* | 21,593 | ||||||||
| 5,515 | Enphase Energy Inc.* | 958,121 | ||||||||
| 11,460 | Entegris Inc.(a) | 1,376,804 | ||||||||
| 4,453 | First Solar Inc.* | 418,582 | ||||||||
| 3,328 | FormFactor Inc.* | 129,393 | ||||||||
| 1,150 | Ichor Holdings Ltd.* | 50,956 | ||||||||
| 5,771 | Impinj Inc.*(a) | 336,392 | ||||||||
| 3,194 | Kopin Corp.* | 18,781 | ||||||||
| 2,605 | Kulicke & Soffa Industries Inc. | 182,845 | ||||||||
| 5,600 | Lattice Semiconductor Corp.* | 347,872 | ||||||||
| 53,560 | MACOM Technology Solutions Holdings Inc.* | 3,251,628 | ||||||||
| 2,909 | MaxLinear Inc., Class A Shares* | 151,937 | ||||||||
| 2,531 | Meta Materials Inc.* | 11,769 | ||||||||
See Notes to Financial Statements.
97
| Schedules of Investments |
| (continued) |
| Small-Mid Cap Equity Fund | ||||||||||
| Shares/Units | Security | Value | ||||||||
INFORMATION TECHNOLOGY — 18.5% — (continued) | ||||||||||
Semiconductors & Semiconductor Equipment — 3.3% — (continued) | ||||||||||
| 7,638 | MKS Instruments Inc. | $ | 1,124,161 | |||||||
| 1,876 | Monolithic Power Systems Inc. | 928,489 | ||||||||
| 2,123 | NeoPhotonics Corp.* | 19,829 | ||||||||
| 213 | NVE Corp. | 14,955 | ||||||||
| 17,727 | ON Semiconductor Corp.* | 786,370 | ||||||||
| 2,011 | Onto Innovation Inc.* | 149,075 | ||||||||
| 1,249 | PDF Solutions Inc.* | 28,127 | ||||||||
| 2,472 | Photronics Inc.* | 37,253 | ||||||||
| 2,498 | Power Integrations Inc.(a) | 271,383 | ||||||||
| 65,776 | Rambus Inc.*(a) | 1,565,469 | ||||||||
| 11,259 | Semtech Corp.* | 787,229 | ||||||||
| 1,833 | Silicon Laboratories Inc.*(a) | 288,917 | ||||||||
| 15,760 | Silicon Motion Technology Corp., ADR(a) | 1,176,642 | ||||||||
| 531 | SiTime Corp.* | 113,018 | ||||||||
| 316 | SkyWater Technology Inc.* | 10,548 | ||||||||
| 16,872 | SMART Global Holdings Inc.* | 817,617 | ||||||||
| 3,445 | SunPower Corp., Class A Shares*(a) | 74,240 | ||||||||
| 1,454 | Synaptics Inc.*(a) | 275,940 | ||||||||
| 1,791 | Ultra Clean Holdings Inc.* | 82,816 | ||||||||
| 1,797 | Universal Display Corp. | 374,836 | ||||||||
| 62,531 | Veeco Instruments Inc.*(a) | 1,425,081 | ||||||||
|
| |||||||||
| Total Semiconductors & Semiconductor Equipment | 22,040,538 | |||||||||
|
| |||||||||
Software — 7.8% | ||||||||||
| 4,388 | 8x8 Inc.* | 105,970 | ||||||||
| 2,594 | A10 Networks Inc.* | 36,031 | ||||||||
| 36,473 | ACI Worldwide Inc.* | 1,175,525 | ||||||||
| 815 | Agilysys Inc.* | 46,316 | ||||||||
| 1,952 | Alarm.com Holdings Inc.* | 164,612 | ||||||||
| 280 | Alkami Technology Inc.* | 7,997 | ||||||||
| 1,858 | Altair Engineering Inc., Class A Shares* | 137,473 | ||||||||
| 2,497 | Alteryx Inc., Class A Shares* | 184,703 | ||||||||
| 1,307 | American Software Inc., Class A Shares | 33,159 | ||||||||
| 5,824 | Anaplan Inc.* | 349,324 | ||||||||
| 7,808 | ANSYS Inc.* | 2,852,731 | ||||||||
| 768 | Appfolio Inc., Class A Shares* | 90,701 | ||||||||
| 1,661 | Appian Corp., Class A Shares*(a) | 178,059 | ||||||||
| 3,042 | Asana Inc., Class A Shares* | 229,823 | ||||||||
| 9,694 | Aspen Technology Inc.* | 1,255,373 | ||||||||
| 3,200 | Atlassian Corp. PLC, Class A Shares* | 1,174,592 | ||||||||
| 3,545 | Avalara Inc.* | 637,036 | ||||||||
| 3,402 | Avaya Holdings Corp.*(a) | 68,618 | ||||||||
| 1,035 | Benefitfocus Inc.* | 12,492 | ||||||||
| 5,585 | Bentley Systems Inc., Class B Shares(a) | 360,177 | ||||||||
| 3,138 | Bill.com Holdings Inc.*(a) | 861,036 | ||||||||
| 43,623 | Black Knight Inc.* | 3,300,952 | ||||||||
| 1,994 | Blackbaud Inc.* | 138,962 | ||||||||
| 26,778 | Blackline Inc.* | 2,921,480 | ||||||||
| 26,866 | Bottomline Technologies de Inc.* | 1,135,626 | ||||||||
| 60,063 | Box Inc., Class A Shares* | 1,548,424 | ||||||||
| 1,938 | BTRS Holdings Inc.* | 21,144 | ||||||||
| 762 | C3.ai Inc., Class A Shares*(a) | 39,273 | ||||||||
| 5,053 | CDK Global Inc. | 210,205 | ||||||||
| 1,562 | Cerence Inc.*(a) | 169,383 | ||||||||
| 5,409 | Ceridian HCM Holding Inc.* | 607,701 | ||||||||
See Notes to Financial Statements.
98
| Schedules of Investments |
| (continued) |
| Small-Mid Cap Equity Fund | ||||||||||
| Shares/Units | Security | Value | ||||||||
INFORMATION TECHNOLOGY — 18.5% — (continued) | ||||||||||
Software — 7.8% — (continued) | ||||||||||
| 1,193 | ChannelAdvisor Corp.* | $ | 30,565 | |||||||
| 1,345 | Cleanspark Inc.* | 18,561 | ||||||||
| 9,847 | Cloudera Inc.* | 156,863 | ||||||||
| 66,668 | Cognyte Software Ltd.* | 1,832,037 | ||||||||
| 1,746 | CommVault Systems Inc.* | 141,374 | ||||||||
| 2,610 | Cornerstone OnDemand Inc.* | 149,553 | ||||||||
| 4,113 | Coupa Software Inc.* | 1,006,904 | ||||||||
| 4,168 | Crowdstrike Holdings Inc., Class A Shares* | 1,171,208 | ||||||||
| 1,014 | Datto Holding Corp.* | 25,857 | ||||||||
| 515 | Digimarc Corp.* | 15,059 | ||||||||
| 3,483 | Digital Turbine Inc.* | 203,581 | ||||||||
| 2,661 | Dolby Laboratories Inc., Class A Shares | 263,732 | ||||||||
| 1,138 | Domo Inc., Class B Shares* | 101,851 | ||||||||
| 627 | DoubleVerify Holdings Inc.* | 22,779 | ||||||||
| 12,788 | Dropbox Inc., Class A Shares* | 405,507 | ||||||||
| 2,990 | Duck Creek Technologies Inc.* | 139,424 | ||||||||
| 7,714 | Dynatrace Inc.* | 530,183 | ||||||||
| 1,702 | E2open Parent Holdings Inc.* | 20,322 | ||||||||
| 1,224 | Ebix Inc. | 35,227 | ||||||||
| 816 | eGain Corp.* | 9,612 | ||||||||
| 2,834 | Elastic NV* | 452,165 | ||||||||
| 2,245 | Envestnet Inc.* | 179,308 | ||||||||
| 1,557 | Everbridge Inc.* | 244,402 | ||||||||
| 1,168 | Fair Isaac Corp.* | 536,976 | ||||||||
| 81,783 | FireEye Inc.* | 1,487,633 | ||||||||
| 2,795 | Five9 Inc.* | 442,253 | ||||||||
| 1,408 | GTY Technology Holdings Inc.* | 10,391 | ||||||||
| 12,124 | Guidewire Software Inc.* | 1,436,209 | ||||||||
| 315 | Intelligent Systems Corp.* | 12,156 | ||||||||
| 1,273 | InterDigital Inc. | 91,796 | ||||||||
| 1,790 | j2 Global Inc.* | 246,483 | ||||||||
| 2,189 | Jamf Holding Corp.* | 76,943 | ||||||||
| 2,120 | JFrog Ltd.*(a) | 81,493 | ||||||||
| 2,644 | LivePerson Inc.* | 169,480 | ||||||||
| 2,661 | Manhattan Associates Inc.* | 433,716 | ||||||||
| 3,931 | Marathon Digital Holdings Inc.*(a) | 159,559 | ||||||||
| 1,915 | McAfee Corp., Class A Shares | 50,862 | ||||||||
| 4,293 | Medallia Inc.* | 144,975 | ||||||||
| 332 | MicroStrategy Inc., Class A Shares*(a) | 230,508 | ||||||||
| 22,128 | Mimecast Ltd.* | 1,544,756 | ||||||||
| 1,743 | Mitek Systems Inc.* | 38,991 | ||||||||
| 1,404 | Model N Inc.* | 47,610 | ||||||||
| 5,456 | Momentive Global Inc.* | 106,992 | ||||||||
| 1,438 | N-Able Inc.* | 19,456 | ||||||||
| 1,959 | nCino Inc.* | 121,478 | ||||||||
| 46,232 | NCR Corp.* | 1,963,935 | ||||||||
| 9,579 | New Relic Inc.* | 766,033 | ||||||||
| 22,996 | NortonLifeLock Inc. | 610,774 | ||||||||
| 11,924 | Nuance Communications Inc.* | 656,416 | ||||||||
| 8,109 | Nutanix Inc., Class A Shares* | 299,303 | ||||||||
| 394 | ON24 Inc.* | 8,908 | ||||||||
| 31,823 | OneSpan Inc.* | 613,229 | ||||||||
| 3,326 | PagerDuty Inc.* | 142,353 | ||||||||
| 1,557 | Paylocity Holding Corp.* | 419,144 | ||||||||
| 1,699 | Pegasystems Inc. | 233,833 | ||||||||
See Notes to Financial Statements.
99
| Schedules of Investments |
| (continued) |
| Small-Mid Cap Equity Fund | ||||||||||
| Shares/Units | Security | Value | ||||||||
INFORMATION TECHNOLOGY — 18.5% — (continued) | ||||||||||
Software — 7.8% — (continued) | ||||||||||
| 1,785 | Ping Identity Holding Corp.* | $ | 46,321 | |||||||
| 1,816 | Progress Software Corp. | 84,553 | ||||||||
| 6,089 | Proofpoint Inc.*(b) | 1,071,055 | ||||||||
| 20,478 | PROS Holdings Inc.*(a) | 885,469 | ||||||||
| 4,416 | PTC Inc.* | 581,411 | ||||||||
| 2,299 | Q2 Holdings Inc.* | 202,519 | ||||||||
| 509 | QAD Inc., Class A Shares | 44,288 | ||||||||
| 1,454 | Qualys Inc.* | 170,671 | ||||||||
| 2,307 | Rapid7 Inc.* | 280,347 | ||||||||
| 1,289 | Rekor Systems Inc.*(a) | 14,076 | ||||||||
| 1,777 | Rimini Street Inc.* | 16,970 | ||||||||
| 3,471 | Riot Blockchain Inc.*(a) | 129,538 | ||||||||
| 3,728 | SailPoint Technologies Holding Inc.* | 174,694 | ||||||||
| 1,273 | Sapiens International Corp. NV | 36,331 | ||||||||
| 552 | SecureWorks Corp., Class A Shares* | 11,294 | ||||||||
| 355 | ShotSpotter Inc.* | 14,140 | ||||||||
| 17,783 | Smartsheet Inc., Class A Shares* | 1,414,993 | ||||||||
| 1,796 | Smith Micro Software Inc.* | 8,962 | ||||||||
| 1,876 | Sprout Social Inc., Class A Shares* | 228,122 | ||||||||
| 1,480 | SPS Commerce Inc.* | 200,584 | ||||||||
| 3,351 | Sumo Logic Inc.* | 69,868 | ||||||||
| 676 | Telos Corp.* | 22,308 | ||||||||
| 3,852 | Tenable Holdings Inc.* | 170,913 | ||||||||
| 4,515 | Teradata Corp.*(a) | 246,925 | ||||||||
| 1,949 | Tyler Technologies Inc.* | 946,629 | ||||||||
| 1,138 | Upland Software Inc.* | 44,359 | ||||||||
| 4,367 | Varonis Systems Inc., Class B Shares* | 301,367 | ||||||||
| 26,574 | Verint Systems Inc.*(a) | 1,186,263 | ||||||||
| 1,168 | Veritone Inc.* | 24,376 | ||||||||
| 490 | Viant Technology Inc., Class A Shares* | 6,737 | ||||||||
| 2,520 | VirnetX Holding Corp.* | 11,315 | ||||||||
| 33,270 | Vonage Holdings Corp.* | 469,107 | ||||||||
| 4,774 | Workiva Inc., Class A Shares* | 669,649 | ||||||||
| 101,315 | Xperi Holding Corp. | 2,165,102 | ||||||||
| 4,516 | Yext Inc.* | 61,056 | ||||||||
| 4,920 | Zendesk Inc.* | 608,112 | ||||||||
| 2,128 | Zix Corp.* | 16,471 | ||||||||
| 4,404 | Zuora Inc., Class A Shares* | 74,780 | ||||||||
|
| |||||||||
| Total Software | 53,127,291 | |||||||||
|
| |||||||||
Technology Hardware, Storage & Peripherals — 0.7% | ||||||||||
| 5,005 | 3D Systems Corp.* | 152,352 | ||||||||
| 1,489 | Avid Technology Inc.* | 38,431 | ||||||||
| 1,103 | Corsair Gaming Inc.*(a) | 31,932 | ||||||||
| 50,023 | Diebold Nixdorf Inc.* | 544,250 | ||||||||
| 1,829 | Eastman Kodak Co.* | 13,315 | ||||||||
| 59,962 | Pure Storage Inc., Class A Shares* | 1,548,818 | ||||||||
| 157,652 | Quantum Corp.* | 983,748 | ||||||||
| 47,442 | Stratasys Ltd.*(a) | 999,129 | ||||||||
| 1,764 | Super Micro Computer Inc.* | 64,457 | ||||||||
| 602 | Turtle Beach Corp.* | 17,103 | ||||||||
| 6,584 | Xerox Holdings Corp. | 148,206 | ||||||||
|
| |||||||||
| Total Technology Hardware, Storage & Peripherals | 4,541,741 | |||||||||
|
| |||||||||
| TOTAL INFORMATION TECHNOLOGY | 125,042,230 | |||||||||
|
| |||||||||
See Notes to Financial Statements.
100
| Schedules of Investments |
| (continued) |
| Small-Mid Cap Equity Fund | ||||||||||
| Shares/Units | Security | Value | ||||||||
MATERIALS — 5.1% | ||||||||||
Chemicals — 2.0% | ||||||||||
| 1,175 | AdvanSix Inc.* | $ | 42,888 | |||||||
| 2,795 | Albemarle Corp. | 661,688 | ||||||||
| 1,145 | American Vanguard Corp. | 17,553 | ||||||||
| 6,884 | Amyris Inc.* | 103,604 | ||||||||
| 2,275 | Ashland Global Holdings Inc.(a) | 207,275 | ||||||||
| 22,733 | Avient Corp. | 1,184,162 | ||||||||
| 36,488 | Axalta Coating Systems Ltd.* | 1,114,344 | ||||||||
| 1,330 | Balchem Corp. | 186,759 | ||||||||
| 2,314 | Cabot Corp. | 123,568 | ||||||||
| 8,981 | CF Industries Holdings Inc. | 407,917 | ||||||||
| 283 | Chase Corp. | 32,403 | ||||||||
| 6,837 | Chemours Co. (The) | 229,108 | ||||||||
| 2,824 | Danimer Scientific Inc.*(a) | 55,181 | ||||||||
| 2,049 | Diversey Holdings Ltd.* | 35,796 | ||||||||
| 11,476 | Ecolab Inc. | 2,586,231 | ||||||||
| 2,066 | Ecovyst Inc. | 26,879 | ||||||||
| 9,588 | Element Solutions Inc. | 217,935 | ||||||||
| 3,573 | Ferro Corp.* | 74,318 | ||||||||
| 1,005 | FutureFuel Corp. | 8,050 | ||||||||
| 6,482 | GCP Applied Technologies Inc.* | 154,531 | ||||||||
| 768 | Hawkins Inc. | 29,092 | ||||||||
| 2,143 | HB Fuller Co. | 144,803 | ||||||||
| 8,727 | Huntsman Corp. | 230,655 | ||||||||
| 1,654 | Ingevity Corp.* | 132,965 | ||||||||
| 1,012 | Innospec Inc. | 94,723 | ||||||||
| 450 | Intrepid Potash Inc.* | 13,955 | ||||||||
| 890 | Koppers Holdings Inc.* | 29,281 | ||||||||
| 20,479 | Kraton Corp.* | 862,575 | ||||||||
| 995 | Kronos Worldwide Inc. | 13,174 | ||||||||
| 6,061 | Livent Corp.* | 150,737 | ||||||||
| 4,067 | Marrone Bio Innovations Inc.* | 4,067 | ||||||||
| 1,381 | Minerals Technologies Inc. | 108,602 | ||||||||
| 14,329 | Mosaic Co. (The) | 461,107 | ||||||||
| 276 | NewMarket Corp. | 96,525 | ||||||||
| 6,081 | Olin Corp. | 303,077 | ||||||||
| 2,448 | Orion Engineered Carbons SA* | 43,256 | ||||||||
| 1,347 | PureCycle Technologies Inc.*(a) | 19,814 | ||||||||
| 552 | Quaker Chemical Corp. | 143,034 | ||||||||
| 2,679 | Rayonier Advanced Materials Inc.* | 18,914 | ||||||||
| 5,294 | RPM International Inc. | 435,643 | ||||||||
| 1,702 | Scotts Miracle-Gro Co. (The) | 266,925 | ||||||||
| 1,810 | Sensient Technologies Corp. | 157,199 | ||||||||
| 931 | Stepan Co. | 109,448 | ||||||||
| 1,116 | Tredegar Corp. | 14,820 | ||||||||
| 1,627 | Trinseo SA | 84,490 | ||||||||
| 57,268 | Tronox Holdings PLC, Class A Shares | 1,210,073 | ||||||||
| 115 | Valhi Inc. | 2,728 | ||||||||
| 7,685 | Valvoline Inc. | 231,780 | ||||||||
| 1,381 | Westlake Chemical Corp. | 120,630 | ||||||||
| 2,326 | WR Grace & Co. | 161,983 | ||||||||
| 761 | Zymergen Inc.*(a) | 9,984 | ||||||||
|
| |||||||||
| Total Chemicals | 13,176,249 | |||||||||
|
| |||||||||
Construction Materials — 0.5% | ||||||||||
| 1,707 | Eagle Materials Inc. | 267,726 | ||||||||
See Notes to Financial Statements.
101
| Schedules of Investments |
| (continued) |
| Small-Mid Cap Equity Fund | ||||||||||
| Shares/Units | Security | Value | ||||||||
MATERIALS — 5.1% — (continued) | ||||||||||
Construction Materials — 0.5% (continued) | ||||||||||
| 1,174 | Forterra Inc.* | $ | 27,049 | |||||||
| 4,867 | Summit Materials Inc., Class A Shares* | 163,872 | ||||||||
| 100 | United States Lime & Minerals Inc. | 14,609 | ||||||||
| 16,927 | Vulcan Materials Co. | 3,147,237 | ||||||||
|
| |||||||||
| Total Construction Materials | 3,620,493 | |||||||||
|
| |||||||||
Containers & Packaging — 1.6% | ||||||||||
| 12,231 | AptarGroup Inc. | 1,648,739 | ||||||||
| 765 | Ardagh Group SA, Class A Shares | 20,097 | ||||||||
| 12,062 | Avery Dennison Corp. | 2,718,654 | ||||||||
| 5,677 | Berry Global Group Inc.* | 381,324 | ||||||||
| 27,021 | Crown Holdings Inc. | 2,966,636 | ||||||||
| 11,650 | Graphic Packaging Holding Co. | 239,058 | ||||||||
| 1,095 | Greif Inc., Class A Shares | 69,335 | ||||||||
| 197 | Greif Inc., Class B Shares | 12,115 | ||||||||
| 1,546 | Myers Industries Inc. | 35,249 | ||||||||
| 6,844 | O-I Glass Inc.* | 103,550 | ||||||||
| 3,893 | Packaging Corp. of America | 590,568 | ||||||||
| 1,728 | Pactiv Evergreen Inc. | 23,760 | ||||||||
| 34,769 | Ranpak Holdings Corp., Class A Shares* | 1,067,408 | ||||||||
| 6,302 | Sealed Air Corp. | 384,611 | ||||||||
| 11,814 | Silgan Holdings Inc.(a) | 501,268 | ||||||||
| 4,317 | Sonoco Products Co. | 281,900 | ||||||||
| 324 | UFP Technologies Inc.* | 22,677 | ||||||||
|
| |||||||||
| Total Containers & Packaging | 11,066,949 | |||||||||
|
| |||||||||
Metals & Mining — 0.9% | ||||||||||
| 78,366 | Alamos Gold Inc., Class A Shares | 619,091 | ||||||||
| 7,747 | Alcoa Corp.* | 343,734 | ||||||||
| 5,493 | Allegheny Technologies Inc.* | 98,105 | ||||||||
| 4,548 | Arconic Corp.* | 156,861 | ||||||||
| 2,080 | Carpenter Technology Corp.(a) | 69,368 | ||||||||
| 2,134 | Century Aluminum Co.* | 27,358 | ||||||||
| 94,168 | Cleveland-Cliffs Inc.*(a) | 2,210,123 | ||||||||
| 9,957 | Coeur Mining Inc.* | 70,197 | ||||||||
| 4,950 | Commercial Metals Co. | 161,469 | ||||||||
| 1,392 | Compass Minerals International Inc. | 93,167 | ||||||||
| 5,019 | Constellium SE, Class A Shares* | 101,484 | ||||||||
| 3,346 | Ferroglobe Representation & Warranty Insurance Trust*#(b)(c) | — | ||||||||
| 1,424 | Gatos Silver Inc.* | 20,420 | ||||||||
| 561 | Haynes International Inc. | 22,019 | ||||||||
| 21,770 | Hecla Mining Co. | 133,885 | ||||||||
| 691 | Kaiser Aluminum Corp. | 87,246 | ||||||||
| 913 | Materion Corp. | 66,676 | ||||||||
| 3,002 | MP Materials Corp.*(a) | 100,777 | ||||||||
| 10,399 | Novagold Resources Inc.* | 75,185 | ||||||||
| 372 | Olympic Steel Inc. | 10,141 | ||||||||
| 1,075 | Perpetua Resources Corp.* | 5,450 | ||||||||
| 1,064 | PolyMet Mining Corp.* | 3,586 | ||||||||
| 2,628 | Reliance Steel & Aluminum Co. | 394,305 | ||||||||
| 2,760 | Royal Gold Inc. | 307,271 | ||||||||
| 726 | Ryerson Holding Corp. | 16,807 | ||||||||
| 1,067 | Schnitzer Steel Industries Inc., Class A Shares | 50,480 | ||||||||
| 8,343 | Steel Dynamics Inc. | 563,069 | ||||||||
| 3,583 | SunCoke Energy Inc. | 24,902 | ||||||||
See Notes to Financial Statements.
102
| Schedules of Investments |
| (continued) |
| Small-Mid Cap Equity Fund | ||||||||||
| Shares/Units | Security | Value | ||||||||
MATERIALS — 5.1% — (continued) | ||||||||||
Metals & Mining — 0.5% (continued) | ||||||||||
| 1,929 | TimkenSteel Corp.* | $ | 26,389 | |||||||
| 11,056 | United States Steel Corp. | 295,748 | ||||||||
| 2,101 | Warrior Met Coal Inc. | 47,041 | ||||||||
| 1,430 | Worthington Industries Inc. | 82,868 | ||||||||
|
| |||||||||
| Total Metals & Mining | 6,285,222 | |||||||||
|
| |||||||||
Paper & Forest Products — 0.1% | ||||||||||
| 684 | Clearwater Paper Corp.* | 22,223 | ||||||||
| 2,150 | Domtar Corp.* | 117,884 | ||||||||
| 1,760 | Glatfelter Corp. | 27,808 | ||||||||
| 4,230 | Louisiana-Pacific Corp. | 268,351 | ||||||||
| 718 | Neenah Inc. | 36,180 | ||||||||
| 1,295 | Schweitzer-Mauduit International Inc. | 49,560 | ||||||||
| 1,199 | Verso Corp., Class A Shares | 22,841 | ||||||||
|
| |||||||||
| Total Paper & Forest Products | 544,847 | |||||||||
|
| |||||||||
| TOTAL MATERIALS | 34,693,760 | |||||||||
|
| |||||||||
REAL ESTATE — 6.5% | ||||||||||
Equity Real Estate Investment Trusts (REITs) — 6.0% | ||||||||||
| 3,486 | Acadia Realty Trust | 73,973 | ||||||||
| 2,829 | Agree Realty Corp. | 210,902 | ||||||||
| 2,918 | Alexander & Baldwin Inc. | 60,928 | ||||||||
| 88 | Alexander’s Inc. | 23,434 | ||||||||
| 31,825 | American Assets Trust Inc. | 1,267,271 | ||||||||
| 5,693 | American Campus Communities Inc.(a) | 289,489 | ||||||||
| 4,760 | American Finance Trust Inc. | 41,031 | ||||||||
| 11,636 | American Homes 4 Rent, Class A Shares | 488,014 | ||||||||
| 10,590 | Americold Realty Trust | 389,077 | ||||||||
| 6,549 | Apartment Income REIT Corp. | 332,820 | ||||||||
| 6,354 | Apartment Investment & Management Co., Class A Shares | 45,622 | ||||||||
| 8,670 | Apple Hospitality REIT Inc. | 128,143 | ||||||||
| 2,525 | Armada Hoffler Properties Inc. | 33,911 | ||||||||
| 443 | Ashford Hospitality Trust Inc.* | 6,844 | ||||||||
| 11,198 | Boston Properties Inc.(a) | 1,265,262 | ||||||||
| 1,765 | Braemar Hotels & Resorts Inc.* | 8,896 | ||||||||
| 7,051 | Brandywine Realty Trust | 97,868 | ||||||||
| 12,298 | Brixmor Property Group Inc. | 288,388 | ||||||||
| 6,023 | Broadstone Net Lease Inc., Class A Shares(a) | 165,030 | ||||||||
| 474 | BRT Apartments Corp. | 9,205 | ||||||||
| 3,957 | Camden Property Trust | 593,708 | ||||||||
| 3,990 | CareTrust REIT Inc. | 87,740 | ||||||||
| 1,948 | CatchMark Timber Trust Inc., Class A Shares | 22,480 | ||||||||
| 567 | Centerspace | 57,369 | ||||||||
| 1,875 | Chatham Lodging Trust* | 22,500 | ||||||||
| 1,709 | City Office REIT Inc. | 27,293 | ||||||||
| 586 | Clipper Realty Inc. | 4,946 | ||||||||
| 4,715 | Columbia Property Trust Inc. | 78,835 | ||||||||
| 950 | Community Healthcare Trust Inc. | 46,084 | ||||||||
| 1,600 | CorePoint Lodging Inc.* | 23,136 | ||||||||
| 1,799 | CoreSite Realty Corp. | 266,918 | ||||||||
| 4,650 | Corporate Office Properties Trust | 131,037 | ||||||||
| 27,392 | Cousins Properties Inc. | 1,056,235 | ||||||||
| 241 | CTO Realty Growth Inc. | 13,518 | ||||||||
| 8,439 | CubeSmart | 451,486 | ||||||||
| 5,148 | CyrusOne Inc. | 396,293 | ||||||||
See Notes to Financial Statements.
103
| Schedules of Investments |
| (continued) |
| Small-Mid Cap Equity Fund | ||||||||||
| Shares/Units | Security | Value | ||||||||
REAL ESTATE — 6.5% — (continued) | ||||||||||
Equity Real Estate Investment Trusts (REITs) — 6.0% — (continued) | ||||||||||
| 8,564 | DiamondRock Hospitality Co.* | $ | 77,419 | |||||||
| 19,741 | DigitalBridge Group Inc.*(a) | 136,213 | ||||||||
| 10,165 | Diversified Healthcare Trust | 38,119 | ||||||||
| 7,049 | Douglas Emmett Inc. | 232,687 | ||||||||
| 3,475 | Easterly Government Properties Inc., Class A Shares | 74,261 | ||||||||
| 1,637 | EastGroup Properties Inc. | 295,086 | ||||||||
| 5,898 | Empire State Realty Trust Inc., Class A Shares | 60,572 | ||||||||
| 3,163 | EPR Properties(a) | 160,522 | ||||||||
| 157,711 | Equity Commonwealth | 4,154,108 | ||||||||
| 7,276 | Equity LifeStyle Properties Inc. | 618,969 | ||||||||
| 4,821 | Essential Properties Realty Trust Inc. | 156,249 | ||||||||
| 1,041 | Farmland Partners Inc. | 12,752 | ||||||||
| 3,244 | Federal Realty Investment Trust | 395,022 | ||||||||
| 5,421 | First Industrial Realty Trust Inc. | 303,522 | ||||||||
| 3,147 | Four Corners Property Trust Inc. | 90,036 | ||||||||
| 4,521 | Franklin Street Properties Corp. | 21,701 | ||||||||
| 9,248 | Gaming and Leisure Properties Inc. | 455,926 | ||||||||
| 4,864 | GEO Group Inc. (The) | 37,696 | ||||||||
| 1,615 | Getty Realty Corp. | 51,082 | ||||||||
| 1,498 | Gladstone Commercial Corp. | 33,900 | ||||||||
| 1,014 | Gladstone Land Corp. | 23,880 | ||||||||
| 2,304 | Global Medical REIT Inc. | 35,528 | ||||||||
| 3,921 | Global Net Lease Inc. | 66,657 | ||||||||
| 63,547 | Healthcare Realty Trust Inc. | 1,908,316 | ||||||||
| 9,047 | Healthcare Trust of America Inc., Class A Shares | 274,395 | ||||||||
| 1,330 | Hersha Hospitality Trust, Class A Shares* | 12,475 | ||||||||
| 4,269 | Highwoods Properties Inc. | 195,051 | ||||||||
| 29,235 | Host Hotels & Resorts Inc.* | 484,132 | ||||||||
| 6,092 | Hudson Pacific Properties Inc.(a) | 160,707 | ||||||||
| 4,131 | Independence Realty Trust Inc. | 84,603 | ||||||||
| 182 | Indus Realty Trust Inc. | 12,760 | ||||||||
| 2,709 | Industrial Logistics Properties Trust | 74,308 | ||||||||
| 979 | Innovative Industrial Properties Inc., Class A Shares | 240,746 | ||||||||
| 12,006 | Iron Mountain Inc. | 573,286 | ||||||||
| 2,919 | iStar Inc.(a) | 77,208 | ||||||||
| 30,886 | JBG SMITH Properties | 930,595 | ||||||||
| 4,881 | Kilroy Realty Corp.(a) | 320,438 | ||||||||
| 24,382 | Kimco Realty Corp. | 531,284 | ||||||||
| 3,435 | Kite Realty Group Trust | 69,593 | ||||||||
| 3,575 | Lamar Advertising Co., Class A Shares | 406,942 | ||||||||
| 11,388 | Lexington Realty Trust(a) | 154,080 | ||||||||
| 3,199 | Life Storage Inc. | 398,084 | ||||||||
| 1,565 | LTC Properties Inc. | 54,008 | ||||||||
| 8,437 | Macerich Co. (The)(a) | 144,104 | ||||||||
| 3,571 | Mack-Cali Realty Corp.* | 63,849 | ||||||||
| 24,341 | Medical Properties Trust Inc. | 498,504 | ||||||||
| 24,902 | Monmouth Real Estate Investment Corp. | 472,640 | ||||||||
| 1,799 | National Health Investors Inc. | 107,616 | ||||||||
| 7,262 | National Retail Properties Inc. | 345,744 | ||||||||
| 3,216 | National Storage Affiliates Trust | 184,116 | ||||||||
| 1,598 | NETSTREIT Corp. | 41,324 | ||||||||
| 3,628 | New Senior Investment Group Inc. | 31,672 | ||||||||
| 913 | NexPoint Residential Trust Inc. | 59,153 | ||||||||
| 1,967 | Office Properties Income Trust | 52,184 | ||||||||
See Notes to Financial Statements.
104
| Schedules of Investments |
| (continued) |
| Small-Mid Cap Equity Fund | ||||||||||
| Shares/Units | Security | Value | ||||||||
REAL ESTATE — 6.5% — (continued) | ||||||||||
Equity Real Estate Investment Trusts (REITs) — 6.0% — (continued) | ||||||||||
| 9,764 | Omega Healthcare Investors Inc. | $ | 327,387 | |||||||
| 702 | One Liberty Properties Inc. | 22,352 | ||||||||
| 5,994 | Outfront Media Inc.* | 148,411 | ||||||||
| 7,779 | Paramount Group Inc. | 68,922 | ||||||||
| 9,746 | Park Hotels & Resorts Inc.* | 186,538 | ||||||||
| 5,345 | Pebblebrook Hotel Trust | 117,750 | ||||||||
| 9,117 | Physicians Realty Trust | 168,756 | ||||||||
| 5,124 | Piedmont Office Realty Trust Inc., Class A Shares | 91,310 | ||||||||
| 1,188 | Plymouth Industrial REIT Inc. | 27,989 | ||||||||
| 483 | Postal Realty Trust Inc., Class A Shares | 9,443 | ||||||||
| 2,725 | PotlatchDeltic Corp. | 141,564 | ||||||||
| 2,072 | Preferred Apartment Communities Inc. | 25,859 | ||||||||
| 7,325 | PS Business Parks Inc. | 1,151,710 | ||||||||
| 25,170 | QTS Realty Trust Inc., Class A Shares | 1,962,757 | ||||||||
| 5,724 | Rayonier Inc. | 210,529 | ||||||||
| 7,014 | Regency Centers Corp. | 481,301 | ||||||||
| 4,786 | Retail Opportunity Investments Corp. | 86,531 | ||||||||
| 8,866 | Retail Properties of America Inc., Class A Shares | 117,208 | ||||||||
| 784 | Retail Value Inc. | 19,600 | ||||||||
| 5,620 | Rexford Industrial Realty Inc. | 348,047 | ||||||||
| 6,738 | RLJ Lodging Trust | 97,229 | ||||||||
| 3,286 | RPT Realty | 42,521 | ||||||||
| 2,213 | Ryman Hospitality Properties Inc.* | 183,834 | ||||||||
| 8,869 | Sabra Health Care REIT Inc. | 141,904 | ||||||||
| 789 | Safehold Inc. | 70,702 | ||||||||
| 478 | Saul Centers Inc. | 22,026 | ||||||||
| 10,076 | SBA Communications Corp., Class A Shares | 3,616,982 | ||||||||
| 1,428 | Seritage Growth Properties, Class A Shares* | 23,091 | ||||||||
| 6,767 | Service Properties Trust | 77,347 | ||||||||
| 7,102 | SITE Centers Corp. | 114,413 | ||||||||
| 2,911 | SL Green Realty Corp.(a) | 204,003 | ||||||||
| 31,365 | Spirit Realty Capital Inc. | 1,623,766 | ||||||||
| 12,847 | STAG Industrial Inc. | 542,786 | ||||||||
| 10,287 | STORE Capital Corp. | 371,052 | ||||||||
| 4,154 | Summit Hotel Properties Inc.* | 38,715 | ||||||||
| 8,853 | Sunstone Hotel Investors Inc.* | 102,606 | ||||||||
| 4,080 | Tanger Factory Outlet Centers Inc.(a) | 68,218 | ||||||||
| 2,904 | Terreno Realty Corp. | 194,016 | ||||||||
| 1,646 | UMH Properties Inc. | 39,010 | ||||||||
| 7,955 | Uniti Group Inc. | 103,972 | ||||||||
| 507 | Universal Health Realty Income Trust | 30,030 | ||||||||
| 4,769 | Urban Edge Properties | 90,325 | ||||||||
| 1,315 | Urstadt Biddle Properties Inc., Class A Shares | 25,090 | ||||||||
| 9,593 | VEREIT Inc. | 484,734 | ||||||||
| 22,465 | VICI Properties Inc.(a) | 694,393 | ||||||||
| 7,249 | Vornado Realty Trust | 303,588 | ||||||||
| 3,492 | Washington Real Estate Investment Trust | 87,789 | ||||||||
| 1,631 | Whitestone REIT, Class B Shares | 16,000 | ||||||||
| 4,682 | Xenia Hotels & Resorts Inc.*(a) | 81,560 | ||||||||
|
| |||||||||
| Total Equity Real Estate Investment Trusts (REITs) | 40,207,176 | |||||||||
|
| |||||||||
Real Estate Management & Development — 0.5% | ||||||||||
| 16,840 | CBRE Group Inc., Class A Shares* | 1,621,692 | ||||||||
| 4,861 | Cushman & Wakefield PLC* | 88,178 | ||||||||
| 2,689 | eXp World Holdings Inc.(a) | 123,291 | ||||||||
See Notes to Financial Statements.
105
| Schedules of Investments |
| (continued) |
| Small-Mid Cap Equity Fund | ||||||||||
| Shares/Units | Security | Value | ||||||||
REAL ESTATE — 6.5% — (continued) | ||||||||||
Real Estate Management & Development — 0.5% — (continued) | ||||||||||
| 200 | Fathom Holdings Inc.*(a) | $ | 5,716 | |||||||
| 669 | Forestar Group Inc.* | 13,908 | ||||||||
| 302 | FRP Holdings Inc.* | 17,425 | ||||||||
| 1,771 | Howard Hughes Corp. (The)* | 160,329 | ||||||||
| 2,119 | Jones Lang LaSalle Inc.* | 513,709 | ||||||||
| 4,957 | Kennedy-Wilson Holdings Inc. | 109,004 | ||||||||
| 1,003 | Marcus & Millichap Inc.* | 39,338 | ||||||||
| 6,186 | Newmark Group Inc., Class A Shares | 84,253 | ||||||||
| 14,704 | Opendoor Technologies Inc.*(a) | 260,702 | ||||||||
| 435 | Rafael Holdings Inc., Class B Shares* | 18,205 | ||||||||
| 783 | RE/MAX Holdings Inc., Class A Shares | 26,223 | ||||||||
| 4,740 | Realogy Holdings Corp.* | 83,187 | ||||||||
| 4,177 | Redfin Corp.*(a) | 202,877 | ||||||||
| 623 | RMR Group Inc. (The), Class A Shares | 28,870 | ||||||||
| 1,370 | St Joe Co. (The) | 63,390 | ||||||||
| 800 | Tejon Ranch Co.* | 15,376 | ||||||||
|
| |||||||||
| Total Real Estate Management & Development | 3,475,673 | |||||||||
|
| |||||||||
| TOTAL REAL ESTATE | 43,682,849 | |||||||||
|
| |||||||||
UTILITIES — 2.9% | ||||||||||
Electric Utilities — 0.6% | ||||||||||
| 20,687 | ALLETE Inc. | 1,394,718 | ||||||||
| 4,380 | Hawaiian Electric Industries Inc. | 190,968 | ||||||||
| 4,292 | IDACORP Inc. | 452,162 | ||||||||
| 1,507 | MGE Energy Inc. | 121,374 | ||||||||
| 10,092 | NRG Energy Inc. | 460,902 | ||||||||
| 8,310 | OGE Energy Corp. | 294,257 | ||||||||
| 1,791 | Otter Tail Corp. | 98,272 | ||||||||
| 4,677 | Pinnacle West Capital Corp. | 359,661 | ||||||||
| 3,632 | PNM Resources Inc. | 179,784 | ||||||||
| 3,712 | Portland General Electric Co. | 190,611 | ||||||||
| 502 | Via Renewables Inc., Class A Shares(a) | 5,622 | ||||||||
|
| |||||||||
| Total Electric Utilities | 3,748,331 | |||||||||
|
| |||||||||
Gas Utilities — 0.2% | ||||||||||
| 1,506 | Brookfield Infrastructure Corp., Class A Shares(a) | 95,782 | ||||||||
| 711 | Chesapeake Utilities Corp. | 92,928 | ||||||||
| 3,626 | National Fuel Gas Co. | 187,863 | ||||||||
| 3,956 | New Jersey Resources Corp. | 147,717 | ||||||||
| 1,252 | Northwest Natural Holding Co.(a) | 64,415 | ||||||||
| 2,234 | ONE Gas Inc. | 160,446 | ||||||||
| 4,269 | South Jersey Industries Inc.(a) | 105,914 | ||||||||
| 2,398 | Southwest Gas Holdings Inc. | 168,603 | ||||||||
| 2,146 | Spire Inc. | 143,138 | ||||||||
| 8,629 | UGI Corp. | 399,609 | ||||||||
|
| |||||||||
| Total Gas Utilities | 1,566,415 | |||||||||
|
| |||||||||
Independent Power & Renewable Electricity Producers — 0.5% | ||||||||||
| 5,291 | Brookfield Renewable Corp., Class A Shares | 231,799 | ||||||||
| 1,444 | Clearway Energy Inc., Class A Shares | 42,945 | ||||||||
| 3,564 | Clearway Energy Inc., Class C Shares | 111,874 | ||||||||
| 20,706 | Ormat Technologies Inc.(a) | 1,472,818 | ||||||||
| 3,682 | Sunnova Energy International Inc.* | 133,288 | ||||||||
| 64,169 | Vistra Corp. | 1,224,986 | ||||||||
|
| |||||||||
| Total Independent Power & Renewable Electricity Producers | 3,217,710 | |||||||||
|
| |||||||||
See Notes to Financial Statements.
106
| Schedules of Investments |
| (continued) |
| Small-Mid Cap Equity Fund | ||||||||||
| Shares/Units | Security | Value | ||||||||
UTILITIES — 2.9% — (continued) | ||||||||||
Multi-Utilities — 0.4% | ||||||||||
| 29,915 | Avista Corp. | $ | 1,251,943 | |||||||
| 2,587 | Black Hills Corp. | 181,944 | ||||||||
| 8,283 | MDU Resources Group Inc. | 266,464 | ||||||||
| 16,358 | NiSource Inc. | 403,224 | ||||||||
| 9,778 | NorthWestern Corp. | 621,881 | ||||||||
| 627 | Unitil Corp. | 31,099 | ||||||||
|
| |||||||||
| Total Multi-Utilities | 2,756,555 | |||||||||
|
| |||||||||
Water Utilities — 1.2% | ||||||||||
| 1,512 | American States Water Co. | 139,422 | ||||||||
| 1,098 | American Water Works Co., Inc. | 200,111 | ||||||||
| 406 | Artesian Resources Corp., Class A Shares | 16,000 | ||||||||
| 827 | Cadiz Inc.* | 11,115 | ||||||||
| 12,949 | California Water Service Group | 822,909 | ||||||||
| 29,658 | Essential Utilities Inc. | 1,471,927 | ||||||||
| 619 | Global Water Resources Inc. | 12,380 | ||||||||
| 706 | Middlesex Water Co.(a) | 77,243 | ||||||||
| 734 | Pure Cycle Corp.* | 10,973 | ||||||||
| 33,146 | SJW Group | 2,298,012 | ||||||||
| 102,669 | United Utilities Group PLC, ADR(a) | 3,001,528 | ||||||||
| 575 | York Water Co. (The) | 29,653 | ||||||||
|
| |||||||||
| Total Water Utilities | 8,091,273 | |||||||||
|
| |||||||||
| TOTAL UTILITIES | 19,380,284 | |||||||||
|
| |||||||||
| TOTAL COMMON STOCKS (Cost — $398,645,347) | 649,857,330 | |||||||||
|
| |||||||||
CONVERTIBLE PREFERRED STOCKS — 0.7% | ||||||||||
HEALTH CARE — 0.5% | ||||||||||
Health Care Equipment & Supplies — 0.5% | ||||||||||
| 58,736 | Becton Dickinson & Co., 6.000% due 6/1/23 | 3,209,923 | ||||||||
|
| |||||||||
UTILITIES — 0.2% | ||||||||||
Water Utilities — 0.2% | ||||||||||
| 25,765 | Essential Utilities Inc., 6.000% due 4/30/22 | 1,575,272 | ||||||||
|
| |||||||||
| TOTAL CONVERTIBLE PREFERRED STOCKS (Cost — $4,413,890) | 4,785,195 | |||||||||
|
| |||||||||
PREFERRED STOCKS — 0.3% | ||||||||||
FINANCIALS — 0.3% | ||||||||||
Banks — 0.2% | ||||||||||
| 55,697 | US Bancorp, 3.500% (3-Month USD-LIBOR + 0.600%)(e)(f) | 1,393,539 | ||||||||
| 11,178 | US Bancorp, 6.500% (3-Month USD-LIBOR + 4.468%)(e)(f) | 287,275 | ||||||||
|
| |||||||||
| Total Banks | 1,680,814 | |||||||||
|
| |||||||||
Insurance — 0.1% | ||||||||||
| 16,133 | MetLife Inc., 4.750%(f) | 429,138 | ||||||||
| 6,440 | MetLife Inc., 5.625%(f) | 174,588 | ||||||||
|
| |||||||||
| Total Insurance | 603,726 | |||||||||
|
| |||||||||
| TOTAL FINANCIALS | 2,284,540 | |||||||||
|
| |||||||||
| TOTAL PREFERRED STOCKS (Cost — $2,156,604) | 2,284,540 | |||||||||
|
| |||||||||
See Notes to Financial Statements.
107
| Schedules of Investments |
| (continued) |
| Small-Mid Cap Equity Fund | ||||||||||
| Shares/Units | Security | Value | ||||||||
CLOSED END MUTUAL FUND SECURITIES — 0.2% | ||||||||||
FINANCIALS — 0.2% | ||||||||||
Capital Markets — 0.2% | ||||||||||
| 4,364 | iShares® Core S&P Small-Capital ETF(a) | $ | 490,382 | |||||||
| 1,203 | iShares® Russell 2000 ETF, Common Class Shares(a) | 271,782 | ||||||||
| 4,193 | iShares® Russell Mid-Capital ETF, Common Class Shares | 343,281 | ||||||||
|
| |||||||||
| TOTAL CLOSED END MUTUAL FUND SECURITIES (Cost — $528,276) | 1,105,445 | |||||||||
|
| |||||||||
| Face Amount/Units† | Rating†† | |||||||||
CORPORATE BONDS & NOTES — 0.1% | ||||||||||
COMMUNICATION SERVICES — 0.1% | ||||||||||
Diversified Telecommunication Services — 0.1% | ||||||||||
| 702,000 | NR | Infinera Corp., Senior Unsecured Notes, 2.500% due 3/1/27(c)(d) | 944,761 | |||||||
|
| |||||||||
ENERGY — 0.0% | ||||||||||
Oil & Gas — 0.0% | ||||||||||
| 20,000 | CCC | ION Geophysical Corp., Secured Notes, 8.000% due 12/15/25 | 18,292 | |||||||
|
| |||||||||
| TOTAL CORPORATE BONDS & NOTES (Cost — $722,016) | 963,053 | |||||||||
|
| |||||||||
| TOTAL INVESTMENTS IN SECURITIES BEFORE SHORT-TERM INVESTMENTS (Cost — $406,466,133) | 658,995,563 | |||||||||
|
| |||||||||
| Face Amount† | ||||||||||
SHORT-TERM INVESTMENTS (g) — 11.2% | ||||||||||
MONEY MARKET FUND — 8.7% | ||||||||||
| $ | 58,746,706 | Invesco STIT — Government & Agency Portfolio, 0.026%, Institutional Class(h) (Cost — $58,746,706) | 58,746,706 | |||||||
|
| |||||||||
TIME DEPOSITS — 2.5% | ||||||||||
| 5,458,723 | ANZ National Bank — London, 0.005% due 9/1/21 | 5,458,723 | ||||||||
| 1,474,923 | Banco Santander SA — Frankfurt, 0.005% due 9/1/21 | 1,474,923 | ||||||||
| 20,372 | CAD | BBH — Grand Cayman, 0.010% due 9/1/21 | 16,149 | |||||||
| 2,158,689 | Royal Bank of Canada — Toronto, 0.005% due 9/1/21 | 2,158,689 | ||||||||
| 8,100,489 | Skandinaviska Enskilda Banken AB — Stockholm, 0.005% due 9/1/21 | 8,100,489 | ||||||||
|
| |||||||||
| TOTAL TIME DEPOSITS (Cost — $17,208,973) | 17,208,973 | |||||||||
|
| |||||||||
| TOTAL SHORT-TERM INVESTMENTS (Cost — $75,955,679) | 75,955,679 | |||||||||
|
| |||||||||
| TOTAL INVESTMENTS — 108.5% (Cost — $482,421,812) | 734,951,242 | |||||||||
|
| |||||||||
| Liabilities in Excess of Other Assets — (8.5)% | (57,681,165 | ) | ||||||||
|
| |||||||||
| TOTAL NET ASSETS — 100.0% | $ | 677,270,077 | ||||||||
|
| |||||||||
| † | Amount denominated in U.S. dollars, unless otherwise noted. |
| †† | All ratings are by Standard & Poor’s Rating Service, unless otherwise noted. All ratings are unaudited. |
| * | Non-income producing security. |
| (a) | All or a portion of this security is on loan (See Note 1). |
| (b) | Security is valued in good faith at fair value by or under the direction of the Board of Trustees. |
| (c) | Illiquid security. |
| (d) | Restricted security that may be sold to “qualified institutional buyers” pursuant to the conditions of Rule 144A under the Securities Act of 1933, as amended. This security has been deemed liquid pursuant to guidelines approved by the Board of Trustees, unless otherwise noted. The aggregate value of restricted 144A holdings at August 31, 2021, amounts to $1,122,443 and represents 0.2% of net assets. |
See Notes to Financial Statements.
108
| Schedules of Investments |
| (continued) |
| Small-Mid Cap Equity Fund | ||||||
| (e) | Variable rate security. Interest rate disclosed is that which was in effect at August 31, 2021. |
| (f) | Security is perpetual in nature and has no stated maturity date. |
| (g) | Inclusive of all short-term holdings, including investments of collateral received from securities lending transactions. Excluding such collateral, the percentage of portfolio holdings would be 2.5%. |
| (h) | Represents investments of collateral received from securities lending transactions. |
| # | Security that used significant unobservable inputs to determine fair value. |
At August 31, 2021, for Small-Mid Cap Equity Fund the aggregate cost of investments, the aggregate gross unrealized appreciation and depreciation of all investments for federal income tax purposes were as follows:
| Fund | Aggregate Cost For Federal Income Tax Purposes | Gross Unrealized Appreciation | Gross Unrealized (Depreciation) | Net | ||||||||||||
Small-Mid Cap Equity Fund | $ | 491,375,984 | $ | 264,459,262 | $ | (20,846,129 | ) | $ | 243,613,133 | |||||||
Abbreviations used in this schedule: | ||
| ADR | — American Depositary Receipts | |
| LIBOR | — London Interbank Offered Rate | |
| PLC | — Public Limited Company | |
| REIT | — Real Estate Investment Trust | |
| Summary of Investments by Security Sector^ | ||||
Information Technology | 18.5 | % | ||
Health Care | 17.9 | |||
Industrials | 15.9 | |||
Financials | 13.1 | |||
Consumer Discretionary | 8.9 | |||
Real Estate | 6.5 | |||
Materials | 5.1 | |||
Consumer Staples | 4.1 | |||
Utilities | 3.1 | |||
Communication Services | 2.4 | |||
Energy | 2.0 | |||
Short-Term Investments | 2.5 | |||
|
| |||
| 100.0 | %+ | |||
|
| |||
| ^ | As a percentage of total investments. |
| + | Does not reflect investments of collateral received from securities lending transactions. |
At August 31, 2021, Small-Mid Cap Equity Fund had open exchange-traded futures contracts as described below.
The unrealized appreciation on the open contracts reflected in the accompanying financial statements were as follows:
| Open Futures Contracts | Number of Contracts | Expiration Date (Month/Year) | Notional Amount | Market Value | Unrealized Appreciation | |||||||||||||||
| Contracts to Buy: | ||||||||||||||||||||
Russell 2000 E-mini Index September Futures | 14 | 9/21 | $ | 1,587,814 | $ | 1,589,841 | $ | 2,027 | ||||||||||||
NASDAQ 100 E-mini Index September Futures | 1 | 9/21 | 279,036 | 311,650 | 32,614 | |||||||||||||||
S&P MidCap 400 E-mini Index September Futures | 4 | 9/21 | 1,098,213 | 1,100,800 | 2,587 | |||||||||||||||
|
| |||||||||||||||||||
| $ | 37,228 | |||||||||||||||||||
|
| |||||||||||||||||||
At August 31, 2021, Small-Mid Cap Equity Fund had deposited cash of $162,000 with a broker or brokers as margin collateral on an open exchange-traded futures contracts.
See Notes to Financial Statements.
109
| Schedules of Investments |
| (continued) |
| Small-Mid Cap Equity Fund | ||||||
Currency Abbreviation used in this schedule: | ||
| CAD | — Canadian Dollar | |
| USD | — United States Dollar | |
See pages 296-297 for definitions of ratings.
See Notes to Financial Statements.
110
| Schedules of Investments |
| (continued) |
| International Equity Fund | ||||||||
| Shares/Units | Security | Value | ||||||
COMMON STOCKS — 96.9% | ||||||||
Argentina — 0.1% | ||||||||
| 425 | MercadoLibre Inc.* | $ | 793,666 | |||||
|
| |||||||
Australia — 3.2% | ||||||||
| 4,603 | Afterpay Ltd.* | 450,367 | ||||||
| 13,687 | AGL Energy Ltd. | 64,510 | ||||||
| 5,110 | Ampol Ltd. | 102,915 | ||||||
| 26,364 | Ansell Ltd. | 693,871 | ||||||
| 27,047 | APA Group | 181,260 | ||||||
| 12,213 | Aristocrat Leisure Ltd. | 407,706 | ||||||
| 4,390 | ASX Ltd. | 281,735 | ||||||
| 41,663 | Aurizon Holdings Ltd. | 114,829 | ||||||
| 36,895 | AusNet Services Ltd., Class Miscella Shares | 52,134 | ||||||
| 61,384 | Australia & New Zealand Banking Group Ltd. | 1,249,737 | ||||||
| 111,148 | Bank of Queensland Ltd. | 767,053 | ||||||
| 86,134 | Bapcor Ltd. | 455,709 | ||||||
| 699,996 | Beach Energy Ltd. | 534,275 | ||||||
| 63,538 | BHP Group Ltd. | 2,115,075 | ||||||
| 45,679 | BHP Group PLC | 1,415,682 | ||||||
| 11,186 | BlueScope Steel Ltd. | 204,679 | ||||||
| 30,764 | Brambles Ltd. | 272,465 | ||||||
| 103,462 | Charter Hall Group, REIT | 1,352,804 | ||||||
| 14,965 | Cochlear Ltd. | 2,544,201 | ||||||
| 29,391 | Coles Group Ltd. | 388,055 | ||||||
| 38,132 | Commonwealth Bank of Australia | 2,791,452 | ||||||
| 11,293 | Computershare Ltd. | 136,238 | ||||||
| 7,474 | Crown Resorts Ltd.* | 50,890 | ||||||
| 31,056 | CSL Ltd. | 7,085,169 | ||||||
| 117,860 | CSR Ltd. | 468,175 | ||||||
| 23,276 | Dexus, REIT | 180,757 | ||||||
| 1,282 | Domino’s Pizza Enterprises Ltd. | 146,749 | ||||||
| 89,508 | Elders Ltd. | 798,250 | ||||||
| 27,115 | Endeavour Group Ltd.* | 144,662 | ||||||
| 34,893 | Evolution Mining Ltd. | 100,075 | ||||||
| 36,411 | Fortescue Metals Group Ltd. | 555,823 | ||||||
| 35,855 | Goodman Group, REIT | 607,717 | ||||||
| 44,991 | GPT Group (The), REIT | 159,512 | ||||||
| 53,269 | Insurance Australia Group Ltd. | 204,037 | ||||||
| 18,391 | JB Hi-Fi Ltd. | 615,749 | ||||||
| 14,273 | Lendlease Corp., Ltd. | 124,934 | ||||||
| 19,952 | Macquarie Group Ltd. | 2,432,396 | ||||||
| 2,673 | Magellan Financial Group Ltd. | 84,701 | ||||||
| 58,441 | Medibank Pvt Ltd. | 151,716 | ||||||
| 49,529 | Mineral Resources Ltd. | 1,975,480 | ||||||
| 83,120 | Mirvac Group, REIT | 189,896 | ||||||
| 71,064 | National Australia Bank Ltd. | 1,440,725 | ||||||
| 17,827 | Newcrest Mining Ltd. | 323,743 | ||||||
| 23,287 | Northern Star Resources Ltd. | 167,102 | ||||||
| 42,522 | Oil Search Ltd.(a) | 116,076 | ||||||
| 8,577 | Orica Ltd. | 82,191 | ||||||
| 37,374 | Origin Energy Ltd. | 121,588 | ||||||
| 64,480 | OZ Minerals Ltd. | 1,103,939 | ||||||
| 137,515 | Pendal Group Ltd. | 869,419 | ||||||
| 18,281 | Qantas Airways Ltd.* | 68,006 | ||||||
| 31,126 | QBE Insurance Group Ltd. | 269,067 | ||||||
| 4,203 | Ramsay Health Care Ltd. | 211,803 | ||||||
See Notes to Financial Statements.
111
| Schedules of Investments |
| (continued) |
| International Equity Fund | ||||||||
| Shares/Units | Security | Value | ||||||
Australia — 3.2% — (continued) | ||||||||
| 1,077 | REA Group Ltd. | $ | 120,600 | |||||
| 6,086 | Reece Ltd. | 92,495 | ||||||
| 8,005 | Rio Tinto Ltd. | 652,739 | ||||||
| 40,754 | Santos Ltd. | 179,391 | ||||||
| 111,490 | Scentre Group, REIT | 232,165 | ||||||
| 7,060 | SEEK Ltd. | 167,892 | ||||||
| 38,826 | Seven Group Holdings Ltd. | 603,202 | ||||||
| 268,441 | Shopping Centres Australasia Property Group, REIT, Class Miscella Shares | 526,337 | ||||||
| 9,575 | Sonic Healthcare Ltd. | 303,924 | ||||||
| 104,884 | South32 Ltd. | 240,715 | ||||||
| 50,069 | Stockland, REIT | 168,761 | ||||||
| 26,756 | Suncorp Group Ltd. | 244,090 | ||||||
| 7,625 | Super Retail Group Ltd. | 68,610 | ||||||
| 30,454 | Sydney Airport* | 177,274 | ||||||
| 46,820 | Tabcorp Holdings Ltd. | 163,979 | ||||||
| 76,426 | Technology One Ltd. | 550,586 | ||||||
| 87,637 | Telstra Corp., Ltd. | 246,108 | ||||||
| 59,247 | Transurban Group | 615,468 | ||||||
| 15,164 | Treasury Wine Estates Ltd. | 139,807 | ||||||
| 84,094 | Vicinity Centres, REIT | 106,550 | ||||||
| 2,114 | Washington H Soul Pattinson & Co., Ltd.(a) | 55,355 | ||||||
| 24,699 | Wesfarmers Ltd. | 1,082,880 | ||||||
| 78,937 | Westpac Banking Corp. | 1,490,078 | ||||||
| 3,097 | WiseTech Global Ltd. | 109,232 | ||||||
| 20,841 | Woodside Petroleum Ltd. | 296,002 | ||||||
| 27,115 | Woolworths Group Ltd. | 827,837 | ||||||
|
| |||||||
| Total Australia | 46,889,176 | |||||||
|
| |||||||
Austria — 0.2% | ||||||||
| 66,299 | Erste Group Bank AG | 2,649,163 | ||||||
| 3,382 | OMV AG | 187,126 | ||||||
| 3,089 | Raiffeisen Bank International AG | 73,939 | ||||||
| 1,373 | Verbund AG | 150,511 | ||||||
| 2,612 | Voestalpine AG | 118,346 | ||||||
|
| |||||||
| Total Austria | 3,179,085 | |||||||
|
| |||||||
Belgium — 0.6% | ||||||||
| 3,789 | Ageas SA NV | 189,428 | ||||||
| 16,298 | Anheuser-Busch InBev SA/NV | 997,744 | ||||||
| 666 | Elia Group SA/NV | 83,661 | ||||||
| 1,256 | Etablissements Franz Colruyt NV | 70,276 | ||||||
| 2,530 | Groupe Bruxelles Lambert SA | 290,000 | ||||||
| 5,299 | KBC Group NV | 444,921 | ||||||
| 3,139 | Proximus SADP | 61,525 | ||||||
| 332 | Sofina SA | 146,868 | ||||||
| 1,573 | Solvay SA | 206,025 | ||||||
| 26,488 | UCB SA | 3,031,551 | ||||||
| 39,412 | Umicore SA | 2,593,304 | ||||||
|
| |||||||
| Total Belgium | 8,115,303 | |||||||
|
| |||||||
Brazil — 0.1% | ||||||||
| 341,410 | B3 SA — Brasil Bolsa Balcao | 929,218 | ||||||
|
| |||||||
Canada — 2.4% | ||||||||
| 349,700 | Air Canada* | 6,794,678 | ||||||
| 133,335 | Alimentation Couche-Tard Inc., Class B Shares | 5,388,575 | ||||||
| 135,522 | ARC Resources Ltd. | 967,976 | ||||||
See Notes to Financial Statements.
112
| Schedules of Investments |
| (continued) |
| International Equity Fund | ||||||||
| Shares/Units | Security | Value | ||||||
Canada — 2.4% — (continued) | ||||||||
| 28,729 | ATS Automation Tooling Systems Inc.* | $ | 1,038,976 | |||||
| 14,566 | Ballard Power Systems Inc.* | 245,490 | ||||||
| 18,113 | Boardwalk Real Estate Investment Trust | 676,159 | ||||||
| 14,335 | BRP Inc. | 1,201,279 | ||||||
| 63,766 | Canadian National Railway Co. | 7,501,585 | ||||||
| 28,271 | Canadian Western Bank(a) | 828,778 | ||||||
| 23,892 | Canfor Corp.* | 512,898 | ||||||
| 36,624 | CI Financial Corp. | 711,024 | ||||||
| 7,785 | Descartes Systems Group Inc. (The)* | 610,420 | ||||||
| 109,156 | Dundee Precious Metals Inc. | 672,355 | ||||||
| 30,335 | Finning International Inc. | 789,727 | ||||||
| 71,167 | Fortuna Silver Mines Inc.* | 312,549 | ||||||
| 29,364 | Northland Power Inc. | 971,623 | ||||||
| 64,563 | Parex Resources Inc.* | 994,970 | ||||||
| 15,393 | Stella-Jones Inc. | 526,421 | ||||||
| 19,399 | TFI International Inc. | 2,192,182 | ||||||
| 27,874 | Tilray Inc., Class 2 Shares*(a) | 381,833 | ||||||
| 79,822 | Tricon Residential Inc. | 1,014,979 | ||||||
|
| |||||||
| Total Canada | 34,334,477 | |||||||
|
| |||||||
Chile — 0.1% | ||||||||
| 93,910 | Antofagasta PLC | 1,877,029 | ||||||
|
| |||||||
China — 0.4% | ||||||||
| 7,580 | Alibaba Group Holding Ltd., ADR* | 1,265,784 | ||||||
| 2,816,000 | Beijing Capital International Airport Co., Ltd., Class H Shares*(b) | 1,697,656 | ||||||
| 416,000 | Kingdee International Software Group Co., Ltd.* | 1,515,021 | ||||||
| 21,100 | Tencent Holdings Ltd. | 1,298,343 | ||||||
|
| |||||||
| Total China | 5,776,804 | |||||||
|
| |||||||
Denmark — 2.7% | ||||||||
| 3,518 | Ambu AS, Class B Shares | 111,167 | ||||||
| 67 | AP Moller — Maersk AS, Class A Shares | 181,274 | ||||||
| 122 | AP Moller — Maersk AS, Class B Shares | 346,163 | ||||||
| 2,248 | Carlsberg AS, Class B Shares | 392,276 | ||||||
| 54,938 | Chr Hansen Holding AS | 5,067,579 | ||||||
| 30,418 | Coloplast AS, Class B Shares | 5,270,907 | ||||||
| 14,912 | Danske Bank AS | 250,475 | ||||||
| 2,342 | Demant AS* | 132,688 | ||||||
| 4,331 | DSV PANALPINA AS | 1,103,213 | ||||||
| 1,424 | Genmab AS* | 674,872 | ||||||
| 2,715 | GN Store Nord AS | 204,018 | ||||||
| 4,784 | Netcompany Group AS(c) | 619,623 | ||||||
| 112,155 | Novo Nordisk AS, Class B Shares | 11,208,209 | ||||||
| 69,726 | Novozymes AS, Class B Shares | 5,631,019 | ||||||
| 4,109 | Orsted AS(c) | 655,542 | ||||||
| 15,364 | Pandora AS | 1,839,384 | ||||||
| 170 | ROCKWOOL International AS, Class B Shares | 90,284 | ||||||
| 6,252 | Royal Unibrew AS | 808,425 | ||||||
| 7,820 | Tryg AS | 194,060 | ||||||
| 98,578 | Vestas Wind Systems AS | 3,975,829 | ||||||
|
| |||||||
| Total Denmark | 38,757,007 | |||||||
|
| |||||||
Finland — 0.9% | ||||||||
| 3,018 | Elisa OYJ | 193,306 | ||||||
| 9,425 | Fortum OYJ | 286,408 | ||||||
| 30,380 | Kemira OYJ | 512,851 | ||||||
See Notes to Financial Statements.
113
| Schedules of Investments |
| (continued) |
| International Equity Fund | ||||||||
| Shares/Units | Security | Value | ||||||
Finland — 0.9% — (continued) | ||||||||
| 5,752 | Kesko OYJ, Class B Shares | $ | 237,539 | |||||
| 60,977 | Kone OYJ, Class B Shares | 5,054,354 | ||||||
| 67,839 | Metso Outotec OYJ | 725,157 | ||||||
| 9,207 | Neste OYJ | 559,536 | ||||||
| 115,984 | Nokia OYJ* | 696,128 | ||||||
| 69,983 | Nordea Bank Abp | 823,534 | ||||||
| 2,533 | Orion OYJ, Class B Shares | 103,254 | ||||||
| 10,683 | Sampo OYJ, Class A Shares | 551,432 | ||||||
| 12,345 | Stora Enso OYJ, Class R Shares | 241,790 | ||||||
| 22,654 | TietoEVRY OYJ | 806,992 | ||||||
| 11,244 | UPM-Kymmene OYJ | 457,348 | ||||||
| 35,164 | Valmet OYJ | 1,408,799 | ||||||
| 10,090 | Wartsila OYJ Abp | 143,120 | ||||||
|
| |||||||
| Total Finland | 12,801,548 | |||||||
|
| |||||||
France — 10.0% | ||||||||
| 3,653 | Accor SA* | 126,020 | ||||||
| 667 | Aeroports de Paris* | 78,460 | ||||||
| 36,367 | Air Liquide SA | 6,526,275 | ||||||
| 192,234 | Alstom SA(c) | 8,271,791 | ||||||
| 18,383 | Amundi SA(c) | 1,743,080 | ||||||
| 7,165 | Arkema SA | 950,659 | ||||||
| 2,085 | Atos SE | 108,139 | ||||||
| 366,737 | AXA SA | 10,293,950 | ||||||
| 878 | BioMerieux | 107,644 | ||||||
| 40,256 | BNP Paribas SA | 2,553,071 | ||||||
| 18,090 | Bollore SA | 106,943 | ||||||
| 4,636 | Bouygues SA | 194,286 | ||||||
| 6,234 | Bureau Veritas SA | 207,158 | ||||||
| 3,483 | Capgemini SE | 781,451 | ||||||
| 12,848 | Carrefour SA | 255,985 | ||||||
| 10,788 | Cie de Saint-Gobain | 783,990 | ||||||
| 3,628 | Cie Générale des Établissements Michelin SCA | 586,931 | ||||||
| 4,073 | CNP Assurances | 69,897 | ||||||
| 1,151 | Covivio, REIT | 109,641 | ||||||
| 25,799 | Credit Agricole SA | 372,858 | ||||||
| 109,720 | Danone SA | 8,014,413 | ||||||
| 61 | Dassault Aviation SA | 68,930 | ||||||
| 113,435 | Dassault Systemes SE | 6,465,714 | ||||||
| 5,161 | Edenred | 292,326 | ||||||
| 13,958 | Eiffage SA | 1,449,250 | ||||||
| 10,238 | Electricite de France SA | 138,978 | ||||||
| 34,774 | Elis SA* | 614,899 | ||||||
| 38,453 | Engie SA | 551,634 | ||||||
| 6,096 | EssilorLuxottica SA | 1,195,921 | ||||||
| 952 | Eurazeo SE | 98,121 | ||||||
| 26,872 | Faurecia SE | 1,299,005 | ||||||
| 970 | Gecina SA, REIT | 150,758 | ||||||
| 9,277 | Getlink SE | 149,109 | ||||||
| 682 | Hermes International | 1,001,449 | ||||||
| 344 | Iliad SA | 73,916 | ||||||
| 794 | Ipsen SA | 79,463 | ||||||
| 1,618 | Kering SA | 1,292,213 | ||||||
| 49,341 | Klepierre SA, REIT | 1,204,998 | ||||||
| 19,990 | Korian SA | 774,798 | ||||||
| 14,093 | La Francaise des Jeux SAEM(c) | 728,932 | ||||||
See Notes to Financial Statements.
114
| Schedules of Investments |
| (continued) |
| International Equity Fund | ||||||||
| Shares/Units | Security | Value | ||||||
France — 10.0% — (continued) | ||||||||
| 24,887 | Legrand SA | $ | 2,847,391 | |||||
| 16,572 | L’Oréal SA | 7,768,724 | ||||||
| 12,479 | LVMH Moët Hennessy Louis Vuitton SE | 9,265,604 | ||||||
| 10,652 | Nexans SA | 1,067,928 | ||||||
| 18,576 | Nexity SA | 958,796 | ||||||
| 43,448 | Orange SA | 493,463 | ||||||
| 1,114 | Orpea SA | 140,137 | ||||||
| 27,522 | Pernod Ricard SA | 5,779,347 | ||||||
| 22,997 | Publicis Groupe SA | 1,506,446 | ||||||
| 518 | Remy Cointreau SA* | 102,157 | ||||||
| 4,327 | Renault SA* | 160,488 | ||||||
| 26,943 | Rexel SA | 565,214 | ||||||
| 7,313 | Safran SA | 920,119 | ||||||
| 151,247 | Sanofi | 15,650,503 | ||||||
| 620 | Sartorius Stedim Biotech | 375,924 | ||||||
| 37,478 | Schneider Electric SE | 6,709,966 | ||||||
| 3,320 | SCOR SE | 102,102 | ||||||
| 3,046 | SEB SA | 478,792 | ||||||
| 17,640 | Societe Generale SA | 554,879 | ||||||
| 1,877 | Sodexo SA* | 155,141 | ||||||
| 4,554 | SOITEC* | 1,090,957 | ||||||
| 4,528 | Sopra Steria Group SACA | 923,313 | ||||||
| 7,252 | Suez SA | 168,247 | ||||||
| 1,283 | Teleperformance | 567,732 | ||||||
| 2,261 | Thales SA | 229,284 | ||||||
| 362,641 | TotalEnergies SE | 16,051,235 | ||||||
| 1,919 | Ubisoft Entertainment SA* | 122,091 | ||||||
| 2,694 | Unibail-Rodamco-Westfield, REIT* | 235,852 | ||||||
| 106,245 | Valeo | 3,016,871 | ||||||
| 11,436 | Veolia Environnement SA | 392,886 | ||||||
| 60,347 | Vinci SA | 6,490,343 | ||||||
| 15,170 | Vivendi SE | 578,766 | ||||||
| 575 | Wendel SE | 83,601 | ||||||
| 5,031 | Worldline SA*(c) | 447,012 | ||||||
|
| |||||||
| Total France | 145,874,367 | |||||||
|
| |||||||
Germany — 8.9% | ||||||||
| 26,499 | adidas AG | 9,396,674 | ||||||
| 8,852 | Allianz SE, Class Registered Shares | 2,079,248 | ||||||
| 40,721 | alstria office REIT-AG | 828,766 | ||||||
| 7,270 | Aurubis AG | 616,786 | ||||||
| 138,178 | BASF SE | 10,686,750 | ||||||
| 89,805 | Bayer AG, Class Registered Shares | 4,997,477 | ||||||
| 32,313 | Bayerische Motoren Werke AG | 3,065,219 | ||||||
| 15,711 | Bechtle AG | 1,135,223 | ||||||
| 2,139 | Beiersdorf AG | 259,482 | ||||||
| 13,018 | Brenntag SE | 1,313,108 | ||||||
| 5,110 | Carl Zeiss Meditec AG | 1,128,490 | ||||||
| 20,700 | Commerzbank AG* | 129,743 | ||||||
| 2,334 | Continental AG* | 313,486 | ||||||
| 19,055 | Covestro AG(c) | 1,234,834 | ||||||
| 46,927 | Daimler AG, Class Registered Shares | 3,954,149 | ||||||
| 3,371 | Delivery Hero SE*(c) | 487,864 | ||||||
| 44,372 | Deutsche Bank AG, Class Registered Shares* | 551,939 | ||||||
| 4,102 | Deutsche Boerse AG | 707,378 | ||||||
| 6,500 | Deutsche Lufthansa AG, Class Registered Shares* | 65,108 | ||||||
See Notes to Financial Statements.
115
| Schedules of Investments |
| (continued) |
| International Equity Fund | ||||||||
| Shares/Units | Security | Value | ||||||
Germany — 8.9% — (continued) | ||||||||
| 61,234 | Deutsche Pfandbriefbank AG(c) | $ | 702,131 | |||||
| 21,439 | Deutsche Post AG, Class Registered Shares | 1,507,499 | ||||||
| 71,945 | Deutsche Telekom AG, Class Registered Shares | 1,529,088 | ||||||
| 7,527 | Deutsche Wohnen SE | 467,045 | ||||||
| 15,139 | DWS Group GmbH & Co. KGaA(c) | 639,218 | ||||||
| 48,692 | E.ON SE | 642,464 | ||||||
| 4,450 | Evonik Industries AG | 150,258 | ||||||
| 34,744 | Freenet AG | 857,271 | ||||||
| 4,431 | Fresenius Medical Care AG & Co. KGaA | 340,197 | ||||||
| 9,143 | Fresenius SE & Co. KGaA | 475,469 | ||||||
| 21,081 | GEA Group AG | 973,396 | ||||||
| 7,467 | Gerresheimer AG | 793,008 | ||||||
| 1,269 | Hannover Rueck SE | 233,546 | ||||||
| 3,158 | HeidelbergCement AG | 274,350 | ||||||
| 11,475 | HelloFresh SE* | 1,236,156 | ||||||
| 2,205 | Henkel AG & Co. KGaA | 198,354 | ||||||
| 118,985 | Infineon Technologies AG | 5,064,481 | ||||||
| 1,642 | KION Group AG | 175,636 | ||||||
| 18,820 | Knorr-Bremse AG | 2,258,544 | ||||||
| 1,914 | Lanxess AG | 139,513 | ||||||
| 1,487 | LEG Immobilien SE | 236,998 | ||||||
| 35,047 | Merck KGaA | 8,326,032 | ||||||
| 1,107 | MTU Aero Engines AG | 253,959 | ||||||
| 3,007 | Muenchener Rueckversicherungs-Gesellschaft AG in Muenchen, Class Registered Shares | 878,305 | ||||||
| 1,244 | Nemetschek SE | 121,921 | ||||||
| 42,850 | ProSiebenSat.1 Media SE | 817,554 | ||||||
| 2,264 | Puma SE | 274,680 | ||||||
| 108 | Rational AG | 123,486 | ||||||
| 9,050 | Rheinmetall AG | 885,258 | ||||||
| 269,340 | RWE AG | 10,516,811 | ||||||
| 156,195 | SAP SE | 23,501,337 | ||||||
| 1,906 | Scout24 AG(c) | 160,196 | ||||||
| 87,194 | Siemens AG, Class Registered Shares | 14,494,518 | ||||||
| 8,632 | Siemens Energy AG* | 250,450 | ||||||
| 5,708 | Siemens Healthineers AG(c) | 396,978 | ||||||
| 2,709 | Symrise AG, Class A Shares | 385,690 | ||||||
| 35,985 | TAG Immobilien AG | 1,217,859 | ||||||
| 3,593 | TeamViewer AG*(c) | 119,664 | ||||||
| 23,429 | Telefonica Deutschland Holding AG | 65,738 | ||||||
| 2,281 | Uniper SE | 90,540 | ||||||
| 17,540 | United Internet AG, Class Registered Shares | 758,193 | ||||||
| 689 | Volkswagen AG | 230,316 | ||||||
| 11,439 | Vonovia SE | 771,816 | ||||||
| 25,356 | Zalando SE*(c) | 2,808,113 | ||||||
|
| |||||||
| Total Germany | 129,295,760 | |||||||
|
| |||||||
Gibraltar — 0.0% | ||||||||
| 98,468 | 888 Holdings PLC | 551,176 | ||||||
|
| |||||||
Hong Kong — 3.0% | ||||||||
| 1,063,000 | AIA Group Ltd. | 12,688,386 | ||||||
| 42,900 | ASM Pacific Technology Ltd. | 509,285 | ||||||
| 836,500 | BOC Hong Kong Holdings Ltd. | 2,536,192 | ||||||
| 37,100 | Budweiser Brewing Co. APAC Ltd.(c) | 92,879 | ||||||
| 190,000 | China Mengniu Dairy Co., Ltd.* | 1,142,448 | ||||||
| 41,200 | Chow Tai Fook Jewellery Group Ltd. | 83,422 | ||||||
| 43,000 | CK Asset Holdings Ltd. | 280,054 | ||||||
See Notes to Financial Statements.
116
| Schedules of Investments |
| (continued) |
| International Equity Fund | ||||||||
| Shares/Units | Security | Value | ||||||
Hong Kong — 3.0% — (continued) | ||||||||
| 59,500 | CK Hutchison Holdings Ltd. | $ | 432,932 | |||||
| 15,000 | CK Infrastructure Holdings Ltd. | 91,038 | ||||||
| 478,000 | CLP Holdings Ltd. | 4,774,851 | ||||||
| 41,000 | ESR Cayman Ltd.*(c) | 124,874 | ||||||
| 1,077 | Futu Holdings Ltd., ADR*(a) | 102,520 | ||||||
| 46,000 | Galaxy Entertainment Group Ltd.* | 294,415 | ||||||
| 1,733,000 | Hang Lung Properties Ltd. | 4,160,496 | ||||||
| 17,000 | Hang Seng Bank Ltd. | 304,092 | ||||||
| 32,894 | Henderson Land Development Co., Ltd. | 148,761 | ||||||
| 53,500 | HK Electric Investments & HK Electric Investments Ltd. | 53,212 | ||||||
| 80,000 | HKT Trust & HKT Ltd., Class Miscella Shares | 109,001 | ||||||
| 672,680 | Hong Kong & China Gas Co., Ltd. | 1,081,598 | ||||||
| 55,019 | Hong Kong Exchanges & Clearing Ltd. | 3,466,154 | ||||||
| 27,400 | Hongkong Land Holdings Ltd. | 114,975 | ||||||
| 167,000 | Hysan Development Co., Ltd. | 595,819 | ||||||
| 68,800 | Jardine Matheson Holdings Ltd. | 3,734,630 | ||||||
| 44,500 | Link REIT | 409,764 | ||||||
| 4,414 | Melco Resorts & Entertainment Ltd., ADR* | 60,737 | ||||||
| 32,500 | MTR Corp., Ltd. | 182,722 | ||||||
| 32,669 | New World Development Co., Ltd. | 153,530 | ||||||
| 1,396,000 | Pacific Basin Shipping Ltd. | 761,154 | ||||||
| 29,500 | Power Assets Holdings Ltd. | 185,166 | ||||||
| 76,646 | Sino Land Co., Ltd. | 112,899 | ||||||
| 29,000 | SITC International Holdings Co., Ltd. | 126,403 | ||||||
| 42,000 | SJM Holdings Ltd.* | 36,516 | ||||||
| 28,000 | Sun Hung Kai Properties Ltd. | 394,188 | ||||||
| 12,500 | Swire Pacific Ltd., Class A Shares | 84,493 | ||||||
| 24,800 | Swire Properties Ltd. | 67,143 | ||||||
| 120,500 | Techtronic Industries Co., Ltd. | 2,665,467 | ||||||
| 724,000 | Towngas China Co., Ltd.* | 527,264 | ||||||
| 594,000 | United Laboratories International Holdings Ltd. (The) | 400,521 | ||||||
| 203,000 | WH Group Ltd.(c) | 176,274 | ||||||
| 36,000 | Wharf Real Estate Investment Co., Ltd. | 178,223 | ||||||
| 38,000 | Xinyi Glass Holdings Ltd. | 159,542 | ||||||
|
| |||||||
| Total Hong Kong | 43,604,040 | |||||||
|
| |||||||
India — 0.1% | ||||||||
| 99,517 | HDFC Bank Ltd. | 2,152,788 | ||||||
|
| |||||||
Indonesia — 0.3% | ||||||||
| 522,100 | Bank Central Asia Tbk PT | 1,198,525 | ||||||
| 5,899,673 | Bank Mandiri Persero Tbk PT | 2,516,628 | ||||||
|
| |||||||
| Total Indonesia | 3,715,153 | |||||||
|
| |||||||
Ireland — 1.2% | ||||||||
| 11,895 | AerCap Holdings NV* | 641,497 | ||||||
| 154,182 | Bank of Ireland Group PLC* | 965,099 | ||||||
| 16,887 | CRH PLC | 896,276 | ||||||
| 110,183 | Dalata Hotel Group PLC* | 492,159 | ||||||
| 2,088 | DCC PLC | 177,461 | ||||||
| 146,092 | Experian PLC | 6,428,251 | ||||||
| 3,628 | Flutter Entertainment PLC* | 707,963 | ||||||
| 32,527 | Glanbia PLC | 580,101 | ||||||
| 9,394 | James Hardie Industries PLC, CDI | 364,326 | ||||||
| 3,345 | Kerry Group PLC, Class A Shares | 490,465 | ||||||
| 3,262 | Kingspan Group PLC | 372,508 | ||||||
| 51,744 | Ryanair Holdings PLC, ADR* | 5,572,829 | ||||||
See Notes to Financial Statements.
117
| Schedules of Investments |
| (continued) |
| International Equity Fund | ||||||||
| Shares/Units | Security | Value | ||||||
Ireland — 1.2% — (continued) | ||||||||
| 5,181 | Smurfit Kappa Group PLC | $ | 297,095 | |||||
|
| |||||||
| Total Ireland | 17,986,030 | |||||||
|
| |||||||
Israel — 0.5% | ||||||||
| 922 | Azrieli Group Ltd. | 86,370 | ||||||
| 24,083 | Bank Hapoalim BM | 207,270 | ||||||
| 31,114 | Bank Leumi Le-Israel BM | 257,199 | ||||||
| 2,451 | Check Point Software Technologies Ltd.* | 307,919 | ||||||
| 804 | CyberArk Software Ltd.* | 135,024 | ||||||
| 614 | Elbit Systems Ltd. | 89,350 | ||||||
| 14,106 | ICL Group Ltd. | 100,011 | ||||||
| 13,497 | Inmode Ltd.* | 1,766,487 | ||||||
| 24,701 | Israel Discount Bank Ltd., Class A Shares* | 127,651 | ||||||
| 3,396 | Mizrahi Tefahot Bank Ltd. | 113,030 | ||||||
| 1,363 | Nice Ltd.* | 396,741 | ||||||
| 6,066 | Nice Ltd., ADR*(a) | 1,763,386 | ||||||
| 23,958 | Perion Network Ltd.* | 505,274 | ||||||
| 16,130 | Radware Ltd.* | 552,936 | ||||||
| 23,175 | Teva Pharmaceutical Industries Ltd., ADR* | 218,309 | ||||||
| 1,165 | Wix.com Ltd.* | 258,723 | ||||||
|
| |||||||
| Total Israel | 6,885,680 | |||||||
|
| |||||||
Italy — 3.0% | ||||||||
| 35,275 | ACEA SpA | 842,618 | ||||||
| 2,622 | Amplifon SpA | 137,155 | ||||||
| 24,027 | Assicurazioni Generali SpA | 490,375 | ||||||
| 10,514 | Atlantia SpA* | 197,243 | ||||||
| 71,567 | Banca Mediolanum SpA | 743,611 | ||||||
| 30,223 | Buzzi Unicem SpA | 803,143 | ||||||
| 12,133 | Davide Campari-Milano NV | 167,846 | ||||||
| 1,257 | De’Longhi SpA | 56,845 | ||||||
| 543 | DiaSorin SpA | 123,831 | ||||||
| 1,321,666 | Enel SpA | 12,033,184 | ||||||
| 53,558 | Eni SpA | 660,139 | ||||||
| 2,725 | Ferrari NV | 590,574 | ||||||
| 122,566 | FinecoBank Banca Fineco SpA* | 2,262,193 | ||||||
| 7,104 | Infrastrutture Wireless Italiane SpA(c) | 84,506 | ||||||
| 10,727 | Interpump Group SpA | 763,248 | ||||||
| 1,405,717 | Intesa Sanpaolo SpA | 3,977,262 | ||||||
| 14,070 | Mediobanca Banca di Credito Finanziario SpA* | 165,948 | ||||||
| 4,213 | Moncler SpA | 269,892 | ||||||
| 9,269 | Nexi SpA*(c) | 193,295 | ||||||
| 10,757 | Poste Italiane SpA(c) | 146,037 | ||||||
| 5,654 | Prysmian SpA | 212,961 | ||||||
| 42,019 | Recordati Industria Chimica e Farmaceutica SpA | 2,755,514 | ||||||
| 6,797 | Reply SpA | 1,370,916 | ||||||
| 42,883 | Snam SpA | 253,508 | ||||||
| 335,552 | Telecom Italia SpA | 155,990 | ||||||
| 29,857 | Terna — Rete Elettrica Nazionale | 236,178 | ||||||
| 1,174,160 | UniCredit SpA | 14,635,980 | ||||||
|
| |||||||
| Total Italy | 44,329,992 | |||||||
|
| |||||||
Japan — 17.4% | ||||||||
| 800 | ABC-Mart Inc. | 42,792 | ||||||
| 8,800 | Acom Co., Ltd. | 33,971 | ||||||
| 4,400 | Advantest Corp. | 379,832 | ||||||
| 13,900 | Aeon Co., Ltd. | 368,569 | ||||||
See Notes to Financial Statements.
118
| Schedules of Investments |
| (continued) |
| International Equity Fund | ||||||||
| Shares/Units | Security | Value | ||||||
Japan — 17.4% — (continued) | ||||||||
| 4,100 | AGC Inc. | $ | 198,070 | |||||
| 2,900 | Aisin Corp. | 110,744 | ||||||
| 10,100 | Ajinomoto Co., Inc. | 297,642 | ||||||
| 3,300 | ANA Holdings Inc.* | 78,075 | ||||||
| 10,000 | Asahi Group Holdings Ltd. | 464,341 | ||||||
| 4,100 | Asahi Intecc Co., Ltd. | 124,012 | ||||||
| 26,600 | Asahi Kasei Corp. | 274,320 | ||||||
| 34,000 | ASKUL Corp. | 534,430 | ||||||
| 40,300 | Astellas Pharma Inc. | 679,706 | ||||||
| 2,600 | Azbil Corp. | 112,740 | ||||||
| 4,200 | Bandai Namco Holdings Inc. | 291,444 | ||||||
| 4,500 | BayCurrent Consulting Inc. | 2,229,779 | ||||||
| 86,900 | Bridgestone Corp. | 3,996,431 | ||||||
| 5,200 | Brother Industries Ltd. | 106,605 | ||||||
| 21,800 | Canon Inc. | 516,464 | ||||||
| 34,100 | Capcom Co., Ltd. | 950,762 | ||||||
| 4,100 | Casio Computer Co., Ltd.(a) | 63,266 | ||||||
| 3,000 | Central Japan Railway Co. | 439,307 | ||||||
| 11,200 | Chiba Bank Ltd. (The) | 69,855 | ||||||
| 13,700 | Chubu Electric Power Co., Inc. | 165,459 | ||||||
| 14,600 | Chugai Pharmaceutical Co., Ltd. | 570,979 | ||||||
| 25,800 | CKD Corp. | 540,233 | ||||||
| 22,500 | Concordia Financial Group Ltd. | 87,215 | ||||||
| 400 | Cosmos Pharmaceutical Corp. | 70,694 | ||||||
| 8,400 | CyberAgent Inc. | 153,508 | ||||||
| 5,200 | Dai Nippon Printing Co., Ltd. | 123,516 | ||||||
| 2,200 | Daifuku Co., Ltd. | 194,204 | ||||||
| 14,000 | Daihen Corp. | 609,644 | ||||||
| 21,900 | Dai-ichi Life Holdings Inc. | 431,250 | ||||||
| 37,000 | Daiichi Sankyo Co., Ltd. | 878,431 | ||||||
| 39,400 | Daikin Industries Ltd. | 9,776,426 | ||||||
| 1,500 | Daito Trust Construction Co., Ltd. | 164,574 | ||||||
| 12,000 | Daiwa House Industry Co., Ltd. | 365,666 | ||||||
| 42 | Daiwa House REIT Investment Corp., Class A Shares | 124,129 | ||||||
| 31,700 | Daiwa Securities Group Inc. | 179,192 | ||||||
| 21,400 | Denka Co., Ltd. | 750,115 | ||||||
| 9,400 | Denso Corp. | 657,960 | ||||||
| 4,900 | Dentsu Group Inc. | 181,518 | ||||||
| 8,800 | Disco Corp. | 2,560,782 | ||||||
| 6,600 | East Japan Railway Co. | 445,420 | ||||||
| 32,100 | Eiken Chemical Co., Ltd. | 625,885 | ||||||
| 5,200 | Eisai Co., Ltd. | 429,329 | ||||||
| 65,150 | ENEOS Holdings Inc. | 250,272 | ||||||
| 61,300 | FANUC Corp. | 13,349,853 | ||||||
| 1,200 | Fast Retailing Co., Ltd. | 790,212 | ||||||
| 18,600 | Food & Life Cos., Ltd. | 798,905 | ||||||
| 4,500 | Freee KK* | 364,314 | ||||||
| 35,300 | Fuji Corp. | 914,393 | ||||||
| 2,600 | Fuji Electric Co., Ltd. | 112,473 | ||||||
| 9,600 | Fuji Soft Inc. | 497,904 | ||||||
| 7,700 | FUJIFILM Holdings Corp. | 634,125 | ||||||
| 4,300 | Fujitsu Ltd. | 792,760 | ||||||
| 23,700 | FULLCAST Holdings Co., Ltd. | 456,681 | ||||||
| 89 | GLP J-REIT | 161,436 | ||||||
| 1,000 | GMO Payment Gateway Inc. | 131,227 | ||||||
| 21,400 | H.U. Group Holdings Inc. | 631,731 | ||||||
See Notes to Financial Statements.
119
| Schedules of Investments |
| (continued) |
| International Equity Fund | ||||||||
| Shares/Units | Security | Value | ||||||
Japan — 17.4% — (continued) | ||||||||
| 5,400 | Hakuhodo DY Holdings Inc. | $ | 84,860 | |||||
| 3,000 | Hamamatsu Photonics KK | 174,904 | ||||||
| 4,900 | Hankyu Hanshin Holdings Inc. | 146,622 | ||||||
| 800 | Harmonic Drive Systems Inc. | 44,209 | ||||||
| 500 | Hikari Tsushin Inc. | 87,524 | ||||||
| 7,200 | Hino Motors Ltd. | 62,299 | ||||||
| 745 | Hirose Electric Co., Ltd. | 124,002 | ||||||
| 1,100 | Hisamitsu Pharmaceutical Co., Inc. | 44,051 | ||||||
| 2,300 | Hitachi Construction Machinery Co., Ltd. | 65,884 | ||||||
| 20,800 | Hitachi Ltd. | 1,149,296 | ||||||
| 4,900 | Hitachi Metals Ltd. | 94,590 | ||||||
| 35,000 | Honda Motor Co., Ltd. | 1,052,506 | ||||||
| 1,000 | Hoshizaki Corp. | 93,820 | ||||||
| 44,600 | Hoya Corp. | 7,201,670 | ||||||
| 6,400 | Hulic Co., Ltd. | 74,972 | ||||||
| 2,200 | Ibiden Co., Ltd. | 118,535 | ||||||
| 4,737 | Idemitsu Kosan Co., Ltd. | 113,094 | ||||||
| 3,400 | Iida Group Holdings Co., Ltd. | 86,306 | ||||||
| 21,700 | Inpex Corp. | 148,416 | ||||||
| 37,100 | Internet Initiative Japan Inc. | 1,292,950 | ||||||
| 1,278 | Invincible Investment Corp., REIT | 495,660 | ||||||
| 12,300 | Isuzu Motors Ltd. | 155,434 | ||||||
| 1,200 | Ito En Ltd. | 75,860 | ||||||
| 25,700 | ITOCHU Corp. | 771,344 | ||||||
| 2,000 | Itochu Techno-Solutions Corp. | 61,829 | ||||||
| 12,300 | Izumi Co., Ltd. | 400,530 | ||||||
| 2,800 | Japan Airlines Co., Ltd.* | 59,522 | ||||||
| 10,800 | Japan Exchange Group Inc. | 256,897 | ||||||
| 148 | Japan Metropolitan Fund Invest, REIT | 143,739 | ||||||
| 8,300 | Japan Post Bank Co., Ltd.(a) | 72,594 | ||||||
| 33,400 | Japan Post Holdings Co., Ltd.* | 286,479 | ||||||
| 5,200 | Japan Post Insurance Co., Ltd. | 94,173 | ||||||
| 29 | Japan Real Estate Investment Corp., REIT | 179,453 | ||||||
| 25,300 | Japan Tobacco Inc. | 490,216 | ||||||
| 10,000 | JFE Holdings Inc. | 161,753 | ||||||
| 4,300 | JSR Corp. | 148,989 | ||||||
| 9,200 | Kajima Corp. | 118,653 | ||||||
| 3,100 | Kakaku.com Inc. | 96,555 | ||||||
| 18,300 | Kanamoto Co., Ltd. | 418,037 | ||||||
| 17,300 | Kaneka Corp. | 715,491 | ||||||
| 14,900 | Kansai Electric Power Co., Inc. (The) | 149,651 | ||||||
| 3,800 | Kansai Paint Co., Ltd. | 98,402 | ||||||
| 10,400 | Kao Corp. | 627,903 | ||||||
| 92,200 | KDDI Corp. | 2,822,288 | ||||||
| 2,200 | Keio Corp. | 118,273 | ||||||
| 2,700 | Keisei Electric Railway Co., Ltd. | 82,991 | ||||||
| 84 | Kenedix Office Investment Corp., REIT, Class A Shares | 616,858 | ||||||
| 20,400 | Keyence Corp. | 12,251,205 | ||||||
| 3,200 | Kikkoman Corp. | 240,011 | ||||||
| 3,600 | Kintetsu Group Holdings Co., Ltd. | 122,926 | ||||||
| 28,000 | Kintetsu World Express Inc. | 679,602 | ||||||
| 17,300 | Kirin Holdings Co., Ltd. | 313,363 | ||||||
| 1,100 | Kobayashi Pharmaceutical Co., Ltd. | 86,047 | ||||||
| 2,800 | Kobe Bussan Co., Ltd. | 108,917 | ||||||
| 1,300 | Koei Tecmo Holdings Co., Ltd. | 55,375 | ||||||
| 2,300 | Koito Manufacturing Co., Ltd. | 140,517 | ||||||
See Notes to Financial Statements.
120
| Schedules of Investments |
| (continued) |
| International Equity Fund | ||||||||
| Shares/Units | Security | Value | ||||||
Japan — 17.4% — (continued) | ||||||||
| 19,100 | Komatsu Ltd. | $ | 460,662 | |||||
| 17,000 | Komeri Co., Ltd. | 389,759 | ||||||
| 2,100 | Konami Holdings Corp. | 133,069 | ||||||
| 800 | Kose Corp. | 96,659 | ||||||
| 106,300 | Kubota Corp. | 2,195,196 | ||||||
| 19,400 | Kumagai Gumi Co., Ltd. | 473,375 | ||||||
| 2,200 | Kurita Water Industries Ltd. | 103,131 | ||||||
| 7,000 | Kyocera Corp. | 435,137 | ||||||
| 5,800 | Kyowa Kirin Co., Ltd. | 189,425 | ||||||
| 1,600 | Lasertec Corp. | 347,968 | ||||||
| 1,100 | Lawson Inc.(a) | 52,967 | ||||||
| 4,700 | Lion Corp. | 79,988 | ||||||
| 5,900 | Lixil Corp. | 171,679 | ||||||
| 9,600 | M3 Inc. | 645,074 | ||||||
| 59,100 | Maeda Corp. | 435,302 | ||||||
| 78,200 | Makita Corp. | 4,487,589 | ||||||
| 33,500 | Marubeni Corp. | 265,548 | ||||||
| 12,100 | Mazda Motor Corp. | 104,909 | ||||||
| 1,800 | McDonald’s Holdings Co. Japan Ltd. | 85,884 | ||||||
| 3,900 | Medipal Holdings Corp. | 74,490 | ||||||
| 2,400 | MEIJI Holdings Co., Ltd. | 147,416 | ||||||
| 2,300 | Mercari Inc.* | 113,633 | ||||||
| 7,700 | MINEBEA MITSUMI Inc. | 198,017 | ||||||
| 127,000 | MISUMI Group Inc. | 5,033,295 | ||||||
| 27,200 | Mitsubishi Chemical Holdings Corp. | 238,558 | ||||||
| 27,200 | Mitsubishi Corp. | 816,408 | ||||||
| 39,600 | Mitsubishi Electric Corp. | 540,195 | ||||||
| 24,900 | Mitsubishi Estate Co., Ltd. | 389,207 | ||||||
| 3,700 | Mitsubishi Gas Chemical Co., Inc. | 69,685 | ||||||
| 14,000 | Mitsubishi HC Capital Inc. | 74,889 | ||||||
| 6,800 | Mitsubishi Heavy Industries Ltd. | 179,141 | ||||||
| 263,700 | Mitsubishi UFJ Financial Group Inc. | 1,425,701 | ||||||
| 33,300 | Mitsui & Co., Ltd. | 732,797 | ||||||
| 3,900 | Mitsui Chemicals Inc. | 134,525 | ||||||
| 20,000 | Mitsui Fudosan Co., Ltd. | 458,345 | ||||||
| 1,900 | Miura Co., Ltd. | 85,237 | ||||||
| 52,090 | Mizuho Financial Group Inc. | 729,930 | ||||||
| 5,400 | MonotaRO Co., Ltd. | 118,863 | ||||||
| 11,700 | Morinaga Milk Industry Co., Ltd. | 735,988 | ||||||
| 9,400 | MS&AD Insurance Group Holdings Inc. | 303,419 | ||||||
| 212,300 | Murata Manufacturing Co., Ltd. | 17,579,497 | ||||||
| 56,400 | Nabtesco Corp. | 2,225,787 | ||||||
| 5,200 | NEC Corp. | 272,907 | ||||||
| 47,000 | NEC Networks & System Integration Corp. | 896,112 | ||||||
| 10,400 | Nexon Co., Ltd. | 189,838 | ||||||
| 5,800 | NGK Insulators Ltd. | 96,106 | ||||||
| 1,700 | NH Foods Ltd. | 65,855 | ||||||
| 16,800 | Nichirei Corp. | 427,920 | ||||||
| 9,600 | Nidec Corp. | 1,100,121 | ||||||
| 6,400 | Nihon M&A Center Inc. | 190,433 | ||||||
| 16,600 | Nikkiso Co., Ltd. | 134,918 | ||||||
| 2,400 | Nintendo Co., Ltd. | 1,153,436 | ||||||
| 113 | Nippon Accommodations Fund Inc., REIT, Class A Shares | 678,833 | ||||||
| 31 | Nippon Building Fund Inc., REIT | 201,433 | ||||||
| 30,500 | Nippon Electric Glass Co., Ltd. | 650,893 | ||||||
| 1,500 | Nippon Express Co., Ltd. | 102,007 | ||||||
See Notes to Financial Statements.
121
| Schedules of Investments |
| (continued) |
| International Equity Fund | ||||||||
| Shares/Units | Security | Value | ||||||
Japan — 17.4% — (continued) | ||||||||
| 15,500 | Nippon Paint Holdings Co., Ltd. | $ | 192,677 | |||||
| 42 | Nippon Prologis REIT Inc. | 151,376 | ||||||
| 3,700 | Nippon Sanso Holdings Corp. | 89,721 | ||||||
| 1,100 | Nippon Shinyaku Co., Ltd. | 89,241 | ||||||
| 18,100 | Nippon Steel Corp. | 368,786 | ||||||
| 27,800 | Nippon Telegraph & Telephone Corp. | 741,598 | ||||||
| 3,800 | Nippon Yusen KK | 305,934 | ||||||
| 2,600 | Nissan Chemical Corp. | 145,645 | ||||||
| 49,300 | Nissan Motor Co., Ltd.* | 258,950 | ||||||
| 3,900 | Nisshin Seifun Group Inc. | 63,933 | ||||||
| 1,300 | Nissin Foods Holdings Co., Ltd. | 101,122 | ||||||
| 1,700 | Nitori Holdings Co., Ltd. | 317,851 | ||||||
| 3,100 | Nitto Denko Corp. | 235,299 | ||||||
| 66,200 | Nomura Holdings Inc. | 320,800 | ||||||
| 2,700 | Nomura Real Estate Holdings Inc. | 69,021 | ||||||
| 87 | Nomura Real Estate Master Fund Inc., REIT | 134,163 | ||||||
| 7,480 | Nomura Research Institute Ltd. | 280,345 | ||||||
| 185,600 | North Pacific Bank Ltd. | 428,022 | ||||||
| 9,500 | NSK Ltd. | 66,573 | ||||||
| 13,400 | NTT Data Corp. | 241,094 | ||||||
| 13,400 | Obayashi Corp. | 109,960 | ||||||
| 1,500 | Obic Co., Ltd. | 284,776 | ||||||
| 6,300 | Odakyu Electric Railway Co., Ltd. | 146,680 | ||||||
| 16,600 | Oji Holdings Corp. | 86,817 | ||||||
| 25,400 | Olympus Corp. | 533,139 | ||||||
| 3,900 | Omron Corp. | 367,534 | ||||||
| 7,800 | Ono Pharmaceutical Co., Ltd. | 187,306 | ||||||
| 24,200 | Open House Co., Ltd. | 1,177,828 | ||||||
| 800 | Oracle Corp. Japan | 65,611 | ||||||
| 4,200 | Oriental Land Co., Ltd. | 635,487 | ||||||
| 26,400 | ORIX Corp. | 493,557 | ||||||
| 55 | Orix JREIT Inc. | 98,011 | ||||||
| 8,000 | Osaka Gas Co., Ltd. | 149,997 | ||||||
| 2,600 | Otsuka Corp. | 134,530 | ||||||
| 8,200 | Otsuka Holdings Co., Ltd. | 348,608 | ||||||
| 28,700 | Outsourcing Inc. | 489,895 | ||||||
| 8,700 | Pan Pacific International Holdings Corp. | 165,242 | ||||||
| 48,100 | Panasonic Corp. | 573,028 | ||||||
| 2,000 | PeptiDream Inc.* | 70,469 | ||||||
| 4,200 | Persol Holdings Co., Ltd. | 98,053 | ||||||
| 2,400 | Pigeon Corp. | 69,436 | ||||||
| 2,000 | Pola Orbis Holdings Inc. | 43,556 | ||||||
| 19,900 | Rakuten Group Inc. | 208,226 | ||||||
| 87,700 | Recruit Holdings Co., Ltd. | 5,174,467 | ||||||
| 26,900 | Renesas Electronics Corp.* | 289,113 | ||||||
| 94,500 | Rengo Co., Ltd. | 769,701 | ||||||
| 44,400 | Resona Holdings Inc. | 171,624 | ||||||
| 30,400 | Resorttrust Inc. | 525,326 | ||||||
| 14,200 | Ricoh Co., Ltd. | 144,437 | ||||||
| 800 | Rinnai Corp. | 85,945 | ||||||
| 1,900 | Rohm Co., Ltd. | 182,384 | ||||||
| 5,000 | Ryohin Keikaku Co., Ltd. | 107,499 | ||||||
| 10,800 | Sankyu Inc. | 503,132 | ||||||
| 7,600 | Santen Pharmaceutical Co., Ltd. | 113,221 | ||||||
| 49,500 | Sanwa Holdings Corp. | 657,023 | ||||||
| 13,400 | Sawai Group Holdings Co., Ltd. | 605,603 | ||||||
See Notes to Financial Statements.
122
| Schedules of Investments |
| (continued) |
| International Equity Fund | ||||||||
| Shares/Units | Security | Value | ||||||
Japan — 17.4% — (continued) | ||||||||
| 5,000 | SBI Holdings Inc. | $ | 121,231 | |||||
| 1,100 | SCSK Corp. | 69,433 | ||||||
| 4,500 | Secom Co., Ltd. | 341,108 | ||||||
| 5,600 | Seiko Epson Corp. | 104,240 | ||||||
| 85,200 | Sekisui Chemical Co., Ltd. | 1,457,526 | ||||||
| 13,200 | Sekisui House Ltd. | 262,872 | ||||||
| 16,300 | Seven & i Holdings Co., Ltd. | 713,036 | ||||||
| 7,000 | SG Holdings Co., Ltd. | 190,236 | ||||||
| 4,700 | Sharp Corp.(a) | 62,006 | ||||||
| 4,900 | Shimadzu Corp. | 219,596 | ||||||
| 1,600 | Shimano Inc. | 469,502 | ||||||
| 12,500 | Shimizu Corp. | 89,686 | ||||||
| 37,300 | Shin-Etsu Chemical Co., Ltd. | 6,164,414 | ||||||
| 47,400 | Shinko Electric Industries Co., Ltd. | 1,594,225 | ||||||
| 5,700 | Shionogi & Co., Ltd. | 360,008 | ||||||
| 25,500 | Ship Healthcare Holdings Inc. | 647,939 | ||||||
| 8,700 | Shiseido Co., Ltd. | 576,348 | ||||||
| 9,700 | Shizuoka Bank Ltd. (The) | 75,933 | ||||||
| 13,100 | SMC Corp. | 8,368,131 | ||||||
| 61,900 | Softbank Corp. | 828,722 | ||||||
| 26,000 | SoftBank Group Corp. | 1,458,901 | ||||||
| 1,400 | Sohgo Security Services Co., Ltd. | 63,382 | ||||||
| 123,200 | Sompo Holdings Inc. | 5,401,568 | ||||||
| 75,600 | Sony Group Corp. | 7,811,100 | ||||||
| 1,900 | Square Enix Holdings Co., Ltd. | 110,298 | ||||||
| 3,300 | Stanley Electric Co., Ltd. | 82,322 | ||||||
| 20,300 | Starts Corp., Inc. | 526,812 | ||||||
| 13,100 | Subaru Corp. | 242,278 | ||||||
| 5,600 | SUMCO Corp. | 117,987 | ||||||
| 30,200 | Sumitomo Chemical Co., Ltd. | 152,974 | ||||||
| 23,600 | Sumitomo Corp. | 333,146 | ||||||
| 3,900 | Sumitomo Dainippon Pharma Co., Ltd. | 69,852 | ||||||
| 16,000 | Sumitomo Electric Industries Ltd. | 213,572 | ||||||
| 30,900 | Sumitomo Forestry Co., Ltd. | 605,945 | ||||||
| 5,400 | Sumitomo Metal Mining Co., Ltd. | 206,835 | ||||||
| 195,590 | Sumitomo Mitsui Financial Group Inc. | 6,738,674 | ||||||
| 7,300 | Sumitomo Mitsui Trust Holdings Inc. | 238,506 | ||||||
| 6,500 | Sumitomo Realty & Development Co., Ltd. | 209,647 | ||||||
| 2,800 | Suntory Beverage & Food Ltd. | 112,049 | ||||||
| 7,800 | Suzuki Motor Corp. | 336,792 | ||||||
| 44,100 | Sysmex Corp. | 5,011,159 | ||||||
| 11,000 | T&D Holdings Inc. | 133,276 | ||||||
| 4,300 | Taisei Corp. | 134,272 | ||||||
| 1,000 | Taisho Pharmaceutical Holdings Co., Ltd. | 58,322 | ||||||
| 17,100 | Taiyo Yuden Co., Ltd. | 964,644 | ||||||
| 459,954 | Takeda Pharmaceutical Co., Ltd. | 15,341,882 | ||||||
| 24,500 | Takeuchi Manufacturing Co., Ltd. | 587,810 | ||||||
| 2,900 | TDK Corp. | 303,492 | ||||||
| 59,400 | Terumo Corp. | 2,480,133 | ||||||
| 2,700 | THK Co., Ltd. | 62,558 | ||||||
| 4,800 | TIS Inc. | 135,305 | ||||||
| 4,100 | Tobu Railway Co., Ltd. | 106,905 | ||||||
| 2,300 | Toho Co., Ltd. | 99,442 | ||||||
| 1,500 | Toho Gas Co., Ltd. | 69,927 | ||||||
| 9,100 | Tohoku Electric Power Co., Inc. | 69,632 | ||||||
| 57,200 | Tokio Marine Holdings Inc. | 2,793,721 | ||||||
See Notes to Financial Statements.
123
| Schedules of Investments |
| (continued) |
| International Equity Fund | ||||||||
| Shares/Units | Security | Value | ||||||
Japan — 17.4% — (continued) | ||||||||
| 800 | Tokyo Century Corp. | $ | 45,687 | |||||
| 32,400 | Tokyo Electric Power Co. Holdings Inc.* | 85,069 | ||||||
| 3,200 | Tokyo Electron Ltd. | 1,365,912 | ||||||
| 8,000 | Tokyo Gas Co., Ltd. | 153,841 | ||||||
| 13,500 | Tokyo Seimitsu Co., Ltd. | 590,437 | ||||||
| 10,200 | Tokyotokeiba Co., Ltd. | 391,014 | ||||||
| 10,600 | Tokyu Corp. | 145,829 | ||||||
| 5,900 | Toppan Inc. | 101,235 | ||||||
| 29,400 | Toray Industries Inc. | 197,960 | ||||||
| 8,800 | Toshiba Corp. | 381,753 | ||||||
| 5,500 | Tosoh Corp. | 99,763 | ||||||
| 3,000 | TOTO Ltd. | 163,136 | ||||||
| 1,800 | Toyo Suisan Kaisha Ltd. | 74,497 | ||||||
| 50,700 | Toyo Tire Corp. | 900,369 | ||||||
| 3,100 | Toyota Industries Corp. | 261,495 | ||||||
| 88,900 | Toyota Motor Corp. | 7,724,290 | ||||||
| 4,500 | Toyota Tsusho Corp. | 198,705 | ||||||
| 2,700 | Trend Micro Inc. | 147,895 | ||||||
| 800 | Tsuruha Holdings Inc. | 100,660 | ||||||
| 8,600 | Unicharm Corp. | 383,149 | ||||||
| 59 | United Urban Investment Corp., REIT | 83,429 | ||||||
| 5,000 | USS Co., Ltd. | 82,695 | ||||||
| 24,000 | Valor Holdings Co., Ltd. | 535,821 | ||||||
| 1,800 | Welcia Holdings Co., Ltd. | 63,539 | ||||||
| 3,500 | West Japan Railway Co. | 191,208 | ||||||
| 2,900 | Yakult Honsha Co., Ltd. | 167,020 | ||||||
| 12,400 | Yamada Holdings Co., Ltd. | 53,281 | ||||||
| 2,900 | Yamaha Corp. | 170,856 | ||||||
| 5,900 | Yamaha Motor Co., Ltd. | 149,985 | ||||||
| 6,500 | Yamato Holdings Co., Ltd. | 165,340 | ||||||
| 35,700 | Yaskawa Electric Corp.(a) | 1,743,220 | ||||||
| 5,600 | Yokogawa Electric Corp. | 87,602 | ||||||
| 56,300 | Z Holdings Corp. | 366,646 | ||||||
| 16,800 | Zenkoku Hosho Co., Ltd. | 799,484 | ||||||
| 32,500 | Zeon Corp. | 430,692 | ||||||
| 2,700 | ZOZO Inc. | 102,703 | ||||||
|
| |||||||
| Total Japan | 253,309,676 | |||||||
|
| |||||||
Jordan — 0.0% | ||||||||
| 20,638 | Hikma Pharmaceuticals PLC | 720,284 | ||||||
|
| |||||||
Luxembourg — 0.4% | ||||||||
| 156,880 | ArcelorMittal SA | 5,264,175 | ||||||
| 21,196 | Aroundtown SA | 162,301 | ||||||
| 2,840 | Eurofins Scientific SE | 402,631 | ||||||
| 10,817 | Tenaris SA | 109,054 | ||||||
|
| |||||||
| Total Luxembourg | 5,938,161 | |||||||
|
| |||||||
Macau — 0.4% | ||||||||
| 1,693,600 | Sands China Ltd.* | 5,444,126 | ||||||
| 33,200 | Wynn Macau Ltd.* | 37,350 | ||||||
|
| |||||||
| Total Macau | 5,481,476 | |||||||
|
| |||||||
Malta — 0.1% | ||||||||
| 71,394 | Kindred Group PLC | 1,312,971 | ||||||
|
| |||||||
Mexico — 0.1% | ||||||||
| 294,631 | Grupo Financiero Banorte SAB de CV, Class O Shares | 1,944,701 | ||||||
|
| |||||||
See Notes to Financial Statements.
124
| Schedules of Investments |
| (continued) |
| International Equity Fund | ||||||||
| Shares/Units | Security | Value | ||||||
Netherlands — 5.3% | ||||||||
| 36,357 | Aalberts NV | $ | 2,267,683 | |||||
| 8,743 | ABN AMRO Group NV, Dutch Certificate, GDR*(c) | 121,631 | ||||||
| 424 | Adyen NV*(c) | 1,374,395 | ||||||
| 37,524 | Aegon NV | 185,147 | ||||||
| 72,765 | Airbus SE* | 9,921,135 | ||||||
| 87,812 | Akzo Nobel NV | 10,826,906 | ||||||
| 2,786 | Argenx SE* | 923,808 | ||||||
| 6,514 | ASM International NV | 2,539,760 | ||||||
| 25,904 | ASML Holding NV | 21,649,841 | ||||||
| 22,324 | ASR Nederland NV | 1,022,476 | ||||||
| 9,480 | Euronext NV(c) | 1,099,593 | ||||||
| 2,286 | EXOR NV | 190,817 | ||||||
| 4,416 | Fugro NV* | 43,799 | ||||||
| 2,445 | Heineken Holding NV | 226,536 | ||||||
| 5,608 | Heineken NV(a) | 614,644 | ||||||
| 348,974 | ING Groep NV | 4,809,552 | ||||||
| 23,771 | Intertrust NV*(c) | 369,063 | ||||||
| 1,579 | JDE Peet’s NV | 54,233 | ||||||
| 3,854 | Just Eat Takeaway.com NV*(c) | 349,063 | ||||||
| 22,553 | Koninklijke Ahold Delhaize NV | 761,479 | ||||||
| 3,729 | Koninklijke DSM NV | 793,321 | ||||||
| 70,482 | Koninklijke KPN NV | 226,055 | ||||||
| 19,588 | Koninklijke Philips NV | 902,802 | ||||||
| 1,492 | Koninklijke Vopak NV | 64,566 | ||||||
| 6,148 | NN Group NV | 318,364 | ||||||
| 20,050 | Prosus NV* | 1,779,998 | ||||||
| 4,811 | QIAGEN NV* | 266,247 | ||||||
| 2,640 | Randstad NV | 193,960 | ||||||
| 367,986 | Royal Dutch Shell PLC, Class A Shares | 7,295,043 | ||||||
| 79,360 | Royal Dutch Shell PLC, Class B Shares | 1,563,061 | ||||||
| 32,986 | SBM Offshore NV | 601,939 | ||||||
| 23,491 | Signify NV(c) | 1,317,548 | ||||||
| 134,239 | Stellantis NV | 2,685,150 | ||||||
| 5,752 | Wolters Kluwer NV | 662,504 | ||||||
|
| |||||||
| Total Netherlands | 78,022,119 | |||||||
|
| |||||||
New Zealand — 0.2% | ||||||||
| 15,616 | a2 Milk Co., Ltd. (The)* | 66,273 | ||||||
| 26,711 | Auckland International Airport Ltd.* | 135,552 | ||||||
| 12,702 | Fisher & Paykel Healthcare Corp., Ltd. | 296,212 | ||||||
| 17,295 | Mercury NZ Ltd. | 80,986 | ||||||
| 27,194 | Meridian Energy Ltd. | 100,569 | ||||||
| 8,488 | Ryman Healthcare Ltd. | 92,345 | ||||||
| 38,983 | Spark New Zealand Ltd. | 133,807 | ||||||
| 15,971 | Xero Ltd.* | 1,764,878 | ||||||
|
| |||||||
| Total New Zealand | 2,670,622 | |||||||
|
| |||||||
Norway — 0.5% | ||||||||
| 6,069 | Adevinta ASA, Class B Shares* | 122,181 | ||||||
| 84,697 | DNB Bank ASA | 1,788,910 | ||||||
| 170,792 | Equinor ASA | 3,625,415 | ||||||
| 4,802 | Gjensidige Forsikring ASA | 112,293 | ||||||
| 9,327 | Mowi ASA | 249,853 | ||||||
| 29,251 | Norsk Hydro ASA | 202,271 | ||||||
| 15,938 | Orkla ASA | 142,451 | ||||||
| 1,592 | Schibsted ASA, Class A Shares | 84,979 | ||||||
| 1,911 | Schibsted ASA, Class B Shares | 88,906 | ||||||
See Notes to Financial Statements.
125
| Schedules of Investments |
| (continued) |
| International Equity Fund | ||||||||
| Shares/Units | Security | Value | ||||||
Norway — 0.5% — (continued) | ||||||||
| 49,148 | Sparebanken Vest | $ | 506,015 | |||||
| 15,305 | Telenor ASA | 268,228 | ||||||
| 3,757 | Yara International ASA | 188,959 | ||||||
|
| |||||||
| Total Norway | 7,380,461 | |||||||
|
| |||||||
Peru — 0.2% | ||||||||
| 23,921 | Credicorp Ltd.* | 2,550,696 | ||||||
|
| |||||||
Poland — 0.0% | ||||||||
| 4,037 | InPost SA* | 78,847 | ||||||
|
| |||||||
Portugal — 0.2% | ||||||||
| 58,580 | EDP — Energias de Portugal SA | 321,707 | ||||||
| 281,237 | Galp Energia SGPS SA | 2,882,463 | ||||||
| 5,342 | Jeronimo Martins SGPS SA | 113,206 | ||||||
|
| |||||||
| Total Portugal | 3,317,376 | |||||||
|
| |||||||
Singapore — 0.8% | ||||||||
| 1,993,158 | Ascendas Real Estate Investment Trust, REIT | 4,503,359 | ||||||
| 93,094 | CapitaLand Integrated Commercial Trust, REIT | 142,461 | ||||||
| 57,900 | CapitaLand Ltd. | 172,075 | ||||||
| 9,400 | City Developments Ltd. | 47,750 | ||||||
| 38,700 | DBS Group Holdings Ltd. | 860,874 | ||||||
| 703,200 | Frasers Logistics & Commercial Trust, REIT | 783,810 | ||||||
| 128,300 | Genting Singapore Ltd. | 72,917 | ||||||
| 30,900 | Keppel Corp., Ltd. | 119,298 | ||||||
| 48,500 | Mapletree Commercial Trust, REIT | 73,131 | ||||||
| 69,888 | Mapletree Logistics Trust, REIT | 105,413 | ||||||
| 70,200 | Oversea-Chinese Banking Corp., Ltd. | 595,256 | ||||||
| 7,459 | Sea Ltd., ADR* | 2,523,529 | ||||||
| 28,650 | Singapore Airlines Ltd.* | 107,637 | ||||||
| 17,600 | Singapore Exchange Ltd. | 129,430 | ||||||
| 33,100 | Singapore Technologies Engineering Ltd. | 92,909 | ||||||
| 184,100 | Singapore Telecommunications Ltd. | 317,138 | ||||||
| 24,803 | United Overseas Bank Ltd. | 470,836 | ||||||
| 9,271 | UOL Group Ltd. | 48,174 | ||||||
| 5,800 | Venture Corp., Ltd. | 82,509 | ||||||
| 40,800 | Wilmar International Ltd. | 125,414 | ||||||
|
| |||||||
| Total Singapore | 11,373,920 | |||||||
|
| |||||||
South Korea — 2.0% | ||||||||
| 10,571 | AfreecaTV Co., Ltd. | 1,394,869 | ||||||
| 4,316 | Cosmax Inc.*(a) | 484,067 | ||||||
| 7,331 | Coway Co., Ltd. | 494,195 | ||||||
| 549 | LEENO Industrial Inc. | 84,331 | ||||||
| 6,467 | Maeil Dairies Co., Ltd. | 406,355 | ||||||
| 28,971 | Neowiz* | 723,957 | ||||||
| 14,774 | Osstem Implant Co., Ltd. | 2,038,508 | ||||||
| 54,312 | Partron Co., Ltd. | 466,690 | ||||||
| 10,142 | PharmaResearch Co., Ltd. | 845,621 | ||||||
| 195,437 | Samsung Electronics Co., Ltd. | 12,906,213 | ||||||
| 39,898 | Samsung Engineering Co., Ltd.* | 766,062 | ||||||
| 3,711 | Samsung SDI Co., Ltd. | 2,527,971 | ||||||
| 18,321 | Seoul Semiconductor Co., Ltd.(a) | 260,077 | ||||||
| 14,445 | SFA Engineering Corp. | 482,366 | ||||||
| 43,829 | SK Hynix Inc. | 4,011,386 | ||||||
| 3,680 | Soulbrain Co., Ltd. | 897,846 | ||||||
See Notes to Financial Statements.
126
| Schedules of Investments |
| (continued) |
| International Equity Fund | ||||||||
| Shares/Units | Security | Value | ||||||
South Korea — 2.0% — (continued) | ||||||||
| 11,209 | WONIK IPS Co., Ltd. | $ | 436,329 | |||||
|
| |||||||
| Total South Korea | 29,226,843 | |||||||
|
| |||||||
Spain — 4.1% | ||||||||
| 4,449 | Acciona SA(a) | 722,713 | ||||||
| 48,375 | Acerinox SA | 658,618 | ||||||
| 5,188 | ACS Actividades de Construccion y Servicios SA | 139,913 | ||||||
| 42,886 | Aena SME SA*(c) | 6,844,491 | ||||||
| 187,141 | Amadeus IT Group SA* | 11,424,925 | ||||||
| 54,796 | Applus Services SA | 533,831 | ||||||
| 1,508,916 | Banco Bilbao Vizcaya Argentaria SA* | 9,843,602 | ||||||
| 370,364 | Banco Santander SA | 1,369,194 | ||||||
| 149,104 | Bankinter SA | 874,583 | ||||||
| 2,479,013 | CaixaBank SA | 7,712,850 | ||||||
| 35,102 | Cellnex Telecom SA(c) | 2,402,660 | ||||||
| 31,084 | Cia de Distribucion Integral Logista Holdings SA | 675,268 | ||||||
| 6,052 | EDP Renovaveis SA | 161,060 | ||||||
| 4,798 | Enagas SA | 109,128 | ||||||
| 6,687 | Endesa SA | 160,860 | ||||||
| 10,697 | Ferrovial SA | 309,459 | ||||||
| 6,330 | Grifols SA | 154,674 | ||||||
| 442,873 | Iberdrola SA | 5,485,304 | ||||||
| 202,626 | Industria de Diseno Textil SA | 6,923,487 | ||||||
| 13,120 | Laboratorios Farmaceuticos Rovi SA | 820,793 | ||||||
| 67,892 | Merlin Properties Socimi SA, REIT | 793,036 | ||||||
| 6,265 | Naturgy Energy Group SA | 161,246 | ||||||
| 9,186 | Red Electrica Corp. SA | 183,116 | ||||||
| 31,603 | Repsol SA | 361,440 | ||||||
| 5,015 | Siemens Gamesa Renewable Energy SA* | 148,836 | ||||||
| 109,901 | Telefonica SA | 542,974 | ||||||
| 7,083 | Viscofan SA | 500,026 | ||||||
|
| |||||||
| Total Spain | 60,018,087 | |||||||
|
| |||||||
Sweden — 1.6% | ||||||||
| 6,676 | Alfa Laval AB | 271,189 | ||||||
| 53,706 | Arjo AB, Class B Shares | 688,564 | ||||||
| 88,766 | Assa Abloy AB, Class B Shares | 2,840,719 | ||||||
| 14,497 | Atlas Copco AB, Class A Shares | 996,802 | ||||||
| 8,281 | Atlas Copco AB, Class B Shares | 479,828 | ||||||
| 5,804 | Boliden AB | 202,699 | ||||||
| 50,569 | Dometic Group AB(c) | 802,632 | ||||||
| 4,612 | Electrolux AB, Series B | 116,804 | ||||||
| 5,494 | Embracer Group AB, Class B Shares* | 124,516 | ||||||
| 13,985 | Epiroc AB, Class A Shares | 307,318 | ||||||
| 8,454 | Epiroc AB, Class B Shares | 160,828 | ||||||
| 5,134 | EQT AB | 262,328 | ||||||
| 13,298 | Essity AB, Class B Shares | 426,710 | ||||||
| 3,655 | Evolution AB(c) | 591,028 | ||||||
| 2,133 | Fastighets AB Balder, Class B Shares* | 152,629 | ||||||
| 11,033 | G5 Entertainment AB | 565,069 | ||||||
| 30,171 | Getinge AB, Class B Shares | 1,238,860 | ||||||
| 15,820 | Hennes & Mauritz AB, Class B Shares* | 317,627 | ||||||
| 42,455 | Hexagon AB, Class B Shares | 736,855 | ||||||
| 8,868 | Husqvarna AB, Class B Shares | 119,075 | ||||||
| 2,167 | ICA Gruppen AB | 107,831 | ||||||
| 2,250 | Industrivarden AB, Class A Shares | 82,945 | ||||||
See Notes to Financial Statements.
127
| Schedules of Investments |
| (continued) |
| International Equity Fund | ||||||||
| Shares/Units | Security | Value | ||||||
Sweden — 1.6% — (continued) | ||||||||
| 3,262 | Industrivarden AB, Class C Shares | $ | 113,893 | |||||
| 3,190 | Investment AB Latour, Class B Shares | 111,170 | ||||||
| 39,196 | Investor AB, Class B Shares | 939,228 | ||||||
| 5,008 | Kinnevik AB, Class B Shares* | 196,092 | ||||||
| 1,736 | L E Lundbergforetagen AB, Class B Shares | 110,952 | ||||||
| 4,431 | Lundin Energy AB | 135,111 | ||||||
| 30,569 | Nibe Industrier AB, Class B Shares | 426,688 | ||||||
| 24,460 | Sandvik AB | 624,733 | ||||||
| 7,153 | Securitas AB, Class B Shares | 118,870 | ||||||
| 10,893 | Sinch AB*(c) | 244,840 | ||||||
| 34,266 | Skandinaviska Enskilda Banken AB, Class A Shares | 459,019 | ||||||
| 7,101 | Skanska AB, Class B Shares | 204,297 | ||||||
| 8,075 | SKF AB, Class B Shares | 206,282 | ||||||
| 13,056 | Svenska Cellulosa AB SCA, Class B Shares | 230,645 | ||||||
| 188,757 | Svenska Handelsbanken AB, Class A Shares | 2,125,395 | ||||||
| 171,466 | Swedbank AB, Class A Shares | 3,302,652 | ||||||
| 34,140 | Swedish Match AB | 315,089 | ||||||
| 10,597 | Tele2 AB, Class B Shares | 158,969 | ||||||
| 62,691 | Telefonaktiebolaget LM Ericsson, Class B Shares | 742,685 | ||||||
| 57,519 | Telia Co. AB | 246,987 | ||||||
| 3,536 | Volvo AB, Class A Shares | 82,055 | ||||||
| 30,739 | Volvo AB, Class B Shares | 696,279 | ||||||
| 28,387 | Wihlborgs Fastigheter AB | 690,765 | ||||||
|
| |||||||
| Total Sweden | 24,075,552 | |||||||
|
| |||||||
Switzerland — 11.1% | ||||||||
| 37,447 | ABB Ltd., Class Registered Shares | 1,384,914 | ||||||
| 17,095 | Adecco Group AG, Class Registered Shares | 950,894 | ||||||
| 36,044 | Alcon Inc. | 2,968,144 | ||||||
| 943 | Baloise Holding AG, Class Registered Shares | 150,374 | ||||||
| 649 | Banque Cantonale Vaudoise, Class Registered Shares | 55,077 | ||||||
| 76 | Barry Callebaut AG, Class Registered Shares | 193,783 | ||||||
| 1,697 | Bossard Holding AG | 571,225 | ||||||
| 2,000 | Bucher Industries AG, Class Registered Shares | 1,010,624 | ||||||
| 235 | Chocoladefabriken Lindt & Spruengli AG | 2,764,586 | ||||||
| 2 | Chocoladefabriken Lindt & Spruengli AG, Class Registered Shares | 244,346 | ||||||
| 86,601 | Cie Financiere Richemont SA, Class Registered Shares | 9,563,617 | ||||||
| 4,226 | Clariant AG, Class Registered Shares* | 88,908 | ||||||
| 19,097 | Coca-Cola HBC AG* | 690,454 | ||||||
| 515,670 | Credit Suisse Group AG, Class Registered Shares | 5,473,542 | ||||||
| 157 | EMS-Chemie Holding AG, Class Registered Shares | 170,054 | ||||||
| 324 | Forbo Holding AG, Class Registered Shares | 694,528 | ||||||
| 806 | Geberit AG, Class Registered Shares | 673,008 | ||||||
| 1,299 | Givaudan SA, Class Registered Shares | 6,521,782 | ||||||
| 214,442 | Glencore PLC* | 965,851 | ||||||
| 11,265 | Holcim Ltd., Class Registered Shares* | 642,586 | ||||||
| 19,131 | Julius Baer Group Ltd. | 1,306,805 | ||||||
| 15,646 | Kuehne + Nagel International AG, Class Registered Shares | 5,730,214 | ||||||
| 21,319 | Logitech International SA, Class Registered Shares | 2,177,961 | ||||||
| 6,818 | Lonza Group AG, Class Registered Shares | 5,765,956 | ||||||
| 159,269 | Nestlé SA, Class Registered Shares | 20,137,581 | ||||||
| 288,248 | Novartis AG, Class Registered Shares | 26,650,072 | ||||||
| 493 | Partners Group Holding AG | 873,600 | ||||||
| 7,544 | PSP Swiss Property AG, Class Registered Shares | 1,011,229 | ||||||
| 75,785 | Roche Holding AG | 30,451,900 | ||||||
| 864 | Schindler Holding AG | 279,219 | ||||||
See Notes to Financial Statements.
128
| Schedules of Investments |
| (continued) |
| International Equity Fund | ||||||||
| Shares/Units | Security | Value | ||||||
Switzerland — 11.1% — (continued) | ||||||||
| 427 | Schindler Holding AG, Class Registered Shares | $ | 133,239 | |||||
| 1,228 | SGS SA, Class Registered Shares | 3,855,661 | ||||||
| 9,111 | Sika AG, Class Registered Shares | 3,286,699 | ||||||
| 1,169 | Sonova Holding AG, Class Registered Shares | 450,926 | ||||||
| 14,511 | STMicroelectronics NV | 645,981 | ||||||
| 776 | Straumann Holding AG, Class Registered Shares | 1,500,832 | ||||||
| 4,414 | Sulzer AG, Class Registered Shares | 664,646 | ||||||
| 657 | Swatch Group AG (The) | 185,083 | ||||||
| 1,068 | Swatch Group AG (The), Class Registered Shares | 58,767 | ||||||
| 2,360 | Swiss Life Holding AG, Class Registered Shares | 1,229,954 | ||||||
| 1,612 | Swiss Prime Site AG, Class Registered Shares | 172,480 | ||||||
| 6,470 | Swiss Re AG | 594,883 | ||||||
| 550 | Swisscom AG, Class Registered Shares | 322,726 | ||||||
| 2,183 | Tecan Group AG, Class Registered Shares | 1,332,592 | ||||||
| 1,388 | Temenos AG, Class Registered Shares | 220,297 | ||||||
| 78,931 | UBS Group AG, Class Registered Shares | 1,312,387 | ||||||
| 9,770 | VAT Group AG(c) | 4,092,348 | ||||||
| 1,096 | Vifor Pharma AG | 155,985 | ||||||
| 11,153 | Vontobel Holding AG, Class Registered Shares | 1,044,262 | ||||||
| 11,048 | Wizz Air Holdings PLC*(c) | 738,460 | ||||||
| 968 | Zur Rose Group AG* | 417,017 | ||||||
| 21,618 | Zurich Insurance Group AG | 9,495,843 | ||||||
|
| |||||||
| Total Switzerland | 162,073,902 | |||||||
|
| |||||||
Taiwan — 0.6% | ||||||||
| 143,000 | Taiwan Semiconductor Manufacturing Co., Ltd. | 3,150,144 | ||||||
| 45,500 | Taiwan Semiconductor Manufacturing Co., Ltd., ADR | 5,414,955 | ||||||
|
| |||||||
| Total Taiwan | 8,565,099 | |||||||
|
| |||||||
United Kingdom — 14.0% | ||||||||
| 21,351 | 3i Group PLC | 392,787 | ||||||
| 49,835 | Abrdn PLC | 181,999 | ||||||
| 4,051 | Admiral Group PLC | 201,072 | ||||||
| 27,650 | Anglo American PLC | 1,167,615 | ||||||
| 9,641 | Ashtead Group PLC | 753,289 | ||||||
| 7,560 | Associated British Foods PLC | 205,900 | ||||||
| 146,021 | AstraZeneca PLC | 17,055,580 | ||||||
| 15,279 | Atlantica Sustainable Infrastructure PLC(a) | 574,643 | ||||||
| 20,574 | Auto Trader Group PLC(c) | 177,952 | ||||||
| 2,344 | AVEVA Group PLC | 133,247 | ||||||
| 84,850 | Aviva PLC | 471,603 | ||||||
| 62,506 | B&M European Value Retail SA | 480,502 | ||||||
| 69,967 | BAE Systems PLC | 546,908 | ||||||
| 342,376 | Balfour Beatty PLC | 1,345,115 | ||||||
| 3,408,445 | Barclays PLC | 8,669,497 | ||||||
| 21,587 | Barratt Developments PLC | 219,422 | ||||||
| 2,564 | Berkeley Group Holdings PLC | 170,222 | ||||||
| 2,437,113 | BP PLC | 9,919,342 | ||||||
| 222,607 | British American Tobacco PLC | 8,351,077 | ||||||
| 18,088 | British Land Co. PLC (The), REIT | 131,914 | ||||||
| 191,370 | BT Group PLC* | 446,375 | ||||||
| 73,606 | Bunzl PLC | 2,668,151 | ||||||
| 106,257 | Burberry Group PLC | 2,718,319 | ||||||
| 261,234 | Cairn Energy PLC | 690,934 | ||||||
| 35,017 | Close Brothers Group PLC | 742,267 | ||||||
| 21,498 | CNH Industrial NV | 354,562 | ||||||
See Notes to Financial Statements.
129
| Schedules of Investments |
| (continued) |
| International Equity Fund | ||||||||
| Shares/Units | Security | Value | ||||||
United Kingdom — 14.0% — (continued) | ||||||||
| 4,321 | �� | Coca-Cola Europacific Partners PLC | $ | 249,495 | ||||
| 410,080 | Compass Group PLC* | 8,464,204 | ||||||
| 32,283 | Computacenter PLC | 1,302,747 | ||||||
| 13,459 | Cranswick PLC | 734,087 | ||||||
| 21,293 | Croda International PLC | 2,676,208 | ||||||
| 236,746 | Diageo PLC | 11,365,669 | ||||||
| 29,178 | Direct Line Insurance Group PLC | 123,987 | ||||||
| 44,662 | Electrocomponents PLC | 653,613 | ||||||
| 26,613 | Endeavour Mining PLC | 650,425 | ||||||
| 40,125 | Entain PLC* | 1,066,032 | ||||||
| 10,549 | Evraz PLC | 85,671 | ||||||
| 4,884 | Ferguson PLC | 705,597 | ||||||
| 35,272 | Future PLC | 1,867,467 | ||||||
| 7,614 | Genus PLC | 621,376 | ||||||
| 274,446 | GlaxoSmithKline PLC | 5,517,386 | ||||||
| 8,056 | Halma PLC | 332,682 | ||||||
| 7,816 | Hargreaves Lansdown PLC | 162,146 | ||||||
| 437,254 | HSBC Holdings PLC | 2,310,322 | ||||||
| 52,800 | IG Group Holdings PLC | 680,000 | ||||||
| 49,312 | IMI PLC | 1,234,890 | ||||||
| 20,777 | Imperial Brands PLC | 440,462 | ||||||
| 42,316 | Inchcape PLC | 534,909 | ||||||
| 31,875 | Informa PLC* | 232,812 | ||||||
| 3,937 | InterContinental Hotels Group PLC* | 251,208 | ||||||
| 22,652 | Intermediate Capital Group PLC | 684,288 | ||||||
| 3,398 | Intertek Group PLC | 246,256 | ||||||
| 37,562 | J Sainsbury PLC | 157,028 | ||||||
| 10,927 | JD Sports Fashion PLC | 151,743 | ||||||
| 4,012 | Johnson Matthey PLC | 162,164 | ||||||
| 614,917 | Kingfisher PLC | 2,962,431 | ||||||
| 15,981 | Land Securities Group PLC, REIT | 155,844 | ||||||
| 130,191 | Legal & General Group PLC | 483,894 | ||||||
| 1,538,740 | Lloyds Banking Group PLC | 922,139 | ||||||
| 6,966 | London Stock Exchange Group PLC | 762,096 | ||||||
| 172,065 | LondonMetric Property PLC, REIT | 619,468 | ||||||
| 53,910 | M&G PLC | 152,602 | ||||||
| 78,433 | Marks & Spencer Group PLC* | 193,561 | ||||||
| 92,784 | Melrose Industries PLC | 213,976 | ||||||
| 86,990 | Micro Focus International PLC | 530,952 | ||||||
| 10,304 | Mondi PLC | 284,157 | ||||||
| 309,999 | National Grid PLC | 4,007,692 | ||||||
| 124,354 | Natwest Group PLC | 364,512 | ||||||
| 14,005 | Next PLC | 1,523,784 | ||||||
| 36,780 | Ocado Group PLC* | 1,018,153 | ||||||
| 122,524 | OSB Group PLC | 858,035 | ||||||
| 15,839 | Pearson PLC | 167,099 | ||||||
| 7,167 | Persimmon PLC | 289,826 | ||||||
| 100,930 | Pets at Home Group PLC | 693,977 | ||||||
| 13,988 | Phoenix Group Holdings PLC | 119,927 | ||||||
| 605,196 | Prudential PLC | 12,613,316 | ||||||
| 105,076 | Reckitt Benckiser Group PLC | 8,003,399 | ||||||
| 104,014 | Redrow PLC | 1,016,112 | ||||||
| 228,416 | RELX PLC | 6,854,144 | ||||||
| 39,244 | Rentokil Initial PLC | 313,217 | ||||||
| 24,240 | Rio Tinto PLC | 1,791,121 | ||||||
| 10,396,637 | Rolls-Royce Holdings PLC* | 16,428,069 | ||||||
See Notes to Financial Statements.
130
| Schedules of Investments |
| (continued) |
| International Equity Fund | ||||||||
| Shares/Units | Security | Value | ||||||
United Kingdom — 14.0% — (continued) | ||||||||
| 109,366 | Royal Mail PLC | $ | 744,230 | |||||
| 67,638 | Safestore Holdings PLC, REIT | 1,073,787 | ||||||
| 24,577 | Sage Group PLC (The) | 250,840 | ||||||
| 2,625 | Schroders PLC | 136,474 | ||||||
| 25,583 | Segro PLC, REIT | 451,691 | ||||||
| 379,040 | Serco Group PLC | 694,833 | ||||||
| 5,049 | Severn Trent PLC | 191,763 | ||||||
| 247,413 | Smith & Nephew PLC | 4,739,028 | ||||||
| 8,407 | Smiths Group PLC | 166,794 | ||||||
| 1,563 | Spirax-Sarco Engineering PLC | 346,272 | ||||||
| 144,619 | Spirent Communications PLC | 593,334 | ||||||
| 22,560 | SSE PLC | 506,005 | ||||||
| 11,202 | St. James’s Place PLC | 248,077 | ||||||
| 57,197 | Standard Chartered PLC | 356,655 | ||||||
| 102,345 | Synthomer PLC | 753,237 | ||||||
| 61,153 | Tate & Lyle PLC | 593,388 | ||||||
| 79,091 | Taylor Wimpey PLC | 198,631 | ||||||
| 168,323 | Tesco PLC | 590,649 | ||||||
| 29,769 | Travis Perkins PLC* | 736,468 | ||||||
| 167,991 | Tritax Big Box REIT PLC | 547,519 | ||||||
| 272,754 | Unilever PLC | 15,172,620 | ||||||
| 32,459 | UNITE Group PLC (The), REIT | 545,720 | ||||||
| 14,470 | United Utilities Group PLC | 210,423 | ||||||
| 50,227 | Vistry Group PLC | 835,974 | ||||||
| 583,933 | Vodafone Group PLC | 978,900 | ||||||
| 183,089 | WH Smith PLC*(c) | 4,110,715 | ||||||
| 33,417 | Whitbread PLC* | 1,474,655 | ||||||
| 51,017 | WM Morrison Supermarkets PLC | 203,431 | ||||||
| 26,779 | WPP PLC | 362,981 | ||||||
|
| |||||||
| Total United Kingdom | 203,593,765 | |||||||
|
| |||||||
United States — 0.2% | ||||||||
| 1,069 | Booking Holdings Inc.* | 2,458,347 | ||||||
| 366,000 | Nexteer Automotive Group Ltd. | 411,615 | ||||||
| 164,017 | Reliance Worldwide Corp., Ltd. | 702,543 | ||||||
|
| |||||||
| Total United States | 3,572,505 | |||||||
|
| |||||||
| TOTAL COMMON STOCKS (Cost — $1,053,185,025) | 1,413,075,362 | |||||||
|
| |||||||
PREFERRED STOCKS — 0.3% | ||||||||
Germany — 0.3% | ||||||||
| 1,338 | Bayerische Motoren Werke AG, Class Preferred Shares | 111,970 | ||||||
| 1,540 | FUCHS PETROLUB SE, Class Preferred Shares | 77,936 | ||||||
| 3,751 | Henkel AG & Co. KGaA, Class Preferred Shares | 366,333 | ||||||
| 3,249 | Porsche Automobil Holding SE, Class Preferred Shares | 328,935 | ||||||
| 573 | Sartorius AG, Class Preferred Shares | 377,436 | ||||||
| 11,125 | Volkswagen AG, Class Preferred Shares | 2,643,217 | ||||||
|
| |||||||
| TOTAL PREFERRED STOCKS (Cost — $2,750,806) | 3,905,827 | |||||||
|
| |||||||
CLOSED END MUTUAL FUND SECURITY — 0.1% | ||||||||
United States — 0.1% | ||||||||
| 11,761 | Vanguard FTSE Developed Markets ETF, Common Class | |||||||
| (Cost — $440,084) | 616,982 | |||||||
|
| |||||||
| TOTAL INVESTMENTS IN SECURITIES BEFORE SHORT-TERM INVESTMENTS (Cost — $1,056,375,915) | 1,417,598,171 | |||||||
|
| |||||||
See Notes to Financial Statements.
131
| Schedules of Investments |
| (continued) |
| International Equity Fund | ||||||||
| Face Amount† | Security | Value | ||||||
SHORT-TERM INVESTMENTS (d) — 2.5% | ||||||||
CONVERTIBLE BOND — 0.1% | ||||||||
| Credit Suisse Group Guernsey VII Ltd.: | ||||||||
| 1,170,000 | CHF | 3.000% due 11/12/21(c)(e) (Cost — $1,279,876) | $ | 1,277,572 | ||||
|
| |||||||
MONEY MARKET FUND — 0.4% | ||||||||
| $ | 6,097,629 | Invesco STIT — Government & Agency Portfolio, 0.026%, Institutional Class(f) (Cost — $6,097,629) | 6,097,629 | |||||
|
| |||||||
TIME DEPOSITS — 2.0% | ||||||||
| 122,746 | ANZ National Bank — London, 0.005% due 9/1/21 | 122,746 | ||||||
| 3,841,311 | Banco Santander — Frankfurt, 0.005% due 9/1/21 | 3,841,311 | ||||||
| 5,404,993 | Barclays Bank PLC — London, 0.005% due 9/1/21 | 5,404,993 | ||||||
| BBH — Grand Cayman: | ||||||||
| 185,026 | DKK | (0.470)% due 9/1/21 | 29,377 | |||||
| 232,774 | AUD | (0.120)% due 9/1/21 | 170,286 | |||||
| 182,374 | NOK | (0.080)% due 9/1/21 | 20,979 | |||||
| 11,477 | NZD | 0.005% due 9/1/21 | 8,088 | |||||
| 2,339 | CAD | 0.010% due 9/1/21 | 1,854 | |||||
| 1,164 | ZAR | 3.800% due 9/1/21 | 80 | |||||
| BNP Paribas — Paris: | ||||||||
| 342,152 | CHF | (1.430)% due 9/1/21 | 373,610 | |||||
| 205,723 | EUR | (0.780)% due 9/1/21 | 242,907 | |||||
| 118,572 | 0.005% due 9/1/21 | 118,572 | ||||||
| Citibank — London: | ||||||||
| 297,497 | EUR | (0.780)% due 9/1/21 | 351,269 | |||||
| 67,319 | GBP | 0.005% due 9/1/21 | 92,554 | |||||
| 1,083,628 | HKD | HSBC Bank — Hong Kong, 0.000% due 9/1/21 | 139,329 | |||||
| 73,547 | SGD | HSBC Bank — Singapore, 0.005% due 9/1/21 | 54,704 | |||||
| 4,353,534 | Royal Bank of Canada — Toronto, 0.005% due 9/1/21 | 4,353,534 | ||||||
| 14,195,103 | Skandinaviska Enskilda Banken AB — Stockholm, 0.005% due 9/1/21 | 14,195,103 | ||||||
| 769,062 | SEK | Skandinaviska Enskilda Banken AB — Sweden, (0.250)% due 9/1/21 | 89,109 | |||||
| 7,191,777 | JPY | Sumitomo Mitsui Banking Corp. — Tokyo, (0.310)% due 9/1/21 | 65,371 | |||||
|
| |||||||
| TOTAL TIME DEPOSITS (Cost — $29,675,776) | 29,675,776 | |||||||
|
| |||||||
| TOTAL SHORT-TERM INVESTMENTS (Cost — $37,053,281) | 37,050,977 | |||||||
|
| |||||||
| TOTAL INVESTMENTS — 99.8% (Cost — $1,093,429,196) | 1,454,649,148 | |||||||
|
| |||||||
| Other Assets in Excess of Liabilities — 0.2% | 3,006,324 | |||||||
|
| |||||||
| TOTAL NET ASSETS — 100.0% | $ | 1,457,655,472 | ||||||
|
| |||||||
| † | Amount denominated in U.S. dollars, unless otherwise noted. |
| * | Non-income producing security. |
| (a) | All or a portion of this security is on loan (See Note 1). |
| (b) | Security trades on the Hong Kong exchange. |
| (c) | Restricted security that may be sold to “qualified institutional buyers” pursuant to the conditions of Rule 144A under the Securities Act of 1933, as amended. This security has been deemed liquid pursuant to guidelines approved by the Board of Trustees, unless otherwise noted. The aggregate value of restricted 144A holdings at August 31, 2021, amounts to $45,746,834 and represents 3.1% of net assets. |
| (d) | Inclusive of all short-term holdings, including investments of collateral received from securities lending transactions. Excluding such collateral, the percentage of portfolio holdings would be 2.1%. |
| (e) | Illiquid security. |
| (f) | Represents investments of collateral received from securities lending transactions. |
See Notes to Financial Statements.
132
| Schedules of Investments |
| (continued) |
| International Equity Fund | ||||
At August 31, 2021, for International Equity Fund the aggregate cost of investments, the aggregate gross unrealized appreciation and depreciation of all investments for federal income tax purposes were as follows:
| Fund | Aggregate Cost For Federal Income Tax Purposes | Gross Unrealized Appreciation | Gross Unrealized (Depreciation) | Net | ||||||||||||
International Equity Fund | $ | 1,130,279,297 | $ | 403,090,324 | $ | (78,537,676 | ) | $ | 324,552,648 | |||||||
Abbreviations used in this schedule: | ||
| ADR | — American Depositary Receipts | |
| CDI | — Clearing House Electronics System (CHESS) Depositary Interest | |
| GDR | — Global Depositary Receipt | |
| PLC | — Public Limited Company | |
| REIT | — Real Estate Investment Trust | |
| Summary of Investments by Security Sector^ | ||||
Industrials | 19.0 | % | ||
Health Care | 15.0 | |||
Financials | 14.7 | |||
Information Technology | 12.0 | |||
Consumer Discretionary | 10.5 | |||
Consumer Staples | 8.2 | |||
Materials | 7.0 | |||
Utilities | 3.4 | |||
Energy | 3.3 | |||
Real Estate | 2.5 | |||
Communication Services | 2.4 | |||
Short-Term Investments | 2.0 | |||
|
| |||
| 100.0 | %+ | |||
|
| |||
| ^ | As a percentage of total investments. |
| + | Does not reflect investments of collateral received from securities lending transactions. |
At August 31, 2021, International Equity Fund had open exchange-traded futures contracts as described below.
The unrealized appreciation (depreciation) on the open contracts reflected in the accompanying financial statements were as follows:
| Open Futures Contracts | Number of Contracts | Expiration Date (Month/Year) | Notional Amount | Market Value | Unrealized Appreciation/ (Depreciation) | |||||||||||||||
| Contracts to Buy: | ||||||||||||||||||||
Euro STOXX 50 September Futures | 14 | 9/21 | $ | 684,070 | $ | 691,222 | $ | 7,152 | ||||||||||||
FTSE 100 Index September Futures | 3 | 9/21 | 293,857 | 292,699 | (1,158 | ) | ||||||||||||||
SPI 200 Index September Futures | 2 | 9/21 | 272,131 | 273,490 | 1,359 | |||||||||||||||
TOPIX Index September Futures | 3 | 9/21 | 528,201 | 535,700 | 7,499 | |||||||||||||||
|
| |||||||||||||||||||
| $ | 14,852 | |||||||||||||||||||
|
| |||||||||||||||||||
At August 31, 2021, International Equity Fund had deposited cash of $120,400 with a broker or brokers as margin collateral on an open exchange-traded futures contracts.
See Notes to Financial Statements.
133
| Schedules of Investments |
| (continued) |
| International Equity Fund | ||||
Currency Abbreviations used in this schedule: | ||
| AUD | — Australian Dollar | |
| CAD | — Canadian Dollar | |
| CHF | — Swiss Franc | |
| DKK | — Danish Krone | |
| EUR | — Euro | |
| GBP | — British Pound | |
| HKD | — Hong Kong Dollar | |
| JPY | — Japanese Yen | |
| NOK | — Norwegian Krone | |
| NZD | — New Zealand Dollar | |
| SEK | — Swedish Krona | |
| SGD | — Singapore Dollar | |
| ZAR | — South African Rand | |
See Notes to Financial Statements.
134
| Schedules of Investments |
| (continued) |
| Emerging Markets Equity Fund | ||||||||
| Shares/Units | Security | Value | ||||||
COMMON STOCKS — 96.1% | ||||||||
Argentina — 0.5% | ||||||||
| 1,555 | MercadoLibre Inc.* | $ | 2,903,885 | |||||
| 5,996 | YPF SA, ADR* | 31,239 | ||||||
|
| |||||||
| Total Argentina | 2,935,124 | |||||||
|
| |||||||
Australia — 0.0% | ||||||||
| 52,000 | MMG Ltd.* | 25,072 | ||||||
|
| |||||||
Brazil — 4.6% | ||||||||
| 102,908 | Ambev SA | 340,402 | ||||||
| 7,535 | Americanas SA* | 60,285 | ||||||
| 7,621 | Atacadao SA | 26,757 | ||||||
| 784,886 | B3 SA — Brasil Bolsa Balcao | 2,136,230 | ||||||
| 35,917 | Banco Bradesco SA | 138,539 | ||||||
| 24,412 | Banco BTG Pactual SA | 133,451 | ||||||
| 359,086 | Banco do Brasil SA | 2,113,721 | ||||||
| 7,416 | Banco Inter SA | 97,248 | ||||||
| 9,295 | Banco Santander Brasil SA | 75,409 | ||||||
| 322,232 | BB Seguridade Participacoes SA | 1,188,061 | ||||||
| 14,894 | BRF SA* | 67,475 | ||||||
| 653,680 | CCR SA | 1,548,990 | ||||||
| 7,810 | Centrais Eletricas Brasileiras SA | 56,850 | ||||||
| 7,187 | Cia de Saneamento Basico do Estado de Sao Paulo | 50,230 | ||||||
| 14,314 | Cia Siderurgica Nacional SA | 96,524 | ||||||
| 660,730 | Cosan SA | 2,818,252 | ||||||
| 4,500 | CPFL Energia SA | 25,279 | ||||||
| 5,411 | Energisa SA | 46,442 | ||||||
| 101,326 | Engie Brasil Energia SA | 736,000 | ||||||
| 19,967 | Equatorial Energia SA | 98,299 | ||||||
| 196,900 | Fleury SA | 901,172 | ||||||
| 22,090 | Hapvida Participacoes e Investimentos SA(a) | 62,900 | ||||||
| 8,769 | Hypera SA | 60,337 | ||||||
| 49,200 | Infracommerce CXAAS SA* | 168,361 | ||||||
| 18,907 | JBS SA | 114,000 | ||||||
| 460,700 | JSL SA | 922,371 | ||||||
| 16,319 | Klabin SA* | 83,054 | ||||||
| 13,764 | Localiza Rent a Car SA | 147,663 | ||||||
| 146,900 | Locaweb Servicos de Internet SA, (Restricted, cost — $136,846, acquired 4/17/20)(a)(b) | 695,918 | ||||||
| 18,150 | Lojas Renner SA | 133,627 | ||||||
| 63,386 | Magazine Luiza SA | 223,648 | ||||||
| 272,800 | Movida Participacoes SA | 976,255 | ||||||
| 19,315 | Natura & Co. Holding SA* | 192,868 | ||||||
| 10,778 | Notre Dame Intermedica Participacoes SA | 166,667 | ||||||
| 443,700 | Odontoprev SA | 1,077,161 | ||||||
| 202,950 | Petrobras Distribuidora SA | 1,067,445 | ||||||
| 79,920 | Petroleo Brasileiro SA | 431,637 | ||||||
| 108,736 | �� | Petróleo Brasileiro SA, ADR | 1,178,698 | |||||
| 24,959 | Raia Drogasil SA | 123,406 | ||||||
| 66,310 | Rede D’Or Sao Luiz SA, (Restricted, cost — $876,395, acquired 8/31/21)(a)(b) | 882,757 | ||||||
| 97,941 | Rumo SA* | 354,664 | ||||||
| 16,504 | Suzano SA* | 194,745 | ||||||
| 18,442 | TIM SA | 44,450 | ||||||
| 12,300 | TOTVS SA | 94,221 | ||||||
| 16,567 | Ultrapar Participações SA | 46,276 | ||||||
| 84,937 | Vale SA | 1,621,337 | ||||||
| 358,400 | Vamos Locacao de Caminhoes Maquinas e Equipamentos SA* | 1,054,495 | ||||||
| 34,547 | Vasta Platform Ltd., Class A Shares* | 193,118 | ||||||
See Notes to Financial Statements.
135
| Schedules of Investments |
| (continued) |
| Emerging Markets Equity Fund | ||||||||
| Shares/Units | Security | Value | ||||||
Brazil — 4.6% — (continued) | ||||||||
| 24,735 | Via SA* | $ | 49,714 | |||||
| 36,784 | WEG SA | 253,028 | ||||||
| 153,100 | Westwing Comercio Varejista Ltda* | 208,199 | ||||||
|
| |||||||
| Total Brazil | 25,578,636 | |||||||
|
| |||||||
Chile — 0.6% | ||||||||
| 129,874 | Antofagasta PLC | 2,595,860 | ||||||
| 847,102 | Banco de Chile | 82,834 | ||||||
| 969 | Banco de Credito e Inversiones SA | 42,003 | ||||||
| 1,335,050 | Banco Santander Chile | 70,591 | ||||||
| 29,156 | Cencosud SA | 55,045 | ||||||
| 12,906 | Cencosud Shopping SA | 18,358 | ||||||
| 2,598 | Cia Cervecerias Unidas SA | 26,238 | ||||||
| 115,265 | Colbun SA | 19,092 | ||||||
| 31,677 | Empresas CMPC SA | 70,413 | ||||||
| 9,480 | Empresas COPEC SA | 88,250 | ||||||
| 473,707 | Enel Americas SA | 66,609 | ||||||
| 564,409 | Enel Chile SA | 28,829 | ||||||
| 16,321 | Falabella SA | 64,686 | ||||||
|
| |||||||
| Total Chile | 3,228,808 | |||||||
|
| |||||||
China — 26.3% | ||||||||
| 2,081 | 21Vianet Group Inc., ADR* | 41,183 | ||||||
| 1,844 | 360 DigiTech Inc., ADR* | 42,043 | ||||||
| 9,300 | 360 Security Technology Inc., Class A Shares* | 17,111 | ||||||
| 32,500 | 3SBio Inc.*(a) | 36,249 | ||||||
| 662 | 51job Inc., ADR* | 50,842 | ||||||
| 129,982 | AAC Technologies Holdings Inc. | 723,593 | ||||||
| 794 | Advanced Micro-Fabrication Equipment Inc., Class A Shares* | 20,281 | ||||||
| 3,000 | AECC Aviation Power Co., Ltd., Class A Shares | 31,667 | ||||||
| 24,000 | Agile Group Holdings Ltd. | 27,504 | ||||||
| 1,011 | Agora Inc., ADR*(c) | 34,293 | ||||||
| 106,600 | Agricultural Bank of China Ltd., Class A Shares | 48,902 | ||||||
| 562,000 | Agricultural Bank of China Ltd., Class H Shares(d) | 188,366 | ||||||
| 6,577 | Aier Eye Hospital Group Co., Ltd., Class A Shares | 42,954 | ||||||
| 40,000 | Air China Ltd., Class H Shares*(d) | 26,853 | ||||||
| 3,000 | Airtac International Group | 91,346 | ||||||
| 6,000 | Akeso Inc.*(a) | 30,970 | ||||||
| 456,576 | Alibaba Group Holding Ltd.* | 9,559,473 | ||||||
| 43,216 | Alibaba Group Holding Ltd., ADR* | 7,216,640 | ||||||
| 825,750 | A-Living Smart City Services Co., Ltd., (Restricted, cost — $2,118,139, acquired 5/28/21)(a)(b)(d) | 3,268,527 | ||||||
| 31,400 | Aluminum Corp. of China Ltd., Class A Shares* | 37,569 | ||||||
| 74,000 | Aluminum Corp. of China Ltd., Class H Shares*(d) | 54,153 | ||||||
| 2,500 | Angel Yeast Co., Ltd., Class A Shares | 15,510 | ||||||
| 6,100 | Anhui Conch Cement Co., Ltd., Class A Shares | 37,823 | ||||||
| 308,837 | Anhui Conch Cement Co., Ltd., Class H Shares(d) | 1,668,114 | ||||||
| 500 | Anhui Gujing Distillery Co., Ltd., Class A Shares | 16,411 | ||||||
| 2,300 | Anhui Gujing Distillery Co., Ltd., Class B Shares | 28,082 | ||||||
| 23,000 | ANTA Sports Products Ltd. | 473,423 | ||||||
| 500 | Asymchem Laboratories Tianjin Co., Ltd., Class A Shares | 27,080 | ||||||
| 1,262 | Autohome Inc., ADR | 55,856 | ||||||
| 34,799 | AVIC Industry-Finance Holdings Co., Ltd., Class A Shares | 21,329 | ||||||
| 42,000 | AviChina Industry & Technology Co., Ltd., Class H Shares(d) | 35,179 | ||||||
| 5,972 | Baidu Inc., ADR* | 937,723 | ||||||
| 19,200 | Bank of Beijing Co., Ltd., Class A Shares | 12,910 | ||||||
| 58,930 | Bank of China Ltd., Class A Shares | 27,673 | ||||||
| 1,713,000 | Bank of China Ltd., Class H Shares(d) | 600,494 | ||||||
See Notes to Financial Statements.
136
| Schedules of Investments |
| (continued) |
| Emerging Markets Equity Fund | ||||||||
| Shares/Units | Security | Value | ||||||
China — 26.3% — (continued) | ||||||||
| 39,800 | Bank of Communications Co., Ltd., Class A Shares | $ | 27,245 | |||||
| 176,000 | Bank of Communications Co., Ltd., Class H Shares(d) | 101,122 | ||||||
| 4,600 | Bank of Hangzhou Co., Ltd., Class A Shares | 9,540 | ||||||
| 19,890 | Bank of Jiangsu Co., Ltd., Class A Shares | 19,812 | ||||||
| 16,600 | Bank of Nanjing Co., Ltd., Class A Shares | 24,119 | ||||||
| 10,900 | Bank of Ningbo Co., Ltd., Class A Shares | 54,542 | ||||||
| 29,640 | Bank of Shanghai Co., Ltd., Class A Shares | 33,102 | ||||||
| 30,184 | Baoshan Iron & Steel Co., Ltd., Class A Shares | 47,501 | ||||||
| 941 | Baozun Inc., ADR* | 22,659 | ||||||
| 973 | BeiGene Ltd., ADR* | 299,976 | ||||||
| 54,000 | Beijing Capital International Airport Co., Ltd., Class H Shares*(d) | 32,554 | ||||||
| 496 | Beijing Kingsoft Office Software Inc., Class A Shares* | 19,175 | ||||||
| 2,000 | Beijing New Building Materials PLC, Class A Shares | 10,244 | ||||||
| 4,000 | Beijing Tiantan Biological Products Corp., Ltd., Class A Shares | 19,212 | ||||||
| 55,900 | Beijing-Shanghai High Speed Railway Co., Ltd., Class A Shares | 41,125 | ||||||
| 200 | Betta Pharmaceuticals Co., Ltd., Class A Shares | 2,285 | ||||||
| 1,000 | BGI Genomics Co., Ltd., Class A Shares | 14,544 | ||||||
| 3,349 | Bilibili Inc., ADR*(c) | 268,690 | ||||||
| 38,300 | BOE Technology Group Co., Ltd., Class A Shares | 34,508 | ||||||
| 939 | Burning Rock Biotech Ltd., ADR* | 17,494 | ||||||
| 2,500 | BYD Co., Ltd., Class A Shares | 107,516 | ||||||
| 16,500 | BYD Co., Ltd., Class H Shares(d) | 557,649 | ||||||
| 14,500 | BYD Electronic International Co., Ltd.(c) | 66,049 | ||||||
| 1,800 | CanSino Biologics Inc., Class H Shares*(a)(c)(d) | 71,175 | ||||||
| 227,000 | CGN Power Co., Ltd., Class H Shares(a)(d) | 50,179 | ||||||
| 400 | Changchun High & New Technology Industry Group Inc., Class A Shares | 15,768 | ||||||
| 1,100 | Changjiang Securities Co., Ltd., Class A Shares | 1,274 | ||||||
| 3,900 | Chaozhou Three-Circle Group Co., Ltd., Class A Shares | 22,705 | ||||||
| 35,000 | China Aoyuan Group Ltd. | 20,963 | ||||||
| 57,500 | China Bohai Bank Co., Ltd., Class H Shares(a)(d) | 23,332 | ||||||
| 255,000 | China Cinda Asset Management Co., Ltd., Class H Shares(d) | 45,199 | ||||||
| 189,000 | China CITIC Bank Corp., Ltd., Class H Shares(d) | 86,942 | ||||||
| 82,000 | China Communications Services Corp., Ltd., Class H Shares(d) | 43,621 | ||||||
| 111,500 | China Conch Venture Holdings Ltd. | 455,469 | ||||||
| 21,100 | China Construction Bank Corp., Class A Shares | 19,119 | ||||||
| 6,742,224 | China Construction Bank Corp., Class H Shares(d) | 4,864,151 | ||||||
| 4,500 | China East Education Holdings Ltd.(a) | 4,812 | ||||||
| 27,298 | China Eastern Airlines Corp., Ltd., Class A Shares* | 19,877 | ||||||
| 30,812 | China Everbright Bank Co., Ltd., Class A Shares | 15,988 | ||||||
| 93,000 | China Everbright Bank Co., Ltd., Class H Shares(d) | 33,351 | ||||||
| 47,000 | China Evergrande Group(c) | 26,309 | ||||||
| 608,000 | China Feihe Ltd., (Restricted, cost — $1,606,931, acquired 4/8/21)(a)(b) | 1,101,235 | ||||||
| 4,901 | China Fortune Land Development Co., Ltd., Class A Shares* | 2,875 | ||||||
| 13,200 | China Galaxy Securities Co., Ltd., Class A Shares | 21,034 | ||||||
| 50,500 | China Galaxy Securities Co., Ltd., Class H Shares(d) | 28,353 | ||||||
| 1,500 | China Greatwall Technology Group Co., Ltd., Class A Shares | 3,412 | ||||||
| 45,500 | China Hongqiao Group Ltd. | 67,348 | ||||||
| 286,000 | China Huarong Asset Management Co., Ltd., Class H Shares*(a)(d)(e)(f) | 28,131 | ||||||
| 102,000 | China Huishan Dairy Holdings Co., Ltd.*#(e)(f) | — | ||||||
| 34,000 | China International Capital Corp., Ltd., Class H Shares(a)(d) | 78,904 | ||||||
| 7,200 | China Jushi Co., Ltd., Class A Shares | 19,541 | ||||||
| 22,000 | China Lesso Group Holdings Ltd. | 46,968 | ||||||
| 4,800 | China Life Insurance Co., Ltd., Class A Shares | 21,425 | ||||||
| 160,000 | China Life Insurance Co., Ltd., Class H Shares(d) | 267,621 | ||||||
| 8,800 | China Literature Ltd.*(a) | 73,810 | ||||||
| 70,000 | China Longyuan Power Group Corp., Ltd., Class H Shares(d) | 142,457 | ||||||
See Notes to Financial Statements.
137
| Schedules of Investments |
| (continued) |
| Emerging Markets Equity Fund | ||||||||
| Shares/Units | Security | Value | ||||||
China — 26.3% — (continued) | ||||||||
| 27,000 | China Medical System Holdings Ltd. | $ | 52,788 | |||||
| 14,000 | China Meidong Auto Holdings., Ltd. | 70,252 | ||||||
| 27,000 | China Merchants Bank Co., Ltd., Class A Shares | 205,346 | ||||||
| 636,891 | China Merchants Bank Co., Ltd., Class H Shares(d) | 5,255,075 | ||||||
| 24,480 | China Merchants Energy Shipping Co., Ltd., Class A Shares | 16,451 | ||||||
| 9,230 | China Merchants Securities Co., Ltd., Class A Shares | 25,946 | ||||||
| 14,820 | China Merchants Shekou Industrial Zone Holdings Co., Ltd., Class A Shares | 22,895 | ||||||
| 55,920 | China Minsheng Banking Corp., Ltd., Class A Shares | 34,419 | ||||||
| 95,700 | China Minsheng Banking Corp., Ltd., Class H Shares(d) | 39,973 | ||||||
| 26,600 | China Molybdenum Co., Ltd., Class A Shares | 32,023 | ||||||
| 81,000 | China Molybdenum Co., Ltd., Class H Shares(d) | 63,157 | ||||||
| 84,000 | China National Building Material Co., Ltd., Class H Shares(d) | 114,994 | ||||||
| 18,900 | China National Nuclear Power Co., Ltd., Class A Shares | 16,043 | ||||||
| 600 | China National Software & Service Co., Ltd., Class A Shares | 4,520 | ||||||
| 5,200 | China Northern Rare Earth Group High-Tech Co., Ltd., Class A Shares | 46,410 | ||||||
| 30,000 | China Oilfield Services Ltd., Class H Shares(d) | 26,063 | ||||||
| 10,500 | China Pacific Insurance Group Co., Ltd., Class A Shares | 42,735 | ||||||
| 52,400 | China Pacific Insurance Group Co., Ltd., Class H Shares(d) | 147,340 | ||||||
| 38,900 | China Petroleum & Chemical Corp., Class A Shares | 25,646 | ||||||
| 490,000 | China Petroleum & Chemical Corp., Class H Shares(d) | 236,279 | ||||||
| 27,800 | China Railway Group Ltd., Class A Shares | 24,231 | ||||||
| 77,000 | China Railway Group Ltd., Class H Shares(d) | 36,906 | ||||||
| 12,200 | China Resources Mixc Lifestyle Services Ltd.(a) | 63,986 | ||||||
| 20,500 | China Resources Pharmaceutical Group Ltd.(a) | 10,668 | ||||||
| 6,299 | China Shenhua Energy Co., Ltd., Class A Shares | 19,457 | ||||||
| 883,000 | China Shenhua Energy Co., Ltd., Class H Shares(d) | 1,947,511 | ||||||
| 9,100 | China South Publishing & Media Group Co., Ltd., Class A Shares | 12,264 | ||||||
| 20,400 | China Southern Airlines Co., Ltd., Class A Shares* | 18,201 | ||||||
| 44,000 | China Southern Airlines Co., Ltd., Class H Shares*(d) | 25,606 | ||||||
| 57,440 | China State Construction Engineering Corp., Ltd., Class A Shares | 42,704 | ||||||
| 2,735 | China Tourism Group Duty Free Corp., Ltd., Class A Shares | 96,621 | ||||||
| 972,000 | China Tower Corp., Ltd., Class H Shares(a)(d) | 127,493 | ||||||
| 40,000 | China United Network Communications Ltd., Class A Shares* | 25,969 | ||||||
| 15,600 | China Vanke Co., Ltd., Class A Shares | 47,947 | ||||||
| 407,600 | China Vanke Co., Ltd., Class H Shares(d) | 1,097,074 | ||||||
| 31,600 | China Yangtze Power Co., Ltd., Class A Shares | 94,690 | ||||||
| 34,000 | China Yuhua Education Corp., Ltd.(a) | 18,151 | ||||||
| 40,300 | China Zheshang Bank Co., Ltd., Class A Shares | 22,167 | ||||||
| 56,000 | Chinasoft International Ltd.* | 94,899 | ||||||
| 1,760 | Chindata Group Holdings Ltd., ADR* | 20,909 | ||||||
| 300 | Chongqing Brewery Co., Ltd., Class A Shares* | 6,516 | ||||||
| 5,740 | Chongqing Changan Automobile Co., Ltd., Class A Shares | 18,339 | ||||||
| 24,000 | Chongqing Rural Commercial Bank Co., Ltd., Class H Shares(d) | 9,199 | ||||||
| 2,000 | Chongqing Zhifei Biological Products Co., Ltd., Class A Shares | 54,780 | ||||||
| 16,000 | CIFI Ever Sunshine Services Group Ltd. | 33,072 | ||||||
| 84,000 | CIFI Holdings Group Co., Ltd. | 56,565 | ||||||
| 126,000 | CITIC Ltd. | 156,507 | ||||||
| 15,100 | CITIC Securities Co., Ltd., Class A Shares | 60,008 | ||||||
| 50,000 | CITIC Securities Co., Ltd., Class H Shares(d) | 126,416 | ||||||
| 48,800 | Contemporary Amperex Technology Co., Ltd., Class A Shares | 3,749,695 | ||||||
| 12,220 | COSCO SHIPPING Holdings Co., Ltd., Class A Shares* | 39,125 | ||||||
| 81,250 | COSCO SHIPPING Holdings Co., Ltd., Class H Shares*(c)(d) | 153,116 | ||||||
| 167,000 | Country Garden Holdings Co., Ltd. | 184,376 | ||||||
| 31,000 | Country Garden Services Holdings Co., Ltd. | 235,795 | ||||||
| 31,400 | CRRC Corp., Ltd., Class A Shares* | 32,840 | ||||||
| 3,800 | CSC Financial Co., Ltd., Class A Shares | 16,467 | ||||||
See Notes to Financial Statements.
138
| Schedules of Investments |
| (continued) |
| Emerging Markets Equity Fund | ||||||||
| Shares/Units | Security | Value | ||||||
China — 26.3% — (continued) | ||||||||
| 201,120 | CSPC Pharmaceutical Group Ltd. | $ | 254,402 | |||||
| 1,263 | Dada Nexus Ltd., ADR* | 29,908 | ||||||
| 59,000 | Dali Foods Group Co., Ltd.(a) | 33,043 | ||||||
| 1,022 | Daqo New Energy Corp., ADR*(c) | 62,659 | ||||||
| 2,280 | DaShenLin Pharmaceutical Group Co., Ltd., Class A Shares | 16,083 | ||||||
| 800 | DHC Software Co., Ltd., Class A Shares | 947 | ||||||
| 6,506 | DiDi Global Inc., ADR*(c) | 53,479 | ||||||
| 62,000 | Dongfeng Motor Group Co., Ltd., Class H Shares(d) | 67,817 | ||||||
| 13,032 | East Money Information Co., Ltd., Class A Shares | 62,397 | ||||||
| 900 | Ecovacs Robotics Co., Ltd., Class A Shares | 20,423 | ||||||
| 17,400 | ENN Energy Holdings Ltd. | 344,124 | ||||||
| 2,581 | Eve Energy Co., Ltd., Class A Shares | 40,897 | ||||||
| 7,300 | Everbright Securities Co., Ltd., Class A Shares | 17,959 | ||||||
| 20,400 | Financial Street Holdings Co., Ltd., Class A Shares | 20,523 | ||||||
| 11,000 | Flat Glass Group Co., Ltd., Class H Shares(d) | 64,100 | ||||||
| 20,800 | Focus Media Information Technology Co., Ltd., Class A Shares | 23,153 | ||||||
| 4,550 | Foshan Haitian Flavouring & Food Co., Ltd., Class A Shares | 66,926 | ||||||
| 51,000 | Fosun International Ltd. | 64,439 | ||||||
| 16,400 | Founder Securities Co., Ltd., Class A Shares | 21,644 | ||||||
| 15,000 | Foxconn Industrial Internet Co., Ltd., Class A Shares | 26,658 | ||||||
| 600 | Fu Jian Anjoy Foods Co., Ltd., Class A Shares | 14,527 | ||||||
| 907,000 | Fu Shou Yuan International Group Ltd. | 817,892 | ||||||
| 4,100 | Fuyao Glass Industry Group Co., Ltd., Class A Shares | 30,394 | ||||||
| 11,200 | Fuyao Glass Industry Group Co., Ltd., Class H Shares(a)(d) | 68,888 | ||||||
| 1,200 | Ganfeng Lithium Co., Ltd., Class A Shares | 40,774 | ||||||
| 5,800 | Ganfeng Lithium Co., Ltd., Class H Shares(a)(c)(d) | 133,779 | ||||||
| 1,828 | Gaotu Techedu Inc., ADR*(c) | 5,265 | ||||||
| 22,200 | GDS Holdings Ltd., ADR*(c) | 1,298,256 | ||||||
| 9,300 | Gemdale Corp., Class A Shares | 15,039 | ||||||
| 26,000 | Genscript Biotech Corp.* | 123,092 | ||||||
| 8,200 | GF Securities Co., Ltd., Class A Shares | 24,096 | ||||||
| 31,400 | GF Securities Co., Ltd., Class H Shares(d) | 55,832 | ||||||
| 8,700 | Giant Network Group Co., Ltd., Class A Shares | 13,606 | ||||||
| 924 | Gigadevice Semiconductor Beijing Inc., Class A Shares | 21,827 | ||||||
| 4,300 | GoerTek Inc., Class A Shares | 30,966 | ||||||
| 294,000 | GOME Retail Holdings Ltd.* | 31,714 | ||||||
| 2,000 | Gotion High-tech Co., Ltd., Class A Shares* | 16,685 | ||||||
| 4,100 | Great Wall Motor Co., Ltd., Class A Shares | 42,057 | ||||||
| 67,000 | Great Wall Motor Co., Ltd., Class H Shares(d) | 307,559 | ||||||
| 165,600 | Gree Electric Appliances Inc. of Zhuhai, Class A Shares | 1,055,684 | ||||||
| 22,995 | Greenland Holdings Corp., Ltd., Class A Shares | 15,871 | ||||||
| 22,000 | Greentown China Holdings Ltd. | 33,804 | ||||||
| 32,000 | Greentown Service Group Co., Ltd. | 34,215 | ||||||
| 2,200 | Guangdong Haid Group Co., Ltd., Class A Shares | 21,899 | ||||||
| 200 | Guangdong Kinlong Hardware Products Co., Ltd., Class A Shares | 5,014 | ||||||
| 30,000 | Guanghui Energy Co., Ltd., Class A Shares* | 28,845 | ||||||
| 60,000 | Guangzhou Automobile Group Co., Ltd., Class H Shares(d) | 60,374 | ||||||
| 2,600 | Guangzhou Baiyunshan Pharmaceutical Holdings Co., Ltd., Class A Shares | 11,866 | ||||||
| 7,900 | Guangzhou Haige Communications Group Inc. Co., Class A Shares | 13,687 | ||||||
| 1,100 | Guangzhou Kingmed Diagnostics Group Co., Ltd., Class A Shares | 17,976 | ||||||
| 38,000 | Guangzhou R&F Properties Co., Ltd., Class H Shares(d) | 32,427 | ||||||
| 600 | Guangzhou Shiyuan Electronic Technology Co., Ltd., Class A Shares | 8,104 | ||||||
| 510 | Guangzhou Tinci Materials Technology Co., Ltd., Class A Shares | 10,794 | ||||||
| 9,400 | Guosen Securities Co., Ltd., Class A Shares | 17,786 | ||||||
| 16,600 | Guotai Junan Securities Co., Ltd., Class A Shares | 45,639 | ||||||
| 5,900 | Guoyuan Securities Co., Ltd., Class A Shares | 7,191 | ||||||
See Notes to Financial Statements.
139
| Schedules of Investments |
| (continued) |
| Emerging Markets Equity Fund | ||||||||
| Shares/Units | Security | Value | ||||||
China — 26.3% — (continued) | ||||||||
| 23,000 | Haidilao International Holding Ltd.(a)(c) | $ | 93,799 | |||||
| 7,300 | Haier Smart Home Co., Ltd., Class A Shares | 30,580 | ||||||
| 43,800 | Haier Smart Home Co., Ltd., Class H Shares(d) | 164,761 | ||||||
| 16,000 | Haitian International Holdings Ltd. | 61,322 | ||||||
| 9,300 | Haitong Securities Co., Ltd., Class A Shares | 18,307 | ||||||
| 62,400 | Haitong Securities Co., Ltd., Class H Shares(d) | 57,658 | ||||||
| 1,800 | Hangzhou First Applied Material Co., Ltd., Class A Shares | 42,419 | ||||||
| 2,700 | Hangzhou Silan Microelectronics Co., Ltd., Class A Shares | 22,831 | ||||||
| 400 | Hangzhou Tigermed Consulting Co., Ltd., Class A Shares | 8,298 | ||||||
| 2,200 | Hangzhou Tigermed Consulting Co., Ltd., Class H Shares(a)(d) | 39,005 | ||||||
| 28,000 | Hansoh Pharmaceutical Group Co., Ltd.(a) | 76,368 | ||||||
| 900 | Hefei Meiya Optoelectronic Technology Inc., Class A Shares | 5,990 | ||||||
| 4,216 | Hello Group Inc., ADR | 55,398 | ||||||
| 5,300 | Henan Shuanghui Investment & Development Co., Ltd., Class A Shares | 19,784 | ||||||
| 258,000 | Hengan International Group Co., Ltd. | 1,496,522 | ||||||
| 10,778 | Hengli Petrochemical Co., Ltd., Class A Shares | 43,642 | ||||||
| 60,000 | HengTen Networks Group Ltd.*(c) | 29,421 | ||||||
| 2,990 | Hengyi Petrochemical Co., Ltd., Class A Shares | 5,418 | ||||||
| 43,300 | Hesteel Co., Ltd., Class A Shares | 20,878 | ||||||
| 299 | Hithink RoyalFlush Information Network Co., Ltd., Class A Shares | 5,355 | ||||||
| 12,000 | Hua Hong Semiconductor Ltd.*(a) | 70,528 | ||||||
| 38,500 | Huadian Power International Corp., Ltd., Class A Shares | 23,077 | ||||||
| 1,694 | Huadong Medicine Co., Ltd., Class A Shares | 8,066 | ||||||
| 2,260 | Hualan Biological Engineering Inc., Class A Shares | 10,299 | ||||||
| 52,000 | Huaneng Power International Inc., Class H Shares(d) | 25,041 | ||||||
| 7,200 | Huatai Securities Co., Ltd., Class A Shares | 18,255 | ||||||
| 33,600 | Huatai Securities Co., Ltd., Class H Shares(a)(d) | 48,156 | ||||||
| 35,600 | Huaxia Bank Co., Ltd., Class A Shares | 30,880 | ||||||
| 1,600 | Huaxin Cement Co., Ltd., Class A Shares | 4,784 | ||||||
| 5,800 | Huayu Automotive Systems Co., Ltd., Class A Shares | 20,867 | ||||||
| 3,879 | Huazhu Group Ltd., ADR*(c) | 187,317 | ||||||
| 2,912 | Hundsun Technologies Inc., Class A Shares | 22,357 | ||||||
| 1,756 | HUYA Inc., ADR*(c) | 18,772 | ||||||
| 3,900 | Iflytek Co., Ltd., Class A Shares | 31,563 | ||||||
| 725 | I-Mab, ADR*(c) | 51,417 | ||||||
| 200 | Imeik Technology Development Co., Ltd., Class A Shares* | 18,191 | ||||||
| 82,200 | Industrial & Commercial Bank of China Ltd., Class A Shares | 58,870 | ||||||
| 1,228,000 | Industrial & Commercial Bank of China Ltd., Class H Shares(d) | 685,418 | ||||||
| 31,500 | Industrial Bank Co., Ltd., Class A Shares | 90,211 | ||||||
| 300 | Industrial Securities Co., Ltd., Class A Shares | 460 | ||||||
| 800 | Ingenic Semiconductor Co., Ltd., Class A Shares | 17,592 | ||||||
| 62,900 | Inner Mongolia BaoTou Steel Union Co., Ltd., Class A Shares* | 36,445 | ||||||
| 16,300 | Inner Mongolia Junzheng Energy & Chemical Industry Group Co., Ltd., Class A Shares | 14,663 | ||||||
| 8,700 | Inner Mongolia Yili Industrial Group Co., Ltd., Class A Shares | 45,829 | ||||||
| 25,500 | Innovent Biologics Inc.*(a) | 205,240 | ||||||
| 3,700 | Inspur Electronic Information Industry Co., Ltd., Class A Shares | 17,177 | ||||||
| 6,066 | iQIYI Inc., ADR*(c) | 54,958 | ||||||
| 1,500 | Jafron Biomedical Co., Ltd., Class A Shares | 11,378 | ||||||
| 4,000 | JCET Group Co., Ltd., Class A Shares | 21,097 | ||||||
| 6,700 | JD Health International Inc.*(a)(c) | 62,173 | ||||||
| 55,403 | JD.com Inc., ADR* | 4,352,460 | ||||||
| 7,400 | Jiangsu Eastern Shenghong Co., Ltd., Class A Shares | 37,046 | ||||||
| 24,000 | Jiangsu Expressway Co., Ltd., Class H Shares(d) | 24,902 | ||||||
| 1,948 | Jiangsu Hengli Hydraulic Co., Ltd., Class A Shares | 28,645 | ||||||
| 7,401 | Jiangsu Hengrui Medicine Co., Ltd., Class A Shares | 51,920 | ||||||
| 1,000 | Jiangsu King’S Luck Brewery JSC Ltd., Class A Shares | 6,506 | ||||||
See Notes to Financial Statements.
140
| Schedules of Investments |
| (continued) |
| Emerging Markets Equity Fund | ||||||||
| Shares/Units | Security | Value | ||||||
China — 26.3% — (continued) | ||||||||
| 1,700 | Jiangsu Yanghe Brewery Joint-Stock Co., Ltd., Class A Shares | $ | 44,108 | |||||
| 6,200 | Jiangsu Zhongtian Technology Co., Ltd., Class A Shares | 7,816 | ||||||
| 5,300 | Jiangxi Copper Co., Ltd., Class A Shares | 21,597 | ||||||
| 19,000 | Jiangxi Copper Co., Ltd., Class H Shares(d) | 38,404 | ||||||
| 7,800 | Jiangxi Zhengbang Technology Co., Ltd., Class A Shares | 10,336 | ||||||
| 10,000 | Jilin Aodong Pharmaceutical Group Co., Ltd., Class A Shares | 24,630 | ||||||
| 7,400 | Jinke Properties Group Co., Ltd., Class A Shares | 5,502 | ||||||
| 24,000 | Jinxin Fertility Group Ltd.*(a)(c) | 38,171 | ||||||
| 200 | JiuGui Liquor Co., Ltd., Class A Shares | 6,487 | ||||||
| 16,000 | Jiumaojiu International Holdings Ltd.(a) | 53,661 | ||||||
| 6,800 | Joincare Pharmaceutical Group Industry Co., Ltd., Class A Shares | 11,643 | ||||||
| 7,800 | Jointown Pharmaceutical Group Co., Ltd., Class A Shares | 18,299 | ||||||
| 2,200 | Jonjee Hi-Tech Industrial And Commercial Holding Co., Ltd., Class A Shares | 10,229 | ||||||
| 1,500 | Juewei Food Co., Ltd., Class A Shares | 14,648 | ||||||
| 52,000 | Kaisa Group Holdings Ltd.* | 17,267 | ||||||
| 7,759 | KE Holdings Inc., ADR*(c) | 140,360 | ||||||
| 58,000 | Kingdee International Software Group Co., Ltd.* | 211,229 | ||||||
| 5,800 | Kingfa Sci. & Tech. Co., Ltd., Class A Shares | 14,578 | ||||||
| 1,431 | Kingsoft Cloud Holdings Ltd., ADR*(c) | 46,064 | ||||||
| 21,000 | Kingsoft Corp., Ltd. | 83,950 | ||||||
| 5,700 | Kuaishou Technology, Class B Shares*(a) | 61,803 | ||||||
| 1,588 | Kweichow Moutai Co., Ltd., Class A Shares | 383,059 | ||||||
| 20,500 | KWG Group Holdings Ltd. | 21,629 | ||||||
| 4,200 | LB Group Co., Ltd., Class A Shares | 24,353 | ||||||
| 152,000 | Lenovo Group Ltd. | 168,219 | ||||||
| 9,000 | Lens Technology Co., Ltd., Class A Shares | 32,879 | ||||||
| 4,500 | Lepu Medical Technology Beijing Co., Ltd., Class A Shares | 17,963 | ||||||
| 11,589 | Li Auto Inc., ADR*(c) | 357,637 | ||||||
| 47,000 | Li Ning Co., Ltd. | 629,744 | ||||||
| 14,500 | Lingyi iTech Guangdong Co., Class A Shares | 15,025 | ||||||
| 27,000 | Logan Group Co., Ltd. | 32,183 | ||||||
| 40,500 | Longfor Group Holdings Ltd.(a) | 175,801 | ||||||
| 5,880 | LONGi Green Energy Technology Co., Ltd., Class A Shares | 81,669 | ||||||
| 2,768 | Lufax Holding Ltd., ADR*(c) | 23,999 | ||||||
| 11,038 | Luxshare Precision Industry Co., Ltd., Class A Shares | 57,730 | ||||||
| 2,000 | Luzhou Laojiao Co., Ltd., Class A Shares | 52,647 | ||||||
| 3,400 | Mango Excellent Media Co., Ltd., Class A Shares | 24,108 | ||||||
| 540 | Maxscend Microelectronics Co., Ltd., Class A Shares | 31,612 | ||||||
| 9,480 | Meinian Onehealth Healthcare Holdings Co., Ltd., Class A Shares* | 10,397 | ||||||
| 278,200 | Meituan, (Restricted, cost — $6,746,464, acquired 3/24/21), Class B Shares*(a)(b) | 8,884,631 | ||||||
| 36,900 | Metallurgical Corp. of China Ltd., Class A Shares | 28,515 | ||||||
| 15,000 | Microport Scientific Corp.(c) | 92,736 | ||||||
| 5,300 | Midea Group Co., Ltd., Class A Shares | 54,157 | ||||||
| 9,000 | Ming Yuan Cloud Group Holdings Ltd.* | 31,265 | ||||||
| 432,000 | Minth Group Ltd. | 1,792,380 | ||||||
| 6,986 | Muyuan Foods Co., Ltd., Class A Shares | 45,759 | ||||||
| 7,600 | Nanjing Securities Co., Ltd., Class A Shares | 12,345 | ||||||
| 7,080 | NARI Technology Co., Ltd., Class A Shares | 38,362 | ||||||
| 1,000 | NAURA Technology Group Co., Ltd., Class A Shares | 55,005 | ||||||
| 17,765 | NetEase Inc., ADR | 1,730,666 | ||||||
| 2,400 | New China Life Insurance Co., Ltd., Class A Shares | 15,096 | ||||||
| 19,500 | New China Life Insurance Co., Ltd., Class H Shares(d) | 57,364 | ||||||
| 6,400 | New Hope Liuhe Co., Ltd., Class A Shares* | 10,847 | ||||||
| 33,712 | New Oriental Education & Technology Group Inc., ADR* | 76,189 | ||||||
| 10,200 | Ningxia Baofeng Energy Group Co., Ltd., Class A Shares | 25,356 | ||||||
| 29,301 | NIO Inc., ADR* | 1,151,822 | ||||||
See Notes to Financial Statements.
141
| Schedules of Investments |
| (continued) |
| Emerging Markets Equity Fund | ||||||||
| Shares/Units | Security | Value | ||||||
China — 26.3% — (continued) | ||||||||
| 834 | Noah Holdings Ltd., ADR* | $ | 32,509 | |||||
| 10,800 | Nongfu Spring Co., Ltd., Class H Shares(a)(d) | 57,145 | ||||||
| 1,400 | Offcn Education Technology Co., Ltd., Class A Shares* | 2,284 | ||||||
| 9,000 | OFILM Group Co., Ltd., Class A Shares | 10,400 | ||||||
| 41,419 | OneConnect Financial Technology Co., Ltd., ADR* | 194,669 | ||||||
| 1,000 | Oppein Home Group Inc., Class A Shares | 23,987 | ||||||
| 11,300 | Orient Securities Co., Ltd., Class A Shares | 26,133 | ||||||
| 2,029 | Ovctek China Inc., Class A Shares | 21,051 | ||||||
| 14,200 | Pacific Securities Co., Ltd., Class A Shares* | 7,168 | ||||||
| 204,000 | People’s Insurance Co. Group of China Ltd., Class H Shares(d) | 62,885 | ||||||
| 4,650 | Perfect World Co., Ltd., Class A Shares | 9,666 | ||||||
| 21,700 | PetroChina Co., Ltd., Class A Shares | 16,530 | ||||||
| 470,000 | PetroChina Co., Ltd., Class H Shares(d) | 204,407 | ||||||
| 55,500 | Pharmaron Beijing Co., Ltd., (Restricted, cost — $1,081,372, acquired 4/8/21), Class H Shares(a)(b)(d) | 1,229,462 | ||||||
| 900 | Pharmaron Beijing Co., Ltd., Class A Shares(a) | 26,807 | ||||||
| 142,000 | PICC Property & Casualty Co., Ltd., Class H Shares(d) | 128,233 | ||||||
| 9,329 | Pinduoduo Inc., ADR*(c) | 933,087 | ||||||
| 1,032,580 | Ping An Bank Co., Ltd., Class A Shares | 2,845,584 | ||||||
| 8,900 | Ping An Healthcare & Technology Co., Ltd.*(a) | 65,712 | ||||||
| 15,800 | Ping An Insurance Group Co. of China Ltd., Class A Shares | 122,090 | ||||||
| 765,000 | Ping An Insurance Group Co. of China Ltd., Class H Shares(d) | 5,935,601 | ||||||
| 18,000 | Poly Developments & Holdings Group Co., Ltd., Class A Shares | 31,809 | ||||||
| 3,400 | Poly Property Services Co., Ltd., Class H Shares(d) | 20,800 | ||||||
| 45,300 | Postal Savings Bank of China Co., Ltd., Class A Shares | 36,054 | ||||||
| 166,000 | Postal Savings Bank of China Co., Ltd., Class H Shares(a)(d) | 119,796 | ||||||
| 22,300 | Power Construction Corp. of China Ltd., Class A Shares | 21,397 | ||||||
| 29,000 | Powerlong Real Estate Holdings Ltd. | 23,515 | ||||||
| 211,971 | Qingdao TGOOD Electric Co., Ltd., Class A Shares | 1,067,480 | ||||||
| 18,700 | RiseSun Real Estate Development Co., Ltd., Class A Shares | 13,756 | ||||||
| 13,324 | RLX Technology Inc., ADR*(c) | 68,485 | ||||||
| 11,550 | Rongsheng Petrochemical Co., Ltd., Class A Shares | 33,267 | ||||||
| 11,800 | SAIC Motor Corp., Ltd., Class A Shares | 35,286 | ||||||
| 7,000 | Sanan Optoelectronics Co., Ltd., Class A Shares | 39,434 | ||||||
| 800 | Sangfor Technologies Inc., Class A Shares | 33,798 | ||||||
| 24,000 | Sany Heavy Equipment International Holdings Co., Ltd. | 30,839 | ||||||
| 9,500 | Sany Heavy Industry Co., Ltd., Class A Shares | 38,565 | ||||||
| 13,224 | SDIC Capital Co., Ltd., Class A Shares | 19,100 | ||||||
| 12,700 | SDIC Power Holdings Co., Ltd., Class A Shares | 17,809 | ||||||
| 50,000 | Seazen Group Ltd.* | 44,322 | ||||||
| 3,000 | Seazen Holdings Co., Ltd., Class A Shares | 15,652 | ||||||
| 5,400 | SF Holding Co., Ltd., Class A Shares | 48,179 | ||||||
| 500 | SG Micro Corp., Class A Shares | 24,780 | ||||||
| 12,300 | Shaanxi Coal Industry Co., Ltd., Class A Shares | 26,093 | ||||||
| 5,600 | Shandong Gold Mining Co., Ltd., Class A Shares | 15,664 | ||||||
| 11,250 | Shandong Gold Mining Co., Ltd., Class H Shares(a)(c)(d) | 18,276 | ||||||
| 5,850 | Shandong Hualu Hengsheng Chemical Co., Ltd., Class A Shares | 32,894 | ||||||
| 3,100 | Shandong Linglong Tyre Co., Ltd., Class A Shares | 14,392 | ||||||
| 14,900 | Shandong Nanshan Aluminum Co., Ltd., Class A Shares | 13,241 | ||||||
| 6,800 | Shandong Sun Paper Industry JSC Ltd., Class A Shares | 12,949 | ||||||
| 52,000 | Shandong Weigao Group Medical Polymer Co., Ltd., Class H Shares(d) | 85,390 | ||||||
| 1,820 | Shanghai Bairun Investment Holging Group Co., Ltd., Class A Shares | 20,178 | ||||||
| 171,961 | Shanghai Baosight Software Co., Ltd., Class A Shares | 1,870,283 | ||||||
| 4,000 | Shanghai Fosun Pharmaceutical Group Co., Ltd., Class A Shares | 39,198 | ||||||
| 434,000 | Shanghai Fosun Pharmaceutical Group Co., Ltd., Class H Shares(d) | 2,767,617 | ||||||
| 2,000 | Shanghai International Airport Co., Ltd., Class A Shares* | 13,404 | ||||||
| 17,999 | Shanghai International Port Group Co., Ltd., Class A Shares | 15,573 | ||||||
See Notes to Financial Statements.
142
| Schedules of Investments |
| (continued) |
| Emerging Markets Equity Fund | ||||||||
| Shares/Units | Security | Value | ||||||
China — 26.3% — (continued) | ||||||||
| 32,520 | Shanghai Lujiazui Finance & Trade Zone Development Co., Ltd., Class B Shares | $ | 29,225 | |||||
| 2,200 | Shanghai M&G Stationery Inc., Class A Shares | 23,483 | ||||||
| 8,700 | Shanghai Pharmaceuticals Holding Co., Ltd., Class A Shares | 25,810 | ||||||
| 16,800 | Shanghai Pharmaceuticals Holding Co., Ltd., Class H Shares(d) | 33,278 | ||||||
| 40,200 | Shanghai Pudong Development Bank Co., Ltd., Class A Shares | 56,352 | ||||||
| 1,380 | Shanghai Putailai New Energy Technology Co., Ltd., Class A Shares | 32,648 | ||||||
| 15,800 | Shanghai RAAS Blood Products Co., Ltd., Class A Shares | 16,985 | ||||||
| 3,500 | Shanxi Meijin Energy Co., Ltd., Class A Shares* | 7,482 | ||||||
| 9,600 | Shanxi Securities Co., Ltd., Class A Shares | 9,739 | ||||||
| 1,540 | Shanxi Xinghuacun Fen Wine Factory Co., Ltd., Class A Shares | 66,122 | ||||||
| 2,100 | Shenergy Co., Ltd., Class A Shares | 2,116 | ||||||
| 4,400 | Shengyi Technology Co., Ltd., Class A Shares | 15,996 | ||||||
| 1,260 | Shennan Circuits Co., Ltd., Class A Shares | 17,815 | ||||||
| 48,700 | Shenwan Hongyuan Group Co., Ltd., Class A Shares | 35,479 | ||||||
| 1,680 | Shenzhen Energy Group Co., Ltd., Class A Shares | 2,036 | ||||||
| 700 | Shenzhen Goodix Technology Co., Ltd., Class A Shares | 11,285 | ||||||
| 4,500 | Shenzhen Inovance Technology Co., Ltd., Class A Shares | 49,428 | ||||||
| 1,400 | Shenzhen Kangtai Biological Products Co., Ltd., Class A Shares* | 26,255 | ||||||
| 1,600 | Shenzhen Mindray Bio-Medical Electronics Co., Ltd., Class A Shares | 81,590 | ||||||
| 15,200 | Shenzhen Overseas Chinese Town Co., Ltd., Class A Shares | 15,898 | ||||||
| 3,000 | Shenzhen Sunway Communication Co., Ltd., Class A Shares | 10,473 | ||||||
| 18,100 | Shenzhou International Group Holdings Ltd. | 393,121 | ||||||
| 4,649 | Shijiazhuang Yiling Pharmaceutical Co., Ltd., Class A Shares | 12,309 | ||||||
| 12,000 | Shimao Services Holdings Ltd.(a) | 27,938 | ||||||
| 4,000 | Sichuan Chuantou Energy Co., Ltd., Class A Shares | 7,052 | ||||||
| 1,200 | Sichuan Swellfun Co., Ltd., Class A Shares | 21,703 | ||||||
| 2,000 | Silergy Corp. | 286,161 | ||||||
| 3,700 | Sinolink Securities Co., Ltd., Class A Shares | 6,290 | ||||||
| 664,572 | Sinopharm Group Co., Ltd., Class H Shares(d) | 1,705,966 | ||||||
| 20,000 | Sinotruk Hong Kong Ltd. | 39,432 | ||||||
| 840 | Skshu Paint Co., Ltd., Class A Shares | 18,964 | ||||||
| 38,000 | Smoore International Holdings Ltd.(a) | 203,280 | ||||||
| 1,120 | Songcheng Performance Development Co., Ltd., Class A Shares | 2,650 | ||||||
| 56,000 | Sunac China Holdings Ltd. | 143,006 | ||||||
| 12,000 | Sunac Services Holdings Ltd.(a) | 31,201 | ||||||
| 2,500 | Sungrow Power Supply Co., Ltd., Class A Shares | 60,848 | ||||||
| 24,400 | Suning.com Co., Ltd., Class A Shares* | 19,961 | ||||||
| 116,500 | Sunny Optical Technology Group Co., Ltd. | 3,517,294 | ||||||
| 5,400 | Suzhou Dongshan Precision Manufacturing Co., Ltd., Class A Shares | 16,055 | ||||||
| 6,199 | Suzhou Gold Mantis Construction Decoration Co., Ltd., Class A Shares | 6,817 | ||||||
| 200 | Suzhou Maxwell Technologies Co., Ltd., Class A Shares | 24,107 | ||||||
| 8,274 | TAL Education Group, ADR* | 44,018 | ||||||
| 2,100 | Tangshan Jidong Cement Co., Ltd., Class A Shares | 4,135 | ||||||
| 6,200 | TBEA Co., Ltd., Class A Shares | 23,531 | ||||||
| 18,200 | TCL Technology Group Corp., Class A Shares | 20,087 | ||||||
| 360,031 | Tencent Holdings Ltd. | 22,153,731 | ||||||
| 14,526 | Tencent Music Entertainment Group, ADR* | 128,410 | ||||||
| 1,200 | Thunder Software Technology Co., Ltd., Class A Shares | 21,939 | ||||||
| 3,900 | Tianjin Zhonghuan Semiconductor Co., Ltd., Class A Shares | 32,674 | ||||||
| 9,900 | Tianma Microelectronics Co., Ltd., Class A Shares | 21,681 | ||||||
| 430,000 | Tingyi Cayman Islands Holding Corp. | 765,400 | ||||||
| 24,000 | Tongcheng-Elong Holdings Ltd.* | 55,682 | ||||||
| 5,900 | Tongkun Group Co., Ltd., Class A Shares | 21,768 | ||||||
| 5,400 | Tongwei Co., Ltd., Class A Shares | 51,078 | ||||||
| 400 | Topchoice Medical Corp., Class A Shares* | 14,556 | ||||||
| 881,000 | Topsports International Holdings Ltd., (Restricted, cost — $1,011,427, acquired 3/24/20)(a)(b) | 1,161,403 | ||||||
See Notes to Financial Statements.
143
| Schedules of Investments |
| (continued) |
| Emerging Markets Equity Fund | ||||||||
| Shares/Units | Security | Value | ||||||
China — 26.3% — (continued) | ||||||||
| 3,700 | Transfar Zhilian Co., Ltd., Class A Shares | $ | 4,983 | |||||
| 20,000 | TravelSky Technology Ltd., Class H Shares(d) | 37,486 | ||||||
| 11,044 | Trip.com Group Ltd., ADR* | 336,732 | ||||||
| 10,000 | Tsingtao Brewery Co., Ltd., Class H Shares(d) | 81,844 | ||||||
| 700 | Unigroup Guoxin Microelectronics Co., Ltd., Class A Shares | 24,258 | ||||||
| 37,000 | Uni-President China Holdings Ltd. | 34,980 | ||||||
| 760 | Unisplendour Corp., Ltd., Class A Shares | 2,797 | ||||||
| 2,600 | Universal Scientific Industrial Shanghai Co., Ltd., Class A Shares | 5,575 | ||||||
| 1,715 | Up Fintech Holding Ltd., ADR*(c) | 23,633 | ||||||
| 4,500 | Venus MedTech Hangzhou Inc., Class H Shares*(a)(d) | 21,264 | ||||||
| 9,197 | Vipshop Holdings Ltd., ADR* | 136,024 | ||||||
| 1,800 | Walvax Biotechnology Co., Ltd., Class A Shares | 21,651 | ||||||
| 4,700 | Wanhua Chemical Group Co., Ltd., Class A Shares | 77,563 | ||||||
| 125,000 | Want Want China Holdings Ltd. | 84,970 | ||||||
| 1,280 | Weibo Corp., ADR*(c) | 64,666 | ||||||
| 5,300 | Weichai Power Co., Ltd., Class A Shares | 16,469 | ||||||
| 401,200 | Weichai Power Co., Ltd., Class H Shares(c)(d) | 1,011,225 | ||||||
| 1,900 | Weihai Guangwei Composites Co., Ltd., Class A Shares | 21,495 | ||||||
| 40,000 | Weimob Inc.*(a) | 58,247 | ||||||
| 14,040 | Wens Foodstuffs Group Co., Ltd., Class A Shares | 28,267 | ||||||
| 11,400 | Western Securities Co., Ltd., Class A Shares | 14,407 | ||||||
| 1,200 | Will Semiconductor Co., Ltd., Class A Shares | 44,927 | ||||||
| 1,600 | Wingtech Technology Co., Ltd., Class A Shares | 29,430 | ||||||
| 8,200 | Wuchan Zhongda Group Co., Ltd., Class A Shares | 7,731 | ||||||
| 1,120 | Wuhan Guide Infrared Co., Ltd., Class A Shares | 4,746 | ||||||
| 3,900 | Wuhu Sanqi Interactive Entertainment Network Technology Group Co., Ltd., Class A Shares | 10,329 | ||||||
| 5,300 | Wuliangye Yibin Co., Ltd., Class A Shares | 165,554 | ||||||
| 7,260 | WUS Printed Circuit Kunshan Co., Ltd., Class A Shares | 12,579 | ||||||
| 3,864 | WuXi AppTec Co., Ltd., Class A Shares | 79,486 | ||||||
| 6,648 | WuXi AppTec Co., Ltd., Class H Shares(a)(d) | 132,402 | ||||||
| 143,000 | Wuxi Biologics Cayman Inc., (Restricted, cost — $623,493, acquired 11/26/19)*(a)(b) | 2,211,038 | ||||||
| 157,900 | Wuxi Lead Intelligent Equipment Co., Ltd., Class A Shares | 1,816,814 | ||||||
| 500 | Wuxi Shangji Automation Co., Ltd., Class A Shares | 25,021 | ||||||
| 5,000 | Xiamen Tungsten Co., Ltd., Class A Shares | 23,753 | ||||||
| 306,000 | Xiaomi Corp., Class B Shares*(a) | 982,119 | ||||||
| 10,200 | Xinjiang Goldwind Science & Technology Co., Ltd., Class A Shares | 23,061 | ||||||
| 16,982 | Xinjiang Goldwind Science & Technology Co., Ltd., Class H Shares(d) | 32,458 | ||||||
| 872,000 | Xinyi Solar Holdings Ltd. | 2,103,996 | ||||||
| 8,250 | XPeng Inc., Class A Shares, ADR*(c) | 350,625 | ||||||
| 28,000 | Yadea Group Holdings., Ltd.(a) | 49,682 | ||||||
| 38,000 | Yanzhou Coal Mining Co., Ltd., Class H Shares(d) | 66,302 | ||||||
| 1,050 | Yealink Network Technology Corp., Ltd., Class A Shares | 13,984 | ||||||
| 147,684 | Yifeng Pharmacy Chain Co., Ltd., Class A Shares | 1,186,224 | ||||||
| 9,000 | Yihai International Holding Ltd.*(c) | 48,556 | ||||||
| 1,800 | Yihai Kerry Arawana Holdings Co., Ltd., Class A Shares | 18,835 | ||||||
| 12,500 | Yonghui Superstores Co., Ltd., Class A Shares | 7,376 | ||||||
| 5,330 | Yonyou Network Technology Co., Ltd., Class A Shares | 27,712 | ||||||
| 29,266 | Yum China Holdings Inc. | 1,801,615 | ||||||
| 4,160 | Yunda Holding Co., Ltd., Class A Shares | 9,926 | ||||||
| 1,400 | Yunnan Baiyao Group Co., Ltd., Class A Shares | 19,232 | ||||||
| 1,300 | Yunnan Energy New Material Co., Ltd., Class A Shares | 56,673 | ||||||
| 7,984 | Zai Lab Ltd., ADR* | 1,153,688 | ||||||
| 800 | Zhangzhou Pientzehuang Pharmaceutical Co., Ltd., Class A Shares | 42,981 | ||||||
| 27,000 | Zhaojin Mining Industry Co., Ltd., Class H Shares(d) | 22,146 | ||||||
| 14,520 | Zhejiang Century Huatong Group Co., Ltd., Class A Shares* | 14,045 | ||||||
| 4,800 | Zhejiang Chint Electrics Co., Ltd., Class A Shares | 46,749 | ||||||
See Notes to Financial Statements.
144
| Schedules of Investments |
| (continued) |
| Emerging Markets Equity Fund | ||||||||
| Shares/Units | Security | Value | ||||||
China — 26.3% — (continued) | ||||||||
| 6,400 | Zhejiang Dahua Technology Co., Ltd., Class A Shares | $ | 22,808 | |||||
| 1,300 | Zhejiang Dingli Machinery Co., Ltd., Class A Shares | 14,138 | ||||||
| 36,000 | Zhejiang Expressway Co., Ltd., Class H Shares(d) | 31,562 | ||||||
| 4,400 | Zhejiang Huahai Pharmaceutical Co., Ltd., Class A Shares | 10,925 | ||||||
| 1,660 | Zhejiang Huayou Cobalt Co., Ltd., Class A Shares | 36,141 | ||||||
| 7,900 | Zhejiang Longsheng Group Co., Ltd., Class A Shares | 16,534 | ||||||
| 6,000 | Zhejiang NHU Co., Ltd., Class A Shares | 26,718 | ||||||
| 9,100 | Zhejiang Sanhua Intelligent Controls Co., Ltd., Class A Shares | 35,516 | ||||||
| 3,700 | Zhejiang Satellite Petrochemical Co., Ltd., Class A Shares | 23,994 | ||||||
| 44,000 | Zhenro Properties Group Ltd. | 25,670 | ||||||
| 7,900 | Zheshang Securities Co., Ltd., Class A Shares* | 15,145 | ||||||
| 10,000 | ZhongAn Online P&C Insurance Co., Ltd., Class H Shares*(a)(d) | 48,655 | ||||||
| 11,600 | Zhongjin Gold Corp., Ltd., Class A Shares | 15,778 | ||||||
| 13,000 | Zhongsheng Group Holdings Ltd. | 108,387 | ||||||
| 10,900 | Zhuzhou CRRC Times Electric Co., Ltd., Class H Shares*(d) | 65,698 | ||||||
| 30,500 | Zijin Mining Group Co., Ltd., Class A Shares | 52,251 | ||||||
| 122,000 | Zijin Mining Group Co., Ltd., Class H Shares(d) | 172,615 | ||||||
| 13,200 | Zoomlion Heavy Industry Science & Technology Co., Ltd., Class A Shares | 16,097 | ||||||
| 29,200 | Zoomlion Heavy Industry Science & Technology Co., Ltd., Class H Shares(d) | 27,761 | ||||||
| 6,400 | ZTE Corp., Class A Shares | 32,928 | ||||||
| 19,000 | ZTE Corp., Class H Shares(d) | 66,589 | ||||||
| 9,753 | ZTO Express Cayman Inc., ADR(c) | 275,132 | ||||||
|
| |||||||
| Total China | 148,209,815 | |||||||
|
| |||||||
Colombia — 0.0% | ||||||||
| 4,158 | Bancolombia SA | 34,276 | ||||||
| 101,878 | Ecopetrol SA | 71,439 | ||||||
| 7,067 | Grupo de Inversiones Suramericana SA | 35,999 | ||||||
| 11,971 | Interconexion Electrica SA ESP | 72,096 | ||||||
|
| |||||||
| Total Colombia | 213,810 | |||||||
|
| |||||||
Cyprus — 0.4% | ||||||||
| 25,008 | TCS Group Holding PLC, GDR | 2,206,864 | ||||||
| 2,605 | TCS Group Holdings PLC, Class Registered Shares, GDR | 231,052 | ||||||
|
| |||||||
| Total Cyprus | 2,437,916 | |||||||
|
| |||||||
Czech Republic — 0.0% | ||||||||
| 3,761 | CEZ AS | 118,468 | ||||||
| 1,684 | Komercní Banka AS* | 64,744 | ||||||
| 9,582 | Moneta Money Bank AS*(a) | 38,841 | ||||||
|
| |||||||
| Total Czech Republic | 222,053 | |||||||
|
| |||||||
Egypt — 0.6% | ||||||||
| 1,829,004 | Cleopatra Hospital* | 542,876 | ||||||
| 735,974 | Commercial International Bank Egypt SAE, Class Registered Shares, GDR* | 2,137,437 | ||||||
| 69,526 | Commercial International Bank Egypt SAE, GDR* | 204,620 | ||||||
| 22,745 | Eastern Co. SAE | 17,023 | ||||||
| 405,047 | Fawry for Banking & Payment Technology Services SAE* | 430,776 | ||||||
| 316,000 | Juhayna Food Industries* | 110,506 | ||||||
|
| |||||||
| Total Egypt | 3,443,238 | |||||||
|
| |||||||
Georgia — 0.3% | ||||||||
| 51,700 | Bank of Georgia Group PLC* | 1,187,396 | ||||||
| 32,700 | Georgia Capital PLC* | 280,586 | ||||||
|
| |||||||
| Total Georgia | 1,467,982 | |||||||
|
| |||||||
Germany — 0.5% | ||||||||
| 17,640 | Delivery Hero SE, (Restricted, cost — $663,915, acquired 2/26/19)*(a)(b) | 2,552,930 | ||||||
|
| |||||||
See Notes to Financial Statements.
145
| Schedules of Investments |
| (continued) |
| Emerging Markets Equity Fund | ||||||||
| Shares/Units | Security | Value | ||||||
Greece — 0.2% | ||||||||
| 48,512 | Alpha Services & Holdings SA* | $ | 67,389 | |||||
| 53,636 | Eurobank Ergasias Services & Holdings SA* | 51,137 | ||||||
| 1,594 | FF Group*#(e)(f) | 19 | ||||||
| 5,034 | Hellenic Telecommunications Organization SA | 99,106 | ||||||
| 2,114 | JUMBO SA | 33,233 | ||||||
| 54,881 | OPAP SA | 860,876 | ||||||
|
| |||||||
| Total Greece | 1,111,760 | |||||||
|
| |||||||
Hong Kong — 2.7% | ||||||||
| 312,600 | AIA Group Ltd. | 3,731,317 | ||||||
| 786,000 | Alibaba Health Information Technology Ltd.* | 1,288,060 | ||||||
| 250,000 | Alibaba Pictures Group Ltd.* | 26,643 | ||||||
| 71,400 | ASM Pacific Technology Ltd. | 847,622 | ||||||
| 11,000 | Beijing Enterprises Holdings Ltd. | 37,918 | ||||||
| 74,000 | Beijing Enterprises Water Group Ltd.* | 30,514 | ||||||
| 92,000 | Bosideng International Holdings Ltd. | 75,131 | ||||||
| 925,000 | Brilliance China Automotive Holdings Ltd.*(e)(f) | 868,210 | ||||||
| 700 | Brilliance China Automotive Holdings Ltd., ADR* | 2,702 | ||||||
| 1,351,000 | China Education Group Holdings Ltd., (Restricted, cost — $2,021,628, acquired 3/22/19)(b) | 2,548,189 | ||||||
| 67,888 | China Everbright Environment Group Ltd. | 46,942 | ||||||
| 24,000 | China Everbright Ltd. | 30,125 | ||||||
| 773,000 | China Gas Holdings Ltd. | 2,240,114 | ||||||
| 156,000 | China Jinmao Holdings Group Ltd. | 50,603 | ||||||
| 67,000 | China Mengniu Dairy Co., Ltd.* | 402,863 | ||||||
| 39,538 | China Merchants Port Holdings Co., Ltd. | 66,516 | ||||||
| 83,500 | China Overseas Land & Investment Ltd. | 191,814 | ||||||
| 20,000 | China Overseas Property Holdings Ltd. | 17,065 | ||||||
| 92,000 | China Power International Development Ltd. | 37,109 | ||||||
| 32,000 | China Resources Beer Holdings Co., Ltd. | 263,142 | ||||||
| 54,000 | China Resources Cement Holdings Ltd. | 53,002 | ||||||
| 20,000 | China Resources Gas Group Ltd. | 121,392 | ||||||
| 70,000 | China Resources Land Ltd. | 260,011 | ||||||
| 38,000 | China Resources Power Holdings Co., Ltd. | 93,450 | ||||||
| 36,000 | China State Construction International Holdings Ltd. | 29,155 | ||||||
| 35,800 | China Taiping Insurance Holdings Co., Ltd. | 52,238 | ||||||
| 72,000 | China Traditional Chinese Medicine Holdings Co., Ltd.* | 34,207 | ||||||
| 324,000 | China Youzan Ltd.* | 45,269 | ||||||
| 46,000 | COSCO SHIPPING Ports Ltd. | 38,248 | ||||||
| 46,000 | Far East Horizon Ltd. | 52,299 | ||||||
| 130,000 | Geely Automobile Holdings Ltd. | 468,495 | ||||||
| 60,000 | Guangdong Investment Ltd. | 83,222 | ||||||
| 13,300 | Hopson Development Holdings Ltd. | 51,777 | ||||||
| 20,000 | Huabao International Holdings Ltd.* | 47,779 | ||||||
| 1,788 | Hutchmed China Ltd., ADR*(c) | 72,164 | ||||||
| 17,500 | Kingboard Holdings Ltd. | 85,945 | ||||||
| 20,500 | Kingboard Laminates Holdings Ltd. | 40,226 | ||||||
| 84,000 | Kunlun Energy Co., Ltd. | 88,858 | ||||||
| 11,000 | Lee & Man Paper Manufacturing Ltd. | 9,647 | ||||||
| 38,000 | Nine Dragons Paper Holdings Ltd. | 51,850 | ||||||
| 26,000 | Shenzhen International Holdings Ltd. | 33,906 | ||||||
| 80,000 | Shenzhen Investment Ltd. | 23,741 | ||||||
| 23,500 | Shimao Group Holdings Ltd. | 48,549 | ||||||
| 226,750 | Sino Biopharmaceutical Ltd. | 189,564 | ||||||
| 50,000 | SSY Group Ltd. | 30,984 | ||||||
| 26,500 | Sun Art Retail Group Ltd. | 16,038 | ||||||
| 4,000 | Vinda International Holdings Ltd. | 11,773 | ||||||
See Notes to Financial Statements.
146
| Schedules of Investments |
| (continued) |
| Emerging Markets Equity Fund | ||||||||
| Shares/Units | Security | Value | ||||||
Hong Kong — 2.7% — (continued) | ||||||||
| 28,000 | Wharf Holdings Ltd. | $ | 94,616 | |||||
| 12,800 | Yuexiu Property Co., Ltd. | 12,002 | ||||||
|
| |||||||
| Total Hong Kong | 15,043,006 | |||||||
|
| |||||||
Hungary — 1.5% | ||||||||
| 9,056 | MOL Hungarian Oil & Gas PLC | 74,261 | ||||||
| 139,206 | OTP Bank Nyrt* | 8,405,292 | ||||||
| 2,785 | Richter Gedeon Nyrt | 83,473 | ||||||
|
| |||||||
| Total Hungary | 8,563,026 | |||||||
|
| |||||||
India — 11.6% | ||||||||
| 1,964 | ACC Ltd. | 64,741 | ||||||
| 5,607 | Adani Enterprises Ltd. | 121,427 | ||||||
| 8,561 | Adani Green Energy Ltd.* | 124,787 | ||||||
| 9,661 | Adani Ports & Special Economic Zone Ltd. | 98,729 | ||||||
| 6,707 | Adani Total Gas Ltd. | 133,405 | ||||||
| 5,953 | Adani Transmission Ltd.* | 128,826 | ||||||
| 13,286 | Ambuja Cements Ltd. | 76,787 | ||||||
| 1,855 | Apollo Hospitals Enterprise Ltd. | 126,256 | ||||||
| 81,999 | Asian Paints Ltd. | 3,598,246 | ||||||
| 5,958 | Aurobindo Pharma Ltd. | 59,374 | ||||||
| 3,778 | Avenue Supermarts Ltd., Class A Shares*(a) | 204,365 | ||||||
| 190,201 | Axis Bank Ltd.* | 2,045,050 | ||||||
| 13,638 | Bajaj Auto Ltd. | 697,743 | ||||||
| 5,671 | Bajaj Finance Ltd. | 583,819 | ||||||
| 899 | Bajaj Finserv Ltd. | 210,148 | ||||||
| 2,275 | Balkrishna Industries Ltd. | 71,555 | ||||||
| 13,938 | Bandhan Bank Ltd.(a) | 54,223 | ||||||
| 6,522 | Berger Paints India Ltd. | 73,292 | ||||||
| 25,719 | Bharat Electronics Ltd. | 65,447 | ||||||
| 6,110 | Bharat Forge Ltd. | 64,022 | ||||||
| 137,944 | Bharat Petroleum Corp., Ltd. | 891,218 | ||||||
| 53,731 | Bharti Airtel Ltd.* | 486,569 | ||||||
| 8,802 | Biocon Ltd.* | 43,166 | ||||||
| 2,219 | Britannia Industries Ltd. | 121,133 | ||||||
| 142,290 | Cholamandalam Investment & Finance Co., Ltd. | 1,076,104 | ||||||
| 11,079 | Cipla Ltd. | 143,960 | ||||||
| 407,974 | Coal India Ltd. | 814,312 | ||||||
| 3,227 | Colgate-Palmolive India Ltd. | 74,549 | ||||||
| 6,095 | Container Corp. Of India Ltd. | 56,818 | ||||||
| 10,469 | Dabur India Ltd. | 88,971 | ||||||
| 2,812 | Divi’s Laboratories Ltd. | 198,951 | ||||||
| 16,810 | DLF Ltd. | 73,597 | ||||||
| 2,413 | Dr Reddy’s Laboratories Ltd. | 155,715 | ||||||
| 2,834 | Eicher Motors Ltd. | 103,706 | ||||||
| 34,196 | GAIL India Ltd. | 68,461 | ||||||
| 7,137 | Godrej Consumer Products Ltd.* | 107,581 | ||||||
| 6,335 | Grasim Industries Ltd. | 129,976 | ||||||
| 5,321 | Havells India Ltd. | 91,660 | ||||||
| 23,503 | HCL Technologies Ltd. | 379,284 | ||||||
| 1,229 | HDFC Asset Management Co., Ltd.(a) | 51,740 | ||||||
| 120,780 | HDFC Bank Ltd. | 2,612,757 | ||||||
| 70,456 | HDFC Bank Ltd., ADR | 5,517,409 | ||||||
| 18,294 | HDFC Life Insurance Co., Ltd.(a) | 179,751 | ||||||
| 17,144 | Hero MotoCorp Ltd. | 644,378 | ||||||
| 33,072 | Hindalco Industries Ltd. | 212,289 | ||||||
| 17,094 | Hindustan Petroleum Corp., Ltd. | 62,384 | ||||||
See Notes to Financial Statements.
147
| Schedules of Investments |
| (continued) |
| Emerging Markets Equity Fund | ||||||||
| Shares/Units | Security | Value | ||||||
India — 11.6% — (continued) | ||||||||
| 17,166 | Hindustan Unilever Ltd. | $ | 640,131 | |||||
| 36,905 | Housing Development Finance Corp., Ltd. | 1,410,578 | ||||||
| 110,513 | ICICI Bank Ltd. | 1,085,520 | ||||||
| 196,166 | ICICI Bank Ltd., ADR(c) | 3,848,777 | ||||||
| 5,614 | ICICI Lombard General Insurance Co., Ltd.(a) | 123,063 | ||||||
| 6,447 | ICICI Prudential Life Insurance Co., Ltd.(a) | 58,118 | ||||||
| 34,476 | Indian Oil Corp., Ltd. | 52,336 | ||||||
| 5,863 | Indraprastha Gas Ltd. | 43,833 | ||||||
| 368,093 | Indus Towers Ltd. | 1,082,250 | ||||||
| 1,743 | Info Edge India Ltd. | 147,708 | ||||||
| 73,328 | Infosys Ltd. | 1,722,625 | ||||||
| 1,670 | InterGlobe Aviation Ltd.*(a) | 43,647 | ||||||
| 1,817 | Ipca Laboratories Ltd. | 64,779 | ||||||
| 62,052 | ITC Ltd. | 179,366 | ||||||
| 17,890 | JSW Steel Ltd. | 168,050 | ||||||
| 1,567 | Jubilant Foodworks Ltd. | 85,686 | ||||||
| 67,370 | Kotak Mahindra Bank Ltd. | 1,612,562 | ||||||
| 914 | Larsen & Toubro Infotech Ltd.(a) | 66,770 | ||||||
| 13,778 | Larsen & Toubro Ltd. | 315,211 | ||||||
| 335,915 | Lemon Tree Hotels Ltd., (Restricted, cost — $258,326, acquired 8/29/19)*(a)(b) | 176,909 | ||||||
| 5,356 | Lupin Ltd. | 70,035 | ||||||
| 19,302 | Mahindra & Mahindra Ltd. | 209,602 | ||||||
| 12,963 | Marico Ltd. | 96,877 | ||||||
| 29,159 | Maruti Suzuki India Ltd. | 2,729,829 | ||||||
| 28,021 | Motherson Sumi Systems Ltd.* | 83,998 | ||||||
| 50 | MRF Ltd. | 54,499 | ||||||
| 3,147 | Muthoot Finance Ltd. | 65,279 | ||||||
| 769 | Nestle India Ltd. | 205,424 | ||||||
| 94,057 | NTPC Ltd. | 149,213 | ||||||
| 73,240 | Oberoi Realty Ltd.* | 712,453 | ||||||
| 535,504 | Oil & Natural Gas Corp., Ltd. | 880,927 | ||||||
| 111 | Page Industries Ltd. | 47,686 | ||||||
| 56,733 | Petronet LNG Ltd. | 177,090 | ||||||
| 57,000 | Phoenix Mills Ltd.* | 676,073 | ||||||
| 2,182 | PI Industries Ltd. | 101,970 | ||||||
| 3,010 | Pidilite Industries Ltd. | 94,020 | ||||||
| 2,673 | Piramal Enterprises Ltd. | 95,362 | ||||||
| 68,288 | Power Grid Corp. of India Ltd. | 164,004 | ||||||
| 13,216 | REC Ltd. | 27,471 | ||||||
| 286,326 | Reliance Industries Ltd. | 8,794,000 | ||||||
| 3,547 | SBI Cards & Payment Services Ltd.* | 55,614 | ||||||
| 10,061 | SBI Life Insurance Co., Ltd.(a) | 164,183 | ||||||
| 257 | Shree Cement Ltd. | 99,443 | ||||||
| 4,001 | Shriram Transport Finance Co., Ltd. | 73,818 | ||||||
| 2,065 | Siemens Ltd. | 64,202 | ||||||
| 38,438 | State Bank of India | 223,857 | ||||||
| 17,435 | Sun Pharmaceutical Industries Ltd. | 189,841 | ||||||
| 36,776 | Tata Consultancy Services Ltd. | 1,912,732 | ||||||
| 13,065 | Tata Consumer Products Ltd. | 155,093 | ||||||
| 35,565 | Tata Motors Ltd.* | 139,796 | ||||||
| 13,401 | Tata Steel Ltd. | 265,026 | ||||||
| 13,845 | Tech Mahindra Ltd. | 274,830 | ||||||
| 208,384 | Titan Co., Ltd. | 5,476,047 | ||||||
| 929 | Torrent Pharmaceuticals Ltd. | 39,467 | ||||||
| 4,476 | Trent Ltd. | 61,425 | ||||||
| 26,187 | UltraTech Cement Ltd. | 2,807,259 | ||||||
See Notes to Financial Statements.
148
| Schedules of Investments |
| (continued) |
| Emerging Markets Equity Fund | ||||||||
| Shares/Units | Security | Value | ||||||
India — 11.6% — (continued) | ||||||||
| 5,897 | United Spirits Ltd.* | $ | 57,654 | |||||
| 149,104 | UPL Ltd. | 1,510,838 | ||||||
| 24,221 | Vedanta Ltd. | 100,480 | ||||||
| 29,150 | Wipro Ltd. | 255,741 | ||||||
| 241,179 | Yes Bank Ltd.*(e) | 35,665 | ||||||
|
| |||||||
| Total India | 65,315,423 | |||||||
|
| |||||||
Indonesia — 2.0% | ||||||||
| 299,900 | Adaro Energy Tbk PT | 26,429 | ||||||
| 197,700 | Aneka Tambang Tbk | 33,091 | ||||||
| 2,745,600 | Astra International Tbk PT | 1,004,473 | ||||||
| 6,320,000 | Bank BTPN Syariah Tbk PT | 1,239,547 | ||||||
| 226,700 | Bank Central Asia Tbk PT | 520,409 | ||||||
| 4,298,724 | Bank Mandiri Persero Tbk PT | 1,833,710 | ||||||
| 151,100 | Bank Negara Indonesia Persero Tbk PT | 57,100 | ||||||
| 9,614,300 | Bank Rakyat Indonesia Persero Tbk PT | 2,642,746 | ||||||
| 430,400 | Barito Pacific Tbk PT | 32,050 | ||||||
| 174,600 | Charoen Pokphand Indonesia Tbk PT | 78,143 | ||||||
| 14,300 | Gudang Garam Tbk PT | 33,101 | ||||||
| 39,700 | Indah Kiat Pulp & Paper Tbk PT | 21,951 | ||||||
| 34,200 | Indocement Tunggal Prakarsa Tbk PT | 26,888 | ||||||
| 69,500 | Indofood CBP Sukses Makmur Tbk PT* | 41,002 | ||||||
| 90,400 | Indofood Sukses Makmur Tbk PT* | 39,074 | ||||||
| 492,600 | Kalbe Farma Tbk PT | 46,388 | ||||||
| 220,500 | Merdeka Copper Gold Tbk PT* | 43,476 | ||||||
| 505,900 | Sarana Menara Nusantara Tbk PT | 47,448 | ||||||
| 69,600 | Semen Indonesia Persero Tbk PT | 45,046 | ||||||
| 6,283,787 | Telkom Indonesia Persero Tbk PT | 1,495,439 | ||||||
| 83,185 | Telkom Indonesia Persero Tbk PT, ADR | 1,978,971 | ||||||
| 146,000 | Tower Bersama Infrastructure Tbk PT | 31,970 | ||||||
| 190,000 | Unilever Indonesia Tbk PT | 53,727 | ||||||
| 38,900 | United Tractors Tbk PT | 54,575 | ||||||
|
| |||||||
| Total Indonesia | 11,426,754 | |||||||
|
| |||||||
Kazakhstan — 0.3% | ||||||||
| 12,470 | Kaspi.KZ JSC, (Restricted, cost — $420,863, acquired 10/15/20), GDR(b) | 1,429,333 | ||||||
| 840 | Kaspi.KZ JSC, GDR(a)(f) | 96,096 | ||||||
|
| |||||||
| Total Kazakhstan | 1,525,429 | |||||||
|
| |||||||
Kenya — 0.0% | ||||||||
| 624,800 | Safaricom PLC | 240,845 | ||||||
|
| |||||||
Kuwait — 0.3% | ||||||||
| 28,173 | Agility Public Warehousing Co., KSC | 93,306 | ||||||
| 26,304 | Boubyan Bank KSCP* | 68,485 | ||||||
| 44,000 | Humansoft Holding Co. KSC | 497,916 | ||||||
| 99,763 | Kuwait Finance House KSCP | 274,061 | ||||||
| 12,432 | Mabanee Co., KPSC | 31,912 | ||||||
| 46,291 | Mobile Telecommunications Co., KSCP | 94,060 | ||||||
| 142,349 | National Bank of Kuwait SAKP | 443,066 | ||||||
|
| |||||||
| Total Kuwait | 1,502,806 | |||||||
|
| |||||||
Luxembourg — 0.0% | ||||||||
| 2,843 | Reinet Investments SCA* | 55,107 | ||||||
|
| |||||||
Malaysia — 0.4% | ||||||||
| 46,100 | AMMB Holdings Bhd* | 33,648 | ||||||
| 59,300 | Axiata Group Bhd | 59,168 | ||||||
See Notes to Financial Statements.
149
| Schedules of Investments |
| (continued) |
| Emerging Markets Equity Fund | ||||||||
| Shares/Units | Security | Value | ||||||
Malaysia — 0.4% — (continued) | ||||||||
| 133,707 | CIMB Group Holdings Bhd | $ | 157,840 | |||||
| 85,400 | Dialog Group Bhd | 54,713 | ||||||
| 60,900 | DiGi.Com Bhd | 64,485 | ||||||
| 3,000 | Fraser & Neave Holdings Bhd | 20,123 | ||||||
| 42,700 | Genting Bhd | 51,898 | ||||||
| 80,300 | Genting Malaysia Bhd | 57,389 | ||||||
| 20,100 | HAP Seng Consolidated Bhd | 41,125 | ||||||
| 39,400 | Hartalega Holdings Bhd | 69,987 | ||||||
| 15,800 | Hong Leong Bank Bhd | 72,926 | ||||||
| 2,900 | Hong Leong Financial Group Bhd | 12,708 | ||||||
| 36,300 | IHH Healthcare Bhd | 55,870 | ||||||
| 56,900 | IOI Corp. Bhd | 56,408 | ||||||
| 21,300 | Kossan Rubber Industries | 15,906 | ||||||
| 5,500 | Kuala Lumpur Kepong Bhd | 28,244 | ||||||
| 91,809 | Malayan Banking Bhd | 185,643 | ||||||
| 25,900 | Malaysia Airports Holdings Bhd* | 41,273 | ||||||
| 57,900 | Maxis Bhd | 65,360 | ||||||
| 34,300 | MISC Bhd | 59,485 | ||||||
| 1,600 | Nestle Malaysia Bhd | 51,851 | ||||||
| 47,200 | Petronas Chemicals Group Bhd | 94,346 | ||||||
| 3,600 | Petronas Dagangan Bhd | 17,298 | ||||||
| 18,400 | Petronas Gas Bhd | 74,353 | ||||||
| 12,800 | PPB Group Bhd | 57,129 | ||||||
| 75,000 | Press Metal Aluminium Holdings Bhd | 97,649 | ||||||
| 318,400 | Public Bank Bhd | 320,118 | ||||||
| 31,500 | QL Resources Bhd | 42,152 | ||||||
| 37,800 | RHB Bank Bhd | 50,874 | ||||||
| 77,200 | Sime Darby Bhd | 43,859 | ||||||
| 28,400 | Sime Darby Plantation Bhd | 27,605 | ||||||
| 24,660 | Supermax Corp. Bhd | 19,567 | ||||||
| 31,400 | Telekom Malaysia Bhd | 46,153 | ||||||
| 52,800 | Tenaga Nasional Bhd | 132,916 | ||||||
| 123,200 | Top Glove Corp. Bhd | 118,524 | ||||||
| 13,800 | Westports Holdings Bhd | 14,589 | ||||||
|
| |||||||
| Total Malaysia | 2,413,182 | |||||||
|
| |||||||
Mexico — 2.4% | ||||||||
| 118,593 | America Movil SAB de CV, Class L Shares, ADR | 2,319,679 | ||||||
| 758,366 | America Movil SAB de CV, Series L | 743,453 | ||||||
| 7,586 | Arca Continental SAB de CV | 48,862 | ||||||
| 15,467 | Becle SAB de CV | 39,667 | ||||||
| 318,068 | Cemex SAB de CV, Class Preferred Shares* | 262,563 | ||||||
| 12,281 | Coca-Cola Femsa SAB de CV | 71,191 | ||||||
| 76,190 | Fibra Uno Administracion SA de CV, REIT | 85,882 | ||||||
| 42,903 | Fomento Economico Mexicano SAB de CV | 372,767 | ||||||
| 3,623 | Gruma SAB de CV, Class B Shares | 41,272 | ||||||
| 8,082 | Grupo Aeroportuario del Pacifico SAB de CV, Class B Shares* | 94,103 | ||||||
| 4,684 | Grupo Aeroportuario del Sureste SAB de CV, Class B Shares | 83,790 | ||||||
| 33,100 | Grupo Bimbo SAB de CV, Series A | 83,587 | ||||||
| 12,114 | Grupo Carso SAB de CV, Series A1 | 41,387 | ||||||
| 277,093 | Grupo Financiero Banorte SAB de CV, Class O Shares | 1,828,942 | ||||||
| 48,261 | Grupo Financiero Inbursa SAB de CV, Class O Shares* | 46,375 | ||||||
| 344,630 | Grupo México SAB de CV, Series B | 1,597,811 | ||||||
| 52,398 | Grupo Televisa SAB | 138,007 | ||||||
| 2,464 | Industrias Peñoles SAB de CV* | 34,732 | ||||||
| 512,040 | Kimberly-Clark de México SAB de CV, Class A Shares | 908,596 | ||||||
See Notes to Financial Statements.
150
| Schedules of Investments |
| (continued) |
| Emerging Markets Equity Fund | ||||||||
| Shares/Units | Security | Value | ||||||
Mexico — 2.4% — (continued) | ||||||||
| 7,978 | Megacable Holdings SAB de CV | $ | 27,813 | |||||
| 475,746 | Orbia Advance Corp. SAB de CV | 1,359,379 | ||||||
| 3,707 | Promotora y Operadora de Infraestructura SAB de CV | 27,685 | ||||||
| 205,681 | Qualitas Controladora SAB de CV | 973,057 | ||||||
| 254,100 | Regional SAB de CV | 1,556,864 | ||||||
| 29,228 | Telesites SAB de CV* | 26,791 | ||||||
| 115,659 | Wal-Mart de Mexico SAB de CV | 410,408 | ||||||
|
| |||||||
| Total Mexico | 13,224,663 | |||||||
|
| |||||||
Netherlands — 1.2% | ||||||||
| 78,813 | Prosus NV* | 6,996,857 | ||||||
|
| |||||||
Pakistan — 0.0% | ||||||||
| 21,800 | Habib Bank Ltd. | 16,329 | ||||||
| 4,036 | Lucky Cement Ltd.* | 20,064 | ||||||
| 822 | MCB Bank Ltd. | 810 | ||||||
|
| |||||||
| Total Pakistan | 37,203 | |||||||
|
| |||||||
Peru — 0.3% | ||||||||
| 4,824 | Cia de Minas Buenaventura SAA, ADR* | 36,180 | ||||||
| 13,920 | Credicorp Ltd.* | 1,484,290 | ||||||
| 1,829 | Southern Copper Corp. | 114,477 | ||||||
|
| |||||||
| Total Peru | 1,634,947 | |||||||
|
| |||||||
Philippines — 0.8% | ||||||||
| 43,280 | Aboitiz Equity Ventures Inc. | 37,518 | ||||||
| 6,660 | Ayala Corp. | 106,348 | ||||||
| 166,460 | Ayala Land Inc. | 113,216 | ||||||
| 34,918 | Bank of the Philippine Islands | 58,531 | ||||||
| 45,844 | BDO Unibank Inc. | 101,469 | ||||||
| 5,586,900 | Bloomberry Resorts Corp.* | 667,875 | ||||||
| 620 | Globe Telecom Inc. | 33,963 | ||||||
| 2,800 | GT Capital Holdings Inc. | 30,405 | ||||||
| 588,870 | International Container Terminal Services Inc. | 2,204,294 | ||||||
| 67,856 | JG Summit Holdings Inc. | 88,816 | ||||||
| 9,470 | Jollibee Foods Corp. | 38,499 | ||||||
| 6,170 | Manila Electric Co. | 35,034 | ||||||
| 109,500 | Metro Pacific Investments Corp. | 8,494 | ||||||
| 31,956 | Metropolitan Bank & Trust Co. | 29,087 | ||||||
| 1,505 | PLDT Inc. | 44,438 | ||||||
| 620,590 | Robinsons Retail Holdings Inc. | 637,592 | ||||||
| 5,930 | SM Investments Corp. | 120,453 | ||||||
| 209,900 | SM Prime Holdings Inc. | 143,666 | ||||||
| 22,540 | Universal Robina Corp. | 68,450 | ||||||
|
| |||||||
| Total Philippines | 4,568,148 | |||||||
|
| |||||||
Poland — 0.4% | ||||||||
| 8,535 | Allegro.eu SA*(a) | 158,011 | ||||||
| 3,979 | Bank Polska Kasa Opieki SA* | 111,271 | ||||||
| 1,614 | CD Projekt SA(c) | 71,512 | ||||||
| 6,856 | Cyfrowy Polsat SA | 65,422 | ||||||
| 836 | Dino Polska SA*(a) | 70,756 | ||||||
| 41,100 | InPost SA* | 802,724 | ||||||
| 3,033 | KGHM Polska Miedz SA | 141,796 | ||||||
| 24 | LPP SA | 87,387 | ||||||
| 9,733 | Orange Polska SA* | 21,038 | ||||||
| 13,221 | PGE Polska Grupa Energetyczna SA* | 34,800 | ||||||
| 7,141 | Polski Koncern Naftowy ORLEN SA | 138,982 | ||||||
See Notes to Financial Statements.
151
| Schedules of Investments |
| (continued) |
| Emerging Markets Equity Fund | ||||||||
| Shares/Units | Security | Value | ||||||
Poland — 0.4% — (continued) | ||||||||
| 38,865 | Polskie Gornictwo Naftowe i Gazownictwo SA | $ | 63,909 | |||||
| 18,828 | Powszechna Kasa Oszczednosci Bank Polski SA* | 206,646 | ||||||
| 13,963 | Powszechny Zaklad Ubezpieczen SA* | 147,892 | ||||||
| 646 | Santander Bank Polska SA* | 50,888 | ||||||
|
| |||||||
| Total Poland | 2,173,034 | |||||||
|
| |||||||
Portugal — 0.2% | ||||||||
| 127,183 | Galp Energia SGPS SA | 1,303,528 | ||||||
|
| |||||||
Qatar — 0.2% | ||||||||
| 58,133 | Barwa Real Estate Co. | 48,340 | ||||||
| 56,283 | Commercial Bank PSQC | 92,237 | ||||||
| 31,452 | Industries Qatar QSC | 109,393 | ||||||
| 68,894 | Masraf Al Rayan QSC | 84,990 | ||||||
| 85,967 | Mesaieed Petrochemical Holding Co. | 46,560 | ||||||
| 13,747 | Ooredoo QPSC | 25,719 | ||||||
| 12,424 | Qatar Electricity & Water Co. QSC | 55,850 | ||||||
| 10,432 | Qatar Fuel QSC | 51,757 | ||||||
| 50,244 | Qatar Gas Transport Co., Ltd. | 42,135 | ||||||
| 16,205 | Qatar International Islamic Bank QSC | 42,127 | ||||||
| 20,139 | Qatar Islamic Bank SAQ | 99,896 | ||||||
| 98,858 | Qatar National Bank QPSC | 513,320 | ||||||
|
| |||||||
| Total Qatar | 1,212,324 | |||||||
|
| |||||||
Romania — 0.0% | ||||||||
| 9,224 | NEPI Rockcastle PLC | 66,600 | ||||||
|
| |||||||
Russia — 4.7% | ||||||||
| 595,118 | Alrosa PJSC | 1,184,785 | ||||||
| 432,100 | Detsky Mir PJSC, (Restricted, cost — $697,226, acquired 10/15/20)(a)(b) | 818,469 | ||||||
| 153,000 | Fix Price Group Ltd., (Restricted, cost — $1,473,726, acquired 3/5/21), GDR*(b) | 1,428,255 | ||||||
| 255,840 | Gazprom PJSC | 1,068,802 | ||||||
| 169,369 | Gazprom PJSC, ADR | 1,406,440 | ||||||
| 885,983 | Inter RAO UES PJSC | 55,825 | ||||||
| 8,996 | Lukoil PJSC | 769,142 | ||||||
| 58,144 | Lukoil PJSC, ADR | 4,973,305 | ||||||
| 7,104 | Magnit PJSC, Class Registered Shares, GDR | 107,846 | ||||||
| 2,330 | Mail.Ru Group Ltd., GDR* | 47,090 | ||||||
| 1,332 | MMC Norilsk Nickel PJSC | 437,492 | ||||||
| 194,783 | Mobile TeleSystems PJSC, ADR | 1,827,065 | ||||||
| 27,471 | Moscow Exchange MICEX-RTS PJSC | 68,753 | ||||||
| 1,943 | Novatek PJSC, Class Registered Shares, GDR | 460,215 | ||||||
| 29,577 | Novolipetsk Steel PJSC | 99,697 | ||||||
| 894 | Ozon Holdings PLC, ADR* | 46,860 | ||||||
| 2,783 | PhosAgro PJSC, Class Registered Shares, GDR | 54,837 | ||||||
| 7,431 | Polymetal International PLC | 148,676 | ||||||
| 740 | Polyus PJSC | 133,429 | ||||||
| 25,771 | Rosneft Oil Co. PJSC | 187,875 | ||||||
| 870,397 | Sberbank of Russia PJSC | 3,908,951 | ||||||
| 235,219 | Sberbank of Russia PJSC, ADR | 4,202,350 | ||||||
| 5,352 | Severstal PAO | 125,594 | ||||||
| 235,623 | Surgutneftegas PJSC | 113,994 | ||||||
| 31,567 | Tatneft PJSC | 208,821 | ||||||
| 60,086,472 | VTB Bank PJSC | 43,443 | ||||||
| 5,549 | X5 Retail Group NV, Class Registered Shares, GDR | 184,211 | ||||||
| 24,755 | X5 Retail Group NV, GDR | 820,133 | ||||||
See Notes to Financial Statements.
152
| Schedules of Investments |
| (continued) |
| Emerging Markets Equity Fund | ||||||||
| Shares/Units | Security | Value | ||||||
Russia — 4.7% — (continued) | ||||||||
| 20,184 | Yandex NV, Class A Shares* | $ | 1,547,737 | |||||
|
| |||||||
| Total Russia | 26,480,092 | |||||||
|
| |||||||
Saudi Arabia — 1.0% | ||||||||
| 584 | Abdullah Al Othaim Markets Co. | 17,937 | ||||||
| 2,938 | Advanced Petrochemical Co. | 56,111 | ||||||
| 25,805 | Al Rajhi Bank | 832,445 | ||||||
| 23,349 | Alinma Bank | 142,546 | ||||||
| 6,060 | Almarai Co. JSC | 93,704 | ||||||
| 14,805 | Arab National Bank | 90,312 | ||||||
| 7,275 | Bank AlBilad* | 82,915 | ||||||
| 7,192 | Bank Al-Jazira | 35,518 | ||||||
| 12,740 | Banque Saudi Fransi | 137,595 | ||||||
| 877 | Bupa Arabia for Cooperative Insurance Co. | 39,050 | ||||||
| 1,797 | Co. for Cooperative Insurance | 43,835 | ||||||
| 5,741 | Dar Al Arkan Real Estate Development Co.* | 15,612 | ||||||
| 944 | Dr Sulaiman Al Habib Medical Services Group Co. | 46,207 | ||||||
| 3,935 | Emaar Economic City* | 13,405 | ||||||
| 8,287 | Etihad Etisalat Co. | 70,751 | ||||||
| 1,138 | Jarir Marketing Co. | 65,716 | ||||||
| 12,541 | Mobile Telecommunications Co.* | 48,418 | ||||||
| 1,161 | Mouwasat Medical Services Co. | 60,669 | ||||||
| 9,889 | National Industrialization Co.* | 55,045 | ||||||
| 1,719 | National Petrochemical Co. | 21,770 | ||||||
| 6,566 | Rabigh Refining & Petrochemical Co.* | 43,093 | ||||||
| 29,590 | Riyad Bank | 212,205 | ||||||
| 4,953 | SABIC Agri-Nutrients Co. | 165,590 | ||||||
| 5,198 | Sahara International Petrochemical Co. | 46,169 | ||||||
| 10,443 | Saudi Arabian Mining Co.* | 202,678 | ||||||
| 44,626 | Saudi Arabian Oil Co.(a) | 418,219 | ||||||
| 19,764 | Saudi Basic Industries Corp. | 648,086 | ||||||
| 16,613 | Saudi British Bank | 152,577 | ||||||
| 2,168 | Saudi Cement Co. | 36,239 | ||||||
| 18,903 | Saudi Electricity Co. | 137,583 | ||||||
| 6,611 | Saudi Industrial Investment Group | 63,275 | ||||||
| 15,381 | Saudi Kayan Petrochemical Co.* | 76,361 | ||||||
| 47,292 | Saudi National Bank | 766,594 | ||||||
| 12,344 | Saudi Telecom Co. | 444,223 | ||||||
| 5,902 | Savola Group | 63,197 | ||||||
| 6,603 | Yanbu National Petrochemical Co. | 119,353 | ||||||
|
| |||||||
| Total Saudi Arabia | 5,565,003 | |||||||
|
| |||||||
Singapore — 1.0% | ||||||||
| 3,600 | BOC Aviation Ltd.(a) | 26,977 | ||||||
| 1,271 | JOYY Inc., ADR(c) | 80,454 | ||||||
| 16,647 | Sea Ltd., ADR* | 5,632,013 | ||||||
|
| |||||||
| Total Singapore | 5,739,444 | |||||||
|
| |||||||
South Africa — 2.4% | ||||||||
| 15,861 | Absa Group Ltd.* | 172,157 | ||||||
| 1,957 | African Rainbow Minerals Ltd. | 35,076 | ||||||
| 1,188 | Anglo American Platinum Ltd. | 135,615 | ||||||
| 9,328 | AngloGold Ashanti Ltd. | 158,555 | ||||||
| 7,696 | Aspen Pharmacare Holdings Ltd.* | 103,898 | ||||||
| 7,144 | Bid Corp., Ltd.* | 157,319 | ||||||
| 92,678 | Bidvest Group Ltd. | 1,307,956 | ||||||
| 1,799 | Capitec Bank Holdings Ltd. | 235,083 | ||||||
See Notes to Financial Statements.
153
| Schedules of Investments |
| (continued) |
| Emerging Markets Equity Fund | ||||||||
| Shares/Units | Security | Value | ||||||
South Africa — 2.4% — (continued) | ||||||||
| 5,665 | Clicks Group Ltd. | $ | 117,995 | |||||
| 10,460 | Discovery Ltd.* | 92,977 | ||||||
| 5,384 | Exxaro Resources Ltd. | 68,354 | ||||||
| 105,457 | FirstRand Ltd. | 449,322 | ||||||
| 17,542 | Gold Fields Ltd. | 167,101 | ||||||
| 79,517 | Growthpoint Properties Ltd., REIT | 84,758 | ||||||
| 14,005 | Harmony Gold Mining Co., Ltd. | 51,850 | ||||||
| 17,405 | Impala Platinum Holdings Ltd. | 266,666 | ||||||
| 1,245 | Kumba Iron Ore Ltd. | 56,183 | ||||||
| 630,772 | Life Healthcare Group Holdings Ltd.* | 1,075,573 | ||||||
| 5,962 | Mr Price Group Ltd. | 89,837 | ||||||
| 37,356 | MTN Group Ltd.* | 343,770 | ||||||
| 7,193 | MultiChoice Group | 56,898 | ||||||
| 4,703 | Naspers Ltd., Class N Shares | 806,807 | ||||||
| 149,283 | Nedbank Group Ltd.* | 1,898,608 | ||||||
| 8,443 | Northam Platinum Ltd.* | 116,163 | ||||||
| 109,246 | Old Mutual Ltd. | 115,455 | ||||||
| 18,253 | Rand Merchant Investment Holdings Ltd. | 39,809 | ||||||
| 10,942 | Remgro Ltd. | 90,997 | ||||||
| 221,504 | Sanlam Ltd. | 985,114 | ||||||
| 12,407 | Sasol Ltd.* | 191,214 | ||||||
| 10,563 | Shoprite Holdings Ltd. | 133,672 | ||||||
| 61,397 | Sibanye Stillwater Ltd. | 251,343 | ||||||
| 3,447 | SPAR Group Ltd. | 49,376 | ||||||
| 120,638 | Standard Bank Group Ltd. | 1,235,047 | ||||||
| 4,420 | Tiger Brands Ltd. | 56,580 | ||||||
| 419,173 | Transaction Capital Ltd. | 1,096,691 | ||||||
| 90,938 | Vodacom Group Ltd. | 898,968 | ||||||
| 20,440 | Woolworths Holdings Ltd.* | 89,590 | ||||||
|
| |||||||
| Total South Africa | 13,282,377 | |||||||
|
| |||||||
South Korea — 12.8% | ||||||||
| 471 | Alteogen Inc.* | 34,441 | ||||||
| 709 | Amorepacific Corp. | 138,973 | ||||||
| 638 | AMOREPACIFIC Group | 31,762 | ||||||
| 233 | BGF retail Co., Ltd. | 35,838 | ||||||
| 1,825 | Celltrion Healthcare Co., Ltd.* | 194,351 | ||||||
| 2,041 | Celltrion Inc.* | 514,653 | ||||||
| 413 | Celltrion Pharm Inc.* | 61,491 | ||||||
| 1,194 | Cheil Worldwide Inc. | 23,732 | ||||||
| 160 | CJ CheilJedang Corp. | 62,488 | ||||||
| 243 | CJ Corp. | 21,199 | ||||||
| 153 | CJ ENM Co., Ltd. | 20,198 | ||||||
| 135 | CJ Logistics Corp.* | 19,894 | ||||||
| 22,185 | Coway Co., Ltd. | 1,495,529 | ||||||
| 1,186 | Daewoo Shipbuilding & Marine Engineering Co., Ltd.* | 28,563 | ||||||
| 962 | DB Insurance Co., Ltd. | 48,614 | ||||||
| 1,233 | Doosan Bobcat Inc.* | 45,824 | ||||||
| 14,660 | Doosan Fuel Cell Co., Ltd.* | 691,865 | ||||||
| 6,118 | Doosan Heavy Industries & Construction Co., Ltd.* | 110,061 | ||||||
| 216 | Douzone Bizon Co., Ltd. | 15,838 | ||||||
| 235 | Ecopro BM Co., Ltd.* | 64,970 | ||||||
| 446 | E-MART Inc. | 68,671 | ||||||
| 831 | Fila Holdings Corp. | 32,060 | ||||||
| 127 | Green Cross Corp. | 42,101 | ||||||
| 1,204 | GS Engineering & Construction Corp. | 46,242 | ||||||
See Notes to Financial Statements.
154
| Schedules of Investments |
| (continued) |
| Emerging Markets Equity Fund | ||||||||
| Shares/Units | Security | Value | ||||||
South Korea — 12.8% — (continued) | ||||||||
| 1,234 | GS Holdings Corp. | $ | 44,959 | |||||
| 6,517 | Hana Financial Group Inc. | 252,443 | ||||||
| 1,886 | Hankook Tire & Technology Co., Ltd. | 75,666 | ||||||
| 115 | Hanmi Pharm Co., Ltd. | 30,615 | ||||||
| 3,831 | Hanon Systems | 54,210 | ||||||
| 2,437 | Hanwha Solutions Corp.* | 85,480 | ||||||
| 1,826 | HLB Inc.* | 87,192 | ||||||
| 5,668 | HMM Co., Ltd.* | 204,723 | ||||||
| 672 | Hotel Shilla Co., Ltd. | 51,934 | ||||||
| 299 | HYBE Co., Ltd.* | 74,500 | ||||||
| 1,329 | Hyundai Engineering & Construction Co., Ltd. | 63,404 | ||||||
| 434 | Hyundai Glovis Co., Ltd. | 72,362 | ||||||
| 1,100 | Hyundai Heavy Industries Holdings Co., Ltd. | 61,813 | ||||||
| 7,334 | Hyundai Mobis Co., Ltd. | 1,751,163 | ||||||
| 3,027 | Hyundai Motor Co. | 553,109 | ||||||
| 1,832 | Hyundai Steel Co. | 80,085 | ||||||
| 5,013 | Industrial Bank of Korea | 44,445 | ||||||
| 6,660 | Kakao Corp. | 887,794 | ||||||
| 1,127 | KakaoBank Corp.* | 81,591 | ||||||
| 2,405 | Kangwon Land Inc.* | 57,335 | ||||||
| 47,365 | KB Financial Group Inc. | 2,161,223 | ||||||
| 5,530 | Kia Corp. | 404,625 | ||||||
| 1,943 | Korea Aerospace Industries Ltd. | 55,056 | ||||||
| 5,040 | Korea Electric Power Corp. | 104,155 | ||||||
| 955 | Korea Investment Holdings Co., Ltd. | 78,239 | ||||||
| 890 | Korea Shipbuilding & Offshore Engineering Co., Ltd.* | 90,623 | ||||||
| 194 | Korea Zinc Co., Ltd. | 88,906 | ||||||
| 3,548 | Korean Air Lines Co., Ltd.* | 95,430 | ||||||
| 19,332 | KT&G Corp. | 1,359,798 | ||||||
| 408 | Kumho Petrochemical Co., Ltd.(c) | 68,319 | ||||||
| 12,798 | LG Chem Ltd. | 8,364,097 | ||||||
| 1,886 | LG Corp. | 154,744 | ||||||
| 5,648 | LG Display Co., Ltd.(c) | 99,508 | ||||||
| 2,329 | LG Electronics Inc. | 284,345 | ||||||
| 1,644 | LG Household & Health Care Ltd. | 2,071,519 | ||||||
| 336 | LG Innotek Co., Ltd. | 62,037 | ||||||
| 4,603 | LG Uplus Corp. | 55,701 | ||||||
| 422 | Lotte Chemical Corp. | 90,822 | ||||||
| 312 | Lotte Shopping Co., Ltd. | 28,851 | ||||||
| 4,055 | Meritz Securities Co., Ltd. | 18,697 | ||||||
| 5,758 | Mirae Asset Securities Co., Ltd. | 43,653 | ||||||
| 17,999 | NAVER Corp. | 6,802,324 | ||||||
| 360 | NCSoft Corp. | 204,873 | ||||||
| 529 | Netmarble Corp.(a) | 58,716 | ||||||
| 1,507 | NH Investment & Securities Co., Ltd. | 17,173 | ||||||
| 640 | Orion Corp. | 69,717 | ||||||
| 6,901 | Pan Ocean Co., Ltd. | 49,296 | ||||||
| 745 | Pearl Abyss Corp.* | 60,216 | ||||||
| 1,631 | POSCO | 469,092 | ||||||
| 598 | POSCO Chemical Co., Ltd.(c) | 79,956 | ||||||
| 256 | S-1 Corp. | 18,122 | ||||||
| 362 | Samsung Biologics Co., Ltd.*(a) | 300,869 | ||||||
| 1,837 | Samsung C&T Corp. | 210,150 | ||||||
| 1,209 | Samsung Electro-Mechanics Co., Ltd. | 191,634 | ||||||
| 366,381 | Samsung Electronics Co., Ltd. | 24,194,964 | ||||||
| 3,127 | Samsung Engineering Co., Ltd.* | 60,040 | ||||||
See Notes to Financial Statements.
155
| Schedules of Investments |
| (continued) |
| Emerging Markets Equity Fund | ||||||||
| Shares/Units | Security | Value | ||||||
South Korea — 12.8% — (continued) | ||||||||
| 662 | Samsung Fire & Marine Insurance Co., Ltd. | $ | 128,941 | |||||
| 9,859 | Samsung Heavy Industries Co., Ltd.* | 53,465 | ||||||
| 1,356 | Samsung Life Insurance Co., Ltd. | 87,028 | ||||||
| 6,977 | Samsung SDI Co., Ltd. | 4,752,804 | ||||||
| 721 | Samsung SDS Co., Ltd. | 107,051 | ||||||
| 1,147 | Samsung Securities Co., Ltd. | 48,772 | ||||||
| 794 | Seegene Inc. | 45,025 | ||||||
| 766 | Shin Poong Pharmaceutical Co., Ltd. | 46,548 | ||||||
| 57,758 | Shinhan Financial Group Co., Ltd. | 1,930,634 | ||||||
| 131 | Shinsegae Inc. | 30,353 | ||||||
| 400 | SK Biopharmaceuticals Co., Ltd.* | 43,224 | ||||||
| 381 | SK Bioscience Co., Ltd.* | 103,066 | ||||||
| 200 | SK Chemicals Co., Ltd. | 46,515 | ||||||
| 74,482 | SK Hynix Inc. | 6,816,858 | ||||||
| 305 | SK IE Technology Co., Ltd.*(a) | 54,610 | ||||||
| 679 | SK Inc. | 153,692 | ||||||
| 1,115 | SK Innovation Co., Ltd.* | 239,168 | ||||||
| 17 | SK Telecom Co., Ltd. | 4,364 | ||||||
| 436 | SKC Co., Ltd. | 59,755 | ||||||
| 1,034 | S-Oil Corp. | 84,134 | ||||||
| 11,081 | Woori Financial Group Inc. | 107,240 | ||||||
| 938 | Yuhan Corp. | 50,499 | ||||||
|
| |||||||
| Total South Korea | 72,025,417 | |||||||
|
| |||||||
Taiwan — 12.2% | ||||||||
| 12,000 | Accton Technology Corp. | 121,576 | ||||||
| 72,000 | Acer Inc. | 65,431 | ||||||
| 7,777 | Advantech Co., Ltd. | 108,437 | ||||||
| 542,498 | ASE Technology Holding Co., Ltd.* | 2,503,967 | ||||||
| 46,000 | Asia Cement Corp. | 74,485 | ||||||
| 15,000 | Asustek Computer Inc. | 175,606 | ||||||
| 175,000 | AU Optronics Corp. | 110,804 | ||||||
| 10,000 | Catcher Technology Co., Ltd. | 60,336 | ||||||
| 154,738 | Cathay Financial Holding Co., Ltd. | 332,461 | ||||||
| 27,392 | Chailease Holding Co., Ltd. | 263,501 | ||||||
| 87,015 | Chang Hwa Commercial Bank Ltd. | 51,900 | ||||||
| 31,000 | Cheng Shin Rubber Industry Co., Ltd. | 41,680 | ||||||
| 324,000 | China Development Financial Holding Corp. | 165,877 | ||||||
| 36,193 | China Life Insurance Co., Ltd. | 37,710 | ||||||
| 258,000 | China Steel Corp. | 354,280 | ||||||
| 99,000 | Chroma ATE Inc. | 641,296 | ||||||
| 77,000 | Chunghwa Telecom Co., Ltd. | 312,216 | ||||||
| 68,000 | Compal Electronics Inc. | 56,185 | ||||||
| 412,880 | CTBC Financial Holding Co., Ltd. | 342,883 | ||||||
| 266,000 | Delta Electronics Inc. | 2,598,462 | ||||||
| 264,477 | E.Sun Financial Holding Co., Ltd. | 254,155 | ||||||
| 4,100 | Eclat Textile Co., Ltd. | 82,492 | ||||||
| 55,478 | Evergreen Marine Corp. Taiwan Ltd. | 269,409 | ||||||
| 54,000 | Far Eastern New Century Corp. | 58,553 | ||||||
| 35,000 | Far EasTone Telecommunications Co., Ltd. | 77,947 | ||||||
| 10,920 | Feng TAY Enterprise Co., Ltd. | 85,164 | ||||||
| 227,449 | First Financial Holding Co., Ltd. | 188,201 | ||||||
| 74,000 | Formosa Chemicals & Fibre Corp. | 224,646 | ||||||
| 28,000 | Formosa Petrochemical Corp. | 98,693 | ||||||
| 83,000 | Formosa Plastics Corp. | 307,365 | ||||||
| 22,230 | Foxconn Technology Co., Ltd. | 53,073 | ||||||
See Notes to Financial Statements.
156
| Schedules of Investments |
| (continued) |
| Emerging Markets Equity Fund | ||||||||
| Shares/Units | Security | Value | ||||||
Taiwan — 12.2% — (continued) | ||||||||
| 140,000 | Fubon Financial Holding Co., Ltd. | $ | 428,711 | |||||
| 6,000 | Giant Manufacturing Co., Ltd. | 72,508 | ||||||
| 182,000 | Globalwafers Co., Ltd. | 5,706,097 | ||||||
| 4,422 | Hiwin Technologies Corp. | 51,983 | ||||||
| 691,660 | Hon Hai Precision Industry Co., Ltd. | 2,765,747 | ||||||
| 6,000 | Hotai Motor Co., Ltd. | 126,392 | ||||||
| 186,562 | Hua Nan Financial Holdings Co., Ltd.* | 140,920 | ||||||
| 178,000 | Innolux Corp. | 110,758 | ||||||
| 49,000 | Inventec Corp. | 43,017 | ||||||
| 2,541 | Largan Precision Co., Ltd. | 245,444 | ||||||
| 48,264 | Lite-On Technology Corp., ADR | 106,620 | ||||||
| 102,000 | MediaTek Inc. | 3,311,124 | ||||||
| 242,000 | Mega Financial Holding Co., Ltd. | 286,871 | ||||||
| 17,000 | Micro-Star International Co., Ltd. | 79,968 | ||||||
| 1,000 | momo.com Inc. | 62,012 | ||||||
| 109,000 | Nan Ya Plastics Corp. | 352,355 | ||||||
| 6,000 | Nan Ya Printed Circuit Board Corp. | 91,020 | ||||||
| 29,000 | Nanya Technology Corp. | 69,354 | ||||||
| 3,000 | Nien Made Enterprise Co., Ltd. | 44,869 | ||||||
| 122,000 | Novatek Microelectronics Corp. | 1,968,712 | ||||||
| 5,000 | Oneness Biotech Co., Ltd.* | 34,844 | ||||||
| 43,000 | Pegatron Corp. | 100,715 | ||||||
| 4,000 | Phison Electronics Corp. | 61,425 | ||||||
| 44,000 | Pou Chen Corp. | 52,349 | ||||||
| 8,000 | Powertech Technology Inc. | 32,474 | ||||||
| 63,660 | Poya International Co., Ltd. | 1,162,501 | ||||||
| 13,539 | President Chain Store Corp.* | 139,635 | ||||||
| 430,000 | Quanta Computer Inc. | 1,217,202 | ||||||
| 10,000 | Realtek Semiconductor Corp. | 199,777 | ||||||
| 24,180 | Ruentex Development Co., Ltd. | 60,440 | ||||||
| 73,206 | Shanghai Commercial & Savings Bank Ltd. | 119,063 | ||||||
| 252,693 | Shin Kong Financial Holding Co., Ltd. | 86,658 | ||||||
| 222,846 | SinoPac Financial Holdings Co., Ltd. | 114,659 | ||||||
| 35,700 | Synnex Technology International Corp. | 69,330 | ||||||
| 225,811 | Taishin Financial Holding Co., Ltd.* | 157,723 | ||||||
| 109,980 | Taiwan Cement Corp. | 192,511 | ||||||
| 173,792 | Taiwan Cooperative Financial Holding Co., Ltd. | 140,314 | ||||||
| 36,000 | Taiwan High Speed Rail Corp. | 39,274 | ||||||
| 29,000 | Taiwan Mobile Co., Ltd. | 105,912 | ||||||
| 773,507 | Taiwan Semiconductor Manufacturing Co., Ltd. | 17,039,572 | ||||||
| 143,991 | Taiwan Semiconductor Manufacturing Co., Ltd., ADR | 17,136,369 | ||||||
| 25,000 | Unimicron Technology Corp. | 132,362 | ||||||
| 107,000 | Uni-President Enterprises Corp.* | 279,390 | ||||||
| 250,000 | United Microelectronics Corp. | 566,731 | ||||||
| 23,000 | Vanguard International Semiconductor Corp. | 122,799 | ||||||
| 7,000 | Walsin Technology Corp.* | 45,472 | ||||||
| 12,000 | Wan Hai Lines Ltd.* | 106,329 | ||||||
| 8,000 | Win Semiconductors Corp. | 95,237 | ||||||
| 59,000 | Winbond Electronics Corp. | 62,539 | ||||||
| 73,361 | Wistron Corp. | 72,626 | ||||||
| 52,000 | Wiwynn Corp. | 1,821,403 | ||||||
| 25,760 | WPG Holdings Ltd. | 45,045 | ||||||
| 8,188 | Yageo Corp. | 140,990 | ||||||
| 35,000 | Yang Ming Marine Transport Corp.* | 167,918 | ||||||
| 232,960 | Yuanta Financial Holding Co., Ltd. | 210,192 | ||||||
See Notes to Financial Statements.
157
| Schedules of Investments |
| (continued) |
| Emerging Markets Equity Fund | ||||||||
| Shares/Units | Security | Value | ||||||
Taiwan — 12.2% — (continued) | ||||||||
| 14,000 | Zhen Ding Technology Holding Ltd. | $ | 50,229 | |||||
|
| |||||||
| Total Taiwan | 68,365,282 | |||||||
|
| |||||||
Thailand — 1.0% | ||||||||
| 28,100 | Advanced Info Service PCL, NVDR | 163,615 | ||||||
| 91,100 | Airports of Thailand PCL, NVDR | 179,813 | ||||||
| 185,700 | Asset World Corp. PCL, NVDR* | 24,932 | ||||||
| 20,800 | B Grimm Power PCL, NVDR | 29,797 | ||||||
| 51,800 | Bangkok Commercial Asset Mangement PCL, NVDR | 29,824 | ||||||
| 191,100 | Bangkok Dusit Medical Services PCL, NVDR | 138,435 | ||||||
| 110,600 | Bangkok Expressway & Metro PCL, NVDR | 29,620 | ||||||
| 34,400 | Berli Jucker PCL, NVDR | 38,588 | ||||||
| 98,100 | BTS Group Holdings PCL, NVDR | 28,505 | ||||||
| 9,500 | Bumrungrad Hospital PCL, NVDR | 39,113 | ||||||
| 6,000 | Carabao Group PCL,NVDR | 26,020 | ||||||
| 37,000 | Central Pattana PCL, NVDR | 61,616 | ||||||
| 33,616 | Central Retail Corp. PCL, NVDR | 35,672 | ||||||
| 86,300 | Charoen Pokphand Foods PCL, NVDR | 72,165 | ||||||
| 127,100 | CP ALL PCL, NVDR | 255,773 | ||||||
| 6,600 | Delta Electronics Thailand PCL, NVDR | 119,054 | ||||||
| 4,600 | Electricity Generating PCL, NVDR | 25,775 | ||||||
| 37,100 | Energy Absolute PCL, NVDR | 75,226 | ||||||
| 17,400 | Global Power Synergy PCL, NVDR | 44,890 | ||||||
| 64,600 | Gulf Energy Development PCL, NVDR | 83,469 | ||||||
| 137,900 | Home Product Center PCL, NVDR | 61,027 | ||||||
| 31,100 | Indorama Ventures PCL, NVDR | 42,087 | ||||||
| 18,950 | Intouch Holdings PCL, NVDR | 50,239 | ||||||
| 240,500 | Kasikornbank PCL | 910,296 | ||||||
| 60,700 | Krung Thai Bank PCL, NVDR | 21,057 | ||||||
| 22,200 | Krungthai Card PCL, NVDR | 45,481 | ||||||
| 56,500 | Land and Houses PCL, NVDR | 14,256 | ||||||
| 60,300 | Minor International PCL, NVDR* | 61,123 | ||||||
| 19,800 | Muangthai Capital PCL, NVDR | 39,645 | ||||||
| 22,800 | Osotspa PCL, NVDR | 25,770 | ||||||
| 28,100 | PTT Exploration & Production PCL, NVDR | 96,763 | ||||||
| 54,100 | PTT Global Chemical PCL, NVDR | 107,025 | ||||||
| 60,000 | PTT Oil & Retail Business PCL, NVDR | 56,190 | ||||||
| 212,500 | PTT PCL, NVDR | 251,131 | ||||||
| 21,400 | Ratch Group PCL, NVDR | 31,362 | ||||||
| 24,300 | SCG Packaging PCL, NVDR | 52,664 | ||||||
| 115,800 | Siam Cement PCL, Class Registered Shares | 1,543,282 | ||||||
| 16,900 | Siam Cement PCL, NVDR | 225,072 | ||||||
| 20,000 | Siam Commercial Bank PCL, NVDR | 65,911 | ||||||
| 21,600 | Sri Trang Gloves Thailand PCL, NVDR(c) | 24,763 | ||||||
| 20,800 | Srisawad Corp. PCL, NVDR | 46,170 | ||||||
| 24,300 | Thai Oil PCL, NVDR | 37,329 | ||||||
| 51,000 | Thai Union Group PCL, NVDR | 31,433 | ||||||
| 336,600 | True Corp. PCL, NVDR(c) | 34,602 | ||||||
|
| |||||||
| Total Thailand | 5,376,580 | |||||||
|
| |||||||
Turkey — 0.6% | ||||||||
| 123,590 | Agesa Hayat ve Emeklilik AS | 276,974 | ||||||
| 61,436 | Akbank TAS | 43,298 | ||||||
| 17,844 | Aselsan Elektronik Sanayi Ve Ticaret AS | 33,864 | ||||||
| 11,261 | BIM Birlesik Magazalar AS | 97,280 | ||||||
| 28,391 | Eregli Demir ve Celik Fabrikalari TAS | 64,129 | ||||||
| 601 | Ford Otomotiv Sanayi AS | 12,427 | ||||||
See Notes to Financial Statements.
158
| Schedules of Investments |
| (continued) |
| Emerging Markets Equity Fund | ||||||||
| Shares/Units | Security | Value | ||||||
Turkey — 0.6% — (continued) | ||||||||
| 10,393 | KOC Holding AS | $ | 28,781 | |||||
| 411,440 | MLP Saglik Hizmetleri AS, (Restricted, cost — $828,538, acquired 4/15/20), Class B Shares*(a)(b) | 1,254,497 | ||||||
| 458,820 | Sok Marketler Ticaret AS | 681,276 | ||||||
| 132,020 | Tofas Turk Otomobil Fabrikasi AS | 662,624 | ||||||
| 25,061 | Turkcell Iletisim Hizmetleri AS | 49,370 | ||||||
| 49,356 | Türkiye Garanti Bankasi AS | 58,264 | ||||||
| 18,380 | Turkiye Is Bankasi AS, Class C Shares | 12,707 | ||||||
| 3,542 | Turkiye Petrol Rafinerileri AS* | 43,310 | ||||||
| 36,548 | Türkiye Sise ve Cam Fabrikalari AS | 39,103 | ||||||
|
| |||||||
| Total Turkey | 3,357,904 | |||||||
|
| |||||||
United Arab Emirates — 0.2% | ||||||||
| 65,895 | Abu Dhabi Commercial Bank PJSC | 134,670 | ||||||
| 20,043 | Abu Dhabi Islamic Bank PJSC | 30,767 | ||||||
| 43,575 | Abu Dhabi National Oil Co. for Distribution PJSC | 53,537 | ||||||
| 87,516 | Aldar Properties PJSC | 98,883 | ||||||
| 52,710 | Dubai Islamic Bank PJSC | 73,155 | ||||||
| 68,151 | Emaar Properties PJSC | 77,865 | ||||||
| 53,119 | Emirates NBD Bank PJSC | 200,255 | ||||||
| 37,646 | Emirates Telecommunications Group Co. PJSC | 241,881 | ||||||
| 92,248 | First Abu Dhabi Bank PJSC | 426,941 | ||||||
|
| |||||||
| Total United Arab Emirates | 1,337,954 | |||||||
|
| |||||||
United Kingdom — 0.9% | ||||||||
| 31,276 | Anglo American PLC | 1,320,736 | ||||||
| 588,959 | Helios Towers PLC* | 1,416,663 | ||||||
| 29,777 | Mondi PLC | 821,171 | ||||||
| 31,181 | Unilever PLC | 1,734,955 | ||||||
|
| |||||||
| Total United Kingdom | 5,293,525 | |||||||
|
| |||||||
United States — 0.9% | ||||||||
| 8,252 | EPAM Systems Inc.* | 5,221,948 | ||||||
|
| |||||||
Uruguay — 0.1% | ||||||||
| 816 | Globant SA* | 262,980 | ||||||
|
| |||||||
| TOTAL COMMON STOCKS (Cost — $394,253,351) | 541,038,532 | |||||||
|
| |||||||
PREFERRED STOCKS — 1.3% | ||||||||
Brazil — 0.4% | ||||||||
| 4,378 | Alpargatas SA, Class Preferred Shares* | 50,788 | ||||||
| 98,464 | Banco Bradesco SA, Class Preferred Shares | 440,936 | ||||||
| 3,861 | Bradespar SA, Class Preferred Shares | 47,165 | ||||||
| 3,867 | Braskem SA, Class Preferred A Shares* | 49,363 | ||||||
| 3,015 | Centrais Eletricas Brasileiras SA, Class Preferred B Shares | 22,028 | ||||||
| 23,342 | Cia Energetica de Minas Gerais, Class Preferred Shares | 61,001 | ||||||
| 24,800 | Cia Paranaense de Energia, Class Preferred B Shares | 32,814 | ||||||
| 25,282 | Gerdau SA, Class Preferred Shares | 138,501 | ||||||
| 106,000 | Itau Unibanco Holding SA, Class Preferred Shares | 634,415 | ||||||
| 94,262 | Itausa SA, Class Preferred Shares | 210,786 | ||||||
| 104,567 | Petroleo Brasileiro SA, Class Preferred Shares | 549,985 | ||||||
| 10,499 | Telefonica Brasil SA, Class Preferred Shares | 88,813 | ||||||
|
| |||||||
| Total Brazil | 2,326,595 | |||||||
|
| |||||||
Chile — 0.1% | ||||||||
| 2,885 | Sociedad Quimica y Minera de Chile SA, Class Preferred B Shares | 151,019 | ||||||
|
| |||||||
See Notes to Financial Statements.
159
| Schedules of Investments |
| (continued) |
| Emerging Markets Equity Fund | ||||||||
| Shares/Units | Security | Value | ||||||
Colombia — 0.0% | ||||||||
| 10,030 | Bancolombia SA, Class Preferred Shares | $ | 83,558 | |||||
|
| |||||||
Russia — 0.0% | ||||||||
| 79,826 | Surgutneftegas PJSC, Class Preferred Shares | 42,155 | ||||||
|
| |||||||
South Korea — 0.8% | ||||||||
| 715 | Hyundai Motor Co., Class Preferred 2nd Shares | 61,094 | ||||||
| 565 | Hyundai Motor Co., Class Preferred Shares | 49,851 | ||||||
| 224 | LG Chem Ltd., Class Preferred Shares | 66,818 | ||||||
| 55 | LG Household & Health Care Ltd., Class Preferred Shares | 32,566 | ||||||
| 72,011 | Samsung Electronics Co., Ltd., Class Preferred Shares | 4,391,922 | ||||||
|
| |||||||
| Total South Korea | 4,602,251 | |||||||
|
| |||||||
| TOTAL PREFERRED STOCKS (Cost — $6,287,351) | 7,205,578 | |||||||
|
| |||||||
RIGHT — 0.0% | ||||||||
China — 0.0% | ||||||||
| 1,176 | Legend Holdings Corp.*(f) (Cost — $0) | 1,896 | ||||||
|
| |||||||
| TOTAL INVESTMENTS IN SECURITIES BEFORE SHORT-TERM INVESTMENTS (Cost — $400,540,702) | 548,246,006 | |||||||
|
| |||||||
| Face Amount† | ||||||||
SHORT-TERM INVESTMENTS (g) — 3.5% | ||||||||
MONEY MARKET FUND — 1.3% | ||||||||
| $ | 7,559,575 | Invesco STIT — Government & Agency Portfolio, 0.026%, Institutional Class(h) (Cost — $7,559,575) | 7,559,575 | |||||
|
| |||||||
TIME DEPOSITS — 2.2% | ||||||||
| 667,161 | HKD | Banco Santander, Frankfurt, 0.000% due 9/1/21 | 85,781 | |||||
| BBH — Grand Cayman: | ||||||||
| 2 | SGD | 0.005% due 9/1/21 | 1 | |||||
| 97,422 | ZAR | 3.800% due 9/1/21 | 6,706 | |||||
| BNP Paribas — Paris: | ||||||||
| 13,920 | EUR | (0.780)% due 9/1/21 | 16,436 | |||||
| 2,138,258 | 0.005% due 9/1/21 | 2,138,258 | ||||||
| 352,612 | Citibank — New York, 0.005% due 9/1/21 | 352,612 | ||||||
| 93,556 | HKD | HSBC Bank — Hong Kong, 0.000% due 9/1/21 | 12,029 | |||||
| 9,643,705 | Skandinaviska Enskilda Banken AB — Stockholm, 0.005% due 9/1/21 | 9,643,705 | ||||||
| 9 | GBP | Sumitomo Mitsui Banking Corp. — Tokyo, 0.005% due 9/1/21 | 12 | |||||
|
| |||||||
| TOTAL TIME DEPOSITS (Cost — $12,255,540) | 12,255,540 | |||||||
|
| |||||||
| TOTAL SHORT-TERM INVESTMENTS (Cost — $19,815,115) | 19,815,115 | |||||||
|
| |||||||
| TOTAL INVESTMENTS — 100.9% (Cost — $420,355,817) | 568,061,121 | |||||||
|
| |||||||
| Liabilities in Excess of Other Assets — (0.9)% | (5,113,640 | ) | ||||||
|
| |||||||
| TOTAL NET ASSETS — 100.0% | $ | 562,947,481 | ||||||
|
| |||||||
| † | Amount denominated in U.S. dollars, unless otherwise noted. |
| * | Non-income producing security. |
See Notes to Financial Statements.
160
| Schedules of Investments |
| (continued) |
| Emerging Markets Equity Fund | ||||
| (a) | Restricted security that may be sold to “qualified institutional buyers” pursuant to the conditions of Rule 144A under the Securities Act of 1933, as amended. This security has been deemed liquid pursuant to guidelines approved by the Board of Trustees, unless otherwise noted. The aggregate value of restricted 144A holdings at August 31, 2021, amounts to $30,090,430 and represents 5.4% of net assets. |
| (b) | The aggregate value of restricted securities (excluding 144A holdings) at August 31, 2021, amounts to $29,643,553 and represents 5.3% of net assets. |
| (c) | All or a portion of this security is on loan (See Note 1). |
| (d) | Security trades on the Hong Kong exchange. |
| (e) | Illiquid security. |
| (f) | Security is valued in good faith at fair value by or under the direction of the Board of Trustees. |
| (g) | Inclusive of all short-term holdings, including investments of collateral received from securities lending transactions. Excluding such collateral, the percentage of portfolio holdings would be 2.2%. |
| (h) | Represents investments of collateral received from securities lending transactions. |
| # | Security that used significant unobservable inputs to determine fair value. |
At August 31, 2021, for Emerging Markets Equity Fund the aggregate cost of investments, the aggregate gross unrealized appreciation and depreciation of all investments for federal income tax purposes were as follows:
| Fund | Aggregate Cost For Federal Income Tax Purposes | Gross Unrealized Appreciation | Gross Unrealized (Depreciation) | Net | ||||||||||||
Emerging Markets Equity Fund | $ | 429,653,647 | $ | 174,706,860 | $ | (37,371,342 | ) | $ | 137,335,518 | |||||||
Abbreviations used in this schedule: | ||
| ADR | — American Depositary Receipts | |
| GDR | — Global Depositary Receipt | |
| NVDR | — Non Voting Depository Receipt | |
| PCL | — Public Company Limited | |
| PLC | — Public Limited Company | |
| REIT | — Real Estate Investment Trust | |
| Summary of Investments by Security Sector^ | ||||
Information Technology | ||||
Semiconductors & Semiconductor Equipment | 10.6 | % | ||
Technology Hardware, Storage & Peripherals | 6.0 | |||
Electronic Equipment, Instruments & Components | 3.4 | |||
Other | 2.9 | |||
Financials | ||||
Banks | 15.8 | |||
Insurance | 2.9 | |||
Consumer Finance | 0.8 | |||
Other | 1.2 | |||
Consumer Discretionary | 15.7 | |||
Communication Services | 10.2 | |||
Materials | 7.5 | |||
Energy | 5.7 | |||
Industrials | 4.2 | |||
Health Care | 4.1 | |||
Consumer Staples | 4.0 | |||
Real Estate | 1.6 | |||
Utilities | 1.2 | |||
Short-Term Investments | 2.2 | |||
|
| |||
| 100.0 | %+ | |||
|
| |||
| ^ | As a percentage of total investments. |
| + | Does not reflect investments of collateral received from securities lending transactions. |
See Notes to Financial Statements.
161
| Schedules of Investments |
| (continued) |
| Emerging Markets Equity Fund | ||||
At August 31, 2021, Emerging Markets Equity Fund had open exchange-traded futures contracts as described below.
The unrealized appreciation on the open contracts reflected in the accompanying financial statements were as follows:
| Open Futures Contracts | Number of Contracts | Expiration Date (Month/Year) | Notional Amount | Market Value | Unrealized Appreciation | |||||||||||||||
| Contracts to Buy: | ||||||||||||||||||||
MSCI Emerging Markets E-mini Index September Futures | 16 | 9/21 | $ | 1,028,730 | $ | 1,039,360 | $ | 10,630 | ||||||||||||
|
| |||||||||||||||||||
At August 31, 2021, Emerging Markets Equity Fund had deposited cash of $95,994 with a broker or brokers as margin collateral on an open exchange-traded futures contracts.
Currency Abbreviations used in this schedule: | ||
| EUR | — Euro | |
| GBP | — British Pound | |
| HKD | — Hong Kong Dollar | |
| SGD | — Singapore Dollar | |
| ZAR | — South African Rand | |
See Notes to Financial Statements.
162
| Schedules of Investments |
| (continued) |
| Core Fixed Income Fund | ||||||||||
| Face Amount/Units† | Rating†† | Security | Value | |||||||
CORPORATE BONDS & NOTES — 30.4% | ||||||||||
Aerospace/Defense — 1.0% | ||||||||||
| BAE Systems Holdings Inc., Company Guaranteed Notes: | ||||||||||
| $ | 205,000 | BBB | 3.800% due 10/7/24(a) | $ | 222,565 | |||||
| 776,000 | BBB | 3.850% due 12/15/25(a) | 854,697 | |||||||
| Boeing Co. (The), Senior Unsecured Notes: | ||||||||||
| 530,000 | BBB- | 1.433% due 2/4/24 | 531,267 | |||||||
| 990,000 | BBB- | 4.875% due 5/1/25 | 1,107,256 | |||||||
| 210,000 | BBB- | 2.196% due 2/4/26 | 210,902 | |||||||
| 50,000 | BBB- | 3.100% due 5/1/26 | 53,206 | |||||||
| 70,000 | BBB- | 2.700% due 2/1/27 | 72,671 | |||||||
| 646,000 | BBB- | 2.800% due 3/1/27 | 673,767 | |||||||
| 260,000 | BBB- | 3.200% due 3/1/29 | 273,917 | |||||||
| 250,000 | BBB- | 5.150% due 5/1/30 | 296,365 | |||||||
| 440,000 | BBB- | 3.250% due 2/1/35 | 450,639 | |||||||
| 40,000 | BBB- | 3.550% due 3/1/38 | 41,354 | |||||||
| 210,000 | BBB- | 5.705% due 5/1/40 | 271,914 | |||||||
| 120,000 | BBB- | 3.500% due 3/1/45 | 118,389 | |||||||
| 140,000 | BBB- | 3.750% due 2/1/50 | 145,132 | |||||||
| 490,000 | BBB- | 5.805% due 5/1/50 | 667,553 | |||||||
| 10,000 | BBB- | 5.930% due 5/1/60 | 13,895 | |||||||
| General Dynamics Corp., Company Guaranteed Notes: | ||||||||||
| 121,000 | A- | 3.500% due 4/1/27 | 135,238 | |||||||
| 607,000 | A- | 3.750% due 5/15/28 | 692,122 | |||||||
| 10,000 | A- | 4.250% due 4/1/40 | 12,453 | |||||||
| 70,000 | A- | 4.250% due 4/1/50 | 90,799 | |||||||
| 141,000 | BBB | L3 Technologies Inc., Company Guaranteed Notes, 3.850% due 12/15/26 | 156,437 | |||||||
| L3Harris Technologies Inc., Senior Unsecured Notes: | ||||||||||
| 489,000 | BBB | 3.850% due 12/15/26 | 546,863 | |||||||
| 934,000 | BBB | 4.400% due 6/15/28 | 1,079,727 | |||||||
| 60,000 | BBB | 5.054% due 4/27/45 | 80,315 | |||||||
| Lockheed Martin Corp., Senior Unsecured Notes: | ||||||||||
| 30,000 | A- | 3.100% due 1/15/23 | 31,003 | |||||||
| 170,000 | A- | 3.550% due 1/15/26 | 188,090 | |||||||
| 40,000 | A- | 4.500% due 5/15/36 | 50,682 | |||||||
| 60,000 | A- | 4.070% due 12/15/42 | 73,739 | |||||||
| 246,000 | A- | 3.800% due 3/1/45 | 290,732 | |||||||
| 39,000 | A- | 4.700% due 5/15/46 | 52,341 | |||||||
| Northrop Grumman Corp., Senior Unsecured Notes: | ||||||||||
| 534,000 | BBB+ | 2.930% due 1/15/25 | 568,054 | |||||||
| 340,000 | BBB+ | 3.250% due 1/15/28 | 371,888 | |||||||
| 29,000 | BBB+ | 4.750% due 6/1/43 | 37,627 | |||||||
| 121,000 | BBB+ | 4.030% due 10/15/47 | 145,110 | |||||||
| 248,000 | BBB+ | 5.250% due 5/1/50 | 352,813 | |||||||
| Raytheon Co., Senior Unsecured Notes: | ||||||||||
| 40,000 | A- | 7.200% due 8/15/27 | 52,674 | |||||||
| 24,000 | A- | 7.000% due 11/1/28 | 31,560 | |||||||
| 55,000 | A- | 4.200% due 12/15/44 | 64,321 | |||||||
| Raytheon Technologies Corp., Senior Unsecured Notes: | ||||||||||
| 70,000 | A- | 3.150% due 12/15/24 | 74,641 | |||||||
| 120,000 | A- | 3.950% due 8/16/25 | 133,173 | |||||||
| 696,000 | A- | 4.125% due 11/16/28 | 801,537 | |||||||
| 140,000 | A- | 2.250% due 7/1/30 | 143,258 | |||||||
| 160,000 | A- | 4.500% due 6/1/42 | 200,392 | |||||||
| 387,000 | A- | 3.750% due 11/1/46 | 440,495 | |||||||
| 108,000 | A- | 4.050% due 5/4/47 | 127,616 | |||||||
See Notes to Financial Statements.
163
| Schedules of Investments |
| (continued) |
| Core Fixed Income Fund | ||||||||||
| Face Amount/Units† | Rating†† | Security | Value | |||||||
Aerospace/Defense — 1.0% — (continued) | ||||||||||
| $ | 8,000 | A- | 2.820% due 9/1/51 | $ | 7,881 | |||||
|
| |||||||||
| Total Aerospace/Defense | 13,039,070 | |||||||||
|
| |||||||||
Agriculture — 0.6% | ||||||||||
| Altria Group Inc., Company Guaranteed Notes: | ||||||||||
| 40,000 | BBB | 2.350% due 5/6/25 | 41,741 | |||||||
| 130,000 | BBB | 4.400% due 2/14/26 | 147,148 | |||||||
| 45,000 | BBB | 4.800% due 2/14/29 | 52,286 | |||||||
| 560,000 | BBB | 2.450% due 2/4/32 | 547,823 | |||||||
| 929,000 | BBB | 5.800% due 2/14/39 | 1,164,132 | |||||||
| 80,000 | BBB | 3.875% due 9/16/46 | 80,853 | |||||||
| 260,000 | BBB | 5.950% due 2/14/49 | 338,548 | |||||||
| 82,000 | BBB | 6.200% due 2/14/59 | 106,698 | |||||||
| BAT Capital Corp., Company Guaranteed Notes: | ||||||||||
| 332,000 | BBB+ | 3.215% due 9/6/26 | 354,634 | |||||||
| 500,000 | BBB+ | 3.557% due 8/15/27 | 541,517 | |||||||
| 1,320,000 | BBB+ | 4.540% due 8/15/47 | 1,414,467 | |||||||
| 150,000 | BBB+ | 3.984% due 9/25/50 | 148,748 | |||||||
| 70,000 | BBB+ | BAT International Finance PLC, Company Guaranteed Notes, 3.950% due 6/15/25(a) | 76,578 | |||||||
| 150,000 | A | Cargill Inc., Senior Unsecured Notes, 1.375% due 7/23/23(a) | 153,069 | |||||||
| Imperial Brands Finance PLC, Company Guaranteed Notes: | ||||||||||
| 400,000 | BBB | 3.125% due 7/26/24(a) | 421,908 | |||||||
| 205,000 | BBB | 3.500% due 7/26/26(a) | 221,411 | |||||||
| Philip Morris International Inc., Senior Unsecured Notes: | ||||||||||
| 190,000 | A | 2.900% due 11/15/21 | 191,027 | |||||||
| 110,000 | A | 2.500% due 11/2/22 | 112,595 | |||||||
| 100,000 | A | 1.125% due 5/1/23 | 101,271 | |||||||
| 100,000 | A | 2.100% due 5/1/30 | 101,347 | |||||||
| 60,000 | A | 4.500% due 3/20/42 | 71,456 | |||||||
| 1,131,000 | BBB+ | Reynolds American Inc., Company Guaranteed Notes, 5.850% due 8/15/45 | 1,399,890 | |||||||
|
| |||||||||
| Total Agriculture | 7,789,147 | |||||||||
|
| |||||||||
Airlines — 0.4% | ||||||||||
| 47,398 | A3(b) | Air Canada Class AA Pass-Through Trust, Pass-Thru Certificates, 3.300% due 1/15/30(a) | 48,339 | |||||||
| 38,921 | A- | American Airlines Class AA Pass-Through Trust, Series 2015-2, Pass-Thru Certificates, 3.600% due 9/22/27 | 40,539 | |||||||
| 304,749 | A- | American Airlines Class AA Pass-Through Trust, Series 2016-1, Pass-Thru Certificates, 3.575% due 1/15/28 | 314,669 | |||||||
| 44,072 | A- | American Airlines Class AA Pass-Through Trust, Series 2016-2, Pass-Thru Certificates, 3.200% due 6/15/28 | 44,936 | |||||||
| 92,409 | A | American Airlines Class AA Pass-Through Trust, Series 2016-3, Pass-Thru Certificates, 3.000% due 10/15/28 | 93,341 | |||||||
| 37,500 | Baa1(b) | American Airlines Class AA Pass-Through Trust, Series 2017-1, Pass-Thru Certificates, 3.650% due 2/15/29 | 39,119 | |||||||
| 111,059 | B | American Airlines Class B Pass-Through Trust, Series 2015-2, Pass-Thru Certificates, 4.400% due 9/22/23 | 108,811 | |||||||
| 72,546 | B | American Airlines Class B Pass-Through Trust, Series 2016-1, Pass-Thru Certificates, 5.250% due 1/15/24 | 71,821 | |||||||
| 59,500 | B | American Airlines Class B Pass-Through Trust, Series 2016-2, Pass-Thru Certificates, 4.375% due 6/15/24(a) | 58,580 | |||||||
| 691 | B | American Airlines Class B Pass-Through Trust, Series 2016-3, Pass-Thru Certificates, 3.750% due 10/15/25 | 671 | |||||||
| 46,662 | Ba2(b) | American Airlines Class B Pass-Through Trust, Series 2017-1, Pass-Thru Certificates, 4.950% due 2/15/25 | 46,083 | |||||||
| Delta Air Lines Inc.: | ||||||||||
| 970,000 | BBB- | Senior Secured Notes, 7.000% due 5/1/25(a) | 1,134,279 | |||||||
See Notes to Financial Statements.
164
| Schedules of Investments |
| (continued) |
| Core Fixed Income Fund | ||||||||||
| Face Amount/Units† | Rating†† | Security | Value | |||||||
Airlines — 0.4% — (continued) | ||||||||||
Senior Unsecured Notes: | ||||||||||
| $ | 120,000 | B+ | 3.625% due 3/15/22 | $ | 121,272 | |||||
| 50,000 | B+ | 3.800% due 4/19/23 | 51,829 | |||||||
| 200,000 | B+ | 2.900% due 10/28/24 | 203,897 | |||||||
| 210,000 | B+ | 7.375% due 1/15/26 | 247,400 | |||||||
| Delta Air Lines Inc./SkyMiles IP Ltd., Senior Secured Notes: | ||||||||||
| 230,000 | Baa1(b) | 4.500% due 10/20/25(a) | 246,789 | |||||||
| 120,000 | Baa1(b) | 4.750% due 10/20/28(a) | 133,586 | |||||||
| 170,000 | Baa3(b) | Mileage Plus Holdings LLC/Mileage Plus Intellectual Property Assets Ltd., Senior Secured Notes, 6.500% due 6/20/27(a) | 184,892 | |||||||
| 87,279 | BB | Northwest Airlines Inc. Class A-1 Pass-Through Trust, Pass-Thru Certificates, 7.041% due 4/1/22 | 87,290 | |||||||
| 95,743 | Ba2(b) | Spirit Loyalty Cayman Ltd./Spirit IP Cayman Ltd., Senior Secured Notes, 8.000% due 9/20/25(a) | 108,549 | |||||||
| United Airlines Class AA Pass-Through Trust, Pass-Thru Certificates: | ||||||||||
| 31,846 | A+ | 3.450% due 12/1/27 | 33,685 | |||||||
| 3,945 | A1(b) | 3.100% due 7/7/28 | 4,148 | |||||||
| 43,194 | A1(b) | 2.875% due 10/7/28 | 44,251 | |||||||
| 17,669 | A1(b) | 3.500% due 3/1/30 | 18,484 | |||||||
| 53,265 | A1(b) | 4.150% due 8/25/31 | 58,347 | |||||||
| 81,694 | A1(b) | 2.700% due 5/1/32 | 82,500 | |||||||
| United Airlines Class B Pass-Through Trust, Pass-Thru Certificates: | ||||||||||
| 29,639 | BB | 4.750% due 4/11/22 | 30,026 | |||||||
| 43,600 | BB | 4.625% due 9/3/22 | 44,489 | |||||||
| 4,201 | Baa2(b) | 3.650% due 10/7/25 | 4,197 | |||||||
| 85,995 | Baa2(b) | 3.500% due 5/1/28 | 85,482 | |||||||
| 790,000 | BB- | United Airlines Inc., Senior Secured Notes, 4.625% due 4/15/29(a) | 820,790 | |||||||
|
| |||||||||
| Total Airlines | 4,613,091 | |||||||||
|
| |||||||||
Apparel — 0.0% | ||||||||||
| NIKE Inc., Senior Unsecured Notes: | ||||||||||
| 40,000 | AA- | 2.400% due 3/27/25 | 42,404 | |||||||
| 70,000 | AA- | 2.750% due 3/27/27 | 75,802 | |||||||
| 140,000 | AA- | 2.850% due 3/27/30 | 153,245 | |||||||
| 100,000 | AA- | 3.250% due 3/27/40 | 111,657 | |||||||
| 220,000 | AA- | 3.375% due 3/27/50 | 252,681 | |||||||
|
| |||||||||
| Total Apparel | 635,789 | |||||||||
|
| |||||||||
Auto Manufacturers — 0.9% | ||||||||||
| BMW US Capital LLC, Company Guaranteed Notes: | ||||||||||
| 159,000 | A | 2.550% due 4/1/31(a) | 166,569 | |||||||
| 45,000 | A | 1.950% due 8/12/31(a) | 44,823 | |||||||
| Daimler Finance North America LLC, Company Guaranteed Notes: | ||||||||||
| 340,000 | A- | 2.125% due 3/10/25(a) | 352,471 | |||||||
| 300,000 | A- | 3.500% due 8/3/25(a) | 326,733 | |||||||
| Ford Motor Co., Senior Unsecured Notes: | ||||||||||
| 40,000 | BB+ | 8.500% due 4/21/23 | 44,300 | |||||||
| 30,000 | BB+ | 4.750% due 1/15/43 | 32,401 | |||||||
| Ford Motor Credit Co. LLC, Senior Unsecured Notes: | ||||||||||
| 440,000 | BB+ | 0.999% (3-Month USD-LIBOR + 0.880%) due 10/12/21(c) | 440,016 | |||||||
| 470,000 | BB+ | 3.339% due 3/28/22 | 475,466 | |||||||
| 1,250,000 | BB+ | 1.198% (3-Month USD-LIBOR + 1.080%) due 8/3/22(c) | 1,246,576 | |||||||
| 200,000 | BB+ | 4.000% due 11/13/30 | 211,803 | |||||||
| General Motors Co., Senior Unsecured Notes: | ||||||||||
| 70,000 | BBB | 5.400% due 10/2/23 | 76,547 | |||||||
| 290,000 | BBB | 6.125% due 10/1/25 | 342,090 | |||||||
See Notes to Financial Statements.
165
| Schedules of Investments |
| (continued) |
| Core Fixed Income Fund | ||||||||||
| Face Amount/Units† | Rating†† | Security | Value | |||||||
Auto Manufacturers — 0.9% — (continued) | ||||||||||
| $ | 250,000 | BBB | 6.250% due 10/2/43 | $ | 341,968 | |||||
| 455,000 | BBB | 5.200% due 4/1/45 | 558,187 | |||||||
| General Motors Financial Co., Inc.: | ||||||||||
Company Guaranteed Notes: | ||||||||||
| 1,183,000 | BBB | 4.375% due 9/25/21 | 1,186,045 | |||||||
| 95,000 | BBB | 3.450% due 4/10/22 | 96,279 | |||||||
| 80,000 | BBB | 3.500% due 11/7/24 | 85,683 | |||||||
| 64,000 | BBB | 4.000% due 1/15/25 | 69,632 | |||||||
| 87,000 | BBB | 4.350% due 4/9/25 | 95,998 | |||||||
| 104,000 | BBB | 4.300% due 7/13/25 | 115,053 | |||||||
| 100,000 | BBB | 4.350% due 1/17/27 | 112,620 | |||||||
Senior Unsecured Notes: | ||||||||||
| 642,000 | BBB | 4.200% due 11/6/21 | 646,510 | |||||||
| 421,000 | BBB | 5.200% due 3/20/23 | 449,705 | |||||||
| 646,000 | BBB | 2.750% due 6/20/25 | 678,828 | |||||||
| Hyundai Capital America, Senior Unsecured Notes: | ||||||||||
| 250,000 | BBB+ | 3.950% due 2/1/22(a) | 253,542 | |||||||
| 412,000 | BBB+ | 2.375% due 2/10/23(a) | 421,917 | |||||||
| Hyundai Capital Services Inc., Senior Unsecured Notes: | ||||||||||
| 200,000 | BBB+ | 3.000% due 8/29/22(a) | 204,821 | |||||||
| 200,000 | BBB+ | 3.750% due 3/5/23(a) | 209,263 | |||||||
| Nissan Motor Acceptance Corp., Senior Unsecured Notes: | ||||||||||
| 20,000 | BBB- | 3.650% due 9/21/21(a) | 20,034 | |||||||
| 54,000 | BBB- | 2.750% due 3/9/28(a) | 55,754 | |||||||
| Nissan Motor Co., Ltd., Senior Unsecured Notes: | ||||||||||
| 250,000 | BBB- | 3.043% due 9/15/23(a) | 260,562 | |||||||
| 600,000 | BBB- | 3.522% due 9/17/25(a) | 642,216 | |||||||
| 300,000 | BBB- | 4.345% due 9/17/27(a) | 334,282 | |||||||
| 245,000 | BBB- | 4.810% due 9/17/30(a) | 277,858 | |||||||
| Toyota Motor Credit Corp., Senior Unsecured Notes: | ||||||||||
| 3,000 | A+ | 3.450% due 9/20/23 | 3,189 | |||||||
| 257,000 | A+ | 3.000% due 4/1/25 | 275,758 | |||||||
|
| |||||||||
| Total Auto Manufacturers | 11,155,499 | |||||||||
|
| |||||||||
Auto Parts & Equipment — 0.0% | ||||||||||
| 239,000 | A- | Magna International Inc., Senior Unsecured Notes, 2.450% due 6/15/30 | 247,110 | |||||||
|
| |||||||||
Banks — 8.7% | ||||||||||
| Banco Santander SA, Senior Unsecured Notes: | ||||||||||
| 200,000 | A- | 3.848% due 4/12/23 | 210,596 | |||||||
| 400,000 | A | 2.706% due 6/27/24 | 422,688 | |||||||
| 600,000 | A- | 2.746% due 5/28/25 | 632,843 | |||||||
| Bank of America Corp.: | ||||||||||
Senior Unsecured Notes: | ||||||||||
| 490,000 | A- | 4.125% due 1/22/24 | 531,894 | |||||||
| 902,000 | A- | 3.550% (3-Month USD-LIBOR + 0.780%) due 3/5/24(c) | 942,189 | |||||||
| 280,000 | A- | 4.000% due 4/1/24 | 304,559 | |||||||
| 210,000 | A- | 3.500% due 4/19/26 | 231,392 | |||||||
| 2,272,000 | A- | 1.319% (SOFR + 1.150%) due 6/19/26(c) | 2,280,408 | |||||||
| 273,000 | A- | 1.197% (SOFR + 1.010%) due 10/24/26(c) | 271,970 | |||||||
| 740,000 | A- | 1.658% (SOFR + 0.910%) due 3/11/27(c) | 748,507 | |||||||
| 802,000 | A- | 3.824% (3-Month USD-LIBOR + 1.575%) due 1/20/28(c) | 894,295 | |||||||
| 50,000 | A- | 3.593% (3-Month USD-LIBOR + 1.370%) due 7/21/28(c) | 55,335 | |||||||
| 435,000 | A- | 3.419% (3-Month USD-LIBOR + 1.040%) due 12/20/28(c) | 478,278 | |||||||
| 934,000 | A- | 3.970% (3-Month USD-LIBOR + 1.070%) due 3/5/29(c) | 1,055,077 | |||||||
| 3,215,000 | A- | 2.087% (SOFR + 1.060%) due 6/14/29(c) | 3,263,933 | |||||||
See Notes to Financial Statements.
166
| Schedules of Investments |
| (continued) |
| Core Fixed Income Fund | ||||||||||
| Face Amount/Units† | Rating†† | Security | Value | |||||||
Banks — 8.7% — (continued) | ||||||||||
| $ | 1,302,000 | A- | 4.271% (3-Month USD-LIBOR + 1.310%) due 7/23/29(c) | $ | 1,498,576 | |||||
| 875,000 | A- | 3.974% (3-Month USD-LIBOR + 1.210%) due 2/7/30(c) | 994,987 | |||||||
| 464,000 | A- | 3.194% (3-Month USD-LIBOR + 1.180%) due 7/23/30(c) | 501,581 | |||||||
| 488,000 | A- | 2.884% (3-Month USD-LIBOR + 1.190%) due 10/22/30(c) | 517,282 | |||||||
| 49,000 | A- | 2.496% (3-Month USD-LIBOR + 0.990%) due 2/13/31(c) | 50,359 | |||||||
| 953,000 | A- | 2.592% (SOFR + 2.150%) due 4/29/31(c) | 987,383 | |||||||
| 172,000 | A- | 1.898% (SOFR + 1.530%) due 7/23/31(c) | 168,625 | |||||||
| 190,000 | A- | 1.922% (SOFR + 1.370%) due 10/24/31(c) | 186,324 | |||||||
| 690,000 | A- | 2.687% (SOFR + 1.320%) due 4/22/32(c) | 717,788 | |||||||
| 575,000 | A- | 4.078% (3-Month USD-LIBOR + 1.320%) due 4/23/40(c) | 677,850 | |||||||
| 240,000 | A- | 5.000% due 1/21/44 | 322,998 | |||||||
| 710,000 | A- | 4.330% (3-Month USD-LIBOR + 1.520%) due 3/15/50(c) | 887,932 | |||||||
| 310,000 | A- | 4.083% (3-Month USD-LIBOR + 3.150%) due 3/20/51(c) | 374,323 | |||||||
Subordinated Notes: | ||||||||||
| 600,000 | BBB+ | 4.200% due 8/26/24 | 657,895 | |||||||
| 1,284,000 | BBB+ | 4.000% due 1/22/25 | 1,404,003 | |||||||
| 383,000 | BBB+ | 3.950% due 4/21/25 | 419,697 | |||||||
| 30,000 | BBB+ | 7.250% due 10/15/25 | 36,950 | |||||||
| 196,000 | BBB+ | 4.450% due 3/3/26 | 221,225 | |||||||
| 20,000 | BBB+ | 4.250% due 10/22/26 | 22,730 | |||||||
| Bank of Montreal: | ||||||||||
| 300,000 | A- | Senior Unsecured Notes, 1.850% due 5/1/25 | 310,252 | |||||||
| 50,000 | BBB+ | Subordinated Notes, 3.803% (5-Year USD Swap Rate + 1.432%) due 12/15/32(c) | 55,210 | |||||||
| Bank of New York Mellon Corp. (The), Senior Unsecured Notes: | ||||||||||
| 90,000 | A | 1.600% due 4/24/25 | 92,562 | |||||||
| 115,000 | A | 3.250% due 5/16/27 | 126,941 | |||||||
| 24,000 | A | 3.400% due 1/29/28 | 26,820 | |||||||
| 170,000 | A- | Bank of Nova Scotia (The), Senior Unsecured Notes, 1.300% due 6/11/25 | 172,014 | |||||||
| 200,000 | A | Barclays Bank PLC, Senior Unsecured Notes, 1.700% due 5/12/22 | 201,848 | |||||||
| Barclays PLC: | ||||||||||
Senior Unsecured Notes: | ||||||||||
| 333,000 | BBB | 3.684% due 1/10/23 | 336,924 | |||||||
| 686,000 | BBB | 4.610% (3-Month USD-LIBOR + 1.400%) due 2/15/23(c) | 699,085 | |||||||
| 620,000 | BBB | 4.972% (3-Month USD-LIBOR + 1.902%) due 5/16/29(c) | 729,248 | |||||||
| 995,000 | BBB | 2.667% (1-Year CMT Index + 1.200%) due 3/10/32(c) | 1,013,246 | |||||||
Subordinated Notes: | ||||||||||
| 200,000 | BB+ | 5.088% (3-Month USD-LIBOR + 3.054%) due 6/20/30(c) | 233,761 | |||||||
| 213,000 | BB+ | 3.811% (1-Year CMT Index + 1.700%) due 3/10/42(c) | 231,904 | |||||||
| BNP Paribas SA: | ||||||||||
Senior Unsecured Notes: | ||||||||||
| 470,000 | A- | 4.705% (3-Month USD-LIBOR + 2.235%) due 1/10/25(a)(c) | 511,787 | |||||||
| 490,000 | A- | 2.819% (3-Month USD-LIBOR + 1.111%) due 11/19/25(a)(c) | 514,067 | |||||||
| 220,000 | A- | 2.219% (SOFR + 2.074%) due 6/9/26(a)(c) | 226,554 | |||||||
| 750,000 | A- | 4.400% due 8/14/28(a) | 865,581 | |||||||
| 200,000 | A- | 2.871% (SOFR + 1.387%) due 4/19/32(a)(c) | 207,629 | |||||||
| 200,000 | BBB+ | Subordinated Notes, 4.375% (5-Year USD Swap Rate + 1.483%) due 3/1/33(a)(c) | 222,277 | |||||||
| 434,000 | A | BPCE SA, Senior Unsecured Notes, 2.700% due 10/1/29(a) | 455,839 | |||||||
| CIT Group Inc., Senior Unsecured Notes: | ||||||||||
| 90,000 | BB+ | 4.750% due 2/16/24 | 97,200 | |||||||
| 40,000 | BB+ | 5.250% due 3/7/25 | 45,138 | |||||||
| Citigroup Inc.: | ||||||||||
| 220,000 | BB+ | Junior Subordinated Notes, 5.950% (3-Month USD-LIBOR + 3.905%)(c)(d) | 242,000 | |||||||
Senior Unsecured Notes: | ||||||||||
| 180,000 | BBB+ | 1.678% (SOFR + 1.667%) due 5/15/24(c) | 183,689 | |||||||
| 120,000 | BBB+ | 3.106% (SOFR + 2.842%) due 4/8/26(c) | 128,389 | |||||||
See Notes to Financial Statements.
167
| Schedules of Investments |
| (continued) |
| Core Fixed Income Fund | ||||||||||
| Face Amount/Units† | Rating†† | Security | Value | |||||||
Banks — 8.7% — (continued) | ||||||||||
| $ | 2,575,000 | BBB+ | 1.462% (SOFR + 0.770%) due 6/9/27(c) | $ | 2,583,964 | |||||
| 100,000 | BBB+ | 3.980% (3-Month USD-LIBOR + 1.338%) due 3/20/30(c) | 113,686 | |||||||
| 210,000 | BBB+ | 4.412% (SOFR + 3.914%) due 3/31/31(c) | 246,449 | |||||||
| 70,000 | BBB+ | 2.572% (SOFR + 2.107%) due 6/3/31(c) | 72,342 | |||||||
| 520,000 | BBB+ | 2.561% (SOFR + 1.167%) due 5/1/32(c) | 535,283 | |||||||
| 314,000 | BBB+ | 8.125% due 7/15/39 | 541,944 | |||||||
| 196,000 | BBB+ | 4.650% due 7/30/45 | 255,490 | |||||||
| 70,000 | BBB+ | 4.650% due 7/23/48 | 92,954 | |||||||
Subordinated Notes: | ||||||||||
| 890,000 | BBB | 4.400% due 6/10/25 | 990,481 | |||||||
| 250,000 | BBB | 5.500% due 9/13/25 | 290,645 | |||||||
| 890,000 | BBB | 4.300% due 11/20/26 | 1,010,669 | |||||||
| 30,000 | BBB | 6.625% due 6/15/32 | 41,028 | |||||||
| 100,000 | BBB | 6.675% due 9/13/43 | 155,907 | |||||||
| 286,000 | BBB | 5.300% due 5/6/44 | 388,779 | |||||||
| 30,000 | BBB | 4.750% due 5/18/46 | 38,666 | |||||||
| 142,000 | BBB+ | Citizens Financial Group Inc., Senior Unsecured Notes, 2.850% due 7/27/26 | 151,951 | |||||||
| 58,000 | AA- | Commonwealth Bank of Australia, Senior Unsecured Notes, 3.900% due 7/12/47(a) | 71,006 | |||||||
| Cooperatieve Rabobank UA, Company Guaranteed Notes: | ||||||||||
| 310,000 | BBB+ | 4.625% due 12/1/23 | 337,454 | |||||||
| 990,000 | BBB+ | 4.375% due 8/4/25 | 1,107,352 | |||||||
| 500,000 | A- | Credit Agricole SA, Senior Unsecured Notes, 1.907% (SOFR + 1.676%) due 6/16/26(a)(c) | 511,961 | |||||||
| Credit Suisse AG, Senior Unsecured Notes: | ||||||||||
| 250,000 | A+ | 2.950% due 4/9/25 | 267,154 | |||||||
| 1,025,000 | A+ | 1.250% due 8/7/26 | 1,020,164 | |||||||
| Credit Suisse Group AG, Senior Unsecured Notes: | ||||||||||
| 625,000 | BBB+ | 4.550% due 4/17/26 | 708,124 | |||||||
| 835,000 | BBB+ | 2.193% (SOFR + 2.044%) due 6/5/26(a)(c) | 857,089 | |||||||
| 900,000 | BBB+ | 1.305% (SOFR + 0.980%) due 2/2/27(a)(c) | 886,346 | |||||||
| 65,000 | BBB+ | 4.282% due 1/9/28(a) | 72,735 | |||||||
| 250,000 | BBB+ | 4.194% (SOFR + 3.730%) due 4/1/31(a)(c) | 283,374 | |||||||
| 1,101,000 | BBB+ | 3.091% (SOFR + 1.730%) due 5/14/32(a)(c) | 1,149,298 | |||||||
| Danske Bank AS, Senior Unsecured Notes: | ||||||||||
| 200,000 | BBB+ | 5.000% due 1/12/22(a) | 203,178 | |||||||
| 430,000 | BBB+ | 3.001% (3-Month USD-LIBOR + 1.249%) due 9/20/22(a)(c) | 430,520 | |||||||
| 327,000 | BBB+ | 5.000% (1-Year CMT Index + 1.730%) due 1/12/23(a)(c) | 332,090 | |||||||
| 200,000 | BBB+ | 3.875% due 9/12/23(a) | 212,263 | |||||||
| 1,435,000 | BBB+ | 5.375% due 1/12/24(a) | 1,582,687 | |||||||
| 944,000 | A | 1.226% due 6/22/24(a) | 954,139 | |||||||
| 240,000 | BBB+ | 3.244% (3-Month USD-LIBOR + 1.591%) due 12/20/25(a)(c) | 255,257 | |||||||
| Deutsche Bank AG, Senior Unsecured Notes: | ||||||||||
| 474,000 | BBB- | 1.447% (SOFR + 1.131%) due 4/1/25(c) | 477,475 | |||||||
| 38,000 | BBB- | 4.100% due 1/13/26 | 41,746 | |||||||
| 846,000 | BBB+ | 1.686% due 3/19/26 | 857,439 | |||||||
| 188,000 | BBB- | 2.129% (SOFR + 1.870%) due 11/24/26(c) | 192,182 | |||||||
| 11,000 | BB | Goldman Sachs Capital II, Limited Guaranteed Notes, 4.000% (3-Month USD-LIBOR + 0.768%)(c)(d) | 11,012 | |||||||
| Goldman Sachs Group Inc. (The): | ||||||||||
Senior Unsecured Notes: | ||||||||||
| 40,000 | BBB+ | 0.909% (3-Month USD-LIBOR + 0.780%) due 10/31/22(c) | 40,044 | |||||||
| 738,000 | BBB+ | 2.876% (3-Month USD-LIBOR + 0.821%) due 10/31/22(c) | 740,987 | |||||||
| 130,000 | BBB+ | 3.200% due 2/23/23 | 135,056 | |||||||
| 2,320,000 | BBB+ | 3.500% due 4/1/25 | 2,514,060 | |||||||
| 437,000 | BBB+ | 3.750% due 5/22/25 | 476,631 | |||||||
| 163,000 | BBB+ | 0.855% (SOFR + 0.609%) due 2/12/26(c) | 162,147 | |||||||
See Notes to Financial Statements.
168
| Schedules of Investments |
| (continued) |
| Core Fixed Income Fund | ||||||||||
| Face Amount/Units† | Rating†† | Security | Value | |||||||
Banks — 8.7% — (continued) | ||||||||||
| $ | 150,000 | BBB+ | 1.295% (3-Month USD-LIBOR + 1.170%) due 5/15/26(c) | $ | 153,745 | |||||
| 613,000 | BBB+ | 3.500% due 11/16/26 | 667,771 | |||||||
| 220,000 | BBB+ | 1.093% (SOFR + 0.789%) due 12/9/26(c) | 218,418 | |||||||
| 685,000 | BBB+ | 1.431% (SOFR + 0.798%) due 3/9/27(c) | 687,993 | |||||||
| 1,240,000 | BBB+ | 1.542% (SOFR + 0.818%) due 9/10/27(c) | 1,246,635 | |||||||
| 620,000 | BBB+ | 3.814% (3-Month USD-LIBOR + 1.158%) due 4/23/29(c) | 695,202 | |||||||
| 1,330,000 | BBB+ | 4.223% (3-Month USD-LIBOR + 1.301%) due 5/1/29(c) | 1,524,267 | |||||||
| 520,000 | BBB+ | 2.615% (SOFR + 1.281%) due 4/22/32(c) | 537,087 | |||||||
| 95,000 | BBB+ | 4.017% (3-Month USD-LIBOR + 1.373%) due 10/31/38(c) | 111,265 | |||||||
| 341,000 | BBB+ | 4.411% (3-Month USD-LIBOR + 1.430%) due 4/23/39(c) | 418,349 | |||||||
| 370,000 | BBB+ | 6.250% due 2/1/41 | 549,923 | |||||||
| 20,000 | BBB+ | 3.210% (SOFR + 1.513%) due 4/22/42(c) | 21,142 | |||||||
| 360,000 | BBB+ | 2.908% (SOFR + 1.472%) due 7/21/42(c) | 363,752 | |||||||
| 180,000 | BBB+ | 4.750% due 10/21/45 | 237,694 | |||||||
Subordinated Notes: | ||||||||||
| 600,000 | BBB- | 4.250% due 10/21/25 | 670,016 | |||||||
| 460,000 | BBB- | 6.750% due 10/1/37 | 671,208 | |||||||
| 290,000 | BBB- | 5.150% due 5/22/45 | 388,927 | |||||||
| HSBC Holdings PLC: | ||||||||||
Senior Unsecured Notes: | ||||||||||
| 200,000 | A- | 3.262% (3-Month USD-LIBOR + 1.055%) due 3/13/23(c) | 203,137 | |||||||
| 105,000 | A- | 4.292% (3-Month USD-LIBOR + 1.348%) due 9/12/26(c) | 116,706 | |||||||
| 715,000 | A- | 1.589% (SOFR + 1.290%) due 5/24/27(c) | 717,709 | |||||||
| 509,000 | A- | 4.041% (3-Month USD-LIBOR + 1.546%) due 3/13/28(c) | 567,435 | |||||||
| 1,285,000 | A- | 2.013% (SOFR + 1.732%) due 9/22/28(c) | 1,297,941 | |||||||
| 785,000 | A- | 2.206% (SOFR + 1.285%) due 8/17/29(c) | 791,787 | |||||||
| 420,000 | A- | 3.973% (3-Month USD-LIBOR + 1.610%) due 5/22/30(c) | 471,358 | |||||||
| 255,000 | A- | 2.804% (SOFR + 1.187%) due 5/24/32(c) | 263,534 | |||||||
| 190,000 | BBB | Subordinated Notes, 6.500% due 9/15/37 | 266,155 | |||||||
| 200,000 | A- | ING Groep NV, Senior Unsecured Notes, 1.726% (SOFR + 1.005%) due 4/1/27(c) | 203,103 | |||||||
| Intesa Sanpaolo SpA: | ||||||||||
Senior Unsecured Notes: | ||||||||||
| 200,000 | BBB | 3.125% due 7/14/22(a) | 204,600 | |||||||
| 200,000 | BBB | 3.375% due 1/12/23(a) | 207,515 | |||||||
| 200,000 | BB+ | Subordinated Notes, 5.017% due 6/26/24(a) | 217,193 | |||||||
| JPMorgan Chase & Co.: | ||||||||||
Senior Unsecured Notes: | ||||||||||
| 460,000 | A- | 1.514% (SOFR + 1.455%) due 6/1/24(c) | 468,291 | |||||||
| 430,000 | A- | 4.023% (3-Month USD-LIBOR + 1.000%) due 12/5/24(c) | 462,005 | |||||||
| 795,000 | A- | 0.969% (SOFR + 0.580%) due 6/23/25(c) | 797,577 | |||||||
| 972,000 | A- | 2.005% (SOFR + 1.585%) due 3/13/26(c) | 1,002,797 | |||||||
| 280,000 | A- | 2.083% (SOFR + 1.850%) due 4/22/26(c) | 289,280 | |||||||
| 644,000 | A- | 3.960% (3-Month USD-LIBOR + 1.245%) due 1/29/27(c) | 717,526 | |||||||
| 2,037,000 | A- | 1.578% (SOFR + 0.885%) due 4/22/27(c) | 2,057,293 | |||||||
| 992,000 | A- | 3.782% (3-Month USD-LIBOR + 1.337%) due 2/1/28(c) | 1,103,697 | |||||||
| 45,000 | A- | 3.540% (3-Month USD-LIBOR + 1.380%) due 5/1/28(c) | 49,667 | |||||||
| 635,000 | A- | 2.182% (SOFR + 1.890%) due 6/1/28(c) | 655,277 | |||||||
| 846,000 | A- | 4.005% (3-Month USD-LIBOR + 1.120%) due 4/23/29(c) | 960,960 | |||||||
| 480,000 | A- | 4.203% (3-Month USD-LIBOR + 1.260%) due 7/23/29(c) | 551,972 | |||||||
| 697,000 | A- | 4.452% (3-Month USD-LIBOR + 1.330%) due 12/5/29(c) | 814,922 | |||||||
| 147,000 | A- | 3.702% (3-Month USD-LIBOR + 1.160%) due 5/6/30(c) | 164,738 | |||||||
| 194,000 | A- | 2.739% (SOFR + 1.510%) due 10/15/30(c) | 204,559 | |||||||
| 150,000 | A- | 2.522% (SOFR + 2.040%) due 4/22/31(c) | 155,346 | |||||||
| 430,000 | A- | 2.580% (SOFR + 1.250%) due 4/22/32(c) | 444,866 | |||||||
| 146,000 | A- | 5.600% due 7/15/41 | 205,814 | |||||||
See Notes to Financial Statements.
169
| Schedules of Investments |
| (continued) |
| Core Fixed Income Fund | ||||||||||
| Face Amount/Units† | Rating†† | Security | Value | |||||||
Banks — 8.7% �� (continued) | ||||||||||
| $ | 38,000 | A- | 4.260% (3-Month USD-LIBOR + 1.580%) due 2/22/48(c) | $ | 46,864 | |||||
| 199,000 | A- | 4.032% (3-Month USD-LIBOR + 1.460%) due 7/24/48(c) | 237,909 | |||||||
| 357,000 | A- | 3.964% (3-Month USD-LIBOR + 1.380%) due 11/15/48(c) | 422,529 | |||||||
| 49,000 | A- | 3.897% (3-Month USD-LIBOR + 1.220%) due 1/23/49(c) | 57,652 | |||||||
| 50,000 | A- | 3.109% (SOFR + 2.440%) due 4/22/51(c) | 52,392 | |||||||
Subordinated Notes: | ||||||||||
| 270,000 | BBB+ | 3.875% due 9/10/24 | 294,025 | |||||||
| 210,000 | BBB+ | 4.250% due 10/1/27 | 241,087 | |||||||
| 490,000 | BBB+ | 4.950% due 6/1/45 | 655,188 | |||||||
| 189,000 | BBB+ | KeyCorp, Senior Unsecured Notes, 2.250% due 4/6/27 | 197,151 | |||||||
| Lloyds Banking Group PLC: | ||||||||||
Senior Unsecured Notes: | ||||||||||
| 860,000 | BBB+ | 2.907% (3-Month USD-LIBOR + 0.810%) due 11/7/23(c) | 883,831 | |||||||
| 400,000 | BBB+ | 3.900% due 3/12/24 | 431,951 | |||||||
| 273,000 | BBB+ | 3.750% due 1/11/27 | 302,935 | |||||||
| 350,000 | BBB+ | 1.627% (1-Year CMT Index + 0.850%) due 5/11/27(c) | 351,492 | |||||||
| 468,000 | BBB+ | 4.375% due 3/22/28 | 539,120 | |||||||
| 200,000 | BBB+ | 4.550% due 8/16/28 | 233,561 | |||||||
| 245,000 | BBB- | Subordinated Notes, 4.582% due 12/10/25 | 276,313 | |||||||
| Macquarie Group Ltd., Senior Unsecured Notes: | ||||||||||
| 540,000 | BBB+ | 1.340% (SOFR + 1.069%) due 1/12/27(a)(c) | 538,580 | |||||||
| 100,000 | BBB+ | 1.629% (SOFR + 0.910%) due 9/23/27(a)(c) | 100,482 | |||||||
| Mizuho Financial Group Inc., Senior Unsecured Notes: | ||||||||||
| 738,000 | A- | 2.839% (SOFR + 1.242%) due 7/16/25(c) | 778,783 | |||||||
| 536,000 | A- | 2.226% (3-Month USD-LIBOR + 0.830%) due 5/25/26(c) | 555,871 | |||||||
| 200,000 | A- | 2.201% (SOFR + 1.772%) due 7/10/31(c) | 200,252 | |||||||
| 945,000 | A- | 1.979% (SOFR + 1.532%) due 9/8/31(c) | 930,133 | |||||||
| 200,000 | A- | 2.260% (1-Year CMT Index + 0.900%) due 7/9/32(c) | 200,195 | |||||||
| 250,000 | AA+ | National Securities Clearing Corp., Senior Unsecured Notes, 1.500% due 4/23/25(a) | 255,383 | |||||||
| Natwest Group PLC, Senior Unsecured Notes: | ||||||||||
| 200,000 | BBB | 4.519% (3-Month USD-LIBOR + 1.550%) due 6/25/24(c) | 213,622 | |||||||
| 865,000 | BBB | 4.269% (3-Month USD-LIBOR + 1.762%) due 3/22/25(c) | 937,900 | |||||||
| 400,000 | BBB | 5.076% (3-Month USD-LIBOR + 1.905%) due 1/27/30(c) | 480,213 | |||||||
| 33,000 | A+ | Northern Trust Corp., Senior Unsecured Notes, 3.150% due 5/3/29 | 36,561 | |||||||
| Royal Bank of Canada, Senior Unsecured Notes: | ||||||||||
| 260,000 | A | 1.600% due 4/17/23 | 265,676 | |||||||
| 160,000 | A | 1.150% due 6/10/25 | 161,162 | |||||||
| 30,000 | BBB+ | Santander Holdings USA Inc., Senior Unsecured Notes, 4.500% due 7/17/25 | 33,278 | |||||||
| Santander UK Group Holdings PLC, Senior Unsecured Notes: | ||||||||||
| 180,000 | BBB | 4.796% (3-Month USD-LIBOR + 1.570%) due 11/15/24(c) | 195,693 | |||||||
| 760,000 | BBB | 1.089% (SOFR + 0.787%) due 3/15/25(c) | 762,420 | |||||||
| 666,000 | BBB | 1.532% (1-Year CMT Index + 1.250%) due 8/21/26(c) | 669,533 | |||||||
| 1,075,000 | BBB | 1.673% (SOFR + 0.989%) due 6/14/27(c) | 1,079,260 | |||||||
| 200,000 | BBB | 3.823% (3-Month USD-LIBOR + 1.400%) due 11/3/28(c) | 221,114 | |||||||
| 535,000 | BBB- | Santander UK PLC, Subordinated Notes, 5.000% due 11/7/23(a) | 580,817 | |||||||
| Sumitomo Mitsui Financial Group Inc., Senior Unsecured Notes: | ||||||||||
| 96,000 | A- | 3.544% due 1/17/28 | 107,122 | |||||||
| 114,000 | A- | 3.944% due 7/19/28 | 130,442 | |||||||
| 200,000 | A- | 3.040% due 7/16/29 | 215,295 | |||||||
| 200,000 | A- | 2.750% due 1/15/30 | 212,060 | |||||||
| 200,000 | A+ | Swedbank AB, Senior Unsecured Notes, 1.300% due 6/2/23(a) | 203,212 | |||||||
| 96,000 | BBB- | Synovus Financial Corp., Senior Unsecured Notes, 3.125% due 11/1/22 | 98,351 | |||||||
| Toronto-Dominion Bank (The), Senior Unsecured Notes: | ||||||||||
| 310,000 | A | 0.750% due 6/12/23 | 312,417 | |||||||
| 150,000 | A | 1.150% due 6/12/25 | 151,460 | |||||||
See Notes to Financial Statements.
170
| Schedules of Investments |
| (continued) |
| Core Fixed Income Fund | ||||||||||
| Face Amount/Units† | Rating†† | Security | Value | |||||||
Banks — 8.7% — (continued) | ||||||||||
| $ | 290,000 | A+ | UBS AG, Senior Unsecured Notes, 1.750% due 4/21/22(a) | $ | 292,585 | |||||
| UBS Group AG: | ||||||||||
| 1,070,000 | BB | Junior Subordinated Notes, 7.000% (5-Year USD Swap Rate + 4.344%)(a)(c)(d) | 1,173,774 | |||||||
Senior Unsecured Notes: | ||||||||||
| 260,000 | A- | 2.650% due 2/1/22(a) | 262,664 | |||||||
| 650,000 | A- | 3.491% due 5/23/23(a) | 664,604 | |||||||
| 200,000 | A- | 2.859% (3-Month USD-LIBOR + 0.954%) due 8/15/23(a)(c) | 204,670 | |||||||
| UniCredit SpA: | ||||||||||
| 580,000 | BBB- | Senior Unsecured Notes, 6.572% due 1/14/22(a) | 592,348 | |||||||
| 200,000 | BB+ | Subordinated Notes, 7.296% (5-Year USD 1100 Run ICE Swap Rate + 4.914%) due 4/2/34(a)(c) | 242,182 | |||||||
| US Bancorp: | ||||||||||
| 350,000 | A+ | Senior Unsecured Notes, 1.450% due 5/12/25 | 358,226 | |||||||
| 56,000 | A- | Subordinated Notes, 3.100% due 4/27/26 | 61,011 | |||||||
| Wells Fargo & Co.: | ||||||||||
| 50,000 | BB+ | Junior Subordinated Notes, 5.875% (3-Month USD-LIBOR + 3.990%)(c)(d) | 56,430 | |||||||
Senior Unsecured Notes: | ||||||||||
| 270,000 | BBB+ | 3.750% due 1/24/24 | 289,557 | |||||||
| 300,000 | BBB+ | 2.188% (SOFR + 2.000%) due 4/30/26(c) | 311,729 | |||||||
| 260,000 | BBB+ | 3.000% due 10/23/26 | 281,266 | |||||||
| 3,259,000 | BBB+ | 3.584% (3-Month USD-LIBOR + 1.310%) due 5/22/28(c) | 3,618,854 | |||||||
| 736,000 | BBB+ | 4.150% due 1/24/29 | 847,680 | |||||||
| 1,076,000 | BBB+ | 2.879% (SOFR + 1.432%) due 10/30/30(c) | 1,145,170 | |||||||
| 100,000 | BBB+ | 4.478% (SOFR + 4.032%) due 4/4/31(c) | 118,605 | |||||||
| 521,000 | BBB+ | 3.068% (SOFR + 2.530%) due 4/30/41(c) | 547,011 | |||||||
| 1,990,000 | BBB+ | 5.013% (SOFR + 4.502%) due 4/4/51(c) | 2,757,797 | |||||||
Subordinated Notes: | ||||||||||
| 330,000 | BBB | 3.450% due 2/13/23 | 344,390 | |||||||
| 169,000 | BBB | 4.480% due 1/16/24 | 184,165 | |||||||
| 230,000 | BBB | 5.375% due 11/2/43 | 310,029 | |||||||
| 110,000 | BBB | 5.606% due 1/15/44 | 152,502 | |||||||
| 280,000 | BBB | 4.650% due 11/4/44 | 350,012 | |||||||
| 450,000 | BBB | 4.900% due 11/17/45 | 583,671 | |||||||
| 40,000 | BBB | 4.400% due 6/14/46 | 48,779 | |||||||
| 160,000 | BBB | 4.750% due 12/7/46 | 203,946 | |||||||
| 517,000 | A+ | Wells Fargo Bank NA, Senior Unsecured Notes, 2.082% (3-Month USD-LIBOR + 0.650%) due 9/9/22(c) | 517,193 | |||||||
|
| |||||||||
| Total Banks | 113,473,936 | |||||||||
|
| |||||||||
Beverages — 0.6% | ||||||||||
| Anheuser-Busch Cos. LLC/Anheuser-Busch InBev Worldwide Inc., Company Guaranteed Notes: | ||||||||||
| 340,000 | BBB+ | 3.650% due 2/1/26 | 375,625 | |||||||
| 1,202,000 | BBB+ | 4.700% due 2/1/36 | 1,483,917 | |||||||
| 1,115,000 | BBB+ | 4.900% due 2/1/46 | 1,423,733 | |||||||
| Anheuser-Busch InBev Worldwide Inc., Company Guaranteed Notes: | ||||||||||
| 140,000 | BBB+ | 4.000% due 4/13/28 | 159,490 | |||||||
| 258,000 | BBB+ | 4.750% due 1/23/29 | 307,058 | |||||||
| 260,000 | BBB+ | 3.500% due 6/1/30 | 289,697 | |||||||
| 160,000 | BBB+ | 4.350% due 6/1/40 | 191,998 | |||||||
| 36,000 | BBB+ | 4.600% due 4/15/48 | 44,417 | |||||||
| 43,000 | BBB+ | 4.439% due 10/6/48 | 51,970 | |||||||
| 270,000 | BBB+ | 5.550% due 1/23/49 | 375,662 | |||||||
| 525,000 | BBB+ | 4.500% due 6/1/50 | 651,970 | |||||||
| 2,000 | BBB+ | 4.750% due 4/15/58 | 2,556 | |||||||
See Notes to Financial Statements.
171
| Schedules of Investments |
| (continued) |
| Core Fixed Income Fund | ||||||||||
| Face Amount/Units† | Rating†† | Security | Value | |||||||
Beverages — 0.6% — (continued) | ||||||||||
| Bacardi Ltd., Company Guaranteed Notes: | ||||||||||
| $ | 405,000 | BBB- | 4.450% due 5/15/25(a) | $ | 449,918 | |||||
| 140,000 | BBB- | 5.300% due 5/15/48(a) | 186,747 | |||||||
| Coca-Cola Co. (The), Senior Unsecured Notes: | ||||||||||
| 110,000 | A+ | 3.375% due 3/25/27 | 122,794 | |||||||
| 160,000 | A+ | 1.450% due 6/1/27 | 163,273 | |||||||
| 74,000 | A+ | 2.125% due 9/6/29 | 76,977 | |||||||
| 179,000 | A+ | 3.450% due 3/25/30 | 203,247 | |||||||
| 41,000 | A+ | 2.000% due 3/5/31 | 41,730 | |||||||
| 74,000 | A+ | 2.250% due 1/5/32 | 76,638 | |||||||
| 10,000 | A+ | 2.500% due 6/1/40 | 10,032 | |||||||
| 60,000 | A+ | 2.600% due 6/1/50 | 59,427 | |||||||
| Keurig Dr Pepper Inc., Company Guaranteed Notes: | ||||||||||
| 114,000 | BBB | 3.200% due 5/1/30 | 124,005 | |||||||
| 79,000 | BBB | 2.250% due 3/15/31 | 80,188 | |||||||
| PepsiCo Inc., Senior Unsecured Notes: | ||||||||||
| 180,000 | A+ | 0.750% due 5/1/23 | 181,637 | |||||||
| 20,000 | A+ | 2.625% due 3/19/27 | 21,562 | |||||||
| 150,000 | A+ | 1.625% due 5/1/30 | 149,669 | |||||||
| 60,000 | A+ | 2.875% due 10/15/49 | 62,980 | |||||||
| 20,000 | A+ | 3.625% due 3/19/50 | 23,794 | |||||||
| 40,000 | A+ | 3.875% due 3/19/60 | 49,947 | |||||||
| 355,000 | BBB | Suntory Holdings Ltd., Senior Unsecured Notes, 2.250% due 10/16/24(a) | 369,071 | |||||||
|
| |||||||||
| Total Beverages | 7,811,729 | |||||||||
|
| |||||||||
Biotechnology — 0.1% | ||||||||||
| Amgen Inc., Senior Unsecured Notes: | ||||||||||
| 70,000 | A- | 3.625% due 5/22/24 | 75,155 | |||||||
| 156,000 | A- | 4.400% due 5/1/45 | 191,174 | |||||||
| 98,000 | A- | 4.663% due 6/15/51 | 127,262 | |||||||
| 125,000 | A- | Biogen Inc., Senior Unsecured Notes, 3.150% due 5/1/50 | 123,907 | |||||||
| 65,000 | A+ | Celgene Corp., Senior Unsecured Notes, 3.900% due 2/20/28 | 71,502 | |||||||
| Gilead Sciences Inc., Senior Unsecured Notes: | ||||||||||
| 160,000 | BBB+ | 3.700% due 4/1/24 | 171,566 | |||||||
| 60,000 | BBB+ | 3.650% due 3/1/26 | 66,193 | |||||||
| 218,000 | BBB+ | 4.800% due 4/1/44 | 279,096 | |||||||
| 130,000 | BBB+ | 4.750% due 3/1/46 | 167,390 | |||||||
| 215,000 | B2(b) | HCRX Investments Holdco LP, Senior Unsecured Notes, 4.500% due 8/1/29(a) | 218,083 | |||||||
|
| |||||||||
| Total Biotechnology | 1,491,328 | |||||||||
|
| |||||||||
Building Materials — 0.0% | ||||||||||
| 178,000 | BBB | Carrier Global Corp., Senior Unsecured Notes, 2.242% due 2/15/25 | 185,550 | |||||||
|
| |||||||||
Chemicals — 0.3% | ||||||||||
| 80,000 | A | Air Products & Chemicals Inc., Senior Unsecured Notes, 2.800% due 5/15/50 | 81,828 | |||||||
| 58,000 | BBB | Dow Chemical Co. (The), Senior Unsecured Notes, 5.550% due 11/30/48 | 82,276 | |||||||
| 479,000 | BBB+ | DuPont de Nemours Inc., Senior Unsecured Notes, 4.493% due 11/15/25 | 541,214 | |||||||
| 4,000 | BBB | Eastman Chemical Co., Senior Unsecured Notes, 4.500% due 12/1/28 | 4,677 | |||||||
| 84,000 | A- | Ecolab Inc., Senior Unsecured Notes, 2.750% due 8/18/55(a) | 83,141 | |||||||
| 200,000 | BBB | Equate Petrochemical BV, Company Guaranteed Notes, 4.250% due 11/3/26(a) | 222,666 | |||||||
| International Flavors & Fragrances Inc., Senior Unsecured Notes: | ||||||||||
| 841,000 | BBB | 2.300% due 11/1/30(a) | 852,841 | |||||||
| 5,000 | BBB | 5.000% due 9/26/48 | 6,664 | |||||||
| 87,000 | BBB | LYB International Finance III LLC, Company Guaranteed Notes, 4.200% due 5/1/50 | 102,186 | |||||||
| 30,000 | BBB | Monsanto Co., Senior Unsecured Notes, 4.400% due 7/15/44 | 32,565 | |||||||
See Notes to Financial Statements.
172
| Schedules of Investments |
| (continued) |
| Core Fixed Income Fund | ||||||||||
| Face Amount/Units† | Rating†† | Security | Value | |||||||
Chemicals — 0.3% — (continued) | ||||||||||
| OCP SA, Senior Unsecured Notes: | ||||||||||
| $ | 200,000 | BB+ | 4.500% due 10/22/25(a) | $ | 217,061 | |||||
| 200,000 | BB+ | 3.750% due 6/23/31(a) | 202,939 | |||||||
| 200,000 | BB+ | 5.125% due 6/23/51(a) | 202,577 | |||||||
| Orbia Advance Corp. SAB de CV, Company Guaranteed Notes: | ||||||||||
| 270,000 | BBB- | 1.875% due 5/11/26(a) | 272,435 | |||||||
| 260,000 | BBB- | 2.875% due 5/11/31(a) | 264,621 | |||||||
| Sherwin-Williams Co. (The), Senior Unsecured Notes: | ||||||||||
| 210,000 | BBB | 4.200% due 1/15/22 | 210,998 | |||||||
| 34,000 | BBB | 4.500% due 6/1/47 | 42,646 | |||||||
| 84,000 | BBB | Westlake Chemical Corp., Senior Unsecured Notes, 3.375% due 8/15/61 | 81,188 | |||||||
|
| |||||||||
| Total Chemicals | 3,504,523 | |||||||||
|
| |||||||||
Commercial Services — 0.2% | ||||||||||
| 110,000 | A- | Cintas Corp. No 2, Company Guaranteed Notes, 3.700% due 4/1/27 | 123,519 | |||||||
| Global Payments Inc., Senior Unsecured Notes: | ||||||||||
| 387,000 | BBB- | 3.200% due 8/15/29 | 415,572 | |||||||
| 127,000 | BBB- | 2.900% due 5/15/30 | 133,618 | |||||||
| IHS Markit Ltd.: | ||||||||||
Company Guaranteed Notes: | ||||||||||
| 584,000 | Ba1(b) | 5.000% due 11/1/22(a) | 607,331 | |||||||
| 112,000 | Ba1(b) | 4.750% due 2/15/25(a) | 124,499 | |||||||
| 28,000 | Ba1(b) | 4.000% due 3/1/26(a) | 30,978 | |||||||
| 450,000 | Ba1(b) | Senior Unsecured Notes, 4.750% due 8/1/28 | 533,122 | |||||||
| 39,000 | BBB+ | Moody’s Corp., Senior Unsecured Notes, 3.250% due 1/15/28 | 42,743 | |||||||
| PayPal Holdings Inc., Senior Unsecured Notes: | ||||||||||
| 130,000 | A- | 1.350% due 6/1/23 | 132,281 | |||||||
| 140,000 | A- | 1.650% due 6/1/25 | 144,191 | |||||||
| 100,000 | A- | 2.300% due 6/1/30 | 104,079 | |||||||
| RELX Capital Inc., Company Guaranteed Notes: | ||||||||||
| 305,000 | BBB+ | 3.500% due 3/16/23 | 318,430 | |||||||
| 59,000 | BBB+ | 4.000% due 3/18/29 | 66,786 | |||||||
| 447,000 | BBB+ | 3.000% due 5/22/30 | 480,478 | |||||||
| 20,000 | BBB- | United Rentals North America Inc., Secured Notes, 3.875% due 11/15/27 | 21,040 | |||||||
|
| |||||||||
| Total Commercial Services | 3,278,667 | |||||||||
|
| |||||||||
Computers — 0.4% | ||||||||||
| Apple Inc., Senior Unsecured Notes: | ||||||||||
| 300,000 | AA+ | 2.400% due 5/3/23 | 310,796 | |||||||
| 290,000 | AA+ | 1.125% due 5/11/25 | 293,546 | |||||||
| 280,000 | AA+ | 2.450% due 8/4/26 | 298,673 | |||||||
| 550,000 | AA+ | 3.350% due 2/9/27 | 611,524 | |||||||
| 360,000 | AA+ | 2.900% due 9/12/27 | 393,351 | |||||||
| 55,000 | AA+ | 3.850% due 5/4/43 | 65,676 | |||||||
| 80,000 | AA+ | 3.850% due 8/4/46 | 95,750 | |||||||
| 272,000 | AA+ | 3.750% due 11/13/47 | 321,800 | |||||||
| 111,000 | AA+ | 2.800% due 2/8/61 | 110,178 | |||||||
| 75,000 | BBB- | Dell International LLC/EMC Corp., Senior Secured Notes, 8.350% due 7/15/46 | 123,124 | |||||||
| 227,000 | BBB | Hewlett Packard Enterprise Co., Senior Unsecured Notes, 4.650% due 10/1/24 | 251,804 | |||||||
| International Business Machines Corp., Senior Unsecured Notes: | ||||||||||
| 680,000 | A- | 3.000% due 5/15/24 | 723,925 | |||||||
| 238,000 | A- | 3.300% due 5/15/26 | 261,849 | |||||||
| 101,000 | A- | 3.300% due 1/27/27 | 111,553 | |||||||
| 100,000 | A- | 4.150% due 5/15/39 | 120,242 | |||||||
| 121,000 | A- | 2.850% due 5/15/40 | 123,515 | |||||||
| 800,000 | BBB- | Leidos Inc., Company Guaranteed Notes, 4.375% due 5/15/30 | 918,764 | |||||||
See Notes to Financial Statements.
173
| Schedules of Investments |
| (continued) |
| Core Fixed Income Fund | ||||||||||
| Face Amount/Units† | Rating†† | Security | Value | |||||||
Computers — 0.4% — (continued) | ||||||||||
| $ | 71,000 | BB+ | Seagate HDD Cayman, Company Guaranteed Notes, 4.091% due 6/1/29(a) | $ | 75,181 | |||||
|
| |||||||||
| Total Computers | 5,211,251 | |||||||||
|
| |||||||||
Cosmetics/Personal Care — 0.0% | ||||||||||
| Procter & Gamble Co. (The), Senior Unsecured Notes: | ||||||||||
| 30,000 | AA- | 2.800% due 3/25/27 | 32,657 | |||||||
| 80,000 | AA- | 3.000% due 3/25/30 | 88,841 | |||||||
|
| |||||||||
| Total Cosmetics/Personal Care | 121,498 | |||||||||
|
| |||||||||
Diversified Financial Services — 0.8% | ||||||||||
| AerCap Ireland Capital DAC/AerCap Global Aviation Trust, Company Guaranteed Notes: | ||||||||||
| 290,000 | BBB | 3.950% due 2/1/22 | 293,302 | |||||||
| 280,000 | BBB | 4.875% due 1/16/24 | 304,045 | |||||||
| 190,000 | BBB | 3.150% due 2/15/24 | 198,800 | |||||||
| 350,000 | BBB | 3.500% due 1/15/25 | 370,667 | |||||||
| 150,000 | BBB | 4.450% due 4/3/26 | 164,785 | |||||||
| Air Lease Corp., Senior Unsecured Notes: | ||||||||||
| 460,000 | BBB | 3.500% due 1/15/22 | 465,261 | |||||||
| 495,000 | BBB | 3.250% due 3/1/25 | 526,269 | |||||||
| 200,000 | BBB | 3.375% due 7/1/25 | 214,272 | |||||||
| Avolon Holdings Funding Ltd., Company Guaranteed Notes: | ||||||||||
| 75,000 | BBB- | 5.250% due 5/15/24(a) | 82,291 | |||||||
| 500,000 | BBB- | 2.875% due 2/15/25(a) | 515,840 | |||||||
| 663,000 | BBB- | 2.528% due 11/18/27(a) | 658,698 | |||||||
| Capital One Financial Corp., Senior Unsecured Notes: | ||||||||||
| 20,000 | BBB | 3.750% due 3/9/27 | 22,379 | |||||||
| 236,000 | BBB | 3.800% due 1/31/28 | 265,320 | |||||||
| 100,000 | AA- | CME Group Inc., Senior Unsecured Notes, 3.750% due 6/15/28 | 114,622 | |||||||
| 255,000 | BBB- | Discover Financial Services, Senior Unsecured Notes, 4.500% due 1/30/26 | 288,069 | |||||||
| 1,946,000 | BBB+ | GE Capital International Funding Co. Unlimited Co., Company Guaranteed Notes, 4.418% due 11/15/35 | 2,363,373 | |||||||
| 298,000 | BBB+ | Intercontinental Exchange Inc., Senior Unsecured Notes, 2.100% due 6/15/30 | 299,296 | |||||||
| 30,000 | A | KKR Group Finance Co. II LLC, Company Guaranteed Notes, 5.500% due 2/1/43(a) | 40,623 | |||||||
| 650,000 | NR | Lehman Brothers Holdings Inc., Subordinated Notes, 6.750% due 12/28/17#(e)(f)(g) | — | |||||||
| 535,000 | A | LSEGA Financing PLC, Company Guaranteed Notes, 2.000% due 4/6/28(a) | 544,887 | |||||||
| 30,000 | A+ | Mastercard Inc., Senior Unsecured Notes, 3.850% due 3/26/50 | 36,658 | |||||||
| Nomura Holdings Inc., Senior Unsecured Notes: | ||||||||||
| 230,000 | BBB+ | 3.103% due 1/16/30 | 243,381 | |||||||
| 200,000 | BBB+ | 2.608% due 7/14/31 | 202,261 | |||||||
| Park Aerospace Holdings Ltd., Company Guaranteed Notes: | ||||||||||
| 9,000 | BBB- | 5.250% due 8/15/22(a) | 9,358 | |||||||
| 60,000 | BBB- | 5.500% due 2/15/24(a) | 65,869 | |||||||
| 220,000 | BBB+ | Raymond James Financial Inc., Senior Unsecured Notes, 4.950% due 7/15/46 | 288,821 | |||||||
| Synchrony Financial, Senior Unsecured Notes: | ||||||||||
| 6,000 | BBB- | 4.500% due 7/23/25 | 6,680 | |||||||
| 265,000 | BBB- | 3.700% due 8/4/26 | 290,621 | |||||||
| 150,000 | AA | USAA Capital Corp., Senior Unsecured Notes, 2.125% due 5/1/30(a) | 152,909 | |||||||
| Visa Inc., Senior Unsecured Notes: | ||||||||||
| 420,000 | AA- | 3.150% due 12/14/25 | 458,678 | |||||||
| 110,000 | AA- | 2.050% due 4/15/30 | 113,697 | |||||||
| 154,000 | AA- | 4.150% due 12/14/35 | 190,082 | |||||||
| 310,000 | AA- | 4.300% due 12/14/45 | 397,798 | |||||||
|
| |||||||||
| Total Diversified Financial Services | 10,189,612 | |||||||||
|
| |||||||||
See Notes to Financial Statements.
174
| Schedules of Investments |
| (continued) |
| Core Fixed Income Fund | ||||||||||
| Face Amount/Units† | Rating†† | Security | Value | |||||||
Electric — 1.2% | ||||||||||
| AEP Texas Inc., Senior Unsecured Notes: | ||||||||||
| $ | 50,000 | A- | 2.400% due 10/1/22 | $ | 51,060 | |||||
| 82,000 | A- | 3.450% due 1/15/50 | 87,293 | |||||||
| 191,000 | A- | 3.450% due 5/15/51 | 202,525 | |||||||
| AEP Transmission Co. LLC, Senior Unsecured Notes: | ||||||||||
| 505,000 | A- | 3.750% due 12/1/47 | 583,753 | |||||||
| 120,000 | A- | 2.750% due 8/15/51 | 118,327 | |||||||
| Alabama Power Co., Senior Unsecured Notes: | ||||||||||
| 17,000 | A | 5.200% due 6/1/41 | 22,527 | |||||||
| 121,000 | A | 4.150% due 8/15/44 | 147,174 | |||||||
| 60,000 | A | 3.450% due 10/1/49 | 66,695 | |||||||
| 161,000 | A | Ameren Illinois Co., 1st Mortgage Notes, 3.250% due 3/15/50 | 176,900 | |||||||
| Baltimore Gas & Electric Co., Senior Unsecured Notes: | ||||||||||
| 6,000 | A | 3.500% due 8/15/46 | 6,713 | |||||||
| 150,000 | A | 3.750% due 8/15/47 | 175,847 | |||||||
| 130,000 | A | 3.200% due 9/15/49 | 140,063 | |||||||
| 67,000 | A | 2.900% due 6/15/50 | 68,111 | |||||||
| CenterPoint Energy Houston Electric LLC: | ||||||||||
| 146,000 | A | 1st Mortgage Notes, 3.350% due 4/1/51 | 163,147 | |||||||
| 15,000 | A | General Refiinance Mortgage, 3.950% due 3/1/48 | 18,084 | |||||||
| 92,000 | A | Commonwealth Edison Co., 1st Mortgage Notes, 4.000% due 3/1/48 | 110,568 | |||||||
| Consolidated Edison Co. of New York Inc., Senior Unsecured Notes: | ||||||||||
| 60,000 | A- | 3.350% due 4/1/30 | 66,444 | |||||||
| 40,000 | A- | 3.950% due 4/1/50 | 46,483 | |||||||
| Consumers Energy Co., 1st Mortgage Notes: | ||||||||||
| 256,000 | A | 3.500% due 8/1/51 | 295,783 | |||||||
| 91,000 | A | 2.650% due 8/15/52 | 89,265 | |||||||
| DTE Electric Co., General Refiinance Mortgage: | ||||||||||
| 30,000 | A | 4.050% due 5/15/48 | 36,986 | |||||||
| 100,000 | A | 3.950% due 3/1/49 | 121,441 | |||||||
| Duke Energy Carolinas LLC, 1st Mortgage Notes: | ||||||||||
| 22,000 | A | 3.950% due 11/15/28 | 25,249 | |||||||
| 500,000 | A | 4.250% due 12/15/41 | 609,154 | |||||||
| 205,000 | A | 3.200% due 8/15/49 | 218,259 | |||||||
| 500,000 | BBB | Duke Energy Corp., Senior Unsecured Notes, 2.550% due 6/15/31 | 514,783 | |||||||
| Duke Energy Florida LLC, 1st Mortgage Notes: | ||||||||||
| 334,000 | A | 2.500% due 12/1/29 | 352,166 | |||||||
| 504,000 | A | 1.750% due 6/15/30 | 499,031 | |||||||
| 24,000 | A | 4.200% due 7/15/48 | 29,645 | |||||||
| 335,000 | A | Duke Energy Ohio Inc., 1st Mortgage Notes, 3.650% due 2/1/29 | 376,055 | |||||||
| Duke Energy Progress LLC, 1st Mortgage Notes: | ||||||||||
| 130,000 | A | 3.450% due 3/15/29 | 145,273 | |||||||
| 162,000 | A | 4.100% due 5/15/42 | 193,576 | |||||||
| 48,000 | A | 4.100% due 3/15/43 | 58,588 | |||||||
| 67,000 | A | 2.900% due 8/15/51 | 67,568 | |||||||
| Edison International, Senior Unsecured Notes: | ||||||||||
| 91,000 | BBB- | 4.950% due 4/15/25 | 100,960 | |||||||
| 72,000 | BBB- | 5.750% due 6/15/27 | 82,368 | |||||||
| 87,000 | A | Entergy Arkansas LLC, 1st Mortgage Notes, 3.350% due 6/15/52 | 96,215 | |||||||
| Entergy Louisiana LLC: | ||||||||||
1st Mortgage Notes: | ||||||||||
| 168,000 | A | 1.600% due 12/15/30 | 163,713 | |||||||
| 60,000 | A | 2.900% due 3/15/51 | 60,474 | |||||||
| 47,000 | A | Collateral Trust, 3.050% due 6/1/31 | 51,315 | |||||||
| 60,000 | A | Entergy Texas Inc., 1st Mortgage Notes, 3.450% due 12/1/27 | 65,463 | |||||||
See Notes to Financial Statements.
175
| Schedules of Investments |
| (continued) |
| Core Fixed Income Fund | ||||||||||
| Face Amount/Units† | Rating†† | �� | Security | Value | ||||||
Electric — 1.2% — (continued) | ||||||||||
| $ | 775,000 | A- | Evergy Missouri West Inc., Senior Unsecured Notes, 8.270% due 11/15/21 | $ | 786,873 | |||||
| Exelon Corp., Senior Unsecured Notes: | ||||||||||
| 143,000 | BBB | 5.625% due 6/15/35 | 189,944 | |||||||
| 143,000 | BBB | 4.700% due 4/15/50 | 183,287 | |||||||
| FirstEnergy Corp., Senior Unsecured Notes: | ||||||||||
| 60,000 | BB | 1.600% due 1/15/26 | 59,470 | |||||||
| 310,000 | BB | 4.400% due 7/15/27 | 348,295 | |||||||
| 550,000 | BB | 7.375% due 11/15/31 | 769,522 | |||||||
| 453,000 | A+ | Florida Power & Light Co., 1st Mortgage Notes, 3.950% due 3/1/48 | 556,941 | |||||||
| 400,000 | BBB+ | ITC Holdings Corp., Senior Unsecured Notes, 4.050% due 7/1/23 | 421,444 | |||||||
| 700,000 | BB+ | Jersey Central Power & Light Co., Senior Unsecured Notes, 4.700% due 4/1/24(a) | 760,249 | |||||||
| MidAmerican Energy Co., 1st Mortgage Notes: | ||||||||||
| 255,000 | A+ | 3.100% due 5/1/27 | 279,644 | |||||||
| 100,000 | A+ | 3.650% due 4/15/29 | 113,675 | |||||||
| 100,000 | A+ | 3.150% due 4/15/50 | 106,480 | |||||||
| Northern States Power Co., 1st Mortgage Notes: | ||||||||||
| 114,000 | A | 2.900% due 3/1/50 | 118,593 | |||||||
| 85,000 | A | 2.600% due 6/1/51 | 82,724 | |||||||
| 50,000 | A | 3.200% due 4/1/52 | 54,827 | |||||||
| NRG Energy Inc., Senior Secured Notes: | ||||||||||
| 155,000 | BBB- | 2.450% due 12/2/27(a) | 157,671 | |||||||
| 122,000 | BBB- | 4.450% due 6/15/29(a) | 136,784 | |||||||
| Ohio Power Co., Senior Unsecured Notes: | ||||||||||
| 118,000 | A- | 1.625% due 1/15/31 | 115,055 | |||||||
| 29,000 | A- | 4.000% due 6/1/49 | 35,029 | |||||||
| Oncor Electric Delivery Co. LLC, Senior Secured Notes: | ||||||||||
| 168,000 | A+ | 3.700% due 11/15/28 | 191,120 | |||||||
| 98,000 | A+ | 3.100% due 9/15/49 | 104,829 | |||||||
| 148,000 | A | PECO Energy Co., 1st Mortgage Notes, 3.050% due 3/15/51 | 156,845 | |||||||
| 500,000 | BBB | Public Service Co. of New Mexico, Senior Unsecured Notes, 3.850% due 8/1/25 | 544,916 | |||||||
| Public Service Electric & Gas Co., 1st Mortgage Notes: | ||||||||||
| 23,000 | A | 3.000% due 5/15/27 | 25,065 | |||||||
| 199,000 | A | 3.200% due 5/15/29 | 220,033 | |||||||
| Southern California Edison Co., 1st Mortgage Notes: | ||||||||||
| 3,214 | A- | 1.845% due 2/1/22 | 3,217 | |||||||
| 486,000 | A- | 3.700% due 8/1/25 | 532,019 | |||||||
| 206,000 | A- | 1.200% due 2/1/26 | 205,270 | |||||||
| 97,000 | A- | 4.200% due 3/1/29 | 110,159 | |||||||
| 134,000 | A | Southwestern Public Services Co., 1st Mortgage Notes, 3.150% due 5/1/50 | 141,869 | |||||||
| 115,000 | BBB+ | Tampa Electric Co., Senior Unsecured Notes, 3.625% due 6/15/50 | 130,288 | |||||||
| 800,000 | A- | Tucson Electric Power Co., Senior Unsecured Notes, 3.850% due 3/15/23 | 834,198 | |||||||
| Virginia Electric & Power Co., Senior Unsecured Notes: | ||||||||||
| 33,000 | BBB+ | 6.000% due 1/15/36 | 46,271 | |||||||
| 68,000 | BBB+ | 6.000% due 5/15/37 | 96,227 | |||||||
| 55,000 | BBB+ | 4.650% due 8/15/43 | 70,160 | |||||||
| 94,000 | BBB+ | 4.200% due 5/15/45 | 114,271 | |||||||
| Vistra Operations Co. LLC, Senior Secured Notes: | ||||||||||
| 92,000 | BBB- | 3.700% due 1/30/27(a) | 97,701 | |||||||
| 323,000 | BBB- | 4.300% due 7/15/29(a) | 348,716 | |||||||
|
| |||||||||
| Total Electric | 15,754,725 | |||||||||
|
| |||||||||
Electronics — 0.0% | ||||||||||
| 190,000 | BBB+ | Agilent Technologies Inc., Senior Unsecured Notes, 2.300% due 3/12/31 | 192,620 | |||||||
| Honeywell International Inc., Senior Unsecured Notes: | ||||||||||
| 110,000 | A | 1.350% due 6/1/25 | 112,288 | |||||||
See Notes to Financial Statements.
176
| Schedules of Investments |
| (continued) |
| Core Fixed Income Fund | ||||||||||
| Face Amount/Units† | Rating†† | Security | Value | |||||||
Electronics — 0.0% — (continued) | ||||||||||
| $ | 28,000 | A | 3.812% due 11/21/47 | $ | 34,027 | |||||
|
| |||||||||
| Total Electronics | 338,935 | |||||||||
|
| |||||||||
Engineering & Construction — 0.0% | ||||||||||
| 87,000 | B- | PowerTeam Services LLC, Senior Secured Notes, 9.033% due 12/4/25(a) | 95,156 | |||||||
|
| |||||||||
Environmental Control — 0.0% | ||||||||||
| Republic Services Inc., Senior Unsecured Notes: | ||||||||||
| 130,000 | BBB+ | 2.500% due 8/15/24 | 136,512 | |||||||
| 219,000 | BBB+ | 3.375% due 11/15/27 | 241,549 | |||||||
| 98,000 | A- | Waste Management Inc., Company Guaranteed Notes, 2.000% due 6/1/29 | 99,898 | |||||||
| 109,000 | B- | Waste Pro USA Inc., Senior Unsecured Notes, 5.500% due 2/15/26(a) | 111,225 | |||||||
|
| |||||||||
| Total Environmental Control | 589,184 | |||||||||
|
| |||||||||
Food — 0.3% | ||||||||||
| 50,000 | A | Hershey Co. (The), Senior Unsecured Notes, 0.900% due 6/1/25 | 50,197 | |||||||
| 275,000 | BB+ | JBS USA LUX SA/JBS USA Food Co./JBS USA Finance Inc., Senior Unsecured Notes, 5.500% due 1/15/30(a) | 310,695 | |||||||
| Kraft Heinz Foods Co., Company Guaranteed Notes: | ||||||||||
| 10,000 | BB+ | 3.000% due 6/1/26 | 10,610 | |||||||
| 40,000 | BB+ | 4.250% due 3/1/31 | 46,229 | |||||||
| 10,000 | BB+ | 6.750% due 3/15/32 | 13,561 | |||||||
| 40,000 | BB+ | 5.000% due 7/15/35 | 49,673 | |||||||
| 30,000 | BB+ | 6.875% due 1/26/39 | 44,864 | |||||||
| 10,000 | BB+ | 7.125% due 8/1/39(a) | 15,193 | |||||||
| 10,000 | BB+ | 4.625% due 10/1/39 | 11,916 | |||||||
| 445,000 | BB+ | 5.000% due 6/4/42 | 563,516 | |||||||
| 150,000 | BB+ | 5.200% due 7/15/45 | 192,684 | |||||||
| 678,000 | BB+ | 4.375% due 6/1/46 | 786,722 | |||||||
| 80,000 | BB+ | 5.500% due 6/1/50 | 106,808 | |||||||
| Mars Inc., Company Guaranteed Notes: | ||||||||||
| 110,000 | A | 2.700% due 4/1/25(a) | 116,806 | |||||||
| 350,000 | A | 3.200% due 4/1/30(a) | 387,457 | |||||||
| Mondelez International Inc., Senior Unsecured Notes: | ||||||||||
| 330,000 | BBB | 1.500% due 5/4/25 | 336,259 | |||||||
| 95,000 | BBB | 2.750% due 4/13/30 | 100,700 | |||||||
| 325,000 | B+ | Post Holdings Inc., Senior Unsecured Notes, 4.500% due 9/15/31(a) | 328,250 | |||||||
| 200,000 | A- | Seven & i Holdings Co., Ltd., Senior Unsecured Notes, 3.350% due 9/17/21(a) | 200,254 | |||||||
| 285,000 | BBB+ | Tyson Foods Inc., Senior Unsecured Notes, 3.900% due 9/28/23 | 304,438 | |||||||
|
| |||||||||
| Total Food | 3,976,832 | |||||||||
|
| |||||||||
Forest Products & Paper — 0.1% | ||||||||||
| 215,000 | BB- | Clearwater Paper Corp., Company Guaranteed Notes, 4.750% due 8/15/28(a) | 221,009 | |||||||
| Georgia-Pacific LLC, Senior Unsecured Notes: | ||||||||||
| 175,000 | A+ | 3.600% due 3/1/25(a) | 190,434 | |||||||
| 236,000 | A+ | 0.950% due 5/15/26(a) | 234,428 | |||||||
| 70,000 | BBB | International Paper Co., Senior Unsecured Notes, 4.800% due 6/15/44 | 90,307 | |||||||
| Suzano Austria GmbH, Company Guaranteed Notes: | ||||||||||
| 380,000 | BBB- | 3.750% due 1/15/31 | 399,479 | |||||||
| 170,000 | BBB- | 3.125% due 1/15/32 | 170,722 | |||||||
|
| |||||||||
| Total Forest Products & Paper | 1,306,379 | |||||||||
|
| |||||||||
Gas — 0.1% | ||||||||||
| 82,000 | A- | Atmos Energy Corp., Senior Unsecured Notes, 4.125% due 10/15/44 | 98,010 | |||||||
| 244,000 | BBB+ | CenterPoint Energy Resources Corp., Senior Unsecured Notes, 1.750% due 10/1/30 | 237,821 | |||||||
| 123,000 | BBB+ | Piedmont Natural Gas Co., Inc., Senior Unsecured Notes, 3.500% due 6/1/29 | 136,073 | |||||||
See Notes to Financial Statements.
177
| Schedules of Investments |
| (continued) |
| Core Fixed Income Fund | ||||||||||
| Face Amount/Units† | Rating†† | Security | Value | |||||||
Gas — 0.1% — (continued) | ||||||||||
| $ | 250,000 | A- | Southern Co. Gas Capital Corp., Company Guaranteed Notes, 4.400% due 5/30/47 | $ | 300,798 | |||||
|
| |||||||||
| Total Gas | 772,702 | |||||||||
|
| |||||||||
Healthcare — Products — 0.1% | ||||||||||
| Abbott Laboratories, Senior Unsecured Notes: | ||||||||||
| 164,000 | A+ | 3.750% due 11/30/26 | 185,645 | |||||||
| 70,000 | A+ | 4.750% due 11/30/36 | 90,798 | |||||||
| 150,000 | A+ | 4.900% due 11/30/46 | 208,179 | |||||||
| 62,000 | BBB | Boston Scientific Corp., Senior Unsecured Notes, 2.650% due 6/1/30 | 64,630 | |||||||
| 100,000 | BB- | Hologic Inc., Company Guaranteed Notes, 4.625% due 2/1/28(a) | 106,504 | |||||||
| 61,000 | A | Medtronic Inc., Company Guaranteed Notes, 3.500% due 3/15/25 | 66,654 | |||||||
| 13,000 | WR(b) | St Jude Medical LLC, Senior Unsecured Notes, 4.750% due 4/15/43 | 16,271 | |||||||
| 403,000 | BBB+ | Thermo Fisher Scientific Inc., Senior Unsecured Notes, 4.497% due 3/25/30 | 481,485 | |||||||
|
| |||||||||
| Total Healthcare — Products | 1,220,166 | |||||||||
|
| |||||||||
Healthcare — Services — 0.9% | ||||||||||
| Aetna Inc., Senior Unsecured Notes: | ||||||||||
| 40,000 | BBB | 2.800% due 6/15/23 | 41,515 | |||||||
| 48,000 | BBB | 6.625% due 6/15/36 | 70,075 | |||||||
| Anthem Inc., Senior Unsecured Notes: | ||||||||||
| 1,120,000 | A | 3.650% due 12/1/27 | 1,254,716 | |||||||
| 133,000 | A | 4.550% due 3/1/48 | 169,663 | |||||||
| 33,000 | A | 4.850% due 8/15/54 | 42,899 | |||||||
| Centene Corp., Senior Unsecured Notes: | ||||||||||
| 30,000 | BBB- | 4.625% due 12/15/29 | 32,944 | |||||||
| 30,000 | BBB- | 3.375% due 2/15/30 | 31,387 | |||||||
| 1,050,000 | BBB- | 3.000% due 10/15/30 | 1,084,742 | |||||||
| CommonSpirit Health: | ||||||||||
| 30,000 | BBB+ | Secured Notes, 4.350% due 11/1/42 | 35,453 | |||||||
Senior Secured Notes: | ||||||||||
| 205,000 | BBB+ | 3.347% due 10/1/29 | 222,860 | |||||||
| 190,000 | BBB+ | 2.782% due 10/1/30 | 198,970 | |||||||
| 95,000 | BBB+ | 3.910% due 10/1/50 | 106,546 | |||||||
| 355,000 | BBB | Fresenius Medical Care US Finance III Inc., Company Guaranteed Notes, 1.875% due 12/1/26(a) | 358,597 | |||||||
| HCA Inc., Senior Secured Notes: | ||||||||||
| 598,000 | BBB- | 5.000% due 3/15/24 | 657,946 | |||||||
| 1,059,000 | BBB- | 5.250% due 4/15/25 | 1,209,420 | |||||||
| 152,000 | BBB- | 5.250% due 6/15/26 | 175,759 | |||||||
| 76,000 | BBB- | 4.500% due 2/15/27 | 86,197 | |||||||
| 1,429,000 | BBB- | 4.125% due 6/15/29 | 1,618,377 | |||||||
| 160,000 | BBB- | 5.500% due 6/15/47 | 211,551 | |||||||
| 295,000 | BBB- | 5.250% due 6/15/49 | 384,584 | |||||||
| Humana Inc., Senior Unsecured Notes: | ||||||||||
| 280,000 | BBB+ | 3.150% due 12/1/22 | 287,797 | |||||||
| 201,000 | BBB+ | 4.500% due 4/1/25 | 224,286 | |||||||
| 128,000 | BBB+ | 1.350% due 2/3/27 | 127,523 | |||||||
| 30,000 | BBB+ | 3.950% due 3/15/27 | 33,734 | |||||||
| 70,000 | BBB+ | 4.625% due 12/1/42 | 87,309 | |||||||
| 40,000 | BBB+ | 4.950% due 10/1/44 | 52,347 | |||||||
| 35,000 | BBB+ | 3.950% due 8/15/49 | 41,102 | |||||||
| 500,000 | AA- | Kaiser Foundation Hospitals, Company Guaranteed Notes, 3.150% due 5/1/27 | 549,331 | |||||||
| Molina Healthcare Inc., Senior Unsecured Notes: | ||||||||||
| 255,000 | BB- | 5.375% due 11/15/22 | 264,690 | |||||||
| 564,000 | BB- | 3.875% due 11/15/30(a) | 602,146 | |||||||
See Notes to Financial Statements.
178
| Schedules of Investments |
| (continued) |
| Core Fixed Income Fund | ||||||||||
| Face Amount/Units† | Rating†† | Security | Value | |||||||
Healthcare — Services — 0.9% — (continued) | ||||||||||
| UnitedHealth Group Inc., Senior Unsecured Notes: | ||||||||||
| $ | 20,000 | A+ | 2.375% due 10/15/22 | $ | 20,478 | |||||
| 60,000 | A+ | 3.500% due 6/15/23 | 63,397 | |||||||
| 70,000 | A+ | 3.750% due 7/15/25 | 77,777 | |||||||
| 60,000 | A+ | 1.250% due 1/15/26 | 60,803 | |||||||
| 50,000 | A+ | 3.875% due 12/15/28 | 57,766 | |||||||
| 50,000 | A+ | 2.000% due 5/15/30 | 50,813 | |||||||
| 305,000 | A+ | 4.750% due 7/15/45 | 406,941 | |||||||
| 223,000 | A+ | 3.750% due 10/15/47 | 261,115 | |||||||
| 40,000 | A+ | 4.250% due 6/15/48 | 50,506 | |||||||
| 30,000 | A+ | 4.450% due 12/15/48 | 39,053 | |||||||
| 100,000 | A+ | 3.700% due 8/15/49 | 116,431 | |||||||
| 120,000 | A+ | 3.875% due 8/15/59 | 145,318 | |||||||
| 20,000 | A+ | 3.125% due 5/15/60 | 21,060 | |||||||
|
| |||||||||
| Total Healthcare — Services | 11,635,924 | |||||||||
|
| |||||||||
Home Builders — 0.0% | ||||||||||
| DR Horton Inc., Company Guaranteed Notes: | ||||||||||
| 69,000 | BBB | 2.600% due 10/15/25 | 72,928 | |||||||
| 248,000 | BBB | 1.300% due 10/15/26 | 247,772 | |||||||
| 130,000 | BBB- | Lennar Corp., Company Guaranteed Notes, 4.750% due 11/29/27 | 151,459 | |||||||
| 10,000 | BBB- | MDC Holdings Inc., Company Guaranteed Notes, 6.000% due 1/15/43 | 12,899 | |||||||
| 50,000 | BB+ | Toll Brothers Finance Corp., Company Guaranteed Notes, 4.375% due 4/15/23 | 52,188 | |||||||
|
| |||||||||
| Total Home Builders | 537,246 | |||||||||
|
| |||||||||
Insurance — 0.5% | ||||||||||
| American International Group Inc., Senior Unsecured Notes: | ||||||||||
| 90,000 | BBB+ | 2.500% due 6/30/25 | 94,684 | |||||||
| 281,000 | BBB+ | 4.800% due 7/10/45 | 362,972 | |||||||
| Aon Corp., Company Guaranteed Notes: | ||||||||||
| 22,000 | A- | 4.500% due 12/15/28 | 25,788 | |||||||
| 407,000 | A- | 2.800% due 5/15/30 | 430,896 | |||||||
| 535,000 | A+ | Athene Global Funding, Senior Secured Notes, 0.750% (SOFR + 0.700%) due 5/24/24(a)(c) | 538,260 | |||||||
| Berkshire Hathaway Finance Corp., Company Guaranteed Notes: | ||||||||||
| 400,000 | AA | 4.400% due 5/15/42 | 506,203 | |||||||
| 350,000 | AA | 4.250% due 1/15/49 | 440,188 | |||||||
| 70,000 | A | Chubb INA Holdings Inc., Company Guaranteed Notes, 3.350% due 5/3/26 | 77,026 | |||||||
| 100,000 | BBB+ | Farmers Exchange Capital, Subordinated Notes, 7.200% due 7/15/48(a) | 146,061 | |||||||
| 900,000 | BBB+ | Farmers Exchange Capital II, Subordinated Notes, 6.151% (3-Month USD-LIBOR + 3.744%) due 11/1/53(a)(c) | 1,180,428 | |||||||
| 4,000 | BBB+ | Hartford Financial Services Group Inc. (The), Senior Unsecured Notes, 4.300% due 4/15/43 | 4,847 | |||||||
| Marsh & McLennan Cos., Inc., Senior Unsecured Notes: | ||||||||||
| 69,000 | A- | 4.375% due 3/15/29 | 81,194 | |||||||
| 268,000 | A- | 2.250% due 11/15/30 | 274,731 | |||||||
| 620,000 | BBB | MetLife Inc., Junior Subordinated Notes, 6.400% due 12/15/36 | 798,074 | |||||||
| 850,000 | A- | Nationwide Mutual Insurance Co., Subordinated Notes, 2.409% (3-Month USD-LIBOR + 2.290%) due 12/15/24(a)(c) | 851,072 | |||||||
| Teachers Insurance & Annuity Association of America, Subordinated Notes: | ||||||||||
| 24,000 | AA- | 6.850% due 12/16/39(a) | 36,904 | |||||||
| 348,000 | AA- | 4.900% due 9/15/44(a) | 458,824 | |||||||
| 85,000 | AA- | 4.270% due 5/15/47(a) | 104,854 | |||||||
| 595,000 | AA- | 3.300% due 5/15/50(a) | 640,419 | |||||||
| 67,000 | BBB | Willis North America Inc., Company Guaranteed Notes, 2.950% due 9/15/29 | 71,193 | |||||||
|
| |||||||||
| Total Insurance | 7,124,618 | |||||||||
|
| |||||||||
See Notes to Financial Statements.
179
| Schedules of Investments |
| (continued) |
| Core Fixed Income Fund | ||||||||||
| Face Amount/Units† | Rating†† | Security | Value | |||||||
Internet — 0.4% | ||||||||||
| Alphabet Inc., Senior Unsecured Notes: | ||||||||||
| $ | 40,000 | AA+ | 0.450% due 8/15/25 | $ | 39,646 | |||||
| 70,000 | AA+ | 0.800% due 8/15/27 | 68,494 | |||||||
| 80,000 | AA+ | 1.100% due 8/15/30 | 76,137 | |||||||
| 140,000 | AA+ | 2.050% due 8/15/50 | 127,062 | |||||||
| Amazon.com Inc., Senior Unsecured Notes: | ||||||||||
| 190,000 | AA | 0.800% due 6/3/25 | 190,507 | |||||||
| 240,000 | AA | 1.200% due 6/3/27 | 241,127 | |||||||
| 130,000 | AA | 3.150% due 8/22/27 | 143,959 | |||||||
| 120,000 | AA | 1.500% due 6/3/30 | 118,086 | |||||||
| 320,000 | AA | 2.100% due 5/12/31 | 328,843 | |||||||
| 80,000 | AA | 3.875% due 8/22/37 | 95,524 | |||||||
| 360,000 | AA | 2.875% due 5/12/41 | 377,666 | |||||||
| 160,000 | AA | 4.950% due 12/5/44 | 220,239 | |||||||
| 100,000 | AA | 4.050% due 8/22/47 | 123,705 | |||||||
| 200,000 | AA | 2.500% due 6/3/50 | 192,055 | |||||||
| 40,000 | AA | 4.250% due 8/22/57 | 52,171 | |||||||
| 69,000 | BBB- | Expedia Group Inc., Company Guaranteed Notes, 3.250% due 2/15/30 | 71,639 | |||||||
| Prosus NV, Senior Unsecured Notes: | ||||||||||
| 200,000 | BBB- | 3.680% due 1/21/30(a) | 208,445 | |||||||
| 940,000 | BBB- | 3.061% due 7/13/31(a) | 920,698 | |||||||
| Tencent Holdings Ltd., Senior Unsecured Notes: | ||||||||||
| 407,000 | A+ | 2.985% due 1/19/23(a) | 419,287 | |||||||
| 165,000 | A+ | 3.975% due 4/11/29(a) | 183,151 | |||||||
| 870,000 | A+ | 3.680% due 4/22/41(a) | 918,632 | |||||||
| 350,000 | A+ | 3.840% due 4/22/51(a) | 379,309 | |||||||
|
| |||||||||
| Total Internet | 5,496,382 | |||||||||
|
| |||||||||
Investment Companies — 0.1% | ||||||||||
| Ares Capital Corp., Senior Unsecured Notes: | ||||||||||
| 131,000 | BBB- | 4.250% due 3/1/25 | 141,361 | |||||||
| 119,000 | BBB- | 3.250% due 7/15/25 | 125,816 | |||||||
| 460,000 | BBB- | 2.150% due 7/15/26 | 463,648 | |||||||
|
| |||||||||
| Total Investment Companies | 730,825 | |||||||||
|
| |||||||||
Iron/Steel — 0.0% | ||||||||||
| 30,000 | BBB- | ArcelorMittal SA, Senior Unsecured Notes, 7.000% due 10/15/39 | 43,093 | |||||||
| 125,000 | BBB- | Vale Overseas Ltd., Company Guaranteed Notes, 6.875% due 11/21/36 | 175,481 | |||||||
|
| |||||||||
| Total Iron/Steel | 218,574 | |||||||||
|
| |||||||||
Leisure Time — 0.0% | ||||||||||
| 110,000 | B | VOC Escrow Ltd., Senior Secured Notes, 5.000% due 2/15/28(a) | 108,909 | |||||||
|
| |||||||||
Lodging — 0.1% | ||||||||||
| Las Vegas Sands Corp., Senior Unsecured Notes: | ||||||||||
| 270,000 | BBB- | 3.200% due 8/8/24 | 281,327 | |||||||
| 50,000 | BBB- | 2.900% due 6/25/25 | 51,673 | |||||||
| 97,000 | BBB- | Marriott International Inc., Senior Unsecured Notes, 4.625% due 6/15/30 | 111,599 | |||||||
| Sands China Ltd., Senior Unsecured Notes: | ||||||||||
| 400,000 | BBB- | 5.125% due 8/8/25 | 445,276 | |||||||
| 200,000 | BBB- | 3.800% due 1/8/26 | 212,592 | |||||||
|
| |||||||||
| Total Lodging | 1,102,467 | |||||||||
|
| |||||||||
Machinery — Diversified — 0.0% | ||||||||||
| Deere & Co., Senior Unsecured Notes: | ||||||||||
| 40,000 | A | 3.100% due 4/15/30 | 44,313 | |||||||
See Notes to Financial Statements.
180
| Schedules of Investments |
| (continued) |
| Core Fixed Income Fund | ||||||||||
| Face Amount/Units† | Rating†† | Security | Value | |||||||
Machinery — Diversified — 0.0% — (continued) | ||||||||||
| $ | 130,000 | A | 3.750% due 4/15/50 | $ | 159,035 | |||||
| 320,000 | BBB- | nVent Finance Sarl, Company Guaranteed Notes, 3.950% due 4/15/23 | 334,175 | |||||||
| 80,000 | BBB | Otis Worldwide Corp., Senior Unsecured Notes, 2.056% due 4/5/25 | 82,922 | |||||||
|
| |||||||||
| Total Machinery — Diversified | 620,445 | |||||||||
|
| |||||||||
Media — 1.1% | ||||||||||
| CCO Holdings LLC/CCO Holdings Capital Corp., Senior Unsecured Notes: | ||||||||||
| 130,000 | BB | 5.125% due 5/1/27(a) | 136,070 | |||||||
| 100,000 | BB | 4.500% due 5/1/32 | 104,633 | |||||||
| 700,000 | BB | 4.500% due 6/1/33(a) | 725,316 | |||||||
| Charter Communications Operating LLC/Charter Communications Operating Capital, Senior Secured Notes: | ||||||||||
| 300,000 | BBB- | 4.908% due 7/23/25 | 339,877 | |||||||
| 210,000 | BBB- | 3.750% due 2/15/28 | 232,536 | |||||||
| 260,000 | BBB- | 4.200% due 3/15/28 | 294,636 | |||||||
| 50,000 | BBB- | 5.375% due 4/1/38 | 61,922 | |||||||
| 756,000 | BBB- | 6.484% due 10/23/45 | 1,056,582 | |||||||
| 836,000 | BBB- | 5.750% due 4/1/48 | 1,076,507 | |||||||
| 330,000 | BBB- | 4.800% due 3/1/50 | 385,910 | |||||||
| 140,000 | BBB- | 4.400% due 12/1/61 | 153,357 | |||||||
| 160,000 | A- | Comcast Cable Communications Holdings Inc., Company Guaranteed Notes, 9.455% due 11/15/22 | 177,717 | |||||||
| Comcast Corp., Company Guaranteed Notes: | ||||||||||
| 10,000 | A- | 3.100% due 4/1/25 | 10,756 | |||||||
| 30,000 | A- | 3.950% due 10/15/25 | 33,484 | |||||||
| 80,000 | A- | 3.150% due 3/1/26 | 86,890 | |||||||
| 177,000 | A- | 3.300% due 4/1/27 | 194,923 | |||||||
| 1,077,000 | A- | 4.150% due 10/15/28 | 1,250,966 | |||||||
| 342,000 | A- | 2.650% due 2/1/30 | 360,371 | |||||||
| 556,000 | A- | 3.400% due 4/1/30 | 619,113 | |||||||
| 200,000 | A- | 4.250% due 10/15/30 | 236,272 | |||||||
| 56,000 | A- | 7.050% due 3/15/33 | 82,072 | |||||||
| 7,000 | A- | 6.500% due 11/15/35 | 10,221 | |||||||
| 50,000 | A- | 3.900% due 3/1/38 | 58,360 | |||||||
| 20,000 | A- | 3.250% due 11/1/39 | 21,782 | |||||||
| 20,000 | A- | 3.750% due 4/1/40 | 23,005 | |||||||
| 27,000 | A- | 4.750% due 3/1/44 | 34,666 | |||||||
| 111,000 | A- | 3.400% due 7/15/46 | 121,145 | |||||||
| 82,000 | A- | 4.000% due 8/15/47 | 97,157 | |||||||
| 272,000 | A- | 3.969% due 11/1/47 | 320,162 | |||||||
| 20,000 | A- | 4.000% due 3/1/48 | 23,553 | |||||||
| 23,000 | A- | 3.999% due 11/1/49 | 27,402 | |||||||
| 80,000 | A- | 3.450% due 2/1/50 | 88,110 | |||||||
| 520,000 | A- | 2.800% due 1/15/51 | 506,576 | |||||||
| 29,000 | A- | 2.887% due 11/1/51(a) | 28,875 | |||||||
| 21,000 | A- | 4.049% due 11/1/52 | 25,431 | |||||||
| 439,000 | A- | 2.937% due 11/1/56(a) | 433,644 | |||||||
| 95,000 | A- | 2.987% due 11/1/63(a) | 93,884 | |||||||
| Cox Communications Inc., Senior Unsecured Notes: | ||||||||||
| 82,000 | BBB | 3.150% due 8/15/24(a) | 87,222 | |||||||
| 70,000 | BBB | 3.850% due 2/1/25(a) | 76,255 | |||||||
| 3,000 | BBB | 3.350% due 9/15/26(a) | 3,268 | |||||||
| 97,000 | BBB | 3.600% due 6/15/51(a) | 102,730 | |||||||
| 600,000 | CCC | Diamond Sports Group LLC/Diamond Sports Finance Co., Senior Secured Notes, 5.375% due 8/15/26(a) | 398,670 | |||||||
See Notes to Financial Statements.
181
| Schedules of Investments |
| (continued) |
| Core Fixed Income Fund | ||||||||||
| Face Amount/Units† | Rating†† | Security | Value | |||||||
Media — 1.1% — (continued) | ||||||||||
| DISH DBS Corp., Company Guaranteed Notes: | ||||||||||
| $ | 140,000 | B- | 7.750% due 7/1/26 | $ | 160,538 | |||||
| 70,000 | B- | 5.125% due 6/1/29(a) | 69,738 | |||||||
| Fox Corp., Senior Unsecured Notes: | ||||||||||
| 200,000 | BBB | 4.030% due 1/25/24 | 215,597 | |||||||
| 240,000 | BBB | 5.476% due 1/25/39 | 311,685 | |||||||
| 425,000 | B+ | Sinclair Television Group Inc., Senior Secured Notes, 4.125% due 12/1/30(a) | 416,022 | |||||||
| Time Warner Cable LLC, Senior Secured Notes: | ||||||||||
| 230,000 | BBB- | 7.300% due 7/1/38 | 335,271 | |||||||
| 100,000 | BBB- | 5.875% due 11/15/40 | 128,906 | |||||||
| 490,000 | BBB- | 5.500% due 9/1/41 | 612,686 | |||||||
| 240,000 | BBB- | Time Warner Entertainment Co. LP, Senior Secured Notes, 8.375% due 7/15/33 | 357,836 | |||||||
| ViacomCBS Inc., Senior Unsecured Notes: | ||||||||||
| 10,000 | BBB | 3.875% due 4/1/24 | 10,716 | |||||||
| 255,000 | BBB | 4.200% due 5/19/32 | 294,821 | |||||||
| 141,000 | BBB | 4.375% due 3/15/43 | 165,081 | |||||||
| Virgin Media Secured Finance PLC, Senior Secured Notes: | ||||||||||
| 225,000 | BB- | 5.500% due 5/15/29(a) | 241,313 | |||||||
| 525,000 | BB- | 4.500% due 8/15/30(a) | 533,164 | |||||||
| Walt Disney Co. (The), Company Guaranteed Notes: | ||||||||||
| 25,000 | BBB+ | 6.200% due 12/15/34 | 35,576 | |||||||
| 30,000 | BBB+ | 6.650% due 11/15/37 | 45,788 | |||||||
|
| |||||||||
| Total Media | 14,136,766 | |||||||||
|
| |||||||||
Mining — 0.5% | ||||||||||
| Anglo American Capital PLC, Company Guaranteed Notes: | ||||||||||
| 350,000 | BBB | 3.625% due 9/11/24(a) | 377,720 | |||||||
| 617,000 | BBB | 4.750% due 4/10/27(a) | 712,820 | |||||||
| 200,000 | BBB | 4.000% due 9/11/27(a) | 223,599 | |||||||
| 212,000 | BBB | 2.250% due 3/17/28(a) | 215,038 | |||||||
| 40,000 | BBB | Barrick Gold Corp., Senior Unsecured Notes, 5.250% due 4/1/42 | 52,847 | |||||||
| Barrick North America Finance LLC, Company Guaranteed Notes: | ||||||||||
| 70,000 | BBB | 5.700% due 5/30/41 | 96,850 | |||||||
| 190,000 | BBB | 5.750% due 5/1/43 | 266,792 | |||||||
| 150,000 | A | BHP Billsiton Finance USA Ltd., Company Guaranteed Notes, 5.000% due 9/30/43 | 208,076 | |||||||
| Freeport-McMoRan Inc., Company Guaranteed Notes: | ||||||||||
| 10,000 | BB+ | 3.875% due 3/15/23 | 10,350 | |||||||
| 10,000 | BB+ | 4.550% due 11/14/24 | 10,837 | |||||||
| 70,000 | BB+ | 5.450% due 3/15/43 | 89,690 | |||||||
| Glencore Funding LLC, Company Guaranteed Notes: | ||||||||||
| 820,000 | BBB+ | 4.125% due 3/12/24(a) | 882,090 | |||||||
| 210,000 | BBB+ | 4.625% due 4/29/24(a) | 230,066 | |||||||
| 25,000 | BBB+ | 1.625% due 4/27/26(a) | 25,103 | |||||||
| 159,000 | BBB+ | 4.000% due 3/27/27(a) | 176,018 | |||||||
| 308,000 | BBB+ | 2.500% due 9/1/30(a) | 307,715 | |||||||
| 138,000 | BBB+ | 2.850% due 4/27/31(a) | 141,395 | |||||||
| Indonesia Asahan Aluminium Persero PT, Senior Unsecured Notes: | ||||||||||
| 200,000 | Baa2(b) | 4.750% due 5/15/25 | 218,272 | |||||||
| 200,000 | Baa2(b) | 6.530% due 11/15/28(a) | 245,867 | |||||||
| 860,000 | BBB+ | Southern Copper Corp., Senior Unsecured Notes, 5.250% due 11/8/42 | 1,106,936 | |||||||
| Teck Resources Ltd., Senior Unsecured Notes: | ||||||||||
| 200,000 | BBB- | 3.900% due 7/15/30 | 218,265 | |||||||
| 10,000 | BBB- | 6.000% due 8/15/40 | 12,921 | |||||||
| 90,000 | BB+ | Yamana Gold Inc., Company Guaranteed Notes, 4.625% due 12/15/27 | 100,893 | |||||||
|
| |||||||||
| Total Mining | 5,930,160 | |||||||||
|
| |||||||||
See Notes to Financial Statements.
182
| Schedules of Investments |
| (continued) |
| Core Fixed Income Fund | ||||||||||
| Face Amount/Units† | Rating†† | Security | Value | |||||||
Miscellaneous Manufacturers — 0.2% | ||||||||||
| 3M Co., Senior Unsecured Notes: | ||||||||||
| $ | 150,000 | A+ | 2.375% due 8/26/29 | $ | 158,152 | |||||
| 30,000 | A+ | 3.050% due 4/15/30 | 33,024 | |||||||
| 190,000 | A+ | 3.700% due 4/15/50 | 225,873 | |||||||
| 160,000 | A- | Eaton Corp., Company Guaranteed Notes, 4.150% due 11/2/42 | 193,286 | |||||||
| General Electric Co., Senior Unsecured Notes: | ||||||||||
| 30,000 | BBB+ | 3.450% due 5/1/27 | 33,113 | |||||||
| 70,000 | BBB+ | 3.625% due 5/1/30 | 78,789 | |||||||
| 610,000 | BBB+ | 6.750% due 3/15/32 | 847,331 | |||||||
| 1,025,000 | BBB+ | 0.605% (3-Month USD-LIBOR + 0.480%) due 8/15/36(c) | 891,826 | |||||||
| 95,000 | BBB+ | 6.875% due 1/10/39 | 143,873 | |||||||
| 156,000 | BBB+ | Parker-Hannifin Corp., Senior Unsecured Notes, 3.250% due 6/14/29 | 169,775 | |||||||
| Textron Inc., Senior Unsecured Notes: | ||||||||||
| 70,000 | BBB | 3.650% due 3/15/27 | 77,698 | |||||||
| 218,000 | BBB | 3.900% due 9/17/29 | 246,111 | |||||||
|
| |||||||||
| Total Miscellaneous Manufacturers | 3,098,851 | |||||||||
|
| |||||||||
Oil & Gas — 1.6% | ||||||||||
| Apache Corp., Senior Unsecured Notes: | ||||||||||
| 181,000 | BB+ | 3.250% due 4/15/22 | 182,830 | |||||||
| 220,000 | BB+ | 4.375% due 10/15/28 | 237,688 | |||||||
| 20,000 | BB+ | 5.250% due 2/1/42 | 22,143 | |||||||
| 30,000 | BB+ | 4.750% due 4/15/43 | 32,223 | |||||||
| 60,000 | BB+ | 4.250% due 1/15/44 | 61,011 | |||||||
| BP Capital Markets America Inc., Company Guaranteed Notes: | ||||||||||
| 230,000 | A- | 3.216% due 11/28/23 | 243,098 | |||||||
| 30,000 | A- | 3.790% due 2/6/24 | 32,186 | |||||||
| 300,000 | A- | 3.410% due 2/11/26 | 328,140 | |||||||
| 110,000 | A- | 3.633% due 4/6/30 | 124,377 | |||||||
| BP Capital Markets PLC, Company Guaranteed Notes: | ||||||||||
| 270,000 | A- | 3.814% due 2/10/24 | 291,148 | |||||||
| 30,000 | A- | 3.535% due 11/4/24 | 32,529 | |||||||
| 270,000 | A- | 3.506% due 3/17/25 | 293,915 | |||||||
| Chevron Corp., Senior Unsecured Notes: | ||||||||||
| 190,000 | AA- | 1.554% due 5/11/25 | 194,945 | |||||||
| 230,000 | AA- | 2.954% due 5/16/26 | 249,468 | |||||||
| 70,000 | AA- | 1.995% due 5/11/27 | 72,674 | |||||||
| Chevron USA Inc., Company Guaranteed Notes: | ||||||||||
| 240,000 | AA- | 3.850% due 1/15/28 | 272,843 | |||||||
| 110,000 | AA- | 5.250% due 11/15/43 | 151,552 | |||||||
| 81,000 | AA- | 5.050% due 11/15/44 | 109,694 | |||||||
| 30,000 | AA- | 4.950% due 8/15/47 | 41,243 | |||||||
| Cimarex Energy Co., Senior Unsecured Notes: | ||||||||||
| 470,000 | BBB- | 3.900% due 5/15/27 | 519,450 | |||||||
| 150,000 | BBB- | 4.375% due 3/15/29 | 170,705 | |||||||
| ConocoPhillips, Company Guaranteed Notes: | ||||||||||
| 80,000 | A- | 3.750% due 10/1/27(a) | 90,047 | |||||||
| 550,000 | A- | 4.300% due 8/15/28(a) | 637,811 | |||||||
| Continental Resources Inc., Company Guaranteed Notes: | ||||||||||
| 870,000 | BB+ | 3.800% due 6/1/24 | 929,812 | |||||||
| 30,000 | BB+ | 4.900% due 6/1/44 | 33,834 | |||||||
| Devon Energy Corp., Senior Unsecured Notes: | ||||||||||
| 708,000 | BBB- | 5.850% due 12/15/25 | 824,637 | |||||||
| 32,000 | BBB- | 5.250% due 10/15/27(a) | 34,053 | |||||||
See Notes to Financial Statements.
183
| Schedules of Investments |
| (continued) |
| Core Fixed Income Fund | ||||||||||
| Face Amount/Units† | Rating†† | Security | Value | |||||||
Oil & Gas — 1.6% — (continued) | ||||||||||
| $ | 20,000 | BBB- | 4.500% due 1/15/30(a) | $ | 21,843 | |||||
| 460,000 | BBB- | 5.600% due 7/15/41 | 574,922 | |||||||
| 10,000 | BBB- | 4.750% due 5/15/42 | 11,480 | |||||||
| 280,000 | BBB- | 5.000% due 6/15/45 | 331,561 | |||||||
| Diamondback Energy Inc., Company Guaranteed Notes: | ||||||||||
| 81,000 | BBB- | 3.250% due 12/1/26 | 86,843 | |||||||
| 484,000 | BBB- | 3.500% due 12/1/29 | 521,403 | |||||||
| 381,000 | BBB- | 3.125% due 3/24/31 | 397,127 | |||||||
| Ecopetrol SA, Senior Unsecured Notes: | ||||||||||
| 95,000 | BB+ | 4.125% due 1/16/25 | 99,482 | |||||||
| 760,000 | BB+ | 5.875% due 5/28/45 | 815,936 | |||||||
| 29,000 | BB- | Endeavor Energy Resources LP/EER Finance Inc., Senior Unsecured Notes, 5.750% due 1/30/28(a) | 30,559 | |||||||
| EOG Resources Inc., Senior Unsecured Notes: | ||||||||||
| 14,000 | A- | 3.150% due 4/1/25 | 15,029 | |||||||
| 10,000 | A- | 4.150% due 1/15/26 | 11,219 | |||||||
| 210,000 | A- | 4.375% due 4/15/30 | 248,374 | |||||||
| 260,000 | A- | 3.900% due 4/1/35 | 300,384 | |||||||
| 170,000 | A- | 4.950% due 4/15/50 | 228,961 | |||||||
| EQT Corp., Senior Unsecured Notes: | ||||||||||
| 20,000 | BB+ | 3.000% due 10/1/22 | 20,447 | |||||||
| 10,000 | BB+ | 6.625% due 2/1/25 | 11,475 | |||||||
| 70,000 | BB+ | 3.900% due 10/1/27 | 75,673 | |||||||
| 10,000 | BB+ | 5.000% due 1/15/29 | 11,387 | |||||||
| 80,000 | BB+ | 3.625% due 5/15/31(a) | 84,511 | |||||||
| Exxon Mobil Corp., Senior Unsecured Notes: | ||||||||||
| 20,000 | AA- | 1.571% due 4/15/23 | 20,410 | |||||||
| 430,000 | AA- | 2.992% due 3/19/25 | 460,266 | |||||||
| 380,000 | AA- | 3.043% due 3/1/26 | 412,280 | |||||||
| 180,000 | AA- | 3.482% due 3/19/30 | 202,670 | |||||||
| 70,000 | AA- | 4.114% due 3/1/46 | 83,734 | |||||||
| 110,000 | AA- | 4.327% due 3/19/50 | 137,637 | |||||||
| 100,000 | AA- | 3.452% due 4/15/51 | 110,706 | |||||||
| 200,000 | Baa2(b) | KazMunayGas National Co. JSC, Senior Unsecured Notes, 5.375% due 4/24/30 | 239,998 | |||||||
| 28,000 | BBB | Marathon Petroleum Corp., Senior Unsecured Notes, 6.500% due 3/1/41 | 38,995 | |||||||
| 30,000 | BB- | MEG Energy Corp., Company Guaranteed Notes, 5.875% due 2/1/29(a) | 30,714 | |||||||
| Occidental Petroleum Corp., Senior Unsecured Notes: | ||||||||||
| 200,000 | BB | 6.950% due 7/1/24 | 225,291 | |||||||
| 760,000 | BB | 5.550% due 3/15/26 | 848,350 | |||||||
| 90,000 | BB | 3.400% due 4/15/26 | 92,587 | |||||||
| 140,000 | BB | 7.500% due 5/1/31 | 183,375 | |||||||
| 75,000 | BB | 7.875% due 9/15/31 | 99,736 | |||||||
| 150,000 | BB | 4.500% due 7/15/44 | 153,207 | |||||||
| 90,000 | BB | 4.625% due 6/15/45 | 93,275 | |||||||
| 30,000 | BB | 4.100% due 2/15/47 | 29,373 | |||||||
| 560,000 | BB | 4.200% due 3/15/48 | 539,680 | |||||||
| 200,000 | Baa2(b) | Pertamina Persero PT, Senior Unsecured Notes, 3.100% due 8/27/30(a) | 209,296 | |||||||
| 360,000 | BB- | Petrobras Global Finance BV, Company Guaranteed Notes, 5.750% due 2/1/29 | 411,673 | |||||||
| Petroleos Mexicanos, Company Guaranteed Notes: | ||||||||||
| 199,000 | BBB | 6.625% due 6/15/35 | 193,026 | |||||||
| 1,170,000 | BBB | 6.750% due 9/21/47 | 1,034,865 | |||||||
| 185,000 | BBB | 7.690% due 1/23/50 | 177,972 | |||||||
| 170,000 | BBB | 6.950% due 1/28/60 | 150,248 | |||||||
| 200,000 | A- | Petronas Capital Ltd., Company Guaranteed Notes, 2.480% due 1/28/32(a) | 203,905 | |||||||
See Notes to Financial Statements.
184
| Schedules of Investments |
| (continued) |
| Core Fixed Income Fund | ||||||||||
| Face Amount/Units† | Rating†† | Security | Value | |||||||
Oil & Gas — 1.6% — (continued) | ||||||||||
| Pioneer Natural Resources Co., Senior Unsecured Notes: | ||||||||||
| $ | 30,000 | BBB | 1.125% due 1/15/26 | $ | 29,736 | |||||
| 250,000 | BBB | 2.150% due 1/15/31 | 245,108 | |||||||
| Qatar Petroleum, Senior Unsecured Notes: | ||||||||||
| 390,000 | AA- | 2.250% due 7/12/31(a) | 393,825 | |||||||
| 240,000 | AA- | 3.125% due 7/12/41(a) | 247,596 | |||||||
| 250,000 | AA- | 3.300% due 7/12/51(a) | 258,763 | |||||||
| Range Resources Corp., Company Guaranteed Notes: | ||||||||||
| 8,000 | B+ | 5.875% due 7/1/22 | 8,181 | |||||||
| 105,000 | B+ | 5.000% due 3/15/23 | 107,894 | |||||||
| 50,000 | B+ | 4.875% due 5/15/25 | 51,812 | |||||||
| Shell International Finance BV, Company Guaranteed Notes: | ||||||||||
| 260,000 | A+ | 2.875% due 5/10/26 | 280,975 | |||||||
| 300,000 | A+ | 3.875% due 11/13/28 | 344,924 | |||||||
| 60,000 | A+ | 2.750% due 4/6/30 | 64,229 | |||||||
| 90,000 | A+ | 4.550% due 8/12/43 | 114,108 | |||||||
| 220,000 | A+ | 4.375% due 5/11/45 | 274,206 | |||||||
| 40,000 | A+ | 4.000% due 5/10/46 | 47,841 | |||||||
| 480,000 | A+ | 3.250% due 4/6/50 | 519,270 | |||||||
| 400,000 | A+ | Sinopec Group Overseas Development 2014 Ltd., Company Guaranteed Notes, 4.375% due 4/10/24(a) | 436,492 | |||||||
| 20,000 | BB- | Southwestern Energy Co., Senior Unsecured Notes, 5.375% due 3/15/30 | 20,792 | |||||||
| Suncor Energy Inc., Senior Unsecured Notes: | ||||||||||
| 58,000 | BBB+ | 6.800% due 5/15/38 | 83,348 | |||||||
| 51,000 | BBB+ | 6.850% due 6/1/39 | 74,773 | |||||||
| 425,000 | BB- | Sunoco LP/Sunoco Finance Corp., Company Guaranteed Notes, 4.500% due 5/15/29 | 430,976 | |||||||
| 85,090 | B- | Transocean Pontus Ltd., Senior Secured Notes, 6.125% due 8/1/25(a) | 84,688 | |||||||
| 140,000 | B- | Transocean Poseidon Ltd., Senior Secured Notes, 6.875% due 2/1/27(a) | 135,625 | |||||||
|
| |||||||||
| Total Oil & Gas | 20,751,103 | |||||||||
|
| |||||||||
Oil & Gas Services — 0.0% | ||||||||||
| Halliburton Co., Senior Unsecured Notes: | ||||||||||
| 14,000 | BBB+ | 3.800% due 11/15/25 | 15,420 | |||||||
| 20,000 | BBB+ | 4.850% due 11/15/35 | 23,703 | |||||||
| 50,000 | BBB+ | 5.000% due 11/15/45 | 60,118 | |||||||
| Schlumberger Holdings Corp., Senior Unsecured Notes: | ||||||||||
| 90,000 | A | 4.000% due 12/21/25(a) | 100,011 | |||||||
| 171,000 | A | 3.900% due 5/17/28(a) | 191,353 | |||||||
| 20,900 | B- | Transocean Phoenix 2 Ltd., Senior Secured Notes, 7.750% due 10/15/24(a) | 21,240 | |||||||
| 68,750 | B- | Transocean Proteus Ltd., Senior Secured Notes, 6.250% due 12/1/24(a) | 67,805 | |||||||
|
| |||||||||
| Total Oil & Gas Services | 479,650 | |||||||||
|
| |||||||||
Packaging & Containers — 0.1% | ||||||||||
| 236,000 | BBB | Amcor Flexibles North America Inc., Company Guaranteed Notes, 2.690% due 5/25/31 | 246,229 | |||||||
| 130,000 | BB+ | Ball Corp., Company Guaranteed Notes, 4.000% due 11/15/23 | 137,638 | |||||||
| Berry Global Inc., Senior Secured Notes: | ||||||||||
| 530,000 | BBB- | 1.570% due 1/15/26(a) | 535,337 | |||||||
| 510,000 | BBB- | 4.875% due 7/15/26(a) | 538,458 | |||||||
| 24,000 | B+ | OI European Group BV, Company Guaranteed Notes, 4.000% due 3/15/23(a) | 24,865 | |||||||
| 20,000 | BBB | WestRock RKT LLC, Company Guaranteed Notes, 4.000% due 3/1/23 | 20,859 | |||||||
|
| |||||||||
| Total Packaging & Containers | 1,503,386 | |||||||||
|
| |||||||||
Pharmaceuticals — 1.8% | ||||||||||
| AbbVie Inc., Senior Unsecured Notes: | ||||||||||
| 100,000 | BBB+ | 3.450% due 3/15/22 | 101,174 | |||||||
| 680,000 | BBB+ | 2.300% due 11/21/22 | 695,649 | |||||||
See Notes to Financial Statements.
185
| Schedules of Investments |
| (continued) |
| Core Fixed Income Fund | ||||||||||
| Face Amount/Units† | Rating†† | Security | Value | |||||||
Pharmaceuticals — 1.8% — (continued) | ||||||||||
| $ | 30,000 | BBB+ | 3.750% due 11/14/23 | $ | 32,026 | |||||
| 730,000 | BBB+ | 2.600% due 11/21/24 | 769,436 | |||||||
| 260,000 | BBB+ | 3.800% due 3/15/25 | 283,662 | |||||||
| 100,000 | BBB+ | 3.600% due 5/14/25 | 108,748 | |||||||
| 150,000 | BBB+ | 2.950% due 11/21/26 | 161,741 | |||||||
| 880,000 | BBB+ | 3.200% due 11/21/29 | 962,264 | |||||||
| 171,000 | BBB+ | 4.550% due 3/15/35 | 208,692 | |||||||
| 396,000 | BBB+ | 4.500% due 5/14/35 | 481,804 | |||||||
| 546,000 | BBB+ | 4.300% due 5/14/36 | 651,309 | |||||||
| 175,000 | BBB+ | 4.050% due 11/21/39 | 205,673 | |||||||
| 7,000 | BBB+ | 4.625% due 10/1/42 | 8,690 | |||||||
| 489,000 | BBB+ | 4.400% due 11/6/42 | 595,392 | |||||||
| 150,000 | BBB+ | 4.750% due 3/15/45 | 190,116 | |||||||
| 230,000 | BBB+ | 4.250% due 11/21/49 | 279,018 | |||||||
| 255,000 | WR(b) | Allergan Funding SCS, Company Guaranteed Notes, 4.550% due 3/15/35 | 279,566 | |||||||
| 330,000 | A- | AstraZeneca PLC, Senior Unsecured Notes, 1.375% due 8/6/30 | 317,964 | |||||||
| Bayer US Finance II LLC, Company Guaranteed Notes: | ||||||||||
| 280,000 | BBB | 4.250% due 12/15/25(a) | 311,914 | |||||||
| 625,000 | BBB | 4.375% due 12/15/28(a) | 718,463 | |||||||
| 285,000 | BBB | 4.625% due 6/25/38(a) | 342,252 | |||||||
| 140,000 | BBB | 4.400% due 7/15/44(a) | 163,982 | |||||||
| 670,000 | BBB | 4.875% due 6/25/48(a) | 849,220 | |||||||
| Becton Dickinson & Co., Senior Unsecured Notes: | ||||||||||
| 377,000 | BBB | 3.363% due 6/6/24 | 402,688 | |||||||
| 17,000 | BBB | 3.734% due 12/15/24 | 18,462 | |||||||
| 47,000 | BBB | 4.685% due 12/15/44 | 59,853 | |||||||
| Bristol-Myers Squibb Co., Senior Unsecured Notes: | ||||||||||
| 190,000 | A+ | 2.600% due 5/16/22 | 193,279 | |||||||
| 60,000 | A+ | 3.550% due 8/15/22 | 61,921 | |||||||
| 326,000 | A+ | 2.900% due 7/26/24 | 347,504 | |||||||
| 137,000 | A+ | 3.875% due 8/15/25 | 151,894 | |||||||
| 240,000 | A+ | 3.200% due 6/15/26 | 263,727 | |||||||
| 130,000 | A+ | 3.400% due 7/26/29 | 146,157 | |||||||
| 46,000 | A+ | 5.000% due 8/15/45 | 63,408 | |||||||
| Cigna Corp.: | ||||||||||
Company Guaranteed Notes: | ||||||||||
| 216,000 | A- | 3.750% due 7/15/23 | 228,834 | |||||||
| 65,000 | A- | 3.500% due 6/15/24 | 69,640 | |||||||
| 624,000 | A- | 4.125% due 11/15/25 | 697,604 | |||||||
| 244,000 | A- | 3.400% due 3/1/27 | 269,003 | |||||||
| 720,000 | A- | 4.375% due 10/15/28 | 841,004 | |||||||
| 300,000 | A- | 4.800% due 8/15/38 | 376,068 | |||||||
Senior Unsecured Notes: | ||||||||||
| 210,000 | A- | 3.200% due 3/15/40 | 221,312 | |||||||
| 420,000 | A- | 3.400% due 3/15/51 | 449,184 | |||||||
| CVS Health Corp., Senior Unsecured Notes: | ||||||||||
| 340,000 | BBB | 2.750% due 12/1/22 | 348,266 | |||||||
| 28,000 | BBB | 3.700% due 3/9/23 | 29,314 | |||||||
| 116,000 | BBB | 3.875% due 7/20/25 | 127,771 | |||||||
| 180,000 | BBB | 3.000% due 8/15/26 | 194,446 | |||||||
| 207,000 | BBB | 3.625% due 4/1/27 | 229,934 | |||||||
| 162,000 | BBB | 4.300% due 3/25/28 | 186,732 | |||||||
| 620,000 | BBB | 3.750% due 4/1/30 | 699,147 | |||||||
| 140,000 | BBB | 2.125% due 9/15/31 | 139,640 | |||||||
| 500,000 | BBB | 4.875% due 7/20/35 | 616,646 | |||||||
See Notes to Financial Statements.
186
| Schedules of Investments |
| (continued) |
| Core Fixed Income Fund | ||||||||||
| Face Amount/Units† | Rating†† | Security | Value | |||||||
Pharmaceuticals — 1.8% — (continued) | ||||||||||
| $ | 440,000 | BBB | 4.780% due 3/25/38 | $ | 547,907 | |||||
| 50,000 | BBB | 4.125% due 4/1/40 | 58,203 | |||||||
| 350,000 | BBB | 5.125% due 7/20/45 | 462,207 | |||||||
| 1,375,000 | BBB | 5.050% due 3/25/48 | 1,820,914 | |||||||
| 30,000 | BBB | 4.250% due 4/1/50 | 36,565 | |||||||
| 134,754 | BBB | CVS Pass-Through Trust, Senior Secured Notes, 6.036% due 12/10/28 | 158,019 | |||||||
| 202,000 | CCC | Endo Dac/Endo Finance LLC/Endo Finco Inc., Company Guaranteed Notes, 6.000% due 6/30/28(a) | 126,528 | |||||||
| 88,000 | A- | Evernorth Health Inc., Company Guaranteed Notes, 4.500% due 2/25/26 | 98,941 | |||||||
| Johnson & Johnson, Senior Unsecured Notes: | ||||||||||
| 100,000 | AAA | 0.550% due 9/1/25 | 99,172 | |||||||
| 400,000 | AAA | 2.450% due 3/1/26 | 426,862 | |||||||
| 210,000 | AAA | 0.950% due 9/1/27 | 208,141 | |||||||
| 110,000 | AAA | 3.625% due 3/3/37 | 129,702 | |||||||
| 425,000 | BB | Organon & Co./Organon Foreign Debt Co.-Issuer BV, Senior Secured Notes, 4.125% due 4/30/28(a) | 439,004 | |||||||
| Pfizer Inc., Senior Unsecured Notes: | ||||||||||
| 230,000 | A+ | 0.800% due 5/28/25 | 230,449 | |||||||
| 160,000 | A+ | 2.625% due 4/1/30 | 172,177 | |||||||
| 140,000 | A+ | 1.700% due 5/28/30 | 140,316 | |||||||
| 259,000 | BBB+ | Shire Acquisitions Investments Ireland DAC, Company Guaranteed Notes, 3.200% due 9/23/26 | 281,351 | |||||||
| 407,000 | BBB+ | Takeda Pharmaceutical Co., Ltd., Senior Unsecured Notes, 2.050% due 3/31/30 | 405,594 | |||||||
| Teva Pharmaceutical Finance Co. BV, Company Guaranteed Notes: | ||||||||||
| 50,000 | BB- | 3.650% due 11/10/21 | 50,272 | |||||||
| 50,000 | BB- | 2.950% due 12/18/22 | 50,437 | |||||||
| Teva Pharmaceutical Finance Netherlands III BV, Company Guaranteed Notes: | ||||||||||
| 300,000 | BB- | 2.800% due 7/21/23 | 296,922 | |||||||
| 220,000 | BB- | 7.125% due 1/31/25 | 240,559 | |||||||
| 540,000 | BB- | 3.150% due 10/1/26 | 516,448 | |||||||
| 130,000 | A+ | Wyeth LLC, Company Guaranteed Notes, 5.950% due 4/1/37 | 186,320 | |||||||
|
| |||||||||
| Total Pharmaceuticals | 23,335,203 | |||||||||
|
| |||||||||
Pipelines — 1.5% | ||||||||||
| Cameron LNG LLC, Senior Secured Notes: | ||||||||||
| 50,000 | A | 2.902% due 7/15/31(a) | 53,890 | |||||||
| 533,000 | A | 3.302% due 1/15/35(a) | 579,237 | |||||||
| 323,000 | BBB- | Cheniere Corpus Christi Holdings LLC, Senior Secured Notes, 5.125% due 6/30/27 | 375,956 | |||||||
| 30,000 | BB | Cheniere Energy Partners LP, Company Guaranteed Notes, 4.000% due 3/1/31(a) | 31,613 | |||||||
| 40,000 | BB+ | DCP Midstream Operating LP, Company Guaranteed Notes, 6.450% due 11/3/36(a) | 48,569 | |||||||
| 38,000 | A | Eastern Gas Transmission & Storage Inc., Senior Unsecured Notes, 4.600% due 12/15/44(a) | 46,282 | |||||||
| Energy Transfer LP: | ||||||||||
| 140,000 | BB | Junior Subordinated Notes, 6.750% (5-Year CMT Index + 5.134%)(c)(d) | 141,757 | |||||||
Senior Unsecured Notes: | ||||||||||
| 230,000 | BBB- | 5.875% due 1/15/24 | 253,574 | |||||||
| 270,000 | BBB- | 4.500% due 4/15/24 | 293,339 | |||||||
| 625,000 | BBB- | 5.500% due 6/1/27 | 738,405 | |||||||
| 303,000 | BBB- | 4.000% due 10/1/27 | 337,030 | |||||||
| 33,000 | BBB- | 4.950% due 6/15/28 | 38,260 | |||||||
| 438,000 | BBB- | 5.250% due 4/15/29 | 516,517 | |||||||
| 380,000 | BBB- | 8.250% due 11/15/29 | 525,361 | |||||||
| 630,000 | BBB- | 3.750% due 5/15/30 | 684,816 | |||||||
| 200,000 | BBB- | 5.300% due 4/1/44 | 233,326 | |||||||
| 10,000 | BBB- | 5.350% due 5/15/45 | 11,839 | |||||||
| 300,000 | BBB- | 5.400% due 10/1/47 | 363,514 | |||||||
See Notes to Financial Statements.
187
| Schedules of Investments |
| (continued) |
| Core Fixed Income Fund | ||||||||||
| Face Amount/Units† | Rating†† | Security | Value | |||||||
Pipelines — 1.5% — (continued) | ||||||||||
| $ | 200,000 | BBB- | 6.000% due 6/15/48 | $ | 256,684 | |||||
| 10,000 | BBB- | 6.250% due 4/15/49 | 13,259 | |||||||
| 720,000 | BBB- | 5.000% due 5/15/50 | 844,974 | |||||||
| Enterprise Products Operating LLC, Company Guaranteed Notes: | ||||||||||
| 50,000 | BBB+ | 3.900% due 2/15/24 | 53,613 | |||||||
| 780,000 | BBB+ | 4.150% due 10/16/28 | 896,855 | |||||||
| 340,000 | BBB+ | 2.800% due 1/31/30 | 361,201 | |||||||
| 200,000 | BBB+ | 4.850% due 3/15/44 | 247,863 | |||||||
| 300,000 | BBB+ | 3.700% due 1/31/51 | 324,127 | |||||||
| 70,000 | BBB+ | 3.950% due 1/31/60 | 77,934 | |||||||
| 200,000 | Aa2(b) | Galaxy Pipeline Assets Bidco Ltd., Senior Secured Notes, 2.160% due 3/31/34(a) | 199,532 | |||||||
| 42,000 | BBB | Kinder Morgan Energy Partners LP, Company Guaranteed Notes, 6.950% due 1/15/38 | 60,165 | |||||||
| Kinder Morgan Inc., Company Guaranteed Notes: | ||||||||||
| 480,000 | BBB | 5.625% due 11/15/23(a) | 525,665 | |||||||
| 290,000 | BBB | 4.300% due 3/1/28 | 331,585 | |||||||
| 240,000 | BBB | 5.550% due 6/1/45 | 311,612 | |||||||
| 10,000 | BBB | 5.200% due 3/1/48 | 12,611 | |||||||
| 35,000 | BBB+ | Magellan Midstream Partners LP, Senior Unsecured Notes, 4.200% due 10/3/47 | 39,324 | |||||||
| MPLX LP, Senior Unsecured Notes: | ||||||||||
| 180,000 | BBB | 4.875% due 6/1/25 | 202,948 | |||||||
| 550,000 | BBB | 4.800% due 2/15/29 | 644,030 | |||||||
| 150,000 | BBB | 4.500% due 4/15/38 | 171,708 | |||||||
| 260,000 | BBB | 4.700% due 4/15/48 | 304,728 | |||||||
| 150,000 | BBB | 5.500% due 2/15/49 | 194,292 | |||||||
| NGPL PipeCo LLC, Senior Unsecured Notes: | ||||||||||
| 190,000 | BBB- | 4.875% due 8/15/27(a) | 217,587 | |||||||
| 277,000 | BBB- | 3.250% due 7/15/31(a) | 286,409 | |||||||
| Northern Natural Gas Co., Senior Unsecured Notes: | ||||||||||
| 94,000 | A | 4.300% due 1/15/49(a) | 112,956 | |||||||
| 50,000 | A | 3.400% due 10/16/51(a) | 52,400 | |||||||
| 426,000 | BBB | Northwest Pipeline LLC, Senior Unsecured Notes, 4.000% due 4/1/27 | 476,446 | |||||||
| Rockies Express Pipeline LLC, Senior Unsecured Notes: | ||||||||||
| 300,000 | BB+ | 4.950% due 7/15/29(a) | 312,496 | |||||||
| 280,000 | BB+ | 6.875% due 4/15/40(a) | 309,782 | |||||||
| 287,879 | CCC+ | Ruby Pipeline LLC, Senior Unsecured Notes, 8.000% due 4/1/22(a)(e) | 271,137 | |||||||
| Sabine Pass Liquefaction LLC, Senior Secured Notes: | ||||||||||
| 110,000 | BBB- | 5.625% due 3/1/25 | 125,421 | |||||||
| 135,000 | BBB- | 5.000% due 3/15/27 | 156,018 | |||||||
| 550,000 | BBB- | 4.200% due 3/15/28 | 618,337 | |||||||
| 258,000 | BBB+ | Southern Natural Gas Co. LLC, Senior Unsecured Notes, 8.000% due 3/1/32 | 371,372 | |||||||
| Targa Resources Partners LP/Targa Resources Partners Finance Corp.: | ||||||||||
Company Guaranteed Notes: | ||||||||||
| 20,000 | BB+ | 5.875% due 4/15/26 | 20,950 | |||||||
| 20,000 | BB+ | 5.375% due 2/1/27 | 20,700 | |||||||
| 50,000 | BB+ | 6.500% due 7/15/27 | 54,198 | |||||||
| 40,000 | BB+ | 5.000% due 1/15/28 | 42,082 | |||||||
| 20,000 | BB+ | 6.875% due 1/15/29 | 22,509 | |||||||
| 50,000 | BB+ | 5.500% due 3/1/30 | 55,188 | |||||||
| 40,000 | BB+ | 4.000% due 1/15/32(a) | 41,803 | |||||||
| 10,000 | BB+ | Senior Unsecured Notes, 4.875% due 2/1/31 | 10,891 | |||||||
| 560,000 | BBB | Tennessee Gas Pipeline Co. LLC, Company Guaranteed Notes, 2.900% due 3/1/30(a) | 583,686 | |||||||
| Texas Eastern Transmission LP, Senior Unsecured Notes: | ||||||||||
| 30,000 | BBB+ | 2.800% due 10/15/22(a) | 30,566 | |||||||
| 184,000 | BBB+ | 3.500% due 1/15/28(a) | 201,627 | |||||||
| 221,000 | BBB+ | 4.150% due 1/15/48(a) | 253,254 | |||||||
See Notes to Financial Statements.
188
| Schedules of Investments |
| (continued) |
| Core Fixed Income Fund | ||||||||||
| Face Amount/Units† | Rating†† | Security | Value | |||||||
Pipelines — 1.5% — (continued) | ||||||||||
| Transcontinental Gas Pipe Line Co. LLC, Senior Unsecured Notes: | ||||||||||
| $ | 1,178,000 | BBB | 7.850% due 2/1/26 | $ | 1,483,963 | |||||
| 650,000 | BBB | 4.000% due 3/15/28 | 736,162 | |||||||
| Western Midstream Operating LP, Senior Unsecured Notes: | ||||||||||
| 50,000 | BB+ | 2.229% (3-Month USD-LIBOR + 2.100%) due 1/13/23(c) | 49,885 | |||||||
| 140,000 | BB+ | 4.350% due 2/1/25 | 147,290 | |||||||
| 40,000 | BB+ | 4.500% due 3/1/28 | 43,154 | |||||||
| 430,000 | BB+ | 5.300% due 2/1/30 | 479,796 | |||||||
| 10,000 | BB+ | 5.500% due 8/15/48 | 11,474 | |||||||
| 90,000 | BB+ | 6.500% due 2/1/50 | 106,225 | |||||||
| Williams Cos., Inc. (The), Senior Unsecured Notes: | ||||||||||
| 50,000 | BBB | 7.500% due 1/15/31 | 69,951 | |||||||
| 260,000 | BBB | 7.750% due 6/15/31 | 366,444 | |||||||
| 116,000 | BBB | 8.750% due 3/15/32 | 179,898 | |||||||
|
| |||||||||
| Total Pipelines | 19,670,052 | |||||||||
|
| |||||||||
Real Estate Investment Trusts (REITs) — 0.7% | ||||||||||
| 103,000 | BBB+ | Alexandria Real Estate Equities Inc., Company Guaranteed Notes, 3.800% due 4/15/26 | 114,854 | |||||||
| American Tower Corp., Senior Unsecured Notes: | ||||||||||
| 197,000 | BBB- | 1.500% due 1/31/28 | 193,082 | |||||||
| 111,000 | BBB- | 3.950% due 3/15/29 | 124,775 | |||||||
| 134,000 | BBB- | 3.800% due 8/15/29 | 149,667 | |||||||
| 208,000 | BBB- | 2.100% due 6/15/30 | 205,942 | |||||||
| 271,000 | BBB- | CC Holdings GS V LLC/Crown Castle GS III Corp., Senior Secured Notes, 3.849% due 4/15/23 | 285,455 | |||||||
| Crown Castle International Corp., Senior Unsecured Notes: | ||||||||||
| 172,000 | BBB- | 3.700% due 6/15/26 | 189,528 | |||||||
| 120,000 | BBB- | 3.800% due 2/15/28 | 133,623 | |||||||
| 150,000 | BBB- | 3.100% due 11/15/29 | 160,271 | |||||||
| 297,000 | BBB- | 2.250% due 1/15/31 | 295,053 | |||||||
| 74,000 | BBB- | 4.150% due 7/1/50 | 86,097 | |||||||
| 400,000 | BBB- | CyrusOne LP/CyrusOne Finance Corp., Company Guaranteed Notes, 3.450% due 11/15/29 | 420,743 | |||||||
| Duke Realty LP, Senior Unsecured Notes: | ||||||||||
| 392,000 | BBB+ | 2.875% due 11/15/29 | 418,352 | |||||||
| 139,000 | BBB+ | 1.750% due 7/1/30 | 135,251 | |||||||
| Equinix Inc., Senior Unsecured Notes: | ||||||||||
| 427,000 | BBB | 2.000% due 5/15/28 | 433,475 | |||||||
| 118,000 | BBB | 3.200% due 11/18/29 | 127,083 | |||||||
| GLP Capital LP/GLP Financing II Inc., Company Guaranteed Notes: | ||||||||||
| 795,000 | BBB- | 5.250% due 6/1/25 | 892,272 | |||||||
| 490,000 | BBB- | 5.375% due 4/15/26 | 562,407 | |||||||
| 220,000 | BBB- | 5.300% due 1/15/29 | 258,627 | |||||||
| 467,000 | BBB- | 4.000% due 1/15/30 | 504,938 | |||||||
| 485,000 | BBB | Healthcare Realty Trust Inc., Senior Unsecured Notes, 3.625% due 1/15/28 | 536,022 | |||||||
| 350,000 | BBB | Healthcare Trust of America Holdings LP, Company Guaranteed Notes, 3.100% due 2/15/30 | 374,518 | |||||||
| 31,000 | BBB+ | Healthpeak Properties Inc., Senior Unsecured Notes, 3.400% due 2/1/25 | 33,275 | |||||||
| 350,000 | BBB | Life Storage LP, Company Guaranteed Notes, 3.875% due 12/15/27 | 394,967 | |||||||
| 160,000 | BB- | MGM Growth Properties Operating Partnership LP/MGP Finance Co.-Issuer Inc., Company Guaranteed Notes, 4.500% due 1/15/28 | 175,846 | |||||||
| National Retail Properties Inc., Senior Unsecured Notes: | ||||||||||
| 164,000 | BBB+ | 3.100% due 4/15/50 | 163,186 | |||||||
| 150,000 | BBB+ | 3.500% due 4/15/51 | 159,739 | |||||||
| 67,000 | A- | Prologis LP, Senior Unsecured Notes, 3.000% due 4/15/50 | 70,190 | |||||||
| 144,000 | A- | Realty Income Corp., Senior Unsecured Notes, 3.250% due 1/15/31 | 159,200 | |||||||
| 69,000 | BB- | SBA Communications Corp., Senior Unsecured Notes, 4.875% due 9/1/24 | 70,121 | |||||||
See Notes to Financial Statements.
189
| Schedules of Investments |
| (continued) |
| Core Fixed Income Fund | ||||||||||
| Face Amount/Units† | Rating†† | Security | Value | |||||||
Real Estate Investment Trusts (REITs) — 0.7% — (continued) | ||||||||||
| $ | 800,000 | BBB- | SL Green Operating Partnership LP, Company Guaranteed Notes, 3.250% due 10/15/22 | $ | 822,110 | |||||
| 400,000 | BBB+ | Ventas Realty LP, Company Guaranteed Notes, 3.750% due 5/1/24 | 427,993 | |||||||
|
| |||||||||
| Total Real Estate Investment Trusts (REITs) | 9,078,662 | |||||||||
|
| |||||||||
Retail — 0.4% | ||||||||||
| Alimentation Couche-Tard Inc., Company Guaranteed Notes: | ||||||||||
| 250,000 | BBB | 3.550% due 7/26/27(a) | 276,760 | |||||||
| 76,000 | BBB | 3.439% due 5/13/41(a) | 79,962 | |||||||
| Costco Wholesale Corp., Senior Unsecured Notes: | ||||||||||
| 260,000 | A+ | 1.375% due 6/20/27 | 263,082 | |||||||
| 160,000 | A+ | 1.600% due 4/20/30 | 158,988 | |||||||
| Home Depot Inc. (The), Senior Unsecured Notes: | ||||||||||
| 210,000 | A | 2.500% due 4/15/27 | 224,379 | |||||||
| 70,000 | A | 3.300% due 4/15/40 | 77,607 | |||||||
| 25,000 | A | 4.200% due 4/1/43 | 30,931 | |||||||
| 20,000 | A | 3.900% due 6/15/47 | 24,078 | |||||||
| 210,000 | A | 3.350% due 4/15/50 | 234,059 | |||||||
| Lowe’s Cos., Inc., Senior Unsecured Notes: | ||||||||||
| 251,000 | BBB+ | 3.650% due 4/5/29 | 282,038 | |||||||
| 70,000 | BBB+ | 4.500% due 4/15/30 | 83,181 | |||||||
| McDonald’s Corp., Senior Unsecured Notes: | ||||||||||
| 40,000 | BBB+ | 3.300% due 7/1/25 | 43,392 | |||||||
| 30,000 | BBB+ | 1.450% due 9/1/25 | 30,567 | |||||||
| 140,000 | BBB+ | 3.700% due 1/30/26 | 155,017 | |||||||
| 30,000 | BBB+ | 3.500% due 3/1/27 | 33,205 | |||||||
| 60,000 | BBB+ | 3.500% due 7/1/27 | 66,659 | |||||||
| 340,000 | BBB+ | 3.800% due 4/1/28 | 384,993 | |||||||
| 190,000 | BBB+ | 2.125% due 3/1/30 | 193,525 | |||||||
| 100,000 | BBB+ | 3.600% due 7/1/30 | 113,076 | |||||||
| 155,000 | BBB+ | 4.875% due 12/9/45 | 204,483 | |||||||
| 20,000 | BBB+ | 3.625% due 9/1/49 | 22,486 | |||||||
| 400,000 | BBB+ | 4.200% due 4/1/50 | 491,189 | |||||||
| 360,000 | B | Michaels Cos., Inc (The), Senior Secured Notes, 5.250% due 5/1/28(a) | 369,900 | |||||||
| 280,000 | BBB+ | Starbucks Corp., Senior Unsecured Notes, 2.250% due 3/12/30 | 286,240 | |||||||
| 120,000 | A | Target Corp., Senior Unsecured Notes, 2.250% due 4/15/25 | 126,198 | |||||||
| Walmart Inc., Senior Unsecured Notes: | ||||||||||
| 50,000 | AA | 3.550% due 6/26/25 | 55,078 | |||||||
| 100,000 | AA | 3.050% due 7/8/26 | 109,559 | |||||||
| 290,000 | AA | 3.700% due 6/26/28 | 331,427 | |||||||
|
| |||||||||
| Total Retail | 4,752,059 | |||||||||
|
| |||||||||
Savings & Loans — 0.1% | ||||||||||
| Nationwide Building Society, Senior Unsecured Notes: | ||||||||||
| 900,000 | BBB+ | 3.766% (3-Month USD-LIBOR + 1.064%) due 3/8/24(a)(c) | 941,293 | |||||||
| 500,000 | BBB+ | 4.363% (3-Month USD-LIBOR + 1.392%) due 8/1/24(a)(c) | 533,631 | |||||||
|
| |||||||||
| Total Savings & Loans | 1,474,924 | |||||||||
|
| |||||||||
Semiconductors — 0.6% | ||||||||||
| 32,000 | A | Applied Materials Inc., Senior Unsecured Notes, 4.350% due 4/1/47 | 41,100 | |||||||
| 245,000 | BBB- | Broadcom Corp./Broadcom Cayman Finance Ltd., Company Guaranteed Notes, 3.875% due 1/15/27 | 270,540 | |||||||
| Broadcom Inc.: | ||||||||||
Company Guaranteed Notes: | ||||||||||
| 85,000 | BBB- | 3.625% due 10/15/24 | 91,970 | |||||||
| 370,000 | BBB- | 4.700% due 4/15/25 | 414,151 | |||||||
| 280,000 | BBB- | 3.150% due 11/15/25 | 300,051 | |||||||
See Notes to Financial Statements.
190
| Schedules of Investments |
| (continued) |
| Core Fixed Income Fund | ||||||||||
| Face Amount/Units† | Rating†† | Security | Value | |||||||
Semiconductors — 0.6% — (continued) | ||||||||||
| $ | 469,000 | BBB- | 4.750% due 4/15/29 | $ | 545,281 | |||||
| 689,000 | BBB- | 5.000% due 4/15/30 | 817,022 | |||||||
| 264,000 | BBB- | 4.150% due 11/15/30 | 297,293 | |||||||
| 98,000 | BBB- | 2.450% due 2/15/31(a) | 97,075 | |||||||
| Intel Corp., Senior Unsecured Notes: | ||||||||||
| 70,000 | A+ | 3.700% due 7/29/25 | 77,163 | |||||||
| 90,000 | A+ | 1.600% due 8/12/28 | 90,594 | |||||||
| 54,000 | A+ | 3.734% due 12/8/47 | 61,877 | |||||||
| 140,000 | A+ | 4.750% due 3/25/50 | 187,204 | |||||||
| 569,000 | A+ | 3.050% due 8/12/51 | 584,517 | |||||||
| 168,000 | A+ | 3.200% due 8/12/61 | 173,828 | |||||||
| KLA Corp., Senior Unsecured Notes: | ||||||||||
| 383,000 | BBB+ | 4.100% due 3/15/29 | 441,508 | |||||||
| 159,000 | BBB+ | 3.300% due 3/1/50 | 173,741 | |||||||
| Lam Research Corp., Senior Unsecured Notes: | ||||||||||
| 38,000 | A- | 3.750% due 3/15/26 | 42,495 | |||||||
| 49,000 | A- | 4.875% due 3/15/49 | 67,754 | |||||||
| 125,000 | A- | 2.875% due 6/15/50 | 128,772 | |||||||
| 150,000 | BBB- | Micron Technology Inc., Senior Unsecured Notes, 2.497% due 4/24/23 | 154,843 | |||||||
| NVIDIA Corp., Senior Unsecured Notes: | ||||||||||
| 320,000 | A- | 1.550% due 6/15/28 | 321,794 | |||||||
| 120,000 | A- | 3.500% due 4/1/40 | 136,684 | |||||||
| 440,000 | A- | 3.500% due 4/1/50 | 505,546 | |||||||
| 160,000 | A- | 3.700% due 4/1/60 | 191,098 | |||||||
| NXP BV/NXP Funding LLC/NXP USA Inc., Company Guaranteed Notes: | ||||||||||
| 90,000 | BBB | 2.700% due 5/1/25(a) | 94,736 | |||||||
| 107,000 | BBB | 3.150% due 5/1/27(a) | 115,060 | |||||||
| 859,000 | BBB | 4.300% due 6/18/29(a) | 987,804 | |||||||
| 218,000 | BBB | 2.500% due 5/11/31(a) | 225,413 | |||||||
| QUALCOMM Inc., Senior Unsecured Notes: | ||||||||||
| 30,000 | A- | 4.650% due 5/20/35 | 38,137 | |||||||
| 137,000 | A- | 4.300% due 5/20/47 | 174,452 | |||||||
| 90,000 | A+ | Texas Instruments Inc., Senior Unsecured Notes, 1.750% due 5/4/30 | 90,103 | |||||||
|
| |||||||||
| Total Semiconductors | 7,939,606 | |||||||||
|
| |||||||||
Shipbuilding — 0.0% | ||||||||||
| Huntington Ingalls Industries Inc., Company Guaranteed Notes: | ||||||||||
| 185,000 | BBB- | 3.483% due 12/1/27 | 201,634 | |||||||
| 223,000 | BBB- | 2.043% due 8/16/28(a) | 223,313 | |||||||
|
| |||||||||
| Total Shipbuilding | 424,947 | |||||||||
|
| |||||||||
Software — 0.9% | ||||||||||
| Activision Blizzard Inc., Senior Unsecured Notes: | ||||||||||
| 189,000 | A- | 3.400% due 9/15/26 | 208,230 | |||||||
| 144,000 | A- | 2.500% due 9/15/50 | 128,620 | |||||||
| Autodesk Inc., Senior Unsecured Notes: | ||||||||||
| 59,000 | BBB | 4.375% due 6/15/25 | 65,764 | |||||||
| 190,000 | BBB | 2.850% due 1/15/30 | 202,241 | |||||||
| 232,000 | BBB | Citrix Systems Inc., Senior Unsecured Notes, 3.300% due 3/1/30 | 244,958 | |||||||
| 476,000 | BBB+ | Electronic Arts Inc., Senior Unsecured Notes, 1.850% due 2/15/31 | 467,768 | |||||||
| 142,000 | BBB | Fidelity National Information Services Inc., Senior Unsecured Notes, 3.100% due 3/1/41 | 147,946 | |||||||
| 774,000 | BBB | Fiserv Inc., Senior Unsecured Notes, 3.500% due 7/1/29 | 851,316 | |||||||
| Microsoft Corp., Senior Unsecured Notes: | ||||||||||
| 270,000 | AAA | 2.875% due 2/6/24 | 285,016 | |||||||
| 70,000 | AAA | 2.700% due 2/12/25 | 74,694 | |||||||
| 1,030,000 | AAA | 2.400% due 8/8/26 | 1,101,728 | |||||||
See Notes to Financial Statements.
191
| Schedules of Investments |
| (continued) |
| Core Fixed Income Fund | ||||||||||
| Face Amount/Units† | Rating†† | Security | Value | |||||||
Software — 0.9% — (continued) | ||||||||||
| $ | 670,000 | AAA | 3.300% due 2/6/27 | $ | 747,303 | |||||
| 98,000 | AAA | 4.200% due 11/3/35 | 123,272 | |||||||
| 5,000 | AAA | 3.450% due 8/8/36 | 5,859 | |||||||
| 7,000 | AAA | 2.525% due 6/1/50 | 6,983 | |||||||
| 18,000 | AAA | 2.921% due 3/17/52 | 19,334 | |||||||
| 8,000 | AAA | 2.675% due 6/1/60 | 8,074 | |||||||
| 42,000 | AAA | 3.041% due 3/17/62 | 45,582 | |||||||
| Oracle Corp., Senior Unsecured Notes: | ||||||||||
| 570,000 | BBB+ | 1.650% due 3/25/26 | 580,279 | |||||||
| 762,000 | BBB+ | 2.800% due 4/1/27 | 813,499 | |||||||
| 235,000 | BBB+ | 3.250% due 11/15/27 | 256,477 | |||||||
| 520,000 | BBB+ | 2.300% due 3/25/28 | 537,115 | |||||||
| 855,000 | BBB+ | 2.875% due 3/25/31 | 901,621 | |||||||
| 411,000 | BBB+ | 4.300% due 7/8/34 | 478,460 | |||||||
| 506,000 | BBB+ | 3.900% due 5/15/35 | 570,716 | |||||||
| 267,000 | BBB+ | 3.850% due 7/15/36 | 296,551 | |||||||
| 444,000 | BBB+ | 3.800% due 11/15/37 | 486,583 | |||||||
| 214,000 | BBB+ | 3.600% due 4/1/40 | 227,367 | |||||||
| 322,000 | BBB+ | 5.375% due 7/15/40 | 417,436 | |||||||
| 570,000 | BBB+ | 3.650% due 3/25/41 | 611,509 | |||||||
| salesforce.com Inc., Senior Unsecured Notes: | ||||||||||
| 130,000 | A+ | 3.250% due 4/11/23 | 135,892 | |||||||
| 450,000 | A+ | 3.700% due 4/11/28 | 512,311 | |||||||
| 50,000 | A+ | 3.050% due 7/15/61 | 52,085 | |||||||
| VMware Inc., Senior Unsecured Notes: | ||||||||||
| 135,000 | BBB- | 1.800% due 8/15/28 | 133,954 | |||||||
| 162,000 | BBB- | 4.700% due 5/15/30 | 193,794 | |||||||
| 43,000 | BBB- | 2.200% due 8/15/31 | 42,760 | |||||||
|
| |||||||||
| Total Software | 11,983,097 | |||||||||
|
| |||||||||
Telecommunications — 2.7% | ||||||||||
| AT&T Inc., Senior Unsecured Notes: | ||||||||||
| 1,000,000 | BBB | zero coupon, due 11/27/22(a) | 994,173 | |||||||
| 20,000 | BBB | 4.250% due 3/1/27 | 22,803 | |||||||
| 472,000 | BBB | 2.300% due 6/1/27 | 492,020 | |||||||
| 170,000 | BBB | 1.650% due 2/1/28 | 170,052 | |||||||
| 306,000 | BBB | 4.100% due 2/15/28 | 349,501 | |||||||
| 184,000 | BBB | 4.350% due 3/1/29 | 213,559 | |||||||
| 439,000 | BBB | 4.300% due 2/15/30 | 510,083 | |||||||
| 1,660,000 | BBB | 2.550% due 12/1/33(a) | 1,670,376 | |||||||
| 501,000 | BBB | 4.500% due 5/15/35 | 595,023 | |||||||
| 47,000 | BBB | 5.250% due 3/1/37 | 59,499 | |||||||
| 30,000 | BBB | 4.900% due 6/15/42 | 37,545 | |||||||
| 70,000 | BBB | 3.100% due 2/1/43 | 69,387 | |||||||
| 144,000 | BBB | 4.650% due 6/1/44 | 173,011 | |||||||
| 73,000 | BBB | 4.350% due 6/15/45 | 84,625 | |||||||
| 820,000 | BBB | 4.750% due 5/15/46 | 1,000,559 | |||||||
| 238,000 | BBB | 4.500% due 3/9/48 | 282,067 | |||||||
| 215,000 | BBB | 5.150% due 2/15/50 | 278,805 | |||||||
| 167,000 | BBB | 3.650% due 6/1/51 | 176,279 | |||||||
| 503,000 | BBB | 3.550% due 9/15/55(a) | 515,067 | |||||||
| 1,030,000 | BBB | 3.800% due 12/1/57(a) | 1,096,460 | |||||||
| 45,000 | BBB | 3.650% due 9/15/59(a) | 46,317 | |||||||
| 50,000 | BBB | 3.850% due 6/1/60 | 53,370 | |||||||
| 305,000 | BBB | 3.500% due 2/1/61 | 303,169 | |||||||
See Notes to Financial Statements.
192
| Schedules of Investments |
| (continued) |
| Core Fixed Income Fund | ||||||||||
| Face Amount/Units† | Rating†† | Security | Value | |||||||
Telecommunications — 2.7% — (continued) | ||||||||||
| $ | 25,000 | BBB+ | Corning Inc., Senior Unsecured Notes, 4.375% due 11/15/57 | $ | 30,653 | |||||
| 160,000 | B+ | Frontier Communications Holdings LLC, Senior Secured Notes, 5.000% due 5/1/28(a) | 167,400 | |||||||
| Intelsat Jackson Holdings SA, Company Guaranteed Notes: | ||||||||||
| 400,000 | WR(b) | 5.500% due 8/1/23(f) | 211,500 | |||||||
| 184,000 | WR(b) | 8.500% due 10/15/24(a)(f) | 99,590 | |||||||
| 605,000 | WR(b) | 9.750% due 7/15/25(a)(f) | 327,456 | |||||||
| Level 3 Financing Inc., Senior Secured Notes: | ||||||||||
| 586,000 | BBB- | 3.400% due 3/1/27(a) | 618,435 | |||||||
| 595,000 | BBB- | 3.875% due 11/15/29(a) | 639,687 | |||||||
| 430,000 | BB- | Lumen Technologies Inc., Senior Unsecured Notes, 5.375% due 6/15/29(a) | 442,358 | |||||||
| Motorola Solutions Inc., Senior Unsecured Notes: | ||||||||||
| 186,000 | BBB- | 4.600% due 2/23/28 | 216,460 | |||||||
| 341,000 | BBB- | 4.600% due 5/23/29 | 400,132 | |||||||
| 253,000 | BBB- | 2.300% due 11/15/30 | 251,994 | |||||||
| 172,000 | BBB- | 2.750% due 5/24/31 | 177,342 | |||||||
| 150,000 | BBB- | Qwest Corp., Senior Unsecured Notes, 7.250% due 9/15/25 | 177,817 | |||||||
| 34,000 | BB+ | Sprint Corp., Company Guaranteed Notes, 7.875% due 9/15/23 | 38,563 | |||||||
| Sprint Spectrum Co. LLC/Sprint Spectrum Co. II LLC/Sprint Spectrum Co. III LLC, Senior Secured Notes: | ||||||||||
| 1,317,188 | A2(b) | 4.738% due 3/20/25(a) | 1,408,995 | |||||||
| 1,000,000 | A2(b) | 5.152% due 3/20/28(a) | 1,152,900 | |||||||
| 330,000 | BBB- | Telefonica Emisiones SA, Company Guaranteed Notes, 4.103% due 3/8/27 | 372,745 | |||||||
| T-Mobile USA Inc.: | ||||||||||
Company Guaranteed Notes: | ||||||||||
| 740,000 | BB+ | 2.250% due 2/15/26 | 756,650 | |||||||
| 192,000 | BB+ | 4.750% due 2/1/28 | 205,123 | |||||||
| 110,000 | BB+ | 2.625% due 2/15/29 | 111,513 | |||||||
| 80,000 | BB+ | 2.875% due 2/15/31 | 82,300 | |||||||
| 1,000,000 | BB+ | 3.500% due 4/15/31 | 1,064,490 | |||||||
Senior Secured Notes: | ||||||||||
| 360,000 | BBB- | 3.500% due 4/15/25 | 389,016 | |||||||
| 2,029,000 | BBB- | 3.750% due 4/15/27 | 2,248,629 | |||||||
| 30,000 | BBB- | 2.050% due 2/15/28 | 30,582 | |||||||
| 525,000 | BBB- | 3.875% due 4/15/30 | 588,184 | |||||||
| 1,165,000 | BBB- | 2.550% due 2/15/31 | 1,189,721 | |||||||
| 290,000 | BBB- | 2.250% due 11/15/31 | 288,968 | |||||||
| 450,000 | BBB- | 4.375% due 4/15/40 | 527,335 | |||||||
| 60,000 | BBB- | 3.000% due 2/15/41 | 59,675 | |||||||
| 10,000 | BBB- | 3.300% due 2/15/51 | 10,041 | |||||||
| Verizon Communications Inc., Senior Unsecured Notes: | ||||||||||
| 80,000 | BBB+ | 3.500% due 11/1/24 | 86,493 | |||||||
| 100,000 | BBB+ | 3.376% due 2/15/25 | 108,353 | |||||||
| 40,000 | BBB+ | 0.850% due 11/20/25 | 39,727 | |||||||
| 90,000 | BBB+ | 1.450% due 3/20/26 | 91,246 | |||||||
| 220,000 | BBB+ | 2.625% due 8/15/26 | 234,384 | |||||||
| 223,000 | BBB+ | 4.125% due 3/16/27 | 254,982 | |||||||
| 129,000 | BBB+ | 3.000% due 3/22/27 | 139,603 | |||||||
| 360,000 | BBB+ | 2.100% due 3/22/28 | 369,416 | |||||||
| 986,000 | BBB+ | 4.329% due 9/21/28 | 1,152,558 | |||||||
| 320,000 | BBB+ | 3.875% due 2/8/29 | 365,022 | |||||||
| 1,495,000 | BBB+ | 3.150% due 3/22/30 | 1,622,839 | |||||||
| 138,000 | BBB+ | 1.680% due 10/30/30 | 133,429 | |||||||
| 140,000 | BBB+ | 1.750% due 1/20/31 | 135,757 | |||||||
| 1,225,000 | BBB+ | 2.550% due 3/21/31 | 1,266,901 | |||||||
| 630,000 | BBB+ | 4.500% due 8/10/33 | 763,550 | |||||||
See Notes to Financial Statements.
193
| Schedules of Investments |
| (continued) |
| Core Fixed Income Fund | ||||||||||
| Face Amount/Units† | Rating†† | Security | Value | |||||||
Telecommunications — 2.7% — (continued) | ||||||||||
| $ | 140,000 | BBB+ | 4.400% due 11/1/34 | $ | 168,809 | |||||
| 71,000 | BBB+ | 5.850% due 9/15/35 | 98,005 | |||||||
| 48,000 | BBB+ | 4.272% due 1/15/36 | 57,486 | |||||||
| 150,000 | BBB+ | 5.250% due 3/16/37 | 198,805 | |||||||
| 466,000 | BBB+ | 2.650% due 11/20/40 | 452,161 | |||||||
| 100,000 | BBB+ | 4.125% due 8/15/46 | 117,495 | |||||||
| 291,000 | BBB+ | 4.862% due 8/21/46 | 379,179 | |||||||
| 53,000 | BBB+ | 5.500% due 3/16/47 | 75,295 | |||||||
| 150,000 | BBB+ | 4.522% due 9/15/48 | 188,599 | |||||||
| 50,000 | BBB+ | 4.000% due 3/22/50 | 58,034 | |||||||
| 430,000 | BBB+ | 2.875% due 11/20/50 | 413,113 | |||||||
| 114,000 | BBB+ | 2.987% due 10/30/56 | 110,452 | |||||||
| 450,000 | BB- | Vmed O2 UK Financing I PLC, Senior Secured Notes, 4.250% due 1/31/31(a) | 452,831 | |||||||
| Vodafone Group PLC, Senior Unsecured Notes: | ||||||||||
| 155,000 | BBB | 4.125% due 5/30/25 | 172,604 | |||||||
| 190,000 | BBB | 4.375% due 5/30/28 | 221,276 | |||||||
| 116,000 | BBB | 5.250% due 5/30/48 | 155,013 | |||||||
| 1,035,000 | BBB | 4.875% due 6/19/49 | 1,332,369 | |||||||
|
| |||||||||
| Total Telecommunications | 34,895,790 | |||||||||
|
| |||||||||
Toys/Games/Hobbies — 0.0% | ||||||||||
| 44,000 | BBB- | Hasbro Inc., Senior Unsecured Notes, 2.600% due 11/19/22 | 45,135 | |||||||
|
| |||||||||
Transportation — 0.4% | ||||||||||
| 216,000 | AA- | Burlington Northern Santa Fe LLC, Senior Unsecured Notes, 4.150% due 12/15/48 | 269,099 | |||||||
| CSX Corp., Senior Unsecured Notes: | ||||||||||
| 82,000 | BBB+ | 2.600% due 11/1/26 | 87,456 | |||||||
| 114,000 | BBB+ | 3.250% due 6/1/27 | 124,782 | |||||||
| 56,000 | BBB+ | 4.100% due 3/15/44 | 66,460 | |||||||
| 31,000 | BBB+ | 3.350% due 9/15/49 | 33,438 | |||||||
| 60,000 | BBB+ | 2.500% due 5/15/51 | 55,424 | |||||||
| FedEx Corp., Company Guaranteed Notes: | ||||||||||
| 797,000 | BBB | 4.250% due 5/15/30 | 932,780 | |||||||
| 34,000 | BBB | 2.400% due 5/15/31 | 34,995 | |||||||
| 91,000 | BBB | 4.900% due 1/15/34 | 114,271 | |||||||
| Norfolk Southern Corp., Senior Unsecured Notes: | ||||||||||
| 282,000 | BBB+ | 2.550% due 11/1/29 | 296,655 | |||||||
| 33,000 | BBB+ | 4.800% due 8/15/43 | 41,021 | |||||||
| Ryder System Inc., Senior Unsecured Notes: | ||||||||||
| 69,000 | BBB | 2.500% due 9/1/24 | 72,354 | |||||||
| 410,000 | BBB | 4.625% due 6/1/25 | 461,210 | |||||||
| 161,000 | BBB | 2.900% due 12/1/26 | 172,962 | |||||||
| Union Pacific Corp., Senior Unsecured Notes: | ||||||||||
| 64,000 | A- | 4.163% due 7/15/22 | 65,547 | |||||||
| 50,000 | A- | 3.750% due 7/15/25 | 55,260 | |||||||
| 60,000 | A- | 2.150% due 2/5/27 | 62,670 | |||||||
| 651,000 | A- | 2.891% due 4/6/36(a) | 685,140 | |||||||
| 234,000 | A- | 3.250% due 2/5/50 | 249,296 | |||||||
| 300,000 | A- | 3.839% due 3/20/60 | 348,789 | |||||||
| 160,000 | A- | 3.750% due 2/5/70 | 182,464 | |||||||
| United Parcel Service Inc., Senior Unsecured Notes: | ||||||||||
| 264,000 | A- | 3.400% due 3/15/29 | 297,091 | |||||||
| 41,000 | A- | 2.500% due 9/1/29 | 43,773 | |||||||
| 43,000 | A- | 4.450% due 4/1/30 | 52,041 | |||||||
|
| |||||||||
| Total Transportation | 4,804,978 | |||||||||
|
| |||||||||
See Notes to Financial Statements.
194
| Schedules of Investments |
| (continued) |
| Core Fixed Income Fund | ||||||||||
| Face Amount/Units† | Rating†† | Security | Value | |||||||
Trucking & Leasing — 0.0% | ||||||||||
| Penske Truck Leasing Co. LP/PTL Finance Corp., Senior Unsecured Notes: | ||||||||||
| $ | 110,000 | BBB | 2.700% due 11/1/24(a) | $ | 115,588 | |||||
| 97,000 | BBB | 3.950% due 3/10/25(a) | 105,996 | |||||||
| 164,000 | BBB | 4.000% due 7/15/25(a) | 180,507 | |||||||
| 51,000 | BBB | 1.700% due 6/15/26(a) | 51,589 | |||||||
|
| |||||||||
| Total Trucking & Leasing | 453,680 | |||||||||
|
| |||||||||
| TOTAL CORPORATE BONDS & NOTES (Cost — $373,550,714) | 399,135,318 | |||||||||
|
| |||||||||
U.S. GOVERNMENT AGENCIES & OBLIGATIONS — 29.6% | ||||||||||
U.S. GOVERNMENT AGENCIES — 0.1% | ||||||||||
| 345,000 | Federal Home Loan Bank (FHLB), 4.000% due 9/1/28 | 411,368 | ||||||||
| Federal National Mortgage Association (FNMA), Principal Strip: | ||||||||||
| 575,000 | zero coupon, due 1/15/30(h) | 510,155 | ||||||||
| 595,000 | zero coupon, due 5/15/30(h) | 524,124 | ||||||||
|
| |||||||||
| Total U.S. GOVERNMENT AGENCIES | 1,445,647 | |||||||||
|
| |||||||||
U.S. GOVERNMENT OBLIGATIONS — 29.5% | ||||||||||
| U.S. Treasury Bonds: | ||||||||||
| 2,835,000 | 4.375% due 2/15/38 | 3,983,396 | ||||||||
| 3,815,000 | 1.125% due 8/15/40 | 3,386,111 | ||||||||
| 5,470,000 | 1.375% due 11/15/40 | 5,062,100 | ||||||||
| 7,670,000 | 1.875% due 2/15/41 | 7,727,525 | ||||||||
| 4,913,000 | 2.250% due 5/15/41 | 5,254,607 | ||||||||
| 385,000 | 1.750% due 8/15/41 | 378,744 | ||||||||
| 2,270,000 | 3.125% due 11/15/41 | 2,775,784 | ||||||||
| 100,000 | 3.125% due 2/15/43 | 122,504 | ||||||||
| 502,500 | 3.625% due 8/15/43 | 662,986 | ||||||||
| 11,510,000 | 3.750% due 11/15/43 | 15,483,648 | ||||||||
| 1,095,000 | 3.625% due 2/15/44 | 1,450,362 | ||||||||
| 415,000 | 3.125% due 8/15/44 | 511,309 | ||||||||
| 1,375,000 | 3.000% due 11/15/44 | 1,662,568 | ||||||||
| 245,000 | 2.875% due 8/15/45 | 291,253 | ||||||||
| 1,412,500 | 3.000% due 11/15/45 | 1,717,401 | ||||||||
| 6,490,000 | 2.500% due 2/15/46 | 7,244,462 | ||||||||
| 738,000 | 3.000% due 2/15/47 | 902,147 | ||||||||
| 500,000 | 2.750% due 8/15/47 | 586,035 | ||||||||
| 2,120,000 | 3.000% due 2/15/48 | 2,601,886 | ||||||||
| 595,000 | 3.375% due 11/15/48 | 781,914 | ||||||||
| 950,000 | 2.250% due 8/15/49 | 1,016,500 | ||||||||
| 4,480,000 | 2.000% due 2/15/50 | 4,549,475 | ||||||||
| 10,870,000 | 1.250% due 5/15/50 | 9,210,202 | ||||||||
| 10,210,000 | 1.375% due 8/15/50 | 8,925,773 | ||||||||
| 4,905,000 | 1.625% due 11/15/50 | 4,561,458 | ||||||||
| 5,363,000 | 1.875% due 2/15/51 | 5,291,354 | ||||||||
| 11,169,000 | 2.375% due 5/15/51 | 12,319,931 | ||||||||
| 20,905,000 | 2.000% due 8/15/51 | 21,247,973 | ||||||||
| U.S. Treasury Inflation Indexed Bonds: | ||||||||||
| 311,256 | 1.750% due 1/15/28 | 379,917 | ||||||||
| 96,192 | 0.750% due 2/15/42 | 120,036 | ||||||||
| 571,232 | 1.375% due 2/15/44 | 804,944 | ||||||||
| 11,538 | 0.750% due 2/15/45 | 14,589 | ||||||||
| 954,867 | 0.125% due 2/15/51 | 1,084,508 | ||||||||
| 2,020,000 | U.S. Treasury Strip Principal, zero coupon, due 5/15/49(h) | 1,171,036 | ||||||||
See Notes to Financial Statements.
195
| Schedules of Investments |
| (continued) |
| Core Fixed Income Fund | ||||||||||
| Face Amount/Units† | Security | Value | ||||||||
U.S. GOVERNMENT OBLIGATIONS — 29.5% — (continued) | ||||||||||
| U.S. Treasury Notes: | ||||||||||
| $ | 1,765,000 | 0.125% due 11/30/22 | $ | 1,765,552 | ||||||
| 5,655,000 | 0.125% due 3/31/23 | 5,653,233 | ||||||||
| 8,050,000 | 0.125% due 6/30/23 | 8,044,025 | ||||||||
| 620,000 | 0.125% due 7/15/23 | 619,382 | ||||||||
| 20,445,000 | 0.125% due 7/31/23 | 20,421,394 | ||||||||
| 725,000 | 0.125% due 8/15/23 | 724,051 | ||||||||
| 41,445,000 | 0.125% due 8/31/23 | 41,377,892 | ||||||||
| 5,790,000 | 0.125% due 10/15/23 | 5,777,674 | ||||||||
| 40,000 | 0.250% due 11/15/23 | 40,005 | ||||||||
| 3,015,000 | 0.125% due 12/15/23 | 3,005,460 | ||||||||
| 5,940,000 | 0.125% due 2/15/24 | 5,916,565 | ||||||||
| 4,100,000 | 0.250% due 3/15/24 | 4,094,074 | ||||||||
| 15,419,000 | 0.250% due 5/15/24 | 15,378,646 | ||||||||
| 6,377,000 | 0.250% due 6/15/24 | 6,358,068 | ||||||||
| 602,000 | 0.375% due 7/15/24 | 601,953 | ||||||||
| 480,000 | 0.375% due 4/30/25 | 476,916 | ||||||||
| 3,900,000 | 0.250% due 5/31/25 | 3,853,916 | ||||||||
| 3,060,000 | 0.250% due 6/30/25 | 3,021,571 | ||||||||
| 375,000 | 0.250% due 9/30/25 | 369,214 | ||||||||
| 2,840,000 | 0.250% due 10/31/25 | 2,793,406 | ||||||||
| 1,920,000 | 0.375% due 11/30/25 | 1,896,975 | ||||||||
| 620,000 | 0.375% due 12/31/25 | 612,032 | ||||||||
| 545,000 | 0.375% due 1/31/26 | 537,442 | ||||||||
| 4,214,000 | 0.500% due 2/28/26 | 4,176,881 | ||||||||
| 11,500,000 | 0.750% due 3/31/26 | 11,517,520 | ||||||||
| 20,346,000 | 0.750% due 4/30/26 | 20,367,459 | ||||||||
| 8,427,000 | 0.750% due 5/31/26 | 8,432,128 | ||||||||
| 11,160,000 | 0.875% due 6/30/26 | 11,223,647 | ||||||||
| 21,340,000 | 0.625% due 7/31/26 | 21,199,692 | ||||||||
| 12,325,000 | 0.750% due 8/31/26 | 12,312,964 | ||||||||
| 120,000 | 0.625% due 12/31/27 | 117,361 | ||||||||
| 7,910,000 | 0.750% due 1/31/28 | 7,788,569 | ||||||||
| 223,000 | 1.125% due 2/29/28 | 224,733 | ||||||||
| 3,600,000 | 1.250% due 4/30/28 | 3,650,625 | ||||||||
| 2,920,000 | 1.250% due 5/31/28 | 2,959,694 | ||||||||
| 1,590,000 | 1.250% due 6/30/28 | 1,610,372 | ||||||||
| 3,110,000 | 1.000% due 7/31/28 | 3,095,908 | ||||||||
| 3,020,000 | 1.125% due 8/31/28 | 3,029,438 | ||||||||
| 3,450,000 | 1.625% due 5/15/31 | 3,557,812 | ||||||||
| 5,165,000 | 1.250% due 8/15/31 | 5,140,386 | ||||||||
|
| |||||||||
| Total U.S. GOVERNMENT OBLIGATIONS | 387,029,073 | |||||||||
|
| |||||||||
| TOTAL U.S. GOVERNMENT AGENCIES & OBLIGATIONS (Cost — $384,503,256) | 388,474,720 | |||||||||
|
| |||||||||
MORTGAGE-BACKED SECURITIES — 24.4% | ||||||||||
FHLMC — 4.6% | ||||||||||
| Federal Home Loan Mortgage Corp. (FHLMC): | ||||||||||
| 760,293 | 4.500% due 4/1/29 — 5/1/50 | 823,128 | ||||||||
| 284,383 | 5.500% due 1/1/30 — 2/1/40 | 326,792 | ||||||||
| 5,247,825 | 3.000% due 3/1/31 — 9/1/50 | 5,571,699 | ||||||||
| 11,574,194 | 2.500% due 11/1/31 — 9/1/51 | 12,063,413 | ||||||||
| 15,910,807 | 3.500% due 4/1/33 — 2/1/51 | 17,281,882 | ||||||||
| 946,682 | 5.000% due 12/1/34 — 1/1/49 | 1,054,035 | ||||||||
| 12,208,474 | 2.000% due 3/1/36 — 7/1/51 | 12,439,740 | ||||||||
See Notes to Financial Statements.
196
| Schedules of Investments |
| (continued) |
| Core Fixed Income Fund | ||||||||||
| Face Amount/Units† | Security | Value | ||||||||
FHLMC — 4.6% — (continued) | ||||||||||
| $ | 30,264 | 6.000% due 5/1/38 — 6/1/39 | $ | 35,598 | ||||||
| 9,550 | 7.000% due 3/1/39 | 11,206 | ||||||||
| 88,373 | 6.500% due 9/1/39 | 101,881 | ||||||||
| 7,753,897 | 4.000% due 9/1/40 — 3/1/50 | 8,558,296 | ||||||||
| 147,544 | 2.090% (5-Year CMT Index + 1.285%) due 3/1/47(c) | 152,927 | ||||||||
| 1,705,311 | 1.500% due 11/1/50 — 3/1/51 | 1,677,907 | ||||||||
|
| |||||||||
| Total FHLMC | 60,098,504 | |||||||||
|
| |||||||||
FNMA — 15.6% | ||||||||||
| Federal National Mortgage Association (FNMA): | ||||||||||
| 1,913,967 | 5.000% due 6/1/22 — 3/1/50 | 2,130,765 | ||||||||
| 966,124 | 5.500% due 3/1/23 — 9/1/56 | 1,122,059 | ||||||||
| 7,382,436 | 4.500% due 3/1/24 — 8/1/58 | 8,134,733 | ||||||||
| 7,969,774 | 4.000% due 4/1/24 — 6/1/57 | 8,670,011 | ||||||||
| 14,919,866 | 3.500% due 11/1/25 — 2/1/50 | 16,004,538 | ||||||||
| 21,370,791 | 2.500% due 11/1/27 — 8/1/51 | 22,305,044 | ||||||||
| 23,723,330 | 3.000% due 12/1/27 — 4/1/51 | 25,123,703 | ||||||||
| 1,152,624 | 3.640% due 3/1/28 | 1,312,519 | ||||||||
| 77,672 | 3.160% due 5/1/29 | 86,976 | ||||||||
| 400,000 | 2.790% due 8/1/29 | 439,457 | ||||||||
| 95,161 | 1.789% (1-Year USD-LIBOR + 1.539%) due 3/1/34(c) | 95,250 | ||||||||
| 240,027 | 6.000% due 8/1/34 — 7/1/41 | 275,709 | ||||||||
| 317,229 | 3.360% due 7/1/35 | 357,818 | ||||||||
| 17,459 | 1.938% (1-Year Treasury Average Rate + 1.853%) due 10/1/35(c) | 18,247 | ||||||||
| 5,735 | 1.961% (1-Year Treasury Average Rate + 1.875%) due 11/1/35(c) | 5,998 | ||||||||
| 15,776 | 1.997% (1-Year Treasury Average Rate + 1.917%) due 11/1/35(c) | 16,520 | ||||||||
| 3,288,091 | 1.500% due 12/1/35 — 8/1/51 | 3,307,746 | ||||||||
| 23,142,943 | 2.000% due 6/1/36 — 9/1/51 | 23,570,174 | ||||||||
| 8,690,000 | 1.500% due 9/1/36 — 9/1/51(i) | 8,818,997 | ||||||||
| 48,525,000 | 2.000% due 10/1/36 — 10/1/51(i) | 49,282,308 | ||||||||
| 20,743 | 7.000% due 4/1/37 | 23,752 | ||||||||
| 41,722 | 1.515% (1-Year USD-LIBOR + 1.265%) due 5/1/37(c) | 41,920 | ||||||||
| 156,281 | 6.500% due 9/1/37 — 5/1/40 | 183,154 | ||||||||
| 32,275,000 | 2.500% due 10/1/51(i) | 33,465,886 | ||||||||
|
| |||||||||
| Total FNMA | 204,793,284 | |||||||||
|
| |||||||||
GNMA — 4.2% | ||||||||||
| Government National Mortgage Association (GNMA): | ||||||||||
| 20,233 | 6.000% due 12/15/33 — 6/15/37 | 22,966 | ||||||||
| 316,619 | 5.000% due 10/15/34 — 9/15/40 | 360,437 | ||||||||
| 28,240 | 5.500% due 5/15/37 — 6/15/38 | 33,074 | ||||||||
| 43,704 | 6.500% due 1/15/38 — 10/15/38 | 51,689 | ||||||||
| 65,646 | 4.500% due 3/15/41 | 74,256 | ||||||||
| 449,176 | 4.000% due 6/15/41 — 11/15/45 | 509,050 | ||||||||
| 247,693 | 3.000% due 9/15/42 — 10/15/42 | 263,918 | ||||||||
| 174,329 | 3.500% due 6/15/48 — 5/15/50 | 186,425 | ||||||||
| Government National Mortgage Association II (GNMA): | ||||||||||
| 5 | 9.000% due 11/20/21 | 5 | ||||||||
| 57,266 | 6.000% due 7/20/37 — 11/20/40 | 66,962 | ||||||||
| 3,243,140 | 4.500% due 1/20/40 — 12/20/50 | 3,494,974 | ||||||||
| 457,995 | 5.000% due 7/20/40 — 10/20/48 | 503,757 | ||||||||
| 4,418,315 | 4.000% due 11/20/40 — 4/20/50 | 4,750,442 | ||||||||
| 8,813,300 | 3.000% due 1/20/43 — 6/20/51 | 9,252,406 | ||||||||
| 9,322,464 | 3.500% due 6/20/43 — 2/20/51 | 9,887,562 | ||||||||
| 4,446,443 | 2.500% due 9/20/50 — 7/20/51 | 4,616,694 | ||||||||
| 5,526,561 | 2.000% due 12/20/50 — 7/20/51 | 5,648,124 | ||||||||
See Notes to Financial Statements.
197
| Schedules of Investments |
| (continued) |
| Core Fixed Income Fund | ||||||||||
| Face Amount/Units† | Rating†† | Security | Value | |||||||
GNMA — 4.2% — (continued) | ||||||||||
| $ | 6,300,000 | 2.000% due 9/20/51 — 10/20/51(i) | $ | 6,425,367 | ||||||
| 8,525,000 | 2.500% due 9/20/51 — 10/20/51(i) | 8,831,732 | ||||||||
|
| |||||||||
| Total GNMA | 54,979,840 | |||||||||
|
| |||||||||
| TOTAL MORTGAGE-BACKED SECURITIES (Cost — $316,034,920) | 319,871,628 | |||||||||
|
| |||||||||
COLLATERALIZED MORTGAGE OBLIGATIONS — 8.6% | ||||||||||
| 1,243,599 | BB+ | Accredited Mortgage Loan Trust, Series 2007-1, Class A4, 0.304% (1-Month USD-LIBOR + 0.220%) due 2/25/37(c) | 1,233,772 | |||||||
| 121,332 | Aaa(b) | ACRES Commercial Realty Corp., Series 2020-RSO8, Class A, 1.314% (30-Day SOFR + 1.264%) due 3/15/35(a)(c) | 121,483 | |||||||
| 78,563 | CC | AFC Home Equity Loan Trust, Series 1999-2, Class 2A, 0.734% (1-Month USD-LIBOR + 0.650%) due 6/25/29(c) | 64,586 | |||||||
| 862,640 | CCC | Alternative Loan Trust, Series 2005-56, Class 4A1, 0.704% (1-Month USD-LIBOR + 0.620%) due 11/25/35(c) | 843,813 | |||||||
| 674,900 | BBB | Applebee’s Funding LLC/IHOP Funding LLC, Series 2019-1A, Class A2I, 4.194% due 6/7/49(a) | 689,135 | |||||||
| Asset-Backed Securities Corp. Home Equity Loan Trust: | ||||||||||
| 578,070 | CCC | Series 2007-HE1, Class A1B, 0.234% (1-Month USD-LIBOR + 0.150%) due 12/25/36(c) | 564,106 | |||||||
| 843,655 | CCC | Series 2007-HE1, Class A4, 0.224% (1-Month USD-LIBOR + 0.140%) due 12/25/36(c) | 827,840 | |||||||
| BAMLL Commercial Mortgage Securities Trust: | ||||||||||
| 480,000 | AA- | Series 2015-200P, Class B, 3.490% due 4/14/33(a) | 512,982 | |||||||
| 420,000 | AAA(j) | Series 2018-PARK, Class A, 4.227% due 8/10/38(a)(c) | 484,338 | |||||||
| 820,000 | AAA | Series 2019-BPR, Class AMP, 3.287% due 11/5/32(a) | 859,124 | |||||||
| 710,000 | AAA(j) | Series 2020-JGDN, Class A, 2.846% (1-Month USD-LIBOR + 2.750%) due 11/15/30(a)(c) | 722,800 | |||||||
| 26,088 | AA+ | Banc of America Mortgage Trust, Series 2004-F, Class 1A1, 2.446% due 7/25/34(c) | 26,711 | |||||||
| 441,925 | AAA | Barings CLO Ltd., Series 2013-IA, Class AR, 0.934% (3-Month USD-LIBOR + 0.800%) due 1/20/28(a)(c) | 442,434 | |||||||
| 133,241 | WD(j) | Bear Stearns Adjustable Rate Mortgage Trust, Series 2007-3, Class 1A1, 3.151% due 5/25/47(c) | 132,535 | |||||||
| 59,566 | CCC | Bear Stearns ALT-A Trust, Series 2005-4, Class 23A2, 2.630% due 5/25/35(c) | 60,032 | |||||||
| 305,659 | CC | Bear Stearns Asset-Backed Securities I Trust, Series 2005-AC6, Class 1A3, 5.500% due 9/25/35(c) | 310,227 | |||||||
| Benchmark Mortgage Trust: | ||||||||||
| 285,000 | AAA | Series 2018-B1, Class A2, 3.571% due 1/15/51 | 292,777 | |||||||
| 348,000 | AAA | Series 2019-B13, Class A4, 2.952% due 8/15/57 | 377,145 | |||||||
| 2,200,000 | Aa1(b) | Series 2021-B28, Class XA, 1.406% due 8/15/54(c)(k) | 218,916 | |||||||
| 775,000 | AAA | BlueMountain Fuji US CLO I Ltd., Series 2017-1A, Class A1R, 1.114% (3-Month USD-LIBOR + 0.980%) due 7/20/29(a)(c) | 775,196 | |||||||
| BX Commercial Mortgage Trust: | ||||||||||
| 504,000 | NR | Series 2018-IND, Class G, 2.146% (1-Month USD-LIBOR + 2.050%) due 11/15/35(a)(c) | 506,141 | |||||||
| 940,000 | AAA | Series 2019-IMC, Class A, 1.096% (1-Month USD-LIBOR + 1.000%) due 4/15/34(a)(c) | 941,172 | |||||||
| 1,998,866 | AA+ | CD Mortgage Trust, Series 2017-CD4, Class XA, 1.435% due 5/10/50(c)(k) | 100,339 | |||||||
| 545,000 | AA+ | CGRBS Commercial Mortgage Trust, Series 2013-VN05, Class A, 3.369% due 3/13/35(a) | 562,065 | |||||||
| 50,108 | BB | Chase Mortgage Finance Trust, Series 2007-A1, Class 5A1, 2.509% due 2/25/37(c) | 50,685 | |||||||
| Chevy Chase Funding LLC Mortgage-Backed Certificates: | ||||||||||
| 331,820 | BBB | Series 2004-2A, Class A1, 0.354% (1-Month USD-LIBOR + 0.270%) due 5/25/35(a)(c) | 332,946 | |||||||
| 1,251,477 | CCC | Series 2004-2A, Class B1, 0.634% due 5/25/35(a)(c) | 1,143,997 | |||||||
| CIM Trust: | ||||||||||
| 581,586 | NR | Series 2018-R5, Class A1, 3.750% due 7/25/58(a)(c) | 581,129 | |||||||
| 585,088 | NR | Series 2018-R6, Class A1, 1.172% (1-Month USD-LIBOR + 1.076%) due 9/25/58(a)(c) | 581,439 | |||||||
| 1,276,638 | NR | Series 2019-R4, Class A1, 3.000% due 10/25/59(a)(c) | 1,299,023 | |||||||
| 700,590 | NR | Series 2020-R6, Class A1A, 2.250% due 12/25/60(a)(c) | 700,033 | |||||||
| 1,464,827 | NR | Series 2021-R1, Class A2, 2.400% due 8/25/56(a)(c) | 1,470,643 | |||||||
| 1,578,414 | NR | Series 2021-R3, Class A1A, 1.951% due 6/25/57(a)(c) | 1,601,143 | |||||||
See Notes to Financial Statements.
198
| Schedules of Investments |
| (continued) |
| Core Fixed Income Fund | ||||||||||
| Face Amount/Units† | Rating†† | Security | Value | |||||||
COLLATERALIZED MORTGAGE OBLIGATIONS — 8.6% — (continued) | ||||||||||
| $ | 1,796,114 | NR | Series 2021-R4, Class A1A, 2.000% due 5/1/61(a)(c) | $ | 1,809,136 | |||||
| Citigroup Commercial Mortgage Trust: | ||||||||||
| 140,000 | Aaa(b) | Series 2013-375P, Class A, 3.251% due 5/10/35(a) | 145,157 | |||||||
| 575,000 | Aaa(b) | Series 2015-P1, Class A5, 3.717% due 9/15/48 | 631,087 | |||||||
| 285,000 | Aa3(b) | Series 2016-C2, Class B, 3.176% due 8/10/49 | 297,766 | |||||||
| 740,000 | Aaa(b) | Series 2016-C3, Class A3, 2.896% due 11/15/49 | 790,683 | |||||||
| 1,017,216 | Aaa(b) | Series 2016-GC37, Class A3, 3.050% due 4/10/49 | 1,072,349 | |||||||
| 500,000 | Aaa(b) | Series 2016-P5, Class A4, 2.941% due 10/10/49 | 537,472 | |||||||
| 355,000 | Aaa(b) | Series 2017-P7, Class AAB, 3.509% due 4/14/50 | 380,997 | |||||||
| 1,651,640 | CC | Citigroup Mortgage Loan Trust, Series 2006-AR6, Class 2A4, 0.524% (1-Month USD-LIBOR + 0.440%) due 9/25/36(c) | 575,006 | |||||||
| Commercial Mortgage Trust: | ||||||||||
| 190,000 | AA-(j) | Series 2013-300P, Class B, 4.540% due 8/10/30(a)(c) | 199,468 | |||||||
| 260,000 | CCC | Series 2013-CR9, Class E, 4.412% due 7/10/45(a)(c) | 86,703 | |||||||
| 534,851 | Aaa(b) | Series 2013-CR11, Class A3, 3.983% due 8/10/50 | 566,758 | |||||||
| 40,000 | A2(b) | Series 2013-CR12, Class B, 4.762% due 10/10/46(c) | 42,194 | |||||||
| 20,000 | Ba1(b) | Series 2013-CR12, Class C, 5.241% due 10/10/46(c) | 20,057 | |||||||
| 205,000 | Baa1(b) | Series 2014-CR17, Class C, 4.946% due 5/10/47(c) | 217,257 | |||||||
| 140,000 | AAA | Series 2014-CR18, Class A5, 3.828% due 7/15/47 | 151,228 | |||||||
| 315,733 | AAA | Series 2014-CR18, Class ASB, 3.452% due 7/15/47 | 324,555 | |||||||
| 210,000 | A-(j) | Series 2014-CR21, Class C, 4.569% due 12/10/47(c) | 220,140 | |||||||
| 345,000 | Aaa(b) | Series 2014-LC17, Class A5, 3.917% due 10/10/47 | 375,711 | |||||||
| 2,922,252 | Aa1(b) | Series 2015-CR25, Class XA, 0.974% due 8/10/48(c)(k) | 81,093 | |||||||
| 175,000 | Aaa(b) | Series 2015-CR26, Class A4, 3.630% due 10/10/48 | 191,915 | |||||||
| 901,982 | Aaa(b) | Series 2015-CR27, Class A3, 3.349% due 10/10/48 | 960,819 | |||||||
| 465,000 | Aaa(b) | Series 2018-COR3, Class A3, 4.228% due 5/10/51 | 537,762 | |||||||
| Countrywide Asset-Backed Certificates: | ||||||||||
| 77,685 | CCC | Series 2006-SD3, Class A1, 0.744% (1-Month USD-LIBOR + 0.660%) due 7/25/36(a)(c) | 75,964 | |||||||
| 223,431 | AA | Series 2007-13, Class 2A2, 0.884% (1-Month USD-LIBOR + 0.800%) due 10/25/47(c) | 222,314 | |||||||
| Countrywide Home Loan Mortgage Pass-Through Trust: | ||||||||||
| 63,340 | WR(b) | Series 2005-11, Class 3A3, 2.535% due 4/25/35(c) | 52,344 | |||||||
| 43,583 | WR(b) | Series 2005-11, Class 6A1, 0.684% (1-Month USD-LIBOR + 0.600%) due 3/25/35(c) | 35,369 | |||||||
| Credit Suisse Commercial Mortgage Capital Trust: | ||||||||||
| 1,260,000 | CCC | Series 2014-USA, Class F, 4.373% due 9/15/37(a) | 992,376 | |||||||
| 197,392 | NR | Series 2015-5R, Class 1A1, 1.028% due 9/27/46(a)(c) | 198,481 | |||||||
| 409,564 | NR | Series 2021-2R, Class 1A1, 1.846% (1-Month USD-LIBOR + 1.750%) due 7/25/47(a)(c) | 415,904 | |||||||
| 1,636,523 | NR | Series 2021-RPL4, Class A1, 1.796% due 12/27/60(a)(c) | 1,646,088 | |||||||
| 190,000 | BBB- | Credit Suisse Commercial Mortgage Securities Corp., Series 2019-SKLZ, Class D, 3.696% (1-Month USD-LIBOR + 3.600%) due 1/15/34(a)(c) | 188,216 | |||||||
| 35,893 | WR(b) | Credit Suisse First Boston Mortgage Securities Corp., Series 2005-6, Class 8A1, 4.500% due 7/25/20 | 35,825 | |||||||
| Credit Suisse Mortgage Capital Certificates: | ||||||||||
| 888,403 | AAA(j) | Series 2018-J1, Class A2, 3.500% due 2/25/48(a)(c) | 909,678 | |||||||
| 660,000 | Aaa(b) | Series 2019-ICE4, Class A, 1.076% (1-Month USD-LIBOR + 0.980%) due 5/15/36(a)(c) | 662,734 | |||||||
| 950,000 | B2(b) | Series 2019-ICE4, Class F, 2.746% (1-Month USD-LIBOR + 2.650%) due 5/15/36(a)(c) | 954,537 | |||||||
| CSAIL Commercial Mortgage Trust: | ||||||||||
| 295,000 | Aaa(b) | Series 2015-C1, Class A4, 3.505% due 4/15/50 | 317,897 | |||||||
| 1,000,000 | Aaa(b) | Series 2016-C5, Class A5, 3.757% due 11/15/48 | 1,098,167 | |||||||
| 180,000 | Aaa(b) | Series 2021-C20, Class A3, 2.805% due 3/15/54 | 192,679 | |||||||
| 280,000 | Aa3(b) | CSMC NET, Series 2020-NET, Class B, 2.816% due 8/15/37(a) | 292,064 | |||||||
| 702,434 | CC | CWABS Revolving Home Equity Loan Trust, Series 2004-B, Class 2A, 0.316% (1-Month USD-LIBOR + 0.220%) due 2/15/29(c) | 666,992 | |||||||
| 350,000 | AA-(j) | DBJPM Mortgage Trust, Series 2016-C1, Class B, 4.195% due 5/10/49(c) | 376,792 | |||||||
| 1,417,000 | Aaa(b) | DBWF Mortgage Trust, Series 2018-AMXP, Class A, 3.873% due 5/5/35(a)(c) | 1,440,355 | |||||||
| 390,000 | Aaa(b) | DC Office Trust, Series 2019-MTC, Class A, 2.965% due 9/15/45(a) | 420,277 | |||||||
See Notes to Financial Statements.
199
| Schedules of Investments |
| (continued) |
| Core Fixed Income Fund | ||||||||||
| Face Amount/Units† | Rating†† | Security | Value | |||||||
COLLATERALIZED MORTGAGE OBLIGATIONS — 8.6% — (continued) | ||||||||||
| $ | 35,278 | CCC | Downey Savings & Loan Association Mortgage Loan Trust, Series 2004-AR2, Class A2B, 0.887% (1-Month USD-LIBOR + 0.800%) due 11/19/44(c) | $ | 34,126 | |||||
| 700,000 | AAA | Dryden XXVIII Senior Loan Fund, Series 2013-28A, Class A1LR, 1.325% (3-Month USD-LIBOR + 1.200%) due 8/15/30(a)(c) | 701,067 | |||||||
| 229,206 | B- | Equifirst Mortgage Loan Trust, Series 2003-2, Class M2, 2.634% (1-Month USD-LIBOR + 2.550%) due 9/25/33(c) | 231,998 | |||||||
| 830,000 | Aaa(b) | Extended Stay America Trust, Series 2021-ESH, Class A, 1.176% (1-Month USD-LIBOR + 1.080%) due 7/15/38(a)(c) | 833,950 | |||||||
| Federal Home Loan Mortgage Corp. (FHLMC), Interest Strips: | ||||||||||
| 62,835 | NR | Series 334, Class S7, 6.005% (6.100% – 1-Month USD-LIBOR) due 8/15/44(k)(l) | 14,363 | |||||||
| 99,684 | NR | Series 353, Class S1, 5.905% (6.000% – 1-Month USD-LIBOR) due 12/15/46(k)(l) | 21,567 | |||||||
| Federal Home Loan Mortgage Corp. (FHLMC), REMICS: | ||||||||||
| 4,716 | NR | Series 1865, Class DA, 30.049% (31.310% – 11th District Cost of Funds Index) due 2/15/24(k)(l) | 777 | |||||||
| 18,936 | NR | Series 3451, Class SB, 5.935% (6.030% – 1-Month USD-LIBOR) due 5/15/38(k)(l) | 2,921 | |||||||
| 55,401 | NR | Series 3621, Class SB, 6.135% (6.230% – 1-Month USD-LIBOR) due 1/15/40(k)(l) | 11,076 | |||||||
| 555,000 | NR | Series 3743, Class PB, 4.500% due 10/15/40 | 631,331 | |||||||
| 669,485 | NR | Series 3866, Class SA, 5.855% (5.950% – 1-Month USD-LIBOR) due 5/15/41(k)(l) | 115,966 | |||||||
| 189,137 | NR | Series 3947, Class SG, 5.855% (5.950% – 1-Month USD-LIBOR) due 10/15/41(k)(l) | 30,269 | |||||||
| 18,238 | NR | Series 3973, Class SA, 6.395% (6.490% – 1-Month USD-LIBOR) due 12/15/41(k)(l) | 4,022 | |||||||
| 184,524 | NR | Series 4203, Class PS, 6.155% (6.250% – 1-Month USD-LIBOR) due 9/15/42(k)(l) | 24,965 | |||||||
| 150,425 | NR | Series 4210, Class Z, 3.000% due 5/15/43 | 159,639 | |||||||
| 76,485 | NR | Series 4239, Class IO, 3.500% due 6/15/27(k) | 4,365 | |||||||
| 334,877 | NR | Series 4316, Class XZ, 4.500% due 3/15/44 | 381,961 | |||||||
| 57,821 | NR | Series 4335, Class SW, 5.905% (6.000% — 1-Month USD-LIBOR) due 5/15/44(k)(l) | 10,882 | |||||||
| 866,010 | NR | Series 4639, Class HZ, step bond to yield, 3.250% due 4/15/53 | 959,845 | |||||||
| 308,046 | NR | Series 4879, Class BC, 3.000% due 4/15/49 | 318,037 | |||||||
| 83,517 | NR | Series 5010, Class IK, 2.500% due 9/25/50(k) | 11,159 | |||||||
| 279,203 | NR | Series 5010, Class JI, 2.500% due 9/25/50(k) | 41,088 | |||||||
| 95,341 | NR | Series 5013, Class IN, 2.500% due 9/25/50(k) | 14,548 | |||||||
| 190,436 | NR | Series 5018, Class MI, 2.000% due 10/25/50(k) | 24,506 | |||||||
| 93,015 | NR | Series 5040, Class IB, 2.500% due 11/25/50(k) | 11,706 | |||||||
| 57,514 | NR | Series R007, Class ZA, 6.000% due 5/15/36 | 67,305 | |||||||
| 410,000 | BB+ | Federal Home Loan Mortgage Corp. (FHLMC), Structured Agency Credit Risk REMIC, Series 2021-DNA1, Class M2, 1.850% (30-Day SOFR + 1.800%) due 1/25/51(a)(c) | 411,719 | |||||||
| Federal National Mortgage Association (FNMA) REMICS: | ||||||||||
| 48,460 | NR | Series 2013-73, Class IA, 3.000% due 9/25/32(k) | 2,821 | |||||||
| 600,000 | NR | Series 2021-61, Class KI, 2.500% due 4/25/49(k) | 76,534 | |||||||
| Federal National Mortgage Association (FNMA), ACES: | ||||||||||
| 7,482,156 | NR | Series 2013-M7, Class X2, 0.248% due 12/27/22(c)(k) | 16,161 | |||||||
| 4,044,383 | NR | Series 2015-M7, Class X2, 0.577% due 12/25/24(c)(k) | 53,467 | |||||||
| 16,518,175 | NR | Series 2015-M8, Class X2, 0.181% due 1/25/25(c)(k) | 47,361 | |||||||
| 100,000 | NR | Series 2017-M8, Class A2, 3.061% due 5/25/27(c) | 109,911 | |||||||
| 80,000 | NR | Series 2019-M4, Class A2, 3.610% due 2/25/31 | 94,118 | |||||||
| 211,879 | NR | Series 2019-M19, Class A2, 2.560% due 9/25/29 | 228,764 | |||||||
| 112,973 | NR | Series 2019-M28, Class AV, 2.232% due 2/25/27 | 119,465 | |||||||
| 93,490 | NR | Series 2020-M6, Class A, 2.500% due 10/25/37 | 99,432 | |||||||
| 596,360 | NR | Series 2020-M36, Class X1, 1.560% due 9/25/34(c)(k) | 62,262 | |||||||
| Federal National Mortgage Association (FNMA), Connecticut Avenue Securities: | ||||||||||
| 773,475 | BB*(j) | Series 2014-C02, Class 1M2, 2.684% (1-Month USD-LIBOR + 2.600%) due 5/25/24(c) | 780,909 | |||||||
| 841,134 | Baa3(b) | Series 2017-C03, Class 1M2, 3.084% (1-Month USD-LIBOR + 3.000%) due 10/25/29(a)(c) | 864,529 | |||||||
| 866,931 | BB(j) | Series 2017-C07, Class 1M2, 2.484% (1-Month USD-LIBOR + 2.400%) due 5/25/30(a)(c) | 880,332 | |||||||
| 762,079 | BB+(j) | Series 2018-C01, Class 1M2, 2.334% (1-Month USD-LIBOR + 2.250%) due 7/25/30(a)(c) | 772,566 | |||||||
| 557,348 | BB-(j) | Series 2018-C06, Class 1M2, 2.084% (1-Month USD-LIBOR + 2.000%) due 3/25/31(a)(c) | 561,540 | |||||||
See Notes to Financial Statements.
200
| Schedules of Investments |
| (continued) |
| Core Fixed Income Fund | ||||||||||
| Face Amount/Units† | Rating†† | Security | Value | |||||||
COLLATERALIZED MORTGAGE OBLIGATIONS — 8.6% — (continued) | ||||||||||
| Federal National Mortgage Association (FNMA), Grantor Trust: | ||||||||||
| $ | 53,134 | NR | Series 2000-T6, Class A3, 4.238% due 11/25/40(c) | $ | 54,611 | |||||
| 99,596 | NR | Series 2017-T1, Class A, 2.898% due 6/25/27 | 108,949 | |||||||
| Federal National Mortgage Association (FNMA), Interest Strip: | ||||||||||
| 72,436 | NR | Series 409, Class C13, 3.500% due 11/25/41(k) | 6,883 | |||||||
| 154,303 | NR | Series 409, Class C18, 4.000% due 4/25/42(k) | 20,995 | |||||||
| 20,874 | NR | Series 409, Class C22, 4.500% due 11/25/39(k) | 2,962 | |||||||
| Federal National Mortgage Association (FNMA), REMICS: | ||||||||||
| 17,587 | NR | Series 2004-38, Class FK, 0.434% (1-Month USD-LIBOR + 0.350%) due 5/25/34(c) | 17,707 | |||||||
| 45,093 | NR | Series 2005-117, Class LC, 5.500% due 11/25/35 | 46,694 | |||||||
| 357,817 | NR | Series 2006-51, Class SP, 6.566% (6.650% – 1-Month USD-LIBOR) due 3/25/36(k)(l) | 45,821 | |||||||
| 163,507 | NR | Series 2007-68, Class SC, 6.616% (6.700% – 1-Month USD-LIBOR) due 7/25/37(k)(l) | 33,676 | |||||||
| 458,577 | NR | Series 2008-18, Class SM, 6.916% (7.000% – 1-Month USD-LIBOR) due 3/25/38(k)(l) | 72,096 | |||||||
| 450,048 | NR | Series 2011-8, Class ZA, 4.000% due 2/25/41 | 483,260 | |||||||
| 157,241 | NR | Series 2011-87, Class SG, 6.466% (6.550% – 1-Month USD-LIBOR) due 4/25/40(k)(l) | 14,013 | |||||||
| 770,000 | NR | Series 2011-131, Class PB, 4.500% due 12/25/41 | 882,436 | |||||||
| 53,408 | NR | Series 2012-35, Class SC, 6.416% (6.500% – 1-Month USD-LIBOR) due 4/25/42(k)(l) | 10,771 | |||||||
| 73,256 | NR | Series 2012-46, Class BA, 6.000% due 5/25/42 | 86,100 | |||||||
| 109,258 | NR | Series 2012-51, Class B, 7.000% due 5/25/42 | 134,290 | |||||||
| 3,657 | NR | Series 2012-70, Class YS, 6.566% (6.650% – 1-Month USD-LIBOR) due 2/25/41(k)(l) | 131 | |||||||
| 90,582 | NR | Series 2012-74, Class SA, 6.566% (6.650% – 1-Month USD-LIBOR) due 3/25/42(k)(l) | 15,192 | |||||||
| 15,097 | NR | Series 2012-75, Class AO, zero coupon, due 3/25/42(h) | 14,394 | |||||||
| 43,920 | NR | Series 2012-101, Class BI, 4.000% due 9/25/27(k) | 2,141 | |||||||
| 18,272 | NR | Series 2012-118, Class CI, 3.500% due 12/25/39(k) | 100 | |||||||
| 67,092 | NR | Series 2012-133, Class CS, 6.066% (6.150% – 1-Month USD-LIBOR) due 12/25/42(k)(l) | 13,973 | |||||||
| 268,872 | NR | Series 2013-9, Class BC, 6.500% due 7/25/42 | 321,811 | |||||||
| 219,229 | NR | Series 2013-9, Class CB, 5.500% due 4/25/42 | 251,469 | |||||||
| 58,843 | NR | Series 2013-54, Class BS, 6.066% (6.150% – 1-Month USD-LIBOR) due 6/25/43(k)(l) | 12,714 | |||||||
| 278,600 | NR | Series 2018-55, Class PA, 3.500% due 1/25/47 | 288,704 | |||||||
| 228,675 | NR | Series 2018-57, Class QA, 3.500% due 5/25/46 | 235,585 | |||||||
| 182,883 | NR | Series 2018-94, Class KD, 3.500% due 12/25/48 | 192,101 | |||||||
| 204,718 | NR | Series 2020-47, Class GZ, 2.000% due 7/25/50 | 195,306 | |||||||
| 182,021 | NR | Series 2020-56, Class DI, 2.500% due 8/25/50(k) | 28,131 | |||||||
| FHLMC Multifamily Structured Pass-Through Certificates: | ||||||||||
| 63,414 | AAA(j) | Series K016, Class X1, 1.599% due 10/25/21(c)(k) | 1 | |||||||
| 2,500,000 | AAA(j) | Series K104, Class XAM, 1.505% due 2/25/52(c)(k) | 272,243 | |||||||
| 1,038,776 | AAA(j) | Series K736, Class X1, 1.437% due 7/25/26(c)(k) | 55,236 | |||||||
| 4,000,000 | AAA(j) | Series K743, Class X1, 1.028% due 5/25/28(c)(k) | 230,000 | |||||||
| 2,089,234 | NR | Series KF73, Class AL, 0.691% (1-Month USD-LIBOR + 0.600%) due 11/25/29(c) | 2,109,722 | |||||||
| 246,343 | NR | Series KIR2, Class A1, 2.748% due 3/25/27 | 260,718 | |||||||
| FHLMC Structured Agency Credit Risk Debt Notes: | ||||||||||
| 322,580 | A3(b) | Series 2016-DNA1, Class M3, 5.634% (1-Month USD-LIBOR + 5.550%) due 7/25/28(c) | 337,642 | |||||||
| 655,000 | BBB(j) | Series 2017-DNA2, Class M2, 3.534% (1-Month USD-LIBOR + 3.450%) due 10/25/29(c) | 677,896 | |||||||
| 238,226 | BBB-(j) | Series 2017-HRP1, Class M2, 2.534% (1-Month USD-LIBOR + 2.450%) due 12/25/42(c) | 239,546 | |||||||
| First Franklin Mortgage Loan Trust: | ||||||||||
| 1,197,055 | CC | Series 2006-FF13, Class A2D, 0.564% (1-Month USD-LIBOR + 0.480%) due 10/25/36(c) | 986,310 | |||||||
| 686,438 | CCC | Series 2006-FF15, Class A2, 0.204% (1-Month USD-LIBOR + 0.120%) due 11/25/36(c) | 660,732 | |||||||
| 1,370,000 | AAA | Ford Credit Floorplan Master Owner Trust A, Series 2018-3, Class A1, 3.520% due 10/15/23 | 1,375,636 | |||||||
| 513,536 | NR | FREMF Mortgage Trust, Series 2019-KF58, Class B, 2.241% (1-Month USD-LIBOR + 2.150%) due 1/25/26(a)(c) | 513,613 | |||||||
| 187,768 | NR | FRESB Mortgage Trust, Series 2019-SB60, Class A10H, 3.500% due 1/25/39(c) | 201,845 | |||||||
| Government National Mortgage Association (GNMA): | ||||||||||
| 335,902 | NR | Series 2007-51, Class SG, 6.492% (6.580% – 1-Month USD-LIBOR) due 8/20/37(k)(l) | 50,015 | |||||||
| 1,056,286 | NR | Series 2008-51, Class GS, 6.135% (6.230% – 1-Month USD-LIBOR) due 6/16/38(k)(l) | 204,960 | |||||||
| 18,995 | NR | Series 2010-85, Class HS, 6.562% (6.650% – 1-Month USD-LIBOR) due 1/20/40(k)(l) | 1,124 | |||||||
See Notes to Financial Statements.
201
| Schedules of Investments |
| (continued) |
| Core Fixed Income Fund | ||||||||||
| Face Amount/Units† | Rating†† | Security | Value | |||||||
COLLATERALIZED MORTGAGE OBLIGATIONS — 8.6% — (continued) | ||||||||||
| $ | 204,900 | NR | Series 2012-H27, Class AI, 1.747% due 10/20/62(c)(k) | $ | 9,852 | |||||
| 135,453 | NR | Series 2013-53, Class OI, 3.500% due 4/20/43(k) | 13,590 | |||||||
| 1,015,674 | NR | Series 2013-85, Class IA, 0.319% due 3/16/47(c)(k) | 12,473 | |||||||
| 110,488 | NR | Series 2013-107, Class AD, 2.769% due 11/16/47(c) | 115,617 | |||||||
| 96,995 | NR | Series 2014-105, Class IO, 0.204% due 6/16/54(c)(k) | 3,800 | |||||||
| 1,360,315 | NR | Series 2014-H20, Class FA, 0.533% (1-Month USD-LIBOR + 0.430%) due 10/20/64(c) | 1,365,456 | |||||||
| 64,345 | NR | Series 2015-167, Class OI, 4.000% due 4/16/45(k) | 9,309 | |||||||
| 220,412 | NR | Series 2015-167, Class SA, 6.162% (6.250% – 1-Month USD-LIBOR) due 11/20/45(k)(l) | 43,448 | |||||||
| 63,659 | NR | Series 2016-84, Class IG, 4.500% due 11/16/45(k) | 11,108 | |||||||
| 58,437 | NR | Series 2016-135, Class SB, 6.005% (6.100% – 1-Month USD-LIBOR) due 10/16/46(k)(l) | 16,956 | |||||||
| 97,519 | NR | Series 2017-187, Class SJ, 6.112% (6.200% – 1-Month USD-LIBOR) due 12/20/47(k)(l) | 19,159 | |||||||
| 608,743 | NR | Series 2017-H22, Class IC, 2.350% due 11/20/67(c)(k) | 53,425 | |||||||
| 134,936 | NR | Series 2018-124, Class NW, 3.500% due 9/20/48 | 145,032 | |||||||
| 22,929 | NR | Series 2018-130, Class A, 3.250% due 5/16/59 | 23,428 | |||||||
| 298,984 | NR | Series 2019-12, Class QA, 3.500% due 9/20/48 | 314,156 | |||||||
| 508,821 | NR | Series 2019-86, Class C, 2.500% due 3/20/49 | 531,469 | |||||||
| 195,254 | NR | Series 2019-119, Class JE, 3.000% due 9/20/49 | 202,126 | |||||||
| 6,708 | NR | Series 2019-123, Class A, 3.000% due 10/20/49 | 6,742 | |||||||
| 362,391 | NR | Series 2020-47, Class MI, 3.500% due 4/20/50(k) | 53,094 | |||||||
| 90,431 | NR | Series 2020-47, Class NI, 3.500% due 4/20/50(k) | 13,944 | |||||||
| 96,736 | NR | Series 2020-123, Class IL, 2.500% due 8/20/50(k) | 12,761 | |||||||
| 285,364 | NR | Series 2020-123, Class NI, 2.500% due 8/20/50(k) | 37,403 | |||||||
| 95,719 | NR | Series 2020-127, Class IN, 2.500% due 8/20/50(k) | 12,655 | |||||||
| 95,889 | NR | Series 2020-129, Class IE, 2.500% due 9/20/50(k) | 13,090 | |||||||
| 96,749 | NR | Series 2020-160, Class IH, 2.500% due 10/20/50(k) | 13,074 | |||||||
| 95,903 | NR | Series 2020-160, Class VI, 2.500% due 10/20/50(k) | 12,732 | |||||||
| 384,598 | NR | Series 2020-160, Class YI, 2.500% due 10/20/50(k) | 52,659 | |||||||
| 479,413 | NR | Series 2020-181, Class WI, 2.000% due 12/20/50(k) | 49,042 | |||||||
| 270,716 | NR | Series 2020-H09, Class FL, 1.238% (1-Month USD-LIBOR + 1.150%) due 5/20/70(c) | 284,555 | |||||||
| 87,978 | NR | Series 2020-H12, Class F, 0.588% (1-Month USD-LIBOR + 0.500%) due 7/20/70(c) | 88,806 | |||||||
| 367,616 | NR | Series 2020-H13, Class FA, 0.538% (1-Month USD-LIBOR + 0.450%) due 7/20/70(c) | 370,349 | |||||||
| 78,508 | NR | Series 2020-H13, Class FC, 0.538% (1-Month USD-LIBOR + 0.450%) due 7/20/70(c) | 79,045 | |||||||
| 2,996,300 | NR | Series 2021-133, Class IO, 0.890% due 7/16/63(c)(k) | 251,167 | |||||||
| 710,000 | A- | GS Mortgage Securities Corp. II, Series 2018-SRP5, Class A, 1.646% (1-Month USD-LIBOR + 1.550%) due 9/15/31(a)(c) | 646,001 | |||||||
| 370,000 | AAA | GS Mortgage Securities Corp. Trust, Series 2021-ROSS, Class A, 1.246% (1-Month USD-LIBOR + 1.150%) due 5/15/26(a)(c) | 370,720 | |||||||
| Harborview Mortgage Loan Trust: | ||||||||||
| 72,893 | AA+ | Series 2004-5, Class 2A6, 2.401% due 6/19/34(c) | 76,123 | |||||||
| 36,705 | WD(j) | Series 2006-2, Class 1A, 2.622% due 2/25/36(c) | 16,216 | |||||||
| 782,909 | Caa2(b) | Series 2006-10, Class 1A1A, 0.287% (1-Month USD-LIBOR + 0.200%) due 11/19/36(c) | 734,502 | |||||||
| 400,000 | Aa3(b) | Hildene Community Funding CDO Ltd., Series 2015-1A, Class AR, 3.250% due 11/1/35(a)(g) | 399,000 | |||||||
| 780,000 | CC | Home Equity Asset Trust, Series 2005-6, Class M5, 1.029% (1-Month USD-LIBOR + 0.945%) due 12/25/35(c) | 778,363 | |||||||
| 65,320 | AA | Impac CMB Trust, Series 2007-A, Class A, 0.584% (1-Month USD-LIBOR + 0.500%) due 5/25/37(a)(c) | 65,332 | |||||||
| 710,000 | AAA(j) | Independence Plaza Trust, Series 2018-INDP, Class A, 3.763% due 7/10/35(a) | 752,188 | |||||||
| 31,175 | Caa2(b) | Indymac Index Mortgage Loan Trust, Series 2005-AR15, Class A2, 2.935% due 9/25/35(c) | 29,692 | |||||||
| 1,091,251 | CCC | IndyMac INDX Mortgage Loan Trust, Series 2005-AR14, Class 2A1A, 0.684% (1-Month USD-LIBOR + 0.600%) due 7/25/35(c) | 1,017,863 | |||||||
| 330,882 | NR | InStar Leasing III LLC, Series 2021-1A, Class A, 2.300% due 2/15/54(a) | 334,580 | |||||||
| 956,477 | CC | IXIS Real Estate Capital Trust, Series 2006-HE2, Class A3, 0.404% (1-Month USD-LIBOR + 0.320%) due 8/25/36(c) | 356,241 | |||||||
| 250,000 | Baa3(b) | JP Morgan Chase Commercial Mortgage Securities Corp., Series 2021-MHC, Class D, 1.796% (1-Month USD-LIBOR + 1.700%) due 4/15/38(a)(c) | 251,780 | |||||||
See Notes to Financial Statements.
202
| Schedules of Investments |
| (continued) |
| Core Fixed Income Fund | ||||||||||
| Face Amount/Units† | Rating†† | Security | Value | |||||||
COLLATERALIZED MORTGAGE OBLIGATIONS — 8.6% — (continued) | ||||||||||
| JP Morgan Chase Commercial Mortgage Securities Trust: | ||||||||||
| $ | 993,648 | Aaa(b) | Series 2016-JP2, Class A3, 2.559% due 8/15/49 | $ | 1,039,440 | |||||
| 1,710,000 | Caa1(b) | Series 2018-PHH, Class F, 4.660% (1-Month USD-LIBOR + 3.160%) due 6/15/35(a)(c)(e) | 466,830 | |||||||
| 365,000 | Aaa(b) | Series 2019-OSB, Class A, 3.397% due 6/5/39(a) | 406,496 | |||||||
| 1,043,563 | CCC | JP Morgan Mortgage Acquisition Corp., Series 2006-FRE1, Class M1, 0.669% (1-Month USD-LIBOR + 0.585%) due 5/25/35(c) | 1,041,028 | |||||||
| 880,000 | B- | JP Morgan Mortgage Acquisition Trust, Series 2007-CH2, Class MV2, 0.384% (1-Month USD-LIBOR + 0.300%) due 1/25/37(c) | 861,666 | |||||||
| JP Morgan Mortgage Trust: | ||||||||||
| 290,472 | AA+ | Series 2018-3, Class A1, 3.500% due 9/25/48(a)(c) | 292,069 | |||||||
| 272,967 | AA+ | Series 2018-5, Class A1, 3.500% due 10/25/48(a)(c) | 275,625 | |||||||
| 76,373 | AAA | Series 2019-1, Class A11, 1.034% (1-Month USD-LIBOR + 0.950%) due 5/25/49(a)(c) | 76,693 | |||||||
| JPMBB Commercial Mortgage Securities Trust: | ||||||||||
| 40,000 | Aa3(b) | Series 2013-C17, Class B, 5.049% due 1/15/47(c) | 42,958 | |||||||
| 350,000 | B(j) | Series 2014-C23, Class E, 3.364% due 9/15/47(a)(c) | 260,643 | |||||||
| 990,187 | Aaa(b) | Series 2015-C28, Class A3, 2.912% due 10/15/48 | 1,027,565 | |||||||
| JPMDB Commercial Mortgage Securities Trust: | ||||||||||
| 340,000 | A(j) | Series 2017-C5, Class B, 4.009% due 3/15/50(c) | 364,150 | |||||||
| 190,000 | Aaa(b) | Series 2017-C7, Class A5, 3.409% due 10/15/50 | 211,196 | |||||||
| 130,000 | AA- | Series 2018-C8, Class B, 4.522% due 6/15/51 | 149,008 | |||||||
| 460,000 | AA | JPMorgan Chase Commercial Mortgage Securities Trust, Series 2012-HSBC, Class C, 4.021% due 7/5/32(a) | 470,072 | |||||||
| 91,094 | Aaa(b) | JPMorgan Trust, Series 2015-5, Class A9, 2.469% due 5/25/45(a)(c) | 92,192 | |||||||
| 890,000 | Aaa(b) | KREF Ltd., Series 2021-FL2, Class A, 1.163% (1-Month USD-LIBOR + 1.070%) due 2/15/39(a)(c)(g) | 893,115 | |||||||
| Legacy Mortgage Asset Trust: | ||||||||||
| 726,321 | NR | Series 2019-GS5, Class A1, step bond to yield, 3.200% due 5/25/59(a) | 730,008 | |||||||
| 745,713 | NR | Series 2021-GS2, Class A1, step bond to yield, 1.750% due 4/25/61(a) | 748,386 | |||||||
| 700,000 | Aaa(b) | Magnetite XVIII Ltd., Series 2016-18A, Class AR, 1.205% (3-Month USD-LIBOR + 1.080%) due 11/15/28(a)(c) | 700,251 | |||||||
| 868,736 | A | MAPS Trust, Series 2021-1A, Class A, 2.521% due 6/15/46(a) | 881,068 | |||||||
| 194,069 | BBB(j) | MASTR Seasoned Securitization Trust, Series 2005-1, Class 4A1, 2.422% due 10/25/32(c) | 194,013 | |||||||
| 243,798 | CC | Merrill Lynch First Franklin Mortgage Loan Trust, Series 2007-4, Class 2A4, 0.334% (1-Month USD-LIBOR + 0.250%) due 7/25/37(c) | 161,263 | |||||||
| 13,612 | A+ | Merrill Lynch Mortgage Investors Trust, Series 2004-A3, Class 4A3, 2.394% due 5/25/34(c) | 13,685 | |||||||
| 291,167 | AA+ | Mid-State Capital Corp. Trust, Series 2004-1, Class A, 6.005% due 8/15/37 | 307,098 | |||||||
| 500,000 | AAA(j) | MKT Mortgage Trust, Series 2020-525M, Class A, 2.694% due 2/12/40(a) | 529,703 | |||||||
| ML-CFC Commercial Mortgage Trust: | ||||||||||
| 31,803 | Caa2(b) | Series 2007-5, Class AJ, 5.450% due 8/12/48(c) | 15,775 | |||||||
| 5,157 | WD(j) | Series 2007-9, Class AJ, 6.193% due 9/12/49(c) | 5,082 | |||||||
| Morgan Stanley Bank of America Merrill Lynch Trust: | ||||||||||
| 500,000 | Aaa(b) | Series 2013-C13, Class A4, 4.039% due 11/15/46(m) | 533,514 | |||||||
| 595,950 | Aaa(b) | Series 2016-C28, Class A3, 3.272% due 1/15/49(m) | 632,966 | |||||||
| 202,238 | NR | Morgan Stanley Resecuritization Trust, Series 2014-R3, Class 2A, 3.000% due 7/26/48(a)(c)(m) | 204,031 | |||||||
| 390,000 | Aaa(b) | Natixis Commercial Mortgage Securities Trust, Series 2020-2PAC, Class A, 2.966% due 12/15/38(a) | 409,067 | |||||||
| New Residential Mortgage Loan Trust: | ||||||||||
| 203,106 | AAA | Series 2016-4A, Class A1, 3.750% due 11/25/56(a)(c) | 218,699 | |||||||
| 680,584 | Aaa(b) | Series 2019-6A, Class A1B, 3.500% due 9/25/59(a)(c) | 718,529 | |||||||
| 365,161 | AAA | Oak Street Investment Grade Net Lease Fund, Series 2020-1A, Class A1, 1.850% due 11/20/50(a) | 371,393 | |||||||
| 500,000 | Aaa(b) | One Bryant Park Trust, Series 2019-OBP, Class A, 2.516% due 9/15/54(a) | 524,255 | |||||||
| 351,360 | BBB- | Option One Mortgage Loan Trust, Series 2004-3, Class M1, 0.864% (1-Month USD-LIBOR + 0.780%) due 11/25/34(c) | 351,441 | |||||||
See Notes to Financial Statements.
203
| Schedules of Investments |
| (continued) |
| Core Fixed Income Fund | ||||||||||
| Face Amount/Units† | Rating†† | Security | Value | |||||||
COLLATERALIZED MORTGAGE OBLIGATIONS — 8.6% — (continued) | ||||||||||
| $ | 800,000 | AAA | Palmer Square CLO Ltd., Series 2014-1A, Class A1R2, 1.264% (3-Month USD-LIBOR + 1.130%) due 1/17/31(a)(c) | $ | 801,658 | |||||
| 1,656,296 | CCC | Park Place Securities Inc. Asset-Backed Pass-Through Certificates, Series 2004-WWF1, Class M5, 1.884% (1-Month USD-LIBOR + 1.800%) due 12/25/34(c) | 1,673,624 | |||||||
| 635,174 | Aaa(b) | PFP Ltd., Series 2019-5, Class A, 1.066% (1-Month USD-LIBOR + 0.970%) due 4/14/36(a)(c) | 635,035 | |||||||
| PFS Financing Corp.: | ||||||||||
| 1,230,000 | AAA | Series 2019-B, Class A, 0.646% (1-Month USD-LIBOR + 0.550%) due 9/15/23(a)(c) | 1,231,690 | |||||||
| 400,000 | AAA | Series 2020-E, Class A, 1.000% due 10/15/25(a) | 404,225 | |||||||
| 190,000 | AAA | Series 2021-A, Class A, 0.710% due 4/15/26(a) | 190,399 | |||||||
| PMT Credit Risk Transfer Trust: | ||||||||||
| 440,943 | NR | Series 2019-2R, Class A, 2.838% (1-Month USD-LIBOR + 2.750%) due 5/27/23(a)(c) | 437,387 | |||||||
| 287,062 | NR | Series 2019-3R, Class A, 2.788% (1-Month USD-LIBOR + 2.700%) due 10/27/22(a)(c) | 288,184 | |||||||
| Prime Mortgage Trust: | ||||||||||
| 10,208 | WR(b) | Series 2006-DR1, Class 1A1, 5.500% due 5/25/35(a) | 10,213 | |||||||
| 658,511 | WR(b) | Series 2006-DR1, Class 2A1, 5.500% due 5/25/35(a) | 608,628 | |||||||
| 1,535,000 | AAA | RBS Commercial Funding Inc. Trust, Series 2013-GSP, Class A, 3.961% due 1/15/32(a)(c) | 1,624,695 | |||||||
| 130,801 | Caa2(b) | Residential Asset Securitization Trust, Series 2005-A15, Class 1A4, 5.750% due 2/25/36 | 135,257 | |||||||
| SBA Small Business Investment Cos.: | ||||||||||
| 531,230 | NR | Series 2018-10B, Class 1, 3.548% due 9/10/28 | 577,855 | |||||||
| 330,349 | NR | Series 2019-10A, Class 1, 3.113% due 3/10/29 | 355,294 | |||||||
| Seasoned Credit Risk Transfer Trust: | ||||||||||
| 121,841 | NR | Series 2018-2, Class MA, 3.500% due 11/25/57 | 127,926 | |||||||
| 790,000 | B-(j) | Series 2019-1, Class M, 4.750% due 7/25/58(a)(c) | 837,076 | |||||||
| 357,063 | NR | Series 2019-2, Class MA, 3.500% due 8/25/58 | 377,103 | |||||||
| 210,000 | B-(j) | Series 2020-2, Class M, 4.250% due 11/25/59(a)(c) | 220,318 | |||||||
| 745,763 | AA- | Sequoia Mortgage Trust, Series 2003-1, Class 1A, 0.848% (1-Month USD-LIBOR + 0.760%) due 4/20/33(c) | 757,794 | |||||||
| 310,000 | NR | Soho Trust, Series 2021-SOHO, Class B, 2.786% due 8/10/38(a)(c) | 301,451 | |||||||
| 620,830 | A | Structured Asset Investment Loan Trust, Series 2004-6, Class A3, 0.884% (1-Month USD-LIBOR + 0.800%) due 7/25/34(c) | 616,744 | |||||||
| 68,083 | AA+ | Structured Asset Mortgage Investments II Trust, Series 2005-AR5, Class A3, 0.587% (1-Month USD-LIBOR + 0.500%) due 7/19/35(c) | 69,236 | |||||||
| 401,269 | NR | Sunrun Atlas Issuer LLC, Series 2019-2, Class A, 3.610% due 2/1/55(a) | 430,528 | |||||||
| Tharaldson Hotel Portfolio Trust: | ||||||||||
| 81,008 | AAA | Series 2018-THL, Class A, 0.996% (1-Month USD-LIBOR + 0.900%) due 11/11/34(a)(c) | 81,123 | |||||||
| 291,629 | B+ | Series 2018-THL, Class E, 3.426% (1-Month USD-LIBOR + 3.330%) due 11/11/34(a)(c) | 290,956 | |||||||
| Towd Point Mortgage Trust: | ||||||||||
| 760,000 | Ba2(b) | Series 2015-2, Class 1B3, 3.400% due 11/25/60(a)(c) | 797,609 | |||||||
| 44,207 | Aaa(b) | Series 2016-3, Class A1, 2.250% due 4/25/56(a)(c) | 44,377 | |||||||
| 770,000 | Baa3(b) | Series 2016-5, Class B2, 3.628% due 10/25/56(a)(c) | 822,664 | |||||||
| 200,000 | Aaa(b) | TPGI Trust, Series 2021-DGWD, Class A, 0.800% (1-Month USD-LIBOR + 0.700%) due 6/15/26(a)(c) | 200,444 | |||||||
| 329,099 | A | TRP LLC, Series 2021-1, Class A, 2.070% due 6/19/51(a) | 330,403 | |||||||
| UBS Commercial Mortgage Trust: | ||||||||||
| 340,000 | AA-(j) | Series 2018-C11, Class B, 4.713% due 6/15/51(c) | 384,309 | |||||||
| 350,000 | Aaa(b) | Series 2019-C17, Class A3, 2.669% due 10/15/52 | 370,530 | |||||||
| 793,800 | A- | Vantage Data Centers Issuer LLC, Series 2019-1A, Class A2, 3.188% due 7/15/44(a) | 822,917 | |||||||
| 530,000 | AAA | VNDO Mortgage Trust, Series 2012-6AVE, Class A, 2.996% due 11/15/30(a) | 542,411 | |||||||
| WaMu Mortgage Pass-Through Certificates Trust: | ||||||||||
| 371,033 | B- | Series 2005-AR1, Class A1B, 0.864% (1-Month USD-LIBOR + 0.780%) due 1/25/45(c) | 365,668 | |||||||
| 164,040 | BB- | Series 2005-AR4, Class A5, 2.845% due 4/25/35(c) | 166,068 | |||||||
| 897,185 | A- | Series 2005-AR19, Class A1B3, 0.784% (1-Month USD-LIBOR + 0.700%) due 12/25/45(c) | 896,046 | |||||||
| 649,343 | CCC | Series 2006-AR3, Class A1A, 1.098% (1-Year Treasury Average Rate + 1.000%) due 2/25/46(c) | 655,900 | |||||||
See Notes to Financial Statements.
204
| Schedules of Investments |
| (continued) |
| Core Fixed Income Fund | ||||||||||
| Face Amount/Units† | Rating†† | Security | Value | |||||||
COLLATERALIZED MORTGAGE OBLIGATIONS — 8.6% — (continued) | ||||||||||
| $ | 346,365 | Ca(b) | Washington Mutual Mortgage Pass-Through Certificates WMALT, Series 2007-OA2, Class 2A, 0.798% (1-Year Treasury Average Rate + 0.700%) due 1/25/47(c) | $ | 309,309 | |||||
| Wells Fargo Commercial Mortgage Trust: | ||||||||||
| 120,000 | Baa3(b) | Series 2013-LC12, Class B, 4.443% due 7/15/46(c) | 120,469 | |||||||
| 1,000,000 | Aa2(b) | Series 2015-C28, Class AS, 3.872% due 5/15/48(c) | 1,083,815 | |||||||
| 150,000 | Aaa(b) | Series 2015-LC20, Class A5, 3.184% due 4/15/50 | 160,999 | |||||||
| 499,992 | AAA | Series 2016-BNK1, Class ASB, 2.514% due 8/15/49 | 519,805 | |||||||
| 459,928 | Aaa(b) | Series 2016-C33, Class A3, 3.162% due 3/15/59 | 489,567 | |||||||
| 11,511,508 | Aaa(b) | Series 2018-C43, Class XA, 0.818% due 3/15/51(c)(k) | 429,455 | |||||||
| 250,000 | Aaa(b) | Series 2018-C44, Class A4, 3.948% due 5/15/51 | 281,068 | |||||||
| 3,485,969 | Aaa(b) | Series 2019-C52, Class XA, 1.759% due 8/15/52(c)(k) | 345,426 | |||||||
| 180,000 | AAA | Series 2019-C54, Class A4, 3.146% due 12/15/52 | 197,947 | |||||||
| 198,855 | Aaa(b) | Wells Fargo Mortgage-Backed Securities Trust, Series 2019-4, Class A2, 3.000% due 9/25/49(a)(c) | 201,763 | |||||||
| WF-RBS Commercial Mortgage Trust: | ||||||||||
| 1,545,266 | Aa2(b) | Series 2012-C7, Class XA, 1.450% due 6/15/45(a)(c)(k) | 5,400 | |||||||
| 125,474 | Aaa(b) | Series 2013-C14, Class A4, 3.073% due 6/15/46 | 127,994 | |||||||
|
| |||||||||
| TOTAL COLLATERALIZED MORTGAGE OBLIGATIONS (Cost — $116,683,883) | 112,504,516 | |||||||||
|
| |||||||||
SOVEREIGN BONDS — 3.7% | ||||||||||
Argentina — 0.1% | ||||||||||
| Argentine Republic Government International Bonds: | ||||||||||
| 64,372 | CCC+ | 1.000% due 7/9/29 | 26,478 | |||||||
| 1,852,700 | CCC+ | step bond to yield, 0.500% due 7/9/30 | 726,240 | |||||||
|
| |||||||||
| Total Argentina | 752,718 | |||||||||
|
| |||||||||
Brazil — 0.3% | ||||||||||
| 656,000 | BRL | BB- | Brazil Notas do Tesouro Nacional Serie B, 6.000% due 8/15/50 | 544,454 | ||||||
| 1,224,000 | BRL | BB- | Brazil Notas do Tesouro Nacional Serie F, 10.000% due 1/1/27 | 241,060 | ||||||
| Brazilian Government International Bonds: | ||||||||||
| 200,000 | BB- | 2.875% due 6/6/25 | 206,782 | |||||||
| 300,000 | BB- | 4.625% due 1/13/28 | 324,377 | |||||||
| 200,000 | BB- | 3.875% due 6/12/30 | 200,870 | |||||||
| 1,680,000 | BB- | 5.000% due 1/27/45 | 1,660,075 | |||||||
|
| |||||||||
| Total Brazil | 3,177,618 | |||||||||
|
| |||||||||
Canada — 0.0% | ||||||||||
| 152,000 | A+ | Province of Manitoba Canada, 3.050% due 5/14/24 | 162,625 | |||||||
|
| |||||||||
Chile — 0.1% | ||||||||||
| Chile Government International Bonds: | ||||||||||
| 100,000 | A | 3.240% due 2/6/28 | 108,846 | |||||||
| 650,000 | A | 2.450% due 1/31/31 | 667,869 | |||||||
| 435,000 | A | 2.550% due 7/27/33 | 443,796 | |||||||
|
| |||||||||
| Total Chile | 1,220,511 | |||||||||
|
| |||||||||
Colombia — 0.2% | ||||||||||
| Colombia Government International Bonds: | ||||||||||
| 220,000 | BB+ | 8.125% due 5/21/24 | 257,472 | |||||||
| 280,000 | BB+ | 3.875% due 4/25/27 | 296,895 | |||||||
| 540,000 | BB+ | 3.000% due 1/30/30 | 530,585 | |||||||
| 315,000 | BB+ | 3.125% due 4/15/31 | 308,372 | |||||||
| 430,000 | BB+ | 3.250% due 4/22/32 | 420,854 | |||||||
| 230,000 | BB+ | 4.125% due 2/22/42 | 221,306 | |||||||
|
| |||||||||
| Total Colombia | 2,035,484 | |||||||||
|
| |||||||||
See Notes to Financial Statements.
205
| Schedules of Investments |
| (continued) |
| Core Fixed Income Fund | ||||||||||
| Face Amount/Units† | Rating†† | Security | Value | |||||||
Dominican Republic — 0.0% | ||||||||||
| $ | 200,000 | BB- | Dominican Republic International Bonds, 4.500% due 1/30/30(a) | $ | 208,502 | |||||
|
| |||||||||
Egypt — 0.0% | ||||||||||
| 230,000 | B | Egypt Government International Bonds, 5.577% due 2/21/23(a) | 240,949 | |||||||
|
| |||||||||
Indonesia — 0.5% | ||||||||||
| Indonesia Government International Bonds: | ||||||||||
| 1,400,000 | BBB | 3.750% due 4/25/22 | 1,431,213 | |||||||
| 290,000 | Baa2(b) | 3.500% due 1/11/28 | 320,114 | |||||||
| 80,000 | BBB | 4.100% due 4/24/28 | 91,173 | |||||||
| 445,000 | BBB | 2.850% due 2/14/30 | 468,467 | |||||||
| 530,000 | Baa2(b) | 4.350% due 1/11/48 | 616,669 | |||||||
| Indonesia Treasury Bonds: | ||||||||||
| 33,727,000,000 | IDR | NR | 6.500% due 2/15/31 | 2,435,412 | ||||||
| 19,692,000,000 | IDR | NR | 6.375% due 4/15/32 | 1,411,075 | ||||||
|
| |||||||||
| Total Indonesia | 6,774,123 | |||||||||
|
| |||||||||
Israel — 0.0% | ||||||||||
| 200,000 | AA- | Israel Government International Bonds, 2.750% due 7/3/30 | 215,666 | |||||||
|
| |||||||||
Kenya — 0.0% | ||||||||||
| 520,000 | B | Kenya Government International Bonds, 6.300% due 1/23/34(a) | 537,365 | |||||||
|
| |||||||||
Kuwait — 0.0% | ||||||||||
| 360,000 | A+ | Kuwait International Government Bonds, 3.500% due 3/20/27(a) | 402,993 | |||||||
|
| |||||||||
Mexico — 1.2% | ||||||||||
| Mexican Bonos: | ||||||||||
| 15,120,000 | MXN | BBB+ | 10.000% due 12/5/24 | 837,923 | ||||||
| 22,540,000 | MXN | BBB+ | 8.500% due 5/31/29 | 1,229,404 | ||||||
| 111,575,700 | MXN | BBB+ | 7.750% due 11/13/42 | 5,667,956 | ||||||
| 84,090,000 | MXN | Baa1(b) | 8.000% due 11/7/47 | 4,367,037 | ||||||
| Mexico Government International Bonds: | ||||||||||
| 8,000 | BBB | 4.000% due 10/2/23 | 8,615 | |||||||
| 200,000 | BBB | 4.150% due 3/28/27 | 228,877 | |||||||
| 323,000 | BBB | 3.750% due 1/11/28 | 357,414 | |||||||
| 572,000 | BBB | 4.500% due 4/22/29 | 656,064 | |||||||
| 550,000 | BBB | 3.250% due 4/16/30 | 577,346 | |||||||
| 1,499,000 | BBB | 2.659% due 5/24/31 | 1,487,862 | |||||||
| 200,000 | BBB | 4.750% due 4/27/32 | 232,214 | |||||||
| 210,000 | BBB | 4.750% due 3/8/44 | 236,650 | |||||||
|
| |||||||||
| Total Mexico | 15,887,362 | |||||||||
|
| |||||||||
Nigeria — 0.0% | ||||||||||
| 260,000 | B- | Nigeria Government International Bonds, 7.143% due 2/23/30(a) | 274,402 | |||||||
|
| |||||||||
Panama — 0.1% | ||||||||||
| Panama Government International Bonds: | ||||||||||
| 210,000 | BBB | 3.875% due 3/17/28 | 232,545 | |||||||
| 700,000 | BBB | 3.160% due 1/23/30 | 742,658 | |||||||
| 240,000 | BBB | 2.252% due 9/29/32 | 234,463 | |||||||
| 290,000 | BBB | 4.500% due 4/1/56 | 332,105 | |||||||
|
| |||||||||
| Total Panama | 1,541,771 | |||||||||
|
| |||||||||
Paraguay — 0.0% | ||||||||||
| 200,000 | BB | Paraguay Government International Bonds, 2.739% due 1/29/33(a) | 199,250 | |||||||
|
| |||||||||
Peru — 0.1% | ||||||||||
| Peruvian Government International Bonds: | ||||||||||
| 625,000 | BBB+ | 4.125% due 8/25/27 | 705,356 | |||||||
See Notes to Financial Statements.
206
| Schedules of Investments |
| (continued) |
| Core Fixed Income Fund | ||||||||||
| Face Amount/Units† | Rating†† | Security | Value | |||||||
Peru — 0.1% — (continued) | ||||||||||
| $ | 360,000 | BBB+ | 2.783% due 1/23/31 | $ | 368,359 | |||||
| 70,000 | BBB+ | 6.550% due 3/14/37 | 97,033 | |||||||
| 160,000 | BBB+ | 5.625% due 11/18/50 | 222,896 | |||||||
|
| |||||||||
| Total Peru | 1,393,644 | |||||||||
|
| |||||||||
Philippines — 0.1% | ||||||||||
| Philippine Government International Bonds: | ||||||||||
| 400,000 | BBB+ | 3.000% due 2/1/28 | 436,178 | |||||||
| 200,000 | BBB+ | 2.457% due 5/5/30 | 211,371 | |||||||
| 360,000 | BBB+ | 1.648% due 6/10/31 | 355,039 | |||||||
|
| |||||||||
| Total Philippines | 1,002,588 | |||||||||
|
| |||||||||
Poland — 0.1% | ||||||||||
| 810,000 | A- | Poland Government International Bonds, 4.000% due 1/22/24 | 878,584 | |||||||
|
| |||||||||
Qatar — 0.2% | ||||||||||
| Qatar Government International Bonds: | ||||||||||
| 200,000 | AA- | 4.500% due 4/23/28 | 236,500 | |||||||
| 250,000 | AA- | 4.000% due 3/14/29(a) | 288,483 | |||||||
| 1,020,000 | AA- | 4.817% due 3/14/49(a) | 1,335,406 | |||||||
|
| |||||||||
| Total Qatar | 1,860,389 | |||||||||
|
| |||||||||
Russia — 0.5% | ||||||||||
| Russian Federal Bonds — OFZ: | ||||||||||
| 6,950,000 | RUB | NR | 7.750% due 9/16/26 | 99,282 | ||||||
| 205,378,000 | RUB | BBB | 7.050% due 1/19/28 | 2,850,065 | ||||||
| 170,520,000 | RUB | BBB(j) | 6.900% due 5/23/29 | 2,337,998 | ||||||
| 49,650,000 | RUB | NR | 7.700% due 3/16/39 | 716,994 | ||||||
|
| |||||||||
| Total Russia | 6,004,339 | |||||||||
|
| |||||||||
Saudi Arabia — 0.0% | ||||||||||
| Saudi Government International Bonds: | ||||||||||
| 200,000 | A1(b) | 3.250% due 10/26/26 | 217,708 | |||||||
| 200,000 | A1(b) | 3.625% due 3/4/28 | 222,099 | |||||||
|
| |||||||||
| Total Saudi Arabia | 439,807 | |||||||||
|
| |||||||||
South Africa — 0.0% | ||||||||||
| 300,000 | BB- | Republic of South Africa Government International Bonds, 4.850% due 9/30/29 | 317,978 | |||||||
|
| |||||||||
United Arab Emirates — 0.1% | ||||||||||
| Abu Dhabi Government International Bonds: | ||||||||||
| 400,000 | AA | 2.500% due 10/11/22(a) | 409,804 | |||||||
| 200,000 | AA | 2.500% due 9/30/29 | 211,933 | |||||||
| 790,000 | AA | 3.875% due 4/16/50(a) | 925,163 | |||||||
|
| |||||||||
| Total United Arab Emirates | 1,546,900 | |||||||||
|
| |||||||||
Uruguay — 0.1% | ||||||||||
| Uruguay Government International Bonds: | ||||||||||
| 70,000 | BBB | 4.500% due 8/14/24 | 75,711 | |||||||
| 355,000 | BBB | 4.375% due 10/27/27 | 411,732 | |||||||
| 200,000 | BBB | 4.375% due 1/23/31 | 235,154 | |||||||
|
| |||||||||
| Total Uruguay | 722,597 | |||||||||
|
| |||||||||
| TOTAL SOVEREIGN BONDS (Cost — $48,353,116) | 47,798,165 | |||||||||
|
| |||||||||
SENIOR LOANS — 1.5% | ||||||||||
| 237,192 | NR | 1011778 B.C. Unlimited Liability Company, (Restricted, cost — $232,849, acquired 8/12/20), 1.835% (1-Month USD-LIBOR + 1.750%) due 11/19/26(n) | 233,461 | |||||||
See Notes to Financial Statements.
207
| Schedules of Investments |
| (continued) |
| Core Fixed Income Fund | ||||||||||
| Face Amount/Units† | Rating†† | Security | Value | |||||||
SENIOR LOANS — 1.5% — (continued) | ||||||||||
| $ | 40,000 | NR | AECOM, (Restricted, cost — $39,716, acquired 4/9/21), 1.835% (1-Month USD-LIBOR + 1.750%) due 4/13/28(n) | $ | 40,020 | |||||
| 150,000 | NR | Air Canada, (Restricted, cost — $149,037, acquired 7/27/21), 4.250% (6-Month USD-LIBOR + 3.500%) due 8/11/28(n) | 150,107 | |||||||
| 419,293 | NR | Allied Universal Holdco LLC, (Restricted, cost — $420,609, acquired 2/19/20), 4.250% (3-Month USD-LIBOR + 3.750%) due 5/12/28(n) | 419,794 | |||||||
| 155,960 | NR | Alterra Mountain Co., (Restricted, cost — $155,770, acquired 3/27/19), 4.000% (1-Month USD-LIBOR + 3.500%) due 8/17/28(n) | 155,570 | |||||||
| 328,344 | NR | Aramark Intermediate HoldCo Corp., (Restricted, cost — $330,358, acquired 12/13/19), 1.835% (1-Month USD-LIBOR + 1.750%) due 1/15/27(n) | 322,256 | |||||||
| 626,593 | NR | Asplundh Tree Expert LLC, (Restricted, cost — $628,227, acquired 3/4/21), 1.835% (1-Month USD-LIBOR + 1.750%) due 9/7/27(n) | 623,169 | |||||||
| 119,700 | NR | Asurion LLC, (Restricted, cost — $118,606, acquired 1/29/21), 3.335% (1-Month USD-LIBOR + 3.250%) due 7/31/27(n) | 117,481 | |||||||
| 176,069 | NR | Asurion LLC, (Restricted, cost — $175,723, acquired 11/20/19), 3.085% (1-Month USD-LIBOR + 3.000%) due 11/3/24(n) | 173,346 | |||||||
| 385,218 | NR | Asurion LLC, (Restricted, cost — $385,667, acquired 4/10/19), 3.335% (1-Month USD-LIBOR + 3.250%) due 12/23/26(n) | 378,236 | |||||||
| 51,568 | NR | Asurion LLC, (Restricted, cost — $51,568, acquired 2/26/20), 3.210% (1-Month USD-LIBOR + 3.125%) due 11/3/23(n) | 51,085 | |||||||
| 541,246 | NR | athenahealth Inc., (Restricted, cost — $541,903, acquired 1/9/20), 4.377% (1-Month USD-LIBOR + 4.250%/3-Month USD-LIBOR + 4.250%) due 2/11/26(n) | 543,784 | |||||||
| 48,750 | NR | Atlantic Aviation FBO Inc., (Restricted, cost — $48,453, acquired 11/30/18), 3.840% (1-Month USD-LIBOR + 3.750%) due 12/6/25(n) | 48,720 | |||||||
| 562,175 | NR | Avolon TLB Borrower 1 (US) LLC, (Restricted, cost — $562,140, acquired 3/4/21), 2.750% (1-Month USD-LIBOR + 2.250%) due 12/1/27(n) | 562,923 | |||||||
| 231,487 | NR | Bausch Health Cos., Inc., (Restricted, cost — $228,764, acquired 6/23/20), 2.835% (1-Month USD-LIBOR + 2.750%) due 11/27/25(n) | 230,371 | |||||||
| 53,460 | NR | Bausch Health Cos., Inc., (Restricted, cost — $53,794, acquired 4/17/19), 3.085% (1-Month USD-LIBOR + 3.000%) due 6/2/25(n) | 53,326 | |||||||
| 226,082 | NR | Berry Global Inc., (Restricted, cost — $226,647, acquired 2/12/21), 1.856% (2-Month USD-LIBOR + 1.750%) due 7/1/26(n) | 224,386 | |||||||
| 6,041 | NR | BJ’s Wholesale Club Inc., (Restricted, cost — $6,020, acquired 8/12/20), 2.097% (1-Month USD-LIBOR + 2.000%) due 2/3/24(n) | 6,045 | |||||||
| 77,843 | NR | Brookfield WEC Holdings Inc., (Restricted, cost — $77,835, acquired 11/15/19), 3.250% (1-Month USD-LIBOR + 2.750%) due 8/1/25(n) | 77,271 | |||||||
| 218,350 | NR | Caesars Resort Collection LLC, (Restricted, cost — $213,344, acquired 6/19/20), 4.585% (1-Month USD-LIBOR + 4.500%) due 7/21/25(n) | 219,112 | |||||||
| 96,420 | NR | Caesars Resort Collection LLC, (Restricted, cost — $96,720, acquired 10/4/17), 2.835% (1-Month USD-LIBOR + 2.750%) due 12/23/24(n) | 95,751 | |||||||
| 246,285 | NR | Change Healthcare Holdings LLC, (Restricted, cost — $245,988, acquired 2/18/20), 3.500% (1-Month USD-LIBOR + 2.500%/3-Month USD-LIBOR + 2.500%) due 3/1/24(n) | 246,023 | |||||||
| 206,842 | NR | Charter Communications Operating LLC, (Restricted, cost — $207,488, acquired 2/7/20), 1.840% (1-Month USD-LIBOR + 1.750%) due 2/1/27(n) | 204,903 | |||||||
| 345,204 | NR | Charter Communications Operating LLC, (Restricted, cost — $346,139, acquired 10/24/19), 1.840% (1-Month USD-LIBOR + 1.750%) due 4/30/25(n) | 344,406 | |||||||
| 468,227 | NR | Citadel Securities LP, (Restricted, cost — $467,358, acquired 4/15/21), 2.585% (1-Month USD-LIBOR + 2.500%) due 2/2/28(n) | 462,624 | |||||||
| 159,083 | NR | CityCenter Holding LLC, (Restricted, cost — $158,439, acquired 1/28/21), 3.000% (1-Month USD-LIBOR + 2.250%) due 4/18/24(n) | 158,902 | |||||||
| 218,077 | NR | Clarios Global LP, (Restricted, cost — $216,654, acquired 3/18/19), 3.335% (1-Month USD-LIBOR + 3.250%) due 4/30/26(n) | 216,123 | |||||||
| 130,000 | NR | Cloudera Inc., (Restricted, cost — $128,707, acquired 8/10/21) due 8/10/28(n)(o) | 129,472 | |||||||
| 69,821 | NR | CSC Holdings LLC, (Restricted, cost — $68,723, acquired 6/29/21), 2.345% (1-Month USD-LIBOR + 2.250%) due 1/15/26(n) | 68,879 | |||||||
See Notes to Financial Statements.
208
| Schedules of Investments |
| (continued) |
| Core Fixed Income Fund | ||||||||||
| Face Amount/Units† | Rating†† | Security | Value | |||||||
SENIOR LOANS — 1.5% — (continued) | ||||||||||
| $ | 425,073 | NR | DCert Buyer Inc., (Restricted, cost — $425,419, acquired 8/8/19), 4.085% (1-Month USD-LIBOR + 4.000%) due 10/16/26(n) | $ | 424,926 | |||||
| 641,665 | NR | Dell International LLC, (Restricted, cost — $635,504, acquired 3/4/21), 2.000% (1-Month USD-LIBOR + 1.750%) due 9/19/25(n) | 642,214 | |||||||
| 750,000 | NR | Delos Finance Sarl, (Restricted, cost — $750,000, acquired 3/4/21), 1.897% (3-Month USD-LIBOR + 1.750%) due 10/6/23(n) | 749,479 | |||||||
| 174,483 | NR | Edelman Financial Engines Center LLC, (Restricted, cost — $174,964, acquired 4/22/19), 4.250% (1-Month USD-LIBOR + 3.500%) due 4/7/28(n) | 173,808 | |||||||
| 108,784 | NR | EyeCare Partners LLC, (Restricted, cost — $108,713, acquired 2/18/20), 3.857% (2-Month USD-LIBOR + 3.750%) due 2/18/27(n) | 107,978 | |||||||
| 18,029 | NR | FinCo I LLC, (Restricted, cost — $17,921, acquired 8/12/20), 2.585% (1-Month USD-LIBOR + 2.500%) due 6/27/25(n) | 17,924 | |||||||
| 56,977 | NR | First Eagle Holdings Inc., (Restricted, cost — $57,120, acquired 4/5/19), 2.647% (3-Month USD-LIBOR + 2.500%) due 2/1/27(n) | 56,188 | |||||||
| 160,000 | NR | FleetCor Technologies Operating Company, LLC, (Restricted, cost — $158,857, acquired 4/22/21), 1.835% (1-Month USD-LIBOR + 1.750%) due 4/28/28(n) | 159,471 | |||||||
| 216,302 | NR | Focus Financial Partners LLC, (Restricted, cost — $216,888, acquired 2/18/20), 2.085% (1-Month USD-LIBOR + 2.000%) due 7/3/24(n) | 214,478 | |||||||
| 20,000 | NR | Formula One Management Ltd., (Restricted, cost — $19,684, acquired 8/12/20), 3.500% (1-Month USD-LIBOR + 2.500%) due 2/1/24(n) | 19,952 | |||||||
| 49,356 | NR | Four Seasons Holdings Inc., (Restricted, cost — $49,539, acquired 11/21/19), 2.085% (1-Month USD-LIBOR + 2.000%) due 11/30/23(n) | 49,074 | |||||||
| 158,400 | NR | Froneri International Ltd., (Restricted, cost — $158,707, acquired 2/18/20), 2.335% (1-Month USD-LIBOR + 2.250%) due 1/29/27(n) | 156,211 | |||||||
| 109,724 | NR | Gainwell Acquisition Corp., (Restricted, cost — $108,268, acquired 2/12/21), 4.750% (3-Month USD-LIBOR + 4.000%) due 10/1/27(n) | 110,204 | |||||||
| 75,577 | NR | Garda World Security Corp., (Restricted, cost — $74,461, acquired 10/24/19), 4.340% (1-Month USD-LIBOR + 4.250%) due 10/30/26(n) | 75,557 | |||||||
| 137,822 | NR | Golden Nugget Inc., (Restricted, cost — $137,822, acquired 2/20/20), 3.250% (2-Month USD-LIBOR + 2.500%) due 10/4/23(n) | 137,082 | |||||||
| 467,644 | NR | Harbor Freight Tools USA Inc., (Restricted, cost — $469,398, acquired 4/15/21), 3.250% (1-Month USD-LIBOR + 2.750%) due 10/19/27(n) | 466,529 | |||||||
| 431,964 | NR | Hilton Worldwide Finance LLC, (Restricted, cost — $432,101, acquired 8/18/16), 1.834% (1-Month USD-LIBOR + 1.750%) due 6/22/26(n) | 427,914 | |||||||
| 320,218 | NR | Icon Public Limited Company, (Restricted, cost — $318,659, acquired 6/16/21), 3.000% (3-Month USD-LIBOR + 2.500%) due 7/3/28(n) | 320,352 | |||||||
| 79,782 | NR | Icon Public Limited Company, (Restricted, cost — $79,394, acquired 6/16/21), 3.000% (3-Month USD-LIBOR + 2.500%) due 7/3/28(n) | 79,816 | |||||||
| 162,988 | NR | iHeartCommunications Inc., (Restricted, cost — $162,842, acquired 1/29/20), 3.084% (1-Month USD-LIBOR + 3.000%) due 5/1/26(n) | 161,750 | |||||||
| 140,000 | NR | INEOS Styrolution Group GmbH, (Restricted, cost — $140,672, acquired 2/19/21), 3.250% (1-Month USD-LIBOR + 2.750%) due 1/29/26(n) | 139,825 | |||||||
| 185,749 | NR | Jane Street Group LLC, (Restricted, cost — $185,536, acquired 1/21/21), 2.835% (1-Month USD-LIBOR + 2.750%) due 1/26/28(n) | 183,350 | |||||||
| 390,000 | NR | Jazz Pharmaceuticals Public Ltd. Company, (Restricted, cost — $388,143, acquired 4/22/21), 4.000% (1-Month USD-LIBOR + 3.500%) due 5/5/28(n) | 390,564 | |||||||
| 382,876 | NR | Level 3 Financing Inc., (Restricted, cost — $382,651, acquired 4/17/19), 1.835% (1-Month USD-LIBOR + 1.750%) due 3/1/27(n) | 377,851 | |||||||
| 214,384 | NR | LifePoint Health Inc., (Restricted, cost — $212,870, acquired 8/16/19), 3.835% (1-Month USD-LIBOR + 3.750%) due 11/16/25(n) | 213,105 | |||||||
| 140,000 | NR | Michaels Companies Inc., (Restricted, cost — $138,674, acquired 4/8/21), 5.000% (1-Month USD-LIBOR + 4.250%) due 4/15/28(n) | 140,262 | |||||||
| 490,185 | NR | Nexstar Broadcasting Inc., (Restricted, cost — $489,150, acquired 8/16/19), 2.596% (1-Month USD-LIBOR + 2.500%) due 9/18/26(n) | 488,498 | |||||||
See Notes to Financial Statements.
209
| Schedules of Investments |
| (continued) |
| Core Fixed Income Fund | ||||||||||
| Face Amount/Units† | Rating†† | Security | Value | |||||||
SENIOR LOANS — 1.5% — (continued) | ||||||||||
| $ | 129,729 | NR | Numericable U.S. LLC, (Restricted, cost — $129,556, acquired 10/6/17), 3.814% (3-Month USD-LIBOR + 3.688%) due 1/31/26(n) | $ | 128,869 | |||||
| 197,000 | NR | Option Care Health Inc., (Restricted, cost — $195,790, acquired 5/22/19), 3.835% (1-Month USD-LIBOR + 3.750%) due 8/6/26(n) | 196,852 | |||||||
| 119,727 | NR | PCI Gaming Authority, (Restricted, cost — $119,907, acquired 5/15/19), 2.585% (1-Month USD-LIBOR + 2.500%) due 5/29/26(n) | 119,010 | |||||||
| 349,125 | NR | Phoenix Guarantor Inc., (Restricted, cost — $349,125, acquired 2/23/21), 3.596% (1-Month USD-LIBOR + 3.500%) due 3/5/26(n) | 347,598 | |||||||
| 680,000 | NR | Pilot Travel Centers LLC, (Restricted, cost — $676,631, acquired 7/29/21) due 8/4/28(n)(o) | 676,036 | |||||||
| 359,100 | NR | PPD Inc., (Restricted, cost — $358,294, acquired 1/6/21), 2.500% (1-Month USD-LIBOR + 2.000%) due 1/13/28(n) | 358,556 | |||||||
| 403,939 | NR | Prime Security Services Borrower LLC, (Restricted, cost — $406,041, acquired 4/22/19), 3.500% (1-Month USD-LIBOR + 2.750%/3-Month USD-LIBOR + 2.750%) due 9/23/26(n) | 403,717 | |||||||
| 170,000 | NR | QUIKRETE Holdings Inc., (Restricted, cost — $168,760, acquired 6/11/21) due 5/22/28(n)(o) | 168,885 | |||||||
| 209,475 | NR | Rackspace Technology Global Inc., (Restricted, cost — $210,036, acquired 2/19/21), 3.500% (2-Month USD-LIBOR + 2.750%/3-Month USD-LIBOR + 2.750%) due 2/15/28(n) | 207,588 | |||||||
| 340,000 | NR | RealPage Inc., (Restricted, cost — $340,131, acquired 2/18/21), 3.750% (1-Month USD-LIBOR + 3.250%) due 4/24/28(n) | 338,450 | |||||||
| 398,802 | NR | Reynolds Consumer Products LLC, (Restricted, cost — $400,267, acquired 2/18/20), 1.835% (1-Month USD-LIBOR + 1.750%) due 2/4/27(n) | 396,595 | |||||||
| 315,576 | NR | Scientific Games International Inc., (Restricted, cost — $315,282, acquired 2/14/18), 2.835% (1-Month USD-LIBOR + 2.750%) due 8/14/24(n) | 313,226 | |||||||
| 360,000 | NR | Sotera Health Holdings LLC, (Restricted, cost — $362,813, acquired 1/20/21), 3.250% (3-Month USD-LIBOR + 2.750%) due 12/11/26(n) | 358,200 | |||||||
| 204,799 | NR | Trans Union LLC, (Restricted, cost — $205,634, acquired 2/16/21), 1.835% (1-Month USD-LIBOR + 1.750%) due 11/16/26(n) | 203,070 | |||||||
| 19,899 | NR | TransDigm Inc., (Restricted, cost — $19,634, acquired 2/9/21), 2.335% (1-Month USD-LIBOR + 2.250%) due 12/9/25(n) | 19,614 | |||||||
| 407,172 | NR | UFC Holdings LLC, (Restricted, cost — $410,226, acquired 4/30/19), 3.500% (3-Month USD-LIBOR + 2.750%) due 4/29/26(n) | 405,207 | |||||||
| 468,825 | NR | United AirLines Inc., (Restricted, cost — $471,273, acquired 4/14/21), 4.500% (3-Month USD-LIBOR + 3.750%) due 4/21/28(n) | 470,529 | |||||||
| 313,636 | NR | US Foods Inc., (Restricted, cost — $304,879, acquired 9/28/20), 1.835% (1-Month USD-LIBOR + 1.750%) due 6/27/23(n) | 310,528 | |||||||
| 150,000 | NR | VFH Parent LLC, (Restricted, cost — $148,570, acquired 10/30/20), 3.088% (1-Month USD-LIBOR + 3.000%) due 3/1/26(n) | 149,391 | |||||||
| 350,000 | NR | VICI Properties 1 LLC, (Restricted, cost — $349,055, acquired 2/20/20), 1.838% (1-Month USD-LIBOR + 1.750%) due 12/20/24(n) | 348,567 | |||||||
| 430,000 | NR | Virgin Media Bristol LLC, (Restricted, cost — $427,503, acquired 4/30/19), 2.596% (1-Month USD-LIBOR + 2.500%) due 1/31/28(n) | 426,085 | |||||||
| 71,034 | NR | Western Digital Corp., (Restricted, cost — $71,745, acquired 10/27/17), 1.838% (1-Month USD-LIBOR + 1.750%) due 4/29/23(n) | 71,141 | |||||||
| 80,000 | NR | Zayo Group Holdings Inc., (Restricted, cost — $80,088, acquired 2/19/21), 3.085% (1-Month USD-LIBOR + 3.000%) due 3/9/27(n) | 79,074 | |||||||
|
| |||||||||
| TOTAL SENIOR LOANS (Cost — $19,598,441) | 19,538,696 | |||||||||
|
| |||||||||
ASSET-BACKED SECURITIES — 0.8% | ||||||||||
Automobiles — 0.2% | ||||||||||
| Credit Acceptance Auto Loan Trust: | ||||||||||
| 450,000 | AAA | Series 2019-3A, Class A, 2.380% due 11/15/28(a) | 456,951 | |||||||
| 410,000 | AAA | Series 2021-2A, Class A, 0.960% due 2/15/30(a) | 412,126 | |||||||
| 320,000 | AAA | Series 2021-3A, Class A, 1.000% due 5/15/30(a) | 321,602 | |||||||
| 920,000 | Aaa(b) | Hertz Vehicle Financing LLC, Series 2021-1A, Class A, 1.210% due 12/26/25(a) | 926,512 | |||||||
See Notes to Financial Statements.
210
| Schedules of Investments |
| (continued) |
| Core Fixed Income Fund | ||||||||||
| Face Amount/Units† | Rating†† | Security | Value | |||||||
Automobiles — 0.2% — (continued) | ||||||||||
| $ | 355,074 | AAA | Nissan Auto Receivables Owner Trust, Series 2018-C, Class A3, 3.220% due 6/15/23 | $ | 358,366 | |||||
|
| |||||||||
| Total Automobiles | 2,475,557 | |||||||||
|
| |||||||||
Credit Cards — 0.0% | ||||||||||
| 315,000 | AAA | Citibank Credit Card Issuance Trust, Series 2017-A6, Class A6, 0.866% (1-Month USD-LIBOR + 0.770%) due 5/14/29(c) | 321,219 | |||||||
|
| |||||||||
Student Loans — 0.6% | ||||||||||
| 159,484 | AA | College Ave Student Loans LLC, Series 2019-A, Class A2, 3.280% due 12/28/48(a) | 165,251 | |||||||
| 174,460 | Aaa(b) | ECMC Group Student Loan Trust, Series 2016-1A, Class A, 1.434% (1-Month USD-LIBOR + 1.350%) due 7/26/66(a)(c) | 180,035 | |||||||
| 110,927 | AAA | Navient Private Education Loan Trust, Series 2014-AA, Class A2B, 1.346% (1-Month USD-LIBOR + 1.250%) due 2/15/29(a)(c) | 111,432 | |||||||
| 270,559 | AAA | Navient Student Loan Trust, Series 2017-4A, Class A2, 0.584% (1-Month USD-LIBOR + 0.500%) due 9/27/66(a)(c) | 271,242 | |||||||
| 235,747 | Aaa(b) | Nelnet Student Loan Trust, Series 2021-A, Class APT1, 1.360% due 4/20/62(a) | 236,748 | |||||||
| 395,000 | AAA | SLM Private Education Loan Trust, Series 2010-C, Class A5, 4.846% (1-Month USD-LIBOR + 4.750%) due 10/15/41(a)(c) | 441,287 | |||||||
| SLM Student Loan Trust: | ||||||||||
| 155,872 | AA+ | Series 2003-4, Class A5E, 0.869% (3-Month USD-LIBOR + 0.750%) due 3/15/33(a)(c) | 148,319 | |||||||
| 780,000 | AA+ | Series 2003-10A, Class A4, 0.789% (3-Month USD-LIBOR + 0.670%) due 12/17/68(a)(c) | 782,089 | |||||||
| 1,048,920 | AAA | Series 2005-5, Class A4, 0.265% (3-Month USD-LIBOR + 0.140%) due 10/25/28(c) | 1,044,384 | |||||||
| SMB Private Education Loan Trust: | ||||||||||
| 12,648 | AAA | Series 2015-B, Class A2A, 2.980% due 7/15/27(a) | 12,760 | |||||||
| 545,000 | AAA | Series 2015-C, Class A3, 2.046% (1-Month USD-LIBOR + 1.950%) due 8/16/32(a)(c) | 555,494 | |||||||
| 37,702 | Aaa(b) | Series 2016-A, Class A2A, 2.700% due 5/15/31(a) | 38,671 | |||||||
| 125,620 | AAA | Series 2017-B, Class A2A, 2.820% due 10/15/35(a) | 130,209 | |||||||
| 74,230 | AAA | Series 2017-B, Class A2B, 0.843% (1-Month USD-LIBOR + 0.750%) due 10/15/35(a)(c) | 74,577 | |||||||
| 304,436 | AAA | Series 2018-A, Class A2B, 0.893% (1-Month USD-LIBOR + 0.800%) due 2/15/36(a)(c) | 305,905 | |||||||
| 357,236 | Aaa(b) | Series 2018-B, Class A2A, 3.600% due 1/15/37(a) | 378,746 | |||||||
| 435,043 | AAA | Series 2018-C, Class A2B, 0.843% (1-Month USD-LIBOR + 0.750%) due 11/15/35(a)(c) | 435,998 | |||||||
| 100,000 | AAA | Series 2020-A, Class A2B, 0.923% (1-Month USD-LIBOR + 0.830%) due 9/15/37(a)(c) | 100,412 | |||||||
| 844,793 | AAA | Series 2020-PTB, Class A2A, 1.600% due 9/15/54(a) | 856,153 | |||||||
| 730,000 | Aaa(b) | Series 2021-A, Class A2B, 1.590% due 1/15/53(a) | 736,032 | |||||||
| 240,000 | Aa2(b) | Series 2021-A, Class B, 2.310% due 1/15/53(a) | 244,771 | |||||||
| 219,622 | AAA | Sofi Professional Loan Program Trust, Series 2018-B, Class A2FX, 3.340% due 8/25/47(a) | 225,446 | |||||||
|
| |||||||||
| Total Student Loans | 7,475,961 | |||||||||
|
| |||||||||
| TOTAL ASSET-BACKED SECURITIES (Cost — $10,182,510) | 10,272,737 | |||||||||
|
| |||||||||
MUNICIPAL BONDS — 0.3% | ||||||||||
California — 0.1% | ||||||||||
| 530,000 | A+ | Los Angeles Unified School District, GO, 5.750% due 7/1/34 | 715,304 | |||||||
| University of California, Revenue Bonds: | ||||||||||
| 25,000 | AA | Series AD, 4.858% due 5/15/12 | 37,407 | |||||||
| 266,000 | AA | Series AQ, 4.767% due 5/15/15 | 387,080 | |||||||
|
| |||||||||
| Total California | 1,139,791 | |||||||||
|
| |||||||||
New Jersey — 0.1% | ||||||||||
| 570,000 | Aa3(b) | Jersey City Municipal Utilities Authority, Revenue Bonds, Series B, 5.470% due 5/15/27 | 645,743 | |||||||
| 85,000 | BBB | New Jersey Transportation Trust Fund Authority, Revenue Bonds, Series B, 6.561% due 12/15/40 | 128,071 | |||||||
|
| |||||||||
| Total New Jersey | 773,814 | |||||||||
|
| |||||||||
See Notes to Financial Statements.
211
| Schedules of Investments |
| (continued) |
| Core Fixed Income Fund | ||||||||||||
| Face Amount/Units† | Rating†† | Security | Value | |||||||||
New York — 0.1% | ||||||||||||
| City of New York: | ||||||||||||
| $ | 375,000 | AA | GO, Series A, 3.000% due 8/1/34 | $ | 401,183 | |||||||
| 500,000 | AA | Series G-1, 5.968% due 3/1/36 | 704,048 | |||||||||
| 80,000 | AAA | New York City Transitional Finance Authority Future Tax Secured Revenue, Revenue Bonds, Series A-1, 5.000% due 11/1/42 | 87,623 | |||||||||
| 350,000 | AA+ | New York State Dormitory Authority, Revenue Bonds, 5.289% due 3/15/33 | 433,858 | |||||||||
|
| |||||||||||
| Total New York | 1,626,712 | |||||||||||
|
| |||||||||||
Ohio — 0.0% | ||||||||||||
| 90,000 | A- | City of Cleveland, OH, Airport System Revenue, Revenue Bonds, 2.882% due 1/1/31 | 95,671 | |||||||||
|
| |||||||||||
Texas — 0.0% | ||||||||||||
| 350,000 | A+ | North Texas Tollway Authority, Revenue Bonds, Series A, 2.530% due 1/1/35 | 360,424 | |||||||||
|
| |||||||||||
Virginia — 0.0% | ||||||||||||
| 137,077 | AAA | Virginia Housing Development Authority, Revenue Bonds, Series C, 6.000% due 6/25/34 | 143,473 | |||||||||
|
| |||||||||||
| TOTAL MUNICIPAL BONDS (Cost — $3,781,105) | 4,139,885 | |||||||||||
|
| |||||||||||
| TOTAL INVESTMENTS IN SECURITIES BEFORE SHORT-TERM INVESTMENTS (Cost — $1,272,687,945) | 1,301,735,665 | |||||||||||
|
| |||||||||||
| Face Amount† | ||||||||||||
SHORT-TERM INVESTMENTS — 9.0% | ||||||||||||
ASSET-BACKED SECURITY — 0.1% | ||||||||||||
| 530,000 | MRA Issuance Trust, 1.846%(1-Month USD-LIBOR + 1.750%) due 2/16/22(a)(c) (Cost — $530,001) | 530,281 | ||||||||||
|
| |||||||||||
TIME DEPOSITS — 2.7% | ||||||||||||
| 314,998 | AUD | BBH — Grand Cayman, (0.120)% due 9/1/21 | 230,437 | |||||||||
| 3,655,818 | BNP Paribas — Paris, 0.005% due 9/1/21 | 3,655,818 | ||||||||||
| Citibank — London: | ||||||||||||
| 329,964 | EUR | (0.780)% due 9/1/21 | 389,604 | |||||||||
| 247,719 | GBP | 0.005% due 9/1/21 | 340,576 | |||||||||
| 9,686,857 | Royal Bank of Canada — Toronto, 0.005% due 9/1/21 | 9,686,857 | ||||||||||
| 12,248,230 | Skandinaviska Enskilda Banken AB — Stockholm, 0.005% due 9/1/21 | 12,248,230 | ||||||||||
| Sumitomo Mitsui Banking Corp. — Tokyo: | ||||||||||||
| 18,845,982 | JPY | (0.310)% due 9/1/21 | 171,304 | |||||||||
| 8,761,068 | 0.005% due 9/1/21 | 8,761,068 | ||||||||||
|
| |||||||||||
| TOTAL TIME DEPOSITS (Cost — $35,483,894) | 35,483,894 | |||||||||||
|
| |||||||||||
U.S. GOVERNMENT OBLIGATIONS — 6.2% | ||||||||||||
| U.S. Cash Management Bills: | ||||||||||||
| 6,395,000 | 0.036% due 12/14/21(p) | 6,394,338 | ||||||||||
| 1,865,000 | 0.042% due 12/21/21(p) | 1,864,759 | ||||||||||
| U.S. Treasury Bills: | ||||||||||||
| 25,665,000 | 0.027% due 10/5/21(p) | 25,664,351 | ||||||||||
| 15,145,000 | 0.040% due 12/2/21(p) | 15,143,452 | ||||||||||
| 6,415,000 | 0.041% due 1/6/22(p) | 6,414,079 | ||||||||||
| 10,130,000 | 0.049% due 1/13/22(p) | 10,128,138 | ||||||||||
| 1,460,000 | 0.046% due 1/20/22(p) | 1,459,737 | ||||||||||
| 1,620,000 | 0.045% due 1/27/22(p) | 1,619,700 | ||||||||||
See Notes to Financial Statements.
212
| Schedules of Investments |
| (continued) |
| Core Fixed Income Fund | ||||||||||||
| Face Amount† | Security | Value | ||||||||||
U.S. GOVERNMENT OBLIGATIONS — 6.2% — (continued) | ||||||||||||
| $ | 12,795,000 | 0.045% due 2/3/22(p) | $ | 12,792,517 | ||||||||
|
| |||||||||||
| TOTAL U.S. GOVERNMENT OBLIGATIONS (Cost — $81,481,071) | 81,481,071 | |||||||||||
|
| |||||||||||
| TOTAL SHORT-TERM INVESTMENTS (Cost — $117,494,966) | 117,495,246 | |||||||||||
|
| |||||||||||
| TOTAL INVESTMENTS IN SECURITIES (Cost — $1,390,182,911) | 1,419,230,911 | |||||||||||
|
| |||||||||||
| TOTAL INVESTMENTS IN PURCHASED OPTIONS (Cost — $271,394) | 213,865 | |||||||||||
|
| |||||||||||
| TOTAL INVESTMENTS — 108.3% (Cost — $1,390,454,305) | 1,419,444,776 | |||||||||||
|
| |||||||||||
| Liabilities in Excess of Other Assets — (8.3)% | (108,247,390 | ) | ||||||||||
|
| |||||||||||
| TOTAL NET ASSETS — 100.0% | $ | 1,311,197,386 | ||||||||||
|
| |||||||||||
| † | Amount denominated in U.S. dollars, unless otherwise noted. |
| †† | All ratings are by Standard & Poor’s Rating Service, unless otherwise noted. All ratings are unaudited. |
| (a) | Restricted security that may be sold to “qualified institutional buyers” pursuant to the conditions of Rule 144A under the Securities Act of 1933, as amended. This security has been deemed liquid pursuant to guidelines approved by the Board of Trustees, unless otherwise noted. The aggregate value of restricted 144A holdings at August 31, 2021, amounts to $144,671,643 and represents 11.3% of net assets. |
| (b) | Rating by Moody’s Investors Service. All ratings are unaudited. |
| (c) | Variable rate security. Interest rate disclosed is that which was in effect at August 31, 2021. |
| (d) | Security is perpetual in nature and has no stated maturity date. |
| (e) | Illiquid security. |
| (f) | Security is currently in default. |
| (g) | Security is valued in good faith at fair value by or under the direction of the Board of Trustees. |
| (h) | Principal only security. |
| (i) | This security is traded on a TBA basis (see Note 1). |
| (j) | Rating by Fitch Ratings Service. All ratings are unaudited. |
| (k) | Interest only security. |
| (l) | Inverse Floating Rate Security — interest rate fluctuates with an inverse relationship to an associated interest rate. Indicated rate is the effective rate as of August 31, 2021. |
| (m) | Affiliated security (See Note 2). As of August 31, 2021, total cost and total market value of affiliated securities amounted to $1,347,582 and $1,370,511, respectively. |
| (n) | The aggregate value of restricted securities (excluding 144A holdings) at August 31, 2021, amounts to $19,538,696 and represents 1.5% of net assets. |
| (o) | This position represents an unsettled loan commitment at period end. Certain details associated with this purchase are not known prior to the settlement date, including coupon rate. |
| (p) | Rate shown represents yield-to-maturity. |
| # | Security that used significant unobservable inputs to determine fair value. |
Abbreviations used in this schedule: | ||
| ACES | — Alternative Credit Enhancement Securities | |
| CLO | — Collateralized Loan Obligation | |
| CMT | — Constant Maturity Treasury Rate | |
| GO | — General Obligation | |
| ICE | — Intercontinental Exchange | |
| LIBOR | — London Interbank Offered Rate | |
| MASTR | — Mortgage Asset Securitization Transactions Incorporation | |
| OFZ | — Federal Loan Obligations (Russian: Obligatsyi Federal’novo Zaima) | |
| PLC | — Public Limited Company | |
| REMICS | — Real Estate Mortgage Investment Conduits | |
| SOFR | — Secured Overnight Financing Rate | |
See Notes to Financial Statements.
213
| Schedules of Investments |
| (continued) |
| Core Fixed Income Fund | ||||||
At August 31, 2021, for Core Fixed Income Fund the aggregate cost of investments, the aggregate gross unrealized appreciation and depreciation of all investments for federal income tax purposes were as follows:
| Fund | Aggregate Cost For Federal Income Tax Purposes | Gross Unrealized Appreciation | Gross Unrealized (Depreciation) | Net Unrealized Appreciation | ||||||||||||
Core Fixed Income Fund | $ | 1,398,278,820 | $ | 47,382,301 | $ | (24,808,764 | ) | $ | 22,573,537 | |||||||
| Summary of Investments by Security Type^ | ||||
Corporate Bonds & Notes | 28.1 | % | ||
U.S. Government Agencies & Obligations | 27.4 | |||
Mortgage-Backed Securities | 22.5 | |||
Collateralized Mortgage Obligations | 7.9 | |||
Sovereign Bonds | 3.4 | |||
Senior Loans | 1.4 | |||
Asset-Backed Securities | 0.7 | |||
Municipal Bonds | 0.3 | |||
Purchased Options | 0.0 | * | ||
Short-Term Investments | 8.3 | |||
|
| |||
| 100.0 | % | |||
|
| |||
| ^ | As a percentage of total investments. |
| * | Position represents less than 0.05%. |
At August 31, 2021, Core Fixed Income Fund held the following Options Contracts Purchased:
| Currency Option | ||||||||||||||||||||||
| Number of Contracts | Notional Amount† | Security Name | Counterparty | Expiration Date | Strike Price | Value | ||||||||||||||||
| 2,050,000 | 2,586,161 | CAD | OTC U.S. Dollar versus Canadian Dollar, Put | CITI | 11/22/21 | $ | 1.27 | $ | 31,316 | |||||||||||||
|
| |||||||||||||||||||||
| Interest Rate Cap Option | ||||||||||||||||||||||
| Number of Contracts | Notional Amount† | Security Name | Counterparty | Expiration Date | Exercise Rate | Value | ||||||||||||||||
| 1,270,000 | $ 2,095,500 | OTC USD ICE Swap 3-30 Year, Put | BCLY | 1/19/24 | 2.750% | $ | 33,792 | |||||||||||||||
|
| |||||||||||||||||||||
| Options on Futures | ||||||||||||||||||||||||
| Number of Contracts | Notional Amount† | Security Name | Counterparty | Expiration Date | Strike Price | Value | ||||||||||||||||||
| 85 | $ 13,894,844 | U.S. Treasury Bond October Futures, Call | GSC | 9/24/21 | $ | 168.00 | $ | 13,282 | ||||||||||||||||
| 66 | 8,165,953 | U.S. Treasury 5-Year Note October Futures, Call | GSC | 9/24/21 | $ | 124.50 | 4,125 | |||||||||||||||||
| 260 | 64,369,500 | 2-Year Mid-Curve Eurodollar December Futures, Put | CITI | 12/10/21 | $ | 99.13 | 125,125 | |||||||||||||||||
| 249 | 62,159,738 | 3-Month Eurodollar March Futures, Put | GSC | 3/14/22 | $ | 99.63 | 6,225 | |||||||||||||||||
|
| |||||||||||||||||||||||
| Total Options on Futures | $ | 148,757 | ||||||||||||||||||||||
|
| |||||||||||||||||||||||
| TOTAL OPTIONS CONTRACTS PURCHASED (Cost — $271,394) | $ | 213,865 | ||||||||||||||||||||||
|
| |||||||||||||||||||||||
| † | Amount denominated in U.S. dollars, unless otherwise noted. |
See Notes to Financial Statements.
214
| Schedules of Investments |
| (continued) |
| Core Fixed Income Fund | ||||||
At August 31, 2021, Core Fixed Income Fund held the following Options Contracts Written:
| Options on Futures | ||||||||||||||||||||||||
| Number of Contracts | Notional Amount† | Security Name | Counterparty | Expiration Date | Strike Price | Value | ||||||||||||||||||
| 85 | $ 13,894,844 | U.S. Treasury Bond October Futures, Call | GSC | 9/24/21 | $ | 165.00 | $ | 53,125 | ||||||||||||||||
| 66 | 8,165,953 | U.S. Treasury 5-Year Note October Futures, Call | GSC | 9/24/21 | $ | 123.75 | 19,594 | |||||||||||||||||
| 520 | 128,739,000 | 2-Year Mid-Curve Eurodollar December Futures, Put | CITI | 12/10/21 | $ | 98.75 | 71,500 | |||||||||||||||||
| 210 | 52,423,878 | 3-Month Eurodollar March Futures, Put | GSC | 3/14/22 | $ | 99.38 | 3,937 | |||||||||||||||||
|
| |||||||||||||||||||||||
| Total Options on Futures | $ | 148,156 | ||||||||||||||||||||||
|
| |||||||||||||||||||||||
| TOTAL OPTIONS CONTRACTS WRITTEN (Premiums received — $255,880) | $ | 148,156 | ||||||||||||||||||||||
|
| |||||||||||||||||||||||
| † | Amount denominated in U.S. dollars, unless otherwise noted. |
At August 31, 2021, Core Fixed Income Fund had open exchange-traded futures contracts as described below.
The unrealized appreciation (depreciation) on the open contracts reflected in the accompanying financial statements were as follows:
| Open Futures Contracts | Number of Contracts | Expiration Date (Month/Year) | Notional Amount | Market Value | Unrealized Appreciation/ (Depreciation) | |||||||||||||||
| Contracts to Buy: | ||||||||||||||||||||
90-Day Eurodollar December Futures | 180 | 12/23 | $ | 44,552,575 | $ | 44,565,750 | $ | 13,175 | ||||||||||||
90-Day Eurodollar June Futures | 89 | 6/23 | 22,081,144 | 22,107,599 | 26,455 | |||||||||||||||
Australian Government 10-Year Bond September Futures | 42 | 9/21 | 4,351,688 | 4,479,994 | 128,306 | |||||||||||||||
Euro-OAT September Futures | 24 | 9/21 | 4,483,638 | 4,567,518 | 83,880 | |||||||||||||||
U.S. Treasury 2-Year Note December Futures | 324 | 12/21 | 71,342,511 | 71,386,313 | 43,802 | |||||||||||||||
U.S. Treasury 5-Year Note December Futures | 435 | 12/21 | 53,739,704 | 53,817,657 | 77,953 | |||||||||||||||
U.S. Treasury Ultra Long Bond December Futures | 199 | 12/21 | 39,386,404 | 39,258,969 | (127,435 | ) | ||||||||||||||
|
| |||||||||||||||||||
| 246,136 | ||||||||||||||||||||
|
| |||||||||||||||||||
| Contracts to Sell: | ||||||||||||||||||||
90-Day Eurodollar December Futures | 347 | 12/21 | 86,491,992 | 86,598,187 | (106,195 | ) | ||||||||||||||
Euro-Bund September Futures | 106 | 9/21 | 21,636,913 | 21,959,234 | (322,321 | ) | ||||||||||||||
Japan Government 10-Year Bond September Futures | 5 | 9/21 | 6,889,515 | 6,915,421 | (25,906 | ) | ||||||||||||||
U.S. Treasury 2-Year Note December Futures | 12 | 12/21 | 2,642,189 | 2,643,937 | (1,748 | ) | ||||||||||||||
U.S. Treasury 10-Year Note December Futures | 330 | 12/21 | 43,997,469 | 44,039,531 | (42,062 | ) | ||||||||||||||
U.S. Treasury Long Bond December Futures | 65 | 12/21 | 10,606,802 | 10,592,968 | 13,834 | |||||||||||||||
U.S. Treasury Ultra Long Bond December Futures | 2 | 12/21 | 392,438 | 394,562 | (2,124 | ) | ||||||||||||||
U.S. Ultra Long Bond December Futures | 55 | 12/21 | 8,150,899 | 8,140,860 | 10,039 | |||||||||||||||
|
| |||||||||||||||||||
| (476,483 | ) | |||||||||||||||||||
|
| |||||||||||||||||||
Net Unrealized Depreciation on Open Exchange-Traded Futures Contracts | $ | (230,347 | ) | |||||||||||||||||
|
| |||||||||||||||||||
See Notes to Financial Statements.
215
| Schedules of Investments |
| (continued) |
| Core Fixed Income Fund | ||||||
At August 31, 2021, Core Fixed Income Fund had deposited cash of $2,803,029 with a broker or brokers as margin collateral on an open exchange-traded futures contracts.
At August 31, 2021, Core Fixed Income Fund had open forward foreign currency contracts as described below.
The unrealized appreciation (depreciation) on the open contracts reflected in the accompanying financial statements were as follows:
| Foreign Currency | Local Currency | In Exchange For | Counterparty | Market Value | Settlement Date | Unrealized Appreciation/ (Depreciation) | ||||||||||||||||||||||
| Contracts to Buy: | ||||||||||||||||||||||||||||
Australian Dollar | 6,473,202 | USD | 4,845,910 | CITI | $ | 4,736,720 | 10/19/21 | $ | (109,190 | ) | ||||||||||||||||||
Brazilian Real | 174,640 | USD | 32,898 | CITI | 33,553 | 10/19/21 | 655 | |||||||||||||||||||||
British Pound | 1,655,489 | USD | 2,292,165 | CITI | 2,276,290 | 10/19/21 | (15,875 | ) | ||||||||||||||||||||
Canadian Dollar | 14,501,678 | USD | 11,545,683 | CITI | 11,495,200 | 10/19/21 | (50,483 | ) | ||||||||||||||||||||
Indonesian Rupiah | 44,149,999,820 | USD | 2,991,395 | CITI | 3,081,953 | 10/19/21 | 90,558 | |||||||||||||||||||||
Japanese Yen | 521,992,622 | USD | 4,756,895 | CITI | 4,746,637 | 10/19/21 | (10,258 | ) | ||||||||||||||||||||
Mexican Peso | 16,828,969 | USD | 830,251 | CITI | 832,431 | 10/19/21 | 2,180 | |||||||||||||||||||||
Russian Ruble | 340,788,779 | USD | 4,510,652 | CITI | 4,615,041 | 10/19/21 | 104,389 | |||||||||||||||||||||
Russian Ruble | 52,048,191 | USD | 700,231 | CITI | 704,849 | 10/19/21 | 4,618 | |||||||||||||||||||||
South African Rand | 8,680,000 | USD | 596,830 | CITI | 593,716 | 10/19/21 | (3,114 | ) | ||||||||||||||||||||
|
| |||||||||||||||||||||||||||
| 13,480 | ||||||||||||||||||||||||||||
|
| |||||||||||||||||||||||||||
| Contracts to Sell: | ||||||||||||||||||||||||||||
Euro | 680,311 | USD | 807,944 | CITI | 804,037 | 10/19/21 | 3,907 | |||||||||||||||||||||
Euro | 450,000 | USD | 533,838 | CITI | 531,840 | 10/19/21 | 1,998 | |||||||||||||||||||||
Indonesian Rupiah | 20,713,719,420 | USD | 1,448,816 | CITI | 1,445,951 | 10/19/21 | 2,865 | |||||||||||||||||||||
Mexican Peso | 14,360,000 | USD | 707,675 | CITI | 710,305 | 10/19/21 | (2,630 | ) | ||||||||||||||||||||
Mexican Peso | 64,911,874 | USD | 3,208,852 | CITI | 3,210,809 | 10/19/21 | (1,957 | ) | ||||||||||||||||||||
|
| |||||||||||||||||||||||||||
| 4,183 | ||||||||||||||||||||||||||||
|
| |||||||||||||||||||||||||||
Net Unrealized Appreciation on Open Forward Foreign Currency Contracts | $ | 17,663 | ||||||||||||||||||||||||||
|
| |||||||||||||||||||||||||||
At August 31, 2021, Core Fixed Income Fund held the following OTC Interest Rate Swap Contract:
| Pay Floating Rate | Floating Rate Index | Fixed Rate | Maturity Date | Counterparty | Notional Amount | Market Value | Upfront Payment Paid | Unrealized Depreciation | ||||||||||||||||||||||
| Pay | 3-Month BRL-CDI-Compounded | 7.024% | 1/4/27 | CITI | BRL 18,325,000 | $ | (142,602) | $ | 7,443 | $ | (150,045) | |||||||||||||||||||
|
|
|
|
|
| |||||||||||||||||||||||||
At August 31, 2021, Core Fixed Income Fund held the following Centrally Cleared Interest Rate Swap Contracts:
| Receive Floating Rate | Floating Rate Index | Fixed Rate | Maturity Date | Payment Frequency | Notional Amount | Market Value | Upfront Payment Paid/ (Received) | Unrealized Appreciation/ (Depreciation) | ||||||||||||||||||||||||||
| Receive | 3-Month USD-LIBOR | 0.450% | 5/15/27 | 6-Month | USD | 23,485,000 | $ | 636,729 | $ | (22,976 | ) | $ | 659,705 | |||||||||||||||||||||
| Receive | 3-Month USD-LIBOR | 0.900% | 3/17/50 | 6-Month | USD | 1,492,000 | 260,892 | (45 | ) | 260,937 | ||||||||||||||||||||||||
| Receive | 3-Month USD-LIBOR | 1.000% | 2/15/47 | 6-Month | USD | 9,250,000 | 1,291,057 | 110,349 | 1,180,708 | |||||||||||||||||||||||||
| Receive | 3-Month USD-LIBOR | 1.200% | 10/7/50 | 6-Month | USD | 662,000 | 69,037 | (290 | ) | 69,327 | ||||||||||||||||||||||||
| Receive | 3-Month USD-LIBOR | 1.225% | 2/15/47 | 6-Month | USD | 724,000 | 65,563 | 831 | 64,732 | |||||||||||||||||||||||||
| Receive | 3-Month USD-LIBOR | 1.250% | 2/15/28 | 6-Month | USD | 5,730,000 | (77,979 | ) | 5,733 | (83,712 | ) | |||||||||||||||||||||||
| Receive | 3-Month USD-LIBOR | 1.350% | 2/15/28 | 6-Month | USD | 10,365,000 | (207,106 | ) | (37,165 | ) | (169,941 | ) | ||||||||||||||||||||||
| Receive | 3-Month USD-LIBOR | 1.630% | 2/15/47 | 6-Month | USD | 5,745,000 | 23,710 | 62,000 | (38,290 | ) | ||||||||||||||||||||||||
See Notes to Financial Statements.
216
| Schedules of Investments |
| (continued) |
| Core Fixed Income Fund | ||||||
| Receive Floating Rate | Floating Rate Index | Fixed Rate | Maturity Date | Payment Frequency | Notional Amount | Market Value | Upfront Payment Paid/ (Received) | Unrealized Appreciation/ (Depreciation) | ||||||||||||||||||||||||||
| Receive | 3-Month USD-LIBOR | 1.671% | 7/9/51 | 6-Month | USD | 1,672,000 | $ | (12,844 | ) | $ | (7,118 | ) | $ | (5,726 | ) | |||||||||||||||||||
| Receive | 3-Month USD-LIBOR | 2.000% | 2/15/47 | 6-Month | USD | 3,485,000 | (272,785 | ) | 5,177 | (277,962 | ) | |||||||||||||||||||||||
| Receive | 3-Month USD-LIBOR | 2.000% | 6/3/51 | 6-Month | USD | 85,000 | (7,733 | ) | 90 | (7,823 | ) | |||||||||||||||||||||||
| Receive | Secured Overnight Financing Rate | 1.520% | 2/15/47 | 12-Month | USD | 997,000 | (30,286 | ) | (31,544 | ) | 1,258 | |||||||||||||||||||||||
| Receive | Secured Overnight Financing Rate | 1.729% | 2/15/47 | 12-Month | USD | 1,505,000 | (121,049 | ) | — | (121,049 | ) | |||||||||||||||||||||||
| Receive | U.S. Federal Funds Effective Rate Index | 0.560% | 7/20/45 | 12-Month | USD | 730,000 | 129,738 | — | 129,738 | |||||||||||||||||||||||||
|
|
|
|
|
| |||||||||||||||||||||||||||||
| $ | 1,746,944 | $ | 85,042 | $ | 1,661,902 | |||||||||||||||||||||||||||||
|
|
|
|
|
| |||||||||||||||||||||||||||||
At August 31, 2021, Core Fixed Income Fund deposited cash collateral with brokers in the amount of $1,370,679 for open centrally cleared swap contracts.
Currency Abbreviations used in this schedule: | Counterparty Abbreviations used in this schedule: | |||||
| AUD | — Australian Dollar | BCLY | — Barclays Bank PLC | |||
| BRL | — Brazilian Real | CITI | — Citigroup Global Markets Inc. | |||
| CAD | — Canadian Dollar | GSC | — Goldman Sachs & Co. | |||
| EUR | — Euro | |||||
| GBP | — British Pound | |||||
| IDR | — Indonesian Rupiah | |||||
| JPY | — Japanese Yen | |||||
| MXN | — Mexican Peso | |||||
| RUB | — Russian Ruble | |||||
| USD | — United States Dollar | |||||
See pages 296-297 for definitions of ratings.
See Notes to Financial Statements.
217
| Schedules of Investments |
| (continued) |
| High Yield Fund | ||||||||||
| Face Amount/Units† | Rating†† | Security | Value | |||||||
CORPORATE BONDS & NOTES — 86.9% | ||||||||||
Advertising — 0.4% | ||||||||||
| $ | 400,000 | CCC | Clear Channel Outdoor Holdings Inc., Company Guaranteed Notes, 7.500% due 6/1/29(a) | $ | 414,500 | |||||
| 472,000 | CCC+ | Terrier Media Buyer Inc., Company Guaranteed Notes, 8.875% due 12/15/27(a) | 503,270 | |||||||
|
| |||||||||
| Total Advertising | 917,770 | |||||||||
|
| |||||||||
Aerospace/Defense — 0.9% | ||||||||||
| 290,000 | BBB- | Boeing Co. (The), Senior Unsecured Notes, 5.150% due 5/1/30 | 343,784 | |||||||
| 491,000 | BB | Moog Inc., Company Guaranteed Notes, 4.250% due 12/15/27(a) | 505,116 | |||||||
| 495,000 | B | Spirit AeroSystems Inc., Secured Notes, 7.500% due 4/15/25(a) | 524,700 | |||||||
| TransDigm Inc.: | ||||||||||
| 280,000 | B- | Company Guaranteed Notes, 4.625% due 1/15/29(a) | 276,850 | |||||||
Senior Secured Notes: | ||||||||||
| 110,000 | B+ | 8.000% due 12/15/25(a) | 117,837 | |||||||
| 100,000 | B+ | 6.250% due 3/15/26(a) | 105,250 | |||||||
|
| |||||||||
| Total Aerospace/Defense | 1,873,537 | |||||||||
|
| |||||||||
Airlines — 2.8% | ||||||||||
| 755,000 | BB- | Air Canada, Senior Secured Notes, 3.875% due 8/15/26(a) | 760,670 | |||||||
| 886,000 | B | American Airlines Inc., Senior Secured Notes, 11.750% due 7/15/25(a) | 1,101,076 | |||||||
| American Airlines Inc./AAdvantage Loyalty IP Ltd., Senior Secured Notes: | ||||||||||
| 188,000 | Ba2(b) | 5.500% due 4/20/26(a) | 198,387 | |||||||
| 301,000 | Ba2(b) | 5.750% due 4/20/29(a) | 325,447 | |||||||
| 200,000 | BBB- | Delta Air Lines Inc., Senior Secured Notes, 7.000% due 5/1/25(a) | 233,872 | |||||||
| 370,000 | Baa1(b) | Delta Air Lines Inc./SkyMiles IP Ltd., Senior Secured Notes, 4.750% due 10/20/28(a) | 411,890 | |||||||
| 429,000 | Ba3(b) | Hawaiian Brand Intellectual Property Ltd./HawaiianMiles Loyalty Ltd., Senior Secured Notes, 5.750% due 1/20/26(a) | 452,329 | |||||||
| 670,000 | Baa3(b) | Mileage Plus Holdings LLC/Mileage Plus Intellectual Property Assets Ltd., Senior Secured Notes, 6.500% due 6/20/27(a) | 728,692 | |||||||
| 290,000 | NR | Spirit Airlines Inc., Senior Unsecured Notes, 1.000% due 5/15/26 | 269,149 | |||||||
| 312,747 | Ba2(b) | Spirit Loyalty Cayman Ltd./Spirit IP Cayman Ltd., Senior Secured Notes, 8.000% due 9/20/25(a) | 354,577 | |||||||
| 196,193 | BBB- | United Airlines Class B Pass Through Trust, Pass-Thru Certificates, 4.875% due 1/15/26 | 206,774 | |||||||
| United Airlines Inc., Senior Secured Notes: | ||||||||||
| 423,000 | BB- | 4.375% due 4/15/26(a) | 439,658 | |||||||
| 512,000 | BB- | 4.625% due 4/15/29(a) | 531,955 | |||||||
|
| |||||||||
| Total Airlines | 6,014,476 | |||||||||
|
| |||||||||
Auto Manufacturers — 3.1% | ||||||||||
| 425,000 | Ba2(b) | Allison Transmission Inc., Company Guaranteed Notes, 3.750% due 1/30/31(a) | 425,062 | |||||||
| Ford Motor Co., Senior Unsecured Notes: | ||||||||||
| 200,000 | BB+ | 9.000% due 4/22/25 | 244,590 | |||||||
| 393,000 | BB+ | 9.625% due 4/22/30 | 560,866 | |||||||
| 218,000 | BB+ | 7.450% due 7/16/31 | 287,149 | |||||||
| 1,141,000 | BB+ | 4.750% due 1/15/43 | 1,232,309 | |||||||
| Ford Motor Credit Co. LLC, Senior Unsecured Notes: | ||||||||||
| 1,270,000 | BB+ | 3.375% due 11/13/25 | 1,316,037 | |||||||
| 300,000 | BB+ | 4.542% due 8/1/26 | 326,250 | |||||||
| 300,000 | BB+ | 2.900% due 2/16/28 | 299,292 | |||||||
| 320,000 | BB+ | 5.113% due 5/3/29 | 362,896 | |||||||
| 550,000 | BB+ | 4.000% due 11/13/30 | 582,458 | |||||||
| 500,000 | B+ | JB Poindexter & Co., Inc., Senior Unsecured Notes, 7.125% due 4/15/26(a) | 528,125 | |||||||
| 335,000 | B+ | PM General Purchaser LLC, Senior Secured Notes, 9.500% due 10/1/28(a) | 364,714 | |||||||
|
| |||||||||
| Total Auto Manufacturers | 6,529,748 | |||||||||
|
| |||||||||
See Notes to Financial Statements.
218
| Schedules of Investments |
| (continued) |
| High Yield Fund | ||||||||||
| Face Amount/Units† | Rating†† | Security | Value | |||||||
Auto Parts & Equipment — 0.6% | ||||||||||
| American Axle & Manufacturing Inc., Company Guaranteed Notes: | ||||||||||
| $ | 450,000 | B+ | 6.500% due 4/1/27 | $ | 473,063 | |||||
| 540,000 | B+ | 5.000% due 10/1/29 | 540,570 | |||||||
| 342,000 | B- | Titan International Inc., Senior Secured Notes, 7.000% due 4/30/28(a) | 357,889 | |||||||
|
| |||||||||
| Total Auto Parts & Equipment | 1,371,522 | |||||||||
|
| |||||||||
Banks — 1.0% | ||||||||||
| 230,000 | B+ | Barclays PLC, Junior Subordinated Notes, 8.000% (5-Year CMT Index + 5.672%)(c)(d) | 261,481 | |||||||
| 200,000 | BBB- | Credit Agricole SA, Junior Subordinated Notes, 8.125% (5-Year USD Swap Rate + 6.185%)(a)(c)(d) | 243,875 | |||||||
| Credit Suisse Group AG, Junior Subordinated Notes: | ||||||||||
| 230,000 | BB- | 6.375% (5-Year CMT Index + 4.822%)(a)(c)(d) | 254,583 | |||||||
| 200,000 | BB- | 7.500% (5-Year USD Swap Rate + 4.600%)(a)(c)(d) | 216,100 | |||||||
| 110,000 | BBB- | Goldman Sachs Group Inc. (The), Subordinated Notes, 5.150% due 5/22/45 | 147,524 | |||||||
| 360,000 | BB+ | Intesa Sanpaolo SpA, Subordinated Notes, 4.198% due 6/1/32(a) | 371,087 | |||||||
| 520,000 | BB+ | UniCredit SpA, Subordinated Notes, 5.459% (5-Year CMT Index + 4.750%) due 6/30/35(a)(c) | 575,345 | |||||||
|
| |||||||||
| Total Banks | 2,069,995 | |||||||||
|
| |||||||||
Beverages — 0.1% | ||||||||||
| 308,000 | CCC+ | Triton Water Holdings Inc., Senior Unsecured Notes, 6.250% due 4/1/29(a) | 305,263 | |||||||
|
| |||||||||
Biotechnology — 0.1% | ||||||||||
| 110,000 | NR | Halozyme Therapeutics Inc., Senior Unsecured Notes, 0.250% due 3/1/27(a) | 100,668 | |||||||
|
| |||||||||
Building Materials — 1.0% | ||||||||||
| 210,000 | B- | Cornerstone Building Brands Inc., Company Guaranteed Notes, 6.125% due 1/15/29(a) | 224,763 | |||||||
| 214,000 | CCC | CP Atlas Buyer Inc., Senior Unsecured Notes, 7.000% due 12/1/28(a) | 218,548 | |||||||
| 350,000 | B+ | Griffon Corp., Company Guaranteed Notes, 5.750% due 3/1/28 | 371,854 | |||||||
| 380,000 | B+ | SRM Escrow Issuer LLC, Senior Secured Notes, 6.000% due 11/1/28(a) | 403,275 | |||||||
| Standard Industries Inc., Senior Unsecured Notes: | ||||||||||
| 252,000 | BB- | 5.000% due 2/15/27(a) | 260,820 | |||||||
| 248,000 | BB- | 4.375% due 7/15/30(a) | 255,106 | |||||||
| 440,000 | BB | Summit Materials LLC/Summit Materials Finance Corp., Company Guaranteed Notes, 5.250% due 1/15/29(a) | 466,418 | |||||||
|
| |||||||||
| Total Building Materials | 2,200,784 | |||||||||
|
| |||||||||
Chemicals — 1.0% | ||||||||||
| 550,000 | B+ | Consolidated Energy Finance SA, Senior Unsecured Notes, 6.875% due 6/15/25(a) | 568,562 | |||||||
| 230,000 | BB- | Kraton Polymers LLC/Kraton Polymers Capital Corp., Company Guaranteed Notes, 4.250% due 12/15/25(a) | 236,519 | |||||||
| 501,000 | BB | Methanex Corp., Senior Unsecured Notes, 5.125% due 10/15/27 | 546,278 | |||||||
| 300,000 | BB- | Minerals Technologies Inc., Company Guaranteed Notes, 5.000% due 7/1/28(a) | 314,741 | |||||||
| 330,000 | BB+ | Olin Corp., Senior Unsecured Notes, 5.000% due 2/1/30 | 354,592 | |||||||
|
| |||||||||
| Total Chemicals | 2,020,692 | |||||||||
|
| |||||||||
Coal — 0.2% | ||||||||||
| 516,000 | BB | SunCoke Energy Inc., Senior Secured Notes, 4.875% due 6/30/29(a) | 523,281 | |||||||
|
| |||||||||
Commercial Services — 7.6% | ||||||||||
| 330,000 | BB- | ADT Security Corp.(The), Senior Secured Notes, 4.125% due 8/1/29(a) | 329,993 | |||||||
| 509,000 | BB- | Adtalem Global Education Inc., Senior Secured Notes, 5.500% due 3/1/28(a) | 521,735 | |||||||
| 525,000 | CCC | Ahern Rentals Inc., Secured Notes, 7.375% due 5/15/23(a) | 512,794 | |||||||
| Allied Universal Holdco LLC/Allied Universal Finance Corp.: | ||||||||||
| 280,000 | B | Senior Secured Notes, 6.625% due 7/15/26(a) | 299,600 | |||||||
| 545,000 | CCC+ | Senior Unsecured Notes, 6.000% due 6/1/29(a) | 545,657 | |||||||
See Notes to Financial Statements.
219
| Schedules of Investments |
| (continued) |
| High Yield Fund | ||||||||||
| Face Amount/Units† | Rating†† | Security | Value | |||||||
Commercial Services — 7.6% — (continued) | ||||||||||
| Allied Universal Holdco LLC/Allied Universal Finance Corp./Atlas Luxco 4 Sarl, Senior Secured Notes: | ||||||||||
| $ | 640,000 | B | 4.625% due 6/1/28(a) | $ | 643,150 | |||||
| 328,000 | B- | Alta Equipment Group Inc., Secured Notes, 5.625% due 4/15/26(a) | 337,430 | |||||||
| 505,000 | CCC | APX Group Inc., Company Guaranteed Notes, 5.750% due 7/15/29(a) | 505,631 | |||||||
| 500,000 | BB- | Brink’s Co. (The), Company Guaranteed Notes, 4.625% due 10/15/27(a) | 525,790 | |||||||
| 330,000 | B+ | Carriage Services Inc., Company Guaranteed Notes, 4.250% due 5/15/29(a) | 330,927 | |||||||
| CoreCivic Inc., Company Guaranteed Notes: | ||||||||||
| 80,000 | BB- | 4.625% due 5/1/23 | 81,357 | |||||||
| 310,000 | BB- | 8.250% due 4/15/26 | 327,644 | |||||||
| 455,000 | B- | Deluxe Corp., Company Guaranteed Notes, 8.000% due 6/1/29(a) | 487,783 | |||||||
| 495,000 | B | Garda World Security Corp., Senior Secured Notes, 4.625% due 2/15/27(a) | 496,856 | |||||||
| 410,000 | BB+ | Gartner Inc., Company Guaranteed Notes, 3.625% due 6/15/29(a) | 422,628 | |||||||
| 172,000 | B+ | Jaguar Holding Co. II/PPD Development LP, Company Guaranteed Notes, 5.000% due 6/15/28(a) | 185,545 | |||||||
| 355,000 | BB | Korn Ferry, Company Guaranteed Notes, 4.625% due 12/15/27(a) | 368,017 | |||||||
| 409,000 | B3(b) | Legends Hospitality Holding Co. LLC/Legends Hospitality Co.-Issuer Inc., Senior Secured Notes, 5.000% due 2/1/26(a) | 421,781 | |||||||
| 505,000 | CCC | Metis Merger Sub LLC, Senior Unsecured Notes, 6.500% due 5/15/29(a) | 505,702 | |||||||
| 610,000 | B | MoneyGram International Inc., Senior Secured Notes, 5.375% due 8/1/26(a) | 622,963 | |||||||
| 1,196,000 | B- | MPH Acquisition Holdings LLC, Company Guaranteed Notes, 5.750% due 11/1/28(a) | 1,143,579 | |||||||
| 396,000 | BB | Nielsen Finance LLC/Nielsen Finance Co., Company Guaranteed Notes, 5.875% due 10/1/30(a) | 424,209 | |||||||
| 900,000 | B+ | Paysafe Finance PLC/Paysafe Holdings US Corp., Senior Secured Notes, 4.000% due 6/15/29(a) | 867,168 | |||||||
| Prime Security Services Borrower LLC/Prime Finance Inc.: | ||||||||||
| 960,000 | B- | Secured Notes, 6.250% due 1/15/28(a) | 996,000 | |||||||
| 515,000 | BB- | Senior Secured Notes, 3.375% due 8/31/27(a) | 497,619 | |||||||
| 214,000 | B | Rent-A-Center Inc., Company Guaranteed Notes, 6.375% due 2/15/29(a) | 230,853 | |||||||
| 400,000 | B+ | Sotheby’s, Senior Secured Notes, 7.375% due 10/15/27(a) | 424,920 | |||||||
| 460,000 | B+ | Sotheby’s/Bidfair Holdings Inc., Senior Secured Notes, 5.875% due 6/1/29(a)(i) | 475,157 | |||||||
| 310,000 | BB | Square Inc., Senior Unsecured Notes, 3.500% due 6/1/31(a) | 322,206 | |||||||
| 382,000 | CCC+ | StoneMor Inc., Senior Secured Notes, 8.500% due 5/15/29(a) | 391,174 | |||||||
| 476,000 | CCC | Team Health Holdings Inc., Company Guaranteed Notes, 6.375% due 2/1/25(a) | 455,175 | |||||||
| 60,000 | B+ | Terminix Co. LLC (The), Senior Unsecured Notes, 7.450% due 8/15/27 | 71,871 | |||||||
| 425,000 | BB | TriNet Group Inc., Company Guaranteed Notes, 3.500% due 3/1/29(a) | 428,719 | |||||||
| 500,000 | BB | United Rentals North America Inc., Company Guaranteed Notes, 5.250% due 1/15/30 | 548,775 | |||||||
| 395,000 | BB- | WW International Inc., Senior Secured Notes, 4.500% due 4/15/29(a) | 391,050 | |||||||
|
| |||||||||
| Total Commercial Services | 16,141,458 | |||||||||
|
| |||||||||
Computers — 0.9% | ||||||||||
| 505,000 | CCC+ | Ahead DB Holdings LLC, Company Guaranteed Notes, 6.625% due 5/1/28(a) | 514,469 | |||||||
| 350,000 | CCC+ | Banff Merger Sub Inc., Senior Unsecured Notes, 9.750% due 9/1/26(a) | 367,500 | |||||||
| 729,000 | B+ | NCR Corp., Company Guaranteed Notes, 5.125% due 4/15/29(a) | 756,766 | |||||||
| 330,000 | B- | Vericast Merger Sub Inc., Senior Secured Notes, 11.000% due 9/15/26(a) | 350,196 | |||||||
|
| |||||||||
| Total Computers | 1,988,931 | |||||||||
|
| |||||||||
Cosmetics/Personal Care — 0.3% | ||||||||||
| 685,000 | BB | Edgewell Personal Care Co., Company Guaranteed Notes, 4.125% due 4/1/29(a) | 690,138 | |||||||
|
| |||||||||
Distribution/Wholesale — 0.5% | ||||||||||
| 108,159 | NR | American News Co. LLC, Secured Notes, 8.500% (8.500% cash or 10.000% PIK) due 9/1/26(a)(e) | 125,107 | |||||||
| 893,000 | BB- | H&E Equipment Services Inc., Company Guaranteed Notes, 3.875% due 12/15/28(a) | 898,313 | |||||||
|
| |||||||||
| Total Distribution/Wholesale | 1,023,420 | |||||||||
|
| |||||||||
See Notes to Financial Statements.
220
| Schedules of Investments |
| (continued) |
| High Yield Fund | ||||||||||
| Face Amount/Units† | Rating†† | Security | Value | |||||||
Diversified Financial Services — 4.3% | ||||||||||
| $ | 100,000 | NR | Alliance Data Systems Corp., Company Guaranteed Notes, 4.750% due 12/15/24(a) | $ | 102,750 | |||||
| 500,000 | CCC | Aretec Escrow Issuer Inc., Senior Unsecured Notes, 7.500% due 4/1/29(a) | 524,375 | |||||||
| 724,000 | BB- | Burford Capital Global Finance LLC, Company Guaranteed Notes, 6.250% due 4/15/28(a) | 764,736 | |||||||
| 500,000 | BB | Credit Acceptance Corp., Company Guaranteed Notes, 6.625% due 3/15/26(a) | 529,375 | |||||||
| 505,000 | B- | Curo Group Holdings Corp., Senior Secured Notes, 7.500% due 8/1/28(a) | 504,369 | |||||||
| 900,000 | Ba3(b) | Enact Holdings Inc., Senior Unsecured Notes, 6.500% due 8/15/25(a) | 973,125 | |||||||
| 700,000 | B- | Enova International Inc., Company Guaranteed Notes, 8.500% due 9/15/25(a) | 723,625 | |||||||
| 1,078,721 | B1(b) | Global Aircraft Leasing Co., Ltd., Senior Unsecured Notes, 6.500% (6.500% cash or 7.250% PIK) due 9/15/24(a)(e) | 1,070,631 | |||||||
| 256,000 | BB- | goeasy Ltd., Company Guaranteed Notes, 4.375% due 5/1/26(a) | 264,320 | |||||||
| LD Holdings Group LLC, Company Guaranteed Notes: | ||||||||||
| 350,000 | B+ | 6.500% due 11/1/25(a) | 357,438 | |||||||
| 270,000 | B+ | 6.125% due 4/1/28(a) | 265,685 | |||||||
| Midcap Financial Issuer Trust, Senior Unsecured Notes: | ||||||||||
| 300,000 | B+ | 6.500% due 5/1/28(a) | 314,313 | |||||||
| 210,000 | B+ | 5.625% due 1/15/30(a) | 209,245 | |||||||
| 523,000 | B | NFP Corp., Senior Secured Notes, 4.875% due 8/15/28(a) | 532,806 | |||||||
| 575,000 | BB- | OneMain Finance Corp., Company Guaranteed Notes, 6.875% due 3/15/25 | 651,906 | |||||||
| Quicken Loans LLC/Quicken Loans Co.-Issuer Inc., Company Guaranteed Notes: | ||||||||||
| 375,000 | BB+ | 3.625% due 3/1/29(a) | 383,438 | |||||||
| 660,000 | BB+ | 3.875% due 3/1/31(a) | 676,079 | |||||||
| 70,000 | BB+ | Rocket Mortgage LLC, Company Guaranteed Notes, 5.250% due 1/15/28(a) | 73,762 | |||||||
| 127,000 | BB- | StoneX Group Inc., Senior Secured Notes, 8.625% due 6/15/25(a) | 137,573 | |||||||
|
| |||||||||
| Total Diversified Financial Services | 9,059,551 | |||||||||
|
| |||||||||
Electric — 1.7% | ||||||||||
| 408,000 | B+ | Calpine Corp., Senior Unsecured Notes, 5.000% due 2/1/31(a) | 415,683 | |||||||
| 400,000 | BB | Clearway Energy Operating LLC, Company Guaranteed Notes, 5.000% due 9/15/26 | 411,196 | |||||||
| 352,000 | BB | NextEra Energy Operating Partners LP, Company Guaranteed Notes, 4.500% due 9/15/27(a) | 381,177 | |||||||
| NRG Energy Inc., Company Guaranteed Notes: | ||||||||||
| 255,000 | BB+ | 5.750% due 1/15/28 | 272,850 | |||||||
| 138,000 | BB+ | 3.375% due 2/15/29(a) | 138,862 | |||||||
| 230,000 | BB+ | 3.625% due 2/15/31(a) | 233,747 | |||||||
| 520,000 | BB- | Pattern Energy Operations LP/Pattern Energy Operations Inc., Company Guaranteed Notes, 4.500% due 8/15/28(a) | 543,421 | |||||||
| Talen Energy Supply LLC, Senior Secured Notes: | ||||||||||
| 40,000 | B+ | 7.250% due 5/15/27(a) | 34,637 | |||||||
| 820,000 | B+ | 6.625% due 1/15/28(a) | 704,897 | |||||||
| 508,000 | BBB- | Vistra Operations Co. LLC, Senior Secured Notes, 4.300% due 7/15/29(a) | 548,444 | |||||||
|
| |||||||||
| Total Electric | 3,684,914 | |||||||||
|
| |||||||||
Electrical Components & Equipment — 0.4% | ||||||||||
| 527,000 | B | Energizer Holdings Inc., Company Guaranteed Notes, 4.375% due 3/31/29(a) | 529,171 | |||||||
| 360,000 | BB+ | EnerSys, Company Guaranteed Notes, 4.375% due 12/15/27(a) | 378,895 | |||||||
|
| |||||||||
| Total Electrical Components & Equipment | 908,066 | |||||||||
|
| |||||||||
Electronics — 0.8% | ||||||||||
| 581,000 | BB- | Imola Merger Corp., Senior Secured Notes, 4.750% due 5/15/29(a) | 602,061 | |||||||
| 310,000 | BB+ | Sensata Technologies BV, Company Guaranteed Notes, 4.000% due 4/15/29(a) | 321,101 | |||||||
| 330,000 | BB+ | Sensata Technologies Inc., Company Guaranteed Notes, 4.375% due 2/15/30(a) | 354,371 | |||||||
| 475,000 | BB- | TTM Technologies Inc., Company Guaranteed Notes, 4.000% due 3/1/29(a) | 481,531 | |||||||
|
| |||||||||
| Total Electronics | 1,759,064 | |||||||||
|
| |||||||||
Energy — Alternate Sources — 0.1% | ||||||||||
| 250,000 | B- | Sunnova Energy Corp., Company Guaranteed Notes, 5.875% due 9/1/26(a) | 252,113 | |||||||
|
| |||||||||
See Notes to Financial Statements.
221
| Schedules of Investments |
| (continued) |
| High Yield Fund | ||||||||||
| Face Amount/Units† | Rating†† | Security | Value | |||||||
Engineering & Construction — 0.5% | ||||||||||
| $ | 322,000 | B | Brundage-Bone Concrete Pumping Holdings Inc., Secured Notes, 6.000% due 2/1/26(a) | $ | 336,490 | |||||
| 270,000 | BB+ | TopBuild Corp., Company Guaranteed Notes, 3.625% due 3/15/29(a) | 269,024 | |||||||
| 499,000 | B- | VM Consolidated Inc., Company Guaranteed Notes, 5.500% due 4/15/29(a) | 510,227 | |||||||
|
| |||||||||
| Total Engineering & Construction | 1,115,741 | |||||||||
|
| |||||||||
Entertainment — 2.6% | ||||||||||
| 748,000 | B- | Allen Media LLC/Allen Media Co.-Issuer Inc., Company Guaranteed Notes, 10.500% due 2/15/28(a) | 723,888 | |||||||
| 650,000 | B | Banijay Entertainment SASU, Senior Secured Notes, 5.375% due 3/1/25(a) | 668,687 | |||||||
| 194,000 | B | Boyne USA Inc., Senior Unsecured Notes, 4.750% due 5/15/29(a) | 200,063 | |||||||
| 641,000 | B | Caesars Entertainment Inc., Senior Secured Notes, 6.250% due 7/1/25(a) | 678,306 | |||||||
| 295,000 | B | Cinemark USA Inc., Company Guaranteed Notes, 5.875% due 3/15/26(a) | 293,894 | |||||||
| 190,000 | B | Everi Holdings Inc., Company Guaranteed Notes, 5.000% due 7/15/29(a) | 194,703 | |||||||
| 360,000 | BB | International Game Technology PLC, Senior Secured Notes, 4.125% due 4/15/26(a) | 374,328 | |||||||
| Premier Entertainment Sub LLC/Premier Entertainment Finance Corp., Company Guaranteed Notes: | ||||||||||
| 282,000 | CCC+ | 5.625% due 9/1/29(a) | 289,594 | |||||||
| 282,000 | CCC+ | 5.875% due 9/1/31(a) | 289,511 | |||||||
| 368,000 | B- | Scientific Games International Inc., Company Guaranteed Notes, 7.000% due 5/15/28(a) | 397,146 | |||||||
| SeaWorld Parks & Entertainment Inc.: | ||||||||||
| 530,000 | B- | Company Guaranteed Notes, 5.250% due 8/15/29(a) | 530,154 | |||||||
| 475,000 | BB- | Senior Secured Notes, 8.750% due 5/1/25(a) | 514,187 | |||||||
| 167,000 | BB- | Speedway Motorsports LLC/Speedway Funding II Inc., Senior Unsecured Notes, 4.875% due 11/1/27(a) | 171,381 | |||||||
| 268,000 | BB- | Wynn Resorts Finance LLC/Wynn Resorts Capital Corp., Senior Unsecured Notes, 7.750% due 4/15/25(a) | 285,096 | |||||||
|
| |||||||||
| Total Entertainment | 5,610,938 | |||||||||
|
| |||||||||
Environmental Control — 0.4% | ||||||||||
| 323,000 | BB- | GFL Environmental Inc., Senior Secured Notes, 3.750% due 8/1/25(a) | 333,094 | |||||||
| 480,000 | B+ | Harsco Corp., Company Guaranteed Notes, 5.750% due 7/31/27(a) | 498,600 | |||||||
|
| |||||||||
| Total Environmental Control | 831,694 | |||||||||
|
| |||||||||
Food — 2.4% | ||||||||||
| 400,000 | BB | Albertsons Cos Inc./Safeway Inc./New Albertsons LP/Albertsons LLC, Company Guaranteed Notes, 5.875% due 2/15/28(a) | 429,500 | |||||||
| 700,000 | B | C&S Group Enterprises LLC, Company Guaranteed Notes, 5.000% due 12/15/28(a) | 693,917 | |||||||
| Kraft Heinz Foods Co., Company Guaranteed Notes: | ||||||||||
| 40,000 | BB+ | 5.000% due 6/4/42 | 50,653 | |||||||
| 40,000 | BB+ | 5.200% due 7/15/45 | 51,382 | |||||||
| 889,000 | BB+ | 4.375% due 6/1/46 | 1,031,557 | |||||||
| 200,000 | BB+ | 5.500% due 6/1/50 | 267,020 | |||||||
| 425,000 | BB | Land O’Lakes Capital Trust I, Limited Guaranteed Notes, 7.450% due 3/15/28(a) | 491,821 | |||||||
| 510,000 | B | Performance Food Group Inc., Company Guaranteed Notes, 5.500% due 10/15/27(a) | 531,675 | |||||||
| 623,000 | B+ | Post Holdings Inc., Company Guaranteed Notes, 4.625% due 4/15/30(a) | 636,904 | |||||||
| 887,000 | B | Simmons Foods Inc./Simmons Prepared Foods Inc./Simmons Pet Food Inc./Simmons Feed, Secured Notes, 4.625% due 3/1/29(a) | 903,764 | |||||||
|
| |||||||||
| Total Food | 5,088,193 | |||||||||
|
| |||||||||
Forest Products & Paper — 0.7% | ||||||||||
| 675,000 | BB- | Clearwater Paper Corp., Company Guaranteed Notes, 4.750% due 8/15/28(a) | 693,866 | |||||||
| 120,000 | B+ | Mercer International Inc., Senior Unsecured Notes, 5.125% due 2/1/29 | 121,350 | |||||||
| 575,000 | BB | Sylvamo Corp., Company Guaranteed Notes, 7.000% due 9/1/29(a) | 596,065 | |||||||
|
| |||||||||
| Total Forest Products & Paper | 1,411,281 | |||||||||
|
| |||||||||
See Notes to Financial Statements.
222
| Schedules of Investments |
| (continued) |
| High Yield Fund | ||||||||||
| Face Amount/Units† | Rating†† | Security | Value | |||||||
Healthcare — Services — 3.3% | ||||||||||
| $ | 505,000 | B | Acadia Healthcare Co., Inc., Company Guaranteed Notes, 5.000% due 4/15/29(a) | $ | 527,094 | |||||
| 170,000 | B- | Akumin Inc., Senior Secured Notes, 7.000% due 11/1/25(a) | 160,726 | |||||||
| 325,000 | BB- | Catalent Pharma Solutions Inc., Company Guaranteed Notes, 3.125% due 2/15/29(a) | 321,523 | |||||||
| Centene Corp., Senior Unsecured Notes: | ||||||||||
| 20,000 | BBB- | 4.250% due 12/15/27 | 21,150 | |||||||
| 125,000 | BBB- | 4.625% due 12/15/29 | 137,267 | |||||||
| 10,000 | BBB- | 3.375% due 2/15/30 | 10,462 | |||||||
| CHS/Community Health Systems Inc.: | ||||||||||
Secured Notes: | ||||||||||
| 410,000 | CCC | 6.875% due 4/15/29(a) | 427,097 | |||||||
| 240,000 | CCC | 6.125% due 4/1/30(a) | 242,250 | |||||||
| 230,000 | B | Senior Secured Notes, 6.625% due 2/15/25(a) | 242,047 | |||||||
| 775,000 | B+ | DaVita Inc., Company Guaranteed Notes, 4.625% due 6/1/30(a) | 810,727 | |||||||
| HCA Inc., Company Guaranteed Notes: | ||||||||||
| 130,000 | BB- | 5.875% due 2/1/29 | 157,799 | |||||||
| 1,125,000 | BB- | 3.500% due 9/1/30 | 1,208,976 | |||||||
| 230,000 | BB- | 7.500% due 11/6/33 | 332,658 | |||||||
| 110,000 | BB- | 7.500% due 11/15/95 | 168,031 | |||||||
| 553,000 | B | Legacy LifePoint Health LLC, Senior Secured Notes, 4.375% due 2/15/27(a) | 552,309 | |||||||
| 190,000 | CCC | Radiology Partners Inc., Company Guaranteed Notes, 9.250% due 2/1/28(a) | 204,012 | |||||||
| 150,000 | CCC+ | RegionalCare Hospital Partners Holdings Inc./LifePoint Health Inc., Company Guaranteed Notes, 9.750% due 12/1/26(a) | 159,750 | |||||||
| Tenet Healthcare Corp., Senior Secured Notes: | ||||||||||
| 542,000 | B+ | 4.875% due 1/1/26(a) | 562,894 | |||||||
| 420,000 | B+ | 4.625% due 6/15/28(a) | 435,225 | |||||||
| 410,000 | CCC | US Renal Care Inc., Senior Unsecured Notes, 10.625% due 7/15/27(a) | 430,935 | |||||||
|
| |||||||||
| Total Healthcare — Services | 7,112,932 | |||||||||
|
| |||||||||
Home Builders — 0.9% | ||||||||||
| 322,000 | B- | Empire Communities Corp., Senior Unsecured Notes, 7.000% due 12/15/25(a) | 340,112 | |||||||
| Forestar Group Inc., Company Guaranteed Notes: | ||||||||||
| 270,000 | B+ | 3.850% due 5/15/26(a) | 272,363 | |||||||
| 390,000 | B+ | 5.000% due 3/1/28(a) | 403,162 | |||||||
| 255,000 | B+ | Installed Building Products Inc., Company Guaranteed Notes, 5.750% due 2/1/28(a) | 269,381 | |||||||
| Mattamy Group Corp., Senior Unsecured Notes: | ||||||||||
| 500,000 | BB | 5.250% due 12/15/27(a) | 521,900 | |||||||
| 43,000 | BB | 4.625% due 3/1/30(a) | 44,134 | |||||||
|
| |||||||||
| Total Home Builders | 1,851,052 | |||||||||
|
| |||||||||
Insurance — 0.6% | ||||||||||
| 460,000 | B- | AmWINS Group Inc., Senior Unsecured Notes, 4.875% due 6/30/29(a) | 468,050 | |||||||
| 430,000 | BB+ | Highlands Holdings Bonds Issuer Ltd./Highlands Holdings Bonds Co.-Issuer Inc., Senior Secured Notes, 7.625% (7.625% cash or 8.375% PIK) due 10/15/25(a)(e) | 457,709 | |||||||
| 322,000 | BB | NMI Holdings Inc., Senior Secured Notes, 7.375% due 6/1/25(a) | 364,665 | |||||||
|
| |||||||||
| Total Insurance | 1,290,424 | |||||||||
|
| |||||||||
Internet — 1.3% | ||||||||||
| 310,000 | B | Acuris Finance US Inc./Acuris Finance SARL, Senior Secured Notes, 5.000% due 5/1/28(a) | 308,081 | |||||||
| 450,000 | B+ | Cablevision Lightpath LLC, Senior Secured Notes, 3.875% due 9/15/27(a) | 445,590 | |||||||
| 300,000 | BB- | GrubHub Holdings Inc., Company Guaranteed Notes, 5.500% due 7/1/27(a) | 313,515 | |||||||
| 720,000 | B | ION Trading Technologies Sarl, Senior Secured Notes, 5.750% due 5/15/28(a) | 744,300 | |||||||
| 230,000 | BB | Match Group Holdings II LLC, Senior Unsecured Notes, 4.625% due 6/1/28(a) | 240,454 | |||||||
| Netflix Inc., Senior Unsecured Notes: | ||||||||||
| 440,000 | BB+ | 6.375% due 5/15/29 | 564,346 | |||||||
| 90,000 | BB+ | 4.875% due 6/15/30(a) | 107,841 | |||||||
| 150,000 | NR | Spotify USA Inc., Company Guaranteed Notes, zero coupon, due 3/15/26(a) | 135,843 | |||||||
|
| |||||||||
| Total Internet | 2,859,970 | |||||||||
|
| |||||||||
See Notes to Financial Statements.
223
| Schedules of Investments |
| (continued) |
| High Yield Fund | ||||||||||
| Face Amount/Units† | Rating†† | Security | Value | |||||||
Investment Companies — 0.1% | ||||||||||
| $ | 210,000 | B+ | Compass Group Diversified Holdings LLC, Company Guaranteed Notes, 5.250% due 4/15/29(a) | $ | 220,088 | |||||
|
| |||||||||
Iron/Steel — 1.0% | ||||||||||
| Cleveland-Cliffs Inc.: | ||||||||||
| 400,000 | Ba3(b) | Company Guaranteed Notes, 4.625% due 3/1/29(a) | 421,500 | |||||||
| 282,000 | BB- | Senior Secured Notes, 6.750% due 3/15/26(a) | 302,797 | |||||||
| 236,000 | CCC+ | Senior Unsecured Notes, 6.250% due 10/1/40 | 258,144 | |||||||
| 675,000 | BB+ | Commercial Metals Co., Senior Unsecured Notes, 3.875% due 2/15/31 | 691,760 | |||||||
| 475,000 | B+ | Mineral Resources Ltd., Senior Unsecured Notes, 8.125% due 5/1/27(a) | 518,344 | |||||||
|
| |||||||||
| Total Iron/Steel | 2,192,545 | |||||||||
|
| |||||||||
Leisure Time — 3.1% | ||||||||||
| 1,070,000 | B | Carnival Corp., Senior Unsecured Notes, 5.750% due 3/1/27(a) | 1,095,728 | |||||||
| NCL Corp., Ltd.: | ||||||||||
| 446,000 | B- | Company Guaranteed Notes, 5.875% due 3/15/26(a) | 447,672 | |||||||
Senior Secured Notes: | ||||||||||
| 261,000 | B+ | 12.250% due 5/15/24(a) | 308,309 | |||||||
| 328,000 | B+ | 10.250% due 2/1/26(a) | 379,320 | |||||||
| 1,068,000 | B- | Senior Unsecured Notes, 3.625% due 12/15/24(a) | 1,010,595 | |||||||
| Royal Caribbean Cruises Ltd., Senior Unsecured Notes: | ||||||||||
| 500,000 | B | 4.250% due 7/1/26(a) | 488,125 | |||||||
| 512,000 | B | 5.500% due 4/1/28(a) | 517,120 | |||||||
| Viking Cruises Ltd.: | ||||||||||
| 194,000 | CCC | Company Guaranteed Notes, 5.875% due 9/15/27(a) | 187,989 | |||||||
| 429,000 | CCC+ | Senior Secured Notes, 13.000% due 5/15/25(a) | 497,121 | |||||||
| 389,000 | CCC | Senior Unsecured Notes, 7.000% due 2/15/29(a) | 393,785 | |||||||
| 88,000 | B- | Viking Ocean Cruises Ship VII Ltd., Senior Secured Notes, 5.625% due 2/15/29(a) | 87,670 | |||||||
| 1,246,000 | B | VOC Escrow Ltd., Senior Secured Notes, 5.000% due 2/15/28(a) | 1,233,640 | |||||||
|
| |||||||||
| Total Leisure Time | 6,647,074 | |||||||||
|
| |||||||||
Lodging — 1.8% | ||||||||||
| 250,000 | B- | Full House Resorts Inc., Senior Secured Notes, 8.250% due 2/15/28(a) | 269,062 | |||||||
| 665,000 | B- | Hilton Grand Vacations Borrower Escrow LLC/Hilton Grand Vacations Borrower Esc, Senior Unsecured Notes, 5.000% due 6/1/29(a) | 674,144 | |||||||
| 675,000 | BB | Melco Resorts Finance Ltd., Senior Unsecured Notes, 5.375% due 12/4/29(a) | 699,428 | |||||||
| 200,000 | BBB- | Sands China Ltd., Senior Unsecured Notes, 3.800% due 1/8/26 | 212,592 | |||||||
| 40,000 | B- | Sugarhouse HSP Gaming Prop Mezz LP/Sugarhouse HSP Gaming Finance Corp., Senior Secured Notes, 5.875% due 5/15/25(a) | 40,026 | |||||||
| 486,000 | BB- | Travel + Leisure Co., Senior Secured Notes, 6.000% due 4/1/27 | 538,384 | |||||||
| Wynn Macau Ltd., Senior Unsecured Notes: | ||||||||||
| 645,000 | BB- | 5.625% due 8/26/28(a) | 654,165 | |||||||
| 730,000 | BB- | 5.125% due 12/15/29(a) | 726,522 | |||||||
|
| |||||||||
| Total Lodging | 3,814,323 | |||||||||
|
| |||||||||
Machinery — Diversified — 0.2% | ||||||||||
| 148,000 | B+ | ATS Automation Tooling Systems Inc., Company Guaranteed Notes, 4.125% due 12/15/28(a) | 152,693 | |||||||
| 330,000 | B+ | TK Elevator US Newco Inc., Senior Secured Notes, 5.250% due 7/15/27(a) | 349,081 | |||||||
|
| |||||||||
| Total Machinery — Diversified | 501,774 | |||||||||
|
| |||||||||
Media — 6.2% | ||||||||||
| 400,000 | B | Altice Financing SA, Senior Secured Notes, 5.750% due 8/15/29(a) | 411,380 | |||||||
| 775,000 | B | Altice Financing SA, Senior Secured Notes, 5.000% due 1/15/28(a) | 775,496 | |||||||
| 525,000 | B+ | Block Communications Inc., Company Guaranteed Notes, 4.875% due 3/1/28(a) | 539,427 | |||||||
| CCO Holdings LLC/CCO Holdings Capital Corp., Senior Unsecured Notes: | ||||||||||
| 70,000 | BB | 5.125% due 5/1/27(a) | 73,269 | |||||||
| 838,000 | BB | 4.750% due 3/1/30(a) | 887,719 | |||||||
See Notes to Financial Statements.
224
| Schedules of Investments |
| (continued) |
| High Yield Fund | ||||||||||
| Face Amount/Units† | Rating†† | Security | Value | |||||||
Media — 6.2% — (continued) | ||||||||||
| $ | 570,000 | BB | 4.500% due 8/15/30(a) | $ | 596,323 | |||||
| 570,000 | BB | 4.500% due 5/1/32 | 596,405 | |||||||
| 190,000 | BBB- | Charter Communications Operating LLC/Charter Communications Operating Capital, Senior Secured Notes, 5.750% due 4/1/48 | 244,661 | |||||||
| CSC Holdings LLC: | ||||||||||
Company Guaranteed Notes: | ||||||||||
| 540,000 | BB | 5.375% due 2/1/28(a) | 569,025 | |||||||
| 340,000 | BB | 4.500% due 11/15/31(a) | 342,475 | |||||||
| 975,000 | B+ | Senior Unsecured Notes, 5.750% due 1/15/30(a) | 1,031,569 | |||||||
| 330,000 | BB | DIRECTV Holdings LLC/DIRECTV Financing Co., Inc., Senior Secured Notes, 5.875% due 8/15/27(a) | 345,396 | |||||||
| 1,320,000 | B- | DISH DBS Corp., Company Guaranteed Notes, 7.750% due 7/1/26 | 1,513,644 | |||||||
| 65,000 | CCC+ | DISH Network Corp., Senior Unsecured Notes, 3.375% due 8/15/26 | 67,964 | |||||||
| 545,000 | B+ | Gray Television Inc., Company Guaranteed Notes, 4.750% due 10/15/30(a) | 539,373 | |||||||
| 560,000 | B+ | iHeartCommunications Inc., Senior Secured Notes, 5.250% due 8/15/27(a) | 583,800 | |||||||
| 44,000 | NR | Liberty Latin America Ltd., Senior Unsecured Notes, 2.000% due 7/15/24 | 44,937 | |||||||
| 295,000 | BB+ | News Corp., Senior Unsecured Notes, 3.875% due 5/15/29(a) | 303,434 | |||||||
| 587,000 | BB | TEGNA Inc., Company Guaranteed Notes, 5.000% due 9/15/29(a) | 620,681 | |||||||
| 150,000 | BBB- | Time Warner Cable LLC, Senior Secured Notes, 7.300% due 7/1/38 | 218,655 | |||||||
| 100,000 | BBB- | Time Warner Entertainment Co. LP, Senior Secured Notes, 8.375% due 7/15/33 | 149,098 | |||||||
| Univision Communications Inc., Senior Secured Notes: | ||||||||||
| 270,000 | B | 9.500% due 5/1/25(a) | 294,638 | |||||||
| 625,000 | B | 6.625% due 6/1/27(a) | 677,531 | |||||||
| 527,000 | BB- | UPC Broadband Finco BV, Senior Secured Notes, 4.875% due 7/15/31(a) | 538,752 | |||||||
| 430,000 | B | UPC Holding BV, Senior Secured Notes, 5.500% due 1/15/28(a) | 454,381 | |||||||
| 167,000 | B- | Urban One Inc., Senior Secured Notes, 7.375% due 2/1/28(a) | 180,292 | |||||||
| 200,000 | BB- | Virgin Media Secured Finance PLC, Senior Secured Notes, 5.500% due 5/15/29(a) | 214,500 | |||||||
| 340,000 | B | Virgin Media Vendor Financing Notes IV DAC, Senior Unsecured Notes, 5.000% due 7/15/28(a) | 352,750 | |||||||
|
| |||||||||
| Total Media | 13,167,575 | |||||||||
|
| |||||||||
Mining — 1.9% | ||||||||||
| First Quantum Minerals Ltd., Company Guaranteed Notes: | ||||||||||
| 560,000 | B | 7.500% due 4/1/25(a) | 581,000 | |||||||
| 342,000 | B | 6.875% due 3/1/26(a) | 357,809 | |||||||
| 680,000 | B | 6.875% due 10/15/27(a) | 736,950 | |||||||
| 1,207,000 | BB+ | Freeport-McMoRan Inc., Company Guaranteed Notes, 5.450% due 3/15/43 | 1,546,511 | |||||||
| Hudbay Minerals Inc., Company Guaranteed Notes: | ||||||||||
| 120,000 | B | 4.500% due 4/1/26(a) | 120,774 | |||||||
| 615,000 | B | 6.125% due 4/1/29(a) | 661,894 | |||||||
|
| |||||||||
| Total Mining | 4,004,938 | |||||||||
|
| |||||||||
Miscellaneous Manufacturers — 0.0% | ||||||||||
| 9,907 | CCC+(f) | Anagram International Inc./Anagram Holdings LLC, Secured Notes, 10.000% (5.000% cash and 5.000% PIK or 10.000% cash) due 8/15/26(a)(e) | 9,662 | |||||||
|
| |||||||||
Oil & Gas — 6.6% | ||||||||||
| 375,000 | BB- | Antero Resources Corp., Company Guaranteed Notes, 5.375% due 3/1/30(a) | 382,138 | |||||||
| Apache Corp., Senior Unsecured Notes: | ||||||||||
| 154,000 | BB+ | 4.375% due 10/15/28 | 166,382 | |||||||
| 70,000 | BB+ | 7.750% due 12/15/29 | 85,860 | |||||||
| 376,000 | BB+ | 4.250% due 1/15/30 | 405,240 | |||||||
| 720,000 | B | Berry Petroleum Co. LLC, Company Guaranteed Notes, 7.000% due 2/15/26(a) | 715,478 | |||||||
| 725,000 | B+ | California Resources Corp., Company Guaranteed Notes, 7.125% due 2/1/26(a) | 761,453 | |||||||
| 20,000 | BB- | Chesapeake Energy Corp., Company Guaranteed Notes, 5.500% due 2/1/26(a) | 20,939 | |||||||
| 520,000 | B | Colgate Energy Partners III LLC, Senior Unsecured Notes, 5.875% due 7/1/29(a) | 527,150 | |||||||
See Notes to Financial Statements.
225
| Schedules of Investments |
| (continued) |
| High Yield Fund | ||||||||||
| Face Amount/Units† | Rating†† | Security | Value | |||||||
Oil & Gas — 6.6% — (continued) | ||||||||||
| Comstock Resources Inc., Company Guaranteed Notes: | ||||||||||
| $ | 4,000 | B | 7.500% due 5/15/25(a) | $ | 4,145 | |||||
| 190,000 | B | 5.875% due 1/15/30(a) | 190,759 | |||||||
| 130,000 | BB+ | Continental Resources Inc., Company Guaranteed Notes, 5.750% due 1/15/31(a) | 158,600 | |||||||
| Endeavor Energy Resources LP/EER Finance Inc., Senior Unsecured Notes: | ||||||||||
| 150,000 | BB- | 6.625% due 7/15/25(a) | 159,255 | |||||||
| 388,000 | BB- | 5.750% due 1/30/28(a) | 408,855 | |||||||
| EQT Corp., Senior Unsecured Notes: | ||||||||||
| 290,000 | BB+ | 5.000% due 1/15/29 | 330,211 | |||||||
| 100,000 | BB+ | 3.625% due 5/15/31(a) | 105,639 | |||||||
| 695,000 | BB- | Hilcorp Energy I LP/Hilcorp Finance Co., Senior Unsecured Notes, 5.750% due 2/1/29(a) | 706,294 | |||||||
| 525,000 | B+ | Independence Energy Finance LLC, Senior Unsecured Notes, 7.250% due 5/1/26(a) | 530,909 | |||||||
| 500,000 | BB- | Indigo Natural Resources LLC, Senior Unsecured Notes, 5.375% due 2/1/29(a) | 517,145 | |||||||
| 835,000 | BB- | MEG Energy Corp., Company Guaranteed Notes, 7.125% due 2/1/27(a) | 879,681 | |||||||
| 500,000 | BB | Murphy Oil Corp., Senior Unsecured Notes, 6.375% due 7/15/28 | 526,875 | |||||||
| 170,000 | B | Northern Oil & Gas Inc., Senior Unsecured Notes, 8.125% due 3/1/28(a) | 176,809 | |||||||
| 1,270,000 | B+ | Oasis Petroleum Inc., Company Guaranteed Notes, 6.375% due 6/1/26(a) | 1,327,150 | |||||||
| Occidental Petroleum Corp., Senior Unsecured Notes: | ||||||||||
| 10,000 | BB | 1.575% (3-Month USD-LIBOR + 1.450%) due 8/15/22(c) | 9,962 | |||||||
| 122,000 | BB | 6.375% due 9/1/28 | 144,546 | |||||||
| 714,000 | BB | 8.875% due 7/15/30 | 980,783 | |||||||
| 83,000 | BB | 6.625% due 9/1/30 | 103,629 | |||||||
| 392,000 | BB | 6.125% due 1/1/31 | 474,553 | |||||||
| 108,000 | BB | 4.625% due 6/15/45 | 111,930 | |||||||
| 202,000 | BB | 4.200% due 3/15/48 | 194,670 | |||||||
| 161,000 | BB | 4.400% due 8/15/49 | 162,028 | |||||||
| PBF Holding Co. LLC/PBF Finance Corp.: | ||||||||||
| 625,000 | B | Company Guaranteed Notes, 6.000% due 2/15/28 | 410,238 | |||||||
| 110,000 | BB- | Senior Secured Notes, 9.250% due 5/15/25(a) | 106,287 | |||||||
| 660,000 | B | Penn Virginia Escrow LLC, Company Guaranteed Notes, 9.250% due 8/15/26(a) | 642,675 | |||||||
| Petrobras Global Finance BV, Company Guaranteed Notes: | ||||||||||
| 40,000 | BB- | 7.375% due 1/17/27 | 49,039 | |||||||
| 20,000 | BB- | 5.750% due 2/1/29 | 22,871 | |||||||
| Range Resources Corp., Company Guaranteed Notes: | ||||||||||
| 330,000 | B+ | 4.875% due 5/15/25 | 341,962 | |||||||
| 70,000 | B+ | 9.250% due 2/1/26 | 76,637 | |||||||
| 240,000 | B+ | 8.250% due 1/15/29(a) | 266,723 | |||||||
| 286,000 | BB- | Southwestern Energy Co., Company Guaranteed Notes, 5.375% due 3/15/30 | 297,321 | |||||||
| 505,000 | BB- | Strathcona Resources Ltd., Senior Unsecured Notes, 6.875% due 8/1/26(a) | 495,554 | |||||||
|
| |||||||||
| Total Oil & Gas | 13,978,375 | |||||||||
|
| |||||||||
Oil & Gas Services — 0.4% | ||||||||||
| 503,000 | B+ | Archrock Partners LP/Archrock Partners Finance Corp., Company Guaranteed Notes, 6.250% due 4/1/28(a) | 513,060 | |||||||
| 300,000 | B+ | USA Compression Partners LP/USA Compression Finance Corp., Company Guaranteed Notes, 6.875% due 4/1/26 | 312,102 | |||||||
|
| |||||||||
| Total Oil & Gas Services | 825,162 | |||||||||
|
| |||||||||
Packaging & Containers — 1.2% | ||||||||||
| 280,000 | B- | ARD Finance SA, Senior Secured Notes, 6.500% (6.500% cash or 7.250% PIK) due 6/30/27(a)(e) | 295,240 | |||||||
| Ardagh Metal Packaging Finance USA LLC/Ardagh Metal Packaging Finance PLC: | ||||||||||
| 350,000 | BB | Senior Secured Notes, 3.250% due 9/1/28(a) | 353,063 | |||||||
| 390,000 | B+ | Senior Unsecured Notes, 4.000% due 9/1/29(a) | 397,995 | |||||||
| 610,000 | BB- | Cascades Inc./Cascades USA Inc., Company Guaranteed Notes, 5.375% due 1/15/28(a) | 643,550 | |||||||
See Notes to Financial Statements.
226
| Schedules of Investments |
| (continued) |
| High Yield Fund | ||||||||||
| Face Amount/Units† | Rating†† | Security | Value | |||||||
Packaging & Containers — 1.2% — (continued) | ||||||||||
| $ | 325,000 | BB | Silgan Holdings Inc., Company Guaranteed Notes, 4.750% due 3/15/25 | $ | 330,281 | |||||
| 425,000 | CCC+ | Trivium Packaging Finance BV, Company Guaranteed Notes, 8.500% due 8/15/27(a) | 457,831 | |||||||
|
| |||||||||
| Total Packaging & Containers | 2,477,960 | |||||||||
|
| |||||||||
Pharmaceuticals — 2.3% | ||||||||||
| AdaptHealth LLC, Company Guaranteed Notes: | ||||||||||
| 110,000 | B | 4.625% due 8/1/29(a) | 110,446 | |||||||
| 550,000 | B | 5.125% due 3/1/30(a) | 557,752 | |||||||
| 730,000 | B | Bausch Health Americas Inc., Company Guaranteed Notes, 8.500% due 1/31/27(a) | 785,991 | |||||||
| Bausch Health Cos., Inc., Company Guaranteed Notes: | ||||||||||
| 20,000 | B | 6.125% due 4/15/25(a) | 20,475 | |||||||
| 500,000 | B | 5.000% due 2/15/29(a) | 468,148 | |||||||
| 80,000 | B | 6.250% due 2/15/29(a) | 79,494 | |||||||
| 190,000 | CCC | Endo Dac/Endo Finance LLC/Endo Finco Inc., Secured Notes, 9.500% due 7/31/27(a) | 186,460 | |||||||
| 455,000 | B | Endo Luxembourg Finance Co. I Sarl/Endo US Inc., Senior Secured Notes, 6.125% due 4/1/29(a) | 451,035 | |||||||
| 675,000 | BB- | HLF Financing Sarl LLC/Herbalife International Inc., Company Guaranteed Notes, 4.875% due 6/1/29(a) | 677,538 | |||||||
| 380,000 | BB- | Jazz Securities DAC, Senior Secured Notes, 4.375% due 1/15/29(a) | 394,305 | |||||||
| 575,000 | B | Par Pharmaceutical Inc., Senior Secured Notes, 7.500% due 4/1/27(a) | 582,906 | |||||||
| 540,000 | BB- | Teva Pharmaceutical Finance Netherlands III BV, Company Guaranteed Notes, 7.125% due 1/31/25 | 590,463 | |||||||
|
| |||||||||
| Total Pharmaceuticals | 4,905,013 | |||||||||
|
| |||||||||
Pipelines — 5.5% | ||||||||||
| 501,000 | BB- | Antero Midstream Partners LP/Antero Midstream Finance Corp., Company Guaranteed Notes, 5.750% due 1/15/28(a) | 522,303 | |||||||
| Blue Racer Midstream LLC/Blue Racer Finance Corp., Senior Unsecured Notes: | ||||||||||
| 190,000 | B+ | 7.625% due 12/15/25(a) | 205,677 | |||||||
| 210,000 | B+ | 6.625% due 7/15/26(a) | 219,187 | |||||||
| 659,000 | BB | Buckeye Partners LP, Senior Unsecured Notes, 4.500% due 3/1/28(a) | 681,446 | |||||||
| 730,000 | NR | Cheniere Energy Inc., Senior Unsecured Notes, 4.250% due 3/15/45 | 617,642 | |||||||
| Cheniere Energy Partners LP, Company Guaranteed Notes: | ||||||||||
| 70,000 | BB | 4.500% due 10/1/29 | 75,512 | |||||||
| 230,000 | BB | 4.000% due 3/1/31(a) | 242,363 | |||||||
| DCP Midstream Operating LP, Company Guaranteed Notes: | ||||||||||
| 475,000 | BB+ | 5.625% due 7/15/27 | 540,479 | |||||||
| 80,000 | BB+ | 6.450% due 11/3/36(a) | 97,137 | |||||||
| 190,000 | BB+ | 6.750% due 9/15/37(a) | 236,842 | |||||||
| 444,000 | BB+ | DT Midstream Inc., Company Guaranteed Notes, 4.375% due 6/15/31(a) | 458,985 | |||||||
| 90,000 | BB | Energy Transfer LP, Junior Subordinated Notes, 6.500% (5-Year CMT Index + 5.694%)(c)(d) | 92,500 | |||||||
| EQM Midstream Partners LP, Senior Unsecured Notes: | ||||||||||
| 200,000 | BB- | 4.000% due 8/1/24 | 204,960 | |||||||
| 120,000 | BB- | 6.000% due 7/1/25(a) | 129,750 | |||||||
| 50,000 | BB- | 6.500% due 7/1/27(a) | 55,690 | |||||||
| 230,000 | BB- | 5.500% due 7/15/28 | 251,275 | |||||||
| 170,000 | BB- | 6.500% due 7/15/48 | 189,048 | |||||||
| 226,000 | B+ | Genesis Energy LP/ Genesis Energy Finance Corp., Company Guaranteed Notes, 8.000% due 1/15/27 | 224,707 | |||||||
| 1,100,000 | B+ | Genesis Energy LP/Genesis Energy Finance Corp., Company Guaranteed Notes, 6.500% due 10/1/25 | 1,079,386 | |||||||
| 675,000 | BB- | Harvest Midstream I LP, Senior Unsecured Notes, 7.500% due 9/1/28(a) | 709,432 | |||||||
| 600,000 | BB | Holly Energy Partners LP/Holly Energy Finance Corp., Company Guaranteed Notes, 5.000% due 2/1/28(a) | 612,930 | |||||||
| 605,000 | B | ITT Holdings LLC, Senior Unsecured Notes, 6.500% due 8/1/29(a) | 617,856 | |||||||
See Notes to Financial Statements.
227
| Schedules of Investments |
| (continued) |
| High Yield Fund | ||||||||||
| Face Amount/Units† | Rating†† | Security | Value | |||||||
Pipelines — 5.5% — (continued) | ||||||||||
| $ | 650,000 | BB- | NGL Energy Operating LLC/NGL Energy Finance Corp., Senior Secured Notes, 7.500% due 2/1/26(a) | $ | 660,562 | |||||
| NuStar Logistics LP, Company Guaranteed Notes: | ||||||||||
| 100,000 | BB- | 5.750% due 10/1/25 | 107,625 | |||||||
| 350,000 | BB- | 6.375% due 10/1/30 | 387,450 | |||||||
| 360,000 | BB- | Tallgrass Energy Partners LP/Tallgrass Energy Finance Corp., Company Guaranteed Notes, 6.000% due 12/31/30(a) | 366,682 | |||||||
| Targa Resources Partners LP/Targa Resources Partners Finance Corp., Company Guaranteed Notes: | ||||||||||
| 423,000 | BB+ | 6.875% due 1/15/29(a) | 476,065 | |||||||
| 290,000 | BB+ | 4.875% due 2/1/31 | 315,825 | |||||||
| 588,000 | (P)BB | Venture Global Calcasieu Pass LLC, Senior Secured Notes, 3.875% due 8/15/29(a) | 606,787 | |||||||
| Western Midstream Operating LP, Senior Unsecured Notes: | ||||||||||
| 170,000 | BB+ | 4.350% due 2/1/25 | 178,852 | |||||||
| 170,000 | BB+ | 3.950% due 6/1/25 | 177,862 | |||||||
| 270,000 | BB+ | 5.500% due 8/15/48 | 309,793 | |||||||
|
| |||||||||
| Total Pipelines | 11,652,610 | |||||||||
|
| |||||||||
Real Estate — 1.2% | ||||||||||
| 400,000 | BB- | Cushman & Wakefield US Borrower LLC, Senior Secured Notes, 6.750% due 5/15/28(a) | 433,664 | |||||||
| 490,000 | B | Five Point Operating Co. LP/Five Point Capital Corp., Company Guaranteed Notes, 7.875% due 11/15/25(a) | 513,106 | |||||||
| Kennedy-Wilson Inc., Company Guaranteed Notes: | ||||||||||
| 350,000 | BB | 4.750% due 3/1/29 | 360,495 | |||||||
| 305,000 | B1(b) | 4.750% due 2/1/30 | 313,781 | |||||||
| 301,000 | BB | 5.000% due 3/1/31 | 313,541 | |||||||
| Realogy Group LLC/Realogy Co.-Issuer Corp.: | ||||||||||
Company Guaranteed Notes: | ||||||||||
| 170,000 | NR | 0.250% due 6/15/26(a) | 170,259 | |||||||
| 240,000 | B- | 5.750% due 1/15/29(a) | 251,472 | |||||||
| 140,000 | BB- | Secured Notes, 7.625% due 6/15/25(a) | 150,918 | |||||||
|
| |||||||||
| Total Real Estate | 2,507,236 | |||||||||
|
| |||||||||
Real Estate Investment Trusts (REITs) — 3.4% | ||||||||||
| Apollo Commercial Real Estate Finance Inc.: | ||||||||||
| 270,000 | B+ | Senior Secured Notes, 4.625% due 6/15/29(a) | 263,309 | |||||||
| 70,000 | NR | Senior Unsecured Notes, 4.750% due 8/23/22 | 71,316 | |||||||
| 256,000 | BB+ | CTR Partnership LP/CareTrust Capital Corp., Company Guaranteed Notes, 3.875% due 6/30/28(a) | 263,395 | |||||||
| Diversified Healthcare Trust: | ||||||||||
Company Guaranteed Notes: | ||||||||||
| 380,000 | BB | 9.750% due 6/15/25 | 418,475 | |||||||
| 60,000 | BB | 4.375% due 3/1/31 | 58,951 | |||||||
| 300,000 | BB- | Senior Unsecured Notes, 4.750% due 2/15/28 | 304,219 | |||||||
| GEO Group Inc. (The), Company Guaranteed Notes: | ||||||||||
| 360,000 | CCC | 5.875% due 10/15/24 | 326,250 | |||||||
| 523,000 | CCC | 6.000% due 4/15/26 | 442,589 | |||||||
| HAT Holdings I LLC/HAT Holdings II LLC, Company Guaranteed Notes: | ||||||||||
| 493,000 | BB+ | 6.000% due 4/15/25(a) | 520,332 | |||||||
| 100,000 | BB+ | 3.375% due 6/15/26(a) | 102,030 | |||||||
| 220,000 | NR | IIP Operating Partnership LP, Company Guaranteed Notes, 5.500% due 5/25/26(a) | 231,176 | |||||||
| Ladder Capital Finance Holdings LLLP/Ladder Capital Finance Corp., Company Guaranteed Notes: | ||||||||||
| 883,000 | BB- | 4.250% due 2/1/27(a) | 888,519 | |||||||
| 340,000 | BB- | 4.750% due 6/15/29(a) | 348,075 | |||||||
See Notes to Financial Statements.
228
| Schedules of Investments |
| (continued) |
| High Yield Fund | ||||||||||
| Face Amount/Units† | Rating†† | Security | Value | |||||||
Real Estate Investment Trusts (REITs) — 3.4% — (continued) | ||||||||||
| MPT Operating Partnership LP/MPT Finance Corp., Company Guaranteed Notes: | ||||||||||
| $ | 230,000 | BBB- | 5.000% due 10/15/27 | $ | 243,800 | |||||
| 40,000 | BBB- | 4.625% due 8/1/29 | 42,817 | |||||||
| 529,000 | B+ | Park Intermediate Holdings LLC/PK Domestic Property LLC/PK Finance Co.-Issuer, Senior Secured Notes, 5.875% due 10/1/28(a) | 564,046 | |||||||
| Service Properties Trust: | ||||||||||
| 201,000 | BB | Company Guaranteed Notes, 5.500% due 12/15/27 | 215,826 | |||||||
Senior Unsecured Notes: | ||||||||||
| 333,000 | BB- | 3.950% due 1/15/28 | 316,810 | |||||||
| 550,000 | BB- | 4.375% due 2/15/30 | 529,089 | |||||||
| Starwood Property Trust Inc., Senior Unsecured Notes: | ||||||||||
| 500,000 | B+ | 4.750% due 3/15/25 | 524,375 | |||||||
| 555,000 | B+ | 3.625% due 7/15/26(a) | 559,162 | |||||||
|
| |||||||||
| Total Real Estate Investment Trusts (REITs) | 7,234,561 | |||||||||
|
| |||||||||
Retail — 4.2% | ||||||||||
| 130,000 | B+ | Academy Ltd., Senior Secured Notes, 6.000% due 11/15/27(a) | 139,464 | |||||||
| Bath & Body Works Inc., Company Guaranteed Notes: | ||||||||||
| 170,000 | BB | 9.375% due 7/1/25(a) | 220,150 | |||||||
| 460,000 | BB | 5.250% due 2/1/28 | 515,867 | |||||||
| 330,000 | BB | 6.625% due 10/1/30(a) | 380,737 | |||||||
| 333,000 | BB- | Brinker International Inc., Company Guaranteed Notes, 5.000% due 10/1/24(a) | 352,579 | |||||||
| 830,000 | CCC | Carrols Restaurant Group Inc., Company Guaranteed Notes, 5.875% due 7/1/29(a) | 802,100 | |||||||
| 670,000 | B- | CEC Entertainment LLC, Senior Secured Notes, 6.750% due 5/1/26(a) | 664,761 | |||||||
| 160,000 | NR | Cheesecake Factory Inc.(The), Senior Unsecured Notes, 0.375% due 6/15/26 | 150,387 | |||||||
| 494,000 | B | Dave & Buster’s Inc., Senior Secured Notes, 7.625% due 11/1/25(a) | 524,257 | |||||||
| 650,000 | B- | eG Global Finance PLC, Senior Secured Notes, 6.750% due 2/7/25(a) | 668,687 | |||||||
| 748,000 | BB | FirstCash Inc., Company Guaranteed Notes, 4.625% due 9/1/28(a) | 778,821 | |||||||
| 154,000 | CCC+ | Foundation Building Materials Inc., Company Guaranteed Notes, 6.000% due 3/1/29(a) | 152,018 | |||||||
| 150,000 | B | Magic Mergeco Inc. (The), Senior Secured Notes, 5.250% due 5/1/28(a) | 154,125 | |||||||
| 370,000 | CCC+ | Michaels Cos Inc.(The), Senior Unsecured Notes, 7.875% due 5/1/29(a) | 381,729 | |||||||
| 543,000 | BB+ | Murphy Oil USA Inc., Company Guaranteed Notes, 3.750% due 2/15/31(a) | 548,585 | |||||||
| 147,000 | B- | NMG Holding Co., Inc./Neiman Marcus Group LLC, Senior Secured Notes, 7.125% due 4/1/26(a) | 155,820 | |||||||
| 360,000 | BB+ | Nordstrom Inc., Senior Unsecured Notes, 5.000% due 1/15/44 | 358,262 | |||||||
| 538,000 | CCC | Park River Holdings Inc., Senior Unsecured Notes, 6.750% due 8/1/29(a) | 536,026 | |||||||
| 342,000 | CCC+ | Party City Holdings Inc., Senior Secured Notes, 8.750% due 2/15/26(a) | 356,963 | |||||||
| PetSmart Inc./PetSmart Finance Corp.: | ||||||||||
| 250,000 | CCC+ | Company Guaranteed Notes, 7.750% due 2/15/29(a) | 275,000 | |||||||
| 250,000 | BB- | Senior Secured Notes, 4.750% due 2/15/28(a) | 260,625 | |||||||
| 310,000 | B3(b) | Sizzling Platter LLC/Sizzling Platter Finance Corp., Senior Secured Notes, 8.500% due 11/28/25(a) | 320,090 | |||||||
| 170,000 | BB- | Suburban Propane Partners LP/Suburban Energy Finance Corp., Senior Unsecured Notes, 5.000% due 6/1/31(a) | 175,387 | |||||||
| 150,000 | BB- | Superior Plus LP/Superior General Partner Inc., Company Guaranteed Notes, 4.500% due 3/15/29(a) | 155,659 | |||||||
|
| |||||||||
| Total Retail | 9,028,099 | |||||||||
|
| |||||||||
Software — 1.5% | ||||||||||
| 40,000 | NR | Alteryx Inc., Senior Unsecured Notes, 0.500% due 8/1/24 | 37,676 | |||||||
| 120,000 | BB- | Black Knight InfoServ LLC, Company Guaranteed Notes, 3.625% due 9/1/28(a) | 121,650 | |||||||
| Clarivate Science Holdings Corp.: | ||||||||||
| 100,000 | B | Senior Secured Notes, 3.875% due 7/1/28(a) | 101,788 | |||||||
| 564,000 | CCC+ | Senior Unsecured Notes, 4.875% due 7/1/29(a) | 581,980 | |||||||
| 350,000 | B+ | Donnelley Financial Solutions Inc., Company Guaranteed Notes, 8.250% due 10/15/24 | 360,068 | |||||||
See Notes to Financial Statements.
229
| Schedules of Investments |
| (continued) |
| High Yield Fund | ||||||||||
| Face Amount/Units† | Rating†† | Security | Value | |||||||
Software — 1.5% — (continued) | ||||||||||
| $ | 280,000 | B+ | Elastic NV, Senior Unsecured Notes, 4.125% due 7/15/29(a) | $ | 284,774 | |||||
| 380,000 | B | Helios Software Holdings Inc./ION Corporate Solutions Finance Sarl, Senior Secured Notes, 4.625% due 5/1/28(a) | 376,561 | |||||||
| 220,000 | BB | Open Text Holdings Inc., Company Guaranteed Notes, 4.125% due 2/15/30(a) | 231,902 | |||||||
| 260,000 | B | Playtika Holding Corp., Company Guaranteed Notes, 4.250% due 3/15/29(a) | 262,600 | |||||||
| 670,000 | B+ | Rackspace Technology Global Inc., Senior Secured Notes, 3.500% due 2/15/28(a) | 644,051 | |||||||
| 110,000 | CCC | Rocket Software Inc., Senior Unsecured Notes, 6.500% due 2/15/29(a) | 103,797 | |||||||
|
| |||||||||
| Total Software | 3,106,847 | |||||||||
|
| |||||||||
Telecommunications — 5.1% | ||||||||||
| 295,000 | CCC+ | Altice France Holding SA, Company Guaranteed Notes, 6.000% due 2/15/28(a) | 293,459 | |||||||
| Altice France SA, Senior Secured Notes: | ||||||||||
| 542,000 | B | 7.375% due 5/1/26(a) | 563,257 | |||||||
| 400,000 | B | 8.125% due 2/1/27(a) | 435,000 | |||||||
| 200,000 | B | 5.125% due 1/15/29(a) | 201,710 | |||||||
| 790,000 | B | 5.125% due 7/15/29(a) | 799,693 | |||||||
| CommScope Inc.: | ||||||||||
| 200,000 | CCC+ | Company Guaranteed Notes, 8.250% due 3/1/27(a) | 211,090 | |||||||
| 260,000 | B | Senior Secured Notes, 4.750% due 9/1/29(a) | 263,628 | |||||||
| CommScope Technologies LLC, Company Guaranteed Notes: | ||||||||||
| 200,000 | CCC+ | 6.000% due 6/15/25(a) | 203,650 | |||||||
| 30,000 | CCC+ | 5.000% due 3/15/27(a) | 29,617 | |||||||
| 750,000 | B+ | Connect Finco SARL/Connect US Finco LLC, Senior Secured Notes, 6.750% due 10/1/26(a) | 779,062 | |||||||
| Frontier Communications Holdings LLC: | ||||||||||
| 150,000 | CCC+ | Secured Notes, 6.750% due 5/1/29(a) | 160,718 | |||||||
| 685,000 | B+ | Senior Secured Notes, 5.000% due 5/1/28(a) | 716,681 | |||||||
| 445,000 | BB | Hughes Satellite Systems Corp., Company Guaranteed Notes, 6.625% due 8/1/26 | 506,236 | |||||||
| 550,000 | WR(b) | Intelsat Jackson Holdings SA, Senior Secured Notes, 8.000% due 2/15/24(a)(g) | 571,695 | |||||||
| Lumen Technologies Inc., Senior Unsecured Notes: | ||||||||||
| 500,000 | BB- | 5.125% due 12/15/26(a) | 517,625 | |||||||
| 475,000 | BB- | 5.375% due 6/15/29(a) | 488,652 | |||||||
| 1,055,000 | BB+ | Sprint Capital Corp., Company Guaranteed Notes, 8.750% due 3/15/32 | 1,617,378 | |||||||
| Switch Ltd., Company Guaranteed Notes: | ||||||||||
| 250,000 | BB | 3.750% due 9/15/28(a) | 254,676 | |||||||
| 270,000 | BB | 4.125% due 6/15/29(a) | 278,897 | |||||||
| Telesat Canada/Telesat LLC: | ||||||||||
| 267,000 | B | Company Guaranteed Notes, 6.500% due 10/15/27(a) | 225,941 | |||||||
| 375,000 | BB- | Senior Secured Notes, 4.875% due 6/1/27(a) | 346,661 | |||||||
| T-Mobile USA Inc., Company Guaranteed Notes: | ||||||||||
| 100,000 | BB+ | 3.500% due 4/15/31 | 106,449 | |||||||
| 390,000 | BB+ | 3.500% due 4/15/31(a) | 415,151 | |||||||
| 460,000 | BB- | Vmed O2 UK Financing I PLC, Senior Secured Notes, 4.750% due 7/15/31(a) | 473,225 | |||||||
| 350,000 | CCC+ | Zayo Group Holdings Inc., Senior Unsecured Notes, 6.125% due 3/1/28(a) | 356,563 | |||||||
|
| |||||||||
| Total Telecommunications | 10,816,714 | |||||||||
|
| |||||||||
Transportation — 0.4% | ||||||||||
| 501,000 | BB | Cargo Aircraft Management Inc., Company Guaranteed Notes, 4.750% due 2/1/28(a) | 518,745 | |||||||
| 214,000 | B+ | XPO CNW Inc., Senior Unsecured Notes, 6.700% due 5/1/34 | 258,236 | |||||||
|
| |||||||||
| Total Transportation | 776,981 | |||||||||
|
| |||||||||
Trucking & Leasing — 0.3% | ||||||||||
| 575,000 | BB+ | AerCap Global Aviation Trust, Company Guaranteed Notes, 6.500% (3-Month USD-LIBOR + 4.300%) due 6/15/45(a)(c) | 624,358 | |||||||
|
| |||||||||
| TOTAL CORPORATE BONDS & NOTES (Cost — $176,249,689) | 185,099,511 | |||||||||
|
| |||||||||
See Notes to Financial Statements.
230
| Schedules of Investments |
| (continued) |
| High Yield Fund | ||||||||||
| Face Amount/Units† | Rating†† | Security | Value | |||||||
SENIOR LOANS — 4.0% | ||||||||||
| $ | 59,250 | NR | Acrisure LLC, (Restricted, cost — $59,135, acquired 1/31/20), 3.607% (2-Month USD-LIBOR + 3.500%) due 2/15/27(h) | $ | 58,519 | |||||
| 29,705 | NR | AmeriLife Holdings LLC, (Restricted, cost — $29,653, acquired 2/6/20), 4.096% (1-Month USD-LIBOR + 4.000%) due 3/18/27(h) | 29,649 | |||||||
| 170,000 | NR | Aramark Intermediate HoldCo Corp., (Restricted, cost — $162,469, acquired 5/21/20), 1.835% (1-Month USD-LIBOR + 1.750%) due 3/11/25(h) | 167,067 | |||||||
| 326,013 | NR | Arctic Canadian Diamond Co., Ltd., (Restricted, cost — $326,013, acquired 2/2/21), 17.500% (3-Month USD-LIBOR + 3.250% due 12/31/24)#(h)(i)(j) | 322,753 | |||||||
| 247,164 | NR | Asurion LLC, (Restricted, cost — $242,927, acquired 4/8/20), 3.335% (1-Month USD-LIBOR + 3.250%) due 12/23/26(h) | 242,684 | |||||||
| 29,401 | NR | athenahealth Inc., (Restricted, cost — $29,027, acquired 2/7/19), 4.377% (3-Month USD-LIBOR + 3.250%) due 2/11/26(h) | 29,539 | |||||||
| 227,111 | NR | Commscope Inc., (Restricted, cost — $220,083, acquired 4/17/20), 3.335% (1-Month USD-LIBOR + 3.250%) due 4/6/26(h) | 224,868 | |||||||
| 54,750 | NR | CoreCivic Inc., (Restricted, cost — $52,944, acquired 12/12/19), 5.500% (1-Month USD-LIBOR + 4.500%) due 12/18/24(h) | 54,453 | |||||||
| 590,000 | NR | DCert Buyer Inc., (Restricted, cost — $588,620, acquired 12/12/19), 7.085% (1-Month USD-LIBOR + 7.000%) due 2/19/29(h) | 597,269 | |||||||
| 325,875 | NR | DCert Buyer Inc., (Restricted, cost — $317,675, acquired 4/17/20), 4.085% (1-Month USD-LIBOR + 4.000%) due 10/16/26(h) | 325,763 | |||||||
| 80,000 | NR | Deerfield Dakota Holding LLC, (Restricted, cost — $79,019, acquired 3/5/20), 7.500% (1-Month USD-LIBOR + 6.750%) due 4/7/28(h) | 82,200 | |||||||
| 267,300 | NR | Equinox Holdings Inc., (Restricted, cost — $261,877, acquired 6/9/20), 10.000% (3-Month USD-LIBOR + 9.000%) due 3/8/24(h) | 268,971 | |||||||
| 40,000 | NR | EyeCare Partners LLC, (Restricted, cost — $39,676, acquired 2/18/20), 8.357% (2-Month USD-LIBOR + 8.250%) due 2/18/28(h) | 38,500 | |||||||
| 59,337 | NR | EyeCare Partners LLC, (Restricted, cost — $59,290, acquired 2/5/20), 3.857% (2-Month USD-LIBOR + 3.750%) due 2/18/27(h) | 58,897 | |||||||
| 124,966 | NR | First Eagle Holdings Inc., (Restricted, cost — $117,095, acquired 5/21/20), 2.647% (3-Month USD-LIBOR + 2.500%) due 2/1/27(h) | 123,234 | |||||||
| 256,692 | NR | Focus Financial Partners LLC, (Restricted, cost — $247,507, acquired 4/24/20), 2.085% (1-Month USD-LIBOR + 2.000%) due 7/3/24(h) | 254,527 | |||||||
| 426,492 | NR | Gannett Holdings LLC, (Restricted, cost — $418,921, acquired 1/29/21), 7.750% (3-Month USD-LIBOR + 7.000%) due 2/9/26(h) | 431,023 | |||||||
| 480,000 | NR | Garda World Security Corp., (Restricted, cost — $461,955, acquired 4/17/20), 4.340% (1-Month USD-LIBOR + 4.250%) due 10/30/26(h) | 479,873 | |||||||
| 77,825 | NR | Global Tel*Link Corp., (Restricted, cost — $75,586, acquired 8/16/19), 4.335% (1-Month USD-LIBOR + 4.250%) due 11/29/25(h) | 72,391 | |||||||
| 238,800 | NR | Great Outdoors Group LLC, (Restricted, cost — $237,688, acquired 2/26/21), 5.000% (3-Month USD-LIBOR + 4.250%) due 3/6/28(h) | 239,994 | |||||||
| 227,118 | NR | Grifols Worldwide Operations Ltd., (Restricted, cost — $223,619, acquired 4/16/20), 2.082% (1-Week USD-LIBOR + 2.000%) due 11/15/27(h) | 224,379 | |||||||
| 109,590 | NR | Harland Clarke Holdings Corp., (Restricted, cost — $100,106, acquired 3/5/21), 5.750% (1-Month USD-LIBOR + 4.750%) due 11/3/23(h) | 103,817 | |||||||
| 200,000 | NR | Level 3 Financing Inc., (Restricted, cost — $193,478, acquired 5/22/20), 1.835% (1-Month USD-LIBOR + 1.750%) due 3/1/27(h) | 197,375 | |||||||
| 30,369 | NR | LifePoint Health Inc., (Restricted, cost — $30,186, acquired 11/14/18), 3.835% (1-Month USD-LIBOR + 3.750%) due 11/16/25(h) | 30,188 | |||||||
| 390,000 | NR | Michaels Companies Inc., (Restricted, cost — $386,305, acquired 4/8/21), 5.000% (1-Month USD-LIBOR + 4.250%) due 4/15/28(h) | 390,731 | |||||||
| 320,000 | NR | Mileage Plus Holdings LLC, (Restricted, cost — $314,659, acquired 6/25/20), 6.250% (3-Month USD-LIBOR + 5.250%) due 6/21/27(h) | 340,040 | |||||||
| 224,527 | NR | Nexstar Broadcasting Inc., (Restricted, cost — $218,343, acquired 4/8/20), 2.596% (1-Month USD-LIBOR + 2.500%) due 9/18/26(h) | 223,755 | |||||||
See Notes to Financial Statements.
231
| Schedules of Investments |
| (continued) |
| High Yield Fund | ||||||||||
| Face Amount/Units† | Rating†† | Security | Value | |||||||
SENIOR LOANS — 4.0% — (continued) | ||||||||||
| $ | 309,225 | NR | Peraton Corp., (Restricted, cost — $307,790, acquired 2/23/21), 4.500% (1-Month USD-LIBOR + 3.750%) due 2/1/28(h) | $ | 309,740 | |||||
| 246,867 | NR | Phoenix Guarantor Inc., (Restricted, cost — $233,607, acquired 4/8/20), 3.339% (1-Month USD-LIBOR + 3.250%) due 3/5/26(h) | 244,664 | |||||||
| 50,000 | NR | Radiology Partners Inc., (Restricted, cost — $47,357, acquired 5/21/20), 4.346% (1-Month USD-LIBOR + 4.250%) due 7/9/25(h) | 49,768 | |||||||
| 380,000 | NR | Redstone HoldCo 2 LP, (Restricted, cost — $377,405, acquired 4/16/21), 5.500% (3-Month USD-LIBOR + 4.750%) due 4/27/28(h) | 379,683 | |||||||
| 246,835 | NR | Sedgwick Claims Management Services Inc., (Restricted, cost — $231,671, acquired 4/30/20), 3.335% (1-Month USD-LIBOR + 3.250%) due 12/31/25(h) | 244,120 | |||||||
| 74,138 | NR | Spencer Spirit IH LLC, (Restricted, cost — $73,121, acquired 6/14/19), 6.085% (1-Month USD-LIBOR + 6.000%) due 6/19/26(h)(j) | 74,045 | |||||||
| 49,228 | NR | Terrier Media Buyer Inc., (Restricted, cost — $49,041, acquired 12/12/19), 3.585% (1-Month USD-LIBOR + 3.500%) due 12/17/26(h) | 48,997 | |||||||
| 315,990 | NR | TransDigm Inc., (Restricted, cost — $292,408, acquired 4/8/20), 2.335% (1-Month USD-LIBOR + 2.250%) due 12/9/25(h) | 311,462 | |||||||
| 249,375 | NR | Truck Hero Inc., (Restricted, cost — $249,375, acquired 1/20/21), 4.000% (1-Month USD-LIBOR + 3.250%) due 1/31/28(h) | 248,751 | |||||||
| 307,664 | NR | U.S. Renal Care Inc., (Restricted, cost — $307,207, acquired 1/7/21), 5.125% (1-Month USD-LIBOR + 5.000%) due 6/26/26(h) | 308,158 | |||||||
| 316,750 | NR | Verscend Holding Corp., (Restricted, cost — $305,694, acquired 4/8/20), 4.085% (1-Month USD-LIBOR + 4.000%) due 8/27/25(h) | 316,750 | |||||||
| 230,000 | NR | Virgin Media Bristol LLC, (Restricted, cost — $224,773, acquired 4/16/20), 2.596% (1-Month USD-LIBOR + 2.500%) due 1/31/28(h) | 227,906 | |||||||
| 227,125 | NR | VS Buyer LLC, (Restricted, cost — $223,479, acquired 4/17/20), 3.085% (1-Month USD-LIBOR + 3.000%) due 2/28/27(h) | 226,273 | |||||||
|
| |||||||||
| TOTAL SENIOR LOANS (Cost — $8,417,682) | 8,602,776 | |||||||||
|
| |||||||||
COLLATERALIZED MORTGAGE OBLIGATIONS — 2.3% | ||||||||||
| 280,000 | BBB- | ARES XLIV CLO Ltd., Series 2017-44A, Class CR, 3.526% (3-Month USD-LIBOR + 3.400%) due 4/15/34(a)(c) | 280,268 | |||||||
| 250,000 | Baa3(b) | Battalion CLO XI Ltd., Series 2017-11A, Class DR, 3.775% (3-Month USD-LIBOR + 3.650%) due 4/24/34(a)(c) | 250,200 | |||||||
| 280,000 | Ba3(b) | Canyon Capital CLO Ltd., Series 2021-1A, Class E, 6.536% (3-Month USD-LIBOR + 6.410%) due 4/15/34(a)(c) | 278,931 | |||||||
| 250,000 | Baa3(b) | Dryden 49 Senior Loan Fund, Series 2017-49A, Class DR, 3.534% (3-Month USD-LIBOR + 3.400%) due 7/18/30(a)(c) | 250,157 | |||||||
| 360,000 | BB- | Madison Park Funding XXXV Ltd., Series 2019-35A, Class ER, 6.234% (3-Month USD-LIBOR + 6.100%) due 4/20/32(a)(c) | 360,406 | |||||||
| 500,000 | Ba1(b) | Marble Point CLO XIV Ltd., Series 2018-2A, Class D, 3.664% (3-Month USD-LIBOR + 3.530%) due 1/20/32(a)(c) | 493,209 | |||||||
| 250,000 | Ba3(b) | Marble Point CLO XVI Ltd., Series 2019-2A, Class E2B, 7.434% (3-Month USD-LIBOR + 7.300%) due 10/19/32(a)(c) | 250,200 | |||||||
| 280,000 | Baa3(b) | Mountain View CLO IX Ltd., Series 2015-9A, Class CR, 3.246% (3-Month USD-LIBOR + 3.120%) due 7/15/31(a)(c) | 271,197 | |||||||
| 250,000 | BB- | Neuberger Berman CLO XVIII Ltd., Series 2014-18A, Class DR2, 6.054% (3-Month USD-LIBOR + 5.920%) due 10/21/30(a)(c) | 247,247 | |||||||
| 210,000 | BB+ | Ocean Trails CLO V, Series 2014-5A, Class DRR, 3.579% (3-Month USD-LIBOR + 3.450%) due 10/13/31(a)(c) | 201,614 | |||||||
| 310,000 | Baa1(b) | Ocean Trails CLO VI, Series 2016-6A, Class DRR, 3.726% (3-Month USD-LIBOR + 3.600%) due 7/15/28(a)(c) | 310,171 | |||||||
| 250,000 | BBB- | Octagon Investment Partners 33 Ltd., Series 2017-1A, Class C, 2.884% (3-Month USD-LIBOR + 2.750%) due 1/20/31(a)(c) | 248,334 | |||||||
See Notes to Financial Statements.
232
| Schedules of Investments |
| (continued) |
| High Yield Fund | ||||||||||
| Face Amount/Units† | Rating†† | Security | Value | |||||||
COLLATERALIZED MORTGAGE OBLIGATIONS — 2.3% — (continued) | ||||||||||
| $ | 300,000 | BBB- | Pulsar Funding I LLC, Series 2019-1A, Class C, 4.934% (3-Month USD-LIBOR + 4.800%) due 1/20/33(a)(c) | $ | 302,252 | |||||
| 230,000 | BB- | Sculptor CLO XXVI Ltd., Series 26A, Class E, zero coupon, (3-Month USD-LIBOR+7.250% ) due 7/20/34(a)(c) | 230,083 | |||||||
| 250,000 | Ba3(b) | Symphony CLO XX Ltd., Series 2018-20A, Class E, 6.416% (3-Month USD-LIBOR + 6.290%) due 1/16/32(a)(c) | 252,520 | |||||||
| 310,000 | Ba3(b) | THL Credit Wind River CLO Ltd., Series 2017-3A, Class ER, 7.176% (3-Month USD-LIBOR + 7.050%) due 4/15/35(a)(c) | 310,277 | |||||||
| 350,000 | BB- | Voya CLO Ltd., Series 2017-3A, Class DR, 7.084% (3-Month USD-LIBOR + 6.950%) due 4/20/34(a)(c) | 353,419 | |||||||
|
| |||||||||
| TOTAL COLLATERALIZED MORTGAGE OBLIGATIONS (Cost — $4,848,322) | 4,890,485 | |||||||||
|
| |||||||||
CONVERTIBLE PREFERRED STOCKS — 0.4% | ||||||||||
ENERGY — 0.4% | ||||||||||
Pipelines — 0.4% | ||||||||||
| 12,149 | MPLX LP, step bond to yield (Restricted, cost — $394,843, acquired 12/16/20), 8.462%*(d)(h)(i) | 430,627 | ||||||||
| 350 | Targa Resources Corp., (Restricted, cost — $367,500, acquired 2/17/21), 9.500%(d)(h) | 377,503 | ||||||||
|
| |||||||||
| TOTAL CONVERTIBLE PREFERRED STOCKS (Cost — $762,342) | 808,130 | |||||||||
|
| |||||||||
| Shares/Units | ||||||||||
COMMON STOCKS — 0.2% | ||||||||||
ENERGY — 0.2% | ||||||||||
Energy Equipment & Services — 0.0% | ||||||||||
| 17,453 | Hercules Offshore Inc.*(i)(j) | 2,257 | ||||||||
|
| |||||||||
Oil & Gas — 0.2% | ||||||||||
| 21,784 | Berry Corp.(k) | 130,704 | ||||||||
| 1,531 | Oasis Petroleum Inc. | 132,569 | ||||||||
| 13,508 | Southwestern Energy Co.* | 61,462 | ||||||||
|
| |||||||||
| Total Oil & Gas | 324,735 | |||||||||
|
| |||||||||
| TOTAL ENERGY | 326,992 | |||||||||
|
| |||||||||
| TOTAL COMMON STOCKS (Cost — $2,033,441) | 326,992 | |||||||||
|
| |||||||||
PREFERRED STOCKS — 0.2% | ||||||||||
FINANCIALS — 0.2% | ||||||||||
Banks — 0.0% | ||||||||||
| 276 | GMAC Capital Trust I, 5.910% (3-Month USD-LIBOR + 5.785%) due 2/15/40(c) | 7,264 | ||||||||
|
| |||||||||
Diversified Financial Services — 0.2% | ||||||||||
| 4,950 | B Riley Financial Inc., 5.250% due 8/31/28* | 122,216 | ||||||||
| 12,150 | B. Riley Financial Inc., 6.000% due 1/31/28 | 314,078 | ||||||||
| 450 | B. Riley Financial Inc., 6.875% due 9/30/23 | 11,524 | ||||||||
|
| |||||||||
| Total Diversified Financial Services | 447,818 | |||||||||
|
| |||||||||
| TOTAL PREFERRED STOCKS (Cost — $443,594) | 455,082 | |||||||||
|
| |||||||||
See Notes to Financial Statements.
233
| Schedules of Investments |
| (continued) |
| High Yield Fund | ||||||||||
| Face Amount/Units† | Rating†† | Security | Value | |||||||
SOVEREIGN BONDS — 0.0% | ||||||||||
Argentina — 0.0% | ||||||||||
| Argentine Republic Government International Bonds: | ||||||||||
| $ | 9,647 | CCC+ | 1.000% due 7/9/29 | $ | 3,968 | |||||
| 51,375 | CCC+ | step bond to yield, 0.500% due 7/9/30 | 20,138 | |||||||
| 94,124 | CCC+ | step bond to yield, 1.125% due 7/9/35 | 33,036 | |||||||
|
| |||||||||
| TOTAL SOVEREIGN BONDS (Cost—$81,583) | 57,142 | |||||||||
|
| |||||||||
| TOTAL INVESTMENTS IN SECURITIES BEFORE SHORT-TERM INVESTMENTS (Cost — $192,836,653) | 200,240,118 | |||||||||
|
| |||||||||
SHORT-TERM INVESTMENTS (l) — 4.9% | ||||||||||
MONEY MARKET FUND — 0.1% | ||||||||||
| 129,000 | Invesco STIT — Government & Agency Portfolio, 0.026%, Institutional Class(m) (Cost — $129,000) | 129,000 | ||||||||
|
| |||||||||
TIME DEPOSITS — 4.8% | ||||||||||
| 8,717,893 | ANZ National Bank — London, 0.005% due 9/1/21 | 8,717,893 | ||||||||
| 1,586,666 | BNP Paribas — Paris, 0.005% due 9/1/21 | 1,586,666 | ||||||||
| 77 | Skandinaviska Enskilda Banken AB — Stockholm, 0.005% due 9/1/21 | 77 | ||||||||
|
| |||||||||
| TOTAL TIME DEPOSITS (Cost — $10,304,636) | 10,304,636 | |||||||||
|
| |||||||||
| TOTAL SHORT-TERM INVESTMENTS (Cost — $10,433,636) | 10,433,636 | |||||||||
|
| |||||||||
| TOTAL INVESTMENTS — 98.9% (Cost — $203,270,289) | 210,673,754 | |||||||||
|
| |||||||||
| Other Assets in Excess of Liabilities — 1.1% | 2,418,823 | |||||||||
|
| |||||||||
| TOTAL NET ASSETS — 100.0% | $ | 213,092,577 | ||||||||
|
| |||||||||
| † | Amount denominated in U.S. dollars, unless otherwise noted. |
| †† | All ratings are by Standard & Poor’s Rating Service, unless otherwise noted. All ratings are unaudited. |
| * | Non-income producing security. |
| (a) | Restricted security that may be sold to “qualified institutional buyers” pursuant to the conditions of Rule 144A under the Securities Act of 1933, as amended. This security has been deemed liquid pursuant to guidelines approved by the Board of Trustees, unless otherwise noted. The aggregate value of restricted 144A holdings at August 31, 2021, amounts to $149,418,683 and represents 70.1% of net assets. |
| (b) | Rating by Moody’s Investors Service. All ratings are unaudited. |
| (c) | Variable rate security. Interest rate disclosed is that which was in effect at August 31, 2021. |
| (d) | Security is perpetual in nature and has no stated maturity date. |
| (e) | Payment in-kind security for which part of the income earned may be paid as additional principal. |
| (f) | Rating by Fitch Ratings Service. All ratings are unaudited. |
| (g) | Security is currently in default. |
| (h) | The aggregate value of restricted securities (excluding 144A holdings) at August 31, 2021, amounts to $9,410,906 and represents 4.4% of net assets. |
| (i) | Security is valued in good faith at fair value by or under the direction of the Board of Trustees. |
| (j) | Illiquid security. |
| (k) | All or a portion of this security is on loan (See Note 1). |
| (l) | Inclusive of all short-term holdings, including investments of collateral received from securities lending transactions. Excluding such collateral, the percentage of portfolio holdings would be 4.8%. |
| (m) | Represents investments of collateral received from securities lending transactions. |
| # | Security that used significant unobservable inputs to determine fair value. |
See Notes to Financial Statements.
234
| Schedules of Investments |
| (continued) |
| High Yield Fund | ||||||
Abbreviations used in this schedule: | ||
| CLO | — Collateralized Loan Obligation | |
| CMT | — Constant Maturity Treasury Rate | |
| LIBOR | — London Interbank Offered Rate | |
| PLC | — Public Limited Company | |
| USD | — United States Dollar | |
See pages 296-297 for definitions of ratings.
At August 31, 2021, for High Yield Fund the aggregate cost of investments, the aggregate gross unrealized appreciation and depreciation of all investments for federal income tax purposes were as follows:
| Fund | Aggregate Cost For Federal Income Tax Purposes | Gross Unrealized Appreciation | Gross Unrealized (Depreciation) | Net Unrealized Appreciation | ||||||||||||
High Yield Fund | $ | 203,941,798 | $ | 9,976,709 | $ | (3,244,753 | ) | $ | 6,731,956 | |||||||
| Summary of Investments by Security Type^ | ||||
Corporate Bonds & Notes | 87.9 | % | ||
Senior Loans | 4.1 | |||
Collateralized Mortgage Obligations | 2.3 | |||
Convertible Preferred Stocks | 0.4 | |||
Preferred Stocks | 0.2 | |||
Common Stocks | 0.2 | |||
Sovereign Bonds | 0.0 | * | ||
Short-Term Investments | 4.9 | |||
|
| |||
| 100.0 | %+ | |||
|
| |||
| ^ | As a percentage of total investments. |
| * | Position represents less than 0.05%. |
| + | Does not reflect investments of collateral received from securities lending transactions. |
See Notes to Financial Statements.
235
| Schedules of Investments |
| (continued) |
| International Fixed Income Fund | ||||||||||
| Face Amount/Units† | Security | Value | ||||||||
SOVEREIGN BONDS — 48.1% | ||||||||||
Argentina — 0.0% | ||||||||||
| 360,000 | ARS | Argentine Bonos del Tesoro, 15.500% due 10/17/26(a) | $ | 1,727 | ||||||
| 4,960,000 | ARS | Bonos del Tesoro Nacional en Pesos Badlar, 36.141% (Argentina Deposit Rates Badlar Private Banks ARS 30 to 35 Days Index + 2.000%) due 4/3/22(a)(b) | 52,850 | |||||||
| 780,000 | ARS | Ciudad Autonoma de Buenos Aires, 39.145% (Argentina Deposit Rates Badlar Private Banks ARS 30 to 35 Days Index + 5.000%) due 1/23/22(a)(b) | 8,379 | |||||||
| 460,000 | ARS | Provincia de Buenos Aires, 37.892% (Argentina Deposit Rates Badlar Private Banks ARS 30 to 35 Days Index + 3.750%) due 4/12/25(a)(b)(c) | 4,313 | |||||||
|
| |||||||||
| Total Argentina | 67,269 | |||||||||
|
| |||||||||
Australia — 0.6% | ||||||||||
| Australia Government Bonds: | ||||||||||
| 100,000 | AUD | 2.500% due 5/21/30 | 82,251 | |||||||
| 200,000 | AUD | 1.000% due 11/21/31 | 144,155 | |||||||
| 500,000 | AUD | 1.750% due 6/21/51 | 344,165 | |||||||
| 300,000 | AUD | Northern Territory Treasury Corp., 2.000% due 4/21/31 | 226,920 | |||||||
| 150,000 | AUD | Treasury Corp. of Victoria, 4.250% due 12/20/32 | 140,204 | |||||||
|
| |||||||||
| Total Australia | 937,695 | |||||||||
|
| |||||||||
Canada — 1.6% | ||||||||||
| 3,100,000 | CAD | Province of Ontario Canada, 3.150% due 6/2/22 | 2,510,495 | |||||||
|
| |||||||||
France — 5.5% | ||||||||||
| French Republic Government Bonds OAT: | ||||||||||
| 900,000 | EUR | 3.250% due 5/25/45 | 1,701,119 | |||||||
| 3,300,000 | EUR | 2.000% due 5/25/48(c) | 5,185,031 | |||||||
| 1,050,000 | EUR | 0.750% due 5/25/52(c) | 1,235,292 | |||||||
| 400,000 | EUR | 0.500% due 5/25/72(c) | 389,375 | |||||||
|
| |||||||||
| Total France | 8,510,817 | |||||||||
|
| |||||||||
Israel — 1.2% | ||||||||||
| Israel Government Bonds — Fixed: | ||||||||||
| 3,000,000 | ILS | 5.500% due 1/31/22 | 987,383 | |||||||
| 2,000,000 | ILS | 1.000% due 3/31/30 | 629,870 | |||||||
| $ | 200,000 | State of Israel, 3.800% due 5/13/60 | 231,723 | |||||||
|
| |||||||||
| Total Israel | 1,848,976 | |||||||||
|
| |||||||||
Italy — 4.6% | ||||||||||
| Italy Buoni Poliennali Del Tesoro: | ||||||||||
| 900,000 | EUR | 0.350% due 2/1/25 | 1,082,748 | |||||||
| 2,600,000 | EUR | 1.850% due 7/1/25(c) | 3,303,773 | |||||||
| 950,000 | EUR | 1.700% due 9/1/51(c) | 1,121,214 | |||||||
| 800,000 | EUR | 2.150% due 3/1/72(c) | 949,379 | |||||||
| 400,000 | GBP | Republic of Italy Government International Bonds, 6.000% due 8/4/28 | 709,286 | |||||||
|
| |||||||||
| Total Italy | 7,166,400 | |||||||||
|
| |||||||||
Japan — 18.6% | ||||||||||
| 1,200,000 | Development Bank of Japan Inc., 2.500% due 10/18/22 | 1,231,620 | ||||||||
| 200,000 | Japan Finance Organization for Municipalities, 2.625% due 4/20/22(c) | 203,050 | ||||||||
| 850,000,000 | JPY | Japan Government Ten Year Bonds, 0.100% due 6/20/31 | 7,788,814 | |||||||
| Japan Government Thirty Year Bonds: | ||||||||||
| 210,000,000 | JPY | 1.700% due 9/20/44 | 2,418,954 | |||||||
| 310,000,000 | JPY | 1.400% due 9/20/45 | 3,395,460 | |||||||
| 152,000,000 | JPY | 0.500% due 9/20/46 | 1,374,305 | |||||||
| 168,000,000 | JPY | 0.700% due 12/20/48 | 1,572,494 | |||||||
| 380,000,000 | JPY | 0.500% due 3/20/49 | 3,374,987 | |||||||
| 120,000,000 | JPY | 0.700% due 6/20/51 | 1,105,520 | |||||||
See Notes to Financial Statements.
236
| Schedules of Investments |
| (continued) |
| International Fixed Income Fund | ||||||||||
| Face Amount/Units† | Security | Value | ||||||||
Japan — 18.6% — (continued) | ||||||||||
| Japan Government Twenty Year Bonds: | ||||||||||
| 120,000,000 | JPY | 1.300% due 6/20/35 | $ | 1,258,024 | ||||||
| 181,000,000 | JPY | 1.200% due 9/20/35 | 1,877,116 | |||||||
| 190,000,000 | JPY | 1.000% due 12/20/35 | 1,923,257 | |||||||
| 40,000,000 | JPY | 0.400% due 3/20/36 | 373,748 | |||||||
| 111,092,300 | JPY | Japanese Government CPI Linked Bonds, 0.100% due 3/10/28 | 1,036,451 | |||||||
|
| |||||||||
| Total Japan | 28,933,800 | |||||||||
|
| |||||||||
Kuwait — 0.6% | ||||||||||
| $ | 900,000 | Kuwait International Government Bonds, 3.500% due 3/20/27 | 1,007,482 | |||||||
|
| |||||||||
Lithuania — 0.4% | ||||||||||
| 500,000 | EUR | Lithuania Government Bonds, 0.100% due 4/1/23 | 594,626 | |||||||
|
| |||||||||
Malaysia — 0.4% | ||||||||||
| Malaysia Government Bonds: | ||||||||||
| 1,100,000 | MYR | 3.906% due 7/15/26 | 279,557 | |||||||
| 700,000 | MYR | 3.502% due 5/31/27 | 173,713 | |||||||
| 600,000 | MYR | Malaysia Government Investment Issue, 4.369% due 10/31/28 | 155,622 | |||||||
|
| |||||||||
| Total Malaysia | 608,892 | |||||||||
|
| |||||||||
Peru — 0.8% | ||||||||||
| Peruvian Government International Bonds: | ||||||||||
| 1,300,000 | PEN | 6.350% due 8/12/28 | 331,468 | |||||||
| 1,300,000 | PEN | 6.350% due 8/12/28(c) | 331,468 | |||||||
| 800,000 | PEN | 5.940% due 2/12/29 | 198,454 | |||||||
| 400,000 | PEN | 5.940% due 2/12/29(c) | 99,227 | |||||||
| 700,000 | PEN | 6.950% due 8/12/31(c) | 181,792 | |||||||
| 200,000 | PEN | 5.350% due 8/12/40(c) | 40,611 | |||||||
|
| |||||||||
| Total Peru | 1,183,020 | |||||||||
|
| |||||||||
Qatar — 1.5% | ||||||||||
| Qatar Government International Bonds: | ||||||||||
| 1,000,000 | 3.875% due 4/23/23 | 1,057,290 | ||||||||
| 900,000 | 4.500% due 4/23/28 | 1,064,250 | ||||||||
| 200,000 | 4.400% due 4/16/50(c) | 248,247 | ||||||||
|
| |||||||||
| Total Qatar | 2,369,787 | |||||||||
|
| |||||||||
Romania — 0.4% | ||||||||||
| Romanian Government International Bonds: | ||||||||||
| 200,000 | EUR | 1.750% due 7/13/30(c) | 237,558 | |||||||
| 100,000 | EUR | 2.000% due 4/14/33(c) | 117,802 | |||||||
| 50,000 | EUR | 2.750% due 4/14/41(c) | 58,487 | |||||||
| 200,000 | EUR | 2.875% due 4/13/42(c) | 234,662 | |||||||
|
| |||||||||
| Total Romania | 648,509 | |||||||||
|
| |||||||||
Saudi Arabia — 0.8% | ||||||||||
| 1,200,000 | Saudi Government International Bonds, 2.375% due 10/26/21 | 1,204,111 | ||||||||
|
| |||||||||
Serbia — 0.1% | ||||||||||
| 100,000 | EUR | Serbia International Bonds, 1.650% due 3/3/33(c) | 117,312 | |||||||
|
| |||||||||
Singapore — 0.7% | ||||||||||
| Singapore Government Bonds: | ||||||||||
| 1,000,000 | SGD | 1.625% due 7/1/31 | 759,114 | |||||||
| 100,000 | SGD | 3.375% due 9/1/33 | 89,033 | |||||||
| 300,000 | SGD | 2.750% due 4/1/42 | 258,733 | |||||||
|
| |||||||||
| Total Singapore | 1,106,880 | |||||||||
|
| |||||||||
See Notes to Financial Statements.
237
| Schedules of Investments |
| (continued) |
| International Fixed Income Fund | ||||||||||
| Face Amount/Units† | Security | Value | ||||||||
Slovenia — 0.2% | ||||||||||
| $ | 250,000 | Slovenia Government International Bonds, 5.250% due 2/18/24 | $ | 279,030 | ||||||
|
| |||||||||
Spain — 6.5% | ||||||||||
| Autonomous Community of Catalonia: | ||||||||||
| 100,000 | EUR | 4.900% due 9/15/21 | 118,398 | |||||||
| 100,000 | EUR | 4.220% due 4/26/35 | 160,389 | |||||||
| Spain Government Bonds: | ||||||||||
| 300,000 | EUR | 0.250% due 7/30/24(c) | 362,185 | |||||||
| 2,000,000 | EUR | 1.450% due 10/31/27(c) | 2,600,870 | |||||||
| 1,500,000 | EUR | 1.400% due 7/30/28(c) | 1,954,858 | |||||||
| 450,000 | EUR | 1.450% due 4/30/29(c) | 590,683 | |||||||
| 2,200,000 | EUR | 1.250% due 10/31/30(c) | 2,846,894 | |||||||
| 400,000 | EUR | 1.850% due 7/30/35(c) | 550,249 | |||||||
| 300,000 | EUR | 1.000% due 10/31/50(c) | 333,320 | |||||||
| 600,000 | EUR | 1.450% due 10/31/71(c) | 650,734 | |||||||
|
| |||||||||
| Total Spain | 10,168,580 | |||||||||
|
| |||||||||
United Arab Emirates — 0.1% | ||||||||||
| 200,000 | Abu Dhabi Government International Bonds, 3.875% due 4/16/50(c) | 234,218 | ||||||||
|
| |||||||||
United Kingdom — 3.5% | ||||||||||
| United Kingdom Gilts: | ||||||||||
| 1,400,000 | GBP | 3.250% due 1/22/44 | 2,760,418 | |||||||
| 700,000 | GBP | 3.500% due 1/22/45 | 1,446,615 | |||||||
| 300,000 | GBP | 1.750% due 1/22/49 | 479,407 | |||||||
| 600,000 | GBP | 0.625% due 10/22/50 | 734,702 | |||||||
|
| |||||||||
| Total United Kingdom | 5,421,142 | |||||||||
|
| |||||||||
| TOTAL SOVEREIGN BONDS (Cost — $70,574,449) | 74,919,041 | |||||||||
|
| |||||||||
COLLATERALIZED MORTGAGE OBLIGATIONS — 19.3% | ||||||||||
| 189,460 | A10 Bridge Asset Financing LLC, Series 2020-C, Class A, 2.021% due 8/15/40(c) | 190,545 | ||||||||
| 400,000 | ACE Securities Corp. Home Equity Loan Trust, Series 2005-HE5, Class M4, 0.984% (1-Month USD-LIBOR + 0.900%) due 8/25/35(b) | 401,352 | ||||||||
| 320,484 | GBP | ALBA PLC, Series 2007-1, Class A3, 0.252% (3-Month GBP-LIBOR + 0.170%) due 3/17/39(b) | 426,688 | |||||||
| 400,000 | Apidos CLO XXVI, Series 2017-26A, Class A1AR, zero coupon (3-Month USD-LIBOR+ 0.900%) due 7/18/29(b)(c) | 400,341 | ||||||||
| 243,758 | Arch Street CLO Ltd., Series 2016-2A, Class AR2, 1.134% (3-Month USD-LIBOR + 1.000%) due 10/20/28(b)(c) | 243,900 | ||||||||
| 400,000 | ARES L CLO Ltd., Series 2018-50A, Class AR, 1.176% (3-Month USD-LIBOR + 1.050%) due 1/15/32(b)(c) | 400,374 | ||||||||
| 464,833 | Argent Mortgage Loan Trust, Series 2005-W1, Class A1, 0.564% (1-Month USD-LIBOR + 0.480%) due 5/25/35(b) | 439,134 | ||||||||
| 271,417 | GBP | Avon Finance No 2 PLC, Series 2A, Class A, 0.950% (Sterling Overnight Index Average + 0.900%) due 9/20/48(b)(c) | 374,327 | |||||||
| 12,471 | Banc of America Funding Trust, Series 2006-A, Class 1A1, 2.686% due 2/20/36(b) | 12,558 | ||||||||
| 194,806 | Bayview Financial Asset Trust, Series 2007-SR1A, Class A, 0.534% (1-Month USD-LIBOR + 0.450%) due 3/25/37(b)(c) | 189,050 | ||||||||
| Bear Stearns Adjustable Rate Mortgage Trust: | ||||||||||
| 2,259 | Series 2003-5, Class 1A2, 2.486% due 8/25/33(b) | 2,360 | ||||||||
| 3,667 | Series 2003-7, Class 6A, 2.477% due 10/25/33(b) | 3,782 | ||||||||
| 8,993 | Series 2004-2, Class 22A, 2.480% due 5/25/34(b) | 8,949 | ||||||||
| 5,298 | Series 2004-2, Class 23A, 2.666% due 5/25/34(b) | 4,972 | ||||||||
| 52,025 | Bear Stearns Structured Products Inc. Trust, Series 2007-R6, Class 1A1, 2.735% due 1/26/36(b) | 43,500 | ||||||||
See Notes to Financial Statements.
238
| Schedules of Investments |
| (continued) |
| International Fixed Income Fund | ||||||||||
| Face Amount/Units† | Security | Value | ||||||||
COLLATERALIZED MORTGAGE OBLIGATIONS — 19.3% — (continued) | ||||||||||
| 103,821 | EUR | Black Diamond CLO Designated Activity Co., Series 2015-1A, Class A1R, 0.650% (3-Month EURIBOR + 0.650%) due 10/3/29(b)(c) | $ | 122,592 | ||||||
| 300,000 | EUR | BlueMountain Euro CLO, Series 2017-2A, Class AR, 0.650% (3-Month EURIBOR + 0.650%) due 7/15/30(b)(c) | 354,072 | |||||||
| 248,955 | EUR | Cairn CLO VII BV, Series 2016-7A, Class A1R, 0.670% (3-Month EURIBOR + 0.670%) due 1/31/30(b)(c) | 294,005 | |||||||
| 250,000 | EUR | Cairn CLO X DAC, Series 2018-10A, Class AR, 0.780% (3-Month EURIBOR + 0.780%) due 10/15/31(b)(c) | 295,225 | |||||||
| $ | 400,000 | CARLYLE US CLO Ltd., Series 2017-1A, Class A1R, 1.134% (3-Month USD-LIBOR + 1.000%) due 4/20/31(b)(c) | 400,342 | |||||||
| 282,212 | Cathedral Lake CLO Ltd., Series 2015-2A, Class A1RR, 0.976% (3-Month USD-LIBOR + 0.850%) due 7/16/29(b)(c) | 282,374 | ||||||||
| 300,000 | EUR | Cordatus CLO PLC, Series 11A, Class AR, 0.650% (3-Month EURIBOR + 0.650%) due 10/15/31(b)(c) | 353,262 | |||||||
| Countrywide Alternative Loan Trust: | ||||||||||
| 4,832 | Series 2005-21CB, Class A3, 5.250% due 6/25/35 | 4,605 | ||||||||
| 28,548 | Series 2007-7T2, Class A9, 6.000% due 4/25/37 | 17,539 | ||||||||
| 38,010 | Series 2007-11T1, Class A12, 0.434% (1-Month USD-LIBOR + 0.350%) due 5/25/37(b) | 12,580 | ||||||||
| 20,786 | Series 2007-16CB, Class 5A1, 6.250% due 8/25/37 | 15,705 | ||||||||
| Countrywide Asset-Backed Certificates: | ||||||||||
| 47,427 | Series 2006-18, Class 2A2, 0.244% (1-Month USD-LIBOR + 0.160%) due 3/25/37(b) | 47,344 | ||||||||
| 400,000 | Series 2007-9, Class 2A4, 0.334% (1-Month USD-LIBOR + 0.250%) due 2/25/36(b) | 391,953 | ||||||||
| 63,759 | Series 2007-12, Class 1A1, 0.824% (1-Month USD-LIBOR + 0.740%) due 8/25/47(b) | 62,793 | ||||||||
| 487,062 | Series 2007-13, Class 1A, 0.924% (1-Month USD-LIBOR + 0.840%) due 10/25/47(b) | 477,708 | ||||||||
| 164,802 | Series 2007-SEA2, Class 1A1, 1.084% (1-Month USD-LIBOR + 1.000%) due 8/25/47(b)(c) | 165,778 | ||||||||
| Countrywide Home Loan Mortgage Pass-Through Trust: | ||||||||||
| 798 | Series 2004-12, Class 11A1, 2.885% due 8/25/34(b) | 812 | ||||||||
| 54,821 | Series 2005-2, Class 1A1, 0.724% (1-Month USD-LIBOR + 0.640%) due 3/25/35(b) | 48,961 | ||||||||
| 3,981 | Series 2005-3, Class 2A1, 0.664% (1-Month USD-LIBOR + 0.580%) due 4/25/35(b) | 3,859 | ||||||||
| 57,323 | Series 2005-9, Class 1A3, 0.544% (1-Month USD-LIBOR + 0.460%) due 5/25/35(b) | 50,543 | ||||||||
| 16,821 | Series 2005-11, Class 3A1, 2.535% due 4/25/35(b) | 15,053 | ||||||||
| 13,731 | Series 2005-HYB9, Class 3A2A, 2.195% (1-Year USD-LIBOR + 1.750%) due 2/20/36(b) | 12,183 | ||||||||
| 567,756 | Series 2007-4, Class 1A47, 6.000% due 5/25/37 | 375,986 | ||||||||
| 94,096 | Series 2007-19, Class 2A1, 6.500% due 11/25/47 | 65,821 | ||||||||
| 175,607 | Credit Suisse Mortgage Capital Certificates, Series 2007-NC1, Class 2A1, 0.684% (1-Month USD-LIBOR + 0.600%) due 9/25/37(b) | 175,006 | ||||||||
| Credit Suisse Mortgage Capital Trust: | ||||||||||
| 34,758 | Series 2007-5R, Class A5, 6.500% due 7/26/36 | 13,062 | ||||||||
| 352,665 | Series 2019-RPL9, Class A1, 2.974% due 10/27/59(b)(c) | 355,608 | ||||||||
| 142,094 | CSAB Mortgage-Backed Trust, Series 2006-4, Class A6A, step bond to yield, 6.184% due 12/25/36 | 47,097 | ||||||||
| 100,000 | CSMC Trust, Series 2021-INV1, Class A3, 2.500% due 7/25/56#(a)(b)(c)(d) | 102,495 | ||||||||
| 484,987 | Deutsche Alternative-A Securities Mortgage Loan Trust, Series 2007-3, Class 2A1, 0.834% (1-Month USD-LIBOR + 0.750%) due 10/25/47(b) | 457,664 | ||||||||
| 300,000 | EUR | Dryden Leveraged Loan CDO, Series 2017-27A, Class AR, 0.660% (3-Month EURIBOR + 0.660%) due 4/15/33(b)(c) | 355,472 | |||||||
| 300,000 | Dryden Senior Loan Fund, Series 2017-47A, Class A1R, 1.106% (3-Month USD-LIBOR + 0.980%) due 4/15/28(b)(c) | 300,194 | ||||||||
| 495,359 | Ellington Loan Acquisition Trust, Series 2007-2, Class A1, 1.134% (1-Month USD-LIBOR + 1.050%) due 5/25/37(b)(c) | 498,452 | ||||||||
| 147,987 | GBP | Eurohome UK Mortgages PLC, Series 2007-1, Class A, 0.231% (3-Month GBP-LIBOR + 0.150%) due 6/15/44(b) | 199,081 | |||||||
| 328,080 | GBP | Eurosail-UK PLC, Series 2007-4X, Class A3, 1.034% (3-Month GBP-LIBOR + 0.950%) due 6/13/45(b) | 451,568 | |||||||
See Notes to Financial Statements.
239
| Schedules of Investments |
| (continued) |
| International Fixed Income Fund | ||||||||||
| Face Amount/Units† | Security | Value | ||||||||
COLLATERALIZED MORTGAGE OBLIGATIONS — 19.3% — (continued) | ||||||||||
| $ | 400,000 | Extended Stay America Trust, Series 2021-ESH, Class A, 1.176% (1-Month USD-LIBOR + 1.080%) due 7/15/38(b)(c) | $ | 401,903 | ||||||
| Federal Home Loan Mortgage Corp. (FHLMC): | ||||||||||
| 19,472 | Series T-35, Class A, 0.364% (1-Month USD-LIBOR + 0.280%) due 9/25/31(b) | 19,331 | ||||||||
| 25,316 | Series T-62, Class 1A1, 1.298% (1-Year Treasury Average Rate + 1.200%) due 10/25/44(b) | 25,981 | ||||||||
| Federal Home Loan Mortgage Corp. (FHLMC), REMICS: | ||||||||||
| 17,239 | Series 2391, Class FJ, 0.596% (1-Month USD-LIBOR + 0.500%) due 4/15/28(b) | 17,315 | ||||||||
| 31,550 | Series 2614, Class SJ, 19.400% (19.663% – 2.75% × 1-Month USD-LIBOR) due 5/15/33(e) | 45,917 | ||||||||
| 123,553 | Series 4579, Class FD, 0.450% (1-Month USD-LIBOR + 0.350%) due 1/15/38(b) | 123,807 | ||||||||
| 123,553 | Series 4579, Class SD, 1.926% due 1/15/38(b)(f) | 7,909 | ||||||||
| 4,995 | Federal National Mortgage Association (FNMA), Grantor Trust, Series 2004-T3, Class 1A1, 6.000% due 2/25/44 | 5,755 | ||||||||
| Federal National Mortgage Association (FNMA), REMICS: | ||||||||||
| 5,032 | Series 2003-34, Class A1, 6.000% due 4/25/43 | 5,712 | ||||||||
| 7,751 | Series 2006-48, Class TF, 0.484% (1-Month USD-LIBOR + 0.400%) due 6/25/36(b) | 7,829 | ||||||||
| 72,534 | Series 2009-104, Class FA, 0.884% (1-Month USD-LIBOR + 0.800%) due 12/25/39(b) | 72,316 | ||||||||
| 35,691 | Federal National Mortgage Association (FNMA), REMICS Trust, Series 2004-W12, Class 1A1, 6.000% due 7/25/44 | 41,539 | ||||||||
| 100,918 | First Franklin Mortgage Loan Trust, Series 2005-FF9, Class A4, 0.804% (1-Month USD-LIBOR + 0.720%) due 10/25/35(b) | 100,883 | ||||||||
| 400,000 | Galaxy XV CLO Ltd., Series 2013-15A, Class ARR, 1.096% (3-Month USD-LIBOR + 0.970%) due 10/15/30(b)(c) | 400,219 | ||||||||
| 21,354 | GMACM Mortgage Loan Trust, Series 2005-AR6, Class 3A1, 3.000% due 11/19/35(b) | 21,465 | ||||||||
| Government National Mortgage Association (GNMA): | ||||||||||
| 331,974 | Series 2016-H15, Class FA, 0.903% (1-Month USD-LIBOR + 0.800%) due 7/20/66(b) | 336,481 | ||||||||
| 14,498 | Series 2017-121, Class PE, 3.000% due 7/20/46 | 14,810 | ||||||||
| GS Mortgage-Backed Securities Trust: | ||||||||||
| 200,000 | Series 2021-GR2, Class A2, 2.500% due 2/25/52(b)(c) | 204,808 | ||||||||
| 100,000 | Series 2021-INV1, Class A2, 2.500% due 12/25/51(b)(c)(d) | 102,582 | ||||||||
| GSR Mortgage Loan Trust: | ||||||||||
| 9,071 | Series 2003-1, Class A2, 1.840% (1-Year CMT Index + 1.750%) due 3/25/33(b) | 9,283 | ||||||||
| 83,132 | Series 2005-AR7, Class 2A1, 2.800% due 11/25/35(b) | 84,295 | ||||||||
| Harborview Mortgage Loan Trust: | ||||||||||
| 13,428 | Series 2005-2, Class 2A1A, 0.527% (1-Month USD-LIBOR + 0.440%) due 5/19/35(b) | 12,967 | ||||||||
| 28,371 | Series 2005-3, Class 2A1A, 0.567% (1-Month USD-LIBOR + 0.480%) due 6/19/35(b) | 28,402 | ||||||||
| 60,085 | Series 2006-SB1, Class A1A, 0.948% (1-Year Treasury Average Rate + 0.850%) due 12/19/36(b) | 58,322 | ||||||||
| 81,327 | Series 2007-1, Class 2A1A, 0.217% (1-Month USD-LIBOR + 0.130%) due 3/19/37(b) | 76,190 | ||||||||
| 300,000 | EUR | Harvest CLO XI DAC, Series 2011-A, Class ARR, 0.650% (3-Month EURIBOR + 0.650%) due 6/26/30(b)(c) | 354,187 | |||||||
| 376,435 | GBP | Hawksmoor Mortgages, Series 2019-1A, Class A, 1.100% (Sterling Overnight Index Average + 1.050%) due 5/25/53(b)(c) | 520,152 | |||||||
| 167,968 | Homeward Opportunities Fund I Trust, Series 2020-2, Class A1, 1.657% due 5/25/65(b)(c) | 169,022 | ||||||||
| JPMorgan Mortgage Trust: | ||||||||||
| 2,377 | Series 2003-A2, Class 3A1, 1.916% due 11/25/33(b) | 2,485 | ||||||||
| 658 | Series 2005-A1, Class 6T1, 2.352% due 2/25/35(b) | 670 | ||||||||
| 800,000 | Series 2021-INV4, Class A2, 3.000% due 12/30/99(b)(c)(d) | 831,056 | ||||||||
| 1,200,000 | Series 2021-INV7, Class A2, 0.000% due 11/25/51#(a)(c)(d) | 1,239,585 | ||||||||
| 7,997 | JPMorgan Resecuritization Trust, Series 2009-7, Class 17A1, 5.064% due 7/27/37(b)(c) | 7,999 | ||||||||
| 459,474 | GBP | Ludgate Funding PLC, Series 2007-1, Class A2A, 0.236% (3-Month GBP-LIBOR + 0.160%) due 1/1/61(b) | 611,342 | |||||||
| 300,000 | Manhattan West Mortgage Trust, Series 2020-1MW, Class A, 2.130% due 9/10/39(c) | 309,762 | ||||||||
| 250,000 | Marble Point CLO X Ltd., Series 2017-1A, Class AR, 1.166% (3-Month USD-LIBOR + 1.040%) due 10/15/30(b)(c) | 250,143 | ||||||||
| 3,682 | Merrill Lynch Mortgage Investors Trust, Series 2003-A2, Class 1A1, 1.870% due 2/25/33(b) | 3,601 | ||||||||
See Notes to Financial Statements.
240
| Schedules of Investments |
| (continued) |
| International Fixed Income Fund | ||||||||||
| Face Amount/Units† | Security | Value | ||||||||
COLLATERALIZED MORTGAGE OBLIGATIONS — 19.3% — (continued) | ||||||||||
| $ | 200,000 | MF1 Multifamily Housing Mortgage Loan Trust, Series 2021-FL5, Class A, 1.014% (30 DAY SOFR + 0.964%) due 7/15/36(b)(c) | $ | 200,547 | ||||||
| 422,503 | MFA Trust, Series 2020-NQM2, Class A1, 1.381% due 4/25/65(b)(c) | 425,378 | ||||||||
| 397,126 | MP CLO VII LTD, Series 2015-1A, Class AR3, 1.024% (3-Month USD-LIBOR + 0.890%) due 10/18/28(b)(c) | 397,398 | ||||||||
| New Residential Mortgage Loan Trust: | ||||||||||
| 290,796 | Series 2019-RPL3, Class A1, 2.750% due 7/25/59(b)(c) | 302,018 | ||||||||
| 295,760 | Series 2020-RPL1, Class A1, 2.750% due 11/25/59(b)(c) | 304,972 | ||||||||
| 561,032 | GBP | Newgate Funding PLC, Series 2007-1X, Class A3, 0.240% (3-Month GBP-LIBOR + 0.160%) due 12/1/50(b) | 745,957 | |||||||
| 400,000 | NovaStar Mortgage Funding Trust, Series 2006-1, Class A2D, 0.624% (1-Month USD-LIBOR + 0.540%) due 5/25/36(b) | 387,461 | ||||||||
| 300,000 | One New York Plaza Trust, Series 2020-1NYP, Class A, 1.046% (1-Month USD-LIBOR + 0.950%) due 1/15/26(b)(c) | 301,834 | ||||||||
| 75,558 | Option One Mortgage Loan Trust, Series 2007-CP1, Class 1A1, 0.224% (1-Month USD-LIBOR + 0.140%) due 3/25/37(b) | 70,754 | ||||||||
| 400,000 | Palmer Square Loan Funding Ltd., Series 2021-3A, Class A1, 0.971% (3-Month USD-LIBOR + 0.800%) due 7/20/29(b)(c) | 400,356 | ||||||||
| 24,727 | RAAC Trust, Series 2007-SP3, Class A1, 1.284% (1-Month USD-LIBOR + 1.200%) due 9/25/47(b) | 24,787 | ||||||||
| RALI Trust: | ||||||||||
| 104,387 | Series 2006-QS6, Class 1A1, 6.000% due 6/25/36 | 100,684 | ||||||||
| 46,867 | Series 2007-QO2, Class A1, 0.234% (1-Month USD-LIBOR + 0.150%) due 2/25/47(b) | 23,720 | ||||||||
| 66,402 | CAD | Real Estate Asset Liquidity Trust, Series 2018-1A, Class A1, 3.072% due 8/12/53(c) | 54,169 | |||||||
| Residential Asset Securitization Trust: | ||||||||||
| 14,497 | Series 2005-A15, Class 5A1, 5.750% due 2/25/36 | 8,904 | ||||||||
| 39,955 | Series 2006-R1, Class A2, 0.484% (1-Month USD-LIBOR + 0.400%) due 1/25/46(b) | 11,981 | ||||||||
| 176,290 | GBP | Residential Mortgage Securities 32 PLC, Series 2032-A, Class A, 1.300% (Sterling Overnight Index Average + 1.250%) due 6/20/70(b)(c) | 245,167 | |||||||
| 212,975 | GBP | ResLoC UK PLC, Series 2007-1X, Class A3B, 0.241% (3-Month GBP-LIBOR + 0.160%) due 12/15/43(b) | 283,572 | |||||||
| RMAC Securities No 1 PLC: | ||||||||||
| 390,517 | GBP | Series 2006-NS3X, Class A2A, 0.234% (3-Month GBP-LIBOR + 0.150%) due 6/12/44(b) | 520,929 | |||||||
| 204,965 | GBP | Series 2006-NS1X, Class A2A, 0.234% (3-Month GBP-LIBOR + 0.150%) due 6/12/44(b) | 274,585 | |||||||
| 300,000 | Sculptor CLO XXV Ltd., Series 25A, Class A1, 1.404% (3-Month USD-LIBOR + 1.270%) due 1/15/31(b)(c) | 300,452 | ||||||||
| 275,332 | Sound Point CLO XIV Ltd., Series 2016-3A, Class AR2, 1.128% (3-Month USD-LIBOR + 0.990%) due 1/23/29(b)(c) | 275,427 | ||||||||
| Soundview Home Loan Trust: | ||||||||||
| 164,998 | Series 2006-3, Class A3, 0.404% (1-Month USD-LIBOR + 0.320%) due 11/25/36(b) | 164,980 | ||||||||
| 1,300,000 | Series 2006-3, Class A4, 0.584% (1-Month USD-LIBOR + 0.500%) due 11/25/36(b) | 1,262,664 | ||||||||
| 174,839 | SP-STATIC CLO 1 Ltd., Series 2020-1A, Class A, 1.538% (3-Month USD-LIBOR + 1.400%) due 7/22/28(b)(c) | 174,951 | ||||||||
| 463,473 | GBP | Stratton Mortgage Funding, Series 2021-2A, Class A, 0.950% (Sterling Overnight Index Average + 0.900%) due 7/20/60(b)(c) | 640,546 | |||||||
| Structured Adjustable Rate Mortgage Loan Trust: | ||||||||||
| 3,193 | Series 2004-1, Class 4A1, 2.513% due 2/25/34(b) | 3,208 | ||||||||
| 11,708 | Series 2004-4, Class 3A2, 2.380% due 4/25/34(b) | 11,911 | ||||||||
| 27,361 | Series 2004-19, Class 2A1, 1.498% (1-Year Treasury Average Rate + 1.400%) due 1/25/35(b) | 25,671 | ||||||||
| Structured Asset Mortgage Investments II Trust: | ||||||||||
| 32,931 | Series 2005-AR2, Class 2A1, 0.544% (1-Month USD-LIBOR + 0.460%) due 5/25/45(b) | 32,996 | ||||||||
| 46,106 | Series 2005-AR8, Class A1A, 0.644% (1-Month USD-LIBOR + 0.560%) due 2/25/36(b) | 44,418 | ||||||||
| 29,193 | Series 2006-AR5, Class 1A1, 0.504% (1-Month USD-LIBOR + 0.420%) due 5/25/36(b) | 25,687 | ||||||||
See Notes to Financial Statements.
241
| Schedules of Investments |
| (continued) |
| International Fixed Income Fund | ||||||||||
| Face Amount/Units† | Security | Value | ||||||||
COLLATERALIZED MORTGAGE OBLIGATIONS — 19.3% — (continued) | ||||||||||
| $ | 135,587 | Series 2007-AR4, Class A3, 0.304% (1-Month USD-LIBOR + 0.220%) due 9/25/47(b) | $ | 124,087 | ||||||
| 73,035 | Series 2007-AR6, Class A1, 1.598% (1-Year Treasury Average Rate + 1.500%) due 8/25/47(b) | 71,775 | ||||||||
| 53,215 | Structured Asset Securities Corp., Series 2006-RF1, Class 1A, 0.364% (1-Month USD-LIBOR + 0.280%) due 1/25/36(b)(c) | 49,875 | ||||||||
| 185,930 | Symphony CLO XIV Ltd., Series 2014-14A, Class AR, 1.083% (3-Month USD-LIBOR + 0.950%) due 7/14/26(b)(c) | 186,047 | ||||||||
| 237,755 | EUR | Tikehau CLO II BV, Series 2A, Class AR, 0.880% (3-Month EURIBOR + 0.880%) due 12/7/29(b)(c) | 281,507 | |||||||
| 499,440 | GBP | Towd Point Mortgage Funding, Series 2019-A13A, Class A1, 0.950% (Sterling Overnight Index Average + 0.900%) due 7/20/45(b)(c) | 689,696 | |||||||
| 273,594 | GBP | Towd Point Mortgage Funding Auburn 14 PLC, Series 2020-A14X, Class A, 0.950% (Sterling Overnight Index Average + 0.900%) due 5/20/45(b) | 377,927 | |||||||
| Towd Point Mortgage Trust: | ||||||||||
| 916,725 | Series 2019-4, Class A1, 2.900% due 10/25/59(b)(c) | 952,763 | ||||||||
| 252,392 | Series 2020-1, Class A1, 2.710% due 1/25/60(b)(c) | 259,754 | ||||||||
| 373,973 | Tralee CLO V Ltd., Series 2018-5A, Class A1, 1.244% (3-Month USD-LIBOR + 1.110%) due 10/20/28(b)(c) | 374,347 | ||||||||
| 184,814 | GBP | Trinity Square PLC, Series 2021-1A, Class A, 0.899% (Sterling Overnight Index Average + 0.850%) due 7/15/59(b)(c) | 255,005 | |||||||
| 81,962 | Venture XVII CLO Ltd., Series 2014-17A, Class ARR, 1.006% (3-Month USD-LIBOR + 0.880%) due 4/15/27(b)(c) | 81,966 | ||||||||
| 300,000 | Vibrant CLO VI Ltd., Series 2017-6A, Class AR, 1.085% (3-Month USD-LIBOR + 0.950%) due 6/20/29(b)(c) | 300,205 | ||||||||
| 300,000 | Vibrant CLO VII Ltd., Series 2017-7A, Class A1R, 1.174% (3-Month USD-LIBOR + 1.040%) due 9/15/30(b)(c) | 300,245 | ||||||||
| Voya CLO Ltd.: | ||||||||||
| 384,639 | Series 2016-4A, Class ARR, 1.034% (3-Month USD-LIBOR + 0.900%) due 7/20/29(b)(c) | 384,959 | ||||||||
| 400,000 | Series 2017-1A, Class A1R, 1.084% (3-Month USD-LIBOR + 0.950%) due 4/17/30(b)(c) | 400,247 | ||||||||
| WaMu Mortgage Pass-Through Certificates Trust: | ||||||||||
| 5,867 | Series 2002-AR9, Class 1A, 1.498% (1-Year Treasury Average Rate + 1.400%) due 8/25/42(b) | 5,816 | ||||||||
| 1,634 | Series 2003-AR5, Class A7, 2.574% due 6/25/33(b) | 1,668 | ||||||||
| 90,008 | Series 2003-AR9, Class 2A, 2.403% due 9/25/33(b) | 89,663 | ||||||||
| 161,774 | Series 2004-AR1, Class A, 2.427% due 3/25/34(b) | 167,075 | ||||||||
| 21,941 | Series 2005-AR13, Class A1A1, 0.664% (1-Month USD-LIBOR + 0.580%) due 10/25/45(b) | 21,982 | ||||||||
| 27,081 | Series 2006-AR10, Class 2A1, 2.870% due 9/25/36(b) | 26,144 | ||||||||
| 45,492 | Series 2006-AR13, Class 2A, 1.782% (11th District Cost of Funds Index + 1.500%) due 10/25/46(b) | 44,552 | ||||||||
| 17,532 | Washington Mutual Mortgage Pass-Through Certificates WMALT, Series 2006-AR5, Class 3A, 1.038% (1-Year Treasury Average Rate + 0.940%) due 7/25/46(b) | 12,156 | ||||||||
| 63,199 | Washington Mutual MSC Mortgage Pass-Through Certificates Trust, Series 2002-AR3, Class 1A7, 2.313% due 12/25/32(b) | 65,019 | ||||||||
|
| |||||||||
| TOTAL COLLATERALIZED MORTGAGE OBLIGATIONS (Cost — $30,084,381) | 30,067,215 | |||||||||
|
| |||||||||
CORPORATE BONDS & NOTES — 19.2% | ||||||||||
Canada — 0.3% | ||||||||||
| 100,000 | EUR | Fairfax Financial Holdings Ltd., Senior Unsecured Notes, 2.750% due 3/29/28(c) | 132,193 | |||||||
| 300,000 | HSBC Bank Canada, Covered Notes, 3.300% due 11/28/21(c) | 302,296 | ||||||||
|
| |||||||||
| Total Canada | 434,489 | |||||||||
|
| |||||||||
See Notes to Financial Statements.
242
| Schedules of Investments |
| (continued) |
| International Fixed Income Fund | ||||||||||
| Face Amount/Units† | Security | Value | ||||||||
Cayman Islands — 1.3% | ||||||||||
| $ | 300,000 | CK Hutchison International 17 Ltd., Company Guaranteed Notes, 2.875% due 4/5/22(c) | $ | 304,245 | ||||||
| KSA Sukuk Ltd., Senior Unsecured Notes: | ||||||||||
| 200,000 | 2.894% due 4/20/22(c) | 203,114 | ||||||||
| 500,000 | 4.303% due 1/19/29(c) | 578,713 | ||||||||
| 200,000 | Sands China Ltd., Senior Unsecured Notes, 5.400% due 8/8/28 | 230,407 | ||||||||
| 666,937 | US Capital Funding II Ltd./US Capital Funding II Corp., Asset Backed, 0.876% (3-Month USD-LIBOR + 0.750%) due 8/1/34(b)(c) | 633,590 | ||||||||
|
| |||||||||
| Total Cayman Islands | 1,950,069 | |||||||||
|
| |||||||||
Denmark — 3.8% | ||||||||||
| Jyske Realkredit AS, Covered Notes: | ||||||||||
| 1 | DKK | 1.500% due 10/1/37 | — | |||||||
| 1 | DKK | 3.000% due 10/1/47 | — | |||||||
| 6,333,960 | DKK | 1.000% due 10/1/50 | 976,831 | |||||||
| 1 | DKK | 1.500% due 10/1/50 | — | |||||||
| Nordea Kredit Realkreditaktieselskab, Covered Notes: | ||||||||||
| 1 | DKK | 1.500% due 10/1/37 | 1 | |||||||
| 1 | DKK | 2.500% due 10/1/37 | — | |||||||
| 1 | DKK | 2.500% due 10/1/47 | — | |||||||
| 9,119,516 | DKK | 1.000% due 10/1/50 | 1,399,215 | |||||||
| 1 | DKK | 1.500% due 10/1/50 | — | |||||||
| 1 | DKK | 2.000% due 10/1/50 | — | |||||||
| Nykredit Realkredit AS, Covered Notes: | ||||||||||
| 1 | DKK | 2.500% due 10/1/36 | — | |||||||
| 1 | DKK | 1.500% due 10/1/37 | — | |||||||
| 1 | DKK | 2.500% due 10/1/47 | — | |||||||
| 19,229,131 | DKK | 1.000% due 10/1/50 | 2,943,891 | |||||||
| 2 | DKK | 1.500% due 10/1/50 | 1 | |||||||
| 3,725,434 | DKK | 1.000% due 10/1/53 | 569,456 | |||||||
| Realkredit Danmark AS, Covered Notes: | ||||||||||
| 1 | DKK | 2.500% due 4/1/36 | — | |||||||
| 1 | DKK | 2.500% due 4/1/47 | — | |||||||
|
| |||||||||
| Total Denmark | 5,889,395 | |||||||||
|
| |||||||||
France — 0.5% | ||||||||||
| 250,000 | Credit Agricole SA, Senior Unsecured Notes, 3.750% due 4/24/23(c) | 263,660 | ||||||||
| 200,000 | EUR | ELO SACA, Senior Unsecured Notes, 3.250% due 7/23/27 | 273,091 | |||||||
| 300,000 | Societe Generale SA, Junior Subordinated Notes, 7.375% (5-Year USD Swap Rate + 6.238%)(b)(c)(g) | 300,974 | ||||||||
|
| |||||||||
| Total France | 837,725 | |||||||||
|
| |||||||||
Germany — 2.3% | ||||||||||
| Deutsche Bank AG, Senior Unsecured Notes: | ||||||||||
| 800,000 | 4.250% due 10/14/21 | 803,576 | ||||||||
| 200,000 | 3.300% due 11/16/22 | 206,732 | ||||||||
| 300,000 | 3.950% due 2/27/23 | 314,720 | ||||||||
| 100,000 | GBP | 2.625% due 12/16/24 | 143,449 | |||||||
| 300,000 | EUR | 1.000% (1.600% – 3-Month EURIBOR) due 11/19/25(e) | 362,540 | |||||||
| 350,000 | 3.961% (SOFR + 2.581%) due 11/26/25(b) | 380,101 | ||||||||
| 300,000 | EUR | 2.625% due 2/12/26 | 389,391 | |||||||
| 200,000 | EUR | 1.625% due 1/20/27 | 249,538 | |||||||
| 200,000 | EUR | 1.750% (2.050% – 3-Month EURIBOR) due 11/19/30(e) | 251,291 | |||||||
| 200,000 | Deutsche Bank AG, (Restricted, cost – $200,406, acquired 1/21/21), Subordinated Notes, 3.729% (SOFR + 2.757%) due 1/14/32(b)(h) | 206,574 | ||||||||
| 300,000 | IHO Verwaltungs GmbH, Senior Secured Notes, 6.000% (6.000% cash or 6.750% PIK) due 5/15/27(c)(i) | 314,817 | ||||||||
|
| |||||||||
| Total Germany | 3,622,729 | |||||||||
|
| |||||||||
See Notes to Financial Statements.
243
| Schedules of Investments |
| (continued) |
| International Fixed Income Fund | ||||||||||
| Face Amount/Units† | Security | Value | ||||||||
Ireland — 0.1% | ||||||||||
| $ | 200,000 | SMBC Aviation Capital Finance DAC, Company Guaranteed Notes, 3.000% due 7/15/22(c) | $ | 203,981 | ||||||
|
| |||||||||
Italy — 1.0% | ||||||||||
| Banca Carige SpA, Covered Notes: | ||||||||||
| 400,000 | EUR | 1.151% (1.700% – 3-Month EURIBOR) due 10/25/21(e) | 472,961 | |||||||
| 400,000 | EUR | 0.951% (1.500% – 3-Month EURIBOR) due 5/25/22(e) | 474,045 | |||||||
| Banca Monte dei Paschi di Siena SpA: | ||||||||||
| 200,000 | EUR | Covered Notes, 0.875% due 10/8/26 | 247,802 | |||||||
| 100,000 | EUR | Senior Unsecured Notes, 2.625% due 4/28/25 | 123,309 | |||||||
| 200,000 | EUR | UniCredit SpA, Junior Subordinated Notes, 9.250% (9.300% – 5-Year EUR Swap Rate)(e)(g) | 251,187 | |||||||
|
| |||||||||
| Total Italy | 1,569,304 | |||||||||
|
| |||||||||
Japan — 0.1% | ||||||||||
| 200,000 | Central Nippon Expressway Co., Ltd., Senior Unsecured Notes, 2.091% due 9/14/21 | 200,110 | ||||||||
|
| |||||||||
Jersey Channel Islands — 0.1% | ||||||||||
| 59,439 | GBP | Kennedy Wilson Europe Real Estate Ltd., Senior Unsecured Notes, 3.950% due 6/30/22 | 83,378 | |||||||
|
| |||||||||
Luxembourg — 0.1% | ||||||||||
| 100,000 | EUR | CPI Property Group SA, Senior Unsecured Notes, 1.500% due 1/27/31 | 117,080 | |||||||
|
| |||||||||
Netherlands — 0.1% | ||||||||||
| 52,525 | EUR | Stichting AK Rabobank Certificaten, Junior Subordinated Notes, step bond to yield, 2.188%(g) | 88,010 | |||||||
|
| |||||||||
Portugal — 0.0% | ||||||||||
| Banco Espirito Santo SA, Senior Unsecured Notes: | ||||||||||
| 200,000 | EUR | 4.750% due 1/15/18(a)(j) | 37,784 | |||||||
| 200,000 | EUR | 4.000% due 1/21/19(a)(j) | 37,784 | |||||||
|
| |||||||||
| Total Portugal | 75,568 | |||||||||
|
| |||||||||
Qatar — 0.3% | ||||||||||
| Qatar Petroleum, Senior Unsecured Notes: | ||||||||||
| 200,000 | 2.250% due 7/12/31(c) | 201,961 | ||||||||
| 200,000 | 3.125% due 7/12/41(c) | 206,330 | ||||||||
|
| |||||||||
| Total Qatar | 408,291 | |||||||||
|
| |||||||||
Singapore — 0.2% | ||||||||||
| 200,000 | BOC Aviation Ltd., Senior Unsecured Notes, 2.750% due 9/18/22(c) | 203,532 | ||||||||
| 100,000 | DBS Bank Ltd., Covered Notes, 3.300% due 11/27/21(c) | 100,717 | ||||||||
|
| |||||||||
| Total Singapore | 304,249 | |||||||||
|
| |||||||||
Supranational — 0.6% | ||||||||||
| European Investment Bank, Senior Unsecured Notes: | ||||||||||
| 500,000 | AUD | 0.500% due 6/21/23 | 367,154 | |||||||
| 800,000 | AUD | 0.500% due 8/10/23 | 586,493 | |||||||
|
| |||||||||
| Total Supranational | 953,647 | |||||||||
|
| |||||||||
Switzerland — 1.4% | ||||||||||
| Credit Suisse Group AG: | ||||||||||
| 200,000 | Junior Subordinated Notes, 7.500% (5-Year USD Swap Rate + 4.598%)(b)(c)(g) | 220,756 | ||||||||
Senior Unsecured Notes: | ||||||||||
| 300,000 | 2.997% (3-Month USD-LIBOR + 1.200%) due 12/14/23(b)(c) | 308,843 | ||||||||
| 250,000 | 4.282% due 1/9/28(c) | 279,749 | ||||||||
| 250,000 | 3.869% (3-Month USD-LIBOR + 1.410%) due 1/12/29(b)(c) | 276,723 | ||||||||
| UBS AG, Subordinated Notes: | ||||||||||
| 250,000 | 7.625% due 8/17/22 | 266,118 | ||||||||
| 400,000 | 5.125% due 5/15/24 | 439,949 | ||||||||
| 400,000 | UBS Group AG, Senior Unsecured Notes, 1.075% (3-Month USD-LIBOR + 0.950%) due 8/15/23(b)(c) | 403,399 | ||||||||
|
| |||||||||
| Total Switzerland | 2,195,537 | |||||||||
|
| |||||||||
See Notes to Financial Statements.
244
| Schedules of Investments |
| (continued) |
| International Fixed Income Fund | ||||||||||
| Face Amount/Units† | Security | Value | ||||||||
United Kingdom — 4.4% | ||||||||||
| $ | 600,000 | Barclays Bank PLC, Subordinated Notes, 7.625% due 11/21/22 | $ | 647,404 | ||||||
| Barclays PLC: | ||||||||||
| | 600,000 | GBP | Junior Subordinated Notes, 7.125% (5-Year UK Government Note Generic Bid Yield + 6.579%)(b)(g) | 938,567 | ||||||
| 200,000 | Senior Unsecured Notes, 4.610% (3-Month USD-LIBOR + 1.400%) due 2/15/23(b) | 203,815 | ||||||||
| 100,000 | British Telecommunications PLC, Senior Unsecured Notes, 9.625% due 12/15/30 | 154,410 | ||||||||
| HSBC Holdings PLC: | ||||||||||
| 200,000 | Junior Subordinated Notes, 6.500% (5-Year USD 1100 Run ICE Swap Rate + 3.606%)(b)(g) | 227,805 | ||||||||
Senior Unsecured Notes: | ||||||||||
| 300,000 | 1.125% (3-Month USD-LIBOR + 1.000%) due 5/18/24(b) | 303,560 | ||||||||
| 200,000 | 3.803% (3-Month USD-LIBOR + 1.211%) due 3/11/25(b) | 214,535 | ||||||||
| 100,000 | GBP | 1.750% (Sterling Overnight Index Average + 1.307%) due 7/24/27(b) | 138,981 | |||||||
| 100,000 | GBP | Subordinated Notes, 6.750% due 9/11/28 | 179,166 | |||||||
| Lloyds Banking Group PLC: | ||||||||||
| 200,000 | GBP | Junior Subordinated Notes, 5.125% (5-Year UK Government Note Generic Bid Yield + 4.607%)(b)(g) | 291,937 | |||||||
| 200,000 | Senior Unsecured Notes, 3.900% due 3/12/24 | 215,975 | ||||||||
| 300,000 | Subordinated Notes, 4.582% due 12/10/25 | 338,343 | ||||||||
| 200,000 | GBP | Marks & Spencer PLC, Senior Unsecured Notes, 4.250% due 12/8/23 | 291,369 | |||||||
| 200,000 | Nationwide Building Society, Senior Unsecured Notes, 3.766% (3-Month USD-LIBOR + 1.064%) due 3/8/24(b)(c) | 209,176 | ||||||||
| Natwest Group PLC: | ||||||||||
Junior Subordinated Notes: | ||||||||||
| 200,000 | GBP | 5.125% (5-Year UK Government Note Generic Bid Yield + 4.985%)(b)(g) | 298,706 | |||||||
| 200,000 | 6.000% (5-Year CMT Index + 5.625%)(b)(g) | 224,430 | ||||||||
Senior Unsecured Notes: | ||||||||||
| 800,000 | 1.697% (3-Month USD-LIBOR + 1.550%) due 6/25/24(b) | 817,783 | ||||||||
| 200,000 | 4.519% (3-Month USD-LIBOR + 1.550%) due 6/25/24(b) | 213,622 | ||||||||
| 100,000 | GBP | Rolls-Royce PLC, Company Guaranteed Notes, 5.750% due 10/15/27 | 152,277 | |||||||
| 400,000 | Santander UK Group Holdings PLC, Senior Unsecured Notes, 4.796% (3-Month USD-LIBOR + 1.570%) due 11/15/24(b) | 434,873 | ||||||||
| 200,000 | Standard Chartered PLC, Junior Subordinated Notes, 7.500% (5-Year USD Swap Rate + 6.301%)(b)(c)(g) | 207,500 | ||||||||
| 95,777 | GBP | Tesco Property Finance 4 PLC, Senior Secured Notes, 5.801% due 10/13/40 | 178,080 | |||||||
|
| |||||||||
| Total United Kingdom | 6,882,314 | |||||||||
|
| |||||||||
United States — 2.6% | ||||||||||
| 100,000 | AbbVie Inc., Senior Unsecured Notes, 3.450% due 3/15/22 | 101,174 | ||||||||
| 200,000 | EUR | AT&T Inc., Junior Subordinated Notes, 2.875% (3.140% – 5-Year EURIBOR ICE Swap Rate)(b)(e)(g) | 239,406 | |||||||
| 200,000 | Bank of America Corp., Junior Subordinated Notes, 5.875% (3-Month USD-LIBOR + 2.931%)(b)(g) | 228,250 | ||||||||
| 200,000 | Broadcom Inc., Company Guaranteed Notes, 4.150% due 11/15/30 | 225,222 | ||||||||
| 58,000 | Campbell Soup Co., Senior Unsecured Notes, 3.650% due 3/15/23 | 60,639 | ||||||||
| 700,000 | Charter Communications Operating LLC/Charter Communications Operating Capital, Senior Secured Notes, 4.464% due 7/23/22 | 720,201 | ||||||||
| 200,000 | Dell International LLC/EMC Corp., Senior Secured Notes, 4.900% due 10/1/26 | 231,458 | ||||||||
| 400,000 | Duke Energy Corp., Senior Unsecured Notes, 0.775% (3-Month USD-LIBOR + 0.650%) due 3/11/22(b) | 401,157 | ||||||||
| Fidelity National Information Services Inc.: | ||||||||||
| 100,000 | GBP | Senior Unsecured Notes, 1.700% due 6/30/22 | 138,827 | |||||||
| 100,000 | EUR | Company Guaranteed Notes, 0.750% due 5/21/23 | 120,006 | |||||||
| Ford Motor Credit Co. LLC, Senior Unsecured Notes: | ||||||||||
| 200,000 | 3.550% due 10/7/22 | 205,000 | ||||||||
| 200,000 | 4.140% due 2/15/23 | 207,000 | ||||||||
See Notes to Financial Statements.
245
| Schedules of Investments |
| (continued) |
| International Fixed Income Fund | ||||||||||
| Face Amount/Units† | Security | Value | ||||||||
United States — 2.6% — (continued) | ||||||||||
| 100,000 | GBP | 2.748% due 6/14/24 | $ | 140,148 | ||||||
| 100,000 | EUR | 0.151% (0.700% – 3-Month EURIBOR) due 12/1/24(e) | 115,858 | |||||||
| $ | 200,000 | 5.125% due 6/16/25 | 219,750 | |||||||
| 200,000 | 4.000% due 11/13/30 | 211,803 | ||||||||
| 1,300,000 | Lehman Brothers Holdings Inc., Senior Unsecured Notes, zero coupon, due 12/28/17(a)(j) | 9,652 | ||||||||
| 100,000 | Pacific Gas & Electric Co., 1st Mortgage Notes, 3.450% due 7/1/25 | 103,691 | ||||||||
| 100,000 | Santander Holdings USA Inc., Senior Unsecured Notes, 3.400% due 1/18/23 | 103,694 | ||||||||
| 300,000 | Zimmer Biomet Holdings Inc., Senior Unsecured Notes, 3.150% due 4/1/22 | 303,579 | ||||||||
|
| |||||||||
| Total United States | 4,086,515 | |||||||||
|
| |||||||||
| TOTAL CORPORATE BONDS & NOTES (Cost — $29,246,444) | 29,902,391 | |||||||||
|
| |||||||||
MORTGAGE-BACKED SECURITIES — 11.7% | ||||||||||
FHLMC — 0.4% | ||||||||||
| Federal Home Loan Mortgage Corp. (FHLMC): | ||||||||||
| 55,291 | 3.500% due 10/1/39 | 58,602 | ||||||||
| 567,226 | 2.500% due 12/1/50 – 2/1/51 | 592,449 | ||||||||
|
| |||||||||
| Total FHLMC | 651,051 | |||||||||
|
| |||||||||
FNMA — 11.3% | ||||||||||
| Federal National Mortgage Association (FNMA): | ||||||||||
| 450,000 | 3.500% due 10/1/51(k) | 476,437 | ||||||||
| 190,290 | 3.500% due 10/1/34 – 2/1/50 | 204,334 | ||||||||
| 21,471 | 2.482% (1-Year CMT Index + 2.360%) due 11/1/34(b) | 22,831 | ||||||||
| 1,736 | 6.500% due 8/1/37 | 1,813 | ||||||||
| 525,117 | 3.000% due 10/1/49 – 5/1/51 | 564,397 | ||||||||
| 13,600,000 | 4.000% due 10/1/51(k) | 14,581,476 | ||||||||
| 392,590 | 4.000% due 5/1/50 – 10/1/51 | 420,374 | ||||||||
| 1,216,171 | 2.500% due 11/1/50 – 12/1/50 | 1,269,740 | ||||||||
|
| |||||||||
| Total FNMA | 17,541,402 | |||||||||
|
| |||||||||
GNMA — 0.0% | ||||||||||
| 1,588 | Government National Mortgage Association II (GNMA), 6.000% due 9/20/38 | 1,744 | ||||||||
|
| |||||||||
| TOTAL MORTGAGE-BACKED SECURITIES (Cost — $18,186,688) | 18,194,197 | |||||||||
|
| |||||||||
U.S. GOVERNMENT OBLIGATIONS — 3.1% | ||||||||||
| U.S. Treasury Bonds: | ||||||||||
| 1,200,000 | 1.375% due 11/15/40 | 1,110,516 | ||||||||
| 1,600,000 | 1.875% due 2/15/41 | 1,612,000 | ||||||||
| 1,101,470 | U.S. Treasury Inflation Indexed Notes, 0.500% due 1/15/28 | 1,250,257 | ||||||||
| 800,000 | U.S. Treasury Notes, 2.875% due 4/30/25 | 867,594 | ||||||||
|
| |||||||||
| TOTAL U.S. GOVERNMENT OBLIGATIONS (Cost — $4,544,666) | 4,840,367 | |||||||||
|
| |||||||||
ASSET-BACKED SECURITIES — 0.3% | ||||||||||
Automobiles — 0.3% | ||||||||||
| 400,000 | Toyota Auto Loan Extended Notes Trust, Series 2019-1A, Class A, 2.560% due 11/25/31(c) | 421,683 | ||||||||
|
| |||||||||
Student Loans — 0.0% | ||||||||||
| 54,108 | Massachusetts Educational Financing Authority, Series 2008-1, Class A1, 1.075% (3-Month USD-LIBOR + 0.950%) due 4/25/38(b) | 54,347 | ||||||||
|
| |||||||||
| TOTAL ASSET-BACKED SECURITIES (Cost — $454,044) | 476,030 | |||||||||
|
| |||||||||
| TOTAL INVESTMENTS IN SECURITIES BEFORE SHORT-TERM INVESTMENTS (Cost — $153,090,672) | 158,399,241 | |||||||||
|
| |||||||||
See Notes to Financial Statements.
246
| Schedules of Investments |
| (continued) |
| International Fixed Income Fund | ||||||||||
| Face Amount/Units† | Security | Value | ||||||||
SHORT-TERM INVESTMENTS — 8.0% | ||||||||||
SOVEREIGN BONDS — 5.7% | ||||||||||
Israel — 1.4% | ||||||||||
| 6,900,000 | ILS | Israel Treasury Bills, (0.051)% due 11/30/21(l) | $ | 2,153,108 | ||||||
|
| |||||||||
Japan — 4.3% | ||||||||||
| Japan Treasury Discount Bills: | ||||||||||
| 340,000,000 | JPY | (0.102)% due 9/13/21(l) | 3,091,276 | |||||||
| 40,000,000 | JPY | (0.101)% due 9/21/21(l) | 363,679 | |||||||
| 350,000,000 | JPY | (0.101)% due 10/4/21(l) | 3,182,177 | |||||||
|
| |||||||||
| Total Japan | 6,637,132 | |||||||||
|
| |||||||||
TOTAL SOVEREIGN BONDS (Cost — $8,691,305) | 8,790,240 | |||||||||
|
| |||||||||
TIME DEPOSITS — 0.8% | ||||||||||
| $ | 389,832 | Banco Santander SA — Frankfurt, 0.005% due 9/1/21 | 389,832 | |||||||
| BBH — Grand Cayman: | ||||||||||
| 35,292 | EUR | (0.780)% due 9/1/21 | 41,671 | |||||||
| 2,093 | DKK | (0.470)% due 9/1/21 | 332 | |||||||
| 43,437 | AUD | (0.120)% due 9/1/21 | 31,776 | |||||||
| 639,412 | NOK | (0.080)% due 9/1/21 | 73,553 | |||||||
| 370 | NZD | 0.005% due 9/1/21 | 261 | |||||||
| 36,414 | CAD | 0.010% due 9/1/21 | 28,867 | |||||||
| 74,470 | ZAR | 3.800% due 9/1/21 | 5,127 | |||||||
| 17,662 | CHF | BNP Paribas — Paris, (1.430)% due 9/1/21 | 19,286 | |||||||
| 42,097 | GBP | Citibank — London, 0.005% due 9/1/21 | 57,877 | |||||||
| 452 | HKD | HSBC Bank — Hong Kong, 0.000% due 9/1/21 | 58 | |||||||
| 27,286 | SGD | HSBC Bank — Singapore, 0.005% due 9/1/21 | 20,295 | |||||||
| Skandinaviska Enskilda Banken AB — Stockholm: | ||||||||||
| 27,243 | SEK | (0.250)% due 9/1/21 | 3,157 | |||||||
| 593,335 | 0.005% due 9/1/21 | 593,335 | ||||||||
| 2,995,015 | JPY | Sumitomo Mitsui Banking Corp. — Tokyo, (0.310)% due 9/1/21 | 27,224 | |||||||
|
| |||||||||
| TOTAL TIME DEPOSITS (Cost — $1,292,651) | 1,292,651 | |||||||||
|
| |||||||||
U.S. GOVERNMENT OBLIGATIONS — 1.5% | ||||||||||
| U.S. Treasury Bills: | ||||||||||
| 701,000 | 0.043% due 9/30/21(l) | 700,976 | ||||||||
| 1,000,000 | 0.030% due 10/5/21(l)(m) | 999,972 | ||||||||
| 700,000 | 0.051% due 2/17/22(l) | 699,832 | ||||||||
|
| |||||||||
| TOTAL U.S. GOVERNMENT OBLIGATIONS (Cost — $2,400,780) | 2,400,780 | |||||||||
|
| |||||||||
| TOTAL SHORT-TERM INVESTMENTS (Cost — $12,384,736) | 12,483,671 | |||||||||
|
| |||||||||
| TOTAL INVESTMENTS IN SECURITIES (Cost — $165,475,408) | 170,882,912 | |||||||||
|
| |||||||||
| TOTAL INVESTMENTS IN PURCHASED OPTIONS (Cost — $55,150) | 29,498 | |||||||||
|
| |||||||||
| TOTAL INVESTMENTS — 109.7% (Cost — $165,530,558) | 170,912,410 | |||||||||
|
| |||||||||
| Liabilities in Excess of Other Assets — (9.7)% | (15,183,759 | ) | ||||||||
|
| |||||||||
| TOTAL NET ASSETS — 100.0% | $ | 155,728,651 | ||||||||
|
| |||||||||
| † | Amount denominated in U.S. dollars, unless otherwise noted. |
See Notes to Financial Statements.
247
| Schedules of Investments |
| (continued) |
| International Fixed Income Fund | ||||||
| (a) | Illiquid security. |
| (b) | Variable rate security. Interest rate disclosed is that which was in effect at August 31, 2021. |
| (c) | Restricted security that may be sold to “qualified institutional buyers” pursuant to the conditions of Rule 144A under the Securities Act of 1933, as amended. This security has been deemed liquid pursuant to guidelines approved by the Board of Trustees, unless otherwise noted. The aggregate value of restricted 144A holdings at August 31, 2021, amounts to $49,470,213 and represents 31.8% of net assets. |
| (d) | Security is valued in good faith at fair value by or under the direction of the Board of Trustees. |
| (e) | Inverse Floating Rate Security — interest rate fluctuates with an inverse relationship to an associated interest rate. Indicated rate is the effective rate as of August 31, 2021. |
| (f) | Interest only security. |
| (g) | Security is perpetual in nature and has no stated maturity date. |
| (h) | The aggregate value of restricted securities (excluding 144A holdings) at August 31, 2021, amounts to $206,574 and represents 0.1% of net assets. |
| (i) | Payment in-kind security for which part of the income earned may be paid as additional principal. |
| (j) | Security is currently in default. |
| (k) | This security is traded on a TBA basis (see Note 1). |
| (l) | Rate shown represents yield-to-maturity. |
| (m) | All or a portion of this security is held at the broker as collateral for open OTC derivative instruments. |
| # | Security that used significant unobservable inputs to determine fair value. |
At August 31, 2021, for International Fixed Income Fund the aggregate cost of investments, the aggregate gross unrealized appreciation and depreciation of all investments for federal income tax purposes were as follows:
| Fund | Aggregate Cost For Federal Income Tax Purposes | Gross Unrealized Appreciation | Gross Unrealized (Depreciation) | Net Unrealized Appreciation | ||||||||||||
International Fixed Income Fund | $ | 167,764,760 | $ | 12,478,514 | $ | (9,415,473 | ) | $ | 3,063,042 | |||||||
Abbreviations used in this schedule: | ||
| CLO | — Collateralized Loan Obligation | |
| CMT | — Constant Maturity Treasury Rate | |
| CPI | — Consumer Price Index | |
| EURIBOR | — Euro Interbank Offered Rate | |
| ICE | — Intercontinental Exchange | |
| LIBOR | — London Interbank Offered Rate | |
| OTC | — Over the Counter | |
| PLC | — Public Limited Company | |
| REMICS | — Real Estate Mortgage Investment Conduit | |
| SOFR | — Secured Overnight Financing Rate | |
| Summary of Investments by Security Type^ | ||||
Sovereign Bonds | 43.8 | % | ||
Collateralized Mortgage Obligations | 17.6 | |||
Corporate Bonds & Notes | 17.5 | |||
Mortgage-Backed Securities | 10.7 | |||
U.S. Government Obligations | 2.8 | |||
Asset-Backed Securities | 0.3 | |||
Purchased Option | 0.0 | * | ||
Short-Term Investments | 7.3 | |||
|
| |||
| 100.0 | % | |||
|
| |||
| ^ | As a percentage of total investments. |
| * | Position represents less than 0.05% |
See Notes to Financial Statements.
248
| Schedules of Investments |
| (continued) |
| International Fixed Income Fund | ||||||
At August 31, 2021, International Fixed Income Fund held the following Options Contracts Purchased:
| Interest Rate Swaptions | ||||||||||||||||||||||
| Number of Contracts | Notional Amount† | Security Name | Counterparty | Expiration Date | Exercise Rate | Value | ||||||||||||||||
| 3,100,000 | 17,019EUR | OTC 10-Year Swaption, 3-Month EURIBOR, Put | GSC | 1/25/22 | 0.400% | $ | 6,669 | |||||||||||||||
|
| |||||||||||||||||||||
| Option on Futures | ||||||||||||||||||||||
| Number of Contracts | Notional Amount† | Security Name | Counterparty | Expiration Date | Strike Price | Value | ||||||||||||||||
| 200,000 | 19,400,000EUR | Franch Republic Government Bonds OAT Futures, Put(a) | BNP | 5/23/25 | EUR 97.00 | $ | 22,829 | |||||||||||||||
|
| |||||||||||||||||||||
| TOTAL OPTIONS CONTRACTS PURCHASED (Cost — $55,150) | $ | 29,498 | ||||||||||||||||||||
|
| |||||||||||||||||||||
| † | Amount denominated in U.S. dollars, unless otherwise noted. |
| (a) | Security is valued in good faith at fair value by or under the direction of the Board of Trustees. |
At August 31, 2021, International Fixed Income Fund held the following Options Contracts Written:
| Credit Default Swaptions | ||||||||||||||||||||||
| Number of Contracts | Notional Amount† | Security Name | Counterparty | Expiration Date | Exercise Rate | Value | ||||||||||||||||
| 200,000 | $ | 219,548 | OTC Markit CDX North America High Yield Series 36 5-Year Index, Put | BOA | 10/20/21 | 101.000% | $ | 130 | ||||||||||||||
| 100,000 | 109,774 | OTC Markit CDX North America High Yield Series 36 5-Year Index, Put | BOA | 11/17/21 | 102.000% | 194 | ||||||||||||||||
| 200,000 | 219,548 | OTC Markit CDX North America High Yield Series 36 5-Year Index, Put | DUB | 11/17/21 | 101.000% | 316 | ||||||||||||||||
| 100,000 | 109,774 | OTC Markit CDX North America High Yield Series 36 5-Year Index, Put | GSC | 11/17/21 | 102.000% | 194 | ||||||||||||||||
| 100,000 | 109,774 | OTC Markit CDX North America High Yield Series 36 5-Year Index, Put | GSC | 10/20/21 | 103.000% | 96 | ||||||||||||||||
| 200,000 | 219,548 | OTC Markit CDX North America High Yield Series 36 5-Year Index, Put | GSC | 10/20/21 | 103.000% | 192 | ||||||||||||||||
| 200,000 | 219,548 | OTC Markit CDX North America High Yield Series 36 5-Year Index, Put | GSC | 10/20/21 | 104.000% | 239 | ||||||||||||||||
| 600,000 | 274,590 | OTC Markit CDX North America Investment Grade Series 36 5-Year Index, Put | BCLY | 9/15/21 | 0.800% | 1 | ||||||||||||||||
| 600,000 | 274,590 | OTC Markit CDX North America Investment Grade Series 36 5-Year Index, Put | BNP | 11/17/21 | 0.750% | 243 | ||||||||||||||||
| 900,000 | 411,885 | OTC Markit CDX North America Investment Grade Series 36 5-Year Index, Put | BNP | 12/15/21 | 0.750% | 617 | ||||||||||||||||
| 200,000 | 91,530 | OTC Markit CDX North America Investment Grade Series 36 5-Year Index, Put | BOA | 11/17/21 | 0.700% | 99 | ||||||||||||||||
| 200,000 | 91,530 | OTC Markit CDX North America Investment Grade Series 36 5-Year Index, Put | BOA | 11/17/21 | 0.800% | 69 | ||||||||||||||||
| 200,000 | 91,530 | OTC Markit CDX North America Investment Grade Series 36 5-Year Index, Put | DUB | 12/15/21 | 0.750% | 137 | ||||||||||||||||
| 300,000 | 137,295 | OTC Markit CDX North America Investment Grade Series 36 5-Year Index, Put | DUB | 9/15/21 | 0.800% | — | ||||||||||||||||
See Notes to Financial Statements.
249
| Schedules of Investments |
| (continued) |
| International Fixed Income Fund | ||||||
| Number of Contracts | Notional Amount† | Security Name | Counterparty | Expiration Date | Exercise Rate | Value | ||||||||||||||||||
| 1,100,000 | $ 503,415 | OTC Markit CDX North America Investment Grade Series 36 5-Year Index, Put | DUB | 9/15/21 | 0.900% | $ | 1 | |||||||||||||||||
| 300,000 | 137,295 | OTC Markit CDX North America Investment Grade Series 36 5-Year Index, Put | GSC | 10/20/21 | 0.700% | 67 | ||||||||||||||||||
| 200,000 | 91,530 | OTC Markit CDX North America Investment Grade Series 36 5-Year Index, Put | GSC | 10/20/21 | 0.750% | 33 | ||||||||||||||||||
| 300,000 | 137,295 | OTC Markit CDX North America Investment Grade Series 36 5-Year Index, Put | GSC | 11/17/21 | 0.750% | 122 | ||||||||||||||||||
| 800,000 | 366,120 | OTC Markit CDX North America Investment Grade Series 36 5-Year Index, Put | GSC | 10/20/21 | 0.800% | 103 | ||||||||||||||||||
| 800,000 | 366,120 | OTC Markit CDX North America Investment Grade Series 36 5-Year Index, Put | GSC | 12/15/21 | 0.800% | 466 | ||||||||||||||||||
| 700,000 | 320,355 | OTC Markit CDX North America Investment Grade Series 36 5-Year Index, Put | GSC | 10/20/21 | 0.850% | 74 | ||||||||||||||||||
| 300,000 | 137,295 | OTC Markit CDX North America Investment Grade Series 36 5-Year Index, Put | GSC | 11/17/21 | 0.900% | 74 | ||||||||||||||||||
| 400,000 | 91,530 | OTC Markit CDX North America Investment Grade Series 36 5-Year Index, Put | JPM | 10/20/21 | 0.800% | 52 | ||||||||||||||||||
| 400,000 | 911,620 | EUR | OTC Markit iTraxx Europe Crossover Series 35 5-Year Index, Put | BCLY | 10/20/21 | 3.500% | 657 | |||||||||||||||||
| 400,000 | 911,620 | EUR | OTC Markit iTraxx Europe Crossover Series 35 5-Year Index, Put | BCLY | 12/15/21 | 3.500% | 1,848 | |||||||||||||||||
| 400,000 | 180,120 | EUR | OTC Markit iTraxx Europe Series 35 5-Year Index, Put | BCLY | 11/17/21 | 0.700% | 220 | |||||||||||||||||
| 1,600,000 | 720,480 | EUR | OTC Markit iTraxx Europe Series 35 5-Year Index, Put | BCLY | 12/15/21 | 0.700% | 1,258 | |||||||||||||||||
| 400,000 | 180,120 | EUR | OTC Markit iTraxx Europe Series 35 5-Year Index, Put | BCLY | 11/17/21 | 0.750% | 191 | |||||||||||||||||
| 200,000 | 90,060 | EUR | OTC Markit iTraxx Europe Series 35 5-Year Index, Put | BCLY | 9/15/21 | 0.800% | 3 | |||||||||||||||||
| 500,000 | 225,150 | EUR | OTC Markit iTraxx Europe Series 35 5-Year Index, Put | BCLY | 10/20/21 | 0.800% | 115 | |||||||||||||||||
| 400,000 | 180,120 | EUR | OTC Markit iTraxx Europe Series 35 5-Year Index, Put | BCLY | 11/17/21 | 0.800% | 173 | |||||||||||||||||
| 1,300,000 | 585,390 | EUR | OTC Markit iTraxx Europe Series 35 5-Year Index, Put | BCLY | 10/20/21 | 0.850% | 252 | |||||||||||||||||
| 200,000 | 90,060 | EUR | OTC Markit iTraxx Europe Series 35 5-Year Index, Put | BNP | 9/15/21 | 0.800% | 3 | |||||||||||||||||
| 500,000 | 225,150 | EUR | OTC Markit iTraxx Europe Series 35 5-Year Index, Put | BNP | 11/17/21 | 0.800% | 217 | |||||||||||||||||
| 600,000 | 270,180 | EUR | OTC Markit iTraxx Europe Series 35 5-Year Index, Put | DUB | 9/15/21 | 0.800% | 8 | |||||||||||||||||
| 1,000,000 | 450,300 | EUR | OTC Markit iTraxx Europe Series 35 5-Year Index, Put | DUB | 11/17/21 | 0.800% | 433 | |||||||||||||||||
| 300,000 | 135,090 | EUR | OTC Markit iTraxx Europe Series 35 5-Year Index, Put | JPM | 12/15/21 | 0.700% | 236 | |||||||||||||||||
| 200,000 | 90,060 | EUR | OTC Markit iTraxx Europe Series 35 5-Year Index, Put | JPM | 11/17/21 | 0.750% | 96 | |||||||||||||||||
| 200,000 | 90,060 | EUR | OTC Markit iTraxx Europe Series 35 5-Year Index, Put | JPM | 10/20/21 | 0.850% | 39 | |||||||||||||||||
|
| |||||||||||||||||||||||
| Total Credit Default Swaptions | $ | 9,268 | ||||||||||||||||||||||
|
| |||||||||||||||||||||||
| Currency Options | ||||||||||||||||||||||||
| Number of Contracts | Notional Amount† | Security Name | Counterparty | Expiration Date | Strike Price | Value | ||||||||||||||||||
| 742,000 | 935,996 | CAD | OTC U.S. Dollar versus Canadian Dollar, Call | GSC | 2/11/22 | CAD 1.27 | $ | 13,174 | ||||||||||||||||
|
| |||||||||||||||||||||||
| Interest Rate Swaptions | ||||||||||||||||||||||||
| Number of Contracts | Notional Amount† | Security Name | Counterparty | Expiration Date | Exercise Rate | Value | ||||||||||||||||||
| 1,300,000 | 891 | GBP | OTC 1-Year Swaption, 3-Month GBP-LIBOR, Call | BCLY | 2/7/22 | 0.010% | $ | 113 | ||||||||||||||||
| 1,400,000 | 959 | GBP | OTC 1-Year Swaption, 3-Month GBP-LIBOR, Call | GSC | 2/7/22 | 0.010% | 121 | |||||||||||||||||
| 6,900,000 | 4,727 | GBP | OTC 1-Year Swaption, 3-Month GBP-LIBOR, Call | RBS | 2/7/22 | 0.010% | 599 | |||||||||||||||||
| 1,300,000 | 891 | GBP | OTC 1-Year Swaption, 3-Month GBP-LIBOR, Put | BCLY | 2/7/22 | 0.010% | 4,698 | |||||||||||||||||
| 1,400,000 | 959 | GBP | OTC 1-Year Swaption, 3-Month GBP-LIBOR, Put | GSC | 2/7/22 | 0.010% | 5,060 | |||||||||||||||||
| 6,900,000 | 4,727 | GBP | OTC 1-Year Swaption, 3-Month GBP-LIBOR, Put | RBS | 2/7/22 | 0.010% | 24,938 | |||||||||||||||||
See Notes to Financial Statements.
250
| Schedules of Investments |
| (continued) |
| International Fixed Income Fund | ||||||
| Number of Contracts | Notional Amount† | Security Name | Counterparty | Expiration Date | Exercise Rate | Value | ||||||||||||||||||
| 8,300,000 | $ | 9,950 | OTC 3-Year Swaption, 3-Month USD-LIBOR, Put | BOA | 9/15/21 | 1.880% | $ | 1 | ||||||||||||||||
| 5,100,000 | 6,114 | OTC 3-Year Swaption, 3-Month USD-LIBOR, Put | DUB | 12/21/21 | 2.020% | 46 | ||||||||||||||||||
| 200,000 | 1,098 | EUR | OTC 25-Year Swaption, 3-Month EURIBOR, Put | BNP | 5/23/25 | 0.451% | 23,086 | |||||||||||||||||
| 1,300,000 | 1,558 | OTC 30-Year Swaption, 3-Month USD-LIBOR, Put | GSC | 1/25/22 | 2.320% | 6,918 | ||||||||||||||||||
|
| |||||||||||||||||||||||
| Total Interest Rate Swaptions | $ | 65,580 | ||||||||||||||||||||||
|
| |||||||||||||||||||||||
| Options on Futures | ||||||||||||||||||||||
| Number of Contracts | Notional Amount† | Security Name | Counterparty | Expiration Date | Strike Price | Value | ||||||||||||||||
| 22 | 2,990,680EUR | Euro-Bobl October Futures, Call | SOG | 9/24/21 | EUR 136.00 | $ | 2,597 | |||||||||||||||
| 8 | 1,386,320EUR | Euro-Bund November Futures, Call | SOG | 10/22/21 | EUR 174.00 | 4,251 | ||||||||||||||||
|
| |||||||||||||||||||||
| Total Options on Futures | $ | 6,848 | ||||||||||||||||||||
|
| |||||||||||||||||||||
| TOTAL OPTIONS CONTRACTS WRITTEN (Premiums received — $188,765) | $ | 94,870 | ||||||||||||||||||||
|
| |||||||||||||||||||||
| † | Amount denominated in U.S. dollars, unless otherwise noted. |
At August 31, 2021, International Fixed Income Fund held the following Forward Sale Commitments:
| Face Amounts† | Security | Value | ||||||
| Federal National Mortgage Association (FNMA): | ||||||||
| $ | 100,000 | 3.500% due 9/1/34(a) | $ | 106,756 | ||||
| 900,000 | 2.500% due 9/1/50(a) | 935,086 | ||||||
| 1,200,000 | 2.500% due 12/14/50(a)(b) | 1,240,265 | ||||||
| 2,000,000 | 2.000% due 9/1/51(a) | 2,028,594 | ||||||
| 4,750,000 | 2.000% due 10/1/51(a) | 4,808,000 | ||||||
| 3,100,000 | 2.500% due 10/1/51(a) | 3,214,384 | ||||||
| Fidelity MSCI Financials Index ETF (FNCL): | ||||||||
| 1,500,000 | 3.000% due 10/1/50(a) | 1,568,379 | ||||||
|
| |||||||
| TOTAL FORWARD SALE COMMITMENTS (Proceeds — $13,906,386) | $ | 13,901,464 | ||||||
|
| |||||||
| † | Amount denominated in U.S. dollars, unless otherwise noted. |
| (a) | This security is traded on a TBA basis (see Note 1). |
| (b) | Security is valued in good faith at fair value by or under the direction of the Board of Trustees. |
At August 31, 2021, International Fixed Income Fund had open exchange-traded futures contracts as described below.
The unrealized appreciation (depreciation) on the open contracts reflected in the accompanying financial statements were as follows:
| Open Futures Contracts | Number of Contracts | Expiration Date (Month/Year) | Notional Amount | Market Value | Unrealized Appreciation/ (Depreciation) | |||||||||||||||
| Contracts to Buy: | ||||||||||||||||||||
Australian Government 10-Year Bond September Futures | 5 | 9/21 | $ | 531,185 | $ | 533,333 | $ | 2,148 | ||||||||||||
Australian Government 3-Year Bond September Futures | 54 | 9/21 | 4,622,999 | 4,627,539 | 4,540 | |||||||||||||||
Euro-BTP September Futures | 79 | 9/21 | 14,295,045 | 14,298,776 | 3,731 | |||||||||||||||
Euro-Buxl 30-Year Bond September Futures | 8 | 9/21 | 2,004,063 | 2,007,464 | 3,401 | |||||||||||||||
Euro-OAT September Futures | 38 | 9/21 | 7,235,494 | 7,231,904 | (3,590 | ) | ||||||||||||||
See Notes to Financial Statements.
251
| Schedules of Investments |
| (continued) |
| International Fixed Income Fund | ||||||
| Open Futures Contracts | Number of Contracts | Expiration Date (Month/Year) | Notional Amount | Market Value | Unrealized Appreciation/ (Depreciation) | |||||||||||||||
| Contracts to Buy: (continued) | ||||||||||||||||||||
U.S. Treasury 5-Year Note December Futures | 64 | 12/21 | $ | 7,901,034 | $ | 7,918,000 | $ | 16,966 | ||||||||||||
U.S. Treasury 10-Year Note December Futures | 36 | 12/21 | 4,812,464 | 4,804,313 | (8,151 | ) | ||||||||||||||
U.S. Treasury Ultra Long Bond December Futures | 2 | 12/21 | 395,649 | 394,562 | (1,087 | ) | ||||||||||||||
U.S. Ultra Long Bond December Futures | 27 | 12/21 | 4,012,231 | 3,996,422 | (15,809 | ) | ||||||||||||||
|
| |||||||||||||||||||
| 2,149 | ||||||||||||||||||||
|
| |||||||||||||||||||
| Contracts to Sell: | ||||||||||||||||||||
Euro-Bund September Futures | 14 | 9/21 | 2,901,599 | 2,900,276 | 1,323 | |||||||||||||||
Euro-Schatz Note September Futures | 24 | 9/21 | 3,181,224 | 3,181,791 | (567 | ) | ||||||||||||||
U.S. Treasury Long Bond December Futures | 11 | 12/21 | 1,806,280 | 1,792,656 | 13,624 | |||||||||||||||
United Kingdom Treasury 10-Year Gilt December Futures | 2 | 12/21 | 352,732 | 352,622 | 110 | |||||||||||||||
|
| |||||||||||||||||||
| 14,490 | ||||||||||||||||||||
|
| |||||||||||||||||||
Net Unrealized Appreciation on Open Exchange–Traded Futures Contracts | $ | 16,639 | ||||||||||||||||||
|
| |||||||||||||||||||
At August 31, 2021, International Fixed Income Fund had deposited cash of $106,000 with a broker or brokers as margin collateral on an open exchange-traded futures contracts.
At August 31, 2021, International Fixed Income Fund had open forward foreign currency contracts as described below.
The unrealized appreciation (depreciation) on the open contracts reflected in the accompanying financial statements were as follows:
| Foreign Currency | Local Currency | In Exchange For | Counterparty | Market Value | Settlement Date | Unrealized Appreciation/ (Depreciation) | ||||||||||||||||||||||
| Contracts to Buy: | ||||||||||||||||||||||||||||
British Pound | 10,972,189 | USD | 15,034,768 | SCB | $ | 15,085,115 | 9/2/21 | $ | 50,347 | |||||||||||||||||||
Canadian Dollar | 2,559,143 | USD | 2,030,173 | BOA | 2,028,732 | 9/2/21 | (1,441 | ) | ||||||||||||||||||||
Chinese Offshore Renminbi | 5,216,345 | USD | 811,678 | HSBC | 807,297 | 9/15/21 | (4,381 | ) | ||||||||||||||||||||
Euro | 83,000 | USD | 97,315 | HSBC | 98,002 | 9/2/21 | 687 | |||||||||||||||||||||
Euro | 350,000 | USD | 411,857 | HSBC | 413,263 | 9/2/21 | 1,406 | |||||||||||||||||||||
Euro | 75,000 | USD | 88,963 | JPM | 88,556 | 9/2/21 | (407 | ) | ||||||||||||||||||||
Indonesian Rupiah | 5,430,920,000 | USD | 376,807 | BOA | 380,226 | 9/15/21 | 3,419 | |||||||||||||||||||||
Korean Won | 1,238,473,146 | USD | 1,111,646 | HSBC | 1,068,466 | 9/15/21 | (43,180 | ) | ||||||||||||||||||||
Korean Won | 72,585,448 | USD | 65,000 | UBS | 62,622 | 9/15/21 | (2,378 | ) | ||||||||||||||||||||
Mexican Peso | 7,076,806 | USD | 336,520 | HSBC | 352,297 | 9/3/21 | 15,777 | |||||||||||||||||||||
Mexican Peso | 7,076,806 | USD | 348,584 | BNP | 350,712 | 10/5/21 | 2,128 | |||||||||||||||||||||
Norwegian Krone | 5,962,692 | USD | 681,343 | GSC | 685,903 | 9/2/21 | 4,560 | |||||||||||||||||||||
Norwegian Krone | 5,962,692 | USD | 674,625 | BNP | 685,921 | 10/4/21 | 11,296 | |||||||||||||||||||||
Norwegian Krone | 2,655,000 | USD | 306,737 | GSC | 305,419 | 10/4/21 | (1,318 | ) | ||||||||||||||||||||
Peruvian Sol | 118,757 | USD | 28,888 | GSC | 29,036 | 9/7/21 | 148 | |||||||||||||||||||||
Peruvian Sol | 233,073 | USD | 57,000 | BNP | 56,937 | 11/4/21 | (63 | ) | ||||||||||||||||||||
Peruvian Sol | 298,774 | USD | 73,000 | GSC | 72,987 | 11/4/21 | (13 | ) | ||||||||||||||||||||
Peruvian Sol | 335,064 | USD | 90,592 | HSBC | 81,769 | 12/9/21 | (8,823 | ) | ||||||||||||||||||||
Polish Zloty | 3,033,000 | USD | 796,950 | GSC | 791,629 | 9/16/21 | (5,321 | ) | ||||||||||||||||||||
Russian Ruble | 2,812,953 | USD | 38,566 | BOA | 38,292 | 9/20/21 | (274 | ) | ||||||||||||||||||||
Russian Ruble | 2,817,667 | USD | 38,609 | BOA | 38,355 | 9/20/21 | (254 | ) | ||||||||||||||||||||
Russian Ruble | 2,854,835 | USD | 39,021 | GSC | 38,861 | 9/20/21 | (160 | ) | ||||||||||||||||||||
Russian Ruble | 4,332,981 | USD | 59,054 | GSC | 58,983 | 9/20/21 | (71 | ) | ||||||||||||||||||||
Russian Ruble | 2,964,631 | USD | 40,477 | HSBC | 40,356 | 9/20/21 | (121 | ) | ||||||||||||||||||||
Russian Ruble | 2,928,933 | USD | 39,928 | UBS | 39,871 | 9/20/21 | (57 | ) | ||||||||||||||||||||
See Notes to Financial Statements.
252
| Schedules of Investments |
| (continued) |
| International Fixed Income Fund | ||||||
| Foreign Currency | Local Currency | In Exchange For | Counterparty | Market Value | Settlement Date | Unrealized Appreciation/ (Depreciation) | ||||||||||||||||||||||
| Contracts to Buy: (continued) | ||||||||||||||||||||||||||||
Russian Ruble | 2,783,284 | USD | 36,955 | GSC | $ | 37,671 | 10/22/21 | $ | 716 | |||||||||||||||||||
Russian Ruble | 2,840,690 | USD | 37,671 | GSC | 38,448 | 10/22/21 | 777 | |||||||||||||||||||||
Russian Ruble | 1,462,213 | USD | 19,399 | HSBC | 19,791 | 10/22/21 | 392 | |||||||||||||||||||||
Russian Ruble | 7,201,224 | USD | 95,696 | SCB | 97,468 | 10/22/21 | 1,772 | |||||||||||||||||||||
Russian Ruble | 2,949,680 | USD | 39,146 | UBS | 39,923 | 10/22/21 | 777 | |||||||||||||||||||||
Russian Ruble | 1,475,499 | USD | 19,577 | UBS | 19,971 | 10/22/21 | 394 | |||||||||||||||||||||
Russian Ruble | 2,942,296 | USD | 39,411 | BCLY | 39,604 | 11/22/21 | 193 | |||||||||||||||||||||
Russian Ruble | 981,957 | USD | 13,111 | BOA | 13,217 | 11/22/21 | 106 | |||||||||||||||||||||
Russian Ruble | 7,096,545 | USD | 94,975 | BOA | 95,520 | 11/22/21 | 545 | |||||||||||||||||||||
Russian Ruble | 3,092,537 | USD | 41,469 | GSC | 41,625 | 11/22/21 | 156 | |||||||||||||||||||||
Russian Ruble | 517,924 | USD | 6,934 | HSBC | 6,971 | 11/22/21 | 37 | |||||||||||||||||||||
Russian Ruble | 4,080,741 | USD | 54,504 | UBS | 54,927 | 11/22/21 | 423 | |||||||||||||||||||||
|
| |||||||||||||||||||||||||||
| 27,794 | ||||||||||||||||||||||||||||
|
| |||||||||||||||||||||||||||
| Contracts to Sell: | ||||||||||||||||||||||||||||
Australian Dollar | 144,000 | USD | 106,435 | BOA | 105,343 | 9/2/21 | 1,092 | |||||||||||||||||||||
Australian Dollar | 401,000 | USD | 295,111 | BOA | 293,352 | 9/2/21 | 1,759 | |||||||||||||||||||||
British Pound | 208,000 | USD | 289,251 | BNP | 285,969 | 9/2/21 | 3,282 | |||||||||||||||||||||
British Pound | 10,370,189 | USD | 14,467,063 | GSC | 14,257,456 | 9/2/21 | 209,607 | |||||||||||||||||||||
British Pound | 394,000 | USD | 545,903 | UBS | 541,691 | 9/2/21 | 4,212 | |||||||||||||||||||||
British Pound | 10,972,189 | USD | 15,036,138 | SCB | 15,086,444 | 10/4/21 | (50,306 | ) | ||||||||||||||||||||
Canadian Dollar | 296,342 | USD | 235,000 | GSC | 234,922 | 9/1/21 | 78 | |||||||||||||||||||||
Canadian Dollar | 2,559,143 | USD | 2,049,936 | BNP | 2,028,731 | 9/2/21 | 21,205 | |||||||||||||||||||||
Canadian Dollar | 236,288 | USD | 187,000 | HSBC | 187,314 | 9/2/21 | (314 | ) | ||||||||||||||||||||
Canadian Dollar | 266,175 | USD | 211,000 | JPM | 211,008 | 9/2/21 | (8 | ) | ||||||||||||||||||||
Canadian Dollar | 2,559,143 | USD | 2,030,100 | BOA | 2,028,633 | 10/4/21 | 1,467 | |||||||||||||||||||||
Canadian Dollar | 299,000 | USD | 237,573 | BOA | 237,018 | 10/4/21 | 555 | |||||||||||||||||||||
Canadian Dollar | 66,512 | USD | 55,000 | GSC | 52,722 | 2/14/22 | 2,278 | |||||||||||||||||||||
Canadian Dollar | 106,088 | USD | 88,000 | GSC | 84,093 | 2/14/22 | 3,907 | |||||||||||||||||||||
Chinese Offshore Renminbi | 2,141,000 | USD | 329,691 | RBS | 331,347 | 9/15/21 | (1,656 | ) | ||||||||||||||||||||
Chinese Offshore Renminbi | 71,000 | USD | 10,911 | SOG | 10,988 | 9/15/21 | (77 | ) | ||||||||||||||||||||
Chinese Onshore Renminbi | 2,996,814 | USD | 465,930 | BOA | 463,326 | 9/15/21 | 2,604 | |||||||||||||||||||||
Danish Krone | 15,129,099 | USD | 2,432,697 | JPM | 2,403,272 | 10/1/21 | 29,425 | |||||||||||||||||||||
Danish Krone | 21,346,033 | USD | 3,433,948 | SOG | 3,390,838 | 10/1/21 | 43,110 | |||||||||||||||||||||
Danish Krone | 755,000 | USD | 119,759 | UBS | 119,933 | 10/1/21 | (174 | ) | ||||||||||||||||||||
Euro | 1,275,000 | USD | 1,516,507 | BNP | 1,505,457 | 9/2/21 | 11,050 | |||||||||||||||||||||
Euro | 27,476,764 | USD | 32,600,633 | SCB | 32,443,201 | 9/2/21 | 157,432 | |||||||||||||||||||||
Euro | 28,243,764 | USD | 33,361,338 | SCB | 33,371,179 | 10/4/21 | (9,841 | ) | ||||||||||||||||||||
Israeli New Shekel | 1,012,017 | USD | 308,906 | BNP | 315,877 | 11/12/21 | (6,971 | ) | ||||||||||||||||||||
Israeli New Shekel | 1,037,643 | USD | 319,879 | HSBC | 323,875 | 11/12/21 | (3,996 | ) | ||||||||||||||||||||
Israeli New Shekel | 4,501,800 | USD | 1,361,502 | BOA | 1,405,517 | 11/30/21 | (44,015 | ) | ||||||||||||||||||||
Israeli New Shekel | 1,300,000 | USD | 396,191 | HSBC | 405,876 | 11/30/21 | (9,685 | ) | ||||||||||||||||||||
Israeli New Shekel | 1,100,330 | USD | 339,839 | JPM | 343,537 | 11/30/21 | (3,698 | ) | ||||||||||||||||||||
Israeli New Shekel | 1,583,025 | USD | 488,860 | GSC | 494,793 | 1/31/22 | (5,933 | ) | ||||||||||||||||||||
Israeli New Shekel | 1,583,100 | USD | 483,198 | GSC | 494,816 | 1/31/22 | (11,618 | ) | ||||||||||||||||||||
Japanese Yen | 38,800,000 | USD | 354,212 | BCLY | 352,679 | 9/2/21 | 1,533 | |||||||||||||||||||||
Japanese Yen | 10,100,000 | USD | 91,743 | BOA | 91,806 | 9/2/21 | (63 | ) | ||||||||||||||||||||
Japanese Yen | 10,100,000 | USD | 92,178 | BOA | 91,805 | 9/2/21 | 373 | |||||||||||||||||||||
Japanese Yen | 21,300,000 | USD | 193,161 | BOA | 193,610 | 9/2/21 | (449 | ) | ||||||||||||||||||||
Japanese Yen | 10,100,000 | USD | 92,131 | GSC | 91,805 | 9/2/21 | 326 | |||||||||||||||||||||
Japanese Yen | 10,200,000 | USD | 92,974 | HSBC | 92,714 | 9/2/21 | 260 | |||||||||||||||||||||
Japanese Yen | 30,000,000 | USD | 271,086 | SCB | 272,690 | 9/2/21 | (1,604 | ) | ||||||||||||||||||||
Japanese Yen | 20,100,000 | USD | 183,291 | SCB | 182,702 | 9/2/21 | 589 | |||||||||||||||||||||
See Notes to Financial Statements.
253
| Schedules of Investments |
| (continued) |
| International Fixed Income Fund | ||||||
| Foreign Currency | Local Currency | In Exchange For | Counterparty | Market Value | Settlement Date | Unrealized Appreciation/ (Depreciation) | ||||||||||||||||||||||
| Contracts to Sell: (continued) | ||||||||||||||||||||||||||||
Japanese Yen | 2,889,115,991 | USD | 26,329,888 | SCB | $ | 26,261,109 | 9/2/21 | $ | 68,779 | |||||||||||||||||||
Japanese Yen | 340,000,000 | USD | 3,110,312 | BOA | 3,090,764 | 9/13/21 | 19,548 | |||||||||||||||||||||
Japanese Yen | 40,000,000 | USD | 361,727 | BOA | 363,648 | 9/21/21 | (1,921 | ) | ||||||||||||||||||||
Japanese Yen | 3,039,815,991 | USD | 27,677,206 | BNP | 27,638,939 | 10/4/21 | 38,267 | |||||||||||||||||||||
Japanese Yen | 350,000,000 | USD | 3,138,332 | BOA | 3,182,307 | 10/4/21 | (43,975 | ) | ||||||||||||||||||||
Malaysian Ringgit | 2,615,253 | USD | 628,671 | BNP | 628,519 | 9/22/21 | 152 | |||||||||||||||||||||
Mexican Peso | 7,076,806 | USD | 350,100 | BNP | 352,296 | 9/3/21 | (2,196 | ) | ||||||||||||||||||||
Mexican Peso | 703,000 | USD | 35,116 | HSBC | 34,928 | 9/17/21 | 188 | |||||||||||||||||||||
Mexican Peso | 3,379,000 | USD | 169,150 | JPM | 167,885 | 9/17/21 | 1,265 | |||||||||||||||||||||
Mexican Peso | 2,300,000 | USD | 115,416 | UBS | 114,275 | 9/17/21 | 1,141 | |||||||||||||||||||||
Mexican Peso | 1,082,000 | USD | 53,599 | BNP | 53,378 | 11/8/21 | 221 | |||||||||||||||||||||
New Zealand Dollar | 380,000 | USD | 267,688 | GSC | 267,781 | 10/4/21 | (93 | ) | ||||||||||||||||||||
Norwegian Krone | 5,962,692 | USD | 674,606 | BNP | 685,904 | 9/2/21 | (11,298 | ) | ||||||||||||||||||||
Peruvian Sol | 118,757 | USD | 32,287 | GSC | 29,036 | 9/7/21 | 3,251 | |||||||||||||||||||||
Peruvian Sol | 3,569,136 | USD | 897,422 | SCB | 872,569 | 9/22/21 | 24,853 | |||||||||||||||||||||
Peruvian Sol | 1,589,953 | USD | 389,237 | BNP | 388,409 | 11/4/21 | 828 | |||||||||||||||||||||
Peruvian Sol | 432,956 | USD | 115,507 | GSC | 105,741 | 11/12/21 | 9,766 | |||||||||||||||||||||
Peruvian Sol | 118,757 | USD | 28,760 | GSC | 28,944 | 1/24/22 | (184 | ) | ||||||||||||||||||||
Polish Zloty | 490,883 | USD | 129,013 | BCLY | 128,123 | 9/16/21 | 890 | |||||||||||||||||||||
Polish Zloty | 747,229 | USD | 196,851 | BOA | 195,031 | 9/16/21 | 1,820 | |||||||||||||||||||||
Polish Zloty | 250,221 | USD | 65,771 | GSC | 65,309 | 9/16/21 | 462 | |||||||||||||||||||||
Polish Zloty | 535,550 | USD | 141,044 | GSC | 139,781 | 9/16/21 | 1,263 | |||||||||||||||||||||
Polish Zloty | 895,901 | USD | 233,923 | HSBC | 233,835 | 9/16/21 | 88 | |||||||||||||||||||||
Singapore Dollar | 624,000 | USD | 459,947 | GSC | 464,045 | 12/15/21 | (4,098 | ) | ||||||||||||||||||||
Singapore Dollar | 117,000 | USD | 86,099 | RBS | 87,008 | 12/15/21 | (909 | ) | ||||||||||||||||||||
Singapore Dollar | 308,000 | USD | 228,850 | SCB | 229,048 | 12/15/21 | (198 | ) | ||||||||||||||||||||
Singapore Dollar | 352,000 | USD | 261,912 | SOG | 261,769 | 12/15/21 | 143 | |||||||||||||||||||||
Singapore Dollar | 105,000 | USD | 77,586 | UBS | 78,084 | 12/15/21 | (498 | ) | ||||||||||||||||||||
Swedish Krona | 30,000 | USD | 3,457 | HSBC | 3,476 | 9/2/21 | (19 | ) | ||||||||||||||||||||
Swiss Franc | 32,000 | USD | 35,375 | JPM | 34,942 | 9/2/21 | 433 | |||||||||||||||||||||
|
| |||||||||||||||||||||||||||
| 453,705 | ||||||||||||||||||||||||||||
|
| |||||||||||||||||||||||||||
Net Unrealized Appreciation on Open Forward Foreign Currency Contracts | $ | 481,499 | ||||||||||||||||||||||||||
|
| |||||||||||||||||||||||||||
At August 31, 2021, International Fixed Income Fund held the following OTC Total Return Swap Contracts:
Fund Pay | Fund Receive Floating Rate Index | Financing Rate | Payment Frequency | Maturity Date | Counterparty | Notional Amount | Market Value | Upfront Payment Paid | Unrealized Depreciation | |||||||||||||||||||||||||||
| iBoxx Investment Grade Index | 3-Month USD-LIBOR | 3.355% | PAM* | 12/20/21 | GSC | USD | 8,500,000 | $ | (438,301) | $ | 4,564 | $ | (442,865) | |||||||||||||||||||||||
|
|
|
|
|
| |||||||||||||||||||||||||||||||
| * | PAM — paid at maturity. |
At August 31, 2021, International Fixed Income Fund held the following Centrally Cleared Interest Rate Swap Contracts:
| Pay/Receive Floating Rate | Floating Rate Index | Fixed Rate | Maturity Date | Payment Frequency | Notional Amount | Market Value | Upfront Payment Paid/ (Received) | Unrealized Appreciation/ (Depreciation) | ||||||||||||||||||||||||||
| Receive | Singapore Overnight Index Average | 1.250% | 9/15/31 | 6-Month | SGD | 1,600,000 | $ | (11,466 | ) | $ | (12,011 | ) | $ | 545 | ||||||||||||||||||||
| Pay | Swiss Average Rate Overnight Index | (0.500)% | 9/15/26 | 12-Month | CHF | 1,000,000 | 859 | 617 | 242 | |||||||||||||||||||||||||
| Pay | Swiss France 6-Month LIBOR | (0.500)% | 9/16/25 | 12-Month | CHF | 1,400,000 | (10,381 | ) | 6,963 | (17,344 | ) | |||||||||||||||||||||||
See Notes to Financial Statements.
254
| Schedules of Investments |
| (continued) |
| International Fixed Income Fund | ||||||
| Pay/Receive Floating Rate | Floating Rate Index | Fixed Rate | Maturity Date | Payment Frequency | Notional Amount | Market Value | Upfront Payment Paid/ (Received) | Unrealized Appreciation/ (Depreciation) | ||||||||||||||||||||||||||
| Pay | Sterling Overnight Index Average | 0.250% | 9/15/23 | 12-Month | GBP | 1,100,000 | $ | (871 | ) | $ | 108 | $ | (979 | ) | ||||||||||||||||||||
| Pay | Sterling Overnight Index Average | 0.500% | 9/15/26 | 12-Month | GBP | 700,000 | 1,170 | 1,790 | (620 | ) | ||||||||||||||||||||||||
| Pay | Sterling Overnight Index Average | 0.750% | 9/15/31 | 12-Month | GBP | 800,000 | 12,771 | 11,685 | 1,086 | |||||||||||||||||||||||||
| Receive | Sterling Overnight Index Average | 0.750% | 9/15/51 | 12-Month | GBP | 500,000 | (12,959 | ) | (5,879 | ) | (7,080 | ) | ||||||||||||||||||||||
| Receive | Tokyo Overnight Average Index | 0.383% | 8/11/51 | 12-Month | JPY | 30,000,000 | 342 | — | 342 | |||||||||||||||||||||||||
| Receive | Tokyo Overnight Average Index | 0.388% | 8/18/51 | 12-Month | JPY | 10,000,000 | (26 | ) | — | (26 | ) | |||||||||||||||||||||||
| Receive | Tokyo Overnight Average Index | 0.398% | 8/13/51 | 12-Month | JPY | 20,000,000 | (560 | ) | — | (560 | ) | |||||||||||||||||||||||
| Receive | Tokyo Overnight Average Index | 0.400% | 12/15/51 | 12-Month | JPY | 40,000,000 | (428 | ) | (1,228 | ) | 800 | |||||||||||||||||||||||
| Pay | Zero Coupon | 0.000% | 1/3/22 | PAM | * | BRL | 56,100,000 | (83,831 | ) | (67,972 | ) | (15,859 | ) | |||||||||||||||||||||
| Pay | Zero Coupon | 0.000% | 1/3/22 | PAM | * | BRL | 1,200,000 | (2,358 | ) | (2,040 | ) | (318 | ) | |||||||||||||||||||||
| Pay | Zero Coupon | 0.000% | 1/3/22 | PAM | * | BRL | 23,700,000 | (46,099 | ) | (39,810 | ) | (6,289 | ) | |||||||||||||||||||||
| Pay | Zero Coupon | 0.000% | 1/3/22 | PAM | * | BRL | 11,300,000 | (18,684 | ) | (15,565 | ) | (3,119 | ) | |||||||||||||||||||||
| Receive | Zero Coupon | 0.000% | 1/3/22 | PAM | * | BRL | 9,600,000 | 25,643 | 23,337 | 2,306 | ||||||||||||||||||||||||
| Receive | Zero Coupon | 0.000% | 1/3/22 | PAM | * | BRL | 3,900,000 | 10,598 | 9,667 | 931 | ||||||||||||||||||||||||
| Receive | Zero Coupon | 0.000% | 1/3/22 | PAM | * | BRL | 5,100,000 | 13,872 | 12,663 | 1,209 | ||||||||||||||||||||||||
| Receive | Zero Coupon | 0.000% | 1/3/22 | PAM | * | BRL | 4,200,000 | 11,191 | 10,177 | 1,014 | ||||||||||||||||||||||||
| Receive | Zero Coupon | 0.000% | 1/3/22 | PAM | * | BRL | 2,800,000 | 7,483 | 6,810 | 673 | ||||||||||||||||||||||||
| Receive | Zero Coupon | 0.000% | 1/3/22 | PAM | * | BRL | 4,000,000 | 10,479 | 9,508 | 971 | ||||||||||||||||||||||||
| Receive | Zero Coupon | 0.000% | 1/3/22 | PAM | * | BRL | 8,300,000 | 9,558 | (7,103 | ) | 16,661 | |||||||||||||||||||||||
| Pay | 3-Month Canadian Bank Bill | 1.220% | 3/3/25 | 6-Month | CAD | 2,000,000 | 13,519 | (380 | ) | 13,899 | ||||||||||||||||||||||||
| Pay | 3-Month Canadian Bank Bill | 1.270% | 3/3/22 | 6-Month | CAD | 1,000,000 | 7,396 | 3,186 | 4,210 | |||||||||||||||||||||||||
| Pay | 3-Month Canadian Bank Bill | 1.500% | 6/17/22 | 6-Month | CAD | 300,000 | 2,430 | 2,196 | 234 | |||||||||||||||||||||||||
| Pay | 3-Month Canadian Bank Bill | 1.500% | 6/17/30 | 6-Month | CAD | 2,800,000 | (16,328 | ) | (34,864 | ) | 18,536 | |||||||||||||||||||||||
| Pay | 3-Month Canadian Bank Bill | 1.713% | 10/2/29 | 6-Month | CAD | 700,000 | 9,929 | 2,503 | 7,426 | |||||||||||||||||||||||||
| Pay | 3-Month Canadian Bank Bill | 1.900% | 12/18/29 | 6-Month | CAD | 800,000 | 18,030 | 12,573 | 5,457 | |||||||||||||||||||||||||
| Pay | 3-Month FRA New Zealand Bank Bill | 0.528% | 3/17/24 | 6-Month | NZD | 100,000 | (1,403 | ) | (1,069 | ) | (334 | ) | ||||||||||||||||||||||
| Receive | 3-Month FRA New Zealand Bank Bill | 0.500% | 12/16/25 | 6-Month | NZD | 100,000 | 3,154 | 2,661 | 493 | |||||||||||||||||||||||||
| Pay | 3-Month SEK-STIBOR-SIDE | 0.500% | 6/19/24 | 12-Month | SEK | 4,800,000 | 6,410 | 6,261 | 149 | |||||||||||||||||||||||||
| Pay | 3-Month USD-LIBOR | 0.400% | 1/15/28 | 3-Month | USD | 2,400,000 | (94,361 | ) | (99,177 | ) | 4,816 | |||||||||||||||||||||||
| Pay | 3-Month USD-LIBOR | 0.500% | 6/16/26 | 6-Month | USD | 4,350,000 | (66,872 | ) | (81,598 | ) | 14,726 | |||||||||||||||||||||||
| Pay | 3-Month USD-LIBOR | 0.500% | 6/16/28 | 6-Month | USD | 500,000 | (19,343 | ) | (21,371 | ) | 2,028 | |||||||||||||||||||||||
| Pay | 3-Month USD-LIBOR | 1.000% | 12/16/25 | 6-Month | USD | 2,000,000 | 24,321 | 17,425 | 6,896 | |||||||||||||||||||||||||
| Pay | 3-Month USD-LIBOR | 1.000% | 12/16/25 | 6-Month | USD | 1,000,000 | 11,875 | 8,176 | 3,699 | |||||||||||||||||||||||||
| Pay | 3-Month USD-LIBOR | 1.250% | 6/16/51 | 6-Month | USD | 1,300,000 | (133,131 | ) | (157,566 | ) | 24,435 | |||||||||||||||||||||||
| Pay | 3-Month USD-LIBOR | 1.460% | 2/2/51 | 6-Month | USD | 400,000 | (20,587 | ) | (27,686 | ) | 7,099 | |||||||||||||||||||||||
| Pay | 3-Month USD-LIBOR | 1.500% | 12/15/28 | 6-Month | USD | 1,600,000 | 34,297 | 35,635 | (1,338 | ) | ||||||||||||||||||||||||
| Pay | 3-Month USD-LIBOR | 1.750% | 12/15/31 | 3-Month | USD | 1,800,000 | 60,440 | 49,992 | 10,448 | |||||||||||||||||||||||||
| Pay | 3-Month USD-LIBOR | 1.750% | 12/15/31 | 6-Month | USD | 3,800,000 | 136,318 | 132,431 | 3,887 | |||||||||||||||||||||||||
| Pay | 3-Month USD-LIBOR | 2.000% | 12/15/51 | 6-Month | USD | 200,000 | 16,460 | 17,140 | (680 | ) | ||||||||||||||||||||||||
| Receive | 3-Month USD-LIBOR | 0.250% | 3/30/23 | 6-Month | USD | 9,400,000 | (11,445 | ) | 953 | (12,398 | ) | |||||||||||||||||||||||
| Receive | 3-Month USD-LIBOR | 0.400% | 3/30/26 | 6-Month | USD | 2,750,000 | 46,043 | 56,962 | (10,919 | ) | ||||||||||||||||||||||||
| Receive | 3-Month USD-LIBOR | 0.750% | 3/30/31 | 6-Month | USD | 2,800,000 | 132,496 | 152,174 | (19,678 | ) | ||||||||||||||||||||||||
| Receive | 3-Month USD-LIBOR | 0.750% | 6/16/31 | 6-Month | USD | 5,800,000 | 309,335 | 343,199 | (33,864 | ) | ||||||||||||||||||||||||
| Receive | 3-Month USD-LIBOR | 0.750% | 6/16/31 | 6-Month | USD | 1,000,000 | 51,204 | 56,646 | (5,442 | ) | ||||||||||||||||||||||||
| Receive | 3-Month USD-LIBOR | 1.000% | 12/16/30 | 6-Month | USD | 2,600,000 | 59,658 | 74,105 | (14,447 | ) | ||||||||||||||||||||||||
| Receive | 3-Month USD-LIBOR | 1.000% | 12/16/30 | 6-Month | USD | 700,000 | 17,419 | 21,641 | (4,222 | ) | ||||||||||||||||||||||||
| Receive | 3-Month USD-LIBOR | 1.150% | 3/30/51 | 6-Month | USD | 500,000 | 58,929 | 69,191 | (10,262 | ) | ||||||||||||||||||||||||
| Receive | 3-Month USD-LIBOR | 1.250% | 12/15/26 | 6-Month | USD | 3,500,000 | (50,293 | ) | (39,011 | ) | (11,282 | ) | ||||||||||||||||||||||
| Receive | 3-Month USD-LIBOR | 1.250% | 12/15/26 | 6-Month | USD | 800,000 | (11,945 | ) | (9,251 | ) | (2,694 | ) | ||||||||||||||||||||||
| Receive | 3-Month USD-LIBOR | 1.250% | 6/9/41 | 6-Month | USD | 1,200,000 | 73,212 | 87,123 | (13,911 | ) | ||||||||||||||||||||||||
| Receive | 3-Month USD-LIBOR | 1.250% | 12/16/50 | 6-Month | USD | 200,000 | 18,987 | 22,617 | (3,630 | ) | ||||||||||||||||||||||||
| Receive | 3-Month USD-LIBOR | 1.250% | 6/16/51 | 6-Month | USD | 450,000 | 43,273 | 51,553 | (8,280 | ) | ||||||||||||||||||||||||
| Receive | 3-Month USD-LIBOR | 1.298% | 8/25/24 | 6-Month | USD | 1,400,000 | (32,716 | ) | (30,011 | ) | (2,705 | ) | ||||||||||||||||||||||
| Receive | 3-Month USD-LIBOR | 1.305% | 8/21/23 | 6-Month | USD | 2,000,000 | (40,451 | ) | (40,806 | ) | 355 | |||||||||||||||||||||||
| Receive | 3-Month USD-LIBOR | 1.400% | 7/19/31 | 6-Month | USD | 400,000 | (2,993 | ) | (3,394 | ) | 401 | |||||||||||||||||||||||
See Notes to Financial Statements.
255
| Schedules of Investments |
| (continued) |
| International Fixed Income Fund | ||||||
| Pay/Receive Floating Rate | Floating Rate Index | Fixed Rate | Maturity Date | Payment Frequency | Notional Amount | Market Value | Upfront Payment Paid/ (Received) | Unrealized Appreciation/ (Depreciation) | ||||||||||||||||||||||||||
| Receive | 3-Month USD-LIBOR | 1.448% | 8/10/31 | 6-Month | USD | 600,000 | $ | (6,610 | ) | $ | — | $ | (6,610 | ) | ||||||||||||||||||||
| Receive | 3-Month USD-LIBOR | 1.508% | 7/15/31 | 6-Month | USD | 700,000 | (12,627 | ) | (8,638 | ) | (3,989 | ) | ||||||||||||||||||||||
| Receive | 3-Month USD-LIBOR | 1.665% | 10/27/51 | 6-Month | USD | 100,000 | 472 | 2,393 | (1,921 | ) | ||||||||||||||||||||||||
| Receive | 3-Month USD-LIBOR | 1.935% | 6/22/51 | 6-Month | USD | 200,000 | (13,528 | ) | (9,318 | ) | (4,210 | ) | ||||||||||||||||||||||
| Receive | 3-Month USD-LIBOR | 1.968% | 6/23/51 | 6-Month | USD | 400,000 | (30,316 | ) | (21,868 | ) | (8,448 | ) | ||||||||||||||||||||||
| Receive | 3-Month USD-LIBOR | 2.000% | 1/15/30 | 6-Month | USD | 2,600,000 | (172,376 | ) | (184,495 | ) | 12,119 | |||||||||||||||||||||||
| Receive | 3-Month USD-LIBOR | 2.000% | 12/15/51 | 6-Month | USD | 400,000 | (30,370 | ) | (24,134 | ) | (6,236 | ) | ||||||||||||||||||||||
| Receive | 3-Month USD-LIBOR | 2.090% | 12/23/51 | 6-Month | USD | 200,000 | (20,843 | ) | (16,956 | ) | (3,887 | ) | ||||||||||||||||||||||
| Receive | 3-Month USD-LIBOR | 2.100% | 8/25/51 | 6-Month | USD | 800,000 | (89,651 | ) | (74,183 | ) | (15,468 | ) | ||||||||||||||||||||||
| Receive | 3-Month USD-LIBOR | 2.250% | 6/20/28 | 6-Month | USD | 900,000 | (73,931 | ) | (68,924 | ) | (5,007 | ) | ||||||||||||||||||||||
| Receive | 3-Month USD-LIBOR | 2.500% | 12/18/21 | PAM | * | USD | 2,000,000 | (24,004 | ) | (20,130 | ) | (3,874 | ) | |||||||||||||||||||||
| Pay | 6-Month EURIBOR | (0.500)% | 9/15/23 | 6-Month | EUR | 1,900,000 | (933 | ) | (2,326 | ) | 1,393 | |||||||||||||||||||||||
| Pay | 6-Month EURIBOR | (0.250)% | 9/15/26 | 6-Month | EUR | 11,500,000 | 55,505 | 24,296 | 31,209 | |||||||||||||||||||||||||
| Pay | 6-Month EURIBOR | 0.000% | 9/15/31 | 6-Month | EUR | 3,900,000 | 14,035 | (11,523 | ) | 25,558 | ||||||||||||||||||||||||
| Pay | 6-Month EURIBOR | 0.250% | 3/16/32 | 12-Month | EUR | 1,000,000 | 27,140 | 29,596 | (2,456 | ) | ||||||||||||||||||||||||
| Receive | 6-Month EURIBOR | 0.054% | 5/27/50 | 12-Month | EUR | 50,000 | 5,178 | 6,520 | (1,342 | ) | ||||||||||||||||||||||||
| Receive | 6-Month EURIBOR | 0.064% | 11/17/52 | 12-Month | EUR | 100,000 | 8,893 | 11,996 | (3,103 | ) | ||||||||||||||||||||||||
| Receive | 6-Month EURIBOR | 0.190% | 1/27/32 | 12-Month | EUR | 300,000 | (6,503 | ) | (3,794 | ) | (2,709 | ) | ||||||||||||||||||||||
| Receive | 6-Month EURIBOR | 0.205% | 1/27/32 | 12-Month | EUR | 300,000 | (7,046 | ) | (4,335 | ) | (2,711 | ) | ||||||||||||||||||||||
| Receive | 6-Month EURIBOR | 0.500% | 9/15/51 | 12-Month | EUR | 1,500,000 | (108,130 | ) | (60,205 | ) | (47,925 | ) | ||||||||||||||||||||||
| Pay | 6-Month JPY-LIBOR | 0.000% | 3/17/31 | 6-Month | JPY | 580,000,000 | (19,641 | ) | (21,270 | ) | 1,629 | |||||||||||||||||||||||
| Pay | 6-Month JPY-LIBOR | 0.200% | 6/19/29 | 6-Month | JPY | 410,000,000 | 57,802 | 56,873 | 929 | |||||||||||||||||||||||||
| Receive | 6-Month JPY-LIBOR | 0.400% | 6/19/39 | 6-Month | JPY | 80,000,000 | (21,965 | ) | (20,967 | ) | (998 | ) | ||||||||||||||||||||||
| Receive | 6-Month JPY-LIBOR | 0.422% | 7/28/51 | 6-Month | JPY | 10,000,000 | 550 | — | 550 | |||||||||||||||||||||||||
| Receive | 6-Month JPY-LIBOR | 0.446% | 7/30/51 | 6-Month | JPY | 10,000,000 | (82 | ) | — | (82 | ) | |||||||||||||||||||||||
| Receive | 6-Month JPY-LIBOR | 0.500% | 6/19/49 | 6-Month | JPY | 30,000,000 | (6,256 | ) | (5,254 | ) | (1,002 | ) | ||||||||||||||||||||||
| Pay | 6-Month Norway Interbank Offer Rate | 1.900% | 3/10/31 | 12-Month | NOK | 2,500,000 | 10,789 | 8,579 | 2,210 | |||||||||||||||||||||||||
| Receive | 6-Month Norway Interbank Offer Rate | 1.500% | 3/10/26 | 12-Month | NOK | 4,800,000 | (4,871 | ) | (3,741 | ) | (1,130 | ) | ||||||||||||||||||||||
| Pay | 28-Day MXN TIIE Banxico | 4.870% | 7/7/25 | 28-Day | MXN | 31,300,000 | (75,926 | ) | (90,196 | ) | 14,270 | |||||||||||||||||||||||
|
|
|
|
|
| |||||||||||||||||||||||||||||
| $ | 24,325 | $ | 109,872 | $ | (85,547 | ) | ||||||||||||||||||||||||||||
|
|
|
|
|
| |||||||||||||||||||||||||||||
| * | PAM — paid at maturity. |
| Fund Pay Floating Rate Index | Fund Receive Floating Rate Index | Maturity Date | Notional Amount | Market Value | Upfront Payment Paid/ (Received) | Unrealized Appreciation/ (Depreciation) | ||||||||||||||||
1-Month USD-LIBOR + 0.070% | 3-Month USD-LIBOR | 3/7/24 | USD | 1,100,000 | $ | (128 | ) | $ | 18 | $ | (146 | ) | ||||||||||
1-Month USD-LIBOR + 0.070% | 3-Month USD-LIBOR | 6/12/22 | USD | 1,400,000 | 678 | (595 | ) | 1,273 | ||||||||||||||
1-Month USD-LIBOR + 0.073% | 3-Month USD-LIBOR | 4/27/23 | USD | 4,600,000 | (1,414 | ) | (1135 | ) | (279 | ) | ||||||||||||
1-Month USD-LIBOR + 0.084% | 3-Month USD-LIBOR | 4/26/22 | USD | 6,700,000 | (2,466 | ) | (3646 | ) | 1,180 | |||||||||||||
1-Month USD-LIBOR + 0.084% | 3-Month USD-LIBOR | 6/12/22 | USD | 1,900,000 | 158 | (812 | ) | 970 | ||||||||||||||
1-Month USD-LIBOR + 0.085% | 3-Month USD-LIBOR | 6/19/22 | USD | 7,400,000 | 8,016 | (4010 | ) | 12,026 | ||||||||||||||
1-Month USD-LIBOR + 0.086% | 3-Month USD-LIBOR | 4/12/23 | USD | 3,100,000 | (2,459 | ) | (2445 | ) | (14 | ) | ||||||||||||
1-Month USD-LIBOR + 0.091% | 3-Month USD-LIBOR | 3/18/22 | USD | 32,200,000 | (6,882 | ) | (15414 | ) | 8,532 | |||||||||||||
1-Month USD-LIBOR + 0.102% | 3-Month USD-LIBOR | 10/4/24 | USD | 2,600,000 | (344 | ) | 115 | (459 | ) | |||||||||||||
1-Month USD-LIBOR + 0.105% | 3-Month USD-LIBOR | 9/27/24 | USD | 1,700,000 | (351 | ) | (76 | ) | (275 | ) | ||||||||||||
|
|
|
|
|
| |||||||||||||||||
| $ | (5,192 | ) | $ | (28,000 | ) | $ | 22,808 | |||||||||||||||
|
|
|
|
|
| |||||||||||||||||
See Notes to Financial Statements.
256
| Schedules of Investments |
| (continued) |
| International Fixed Income Fund | ||||||
At August 31, 2021, International Fixed Income Fund held the following Centrally Cleared Inflation Rate Swap Contracts:
| Pay/ Receive Floating Rate | Floating Rate Index | Fixed Rate | Maturity Date | Notional | Market Value | Upfront Premiums Paid/ (Received) | Unrealized Appreciation/ (Depreciation) | |||||||||||||||||||||||
| Pay | 10-Year GBP Inflation Linked | 3.740% | 3/15/31 | GBP | 300,000 | $ | (10,959 | ) | $ | (2,629 | ) | $ | (8,330 | ) | ||||||||||||||||
| Pay | 10-Year GBP Inflation Linked | 3.700% | 4/15/31 | GBP | 450,000 | (21,932 | ) | (9,516 | ) | (12,416 | ) | |||||||||||||||||||
| Receive | 10-Year GBP Inflation Linked | 3.397% | 11/15/30 | GBP | 280,000 | 26,342 | 18,265 | 8,077 | ||||||||||||||||||||||
| Receive | 10-Year GBP Inflation Linked | 3.445% | 11/15/30 | GBP | 140,000 | 11,981 | 7,941 | 4,040 | ||||||||||||||||||||||
| Pay | 20-Year GBP Inflation Linked | 3.217% | 11/15/40 | GBP | 480,000 | (110,488 | ) | (83,905 | ) | (26,583 | ) | |||||||||||||||||||
| Pay | 20-Year GBP Inflation Linked | 3.272% | 11/15/40 | GBP | 100,000 | (20,606 | ) | (15,078 | ) | (5,528 | ) | |||||||||||||||||||
| Pay | 20-Year GBP Inflation Linked | 3.273% | 11/15/40 | GBP | 140,000 | (28,817 | ) | (21,078 | ) | (7,739 | ) | |||||||||||||||||||
| Receive | 30-Year GBP Inflation Linked | 3.000% | 11/15/50 | GBP | 200,000 | 87,223 | 69,058 | 18,165 | ||||||||||||||||||||||
| Receive | 30-Year GBP Inflation Linked | 3.051% | 11/15/50 | GBP | 100,000 | 39,534 | 30,491 | 9,043 | ||||||||||||||||||||||
|
|
|
|
|
| |||||||||||||||||||||||||
| $ | (27,722 | ) | $ | (6,451 | ) | $ | (21,271 | ) | ||||||||||||||||||||||
|
|
|
|
|
| |||||||||||||||||||||||||
At August 31, 2021, International Fixed Income Fund held the following OTC and Centrally Cleared Credit Default Swap Contracts:
OTC Credit Default Swaps on Sovereign Issues — Buy Protection (1)
| Reference Obligation | Fixed Deal (Pay) Rate | Maturity Date | Payment Frequency | Counterparty | Implied Credit Spread at 8/31/21 (2) | Notional Amount (3) | Market Value | Upfront Payment (Received) | Unrealized Appreciation | |||||||||||||||||||||||||||||||
China Government International Bonds, A+ | (1.000 | )% | 6/20/23 | 3-Month | BCLY | 0.110 | % | USD | 200,000 | $ | (3,648 | ) | $ | (3,815 | ) | $ | 167 | |||||||||||||||||||||||
China Government International Bonds, A+ | (1.000 | )% | 6/20/23 | 3-Month | GSC | 0.110 | % | USD | 500,000 | (9,119 | ) | (9,653 | ) | 534 | ||||||||||||||||||||||||||
Japan Government International Bonds, A+ | (1.000 | )% | 6/20/22 | 3-Month | BCLY | 0.036 | % | USD | 400,000 | (3,946 | ) | (14,121 | ) | 10,175 | ||||||||||||||||||||||||||
Japan Government International Bonds, A+ | (1.000 | )% | 6/20/22 | 3-Month | BNP | 0.036 | % | USD | 700,000 | (6,906 | ) | (25,057 | ) | 18,151 | ||||||||||||||||||||||||||
Japan Government International Bonds, A+ | (1.000 | )% | 6/20/22 | 3-Month | BOA | 0.036 | % | USD | 200,000 | (1,974 | ) | (6,914 | ) | 4,940 | ||||||||||||||||||||||||||
Japan Government International Bonds, A+ | (1.000 | )% | 6/20/22 | 3-Month | GSC | 0.036 | % | USD | 500,000 | (4,933 | ) | (17,653 | ) | 12,720 | ||||||||||||||||||||||||||
Japan Government International Bonds, A+ | (1.000 | )% | 6/20/22 | 3-Month | HSBC | 0.036 | % | USD | 300,000 | (2,959 | ) | (10,159 | ) | 7,200 | ||||||||||||||||||||||||||
South Korea International Bonds, AA | (1.000 | )% | 6/20/23 | 3-Month | BCLY | 0.087 | % | USD | 600,000 | (11,193 | ) | (15,056 | ) | 3,863 | ||||||||||||||||||||||||||
South Korea International Bonds, AA | (1.000 | )% | 6/20/23 | 3-Month | BNP | 0.087 | % | USD | 400,000 | (7,462 | ) | (9,884 | ) | 2,422 | ||||||||||||||||||||||||||
South Korea International Bonds, AA | (1.000 | )% | 6/20/23 | 3-Month | HSBC | 0.087 | % | USD | 200,000 | (3,731 | ) | (4,989 | ) | 1,258 | ||||||||||||||||||||||||||
South Korea International Bonds, AA | (1.000 | )% | 6/20/23 | 3-Month | JPM | 0.087 | % | USD | 400,000 | (7,461 | ) | (9,580 | ) | 2,119 | ||||||||||||||||||||||||||
|
|
|
|
|
| |||||||||||||||||||||||||||||||||||
| $ | (63,332 | ) | $ | (126,881 | ) | $ | 63,549 | |||||||||||||||||||||||||||||||||
|
|
|
|
|
| |||||||||||||||||||||||||||||||||||
See Notes to Financial Statements.
257
| Schedules of Investments |
| (continued) |
| International Fixed Income Fund | ||||||
OTC Credit Default Swaps on Sovereign Issues — Sell Protection (4)
| Reference Obligation | Fixed Deal Receive Rate | Maturity Date | Payment Frequency | Counterparty | Implied Credit Spread at 8/31/21 (2) | Notional Amount (3) | Market Value | Upfront Premiums Paid/ (Received) | Unrealized Appreciation | |||||||||||||||||||||||||||||||
Abu Dhabi Government International Bonds, AA | 1.000 | % | 6/20/26 | 3-Month | GSC | 0.417 | % | USD | 350,000 | $ | 10,424 | $ | 10,156 | $ | 268 | |||||||||||||||||||||||||
Republic of Italy Government International Bonds, BBB | 1.000 | % | 6/20/25 | 3-Month | BCLY | 0.613 | % | USD | 300,000 | 4,987 | (7,348 | ) | 12,335 | |||||||||||||||||||||||||||
Saudi Government International Bonds, A- | 1.000 | % | 6/20/26 | 3-Month | DUB | 0.515 | % | USD | 700,000 | 17,548 | 14,506 | 3,042 | ||||||||||||||||||||||||||||
|
|
|
|
|
| |||||||||||||||||||||||||||||||||||
| $ | 32,959 | $ | 17,314 | $ | 15,645 | |||||||||||||||||||||||||||||||||||
|
|
|
|
|
| |||||||||||||||||||||||||||||||||||
Centrally Cleared — Credit Default Swaps on Indexes — Buy Protection (1)
| Reference Obligation | Fixed Deal (Pay) Rate | Maturity Date | Payment Frequency | Implied Credit Spread at 8/31/21 (2) | Notional Amount (3) | Market Value | Upfront Payment (Received) | Unrealized Depreciation | ||||||||||||||||||||||||||||
Markit CDX North America High Yield Series 35 5-Year Index | (5.000 | )% | 12/20/25 | 3-Month | 2.606 | % | USD | 200,000 | $ | (21,314 | ) | $ | (19,498 | ) | $ | (1,816 | ) | |||||||||||||||||||
Markit CDX North America High Yield Series 36 5-Year Index | (5.000 | )% | 6/20/26 | 3-Month | 2.770 | % | USD | 300,000 | (32,607 | ) | (29,462 | ) | (3,145 | ) | ||||||||||||||||||||||
Markit CDX North America Investment Grade Series 36 10-Year Index | (1.000 | )% | 6/20/31 | 3-Month | 0.873 | % | USD | 500,000 | (6,683 | ) | (4,893 | ) | (1,790 | ) | ||||||||||||||||||||||
Markit iTraxx Europe Series 31 10-Year Index | (1.000 | )% | 6/20/29 | 3-Month | 0.737 | % | EUR | 9,600,000 | (252,293 | ) | (218,575 | ) | (33,718 | ) | ||||||||||||||||||||||
|
|
|
|
|
| |||||||||||||||||||||||||||||||
| $ | (312,897 | ) | $ | (272,428 | ) | $ | (40,469 | ) | ||||||||||||||||||||||||||||
|
|
|
|
|
| |||||||||||||||||||||||||||||||
Centrally Cleared — Credit Default Swaps on Corporate Issues and Indexes — Sell Protection (4)
| Reference Obligation | Fixed Deal Receive Rate | Maturity Date | Payment Frequency | Implied Credit Spread at 8/31/21 (2) | Notional Amount (3) | Market Value | Upfront Premiums Paid/ (Received) | Unrealized Appreciation | ||||||||||||||||||||||||||||
Jaguar Land Rover Automotive PLC, B | 5.000 | % | 6/20/26 | 3-Month | 3.609 | % | EUR | 200,000 | $ | 16,882 | $ | 12,873 | $ | 4,009 | ||||||||||||||||||||||
Markit CDX North America Investment Grade Series 36 5-Year Index | 1.000 | % | 6/20/26 | 3-Month | 0.465 | % | USD | 2,000,000 | 54,928 | 49,641 | 5,287 | |||||||||||||||||||||||||
Rolls-Royce PLC, BB- | 1.000 | % | 6/20/26 | 3-Month | 2.111 | % | EUR | 200,000 | (11,640 | ) | (15,001 | ) | 3,361 | |||||||||||||||||||||||
Ryder System Inc, BBB+ | 1.000 | % | 6/20/22 | 3-Month | 0.220 | % | USD | 100,000 | 836 | 725 | 111 | |||||||||||||||||||||||||
Sheel International Finance BV, AA- | 1.000 | % | 12/20/26 | 3-Month | 0.427 | % | EUR | 200,000 | 7,778 | 6,963 | 815 | |||||||||||||||||||||||||
|
|
|
|
|
| |||||||||||||||||||||||||||||||
| $ | 68,784 | $ | 55,201 | $ | 13,583 | |||||||||||||||||||||||||||||||
|
|
|
|
|
| |||||||||||||||||||||||||||||||
See Notes to Financial Statements.
258
| Schedules of Investments |
| (continued) |
| International Fixed Income Fund |
At August 31, 2021, International Fixed Income Fund held the following OTC Cross-Currency Swap Contracts:
| Counterparty Pay | Counterparty Receive | Maturity Date (5) | Counterparty | Notional Amount of Currency Received (6) | Notional Amount of Currency Delivered (6) | Market Value | Upfront Payment (Received) | Unrealized Appreciation | ||||||||||||||||||||||
Floating rate equal to 3-Month USD-LIBOR based on the notional amount of currency received | Floating rate equal to 3-Month AUD-LIBOR | 8/1/29 |
| GSC | USD | 1,449,000 | AUD | 2,100,000 | $ | 94,674 | $ | (3,920) | $ | 98,594 | ||||||||||||||||
|
|
|
|
|
| |||||||||||||||||||||||||
| (1) | If the Fund is a buyer of protection and a credit event occurs, as defined under the terms of that particular swap agreement, the Fund will either (i) receive from the seller of protection an amount equal to the notional amount of the swap and deliver the reference obligation or underlying securities comprising the referenced index or (ii) receive a net settlement amount in the form of cash or securities equal to the notional amount of the swap less the recovery value of the reference obligation or underlying securities comprising the referenced index. |
| (2) | Implied credit spreads, represented in absolute terms, utilized in determining the market value of credit default swap agreements on corporate issues or sovereign issues of an emerging country as of period end serve as an indicator of the current status of the payment/performance risk and represent the likelihood or risk of default for the credit derivative. The implied credit spread of a particular referenced entity reflects the cost of buying/selling protection and may include upfront payments required to be made to enter into the agreement. Wider credit spreads represent a deterioration of the referenced entity’s credit soundness and a greater likelihood or risk of default or other credit event occurring as defined under the terms of the agreement. A credit spread identified as ‘‘Defaulted’’ indicates a credit event has occurred for the referenced entity or obligation. |
| (3) | The maximum potential amount the Fund could be required to make as a seller of credit protection or receive as a buyer of credit protection if a credit event occurs as defined under the terms of that particular swap agreement. |
| (4) | If the Fund is a seller of protection and a credit event occurs, as defined under the terms of that particular swap agreement, the Fund will either (i) pay to the buyer of protection an amount equal to the notional amount of the swap and take delivery of the referenced obligation or underlying securities comprising the referenced index or (ii) pay a net settlement amount in the form of cash or securities equal to the notional amount of the swap less the recovery value of the referenced obligation or underlying securities comprising the referenced index. |
| (5) | At the maturity date, the notional amount of the currency received will be exchanged back for the notional amount of the currency delivered. |
| (6) | The notional amounts to be received or delivered may be determined and exchanged at a future date, based on the effective date of the cross-currency swap. |
At August 31, 2021, International Fixed Income Fund deposited cash collateral with brokers in the amount of $583,000 for open centrally cleared swap contracts.
At August 31, 2021, International Fixed Income Fund had cash collateral from brokers in the amount of $710,000 for open OTC swap contracts.
See Notes to Financial Statements.
259
| Schedules of Investments |
| (continued) |
| International Fixed Income Fund |
Currency Abbreviations used in this schedule: | Counterparty Abbreviations used in this schedule: | |||||
| ARS | — Argentine Peso | BCLY | — Barclays Bank PLC | |||
| AUD | — Australian Dollar | BNP | — BNP Paribas SA | |||
| BRL | — Brazilian Real | BOA | — Bank of America | |||
| CAD | — Canadian Dollar | DUB | — Deutsche Bank AG | |||
| CHF | — Swiss Franc | GSC | — Goldman Sachs & Co. | |||
| DKK | — Danish Krone | HSBC | — HSBC Bank USA | |||
| EUR | — Euro | JPM | — JPMorgan Chase & Co. | |||
| GBP | — British Pound | RBS | — Royal Bank of Scotland PLC | |||
| HKD | — Hong Kong Dollar | SCB | — Standard Chartered Bank | |||
| ILS | — Israeli New Shekel | SOG | — Societe Generale SA | |||
| JPY | — Japanese Yen | UBS | — UBS Securities LLC | |||
| MXN | — Mexican Peso | |||||
| MYR | — Malaysian Ringgit | |||||
| NOK | — Norwegian Krone | |||||
| NZD | — New Zealand Dollar | |||||
| PEN | — Peruvian Sol | |||||
| SEK | — Swedish Krona | |||||
| SGD | — Singapore Dollar | |||||
| USD | — United States Dollar | |||||
| ZAR | — South African Rand | |||||
See Notes to Financial Statements.
260
| Schedules of Investments |
| (continued) |
| Municipal Bond Fund | ||||||||||
| Face Amount† | Rating†† | Security | Value | |||||||
MUNICIPAL BONDS — 90.7% | ||||||||||
Alaska — 0.1% | ||||||||||
| Northern Tobacco Securitization Corp., Revenue Bonds: | ||||||||||
| $ | 35,000 | BBB+ | Series B1, 0.500% due 6/1/31 | $ | 35,301 | |||||
| 80,000 | BBB- | Series B1, 4.000% due 6/1/50 | 93,409 | |||||||
|
| |||||||||
| Total Alaska | 128,710 | |||||||||
|
| |||||||||
Arizona — 5.6% | ||||||||||
| 530,000 | BB | Arizona Industrial Development Authority, Revenue Bonds, Somerset Academy of Las Vegas — Aliante and Skye Canyon Campus Projects, 3.000% due 12/15/31(a) | 563,187 | |||||||
| 2,815,000 | A+ | Chandler Industrial Development Authority, Revenue Bonds, Variable AMT Intel Corp., 5.000% due 6/1/49(b)(c) | 3,163,501 | |||||||
| Industrial Development Authority of the County of Pima (The), Revenue Bonds: | ||||||||||
Facility American Leadership Academy: | ||||||||||
| 350,000 | NR | 4.125% due 6/15/29(a) | 354,553 | |||||||
| 250,000 | NR | 4.750% due 6/15/37(a) | 253,735 | |||||||
| 230,000 | NR | Imagine East Mesa Charter School, 3.250% due 7/1/24(a) | 239,030 | |||||||
| 500,000 | BB+ | Maricopa County Industrial Development Authority, Revenue Bonds, Paradise School Project Paragon Management Inc., 4.000% due 7/1/26(a) | 540,206 | |||||||
|
| |||||||||
| Total Arizona | 5,114,212 | |||||||||
|
| |||||||||
California — 5.1% | ||||||||||
| 620,000 | A | California County Tobacco Securitization Agency, Revenue Bonds, Series A, 5.000% due 6/1/28 | 790,432 | |||||||
| California County Tobacco Securitization Agency, Revenue Bonds, Merced County Tobacco Funding Corp.: | ||||||||||
| 240,000 | A | 5.000% due 6/1/25 | 280,239 | |||||||
| 100,000 | A | 5.000% due 6/1/27 | 124,312 | |||||||
| 100,000 | A | 5.000% due 6/1/28 | 127,485 | |||||||
| 335,000 | A- | 5.000% due 6/1/31 | 448,504 | |||||||
| 250,000 | NR | California School Finance Authority, Revenue Bonds, iLead Lancaster Project, Series A, 4.000% due 6/1/31(a) | 274,961 | |||||||
| 965,000 | AAA | City & County of San Francisco CA, GO, Series A, 4.000% due 6/15/36 | 1,060,083 | |||||||
| Golden State Tobacco Securitization Corp., Revenue Bonds: | ||||||||||
| 35,000 | NR | Series A1, 5.000% due 6/1/47 | 36,167 | |||||||
| 290,000 | NR | Series A2, 5.000% due 6/1/47 | 299,665 | |||||||
| 595,000 | AA | Riverside County Public Financing Authority, Tax Allocation, Series A, BAM-Insured, 4.000% due 10/1/40 | 677,613 | |||||||
| 475,000 | Aa2(d) | Sonoma Valley Unified School District, GO, 4.000% due 8/1/38 | 562,254 | |||||||
|
| |||||||||
| Total California | 4,681,715 | |||||||||
|
| |||||||||
Colorado — 6.8% | ||||||||||
| 750,000 | A+ | City & County of Denver, CO, Airport System Revenue, Revenue Bonds, AMT, Series A, 5.000% due 11/15/30(c) | 928,402 | |||||||
| 1,435,000 | AA+ | City of Colorado Springs, CO, Utilities System Revenue, Revenue Bonds, System Improvement, Series B-2, 5.000% due 11/15/38 | 1,573,771 | |||||||
| 1,500,000 | AA- | Colorado Health Facilities Authority, Revenue Bonds, Sisters of Charity of Leavenworth Inc., Series A, 5.000% due 1/1/44 | 1,653,142 | |||||||
| 2,000,000 | AA | University of Colorado Hospital Authority, Revenue Bonds, Series A, 4.000% due 11/15/36 | 2,081,413 | |||||||
|
| |||||||||
| Total Colorado | 6,236,728 | |||||||||
|
| |||||||||
Connecticut — 0.9% | ||||||||||
| 790,000 | AAA | Connecticut Housing Finance Authority, Revenue Bonds, AMT, Series B2, 2.300% due 11/15/23(c) | 816,604 | |||||||
|
| |||||||||
See Notes to Financial Statements.
261
| Schedules of Investments |
| (continued) |
| Municipal Bond Fund | ||||||||||
| Face Amount† | Rating†† | Security | Value | |||||||
District of Columbia — 1.3% | ||||||||||
| $ | 2,075,000 | WD(e) | District of Columbia Tobacco Settlement Financing Corp., Revenue Bonds, Capital Appreciation Asset-Backed, Series B, zero coupon, due 6/15/46 | $ | 382,667 | |||||
| 700,000 | A+ | Metropolitan Washington Airports Authority Aviation Revenue, Revenue Bonds, AMT, Series A, 4.000% due 10/1/36(c) | 798,255 | |||||||
|
| |||||||||
| Total District of Columbia | 1,180,922 | |||||||||
|
| |||||||||
Florida — 9.6% | ||||||||||
| 225,000 | Baa3(d) | Capital Projects Finance Authority, FL, Revenue Bonds, Florida University Project, Series A1, 5.000% due 10/1/26 | 265,799 | |||||||
| 500,000 | NR | Capital Trust Agency Inc., Revenue Bonds, Educational Growth Fund, LLC Charter School Portfolio Projects, Series A1, 3.375% due 7/1/31(a) | 550,649 | |||||||
| 100,000 | Ba2(d) | Capital Trust Agency Inc., Revenue Bonds, Viera Charter Schools Inc. Project, Series A, 4.000% due 10/15/29(a) | 109,573 | |||||||
| 1,400,000 | A+ | City of Cape Coral, FL, Water & Sewer Revenue, Revenue Bonds, 5.000% due 10/1/39 | 1,720,679 | |||||||
| City of Tallahasee, FL, Health Facilities Revenue, Revenue Bonds: | ||||||||||
| 500,000 | Baa1(d) | 5.000% due 12/1/26 | 592,294 | |||||||
| 500,000 | Baa1(d) | 5.000% due 12/1/27 | 588,690 | |||||||
| 250,000 | NR | Finley Woods Community Development District, Special Assessment, Area One, 3.150% due 5/1/25 | 256,585 | |||||||
| 190,000 | NR | Florida Development Finance Corp., Revenue Bonds, AMT, Waste Pro USA Inc. Project, 5.000% due 5/1/29(a)(c) | 204,168 | |||||||
| 115,000 | NR | Harbor Bay Community Development District, Special Assessment, Area One, Series A2, 3.100% due 5/1/24 | 117,800 | |||||||
| 275,000 | NR | Lakewood Ranch Stewardship District, Special Assessment, Isles Lakewood Ranch Project, 3.875% due 5/1/29 | 299,450 | |||||||
| 3,000,000 | AA- | Orange County Convention Center, Revenue Bonds, 5.000% due 10/1/29 | 3,522,052 | |||||||
| 310,000 | NR | Seminole County Industrial Development Authority, Revenue Bonds, Legacy Pointe at UCF Project, 3.750% due 11/15/25 | 312,869 | |||||||
| 240,000 | NR | Southern Groves Community Development District No. 5, Special Assessment, 2.875% due 5/1/24 | 244,430 | |||||||
|
| |||||||||
| Total Florida | 8,785,038 | |||||||||
|
| |||||||||
Georgia — 4.6% | ||||||||||
| City of Atlanta, GA, Department of Aviation, Revenue Bonds: | ||||||||||
| 65,000 | Aa3(d) | Series A, 5.000% due 7/1/24 | 73,797 | |||||||
| 265,000 | Aa3(d) | Series A, 5.000% due 7/1/25 | 312,349 | |||||||
| 265,000 | Aa3(d) | Series A, 5.000% due 7/1/26 | 322,825 | |||||||
| 70,000 | Aa3(d) | Series B, AMT, 5.000% due 7/1/24(c) | 79,324 | |||||||
| 120,000 | Aa3(d) | Series B, AMT, 5.000% due 7/1/25(c) | 141,089 | |||||||
| Main Street Natural Gas Inc., Revenue Bonds: | ||||||||||
| 2,610,000 | Aa2(d) | Series B, 4.000% due 8/1/49(b) | 2,897,286 | |||||||
| 320,000 | A3(d) | Series C, 4.000% due 5/1/52(b) | 383,016 | |||||||
|
| |||||||||
| Total Georgia | 4,209,686 | |||||||||
|
| |||||||||
Guam — 0.1% | ||||||||||
| Territory of Guam, Revenue Bonds: | ||||||||||
| 15,000 | Ba1(d) | Series A, 5.000% due 11/1/27 | 18,388 | |||||||
| 15,000 | Ba1(d) | Series A, 5.000% due 11/1/28 | 18,730 | |||||||
| 15,000 | Ba1(d) | Series A, 5.000% due 11/1/29 | 19,034 | |||||||
|
| |||||||||
| Total Guam | 56,152 | |||||||||
|
| |||||||||
Idaho — 0.1% | ||||||||||
| 100,000 | A2(d) | Idaho Housing & Finance Association, Revenue Bonds, Series A, 5.000% due 7/15/29 | 130,669 | |||||||
|
| |||||||||
See Notes to Financial Statements.
262
| Schedules of Investments |
| (continued) |
| Municipal Bond Fund | ||||||||||
| Face Amount† | Rating†† | Security | Value | |||||||
Illinois — 4.2% | ||||||||||
| Illinois Finance Authority, Revenue Bonds: | ||||||||||
Advocate Health Care: | ||||||||||
| $ | 785,000 | Aa3(d) | Pre-refunded 6/1/22 @ 100, 4.000% due 6/1/47(f) | $ | 807,260 | |||||
| 440,000 | AA | Pre-refunded 6/1/22 @ 100, 4.000% due 6/1/47(f) | 452,645 | |||||||
| 10,000 | AA | Pre-refunded 6/1/22 @ 100, 4.000% due 6/1/47(f) | 10,284 | |||||||
| 600,000 | A | DePaul University, 5.000% due 10/1/36 | 716,366 | |||||||
| 1,000,000 | AA+ | Northwestern University, 5.000% due 12/1/28 | 1,295,434 | |||||||
| Northwestern Memorial HealthCare, Series A, 4.000%: | ||||||||||
| 110,000 | AA+ | due 7/15/37 | 132,584 | |||||||
| 145,000 | AA+ | due 7/15/38 | 174,289 | |||||||
| 220,000 | AA+ | due 7/15/39 | 263,679 | |||||||
|
| |||||||||
| Total Illinois | 3,852,541 | |||||||||
|
| |||||||||
Indiana — 1.3% | ||||||||||
| 1,000,000 | A+ | Indiana Municipal Power Agency, Power Supply, Revenue Bonds, Series C, 5.000% due 1/1/37 | 1,199,762 | |||||||
|
| |||||||||
Iowa — 1.3% | ||||||||||
| 1,000,000 | A3(d) | PEFA Inc., Revenue Bonds, 5.000% due 9/1/49(b) | 1,202,669 | |||||||
|
| |||||||||
Louisiana — 0.7% | ||||||||||
| New Orleans Aviation Board, AMT, General Airport North Terminal, Revenue Bonds, Series B: | ||||||||||
| 250,000 | A- | Series B, 5.000% due 1/1/37(c) | 298,649 | |||||||
| 250,000 | A- | Series B, 5.000% due 1/1/38(c) | 298,607 | |||||||
|
| |||||||||
| Total Louisiana | 597,256 | |||||||||
|
| |||||||||
Maryland — 3.1% | ||||||||||
| City of Baltimore, MD,Tax Allocation, Harbor Point Project: | ||||||||||
| 200,000 | NR | Series A, 2.750% due 6/1/24(a) | 205,937 | |||||||
| 125,000 | NR | Series A, 2.800% due 6/1/25(a) | 130,016 | |||||||
| 135,000 | NR | Series A, 2.850% due 6/1/26(a) | 141,797 | |||||||
| 140,000 | NR | Series B, 3.000% due 6/1/24(a) | 142,777 | |||||||
| 660,000 | AA+ | County of Prince George’s, MD, Behavioral Health Facility, Certificates Participation, 5.000% due 10/1/28 | 848,468 | |||||||
| 1,000,000 | AAA | State of Maryland, GO, Series A, 5.000% due 8/1/31 | 1,382,861 | |||||||
|
| |||||||||
| Total Maryland | 2,851,856 | |||||||||
|
| |||||||||
Massachusetts — 1.4% | ||||||||||
| Massachusetts Bay Transportation Authority, Sales Tax Revenue, Revenue Bonds: | ||||||||||
| 75,000 | AA | Series A1, 5.000% due 7/1/28 | 96,482 | |||||||
| 1,000,000 | AA | Series A1, 5.000% due 7/1/44 | 1,223,107 | |||||||
|
| |||||||||
| Total Massachusetts | 1,319,589 | |||||||||
|
| |||||||||
Michigan — 0.7% | ||||||||||
| 400,000 | BB+ | Michigan Finance Authority, Revenue Bonds, Cesar Chavez Academy Project, 3.250% due 2/1/24 | 411,435 | |||||||
| 190,000 | A1(d) | Michigan Finance Authority, Revenue Bonds, McLaren Health Care Corp., 1.200% due 10/15/38(b) | 192,146 | |||||||
|
| |||||||||
| Total Michigan | 603,581 | |||||||||
|
| |||||||||
Nevada — 1.6% | ||||||||||
| 75,000 | Ba2(d) | City of Sparks, NV, Revenue Bonds, Senior Sales Tax Anticipation, Series A, 2.500% due 6/15/24(a) | 76,325 | |||||||
| 1,130,000 | AAA | State of Nevada Highway Improvement Revenue, Revenue Bonds, 5.000% due 12/1/31 | 1,392,395 | |||||||
|
| |||||||||
| Total Nevada | 1,468,720 | |||||||||
|
| |||||||||
New Hampshire — 1.2% | ||||||||||
| 1,000,000 | B | New Hampshire Business Finance Authority, Revenue Bonds, Casella Waste Systems Inc., 2.950% due 4/1/29(a)(c) | 1,093,015 | |||||||
|
| |||||||||
See Notes to Financial Statements.
263
| Schedules of Investments |
| (continued) |
| Municipal Bond Fund | ||||||||||
| Face Amount† | Rating†† | Security | Value | |||||||
New Jersey — 3.6% | ||||||||||
| $ | 1,340,000 | A3(d) | Manalapan-Englishtown Regional Board of Education, GO, FGIC & NPFG-Insured, 5.750% due 12/1/22 | $ | 1,431,240 | |||||
| 215,000 | NR | New Jersey Economic Development Authority, Revenue Bonds, Golden Door Charter School Project, 5.125% due 11/1/29(a) | 240,472 | |||||||
| 1,250,000 | A+ | New Jersey Transportation Trust Fund Authority, Revenue Bonds, Highway Reimbursement, 5.000% due 6/15/30 | 1,486,576 | |||||||
| 100,000 | A | Tobacco Settlement Financing Corp., Revenue Bonds, Series A, 5.000% due 6/1/25 | 116,887 | |||||||
|
| |||||||||
| Total New Jersey | 3,275,175 | |||||||||
|
| |||||||||
New Mexico — 1.3% | ||||||||||
| 1,000,000 | BBB | City of Farmington, NM, Revenue Bonds, Public Service Company of New Mexico, 1.875% due 4/1/33(b) | 1,001,227 | |||||||
| City of Santa Fe, NM, Revenue Bonds, El Castillo Retirement Project: | ||||||||||
| 100,000 | BB+(e) | 2.250% due 5/15/24 | 100,254 | |||||||
| 100,000 | BB+(e) | 2.625% due 5/15/25 | 100,317 | |||||||
|
| |||||||||
| Total New Mexico | 1,201,798 | |||||||||
|
| |||||||||
New York — 3.1% | ||||||||||
| 1,170,000 | AA | Trust for Cultural Resources of The City of New York/The, Revenue Bonds, Juilliard School, Series A, 5.000% due 1/1/33 | 1,494,364 | |||||||
| 400,000 | AA+ | New York City Water & Sewer System, Revenue Bonds, 4.625% due 6/15/46 | 428,295 | |||||||
| 500,000 | AA+ | New York State Dormitory Authority, Revenue Bonds, Bidding Group, Unrefunded Portion, 5.000% due 2/15/43 | 612,529 | |||||||
| 225,000 | Baa3(d) | New York Transportation Development Corp., Revenue Bonds, Delta Air Lines Inc. — LaGuardia, AMT, 4.000% due 10/1/30(c) | 270,131 | |||||||
|
| |||||||||
| Total New York | 2,805,319 | |||||||||
|
| |||||||||
Ohio — 0.9% | ||||||||||
| 160,000 | NR | Buckeye Tobacco Settlement Financing Authority, Revenue Bonds, Series B2, Class 2, 5.000% due 6/1/55 | 186,191 | |||||||
| 600,000 | Ba1(d) | Ohio Air Quality Development Authority, Revenue Bonds, Ohio Valley Electric Corp., Remarketing, Series A, 2.875% due 2/1/26 | 640,624 | |||||||
|
| |||||||||
| Total Ohio | 826,815 | |||||||||
|
| |||||||||
Oregon — 0.9% | ||||||||||
| 830,000 | Aa2(d) | Washington & Clackamas Counties School District No. 23J Tigard-Tualatin, GO, NPFG-Insured, 5.000% due 6/15/22 | 862,175 | |||||||
|
| |||||||||
Pennsylvania — 0.1% | ||||||||||
| 100,000 | BB+ | Bucks County Industrial Development Authority, Revenue Bonds, Grand View Hospital Project, 5.000% due 7/1/28 | 122,361 | |||||||
|
| |||||||||
Puerto Rico — 3.1% | ||||||||||
| Puerto Rico Housing Finance Authority, Revenue Bonds, Puerto Rico Public Housing Project: | ||||||||||
| 440,000 | AA- | 5.000% due 12/1/21 | 445,249 | |||||||
| 265,000 | AA- | 5.000% due 12/1/22 | 280,537 | |||||||
| 200,000 | AA- | 5.000% due 12/1/23 | 220,428 | |||||||
| 430,000 | AA- | 5.000% due 12/1/24 | 491,493 | |||||||
| Puerto Rico Sales Tax Financing Corp. Sales Tax Revenue, Revenue Bonds: | ||||||||||
| 299,000 | NR | Series A1, zero coupon, due 7/1/24 | 288,845 | |||||||
| 664,000 | NR | Series A1, 4.750% due 7/1/53 | 759,883 | |||||||
| 90,000 | NR | Series A1, 5.000% due 7/1/58 | 104,207 | |||||||
| 216,000 | NR | Series A2, 4.784% due 7/1/58 | 247,188 | |||||||
|
| |||||||||
| Total Puerto Rico | 2,837,830 | |||||||||
|
| |||||||||
See Notes to Financial Statements.
264
| Schedules of Investments |
| (continued) |
| Municipal Bond Fund | ||||||||||
| Face Amount† | Rating†† | Security | Value | |||||||
South Carolina — 7.9% | ||||||||||
| $ | 1,535,000 | Aa3(d) | Clemson University, Revenue Bonds, 5.000% due 5/1/29 | $ | 1,776,764 | |||||
| 2,000,000 | A | South Carolina Jobs-Economic Development Authority, Revenue Bonds, Prisma Health Obligation Group, Series A, 5.000% due 5/1/28 | 2,529,412 | |||||||
| 2,970,000 | Aa3(d) | South Carolina Transportation Infrastructure Bank, Revenue Bonds, Remarketing, Series B, 0.514% (1-Month USD-LIBOR + 0.450%) due 10/1/31(b) | 2,970,274 | |||||||
|
| |||||||||
| Total South Carolina | 7,276,450 | |||||||||
|
| |||||||||
Tennessee — 0.9% | ||||||||||
| 800,000 | Aa2(d) | Tennessee Housing Development Agency, Revenue Bonds, Series A, 3.850% due 1/1/35 | 853,576 | |||||||
|
| |||||||||
Texas — 6.8% | ||||||||||
| City of Houston, TX, Airport System Revenue, Revenue Bonds, AMT: | ||||||||||
| 100,000 | B-(e) | 4.000% due 7/15/41(c) | 109,011 | |||||||
| 1,000,000 | A1(d) | Series C, 5.000% due 7/1/26(c) | 1,209,675 | |||||||
| 295,000 | A | Lower Colorado River Authority, Revenue Bonds, LCRA Transmission Services Corp. Project, 4.000% due 5/15/36 | 301,904 | |||||||
| 505,000 | NR | New Hope Cultural Education Facilities Finance Corp., Revenue Bonds, Beta Academy, 3.375% due 8/15/29(a) | 517,788 | |||||||
| 500,000 | AAA | North East, TX, Independent School District, GO, PSF-GTD-Insured, 5.250% due 2/1/28 | 643,939 | |||||||
| 1,000,000 | A+ | North Texas Tollway Authority, Revenue Bonds, Series A, 5.000% due 1/1/39 | 1,181,589 | |||||||
| 795,000 | Aaa(d) | Northside Independent School District, GO, PSF-GTD-Insured, 0.700% due 6/1/50(b) | 801,030 | |||||||
| 1,250,000 | AA | San Antonio Water System, Revenue Bonds, Junior Lien Revenue and Refunding Bonds, Series C, 5.000% due 5/15/46 | 1,499,552 | |||||||
|
| |||||||||
| Total Texas | 6,264,488 | |||||||||
|
| |||||||||
Utah — 0.7% | ||||||||||
| 500,000 | A- | Utah Associated Municipal Power Systems, Revenue Bonds, Horse Butte Wind, Series A, 5.000% due 9/1/32 | 612,328 | |||||||
|
| |||||||||
Virginia — 4.1% | ||||||||||
| 500,000 | AAA | County of Arlington, VA, GO, 5.000% due 6/15/31 | 689,510 | |||||||
| Virginia College Building Authority, Revenue Bonds: | ||||||||||
| 350,000 | A | Series A, 5.000% due 1/15/28 | 437,808 | |||||||
| 585,000 | A | Series A, 5.000% due 1/15/29 | 746,528 | |||||||
| 500,000 | A | Series A, 5.000% due 1/15/30 | 650,356 | |||||||
| 1,000,000 | AA+ | Virginia College Building Authority, VA, Educational Facilities Revenue, Revenue Bonds, 4.000% due 2/1/34 | 1,241,597 | |||||||
|
| |||||||||
| Total Virginia | 3,765,799 | |||||||||
|
| |||||||||
Washington — 2.6% | ||||||||||
| 1,000,000 | AA+ | King County School District No. 401 Highline, GO, SCH BD GTY-Insured, 5.000% due 12/1/35 | 1,259,102 | |||||||
| 650,000 | Aa2(d) | Snohomish County Public Utility District No 1, Revenue Bonds, Series A, 5.000% due 12/1/51 | 848,759 | |||||||
| 100,000 | NR | Washington State Convention Center Public Facilities District, Revenue Bonds, Junior Lodging Tax Notes, 4.000% due 7/1/31 | 119,044 | |||||||
| 100,000 | BB(e) | Washington State Housing Finance Commission, Revenue Bonds, Transforming Age Projects, Series A, 5.000% due 1/1/26(a) | 114,711 | |||||||
|
| |||||||||
| Total Washington | 2,341,616 | |||||||||
|
| |||||||||
West Virginia — 2.7% | ||||||||||
| West Virginia Parkways Authority, Revenue Bonds: | ||||||||||
| 1,000,000 | AA- | 4.000% due 6/1/51 | 1,186,966 | |||||||
| 1,000,000 | AA- | 5.000% due 6/1/47 | 1,291,327 | |||||||
|
| |||||||||
| Total West Virginia | 2,478,293 | |||||||||
|
| |||||||||
See Notes to Financial Statements.
265
| Schedules of Investments |
| (continued) |
| Municipal Bond Fund | ||||||||||
| Face Amount† | Rating†† | Security | Value | |||||||
Wisconsin — 2.3% | ||||||||||
| $ | 90,000 | A+ | Public Finance Authority, Revenue Bonds, Renown Regional Medical Center Project, 5.000% due 6/1/27 | $ | 111,666 | |||||
| Wisconsin Health & Educational Facilities Authority, Revenue Bonds: | ||||||||||
| 1,300,000 | AA- | Aspirus Inc. Obligation Group, 4.000% due 8/15/40 | 1,415,150 | |||||||
| 500,000 | AA | Milwaukee Regional Medical Center Thermal Service Obligated Group, 5.000% due 4/1/37 | 626,358 | |||||||
|
| |||||||||
| Total Wisconsin | 2,153,174 | |||||||||
|
| |||||||||
| TOTAL MUNICIPAL BONDS (Cost — $78,547,048) | 83,206,622 | |||||||||
|
| |||||||||
| Shares/Units | ||||||||||
CLOSED END MUTUAL FUND SECURITY — 3.3% | ||||||||||
United States — 3.3% | ||||||||||
| 25,800 | iShares ® National Muni Bond ETF, Common Class (Cost — $3,008,973) | 3,022,728 | ||||||||
|
| |||||||||
| TOTAL INVESTMENTS IN SECURITIES BEFORE SHORT-TERM INVESTMENTS (Cost — $81,556,021) | 86,229,350 | |||||||||
|
| |||||||||
| Face Amount† | ||||||||||
SHORT-TERM INVESTMENTS — 5.2% | ||||||||||
TIME DEPOSITS — 5.2% | ||||||||||
| 71,784 | Barclays Bank PLC — London, 0.005% due 9/1/21 | 71,784 | ||||||||
| 2,144,243 | Skandinaviska Enskilda Banken AB — Stockholm, 0.005% due 9/1/21 | 2,144,243 | ||||||||
| 2,565,572 | Sumitomo Mitsui Banking Corp. — Tokyo, 0.005% due 9/1/21 | 2,565,572 | ||||||||
|
| |||||||||
| TOTAL SHORT-TERM INVESTMENTS (Cost — $4,781,599) | 4,781,599 | |||||||||
|
| |||||||||
| TOTAL INVESTMENTS — 99.2% (Cost — $86,337,620) | 91,010,949 | |||||||||
|
| |||||||||
| Other Assets in Excess of Liabilities — 0.8% | 758,098 | |||||||||
|
| |||||||||
| TOTAL NET ASSETS — 100.0% | $ | 91,769,047 | ||||||||
|
| |||||||||
| † | Amount denominated in U.S. dollars, unless otherwise noted. |
| †† | All ratings are by Standard & Poor’s Rating Service, unless otherwise noted. All ratings are unaudited. |
| (a) | Restricted security that may be sold to “qualified institutional buyers” pursuant to the conditions of Rule 144A under the Securities Act of 1933, as amended. This security has been deemed liquid pursuant to guidelines approved by the Board of Trustees, unless otherwise noted. The aggregate value of restricted 144A holdings at August 31, 2021, amounts to $5,752,900 and represents 6.3% of net assets. |
| (b) | Variable rate security. Interest rate disclosed is that which was in effect at August 31, 2021. |
| (c) | Income from this issue is considered a preference item for purposes of calculating the alternative minimum tax (AMT). |
| (d) | Rating by Moody’s Investors Service. All ratings are unaudited. |
| (e) | Rating by Fitch Ratings Service. All ratings are unaudited. |
| (f) | Pre-refunded bonds are escrowed with government obligations and/or government agency securities and are considered by the Manager to be triple-A rated even if the issuer has not applied for new ratings. |
See Notes to Financial Statements.
266
| Schedules of Investments |
| (continued) |
| Municipal Bond Fund | ||||||
At August 31, 2021, for Municipal Bond Fund the aggregate cost of investments, the aggregate gross unrealized appreciation and depreciation of all investments for federal income tax purposes were as follows:
| Fund | Aggregate Cost For Federal Income Tax Purposes | Gross Unrealized Appreciation | Gross Unrealized (Depreciation) | Net Unrealized Appreciation | ||||||||||||
Municipal Bond Fund | $ | 86,347,122 | $ | 4,735,630 | $ | (71,951 | ) | $ | 4,663,679 | |||||||
Abbreviations used in this schedule: | ||
| BAM | — Build America Mutual | |
| ETF | — Exchange–Traded Fund | |
| FGIC | — Financial Guarantee Insurance Company | |
| GO | — General Obligation | |
| LIBOR | — London Interbank Offered Rate | |
| NPFG | — National Public Finance Guarantee Corp. | |
| PSF-GTD | — Permanent School Fund Guaranteed | |
| SCH BD GTY | — School Bond Guaranty | |
See pages 296-297 for definitions of ratings.
| Summary of Investments by Industry^ | ||||
General Obligation | 23.3 | % | ||
Health Care Providers & Services | 12.2 | |||
Transportation | 8.8 | |||
Higher Education | 7.8 | |||
Development | 6.8 | |||
School District | 6.1 | |||
Airport | 5.0 | |||
Education | 4.5 | |||
Utilities | 4.0 | |||
Water and Sewer | 4.0 | |||
Capital Markets | 3.3 | |||
Tobacco Settlement | 3.2 | |||
Power | 1.7 | |||
Pollution | 1.2 | |||
Single Family Housing | 0.9 | |||
Multi family Housing | 0.9 | |||
Nursing Homes | 0.7 | |||
Housing | 0.3 | |||
Short-Term Investments | 5.3 | |||
|
| |||
| 100.0 | % | |||
|
| |||
| ^ | As a percentage of total investments. |
At August 31, 2021, Municipal Bond Fund had open exchange-traded futures contracts as described below.
The unrealized depreciation on the open contracts reflected in the accompanying financial statements were as follows:
| Open Futures Contracts | Number of Contracts | Expiration Date (Month/Year) | Notional Amount | Market Value | Unrealized Depreciation | |||||||||||||||
| Contracts to Sell: | ||||||||||||||||||||
U.S. Treasury 5-Year Note December Futures | 7 | 12/21 | $ | 865,977 | $ | 866,031 | $ | (54 | ) | |||||||||||
U.S. Treasury 10-Year Note December Futures | 6 | 12/21 | 800,625 | 800,719 | (94 | ) | ||||||||||||||
U.S. Treasury Long Bond December Futures | 1 | 12/21 | 162,969 | 162,969 | — | |||||||||||||||
|
| |||||||||||||||||||
| $ | (148 | ) | ||||||||||||||||||
|
| |||||||||||||||||||
See Notes to Financial Statements.
267
| Schedules of Investments |
| (continued) |
| Municipal Bond Fund | ||||||
At August 31, 2021, Municipal Bond Fund had no deposited cash with a broker or brokers as margin collateral on an open exchange-traded futures contracts.
Currency Abbreviation used in this schedule: | ||
| USD | — United States Dollars | |
See Notes to Financial Statements.
268
| Schedules of Investments |
| (continued) |
| Inflation-Linked Fixed Income Fund | ||||||||||
| Face Amount/Units† | Rating†† | Security | Value | |||||||
U.S. GOVERNMENT AGENCIES & OBLIGATIONS — 102.2% | ||||||||||
| U.S. Treasury Inflation Indexed Bonds: | ||||||||||
| $ | 1,744,070 | 2.375% due 1/15/25 | $ | 2,018,292 | ||||||
| 2,084,835 | 2.000% due 1/15/26 | 2,455,994 | ||||||||
| 2,071,149 | 1.750% due 1/15/28 | 2,528,031 | ||||||||
| 5,192,355 | 3.625% due 4/15/28(a) | 7,049,173 | ||||||||
| 1,761,534 | 2.500% due 1/15/29 | 2,293,277 | ||||||||
| 2,060,942 | 3.875% due 4/15/29 | 2,924,006 | ||||||||
| 36,736 | 3.375% due 4/15/32 | 54,858 | ||||||||
| 1,734,715 | 2.125% due 2/15/40 | 2,640,590 | ||||||||
| 2,915,575 | 2.125% due 2/15/41 | 4,491,219 | ||||||||
| 2,164,320 | 0.750% due 2/15/42 | 2,700,815 | ||||||||
| 460,879 | 0.625% due 2/15/43 | 563,350 | ||||||||
| 4,045,257 | 1.375% due 2/15/44 | 5,700,315 | ||||||||
| 830,729 | 0.750% due 2/15/45 | 1,050,409 | ||||||||
| 4,116,545 | 1.000% due 2/15/46 | 5,516,972 | ||||||||
| 1,789,609 | 0.875% due 2/15/47 | 2,366,406 | ||||||||
| 1,123,816 | 1.000% due 2/15/48 | 1,540,619 | ||||||||
| 486,123 | 0.250% due 2/15/50 | 566,595 | ||||||||
| 1,356,641 | 0.125% due 2/15/51 | 1,540,831 | ||||||||
| U.S. Treasury Inflation Indexed Notes: | ||||||||||
| 16,018,882 | 0.125% due 1/15/23(a) | 16,620,017 | ||||||||
| 8,881,818 | 0.625% due 4/15/23(a) | 9,333,507 | ||||||||
| 1,979,531 | 0.625% due 1/15/24 | 2,120,846 | ||||||||
| 5,494,077 | 0.500% due 4/15/24 | 5,894,917 | ||||||||
| 1,906,146 | 0.125% due 10/15/24 | 2,049,281 | ||||||||
| 5,680,044 | 0.125% due 4/15/25 | 6,132,174 | ||||||||
| 418,848 | 0.125% due 10/15/25 | 457,045 | ||||||||
| 4,642,407 | 0.625% due 1/15/26 | 5,171,104 | ||||||||
| 3,315,264 | 0.125% due 4/15/26 | 3,623,611 | ||||||||
| 3,666,808 | 0.125% due 7/15/26 | 4,040,961 | ||||||||
| 3,520,499 | 0.375% due 1/15/27 | 3,932,831 | ||||||||
| 4,342,798 | 0.375% due 7/15/27 | 4,895,134 | ||||||||
| 5,152,677 | 0.500% due 1/15/28 | 5,848,704 | ||||||||
| 7,046,294 | 0.750% due 7/15/28(a) | 8,189,524 | ||||||||
| 2,894,467 | 0.875% due 1/15/29 | 3,397,988 | ||||||||
| 2,939,024 | 0.250% due 7/15/29 | 3,321,985 | ||||||||
| 1,731,873 | 0.125% due 1/15/30 | 1,933,471 | ||||||||
| 3,147,279 | 0.125% due 7/15/30 | 3,533,007 | ||||||||
| 5,646,525 | 0.125% due 1/15/31(i) | 6,316,794 | ||||||||
| 5,889,655 | 0.125% due 7/15/31 | 6,614,444 | ||||||||
| 130,000 | U.S. Treasury Notes, 1.750% due 12/31/24 | 135,520 | ||||||||
|
| |||||||||
| TOTAL U.S. GOVERNMENT AGENCIES & OBLIGATIONS (Cost — $136,992,535) | 151,564,617 | |||||||||
|
| |||||||||
SOVEREIGN BONDS — 12.1% | ||||||||||
Australia — 0.8% | ||||||||||
| Australia Government Bonds: | ||||||||||
| 1,040,000 | AUD | Aaa(b) | 1.250% due 2/21/22 | 915,782 | ||||||
| 290,000 | AUD | Aaa(b) | 3.000% due 9/20/25 | 320,574 | ||||||
|
| |||||||||
| Total Australia | 1,236,356 | |||||||||
|
| |||||||||
Canada — 0.4% | ||||||||||
| Canadian Government Real Return Bonds: | ||||||||||
| 483,003 | CAD | AAA | 4.250% due 12/1/26 | 495,263 | ||||||
| 54,399 | CAD | AAA | 0.500% due 12/1/50 | 47,785 | ||||||
|
| |||||||||
| Total Canada | 543,048 | |||||||||
|
| |||||||||
See Notes to Financial Statements.
269
| Schedules of Investments |
| (continued) |
| Inflation-Linked Fixed Income Fund | ||||||||||
| Face Amount/Units† | Rating†† | Security | Value | |||||||
France — 0.5% | ||||||||||
| 612,156 | EUR | AAu(c) | French Republic Government Bonds OAT, 0.100% due 3/1/26(d) | $ | 792,951 | |||||
|
| |||||||||
Italy — 5.0% | ||||||||||
| Italy Buoni Poliennali Del Tesoro: | ||||||||||
| 3,743,993 | EUR | NR | 1.400% due 5/26/25(d) | 4,811,308 | ||||||
| 1,968,552 | EUR | Baa3u(b) | 0.400% due 5/15/30(d) | 2,559,073 | ||||||
|
| |||||||||
| Total Italy | 7,370,381 | |||||||||
|
| |||||||||
Japan — 2.2% | ||||||||||
| Japanese Government CPI Linked Bonds: | ||||||||||
| 140,380,270 | JPY | A1(b) | 0.100% due 3/10/28 | 1,309,697 | ||||||
| 181,535,760 | JPY | A1(b) | 0.100% due 3/10/29 | 1,698,778 | ||||||
| 20,118,600 | JPY | NR | 0.005% due 3/10/31 | 186,035 | ||||||
|
| |||||||||
| Total Japan | 3,194,510 | |||||||||
|
| |||||||||
New Zealand — 0.2% | ||||||||||
| 270,000 | NZD | AAA | New Zealand Government Bonds Inflation Linked Bonds, 2.500% due 9/20/35 | 271,352 | ||||||
|
| |||||||||
Peru — 0.2% | ||||||||||
| 1,400,000 | PEN | A- | Peru Government Bonds Inflation Linked Bonds, 6.150% due 8/12/32(d) | 338,112 | ||||||
|
| |||||||||
Qatar — 0.1% | ||||||||||
| $ | 200,000 | AA- | Qatar Government International Bonds, 3.875% due 4/23/23 | 211,458 | ||||||
|
| |||||||||
United Kingdom — 2.7% | ||||||||||
| 2,660,724 | GBP | Aa3u(b) | United Kingdom Gilt Inflation Linked, 1.875% due 11/22/22 | 3,940,146 | ||||||
|
| |||||||||
| TOTAL SOVEREIGN BONDS (Cost — $17,428,363) | 17,898,314 | |||||||||
|
| |||||||||
COLLATERALIZED MORTGAGE OBLIGATIONS — 9.5% | ||||||||||
| Alternative Loan Trust: | ||||||||||
| 253,014 | Caa2(b) | Series 2006-HY11, Class A1, 0.324% (1-Month USD-LIBOR + 0.240%) due 6/25/36(e) | 246,067 | |||||||
| 40,219 | WR(b) | Series 2007-4CB, Class 1A35, 6.000% due 4/25/37 | 40,649 | |||||||
| 506,645 | Caa3(b) | Alternative Loan Trust Resecuritization, Series 2008-2R, Class 1A1, 6.000% due 8/25/37(e) | 511,072 | |||||||
| 783 | AA | American Home Mortgage Investment Trust, Series 2005-2, Class 4A1, 1.654% (6-Month USD-LIBOR + 1.500%) due 9/25/45(e) | 786 | |||||||
| 325,011 | Aaa(b) | Arch Street CLO Ltd., Series 2016-2A, Class AR2, 1.134% (3-Month USD-LIBOR + 1.000%) due 10/20/28(d)(e) | 325,200 | |||||||
| 300,000 | Aaa(b) | ARES L CLO Ltd., Series 2018-50A, Class AR, 1.176% (3-Month USD-LIBOR + 1.050%) due 1/15/32(d)(e) | 300,281 | |||||||
| 92,339 | Aaa(b) | Bancorp Commercial Mortgage Trust, Series 2019-CRE6, Class A, 1.214% (30-Day SOFR + 1.164%) due 9/15/36(d)(e) | 92,431 | |||||||
| 30,062 | NR | Bayview Opportunity Master Fund IVa Trust, Series 2019-SBR1, Class A1, step bond to yield, 3.475% due 6/28/34(d) | 30,289 | |||||||
| 20,292 | WR(b) | Bear Stearns Adjustable Rate Mortgage Trust, Series 2003-3, Class 3A2, 2.868% due 5/25/33(e) | 20,517 | |||||||
| 213,408 | CCC | Bear Stearns Asset-Backed Securities Trust, Series 2004-1, Class M1, 1.059% (1-Month USD-LIBOR + 0.975%) due 6/25/34(e) | 219,005 | |||||||
| 300,000 | EUR | Aaa(b) | Cairn CLO X DAC, Series 2018-10A, Class AR, 0.780% (3-Month EURIBOR+ 0.780%) due 10/15/31(d)(e) | 354,270 | ||||||
| 300,000 | EUR | Aaa(b) | Carlyle Global Markets Strategies, Series 2014-2A, Class AR-1, 0.750% (3-Month EURIBOR + 0.750% ) due 11/15/31(d)(e) | 354,009 | ||||||
| 40,368 | AA+ | Chevy Chase Funding LLC Mortgage-Backed Certificates, Series 2004-A, Class A1, 0.444% (1-Month USD-LIBOR + 0.360%) due 3/25/35(d)(e) | 41,800 | |||||||
| CHL Mortgage Pass-Through Trust: | ||||||||||
| 733,991 | WR(b) | Series 2005-HYB6, Class 2A1, 2.768% due 10/20/35(e) | 753,934 | |||||||
| 75,368 | WR(b) | Series 2005-HYB9, Class 2A1, 1.987% (1-Year USD-LIBOR + 1.750%) due 2/20/36(e) | 72,950 | |||||||
| 103,720 | Caa2(b) | Series 2006-6, Class A4, 6.000% due 4/25/36 | 77,511 | |||||||
| 144,178 | WD(c) | Series 2007-1, Class A1, 6.000% due 3/25/37 | 106,828 | |||||||
See Notes to Financial Statements.
270
| Schedules of Investments |
| (continued) |
| Inflation-Linked Fixed Income Fund | ||||||||||
| Face Amount/Units† | Rating†† | Security | Value | |||||||
COLLATERALIZED MORTGAGE OBLIGATIONS — 9.5% — (continued) | ||||||||||
| Citigroup Mortgage Loan Trust: | ||||||||||
| $ | 5,691 | B- | Series 2004-HYB2, Class 2A, 2.389% due 3/25/34(e) | $ | 5,910 | |||||
| 177,427 | Caa2(b) | Series 2007-AR4, Class 1A1A, 3.154% due 3/25/37(e) | 177,790 | |||||||
| 77,776 | NR | Series 2019-B, Class A1, 3.258% due 4/25/66(d)(e) | 78,475 | |||||||
| 22,888 | WR(b) | Citigroup Mortgage Loan Trust Inc., Series 2004-NCM2, Class 1CB1, 5.500% due 8/25/34 | 23,562 | |||||||
| Countrywide Asset-Backed Certificates: | ||||||||||
| 356,809 | CC | Series 2007-1, Class 1A, 0.224% (1-Month USD-LIBOR + 0.140%) due 7/25/37(e) | 338,610 | |||||||
| 76,942 | D | Series 2007-6, Class 1A, 0.284% (1-Month USD-LIBOR + 0.200%) due 9/25/37(e) | 71,953 | |||||||
| 411,387 | CCC | Series 2007-8, Class 1A1, 0.274% (1-Month USD-LIBOR + 0.190%) due 11/25/37(e) | 397,165 | |||||||
| 488,047 | NR | Credit Suisse Commercial Mortgage, Series 2015-3R, Class 5A2, 0.234% (1-Month USD-LIBOR + 0.150%) due 9/29/36(d)(e) | 478,689 | |||||||
| Credit-Based Asset Servicing & Securitization LLC: | ||||||||||
| 153,000 | BB | Series 2005-CB3, Class M4, 1.134% (1-Month USD-LIBOR + 1.050%) due 6/25/35(e) | 153,214 | |||||||
| 870,499 | CC | Series 2007-CB6, Class A3, 0.312% (1-Month USD-LIBOR + 0.220%) due 7/25/37(d)(e) | 702,563 | |||||||
| 149,011 | D | CWABS Asset-Backed Certificates Trust, Series 2004-7, Class MV5, 1.809% (1-Month USD-LIBOR + 1.725%) due 11/25/34(e) | 150,903 | |||||||
| 400,000 | Aaa(b) | Dryden Senior Loan Fund, Series 2017-47A, Class A1R, 1.106% (3-Month USD-LIBOR + 0.980%) due 4/15/28(d)(e) | 400,259 | |||||||
| 810,270 | CCC | Ellington Loan Acquisition Trust, Series 2007-1, Class A1, 1.184% (1-Month USD-LIBOR + 1.100%) due 5/25/37(d)(e) | 812,831 | |||||||
| 323,651 | NR | Government National Mortgage Association (GNMA), Series 2018-H15, Class FG, 0.599% (1-Year USD-LIBOR + 0.150%) due 8/20/68(e) | 320,650 | |||||||
| 24,837 | D | GSAA Trust, Series 2006-7, Class AF4A, step bond to yield, 6.720% due 3/25/46 | 18,613 | |||||||
| 4,358 | AA- | HarborView Mortgage Loan Trust, Series 2005-9, Class 2A1A, 0.768% (1-Month USD-LIBOR + 0.680%) due 6/20/35(e) | 4,293 | |||||||
| 300,000 | EUR | AAA(b) | Harvest CLO, Series 11A, Class ARR, 0.650% (3-Month EURIBOR+ 0.650%) due 6/26/30(d)(e) | 354,187 | ||||||
| 677,583 | GBP | AAA | Hawksmoor Mortgages, Series 2019-1A, Class A, 1.100% (Sterling Overnight Index Average + 1.050%) due 5/25/53(d)(e) | 936,274 | ||||||
| 55,516 | B- | IndyMac INDX Mortgage Loan Trust, Series 2005-16IP, Class A1, 0.724% (1-Month USD-LIBOR + 0.640%) due 7/25/45(e) | 49,525 | |||||||
| 336,798 | CCC | JP Morgan Alternative Loan Trust, Series 2006-A1, Class 1A1, 0.544% (1-Month USD-LIBOR + 0.460%) due 3/25/36(e) | 329,884 | |||||||
| 141,981 | A- | JP Morgan Chase Commercial Mortgage Securities Trust, Series 2019-FL12, Class A, 1.546% (1-Month USD-LIBOR + 1.450%) due 12/15/31(d)(e) | 141,228 | |||||||
| 256,438 | EUR | Aaa(b) | Jubilee CLO BV, Series 2015-16A, Class A1R, 0.471% (0.800% — 3-Month EURIBOR) due 12/15/29(d)(f) | 301,612 | ||||||
| 72,578 | NR | Legacy Mortgage Asset Trust, Series 2019-GS3, Class A1, step bond to yield, 3.750% due 4/25/59(d) | 73,181 | |||||||
| 315,555 | WD(c) | Lehman XS Trust, Series 2007-20N, Class A1, 1.234% (1-Month USD-LIBOR + 1.150%) due 12/25/37(e) | 329,905 | |||||||
| 172,638 | CC | Long Beach Mortgage Loan Trust, Series 2006-7, Class 2A2, 0.204% (1-Month USD-LIBOR + 0.120%) due 8/25/36(e) | 93,609 | |||||||
| 369,387 | AAA | Mountain View CLO X Ltd., Series 2015-10A, Class AR, 0.949% (3-Month USD-LIBOR + 0.820%) due 10/13/27(d)(e) | 369,464 | |||||||
| 9,246 | AA+ | MRFC Mortgage Pass-Through Trust, Series 2000-TBC2, Class A1, 0.576% (1-Month USD-LIBOR + 0.480%) due 6/15/30(e) | 9,305 | |||||||
| New Residential Mortgage Loan Trust: | ||||||||||
| 54,482 | NR | Series 2018-3A, Class A1, 4.500% due 5/25/58(d)(e) | 59,053 | |||||||
| 290,796 | Aaa(b) | Series 2019-RPL3, Class A1, 2.750% due 7/25/59(d)(e) | 302,018 | |||||||
| Option One Mortgage Loan Trust: | ||||||||||
| 108,689 | CC | Series 2007-1, Class 1A1, 0.224% (1-Month USD-LIBOR + 0.140%) due 1/25/37(e) | 82,686 | |||||||
| 102,747 | CC | Series 2007-2, Class 1A1, 0.224% (1-Month USD-LIBOR + 0.140%) due 3/25/37(e) | 78,997 | |||||||
| 473,166 | B+ | RASC Trust, Series 2006-KS3, Class M1, 0.579% (1-Month USD-LIBOR + 0.330%) due 4/25/36(e) | 473,639 | |||||||
See Notes to Financial Statements.
271
| Schedules of Investments |
| (continued) |
| Inflation-Linked Fixed Income Fund | ||||||||||
| Face Amount/Units† | Rating†† | Security | Value | |||||||
COLLATERALIZED MORTGAGE OBLIGATIONS — 9.5% — (continued) | ||||||||||
| $ | 517,463 | WD(c) | Residential Asset Securitization Trust, Series 2006-A10, Class A5, 6.500% due 9/25/36 | $ | 283,145 | |||||
| Securitized Asset-Backed Receivables LLC Trust: | ||||||||||
| 534,656 | CC | Series 2006-FR3, Class A3, 0.584% (1-Month USD-LIBOR + 0.500%) due 5/25/36(e) | 372,378 | |||||||
| 105,059 | CC | Series 2006-HE2, Class A2C, 0.384% (1-Month USD-LIBOR + 0.300%) due 7/25/36(e) | 60,114 | |||||||
| 195,494 | B- | Sequoia Mortgage Trust, Series 6, Class A, 0.727% (1-Month USD-LIBOR + 0.640%) due 4/19/27(e) | 194,530 | |||||||
| Soundview Home Loan Trust: | ||||||||||
| 249,425 | CC | Series 2007-OPT1, Class 1A1, 0.284% (1-Month USD-LIBOR + 0.200%) due 6/25/37(e) | 206,304 | |||||||
| 66,213 | CCC | Series 2007-OPT2, Class 2A3, 0.264% (1-Month USD-LIBOR + 0.180%) due 7/25/37(e) | 63,808 | |||||||
| 116,206 | Aaa(b) | Symphony CLO XIV Ltd., Series 2014-14A, Class AR, 1.083% (3-Month USD-LIBOR + 0.950%) due 7/14/26(d)(e) | 116,279 | |||||||
| 198,691 | Aaa(b) | Symphony CLO XVII Ltd., Series 2016-17A, Class AR, 1.006% (3-Month USD-LIBOR + 0.880%) due 4/15/28(d)(e) | 198,616 | |||||||
| 231,159 | Aaa(b) | TICP CLO III-2 Ltd., Series 2018-3R, Class A, 0.974% (3-Month USD-LIBOR + 0.840%) due 4/20/28(d)(e) | 231,275 | |||||||
| 270,475 | Aaa(b) | Venture XVII CLO Ltd., Series 2014-17A, Class ARR, 1.006% (3-Month USD-LIBOR + 0.880%) due 4/15/27(d)(e) | 270,488 | |||||||
| 400,000 | Aaa(b) | Voya CLO Ltd., Series 2017-1A, Class A1R, 1.084% (3-Month USD-LIBOR + 0.950%) due 4/17/30(d)(e) | 400,247 | |||||||
| WaMu Mortgage Pass-Through Certificates Trust: | ||||||||||
| 9,447 | Baa1(b) | Series 2002-AR2, Class A, 1.532% (11th District Cost of Funds Index + 1.250%) due 2/27/34(e) | 9,674 | |||||||
| 3,952 | BB | Series 2002-AR17, Class 1A, 1.298% (1-Year Treasury Average Rate + 1.200%) due 11/25/42(e) | 3,903 | |||||||
|
| |||||||||
| TOTAL COLLATERALIZED MORTGAGE OBLIGATIONS (Cost — $13,956,951) | 14,078,407 | |||||||||
|
| |||||||||
CORPORATE BONDS & NOTES — 4.9% | ||||||||||
Banks — 2.5% | ||||||||||
| 100,000 | EUR | Ba1(b) | Banco Santander SA, Junior Subordinated Notes, 6.250% (5-Year EUR Swap Rate + 5.640%)(e)(g) | 118,257 | ||||||
| 700,000 | BBB- | Deutsche Bank AG, Senior Unsecured Notes, 4.250% due 10/14/21 | 703,129 | |||||||
| 100,000 | GBP | BBB | HSBC Holdings PLC, Subordinated Notes, 6.000% due 3/29/40 | 198,151 | ||||||
| Natwest Group PLC, Senior Unsecured Notes: | ||||||||||
| 200,000 | BBB | 1.697% (3-Month USD-LIBOR + 1.550%) due 6/25/24(e) | 204,446 | |||||||
| 200,000 | BBB | 4.519% (3-Month USD-LIBOR + 1.550%) due 6/25/24(e) | 213,622 | |||||||
| 14,440,380 | DKK | AAA | Nykredit Realkredit AS, Covered Notes, 1.000% due 10/1/50 | 2,230,574 | ||||||
|
| |||||||||
| Total Banks | 3,668,179 | |||||||||
|
| |||||||||
Diversified Financial Services — 2.0% | ||||||||||
| 17,033,191 | DKK | AAA | Jyske Realkredit AS, Covered Notes, 1.000% due 10/1/50 | 2,636,759 | ||||||
| 2,439,780 | DKK | AAA | Nordea Kredit Realkreditaktieselskab, Covered Notes, 1.000% due 10/1/50 | 378,068 | ||||||
|
| |||||||||
| Total Diversified Financial Services | 3,014,827 | |||||||||
|
| |||||||||
Electric — 0.2% | ||||||||||
| 200,000 | BBB+ | NextEra Energy Capital Holdings Inc., Company Guaranteed Notes, 2.800% due 1/15/23 | 206,407 | |||||||
|
| |||||||||
Oil & Gas — 0.2% | ||||||||||
| 305,000 | BB- | Petrobras Global Finance BV, Company Guaranteed Notes, 5.093% due 1/15/30 | 334,038 | |||||||
|
| |||||||||
| TOTAL CORPORATE BONDS & NOTES (Cost — $6,974,120) | 7,223,451 | |||||||||
|
| |||||||||
See Notes to Financial Statements.
272
| Schedules of Investments |
| (continued) |
| Inflation-Linked Fixed Income Fund | ||||||||||
| Face Amount/Units† | Security | Value | ||||||||
MORTGAGE-BACKED SECURITIES — 3.9% | ||||||||||
FNMA — 3.9% | ||||||||||
| Federal National Mortgage Association (FNMA): | ||||||||||
| $ | 42,400 | 4.000% due 3/1/50 | $ | 45,680 | ||||||
| 1,566,000 | 3.500% due 10/1/51(h) | 1,658,002 | ||||||||
| 3,800,000 | 4.000% due 10/1/51(h) | 4,074,236 | ||||||||
|
| |||||||||
| TOTAL MORTGAGE-BACKED SECURITIES (Cost — $5,775,197) | 5,777,918 | |||||||||
|
| |||||||||
| TOTAL INVESTMENTS IN SECURITIES BEFORE SHORT-TERM INVESTMENTS (Cost — $181,127,166) | 196,542,707 | |||||||||
|
| |||||||||
SHORT-TERM INVESTMENTS — 0.6% | ||||||||||
TIME DEPOSITS — 0.6% | ||||||||||
| 4,710 | ZAR | BBH — Grand Cayman, 3.800% due 9/1/21 | 324 | |||||||
| BNP Paribas — Paris: | ||||||||||
| 3,653 | DKK | (0.470)% due 9/1/21 | 580 | |||||||
| 2,693 | NOK | (0.080)% due 9/1/21 | 310 | |||||||
| 13,674 | NZD | 0.005% due 9/1/21 | 9,636 | |||||||
| 942 | CAD | 0.010% due 9/1/21 | 747 | |||||||
| 95,994 | EUR | DNB — Oslo, (0.780)% due 9/1/21 | 113,345 | |||||||
| 441 | SGD | HSBC Bank — Singapore, 0.005% due 9/1/21 | 328 | |||||||
| 703,041 | Royal Bank of Canada — Toronto, 0.005% due 9/1/21 | 703,041 | ||||||||
| 4,894 | SEK | Skandinaviska Enskilda Banken AB — Sweden, (0.250)% due 9/1/21 | 567 | |||||||
| Societe Generale SA — Paris: | ||||||||||
| 308,720 | JPY | (0.310)% due 9/1/21 | 2,806 | |||||||
| 8,954 | AUD | (0.120)% due 9/1/21 | 6,550 | |||||||
| 16,896 | GBP | Sumitomo Mitsui Banking Corp. — Tokyo, 0.005% due 9/1/21 | 23,230 | |||||||
|
| |||||||||
| TOTAL SHORT-TERM INVESTMENTS (Cost — $861,464) | 861,464 | |||||||||
|
| |||||||||
| TOTAL INVESTMENTS IN SECURITIES (Cost — $181,988,630) | 197,404,171 | |||||||||
|
| |||||||||
| TOTAL INVESTMENTS IN PURCHASED OPTIONS (Cost — $138,581) | 191,401 | |||||||||
|
| |||||||||
| TOTAL INVESTMENTS — 133.2% (Cost — $182,127,211) | 197,595,572 | |||||||||
|
| |||||||||
| Liabilities in Excess of Other Assets — (33.2)% | (49,318,757 | ) | ||||||||
|
| |||||||||
| TOTAL NET ASSETS — 100.0% | $ | 148,276,815 | ||||||||
|
| |||||||||
| † | Amount denominated in U.S. dollars, unless otherwise noted. |
| †† | All ratings are by Standard & Poor’s Rating Service, unless otherwise noted. All ratings are unaudited. |
| (a) | Position, or portion thereof, has been segregated to collateralize reverse repurchase agreements. |
| (b) | Rating by Moody’s Investors Service. All ratings are unaudited. |
| (c) | Rating by Fitch Ratings Service. All ratings are unaudited. |
| (d) | Restricted security that may be sold to “qualified institutional buyers” pursuant to the conditions of Rule 144A under the Securities Act of 1933, as amended. This security has been deemed liquid pursuant to guidelines approved by the Board of Trustees, unless otherwise noted. The aggregate value of restricted 144A holdings at August 31, 2021, amounts to $16,226,463 and represents 10.9% of net assets. |
| (e) | Variable rate security. Interest rate disclosed is that which was in effect at August 31, 2021. |
| (f) | Inverse Floating Rate Security — interest rate fluctuates with an inverse relationship to an associated interest rate. Indicated rate is the effective rate as of August 31, 2021. |
See Notes to Financial Statements.
273
| Schedules of Investments |
| (continued) |
| Inflation-Linked Fixed Income Fund | ||||||
| (g) | Security is perpetual in nature and has no stated maturity date. |
| (h) | This security is traded on a TBA basis (see Note 1). |
| (i) | All or a portion of these securities were purchased in a sale-buyback transaction. The value of these securities total $6,316,794 which represents 4.3% of net assets. |
At August 31, 2021, for Inflation-Linked Fixed Income Fund the aggregate cost of investments, the aggregate gross unrealized appreciation and depreciation of all investments for federal income tax purposes were as follows:
| Fund | Aggregate Cost For Federal Income Tax Purposes | Gross Unrealized Appreciation | Gross Unrealized (Depreciation) | Net Unrealized Appreciation | ||||||||||||
Inflation-Linked Fixed Income Fund | $ | 184,344,219 | $ | 20,084,667 | $ | (7,218,351 | ) | $ | 12,866,316 | |||||||
Abbreviations used in this schedule: | ||
| CLO | — Collateralized Loan Obligation | |
| CPI | — Consumer Price Index | |
| EURIBOR | — Euro Interbank Offered Rate | |
| LIBOR | — London Interbank Offered Rate | |
| PLC | — Public Limited Company | |
| SOFR | — Secured Overnight Financing Rate | |
| Summary of Investments by Security Type^ | ||||
U.S. Government Agencies & Obligations | 76.7 | % | ||
Sovereign Bonds | 9.1 | |||
Collateralized Mortgage Obligations | 7.1 | |||
Corporate Bonds & Notes | 3.7 | |||
Mortgage-Backed Securities | 2.9 | |||
Purchased Options | 0.1 | |||
Short-Term Investments | 0.4 | |||
|
| |||
| 100.0% | ||||
|
| |||
| ^ | As a percentage of total investments. |
At August 31, 2021, Inflation-Linked Fixed Income Fund held the following Options Contracts Purchased:
Interest Rate Swaptions
| Number of Contracts | Notional Amount† | Security Name | Counterparty | Expiration Date | Exercise Rate | Value | ||||||||||||||||||
| 1,500,000 | 8,100EUR | OTC 30-Year Swaption, 3-Month EURIBOR, Put | BNP | 11/4/22 | 0.197 | % | $ | 159,470 | ||||||||||||||||
| 300,000 | 1,620EUR | OTC 30-Year Swaption, 3-Month EURIBOR, Put | BCLY | 11/4/22 | 0.197 | % | 31,894 | |||||||||||||||||
|
| |||||||||||||||||||||||
| Total Interest Rate Swaptions | $ | 191,364 | ||||||||||||||||||||||
|
| |||||||||||||||||||||||
| Option on Futures | ||||||||||||||||||||||||
| Number of Contracts | Notional Amount† | Security Name | Counterparty | Expiration Date | Strike Price | Value | ||||||||||||||||||
| 37 | 4,076,215 | U.S. Treasury 2-Year Note November Futures, Call | CITI | 10/22/21 | $ | 112.00 | $ | 37 | ||||||||||||||||
|
| |||||||||||||||||||||||
| TOTAL OPTIONS CONTRACTS PURCHASED (Cost — $138,581) | $ | 191,401 | ||||||||||||||||||||||
|
| |||||||||||||||||||||||
| † | Amount denominated in U.S. dollars, unless otherwise noted. |
See Notes to Financial Statements.
274
| Schedules of Investments |
| (continued) |
At August 31, 2021, Inflation-Linked Fixed Income Fund held the following Options Contracts Written:
| Credit Default Swaptions | ||||||||||||||||||||||||
| Number of Contracts | Notional Amount† | Security Name | Counterparty | Expiration Date | Exercise Rate | Value | ||||||||||||||||||
| 300,000 | $ 151,179 | OTC Markit CDX North America Investment Grade Series 36 5-Year Index, Put | BCLY | 9/15/21 | 0.800% | $ | 1 | |||||||||||||||||
| 300,000 | 151,179 | OTC Markit CDX North America Investment Grade Series 36 5-Year Index, Put | BNP | 11/17/21 | 0.750% | 122 | ||||||||||||||||||
| 2,700,000 | 1,360,611 | OTC Markit CDX North America Investment Grade Series 36 5-Year Index, Put | BNP | 12/15/21 | 0.750% | 1,852 | ||||||||||||||||||
| 600,000 | 302,358 | OTC Markit CDX North America Investment Grade Series 36 5-Year Index, Put | DUB | 12/15/21 | 0.750% | 412 | ||||||||||||||||||
| 300,000 | 151,179 | OTC Markit CDX North America Investment Grade Series 36 5-Year Index, Put | DUB | 9/15/21 | 0.800% | 1 | ||||||||||||||||||
| 800,000 | 403,144 | OTC Markit CDX North America Investment Grade Series 36 5-Year Index, Put | DUB | 9/15/21 | 0.900% | — | ||||||||||||||||||
| 100,000 | 50,393 | OTC Markit CDX North America Investment Grade Series 36 5-Year Index, Put | DUB | 11/17/21 | 101.000% | 158 | ||||||||||||||||||
| 100,000 | 109,724 | OTC Markit CDX North America High Yield Series 36 5-Year Index, Put | DUB | 1/19/22 | 102.000% | 525 | ||||||||||||||||||
| 1,000,000 | 503,400 | EUR | OTC Markit iTraxx Europe Series 35 5-Year Index, Put | BCLY | 12/15/21 | 0.700% | 785 | |||||||||||||||||
| 200,000 | 100,680 | EUR | OTC Markit iTraxx Europe Series 35 5-Year Index, Put | BCLY | 10/20/21 | 0.850% | 39 | |||||||||||||||||
| 100,000 | 50,340 | EUR | OTC Markit iTraxx Europe Series 35 5-Year Index, Put | BCLY | 12/15/21 | 3.500% | 462 | |||||||||||||||||
| 800,000 | 402,720 | EUR | OTC Markit iTraxx Europe Series 35 5-Year Index, Put | DUB | 9/15/21 | 0.800% | 10 | |||||||||||||||||
| 200,000 | 100,680 | EUR | OTC Markit iTraxx Europe Series 35 5-Year Index, Put | JPM | 12/15/21 | 0.700% | 157 | |||||||||||||||||
|
| |||||||||||||||||||||||
| Total Credit Default Swaptions | $ | 4,524 | ||||||||||||||||||||||
|
| |||||||||||||||||||||||
| Interest Rate Swaptions | ||||||||||||||||||||||||
| Number of Contracts | Notional Amount† | Security Name | Counterparty | Expiration Date | Exercise Rate | Value | ||||||||||||||||||
| 4,440,000 | 23,976EUR | OTC 10-Year Swaption, 3-Month EURIBOR, Put | BNP | 11/4/22 | 0.000% | $ | 133,415 | |||||||||||||||||
| 860,000 | 4,644EUR | OTC 10-Year Swaption, 3-Month EURIBOR, Put | BCLY | 11/4/22 | 0.000% | 25,842 | ||||||||||||||||||
|
| |||||||||||||||||||||||
| Total Interest Rate Swaptions | $ | 159,257 | ||||||||||||||||||||||
|
| |||||||||||||||||||||||
| Options on Futures | ||||||||||||||||||||||||
| Number of Contracts | Notional Amount† | Security Name | Counterparty | Expiration Date | Strike Price | Value | ||||||||||||||||||
| 20 | 2,718,800 | EUR | Euro-Bobl October Futures, Call | MLP | 9/24/21 | EUR 136.25 | $ | 945 | ||||||||||||||||
| 100,000 | $ 10,151,000 | OTC Federal National Mortgage Association (FNMA) 30-Year November Futures, Call | JPM | 11/3/21 | $ 101.51 | 440 | ||||||||||||||||||
| 100,000 | 10,377,000 | OTC Federal National Mortgage Association (FNMA) 30-Year October Futures, Call | JPM | 10/7/21 | $ 103.77 | 291 | ||||||||||||||||||
| 100,000 | 10,432,000 | OTC Federal National Mortgage Association (FNMA) 30-Year October Futures, Call | JPM | 10/7/21 | $ 104.32 | 73 | ||||||||||||||||||
| 300,000 | 30,648,000 | OTC Federal National Mortgage Association (FNMA) 30-Year September Futures, Put | JPM | 9/7/21 | $ 102.16 | 2 | ||||||||||||||||||
| 100,000 | 10,243,000 | OTC Government National Mortgage Association II (GNMA) 30-Year October Futures, Put | JPM | 10/14/21 | $ 102.43 | 115 | ||||||||||||||||||
|
| |||||||||||||||||||||||
| Total Options on Futures | $ | 1,866 | ||||||||||||||||||||||
|
| |||||||||||||||||||||||
| TOTAL OPTIONS CONTRACTS WRITTEN (Premiums received — $147,887) | $ | 165,647 | ||||||||||||||||||||||
|
| |||||||||||||||||||||||
| † | Amount denominated in U.S. dollars, unless otherwise noted. |
See Notes to Financial Statements.
275
| Schedules of Investments |
| (continued) |
| Inflation-Linked Fixed Income Fund | ||||||
At August 31, 2021, Inflation-Linked Fixed Income Fund held the following Reverse Repurchase Agreements:
| Face Amounts† | Security | Value | ||||||
| NatWest Markets Securities Inc.: | ||||||||
| $ | 3,922,750 | 0.080% due 9/7/21 | $ | 3,922,750 | ||||
| Nomura Securities International, Inc.: | ||||||||
| 34,029,546 | 0.070% due 9/2/21 | 34,029,546 | ||||||
|
| |||||||
| TOTAL REVERSE REPURCHASE AGREEMENTS (Proceeds — $37,952,296) | $ | 37,952,296 | ||||||
|
| |||||||
For the year ended August 31, 2021, the daily average borrowing and interest rate under the reverse repurchase agreements were $47,249,629 and 0.110%, respectively.
| † | Amount denominated in U.S. dollars, unless otherwise noted. |
At August 31, 2021, Inflation-Linked Fixed Income Fund had open exchange-traded futures contracts as described below.
The unrealized appreciation (depreciation) on the open contracts reflected in the accompanying financial statements were as follows:
| Open Futures Contracts | Number of Contracts | Expiration Date (Month/Year) | Notional Amount | Market Value | Unrealized Appreciation/ (Depreciation) | |||||||||||||||
| Contracts to Buy: | ||||||||||||||||||||
Euro-Bund September Futures | 25 | 9/21 | $ | 5,049,312 | $ | 5,179,065 | $ | 129,753 | ||||||||||||
U.S. Treasury 2-Year Note December Futures | 2 | 12/21 | 440,641 | 440,657 | 16 | |||||||||||||||
U.S. Treasury 5-Year Note December Futures | 149 | 12/21 | 18,394,594 | 18,434,094 | 39,500 | |||||||||||||||
|
| |||||||||||||||||||
| 169,269 | ||||||||||||||||||||
|
| |||||||||||||||||||
| Contracts to Sell: | ||||||||||||||||||||
Australian Government 3-Year Bond September Futures | 8 | 9/21 | 683,450 | 685,561 | (2,111 | ) | ||||||||||||||
Euro-Bobl September Futures | 31 | 9/21 | 4,952,786 | 4,940,341 | 12,445 | |||||||||||||||
Euro-BTP September Futures | 13 | 9/21 | 2,307,918 | 2,352,964 | (45,046 | ) | ||||||||||||||
Euro-Buxl 30-Year Bond September Futures | 17 | 9/21 | 4,007,725 | 4,265,861 | (258,136 | ) | ||||||||||||||
Euro-Schatz Note September Futures | 194 | 9/21 | 25,687,405 | 25,719,474 | (32,069 | ) | ||||||||||||||
Japan Government 10-Year Bond September Futures | 3 | 9/21 | 4,130,891 | 4,149,252 | (18,361 | ) | ||||||||||||||
U.S. Treasury 10-Year Note December Futures | 10 | 12/21 | 1,335,037 | 1,334,531 | 506 | |||||||||||||||
U.S. Treasury Long Bond December Futures | 8 | 12/21 | 1,313,658 | 1,303,750 | 9,908 | |||||||||||||||
U.S. Treasury Ultra Long Bond December Futures | 15 | 12/21 | 2,970,275 | 2,959,219 | 11,056 | |||||||||||||||
U.S. Ultra Long Bond December Futures | 48 | 12/21 | 7,132,841 | 7,104,749 | 28,092 | |||||||||||||||
|
| |||||||||||||||||||
| (293,716 | ) | |||||||||||||||||||
|
| |||||||||||||||||||
Net Unrealized Depreciation on Open Exchange–Traded Futures Contracts | $ | (124,447 | ) | |||||||||||||||||
|
| |||||||||||||||||||
At August 31, 2021, Inflation-Linked Fixed Income Fund had deposited cash of $399,000 with a broker or brokers as margin collateral on an open exchange-traded futures contracts.
See Notes to Financial Statements.
276
| Schedules of Investments |
| (continued) |
| Inflation-Linked Fixed Income Fund | ||||||
At August 31, 2021, Inflation-Linked Fixed Income Fund had open forward foreign currency contracts as described below.
The unrealized appreciation (depreciation) on the open contracts reflected in the accompanying financial statements were as follows:
| Foreign Currency | Local Currency | In Exchange For | Counterparty | Market Value | Settlement Date | Unrealized Appreciation/ (Depreciation) | ||||||||||||||||||||||
| Contracts to Buy: | ||||||||||||||||||||||||||||
Chinese Offshore Renminbi | 2,540,000 | USD | 395,231 | HSBC | $ | 393,098 | 9/15/21 | $ | (2,133 | ) | ||||||||||||||||||
Indonesian Rupiah | 5,694,225,000 | USD | 395,076 | MLP | 398,661 | 9/15/21 | 3,585 | |||||||||||||||||||||
Norwegian Krone | 3,370,000 | USD | 381,344 | JPM | 387,558 | 11/17/21 | 6,214 | |||||||||||||||||||||
Swedish Krona | 3,300,000 | USD | 381,393 | BNP | 382,570 | 11/17/21 | 1,177 | |||||||||||||||||||||
|
| |||||||||||||||||||||||||||
| 8,843 | ||||||||||||||||||||||||||||
|
| |||||||||||||||||||||||||||
| Contracts to Sell: | ||||||||||||||||||||||||||||
Australian Dollar | 1,187,000 | USD | 873,557 | JPM | 868,349 | 9/2/21 | 5,208 | |||||||||||||||||||||
British Pound | 24,000 | USD | 33,328 | BCLY | 32,996 | 9/2/21 | 332 | |||||||||||||||||||||
British Pound | 31,000 | USD | 43,169 | JPM | 42,621 | 9/2/21 | 548 | |||||||||||||||||||||
British Pound | 32,000 | USD | 44,719 | MLP | 43,996 | 9/2/21 | 723 | |||||||||||||||||||||
British Pound | 877,000 | USD | 1,219,694 | MLP | 1,205,744 | 9/2/21 | 13,950 | |||||||||||||||||||||
British Pound | 2,867,000 | USD | 3,947,450 | MLP | 3,942,042 | 10/4/21 | 5,408 | |||||||||||||||||||||
Canadian Dollar | 183,000 | USD | 146,821 | JPM | 145,072 | 9/2/21 | 1,749 | |||||||||||||||||||||
Danish Krone | 850,000 | USD | 135,980 | BNP | 135,023 | 10/1/21 | 957 | |||||||||||||||||||||
Danish Krone | 32,590,582 | USD | 5,240,431 | JPM | 5,177,045 | 10/1/21 | 63,386 | |||||||||||||||||||||
Euro | 8,300,000 | USD | 9,847,785 | SCB | 9,800,229 | 9/2/21 | 47,556 | |||||||||||||||||||||
Euro | 8,300,000 | USD | 9,803,902 | SCB | 9,806,794 | 10/4/21 | (2,892 | ) | ||||||||||||||||||||
Japanese Yen | 352,273,931 | USD | 3,210,440 | SCB | 3,202,054 | 9/2/21 | 8,386 | |||||||||||||||||||||
Japanese Yen | 352,273,931 | USD | 3,207,417 | SCB | 3,202,982 | 10/4/21 | 4,435 | |||||||||||||||||||||
New Zealand Dollar | 338,000 | USD | 235,752 | JPM | 238,189 | 9/2/21 | (2,437 | ) | ||||||||||||||||||||
Peruvian Sol | 1,887,374 | USD | 474,560 | SCB | 461,417 | 9/22/21 | 13,143 | |||||||||||||||||||||
|
| |||||||||||||||||||||||||||
| 160,452 | ||||||||||||||||||||||||||||
|
| |||||||||||||||||||||||||||
Net Unrealized Appreciation on Open Forward Foreign Currency Contracts | $ | 169,295 | ||||||||||||||||||||||||||
|
| |||||||||||||||||||||||||||
At August 31, 2021, Inflation-Linked Fixed Income Fund held the following Centrally Cleared Interest Rate Swap Contracts:
| Pay/Receive Floating Rate | Floating Rate Index | Fixed Rate | Maturity Date | Payment Frequency | Notional Amount | Market Value | Upfront Payment (Received) | Unrealized Depreciation | ||||||||||||||||||||||||||
| Receive | 3-Month FRA New Zealand Bank Bill | 3.250% | 3/21/28 | 6-Month | NZD | 700,000 | $ | (52,682 | ) | $ | (103,179 | ) | $ | 50,497 | ||||||||||||||||||||
| Receive | 6-Month JPY-LIBOR | 0.300% | 9/20/27 | 6-Month | JPY | 5,590,000 | (1,050 | ) | (1,230 | ) | 180 | |||||||||||||||||||||||
|
|
|
|
|
| |||||||||||||||||||||||||||||
| $ | (53,732 | ) | $ | (104,409 | ) | $ | 50,677 | |||||||||||||||||||||||||||
|
|
|
|
|
| |||||||||||||||||||||||||||||
See Notes to Financial Statements.
277
| Schedules of Investments |
| (continued) |
| Inflation-Linked Fixed Income Fund | ||||||
At August 31, 2021, Inflation-Linked Fixed Income Fund held the following Centrally Cleared Inflation Rate Swap Contracts:
| Pay/ Receive Floating Rate | Floating Rate Index | Fixed Rate | Maturity Date | Notional Amount | Market Value | Upfront Premiums Paid/ (Received) | Unrealized Appreciation/ (Depreciation) | |||||||||||||||||||||||
| Receive | 2-Year EUR Inflation Linked | 0.330% | 7/15/22 | EUR | 600,000 | $ | 23,377 | $ | 2,849 | $ | 20,528 | |||||||||||||||||||
| Receive | 2-Year EUR Inflation Linked | 0.090% | 5/15/22 | EUR | 100,000 | 3,862 | 423 | 3,439 | ||||||||||||||||||||||
| Receive | 5-Year EUR Inflation Linked | 1.030% | 3/15/24 | EUR | 2,000,000 | 5,030 | (75,970 | ) | 81,000 | |||||||||||||||||||||
| Pay | 10-Year EUR Inflation Linked | 1.380% | 3/15/31 | EUR | 1,300,000 | (73,450 | ) | (9,569 | ) | (63,881 | ) | |||||||||||||||||||
| Pay | 10-Year EUR Inflation Linked | 1.620% | 5/15/28 | EUR | 910,000 | 12,889 | 93,051 | (80,162 | ) | |||||||||||||||||||||
| Receive | 15-Year EUR Inflation Linked | 1.710% | 3/15/33 | EUR | 100,000 | (2,865 | ) | (15,114 | ) | 12,249 | ||||||||||||||||||||
| Pay | 5-Year GBP Inflation Linked | 3.330% | 1/15/25 | GBP | 4,000,000 | (55,969 | ) | 41,097 | (97,066 | ) | ||||||||||||||||||||
| Pay | 5-Year GBP Inflation Linked | 3.850% | 9/15/24 | GBP | 1,300,000 | 48,626 | 76,362 | (27,736 | ) | |||||||||||||||||||||
| Pay | 10-Year GBP Inflation Linked | 3.470% | 8/15/30 | GBP | 900,000 | (66,728 | ) | 9,395 | (76,123 | ) | ||||||||||||||||||||
| Pay | 10-Year GBP Inflation Linked | 3.710% | 12/15/28 | GBP | 920,000 | 33,074 | 69,593 | (36,519 | ) | |||||||||||||||||||||
| Pay | 10-Year GBP Inflation Linked | 3.750% | 4/15/31 | GBP | 520,000 | (20,661 | ) | (4 | ) | (20,657 | ) | |||||||||||||||||||
| Pay | 15-Year GBP Inflation Linked | 3.566% | 3/15/36 | GBP | 100,000 | (7,104 | ) | — | (7,104 | ) | ||||||||||||||||||||
| Pay | 15-Year GBP Inflation Linked | 3.580% | 3/15/36 | GBP | 300,000 | (20,032 | ) | (2,006 | ) | (18,026 | ) | |||||||||||||||||||
| Pay | 1-Year USD Inflation Linked | 2.155% | 1/19/22 | USD | 400,000 | (13,824 | ) | — | (13,824 | ) | ||||||||||||||||||||
| Pay | 1-Year USD Inflation Linked | 2.155% | 2/4/22 | USD | 1,800,000 | (62,084 | ) | — | (62,084 | ) | ||||||||||||||||||||
| Pay | 1-Year USD Inflation Linked | 2.170% | 2/1/22 | USD | 1,100,000 | (37,931 | ) | — | (37,931 | ) | ||||||||||||||||||||
| Pay | 1-Year USD Inflation Linked | 2.180% | 1/19/22 | USD | 1,300,000 | (44,604 | ) | (20 | ) | (44,584 | ) | |||||||||||||||||||
| Pay | 1-Year USD Inflation Linked | 2.200% | 2/5/22 | USD | 400,000 | (13,540 | ) | — | (13,540 | ) | ||||||||||||||||||||
| Pay | 1-Year USD Inflation Linked | 2.200% | 1/21/22 | USD | 600,000 | (20,473 | ) | — | (20,473 | ) | ||||||||||||||||||||
| Receive | 5-Year USD Inflation Linked | 2.210% | 2/5/23 | USD | 2,090,000 | 54,224 | (62,311 | ) | 116,535 | |||||||||||||||||||||
| Receive | 5-Year USD Inflation Linked | 2.220% | 4/13/23 | USD | 6,296,000 | 152,163 | (214,466 | ) | 366,629 | |||||||||||||||||||||
| Receive | 5-Year USD Inflation Linked | 2.703% | 5/25/26 | USD | 510,000 | 9,291 | 80 | 9,211 | ||||||||||||||||||||||
| Receive | 5-Year USD Inflation Linked | 2.767% | 5/13/26 | USD | 500,000 | 7,813 | — | 7,813 | ||||||||||||||||||||||
| Receive | 5-Year USD Inflation Linked | 2.813% | 5/14/26 | USD | 300,000 | 3,925 | — | 3,925 | ||||||||||||||||||||||
| Receive | 7-Year USD Inflation Linked | 1.797% | 8/25/27 | USD | 600,000 | 57,273 | 5,868 | 51,405 | ||||||||||||||||||||||
| Receive | 7-Year USD Inflation Linked | 1.890% | 8/27/27 | USD | 700,000 | 61,802 | 1,693 | 60,109 | ||||||||||||||||||||||
| Receive | 7-Year USD Inflation Linked | 2.573% | 8/26/28 | USD | 100,000 | 357 | — | 357 | ||||||||||||||||||||||
| Pay | 10-Year USD Inflation Linked | 1.280% | 5/19/30 | USD | 800,000 | (124,915 | ) | (50,027 | ) | (74,888 | ) | |||||||||||||||||||
| Pay | 10-Year USD Inflation Linked | 1.760% | 11/4/29 | USD | 1,200,000 | (122,084 | ) | (8,764 | ) | (113,320 | ) | |||||||||||||||||||
| Pay | 10-Year USD Inflation Linked | 1.882% | 11/20/29 | USD | 1,500,000 | (133,335 | ) | 9,233 | (142,568 | ) | ||||||||||||||||||||
| Receive | 10-Year USD Inflation Linked | 2.311% | 2/24/31 | USD | 2,300,000 | 115,976 | 1,035 | 114,941 | ||||||||||||||||||||||
| Pay | 10-Year USD Inflation Linked | 2.335% | 2/5/28 | USD | 960,000 | (29,719 | ) | 59,292 | (89,011 | ) | ||||||||||||||||||||
| Pay | 10-Year USD Inflation Linked | 2.353% | 5/9/28 | USD | 360,000 | (9,795 | ) | 24,122 | (33,917 | ) | ||||||||||||||||||||
| Pay | 10-Year USD Inflation Linked | 2.360% | 5/9/28 | USD | 540,000 | (14,221 | ) | 36,670 | (50,891 | ) | ||||||||||||||||||||
| Pay | 10-Year USD Inflation Linked | 2.364% | 5/10/28 | USD | 550,000 | (14,276 | ) | 37,569 | (51,845 | ) | ||||||||||||||||||||
|
|
|
|
|
| |||||||||||||||||||||||||
| $ | (297,928 | ) | $ | 30,081 | $ | (328,009 | ) | |||||||||||||||||||||||
|
|
|
|
|
| |||||||||||||||||||||||||
Centrally Cleared — Credit Default Swaps on Corporate Issues — Sell Protection (1)
| Reference Obligation | Fixed Deal Receive Rate | Maturity Date | Payment Frequency | Implied Credit Spread at 8/31/21 (2) | Notional Amount (3) | Market Value | Upfront Payment (Received) | Unrealized Appreciation | ||||||||||||||||||||||||||||
General Electric Co., BBH+ | 1.000 | % | 12/20/23 | 3-Month | 0.004 | % | USD | 100,000 | $ | 1,619 | $ | (176 | ) | $ | 1,795 | |||||||||||||||||||||
|
|
|
|
|
| |||||||||||||||||||||||||||||||
| (1) | If the Fund is a seller of protection and a credit event occurs, as defined under the terms of that particular swap agreement, the Fund will either (i) pay to the buyer of protection an amount equal to the notional amount of the swap and take delivery of the referenced obligation or underlying securities comprising the referenced index or (ii) pay a net settlement amount in the form of cash or securities equal to the notional amount of the swap less the recovery value of the referenced obligation or underlying securities comprising the referenced index. |
See Notes to Financial Statements.
278
| Schedules of Investments |
| (continued) |
| Inflation-Linked Fixed Income Fund | ||||||
| (2) | Implied credit spreads, represented in absolute terms, utilized in determining the market value of credit default swap agreements on corporate issues or sovereign issues of an emerging country as of period end serve as an indicator of the current status of the payment/performance risk and represent the likelihood or risk of default for the credit derivative. The implied credit spread of a particular referenced entity reflects the cost of buying/selling protection and may include upfront payments required to be made to enter into the agreement. Wider credit spreads represent a deterioration of the referenced entity’s credit soundness and a greater likelihood or risk of default or other credit event occurring as defined under the terms of the agreement. A credit spread identified as ‘‘Defaulted’’ indicates a credit event has occurred for the referenced entity or obligation. |
| (3) | The maximum potential amount the Fund could be required to make as a seller of credit protection or receive as a buyer of credit protection if a credit event occurs as defined under the terms of that particular swap agreement. |
At August 31, 2021, Inflation-Linked Fixed Income Fund deposited cash collateral with brokers in the amount of $457,000 for open centrally cleared swap contracts.
At August 31, 2021, Inflation-Linked Fixed Income Fund had cash collateral from brokers in the amount of $120,000 for open OTC swap contracts.
Currency Abbreviations used in this schedule: | Counterparty Abbreviations used in this schedule: | |||||
| AUD | — Australian Dollar | BCLY | — Barclays Bank PLC | |||
| CAD | — Canadian Dollar | BNP | — BNP Paribas SA | |||
| DKK | — Danish Krone | CITI | — Citigroup Global Markets Inc. | |||
| EUR | — Euro | DUB | — Deutsche Bank AG | |||
| GBP | — British Pound | HSBC | — HSBC Bank USA | |||
| JPY | — Japanese Yen | JPM | — JPMorgan Chase & Co. | |||
| NOK | — Norwegian Krone | MLP | — Merrill Lynch, Pierce, Fenner & Smith Inc. | |||
| NZD | — New Zealand Dollar | SCB | — Standard Chartered Bank | |||
| PEN | — Peruvian Sol | |||||
| SEK | — Swedish Krona | |||||
| SGD | — Singapore Dollar | |||||
| USD | — United States Dollar | |||||
| ZAR | — South African Rand | |||||
See pages 296-297 for definitions of ratings.
At August 31, 2021, Inflation-Linked Fixed Income Fund was involved in following sale-buyback transaction:
| Counterparty | Borrowing date | Maturity date | Borrowing rate | Amount borrowed | ||||||||||||
BofA Securities, Inc. | 8/26/2021 | 9/2/2021 | 0.03 | % | 6,310,170 | |||||||||||
|
| |||||||||||||||
| $ | 6,310,170 | |||||||||||||||
|
| |||||||||||||||
See Notes to Financial Statements.
279
| Schedules of Investments |
| (continued) |
| Ultra-Short Term Fixed Income Fund | ||||||||||
| Face Amount/Units† | Rating†† | Security | Value | |||||||
CORPORATE BONDS & NOTES — 37.9% | ||||||||||
Aerospace/Defense — 1.2% | ||||||||||
| Boeing Co. (The), Senior Unsecured Notes: | ||||||||||
| $ | 1,700,000 | BBB- | 4.508% due 5/1/23 | $ | 1,801,687 | |||||
| 100,000 | BBB- | 1.875% due 6/15/23 | 101,653 | |||||||
| 3,600,000 | BBB- | 1.433% due 2/4/24 | 3,608,605 | |||||||
|
| |||||||||
| Total Aerospace/Defense | 5,511,945 | |||||||||
|
| |||||||||
Agriculture — 1.1% | ||||||||||
| 1,200,000 | BBB+ | BAT Capital Corp., Company Guaranteed Notes, 3.222% due 8/15/24 | 1,273,723 | |||||||
| 2,700,000 | BBB | Imperial Brands Finance PLC, Company Guaranteed Notes, 3.750% due 7/21/22(a) | 2,757,791 | |||||||
| 600,000 | BBB+ | Reynolds American Inc., Company Guaranteed Notes, 4.450% due 6/12/25 | 665,456 | |||||||
|
| |||||||||
| Total Agriculture | 4,696,970 | |||||||||
|
| |||||||||
Airlines — 0.0% | ||||||||||
| 81,259 | BBB+ | Northwest Airlines Inc. Class G-2 Pass-Through Trust, Pass-Thru Certificates, 6.264% due 11/20/21 | 81,065 | |||||||
|
| |||||||||
Auto Manufacturers — 5.3% | ||||||||||
| Ford Motor Credit Co. LLC, Senior Unsecured Notes: | ||||||||||
| 300,000 | BB+ | 3.278% (3-Month USD-LIBOR + 3.140%) due 1/7/22(b) | 302,011 | |||||||
| 800,000 | BB+ | 5.596% due 1/7/22 | 811,480 | |||||||
| 500,000 | BB+ | 3.219% due 1/9/22 | 503,750 | |||||||
| 500,000 | BB+ | 2.979% due 8/3/22 | 507,975 | |||||||
| 900,000 | BB+ | 3.350% due 11/1/22 | 920,925 | |||||||
| 200,000 | BBB | General Motors Co., Senior Unsecured Notes, 1.028% (3-Month USD-LIBOR + 0.900%) due 9/10/21(b) | 200,033 | |||||||
| General Motors Financial Co., Inc.: | ||||||||||
Company Guaranteed Notes: | ||||||||||
| 500,000 | BBB | 1.683% (3-Month USD-LIBOR + 1.550%) due 1/14/22(b) | 502,511 | |||||||
| 1,500,000 | BBB | 1.457% (3-Month USD-LIBOR + 1.310%) due 6/30/22(b) | 1,512,750 | |||||||
| 2,400,000 | BBB | Senior Unsecured Notes, 1.222% (3-Month USD-LIBOR + 1.100%) due 11/6/21(b) | 2,404,521 | |||||||
| 700,000 | BBB- | Harley-Davidson Financial Services Inc., Company Guaranteed Notes, 4.050% due 2/4/22(a) | 710,748 | |||||||
| Hyundai Capital America, Senior Unsecured Notes: | ||||||||||
| 1,500,000 | BBB+ | 0.800% due 4/3/23(a) | 1,502,000 | |||||||
| 1,200,000 | BBB+ | 5.750% due 4/6/23 | 1,294,416 | |||||||
| 1,000,000 | BBB+ | 5.750% due 4/6/23(a) | 1,078,680 | |||||||
| 1,500,000 | BBB+ | 1.250% due 9/18/23(a) | 1,514,327 | |||||||
| Nissan Motor Acceptance Corp., Senior Unsecured Notes: | ||||||||||
| 200,000 | BBB- | 0.765% (3-Month USD-LIBOR + 0.630%) due 9/21/21(a)(b) | 200,036 | |||||||
| 500,000 | BBB- | 1.019% (3-Month USD-LIBOR + 0.890%) due 1/13/22(a)(b) | 500,879 | |||||||
| 1,630,000 | BBB- | 2.650% due 7/13/22 | 1,642,190 | |||||||
| 2,400,000 | BBB- | 0.836% (3-Month USD-LIBOR + 0.690%) due 9/28/22(a)(b) | 2,405,794 | |||||||
| 1,000,000 | BBB- | 3.875% due 9/21/23(a) | 1,058,094 | |||||||
| 710,000 | AUD | BBB+ | Volkswagen Financial Services Australia Pty Ltd., Company Guaranteed Notes, 1.324% (3-Month Australian Bank Bill + 1.300%) due 9/14/22(b) | 523,415 | ||||||
| 4,000,000 | CAD | BBB+ | VW Credit Canada Inc., (Restricted, cost — $3,234,910, acquired 3/5/21), Company Guaranteed Notes, 2.650% due 6/27/22(c) | 3,223,700 | ||||||
|
| |||||||||
| Total Auto Manufacturers | 23,320,235 | |||||||||
|
| |||||||||
Banks — 15.4% | ||||||||||
| 700,000 | BBB+ | Aozora Bank Ltd., Senior Unsecured Notes, 2.550% due 9/9/22 | 712,916 | |||||||
| 400,000 | AUD | A- | Banco Santander SA, Senior Unsecured Notes, 1.675% (3-Month Australian Bank Bill + 1.650%) due 1/19/23(b) | 296,884 | ||||||
| 800,000 | A- | Banco Santander Chile, Senior Unsecured Notes, 1.321% (3-Month USD-LIBOR + 1.200%) due 11/28/21(b) | 801,389 | |||||||
See Notes to Financial Statements.
280
| Schedules of Investments |
| (continued) |
| Ultra-Short Term Fixed Income Fund | ||||||||||
| Face Amount/Units† | Rating†† | Security | Value | |||||||
Banks — 15.4% — (continued) | ||||||||||
| 3,500,000 | CAD | A- | Bank of America Corp., (Restricted, cost — $2,709,688, acquired 10/5/20), Senior Unsecured Notes, 2.604% (3-Month Canadian Bank Bill + 1.125%) due 3/15/23(b)(c) | $ | 2,806,529 | |||||
| Barclays PLC, Senior Unsecured Notes: | ||||||||||
| $ | 300,000 | BBB | 1.555% (3-Month USD-LIBOR + 1.430%) due 2/15/23(b) | 301,708 | ||||||
| 1,250,000 | AUD | BBB | 1.824% (3-Month Australian Bank Bill + 1.800%) due 6/15/23(b) | 936,233 | ||||||
| 500,000 | BBB | 1.505% (3-Month USD-LIBOR + 1.380%) due 5/16/24(b) | 508,844 | |||||||
| 2,004,000 | BB+ | CIT Group Inc., Senior Unsecured Notes, 5.000% due 8/15/22 | 2,086,064 | |||||||
| Citigroup Inc., Senior Unsecured Notes: | ||||||||||
| 1,500,000 | BBB+ | 1.075% (3-Month USD-LIBOR + 0.950%) due 7/24/23(b) | 1,510,066 | |||||||
| 2,100,000 | BBB+ | 1.550% (3-Month USD-LIBOR + 1.430%) due 9/1/23(b) | 2,125,480 | |||||||
| 500,000 | BBB+ | 1.224% (3-Month USD-LIBOR + 1.100%) due 5/17/24(b) | 507,611 | |||||||
| 300,000 | BBB+ | 1.143% (3-Month USD-LIBOR + 1.023%) due 6/1/24(b) | 304,076 | |||||||
| 1,000,000 | A- | Credit Agricole SA, Senior Unsecured Notes, 1.185% (3-Month USD-LIBOR + 1.050%) due 3/22/24(b) | 1,012,371 | |||||||
| Credit Suisse Group AG, Senior Unsecured Notes: | ||||||||||
| 1,750,000 | BBB+ | 1.359% (3-Month USD-LIBOR + 1.240%) due 6/12/24(b) | 1,773,165 | |||||||
| 2,000,000 | BBB+ | 1.359% (3-Month USD-LIBOR + 1.240%) due 6/12/24(a)(b) | 2,026,474 | |||||||
| Danske Bank AS, Senior Unsecured Notes: | ||||||||||
| 500,000 | BBB+ | 1.179% (3-Month USD-LIBOR + 1.060%) due 9/12/23(b) | 505,629 | |||||||
| 1,000,000 | BBB+ | 3.875% due 9/12/23(a) | 1,061,313 | |||||||
| 3,431,000 | BBB+ | 1.171% (1-Year CMT Index + 1.030%) due 12/8/23(a)(b) | 3,449,425 | |||||||
| Deutsche Bank AG, Senior Unsecured Notes: | ||||||||||
| 500,000 | BBB- | 4.250% due 10/14/21 | 502,235 | |||||||
| 500,000 | AUD | BBB- | 1.421% (3-Month Australian Bank Bill + 1.400%) due 1/30/23(b) | 369,413 | ||||||
| 400,000 | BBB- | 1.354% (3-Month USD-LIBOR + 1.230%) due 2/27/23(b) | 404,250 | |||||||
| 300,000 | BBB+ | Deutsche Bank AG, (Restricted, cost — $300,399, acquired 5/26/21), Senior Unsecured Notes, 0.898% due 5/28/24(c) | 300,214 | |||||||
| 1,500,000 | AA- | First Abu Dhabi Bank PJSC, Senior Unsecured Notes, 1.076% (3-Month USD-LIBOR + 0.950%) due 4/16/22(b) | 1,505,625 | |||||||
| Goldman Sachs Group Inc. (The), Senior Unsecured Notes: | ||||||||||
| 1,000,000 | BBB+ | 2.876% (3-Month USD-LIBOR + 0.821%) due 10/31/22(b) | 1,004,047 | |||||||
| 700,000 | BBB+ | 0.474% (SOFR + 0.430%) due 3/8/23(b) | 700,356 | |||||||
| 1,000,000 | AUD | BBB+ | Goldman Sachs Group Inc. (The), Senior Unsecured Notes, 1.569% (3-Month Australian Bank Bill + 1.550%) due 5/2/24(b) | 751,608 | ||||||
| Hana Bank, Senior Unsecured Notes: | ||||||||||
| 1,000,000 | A+ | 3.375% due 1/30/22 | 1,012,335 | |||||||
| 400,000 | A+ | 0.994% (3-Month USD-LIBOR + 0.875%) due 9/14/22(b) | 402,492 | |||||||
| 5,900,000 | A- | HSBC Holdings PLC, Senior Unsecured Notes, 1.355% (3-Month USD-LIBOR + 1.230%) due 3/11/25(b) | 6,029,344 | |||||||
| 900,000 | A- | ING Groep NV, Senior Unsecured Notes, 1.060% (SOFR + 1.010%) due 4/1/27(b) | 911,788 | |||||||
| 3,900,000 | A- | JPMorgan Chase & Co., Senior Unsecured Notes, 1.028% (3-Month USD-LIBOR + 0.890%) due 7/23/24(b) | 3,954,629 | |||||||
| 1,500,000 | AUD | BBB+ | Lloyds Banking Group PLC, Senior Unsecured Notes, 1.328% (3-Month Australian Bank Bill + 1.300%) due 3/20/23(b) | 1,113,440 | ||||||
| Mizuho Financial Group Inc., Senior Unsecured Notes: | ||||||||||
| 2,900,000 | A- | 0.969% (3-Month USD-LIBOR + 0.850%) due 9/13/23(b) | 2,918,206 | |||||||
| 1,500,000 | A- | 0.759% (3-Month USD-LIBOR + 0.630%) due 5/25/24(b) | 1,508,821 | |||||||
| 300,000 | BBB | Natwest Group PLC, Senior Unsecured Notes, 1.697% (3-Month USD-LIBOR + 1.550%) due 6/25/24(b) | 306,669 | |||||||
| 1,200,000 | A | Nordea Bank Abp, Senior Unsecured Notes, 1.061% (3-Month USD-LIBOR + 0.940%) due 8/30/23(a)(b) | 1,216,436 | |||||||
| QNB Finance Ltd., Company Guaranteed Notes: | ||||||||||
| 1,000,000 | A | 1.126% (3-Month USD-LIBOR + 1.000%) due 5/2/22(b) | 1,005,000 | |||||||
| 500,000 | AUD | A | 1.769% (3-Month Australian Bank Bill + 1.750%) due 2/1/23(b) | 370,973 | ||||||
See Notes to Financial Statements.
281
| Schedules of Investments |
| (continued) |
| Ultra-Short Term Fixed Income Fund | ||||||||||
| Face Amount/Units† | Rating†† | Security | Value | |||||||
Banks — 15.4% — (continued) | ||||||||||
| $ | 800,000 | Aa3(d) | QNB Finance Ltd., (Restricted, cost — $808,304, acquired 6/20/19), Senior Unsecured Notes, 1.451% (3-Month USD-LIBOR + 1.320%) due 12/6/21(b)(c) | $ | 800,359 | |||||
| 2,000,000 | BBB+ | Santander Holdings USA Inc., Senior Unsecured Notes, 4.450% due 12/3/21 | 2,013,564 | |||||||
| Standard Chartered PLC, Senior Unsecured Notes: | ||||||||||
| 600,000 | BBB+ | 1.284% (3-Month USD-LIBOR + 1.150%) due 1/20/23(a)(b) | 602,390 | |||||||
| 1,700,000 | BBB+ | 3.785% (3-Month USD-LIBOR + 1.560%) due 5/21/25(a)(b) | 1,820,602 | |||||||
| 1,000,000 | BBB- | State Bank of India, Senior Unsecured Notes, 4.000% due 1/24/22(a) | 1,013,170 | |||||||
| 5,200,000 | AUD | A- | Sumitomo Mitsui Financial Group Inc., Senior Unsecured Notes, 1.274% (3-Month Australian Bank Bill + 1.250%) due 10/16/24(b) | 3,902,173 | ||||||
| 5,100,000 | AUD | A+ | UBS AG, Senior Unsecured Notes, 0.891% (3-Month Australian Bank Bill + 0.870%) due 7/30/25(b) | 3,798,263 | ||||||
| 200,000 | CAD | BBB+ | Wells Fargo & Co., (Restricted, cost — $153,473, acquired 10/6/20), Senior Unsecured Notes, 2.094% due 4/25/22(c) | 160,216 | ||||||
| 5,200,000 | CAD | BBB+ | Wells Fargo & Co., (Restricted, cost — $4,286,016, acquired 2/11/21), Senior Unsecured Notes, 2.509% due 10/27/23(c) | 4,252,454 | ||||||
| 1,000,000 | CAD | BBB+ | Wells Fargo & Co., (Restricted, cost — $797,484, acquired 10/6/20), Senior Unsecured Notes, 3.184% due 2/8/24(c) | 830,977 | ||||||
|
| |||||||||
| Total Banks | 68,208,226 | |||||||||
|
| |||||||||
Commercial Services — 1.2% | ||||||||||
| Central Nippon Expressway Co., Ltd., Senior Unsecured Notes: | ||||||||||
| 1,000,000 | A1(d) | 0.969% (3-Month USD-LIBOR + 0.850%) due 9/14/21(b) | 1,000,260 | |||||||
| 1,200,000 | A1(d) | 2.567% due 11/2/21 | 1,204,482 | |||||||
| 3,000,000 | A1(d) | 0.939% (3-Month USD-LIBOR + 0.810%) due 3/3/22(b) | 3,010,095 | |||||||
|
| |||||||||
| Total Commercial Services | 5,214,837 | |||||||||
|
| |||||||||
Diversified Financial Services — 4.7% | ||||||||||
| AerCap Ireland Capital DAC/AerCap Global Aviation Trust, Company Guaranteed Notes: | ||||||||||
| 500,000 | BBB | 4.450% due 12/16/21 | 504,133 | |||||||
| 600,000 | BBB | 4.625% due 7/1/22 | 620,409 | |||||||
| Aircastle Ltd., Senior Unsecured Notes: | ||||||||||
| 200,000 | BBB- | 5.000% due 4/1/23 | 213,178 | |||||||
| 800,000 | BBB- | 4.400% due 9/25/23 | 853,723 | |||||||
| 500,000 | BBB- | Ally Financial Inc., Senior Unsecured Notes, 4.125% due 2/13/22 | 508,368 | |||||||
| Aviation Capital Group LLC, Senior Unsecured Notes: | ||||||||||
| 1,550,000 | BBB- | 2.875% due 1/20/22(a) | 1,560,722 | |||||||
| 1,000,000 | BBB- | 3.875% due 5/1/23(a) | 1,046,343 | |||||||
| 500,000 | BBB- | Avolon Holdings Funding Ltd., Company Guaranteed Notes, 5.500% due 1/15/23(a) | 528,899 | |||||||
| BOC Aviation Ltd., Senior Unsecured Notes: | ||||||||||
| 1,200,000 | A- | 3.000% due 5/23/22 | 1,214,196 | |||||||
| 500,000 | A- | 2.750% due 9/18/22 | 508,830 | |||||||
| 200,000 | A- | 2.750% due 9/18/22(a) | 203,532 | |||||||
| 400,000 | A- | 1.271% (3-Month USD-LIBOR + 1.125%) due 9/26/23(a)(b) | 400,596 | |||||||
| 600,000 | A- | BOC Aviation USA Corp., Company Guaranteed Notes, 1.625% due 4/29/24(a) | 606,512 | |||||||
| 1,300,000 | BBB | International Lease Finance Corp., Senior Unsecured Notes, 8.625% due 1/15/22 | 1,338,910 | |||||||
| 800,000 | BBB- | LeasePlan Corp. NV, Senior Unsecured Notes, 2.875% due 10/24/24(a) | 839,428 | |||||||
| 500,000 | Baa2(d) | Mirae Asset Securities Co., Ltd., Senior Unsecured Notes, 4.125% due 11/7/21 | 502,945 | |||||||
| 500,000 | A- | Mitsubishi HC Capital Inc., Senior Unsecured Notes, 2.652% due 9/19/22(a) | 511,005 | |||||||
| Nomura Holdings Inc., Senior Unsecured Notes: | ||||||||||
| 2,400,000 | BBB+ | 2.648% due 1/16/25 | 2,515,622 | |||||||
| 1,100,000 | BBB+ | 1.851% due 7/16/25 | 1,125,256 | |||||||
| ORIX Corp., Senior Unsecured Notes: | ||||||||||
| 200,000 | A- | 3.200% due 1/19/22 | 202,066 | |||||||
| 400,000 | A- | 2.900% due 7/18/22 | 408,939 | |||||||
See Notes to Financial Statements.
282
| Schedules of Investments |
| (continued) |
| Ultra-Short Term Fixed Income Fund | ||||||||||
| Face Amount/Units† | Rating†† | Security | Value | |||||||
Diversified Financial Services — 4.7% — (continued) | ||||||||||
| Park Aerospace Holdings Ltd., Company Guaranteed Notes: | ||||||||||
| $ | 1,769,000 | BBB- | 5.250% due 8/15/22(a) | $ | 1,839,306 | |||||
| 1,000,000 | BBB- | 4.500% due 3/15/23(a) | 1,049,742 | |||||||
| 1,800,000 | BBB- | Synchrony Financial, Senior Unsecured Notes, 2.850% due 7/25/22 | 1,837,868 | |||||||
|
| |||||||||
| Total Diversified Financial Services | 20,940,528 | |||||||||
|
| |||||||||
Electric — 1.3% | ||||||||||
| 400,000 | BBB | Israel Electric Corp., Ltd., Senior Secured Notes, 6.875% due 6/21/23 | 442,932 | |||||||
| 400,000 | AUD | Aa2(d) | Korea Southern Power Co., Ltd., Senior Unsecured Notes, 0.991% (3-Month Australian Bank Bill + 0.970%) due 10/30/24(b) | 296,191 | ||||||
| Pacific Gas & Electric Co., 1st Mortgage Notes: | ||||||||||
| 1,800,000 | BBB- | 1.598% (3-Month USD-LIBOR + 1.480%) due 6/16/22(b) | 1,800,843 | |||||||
| 1,000,000 | BBB- | 1.750% due 6/16/22 | 999,752 | |||||||
| 1,400,000 | BBB- | 4.250% due 8/1/23 | 1,466,924 | |||||||
| 500,000 | BBB- | 3.850% due 11/15/23 | 520,863 | |||||||
| 300,000 | BBB- | 3.750% due 2/15/24 | 312,422 | |||||||
| 100,000 | BBB- | 3.400% due 8/15/24 | 104,441 | |||||||
|
| |||||||||
| Total Electric | 5,944,368 | |||||||||
|
| |||||||||
Electronics — 0.3% | ||||||||||
| 300,000 | BBB- | Arrow Electronics Inc., Senior Unsecured Notes, 3.500% due 4/1/22 | 303,710 | |||||||
| 800,000 | BBB- | SYNNEX Corp., Senior Unsecured Notes, 1.250% due 8/9/24(a) | 800,650 | |||||||
|
| |||||||||
| Total Electronics | 1,104,360 | |||||||||
|
| |||||||||
Food — 0.1% | ||||||||||
| 300,000 | BB+ | Kraft Heinz Foods Co., Company Guaranteed Notes, 0.948% (3-Month USD-LIBOR + 0.820%) due 8/10/22(b) | 299,661 | |||||||
|
| |||||||||
Holding Companies — Diversified — 0.3% | ||||||||||
| 1,250,000 | A | CK Hutchison International 17 Ltd., Company Guaranteed Notes, 2.875% due 4/5/22 | 1,267,688 | |||||||
|
| |||||||||
Home Builders — 0.5% | ||||||||||
| Lennar Corp., Company Guaranteed Notes: | ||||||||||
| 700,000 | BBB- | 4.125% due 1/15/22 | 703,885 | |||||||
| 700,000 | BBB- | 5.375% due 10/1/22 | 737,271 | |||||||
| 700,000 | BBB- | 4.750% due 11/15/22 | 727,125 | |||||||
|
| |||||||||
| Total Home Builders | 2,168,281 | |||||||||
|
| |||||||||
Insurance — 0.2% | ||||||||||
| 400,000 | A- | GA Global Funding Trust, Secured Notes, 1.625% due 1/15/26(a) | 407,518 | |||||||
| 400,000 | AA- | Pacific Life Global Funding II, Secured Notes, 0.663% (SOFR + 0.620%) due 6/4/26(a)(b) | 402,128 | |||||||
|
| |||||||||
| Total Insurance | 809,646 | |||||||||
|
| |||||||||
Lodging — 0.4% | ||||||||||
| 1,800,000 | B+ | MGM Resorts International, Company Guaranteed Notes, 7.750% due 3/15/22 | 1,865,610 | |||||||
|
| |||||||||
Machinery — Diversified — 0.2% | ||||||||||
| 700,000 | BBB | CNH Industrial Capital LLC, Company Guaranteed Notes, 3.875% due 10/15/21 | 702,823 | |||||||
|
| |||||||||
Media — 0.9% | ||||||||||
| 4,000,000 | BBB- | Charter Communications Operating LLC/Charter Communications Operating Capital, Senior Secured Notes, 1.776% (3-Month USD-LIBOR + 1.650%) due 2/1/24(b) | 4,110,537 | |||||||
|
| |||||||||
Oil & Gas — 1.3% | ||||||||||
| 1,300,000 | A- | BP Capital Markets America Inc., Company Guaranteed Notes, 0.785% (3-Month USD-LIBOR + 0.650%) due 9/19/22(b) | 1,307,004 | |||||||
| 2,855,000 | BB | Occidental Petroleum Corp., Senior Unsecured Notes, 1.575% (3-Month USD-LIBOR + 1.450%) due 8/15/22(b) | 2,844,215 | |||||||
See Notes to Financial Statements.
283
| Schedules of Investments |
| (continued) |
| Ultra-Short Term Fixed Income Fund | ||||||||||
| Face Amount/Units† | Rating†† | Security | Value | |||||||
Oil & Gas — 1.3% — (continued) | ||||||||||
| $ | 400,000 | BBB+ | Reliance Industries Ltd., Senior Unsecured Notes, 5.400% due 2/14/22 | $ | 408,228 | |||||
| 1,300,000 | BBB | Valero Energy Corp., Senior Unsecured Notes, 1.269% (3-Month USD-LIBOR + 1.150%) due 9/15/23(b) | 1,300,870 | |||||||
|
| |||||||||
| Total Oil & Gas | 5,860,317 | |||||||||
|
| |||||||||
Packaging & Containers — 0.4% | ||||||||||
| Berry Global Inc., Senior Secured Notes: | ||||||||||
| 600,000 | BBB- | 0.950% due 2/15/24(a) | 602,642 | |||||||
| 1,114,000 | BBB- | 4.875% due 7/15/26(a) | 1,176,161 | |||||||
|
| |||||||||
| Total Packaging & Containers | 1,778,803 | |||||||||
|
| |||||||||
Pipelines — 0.2% | ||||||||||
| 600,000 | BBB- | Energy Transfer LP/Regency Energy Finance Corp., Senior Unsecured Notes, 5.000% due 10/1/22 | 621,280 | |||||||
| 400,000 | BBB- | Sabine Pass Liquefaction LLC, Senior Secured Notes, 6.250% due 3/15/22 | 406,577 | |||||||
|
| |||||||||
| Total Pipelines | 1,027,857 | |||||||||
|
| |||||||||
Semiconductors — 0.1% | ||||||||||
| 300,000 | BBB | NXP BV/NXP Funding LLC, Company Guaranteed Notes, 3.875% due 9/1/22(a) | 309,673 | |||||||
|
| |||||||||
Software — 0.1% | ||||||||||
| 500,000 | BBB- | VMware Inc., Senior Unsecured Notes, 1.000% due 8/15/24 | 502,199 | |||||||
|
| |||||||||
Telecommunications — 2.0% | ||||||||||
| 3,300,000 | AUD | BBB | AT&T Inc., Senior Unsecured Notes, 1.278% (3-Month Australian Bank Bill + 1.250%) due 9/19/23(b) | 2,443,605 | ||||||
| 1,000,000 | CAD | BBB | AT&T Inc., (Restricted, cost — $794,831, acquired 10/5/20), Senior Unsecured Notes, 2.850% due 5/25/24(c) | 825,981 | ||||||
| 400,000 | BB+ | Sprint Corp., Company Guaranteed Notes, 7.250% due 9/15/21 | 401,380 | |||||||
| 5,400,000 | AUD | BBB+ | Verizon Communications Inc., Senior Unsecured Notes, 1.234% (3-Month Australian Bank Bill + 1.220%) due 2/17/23(b) | 3,987,689 | ||||||
| 1,780,000 | AUD | BBB | Vodafone Group PLC, Senior Unsecured Notes, 1.074% (3-Month Australian Bank Bill + 1.050%) due 12/13/22(b) | 1,308,968 | ||||||
|
| |||||||||
| Total Telecommunications | 8,967,623 | |||||||||
|
| |||||||||
Trucking & Leasing — 0.7% | ||||||||||
| 500,000 | Baa3(d) | DAE Funding LLC, Company Guaranteed Notes, 5.250% due 11/15/21(a) | 502,042 | |||||||
| 800,000 | BBB | GATX Corp., Senior Unsecured Notes, 0.841% (3-Month USD-LIBOR + 0.720%) due 11/5/21(b) | 800,769 | |||||||
| SMBC Aviation Capital Finance DAC, Company Guaranteed Notes: | ||||||||||
| 400,000 | A- | 3.000% due 7/15/22 | 407,962 | |||||||
| 500,000 | A- | 4.125% due 7/15/23(a) | 530,055 | |||||||
| 700,000 | A- | 3.550% due 4/15/24(a) | 744,262 | |||||||
|
| |||||||||
| Total Trucking & Leasing | 2,985,090 | |||||||||
|
| |||||||||
| TOTAL CORPORATE BONDS & NOTES (Cost — $167,360,440) | 167,678,342 | |||||||||
|
| |||||||||
COLLATERALIZED MORTGAGE OBLIGATIONS — 32.8% | ||||||||||
| 1,199,912 | Aaa(d) | A10 Bridge Asset Financing LLC, Series 2020-C, Class A, 2.021% due 8/15/40(a) | 1,206,782 | |||||||
| 493,424 | B- | ACE Securities Corp. Home Equity Loan Trust, Series 2004-OP1, Class M1, 0.864% (1-Month USD-LIBOR + 0.780%) due 4/25/34(b) | 486,951 | |||||||
| 489,026 | Aaa(d) | ACRES Commercial Realty Corp., Series 2020-RSO9, Class A, 2.664% (30-Day SOFR + 2.614%) due 4/17/37(a)(b) | 489,567 | |||||||
| 184,961 | Aaa(d) | AMMC CLO 16 Ltd., Series 2015-16A, Class AR2, 1.113% (3-Month USD-LIBOR + 0.980%) due 4/14/29(a)(b) | 185,059 | |||||||
| 2,000,000 | Aaa(d) | Anchorage Capital CLO 6 Ltd., Series 2015-6A, Class ARR, 1.176% (3-Month USD-LIBOR + 1.050%) due 7/15/30(a)(b) | 2,001,344 | |||||||
See Notes to Financial Statements.
284
| Schedules of Investments |
| (continued) |
| Ultra-Short Term Fixed Income Fund | ||||||||||
| Face Amount/Units† | Rating†† | Security | Value | |||||||
COLLATERALIZED MORTGAGE OBLIGATIONS — 32.8% — (continued) | ||||||||||
| $ | 300,000 | Aaa(d) | ARES L CLO Ltd., Series 2018-50A, Class AR, 1.176% (3-Month USD-LIBOR + 1.050%) due 1/15/32(a)(b) | $ | 300,281 | |||||
| 275,943 | AAA | Atlas Senior Loan Fund IX Ltd., Series 2018-9A, Class A, 1.004% (3-Month USD-LIBOR + 0.870%) due 4/20/28(a)(b) | 276,086 | |||||||
| 700,000 | AAA | Atrium Hotel Portfolio Trust, Series 2018-ATRM, Class A, 1.046% (1-Month USD-LIBOR + 0.950%) due 6/15/35(a)(b) | 700,958 | |||||||
| 1,628,503 | GBP | AAA | Avon Finance No 2 PLC, Series 2A, Class A, 0.949% (Sterling Overnight Index Average + 0.900%) due 9/20/48(a)(b) | 2,245,960 | ||||||
| 1,200,000 | EUR | Aaa(d) | Bain Capital Euro CLO DAC, Series 2018-2A, Class AR, 0.740% (3-Month EURIBOR + 0.740%) due 1/20/32(a)(b) | 1,414,506 | ||||||
| BAMLL Commercial Mortgage Securities Trust: | ||||||||||
| 500,000 | AAA | Series 2019-AHT, Class A, 1.296% (1-Month USD-LIBOR + 1.200%) due 3/15/34(a)(b) | 500,897 | |||||||
| 400,000 | Aaa(d) | Series 2019-RLJ, Class A, 1.146% (1-Month USD-LIBOR + 1.050%) due 4/15/36(a)(b) | 399,524 | |||||||
| 107,729 | Aaa(d) | Bancorp Commercial Mortgage Trust, Series 2019-CRE6, Class A, 1.214% (30-Day SOFR + 1.164%) due 9/15/36(a)(b) | 107,836 | |||||||
| 60,124 | NR | Bayview Opportunity Master Fund IVa Trust, Series 2019-SBR1, Class A1, step bond to yield, 3.475% due 6/28/34(a) | 60,579 | |||||||
| 563,244 | BBB- | Bear Stearns Asset Backed Securities I Trust, Series 2005-CL1, Class A2, 0.500% (1-Month USD-LIBOR + 0.500%) due 9/25/34(b) | 546,155 | |||||||
| 93,781 | B3(d) | Bear Stearns Second Lien Trust, Series 2007-SV1A, Class M2, 1.434% (1-Month USD-LIBOR + 1.350%) due 1/25/36(a)(b) | 93,706 | |||||||
| 1,000,000 | EUR | AAA | Black Diamond CLO Ltd., Series 2017-2A, Class A1, 0.860% (3-Month USD-LIBOR + 0.860%) due 1/20/32(a)(b) | 1,182,226 | ||||||
| 190,411 | Aaa(d) | Brass NO 8 PLC, Series 8A, Class A1, 0.825% (3-Month USD-LIBOR + 0.700%) due 11/16/66(a)(b) | 191,373 | |||||||
| 2,000,000 | EUR | AAA | Bruegel 2021 DAC, Series 2021-1A, Class A, 0.800% (3-Month USD-LIBOR + 0.800%) due 5/22/31(a)(b) | 2,363,017 | ||||||
| 2,000,000 | NR | BWAY Mortgage Trust, Series 2021-1450, Class A, 1.337% (1-Month USD-LIBOR + 1.250%) due 9/15/36(a)(b) | 1,999,655 | |||||||
| 1,500,000 | Aaa(d) | BXMT Ltd., Series 2020-FL3, Class A, 1.564% (30-Day SOFR + 1.514%) due 3/15/37(a)(b) | 1,507,461 | |||||||
| 967,840 | GBP | Aaa(d) | Canterbury Finance No 1 PLC, Series 1, Class A2, 1.400% (Sterling Overnight Index Average + 1.350%) due 5/16/56(b) | 1,345,454 | ||||||
| 564,424 | AAA | Cathedral Lake CLO Ltd., Series 2015-2A, Class A1RR, 0.976% (3-Month USD-LIBOR + 0.850%) due 7/16/29(a)(b) | 564,748 | |||||||
| 1,800,000 | Aaa(d) | CIFC Funding 2017-IV Ltd., Series 2017-4A, Class A1R, 1.075% (3-Month USD-LIBOR + 0.950%) due 10/24/30(a)(b) | 1,801,552 | |||||||
| Citigroup Mortgage Loan Trust: | ||||||||||
| 544,429 | NR | Series 2019-B, Class A1, 3.258% due 4/25/66(a)(b) | 549,324 | |||||||
| 230,969 | NR | Series 2019-C, Class A1, step bond to yield, 3.228% due 9/25/59(a) | 231,422 | |||||||
| 1,504,606 | CAD | Aaa(d) | CNH Capital Canada Receivables Trust, Series 2021-1A, Class A1, 0.386% due 3/15/24(a) | 1,192,525 | ||||||
| 480,526 | AAA(e) | COLT Mortgage Loan Trust, Series 2020-1R, Class A1, 1.255% due 9/25/65(a)(b) | 482,142 | |||||||
| 31,518 | Aaa(d) | COMM Mortgage Trust, Series 2013-CR6, Class A3FL, 0.727% (1-Month USD-LIBOR + 0.630%) due 3/10/46(a)(b) | 31,519 | |||||||
| Credit Suisse Commercial Mortgage Capital Trust: | ||||||||||
| 300,000 | AAA | Series 2021-INV1, Class A11, 0.850% (30-Day SOFR + 0.800%) due 7/25/56#(a)(b)(f)(i) | 299,944 | |||||||
| 962,661 | NR | Series 2021-RPL4, Class A1, 1.796% due 12/27/60(a)(b) | 968,287 | |||||||
| 881,662 | NR | Credit Suisse Mortgage Capital Trust, Series 2019-RPL9, Class A1, 2.974% due 10/27/59(a)(b) | 889,021 | |||||||
| 240,945 | NR | CSMC Trust, Series 2019-RPL8, Class A1, 3.322% due 10/25/58(a)(b) | 242,688 | |||||||
| 266,018 | B- | CWABS Inc. Asset-Backed Certificates Trust, Series 2004-5, Class M1, 0.939% (1-Month USD-LIBOR + 0.855%) due 8/25/34(b) | 265,814 | |||||||
| 640,563 | EUR | Aaa(d) | Dilosk RMBS No. 2 DAC, Series 2, Class A, 0.207% (0.750% — 3-Month EURIBOR) due 12/20/57(g) | 758,018 | ||||||
| 219,275 | AAA | Dorchester Park CLO DAC, Series 2015-1A, Class AR, 1.034% (3-Month USD-LIBOR + 0.900%) due 4/20/28(a)(b) | 219,498 | |||||||
See Notes to Financial Statements.
285
| Schedules of Investments |
| (continued) |
| Ultra-Short Term Fixed Income Fund | ||||||||||
| Face Amount/Units† | Rating†† | Security | Value | |||||||
COLLATERALIZED MORTGAGE OBLIGATIONS — 32.8% — (continued) | ||||||||||
| $ | 592,961 | AAA | Dryden 36 Senior Loan Fund, Series 2014-36A, Class AR3, 1.146% (3-Month USD-LIBOR + 1.020%) due 4/15/29(a)(b) | $ | 593,404 | |||||
| 1,500,000 | EUR | AAA | Dryden 52 Euro CLO DAC, Series 2017-52A, Class AR, 0.860% (3-Month USD-LIBOR + 0.860%) due 5/15/34(a)(b) | 1,769,010 | ||||||
| 1,300,000 | EUR | AAA | Dryden Leveraged Loan CDO, Series 2017-27A, Class AR, 0.660% (3-Month EURIBOR + 0.660%) due 4/15/33(a)(b) | 1,540,380 | ||||||
| 2,100,000 | Aaa(d) | Extended Stay America Trust, Series 2021-ESH, Class A, 1.176% (1-Month USD-LIBOR + 1.080%) due 7/15/38(a)(b) | 2,109,993 | |||||||
| Federal Home Loan Mortgage Corp. (FHLMC), REMICS: | ||||||||||
| 859,523 | NR | Series 4344, Class FA, 0.550% (1-Month USD-LIBOR + 0.450%) due 12/15/37(b) | 858,902 | |||||||
| 1,167,250 | NR | Series 4351, Class FA, 0.550% (1-Month USD-LIBOR + 0.450%) due 5/15/38(b) | 1,162,484 | |||||||
| 2,096,416 | NR | Series 4906, Class WF, 0.500% (1-Month USD-LIBOR + 0.400%) due 12/15/38(b) | 2,127,938 | |||||||
| 1,297,984 | NR | Federal National Mortgage Association (FNMA), REMICS, Series 2017-108, Class AF, 0.384% (1-Month USD-LIBOR + 0.300%) due 1/25/48(b) | 1,301,810 | |||||||
| 185,444 | BBB+ | Finance America Mortgage Loan Trust, Series 2004-2, Class M1, 0.909% (1-Month USD-LIBOR + 0.825%) due 8/25/34(b) | 184,736 | |||||||
| 3,000,000 | GBP | (P)AAA | Finsbury Square, Series 2021-1GRA, Class AGRN, zero coupon, (Sterling Overnight Index Average + 0.650%) due 12/16/67(a)(b) | 4,139,774 | ||||||
| Finsbury Square PLC: | ||||||||||
| 783,618 | GBP | AAA(e) | Series 2019-1, Class A, 1.052% (3-Month GBP-LIBOR + 0.970%) due 6/16/69(b) | 1,080,834 | ||||||
| 2,192,146 | GBP | NR | Series 2020-1A, Class A, 0.850% (Sterling Overnight Index Average + 0.800%) due 3/16/70(a)(b) | 3,027,416 | ||||||
| 700,000 | AAA | Ford Credit Floorplan Master Owner Trust A, Series 2019-3, Class A2, 0.696% (1-Month USD-LIBOR + 0.600%) due 9/15/24(b) | 703,933 | |||||||
| 344,327 | BB | Fremont Home Loan Trust, Series 2005-A, Class M3, 0.819% (1-Month USD-LIBOR + 0.735%) due 1/25/35(b) | 342,555 | |||||||
| 1,344,682 | AAA | GCAT Trust, Series 2021-NQM3, Class A1, 1.091% due 5/25/66(a)(b) | 1,353,919 | |||||||
| GLG Euro CLO: | ||||||||||
| 3,600,000 | EUR | Aaa(d) | Series 5A, Class A1R, 0.690% (3-Month USD-LIBOR + 0.690%) due 12/15/31(a)(b) | 4,251,246 | ||||||
| 250,000 | EUR | AAA | Series 6A, Class A, 0.900% (3-Month EURIBOR + 9.000%) due 10/15/32(a)(b) | 294,930 | ||||||
| 1,600,000 | AAA | GMF Floorplan Owner Revolving Trust, Series 2018-4, Class A1, 3.500% due 9/15/23(a) | 1,602,041 | |||||||
| 2,589 | Aaa(d) | Gosforth Funding PLC, Series 2017-1A, Class A1A, 0.605% (3-Month USD-LIBOR + 0.470%) due 12/19/59(a)(b) | 2,593 | |||||||
| Government National Mortgage Association (GNMA): | ||||||||||
| 1,921,028 | NR | Series 2016-H06, Class FD, 1.023% (1-Month USD-LIBOR + 0.920%) due 7/20/65(b) | 1,952,980 | |||||||
| 132,945 | NR | Series 2016-H11, Class F, 0.903% (1-Month USD-LIBOR + 0.800%) due 5/20/66(b) | 134,862 | |||||||
| 1,522,841 | NR | Series 2017-H15, Class FE, 1.047% (1-Year USD-LIBOR + 0.800%) due 7/20/67(b) | 1,548,081 | |||||||
| 135,026 | NR | Series 2020-17, Class EU, 2.500% due 10/20/49 | 141,659 | |||||||
| 98,571 | NR | Series 2020-21, Class AC, 2.500% due 1/20/49 | 103,576 | |||||||
| 4,074,295 | NR | Series 2021-97, Class FA, 0.450% (30-Day SOFR + 0.400%) due 6/20/51(b) | 4,068,417 | |||||||
| 3,990,347 | NR | Series 2021-122, Class FA, 0.450% (30-Day SOFR + 0.400%) due 7/20/51(b) | 3,974,774 | |||||||
| 1,000,000 | Aaa(d) | Greystone CRE Notes Ltd., Series 2019-FL2, Class A, 1.276% (1-Month USD-LIBOR + 1.180%) due 9/15/37(a)(b) | 1,001,192 | |||||||
| 237,798 | Aaa(d) | GS Mortgage Securities Trust, Series 2014-GC18, Class AAB, 3.648% due 1/10/47 | 245,915 | |||||||
| 2,064,147 | AAA(e) | GS Mortgage-Backed Securities Corp. Trust, Series 2021-RPL1, Class A1, 1.750% due 12/25/60(a)(b) | 2,099,022 | |||||||
| GS Mortgage-Backed Securities Trust: | ||||||||||
| 900,000 | (P)Aaa(d) | Series 2021-GR2, Class A9, 0.900% (30-Day SOFR + 0.850%) due 2/25/52(a)(b) | 902,248 | |||||||
| 300,000 | (P)Aaa(d) | Series 2021-INV1, Class A9, 0.900% (30-Day SOFR + 0.850%) due 12/25/51#(a)(b)(f) | 299,861 | |||||||
| 1,600,000 | EUR | Aaa(d) | Harvest CLO XVI DAC, Series 2016-A, Class ARR, 0.640% (3-Month EURIBOR + 6.400%) due 10/15/31(a)(b) | 1,882,035 | ||||||
| 500,000 | EUR | Aaa(d) | Harvest CLO XXI DAC, Series 2021-A, Class A1R, 0.760% (3-Month EURIBOR + 7.600%) due 7/15/31(a)(b) | 591,067 | ||||||
| 3,011,480 | GBP | AAA | Hawksmoor Mortgages, Series 2019-1A, Class A, 1.100% (Sterling Overnight Index Average + 1.050%) due 5/25/53(a)(b) | 4,161,218 | ||||||
See Notes to Financial Statements.
286
| Schedules of Investments |
| (continued) |
| Ultra-Short Term Fixed Income Fund | ||||||||||
| Face Amount/Units† | Rating†† | Security | Value | |||||||
COLLATERALIZED MORTGAGE OBLIGATIONS — 32.8% — (continued) | ||||||||||
| $ | 279,947 | AAA | Homeward Opportunities Fund I Trust, Series 2020-2, Class A1, 1.657% due 5/25/65(a)(b) | $ | 281,703 | |||||
| 104,539 | CCC | Impac CMB Trust, Series 2004-10, Class 1A1, 0.724% (1-Month USD-LIBOR + 0.640%) due 3/25/35(b) | 102,961 | |||||||
| JP Morgan Chase Commercial Mortgage Securities Trust: | ||||||||||
| 87,846 | AAA(e) | Series 2018-LAQ, Class A, 1.096% (1-Month USD-LIBOR + 1.000%) due 6/15/32(a)(b) | 87,993 | |||||||
| 354,951 | A- | Series 2019-FL12, Class A, 1.546% (1-Month USD-LIBOR + 1.450%) due 12/15/31(a)(b) | 353,070 | |||||||
| 1,972,600 | EUR | AAA | Jubilee CLO BV, Series 2015-16A, Class A1R, 0.252% (0.800% – 3-Month EURIBOR) due 12/15/29(a)(g) | 2,320,091 | ||||||
| 1,700,000 | EUR | Aaa(d) | Laurelin DAC, Series 2016-1A, Class ARR, 0.720% (3-Month EURIBOR+ 0.720%) due 10/20/31(a)(b) | 2,002,288 | ||||||
| Legacy Mortgage Asset Trust: | ||||||||||
| 362,888 | NR | Series 2019-GS3, Class A1, step bond to yield, 3.750% due 4/25/59(a) | 365,903 | |||||||
| 235,151 | NR | Series 2019-GS6, Class A1, step bond to yield, 3.000% due 6/25/59(a) | 236,155 | |||||||
| 200,000 | NR | LL ABS Trust, Series 2021-1A, Class A, 1.070% due 5/15/29(a) | 200,079 | |||||||
| 198,913 | GBP | Aaa(d) | London Wall Mortgage Capital PLC, Series 2017-FL1, Class A, 0.921% (3-Month GBP-LIBOR + 0.850%) due 11/15/49(b) | 274,292 | ||||||
| 285,634 | AAA | Marathon CLO V Ltd., Series 2013-5A, Class A1R, 1.001% (3-Month USD-LIBOR + 0.870%) due 11/21/27(a)(b) | 285,767 | |||||||
| 204,112 | A | Mastr Asset Backed Securities Trust, Series 2004-OPT2, Class A1, 0.784% (1-Month USD-LIBOR + 0.700%) due 9/25/34(b) | 200,644 | |||||||
| MF1 Ltd.: | ||||||||||
| 369,757 | Aaa(d) | Series 2019-FL2, Class A, 1.294% (30-Day SOFR + 1.244%) due 12/25/34(a)(b) | 370,396 | |||||||
| 671,793 | Aaa(d) | Series 2020-FL3, Class A, 2.214% (30-Day SOFR + 2.164%) due 7/15/35(a)(b) | 679,554 | |||||||
| 1,100,000 | Aaa(d) | Series 2020-FL4, Class A, 1.864% (30-Day SOFR + 1.814%) due 11/15/35(a)(b) | 1,113,708 | |||||||
| 1,800,000 | Aaa(d) | MF1 Multifamily Housing Mortgage Loan Trust, Series 2021-FL5, Class A, 1.014% (30-Day SOFR + 0.964%) due 7/15/36(a)(b) | 1,804,922 | |||||||
| MFA Trust: | ||||||||||
| 561,293 | AAA | Series 2020-NQM1, Class A1, 1.479% due 3/25/65(a)(b) | 565,725 | |||||||
| 663,933 | AAA | Series 2020-NQM2, Class A1, 1.381% due 4/25/65(a)(b) | 668,452 | |||||||
| 2,000,000 | AAA | MidOcean Credit CLO II, Series 2013-2A, Class ARR, zero coupon, (3-Month USD-LIBOR + 1.030%) due 1/29/30(a)(b) | 2,001,158 | |||||||
| Mill City Mortgage Loan Trust: | ||||||||||
| 957,203 | Aaa(d) | Series 2019-GS2, Class A1, 2.750% due 8/25/59(a)(b) | 983,205 | |||||||
| 805,695 | AAA(e) | Series 2021-NMR1, Class A1, 1.125% due 11/25/60(a)(b) | 810,647 | |||||||
| 510,658 | B- | Morgan Stanley ABS Capital I Inc. Trust, Series 2004-HE4, Class M1, 1.018% (1-Month USD-LIBOR + 0.900%) due 5/25/34(b)(h) | 508,348 | |||||||
| 800,000 | Aaa(d) | Mountain View CLO LLC, Series 2017-1A, Class AR, 1.216% (3-Month USD-LIBOR + 1.090%) due 10/16/29(a)(b) | 800,211 | |||||||
| 1,119,354 | AAA | Mountain View CLO X Ltd., Series 2015-10A, Class AR, 0.949% (3-Month USD-LIBOR + 0.820%) due 10/13/27(a)(b) | 1,119,587 | |||||||
| New Residential Mortgage Loan Trust: | ||||||||||
| 272,412 | NR | Series 2018-3A, Class A1, 4.500% due 5/25/58(a)(b) | 295,266 | |||||||
| 96,702 | AAA(e) | Series 2018-RPL1, Class A1, 3.500% due 12/25/57(a)(b) | 99,761 | |||||||
| 2,253,672 | Aaa(d) | Series 2019-RPL3, Class A1, 2.750% due 7/25/59(a)(b) | 2,340,637 | |||||||
| 2,070,320 | Aaa(d) | Series 2020-RPL1, Class A1, 2.750% due 11/25/59(a)(b) | 2,134,806 | |||||||
| 261,972 | BBB+ | NovaStar Mortgage Funding Trust, Series 2005-4, Class M1, 0.744% (1-Month USD-LIBOR + 0.660%) due 1/25/36(b) | 260,973 | |||||||
| 600,000 | NR | NYMT Loan Trust, Series 2021-SP1, Class A1, 1.670% due 8/25/61#(a)(i) | 600,133 | |||||||
| OCP CLO Ltd.: | ||||||||||
| 136,210 | AAA | Series 2015-9A, Class A1R, 0.926% (3-Month USD-LIBOR + 0.800%) due 7/15/27(a)(b) | 136,244 | |||||||
| 256,658 | AAA | Series 2015-10A, Class A1R, 0.945% (3-Month USD-LIBOR + 0.820%) due 10/26/27(a)(b) | 257,038 | |||||||
| 1,800,000 | EUR | (P)AAA | OCP Euro CLO DAC, Series 2020-4A, Class AR, zero coupon, (3-Month USD-LIBOR + 0.880%) due 9/22/34(a)(b) | 2,125,350 | ||||||
| 152,930 | AAA(e) | Palmer Square CLO Ltd., Series 2018-3A, Class A1, 0.975% (3-Month USD-LIBOR + 0.850%) due 8/15/26(a)(b) | 153,083 | |||||||
See Notes to Financial Statements.
287
| Schedules of Investments |
| (continued) |
| Ultra-Short Term Fixed Income Fund | ||||||||||
| Face Amount/Units† | Rating†† | Security | Value | |||||||
COLLATERALIZED MORTGAGE OBLIGATIONS — 32.8% — (continued) | ||||||||||
| 500,000 | EUR | Aaa(d) | Palmer Square European Loan Funding DAC, Series 2021-1A, Class A, 0.780% (3-Month USD-LIBOR + 0.780%) due 4/15/31(a)(b) | $ | 590,502 | |||||
| $ | 408,170 | AAA | Pennsylvania Higher Education Assistance Agency, Series 2006-2, Class A-3, 0.255% (3-Month USD-LIBOR + 0.130%) due 10/25/36(b) | 403,733 | ||||||
| PFP Ltd.: | ||||||||||
| 1,051,063 | Aaa(d) | Series 2019-6, Class A, 1.146% (1-Month USD-LIBOR + 1.050%) due 4/14/37(a)(b) | 1,050,117 | |||||||
| 499,975 | Aaa(d) | Series 2021-7, Class A, 0.946% (1-Month USD-LIBOR + 0.850%) due 4/14/38(a)(b) | 499,060 | |||||||
| PFS Financing Corp.: | ||||||||||
| 1,200,000 | AAA | Series 2019-A, Class A1, 0.646% (1-Month USD-LIBOR + 0.550%) due 4/15/24(a)(b) | 1,202,953 | |||||||
| 400,000 | AAA | Series 2020-F, Class A, 0.930% due 8/15/24(a) | 402,085 | |||||||
| 177,499 | NR | Pretium Mortgage Credit Partners I LLC, Series 2021-NPL1, Class A1, step bond to yield, 2.240% due 9/27/60(a) | 177,870 | |||||||
| 276,612 | GBP | AAA | Residential Mortgage Securities 31 PLC, Series 2031, Class A, 1.281% (3-Month GBP-LIBOR + 1.200%) due 9/20/65(b) | 380,616 | ||||||
| 1,762,905 | GBP | AAA | Residential Mortgage Securities 32 PLC, Series 2032, Class A, 1.299% (Sterling Overnight Index Average + 1.250%) due 6/20/70(a)(b) | 2,451,668 | ||||||
| Ripon Mortgages PLC: | ||||||||||
| 700,285 | GBP | AAA | Series 1X, Class A1, 0.868% (3-Month GBP-LIBOR + 0.800%) due 8/20/56(b) | 965,038 | ||||||
| 2,100,854 | GBP | AAA | Series 1A, Class A1, 0.868% (3-Month GBP-LIBOR + 0.800%) due 8/20/56(a)(b) | 2,895,113 | ||||||
| 339,919 | GBP | AAA | RMAC PLC, Series 2018-1, Class A, 0.784% (3-Month GBP-LIBOR + 0.700%) due 6/12/46(b) | 467,766 | ||||||
| Silverstone Master Issuer PLC: | ||||||||||
| 110,000 | AAA | Series 2019-1A, Class 1A, 0.704% (3-Month USD-LIBOR + 0.570%) due 1/21/70(a)(b) | 110,060 | |||||||
| 528,000 | GBP | AAA | Series 2019-1A, Class 2A, 0.800% (Sterling Overnight Index Average + 0.750%) due 1/21/70(a)(b) | 733,779 | ||||||
| 801,506 | Aaa(d) | Sound Point CLO XII Ltd., Series 2016-2A, Class AR2, 1.184% (3-Month USD-LIBOR + 1.050%) due 10/20/28(a)(b) | 801,960 | |||||||
| 1,835,546 | Aaa(d) | Sound Point CLO XIV Ltd., Series 2016-3A, Class AR2, 1.128% (3-Month USD-LIBOR + 0.990%) due 1/23/29(a)(b) | 1,836,179 | |||||||
| 793,310 | B | Soundview Home Loan Trust, Series 2005-OPT1, Class M2, 0.759% (1-Month USD-LIBOR + 0.675%) due 6/25/35(b) | 792,681 | |||||||
| 19,861 | NR | Stanwich Mortgage Loan Co. LLC, Series 2019-NPB1, Class A1, step bond to yield, 3.375% due 8/15/24(a) | 19,934 | |||||||
| 463,473 | GBP | AAA | Stratton Mortgage Funding, Series 2021-2A, Class A, 0.950% (Sterling Overnight Index Average + 0.900%) due 7/20/60(a)(b) | 640,546 | ||||||
| 1,200,000 | AAA | STWD Mortgage Trust, Series 2021-HTS, Class A, 1.146% (1-Month USD-LIBOR + 1.050%) due 4/15/34(a)(b) | 1,205,279 | |||||||
| 1,215,120 | AAA | Tharaldson Hotel Portfolio Trust, Series 2018-THL, Class A, 0.996% (1-Month USD-LIBOR + 0.900%) due 11/11/34(a)(b) | 1,216,850 | |||||||
| 400,000 | NR | Theorem Funding Trust, Series 2021-1A, Class A, 1.210% due 12/15/27(a) | 401,658 | |||||||
| 998,880 | GBP | AAA | Towd Point Mortgage Funding, Series 2019-A13A, Class A1, 0.950% (Sterling Overnight Index Average + 0.900%) due 7/20/45(a)(b) | 1,379,393 | ||||||
| 2,735,940 | GBP | AAA | Towd Point Mortgage Funding Auburn 14 PLC, Series 2020-A14X, Class A, 0.950% (Sterling Overnight Index Average + 0.900%) due 5/20/45(b) | 3,779,273 | ||||||
| 483,234 | GBP | AAA | Towd Point Mortgage Funding Granite 4 PLC, Series 2019-GR4X, Class A1, 1.097% (3-Month GBP-LIBOR + 1.025%) due 10/20/51(b) | 671,262 | ||||||
| Towd Point Mortgage Trust: | ||||||||||
| 429,186 | Aaa(d) | Series 2017-5, Class A1, 0.684% (1-Month USD-LIBOR + 0.600%) due 2/25/57(a)(b) | 429,682 | |||||||
| 576,753 | AAA(e) | Series 2018-3, Class A1, 3.750% due 5/25/58(a)(b) | 602,857 | |||||||
| 378,031 | Aaa(d) | Series 2019-HY2, Class A1, 1.084% (1-Month USD-LIBOR + 1.000%) due 5/25/58(a)(b) | 381,042 | |||||||
| 444,843 | Aaa(d) | Series 2019-HY3, Class A1A, 1.084% (1-Month USD-LIBOR + 1.000%) due 10/25/59(a)(b) | 448,551 | |||||||
| 1,009,569 | AAA(e) | Series 2020-1, Class A1, 2.710% due 1/25/60(a)(b) | 1,039,016 | |||||||
| 2,815,347 | AAA(e) | Series 2020-2, Class A1A, 1.636% due 4/25/60(a)(b) | 2,845,922 | |||||||
See Notes to Financial Statements.
288
| Schedules of Investments |
| (continued) |
| Ultra-Short Term Fixed Income Fund | ||||||||||
| Face Amount/Units† | Rating†† | Security | Value | |||||||
COLLATERALIZED MORTGAGE OBLIGATIONS — 32.8% — (continued) | ||||||||||
| 1,570,923 | GBP | AAA | Trinity Square PLC, Series 2021-1A, Class A, 0.899% (Sterling Overnight Index Average + 0.850%) due 7/15/59(a)(b) | $ | 2,167,541 | |||||
| $ | 1,000,000 | Aaa(d) | Venture 36 CLO Ltd., Series 2019-36A, Class A1AR, 1.264% (3-Month USD-LIBOR + 1.130%) due 4/20/32(a)(b) | 1,000,753 | ||||||
| 655,697 | Aaa(d) | Venture XVII CLO Ltd., Series 2014-17A, Class ARR, 1.006% (3-Month USD-LIBOR + 0.880%) due 4/15/27(a)(b) | 655,728 | |||||||
| 600,000 | Aaa(d) | Venture XXVI CLO Ltd., Series 2017-26A, Class AR, 1.234% (3-Month USD-LIBOR + 1.100%) due 1/20/29(a)(b) | 600,307 | |||||||
| 384,116 | Aaa(d) | VMC Finance LLC, Series 2019-FL3, Class A, 1.193% (1-Month USD-LIBOR + 1.100%) due 9/15/36(a)(b) | 383,886 | |||||||
| 513,412 | AA | WaMu Mortgage Pass-Through Certificates Trust, Series 2005-AR13, Class A1A1, 0.664% (1-Month USD-LIBOR + 0.580%) due 10/25/45(b) | 514,387 | |||||||
| Wells Fargo Commercial Mortgage Trust: | ||||||||||
| 400,000 | Aaa(d) | Series 2013-LC12, Class A4, 4.218% due 7/15/46(b) | 421,823 | |||||||
| 500,000 | AAA | Series 2017-HSDB, Class A, 0.947% (1-Month USD-LIBOR + 0.850%) due 12/13/31(a)(b) | 495,998 | |||||||
| WFRBS Commercial Mortgage Trust: | ||||||||||
| 1,279,795 | Aaa(d) | Series 2012-C7, Class AFL, 1.293% (1-Month USD-LIBOR + 1.200%) due 6/15/45(a)(b) | 1,278,903 | |||||||
| 597,641 | Aaa(d) | Series 2012-C10, Class AFL, 0.883% (1-Month USD-LIBOR + 0.790%) due 12/15/45(a)(b) | 598,681 | |||||||
|
| |||||||||
| TOTAL COLLATERALIZED MORTGAGE OBLIGATIONS (Cost — $143,232,966) | 145,137,286 | |||||||||
|
| |||||||||
U.S. GOVERNMENT AGENCIES & OBLIGATIONS — 18.0% | ||||||||||
U.S. GOVERNMENT AGENCIES — 12.6% | ||||||||||
| Federal Home Loan Banks: | ||||||||||
| 3,200,000 | AA+ | 0.750% due 2/24/26 | 3,200,919 | |||||||
| 3,400,000 | AA+ | 0.960% due 3/5/26 | 3,400,352 | |||||||
| 877,500 | AA+ | 1.000% due 3/23/26 | 877,762 | |||||||
| 2,600,000 | AA+ | 1.000% due 7/27/26 | 2,600,285 | |||||||
| 3,500,000 | AA+ | 1.050% due 8/13/26 | 3,500,515 | |||||||
| 4,000,000 | AA+ | 1.100% due 8/20/26 | 4,000,758 | |||||||
| 4,600,000 | AA+ | 0.830% due 2/10/27 | 4,577,197 | |||||||
| 3,900,000 | AA+ | 0.850% due 2/17/27 | 3,874,189 | |||||||
| 5,500,000 | AA+ | 1.020% due 2/24/27 | 5,489,461 | |||||||
| 5,000,000 | AA+ | 0.900% due 2/26/27 | 4,993,179 | |||||||
| 3,400,000 | AA+ | 0.920% due 2/26/27 | 3,385,507 | |||||||
| 3,700,000 | AA+ | 1.115% due 2/26/27 | 3,698,522 | |||||||
| Federal Home Loan Mortgage Corp.: | ||||||||||
| 3,000,000 | Aaa(d) | 0.600% due 10/15/25 | 2,991,440 | |||||||
| 5,000,000 | Aaa(d) | 0.800% due 10/28/26 | 4,993,931 | |||||||
| 4,000,000 | Federal National Mortgage Association, 0.875% due 12/18/26 | 3,983,452 | ||||||||
|
| |||||||||
| TOTAL U.S. GOVERNMENT AGENCIES | 55,567,469 | |||||||||
|
| |||||||||
U.S. GOVERNMENT OBLIGATIONS — 5.4% | ||||||||||
| U.S. Treasury Notes: | ||||||||||
| 18,400,000 | 0.125% due 4/30/23 | 18,389,578 | ||||||||
| 5,600,000 | 0.750% due 1/31/28 | 5,514,031 | ||||||||
|
| |||||||||
| TOTAL U.S. GOVERNMENT OBLIGATIONS | 23,903,609 | |||||||||
|
| |||||||||
| TOTAL U.S. GOVERNMENT AGENCIES & OBLIGATIONS (Cost — $79,574,152) | 79,471,078 | |||||||||
|
| |||||||||
ASSET-BACKED SECURITIES — 4.4% | ||||||||||
Automobiles — 0.5% | ||||||||||
| 86,268 | AAA | DT Auto Owner Trust, Series 2020-3A, Class A, 0.540% due 4/15/24(a) | 86,372 | |||||||
| 38,574 | AAA | Flagship Credit Auto Trust, Series 2019-2, Class A, 2.830% due 10/16/23(a) | 38,730 | |||||||
See Notes to Financial Statements.
289
| Schedules of Investments |
| (continued) |
| Ultra-Short Term Fixed Income Fund | ||||||||||
| Face Amount/Units† | Rating†† | Security | Value | |||||||
Automobiles — 0.5% — (continued) | ||||||||||
| Ford Auto Securitization Trust: | ||||||||||
| 194,684 | CAD | Aaa(d) | Series 2020-AA, Class A1, 0.516% due 8/15/22(a) | $ | 154,348 | |||||
| 1,900,000 | CAD | Aaa(d) | Series 2020-AA, Class A2, 0.887% due 8/15/24(a) | 1,510,302 | ||||||
| $ | 411,470 | AAA | GLS Auto Receivables Issuer Trust, Series 2020-3A, Class A, 0.690% due 10/16/23(a) | 411,909 | ||||||
| 10,213 | CAD | Aaa(d) | GMF Canada Leasing Trust, Series 2020-1A, Class A1, 0.561% due 7/20/22(a) | 8,097 | ||||||
|
| |||||||||
| Total Automobiles | 2,209,758 | |||||||||
|
| |||||||||
Credit Cards — 0.9% | ||||||||||
| 777,513 | NR | LP Credit Card ABS Master Trust, Series 2018-1, Class A, 1.661% (1-Month USD-LIBOR + 1.550%) due 8/20/24(a)(b) | 779,644 | |||||||
| 3,000,000 | Aaa(d) | Master Credit Card Trust II, Series 2018-1A, Class A, 0.578% (1-Month USD-LIBOR + 0.490%) due 7/21/24(a)(b) | 3,017,073 | |||||||
|
| |||||||||
| Total Credit Cards | 3,796,717 | |||||||||
|
| |||||||||
Student Loans — 3.0% | ||||||||||
| ECMC Group Student Loan Trust: | ||||||||||
| 600,525 | Aaa(d) | Series 2017-2A, Class A, 1.134% (1-Month USD-LIBOR + 1.050%) due 5/25/67(a)(b) | 613,455 | |||||||
| 503,608 | Aaa(d) | Series 2018-1A, Class A, 0.834% (1-Month USD-LIBOR + 0.750%) due 2/27/68(a)(b) | 504,780 | |||||||
| 781,240 | Aaa(d) | Series 2019-1A, Class A1B, 1.084% (1-Month USD-LIBOR + 1.000%) due 7/25/69(a)(b) | 794,923 | |||||||
| 146,213 | AAA | EFS Volunteer LLC, Series 2010-1, Class A2, 0.975% (3-Month USD-LIBOR + 0.850%) due 10/25/35(a)(b) | 146,769 | |||||||
| 49,162 | Aaa(d) | Navient Private Education Loan Trust, Series 2015-AA, Class A2A, 2.650% due 12/15/28(a) | 50,005 | |||||||
| Navient Private Education Refi Loan Trust: | ||||||||||
| 122,171 | AAA | Series 2020-A, Class A1, 0.446% (1-Month USD-LIBOR + 0.350%) due 11/15/68(a)(b) | 122,179 | |||||||
| 379,911 | AAA | Series 2020-GA, Class A, 1.170% due 9/16/69(a) | 382,742 | |||||||
| Navient Student Loan Trust: | ||||||||||
| 630,430 | AAA | Series 2018-1A, Class A2, 0.434% (1-Month USD-LIBOR + 0.350%) due 3/25/67(a)(b) | 630,910 | |||||||
| 1,112,503 | AAA | Series 2018-2A, Class A2, 0.464% (1-Month USD-LIBOR + 0.380%) due 3/25/67(a)(b) | 1,113,645 | |||||||
| Nelnet Student Loan Trust: | ||||||||||
| 1,018,449 | AA+ | Series 2017-3A, Class A, 0.934% (1-Month USD-LIBOR + 0.850%) due 2/25/66(a)(b) | 1,028,894 | |||||||
| 1,158,946 | AA+ | Series 2019-2A, Class A, 0.984% (1-Month USD-LIBOR + 0.900%) due 6/27/67(a)(b) | 1,180,296 | |||||||
| 1,015,556 | AA+ | Series 2019-3A, Class A, 0.884% (1-Month USD-LIBOR + 0.800%) due 8/25/67(a)(b) | 1,013,848 | |||||||
| SLC Student Loan Trust: | ||||||||||
| 436,986 | AAA | Series 2006-1, Class A5, 0.229% (3-Month USD-LIBOR + 0.110%) due 3/15/27(b) | 436,388 | |||||||
| 473,836 | AAA | Series 2007-1, Class A4, 0.185% (3-Month USD-LIBOR + 0.060%) due 5/15/29(b) | 471,221 | |||||||
| SLM Student Loan Trust: | ||||||||||
| 79,291 | AAA | Series 2003-10A, Class A3, 0.589% (3-Month USD-LIBOR + 0.470%) due 12/15/27(a)(b) | 79,312 | |||||||
| 788,909 | AAA | Series 2004-10, Class A7B, 0.725% (3-Month USD-LIBOR + 0.600%) due 10/25/29(a)(b) | 790,440 | |||||||
| 618,224 | AAA | Series 2005-5, Class A4, 0.265% (3-Month USD-LIBOR + 0.140%) due 10/25/28(b) | 615,550 | |||||||
| 418,659 | B | Series 2008-5, Class A4, 1.825% (3-Month USD-LIBOR + 1.700%) due 7/25/23(b) | 422,990 | |||||||
| 633,547 | B | Series 2008-7, Class A4, 1.025% (3-Month USD-LIBOR + 0.900%) due 7/25/23(b) | 631,499 | |||||||
| 97,150 | B | Series 2008-8, Class A4, 1.625% (3-Month USD-LIBOR + 1.500%) due 4/25/23(b) | 97,788 | |||||||
| SMB Private Education Loan Trust: | ||||||||||
| 240,914 | AAA | Series 2015-B, Class A2B, 1.296% (1-Month USD-LIBOR + 1.200%) due 7/15/27(a)(b) | 241,522 | |||||||
| 2,328 | AAA | Series 2020-PTA, Class A1, 0.389% (1-Month USD-LIBOR + 0.300%) due 9/15/54(a)(b) | 2,328 | |||||||
| 500,000 | AAA | Series 2020-PTA, Class A2A, 1.600% due 9/15/54(a) | 507,709 | |||||||
| 400,000 | AAA | Series 2021-D, Class A1A, 1.340% due 3/17/53(a) | 401,338 | |||||||
| 300,000 | Aaa(d) | Towd Point Asset Trust, Series 2021-SL1, Class A2, zero coupon, (1-Month USD-LIBOR + 0.700%) due 11/20/61#(a)(b)(i) | 299,716 | |||||||
| 676,226 | AA+ | Utah State Board of Regents, Series 2017-1, Class A, 0.839% (1-Month USD-LIBOR + 0.750%) due 1/25/57(b) | 672,920 | |||||||
|
| |||||||||
| Total Student Loans | 13,253,167 | |||||||||
|
| |||||||||
| TOTAL ASSET-BACKED SECURITIES (Cost — $19,077,710) | 19,259,642 | |||||||||
|
| |||||||||
See Notes to Financial Statements.
290
| Schedules of Investments |
| (continued) |
| Ultra-Short Term Fixed Income Fund | ||||||||||
| Face Amount/Units† | Rating†† | Security | Value | |||||||
SOVEREIGN BONDS — 2.1% | ||||||||||
India — 0.4% | ||||||||||
| $ | 1,900,000 | Baa3(d) | Export-Import Bank of India, 1.131% (3-Month USD-LIBOR + 1.000%) due 8/21/22(b) | $ | 1,909,852 | |||||
|
| |||||||||
Saudi Arabia — 0.1% | ||||||||||
| 400,000 | A1(d) | Saudi Government International Bonds, 2.375% due 10/26/21 | 401,370 | |||||||
|
| |||||||||
South Korea — 0.7% | ||||||||||
| 1,500,000 | AA | Export-Import Bank of Korea, 0.895% (3-Month USD-LIBOR + 0.775%) due 6/1/23(b) | 1,514,522 | |||||||
| 2,000,000 | AUD | Aa2(d) | Korea Expressway Corp., 0.732% (3-Month Australian Bank Bill + 0.720%) due 9/2/23(b) | 1,471,253 | ||||||
|
| |||||||||
| Total South Korea | 2,985,775 | |||||||||
|
| |||||||||
Supranational — 0.9% | ||||||||||
| 3,800,000 | AAA | International Bank for Reconstruction & Development, 0.850% due 2/10/27 | 3,745,530 | |||||||
|
| |||||||||
| TOTAL SOVEREIGN BONDS (Cost — $9,096,878) | 9,042,527 | |||||||||
|
| |||||||||
MORTGAGE-BACKED SECURITIES — 0.4% | ||||||||||
FHLMC — 0.4% | ||||||||||
| 1,615,085 | Federal Home Loan Mortgage Corp. (FHLMC), 4.000% due 6/1/49 – 9/1/49 (Cost — $1,694,325) | 1,728,268 | ||||||||
|
| |||||||||
| TOTAL INVESTMENTS IN SECURITIES BEFORE SHORT-TERM INVESTMENTS (Cost — $420,036,471) | 422,317,143 | |||||||||
|
| |||||||||
SHORT-TERM INVESTMENTS — 3.7% | ||||||||||
CORPORATE BOND — 0.1% | ||||||||||
| 500,000 | BBB- | Pacific Gas & Electric Co., 1.500%(3-Month USD-LIBOR + 1.375%) due 11/15/21(b) (Cost — $500,670) | 500,670 | |||||||
TIME DEPOSITS — 1.2% | ||||||||||
| BBH — Grand Cayman: | ||||||||||
| 2,579 | DKK | (0.470)% due 9/1/21 | 410 | |||||||
| 620 | AUD | (0.120)% due 9/1/21 | 454 | |||||||
| 6,087 | NZD | 0.005% due 9/1/21 | 4,289 | |||||||
| 750,900 | CAD | 0.010% due 9/1/21 | 595,267 | |||||||
| BNP Paribas — Paris: | ||||||||||
| 3,428 | EUR | (0.780)% due 9/1/21 | 4,048 | |||||||
| 1,337,930 | 0.005% due 9/1/21 | 1,337,930 | ||||||||
| 809 | GBP | Citibank — London, 0.005% due 9/1/21 | 1,112 | |||||||
| 3,584,000 | Skandinaviska Enskilda Banken AB — Stockholm, 0.005% due 9/1/21 | 3,584,000 | ||||||||
| 38,314 | JPY | Sumitomo Mitsui Banking Corp. — Tokyo, (0.310)% due 9/1/21 | 348 | |||||||
|
| |||||||||
| TOTAL TIME DEPOSITS (Cost — $5,527,858) | 5,527,858 | |||||||||
|
| |||||||||
U.S. GOVERNMENT OBLIGATIONS — 2.4% | ||||||||||
| 8,000,000 | U.S. Cash Management Bills, 0.048% due 12/28/21(j) | 7,998,741 | ||||||||
| 2,500,000 | U.S Treasury Bills, 0.055% due 2/3/22(j) | 2,499,408 | ||||||||
|
| |||||||||
| TOTAL U.S. GOVERNMENT OBLIGATIONS (Cost — $10,498,149) | 10,498,149 | |||||||||
|
| |||||||||
| TOTAL SHORT-TERM INVESTMENTS (Cost — $16,526,677) | 16,526,677 | |||||||||
|
| |||||||||
| TOTAL INVESTMENTS — 99.3% (Cost — $436,563,148) | 438,843,820 | |||||||||
|
| |||||||||
| Other Assets in Excess of Liabilities — 0.7% | 3,112,057 | |||||||||
|
| |||||||||
| TOTAL NET ASSETS — 100.0% | $ | 441,955,877 | ||||||||
|
| |||||||||
See Notes to Financial Statements.
291
| Schedules of Investments |
| (continued) |
| Ultra-Short Term Fixed Income Fund | ||||||
| † | Amount denominated in U.S. dollars, unless otherwise noted. |
| †† | All ratings are by Standard & Poor’s Rating Service, unless otherwise noted. All ratings are unaudited. |
| (a) | Restricted security that may be sold to “qualified institutional buyers” pursuant to the conditions of Rule 144A under the Securities Act of 1933, as amended. This security has been deemed liquid pursuant to guidelines approved by the Board of Trustees, unless otherwise noted. The aggregate value of restricted 144A holdings at August 31, 2021, amounts to $ 164,948,302 and represents 37.3% of net assets. |
| (b) | Variable rate security. Interest rate disclosed is that which was in effect at August 31, 2021. |
| (c) | The aggregate value of restricted securities (excluding 144A holdings) at August 31, 2021, amounts to $13,200,430 and represents 3.0% of net assets. |
| (d) | Rating by Moody’s Investors Service. All ratings are unaudited. |
| (e) | Rating by Fitch Ratings Service. All ratings are unaudited. |
| (f) | Illiquid security. |
| (g) | Inverse Floating Rate Security — interest rate fluctuates with an inverse relationship to an associated interest rate. Indicated rate is the effective rate as of August 31, 2021. |
| (h) | Affiliated security (See Note 2). As of August 31, 2021, total cost and total market value of affiliated securities amounted to $508,416 and $508,348, respectively. |
| (i) | Security is valued in good faith at fair value by or under the direction of the Board of Trustees. |
| (j) | Rate shown represents yield-to-maturity. |
| # | Security that used significant unobservable inputs to determine fair value. |
At August 31, 2021, for Ultra-Short Term Fixed Income Fund the aggregate cost of investments, the aggregate gross unrealized appreciation and and depreciation of all investments for federal income tax purposes were as follows:
| Fund | Aggregate Cost For Federal Income Tax Purposes | Gross Unrealized Appreciation | Gross Unrealized (Depreciation) | Net Unrealized Appreciation | ||||||||||||
Ultra-Short Term Fixed Income Fund | $ | 439,013,622 | $ | 6,289,958 | $ | (5,756,993 | ) | $ | 532,965 | |||||||
Abbreviations used in this schedule: | ||
| ABS | — Asset-Based Security | |
| CLO | — Collateralized Loan Obligation | |
| CMT | — Constant Maturity Treasury Rate | |
| EURIBOR | — Euro Interbank Offered Rate | |
| LIBOR | — London Interbank Offered Rate | |
| PLC | — Public Limited Company | |
| REMICS | — Real Estate Mortgage Investment Conduit | |
| SOFR | — Secured Overnight Financing Rate | |
| Summary of Investments by Security Type^ | ||||
Corporate Bonds & Notes | 38.2 | % | ||
Collateralized Mortgage Obligations | 33.1 | |||
U.S. Government Agencies & Obligations | 18.1 | |||
Asset-Backed Securities | 4.4 | |||
Sovereign Bonds | 2.0 | |||
Mortgage-Backed Securities | 0.4 | |||
Short-Term Investments | 3.8 | |||
|
| |||
| 100.0 | % | |||
|
| |||
| ^ | As a percentage of total investments. |
See Notes to Financial Statements.
292
| Schedules of Investments |
| (continued) |
| Ultra-Short Term Fixed Income Fund | ||||||
At August 31, 2021, Ultra-Short Term Fixed Income Fund had open exchange-traded futures contracts as described below.
The unrealized appreciation (depreciation) on the open contracts reflected in the accompanying financial statements were as follows:
| Open Futures Contracts | Number of Contracts | Expiration Date (Month/Year) | Notional Amount | Market Value | Unrealized Appreciation/ (Depreciation) | |||||||||||||||
| Contracts to Buy: | ||||||||||||||||||||
Bank Accept December Futures | 324 | 12/22 | $ | 63,521,662 | $ | 63,550,438 | $ | 28,776 | ||||||||||||
Bank Accept March Futures | 258 | 3/23 | 50,790,380 | 50,518,055 | (272,325 | ) | ||||||||||||||
|
| |||||||||||||||||||
| (243,549 | ) | |||||||||||||||||||
|
| |||||||||||||||||||
| Contracts to Sell: | ||||||||||||||||||||
U.S. Treasury 2-Year Note December Futures | 46 | 12/21 | 10,128,172 | 10,135,094 | (6,922 | ) | ||||||||||||||
U.S. Treasury 5-Year Note December Futures | 559 | 12/21 | 69,118,430 | 69,158,782 | (40,352 | ) | ||||||||||||||
U.S. Ultra Long Bond December Futures | 146 | 12/21 | 21,695,726 | 21,610,281 | 85,445 | |||||||||||||||
|
| |||||||||||||||||||
| 38,171 | ||||||||||||||||||||
|
| |||||||||||||||||||
Net Unrealized Depreciation on Open Exchange–Traded Futures Contracts | $ | (205,378 | ) | |||||||||||||||||
|
| |||||||||||||||||||
At August 31, 2021, Ultra-Short Term Fixed Income Fund had deposited cash of $1,145,000 with a broker or brokers as margin collateral on an open exchange-traded futures contracts.
At August 31, 2021, Ultra-Short Term Fixed Income Fund had open forward foreign currency contracts as described below.
The unrealized appreciation (depreciation) on the open contracts reflected in the accompanying financial statements were as follows:
| Foreign Currency | Local Currency | In Exchange For | Counterparty | Market Value | Settlement Date | Unrealized Appreciation/ (Depreciation) | ||||||||||||||||||||||
| Contracts to Buy: | ||||||||||||||||||||||||||||
Australian Dollar | 10,511,289 | USD | 7,626,852 | MLP | $ | 7,689,531 | 9/2/21 | $ | 62,679 | |||||||||||||||||||
British Pound | 365,000 | USD | 503,858 | BNP | 501,820 | 9/2/21 | (2,038 | ) | ||||||||||||||||||||
British Pound | 367,000 | USD | 504,091 | JPM | 504,570 | 9/2/21 | 479 | |||||||||||||||||||||
British Pound | 23,571,000 | USD | 32,298,434 | SCB | 32,406,593 | 9/2/21 | 108,159 | |||||||||||||||||||||
Canadian Dollar | 20,272,010 | USD | 16,081,821 | MLP | 16,070,403 | 9/2/21 | (11,418 | ) | ||||||||||||||||||||
Euro | 403,000 | USD | 474,622 | JPM | 475,843 | 9/2/21 | 1,221 | |||||||||||||||||||||
Mexican Peso | 7,185,000 | USD | 341,665 | HSBC | 357,683 | 9/3/21 | 16,018 | |||||||||||||||||||||
Mexican Peso | 7,185,000 | USD | 353,914 | BNP | 356,074 | 10/5/21 | 2,160 | |||||||||||||||||||||
|
| |||||||||||||||||||||||||||
| 177,260 | ||||||||||||||||||||||||||||
|
| |||||||||||||||||||||||||||
| Contracts to Sell: | ||||||||||||||||||||||||||||
Australian Dollar | 7,363,400 | USD | 5,452,219 | BNP | 5,386,693 | 9/2/21 | 65,526 | |||||||||||||||||||||
Australian Dollar | 3,269,000 | USD | 2,382,752 | BNP | 2,391,436 | 9/2/21 | (8,684 | ) | ||||||||||||||||||||
Australian Dollar | 14,222,314 | USD | 10,454,399 | MLP | 10,404,330 | 9/2/21 | 50,069 | |||||||||||||||||||||
Australian Dollar | 2,033,000 | USD | 1,502,661 | MLP | 1,487,241 | 9/2/21 | 15,420 | |||||||||||||||||||||
Australian Dollar | 509,000 | USD | 376,327 | SCB | 372,359 | 9/2/21 | 3,968 | |||||||||||||||||||||
Australian Dollar | 10,511,289 | USD | 7,628,176 | MLP | 7,691,118 | 10/5/21 | (62,942 | ) | ||||||||||||||||||||
Australian Dollar | 16,885,425 | USD | 12,378,165 | MLP | 12,355,078 | 10/5/21 | 23,087 | |||||||||||||||||||||
Australian Dollar | 2,013,000 | USD | 1,470,231 | SCB | 1,472,913 | 10/5/21 | (2,682 | ) | ||||||||||||||||||||
British Pound | 24,303,000 | USD | 33,953,279 | MLP | 33,412,983 | 9/2/21 | 540,296 | |||||||||||||||||||||
British Pound | 23,571,000 | USD | 32,301,375 | SCB | 32,409,444 | 10/4/21 | (108,069 | ) | ||||||||||||||||||||
Canadian Dollar | 20,272,010 | USD | 16,238,378 | BNP | 16,070,403 | 9/2/21 | 167,975 | |||||||||||||||||||||
See Notes to Financial Statements.
293
| Schedules of Investments |
| (continued) |
| Ultra-Short Term Fixed Income Fund | ||||||
| Foreign Currency | Local Currency | In Exchange For | Counterparty | Market Value | Settlement Date | Unrealized Appreciation/ (Depreciation) | ||||||||||||||||||||||
| Contracts to Sell: (continued) | ||||||||||||||||||||||||||||
Canadian Dollar | 20,272,010 | USD | 16,081,247 | MLP | $ | 16,069,626 | 10/4/21 | $ | 11,621 | |||||||||||||||||||
Euro | 17,618,000 | USD | 20,903,407 | SCB | 20,802,462 | 9/2/21 | 100,945 | |||||||||||||||||||||
Euro | 17,215,000 | USD | 20,334,239 | SCB | 20,340,237 | 10/4/21 | (5,998 | ) | ||||||||||||||||||||
Mexican Peso | 7,185,000 | USD | 355,453 | BNP | 357,683 | 9/3/21 | (2,230 | ) | ||||||||||||||||||||
|
| |||||||||||||||||||||||||||
| 788,302 | ||||||||||||||||||||||||||||
|
| |||||||||||||||||||||||||||
Net Unrealized Appreciation on Open Forward Foreign Currency Contracts | $ | 965,562 | ||||||||||||||||||||||||||
|
| |||||||||||||||||||||||||||
At August 31, 2021, Ultra-Short Term Fixed Income Fund held the following Centrally Cleared Credit Default Swap Contract:
Centrally Cleared — Credit Default Swaps on Indexes — Buy Protection (1)
| Reference Obligation | Fixed Deal (Pay) Rate | Maturity Date | Payment Frequency | Implied Credit Spread at 8/31/21 (2) | Notional Amount (3) | Market Value | Upfront Payment (Received) | Unrealized (Depreciation) | ||||||||||||||||||||||||||||
Markit CDX North America Investment Grade Series 36 5-Year Index | (1.000 | )% | 6/20/26 | 3-Month | 0.465% | USD | 12,200,000 | (335,063 | ) | $ | (306,524 | ) | $ | (28,539 | ) | |||||||||||||||||||||
|
|
|
|
|
| |||||||||||||||||||||||||||||||
| (1) | If the Fund is a buyer of protection and a credit event occurs, as defined under the terms of that particular swap agreement, the Fund will either (i) receive from the seller of protection an amount equal to the notional amount of the swap and deliver the reference obligation or underlying securities comprising the referenced index or (ii) receive a net settlement amount in the form of cash or securities equal to the notional amount of the swap less the recovery value of the reference obligation or underlying securities comprising the referenced index. |
| (2) | Implied credit spreads, represented in absolute terms, utilized in determining the market value of credit default swap agreements on corporate issues or sovereign issues of an emerging country as of period end serve as an indicator of the current status of the payment/performance risk and represent the likelihood or risk of default for the credit derivative. The implied credit spread of a particular referenced entity reflects the cost of buying/selling protection and may include upfront payments required to be made to enter into the agreement. Wider credit spreads represent a deterioration of the referenced entity’s credit soundness and a greater likelihood or risk of default or other credit event occurring as defined under the terms of the agreement. A credit spread identified as ‘‘Defaulted’’ indicates a credit event has occurred for the referenced entity or obligation. |
| (3) | The maximum potential amount the Fund could be required to make as a seller of credit protection or receive as a buyer of credit protection if a credit event occurs as defined under the terms of that particular swap agreement. |
At August 31, 2021, Ultra-Short Term Fixed Income Fund deposited cash collateral with brokers in the amount of $151,000 for open centrally cleared swap contracts.
At August 31, 2021, Ultra-Short Term Fixed Income Fund had cash collateral from brokers in the amount of $1,320,000 for open OTC swap contracts.
Currency Abbreviations used in this schedule: | Counterparty Abbreviations used in this schedule: | |||||
| AUD | — Australian Dollar | BNP | — BNP Paribas SA | |||
| CAD | — Canadian Dollar | HSBC | — HSBC Bank USA | |||
| EUR | — Euro | JPM | — JPMorgan Chase & Co. | |||
| GBP | — British Pound | MLP | — Merrill Lynch, Pierce, Fenner & Smith Inc. | |||
| MXN | — Mexican Peso | SCB | — Standard Chartered Bank | |||
| USD | — United States Dollar | |||||
See pages 296-297 for definitions of ratings.
See Notes to Financial Statements.
294
| Schedules of Investments |
| (continued) |
| Alternative Strategies Fund | ||||||||
| Units | Security | Value | ||||||
OPEN END MUTUAL FUND SECURITIES — 98.4% | ||||||||
United States — 98.4% | ||||||||
| 1,014,181 | American Beacon AHL Managed Futures Strategy Fund, Class Y | $ | 11,683,366 | |||||
| 591,389 | BlackRock Event Driven Equity Fund, Institutional Class | 5,825,181 | ||||||
| 905,945 | BlackRock Global Long/Short Equity Fund, Institutional Class | 10,527,085 | ||||||
| 398,564 | BNY Mellon Global Real Return Fund, Class Y | 7,018,716 | ||||||
| 36,184 | Cohen & Steers Global Realty Shares Inc., Class I | 2,352,314 | ||||||
| 188,178 | Diamond Hill Long/Short Fund, Class I | 5,810,942 | ||||||
| 398,316 | Driehaus Event Driven Fund, Common Class | 5,855,244 | ||||||
| 880,156 | Goldman Sachs Absolute Return Tracker Fund, Institutional Class | 9,364,856 | ||||||
| 745,733 | John Hancock Diversified Macro Fund, Class I | 7,009,893 | ||||||
| 535,574 | John Hancock Seaport Long/Short Fund, Class I | 7,016,014 | ||||||
| 474,742 | LoCorr Market Trend Fund, Class I | 5,834,585 | ||||||
| 324,943 | Neuberger Berman Long Short Fund, Institutional Class | 5,852,231 | ||||||
| 560,894 | PIMCO CommodityRealReturn Strategy Fund, Institutional Class | 3,494,371 | ||||||
| 925,568 | PIMCO Credit Opportunities Bond Fund, Institutional Class | 9,357,493 | ||||||
| 961,848 | PIMCO Mortgage Opportunities and Bond Fund, Class I-2 | 10,541,849 | ||||||
| 790,785 | Western Asset Macro Opportunities Fund, Class I | 9,402,430 | ||||||
|
| |||||||
| TOTAL INVESTMENTS — 98.4% (Cost — $110,971,224) | 116,946,570 | |||||||
|
| |||||||
| Other Assets in Excess of Liabilities — 1.6% | 1,918,770 | |||||||
|
| |||||||
| TOTAL NET ASSETS — 100.0% | $ | 118,865,340 | ||||||
|
| |||||||
At August 31, 2021, for Alternative Strategies Fund the aggregate cost of investments, the aggregate gross unrealized appreciation and depreciation of all investments for federal income tax purposes were as follows:
| Fund | Aggregate Cost For Federal Income Tax Purposes | Gross Unrealized Appreciation | Gross Unrealized (Depreciation) | Net Unrealized Appreciation | ||||||||||||
Alternative Strategies Fund | $ | 111,074,110 | $ | 6,227,589 | $ | (355,129 | ) | $ | 5,872,460 | |||||||
| Summary of Investments by Security Type^ | ||||
Open End Mutual Fund Securities | 100.0 | % | ||
|
| |||
| ^ | As a percentage of total investments. |
See Notes to Financial Statements.
295
| Ratings |
The definitions of the applicable rating symbols are set forth below:
Standard & Poor’s Ratings Service (“Standard & Poor’s”) — Ratings from “AA” to “CCC” may be modified by the addition of a plus (+) or minus (-) sign to show relative standings within the major rating categories.
| AAA | — Bonds rated “AAA” have the highest rating assigned by Standard & Poor’s. Capacity to pay interest and repay principal is extremely strong. | |
| AA | — Bonds rated “AA” have a very strong capacity to pay interest and repay principal and differ from the highest rated issues only in a small degree. | |
| A | — Bonds rated “A” have a strong capacity to pay interest and repay principal although they are somewhat more susceptible to the adverse effects of changes in circumstances and economic conditions than debt in higher rated categories. | |
| BBB | — Bonds rated “BBB” are regarded as having an adequate capacity to pay interest and repay principal. Whereas they normally exhibit adequate protection parameters, adverse economic conditions or changing circumstances are more likely to lead to a weakened capacity to pay interest and repay principal for bonds in this category than in higher rated categories. | |
| BB, B, CCC, CC and C | — Bonds rated “BB”, “B”, “CCC”, “CC” and “C” are regarded, on balance, as predominantly speculative with respect to capacity to pay interest and repay principal in accordance with the terms of the obligation. “BB” represents the lowest degree of speculation and “C” the highest degree of speculation. While such bonds will likely have some quality and protective characteristics, these are outweighed by large uncertainties or major risk exposures to adverse conditions. | |
| D | — Bonds rated “D” are in default and payment of interest and/or repayment of principal is in arrears. | |
| P | — Preliminary rating. | |
| u | — The upgrade state defines bonds that have recently been upgraded into higher rating categories. | |
Moody’s Investors Service (“Moody’s”) — Numerical modifiers 1, 2 and 3 may be applied to each generic rating from “Aa” to “Caa,” where 1 is the highest and 3 the lowest ranking within its generic category.
| Aaa | — Bonds rated “Aaa” are judged to be of the best quality. They carry the smallest degree of investment risk and are generally referred to as “gilt edge.” Interest payments are protected by a large or by an exceptionally stable margin and principal is secure. While the various protective elements are likely to change, such changes as can be visualized are most unlikely to impair the fundamentally strong position of such issues. | |
| Aa | — Bonds rated “Aa” are judged to be of high quality by all standards. Together with the “Aaa” group they comprise what are generally known as high grade bonds. They are rated lower than the best bonds because margins of protection may not be as large as in “Aaa” securities or fluctuation of protective elements may be of greater amplitude or there may be other elements present which make the long-term risks appear somewhat larger than in “Aaa” securities. | |
| A | — Bonds rated “A” possess many favorable investment attributes and are to be considered as upper medium grade obligations. Factors giving security to principal and interest are considered adequate but elements may be present which suggest a susceptibility to impairment some time in the future. | |
| Baa | — Bonds rated “Baa” are considered as medium grade obligations, i.e., they are neither highly protected nor poorly secured. Interest payments and principal security appear adequate for the present but certain protective elements may be lacking or may be characteristically unreliable over any great length of time. Such bonds lack outstanding investment characteristics and in fact have speculative characteristics as well. | |
| Ba | — Bonds rated “Ba” are judged to have speculative elements; their future cannot be considered as well assured. Often the protection of interest and principal payments may be very moderate and therefore not well safeguarded during both good and bad times over the future. Uncertainty of position characterizes bonds in this class. | |
| B | — Bonds rated “B” generally lack characteristics of desirable investments. Assurance of interest and principal payments or of maintenance of other terms of the contract over any long period of time may be small. | |
| Caa | — Bonds rated “Caa” are of poor standing. These may be in default, or present elements of danger may exist with respect to principal or interest. | |
| Ca | — Bonds rated “Ca” represent obligations which are speculative in a high degree. Such issues are often in default or have other marked short-comings. | |
| C | — Bonds rated “C” are the lowest class of bonds and issues so rated can be regarded as having extremely poor prospects of ever attaining any real investment standing. | |
| e | — Expected. | |
| u | — Upgraded. | |
Fitch Ratings Service (“Fitch”) — Ratings from “AA” to “CCC” may be modified by the addition of a plus (+) or minus (-) sign to show relative standings within the major rating categories.
| AAA | — Bonds rated “AAA” have the highest rating assigned by Fitch. Capacity to pay interest and repay principal is extremely strong. | |
| AAApre | — Stable Outlook rating is based on the pledge of securities in the escrow deposit fund securing the bonds and reflects the lien of the refunded bondholders on the escrow trust funds and that all amounts have been invested in direct non-callable obligations of the United States. | |
| AA | — Bonds rated “AA” have a very strong capacity to pay interest and repay principal and differ from the highest rated issues only in a small degree. | |
| A | — Bonds rated “A” have a strong capacity to pay interest and repay principal although they are somewhat more susceptible to the adverse effects of changes in circumstances and economic conditions than debt in higher rated categories. | |
296
| Ratings |
| (continued) |
| BBB | — Bonds rated “BBB” are regarded as having an adequate capacity to pay interest and repay principal. Whereas they normally exhibit adequate protection parameters, adverse economic conditions or changing circumstances are more likely to lead to a weakened capacity to pay interest and repay principal for bonds in this category than in higher rated categories. | |
| BB, B, CCC, CC and C | — Bonds rated “BB”, “B”, “CCC”, “CC” and “C” are regarded, on balance, as predominantly speculative with respect to capacity to pay interest and repay principal in accordance with the terms of the obligation. “BB” represents a lower degree of speculation than “B”, and “CC” the highest degree of speculation. While such bonds will likely have some quality and protective characteristics, these are outweighed by large uncertainties or major risk exposures to adverse conditions. | |
| D | — Bonds rated “D” are in default and payment of interest and/or repayment of principal is in arrears. | |
| NR | — Indicates that the bond is not rated by Standard & Poor’s, Moody’s, or Fitch. | |
| WD, WR | — Indicates that the bonds rating has been withdrawn and the issuer is no longer rated by Standard & Poor’s, Moody’s or Fitch. | |
Short-Term Security Ratings
297
| Statements of Assets and Liabilities |
| August 31, 2021 |
| Large Cap Equity Fund | Small-Mid Cap Equity Fund | International Equity Fund | ||||||||||||||
| ASSETS: | ||||||||||||||||
Unaffiliated investments, at value1,3 | $ | 2,188,422,682 | $ | 734,951,242 | $ | 1,454,649,148 | ||||||||||
Affiliated investments, at value2 | 3,824,540 | — | — | |||||||||||||
Foreign currency, at value4 | — | — | 197,851 | |||||||||||||
Cash | 3,115,723 | 28,416 | 85 | |||||||||||||
Receivable for securities sold | 5,593,860 | 769,565 | 2,435,265 | |||||||||||||
Receivable for TBA securities sold | — | — | — | |||||||||||||
Dividends and interest receivable from unaffiliated investments | 2,387,307 | 445,610 | 7,596,539 | |||||||||||||
Dividends and interest receivable from affiliated investments | — | — | — | |||||||||||||
Receivable for Fund shares sold | 5,590,550 | 2,277,621 | 5,437,934 | |||||||||||||
Unrealized appreciation on open forward foreign currency contracts (Note 1) | — | — | — | |||||||||||||
Variation margin on open future contracts (Note 1) | — | — | 6,926 | |||||||||||||
Variation margin on open centrally cleared swap contracts (Note 1) | — | — | — | |||||||||||||
Unrealized appreciation on open OTC swap contracts | — | — | — | |||||||||||||
Upfront payment paid on open OTC swap contracts | — | — | — | |||||||||||||
Deposits for collateral with counterparty | 974,984 | 162,000 | 120,400 | |||||||||||||
Foreign capital gains tax receivable | — | — | — | |||||||||||||
Prepaid expenses | 56,510 | 26,229 | 94,514 | |||||||||||||
|
|
|
|
|
| |||||||||||
Total Assets | 2,209,966,156 | 738,660,683 | 1,470,538,662 | |||||||||||||
|
|
|
|
|
| |||||||||||
| LIABILITIES: | ||||||||||||||||
Reverse repurchase agreements, at value7 | — | — | — | |||||||||||||
Payable for collateral received from securities on loan | 24,409,909 | 58,746,706 | 6,097,629 | |||||||||||||
Payable for Fund shares repurchased | 6,242,471 | 1,500,329 | 3,190,568 | |||||||||||||
Payable for securities purchased | 3,582,947 | 686,619 | 2,489,177 | |||||||||||||
Payable for TBA securities purchased | — | — | — | |||||||||||||
Payable for sale-buyback transactions | — | — | — | |||||||||||||
Investment management fee payable | 699,230 | 253,919 | 622,883 | |||||||||||||
Transfer agent fees payable | 34,232 | 14,702 | 25,131 | |||||||||||||
Interest expense payable | — | — | — | |||||||||||||
Custody fee payable | 84,350 | 42,926 | 98,773 | |||||||||||||
Trustees’ fees payable | — | — | — | |||||||||||||
Variation margin on open future contracts (Note 1) | 21,830 | 4,139 | — | |||||||||||||
Variation margin on open centrally cleared swap contracts (Note 1) | — | — | — | |||||||||||||
Due to custodian | — | — | — | |||||||||||||
Forward sale commitments, at value5 (Note 1) | — | — | — | |||||||||||||
Options contracts written, at value6 (Note 1) | — | — | — | |||||||||||||
Unrealized depreciation on open OTC swap contracts | — | — | — | |||||||||||||
Upfront payment received on open OTC swap contracts | — | — | — | |||||||||||||
Unrealized depreciation on open forward foreign currency contracts (Note 1) | — | — | — | |||||||||||||
Deposits for collateral from counterparty | — | — | — | |||||||||||||
Foreign capital gains tax payable | — | — | 17,578 | |||||||||||||
Distributions payable | — | — | — | |||||||||||||
Audit fees payable | — | — | — | |||||||||||||
Accrued expenses | 174,382 | 141,266 | 341,451 | |||||||||||||
|
|
|
|
|
| |||||||||||
Total Liabilities | 35,249,351 | 61,390,606 | 12,883,190 | |||||||||||||
|
|
|
|
|
| |||||||||||
| Total Net Assets | $ | 2,174,716,805 | $ | 677,270,077 | $ | 1,457,655,472 | ||||||||||
|
|
|
|
|
| |||||||||||
| NET ASSETS: | ||||||||||||||||
Paid-in-capital (Note 4) | $ | 888,318,882 | $ | 327,464,431 | $ | 1,035,500,834 | ||||||||||
Total distributable earnings (losses) | 1,286,397,923 | 349,805,646 | 422,154,638 | |||||||||||||
|
|
|
|
|
| |||||||||||
| Total Net Assets | $ | 2,174,716,805 | $ | 677,270,077 | $ | 1,457,655,472 | ||||||||||
|
|
|
|
|
| |||||||||||
| Shares Outstanding | 78,847,245 | 27,810,955 | 93,813,579 | |||||||||||||
|
|
|
|
|
| |||||||||||
| Net Asset Value | $ | 27.58 | $ | 24.35 | $ | 15.54 | ||||||||||
|
|
|
|
|
| |||||||||||
| 1 Unaffiliated investments, at cost | $ | 1,059,242,615 | $ | 482,421,812 | $ | 1,093,429,196 | ||||||||||
|
|
|
|
|
| |||||||||||
| 2 Affiliated investments, at cost | $ | 868,742 | $ | — | $ | — | ||||||||||
|
|
|
|
|
| |||||||||||
| 3 Includes securities on loan | $ | 23,855,008 | $ | 57,666,535 | $ | 5,868,796 | ||||||||||
|
|
|
|
|
| |||||||||||
| 4 Foreign currency, at cost | $ | — | $ | — | $ | 190,078 | ||||||||||
|
|
|
|
|
| |||||||||||
| 5 Proceeds received | $ | — | $ | — | $ | — | ||||||||||
|
|
|
|
|
| |||||||||||
| 6 Premiums received | $ | — | $ | — | $ | — | ||||||||||
|
|
|
|
|
| |||||||||||
| 7 Proceeds of reverse repurchase agreement | $ | — | $ | — | $ | — | ||||||||||
|
|
|
|
|
| |||||||||||
See Notes to Financial Statements.
298
| Emerging Markets Equity Fund | Core Fixed Income Fund | High Yield Fund | International Fixed Income Fund | Municipal Bond Fund | Inflation-Linked Fixed Income Fund | Ultra-Short Term Fixed Income Fund | Alternative Strategies Fund | |||||||||||||||||||||||||||
| $ | 568,061,121 | $ | 1,418,074,265 | $ | 210,673,754 | $ | 170,912,410 | $ | 91,010,949 | $ | 197,595,572 | $ | 438,335,472 | $ | 116,946,570 | |||||||||||||||||||
| — | 1,370,511 | — | — | — | — | 508,348 | — | |||||||||||||||||||||||||||
| 1,845,933 | 2,364,337 | — | 261,010 | — | 458,775 | 187 | — | |||||||||||||||||||||||||||
| 45 | 3,628 | — | — | 11 | 393,452 | 19 | 2,232,455 | |||||||||||||||||||||||||||
| 1,010,347 | 3,905,419 | 1,066,309 | 2,415,526 | — | 27,670 | 3,049,218 | — | |||||||||||||||||||||||||||
| — | 97,334,741 | — | 39,255,655 | — | 5,727,721 | — | — | |||||||||||||||||||||||||||
| 727,241 | 5,769,724 | 2,616,452 | 642,353 | 768,625 | 300,636 | 1,115,342 | — | |||||||||||||||||||||||||||
| — | — | — | — | — | — | 98 | — | |||||||||||||||||||||||||||
| 2,351,001 | 4,728,374 | 903,896 | 626,880 | 671,878 | 543,517 | 2,107,376 | 1,493,428 | |||||||||||||||||||||||||||
| — | 211,170 | — | 765,558 | — | 176,757 | 1,169,623 | — | |||||||||||||||||||||||||||
| 24,197 | — | — | — | — | 63,470 | |||||||||||||||||||||||||||||
| — | — | — | 85,897 | — | 185,802 | 408,219 | — | |||||||||||||||||||||||||||
| — | — | — | 177,788 | — | — | — | — | |||||||||||||||||||||||||||
| — | 7,443 | — | 29,226 | — | — | — | — | |||||||||||||||||||||||||||
| 95,994 | 4,173,708 | — | 689,000 | — | 856,000 | 1,296,000 | — | |||||||||||||||||||||||||||
| 68,397 | — | — | — | — | — | — | — | |||||||||||||||||||||||||||
| 34,454 | 76,901 | 46,281 | 16,711 | 17,487 | 35,113 | 17,232 | 4,457 | |||||||||||||||||||||||||||
|
|
|
|
|
|
|
|
|
|
|
|
|
|
|
| |||||||||||||||||||
| 574,218,730 | 1,538,020,221 | 215,306,692 | 215,878,014 | 92,468,950 | 206,364,485 | 448,007,134 | 120,676,910 | |||||||||||||||||||||||||||
|
|
|
|
|
|
|
|
|
|
|
|
|
|
|
| |||||||||||||||||||
| — | — | — | — | — | 37,952,296 | — | — | |||||||||||||||||||||||||||
| 7,559,575 | — | 129,000 | — | — | — | — | — | |||||||||||||||||||||||||||
| 1,182,613 | 4,639,040 | 1,183,781 | 508,599 | 187,946 | 1,458,375 | 1,195,661 | 58,274 | |||||||||||||||||||||||||||
| 1,450,051 | 15,271,624 | 593,222 | 3,322,079 | 381,600 | 327,294 | 2,786,347 | 1,650,210 | |||||||||||||||||||||||||||
| — | 204,019,433 | — | 40,389,065 | — | 11,443,950 | — | — | |||||||||||||||||||||||||||
| — | — | — | — | — | 6,310,170 | — | — | |||||||||||||||||||||||||||
| 262,023 | 407,451 | 86,898 | 57,870 | 29,758 | 55,376 | 162,174 | 18,243 | |||||||||||||||||||||||||||
| 12,684 | 38,281 | 6,870 | 2,453 | 1,250 | 4,843 | 12,581 | 1,264 | |||||||||||||||||||||||||||
| — | — | — | — | — | 869 | — | — | |||||||||||||||||||||||||||
| 61,379 | 167,904 | 42,505 | 62,954 | 10,540 | 30,556 | 39,695 | 12,697 | |||||||||||||||||||||||||||
| — | 7,558 | 1,131 | — | — | 2,490 | 2,989 | — | |||||||||||||||||||||||||||
| — | 1,450,715 | — | 81,912 | 167 | — | 98,419 | — | |||||||||||||||||||||||||||
| — | 29,071 | — | — | — | — | — | — | |||||||||||||||||||||||||||
| — | — | 2,280 | 1,822 | — | — | — | — | |||||||||||||||||||||||||||
| — | — | — | 13,901,464 | — | — | — | — | |||||||||||||||||||||||||||
| — | 148,156 | — | 94,870 | — | 165,647 | — | — | |||||||||||||||||||||||||||
| — | 150,045 | — | 442,865 | — | — | — | — | |||||||||||||||||||||||||||
| — | — | — | 138,149 | — | — | — | — | |||||||||||||||||||||||||||
| — | 193,507 | — | 284,059 | — | 7,462 | 204,061 | — | |||||||||||||||||||||||||||
| — | — | — | 710,000 | — | 120,000 | 1,320,000 | — | |||||||||||||||||||||||||||
| 518,979 | — | — | — | — | — | — | — | |||||||||||||||||||||||||||
| — | 2,019 | 1,103 | — | 575 | 1,106 | — | — | |||||||||||||||||||||||||||
| — | — | — | — | 73,195 | — | — | — | |||||||||||||||||||||||||||
| 223,945 | 298,031 | 167,325 | 151,202 | 14,872 | 207,236 | 229,330 | 70,882 | |||||||||||||||||||||||||||
|
|
|
|
|
|
|
|
|
|
|
|
|
|
|
| |||||||||||||||||||
| 11,271,249 | 226,822,835 | 2,214,115 | 60,149,363 | 699,903 | 58,087,670 | 6,051,257 | 1,811,570 | |||||||||||||||||||||||||||
|
|
|
|
|
|
|
|
|
|
|
|
|
|
|
| |||||||||||||||||||
| $ | 562,947,481 | $ | 1,311,197,386 | $ | 213,092,577 | $ | 155,728,651 | $ | 91,769,047 | $ | 148,276,815 | $ | 441,955,877 | $ | 118,865,340 | |||||||||||||||||||
|
|
|
|
|
|
|
|
|
|
|
|
|
|
|
| |||||||||||||||||||
| $ | 407,509,628 | $ | 1,281,273,023 | $ | 215,524,494 | $ | 150,224,729 | $ | 86,489,558 | $ | 130,887,794 | $ | 450,313,769 | $ | 112,241,137 | |||||||||||||||||||
| 155,437,853 | 29,924,363 | (2,431,917 | ) | 5,503,922 | 5,279,489 | 17,389,021 | (8,357,892 | ) | 6,624,203 | |||||||||||||||||||||||||
|
|
|
|
|
|
|
|
|
|
|
|
|
|
|
| |||||||||||||||||||
| $ | 562,947,481 | $ | 1,311,197,386 | $ | 213,092,577 | $ | 155,728,651 | $ | 91,769,047 | $ | 148,276,815 | $ | 441,955,877 | $ | 118,865,340 | |||||||||||||||||||
|
|
|
|
|
|
|
|
|
|
|
|
|
|
|
| |||||||||||||||||||
| 32,276,447 | 156,207,601 | 57,224,542 | 19,188,362 | 9,563,635 | 13,290,374 | 44,684,350 | 10,815,911 | |||||||||||||||||||||||||||
|
|
|
|
|
|
|
|
|
|
|
|
|
|
|
| |||||||||||||||||||
| $ | 17.44 | $ | 8.39 | $ | 3.72 | $ | 8.12 | $ | 9.60 | $ | 11.16 | $ | 9.89 | $ | 10.99 | |||||||||||||||||||
|
|
|
|
|
|
|
|
|
|
|
|
|
|
|
| |||||||||||||||||||
| $ | 420,355,817 | $ | 1,389,106,723 | $ | 203,270,289 | $ | 165,530,558 | $ | 86,337,620 | $ | 182,127,211 | $ | 436,054,732 | $ | 110,971,224 | |||||||||||||||||||
|
|
|
|
|
|
|
|
|
|
|
|
|
|
|
| |||||||||||||||||||
| $ | — | $ | 1,347,582 | $ | — | $ | — | $ | — | $ | — | $ | 508,416 | $ | — | |||||||||||||||||||
|
|
|
|
|
|
|
|
|
|
|
|
|
|
|
| |||||||||||||||||||
| $ | 7,664,872 | $ | — | $ | 129,000 | $ | — | $ | — | $ | — | $ | — | $ | — | |||||||||||||||||||
|
|
|
|
|
|
|
|
|
|
|
|
|
|
|
| |||||||||||||||||||
| $ | 1,834,981 | $ | 2,358,011 | $ | — | $ | 309,009 | $ | — | $ | 585,239 | $ | — | $ | — | |||||||||||||||||||
|
|
|
|
|
|
|
|
|
|
|
|
|
|
|
| |||||||||||||||||||
| $ | — | $ | — | $ | — | $ | 13,906,386 | $ | — | $ | — | $ | — | $ | — | |||||||||||||||||||
|
|
|
|
|
|
|
|
|
|
|
|
|
|
|
| |||||||||||||||||||
| $ | — | $ | 255,880 | $ | — | $ | 188,765 | $ | — | $ | 147,887 | $ | — | $ | — | |||||||||||||||||||
|
|
|
|
|
|
|
|
|
|
|
|
|
|
|
| |||||||||||||||||||
| $ | — | $ | — | $ | — | $ | — | $ | — | $ | 37,952,296 | $ | — | $ | — | |||||||||||||||||||
|
|
|
|
|
|
|
|
|
|
|
|
|
|
|
| |||||||||||||||||||
See Notes to Financial Statements.
299
| Statements of Operations |
| For the Year Ended August 31, 2021 |
| Large Cap Equity Fund | Small-Mid Cap Equity Fund | International Equity Fund | ||||||||||||||
| INVESTMENT INCOME: | ||||||||||||||||
Dividends from unaffiliated investments | $ | 27,399,375 | $ | 8,020,946 | $ | 32,831,668 | ||||||||||
Dividends from affiliated investments | 65,417 | — | — | |||||||||||||
Interest from unaffiliated investments | 3,331 | 19,864 | 20,768 | |||||||||||||
Interest from affiliated investments | — | — | — | |||||||||||||
Income from securities lending | 149,575 | 181,236 | 165,899 | |||||||||||||
Less: Foreign taxes withheld (see Note 1s) | (25,551 | ) | (16,820 | ) | (3,202,271 | ) | ||||||||||
Miscellaneous income | — | — | 6,909 | |||||||||||||
|
|
|
|
|
| |||||||||||
Total Investment Income | 27,592,147 | 8,205,226 | 29,822,973 | |||||||||||||
|
|
|
|
|
| |||||||||||
| EXPENSES: | ||||||||||||||||
Investment management fee (Note 2) | 11,927,520 | 5,518,266 | 9,619,108 | |||||||||||||
Transfer agent fees | 223,184 | 81,739 | 153,239 | |||||||||||||
Custody fees | 498,136 | 245,930 | 840,676 | |||||||||||||
Trustees’ fees | 339,557 | 116,507 | 196,333 | |||||||||||||
Shareholder reports | 170,451 | 133,074 | 271,787 | |||||||||||||
Insurance | 89,678 | 29,919 | 52,578 | |||||||||||||
Audit and tax | 101,143 | 99,205 | 150,443 | |||||||||||||
Legal fees | 97,995 | 34,508 | 44,282 | |||||||||||||
Registration fees | 34,302 | 31,379 | 36,360 | |||||||||||||
Other expense | 82,185 | 27,291 | 105,318 | |||||||||||||
Interest expense | — | — | — | |||||||||||||
|
|
|
|
|
| |||||||||||
Total Expenses | 13,564,151 | 6,317,818 | 11,470,124 | |||||||||||||
Less: Fee waivers and/or expense reimbursement (Note 2) | (4,123,697 | ) | (2,345,388 | ) | (2,289,028 | ) | ||||||||||
|
|
|
|
|
| |||||||||||
Net Expenses | 9,440,454 | 3,972,430 | 9,181,096 | |||||||||||||
|
|
|
|
|
| |||||||||||
Net Investment Income (Loss) | $ | 18,151,693 | $ | 4,232,796 | $ | 20,641,877 | ||||||||||
|
|
|
|
|
| |||||||||||
| REALIZED AND UNREALIZED GAIN (LOSS) ON INVESTMENTS, FUTURES CONTRACTS, OPTIONS CONTRACTS WRITTEN, UNFUNDED LOAN COMMITMENTS, SHORT SALES, FORWARD SALE COMMITMENTS, SWAP CONTRACTS, FORWARD FOREIGN CURRENCY CONTRACTS, FOREIGN CURRENCY TRANSLATIONS AND CAPITAL GAIN DISTRIBUTIONS RECEIVED (NOTES 1 AND 3): | ||||||||||||||||
Net Realized Gain (Loss) from: | ||||||||||||||||
Unaffiliated Investments | $ | 172,779,122 | $ | 102,688,779 | $ | 167,543,576 | ||||||||||
Affiliated investments | 137,354 | — | — | |||||||||||||
Futures contracts | 4,104,681 | 2,124,304 | 404,067 | |||||||||||||
Options contracts written | — | — | — | |||||||||||||
Forward sale commitments | — | — | — | |||||||||||||
Short sales | — | — | — | |||||||||||||
Swap contracts | — | — | — | |||||||||||||
Forward foreign currency contracts | — | — | — | |||||||||||||
Foreign currency translations | 219,731 | 48,830 | (172,832 | ) | ||||||||||||
Capital gain distributions received | — | — | — | |||||||||||||
|
|
|
|
|
| |||||||||||
Net Realized Gain (Loss): | 177,240,888 | 104,861,913 | 167,774,811 | |||||||||||||
|
|
|
|
|
| |||||||||||
Change in Net Unrealized Appreciation (Depreciation) from: | ||||||||||||||||
Unaffiliated Investments | 354,098,970 | 129,180,343 | 156,646,420 | (b) | ||||||||||||
Affiliated Investments | 2,030,039 | — | — | |||||||||||||
Futures contracts | (185,400 | ) | (404,863 | ) | 12,913 | |||||||||||
Options contracts written | — | — | — | |||||||||||||
Forward sale commitments | — | — | — | |||||||||||||
Swap contracts | — | — | — | |||||||||||||
Unfunded loan commitments | — | — | — | |||||||||||||
Forward foreign currency contracts | — | — | — | |||||||||||||
Foreign currency transactions | 679 | 529 | (123,999 | ) | ||||||||||||
|
|
|
|
|
| |||||||||||
Change in Net Unrealized Appreciation (Depreciation): | 355,944,288 | 128,776,009 | 156,535,334 | |||||||||||||
|
|
|
|
|
| |||||||||||
Net Gain (Loss) on Investments, Futures Contracts, Options Contracts Written, Unfunded Loan Commitments, Forward Sale Commitments, Short Sales, Swap Contracts, Forward Foreign Currency Contract, Foreign Currency Translations and Capital Gain Distributions Received | 533,185,176 | 233,637,922 | 324,310,145 | |||||||||||||
|
|
|
|
|
| |||||||||||
Total Increase (Decrease) in Net Assets from Operations | $ | 551,336,869 | $ | 237,870,718 | $ | 344,952,022 | ||||||||||
|
|
|
|
|
| |||||||||||
| (a) | Includes foreign capital gains tax of $(1,342) for Emerging Markets Equity Fund. |
| (b) | Includes Net increase in accrued foreign capital gains taxes of $17,578 and $943,197 for International Equity Fund and Emerging Markets Equity Fund, respectively. |
See Notes to Financial Statements.
300
| Emerging Markets Equity Fund | Core Fixed Income Fund | High Yield Fund | International Fixed Income Fund | Municipal Bond Fund | Inflation-Linked Fixed Income Fund | Ultra-Short Term Fixed Income Fund | Alternative Strategies Fund | |||||||||||||||||||||||||||
| $ | 13,371,909 | $ | — | $ | 100,376 | $ | — | $ | 18,275 | $ | — | $ | — | $ | 1,286,219 | |||||||||||||||||||
| — | — | — | — | — | — | — | — | |||||||||||||||||||||||||||
| 9,876 | 22,794,266 | 15,126,664 | 2,643,343 | 1,887,043 | 9,158,918 | 4,688,755 | 93 | |||||||||||||||||||||||||||
| — | 43,391 | — | — | — | — | 6,080 | — | |||||||||||||||||||||||||||
| 47,366 | — | 3,076 | — | — | — | — | — | |||||||||||||||||||||||||||
| (1,724,908 | ) | — | — | — | — | — | — | — | ||||||||||||||||||||||||||
| — | — | 98 | 187 | — | — | — | — | |||||||||||||||||||||||||||
|
|
|
|
|
|
|
|
|
|
|
|
|
|
|
| |||||||||||||||||||
| 11,704,243 | 22,837,657 | 15,230,214 | 2,643,530 | 1,905,318 | 9,158,918 | 4,694,835 | 1,286,312 | |||||||||||||||||||||||||||
|
|
|
|
|
|
|
|
|
|
|
|
|
|
|
| |||||||||||||||||||
| 5,332,465 | 4,327,633 | 1,920,564 | 717,752 | 299,531 | 767,970 | 2,104,173 | 859,139 | |||||||||||||||||||||||||||
| 69,730 | 136,356 | 33,993 | 15,733 | 8,223 | 19,657 | 52,328 | 7,706 | |||||||||||||||||||||||||||
| 658,743 | 938,233 | 289,850 | 378,711 | 106,129 | 183,415 | 237,450 | 106,338 | |||||||||||||||||||||||||||
| 64,271 | 187,173 | 49,538 | 25,170 | 11,141 | 26,132 | 70,376 | 6,915 | |||||||||||||||||||||||||||
| 189,258 | 149,351 | 156,495 | 60,963 | 12,758 | 69,588 | 95,241 | 17,280 | |||||||||||||||||||||||||||
| 23,684 | 61,619 | 12,323 | 6,895 | 3,056 | 33,668 | 29,668 | 1,952 | |||||||||||||||||||||||||||
| 133,180 | 145,367 | 127,794 | 139,576 | 88,070 | 126,125 | 117,883 | 70,822 | |||||||||||||||||||||||||||
| 32,168 | 56,582 | 13,048 | 7,016 | 3,232 | 7,205 | 20,104 | 4,363 | |||||||||||||||||||||||||||
| 34,971 | 5,634 | 22,868 | 24,229 | 18,158 | 380 | 33,276 | 37,756 | |||||||||||||||||||||||||||
| 50,806 | 74,308 | 12,255 | 21,543 | 4,497 | 148,534 | 68,427 | 3,757 | |||||||||||||||||||||||||||
| — | — | — | 2,873 | — | 47,594 | 2,671 | — | |||||||||||||||||||||||||||
|
|
|
|
|
|
|
|
|
|
|
|
|
|
|
| |||||||||||||||||||
| 6,589,276 | 6,082,256 | 2,638,728 | 1,400,461 | 554,795 | 1,430,268 | 2,831,597 | 1,116,028 | |||||||||||||||||||||||||||
| (1,874,842 | ) | (220,958 | ) | (557,917 | ) | (75,250 | ) | — | (77,960 | ) | (224,510 | ) | (715,949 | ) | ||||||||||||||||||||
|
|
|
|
|
|
|
|
|
|
|
|
|
|
|
| |||||||||||||||||||
| 4,714,434 | 5,861,298 | 2,080,811 | 1,325,211 | 554,795 | 1,352,308 | 2,607,087 | 400,079 | |||||||||||||||||||||||||||
|
|
|
|
|
|
|
|
|
|
|
|
|
|
|
| |||||||||||||||||||
| $ | 6,989,809 | $ | 16,976,359 | $ | 13,149,403 | $ | 1,318,319 | $ | 1,350,523 | $ | 7,806,610 | $ | 2,087,748 | $ | 886,233 | |||||||||||||||||||
|
|
|
|
|
|
|
|
|
|
|
|
|
|
|
| |||||||||||||||||||
| $ | 69,526,237 | (a) | $ | 8,941,333 | $ | 15,053,510 | $ | 2,351,394 | $ | 165,283 | $ | 3,682,004 | $ | 2,060,485 | $ | 479,565 | ||||||||||||||||||
| — | (2,976 | ) | — | — | — | — | 358 | — | ||||||||||||||||||||||||||
| 393,117 | 2,019,649 | 36,834 | 1,433,956 | 86,760 | 695,344 | (549,859 | ) | — | ||||||||||||||||||||||||||
| — | 1,458,601 | — | 371,356 | — | 110,896 | — | — | |||||||||||||||||||||||||||
| — | — | — | (14,141 | ) | — | (13,072 | ) | — | — | |||||||||||||||||||||||||
| — | 562 | — | 134 | — | 148,198 | 9,654 | — | |||||||||||||||||||||||||||
| — | (1,985,972 | ) | — | (313,953 | ) | — | (570,240 | ) | (1,315,901 | ) | — | |||||||||||||||||||||||
| (19,460 | ) | 1,294,394 | — | (564,199 | ) | — | (394,408 | ) | (1,975,680 | ) | — | |||||||||||||||||||||||
| (426,351 | ) | 96,953 | — | 171,899 | — | 100,710 | 245,236 | — | ||||||||||||||||||||||||||
| — | — | — | — | — | — | — | 609,880 | |||||||||||||||||||||||||||
|
|
|
|
|
|
|
|
|
|
|
|
|
|
|
| |||||||||||||||||||
| 69,473,543 | 11,822,544 | 15,090,344 | 3,436,446 | 252,043 | 3,759,432 | (1,525,707 | ) | 1,089,445 | ||||||||||||||||||||||||||
|
|
|
|
|
|
|
|
|
|
|
|
|
|
|
| |||||||||||||||||||
| 38,941,278 | (b) | (18,569,286 | ) | (5,759,305 | ) | (3,512,454 | ) | 610,471 | (3,266,235 | ) | (529,933 | ) | 4,616,128 | |||||||||||||||||||||
| — | (15,004 | ) | — | — | — | — | 7,748 | — | ||||||||||||||||||||||||||
| (123,799 | ) | (988,051 | ) | (580 | ) | (47,140 | ) | (148 | ) | (151,188 | ) | (393,033 | ) | — | ||||||||||||||||||||
| — | 72,906 | — | (26,925 | ) | — | (22,842 | ) | — | — | |||||||||||||||||||||||||
| — | — | — | (1,562 | ) | — | — | — | — | ||||||||||||||||||||||||||
| — | 2,889,913 | — | 845 | — | 98,425 | 1,072,581 | — | |||||||||||||||||||||||||||
| — | 1,293 | 786 | — | — | — | — | — | |||||||||||||||||||||||||||
| — | (83,561 | ) | — | 1,368,443 | — | 613,794 | 1,855,605 | — | ||||||||||||||||||||||||||
| 42,670 | (51,122 | ) | — | 49,750 | — | (113,412 | ) | (84,157 | ) | — | ||||||||||||||||||||||||
|
|
|
|
|
|
|
|
|
|
|
|
|
|
|
| |||||||||||||||||||
| 38,860,149 | (16,742,912 | ) | (5,759,099 | ) | (2,169,043 | ) | 610,323 | (2,841,458 | ) | 1,928,811 | 4,616,128 | |||||||||||||||||||||||
|
|
|
|
|
|
|
|
|
|
|
|
|
|
|
| |||||||||||||||||||
| | | (4,920,368 | ) | 9,331,245 | 1,267,403 | 862,366 | 917,974 | 403,104 | 5,705,573 | ||||||||||||||||||||||||
|
|
|
|
|
|
|
|
|
|
|
|
|
|
|
| |||||||||||||||||||
| $ | 115,323,501 | $ | 12,055,991 | $ | 22,480,648 | $ | 2,585,722 | $ | 2,212,889 | $ | 8,724,584 | $ | 2,490,852 | $ | 6,591,806 | |||||||||||||||||||
|
|
|
|
|
|
|
|
|
|
|
|
|
|
|
| |||||||||||||||||||
See Notes to Financial Statements.
301
| Statements of Changes in Net Assets |
| For the Years Ended August 31, 2021 and August 31, 2020 |
| Large Cap Equity Fund | Small-Mid Cap Equity Fund | |||||||||||||||||||
| 2021 | 2020 | 2021 | 2020 | |||||||||||||||||
| OPERATIONS: | ||||||||||||||||||||
Net investment income | $ | 18,151,693 | $ | 21,440,336 | $ | 4,232,796 | $ | 3,758,140 | ||||||||||||
Net realized gain (loss) | 177,240,888 | 19,442,182 | 104,861,913 | 18,298,269 | ||||||||||||||||
Change in unrealized appreciation (depreciation) | 355,944,288 | 279,852,393 | 128,776,009 | 70,173,608 | ||||||||||||||||
|
|
|
|
|
|
|
| |||||||||||||
Increase (Decrease) in Net Assets from Operations | 551,336,869 | 320,734,911 | 237,870,718 | 92,230,017 | ||||||||||||||||
|
|
|
|
|
|
|
| |||||||||||||
| DISTRIBUTIONS TO SHAREHOLDERS FROM (NOTE 1): | ||||||||||||||||||||
Distributable earnings | (61,943,407 | ) | (77,893,014 | ) | (29,404,878 | ) | (49,102,404 | ) | ||||||||||||
|
|
|
|
|
|
|
| |||||||||||||
Decrease in Net Assets from Distributions to Shareholders | (61,943,407 | ) | (77,893,014 | ) | (29,404,878 | ) | (49,102,404 | ) | ||||||||||||
|
|
|
|
|
|
|
| |||||||||||||
| FUND SHARE TRANSACTIONS (NOTE 4): | ||||||||||||||||||||
Net proceeds from sale of shares | 405,330,578 | 321,453,670 | 141,489,301 | 224,150,769 | ||||||||||||||||
Reinvestment of distributions | 61,942,619 | 77,891,987 | 29,404,580 | 49,101,666 | ||||||||||||||||
Cost of shares repurchased | (635,750,721 | ) | (342,309,841 | ) | (322,250,629 | ) | (118,873,225 | ) | ||||||||||||
|
|
|
|
|
|
|
| |||||||||||||
Increase (Decrease) in Net Assets from Fund Share Transactions | (168,477,524 | ) | 57,035,816 | (151,356,748 | ) | 154,379,210 | ||||||||||||||
|
|
|
|
|
|
|
| |||||||||||||
Increase (Decrease) in Net Assets | 320,915,938 | 299,877,713 | 57,109,092 | 197,506,823 | ||||||||||||||||
| NET ASSETS: | ||||||||||||||||||||
Beginning of year | 1,853,800,867 | 1,553,923,154 | 620,160,985 | 422,654,162 | ||||||||||||||||
|
|
|
|
|
|
|
| |||||||||||||
End of year | $ | 2,174,716,805 | $ | 1,853,800,867 | $ | 677,270,077 | $ | 620,160,985 | ||||||||||||
|
|
|
|
|
|
|
| |||||||||||||
See Notes to Financial Statements.
302
| International Equity Fund | Emerging Markets Equity Fund | Core Fixed Income Fund | High Yield Fund | |||||||||||||||||||||||||||||||
| 2021 | 2020 | 2021 | 2020 | 2021 | 2020 | 2021 | 2020 | |||||||||||||||||||||||||||
| $ | 20,641,877 | $ | 18,756,406 | $ | 6,989,809 | $ | 7,383,197 | $ | 16,976,359 | $ | 24,841,167 | $ | 13,149,403 | $ | 6,162,629 | |||||||||||||||||||
| 167,774,811 | (54,438,549 | ) | 69,473,543 | (6,703,990 | ) | 11,822,544 | 30,152,010 | 15,090,344 | 1,064,607 | |||||||||||||||||||||||||
| 156,535,334 | 152,867,728 | 38,860,149 | 43,039,982 | (16,742,912 | ) | 5,231,747 | (5,759,099 | ) | 14,291,695 | |||||||||||||||||||||||||
|
|
|
|
|
|
|
|
|
|
|
|
|
|
|
| |||||||||||||||||||
| 344,952,022 | 117,185,585 | 115,323,501 | 43,719,189 | 12,055,991 | 60,224,924 | 22,480,648 | 21,518,931 | |||||||||||||||||||||||||||
|
|
|
|
|
|
|
|
|
|
|
|
|
|
|
| |||||||||||||||||||
| (23,968,738 | ) | (36,438,560 | ) | (11,972,541 | ) | (9,873,780 | ) | (52,680,365 | ) | (31,609,573 | ) | (13,565,430 | ) | (6,497,717 | ) | |||||||||||||||||||
|
|
|
|
|
|
|
|
|
|
|
|
|
|
|
| |||||||||||||||||||
| | (23,968,738 | ) | (36,438,560 | ) | (11,972,541 | ) | (9,873,780 | ) | (52,680,365 | ) | (31,609,573 | ) | (13,565,430 | ) | (6,497,717 | ) | ||||||||||||||||||
|
|
|
|
|
|
|
|
|
|
|
|
|
|
|
| |||||||||||||||||||
| 303,055,088 | 270,691,117 | 135,269,799 | 104,378,670 | 630,592,342 | 191,008,875 | 96,770,236 | 235,542,532 | |||||||||||||||||||||||||||
| 23,968,252 | 36,437,906 | 11,972,351 | 9,873,619 | 52,679,124 | 31,609,499 | 13,564,992 | 6,497,134 | |||||||||||||||||||||||||||
| (444,679,701 | ) | (444,589,318 | ) | (236,058,440 | ) | (92,236,972 | ) | (312,565,000 | ) | (473,650,990 | ) | (188,399,602 | ) | (23,730,182 | ) | |||||||||||||||||||
|
|
|
|
|
|
|
|
|
|
|
|
|
|
|
| |||||||||||||||||||
| (117,656,361 | ) | (137,460,295 | ) | (88,816,290 | ) | 22,015,317 | 370,706,466 | (251,032,616 | ) | (78,064,374 | ) | 218,309,484 | ||||||||||||||||||||||
|
|
|
|
|
|
|
|
|
|
|
|
|
|
|
| |||||||||||||||||||
| 203,326,923 | (56,713,270 | ) | 14,534,670 | 55,860,726 | 330,082,092 | (222,417,265 | ) | (69,149,156 | ) | 233,330,698 | ||||||||||||||||||||||||
| 1,254,328,549 | 1,311,041,819 | 548,412,811 | 492,552,085 | 981,115,294 | 1,203,532,559 | 282,241,733 | 48,911,035 | |||||||||||||||||||||||||||
|
|
|
|
|
|
|
|
|
|
|
|
|
|
|
| |||||||||||||||||||
| $ | 1,457,655,472 | $ | 1,254,328,549 | $ | 562,947,481 | $ | 548,412,811 | $ | 1,311,197,386 | $ | 981,115,294 | $ | 213,092,577 | $ | 282,241,733 | |||||||||||||||||||
|
|
|
|
|
|
|
|
|
|
|
|
|
|
|
| |||||||||||||||||||
See Notes to Financial Statements.
303
| Statements of Changes in Net Assets |
| For the Years Ended August 31, 2021 and August 31, 2020 |
| International Fixed Income Fund | Municipal Bond Fund | |||||||||||||||||||
| 2021 | 2020 | 2021 | 2020 | |||||||||||||||||
| OPERATIONS: | ||||||||||||||||||||
Net investment income | $ | 1,318,319 | $ | 3,436,997 | $ | 1,350,523 | $ | 1,667,203 | ||||||||||||
Net realized gain (loss) | 3,436,446 | (1,362,833 | ) | 252,043 | 404,902 | |||||||||||||||
Change in unrealized appreciation (depreciation) | (2,169,043 | ) | (1,863,189 | ) | 610,323 | (1,385,198 | ) | |||||||||||||
|
|
|
|
|
|
|
| |||||||||||||
Increase (Decrease) in Net Assets from Operations | 2,585,722 | 210,975 | 2,212,889 | 686,907 | ||||||||||||||||
|
|
|
|
|
|
|
| |||||||||||||
| DISTRIBUTIONS TO SHAREHOLDERS FROM (NOTE 1): | ||||||||||||||||||||
Distributable earnings | (993,150 | ) | (6,470,801 | ) | (1,694,828 | ) | (2,196,820 | ) | ||||||||||||
|
|
|
|
|
|
|
| |||||||||||||
Decrease in Net Assets from Distributions to Shareholders | (993,150 | ) | (6,470,801 | ) | (1,694,828 | ) | (2,196,820 | ) | ||||||||||||
|
|
|
|
|
|
|
| |||||||||||||
| FUND SHARE TRANSACTIONS (NOTE 4): | ||||||||||||||||||||
Net proceeds from sale of shares | 61,446,770 | 25,151,017 | 42,586,476 | 14,213,472 | ||||||||||||||||
Reinvestment of distributions | 993,140 | 6,470,738 | 1,694,319 | 2,196,764 | ||||||||||||||||
Cost of shares repurchased | (43,465,854 | ) | (37,198,843 | ) | (22,177,139 | ) | (31,387,627 | ) | ||||||||||||
|
|
|
|
|
|
|
| |||||||||||||
Increase (Decrease) in Net Assets from Fund Share Transactions | 18,974,056 | (5,577,088 | ) | 22,103,656 | (14,977,391 | ) | ||||||||||||||
|
|
|
|
|
|
|
| |||||||||||||
Increase (Decrease) in Net Assets | 20,566,628 | (11,836,914 | ) | 22,621,717 | (16,487,304 | ) | ||||||||||||||
| NET ASSETS: | ||||||||||||||||||||
Beginning of year | 135,162,023 | 146,998,937 | 69,147,330 | 85,634,634 | ||||||||||||||||
|
|
|
|
|
|
|
| |||||||||||||
End of year | $ | 155,728,651 | $ | 135,162,023 | $ | 91,769,047 | $ | 69,147,330 | ||||||||||||
|
|
|
|
|
|
|
| |||||||||||||
See Notes to Financial Statements.
304
| Inflation-Linked Fixed Income Fund | Ultra-Short Term Fixed Income Fund | Alternative Strategies Fund | ||||||||||||||||||||||||
| 2021 | 2020 | 2021 | 2020 | 2021 | 2020 | |||||||||||||||||||||
| $ | 7,806,610 | $ | 3,312,713 | $ | 2,087,748 | $ | 8,143,799 | $ | 886,233 | $ | 498,606 | |||||||||||||||
| 3,759,432 | 3,766,463 | (1,525,707 | ) | (4,821,061 | ) | 1,089,445 | (272,883 | ) | ||||||||||||||||||
| (2,841,458 | ) | 8,074,864 | 1,928,811 | 4,882,612 | 4,616,128 | 483,310 | ||||||||||||||||||||
|
|
|
|
|
|
|
|
|
|
|
| |||||||||||||||
| 8,724,584 | 15,154,040 | 2,490,852 | 8,205,350 | 6,591,806 | 709,033 | |||||||||||||||||||||
|
|
|
|
|
|
|
|
|
|
|
| |||||||||||||||
| (8,155,061 | ) | (2,532,631 | ) | (6,604,435 | ) | (7,631,973 | ) | (482,881 | ) | (996,291 | ) | |||||||||||||||
|
|
|
|
|
|
|
|
|
|
|
| |||||||||||||||
| (8,155,061 | ) | (2,532,631 | ) | (6,604,435 | ) | (7,631,973 | ) | (482,881 | ) | (996,291 | ) | |||||||||||||||
|
|
|
|
|
|
|
|
|
|
|
| |||||||||||||||
| 68,928,239 | 29,664,160 | 196,780,874 | 92,942,173 | 85,736,630 | 24,543,385 | |||||||||||||||||||||
| 8,153,862 | 2,532,629 | 6,604,469 | 7,632,233 | 482,881 | 996,291 | |||||||||||||||||||||
| (85,167,803 | ) | (105,689,502 | ) | (155,412,273 | ) | (200,341,040 | ) | (12,798,941 | ) | (12,767,133 | ) | |||||||||||||||
|
|
|
|
|
|
|
|
|
|
|
| |||||||||||||||
| (8,085,702 | ) | (73,492,713 | ) | 47,973,070 | (99,766,634 | ) | 73,420,570 | 12,772,543 | ||||||||||||||||||
|
|
|
|
|
|
|
|
|
|
|
| |||||||||||||||
| (7,516,179 | ) | (60,871,304 | ) | 43,859,487 | (99,193,257 | ) | 79,529,495 | 12,485,285 | ||||||||||||||||||
| 155,792,994 | 216,664,298 | 398,096,390 | 497,289,647 | 39,335,845 | 26,850,560 | |||||||||||||||||||||
|
|
|
|
|
|
|
|
|
|
|
| |||||||||||||||
| $ | 148,276,815 | $ | 155,792,994 | $ | 441,955,877 | $ | 398,096,390 | $ | 118,865,340 | $ | 39,335,845 | |||||||||||||||
|
|
|
|
|
|
|
|
|
|
|
| |||||||||||||||
See Notes to Financial Statements.
305
| Statements of Cash Flows |
| For the Year Ended August 31, 2021 |
| International Fixed Income Fund | Inflation-Linked Fixed Income Fund | |||||||
Cash Flows Provided by/Used in Operating Activities: | ||||||||
Net increase in net assets resulting from operations | $ | 2,585,722 | $ | 8,724,584 | ||||
Adjustments to reconcile net increase/decrease in net assets from operations to net cash and foreign currency provided by/used in operating activities: | ||||||||
Purchases of long-term investments | (703,782,640 | ) | (224,321,520 | ) | ||||
Proceeds from the sale and maturity of long-term investments | 743,130,962 | 273,045,565 | ||||||
Proceeds from short-term investments, net | (6,052,787 | ) | 151,675 | |||||
Decrease to the principal amount of inflation-indexed bonds | (79,923 | ) | (7,298,399 | ) | ||||
Change in net unrealized depreciation from unaffiliated investments | 3,512,454 | 3,266,235 | ||||||
Change in net unrealized depreciation from options contracts written | 26,925 | 22,842 | ||||||
Change in net unrealized depreciation on open OTC swap contracts | 354,496 | — | ||||||
Increase/Decrease in variation margin on open centrally cleared swap contracts | 44,543 | (70,257 | ) | |||||
Net amortization (accretion) of premiums (discounts) of investments | 39,703 | 189,429 | ||||||
Net realized gain from unaffiliated investments | (2,351,394 | ) | (3,682,004 | ) | ||||
Increase in premium received on options contracts written | 11,199 | 138,765 | ||||||
Increase/Decrease in variation margin on open futures contracts | 10,683 | (101,483 | ) | |||||
Decrease in receivable for securities sold | 1,302,393 | 73,886 | ||||||
Decrease in receivable for TBA securities sold | 71,007,201 | 31,236,693 | ||||||
Increase/Decrease in dividends and interest receivable from unaffiliated investments | (22,818 | ) | 22,787 | |||||
Decrease in deposits for collateral from counterparty | 1,442,000 | 313,000 | ||||||
Increase in net upfront payments received/paid on OTC open swap contracts | (3,999 | ) | — | |||||
Decrease for due to custodian | (39,625 | ) | — | |||||
Decrease in forward sale commitments | 7,068,823 | — | ||||||
Increase/Decrease in prepaid expenses | (2,557 | ) | 2,825 | |||||
Increase/Decrease in unrealized appreciation on open forward foreign currency contracts | 8,788 | (102,172 | ) | |||||
Increase in payable for securities purchased | 1,054,374 | 200,331 | ||||||
Decrease in payable for TBA securities purchased | (128,979,087 | ) | (50,409,308 | ) | ||||
Increase in deposits for collateral from counterparty | 353,000 | 110,000 | ||||||
Increase in investment management fee payable | 9,552 | 48 | ||||||
Decrease in interest expense payable | (607 | ) | (3,972 | ) | ||||
Decrease in custody fee payable | (13,516 | ) | (7,067 | ) | ||||
Increase/Decrease in transfer agent fees payable | (697 | ) | 1,548 | |||||
Decrease in trustees’ fees payable | — | (380 | ) | |||||
Decrease in unrealized depreciation on open forward foreign currency contracts | (1,377,231 | ) | (511,622 | ) | ||||
Increase in accrued expenses | 70,328 | 52,798 | ||||||
|
|
|
| |||||
Net cash and foreign currency provided by/used in operating activities | (10,673,735 | ) | 31,044,827 | |||||
|
|
|
| |||||
Cash Flows Provided by/Used in Financing Activities: | ||||||||
Proceeds from sale-buyback transactions | 190,227,429 | 202,119,091 | ||||||
Payments on sale-buyback transactions | (191,057,155 | ) | (195,808,921 | ) | ||||
Proceeds from reverse repurchase agreements | (6,410,965 | ) | (23,500,029 | ) | ||||
Proceeds from sale of shares | 60,993,832 | 68,500,366 | ||||||
Cost of shares repurchased | (43,170,903 | ) | (83,955,414 | ) | ||||
Distributions to shareholders, net of reinvestments | (10 | ) | (93 | ) | ||||
|
|
|
| |||||
Net cash and foreign currency provided by/used in financing activities | 10,582,228 | (32,645,000 | ) | |||||
|
|
|
| |||||
Net increase in cash and foreign currency (a) | (91,507 | ) | (1,600,173 | ) | ||||
|
|
|
| |||||
Cash and Foreign Currency: | ||||||||
Cash, cash equivalents and foreign cash at the beginning of the year | 352,517 | 2,452,400 | ||||||
|
|
|
| |||||
Cash, cash equivalents and foreign cash at end of the year | 261,010 | 852,227 | ||||||
|
|
|
| |||||
Non-Cash Financing Activities: | ||||||||
Reinvestment of distributions | (993,140 | ) | (8,153,862 | ) | ||||
|
|
|
| |||||
| (a) | Includes net change in unrealized (depreciation) on foreign currency of $(31,348) and $(102,154) for International Fixed Income Fund and Inflation-Linked Fixed Income Fund, respectively. |
See Notes to Financial Statements.
306
| Financial Highlights |
For a share of beneficial interest outstanding throughout each year ended August 31, unless otherwise noted:
| Large Cap Equity Fund | ||||||||||||||||||||
| 2021 | 2020 | 2019 | 2018 | 2017 | ||||||||||||||||
Net Asset Value, Beginning of Year | $ | 21.62 | $ | 19.10 | $ | 21.31 | $ | 18.76 | $ | 17.06 | ||||||||||
|
|
|
|
|
|
|
|
|
| |||||||||||
| Income from Operations: | ||||||||||||||||||||
Net investment income(1) | 0.22 | 0.26 | 0.27 | 0.26 | 0.25 | |||||||||||||||
Net realized and unrealized gain (loss) | 6.49 | 3.23 | (0.24 | ) | 3.18 | 2.05 | ||||||||||||||
|
|
|
|
|
|
|
|
|
| |||||||||||
Total Income from Operations | 6.71 | 3.49 | 0.03 | 3.44 | 2.30 | |||||||||||||||
|
|
|
|
|
|
|
|
|
| |||||||||||
| Less Distributions from: | ||||||||||||||||||||
Net investment income | (0.18 | ) | (0.20 | ) | (0.34 | ) | (0.24 | ) | (0.27 | ) | ||||||||||
Net realized gain | (0.57 | ) | (0.77 | ) | (1.90 | ) | (0.65 | ) | (0.33 | ) | ||||||||||
|
|
|
|
|
|
|
|
|
| |||||||||||
Total Distributions | (0.75 | ) | (0.97 | ) | (2.24 | ) | (0.89 | ) | (0.60 | ) | ||||||||||
|
|
|
|
|
|
|
|
|
| |||||||||||
Net Asset Value, End of Year | $ | 27.58 | $ | 21.62 | $ | 19.10 | $ | 21.31 | $ | 18.76 | ||||||||||
|
|
|
|
|
|
|
|
|
| |||||||||||
Total Return†(2) | 31.79 | % | 18.85 | % | 1.32 | % | 18.89 | % | 13.86 | % | ||||||||||
Net Assets, End of Year (millions) | $ | 2,175 | $ | 1,854 | $ | 1,554 | $ | 1,737 | $ | 1,687 | ||||||||||
| Ratios to Average Net Assets: | ||||||||||||||||||||
Gross expenses | 0.68 | % | 0.70 | % | 0.69 | % | 0.69 | % | 0.69 | % | ||||||||||
Net expenses(3) | 0.47 | 0.49 | 0.48 | 0.48 | 0.48 | |||||||||||||||
Net investment income | 0.91 | 1.33 | 1.43 | 1.29 | 1.40 | |||||||||||||||
Portfolio Turnover Rate | 15 | % | 21 | % | 13 | % | 29 | % | 18 | % | ||||||||||
| (1) | Per share amounts have been calculated using the average shares method. |
| (2) | Performance figures may reflect fee waivers and/or expense reimbursements and assume reinvestment of dividend distribution. In the absence of fee waivers and/or expense reimbursements, the total return would have been lower. Applicable advisory program charges, which may be up to 2.50%, are not reflected in the performance data and would reduce the total returns. Effective October 1, 2018, the new advisory program charge is 2.00%. Past performance is no guarantee of future results. |
| (3) | Reflects fee waivers and/or expense reimbursements. |
| † | Calculated based on the net asset value as of the last business day of the period. |
See Notes to Financial Statements.
307
| Financial Highlights |
| (continued) |
For a share of beneficial interest outstanding throughout each year ended August 31, unless otherwise noted:
| Small-Mid Cap Equity Fund | ||||||||||||||||||||
| 2021 | 2020 | 2019 | 2018 | 2017 | ||||||||||||||||
Net Asset Value, Beginning of Year | $ | 18.01 | $ | 18.60 | $ | 23.06 | $ | 19.53 | $ | 17.40 | ||||||||||
|
|
|
|
|
|
|
|
|
| |||||||||||
| Income (Loss) from Operations: | ||||||||||||||||||||
Net investment income(1) | 0.13 | 0.13 | 0.12 | 0.10 | 0.10 | |||||||||||||||
Net realized and unrealized gain (loss) | 7.10 | 1.48 | (1.83 | ) | 4.14 | 2.39 | ||||||||||||||
|
|
|
|
|
|
|
|
|
| |||||||||||
Total Income (Loss) from Operations | 7.23 | 1.61 | (1.71 | ) | 4.24 | 2.49 | ||||||||||||||
|
|
|
|
|
|
|
|
|
| |||||||||||
| Less Distributions from: | ||||||||||||||||||||
Net investment income | (0.14 | ) | (0.10 | ) | (0.10 | ) | (0.03 | ) | (0.06 | ) | ||||||||||
Net realized gain | (0.75 | ) | (2.10 | ) | (2.65 | ) | (0.68 | ) | (0.30 | ) | ||||||||||
|
|
|
|
|
|
|
|
|
| |||||||||||
Total Distributions | (0.89 | ) | (2.20 | ) | (2.75 | ) | (0.71 | ) | (0.36 | ) | ||||||||||
|
|
|
|
|
|
|
|
|
| |||||||||||
Net Asset Value, End of Year | $ | 24.35 | $ | 18.01 | $ | 18.60 | $ | 23.06 | $ | 19.53 | ||||||||||
|
|
|
|
|
|
|
|
|
| |||||||||||
Total Return†(2) | 41.14 | % | 8.78 | % | (6.25 | )% | 22.17 | % | 14.49 | % | ||||||||||
Net Assets, End of Year (millions) | $ | 677 | $ | 620 | $ | 423 | $ | 520 | $ | 674 | ||||||||||
| Ratios to Average Net Assets: | ||||||||||||||||||||
Gross expenses | 0.92 | % | 0.96 | % | 0.98 | % | 0.92 | % | 0.94 | % | ||||||||||
Net expenses(3) | 0.58 | 0.62 | 0.66 | 0.61 | 0.63 | |||||||||||||||
Net investment income | 0.61 | 0.77 | 0.63 | 0.47 | 0.52 | |||||||||||||||
Portfolio Turnover Rate | 29 | % | 45 | % | 65 | % | 34 | % | 34 | % | ||||||||||
| (1) | Per share amounts have been calculated using the average shares method. |
| (2) | Performance figures may reflect fee waivers and/or expense reimbursements and assume reinvestment of dividend distribution. In the absence of fee waivers and/or expense reimbursements, the total return would have been lower. Applicable advisory program charges, which may be up to 2.50%, are not reflected in the performance data and would reduce the total returns. Effective October 1, 2018, the new advisory program charge is 2.00%. Past performance is no guarantee of future results. |
| (3) | Reflects fee waivers and/or expense reimbursements. |
| † | Calculated based on the net asset value as of the last business day of the period. |
See Notes to Financial Statements.
308
| Financial Highlights |
| (continued) |
For a share of beneficial interest outstanding throughout each year ended August 31, unless otherwise noted:
| International Equity Fund | ||||||||||||||||||||
| 2021 | 2020 | 2019 | 2018 | 2017 | ||||||||||||||||
Net Asset Value, Beginning of Year | $ | 12.27 | $ | 11.59 | $ | 12.64 | $ | 12.34 | $ | 10.83 | ||||||||||
|
|
|
|
|
|
|
|
|
| |||||||||||
| Income (Loss) from Operations: | ||||||||||||||||||||
Net investment income(1) | 0.21 | 0.17 | 0.28 | 0.27 | 0.24 | |||||||||||||||
Net realized and unrealized gain (loss) | 3.30 | 0.84 | (1.09 | ) | 0.24 | 1.56 | ||||||||||||||
|
|
|
|
|
|
|
|
|
| |||||||||||
Total Income (Loss) from Operations | 3.51 | 1.01 | (0.81 | ) | 0.51 | 1.80 | ||||||||||||||
|
|
|
|
|
|
|
|
|
| |||||||||||
| Less Distributions from: | ||||||||||||||||||||
Net investment income | (0.24 | ) | (0.33 | ) | (0.24 | ) | (0.21 | ) | (0.29 | ) | ||||||||||
|
|
|
|
|
|
|
|
|
| |||||||||||
Net Asset Value, End of Year | $ | 15.54 | $ | 12.27 | $ | 11.59 | $ | 12.64 | $ | 12.34 | ||||||||||
|
|
|
|
|
|
|
|
|
| |||||||||||
Total Return†(2) | 28.93 | % | 8.64 | % | (6.34 | )% | 4.15 | % | 17.14 | % | ||||||||||
Net Assets, End of Year (millions) | $ | 1,458 | $ | 1,254 | $ | 1,311 | $ | 1,677 | $ | 1,244 | ||||||||||
| Ratios to Average Net Assets: | ||||||||||||||||||||
Gross expenses | 0.84 | % | 0.87 | % | 0.84 | % | 0.83 | % | 0.83 | % | ||||||||||
Net expenses(3) | 0.67 | 0.71 | 0.68 | 0.66 | 0.65 | |||||||||||||||
Net investment income | 1.50 | 1.44 | 2.40 | 2.07 | 2.15 | |||||||||||||||
Portfolio Turnover Rate | 52 | % | 39 | % | 28 | % | 41 | % | 27 | % | ||||||||||
| (1) | Per share amounts have been calculated using the average shares method. |
| (2) | Performance figures may reflect fee waivers and/or expense reimbursements and assume reinvestment of dividend distribution. In the absence of fee waivers and/or expense reimbursements, the total return would have been lower. Applicable advisory program charges, which may be up to 2.50%, are not reflected in the performance data and would reduce the total returns. Effective October 1, 2018, the new advisory program charge is 2.00%. Past performance is no guarantee of future results. |
| (3) | Reflects fee waivers and/or expense reimbursements. |
| † | Calculated based on the net asset value as of the last business day of the period. |
See Notes to Financial Statements.
309
| Financial Highlights |
| (continued) |
For a share of beneficial interest outstanding throughout each year ended August 31, unless otherwise noted:
| Emerging Markets Equity Fund | ||||||||||||||||||||
| 2021 | 2020 | 2019 | 2018 | 2017 | ||||||||||||||||
Net Asset Value, Beginning of Year | $ | 14.67 | $ | 14.00 | $ | 14.29 | $ | 15.33 | $ | 12.36 | ||||||||||
|
|
|
|
|
|
|
|
|
| |||||||||||
| Income (Loss) from Operations: | ||||||||||||||||||||
Net investment income(1) | 0.20 | 0.20 | 0.27 | 0.22 | 0.20 | |||||||||||||||
Net realized and unrealized gain (loss) | 2.90 | 0.75 | (0.34 | ) | (1.06 | ) | 2.90 | |||||||||||||
|
|
|
|
|
|
|
|
|
| |||||||||||
Total Income (Loss) from Operations | 3.10 | 0.95 | (0.07 | ) | (0.84 | ) | 3.10 | |||||||||||||
|
|
|
|
|
|
|
|
|
| |||||||||||
| Less Distributions from: | ||||||||||||||||||||
Net investment income | (0.33 | ) | (0.28 | ) | (0.22 | ) | (0.20 | ) | (0.13 | ) | ||||||||||
|
|
|
|
|
|
|
|
|
| |||||||||||
Net Asset Value, End of Year | $ | 17.44 | $ | 14.67 | $ | 14.00 | $ | 14.29 | $ | 15.33 | ||||||||||
|
|
|
|
|
|
|
|
|
| |||||||||||
Total Return†(2) | 21.28 | % | 6.79 | % | (0.40 | )% | (5.55 | )% | 25.48 | % | ||||||||||
Net Assets, End of Year (millions) | $ | 563 | $ | 548 | $ | 493 | $ | 498 | $ | 488 | ||||||||||
| Ratios to Average Net Assets: | ||||||||||||||||||||
Gross expenses | 1.12 | % | 1.15 | % | 1.13 | % | 1.11 | % | 1.14 | % | ||||||||||
Net expenses(3) | 0.80 | 0.84 | 0.82 | 0.80 | 0.86 | |||||||||||||||
Net investment income | 1.18 | 1.44 | 1.95 | 1.42 | 1.51 | |||||||||||||||
Portfolio Turnover Rate | 53 | % | 23 | % | 22 | % | 24 | % | 27 | % | ||||||||||
| (1) | Per share amounts have been calculated using the average shares method. |
| (2) | Performance figures may reflect fee waivers and/or expense reimbursements and assume reinvestment of dividend distribution. In the absence of fee waivers and/or expense reimbursements, the total return would have been lower. Applicable advisory program charges, which may be up to 2.50%, are not reflected in the performance data and would reduce the total returns. Effective October 1, 2018, the new advisory program charge is 2.00%. Past performance is no guarantee of future results. |
| (3) | Reflects fee waivers and/or expense reimbursements. |
| † | Calculated based on the net asset value as of the last business day of the period. |
See Notes to Financial Statements.
310
| Financial Highlights |
| (continued) |
For a share of beneficial interest outstanding throughout each year ended August 31, unless otherwise noted:
| Core Fixed Income Fund | ||||||||||||||||||||
| 2021 | 2020 | 2019 | 2018 | 2017 | ||||||||||||||||
Net Asset Value, Beginning of Year | $ | 8.79 | $ | 8.42 | $ | 7.86 | $ | 8.19 | $ | 8.41 | ||||||||||
|
|
|
|
|
|
|
|
|
| |||||||||||
| Income (Loss) from Operations: | ||||||||||||||||||||
Net investment income(1) | 0.13 | 0.19 | 0.23 | 0.20 | 0.19 | |||||||||||||||
Net realized and unrealized gain (loss) | (0.08 | ) | 0.42 | 0.57 | (0.31 | ) | (0.11 | ) | ||||||||||||
|
|
|
|
|
|
|
|
|
| |||||||||||
Total Income (Loss) from Operations | 0.05 | 0.61 | 0.80 | (0.11 | ) | 0.08 | ||||||||||||||
|
|
|
|
|
|
|
|
|
| |||||||||||
| Less Distributions from: | ||||||||||||||||||||
Net investment income | (0.17 | ) | (0.22 | ) | (0.24 | ) | (0.21 | ) | (0.22 | ) | ||||||||||
Tax return of capital | — | — | — | (0.01 | ) | — | ||||||||||||||
Net realized gain | (0.28 | ) | (0.02 | ) | — | — | (0.08 | ) | ||||||||||||
|
|
|
|
|
|
|
|
|
| |||||||||||
Total Distributions | (0.45 | ) | (0.24 | ) | (0.24 | ) | (0.22 | ) | (0.30 | ) | ||||||||||
|
|
|
|
|
|
|
|
|
| |||||||||||
Net Asset Value, End of Year | $ | 8.39 | $ | 8.79 | $ | 8.42 | $ | 7.86 | $ | 8.19 | ||||||||||
|
|
|
|
|
|
|
|
|
| |||||||||||
Total Return†(2) | 0.58 | % | 7.46 | % | 10.39 | % | (1.35 | )% | 1.07 | % | ||||||||||
Net Assets, End of Year (millions) | $ | 1,311 | $ | 981 | $ | 1,204 | $ | 867 | $ | 710 | ||||||||||
| Ratios to Average Net Assets: | ||||||||||||||||||||
Gross expenses | 0.56 | % | 0.58 | % | 0.57 | % | 0.57 | % | 0.58 | %(3) | ||||||||||
Net expenses(4) | 0.54 | 0.56 | 0.56 | 0.56 | 0.56 | (3) | ||||||||||||||
Net investment income | 1.57 | 2.27 | 2.85 | 2.49 | 2.32 | |||||||||||||||
Portfolio Turnover Rate | 227 | % | 216 | % | 210 | % | 253 | % | 236 | % | ||||||||||
| (1) | Per share amounts have been calculated using the average shares method. |
| (2) | Performance figures may reflect fee waivers and/or expense reimbursements and assume reinvestment of dividend distribution. In the absence of fee waivers and/or expense reimbursements, the total return would have been lower. Applicable advisory program charges, which may be up to 2.50%, are not reflected in the performance data and would reduce the total returns. Effective October 1, 2018, the new advisory program charge is 2.00%. Past performance is no guarantee of future results. |
| (3) | Ratio includes interest expense on reverse repurchase agreements which represents less than 0.005%. |
| (4) | Reflects fee waivers and/or expense reimbursements. |
| † | Calculated based on the net asset value as of the last business day of the period. |
See Notes to Financial Statements.
311
| Financial Highlights |
| (continued) |
For a share of beneficial interest outstanding throughout each year ended August 31, unless otherwise noted:
| High Yield Fund | ||||||||||||||||||||
| 2021 | 2020 | 2019 | 2018 | 2017 | ||||||||||||||||
Net Asset Value, Beginning of Year | $ | 3.61 | $ | 3.76 | $ | 3.77 | $ | 3.86 | $ | 3.78 | ||||||||||
|
|
|
|
|
|
|
|
|
| |||||||||||
| Income from Operations: | ||||||||||||||||||||
Net investment income(1) | 0.18 | 0.17 | 0.19 | 0.20 | 0.22 | |||||||||||||||
Net realized and unrealized gain (loss) | 0.11 | (0.15 | ) | — | (0.08 | ) | 0.10 | |||||||||||||
|
|
|
|
|
|
|
|
|
| |||||||||||
Total Income from Operations | 0.29 | 0.02 | 0.19 | 0.12 | 0.32 | |||||||||||||||
|
|
|
|
|
|
|
|
|
| |||||||||||
| Less Distributions from: | ||||||||||||||||||||
Net investment income | (0.18 | ) | (0.17 | ) | (0.20 | ) | (0.21 | ) | (0.24 | ) | ||||||||||
|
|
|
|
|
|
|
|
|
| |||||||||||
Net Asset Value, End of Year | $ | 3.72 | $ | 3.61 | $ | 3.76 | $ | 3.77 | $ | 3.86 | ||||||||||
|
|
|
|
|
|
|
|
|
| |||||||||||
Total Return†(2) | 8.61 | % | 0.14 | % | 5.58 | % | 3.20 | % | 8.38 | % | ||||||||||
Net Assets, End of Period (millions) | $ | 213 | $ | 282 | $ | 49 | $ | 58 | $ | 173 | ||||||||||
| Ratios to Average Net Assets: | ||||||||||||||||||||
Gross expenses | 0.96 | % | 1.07 | % | 1.32 | % | 1.17 | % | 0.95 | % | ||||||||||
Net expenses(3) | 0.76 | 0.86 | 1.12 | 0.97 | 0.75 | |||||||||||||||
Net investment income | 4.79 | 4.85 | 5.09 | 5.27 | 5.65 | |||||||||||||||
Portfolio Turnover Rate | 117 | % | 84 | % | 43 | % | 57 | % | 72 | % | ||||||||||
| (1) | Per share amounts have been calculated using the average shares method. |
| (2) | Performance figures may reflect fee waivers and/or expense reimbursements and assume reinvestment of dividend distribution. In the absence of fee waivers and/or expense reimbursements, the total return would have been lower. Applicable advisory program charges, which may be up to 2.50%, are not reflected in the performance data and would reduce the total returns. Effective October 1, 2018, the new advisory program charge is 2.00%. Past performance is no guarantee of future results. |
| (3) | Reflects fee waivers and/or expense reimbursements. |
| † | Calculated based on the net asset value as of the last business day of the period. |
See Notes to Financial Statements.
312
| Financial Highlights |
| (continued) |
For a share of beneficial interest outstanding throughout each year ended August 31, unless otherwise noted:
| International Fixed Income Fund | ||||||||||||||||||||
| 2021 | 2020 | 2019 | 2018 | 2017 | ||||||||||||||||
Net Asset Value, Beginning of Year | $ | 8.03 | $ | 8.35 | $ | 7.86 | $ | 7.78 | $ | 7.79 | ||||||||||
|
|
|
|
|
|
|
|
|
| |||||||||||
| Income from Operations: | ||||||||||||||||||||
Net investment income(1) | 0.07 | 0.20 | 0.06 | 0.14 | 0.14 | |||||||||||||||
Net realized and unrealized gain (loss) | 0.08 | (0.15 | ) | 0.70 | 0.03 | (0.07 | ) | |||||||||||||
|
|
|
|
|
|
|
|
|
| |||||||||||
Total Income from Operations | 0.15 | 0.05 | 0.76 | 0.17 | 0.07 | |||||||||||||||
|
|
|
|
|
|
|
|
|
| |||||||||||
| Less Distributions from: | ||||||||||||||||||||
Net investment income | — | (0.35 | ) | (0.27 | ) | (0.09 | ) | (0.08 | ) | |||||||||||
Net realized gain | (0.06 | ) | (0.02 | ) | — | — | — | |||||||||||||
|
|
|
|
|
|
|
|
|
| |||||||||||
Total Distributions | (0.06 | ) | (0.37 | ) | (0.27 | ) | (0.09 | ) | (0.08 | ) | ||||||||||
|
|
|
|
|
|
|
|
|
| |||||||||||
Net Asset Value, End of Year | $ | 8.12 | $ | 8.03 | $ | 8.35 | $ | 7.86 | $ | 7.78 | ||||||||||
|
|
|
|
|
|
|
|
|
| |||||||||||
Total Return†(2) | 1.86 | % | 0.75 | % | 10.01 | % | 2.25 | % | 0.98 | % | ||||||||||
Net Assets, End of Year (millions) | $ | 156 | $ | 135 | $ | 147 | $ | 145 | $ | 148 | ||||||||||
| Ratios to Average Net Assets: | ||||||||||||||||||||
Gross expenses(3) | 0.97 | % | 1.16 | % | 1.24 | % | 1.01 | % | 1.06 | % | ||||||||||
Net expenses(3)(4) | 0.92 | 1.11 | 1.19 | 0.95 | 1.01 | |||||||||||||||
Net investment income | 0.92 | 2.49 | 0.77 | 1.76 | 1.82 | |||||||||||||||
Portfolio Turnover Rate | 402 | % | 437 | % | 265 | % | 203 | % | 268 | % | ||||||||||
| (1) | Per share amounts have been calculated using the average shares method. |
| (2) | Performance figures may reflect fee waivers and/or expense reimbursements and assume reinvestment of dividend distribution. In the absence of fee waivers and/or expense reimbursements, the total return would have been lower. Applicable advisory program charges, which may be up to 2.50%, are not reflected in the performance data and would reduce the total returns. Effective October 1, 2018, the new advisory program charge is 2.00%. Past performance is no guarantee of future results. |
| (3) | Ratio includes interest expense on reverse repurchase agreements and sale-buyback transactions which represents less than 0.005%, 0.09%, 0.15%, 0.04% and 0.11%, respectively. |
| (4) | Reflects fee waivers and/or expense reimbursements. |
| † | Calculated based on the net asset value as of the last business day of the period. |
See Notes to Financial Statements.
313
| Financial Highlights |
| (continued) |
For a share of beneficial interest outstanding throughout each year ended August 31, unless otherwise noted:
| Municipal Bond Fund | ||||||||||||||||||||
| 2021 | 2020 | 2019 | 2018 | 2017 | ||||||||||||||||
Net Asset Value, Beginning of Year | $ | 9.53 | $ | 9.61 | $ | 9.11 | $ | 9.37 | $ | 9.93 | ||||||||||
|
|
|
|
|
|
|
|
|
| |||||||||||
| Income (Loss) from Operations: | ||||||||||||||||||||
Net investment income(1) | 0.17 | 0.20 | 0.23 | 0.24 | 0.27 | |||||||||||||||
Net realized and unrealized gain (loss) | 0.12 | (0.01 | ) | 0.52 | (0.26 | ) | (0.31 | ) | ||||||||||||
|
|
|
|
|
|
|
|
|
| |||||||||||
Total Income (Loss) from Operations | 0.29 | 0.19 | 0.75 | (0.02 | ) | (0.04 | ) | |||||||||||||
|
|
|
|
|
|
|
|
|
| |||||||||||
| Less Distributions from: | ||||||||||||||||||||
Net investment income | (0.17 | ) | (0.21 | ) | (0.22 | ) | (0.24 | ) | (0.27 | ) | ||||||||||
Net realized gain | (0.05 | ) | (0.06 | ) | (0.03 | ) | — | (0.25 | ) | |||||||||||
|
|
|
|
|
|
|
|
|
| |||||||||||
Total Distributions | (0.22 | ) | (0.27 | ) | (0.25 | ) | (0.24 | ) | (0.52 | ) | ||||||||||
|
|
|
|
|
|
|
|
|
| |||||||||||
Net Asset Value, End of Year | $ | 9.60 | $ | 9.53 | $ | 9.61 | $ | 9.11 | $ | 9.37 | ||||||||||
|
|
|
|
|
|
|
|
|
| |||||||||||
Total Return†(2) | 3.07 | % | 1.99 | % | 8.38 | % | (0.21 | )% | (0.22 | )% | ||||||||||
Net Assets, End of Year (millions) | $ | 92 | $ | 69 | $ | 86 | $ | 64 | $ | 58 | ||||||||||
| Ratios to Average Net Assets: | ||||||||||||||||||||
Gross expenses | 0.73 | % | 0.73 | % | 0.74 | % | 0.72 | % | 0.75 | % | ||||||||||
Net expenses | 0.73 | 0.73 | 0.74 | 0.72 | 0.75 | |||||||||||||||
Net investment income | 1.79 | 2.16 | 2.44 | 2.61 | 2.85 | |||||||||||||||
Portfolio Turnover Rate | 7 | % | 10 | % | 42 | % | 18 | % | 13 | % | ||||||||||
| (1) | Per share amounts have been calculated using the average shares method. |
| (2) | Performance figures may reflect fee waivers and/or expense reimbursements and assume reinvestment of dividend distribution. In the absence of fee waivers and/or expense reimbursements, the total return would have been lower. Applicable advisory program charges, which may be up to 2.50%, are not reflected in the performance data and would reduce the total returns. Effective October 1, 2018, the new advisory program charge is 2.00%. Past performance is no guarantee of future results. |
| † | Calculated based on the net asset value as of the last business day of the period. |
See Notes to Financial Statements.
314
| Financial Highlights |
| (continued) |
For a share of beneficial interest outstanding throughout each year ended August 31, unless otherwise noted:
| Inflation-Linked Fixed Income Fund | ||||||||||||||||||||
| 2021 | 2020 | 2019 | 2018 | 2017 | ||||||||||||||||
Net Asset Value, Beginning of Year | $ | 11.13 | $ | 10.19 | $ | 9.79 | $ | 10.08 | $ | 10.23 | ||||||||||
|
|
|
|
|
|
|
|
|
| |||||||||||
| Income from Operations: | ||||||||||||||||||||
Net investment income(1) | 0.56 | 0.18 | 0.24 | 0.30 | 0.23 | |||||||||||||||
Net realized and unrealized gain (loss) | 0.07 | 0.88 | 0.38 | (0.25 | ) | (0.13 | ) | |||||||||||||
|
|
|
|
|
|
|
|
|
| |||||||||||
Total Income from Operations | 0.63 | 1.06 | 0.62 | 0.05 | 0.10 | |||||||||||||||
|
|
|
|
|
|
|
|
|
| |||||||||||
| Less Distributions from: | ||||||||||||||||||||
Net investment income | (0.60 | ) | (0.12 | ) | (0.22 | ) | (0.34 | ) | (0.24 | ) | ||||||||||
Net realized gain | — | — | — | — | (0.01 | ) | ||||||||||||||
|
|
|
|
|
|
|
|
|
| |||||||||||
Total Distributions | (0.60 | ) | (0.12 | ) | (0.22 | ) | (0.34 | ) | (0.25 | ) | ||||||||||
|
|
|
|
|
|
|
|
|
| |||||||||||
Net Asset Value, End of Year | $ | 11.16 | $ | 11.13 | $ | 10.19 | $ | 9.79 | $ | 10.08 | ||||||||||
|
|
|
|
|
|
|
|
|
| |||||||||||
Total Return†(2) | 5.87 | % | 10.38 | % | 6.42 | % | 0.55 | % | 1.05 | % | ||||||||||
Net Assets, End of Year (millions) | $ | 148 | $ | 156 | $ | 217 | $ | 240 | $ | 190 | ||||||||||
| Ratios to Average Net Assets: | ||||||||||||||||||||
Gross expenses(3) | 0.93 | % | 1.27 | % | 1.35 | % | 1.27 | % | 1.15 | % | ||||||||||
Net expenses(3)(4) | 0.88 | 1.22 | 1.30 | 1.22 | 1.10 | |||||||||||||||
Net investment income | 5.08 | 1.76 | 2.47 | 3.07 | 2.25 | |||||||||||||||
Portfolio Turnover Rate | 104 | % | 193 | % | 143 | % | 72 | % | 120 | % | ||||||||||
| (1) | Per share amounts have been calculated using the average shares method. |
| (2) | Performance figures may reflect fee waivers and/or expense reimbursements and assume reinvestment of dividend distribution. In the absence of fee waivers and/or expense reimbursements, the total return would have been lower. Applicable advisory program charges, which may be up to 2.50%, are not reflected in the performance data and would reduce the total returns. Effective October 1, 2018, the new advisory program charge is 2.00%. Past performance is no guarantee of future results. |
| (3) | Ratio includes interest expense on reverse repurchase agreements and sale-buyback transactions which represents 0.03%, 0.35%, 0.55%, 0.49% and 0.29%, respectively. |
| (4) | Reflects fee waivers and/or expense reimbursements. |
| † | Calculated based on the net asset value as of the last business day of the period. |
See Notes to Financial Statements.
315
| Financial Highlights |
| (continued) |
For a share of beneficial interest outstanding throughout each year ended August 31, unless otherwise noted:
| Ultra-Short Term Fixed Income Fund | ||||||||||||||||||||
| 2021 | 2020 | 2019 | 2018 | 2017 | ||||||||||||||||
Net Asset Value, Beginning of Year | $ | 9.99 | $ | 9.90 | $ | 9.97 | $ | 9.99 | $ | 10.00 | ||||||||||
|
|
|
|
|
|
|
|
|
| |||||||||||
| Income from Operations: | ||||||||||||||||||||
Net investment income(1) | 0.05 | 0.18 | 0.25 | 0.19 | 0.13 | |||||||||||||||
Net realized and unrealized gain (loss) | 0.01 | 0.06 | (0.06 | ) | 0.02 | 0.08 | ||||||||||||||
|
|
|
|
|
|
|
|
|
| |||||||||||
Total Income from Operations | 0.06 | 0.24 | 0.19 | 0.21 | 0.21 | |||||||||||||||
|
|
|
|
|
|
|
|
|
| |||||||||||
| Less Distributions from: | ||||||||||||||||||||
Net investment income | (0.16 | ) | (0.15 | ) | (0.26 | ) | (0.23 | ) | (0.22 | ) | ||||||||||
|
|
|
|
|
|
|
|
|
| |||||||||||
Net Asset Value, End of Year | $ | 9.89 | $ | 9.99 | $ | 9.90 | $ | 9.97 | $ | 9.99 | ||||||||||
|
|
|
|
|
|
|
|
|
| |||||||||||
Total Return†(2) | 0.61 | % | 2.36 | % | 2.07 | % | 2.09 | % | 2.14 | % | ||||||||||
Net Assets, End of Year (millions) | $ | 442 | $ | 398 | $ | 497 | $ | 507 | $ | 276 | ||||||||||
| Ratios to Average Net Assets: | ||||||||||||||||||||
Gross expenses(3) | 0.67 | % | 0.69 | % | 0.82 | % | 0.71 | % | 0.84 | % | ||||||||||
Net expenses(3)(4) | 0.62 | 0.64 | 0.77 | 0.66 | 0.79 | |||||||||||||||
Net investment income | 0.50 | 1.78 | 2.51 | 1.90 | 1.29 | |||||||||||||||
Portfolio Turnover Rate | 55 | % | 96 | % | 97 | % | 128 | % | 103 | % | ||||||||||
| (1) | Per share amounts have been calculated using the average shares method. |
| (2) | Performance figures may reflect fee waivers and/or expense reimbursements and assume reinvestment of dividend distribution. In the absence of fee waivers and/or expense reimbursements, the total return would have been lower. Applicable advisory program charges, which may be up to 2.50%, are not reflected in the performance data and would reduce the total returns. Effective October 1, 2018, the new advisory program charge is 2.00%. Past performance is no guarantee of future results. |
| (3) | Ratio includes interest expense on reverse repurchase agreements and sale-buyback transactions which represents less than 0.005%, 0.02%, 0.07%, 0.04% and 0.05%, respectively. |
| (4) | Reflects fee waivers and/or expense reimbursements. |
| † | Calculated based on the net asset value as of the last business day of the period. |
See Notes to Financial Statements.
316
| Financial Highlights |
| (continued) |
For a share of beneficial interest outstanding throughout each year ended August 31, unless otherwise noted:
| Alternative Strategies Fund | ||||||||||||||||
| 2021 | 2020 | 2019 | 2018(1) | |||||||||||||
Net Asset Value, Beginning of Year | $ | 10.04 | $ | 10.10 | $ | 9.88 | $ | 10.00 | ||||||||
|
|
|
|
|
|
|
| |||||||||
| Income (Loss) from Operations: | ||||||||||||||||
Net investment income (loss)(2) | 0.13 | 0.15 | 0.10 | (0.09 | ) | |||||||||||
Net realized and unrealized gain (loss) | 0.91 | 0.10 | 0.19 | (0.03 | ) | |||||||||||
|
|
|
|
|
|
|
| |||||||||
Total Income (Loss) from Operations | 1.04 | 0.25 | 0.29 | (0.12 | ) | |||||||||||
|
|
|
|
|
|
|
| |||||||||
| Less Distributions from: | ||||||||||||||||
Net investment income | (0.09 | ) | (0.28 | ) | (0.07 | ) | — | |||||||||
Net realized gain | — | (0.03 | ) | — | — | |||||||||||
|
|
|
|
|
|
|
| |||||||||
Total Distributions | (0.09 | ) | (0.31 | ) | (0.07 | ) | — | |||||||||
|
|
|
|
|
|
|
| |||||||||
Net Asset Value, End of Year/Period | $ | 10.99 | $ | 10.04 | $ | 10.10 | $ | 9.88 | ||||||||
|
|
|
|
|
|
|
| |||||||||
Total Return†(3) | 10.39 | % | 2.61 | % | 2.90 | % | (1.20 | )%(4) | ||||||||
Net Assets, End of Year/Period (millions) | $ | 119 | $ | 39 | $ | 27 | $ | 6 | ||||||||
| Ratios to Average Net Assets: | ||||||||||||||||
Gross expenses | 1.56 | % | 1.85 | % | 2.34 | % | 11.00 | %(5) | ||||||||
Net expenses(6)(7) | 0.56 | 0.70 | 0.88 | 1.95 | (5) | |||||||||||
Net investment income (loss) | 1.24 | 1.52 | 1.01 | (1.72 | )(5) | |||||||||||
Portfolio Turnover Rate | 18 | % | 34 | % | 16 | % | 14 | %(4) | ||||||||
| (1) | For the period form Fund inception (February 15, 2018) through the period ended August 31, 2018. |
| (2) | Per share amounts have been calculated using the average shares method. |
| (3) | Performance figures may reflect fee waivers and/or expense reimbursements and assume reinvestment of dividend distribution. In the absence of fee waivers and/or expense reimbursements, the total return would have been lower. Applicable advisory program charges, which may be up to 2.50%, are not reflected in the performance data and would reduce the total returns. Effective October 1, 2018, the new advisory program charge is 2.00%. Past performance is no guarantee of future results. |
| (4) | Not annualized |
| (5) | Annualized. |
| (6) | Reflects fee waivers and/or expense reimbursements. |
| (7) | Does not reflect the Fund’s proportionate share of income and expenses from the Underlying Fund. |
| † | Calculated based on the net asset value as of the last business day of the period. |
See Notes to Financial Statements.
317
| Notes to Financial Statements |
1. Organization and Significant Accounting Policies
The Morgan Stanley Pathway Funds (the “Trust”) is organized as a Massachusetts business trust and registered under the Investment Company Act of 1940, as amended (“1940 Act”), as an open-end management investment company. The Trust currently consists of Large Cap Equity Fund, Small-Mid Cap Equity Fund, International Equity Fund, Emerging Markets Equity Fund, Core Fixed Income Fund, High Yield Fund, International Fixed Income Fund, Municipal Bond Fund, Inflation-Linked Fixed Income Fund, Ultra-Short Term Fixed Income Fund and Alternative Strategies Fund (individually, a “Fund” and collectively, the “Funds”). Each Fund is a diversified series of the Trust, except for International Fixed Income Fund, which is non-diversified.
The following is a summary of significant accounting policies consistently followed by the Funds which are in conformity with accounting principles generally accepted in the United States of America (“GAAP”). Estimates and assumptions are required to be made by management regarding assets, liabilities and changes in net assets resulting from operations when financial statements are prepared. Changes in the economic environment, financial markets and any other parameters used in determining these estimates could cause actual results to differ. The Funds are investment companies and follow the accounting and reporting guidance of the Financial Accounting Standards Board (“FASB”) Accounting Standards Codification Topic 946 – Investment Companies.
In March 2020, FASB issued an Accounting Standard Update, ASU 2020-04, Reference Rate Reform (Topic 848) — Facilitation of the Effects of Reference Rate Reform on Financial Reporting (“ASU 2020-04”), which provides optional, temporary relief with respect to the financial reporting of contracts subject to certain types of modifications due to the planned discontinuation of the London Interbank Offered Rate (“LIBOR”) and other Interbank Offered Rate (“IBOR”)-based reference rates at the end of 2021. The temporary relief provided by ASU 2020-04 is effective for certain reference rate-related contract modifications that occur during the period from March 12, 2020 through December 31, 2022. Management is evaluating the impact of ASU 2020-04 on the Fund’s investments, derivatives, debt and other contracts that will undergo reference rate-related modifications as a result of the reference rate reform.
(a) Investment Valuation. Equity securities for each Fund for which market quotations are readily available and are traded on an exchange are valued at the closing sale price or official closing price on the exchange on which such security is principally traded. In the event there are no sales that day, such securities are valued at the mean between the bid and ask prices. For securities that are primarily traded on foreign exchanges, these values are converted to U.S. dollars using the current exchange rates as of the close of the New York Stock Exchange (“NYSE”).
Exchange-traded purchased and written options and futures contracts are valued at the last sale price (closing price) in the market where such contracts are principally traded or, if no sales are reported, the bid price. Swaps for which quotations are available on an automated basis from approved third-party pricing services are valued using those automated third-party pricing service quotations. Forward foreign currency contracts are valued using the official closing price for such contracts on the NYSE.
Portfolio securities traded in the over-the-counter market for which market quotations are readily available are valued at the last sales price that day. In the event there are no sales that day, such securities are valued at the mean between the bid and ask prices. Investments in registered open-end management investment companies are valued at reported net asset value per share.
Debt obligations that will mature in 60 days or less are valued at amortized cost, which approximates market value. Debt obligations that will mature in more than 60 days are valued using valuations furnished by an approved third-party pricing service; such valuations are determined by the third-party pricing service based upon its analysis of a variety of factors, including transactions in debt obligations, quotations from bond dealers, market transactions in comparable securities and its analysis of various relationships between securities, prices or yields of securities with similar characteristics, benchmark curves or information pertaining to the issuer, and as well as industry and economic events.
Overnight repurchase agreements and repurchase agreements maturing in seven days or less are valued at cost. Term repurchase agreements maturing in more than seven days are valued at the average of the bid quotations obtained daily from at least two recognized purchasers of such term repurchase agreements selected by Consulting Group Advisory Services, LLC (“CGAS”) (the “Manager”).
The Board of Trustees (the “Board”) has ultimate responsibility for ensuring the Funds’ investments are valued appropriately. The Board has delegated primary responsibility for determining or causing to be determined the value of the Funds’ investments (including any fair valuation) to the Manager pursuant to valuation policies and procedures approved by the Board. When market quotations are not readily available or are determined to be unreliable, investments are valued at fair value as determined in good
318
| Notes to Financial Statements |
| (continued) |
faith by the valuation committee established by the Manager in accordance with such procedures under the oversight of the Board. Circumstances that may indicate that market quotations are not readily available or are unreliable include, but are not limited to, such instances when the value of a security has been significantly affected by events after the close of the exchange or market on which the security is principally traded, and before the applicable Fund calculates its Net Asset Value (“NAV”).
Each business day, Emerging Markets Equity Fund and International Equity Fund use a Board-approved third-party pricing service to assist with the valuation of foreign equity securities. Events occurring after the close of trading on foreign exchanges may result in adjustments to the valuation of foreign securities to reflect market trading that occurs after the close of the applicable foreign markets of comparable securities or other instruments that have a strong correlation to the fair-valued securities to more accurately reflect their fair value as of the close of regular trading on the NYSE.
The Funds disclose the fair value of their investments in a hierarchy that prioritizes the inputs to valuation techniques used to measure the fair value. The hierarchy prioritizes inputs to valuation methods and requires disclosure of the fair value hierarchy, separately for each major category of assets and liabilities that segregates fair value measurements into levels (Level 1, 2 and 3). The three levels of the fair value hierarchy are as follows:
Level 1 – unadjusted quoted prices in active markets for identical securities.
Level 2 – significant observable inputs (including quoted prices for similar securities, interest rates, prepayment speeds, credit risk, etc.).
Level 3 – significant unobservable inputs (including assumptions made by the Board or persons acting at their direction that are used in determining the fair value of investments).
The inputs or methodology used for valuing securities are not necessarily an indication of the risk associated with investing in those securities. The following are certain inputs and techniques that the Funds generally use to evaluate how to classify each major category of assets and liabilities in accordance with GAAP.
Fixed income securities including corporate, convertible and municipal bonds and notes, U.S. government agencies, U.S. treasury obligations, sovereign bonds, bank loans, convertible preferred securities and non-U.S. bonds are normally valued by third-party pricing service providers that use broker quotations, reported trades or valuation estimates from their internal pricing models. The service providers’ internal models use inputs that are observable such as issuer details, interest rates, yield curves, prepayment speeds, credit risks/spreads, default rates and quoted prices for similar assets. Securities that use similar valuation techniques and inputs as described above are categorized as Level 2 of the fair value hierarchy. To the extent that these inputs are significant and unobservable, the values are categorized as Level 3 of the fair value hierarchy.
Mortgage-related and asset-backed securities are usually issued as separate tranches, or classes, of securities within each deal. These securities are also normally valued by third-party pricing service providers that use broker-dealer quotations or valuation estimates from their internal pricing models. The pricing models for these securities usually consider tranche-level attributes, current market data, estimated cash flows and market-based yield spreads for each tranche, and incorporate deal collateral performance, as available. Mortgage-related and asset-backed securities and the related forward sales commitments that use similar valuation techniques and inputs as described above are categorized as Level 2 of the fair value hierarchy. To the extent that these inputs are significant and unobservable, the values are categorized as Level 3 of the fair value hierarchy.
Common stocks, preferred stocks, rights, warrants, exchange-traded funds and financial derivative instruments, such as futures contracts or options contracts that are traded on a national securities exchange, are categorized as Level 1 of the fair value hierarchy, to the extent these securities are actively traded and valuation adjustments are not applied.
Valuation adjustments may be applied to certain securities that are solely traded on a foreign exchange to account for the market movement between the close of the foreign market and the NYSE close. Securities using these valuation adjustments are categorized as Level 2 of the fair value hierarchy. Preferred securities and other equities traded on inactive markets or valued by reference to similar instruments are also categorized as Level 2 of the fair value hierarchy.
Investments in registered open-end investment management companies are valued based upon the NAVs of such investments and are categorized as Level 1 of the fair value hierarchy.
Short-term investments having a maturity of 60 days or less are generally valued at amortized cost which approximates fair market value. These investments are categorized as Level 2 of the fair value hierarchy.
319
| Notes to Financial Statements |
| (continued) |
Over-the-counter financial derivative instruments, such as foreign currency contracts, forward foreign currency contracts, options contracts, or swap contracts, derive their value from underlying asset prices, indices, reference rates, and other inputs or a combination of these factors. These contracts are normally valued on the basis of broker dealer quotations or by third-party pricing service providers. Depending on the product and the terms of the transaction, the value of financial derivatives can be estimated by a third-party pricing service provider using a series of techniques, including simulation pricing models. The pricing models use inputs that are observed from actively quoted markets such as issuer details, indices, spreads, interest rates, yield curves, dividends and exchange rates. Financial derivatives that use similar valuation techniques and inputs as described above are categorized as Level 2 of the fair value hierarchy. To the extent that these inputs are significant and unobservable, the values are categorized as Level 3 of the fair value hierarchy.
Centrally cleared swaps listed or traded on a multilateral or trade facility platform, such as a registered exchange, are valued at the daily settlement price determined by the respective exchange. For centrally cleared credit default swaps the clearing facility requires its members to provide actionable levels across complete term structures. These levels along with external third party prices are used to produce daily settlement prices. Centrally cleared interest rate swaps are valued using a pricing model that references the underlying rates including the overnight index swap rate and London Interbank Offered Rate (“LIBOR”) forward rate to produce the daily settlement price. These securities are categorized as Level 2 of the fair value hierarchy.
The Funds’ policy is to recognize transfers between levels at the end of the reporting period. In some instances, the inputs used to measure fair value might fall in different levels of the fair value hierarchy. The level in the fair value hierarchy within which the fair value measurement in its entirety falls is determined based on the lowest level input that is significant to the fair value measurement in its entirety. Because of the inherent uncertainties of valuation, the values reflected in the financial statements may materially differ from the value received upon actual sale of those investments.
The following table summarizes the valuation of each Fund’s assets and liabilities using the fair value hierarchy:
| Total Fair Value at August 31, 2021 | Unadjusted Quoted Prices in Active Markets for Identical Investments (Level 1) | Significant Observable Inputs (Level 2) | Significant Unobservable Inputs (Level 3) | |||||||||||||
| Large Cap Equity Fund |
| |||||||||||||||
Investments, at Value | ||||||||||||||||
Common Stocks: | ||||||||||||||||
Communication Services | $ | 212,304,175 | $ | 212,304,175 | $ | — | $ | — | ||||||||
Consumer Discretionary | 273,681,518 | 273,681,518 | — | — | ||||||||||||
Consumer Staples | 96,922,090 | 96,922,090 | — | — | ||||||||||||
Energy | 36,066,317 | 36,066,317 | — | — | ||||||||||||
Financials | 209,984,530 | 209,984,530 | — | — | ||||||||||||
Health Care | 295,114,973 | 295,114,973 | — | — | ||||||||||||
Industrials | 206,228,366 | 206,228,366 | — | — | ||||||||||||
Information Technology | 625,127,546 | 624,875,833 | 251,713 | — | ||||||||||||
Materials | 54,163,170 | 54,163,170 | — | — | ||||||||||||
Real Estate | 63,567,767 | 63,567,767 | — | — | ||||||||||||
Utilities | 38,498,842 | 38,498,842 | — | — | ||||||||||||
Closed End Mutual Fund Security: | ||||||||||||||||
Financials | 20,554,936 | 20,554,936 | — | — | ||||||||||||
Short-Term Investments: |
| |||||||||||||||
Money Market Fund | 24,409,909 | 24,409,909 | — | — | ||||||||||||
Time Deposits | 35,623,083 | — | 35,623,083 | — | ||||||||||||
|
|
|
|
|
|
|
| |||||||||
| Total Investments, at Value | $ | 2,192,247,222 | $ | 2,156,372,426 | $ | 35,874,796 | $ | — | ||||||||
|
|
|
|
|
|
|
| |||||||||
| Security Lending Transactions — Liabilities | $ | (24,409,909 | ) | $ | — | $ | (24,409,909 | ) | $ | — | ||||||
|
|
|
|
|
|
|
| |||||||||
320
| Notes to Financial Statements |
| (continued) |
| Total Fair Value at August 31, 2021 | Unadjusted Quoted Prices in Active Markets for Identical Investments (Level 1) | Significant Observable Inputs (Level 2) | Significant Unobservable Inputs (Level 3) | |||||||||||||
| Other Financial Instruments — Assets | ||||||||||||||||
Futures Contracts | $ | 1,019,710 | $ | 1,019,710 | $ | — | $ | — | ||||||||
|
|
|
|
|
|
|
| |||||||||
| Total Other Financial Instruments — Assets | $ | 1,019,710 | $ | 1,019,710 | $ | — | $ | — | ||||||||
|
|
|
|
|
|
|
| |||||||||
| Small-Mid Cap Equity Fund |
| |||||||||||||||
Investments, at Value | ||||||||||||||||
Common Stocks: | ||||||||||||||||
Communication Services | $ | 15,136,793 | $ | 15,136,793 | $ | — | $ | — | ||||||||
Consumer Discretionary | 59,868,469 | * | 59,868,469 | — | — | * | ||||||||||
Consumer Staples | 27,581,054 | 27,581,054 | — | — | ||||||||||||
Energy | 13,547,891 | 13,547,891 | — | — | ||||||||||||
Financials | 85,541,461 | 85,541,461 | — | — | ||||||||||||
Health Care | 117,818,474 | * | 117,813,522 | 4,952 | — | * | ||||||||||
Industrials | 107,564,065 | 107,564,065 | — | — | ||||||||||||
Information Technology | 125,042,230 | 123,971,175 | 1,071,055 | — | ||||||||||||
Materials | 34,693,760 | * | 34,693,760 | — | — | * | ||||||||||
Real Estate | 43,682,849 | 43,682,849 | — | — | ||||||||||||
Utilities | 19,380,284 | 19,380,284 | — | — | ||||||||||||
Convertible Preferred Stocks: | ||||||||||||||||
Health Care | 3,209,923 | 3,209,923 | — | — | ||||||||||||
Utilities | 1,575,272 | 1,575,272 | — | — | ||||||||||||
Preferred Stocks: | ||||||||||||||||
Financials | 2,284,540 | 2,284,540 | — | — | ||||||||||||
Closed End Mutual Fund Securities: | ||||||||||||||||
Financials | 1,105,445 | 1,105,445 | — | — | ||||||||||||
Corporate Bonds & Notes: | ||||||||||||||||
Communication Services | 944,761 | — | 944,761 | — | ||||||||||||
Energy | 18,292 | — | 18,292 | — | ||||||||||||
Short-Term Investments: |
| |||||||||||||||
Money Market Fund | 58,746,706 | 58,746,706 | — | — | ||||||||||||
Time Deposits | 17,208,973 | — | 17,208,973 | — | ||||||||||||
|
|
|
|
|
|
|
| |||||||||
| Total Investments, at Value | $ | 734,951,242 | * | $ | 715,703,209 | $ | 19,248,033 | $ | — | * | ||||||
|
|
|
|
|
|
|
| |||||||||
| Security Lending Transactions — Liabilities | $ | (58,746,706 | ) | $ | — | $ | (58,746,706 | ) | $ | — | ||||||
|
|
|
|
|
|
|
| |||||||||
| Other Financial Instruments — Assets | ||||||||||||||||
Futures Contracts | $ | 37,228 | $ | 37,228 | $ | — | $ | — | ||||||||
|
|
|
|
|
|
|
| |||||||||
| Total Other Financial Instruments — Assets | $ | 37,228 | $ | 37,228 | $ | — | $ | — | ||||||||
|
|
|
|
|
|
|
| |||||||||
| International Equity Fund |
| |||||||||||||||
Investments, at Value | ||||||||||||||||
Common Stocks: | ||||||||||||||||
France | $ | 145,874,367 | $ | 54,056 | $ | 145,820,311 | $ | — | ||||||||
Germany | 129,295,760 | — | 129,295,760 | — | ||||||||||||
Japan | 253,309,676 | — | 253,309,676 | — | ||||||||||||
Netherlands | 78,022,119 | 43,799 | 77,978,320 | — | ||||||||||||
Switzerland | 162,073,902 | 4,092,348 | 157,981,554 | — | ||||||||||||
United Kingdom | 203,593,765 | 1,882,100 | 201,711,665 | — | ||||||||||||
Other Countries** | 440,905,773 | 64,352,872 | 376,552,901 | — | ||||||||||||
321
| Notes to Financial Statements |
| (continued) |
| Total Fair Value at August 31, 2021 | Unadjusted Quoted Prices in Active Markets for Identical Investments (Level 1) | Significant Observable Inputs (Level 2) | Significant Unobservable Inputs (Level 3) | |||||||||||||
Preferred Stocks: | ||||||||||||||||
Germany | $ | 3,905,827 | $ | — | $ | 3,905,827 | $ | — | ||||||||
Closed End Mutual Fund Security: | ||||||||||||||||
United States | 616,982 | 616,982 | — | — | ||||||||||||
Short-Term Investments: |
| |||||||||||||||
Convertible Bond | 1,277,572 | — | 1,277,572 | — | ||||||||||||
Money Market Fund | 6,097,629 | 6,097,629 | — | — | ||||||||||||
Time Deposits | 29,675,776 | — | 29,675,776 | — | ||||||||||||
|
|
|
|
|
|
|
| |||||||||
| Total Investments, at Value | $ | 1,454,649,148 | $ | 77,139,786 | $ | 1,377,509,362 | $ | — | ||||||||
|
|
|
|
|
|
|
| |||||||||
| Security Lending Transactions — Liabilities | $ | (6,097,629 | ) | $ | — | $ | (6,097,629 | ) | $ | — | ||||||
|
|
|
|
|
|
|
| |||||||||
| Other Financial Instruments — Assets | ||||||||||||||||
Futures Contracts | $ | 16,010 | $ | 16,010 | $ | — | $ | — | ||||||||
|
|
|
|
|
|
|
| |||||||||
| Total Other Financial Instruments — Assets | $ | 16,010 | $ | 16,010 | $ | — | $ | — | ||||||||
|
|
|
|
|
|
|
| |||||||||
| Other Financial Instruments — Liabilities | ||||||||||||||||
Futures Contract | $ | (1,158 | ) | $ | (1,158 | ) | $ | — | $ | — | ||||||
|
|
|
|
|
|
|
| |||||||||
| Total Other Financial Instruments — Liabilities | $ | (1,158 | ) | $ | (1,158 | ) | $ | — | $ | — | ||||||
|
|
|
|
|
|
|
| |||||||||
| Emerging Markets Equity Fund | ||||||||||||||||
Investments, at Value | ||||||||||||||||
Common Stocks: | ||||||||||||||||
China | $ | 148,209,815 | * | $ | 24,459,582 | $ | 123,750,233 | $ | — | * | ||||||
India | 65,315,423 | 9,366,186 | 55,949,237 | — | ||||||||||||
South Korea | 72,025,417 | 222,646 | 71,802,771 | — | ||||||||||||
Taiwan | 68,365,282 | 17,198,381 | 51,166,901 | — | ||||||||||||
Other Countries** | 187,122,595 | 83,373,250 | 103,749,326 | 19 | ||||||||||||
Preferred Stocks: | ||||||||||||||||
Brazil | 2,326,595 | 2,326,595 | — | — | ||||||||||||
Chile | 151,019 | 151,019 | — | — | ||||||||||||
Colombia | 83,558 | 83,558 | — | — | ||||||||||||
Russia | 42,155 | 42,155 | — | — | ||||||||||||
South Korea | 4,602,251 | — | 4,602,251 | — | ||||||||||||
Right: | ||||||||||||||||
China | 1,896 | — | 1,896 | — | ||||||||||||
Short-Term Investments: | ||||||||||||||||
Money Market Fund | 7,559,575 | 7,559,575 | — | — | ||||||||||||
Time Deposits | 12,255,540 | — | 12,255,540 | — | ||||||||||||
|
|
|
|
|
|
|
| |||||||||
| Total Investments, at Value | $ | 568,061,121 | * | $ | 144,782,947 | $ | 423,278,155 | $ | 19 | * | ||||||
|
|
|
|
|
|
|
| |||||||||
| Security Lending Transactions — Liabilities | $ | (7,559,575 | ) | $ | — | $ | (7,559,575 | ) | $ | — | ||||||
|
|
|
|
|
|
|
| |||||||||
| Other Financial Instruments — Asset | ||||||||||||||||
Futures Contract | $ | 10,630 | $ | 10,630 | $ | — | $ | — | ||||||||
|
|
|
|
|
|
|
| |||||||||
| Total Other Financial Instruments — Assets | $ | 10,630 | $ | 10,630 | $ | — | $ | — | ||||||||
|
|
|
|
|
|
|
| |||||||||
322
| Notes to Financial Statements |
| (continued) |
| Total Fair Value at August 31, 2021 | Unadjusted Quoted Prices in Active Markets for Identical Investments (Level 1) | Significant Observable Inputs (Level 2) | Significant Unobservable Inputs (Level 3) | |||||||||||||
| Core Fixed Income Fund | ||||||||||||||||
Investments, at Value | ||||||||||||||||
Corporate Bonds & Notes | $ | 399,135,318 | * | $ | — | $ | 399,135,318 | $ | — | * | ||||||
U.S. Government Agencies & Obligations | 388,474,720 | — | 388,474,720 | — | ||||||||||||
Mortgage-Backed Securities | 319,871,628 | — | 319,871,628 | — | ||||||||||||
Collateralized Mortgage Obligations | 112,504,516 | — | 112,504,516 | — | ||||||||||||
Sovereign Bonds | 47,798,165 | — | 47,798,165 | — | ||||||||||||
Senior Loans | 19,538,696 | — | 19,538,696 | — | ||||||||||||
Asset-Backed Securities | 10,272,737 | — | 10,272,737 | — | ||||||||||||
Municipal Bonds | 4,139,885 | — | 4,139,885 | — | ||||||||||||
Purchased Options | 213,865 | 148,757 | 65,108 | — | ||||||||||||
Short-Term Investments: | ||||||||||||||||
Asset-Backed Security | 530,281 | — | 530,281 | — | ||||||||||||
Time Deposits | 35,483,894 | — | 35,483,894 | — | ||||||||||||
U.S. Government Obligations | 81,481,071 | — | 81,481,071 | — | ||||||||||||
|
|
|
|
|
|
|
| |||||||||
| Total Investments, at Value | $ | 1,419,444,776 | * | $ | 148,757 | $ | 1,419,296,019 | $ | — | * | ||||||
|
|
|
|
|
|
|
| |||||||||
| Other Financial Instruments — Assets | ||||||||||||||||
Futures Contracts | $ | 397,444 | $ | 397,444 | $ | — | $ | — | ||||||||
Forward Foreign Currency Contracts | 211,170 | — | 211,170 | — | ||||||||||||
Centrally Cleared Interest Rate Swaps | 2,366,405 | — | 2,366,405 | — | ||||||||||||
|
|
|
|
|
|
|
| |||||||||
| Total Other Financial Instruments — Assets | $ | 2,975,019 | $ | 397,444 | $ | 2,577,575 | $ | — | ||||||||
|
|
|
|
|
|
|
| |||||||||
| Other Financial Instruments — Liabilities | ||||||||||||||||
Options Contracts Written | $ | (148,156 | ) | $ | (148,156 | ) | $ | — | $ | — | ||||||
Futures Contracts | (627,791 | ) | (627,791 | ) | — | — | ||||||||||
Forward Foreign Currency Contracts | (193,507 | ) | — | (193,507 | ) | — | ||||||||||
OTC Interest Rate Swap | (150,045 | ) | — | (150,045 | ) | — | ||||||||||
Centrally Cleared Interest Rate Swaps | (704,503 | ) | — | (704,503 | ) | — | ||||||||||
|
|
|
|
|
|
|
| |||||||||
| Total Other Financial Instruments — Liabilities | $ | (1,824,002 | ) | $ | (775,947 | ) | $ | (1,048,055 | ) | $ | — | |||||
|
|
|
|
|
|
|
| |||||||||
| High Yield Fund | ||||||||||||||||
Investments, at Value | ||||||||||||||||
Corporate Bonds & Notes | $ | 185,099,511 | $ | — | $ | 185,099,511 | $ | — | ||||||||
Senior Loans | 8,602,776 | — | 8,280,023 | 322,753 | ||||||||||||
Collateralized Mortgage Obligations | 4,890,485 | — | 4,890,485 | — | ||||||||||||
Convertible Preferred Stocks: | ||||||||||||||||
Energy | 808,130 | — | 808,130 | — | ||||||||||||
Common Stocks: | ||||||||||||||||
Energy | 326,992 | 324,735 | 2,257 | — | ||||||||||||
Preferred Stocks: | ||||||||||||||||
Financials | 455,082 | 455,082 | — | — | ||||||||||||
Sovereign Bonds | 57,142 | — | 57,142 | — | ||||||||||||
323
| Notes to Financial Statements |
| (continued) |
| Total Fair Value at August 31, 2021 | Unadjusted Quoted Prices in Active Markets for Identical Investments (Level 1) | Significant Observable Inputs (Level 2) | Significant Unobservable Inputs (Level 3) | |||||||||||||
Short-Term Investments: | ||||||||||||||||
Money Market Fund | $ | 129,000 | $ | 129,000 | $ | — | $ | — | ||||||||
Time Deposits | 10,304,636 | — | 10,304,636 | — | ||||||||||||
|
|
|
|
|
|
|
| |||||||||
| Total Investments, at Value | $ | 210,673,754 | $ | 908,817 | $ | 209,442,184 | $ | 322,753 | ||||||||
|
|
|
|
|
|
|
| |||||||||
| Security Lending Transactions — Liabilities | $ | (129,000 | ) | $ | — | $ | (129,000 | ) | $ | — | ||||||
|
|
|
|
|
|
|
| |||||||||
| International Fixed Income Fund |
| |||||||||||||||
Investments, at Value | ||||||||||||||||
Sovereign Bonds: | ||||||||||||||||
France | $ | 8,510,817 | $ | — | $ | 8,510,817 | $ | — | ||||||||
Japan | 28,933,800 | — | 28,933,800 | — | ||||||||||||
Spain | 10,168,580 | — | 10,168,580 | — | ||||||||||||
Other Countries** | 27,305,844 | — | 27,305,844 | — | ||||||||||||
Collateralized Mortgage Obligations | 30,067,215 | — | 28,725,135 | 1,342,080 | ||||||||||||
Corporate Bonds & Notes: | ||||||||||||||||
Other Countries** | 29,902,391 | — | 29,902,391 | — | ||||||||||||
Mortgage-Backed Securities | 18,194,197 | — | 18,194,197 | — | ||||||||||||
U.S. Government Obligations | 4,840,367 | — | 4,840,367 | — | ||||||||||||
Asset-Backed Securities | 476,030 | — | 476,030 | — | ||||||||||||
Purchased Options | 29,498 | — | 29,498 | — | ||||||||||||
Short-Term Investments: | ||||||||||||||||
Sovereign Bonds | 8,790,240 | — | 8,790,240 | — | ||||||||||||
Time Deposits | 1,292,651 | — | 1,292,651 | — | ||||||||||||
U.S. Government Obligations | 2,400,780 | — | 2,400,780 | — | ||||||||||||
|
|
|
|
|
|
|
| |||||||||
| Total Investments, at Value | $ | 170,912,410 | $ | — | $ | 169,570,330 | $ | 1,342,080 | ||||||||
|
|
|
|
|
|
|
| |||||||||
| Other Financial Instruments — Assets | ||||||||||||||||
Futures Contracts | $ | 45,843 | $ | 45,843 | $ | — | $ | — | ||||||||
Forward Foreign Currency Contracts | 765,558 | — | 765,558 | — | ||||||||||||
Centrally Cleared Interest Rate Swaps | 269,822 | — | 269,822 | — | ||||||||||||
Centrally Cleared Inflation Rate Swaps | 39,325 | — | 39,325 | — | ||||||||||||
OTC Credit Default Swaps | 79,194 | — | 79,194 | — | ||||||||||||
Centrally Cleared Credit Default Swaps | 13,583 | — | 13,583 | — | ||||||||||||
OTC Cross Currency Swap | 98,594 | — | 98,594 | — | ||||||||||||
|
|
|
|
|
|
|
| |||||||||
| Total Other Financial Instruments Assets | $ | 1,311,919 | $ | 45,843 | $ | 1,266,076 | $ | — | ||||||||
|
|
|
|
|
|
|
| |||||||||
| Other Financial Instruments — Liabilities | ||||||||||||||||
Options Contracts Written | $ | (94,870 | ) | $ | (6,848 | ) | $ | (88,022 | ) | $ | — | |||||
Forward Sale Commitments | (13,901,464 | ) | — | (13,901,464 | ) | — | ||||||||||
Futures Contracts | (29,204 | ) | (29,204 | ) | — | — | ||||||||||
Forward Foreign Currency Contracts | (284,059 | ) | — | (284,059 | ) | — | ||||||||||
Centrally Cleared Interest Rate Swaps | (332,561 | ) | — | (332,561 | ) | — | ||||||||||
Centrally Cleared Inflation Rate Swaps | (60,596 | ) | — | (60,596 | ) | — | ||||||||||
Centrally Cleared Credit Default Swaps | (40,469 | ) | — | (40,469 | ) | — | ||||||||||
OTC Total Return Swap | (442,865 | ) | — | (442,865 | ) | — | ||||||||||
|
|
|
|
|
|
|
| |||||||||
| Total Other Financial Instruments — Liabilities | $ | (15,186,088 | ) | $ | (36,052 | ) | $ | (15,150,036 | ) | $ | — | |||||
|
|
|
|
|
|
|
| |||||||||
324
| Notes to Financial Statements |
| (continued) |
| Total Fair Value at August 31, 2021 | Unadjusted Quoted Prices in Active Markets for Identical Investments (Level 1) | Significant Observable Inputs (Level 2) | Significant Unobservable Inputs (Level 3) | |||||||||||||
| Municipal Bond Fund | ||||||||||||||||
Investments, at Value | ||||||||||||||||
Municipal Bonds | $ | 83,206,622 | $ | — | $ | 83,206,622 | $ | — | ||||||||
Closed End Mutual Fund Security: | ||||||||||||||||
United States | 3,022,728 | 3,022,728 | — | — | ||||||||||||
Short-Term Investments: |
| |||||||||||||||
Time Deposits | 4,781,599 | — | 4,781,599 | — | ||||||||||||
|
|
|
|
|
|
|
| |||||||||
| Total Investments, at Value | $ | 91,010,949 | $ | 3,022,728 | $ | 87,988,221 | $ | — | ||||||||
|
|
|
|
|
|
|
| |||||||||
| Other Financial Instruments — Liabilities | ||||||||||||||||
Futures Contracts | $ | (148 | ) | $ | (148 | ) | $ | — | $ | — | ||||||
|
|
|
|
|
|
|
| |||||||||
| Total Other Financial Instruments — Liabilities | $ | (148 | ) | $ | (148 | ) | $ | — | $ | — | ||||||
|
|
|
|
|
|
|
| |||||||||
| Inflation-Linked Fixed Income Fund |
| |||||||||||||||
Investments, at Value | ||||||||||||||||
U.S. Government Agencies & Obligations | $ | 151,564,617 | $ | — | $ | 151,564,617 | $ | — | ||||||||
Sovereign Bonds | 17,898,314 | — | 17,898,314 | — | ||||||||||||
Collateralized Mortgage Obligations | 14,078,407 | — | 14,078,407 | — | ||||||||||||
Corporate Bonds & Notes | 7,223,451 | — | 7,223,451 | — | ||||||||||||
Mortgage-Backed Securities | 5,777,918 | — | 5,777,918 | — | ||||||||||||
Purchased Options | 191,401 | 37 | 191,364 | — | ||||||||||||
Short-Term Investments: | ||||||||||||||||
Time Deposits | 861,464 | — | 861,464 | — | ||||||||||||
|
|
|
|
|
|
|
| |||||||||
| Total Investments, at Value | $ | 197,595,572 | $ | 37 | $ | 197,595,535 | $ | — | ||||||||
|
|
|
|
|
|
|
| |||||||||
| Other Financial Instruments — Assets | ||||||||||||||||
Futures Contracts | $ | 231,276 | $ | 231,276 | $ | — | $ | — | ||||||||
Forward Foreign Currency Contracts | 176,757 | — | 176,757 | — | ||||||||||||
Centrally Cleared Interest Rate Swaps | 50,677 | — | 50,677 | — | ||||||||||||
Centrally Cleared Inflation Rate Swaps | 848,141 | — | 848,141 | — | ||||||||||||
Centrally Cleared Credit Default Swap | 1,795 | — | 1,795 | — | ||||||||||||
|
|
|
|
|
|
|
| |||||||||
| Total Other Financial Instruments — Assets | $ | 1,308,646 | $ | 231,276 | $ | 1,077,370 | $ | — | ||||||||
|
|
|
|
|
|
|
| |||||||||
| Other Financial Instruments — Liabilities | ||||||||||||||||
Options Contracts Written | $ | (165,647 | ) | $ | (1,866 | ) | $ | (163,781 | ) | $ | — | |||||
Reverse Repurchase Agreements | (37,952,296 | ) | — | (37,952,296 | ) | — | ||||||||||
Futures Contracts | (355,723 | ) | (355,723 | ) | — | — | ||||||||||
Forward Foreign Currency Contracts | (7,462 | ) | — | (7,462 | ) | — | ||||||||||
Centrally Cleared Inflation Rate Swaps | (1,176,150 | ) | — | (1,176,150 | ) | — | ||||||||||
|
|
|
|
|
|
|
| |||||||||
| Total Other Financial Instruments — Liabilities | $ | (39,657,278 | ) | $ | (357,589 | ) | $ | (39,299,689 | ) | $ | — | |||||
|
|
|
|
|
|
|
| |||||||||
325
| Notes to Financial Statements |
| (continued) |
| Total Fair Value at August 31, 2021 | Unadjusted Quoted Prices in Active Markets for Identical Investments (Level 1) | Significant Observable Inputs (Level 2) | Significant Unobservable Inputs (Level 3) | |||||||||||||
| Ultra-Short Term Fixed Income Fund |
| |||||||||||||||
Investments, at Value | ||||||||||||||||
Corporate Bonds & Notes | $ | 167,678,342 | $ | — | $ | 167,678,342 | $ | — | ||||||||
Collateralized Mortgage Obligations | 145,137,286 | — | 143,937,348 | 1,199,938 | ||||||||||||
U.S. Government Agencies & Obligations | 79,471,078 | — | 79,471,078 | — | ||||||||||||
Asset-Backed Securities | 19,259,642 | — | 18,959,926 | 299,716 | ||||||||||||
Sovereign Bonds | 9,042,527 | — | 9,042,527 | — | ||||||||||||
Mortgage-Backed Securities | 1,728,268 | — | 1,728,268 | — | ||||||||||||
Short-Term Investments: |
| |||||||||||||||
Corporate Bond | 500,670 | — | 500,670 | — | ||||||||||||
Time Deposits | 5,527,858 | — | 5,527,858 | — | ||||||||||||
U.S. Government Obligations | 10,498,149 | — | 10,498,149 | — | ||||||||||||
|
|
|
|
|
|
|
| |||||||||
| Total Investments, at Value | $ | 438,843,820 | $ | — | $ | 437,344,166 | $ | 1,499,654 | ||||||||
|
|
|
|
|
|
|
| |||||||||
| Other Financial Instruments — Assets | ||||||||||||||||
Futures Contracts | $ | 114,221 | $ | 114,221 | $ | — | $ | — | ||||||||
Forward Foreign Currency Contracts | 1,169,623 | — | 1,169,623 | — | ||||||||||||
|
|
|
|
|
|
|
| |||||||||
| Total Other Financial Instruments — Assets | $ | 1,283,844 | $ | 114,221 | $ | 1,169,623 | $ | — | ||||||||
|
|
|
|
|
|
|
| |||||||||
| Other Financial Instruments — Liabilities | ||||||||||||||||
Futures Contracts | $ | (319,599 | ) | $ | (319,599 | ) | $ | — | $ | — | ||||||
Forward Foreign Currency Contracts | (204,061 | ) | — | (204,061 | ) | — | ||||||||||
Centrally Cleared Credit Default Swap | (28,539 | ) | — | (28,539 | ) | — | ||||||||||
|
|
|
|
|
|
|
| |||||||||
| Total Other Financial Instruments — Liabilities | $ | (552,199 | ) | $ | (319,599 | ) | $ | (232,600 | ) | $ | — | |||||
|
|
|
|
|
|
|
| |||||||||
| Alternative Strategies Fund | ||||||||||||||||
Investments, at Value | ||||||||||||||||
Open End Mutual Fund Securities | ||||||||||||||||
United States | $ | 116,946,570 | $ | 116,946,570 | $ | — | $ | — | ||||||||
|
|
|
|
|
|
|
| |||||||||
| Total Investments, at Value | $ | 116,946,570 | $ | 116,946,570 | $ | — | $ | — | ||||||||
|
|
|
|
|
|
|
| |||||||||
| * | Includes securities that are valued in good faith at fair value by or under the direction of the Board of Trustees at $0. |
| ** | Other countries represents countries that are individually less than 5% of Net Assets. |
The level classification by major category of investments is the same as the category presentation in the Schedules of Investments.
Transfer between investment levels may occur as the markets fluctuate and/or the availability of data used in an investment’s valuation changes.
326
| Notes to Financial Statements |
| (continued) |
The following is a reconciliation of assets for which significant unobservable inputs (Level 3) were used in determining fair value during the year September 1, 2020 through August 31, 2021:
| Total | Collateralized Mortgage Obligations | Asset-Backed Securities | Common Stocks | Corporate Bonds & Notes | Senior Loans | |||||||||||||||||||
| Small-Mid Cap Equity Fund | ||||||||||||||||||||||||
Balance as of August 31, 2020 | $ | — | * | $ | — | $ | — | $ | — | * | $ | — | $ | — | ||||||||||
Total realized gain (loss) | — | — | — | — | — | — | ||||||||||||||||||
Change in unrealized appreciation (depreciation) | — | — | — | — | — | — | ||||||||||||||||||
Purchases | — | * | — | — | — | * | — | — | ||||||||||||||||
(Sales) | — | * | — | — | — | * | — | — | ||||||||||||||||
Transfers in | — | — | — | — | — | — | ||||||||||||||||||
(Transfers out) | — | — | — | — | — | — | ||||||||||||||||||
|
|
|
|
|
|
|
|
|
|
|
| |||||||||||||
Balance as of August 31, 2021 | $ | — | * | $ | — | $ | — | $ | — | * | $ | — | $ | — | ||||||||||
|
|
|
|
|
|
|
|
|
|
|
| |||||||||||||
Change in unrealized appreciation (depreciation) from Investments held as of August 31, 2021 | $ | — | $ | — | $ | — | $ | — | $ | — | $ | — | ||||||||||||
|
|
|
|
|
|
|
|
|
|
|
| |||||||||||||
| Emerging Markets Equity Fund | ||||||||||||||||||||||||
Balance as of August 31, 2020 | $ | — | $ | — | $ | — | $ | — | $ | — | $ | — | ||||||||||||
Total realized gain (loss) | — | — | — | — | — | — | ||||||||||||||||||
Change in unrealized appreciation (depreciation) | — | — | — | — | — | — | ||||||||||||||||||
Purchases | — | — | — | — | — | — | ||||||||||||||||||
(Sales) | — | — | — | — | — | — | ||||||||||||||||||
Transfers in | 19 | * | — | — | 19 | * | — | — | ||||||||||||||||
(Transfers out) | — | — | — | — | — | — | ||||||||||||||||||
|
|
|
|
|
|
|
|
|
|
|
| |||||||||||||
Balance as of August 31, 2021 | 19 | * | $ | — | $ | — | $ | 19 | * | $ | — | $ | — | |||||||||||
|
|
|
|
|
|
|
|
|
|
|
| |||||||||||||
Change in unrealized appreciation (depreciation) from Investments held as of August 31, 2021 | $ | — | $ | — | $ | — | $ | — | $ | — | $ | — | ||||||||||||
|
|
|
|
|
|
|
|
|
|
|
| |||||||||||||
| Core Fixed Income Fund | ||||||||||||||||||||||||
Balance as of August 31, 2020 | $ | — | * | $ | — | $ | — | $ | — | $ | — | * | $ | — | ||||||||||
Total realized gain (loss) | — | — | — | — | — | — | ||||||||||||||||||
Change in unrealized appreciation (depreciation) | — | — | — | — | — | — | ||||||||||||||||||
Purchases | — | — | — | — | — | — | ||||||||||||||||||
(Sales) | — | — | — | — | — | — | ||||||||||||||||||
Transfers in | — | — | — | — | — | — | ||||||||||||||||||
(Transfers out) | — | — | — | — | — | |||||||||||||||||||
|
|
|
|
|
|
|
|
|
|
|
| |||||||||||||
Balance as of August 31, 2021 | $ | — | * | $ | — | $ | — | $ | — | $ | — | * | $ | — | ||||||||||
|
|
|
|
|
|
|
|
|
|
|
| |||||||||||||
Change in unrealized appreciation (depreciation) from Investments held as of August 31, 2021 | $ | — | $ | — | $ | — | $ | — | $ | — | $ | — | ||||||||||||
|
|
|
|
|
|
|
|
|
|
|
| |||||||||||||
327
| Notes to Financial Statements |
| (continued) |
| Total | Collateralized Mortgage Obligations | Asset-Backed Securities | Common Stocks | Corporate Bonds & Notes | Senior Loans | |||||||||||||||||||
| High Yield Fund | ||||||||||||||||||||||||
Balance as of August 31, 2020 | $ | 19,472 | $ | — | $ | — | $ | 19,472 | $ | — | $ | — | ||||||||||||
Total realized gain (loss) | (202,289 | ) | — | — | (202,289 | ) | — | — | ||||||||||||||||
Change in unrealized appreciation (depreciation) | 188,240 | — | — | 191,500 | — | (3,260 | ) | |||||||||||||||||
Purchases | 326,013 | — | — | — | — | 326,013 | ||||||||||||||||||
(Sales) | (6,426 | ) | — | — | (6,426 | ) | — | — | ||||||||||||||||
Transfers in | — | — | — | — | — | — | ||||||||||||||||||
(Transfers out) | (2,257 | ) | — | — | (2,257 | ) | — | — | ||||||||||||||||
|
|
|
|
|
|
|
|
|
|
|
| |||||||||||||
Balance as of August 31, 2021 | $ | 322,753 | $ | — | $ | — | $ | — | $ | — | $ | 322,753 | ||||||||||||
|
|
|
|
|
|
|
|
|
|
|
| |||||||||||||
Change in unrealized appreciation (depreciation) from Investments held as of August 31, 2021 | $ | (3,260 | ) | $ | — | $ | — | $ | — | $ | — | $ | (3,260 | ) | ||||||||||
|
|
|
|
|
|
|
|
|
|
|
| |||||||||||||
| International Fixed Income Fund | ||||||||||||||||||||||||
Balance as of August 31, 2020 | — | $ | — | $ | — | $ | — | $ | — | $ | — | |||||||||||||
Total realized gain (loss) | — | — | — | — | — | — | ||||||||||||||||||
Change in unrealized appreciation (depreciation) | 1,202 | 1,202 | — | — | — | — | ||||||||||||||||||
Purchases | 1,340,878 | 1,340,878 | — | — | — | — | ||||||||||||||||||
(Sales) | — | — | �� | — | — | — | — | |||||||||||||||||
Transfers in | — | — | — | — | — | — | ||||||||||||||||||
(Transfers out) | — | — | — | — | — | — | ||||||||||||||||||
|
|
|
|
|
|
|
|
|
|
|
| |||||||||||||
Balance as of August 31, 2021 | $ | 1,342,080 | $ | 1,342,080 | $ | — | $ | — | $ | — | $ | — | ||||||||||||
|
|
|
|
|
|
|
|
|
|
|
| |||||||||||||
Change in unrealized appreciation (depreciation) from Investments held as of August 31, 2021 | $ | 1,202 | $ | 1,202 | $ | — | $ | — | $ | — | $ | — | ||||||||||||
|
|
|
|
|
|
|
|
|
|
|
| |||||||||||||
| Ultra-Short Term Fixed Income Fund | ||||||||||||||||||||||||
Balance as of August 31, 2020 | — | $ | — | $ | — | $ | — | $ | — | $ | — | |||||||||||||
Total realized gain (loss) | — | — | — | — | — | — | ||||||||||||||||||
Change in unrealized appreciation (depreciation) | (280 | ) | 4 | (284 | ) | — | — | — | ||||||||||||||||
Purchases | 1,499,934 | 1,199,934 | 300,000 | — | — | — | ||||||||||||||||||
(Sales) | — | — | — | — | — | — | ||||||||||||||||||
Transfers in | — | — | — | — | — | — | ||||||||||||||||||
(Transfers out) | — | — | — | — | — | — | ||||||||||||||||||
|
|
|
|
|
|
|
|
|
|
|
| |||||||||||||
Balance as of August 31, 2021 | $ | 1,499,654 | $ | 1,199,938 | $ | 299,716 | $ | — | $ | — | $ | — | ||||||||||||
|
|
|
|
|
|
|
|
|
|
|
| |||||||||||||
Change in unrealized appreciation (depreciation) from Investments held as of August 31, 2021 | $ | (280 | ) | $ | 4 | $ | (284 | ) | $ | — | $ | — | $ | — | ||||||||||
|
|
|
|
|
|
|
|
|
|
|
| |||||||||||||
| * | Includes securities that are valued at $0. |
(b) Accounting for Derivative Instruments. Derivative instruments require enhanced disclosures regarding a Fund’s credit derivatives holdings, including credit default swaps, credit spread options and hybrid financial instruments containing embedded credit derivatives.
All open derivative positions at the year-end for each Fund are disclosed in the Fund’s Schedule of Investments.
328
| Notes to Financial Statements |
| (continued) |
Certain Funds may use derivative instruments including futures, options, forward foreign currency contracts, swaptions and swap contracts as part of their investment strategies. Following is a description of these derivative instruments, including the primary underlying risk exposures related to each instrument type:
(i) Futures Contracts. Certain Funds may enter into futures contracts, to the extent permitted by their investment policies and objectives, for bonafide hedging and other permissible risk management purposes including protecting against anticipated changes in the value of securities a Fund intends to purchase. Upon entering into a futures contract, a Fund is required to deposit cash or securities as initial margin, which is included in deposits for collateral with counterparty on the Statements of Assets and Liabilities. Additional securities are also segregated as collateral up to the current market value of the futures contracts. Subsequent payments, known as variation margin, are made or received by the Fund, depending on the fluctuation in the value of the underlying financial instruments and are reported on the Statements of Assets and Liabilities. The Fund recognizes an unrealized gain or loss equal to the variation margin. When futures contracts are closed, a realized gain or loss is recognized which is equal to the difference between the proceeds from (or cost of) the closing transactions and the Fund’s basis in the contracts.
The risks associated with entering into futures contracts include the possibility that a change in the value of the contract may not correlate with the changes in the value of the underlying instruments. In addition, investing in futures contracts involves the risk that the Fund could lose more than the original margin deposit due to subsequent payments that may be required for a futures transaction.
(ii) Options Written. Certain Funds may write options to manage exposure to certain changes in the market. When a Fund writes an option, an amount equal to the premium received by the Fund is recorded as a liability, the value of which is marked-to-market daily to reflect the current market value of the option written. If the option expires, the Fund realizes a gain from investments equal to the amount of the premium received. When a written call option is exercised, the premium received is added to the proceeds from the sale of the underlying security in determining whether the Fund has a realized gain or loss. When a written put option is exercised, the amount of the premium received reduces the cost of the security purchased by the Fund.
When writing a covered call option, a Fund may forego the opportunity of profit if the market price of the underlying security increases more than the premium received and the option is exercised. When writing a put option, a Fund may incur a loss if the market price of the underlying security decreases more than the premium received and the option is exercised. In addition, there is the risk that the Fund may not be able to enter into a closing transaction because of an illiquid secondary market.
(iii) Purchased Options. Certain Funds may purchase options to manage exposure to certain changes in the market. A Fund will normally purchase call options in anticipation of an increase in the market value of securities of the type in which they may invest, an amount equal to the value is recorded as an asset. The purchase of a call option will entitle a Fund, in return for the premium paid, to purchase specified securities at a specified price during the option period. A Fund will ordinarily realize a gain if, during the option period, the value of such securities exceeded the sum of the exercise price, the premium paid and transaction costs; otherwise, the Fund will realize a loss equal to the amount of the premium paid on the purchase of the call option.
A Fund will normally purchase put options in anticipation of a decline in the market value of securities in its portfolio (“protective puts”) or in securities in which it may invest. The purchase of a put option will entitle the Fund, in exchange for the premium paid, to sell specified securities at a specified price during the option period. The purchase of protective puts is designed to offset or hedge against a decline in the market value of the Fund’s securities. Put options may also be purchased by a Fund for the purpose of affirmatively benefiting from a decline in the price of securities which it does not own. The Fund will ordinarily realize a gain if, during the option period, the value of the underlying securities decreased below the exercise price sufficiently to more than cover the premium and transaction costs; otherwise the Fund will realize a loss equal to the amount of the premium paid on the purchase of the put option. Gains and losses on the purchase of protective put options would tend to be offset by countervailing changes in the value of the underlying portfolio securities.
(iv) Inflation-Capped Options. Certain Funds may write or purchase inflation-capped options to enhance returns or for hedging opportunities. When a Fund writes an inflation-capped option, an amount equal to the premium received is recorded
329
| Notes to Financial Statements |
| (continued) |
as a liability on the Statements of Assets and Liabilities and subsequently marked to market to reflect the change value of the option written. When a Fund purchases an inflation-capped option, the Fund pays a premium which is recorded as an asset on the Statements of Assets and Liabilities and subsequently marked to market to reflect the current value of the option. The purpose of purchasing inflation-capped options is to protect a Fund from inflation erosion above a certain rate on a given notional exposure. A floor can be used to give downside protection to investments in inflation-linked products.
(v) Forward Foreign Currency Contracts. Certain Funds may enter into forward foreign currency contracts to hedge against foreign currency exchange rate risk on their non-U.S. dollar denominated securities or to facilitate settlement of foreign currency denominated portfolio transactions. A forward foreign currency contract is an agreement between two parties to buy and sell a currency at a set price on a future date. The contract is marked-to-market daily and the change in value is recorded by a Fund as an unrealized gain or loss. When a forward foreign currency contract is extinguished, through either delivery or offset by entering into another forward foreign currency contract, the Fund records a realized gain or loss equal to the difference between the value of the contract at the time it was opened and the value of the contract at the time it was extinguished.
Forward foreign currency contracts involve elements of market risk in excess of the amounts reflected in the Statements of Assets and Liabilities. The Fund bears the risk of an unfavorable change in the foreign exchange rate underlying the forward foreign currency contract. Risks may also arise upon entering into these contracts from the potential inability of the counterparties to meet the terms of their contracts.
(vi) Swaptions. Swaptions contracts entered into by the Funds typically represent an option that gives the purchaser the right, but not the obligation, to enter into a swap contract on a future date. Certain Funds may purchase swaptions to manage exposure to fluctuations in interest rates and to enhance portfolio yield. Changes in the value of purchased swaptions are reported as net change in unrealized appreciation or depreciation on the Statements of Operations and Changes in Net Assets. Gain or loss is recognized when the swaptions contract expires or is closed as net realized gain or loss on the Statements of Operations and Changes in Net Assets. Details of purchased swaptions contracts held at year-end are included on the Fund’s Schedule of Investments under the caption “Purchased Options.”
Certain Funds may write swaption contracts to manage exposure to fluctuations in interest rates and to enhance portfolio yield. Swaption contracts written by a Fund represent an option that obligates the writer upon exercise by the purchaser, to enter into a previously agreed upon swap contract on a future date. If a written call swaption is exercised, the writer will enter into a swap and is obligated to pay the fixed rate and receive a floating rate in exchange. If a written put swaption is exercised, the writer will enter a swap and is obligated to pay the floating rate and receive a fixed rate in exchange.
When a Fund writes a swaption, the premium received is recorded as a liability in the Statements of Assets and Liabilities and is subsequently adjusted to the current market value of the swaption. Changes in the value of the swaption are reported as unrealized gains or losses in the Statements of Operations. A gain or loss is recognized when the swaption contract expires or is closed. Premiums received from writing swaptions that expire or are exercised are treated by the Fund as realized gains from investments. The difference between the premium and the amount paid on effecting a closing purchase transaction is also treated as a realized gain or, if the premium received is less than the amount paid for the closing purchase, as a realized loss.
Entering into a swaption contract involves, to varying degrees, the elements of credit, market and interest rate risk, associated with both option contracts and swap contracts. To reduce credit risk from potential counterparty default, a Fund only enters into swaption contracts with counterparties that meet certain standards of creditworthiness. A Fund bears the market risk arising from any change in index values or interest rates.
(vii) Swap Contracts. Swaps involve the exchange by a Fund with another party of the respective amounts payable with respect to a notional principal amount related to one or more indices. Certain Funds may enter into these transactions to preserve a return or spread on a particular investment or portion of its assets, as a duration management technique or to protect against any increase in the price of securities the Fund anticipates purchasing at a later date. Certain Funds may also use these transactions for speculative purposes, such as to obtain the price performance of a security without actually purchasing the security in circumstances where, for example, the subject security is illiquid, is unavailable for direct investment or available only on less attractive terms.
330
| Notes to Financial Statements |
| (continued) |
Swaps are marked-to-market daily based upon quotations from market makers and the change, if any, is recorded as change in unrealized appreciation or depreciation in the Statements of Operations. Net receipts or payments of interest are recorded as realized gains or losses, respectively. Gains and losses are realized upon termination of a swap contract. An upfront payment received by the Fund, is recorded as a liability on the Fund’s books. An upfront payment made by the Fund is recorded as an asset on the Fund’s books. Any upfront payments paid or received upon entering a swap contract to compensate for differences between stated terms of the agreement and prevailing market conditions (e.g. credit spreads, interest rates or other factors) are recorded as a realized gain or loss at the termination of the swap.
Swaps have risks associated with them, including possible default by the counterparty to the transaction, illiquidity and, where swaps are used as hedges, the risk that the use of a swap could result in losses greater than if the swap had not been employed. This risk is mitigated by the posting of collateral by the counterparty to the Fund to cover the Fund’s exposure to the counterparty. Such amounts are reported on the Statements of Assets and Liabilities as deposits with counterparties.
(viii) Credit Default Swaps. Certain Funds may enter into credit default swap contracts for investment purposes, to manage their credit risk or to add leverage. As a seller in a credit default swap contract, a Fund is required to pay the notional or other agreed-upon value to the counterparty in the event of a default by a third party, such as a U.S. or foreign corporate issuer, on the referenced debt obligation. In return, the Fund receives from the counterparty a periodic stream of payments over the term of the contract provided that no event of default has occurred. If no default occurs, the Fund keeps the stream of payments and has no payment obligations. Such periodic payments are accrued daily and accounted for as realized gains.
Certain Funds may also purchase credit default swap contracts in order to hedge against the risk of default by debt securities held in their portfolios. In these cases, a Fund functions as the counterparty referenced in the preceding paragraph. As a purchaser of a credit default swap contract, the Fund receives the notional or other agreed upon value from the counterparty in the event of a default by a third party, such as a U.S. or foreign corporate issuer, on the referenced debt obligation. In return, the Fund makes periodic payments to the counterparty over the term of the contract provided no event of default has occurred. Such periodic payments are accrued daily and accounted for as realized losses.
For a credit default swap sold by a Fund, payment of the agreed upon amount made by the Fund in the event of default of the referenced debt obligation is recorded as the cost of the referenced debt obligation received. For a credit default swap purchased by a Fund, the agreed upon amount received by the Fund in the event of default of the referenced debt obligation is recorded as proceeds from sale/delivery of the referenced debt obligation and the resulting gain or loss realized on the referenced debt obligation is recorded as such by the Fund.
Entering into credit default swaps involves, to varying degrees, elements of credit and market risk in excess of the related amounts recognized on the Statements of Assets and Liabilities. Such risks involve the possibility that there will be no liquid market for these agreements, that the counterparty to the agreements may default on its obligation to perform or disagree as to the meaning of the contractual terms in the agreements, and that there will be unfavorable changes in net interest rates. As privately negotiated transactions, swaps may involve risk, which is the risk that the swap contracts fail to contemplate a particular outcome or that the parties disagree about the proper interpretation of a transaction term.
(ix) Interest Rate Swaps. Certain Funds may enter into interest rate swaps for investment purposes to manage exposure to fluctuations in interest rates or to add leverage. Interest rate swaps represent an agreement between two counterparties to exchange cash flows based on the difference in the fixed interest rate and the floating interest rate, applied to the notional principal amount for a specified period. The payment flows are usually netted against each other, with the difference being paid by one party to the other. Once the payments are settled in cash, the net amount is recorded as realized gain or loss from swap contracts on the Statements of Operations. The Funds settle accrued net receivable or payable under the swap contracts on a periodic basis.
The primary risk associated with interest rate swaps is that unfavorable changes in interest rates could adversely impact a Fund.
(x) Centrally Cleared Swaps. Certain clearinghouses currently offer clearing for limited types of derivatives transactions, principally credit and interest derivatives. In a centrally cleared derivative transaction, a Fund typically enters into the transaction with financial institution counterparty, and performance of the transaction is effectively guaranteed by a central clearinghouse, thereby reducing or eliminating the Fund’s exposure to the credit risk of the original counterparty. The Fund
331
| Notes to Financial Statements |
| (continued) |
typically will be required to post specified levels of margin with the clearinghouse or at the instruction of the clearinghouse. The margin required by a clearinghouse may be greater than the margin the Fund would be required to post in an uncleared derivative transaction. Daily changes in valuation of centrally cleared swaps, if any, are recorded as variation margin receivable or payable on swap contracts for the change in value as appropriate on the Statements of Assets and Liabilities. Only a limited number of derivative transactions are currently eligible for clearing by clearinghouses.
(xi) Cross-Currency Swaps. Certain Funds may enter into cross-currency swaps to gain or mitigate exposure to currency risk. Cross-currency swaps involve two parties exchanging two different currencies with an agreement to reverse the exchange at a later date at specific exchange rates. The exchange of currencies at the inception date of the contract takes place at the current spot rate. The re-exchange at maturity may take place at the same exchange rate, a specified rate, or the then current spot rate. Interest payments, if applicable, are made between the parties based on interest rates available in the two currencies at the inception of the contract. The terms of cross-currency swap contracts may extend for many years. Cross-currency swaps are usually negotiated with commercial and investment banks. Some cross-currency swaps may not provide for exchanging principal cash flows, but only for exchanging interest cash flows.
(xii) Volatility Swap Contracts. A volatility swap is an agreement between counterparties to exchange periodic payments based on the measured volatility of a reference security, index, currency or other reference investment over a specified time frame. One cash flow is typically based on the realized volatility of the reference investment as measured by changes in its price or level over the specified time period while the other cash flow is based on a specified rate representing expected volatility for the reference investment at the time the swap is executed, or the measured volatility of a different reference investment over the specified time period. The appreciation or depreciation on a volatility swap will typically depend on the magnitude of the reference investment’s volatility, or size of the movements in its price, over the specified time period, rather than general directional increases or decreases in its price.
Volatility swaps are less standard in structure than other types of swaps and provide pure, or isolated, exposure to volatility risk of the specific underlying reference investment. Volatility swaps are typically used to speculate on future volatility levels, to trade the spread between realized and expected volatility, or to decrease the volatility exposure of investments held by the Fund.
Variance swaps are a type of volatility swap where counterparties agree to exchange periodic payments based on the measured variance (or the volatility squared) of a reference security, index, or other reference investment over a specified time period. At payment date, a net cash flow will be exchanged based on the difference between the realized variance of the reference investment over the specified time period and the specified rate representing expected variance for the reference investment at the time the swap is executed multiplied by the notional amount of the contract.
(xiii) Inflation Rate Swap Contracts. The Fund may enter into inflation rate swap contracts to attempt to hedge against inflation. Pursuant to the inflation rate swap agreement, the Fund negotiates with a counterparty to exchange a periodic stream of payments, based on a benchmark inflation index. One cash flow stream will typically be a floating rate payment linked to the specified inflation index while the other is typically a fixed interest rate.
Inflation rate swaps are normally issued on a zero coupon basis where all payments compound during the life of the contract and are netted upon the termination or maturity of the contract. Final payments received or paid by the Fund are recorded as realized gains or losses in the Statements of Operations. Inflation rate swap contracts are subject to movements in interest rates.
(xiv) Total Return Swaps. The Fund may enter into total return swap contracts to gain exposure and benefit from reference asset (single asset, or a basket of assets) without actually having to own it. Total return swap contracts are agreements where the total return of a reference asset is paid in exchange for periodic cash flows. The deal is structured such that the total return (asset income plus capital appreciation/depreciation) is exchanged, in the cash flows. Periodic payments received or made by the Fund are recorded as realized gains or losses in the Statements of Operations.
332
| Notes to Financial Statements |
| (continued) |
The following is a summary of the fair valuations of the Funds’ derivative instruments categorized by risk exposure at August 31, 2021:
Large Cap Equity Fund
Fair Values of Derivative Instruments on the Statements of Assets and Liabilities as of August 31, 2021: | ||||||||||||||||||||
| Location | Interest rate risk | Foreign exchange risk | Credit risk | Equity risk | Total | |||||||||||||||
| Asset derivatives | ||||||||||||||||||||
Unrealized appreciation on open futures contracts (b) | $ | — | $ | — | $ | — | $ | 1,019,710 | $ | 1,019,710 | ||||||||||
|
|
|
|
|
|
|
|
|
| |||||||||||
Effect of Derivative Instruments on the Statements of Operations for the Year Ended August 31, 2021: | ||||||||||||||||||||
| Location | Interest rate risk | Foreign exchange risk | Credit risk | Equity risk | Total | |||||||||||||||
| Realized gain/(loss) on derivatives (d) | ||||||||||||||||||||
Futures contracts | $ | — | $ | — | $ | — | $ | 4,104,681 | $ | 4,104,681 | ||||||||||
|
|
|
|
|
|
|
|
|
| |||||||||||
| Change in unrealized appreciation (depreciation) on derivatives (e) | ||||||||||||||||||||
Futures contracts | $ | — | $ | — | $ | — | $ | (185,400 | ) | $ | (185,400 | ) | ||||||||
|
|
|
|
|
|
|
|
|
| |||||||||||
Small-Mid Cap Equity Fund
Fair Values of Derivative Instruments on the Statements of Assets and Liabilities as of August 31, 2021: | ||||||||||||||||||||
| Location | Interest rate risk | Foreign exchange risk | Credit risk | Equity risk | Total | |||||||||||||||
| Asset derivatives | ||||||||||||||||||||
Unrealized appreciation on open futures contracts (b) | $ | — | $ | — | $ | — | $ | 37,228 | $ | 37,228 | ||||||||||
|
|
|
|
|
|
|
|
|
| |||||||||||
Effect of Derivative Instruments on the Statements of Operations for the Year Ended August 31, 2021: | ||||||||||||||||||||
| Location | Interest rate risk | Foreign exchange risk | Credit risk | Equity risk | Total | |||||||||||||||
| Realized gain/(loss) on derivatives (d) | ||||||||||||||||||||
Futures contracts | $ | — | $ | — | $ | — | $ | 2,124,304 | $ | 2,124,304 | ||||||||||
|
|
|
|
|
|
|
|
|
| |||||||||||
| Change in unrealized appreciation (depreciation) on derivatives (e) | ||||||||||||||||||||
Futures contracts | $ | — | $ | — | $ | — | $ | (404,863 | ) | $ | (404,863 | ) | ||||||||
|
|
|
|
|
|
|
|
|
| |||||||||||
International Equity Fund
Fair Values of Derivative Instruments on the Statements of Assets and Liabilities as of August 31, 2021: | ||||||||||||||||||||
| Location | Interest rate risk | Foreign exchange risk | Credit risk | Equity risk | Total | |||||||||||||||
| Asset derivatives | ||||||||||||||||||||
Unrealized appreciation on open futures contracts (b) | $ | — | $ | — | $ | — | $ | 16,010 | $ | 16,010 | ||||||||||
|
|
|
|
|
|
|
|
|
| |||||||||||
| Liability derivatives | ||||||||||||||||||||
Unrealized depreciation on open futures contracts (b) | $ | — | $ | — | $ | — | $ | 1,158 | $ | 1,158 | ||||||||||
|
|
|
|
|
|
|
|
|
| |||||||||||
333
| Notes to Financial Statements |
| (continued) |
Effect of Derivative Instruments on the Statements of Operations for the Year Ended August 31, 2021: | ||||||||||||||||||||
| Location | Interest rate risk | Foreign exchange risk | Credit risk | Equity risk | Total | |||||||||||||||
| Realized gain/(loss) on derivatives (d) | ||||||||||||||||||||
Futures contracts | $ | — | $ | — | $ | — | $ | 404,067 | $ | 404,067 | ||||||||||
|
|
|
|
|
|
|
|
|
| |||||||||||
| Change in unrealized appreciation (depreciation) on derivatives (e) | ||||||||||||||||||||
Futures contracts | $ | — | $ | — | $ | — | $ | 12,913 | $ | 12,913 | ||||||||||
|
|
|
|
|
|
|
|
|
| |||||||||||
Emerging Markets Equity Fund
Fair Values of Derivative Instruments on the Statements of Assets and Liabilities as of August 31, 2021: | ||||||||||||||||||||
| Location | Interest rate risk | Foreign exchange risk | Credit risk | Equity risk | Total | |||||||||||||||
| Asset derivatives | ||||||||||||||||||||
Unrealized appreciation on open futures contracts (b) | $ | — | $ | — | $ | — | $ | 10,630 | $ | 10,630 | ||||||||||
|
|
|
|
|
|
|
|
|
| |||||||||||
Effect of Derivative Instruments on the Statements of Operations for the Year Ended August 31, 2021: | ||||||||||||||||||||
| Location | Interest rate risk | Foreign exchange risk | Credit risk | Equity risk | Total | |||||||||||||||
| Realized gain/(loss) on derivatives (d) | ||||||||||||||||||||
Futures contracts | $ | — | $ | — | $ | — | $ | 393,117 | $ | 393,117 | ||||||||||
Forward foreign currency contracts | — | (19,460 | ) | — | — | (19,460 | ) | |||||||||||||
|
|
|
|
|
|
|
|
|
| |||||||||||
| $ | — | $ | (19,460 | ) | $ | — | $ | 393,117 | $ | 373,657 | ||||||||||
|
|
|
|
|
|
|
|
|
| |||||||||||
| Change in unrealized appreciation (depreciation) on derivatives (e) | ||||||||||||||||||||
Futures contracts | $ | — | $ | — | $ | — | $ | (123,799 | ) | $ | (123,799 | ) | ||||||||
|
|
|
|
|
|
|
|
|
| |||||||||||
Core Fixed Income Fund
Fair Values of Derivative Instruments on the Statements of Assets and Liabilities as of August 31, 2021: | ||||||||||||||||||||
| Location | Interest rate risk | Foreign exchange risk | Credit risk | Equity risk | Total | |||||||||||||||
| Asset derivatives | ||||||||||||||||||||
Purchased options (c) | $ | 182,549 | $ | 31,316 | $ | — | $ | — | $ | 213,865 | ||||||||||
Unrealized appreciation on open futures contracts (b) | 397,444 | — | — | — | 397,444 | |||||||||||||||
Unrealized appreciation on forward foreign currency contracts (c) . | — | 211,170 | — | — | 211,170 | |||||||||||||||
Unrealized appreciation on centrally cleared swaps (f) | 2,366,405 | — | — | — | 2,366,405 | |||||||||||||||
|
|
|
|
|
|
|
|
|
| |||||||||||
| $ | 2,946,398 | $ | 242,486 | $ | — | $ | — | $ | 3,188,884 | |||||||||||
|
|
|
|
|
|
|
|
|
| |||||||||||
| Liability derivatives | ||||||||||||||||||||
Options contracts written outstanding (a) | $ | 148,156 | $ | — | $ | — | $ | — | $ | 148,156 | ||||||||||
Unrealized depreciation on open futures contracts (b) | 627,791 | — | — | — | 627,791 | |||||||||||||||
Unrealized depreciation on forward foreign currency contracts (a) | — | 193,507 | — | — | 193,507 | |||||||||||||||
Unrealized depreciation on centrally cleared swaps (f) | 704,503 | — | — | — | 704,503 | |||||||||||||||
Unrealized depreciation on OTC swaps (a) | 150,045 | — | — | — | 150,045 | |||||||||||||||
|
|
|
|
|
|
|
|
|
| |||||||||||
| $ | 1,630,495 | $ | 193,507 | $ | — | $ | — | $ | 1,824,002 | |||||||||||
|
|
|
|
|
|
|
|
|
| |||||||||||
334
| Notes to Financial Statements |
| (continued) |
Effect of Derivative Instruments on the Statements of Operations for the Year Ended August 31, 2021: | ||||||||||||||||||||
| Location | Interest rate risk | Foreign exchange risk | Credit risk | Equity risk | Total | |||||||||||||||
| Realized gain/(loss) on derivatives (d) | ||||||||||||||||||||
Purchased options | $ | (1,143,648 | ) | $ | (63,924 | ) | $ | — | $ | — | $ | (1,207,572 | ) | |||||||
Futures contracts | 2,019,649 | — | — | — | 2,019,649 | |||||||||||||||
Options contracts written | 1,458,601 | — | — | — | 1,458,601 | |||||||||||||||
Swap contracts | (1,985,972 | ) | — | — | — | (1,985,972 | ) | |||||||||||||
Forward foreign currency contracts | — | 1,294,394 | — | — | 1,294,394 | |||||||||||||||
|
|
|
|
|
|
|
|
|
| |||||||||||
| $ | 348,630 | $ | 1,230,470 | $ | — | $ | — | $ | 1,579,100 | |||||||||||
|
|
|
|
|
|
|
|
|
| |||||||||||
| Change in unrealized appreciation (depreciation) on derivatives (e) | ||||||||||||||||||||
Purchased options | $ | (3,181 | ) | $ | 12,938 | $ | — | $ | — | $ | 9,757 | |||||||||
Futures contracts | (988,051 | ) | — | — | — | (988,051 | ) | |||||||||||||
Options contracts written | 72,906 | — | — | — | 72,906 | |||||||||||||||
Swap contracts | 2,889,913 | — | — | — | 2,889,913 | |||||||||||||||
Forward foreign currency contracts | — | (83,561 | ) | — | — | (83,561 | ) | |||||||||||||
|
|
|
|
|
|
|
|
|
| |||||||||||
| $ | 1,971,587 | $ | (70,623 | ) | $ | — | $ | — | $ | 1,900,964 | ||||||||||
|
|
|
|
|
|
|
|
|
| |||||||||||
High Yield Fund
Effect of Derivative Instruments on the Statements of Operations for the Year Ended August 31, 2021: | ||||||||||||||||||||
| Location | Interest rate risk | Foreign exchange risk | Credit risk | Equity risk | Total | |||||||||||||||
| Realized gain/(loss) on derivatives (d) | ||||||||||||||||||||
Futures contracts | $ | 36,834 | $ | — | $ | — | $ | — | $ | 36,834 | ||||||||||
|
|
|
|
|
|
|
|
|
| |||||||||||
| Change in unrealized appreciation (depreciation) on derivatives (e) | ||||||||||||||||||||
Futures contracts | $ | (580 | ) | $ | — | $ | — | $ | — | $ | (580 | ) | ||||||||
|
|
|
|
|
|
|
|
|
| |||||||||||
International Fixed Income Fund
Fair Values of Derivative Instruments on the Statements of Assets and Liabilities as of August 31, 2021: | ||||||||||||||||||||
| Location | Interest rate risk | Foreign exchange risk | Credit risk | Equity risk | Total | |||||||||||||||
| Asset derivatives | ||||||||||||||||||||
Purchased options (c) | $ | 29,498 | $ | — | $ | — | $ | — | $ | 29,498 | ||||||||||
Unrealized appreciation on open futures contracts (b) | 45,843 | — | — | — | 45,843 | |||||||||||||||
Unrealized appreciation on forward foreign currency contracts (c) . | — | 765,558 | — | — | 765,558 | |||||||||||||||
Unrealized appreciation on centrally cleared swaps (f) | 309,147 | — | 13,583 | — | 322,730 | |||||||||||||||
Unrealized appreciation on OTC swaps (c) | — | 98,594 | 79,194 | — | 177,788 | |||||||||||||||
|
|
|
|
|
|
|
|
|
| |||||||||||
| $ | 384,488 | $ | 864,152 | $ | 92,777 | $ | — | $ | 1,341,417 | |||||||||||
|
|
|
|
|
|
|
|
|
| |||||||||||
| Liability derivatives | ||||||||||||||||||||
Options contracts written outstanding (a) | $ | 72,428 | $ | 13,174 | $ | 9,268 | $ | — | $ | 94,870 | ||||||||||
Unrealized depreciation on open futures contracts (b) | 29,204 | — | — | — | 29,204 | |||||||||||||||
Unrealized depreciation on forward foreign currency contracts (a) | — | 284,059 | — | — | 284,059 | |||||||||||||||
Unrealized depreciation on centrally cleared swaps (f) | 393,157 | — | 40,469 | — | 433,626 | |||||||||||||||
Unrealized depreciation on OTC swaps (a) | 442,865 | — | — | — | 442,865 | |||||||||||||||
|
|
|
|
|
|
|
|
|
| |||||||||||
| $ | 937,654 | $ | 297,233 | $ | 49,737 | $ | — | $ | 1,284,624 | |||||||||||
|
|
|
|
|
|
|
|
|
| |||||||||||
335
| Notes to Financial Statements |
| (continued) |
Effect of Derivative Instruments on the Statements of Operations for the Year Ended August 31, 2021: | ||||||||||||||||||||
| Location | Interest rate risk | Foreign exchange risk | Credit risk | Equity risk | Total | |||||||||||||||
| Realized gain/(loss) on derivatives (d) | ||||||||||||||||||||
Purchased options | $ | 48,220 | $ | 3,922 | $ | — | $ | — | $ | 52,142 | ||||||||||
Futures contracts | 1,433,956 | — | — | — | 1,433,956 | |||||||||||||||
Options contracts written | 223,743 | 59,040 | 88,573 | — | 371,356 | |||||||||||||||
Swap contracts | 15,279 | — | (329,232 | ) | | — | | (313,953 | ) | |||||||||||
Forward foreign currency contracts | — | (564,199 | ) | — | — | (564,199 | ) | |||||||||||||
|
|
|
|
|
|
|
|
|
| |||||||||||
| $ | 1,721,198 | $ | (501,237 | ) | $ | (240,659 | ) | $ | — | $ | 979,302 | |||||||||
|
|
|
|
|
|
|
|
|
| |||||||||||
| Change in unrealized appreciation (depreciation) on derivatives (e) | ||||||||||||||||||||
Purchased options | $ | 41,880 | $ | 2,959 | $ | — | $ | — | $ | 44,839 | ||||||||||
Futures contracts | (47,140 | ) | — | — | — | (47,140 | ) | |||||||||||||
Options contracts written | (19,271 | ) | (9,133 | ) | 1,479 | — | (26,925 | ) | ||||||||||||
Swap contracts | (38,341 | ) | (17,886 | ) | 57,072 | — | 845 | |||||||||||||
Forward foreign currency contracts | — | 1,368,443 | — | — | 1,368,443 | |||||||||||||||
|
|
|
|
|
|
|
|
|
| |||||||||||
| $ | (62,872 | ) | $ | 1,344,383 | $ | 58,551 | $ | — | $ | 1,340,062 | ||||||||||
|
|
|
|
|
|
|
|
|
| |||||||||||
Municipal Bond Fund
Fair Values of Derivative Instruments on the Statements of Assets and Liabilities as of August 31, 2021: | ||||||||||||||||||||
| Location | Interest rate risk | Foreign exchange risk | Credit risk | Equity risk | Total | |||||||||||||||
| Liability derivatives | ||||||||||||||||||||
Unrealized depreciation on open futures contracts (b) | $ | 148 | $ | — | $ | — | $ | — | $ | 148 | ||||||||||
|
|
|
|
|
|
|
|
|
| |||||||||||
Effect of Derivative Instruments on the Statements of Operations for the Year Ended August 31, 2021: | ||||||||||||||||||||
| Location | Interest rate risk | Foreign exchange risk | Credit risk | Equity risk | Total | |||||||||||||||
| Realized gain/(loss) on derivatives (d) | �� | |||||||||||||||||||
Futures contracts | $ | 86,760 | $ | — | $ | — | $ | — | $ | 86,760 | ||||||||||
|
|
|
|
|
|
|
|
|
| |||||||||||
| Change in unrealized appreciation (depreciation) on derivatives (e) | ||||||||||||||||||||
Futures contracts | $ | (148 | ) | $ | — | $ | — | $ | — | $ | (148 | ) | ||||||||
|
|
|
|
|
|
|
|
|
| |||||||||||
336
| Notes to Financial Statements |
| (continued) |
Inflation-Linked Fixed Income Fund
Fair Values of Derivative Instruments on the Statements of Assets and Liabilities as of August 31, 2021: | ||||||||||||||||||||
| Location | Interest rate risk | Foreign exchange risk | Credit risk | Equity risk | Total | |||||||||||||||
| Asset derivatives | ||||||||||||||||||||
Purchased options (c) | $ | 191,401 | $ | — | $ | — | $ | — | $ | 191,401 | ||||||||||
Unrealized appreciation on open futures contracts (b) | 231,276 | — | — | — | 231,276 | |||||||||||||||
Unrealized appreciation on forward foreign currency contracts (c) | — | 176,757 | — | — | 176,757 | |||||||||||||||
Unrealized appreciation on centrally cleared swaps (f) | 898,818 | — | 1,795 | — | 900,613 | |||||||||||||||
|
|
|
|
|
|
|
|
|
| |||||||||||
| $ | 1,321,495 | $ | 176,757 | $ | 1,795 | $ | — | $ | 1,500,047 | |||||||||||
|
|
|
|
|
|
|
|
|
| |||||||||||
| Liability derivatives | ||||||||||||||||||||
Options contracts written outstanding (a) | $ | 161,123 | $ | — | $ | 4,524 | $ | — | $ | 165,647 | ||||||||||
Unrealized depreciation on open futures contracts (b) | 355,723 | — | — | — | 355,723 | |||||||||||||||
Unrealized depreciation on forward foreign currency contracts (a) | — | 7,462 | — | — | 7,462 | |||||||||||||||
Unrealized depreciation on centrally cleared swaps (f) | 1,176,150 | — | — | — | 1,176,150 | |||||||||||||||
|
|
|
|
|
|
|
|
|
| |||||||||||
| $ | 1,692,996 | $ | 7,462 | $ | 4,524 | $ | — | $ | 1,704,982 | |||||||||||
|
|
|
|
|
|
|
|
|
| |||||||||||
Effect of Derivative Instruments on the Statements of Operations for the Year Ended August 31, 2021: | ||||||||||||||||||||
| Location | Interest rate risk | Foreign exchange risk | Credit risk | Equity risk | Total | |||||||||||||||
| Realized gain/(loss) on derivatives (d) | ||||||||||||||||||||
Purchased options | $ | (23,402 | ) | $ | (29,226 | ) | $ | — | $ | — | $ | (52,628 | ) | |||||||
Futures contracts | 695,344 | — | — | — | 695,344 | |||||||||||||||
Options contracts written | 71,175 | — | 39,721 | — | 110,896 | |||||||||||||||
Swap contracts | (308,313 | ) | — | (261,927 | ) | — | (570,240 | ) | ||||||||||||
Forward foreign currency contracts | — | (394,408 | ) | — | — | (394,408 | ) | |||||||||||||
|
|
|
|
|
|
|
|
|
| |||||||||||
| $ | 434,804 | $ | (423,634 | ) | $ | (222,206 | ) | $ | — | $ | (211,036 | ) | ||||||||
|
|
|
|
|
|
|
|
|
| |||||||||||
| Change in unrealized appreciation (depreciation) on derivatives (e) | ||||||||||||||||||||
Purchased options | $ | 54,290 | $ | — | $ | — | $ | — | $ | 54,290 | ||||||||||
Futures contracts | (151,188 | ) | — | — | — | (151,188 | ) | |||||||||||||
Options contracts written | (22,115 | ) | — | (727 | ) | — | (22,842 | ) | ||||||||||||
Swap contracts | (55,207 | ) | — | 153,632 | — | 98,425 | ||||||||||||||
Forward foreign currency contracts | — | 613,794 | — | — | 613,794 | |||||||||||||||
|
|
|
|
|
|
|
|
|
| |||||||||||
| $ | (174,220 | ) | $ | 613,794 | $ | 152,905 | $ | — | $ | 592,479 | ||||||||||
|
|
|
|
|
|
|
|
|
| |||||||||||
Ultra-Short Fixed Income Fund
Fair Values of Derivative Instruments on the Statements of Assets and Liabilities as of August 31, 2021: | ||||||||||||||||||||
| Location | Interest rate risk | Foreign exchange risk | Credit risk | Equity risk | Total | |||||||||||||||
| Asset derivatives | ||||||||||||||||||||
Unrealized appreciation on open futures contracts (b) | $ | 114,221 | $ | — | $ | — | $ | — | $ | 114,221 | ||||||||||
Unrealized appreciation on forward foreign currency contracts (c) | — | 1,169,623 | — | — | 1,169,623 | |||||||||||||||
|
|
|
|
|
|
|
|
|
| |||||||||||
| $ | 114,221 | $ | 1,169,623 | $ | — | $ | — | $ | 1,283,844 | |||||||||||
|
|
|
|
|
|
|
|
|
| |||||||||||
| Liability derivatives | ||||||||||||||||||||
Unrealized depreciation on open futures contracts (b) | $ | 319,599 | $ | — | $ | — | $ | — | $ | 319,599 | ||||||||||
Unrealized depreciation on forward foreign currency contracts (a) | — | 204,061 | — | — | 204,061 | |||||||||||||||
Unrealized depreciation on centrally cleared swaps (f) | — | — | 28,539 | — | 28,539 | |||||||||||||||
|
|
|
|
|
|
|
|
|
| |||||||||||
| $ | 319,599 | $ | 204,061 | $ | 28,539 | $ | — | $ | 552,199 | |||||||||||
|
|
|
|
|
|
|
|
|
| |||||||||||
337
| Notes to Financial Statements |
| (continued) |
Effect of Derivative Instruments on the Statements of Operations for the Year Ended August 31, 2021: | ||||||||||||||||||||
| Location | Interest rate risk | Foreign exchange risk | Credit risk | Equity risk | Total | |||||||||||||||
| Realized gain/(loss) on derivatives (d) | ||||||||||||||||||||
Futures contracts | $ | (549,859 | ) | $ | — | $ | — | $ | — | $ | (549,859 | ) | ||||||||
Swap contracts | 748,823 | — | (2,064,724 | ) | — | (1,315,901 | ) | |||||||||||||
Forward foreign currency contracts | — | (1,975,680 | ) | — | — | (1,975,680 | ) | |||||||||||||
|
|
|
|
|
|
|
|
|
| |||||||||||
| $ | 198,964 | $ | (1,975,680 | ) | $ | (2,064,724 | ) | $ | — | $ | (3,841,440 | ) | ||||||||
|
|
|
|
|
|
|
|
|
| |||||||||||
| Change in unrealized appreciation (depreciation) on derivatives (e) |
| |||||||||||||||||||
Futures contracts | $ | (393,033 | ) | $ | — | $ | — | $ | — | $ | (393,033 | ) | ||||||||
Swap contracts | (104,542 | ) | — | 1,177,123 | — | 1,072,581 | ||||||||||||||
Forward foreign currency contracts | — | 1,855,605 | — | — | 1,855,605 | |||||||||||||||
|
|
|
|
|
|
|
|
|
| |||||||||||
| $ | (497,575 | ) | $ | 1,855,605 | $ | 1,177,123 | $ | — | $ | 2,535,153 | ||||||||||
|
|
|
|
|
|
|
|
|
| |||||||||||
| (a) | Statements of Assets and Liabilities location: Unrealized depreciation on open forward foreign currency contracts, unrealized depreciation on OTC swap contracts or options contracts written, at value. |
| (b) | Only variation margin, if any, is reported within the Statements of Assets and Liabilities. Cumulative appreciation (depreciation) on futures contracts is reported in the open exchanged-traded futures contracts table in the Fund’s Schedule of Investments. |
| (c) | Statements of Assets and Liabilities location: Investments, at value or unrealized appreciation on open forward foreign currency contracts or unrealized appreciation on OTC swap contracts. |
| (d) | Statements of Operations location: Net realized gain (loss) from investments, forward foreign currency contracts, futures contracts, options contracts written or swap contracts. |
| (e) | Statements of Operations location: Change in net unrealized appreciation (depreciation) from investments, forward foreign currency contracts, futures contracts, options contracts written or swap contracts. |
| (f) | Only variation margin, if any, is reported within the Statements of Assets and Liabilities. Cumulative appreciation (depreciation) on centrally cleared swaps is reported in the open swap contracts table in the Fund’s Schedule of Investments. |
The average monthly notional amounts of futures contracts, swaps contracts and forward foreign currency contracts, and the monthly average market value of options contracts written and purchased options outstanding during the year ended August 31, 2021 were as follows:
Large Cap Equity Fund
| Interest rate risk | Foreign exchange risk | Credit risk | Equity risk | |||||||||||||
Futures contracts | $ | — | $ | — | $ | — | $ | 12,955,042 | ||||||||
Small-Mid Cap Equity Fund
| Interest rate risk | Foreign exchange risk | Credit risk | Equity risk | |||||||||||||
Futures contracts | $ | — | $ | — | $ | — | $ | 4,318,224 | ||||||||
International Equity Fund
| Interest rate risk | Foreign exchange risk | Credit risk | Equity risk | |||||||||||||
Futures contracts | $ | — | $ | — | $ | — | $ | 1,853,973 | ||||||||
338
| Notes to Financial Statements |
| (continued) |
Emerging Markets Equity Fund
| Interest rate risk | Foreign exchange risk | Credit risk | Equity risk | |||||||||||||
Futures contracts | $ | — | $ | — | $ | — | $ | 1,657,028 | ||||||||
Forward foreign currency contracts | — | 529 | — | — | ||||||||||||
Core Fixed Income Fund
| Interest rate risk | Foreign exchange risk | Credit risk | Equity risk | |||||||||||||
Purchased options | $ | 101,782 | $ | 3,221 | $ | — | $ | — | ||||||||
Futures contracts | 389,695,693 | — | — | — | ||||||||||||
Option contracts written | 114,223 | — | — | — | ||||||||||||
Swap contracts | 57,802,254 | — | — | — | ||||||||||||
Forward foreign currency contracts | — | 46,623,419 | — | — | ||||||||||||
High Yield Fund
| Interest rate risk | Foreign exchange risk | Credit risk | Equity risk | |||||||||||||
Futures contracts | $ | 534,672 | $ | — | $ | — | $ | — | ||||||||
International Fixed Income Fund
| Interest rate risk | Foreign exchange risk | Credit risk | Equity risk | |||||||||||||
Purchased options | $ | 73,149 | $ | 2,231 | $ | — | $ | — | ||||||||
Futures contracts | 62,024,845 | — | — | — | ||||||||||||
Option contracts written | 81,711 | 9,759 | 12,738 | — | ||||||||||||
Swap contracts | 193,383,944 | 1,568,837 | �� | 19,564,008 | — | |||||||||||
Forward foreign currency contracts | — | 169,114,618 | — | — | ||||||||||||
Municipal Bond Fund
| Interest rate risk | Foreign exchange risk | Credit risk | Equity risk | |||||||||||||
Futures contracts | $ | 460,043 | $ | — | $ | — | $ | — | ||||||||
Inflation-Linked Fixed Income Fund
| Interest rate risk | Foreign exchange risk | Credit risk | Equity risk | |||||||||||||
Purchased options | $ | 179,890 | $ | 783 | $ | — | $ | — | ||||||||
Futures contracts | 86,009,971 | — | — | — | ||||||||||||
Option contracts written | 170,534 | 514 | 9,765 | — | ||||||||||||
Swap contracts | 54,336,892 | 115,670 | 2,423,132 | — | ||||||||||||
Forward foreign currency contracts | — | 48,443,900 | — | — | ||||||||||||
339
| Notes to Financial Statements |
| (continued) |
Ultra-Short Term Fixed Income Fund
| Interest rate risk | Foreign exchange risk | Credit risk | Equity risk | |||||||||||||
Futures contracts | $ | 206,663,320 | $ | — | $ | — | $ | — | ||||||||
Swap contracts | 7,517,376 | — | 11,108,000 | — | ||||||||||||
Forward foreign currency contracts | — | 153,137,738 | — | — | ||||||||||||
(c) Repurchase Agreements. When entering into repurchase agreements, it is the Funds’ policy that their custodian or a third party custodian takes possession of the underlying collateral securities, the market value of which at least equals the principal amount of the repurchase transaction, including accrued interest. To the extent that any repurchase transaction exceeds one business day, the value of the collateral is marked-to-market daily to ensure the adequacy of the collateral. If the seller defaults and the market value of the collateral declines or if bankruptcy proceedings are commenced with respect to the seller of the security, realization of the collateral by the Funds may be delayed or limited.
(d) Stripped Securities. Certain Funds may invest in “Stripped Securities”, a term used collectively for stripped fixed income securities. Stripped Securities can be principal-only securities (“PO”), which are debt obligations that have been stripped of interest coupons, or interest-only securities (“IO”), which are interest coupons that have been stripped from debt obligations. As is the case with all securities, the market value of Stripped Securities will fluctuate in response to changes in economic conditions, interest rates and the market’s perception of the securities. However, fluctuations in response to interest rates may be greater in Stripped Securities than for debt obligations of comparable maturities that pay interest currently. The amount of fluctuation increases with a longer period of maturity. The yield-to-maturity on an IO is sensitive to the rate of principal repayments (including prepayments) on the related underlying debt obligation and principal payments may have a material effect on yield to maturity. If the underlying debt obligation experiences greater than anticipated prepayments of principal, the Fund may not fully recoup its initial investment in the IO.
(e) Time Deposits. Certain Funds may purchase overnight time deposits issued by offshore branches of U.S. banks that meet credit and risk standards established by the custodian and approved by the Board.
(f) Lending of Portfolio Securities. The Trust has an agreement with its custodian, whereby the custodian, as agent, may lend securities owned by the Funds to brokers, dealers and other financial organizations that have been approved as borrowers by the Funds. The custodian enters into agreements with the borrowers. Loans of securities by a Fund are collateralized by cash, U.S. government securities or irrevocable performance letters of credit issued by banks approved by the Funds. All non-cash collateral is received, held and administered by the custodian in an applicable custody account or other account established for the purpose of holding collateral for each Fund. Cash collateral received by the Funds as a result of securities lending activities is invested in an unaffiliated registered money market fund, and is recorded as Payable for collateral received from securities on loan within the Statements of Assets and Liabilities. Securities lending income represents the income earned on investing cash collateral plus any premium payments that may be received on the loan of certain types of securities, less fees and expenses associated with the loan. Each Fund maintains the risk of any market loss on its securities on loan as well as the potential loss on investments purchased with cash collateral received from its securities lending. The custodian has the right under its agreement with the borrowers to recover any loaned securities from the borrower on demand. Additionally, the Funds are exposed to risks that a borrower may not provide additional collateral when required or return loaned securities when due. If the borrower fails to return the securities, the custodian will use the collateral to purchase replacement securities. The custodian is responsible for any shortfall in collateral value under certain circumstances.
340
| Notes to Financial Statements |
| (continued) |
The following table presents securities on loan that are subject to enforceable netting arrangements as of August 31, 2021:
Gross Amounts Not Offset in the Statements of Assets and Liabilities
| Fund | Gross Asset Amount Presented in the Statements of Assets and Liabilities (a) | Financial Instrument | Collateral Received (b)(c) | Net Amount (Not Less than $0) | ||||||||||||
Large Cap Equity Fund | $ | 23,855,008 | $ | — | $ | (23,855,008 | ) | $ | 0 | |||||||
Small-Mid Cap Equity Fund | 57,666,535 | — | (57,666,535 | ) | 0 | |||||||||||
International Equity Fund | 5,868,796 | — | (5,868,796 | ) | 0 | |||||||||||
Emerging Markets Equity Fund | 7,664,872 | — | (7,664,872 | ) | 0 | |||||||||||
High Yield Fund | 129,000 | — | (129,000 | ) | 0 | |||||||||||
| (a) | Represents market value of securities on loan at period end. |
| (b) | The Funds received cash collateral of $24,409,909, $58,746,706, $6,097,629, $7,559,575 and $129,000, respectively, which was subsequently invested in Invesco STIT — Government & Agency Portfolio as reported in the Schedules of Investments. In addition, the Funds received non-cash collateral of $0, $0, $239,209, $139,298 and $0, respectively, in the form of U.S. Government Obligations, which the Funds cannot sell or repledge, and accordingly are not reflected in the Portfolio of Investments. |
| (c) | The actual collateral received could be greater than the amount shown here due to overcollateralization. |
The Funds have adopted the disclosure provisions of FASB Accounting Standards Update No. 2014-11 (“ASU No. 2014-11”), “Transfers & Servicing (Topic 860): Repurchase-to-Maturity Transactions, Repurchase Financings, and Disclosures.” ASU No. 2014-11 is intended to provide increased transparency about the types of collateral pledged in securities lending transactions and other similar transactions that are accounted for as secured borrowing.
The following table displays a breakdown of transactions accounted for as secured borrowings, the gross obligations by class of collateral pledged, and the remaining contractual maturity of those transactions as of August 31, 2021:
| Remaining Contractual Maturity of the Agreements As of August 31, 2021 | ||||||||||||||||||||
| Overnight and Continuous | < 30 days | Between 30 & 90 days | > 90 days | Total | ||||||||||||||||
| Large Cap Equity Fund | ||||||||||||||||||||
| Securities Lending Transactions | ||||||||||||||||||||
Common Stocks | $ | 24,409,909 | $ | — | $ | — | $ | — | $ | 24,409,909 | ||||||||||
|
|
|
|
|
|
|
|
|
| |||||||||||
Total Borrowings | $ | 24,409,909 | $ | — | $ | — | $ | — | $ | 24,409,909 | ||||||||||
|
|
|
|
|
|
|
|
|
| |||||||||||
Gross amount of recognized liabilities for securities lending transactions |
| $ | 24,409,909 | |||||||||||||||||
|
| |||||||||||||||||||
| Small-Mid Cap Equity Fund | ||||||||||||||||||||
| Securities Lending Transactions | ||||||||||||||||||||
Common Stocks | $ | 58,746,706 | $ | — | $ | — | $ | — | $ | 58,746,706 | ||||||||||
|
|
|
|
|
|
|
|
|
| |||||||||||
Total Borrowings | $ | 58,746,706 | $ | — | $ | — | $ | — | $ | 58,746,706 | ||||||||||
|
|
|
|
|
|
|
|
|
| |||||||||||
Gross amount of recognized liabilities for securities lending transactions |
| $ | 58,746,706 | |||||||||||||||||
|
| |||||||||||||||||||
| International Equity Fund | ||||||||||||||||||||
| Securities Lending Transactions | ||||||||||||||||||||
Common Stocks | $ | 6,097,629 | $ | — | $ | — | $ | — | $ | 6,097,629 | ||||||||||
|
|
|
|
|
|
|
|
|
| |||||||||||
Total Borrowings | $ | 6,097,629 | $ | — | $ | — | $ | — | $ | 6,097,629 | ||||||||||
|
|
|
|
|
|
|
|
|
| |||||||||||
Gross amount of recognized liabilities for securities lending transactions |
| $ | 6,097,629 | |||||||||||||||||
|
| |||||||||||||||||||
| Emerging Markets Equity Fund | ||||||||||||||||||||
| Securities Lending Transactions | ||||||||||||||||||||
Common Stocks | $ | 7,559,575 | $ | — | $ | — | $ | — | $ | 7,559,575 | ||||||||||
|
|
|
|
|
|
|
|
|
| |||||||||||
Total Borrowings | $ | 7,559,575 | $ | — | $ | — | $ | — | $ | 7,559,575 | ||||||||||
|
|
|
|
|
|
|
|
|
| |||||||||||
Gross amount of recognized liabilities for securities lending transactions |
| $ | 7,559,575 | |||||||||||||||||
|
| |||||||||||||||||||
341
| Notes to Financial Statements |
| (continued) |
| Remaining Contractual Maturity of the Agreements As of August 31, 2021 | ||||||||||||||||||||
| Overnight and Continuous | < 30 days | Between 30 & 90 days | > 90 days | Total | ||||||||||||||||
| High Yield Fund | ||||||||||||||||||||
| Securities Lending Transactions | ||||||||||||||||||||
Common Stocks | $ | 129,000 | $ | — | $ | — | $ | — | $ | 129,000 | ||||||||||
|
|
|
|
|
|
|
|
|
| |||||||||||
Total Borrowings | $ | 129,000 | $ | — | $ | — | $ | — | $ | 129,000 | ||||||||||
|
|
|
|
|
|
|
|
|
| |||||||||||
Gross amount of recognized liabilities for securities lending transactions |
| $ | 129,000 | |||||||||||||||||
|
| |||||||||||||||||||
| Inflation-Linked Fixed Income Fund | ||||||||||||||||||||
| Reverse Repurchase Agreements Transactions | ||||||||||||||||||||
U.S. Government Obligations | $ | — | $ | 37,952,296 | $ | — | $ | — | $ | 37,952,296 | ||||||||||
| Sale-Buyback Transactions | ||||||||||||||||||||
U.S. Government Obligations | $ | — | $ | 6,310,170 | $ | — | $ | — | $ | 6,310,170 | ||||||||||
|
|
|
|
|
|
|
|
|
| |||||||||||
Total Borrowings | $ | — | $ | 44,262,466 | $ | — | $ | — | $ | 44,262,466 | ||||||||||
|
|
|
|
|
|
|
|
|
| |||||||||||
Gross amount of recognized liabilities for reverse repurchase agreements transactions |
| $ | 37,952,296 | |||||||||||||||||
|
| |||||||||||||||||||
Gross amount of recognized liabilities for Sale-Buyback Transactions |
| $ | 6,310,170 | |||||||||||||||||
|
| |||||||||||||||||||
(g) To-Be-Announced Purchase and Sale Commitments. Certain Funds may trade securities on a to-be-announced (“TBA”) basis. In a TBA transaction, a Fund commits to purchasing or selling securities which have not yet been issued by the issuer and for which specific information is not known, such as the face amount and maturity date and the underlying pool of investments in U.S. government agency mortgage pass-through transactions. Securities purchased on a TBA basis are not settled until they are delivered to the Fund, normally 15 to 45 days later. Beginning on the date the Fund enters into a TBA transaction, cash, U.S. government securities or other liquid high-grade debt obligations are segregated in an amount equal in value to the purchase price of the TBA security. These transactions are marked-to-market on a daily basis and are subject to market fluctuations. Realized gains or losses on TBA purchase commitments are included in Net realized gain (loss) on investments on the Statements of Operations. Any fluctuation in the value of the purchased TBA commitments is included in Net change in unrealized appreciation (depreciation) on investments on the Statements of Operations.
Additionally, when a Fund sells TBA securities without already owning or having the right to obtain the deliverable securities (an uncovered forward commitment to sell), it incurs a risk of loss because it could have to purchase the securities at a price that is higher than the price at which it sold them. A Fund may be unable to purchase the deliverable securities if the corresponding market is illiquid.
TBA securities subject to a forward commitment to sell at period end are included at the end of the Fund’s Schedule of Investments under the caption “Schedule of Forward Sale Commitments.” The proceeds and value of these commitments are recorded as Forward Sale Commitments at value in the Statements of Assets and Liabilities.
(h) Short Sales of Securities. A short sale is a transaction in which a Fund sells securities it does not own in anticipation of a decline in the market price of the securities. To complete a short sale, the Fund may arrange through a broker to borrow the securities to be delivered to the buyer. The proceeds received by the Fund for the short sale are retained by the broker until the Fund replaces the borrowed securities. In borrowing the securities to be delivered to the buyer, the Fund becomes obligated to replace the securities borrowed at their market price at the time of replacement, whatever that price may be.
The risk of engaging in short sale transactions is that selling short magnifies the potential for loss to a Fund. The larger the Fund’s short position, the greater the potential loss. If a security sold short increases in price, the Fund may have to cover its short position at a higher price than the short sale price, resulting in a loss. To borrow the security, the Fund also may be required to pay a premium, which could decrease the proceeds of the security sold short. The amount of any gain will be decreased, and the amount of any loss increased, by the amount of the premium, dividends, interest or expenses the Fund may be required to pay in connection with the short sale. In addition, because the Fund’s loss on a short sale arises from increases in the value of the security sold short, such loss is unlimited.
342
| Notes to Financial Statements |
| (continued) |
(i) Mortgage Dollar Rolls. Certain Funds may sell mortgage-backed securities for delivery in the current month and simultaneously contract to repurchase substantially similar (same type, coupon and maturity) securities to settle on a specific future date at an agreed upon price. Pools of mortgage securities are used to collateralize mortgage dollar roll transactions and may have different prepayment histories than those sold. During the period between the sale and the repurchase, a Fund forgoes principal and interest paid on the securities sold. Proceeds of the sale will be invested in short-term instruments and the income from these investments, together with any additional fee income received on a sale, is intended to generate income for a Fund. A Fund accounts for mortgage dollar roll transactions as purchases and sales and realizes the gain or loss at the time the transaction is entered into on these transactions. If certain criteria are met, these dollar roll transactions may be considered financing transactions, whereby the difference in the sale price and the future purchase price is recorded as an adjustment to interest income.
Mortgage dollar roll transactions involve the risk that the market value of the securities a Fund is obligated to repurchase under the agreement may decline below the repurchase price of those securities. If investment performance of securities purchased with proceeds from these transactions does not exceed the income, capital appreciation and gain or loss that would have been realized on the securities sold as part of the dollar roll, the use of this technique will adversely impact the investment performance of a Fund. In the event the buyer of securities under a mortgage dollar roll files for bankruptcy or becomes insolvent, the Fund’s use of proceeds of the dollar roll may be restricted pending a determination by the other party, or its trustee or receiver, whether to enforce the Fund’s obligation to repurchase the securities.
(j) Credit and Market Risk. Certain Funds invest in high yield instruments that are subject to certain credit and market risks. The yields of high yield obligations reflect, among other things, perceived credit and market risks. Each Fund’s investment in securities rated below investment grade typically involve risks not associated with higher rated securities, including, among others, greater risk related to timely and ultimate payment of interest and principal, greater market price volatility and less liquid secondary market trading.
(k) Foreign Investment and Currency Risks. Certain Funds’ investments in foreign securities may involve risks not present in domestic investments. Because securities may be denominated in foreign currencies and may require settlement in foreign currencies and pay interest or dividends in foreign currencies, changes in the relationship of these foreign currencies to the U.S. dollar can significantly affect the value of the investments and earnings of a Fund. Foreign investments may also subject the Fund to foreign government exchange restrictions, expropriation, taxation or other political, social or economic developments, all of which affect the market and/or credit risk of the investments.
(l) Emerging Markets Risk. In addition to foreign investment and currency risks, which tend to be amplified in emerging markets, emerging markets may experience rising interest rates, or, more significantly, rapid inflation or hyperinflation. The economies of emerging market countries may grow at slower rates than expected or suffer a downturn or recession. Emerging market securities may present market, credit, liquidity, legal, political and other risks different from, or greater than, the risks of investing in developed foreign countries.
(m) LIBOR Replacement Risk. Many financial instruments use or may use a floating rate based on LIBOR, the offered rate at which major international banks can obtain wholesale, unsecured funding. LIBOR may be a significant factor in determining the Fund’s payment obligations under a derivative investment, the cost of financing to the Fund or an investment’s value or return to the Fund, and may be used in other ways that affect the Fund’s investment performance. In July 2017, the United Kingdom’s Financial Conduct Authority announced a desire to phase out the use of LIBOR by the end of 2022. The unavailability and/or discontinuation of LIBOR may affect the value, liquidity or return on certain Fund investments that mature later than 2022 and may result in costs incurred in connection with closing out positions and entering into new positions. Any pricing adjustments to the Fund’s investments resulting from a substitute reference rate may also adversely affect the Fund’s performance and/or net asset value.
(n) Volatility Risk. Volatility risk refers to the magnitude of the movement, but not the direction of the movement, in a financial instrument’s price over a defined time period. Large increases or decreases in a financial instrument’s price over a relative time period typically indicate greater volatility risk, while small increases or decreases in its price typically indicate lower volatility risk.
(o) Market Risk. Certain impacts to public health conditions particular to the coronavirus (COVID-19) outbreak could impact the operations and financial performance of certain of the Fund’s investments. The extent of the impact to the financial performance of Funds’ investments will depend on future developments, including (i) the duration and spread of the outbreak,
343
| Notes to Financial Statements |
| (continued) |
(ii) the restrictions and advisories, (iii) the effects on the financial markets, and (iv) the effects on the economy overall, all of which are highly uncertain and cannot be predicted. If the financial performance of Funds’ investments is impacted because of these factors for an extended period, the Funds’ investment results may be adversely affected.
(p) Security Transactions and Investment Income. Security transactions are accounted for on a trade date basis. Interest income, adjusted for amortization of premium and accretion of discount, is recorded on an accrual basis. Dividend income is recorded on the ex-dividend date. Foreign dividend income is recorded on the ex-dividend date or as soon as practical after a Fund determines the existence of a dividend declaration after exercising reasonable due diligence. Interest and dividend income payable by delivery of additional shares is reclassified as PIK (payment-in-kind) income upon receipt, if any, and is included in interest and dividend income, respectively. The cost of investments sold is determined by use of the specific identification method. To the extent any issuer defaults on an expected interest payment, the Trust’s policy is to generally halt any additional “interest income accruals and accretion” and consider the Fund’s ability to realize interest accrued up to the date of default.
(q) Foreign Currency Translation. Investment securities and other assets and liabilities denominated in foreign currencies are translated into U.S. dollar amounts based upon prevailing exchange rates on the date of valuation. Purchases and sales of investment securities and income and expense items denominated in foreign currencies are translated into U.S. dollar amounts based upon prevailing exchange rates on the respective dates of such transactions.
The Funds do not isolate that portion of the results of operations resulting from changes in foreign exchange rates on investments from the fluctuations arising from changes in market prices of securities held. Such fluctuations are included with the net realized and unrealized gain or loss on investments in the Statements of Operations.
Net realized foreign exchange gains or losses arise from sales of foreign currencies, including gains and losses on forward foreign currency contracts, currency gains or losses realized between the trade and settlement dates on securities transactions and the difference between the amounts of dividends, interest and foreign withholding taxes recorded on the Funds’ books and the U.S. dollar equivalent of the amounts actually received or paid. Net unrealized foreign exchange gains and losses arise from changes in the fair values of assets and liabilities, other than investments in securities, at the date of valuation, resulting from changes in exchange rates.
Foreign security and currency transactions may involve certain considerations and risks not typically associated with those of U.S. dollar denominated transactions as a result of, among other factors, the possibility of lower levels of governmental supervision and regulation of foreign securities markets and the possibility of political or economic instability.
(r) Distributions to Shareholders. Distributions from net investment income for Large Cap Equity Fund, Small-Mid Cap Equity Fund, International Equity Fund, Emerging Markets Equity Fund, International Fixed Income Fund and Alternative Strategies Fund, if any, are declared and paid on an annual basis. Distributions from net investment income for Core Fixed Income Fund, High Yield Fund, Municipal Bond Fund, Inflation-Linked Fixed Income Fund and Ultra-Short Term Fixed Income Fund, if any, are declared and paid on a monthly basis.
The Funds intend to satisfy conditions that will enable interest from municipal securities, which are exempt from regular federal income tax and from designated state income taxes, to retain such tax-exempt status when distributed to the shareholders of the Funds. Distributions of net realized gains to shareholders of the Funds, if any, are taxable and are declared at least annually. Distributions to shareholders of the Funds are recorded on the ex-dividend date and are determined in accordance with income tax regulations, which may differ from GAAP.
(s) Federal and Other Taxes. It is the Trust’s policy to comply with the federal income and excise tax requirements of the Internal Revenue Code of 1986, as amended, applicable to regulated investment companies. Accordingly, each Fund intends to distribute substantially all of its income and net realized gains on investments, if any, to shareholders each year. Therefore, no federal income tax provision is required in the Funds’ financial statements. Under the applicable foreign tax laws, a withholding tax may be imposed on interest, dividends and capital gains at various rates.
Management has reviewed the tax positions and has concluded that no liability for unrecognized tax benefits should be recorded related to uncertain tax positions taken on returns filed for open tax years or expected to be taken in 2020 tax returns. Each Fund’s federal tax returns for the prior three fiscal years remain subject to examination by the Internal Revenue Service.
344
| Notes to Financial Statements |
| (continued) |
(t) Reclassification. GAAP requires that certain components of net assets be adjusted to reflect permanent differences between financial and tax reporting. These reclassifications have no effect on net assets or net asset values per share. The Funds had no permanent differences causing reclassifications among the components of net assets for the year ended August 31, 2021.
(u) Restricted Securities. All Funds may invest in non-publicly traded securities, commonly called restricted securities. Restricted securities may be less liquid than publicly-traded securities. Although certain restricted securities may be resold in privately negotiated transactions, the values realized from these sales could be less than originally paid by a Fund. Certain restricted securities may be deemed liquid by the Manager and/or Sub-adviser pursuant to the procedures approved by the Board. The value of restricted securities is determined as described in Note 1(a).
(v) Reverse Repurchase Agreements. Certain Funds may each enter into reverse repurchase agreements with the financial institutions with which it may enter into repurchase agreements. Under a reverse repurchase agreement, a Fund sells securities to a financial institution and agrees to repurchase them at a mutually agreed upon date, price and rate of interest. During the period between the sale and repurchase, the Fund would not be entitled to principal and interest paid on the securities sold by the Fund. The Fund, however, would seek to achieve gains derived from the difference between the current sale price and the forward price for the future purchase as well as the interest earned on the proceeds on the initial sale. Reverse repurchase agreements involve the risk that the market value of the securities purchased with the proceeds from the sale of the securities received by the Fund may decline below the price of the securities the Fund is obligated to repurchase. Reverse repurchase agreements also involve credit risk with the counterparty to the extent that the value of securities subject to repurchase exceed the Fund’s liability under the reverse repurchase agreement. Reverse repurchase agreements will be viewed as borrowings by a Fund for the purpose of calculating the Fund’s indebtedness and will have the effect of leveraging the Fund’s assets.
(w) Indemnification. In the normal course of business, the Funds may enter into contracts that provide certain indemnifications. The Funds’ maximum exposure under these arrangements is dependent on future claims that may be made against the Funds and, therefore, cannot be estimated; however, based on experience, risk of loss from such claims is considered remote.
(x) Senior Floating-Rate Loans. Interests in senior floating-rate loans (“Senior Loans”) for which reliable market quotations are readily available are valued generally at the average mean of bid and ask quotations obtained from a third party pricing service. Other Senior Loans are valued at fair value by the investment adviser under procedures approved by the Trustees. In fair valuing a Senior Loan, the investment adviser utilizes one or more of the valuation techniques described in (i) through (iii) below to assess the likelihood that the borrower will make a full repayment of the loan underlying such Senior Loan relative to yields on other Senior Loans issued by companies of comparable credit quality. If the investment adviser believes that there is a reasonable likelihood of full repayment, the investment adviser will determine fair value using a matrix pricing approach that considers the yield on the Senior Loan. If the investment adviser believes there is not a reasonable likelihood of full repayment, the investment adviser will determine fair value using analyses that include, but are not limited to: (i) a comparison of the value of the borrower’s outstanding equity and debt to that of comparable public companies; (ii) a discounted cash flow analysis; or (iii) when the investment adviser believes it is likely that a borrower will be liquidated or sold, an analysis of the terms of such liquidation or sale. In certain cases, the investment adviser will use a combination of analytical methods to determine fair value, such as when only a portion of a borrower’s assets are likely to be sold. In conducting its assessment and analyses for purposes of determining fair value of a Senior Loan, the investment adviser will use its discretion and judgment in considering and appraising relevant factors. Fair value determinations are made by the portfolio managers of the Fund based on information available to such managers. The portfolio managers of other funds managed by the investment adviser that invest in Senior Loans may not possess the same information about a Senior Loan borrower as the portfolio managers of the Fund. At times, the fair value of a Senior Loan determined by the portfolio managers of other funds managed by the investment adviser that invest in Senior Loans may vary from the fair value of the same Senior Loan determined by the portfolio managers of the Fund. The fair value of each Senior Loan is periodically reviewed and approved by the investment adviser’s Valuation Committee and by the Trustees based upon procedures approved by the Trustees. Junior Loans (i.e., subordinated loans and second lien loans) are valued in the same manner as Senior Loans.
In connection with bank loan interests, the Fund may enter into unfunded bank loan interests (“commitments”). Unfunded loan commitments may be partially or wholly unfunded. The Fund is obligated to fund those commitments at borrower’s discretion. In connection with these commitments, the Fund earns a commitment fee, which is included in interest income in the Statements of Operations and recognized respectively over the commitment period.
345
| Notes to Financial Statements |
| (continued) |
(y) Sale-Buyback and Buy-Saleback Transactions. A sale-buyback financing transaction consists of a sale of a security by a Fund to a counterparty, with a simultaneous agreement to repurchase the same or substantially the same security at an agreed-upon price and date. The Fund will segregate assets determined to be liquid by the Sub-adviser or will otherwise cover its obligations under sale-buyback transactions.
During the year ended August 31, 2021, the International Fixed Income Fund, Inflation-Linked Fixed Income Fund and Ultra-Short Term Fixed Income Fund participated in sale-buyback transactions. The payable for investments purchased related to sale-buyback transactions at August 31, 2021, an average amount of borrowings, incurred interest expense and a weighted average interest rate related to sale-buyback transactions outstanding during the year ended August 31, 2021, were as following:
| International Fixed Income Fund | Inflation-Linked Fixed Income Fund | Ultra-Short Term Fixed Income Fund | ||||||||||
Payable for investments purchased | $ | — | $ | 6,310,170 | $ | — | ||||||
Average amount borrowed | 10,814 | 4,573,343 | 559,372 | |||||||||
Interest expense | 10 | 5,841 | 879 | |||||||||
Weighted average interest rate | 0.09 | % | 0.13 | % | 0.16 | % | ||||||
A buy-saleback lending transaction consists of a purchase of a security by a Fund from a counterparty, with a simultaneous agreement to sell the same or substantially the same security at an agreed-upon price and date. The party who sold the security is not entitled to receive principal and interest payments, if any, made on the security during the term of the agreement. The Fund will segregate assets determined to be liquid by the Sub-adviser or will otherwise cover its obligations under buy-saleback transactions.
During the year ended August 31, 2021, the Inflation-Linked Fixed Income Fund participated in buy-saleback transactions. The receivable for investments sold related to buy-saleback transactions at August 31, 2021, an average amount loaned, received interest income and a weighted average interest rate related to buy-saleback transactions outstanding during the year ended August 31, 2021, were as following:
| Inflation-Linked Fixed | ||||
Receivable for investments sold | $ | — | ||
Average amount loaned | 14,012 | |||
Interest income | 57 | |||
Weighted average interest rate | 0.04 | % | ||
Sale-buyback and buy-saleback transactions are governed by Master Securities Forward Transaction Agreements (“Master Forward Agreements”), which are agreements between the Fund and select counterparties. The Master Forward Agreements maintain provisions for, among other things, transaction initiation and confirmation, payment and transfer, events of default, termination and maintenance of collateral. The market value of any pending sale-buyback and buy-saleback transactions as of period end is disclosed in each Fund’s Summary Schedule of Investments.
(z) Disclosure about Offsetting Assets and Liabilities. In order to better define contractual rights under derivative contracts and to secure rights that will help the Funds mitigate their counterparty risk, a Sub-adviser may, on behalf of the Funds, enter into an International Swaps and Derivatives Association, Inc. Master Agreement (“ISDA Master Agreement”) or similar agreement with its derivative contract counterparties. An ISDA Master Agreement is a bilateral agreement between the Funds and a counterparty that governs OTC derivatives and foreign exchange contracts and typically contains, among other things, collateral posting terms and netting provisions in the event of a default and/or termination event. The ISDA Master Agreement gives a Fund the right, upon an event of default by the applicable counterparty or a termination of the agreement, to close out all transactions traded under such agreement and to net amounts owed under each transaction to one net amount payable by one party to the other. Absent an event of default by the counterparty or a termination of the agreement, the ISDA Master Agreement does not result in an offset of reported amounts of assets and liabilities in the Statements of Assets and Liabilities across the transactions between the Funds and the applicable counterparty. The right to offset and net payments across all transactions traded under the ISDA Master Agreement could result in a reduction of the Funds’ credit risk to such counterparty equal to any amounts payable by the Funds under the applicable transactions, if any. The enforceability of the right to offset may vary by jurisdiction.
346
| Notes to Financial Statements |
| (continued) |
Cash collateral that has been received or pledged to cover obligations under derivative contracts, if any, will be reported separately in the Statements of Assets and Liabilities. Generally, the amount of collateral due from or to a counterparty is subject to a minimum transfer threshold amount before a transfer is required, which may vary by counterparty. Collateral pledged for the benefit of the Fund and/or counterparty is held in segregated accounts by the Fund’s custodian and cannot be sold, re-pledged, assigned or otherwise used while pledged. The portion of such collateral representing cash, if any, is reflected as deposits with counterparties and, in the case of cash pledged by counterparty for the benefit of the Fund, a corresponding liability in the Statements of Assets and Liabilities. Securities pledged by the Fund as collateral, if any, are identified as such in the Schedule of Investments. The carrying amount of such deposits due to brokers at August 31, 2021 approximated their fair value. If measured at fair value, such deposits would have been considered as Level 2 in the fair value hierarchy (see Note 1(a)).
Repurchase agreements and reverse repurchase agreements may be entered into by the Funds under Master Repurchase Agreements (“MRA”) which permit a Fund, under certain circumstances including an event of default (such as bankruptcy or insolvency), to offset payables and/or receivables under the MRA with collateral held and/or posted to the counterparty and create one single net payment due to or from a Fund. However, bankruptcy or insolvency laws of a particular jurisdiction may impose restrictions on or prohibitions against such a right of offset in the event of the MRA counterparty’s bankruptcy or insolvency. The Fund’s repurchase agreements as of August 31, 2021 are shown on a gross basis and the required offsetting disclosures are shown in the Schedules of Investments. The value of the related collateral exceeded the value of the repurchase agreements as of August 31, 2021.
For financial reporting purposes, the Funds do not offset financial assets and financial liabilities that are subject to master netting arrangements or similar agreements on the Statements of Assets and Liabilities.
The following table presents the Funds’ gross and net amounts of assets and liabilities, by derivative type, available for offset under a master netting agreement, or similar agreement as of August 31, 2021:
| Assets | Liabilities | |||||||
| Derivative Instruments (a) | Gross Amounts of Recognized Assets Presented in the Statements of Assets and Liabilities | Gross Amounts of Recognized Liabiliites Presented in the Statements of Assets and Liabilities | ||||||
| Core Fixed Income Fund: | ||||||||
Forward foreign currency contracts | $ | 211,170 | $ | 193,507 | ||||
Option contracts | 65,108 | (b) | — | |||||
Swap contracts | — | 150,045 | ||||||
|
|
|
| |||||
Total Derivative Instruments, subject to master netting arrangement or similar arrangement | $ | 276,278 | $ | 343,552 | ||||
|
|
|
| |||||
| International Fixed Income Fund: | ||||||||
Forward foreign currency contracts | $ | 765,558 | $ | 284,059 | ||||
Option contracts | 29,498 | (b) | 88,022 | |||||
Swap contracts | 177,788 | 442,865 | ||||||
|
|
|
| |||||
Total Derivative Instruments, subject to master netting arrangement or similar arrangement | $ | 972,844 | $ | 814,946 | ||||
|
|
|
| |||||
| Inflation-Linked Fixed Income Fund: | ||||||||
Forward foreign currency contracts | $ | 176,757 | $ | 7,462 | ||||
Option contracts | 191,364 | (b) | 164,702 | |||||
|
|
|
| |||||
Total Derivative Instruments, subject to master netting arrangement or similar arrangement | $ | 368,121 | $ | 172,164 | ||||
|
|
|
| |||||
347
| Notes to Financial Statements |
| (continued) |
| Assets | Liabilities | |||||||
| Derivative Instruments (a) | Gross Amounts of Recognized Assets Presented in the Statements of Assets and Liabilities | Gross Amounts of Recognized Liabiliites Presented in the Statements of Assets and Liabilities | ||||||
| Ultra-Short Term Fixed Income Fund: | ||||||||
Forward foreign currency contracts | $ | 1,169,623 | $ | 204,061 | ||||
|
|
|
| |||||
Total Derivative Instruments, subject to master netting arrangement or similar arrangement | $ | 1,169,623 | $ | 204,061 | ||||
|
|
|
| |||||
| (a) | Excludes exchange-traded derivatives. |
| (b) | Amounts are included in Unaffiliated Investments in the Statements of Assets and Liabilities. |
The following table presents the Funds’ derivative assets and liabilities by counterparty net of amounts available for offset under master netting or similar agreements, and net of related collateral received or pledged as of August 31, 2021.
| Counterparty | Gross Amounts of Recognized Assets Presented in the Statements of Assets and Liabilities | Financial Instruments Available for Offset (a) | Collateral Received | Net Amount (b) (Not Less than $0) | ||||||||||||
| Core Fixed Income Fund | ||||||||||||||||
| Over-the-counter | ||||||||||||||||
Barclays Bank PLC | $ | 33,792 | $ | — | $ | — | $ | 33,792 | ||||||||
Citigroup Global Markets Inc. | 242,486 | (242,486 | ) | — | 0 | |||||||||||
|
|
|
|
|
|
|
| |||||||||
Total Over-the-counter derivative instruments | $ | 276,278 | $ | (242,486 | ) | $ | — | $ | 33,792 | |||||||
|
|
|
|
|
|
|
| |||||||||
| Counterparty | Gross Amounts of Recognized Liabilities Presented in the Statements of Assets and Liabilities | Financial Instruments Available for Offset (c) | Collateral Pledged | Net Amount (d) (Not Less than $0) | ||||||||||||
| Core Fixed Income Fund | ||||||||||||||||
| Over-the-counter | ||||||||||||||||
Citigroup Global Markets Inc. | $ | 343,552 | $ | (242,486 | ) | $ | — | $ | 101,066 | |||||||
|
|
|
|
|
|
|
| |||||||||
Total Over-the-counter derivative instruments | $ | 343,552 | $ | (242,486 | ) | $ | — | $ | 101,066 | |||||||
|
|
|
|
|
|
|
| |||||||||
348
| Notes to Financial Statements |
| (continued) |
| Counterparty | Gross Amounts of Recognized Assets Presented in the Statements of Assets and Liabilities | Financial Instruments Available for Offset (a) | Collateral Received (e) | Net Amount (b) (Not Less than $0) | ||||||||||||
| International Fixed Income Fund | ||||||||||||||||
| Over-the-counter | ||||||||||||||||
Bank of America | $ | 38,228 | $ | (38,228 | ) | $ | — | $ | 0 | |||||||
Barclays Bank PLC | 29,156 | (9,529 | ) | — | 19,627 | |||||||||||
BNP Paribas SA | 131,831 | (44,694 | ) | — | 87,137 | |||||||||||
Deutsche Bank AG | 3,042 | (941 | ) | (2,101 | ) | 0 | ||||||||||
Goldman Sachs & Co. | 356,080 | (356,080 | ) | — | 0 | |||||||||||
HSBC Bank USA | 27,293 | (27,293 | ) | — | 0 | |||||||||||
JPMorgan Chase & Co. | 33,242 | (4,536 | ) | — | 28,706 | |||||||||||
Societe Generale SA | 43,253 | (77 | ) | — | 43,176 | |||||||||||
Standard Chartered Bank | 303,772 | (61,949 | ) | (241,823 | ) | 0 | ||||||||||
UBS Securities LLC | 6,947 | (3,107 | ) | — | 3,840 | |||||||||||
|
|
|
|
|
|
|
| |||||||||
Total Over-the-counter derivative instruments | $ | 972,844 | $ | (546,434 | ) | $ | (243,924 | ) | $ | 182,486 | ||||||
|
|
|
|
|
|
|
| |||||||||
| Counterparty | Gross Amounts of Recognized Liabilities Presented in the Statements of Assets and Liabilities | Financial Instruments Available for Offset (c) | Collateral Pledged | Net Amount (d) (Not Less than $0) | ||||||||||||
| International Fixed Income Fund | ||||||||||||||||
| Over-the-counter | ||||||||||||||||
Bank of America | $ | 92,885 | $ | (38,228 | ) | $ | — | $ | 54,657 | |||||||
Barclays Bank PLC | 9,529 | (9,529 | ) | — | 0 | |||||||||||
BNP Paribas SA | 44,694 | (44,694 | ) | — | 0 | |||||||||||
Deutsche Bank AG | 941 | (941 | ) | — | 0 | |||||||||||
Goldman Sachs & Co. | 498,607 | (356,080 | ) | — | 142,527 | |||||||||||
HSBC Bank USA | 70,519 | (27,293 | ) | — | 43,226 | |||||||||||
JPMorgan Chase & Co. | 4,536 | (4,536 | ) | — | 0 | |||||||||||
Royal Bank of Scotland PLC | 28,102 | – | — | 28,102 | ||||||||||||
Societe Generale SA | 77 | (77 | ) | — | 0 | |||||||||||
Standard Chartered Bank | 61,949 | (61,949 | ) | — | 0 | |||||||||||
UBS Securities LLC | 3,107 | (3,107 | ) | — | 0 | |||||||||||
|
|
|
|
|
|
|
| |||||||||
Total Over-the-counter derivative instruments | $ | 814,946 | $ | (546,434 | ) | $ | — | $ | 268,512 | |||||||
|
|
|
|
|
|
|
| |||||||||
349
| Notes to Financial Statements |
| (continued) |
| Counterparty | Gross Amounts of Recognized Assets Presented in the Statements of Assets and Liabilities | Financial Instruments Available for Offset (a) | Collateral Received (e) | Net Amount (b) (Not Less than $0) | ||||||||||||
| Inflation-Linked Fixed Income Fund | ||||||||||||||||
| Over-the-counter | ||||||||||||||||
Barclays Bank PLC | $ | 32,226 | $ | (27,129 | ) | $ | — | $ | 5,097 | |||||||
BNP Paribas SA | 161,604 | (135,389 | ) | — | 26,215 | |||||||||||
JPMorgan Chase & Co. | 77,105 | (3,515 | ) | (73,590 | ) | 0 | ||||||||||
Merrill Lynch, Pierce, Fenner & Smith Inc. | 23,666 | — | — | 23,666 | ||||||||||||
Standard Chartered Bank | 73,520 | (2,892 | ) | — | 70,628 | |||||||||||
|
|
|
|
|
|
|
| |||||||||
Total Over-the-counter derivative instruments | $ | 368,121 | $ | (168,925 | ) | $ | (73,590 | ) | $ | 125,606 | ||||||
|
|
|
|
|
|
|
| |||||||||
| Counterparty | Gross Amounts of Recognized Liabilities Presented in the Statements of Assets and Liabilities | Financial Instruments Available for Offset (c) | Collateral Pledged | Net Amount (d) (Not Less than $0) | ||||||||||||
| Inflation-Linked Fixed Income Fund | ||||||||||||||||
| Over-the-counter | ||||||||||||||||
Barclays Bank PLC | $ | 27,129 | $ | (27,129 | ) | $ | — | $ | 0 | |||||||
BNP Paribas SA | 135,389 | (135,389 | ) | — | 0 | |||||||||||
Deutsche Bank AG | 1,106 | — | — | 1,106 | ||||||||||||
HSBC Bank USA | 2,133 | — | — | 2,133 | ||||||||||||
JPMorgan Chase & Co. | 3,515 | (3,515 | ) | — | 0 | |||||||||||
Standard Chartered Bank | 2,892 | (2,892 | ) | — | 0 | |||||||||||
|
|
|
|
|
|
|
| |||||||||
Total Over-the-counter derivative instruments | $ | 172,164 | $ | (168,925 | ) | $ | — | $ | 3,239 | |||||||
|
|
|
|
|
|
|
| |||||||||
| Counterparty | Gross Amounts of Recognized Assets Presented in the Statements of Assets and Liabilities | Financial Instruments Available for Offset (a) | Collateral Received (e) | Net Amount (b) (Not Less than $0) | ||||||||||||
| Ultra-Short Term Fixed Income Fund | ||||||||||||||||
| Over-the-counter | ||||||||||||||||
BNP Paribas SA | $ | 235,661 | $ | (12,952 | ) | $ | (222,709 | ) | $ | 0 | ||||||
HSBC Bank USA | 16,018 | — | — | 16,018 | ||||||||||||
JPMorgan Chase & Co. | 1,700 | — | — | 1,700 | ||||||||||||
Merrill Lynch, Pierce, Fenner & Smith Inc. | 703,172 | (74,360 | ) | (628,812 | ) | 0 | ||||||||||
Standard Chartered Bank | 213,072 | (116,749 | ) | (96,323 | ) | 0 | ||||||||||
|
|
|
|
|
|
|
| |||||||||
Total Over-the-counter derivative instruments | $ | 1,169,623 | $ | (204,061 | ) | $ | (947,844 | ) | $ | 17,718 | ||||||
|
|
|
|
|
|
|
| |||||||||
350
| Notes to Financial Statements |
| (continued) |
| Counterparty | Gross Amounts of Recognized Liabilities Presented in the Statements of Assets and Liabilities | Financial Instruments Available for Offset (c) | Collateral Pledged | Net Amount (d) (Not Less than $0) | ||||||||||||
| Ultra-Short Term Fixed Income Fund | ||||||||||||||||
| Over-the-counter | ||||||||||||||||
BNP Paribas SA | $ | 12,952 | $ | (12,952 | ) | $ | — | $ | 0 | |||||||
Merrill Lynch, Pierce, Fenner & Smith Inc. | 74,360 | (74,360 | ) | — | 0 | |||||||||||
Standard Chartered Bank | 116,749 | (116,749 | ) | — | 0 | |||||||||||
|
|
|
|
|
|
|
| |||||||||
Total Over-the-counter derivative instruments | $ | 204,061 | $ | (204,061 | ) | $ | — | $ | 0 | |||||||
|
|
|
|
|
|
|
| |||||||||
| (a) | Represents the amount of assets that could be offset by liabilities with the same counterparty under master netting or similar agreements that are not offset on the Statements of Assets and Liabilities. |
| (b) | Net amount represents the new amount receivable from the counterparty in the event of default. |
| (c) | Represents the amount of liabilities that could be offset by assets with the same counterparty under master netting or similar agreements that are not offset on the Statements of Assets and Liabilities. |
| (d) | Net amount represents the net amount payable to the counterparty in the event of default. |
| (e) | In some instances, the actual collateral received and/or pledged may be more than the amount shown here due to overcollateralization. |
2. Investment Management Agreement and Other Transactions with Affiliates
CGAS, a business of Morgan Stanley Wealth Management, serves as the investment manager to the Funds. The Manager selects and oversees professional money managers who are responsible for investing the assets of the Funds (each a “Sub-adviser,” and collectively the “Sub-advisers”). Each Fund pays the Manager an investment management fee calculated daily at an annual rate based on each Fund’s average daily net assets and paid monthly in arrears. The Manager pays each Sub-adviser on a monthly basis, a sub-advisory fee from its investment management fees.
CGAS has contractually agreed to waive fees and reimburse expenses in order to keep the Funds’ management fees from exceeding the total amount of sub-advisory fees paid by CGAS plus 0.20% based on average net assets. Because the Alternative Strategies Fund does not currently have sub-advisers, CGAS will contractually waive 1.00% of its management fees. This contractual waiver will only apply if the Funds’ total management fees exceed the total amount of sub-advisory fees paid by CGAS plus 0.20%, and will not affect the Funds’ total management fees if they are less than such amount. This fee waiver and/or reimbursement will continue for at least one year from the date of the Funds’ prospectus or until such time as the Board of Trustees act to discontinue all or a portion of such waiver and/or reimbursement when they deem such action is appropriate.
In addition, for Alternative Strategies Fund, CGAS and its affiliates agrees to waive fees and reimburse expenses in order to keep the Fund’s management fee from exceeding 0.20% more than the total amount of sub-advisory fees paid by the Adviser and to keep the Fund’s total operating costs from exceeding 0.70% (exclusive of interest from borrowing, brokerage commissions, taxes, acquired fund fees and expenses, and other extraordinary expenses not incurred in the ordinary course of the Fund’s business). This contractual arrangement shall remain in effect for at least one year from the date of the Fund’s prospectus or until such time as the Board of Trustees act to discontinue all or a portion of such waiver and/or reimbursement when they deem such action is appropriate.
The maximum allowable investment management fees represents the total amount that could be charged to each Fund. The aggregate fees paid by the Manager to each Fund’s Sub-advisers and the fees retained by the Manager for the year ended August 31, 2021 are indicated below:
| Fund | Sub-advisory Fee | Consulting Group Advisory Services LLC Fee | Maximum Allowable Annual Management Fee | |||||||||
Large Cap Equity Fund | 0.19 | % | 0.20 | % | 0.60 | % | ||||||
Small-Mid Cap Equity Fund | 0.26 | % | 0.20 | % | 0.80 | % | ||||||
International Equity Fund | 0.33 | % | 0.20 | % | 0.70 | % | ||||||
Emerging Markets Equity Fund | 0.38 | % | 0.20 | % | 0.90 | % | ||||||
351
| Notes to Financial Statements |
| (continued) |
| Fund | Sub-advisory Fee | Consulting Group Advisory Services LLC Fee | Maximum Allowable Annual Management Fee | |||||||||
Core Fixed Income Fund | 0.18 | % | 0.20 | % | 0.40 | % | ||||||
High Yield Fund | 0.30 | % | 0.20 | % | 0.70 | % | ||||||
International Fixed Income Fund | 0.25 | % | 0.20 | % | 0.50 | % | ||||||
Municipal Bond Fund | 0.20 | % | 0.20 | % | 0.40 | % | ||||||
Inflation-Linked Fixed Income Fund | 0.25 | % | 0.20 | % | 0.50 | % | ||||||
Ultra-Short Term Fixed Income Fund | 0.25 | % | 0.20 | % | 0.50 | % | ||||||
Alternative Strategies Fund | N/A | 0.20 | % | 1.20 | % | |||||||
The Manager has agreed to waive and/or reimburse a portion of its fee. For the year ended August 31, 2021, the amounts waived and/or reimbursed by the Manager were as follows:
| Fund | Amounts Waived and/or Reimbursed | |||
Large Cap Equity Fund | $ | 4,123,697 | ||
Small-Mid Cap Equity Fund | 2,345,388 | |||
International Equity Fund | 2,289,028 | |||
Emerging Markets Equity Fund | 1,874,842 | |||
Core Fixed Income Fund | 220,958 | |||
High Yield Fund | 557,917 | |||
International Fixed Income Fund | 75,250 | |||
Municipal Bond Fund | — | |||
Inflation-Linked Fixed Income Fund | 77,960 | |||
Ultra-Short Term Fixed Income Fund | 224,510 | |||
Alternative Strategies Fund | 715,949 | |||
Brown Brothers Harriman & Co. (“BBH”) serves as the Trust’s administrator. For its administrative services, BBH receives an annual asset based fee of 0.0250% of the Trust’s assets up to $5 billion, 0.02% on assets between $5 billion and $8 billion and 0.0175% on assets in excess of $8 billion, plus out-of-pocket expenses. The fee is calculated and allocated daily based on the relative assets of each Fund.
For the year ended August 31, 2021, Morgan Stanley & Co. Incorporated (“MS&Co.”), and its affiliates, including Morgan Stanley Smith Barney LLC, the Trust’s distributor, received brokerage commissions of:
| Fund | Commission Dollars to MS&Co. | |||
Large Cap Equity Fund | $ | 9,014 | ||
Small-Mid Cap Equity Fund | 6,761 | |||
International Equity Fund | 1,296 | |||
Emerging Markets Equity Fund | 16,758 | |||
Core Fixed Income Fund | — | |||
High Yield Fund | — | |||
International Fixed Income Fund | — | |||
Municipal Bond Fund | — | |||
Inflation-Linked Fixed Income Fund | — | |||
Ultra-Short Term Fixed Income Fund | — | |||
Alternative Strategies Fund | — | |||
Officers of the Trust do not receive compensation directly from the Trust. The Funds may bear a portion of the annual compensation of the Fund’s Chief Compliance Officer.
352
| Notes to Financial Statements |
| (continued) |
For the year ended August 31, 2021, the Funds assume the following to be affiliated issuers:
Large Cap Equity Fund
| Underlying Security | Beginning Value as of August 31, 2020 | Purchases at Cost | Proceeds from Sales | Net Realized Gain on Sales | Change in Unrealized Appreciation | Dividend/ Interest Income | Ending Value as of August 31, 2021 | |||||||||||||||||||||
Morgan Stanley | $ | 1,721,653 | $ | 266,745 | $ | (331,251) | $ | 137,354 | $ | 2,030,039 | $ | 65,417 | $ | 3,824,540 | ||||||||||||||
Core Fixed Income Fund
| Underlying Security | Beginning Value as of August 31, 2020 | Purchases at Cost | Proceeds from Sales | Net Realized (Loss) on Sales | Change in Unrealized Appreciation/ (Depreciation) | Dividend/ Interest Income | Ending Value as of August 31, 2021 | |||||||||||||||||||||
Morgan Stanley Bank of America Merrill Lynch Trust: | ||||||||||||||||||||||||||||
Series 2013-C13, Class A4, 4.039% due 11/15/46 | $ | 541,338 | $ | — | $ | — | $ | — | $ | (7,824 | ) | $ | 20,195 | $ | 533,514 | |||||||||||||
Series 2016-C28, Class A3, 3.272% due 1/15/49 | — | 674,681 | (40,448 | ) | (2,433 | ) | 1,166 | 9,552 | 632,966 | |||||||||||||||||||
Morgan Stanley Resecuritization Trust, Series 2014-R3, Class 2A, 3.000%, due 7/26/48 | 1,081,594 | — | (868,674 | ) | (543 | ) | (8,346 | ) | 13,644 | 204,031 | ||||||||||||||||||
Ultra-Short Term Fixed Income Fund
| Underlying Security | Beginning Value as of August 31, 2020 | Purchases at Cost | Proceeds from Sales | Net Realized Gain on Sales | Change in Unrealized Appreciation | Accretion of discount | Dividend/ Interest Income | Ending Value as of August 31, 2021 | ||||||||||||||||||||||||
Morgan Stanley ABS Capital I Inc. Trust, Series 2004-HE4, Class M1, 1.018% (1-Month USD-LIBOR + 0.900%) due 5/25/34 | $ | 578,232 | $ — | $ | (78,261) | $ | 358 | $ | 7,748 | $ | 271 | $ | 5,809 | $ | 508,348 | |||||||||||||||||
3. Investments
During the year ended August 31, 2021, the aggregate cost of purchases and proceeds from sales of investments (excluding short-term investments) for each Fund were as follows:
| Other Investments | U.S. Government Securities | |||||||||||||||
| Fund | Purchases | Sales | Purchases | Sales | ||||||||||||
Large Cap Equity Fund | $ | 289,077,170 | $ | 509,370,358 | $ | — | $ | — | ||||||||
Small-Mid Cap Equity Fund | 187,339,256 | 350,590,760 | — | — | ||||||||||||
International Equity Fund | 684,016,028 | 809,289,420 | — | — | ||||||||||||
Emerging Markets Fund | 299,680,869 | 395,107,124 | — | — | ||||||||||||
Core Fixed Income Fund | 390,356,203 | 320,640,906 | 2,446,787,577 | 2,155,171,528 | ||||||||||||
High Yield Fund | 295,679,092 | 380,405,706 | — | — | ||||||||||||
International Fixed Income Fund | 51,343,236 | 43,093,411 | 650,518,762 | 698,391,745 | ||||||||||||
Municipal Bond Fund | 27,935,124 | 4,744,140 | — | — | ||||||||||||
Inflation-Linked Fixed Income Fund | 10,231,583 | 13,803,418 | 213,884,640 | 258,309,000 | ||||||||||||
Ultra-Short Term Fixed Income Fund | 196,624,608 | 217,947,089 | 99,066,959 | 43,596,161 | ||||||||||||
Alternative Strategies Fund | 86,870,509 | 12,803,906 | — | — | ||||||||||||
The cost of investments for federal income tax purposes, gross unrealized appreciation and unrealized depreciation at August 31, 2021 have been disclosed under respective schedules of investments.
4. Shares of Beneficial Interest
At August 31, 2021, the Trust had an unlimited number of units of beneficial interest (shares) authorized with a par value of $0.001 per share. At August 31, 2021, Trustees and executive officers of the Trust as a group owned of record less than 1% of the outstanding shares of the Trust.
353
| Notes to Financial Statements |
| (continued) |
Transactions in shares of each Fund were as follows:
Year Ended August 31, 2021 | Year Ended 2020 | |||||||
| Large Cap Equity Fund | ||||||||
Shares sold | 16,388,468 | 18,556,044 | ||||||
Shares issued on reinvestment | 2,732,361 | 3,980,173 | ||||||
Shares repurchased | (26,014,243 | ) | (18,156,575 | ) | ||||
|
|
|
| |||||
Net Increase (Decrease) | (6,893,414 | ) | 4,379,642 | |||||
|
|
|
| |||||
| Small-Mid Cap Equity Fund | ||||||||
Shares sold | 6,299,496 | 16,067,985 | ||||||
Shares issued on reinvestment | 1,453,513 | 2,752,335 | ||||||
Shares repurchased | (14,375,989 | ) | (7,107,525 | ) | ||||
|
|
|
| |||||
Net Increase (Decrease) | (6,622,980 | ) | 11,712,795 | |||||
|
|
|
| |||||
| International Equity Fund | ||||||||
Shares sold | 20,885,682 | 26,722,202 | ||||||
Shares issued on reinvestment | 1,776,742 | 2,929,092 | ||||||
Shares repurchased | (31,102,796 | ) | (40,562,287 | ) | ||||
|
|
|
| |||||
Net Decrease | (8,440,372 | ) | (10,910,993 | ) | ||||
|
|
|
| |||||
| Emerging Markets Equity Fund | ||||||||
Shares sold | 7,814,946 | 8,178,789 | ||||||
Shares issued on reinvestment | 727,361 | 669,852 | ||||||
Shares repurchased | (13,644,516 | ) | (6,661,043 | ) | ||||
|
|
|
| |||||
Net Increase (Decrease) | (5,102,209 | ) | 2,187,598 | |||||
|
|
|
| |||||
| Core Fixed Income Fund | ||||||||
Shares sold | 75,404,820 | 22,527,192 | ||||||
Shares issued on reinvestment | 6,196,598 | 3,723,753 | ||||||
Shares repurchased | (37,036,082 | ) | (57,469,122 | ) | ||||
|
|
|
| |||||
Net Increase (Decrease) | 44,565,336 | (31,218,177 | ) | |||||
|
|
|
| |||||
| High Yield Fund | ||||||||
Shares sold | 26,167,624 | 70,159,389 | ||||||
Shares issued on reinvestment | 3,691,543 | 1,830,895 | ||||||
Shares repurchased | (50,925,415 | ) | (6,699,380 | ) | ||||
|
|
|
| |||||
Net Increase (Decrease) | (21,066,248 | ) | 65,290,904 | |||||
|
|
|
| |||||
| International Fixed Income Fund | ||||||||
Shares sold | 7,584,914 | 3,184,186 | ||||||
Shares issued on reinvestment | 121,411 | 828,520 | ||||||
Shares repurchased | (5,355,761 | ) | (4,781,519 | ) | ||||
|
|
|
| |||||
Net Increase (Decrease) | 2,350,564 | (768,813 | ) | |||||
|
|
|
| |||||
354
| Notes to Financial Statements |
| (continued) |
Year Ended August 31, 2021 | Year Ended 2020 | |||||||
| Municipal Bond Fund | ||||||||
Shares sold | 4,448,064 | 1,507,022 | ||||||
Shares issued on reinvestment | 177,244 | 232,018 | ||||||
Shares repurchased | (2,316,494 | ) | (3,392,268 | ) | ||||
|
|
|
| |||||
Net Increase (Decrease) | 2,308,814 | (1,653,228 | ) | |||||
|
|
|
| |||||
| Inflation-Linked Fixed Income Fund | ||||||||
Shares sold | 6,226,990 | 2,864,882 | ||||||
Shares issued on reinvestment | 734,246 | 251,506 | ||||||
Shares repurchased | (7,669,850 | ) | (10,376,618 | ) | ||||
|
|
|
| |||||
Net Decrease | (708,614 | ) | (7,260,230 | ) | ||||
|
|
|
| |||||
| Ultra-Short Term Fixed Income Fund | ||||||||
Shares sold | 19,830,490 | 9,415,367 | ||||||
Shares issued on reinvestment | 667,516 | 773,647 | ||||||
Shares repurchased | (15,665,398 | ) | (20,550,346 | ) | ||||
|
|
|
| |||||
Net Increase (Decrease) | 4,832,608 | (10,361,332 | ) | |||||
|
|
|
| |||||
| Alternative Strategies Fund | ||||||||
Shares sold | 8,057,159 | 2,493,185 | ||||||
Shares issued on reinvestment | 46,431 | 99,928 | ||||||
Shares repurchased | (1,206,672 | ) | (1,333,279 | ) | ||||
|
|
|
| |||||
Net Increase | 6,896,918 | 1,259,834 | ||||||
|
|
|
| |||||
5. Dividend and Tax Components of Capital
The tax character of distributors paid during the fiscal year ended August 31, 2021, were as follows:
| Large Cap Equity Fund | Small-Mid Cap Equity Fund | International Equity Fund | Emerging Market Equity Fund | |||||||||||||
Distributions paid from: | ||||||||||||||||
Tax Exempt | $ | — | $ | — | $ | — | $ | — | ||||||||
Tax Return of Capital | — | — | — | — | ||||||||||||
Ordinary Income | 14,593,306 | 15,334,346 | 23,968,738 | 11,972,541 | ||||||||||||
Net Long-term Capital Gains | 47,350,101 | 14,070,532 | — | — | ||||||||||||
|
|
|
|
|
|
|
| |||||||||
Total Distributions Paid | $ | 61,943,407 | $ | 29,404,878 | $ | 23,968,738 | $ | 11,972,541 | ||||||||
|
|
|
|
|
|
|
| |||||||||
| Core Fixed Income Fund | High Yield Fund | International Fixed Income Fund | Municipal Bond Fund | |||||||||||||
Distributions paid from: | ||||||||||||||||
Tax Exempt | $ | — | $ | — | $ | — | $ | 1,309,735 | ||||||||
Tax Return of Capital | — | — | — | — | ||||||||||||
Ordinary Income | 33,531,908 | 13,565,430 | — | 41,176 | ||||||||||||
Net Long-term Capital Gains | 19,148,457 | — | 993,150 | 343,917 | ||||||||||||
|
|
|
|
|
|
|
| |||||||||
Total Distributions Paid | $ | 52,680,365 | $ | 13,565,430 | $ | 993,150 | $ | 1,694,828 | ||||||||
|
|
|
|
|
|
|
| |||||||||
355
| Notes to Financial Statements |
| (continued) |
| Inflation-Linked Fixed Income Fund | Ultra-Short Term Fixed Income Fund | Alternative Strategies Fund | ||||||||||||||
Distributions paid from: | ||||||||||||||||
Tax Exempt |
| $ | — | $ | — | $ | — | |||||||||
Tax Return of Capital |
| — | — | — | ||||||||||||
Ordinary Income |
| 8,155,061 | 6,604,435 | 482,881 | ||||||||||||
Net Long-term Capital Gains |
| — | — | — | ||||||||||||
|
|
|
|
|
| |||||||||||
Total Distributions Paid |
| $ | 8,155,061 | $ | 6,604,435 | $ | 482,881 | |||||||||
|
|
|
|
|
| |||||||||||
As of August 31, 2021, the components of accumulated earnings on a tax basis were as follows:
| Large Cap Equity Fund | Small-Mid Cap Equity Fund | International Equity Fund | Emerging Market Equity Fund | |||||||||||||
Undistributed ordinary income - net | $ | 50,640,548 | $ | 38,807,154 | $ | 53,153,678 | $ | 8,677,024 | ||||||||
Undistributed long-term capital gains - net | 115,224,722 | 67,385,359 | 44,448,312 | 9,425,304 | ||||||||||||
Undistributed tax exempt income - net | — | — | — | — | ||||||||||||
|
|
|
|
|
|
|
| |||||||||
Total Undistributed earnings | 165,865,270 | 106,192,513 | 97,601,990 | 18,102,328 | ||||||||||||
Capital loss carryforward | — | — | — | — | ||||||||||||
Other book/tax temporary differences | 1 | (a) | — | (a) | — | (a) | 7 | (a) | ||||||||
Unrealized appreciation (depreciation) | 1,120,532,652 | 243,613,133 | 324,552,648 | 137,335,518 | ||||||||||||
|
|
|
|
|
|
|
| |||||||||
Total accumulated earnings/(losses) - net | $ | 1,286,397,923 | $ | 349,805,646 | $ | 422,154,638 | $ | 155,437,853 | ||||||||
|
|
|
|
|
|
|
| |||||||||
| Core Fixed Income Fund | High Yield Fund | International Fixed Income Fund | Municipal Bond Fund | |||||||||||||
Undistributed ordinary income - net | $ | — | $ | 1,413,155 | $ | 1,783,131 | $ | 39,141 | ||||||||
Undistributed long-term capital gains - net | 7,350,824 | — | 657,751 | 172,870 | ||||||||||||
Undistributed tax exempt income - net | — | — | — | 404,374 | ||||||||||||
|
|
|
|
|
|
|
| |||||||||
Total Undistributed earnings | 7,350,824 | 1,413,155 | 2,440,882 | 616,385 | ||||||||||||
Capital loss carryforward | — | (10,577,028 | ) | — | — | |||||||||||
Other book/tax temporary differences | 2 | (a) | — | (a) | (2 | )(a) | (575 | )(a) | ||||||||
Unrealized appreciation (depreciation) | 22,573,537 | 6,731,956 | 3,063,042 | 4,663,679 | ||||||||||||
|
|
|
|
|
|
|
| |||||||||
Total accumulated earnings/(losses) - net | $ | 29,924,363 | $ | (2,431,917 | ) | $ | 5,503,922 | $ | 5,279,489 | |||||||
|
|
|
|
|
|
|
| |||||||||
| Inflation-Linked Fixed Income Fund | Ultra-Short Term Fixed Income Fund | Alternative Strategies Fund | ||||||||||||||
Undistributed ordinary income - net |
| $ | 587,304 | $ | 1,572,494 | $ | 687,032 | |||||||||
Undistributed long-term capital gains - net |
| 3,935,400 | — | 64,711 | ||||||||||||
Undistributed tax exempt income - net |
| — | — | — | ||||||||||||
|
|
|
|
|
| |||||||||||
Total Undistributed earnings |
| 4,522,704 | 1,572,494 | 751,743 | ||||||||||||
Capital loss carryforward |
| — | (10,463,350 | ) | — | |||||||||||
Other book/tax temporary differences |
| 1 | (a) | (1 | )(a) | — | (a) | |||||||||
Unrealized appreciation (depreciation) |
| 12,866,316 | 532,965 | 5,872,460 | ||||||||||||
|
|
|
|
|
| |||||||||||
Total accumulated earnings/(losses) - net |
| $ | 17,389,021 | $ | (8,357,892 | ) | $ | 6,624,203 | ||||||||
|
|
|
|
|
| |||||||||||
| (a) | The differences between book-basis and tax-basis unrealized appreciation (depreciation) is attributable to the tax deferral of losses on wash sales, tax cost adjustments related to partnerships, forwards, futures, options, swaps, ROC dividends received, real estate investments, interest accrual on defaulted bonds, the difference between book and tax amortization methods for premiums on fixed income securities, and/or the realization for tax purposes of unrealized gains on investments in passive foreign investment companies. |
356
| Notes to Financial Statements |
| (continued) |
6. Capital Loss Carry Forward
Under the Regulated Investment Company Modernization Act of 2010 (the “Act”), the Funds are permitted to carry forward capital losses incurred in taxable years beginning after December 22, 2010, for an unlimited period. However, any losses incurred during those future taxable years will be required to be utilized prior to the losses incurred in pre-enactment taxable years. As a result of this, pre-enactment capital loss carryforwards may be more likely to expire unused.
As of August 31, 2021, the Funds had the following net capital loss carryforwards remaining:
| Large Cap Equity Fund | Small-Mid Cap Equity Fund | International Equity Fund | Emerging Market Equity Fund | Core Fixed Income Fund | High Yield Fund | |||||||||||||||||||
Short-Term | $ | — | $ | — | $ | — | $ | — | $ | — | $ | — | ||||||||||||
Long-Term | — | — | — | — | — | 10,557,028 | ||||||||||||||||||
|
|
|
|
|
|
|
|
|
|
|
| |||||||||||||
| $ | — | $ | — | $ | — | $ | — | $ | — | $ | 10,557,028 | |||||||||||||
|
|
|
|
|
|
|
|
|
|
|
| |||||||||||||
| International Fixed Income Fund | Municipal Bond Fund | Inflation-Linked Fixed Income Fund | Ultra-Short Term Fixed Income Fund | Alternative Strategies Fund | ||||||||||||||||||||
Short-Term |
| $ | — | $ | — | $ | — | $ | 10,343,667 | $ | — | |||||||||||||
Long-Term |
| — | — | — | 119,683 | — | ||||||||||||||||||
|
|
|
|
|
|
|
|
|
| |||||||||||||||
| $ | — | $ | — | $ | — | $ | 10,463,350 | $ | — | |||||||||||||||
|
|
|
|
|
|
|
|
|
| |||||||||||||||
During the year ended August 31, 2021 the following funds utilized capital loss carryforwards:
International | Emerging Market Equity Fund | High Yield Fund | Inflation-Linked Fixed Income Fund | Ultra-Short Term Fixed Income Fund | Alternative Strategies Fund | |||||||||||||||||||
Short-Term | $ | 15,848,980 | $ | 39,235,125 | $ | 2,185,369 | $ | — | $ | — | $ | 542,432 | ||||||||||||
Long-Term | 64,281,614 | 13,464,658 | 12,105,741 | 349,764 | 381,239 | 208,732 | ||||||||||||||||||
|
|
|
|
|
|
|
|
|
|
|
| |||||||||||||
| $ | 80,130,594 | $ | 52,699,783 | $ | 14,291,110 | $ | 349,764 | $ | 381,239 | $ | 751,164 | |||||||||||||
|
|
|
|
|
|
|
|
|
|
|
| |||||||||||||
7. Subsequent Events
Management has evaluated subsequent events after the balance sheet date through the date that the financial statements were issued and has not identified any additional events or transactions that would require recognition or disclosure in the financial statements other than the distribution information below.
Subsequent to August 31, 2021, the Funds made the following distributions:
| Record Date Payable Date | Core Fixed Income Fund | High Yield Fund | Municipal Bond Fund | Inflation-Linked Fixed Income Fund | Ultra-Short Term Fixed Income Fund | |||||||||||||||
9/1/21-9/30/21 | $ | 0.011303 | $ | 0.014818 | $ | 0.011911 | $ | 0.050897 | $ | 0.005020 | ||||||||||
357
| Report of Independent Registered Public Accounting Firm |
To the shareholders and Board of Trustees of
Morgan Stanley Pathway Funds:
Opinion on the Financial Statements and Financial Highlights
We have audited the accompanying statements of assets and liabilities of the Morgan Stanley Pathway Funds comprising the Large Cap Equity Fund, Small-Mid Cap Equity Fund, International Equity Fund, Emerging Markets Equity Fund, Core Fixed Income Fund, High Yield Fund, International Fixed Income Fund, Municipal Bond Fund, Inflation-Linked Fixed Income Fund, Ultra-Short Term Fixed Income Fund, and Alternative Strategies Fund (the “Funds”), including the schedules of investments, as of August 31, 2021, the related statements of operations, cash flows, changes in net assets, and the financial highlights for the periods indicated in the table below, and the related notes. In our opinion, the financial statements and financial highlights present fairly, in all material respects, the financial position of each of the funds listed above constituting the Morgan Stanley Pathway Funds as of August 31, 2021, and the results of their operations and their cash flows for the year then ended, the changes in their net assets for each of the two years in the period then ended, and the financial highlights for the period listed in the table below, in conformity with accounting principles generally accepted in the United States of America.
| Individual Fund Comprising the Morgan Stanley Pathway Funds | Statements of Operations and Cash Flows* | Statements of Changes in Net Assets | Financial Highlights | |||
| Large Cap Equity Fund | For the year-ended August 31, 2021 | For the years ended August 31, 2021 and 2020 | For the years ended August 31, 2021, 2020, 2019, 2018, and 2017 | |||
| Small-Mid Cap Equity Fund | ||||||
| International Equity Fund | ||||||
| Emerging Markets Equity Fund | ||||||
| Core Fixed Income Fund | ||||||
| High Yield Fund | ||||||
| International Fixed Income Fund | ||||||
| Municipal Bond Fund | ||||||
| Inflation-Linked Fixed Income Fund | ||||||
| Ultra-Short Term Fixed Income Fund | ||||||
| Alternative Strategies Fund | For the year-ended August 31, 2021 | For the years ended August 31, 2021 and 2020 | For the year ended August 31, 2021,2020, 2019 and the period of February 15, 2018 (fund inception) through August 31, 2018. |
| * | Statements of Cash Flows presented for the International Fixed Income Fund and Inflation-Linked Fixed Income Fund. |
Basis for Opinion
These financial statements and financial highlights are the responsibility of the Funds’ management. Our responsibility is to express an opinion on the Funds’ financial statements and financial highlights based on our audits. We are a public accounting firm registered with the Public Company Accounting Oversight Board (United States) (PCAOB) and are required to be independent with respect to the Funds in accordance with the U.S. federal securities laws and the applicable rules and regulations of the Securities and Exchange Commission and the PCAOB.
We conducted our audits in accordance with the standards of the PCAOB. Those standards require that we plan and perform the audit to obtain reasonable assurance about whether the financial statements and financial highlights are free of material misstatement, whether due to error or fraud. The Funds are not required to have, nor were we engaged to perform, an audit of their internal control over financial reporting. As part of our audits we are required to obtain an understanding of internal control over financial reporting but not for the purpose of expressing an opinion on the effectiveness of the Funds’ internal control over financial reporting. Accordingly, we express no such opinion.
358
| Report of Independent Registered Public Accounting Firm |
| (continued) |
Our audits included performing procedures to assess the risks of material misstatement of the financial statements and financial highlights, whether due to error or fraud, and performing procedures that respond to those risks. Such procedures included examining, on a test basis, evidence regarding the amounts and disclosures in the financial statements and financial highlights. Our audits also included evaluating the accounting principles used and significant estimates made by management, as well as evaluating the overall presentation of the financial statements and financial highlights. Our procedures included confirmation of securities owned as of August 31, 2021, by correspondence with the custodian and brokers; when replies were not received from brokers, we performed other auditing procedures. We believe that our audits provide a reasonable basis for our opinion.
/s/ Deloitte & Touche LLP
Boston, Massachusetts
October 28, 2021
We have served as the auditor of one or more Morgan Stanley Pathway Funds investment companies since 2009.
359
| Board Approval of Management Agreement and Investment Advisory Agreements |
| (unaudited) |
Approval of Advisory Agreements
The Morgan Stanley Pathway Funds (the “Trust,” and each series thereof a “Fund,” and collectively, the “Funds”) and Consulting Group Advisory Services LLC (“Manager”), a business of Morgan Stanley LLC, have entered into an investment management agreement (“Management Agreement”). Pursuant to the Management Agreement, other than with respect to the Alternative Strategies Fund, the Manager serves as “manager of managers” for the Trust and selects and oversees professional money managers (each, a “Sub-adviser” and collectively, the “Sub-advisers”) who are responsible for investing the portion of assets of the Funds allocated to them by the Manager pursuant to investment advisory agreements (the “Subadvisory Agreements” and, together with the Management Agreement, the “Agreements”) between the Manager and each of the Sub-advisers.
The Investment Company Act of 1940, as amended (the “1940 Act”), requires that the Agreements be approved initially for a two year term, as well as annually thereafter, by the Trust’s Board of Trustees (“Board”) and by a majority of the Trustees who are not “interested persons” (as defined in the 1940 Act) of any party to the Agreements (“Independent Trustees”), by vote cast in person at a meeting called for the purpose of voting on such approval. In connection with their consideration of the approval of the Agreements, the Independent Trustees must request and evaluate such information as may reasonably be necessary to make a reasonable business judgment with respect to the approval of the Agreements, and the Manager and Sub-advisers are required to provide such information.
****
At a meeting1 held on May 25-26, 2021 (the “May Meeting”), the Board, including a majority of the Independent Trustees, approved the continuance of the Agreements for an annual period. In connection with the May Meeting and at other meetings during the course of the year, the Independent Trustees requested and received information from the Manager and the Sub-advisers that they deemed reasonably necessary for their review of the Agreements and the performance of the Manager and Sub-advisers under the Agreements. The Independent Trustees were assisted in their reviews by Fund counsel and independent legal counsel (“Independent Counsel”) and met with Independent Counsel in executive sessions separate from representatives of the Manager and the Sub-advisers. In addition to the Management Agreement and the investment advisory agreement between the Trust, on behalf of the Alternative Strategies Fund, and the Manager (the “IM Agreement”), pursuant to which the Manager serves as the investment adviser for the Alternative Strategies Fund, the Board approved at the May Meeting the Subadvisory Agreements with the following Sub-advisers on behalf of the indicated Fund to continue for another year:
Sub-adviser Name | Fund(s) Serviced | |
| The Consulting Group, Consulting Group Advisory Services LLC | ¨ Alternative Strategies Fund | |
| Aristotle Capital Boston, LLC | ¨ Small-Mid Cap Equity Fund | |
| BlackRock Financial Management, Inc. | ¨ Core Fixed Income Fund ¨ Large Cap Equity Fund ¨ Small-Mid Cap Equity Fund ¨ International Equity Fund ¨ Emerging Markets Equity Fund ¨ Municipal Bond Fund | |
| Causeway Capital Management LLC | ¨ International Equity Fund | |
| ClearBridge Investments, LLC | ¨ Large Cap Equity Fund | |
| Columbia Management Investment Advisers, LLC | ¨ Large Cap Equity Fund | |
| D.F. Dent and Company, Inc. | ¨ Small-Mid Cap Equity Fund | |
| 1 | The meeting was held telephonically in reliance on exemptive orders issued by the Securities and Exchange Commission in 2020. Reliance on the exemptive order was necessary and appropriate due to circumstances related to the effects of COVID-19. All Trustees participating in the telephonic meeting were able to hear each other simultaneously during the meeting. Reliance on the exemptive order requires Trustees, including a majority of the Independent Trustees, to ratify actions taken pursuant to the exemptive order by vote cast at the next in-person meeting. |
360
| Board Approval of Management Agreement and Investment Advisory Agreements |
| (unaudited) (continued) |
Sub-adviser Name | Fund(s) Serviced | |
| Lazard Asset Management LLC | ¨ Large Cap Equity Fund ¨ Emerging Markets Equity Fund | |
| Lyrical Asset Management LLC | ¨ Large Cap Equity Fund | |
| Martin Currie Inc. | ¨ Emerging Markets Equity Fund | |
| Macquarie Investment Management | ¨ Large Cap Equity Fund | |
| Metropolitan West Asset Management LLC | ¨ Core Fixed Income Fund | |
| Neuberger Berman LLC | ¨ Small-Mid Cap Equity Fund | |
| Nuance Investments, LLC | ¨ Small-Mid Cap Equity Fund | |
| Pacific Investment Management Company LLC | ¨ International Fixed Income Fund ¨ Inflation-Linked Fixed Income Fund ¨ Ultra-Short Term Fixed Income Fund | |
| PineBridge Investments LLC | ¨ High Yield Fund | |
| Schroder Investment Management North America Inc. | ¨ International Equity Fund | |
| Schroder Investment Management North America Ltd. (delegation agreement) | ¨ International Equity Fund | |
| Van Eck Associates Corporation | ¨ Emerging Markets Equity Fund | |
| Victory Capital Management, Inc. | ¨ International Equity Fund | |
| Walter Scott & Partners Limited | ¨ International Equity Fund | |
| Western Asset Management Company | ¨ Core Fixed Income Fund ¨ High Yield Fund | |
| Westfield Capital Management Co., L.P. | ¨ Small-Mid Cap Equity Fund | |
In voting to approve the Agreements at the May Meeting, the Independent Trustees considered whether the approval of the Agreements would be in the best interests of the respective Fund and its shareholders, an evaluation based on several factors including those discussed below.
Nature, Extent and Quality of the Services Provided Under the Agreements
The Board received and considered information regarding the nature, extent and quality of services provided to the Funds by the Manager and the Sub-advisers under the respective Agreements during the meetings and during the past year, as applicable. The Independent Trustees considered information regarding the process by which the Manager selected and recommended the Sub-advisers for Board approval and the Manager’s supervisory activities over the Sub-advisers. The Independent Trustees noted that the Manager monitors and evaluates the performance of each Fund’s Sub-advisers, including the Sub-advisers’ compliance with the investment objective, policies, and restrictions of the relevant Fund. The Board also received a description of the administrative and other services rendered to the Trust and its shareholders during the past year. The Board noted information received at regular meetings throughout the year related to the services rendered by the Manager about the management of the Trust’s affairs and its role in coordinating the activities of the Sub-advisers and the Trust’s other service providers. The Board considered each Sub-adviser’s specific responsibilities in all aspects of the day-to-day management of the portion of the respective Fund’s assets allocated to it, as well as the qualifications, experience and responsibilities of the persons serving as the portfolio managers for the segment of the Fund’s assets managed by the respective Sub-adviser, and other key personnel at the Sub-adviser. The Board specifically considered each Sub-adviser’s investment process and capabilities, evaluating, if applicable, how the Sub-adviser complemented each of the other Sub-advisers, if any, to the respective Fund. With respect to the Alternative Strategies Fund, the Independent Trustees considered the Manager’s investment process and capabilities managing assets and the Manager’s specific responsibilities in all aspects of day-to-day management of the Fund’s assets, as well as the qualification, experience and responsibilities of the person who serves as the portfolio manager for the Alternative Strategies Fund.
361
| Board Approval of Management Agreement and Investment Advisory Agreements |
| (unaudited) (continued) |
The Independent Trustees also discussed the acceptability of the terms of the Management Agreement, IM Agreement and Sub-Advisory Agreements. The Independent Trustees considered the Manager’s favorable assessment of the nature and quality of the sub-advisory services provided to the Funds by the Sub-advisers. The Board also reviewed information received from the Manager and the Trust’s Chief Compliance Officer regarding the Trust’s compliance policies and procedures established pursuant to Rule 38a-1 under the 1940 Act, including those specific to the Manager providing day-to-day management of the Alternative Strategies Fund’s assets, and those of each Sub-adviser.
During the course of the year and at the May Meeting, the Board reviewed the qualifications, backgrounds and responsibilities of the Trust’s senior personnel and the portfolio management team primarily responsible for the management of the Funds and the selection and evaluation of Sub-Advisers. In addition, the Independent Trustees discussed with representatives of management the portfolio management strategy of the Alternative Strategies Fund’s portfolio manager. The Board also considered the Manager’s and the Sub-advisers’ brokerage policies and practices, transaction execution standards, policies and practices regarding soft dollars, and quality controls applicable to brokerage allocation procedures.
The Board concluded that, overall, the nature, extent and quality of services provided (and expected to be provided) under the Management Agreement, IM Agreement and Subadvisory Agreements were adequate and appropriate.
Fund Performance
As to each Fund, the Board received and considered performance information for the Fund and for all retail and institutional funds, regardless of asset size or primary channel of distribution, in the Fund’s Lipper category (the “Performance Universe”) selected by Broadridge Financial Solutions Inc. (“Broadridge”), an independent provider of investment company data based on classifications provided by Thomson Reuters Lipper. As to each Fund, the Board was provided with a description of the methodology Broadridge used to determine the similarity of the Fund with the funds included in the Fund’s Performance Universe. It was noted that, while the Board has found the Broadridge data generally useful, the Trustees recognized the limitations of such data, including that the data may vary depending on the end date selected and that the results of the performance comparisons may vary depending on the selection of the peer group and its composition over time. The Board also noted that it had received and discussed with advisory personnel of the Trust at periodic intervals throughout the year information on the investment performance of each Fund in comparison to similar mutual funds and benchmark performance indices. As to each Sub-adviser, the Board received and considered performance information provided by the Manager for the Sub-adviser managing the portion of the respective Fund’s assets allocated to it. In addition, the Board considered the Funds’ performance in light of overall financial market conditions. The information comparing each Fund’s performance to that of its Performance Universe (except as noted below) was for the one-, three-, five- and ten-year periods ended March 31, 2021.
The Board noted that the Large Cap Equity Fund performed above the median performance of the funds in the Performance Universe for each period. The Board noted that Small-Mid Cap Equity Fund performed better than the median performance of the funds in the Performance Universe for each period (and was ranked in the first quintile for the three- and five-year periods), except for the one-year period where it performed below the median performance of the funds in the Performance Universe. The Board further noted that the International Equity Fund performed above the median performance of the funds in the Performance Universe for each period (and was ranked in the first quintile for the one-year period), except for the ten-year period where it performed slightly below the median performance of the funds in the Performance Universe. With respect to the Emerging Markets Equity Fund, the Board noted that the Fund performed below the median performance of the funds in its Performance Universe for each period. The Trustees then discussed with representatives of management the portfolio management strategy of the Funds’ Sub-advisers and the reasons for certain Funds’ underperformance versus the Performance Universe during certain of the periods under review. Based on its review and discussions with management, as to the Large Cap Equity Fund, Small-Mid Cap Equity Fund and International Equity Fund, the Board was satisfied with the overall performance of the Funds and the performance of the Funds’ Sub-advisers, and with the Adviser’s evaluation of the Emerging Markets Equity Fund’s underperforming its Performance Universe during the periods under review.
The Board noted that the Core Fixed Income Fund performed above the median performance of the funds in the Performance Universe for each period, except for the one-year period where it performed below the median performance of the funds in the Performance Universe. The Board further noted that the International Fixed Income Fund performed above the median performance of the funds in its Performance Universe for each period (and was ranked in the first quintile for the five- and ten-year
362
| Board Approval of Management Agreement and Investment Advisory Agreements |
| (unaudited) (continued) |
periods), except for the one-year period where it performed below the median performance of the funds in the Performance Universe. With respect to each of the High Yield Fund and Municipal Bond Fund, the Board noted that the Funds performed below the median performance of the funds in their respective Performance Universe for each period. With respect to the Inflation-Linked Fixed Income Fund, the Board noted that the Fund performed better than the median performance of the funds in its Performance Universe for the one-, three- and five-year periods, the only periods of performance information provided by Broadridge as the Fund commenced operations on March 8, 2016. With respect to the Ultra-Short-Term Fund, the Board noted that the Fund performed above the median performance of the funds in its Performance Universe for the one-, three- and five-year periods, the only periods of performance information provided by Broadridge as the Fund commenced operations on March 8, 2016. The Trustees then discussed with representatives of management the portfolio management strategy of the Funds’ Sub-advisers and the reasons for certain Funds’ underperformance versus the respective Performance Universe during certain of the periods under review. Based on its review and discussions with management, as to the Core Fixed Income Fund, International Fixed Income Fund, Inflation-Linked Fixed Income Fund and Ultra-Short-Term Fund, the Board was satisfied with the overall performance of the Funds and the performance of the Funds’ Sub-advisers. With respect to each of the High Yield Fund and Municipal Bond Fund, the Board noted the recent additions of new Sub-advisers for the High Yield Fund and Municipal Bond Fund.
In addition, the Board noted that the Alternative Strategies Fund performed better than the median performance of the funds in the Performance Universe for the one- and three-year periods, the only periods of performance information provided by Broadridge as the Fund commenced operations on February 15, 2018. As to the Alternative Strategies Fund, based on its review and discussions with management, and noting the limited period of performance data available from Broadridge, the Board was satisfied with the overall performance of the Fund.
The Trustees determined to continue to evaluate the Funds’ performance and that of their respective Sub-advisers, as applicable, and to continue to periodically review Fund performance with the Manager.
Management Fees and Expense Ratios
As to each Fund, the Board reviewed and considered the contractual management fee rate (“Contractual Management Fee”) payable by the Fund to the Manager in light of the nature, extent and quality of the management and sub-advisory services provided by the Manager and the Sub-advisers, respectively. The Board also reviewed and considered the actual management fee rate (“Actual Management Fee”) paid by the Fund over the Fund’s last fiscal year which included reductions for fee waiver and/or expense reimbursement arrangements that were in effect for the Fund, which reduced the management fee paid to the Manager. The Board noted that the compensation paid to the Sub-advisers is paid by the Manager, not the applicable Funds, and, accordingly, that the retention of the Sub-advisers does not increase the fees or expenses otherwise incurred by such Funds and their shareholders. The Board also reviewed with management the scope of services provided to the Funds by the Manager, noting that the Funds are provided with regulatory compliance services, office facilities and Trust officers (including the Trust’s chief financial, chief legal and chief compliance officers), and that the Manager coordinates and oversees the provision of services to each Fund by other fund service providers, including the Sub-advisers. The Board also considered and discussed information about the Sub-advisers’ fees and comparable information for other sub-advised funds and accounts managed by the Sub-advisers.
Additionally, the Board received and considered information comparing each Fund’s Contractual Management Fee and Actual Management Fee and the Fund’s actual total expenses with those of a group of funds selected by Broadridge as comparable to the particular Fund (the “Expense Group”) and a broader group of retail no-load funds selected by Broadridge (the “Expense Universe”). It was noted that while the Board found the Broadridge data generally useful they recognized its limitations, including that the data may vary depending on the selection of the peer group.
The information reviewed showed that the Contractual and Actual Management Fees of the Large Cap Equity Fund, Small-Mid Cap Equity Fund, Emerging Markets Equity Fund and Core Fixed Income Fund were lower than the median Contractual and Actual Management Fees for the funds in the applicable Expense Group, and that the Actual Management Fees were lower than the average Actual Management Fees for the funds in the applicable Expense Universe for each of these Funds, except for the Core Fixed Income Fund where the Actual Management Fee was slightly above the average for the funds in its Expense Universe. The information reviewed showed that the Contractual Management Fee of the International Equity Fund, High Yield Fund and Alternative Strategies Fund were higher than the median Contractual Management Fee for the funds in their respective Expense
363
| Board Approval of Management Agreement and Investment Advisory Agreements |
| (unaudited) (continued) |
Group, but that the Funds’ Actual Management Fees were lower than the median Actual Management Fees for the funds in their respective Expense Group and were lower than the average Actual Management Fees for the funds in their respective Expense Universe.
With respect to the Alternative Strategies Fund, the Independent Trustees noted that the Manager was waiving the entire management fee and determined that the Contractual Management Fee payable to the Manager with respect to the Fund was for services provided in addition to, and not duplicative of, services provided under the advisory contracts of the underlying funds in which the Fund invested. The information reviewed also showed that the Contractual and Actual Management Fees of the Inflation-Linked Fixed Income Fund, Ultra-Short Term Fixed Income Fund, Municipal Bond Fund and International Fixed Income Fund were higher than the median Contractual and Actual Management Fees for the funds in the applicable Expense Group, and that the Funds’ Actual Management Fees were higher than the average Actual Management Fees for the funds in the applicable Expense Universe.
The Independent Trustees also noted that the Broadridge expense information showed that the actual total expense ratio for each of the Large Cap Equity Fund, Small-Mid Cap Equity Fund, International Equity Fund, Emerging Markets Equity Fund, Core Fixed Income Fund and Alternative Strategies Fund was lower than the median expense ratios of the funds in its respective Expense Group. The Broadridge expense information also showed that the actual total expense ratios for the High Yield Fund, Inflation-Linked Fixed Income Fund, International Fixed Income Fund, Municipal Bond Fund and Ultra-Short Term Fixed Income Fund were higher than the median expense ratios of the funds in their respective Expense Groups. The Board determined that, as to each Fund, the management fee paid by the Fund to the Manager and the sub-advisory fees paid by the Manager to the Sub-advisers, as applicable, were reasonable in light of comparative performance and expense information and the nature, extent and quality of the services provided to the Fund under the Agreements.
Manager Profitability
The Board received and considered a profitability analysis of the Manager and its affiliates in providing services to the Funds. In addition, the Board received information with respect to the Manager’s allocation methodologies used in preparing this profitability data. To the extent available, the Board also reviewed information provided by the Sub-advisers with respect to the relevant Sub-adviser’s profitability in providing sub-advisory services to the Funds. The Board also noted the profitability percentage ranges determined by appropriate court cases to be reasonable given the services rendered to investment companies. As to each Fund, the Board determined that the Manager’s profitability was not excessive in light of the nature, extent and quality of the services provided to the Fund.
Economies of Scale
As to each Fund, the Board considered information regarding whether there have been economies of scale with respect to the management of the Fund, whether the Fund has appropriately benefited from any economies of scale and whether there is potential for realization of any further economies of scale. The Board considered the various ways economies of scale could be realized and shared with Fund investors, and whether economies of scale in the provision of services to the Fund were being passed along to the shareholders. As to each Fund, the Board also noted that to the extent the Fund’s assets increase over time, the Fund and its shareholders should realize economies of scale as certain expenses, such as fixed fund fees, become a smaller percentage of overall assets. The Board noted that it appeared that the benefits of any economies of scale also would be appropriately shared with shareholders through increased investment in fund management resources.
Other Benefits to the Manager and the Sub-advisers
As to each Fund, the Board considered other benefits received by the Manager, the Sub-advisers and their affiliates as a result of their relationship with the Funds, including soft dollar arrangements, receipt of brokerage and the opportunity to offer additional products and services to Fund shareholders.
In light of the Manager’s costs of providing investment management and other services to the Funds and the Manager’s ongoing commitment to the Funds and each Sub-adviser’s day-to-day management of the portion of the respective Fund’s assets allocated to it, the profits and ancillary benefits that the Manager, the Sub-advisers and their affiliates received were considered reasonable.
364
| Board Approval of Management Agreement and Investment Advisory Agreements |
| (unaudited) (continued) |
Based on their discussions and considerations, including those described above, the Board approved the Management Agreement, the IM Agreement and the Subadvisory Agreements to continue for another year. No single factor reviewed by the Board was identified by the Board as the principal factor in determining whether to approve the Agreements.
*******
TRUSTEES AND OFFICERS OF THE TRUST
The Trust’s Board of Trustees (“Board” or “Trustees”) is responsible for overseeing the Trust’s management and operations. The Board approves all significant agreements between the Trust and the companies that furnish services to the Funds, including agreements with the Trust’s distributor, Sub-advisers, custodian, transfer agent and administrator. The Board elects officers who are responsible for the day-to-day operations of the Trust and the Funds and who execute policies authorized by the Board.
Consulting Group Advisory Services LLC (“CGAS” or “Manager”), a business of Morgan Stanley Wealth Management, serves as the investment adviser for each Fund. The Funds employ a “multi-manager” strategy. The Manager selects and oversees professional money managers (each a “Sub-adviser,” collectively, the “Sub-advisers”) who are responsible for investing the assets of the Funds allocated to them. In addition to investment management services, the Manager monitors and supervises the services provided to the Trust by its administrator. The Manager also is responsible for conducting all operations of the Trust, except those operations contracted to the Sub-advisers, the custodian, the transfer agent and the administrator.
The names of the Trustees and officers of the Trust, their addresses and years of birth, together with information as to their principal business occupations and, for the Trustees, other board memberships they have held during the past five years, are set forth below. The executive officers of the Trust are employees of organizations that provide services to the Funds.
365
| Additional Information |
| (unaudited) |
Trustees and Officers of the Trust
The Trust’s Board of Trustees (“Board” or “Trustees”) is responsible for overseeing the Trust’s management and operations. The Board approves all significant agreements between the Trust and the companies that furnish services to the Funds, including agreements with the Trust’s distributor, Sub-advisers, custodian, transfer agent and administrator. The Board elects officers who are responsible for the day-to-day operations of the Trust and the Funds and who execute policies authorized by the Board.
Consulting Group Advisory Services LLC (“CGAS” or “Manager”), a business of Morgan Stanley Wealth Management, serves as the investment adviser for each Fund. The Funds employ a “multi-manager” strategy. The Manager selects and oversees professional money managers (each a “Sub-adviser,” collectively, the “Sub-advisers”) who are responsible for investing the assets of the Funds allocated to them. In addition to investment management services, the Manager monitors and supervises the services provided to the Trust by its administrator. The Manager also is responsible for conducting all operations of the Trust, except those operations contracted to the Sub-advisers, the custodian, the transfer agent and the administrator.
The names of the Trustees and officers of the Trust, their addresses and years of birth, together with information as to their principal business occupations and, for the Trustees, other board memberships they have held during the past five years, are set forth below. The executive officers of the Trust are employees of organizations that provide services to the Funds.
Name, Address and | Position(s) | Term of Office | Principal Occupation(s) | Number of Funds in Fund Complex Overseen by Trustee | Other Board | |||||||
INDEPENDENT TRUSTEES | ||||||||||||
Mark J. Reed 2000 Westchester Avenue Purchase, NY 10577 Birth Year: 1964 | Trustee | Since 2007 | Principal and Portfolio Manager, North American Management Corp. (Investment Advisory) (2013-present); and formerly, Managing Director and Chief Compliance Officer, Bush O’Donnell Investment Advisors, Inc. (Registered Investment Advisor) (1988-2013) | 11 | None | |||||||
Adela Cepeda 2000 Westchester Avenue Purchase, NY 10577 Birth Year: 1958 | Chair and Trustee | Since 2008 (Chair since 2021) | Managing Director, PFM Financial Advisors, LLC (Financial Advisory) (2016-December 2019); and formerly, President, A.C. Advisory, Inc. (Financial Advisory) (1995-September 2016) | 11 | Director, BMO Financial Corp. (2012-present); Trustee, Mercer Funds (2005-present); Trustee, UBS Funds (2004-present); and formerly, Director, Fort Dearborn Income Securities (2000-August 2016) | |||||||
366
| Additional Information |
| (unaudited) (continued) |
Name, Address and | Position(s) | Term of Office | Principal Occupation(s) | Number of Funds in Fund Complex Overseen by Trustee | Other Board | |||||||
W. Thomas Matthews 2000 Westchester Avenue Purchase, NY 10577 Birth Year: 1949 | Trustee | Since 2009 (Interested Trustee from 2006-2009) | Retired; Advisor, Smith Barney (2005-2007) | 11 | Chairman Emeritus, Congressional Medal of Honor Foundation (2009-present); formerly Treasurer (2009-2016); and Chairman Emeritus, America’s Warrior Partnership (2017-present), formerly, Chairman (2013-2016) and Director (2013-2017) | |||||||
Eric T. McKissack, CFA® 2000 Westchester Avenue Purchase, NY 10577 Birth Year: 1953 | Vice Chair and Trustee | Since 2013 (Vice Chair since 2021) | Founder and Chief Executive Officer Emeritus, Channing Capital Management, LLC (Investment Management) (2017-December 2019); and formerly, Chief Executive Officer, Channing Capital Management, LLC (2004-2017) | 11 | Trustee and Chairman, FlexShares Funds (2011-present); Trustee, The Art Institute of Chicago (2001-present); and Director, Urban Gateways (1995-present) | |||||||
Teresa S. Westbrook 2000 Westchester Avenue Purchase, NY 10577 Birth Year: 1959 | Trustee | Since 2020 | CPA/ Partner, Deloitte & Touche LLP (1999-2015) | 11 | None | |||||||
INTERESTED TRUSTEE | ||||||||||||
Paul Ricciardelli** Morgan Stanley 522 Fifth Avenue, New York, NY 10036 Birth Year: 1969 | Trustee and Chief Executive Officer and President | Since April 2017 | Head of IAR/GIMA, Morgan Stanley (2011-present); Head of Wealth Advisory Solutions, Morgan Stanley (March 2017-present); and formerly, Head of Manager Solutions, Morgan Stanley (2015-March 2017) | 11 | None | |||||||
367
| Additional Information |
| (unaudited) (continued) |
Name, Address and | Position(s) | Term of Office*** | Principal Occupation(s) During Past Five Years | |||
OFFICERS | ||||||
Francis Smith Morgan Stanley 522 Fifth Avenue, New York, NY 10036 Birth Year: 1965 | Chief Financial Officer and Treasurer | Since 2014 | Managing Director, Morgan Stanley (2017-present); formerly Executive Director, Morgan Stanley (2001-2016); and Treasurer and Principal Financial Officer of various Morgan Stanley Funds (2003-present) | |||
Eric Metallo Morgan Stanley 1633 Broadway, New York, NY 10019 Birth Year: 1976 | Chief Legal Officer and Secretary | Since August 2015 | Executive Director, Morgan Stanley Wealth Management (2014-present); and formerly Senior Vice President and Associate General Counsel, PineBridge Investments (2011-2014) | |||
Joseph Signora Morgan Stanley 2000 Westchester Avenue Purchase, NY 10577 Birth Year: 1977 | Chief Compliance Officer | Since December 2017 | Executive Director, Morgan Stanley (2017-present); formerly, Senior Director, AXA Equitable (2015-2017); Vice President, EQ Advisors Trust (2015-2017); Vice President, AXA Premier VIP Trust (2015-2017); Vice President, 1290 Funds (2015-2017); Vice President, FMG LLC (2015-2017); Deputy Chief Compliance Officer, Emerging Global Advisors (2014-2015); Chief Compliance Officer, EGA Emerging Global Shares Trust (2014-2015); and Chief Compliance Officer, EGA Frontier Diversified Core Fund (2014-2015) | |||
Sara Cetron Morgan Stanley 2000 Westchester Avenue Purchase, NY 10577 Birth Year: 1980 | Chief Administrative Officer | Since March 2017 | Vice President, Morgan Stanley (2015-present); and formerly Platform Management, Managed Solutions, Barclays Capital Inc. (2008-2015) | |||
Robert Garcia Morgan Stanley 522 Fifth Avenue, 14th Floor New York, NY 10036 Birth Year: 1983 | Chief Operating Officer Investment Officer Co-Chief Operating Officer | Since May 2016 Since July 2015 August 2015-May 2016 | Head of Operations and Strategy, Morgan Stanley (2017-present); Head of Portfolio Operations-WMIR, Morgan Stanley (2016-present); Head of Packaged Digital Solutions, Morgan Stanley (2015-present); and formerly Head of Strategy and Development-Global Investment Solutions, Morgan Stanley (2013-2015) | |||
Zachary Apoian Morgan Stanley 522 Fifth Avenue, New York, NY 10036 Birth Year: 1979 | Investment Officer | Since May 2019 | Executive Director, Morgan Stanley Wealth Management (2019-present); formerly, Private Wealth Advisor, Morgan Stanley Wealth Management (2017-2019); and Executive Director, Morgan Stanley Wealth Management (2014-2017) | |||
368
| Additional Information |
| (unaudited) (continued) |
Name, Address and | Position(s) | Term of Office*** | Principal Occupation(s) During Past Five Years | |||
Franceen Jansen Morgan Stanley 522 Fifth Avenue, 12th Floor New York, NY 10036 Birth Year: 1959 | Investment Officer | Since August 2015 | Executive Director, Morgan Stanley (2010-present) | |||
Brian Mulley Morgan Stanley 522 Fifth Avenue, 14th Floor New York, NY 10036 Birth Year: 1977 | Investment Officer | Since August 2015 | Investment Analyst, Executive Director, Morgan Stanley (2005-present) | |||
Sukru Saman Morgan Stanley 522 Fifth Avenue, 14th Floor New York, NY 10036 Birth Year: 1972 | Investment Officer | Since August 2015 | Investment Officer, Morgan Stanley Wealth Management (2013-present) | |||
Lisa Shalett Morgan Stanley 522 Fifth Avenue, New York, NY 10036 Birth Year: 1963 | Investment Officer | Since August 2015 | Head of Investment and Portfolio Strategies, Morgan Stanley (2013-present) | |||
James Totino Morgan Stanley 522 Fifth Avenue, 14th Floor New York, NY 10036 Birth Year: 1970 | Investment Officer | Since May 2018 | Portfolio Specialist, Investment Officer, Morgan Stanley (2018-present); and formerly Investment Officer, Morgan Stanley (2011-2018) | |||
Todd McElduff Morgan Stanley 1633 Broadway, New York, NY 10019 Birth Year: 1977 | Anti-Money Laundering (“AML”) Compliance Officer | Since September 2019 | Head of Bank & WM AML Advisory, Morgan Stanley (2019-present); formerly, Head of Bank AML Advisory, Morgan Stanley (2017-2019); and Head of GFC US Investigations, Morgan Stanley (2014-2017) | |||
James J. Tracy Morgan Stanley 2000 Westchester Avenue Purchase, NY 10577 Birth Year: 1957 | Product Management Officer Trustee Chief Executive Officer and President | Since May 2016 2013-2015 2013-2015 | Managing Director, Head of Consulting Group and Graystone Consulting (2018-present); Managing Director, Director of Consulting Group and Practice Management (2016-2018); Managing Director, Vice Chairman of Wealth Management (2015); and Managing Director, Director of Consulting Group Wealth Advisory Solutions (2012-2015) | |||
369
| Additional Information |
| (unaudited) (continued) |
Name, Address and | Position(s) | Term of Office*** | Principal Occupation(s) During Past Five Years | |||
Steven Ross Morgan Stanley 522 Fifth Avenue, New York, NY 10036 Birth Year: 1971 | Assistant Treasurer | Since 2014 | Executive Director, Morgan Stanley (2013-present) | |||
Suzan M. Barron Brown Brothers Harriman & Co. (“BBH&Co.”) 50 Post Office Square Boston, MA 02110 Birth Year: 1964 | Assistant Secretary | Since 2011 | Senior Vice President and Senior Investor Services Counsel, Corporate Secretary Legal Administration Practice of Fund Administration, BBH&Co. (2005-present); Secretary, BBH Trust (2009-present) | |||
| * | Each Trustee remains in office until he or she resigns, retires or is removed. |
| ** | Mr. Ricciardelli is an “interested person” of the Trust as defined in the 1940 Act because of his position with Morgan Stanley. |
| *** | The President, Treasurer and Secretary hold office until their respective successors are chosen and qualified or until he or she sooner dies, resigns, is removed or becomes disqualified. Each of the other officers serves at the pleasure of the Board. |
370
| Important Tax Information |
| (unaudited) |
The following information is provided with respect to the distributions paid during the taxable year ended August 31, 2021:
| Large Cap Equity Fund | Small-Mid Cap Equity Fund | International Equity Fund | Emerging Markets Equity Fund | Core Fixed Income Fund | ||||||||||||||||
Record Date | 12/4/2020 | 12/4/2020 | 12/4/2020 | 12/4/2020 | Monthly | |||||||||||||||
Payable Date | 12/7/2020 | 12/7/2020 | 12/7/2020 | 12/7/2020 | Monthly | |||||||||||||||
Ordinary Income: | ||||||||||||||||||||
Qualified Dividend Income for Individuals | 83.68 | % | 32.21 | % | 93.58 | % | 65.41 | % | 0.00 | % | ||||||||||
Dividends Qualifying for the Dividends Received: | — | |||||||||||||||||||
Deduction for Corporations | 83.26 | % | 30.77 | % | 0.27 | % | 0.08 | % | 0.00 | % | ||||||||||
Foreign Source Income | — | — | 99.74 | %* | 99.95 | %* | — | |||||||||||||
Foreign Tax Paid par Share | — | — | 0.025338 | 0.040055 | ||||||||||||||||
Interest from Federal Obligations | — | — | — | — | 7.97 | % | ||||||||||||||
Long-term Capital Gain Dividend | 0.573371 | 0.425084 | — | — | 0.172538 | |||||||||||||||
| High Yield Fund | International Fixed Income Fund | Municipal Bond Fund | Inflation-Linked Fixed Income Fund | Ultra-Short Term Fixed Income Fund | ||||||||||||||||
Record Date | Monthly | 12/4/2020 | Monthly | Monthly | Monthly | |||||||||||||||
Payable Date | Monthly | 12/7/2020 | Monthly | Monthly | Monthly | |||||||||||||||
Ordinary Income: | ||||||||||||||||||||
Qualified Dividend Income for Individuals | 0.67 | % | 0.00 | % | 0.00 | % | 0.00 | % | 0.00 | % | ||||||||||
Dividends Qualifying for the Dividends Received: | ||||||||||||||||||||
Deduction for Corporations | 0.71 | % | 0.00 | % | 0.00 | % | 0.00 | % | 0.00 | % | ||||||||||
Interest from Tax-Exempt Obligations | — | — | 100.00 | % | — | — | ||||||||||||||
Interest from Federal Obligations | — | 2.55 | % | — | 69.17 | % | 3.12 | % | ||||||||||||
Long-term Capital Gain Dividend | — | 0.059568 | 0.048255 | — | — | |||||||||||||||
| Alternative Strategies Fund | ||||||||||||||||||||
Record Date | 12/30/2020 | |||||||||||||||||||
Payable Date | 12/30/2020 | |||||||||||||||||||
Ordinary Income: | ||||||||||||||||||||
Qualified Dividend Income for Individuals | 10.36 | % | ||||||||||||||||||
Dividends Qualifying for the Dividends Received: | ||||||||||||||||||||
Deduction for Corporations | 0.00 | % | ||||||||||||||||||
Foreign Source Income | — | |||||||||||||||||||
Foreign Tax Paid par Share | — | |||||||||||||||||||
Federal Interest | — | |||||||||||||||||||
Long-term Capital Gain Dividend | — | |||||||||||||||||||
| * | Expressed as a percentage of the cash distribution grossed-up for foreign taxes. |
The law varies in each state as to whether and what percentage of dividend income attributable to Federal obligations is exempt from state income tax. We recommend that you consult with your tax adviser to determine if any portion of the dividends you received is exempt from state income taxes.
The foreign taxes paid represent taxes incurred by the Fund on income received by the Fund from foreign sources. Foreign taxes paid may be included in taxable income with an offsetting deduction from gross income or may be taken as a credit for taxes paid to foreign governments. You should consult your tax adviser regarding the appropriate treatment of foreign taxes paid.
Please retain this information for your records.
371
MORGAN STANLEY SMITH BARNEY LLC
Distributor
CONSULTING GROUP ADVISORY SERVICES LLC
Investment Adviser
This report is submitted for the general information of the shareholders of Morgan Stanley Pathway Funds. It is not authorized for distribution to prospective investors unless accompanied or preceded by a current Prospectus for the Trust which contains information concerning the Trust’s Investment policies, charges and expenses as well as other pertinent information.
The Funds file their complete schedule of portfolio holdings with the Securities and Exchange Commission (“SEC”) for the first and third quarters as an attachment to Form N-Port. Morgan Stanley does not deliver the reports for the first and third fiscal quarters to shareholders, but makes the complete schedule of portfolio holdings for the funds’ first and third quarters available on its public website. You may obtain the Form N-PORT filings by accessing the SEC’s website, www.sec.gov. For additional information, shareholders can call 1-888-454-3965 (“ask for Consulting Group”).
Information on how the Funds voted proxies relating to portfolio securities during the most recent 12-month period ended June 30 and a description of the policies and procedures that the Funds use to determine how to vote proxies relating to portfolio securities is available (1) without charge, upon request, by calling 1-888-454-3965 (ask for “Consulting Group”), (2) on the Funds’ website at www.morganstanley.com/wealth-investmentsolutions/cgcm and (3) on the SEC’s website at www.sec.gov.
© 2021 Morgan Stanley Smith Barney LLC (“Morgan Stanley”). Consulting Group Advisory Services LLC (“CGAS”) is a business of Morgan Stanley. Securities are offered through Morgan Stanley.
Morgan Stanley Pathway Funds
2000 Westchester Avenue
Purchase, NY 10577
ITEM 2. CODE OF ETHICS.
As of the period ended August 31, 2021 (“Reporting Period”), the Registrant has adopted a code of ethics (“Code”) that applies to the Registrant’s principal executive officer, principal financial officer, principal accounting officer or controller, or persons performing similar functions, regardless of whether these individuals are employed by the Registrant or a third party. The Registrant has not amended any provision in its Code that relates to an element of the Code’s definitions enumerated in paragraph (b) of Item 2 of this Form N-CSR. A copy of this Code is filed as an Exhibit to this Form N-CSR pursuant to Item 13(a)(1).
The Registrant has not granted any waiver, including any implicit waiver, from a provision of its Code to the Registrant’s principal executive officer, principal financial officer, principal accounting officer or controller, or persons performing similar functions, regardless of whether these individuals are employed by the Registrant or a third party.
ITEM 3. AUDIT COMMITTEE FINANCIAL EXPERT.
The Board of Trustees of the Registrant has determined that Teresa S. Westbrook possesses the attributes identified in Instruction (b) of Item 3 to Form N-CSR to qualify as an “audit committee financial expert,” and has designated Ms. Westbrook as the Registrant’s audit committee financial expert. Ms. Westbrook is an “independent” Trustee pursuant to paragraph (a)(2) of Item 3 to Form N-CSR.
ITEM 4. PRINCIPAL ACCOUNTANT FEES AND SERVICES.
AUDIT FEES –
(a) Audit Fees. The aggregate fees billed for each of the last two fiscal years ended August 31, 2021 and August 31, 2020 for professional services rendered by the Registrant’s principal accountant (“Auditor”) for the audit of the Registrant’s annual financial statements, or services that are normally provided by the Auditor in connection with the statutory and regulatory filings or engagements for each of the last two fiscal years, were $626,080 in 2021 and $626,080 in 2020.
(b) Audit-Related Fees. The aggregate fees billed for each of the last two fiscal years ended August 31, 2021, and August 31, 2020, for assurance and related services by the Auditor that were reasonably related to the performance of the audit of the Registrant’s financial statements and were not reported under paragraph (a) of this Item 4, were $0 in 2021 and $0 in 2020
(c) Tax Fees. The aggregate fees billed for each of the last two fiscal years ended August 31, 2021 and August 31, 2020 for professional services rendered by the Auditor for tax compliance, tax advice and tax planning (“Tax Services”) were $0 in 2021 and $0 in 2020. These services consisted of (i) review or preparation of U.S. federal, state, local and excise tax returns; (ii) U.S. federal, state and local tax planning, advice and assistance regarding statutory, regulatory or administrative developments, and (iii) tax advice regarding tax qualification matters and/or treatment of various financial instruments held or proposed to be acquired or held.
(d) All Other Fees. The aggregate fees billed for each of the last two fiscal years ended August 31, 2021, and August 31, 2020, for products and services provided by the Auditor to the Registrant, other than the services reported in paragraphs (a) through (c) of this Item 4, were $0 for 2021 and $0 for 2020.
(e)(1) The Charter for the Audit Committee (“Committee”) of the Morgan Stanley Pathway Funds provides that the Committee may delegate its responsibility to approve any such audit and permissible non-audit services to a sub-committee consisting of the Chairperson of the Committee (“Chairperson”) and at least one other member of the Committee as the Chairperson, from time to time, may determine and appoint, and such sub-committee shall report to the Committee, at its next meeting after the sub-committee’s meeting, its decision(s). From year to year, and at such other times as the Committee deems appropriate, the Committee shall report to the Board whether this system of approval has been effective and efficient or whether this Charter should be amended to allow for pre-approval pursuant to such policies and procedures as the Committee shall approve, including the delegation of some or all of the Committee’s pre-approval responsibilities to other persons (other than the Adviser or the Trust’s officers).
(e)(2) The percentage of services described in each of paragraphs (b) through (d) of this Item that were approved by the audit committee pursuant to paragraph (c)(7)(i)(c) of Rule 2-01 of Regulation S-X, with respect to: Audit-Related Fees were 0% for 2021 and 0% for 2020; Tax Fees were 0% for 2021 and 0% for 2020; and Other Fees were 0% for 2021 and 0% for 2020.
(f) Not Applicable.
(g) Aggregate non-audit fees billed by the Auditor for services rendered to the Registrant and the Registrant’s investment adviser (not including any sub-adviser whose role is primarily portfolio management as is subcontracted with or overseen by another investment adviser), and any entity controlling, controlled by, or under common control with the adviser that provides ongoing services to the Registrant of each of the last two fiscal years of the Registrant (“Service Affiliates”) were $0 for 2021 and $0 in 2020.
(h) The Registrant’s Audit Committee has considered whether the provision of non-audit services that were rendered to Service Affiliates that were not pre-approved pursuant to paragraph (c)(7)ii of Rule 2-01 of Regulation S-X is compatible with maintaining the Auditor’s independence.
(i) Not Applicable.
(j) Not Applicable.
ITEM 5. AUDIT COMMITTEE OF LISTED REGISTRANTS.
Not Applicable.
ITEM 6. INVESTMENTS.
A Schedule of Investments in securities of unaffiliated issuers as of the close of the Reporting Period is included as part of the report to shareholders filed under Item 1 of this Form N-CSR.
ITEM 7. DISCLOSURE OF PROXY VOTING POLICIES AND PROCEDURES FOR CLOSED-END MANAGEMENT INVESTMENT COMPANIES.
Not Applicable.
ITEM 8. PORTFOLIO MANAGERS OF CLOSED-END MANAGEMENT INVESTMENT COMPANIES.
Not Applicable.
ITEM 9. PURCHASES OF EQUITY SECURITIES BY CLOSED-END MANAGEMENT INVESTMENT COMPANIES AND AFFILIATED PURCHASERS.
Not Applicable.
ITEM 10. SUBMISSION OF MATTERS TO A VOTE OF SECURITY HOLDERS.
There have been no material changes to the procedures by which the shareholders may recommend nominees to the Registrant’s board of directors, where those changes were implemented after the Registrant last provided disclosure in response to the requirements of Item 407(c)(2)(iv) of Regulation S-K (as required by Item 22(b)(15) of Schedule 14A (17 CFR 240.14a-101)), or this Item.
ITEM 11. CONTROLS AND PROCEDURES.
(a) The Registrant’s principal executive officer and principal financial officer, or persons performing similar functions, have concluded that the Registrant’s disclosure controls and procedures (as defined in Rule 30a-3(c) under the Investment Company Act of 1940, as amended (17 CFR 270.30a-3(c)) were effective, as of a date within 90 days of the filing date of this report, based on his evaluation of these disclosure controls and procedures as required by Rule 30a-3(b) under the Investment Company Act of 1940, as amended (17 CFR 270.30a-3(b)), and Rules 13a-15(b) or 15d-15(b) under the Securities Exchange Act of 1934, as amended (17 CFR 240.13a-15(b) or 240.15d-15(b)).
(b) There were no changes in the Registrant’s internal control over financial reporting (as defined in Rule 30a-3(d) under the Investment Company Act of 1940, as amended (17 CFR 270.30a-3(d)), that occurred during the Registrant’s second fiscal quarter of the period covered by this report that has materially affected, or is reasonably likely to materially affect, the Registrant’s internal control over financial reporting.
ITEM 12. DISCLOSURE OF SECURITIES LENDING ACTIVITIES FOR CLOSED-END MANAGEMENT INVESTMENT COMPANIES.
Not Applicable.
ITEM 13. EXHIBITS.
SIGNATURES
Pursuant to the requirements of the Securities Exchange Act of 1934 and the Investment Company Act of 1940, the Registrant has duly caused this Report to be signed on its behalf by the undersigned, thereunto duly authorized.
| Morgan Stanley Pathway Funds | ||
| By: | /s/ Paul Ricciardelli | |
| Paul Ricciardelli | ||
| Chief Executive Officer | ||
| Morgan Stanley Pathway Funds | ||
| Date: | November 5, 2021 | |
Pursuant to the requirements of the Securities Exchange Act of 1934 and the Investment Company Act of 1940, this report has been signed below by the following persons on behalf of the Registrant and in the capacities and on the dates indicated.
| By: | /s/ Paul Ricciardelli | |
| Paul Ricciardelli | ||
| Chief Executive Officer | ||
| Morgan Stanley Pathway Funds | ||
| Date: | November 5, 2021 | |
| Morgan Stanley Pathway Funds | ||
| By: | /s/ Francis Smith | |
| Francis Smith | ||
| Chief Financial Officer | ||
| Morgan Stanley Pathway Funds | ||
| Date: | November 5, 2021 | |