UNITED STATES SECURITIES AND EXCHANGE COMMISSION
Washington, D.C. 20549
FORM N-CSR
CERTIFIED SHAREHOLDER REPORT OF REGISTERED MANAGEMENT
INVESTMENT COMPANIES
| Investment Company Act file number: | 811-06324 | |
| Exact name of registrant as specified in charter: | Delaware Group®Global & International Funds | |
| Address of principal executive offices: | 2005 Market Street | |
| Philadelphia, PA 19103 | ||
| Name and address of agent for service: | David F. Connor, Esq. | |
| 2005 Market Street | ||
| Philadelphia, PA 19103 | ||
| Registrant’s telephone number, including area code: | (800) 523-1918 | |
| Date of fiscal year end: | November 30 | |
| Date of reporting period: | November 30, 2019 |
Item 1. Reports to Stockholders
Table of Contents
 |  |
Annual report
Global / international equity mutual funds
Delaware Emerging Markets Fund
Delaware Global Value Fund
Delaware International Small Cap Fund
Delaware International Value Equity Fund
November 30, 2019
Beginning on or about June 1, 2021, as permitted by regulations adopted by the Securities and Exchange Commission, paper copies of your Fund’s shareholder reports will no longer be sent to you by mail, unless you specifically request them from the Fund or from your financial intermediary, such as a broker/dealer, bank, or insurance company. Instead, you will be notified by mail each time a report is posted on the website and provided with a link to access the report.
If you already elected to receive shareholder reports electronically, you will not be affected by this change and you do not need to take any action. You may elect to receive shareholder reports and other communications from the Fund electronically by signing up at delawarefunds.com/edelivery. If you own these shares through a financial intermediary, you may contact your financial intermediary.
You may elect to receive paper copies of all future shareholder reports free of charge. You can inform the Fund that you wish to continue receiving paper copies of your shareholder reports by contacting us at 800523-1918. If you own these shares through a financial intermediary, you may contact your financial intermediary to elect to continue to receive paper copies of your shareholder reports. Your election to receive reports in paper will apply to all funds held with the Delaware Funds® by Macquarie or your financial intermediary.
|
Carefully consider the Funds’ investment objectives, risk factors, charges, and expenses before investing. This and other information can be found in the Funds’ prospectus and their summary prospectuses, which may be obtained by visiting delawarefunds.com/literature or calling 800523-1918. Investors should read the prospectus and the summary prospectus carefully before investing.
You can obtain shareholder reports and prospectuses online instead of in the mail. Visit delawarefunds.com/edelivery.
Table of Contents
Experience Delaware Funds®by Macquarie
Macquarie Investment Management (MIM) is a global asset manager with offices in the United States, Europe, Asia, and Australia. As active managers we prioritize autonomy and accountability at the investment team level in pursuit of opportunities that matter for clients. Delaware Funds is one of the longest-standing mutual fund families, with more than 80 years in existence.
If you are interested in learning more about creating an investment plan, contact your financial advisor.
You can learn more about Delaware Funds or obtain a prospectus for Delaware Emerging Markets Fund, Delaware Global Value Fund, Delaware International Small Cap Fund, and Delaware International Value Equity Fund at delawarefunds.com/literature.
Manage your account online
| ● | Check your account balance and transactions |
| ● | View statements and tax forms |
| ● | Make purchases and redemptions |
Visit delawarefunds.com/account-access.
Macquarie Asset Management (MAM) offers a diverse range of products including securities investment management, infrastructure and real asset management, and fund and equity-based structured products. MIM is the marketing name for certain companies comprising the asset management division of Macquarie Group. This includes the following investment advisers: Macquarie Investment Management Business Trust (MIMBT), Macquarie Funds Management Hong Kong Limited, Macquarie Investment Management Austria Kapitalanlage AG, Macquarie Investment Management Global Limited, Macquarie Investment Management Europe Limited, Macquarie Capital Investment Management LLC, and Macquarie Investment Management Europe S.A.
The Funds are distributed byDelaware Distributors, L.P. (DDLP), an affiliate of MIMBT and Macquarie Group Limited.
Other than Macquarie Bank Limited (MBL), none of the entities noted are authorized deposit-taking institutions for the purposes of the Banking Act 1959 (Commonwealth of Australia). The obligations of these entities do not represent deposits or other liabilities of MBL. MBL does not guarantee or otherwise provide assurance in respect of the obligations of these entities, unless noted otherwise. The Funds are governed by US laws and regulations.
| Table of contents | ||||
| 1 | ||||
| 13 | ||||
| 29 | ||||
| 33 | ||||
| 41 | ||||
| 58 | ||||
| 64 | ||||
| 68 | ||||
| 76 | ||||
| 111 | ||||
| 137 | ||||
| 138 | ||||
| 146 | ||||
| 156 | ||||
Unless otherwise noted, views expressed herein are current as of Nov. 30, 2019, and subject to change for events occurring after such date.
The Funds are not FDIC insured and are not guaranteed. It is possible to lose the principal amount invested.
Advisory services provided by Delaware Management Company, a series of MIMBT, a US registered investment advisor.
All third-party marks cited are the property of their respective owners.
© 2020 Macquarie Management Holdings, Inc.
Table of Contents
| Portfolio management review | ||
| Delaware Emerging Markets Fund | December 10, 2019 (Unaudited) | |
Performance preview (for the year ended November 30, 2019) | ||||||||
Delaware Emerging Markets Fund (Institutional Class shares) | 1-year return | +9.79% | ||||||
Delaware Emerging Markets Fund (Class A shares) | 1-year return | +9.50% | ||||||
MSCI Emerging Markets Index (net) | 1-year return | +7.28% | ||||||
MSCI Emerging Markets Index (gross) | 1-year return | +7.70% | ||||||
Past performance does not guarantee future results.
For complete, annualized performance for Delaware Emerging Markets Fund, please see the table on page 13. Institutional Class shares are not subject to a sales charge and are offered for sale exclusively to certain eligible investors. In addition, Institutional Class shares pay no distribution and service fee.
The performance of Class A shares excludes the applicable sales charge. Both Institutional Class shares and Class A shares reflect the reinvestment of all distributions.
Please see page 15 for a description of the index. Index performance returns do not reflect any management fees, transaction costs, or expenses. Indices are unmanaged and one cannot invest directly in an index.
Market review
While the MSCI Emerging Markets Index (net) gained 7.28% during the12-month period ended Nov. 30, 2019, emerging markets lagged developed market indices amid ongoing trade tensions and concerns about slowing economic growth. Country-level performance showed a large dispersion. While trade concerns pressured China, the absence thereof in Russia supported strong equity performance. Argentina was by far the weakest performer after surprise primary election results precipitated a severe selloff in both equities and the Argentine peso. Sector performance was mostly positive except for materials and healthcare. (Source: Bloomberg.)
Within the Fund
For the fiscal year ended Nov. 30, 2019, Delaware Emerging Markets Fund outperformed its benchmark, the MSCI Emerging Markets Index (net). The Fund’s Institutional Class shares gained 9.79%. The Fund’s Class A shares advanced 9.50% at net asset value and 3.20% at maximum offer price. These figures reflect all distributions reinvested. During the same period, the Fund’s benchmark gained 7.28%. For complete, annualized performance of Delaware Emerging Markets Fund, please see the table on page 13.
Among countries, Taiwan was the largest contributor to the Fund’s relative performance during the fiscal period due to stock selection.MediaTek Inc.andTaiwan Semiconductor Manufacturing Co. Ltd.benefited from strength in5G-related orders and easing restrictions on Huawei Technologies Co. As mobile technology penetrates more deeply into everyday products, we believe there may be attractive structural growth opportunities for both companies.
In India, stock selection contributed to the Fund’s relative performance during the12-month period. Shares ofReliance Industries Ltd.rose when the company disclosed its intent to become debt-free over the next few years. Reliance Industries also announced a nonbinding agreement to sell a stake in its refining and chemicals businesses. We continue to hold a favorable view as the company focuses on strengthening its burgeoning media and retail businesses.
In Russia, the Fund’s overweight allocation contributed to relative performance during the fiscal year. Russia was one of the strongest-performing emerging markets as investors searched for pockets of insulation fromUS-China trade issues. Shares ofGazprom PJSCrose following its intention to increase the dividend payout ratio and from overall higher energy prices.
1
Table of Contents
Portfolio management review
Delaware Emerging Markets Fund
We continue to view Gazprom favorably given its globally superior extraction costs, inexpensive valuation, and continued improvement in corporate governance.
Brazil also contributed to the Fund’s performance during the12-month period on strong stock selection and the Fund’s overweight allocation. Shares ofB2W Companhia Digitalrose in concert with the improved outlook for Brazil’s economy and positive developments on pension reform. We continue to believe B2W is well positioned for structural growth in Brazil’s ecommerce industry, which is still in its early stages of development. In addition, shares ofBRF S.A.rose as poultry prices benefited from the effect of African swine fever.
Conversely, stock selection in Mexico detracted from the Fund’s relative performance.Grupo Televisa SABdetracted from performance due to softness in advertising. While the stock experienced weakness during the12-month period, we continue to believe that valuations are compelling, underpinned by the cable business.
Stock selection in Argentina contributed to relative performance, but it was overwhelmed by the Fund’s overweight allocation. As previously mentioned, the Argentinian market fell significantly after surprising primary election results led to weakness in the Argentine peso.
South Korea also detracted from relative performance as a result of the Fund’s overweight allocation and stock selection. Shares ofSK Telecom Co. Ltd.weakened as concerns about 5G investment spending weighed on profitability. We continue to believe that the stock’s inexpensive valuations reflect these concerns and that improvement in the company’snon-telecommunications businesses can support profit growth.
While China contributed overall to relative performance during the fiscal period, several of the Fund’s Internet holdings underperformed.
Increased competition for online advertising and concerns about slower economic growth weighed onSINA Corp.,Baidu Inc., andSohu.com Ltd. Despite these concerns, we believe that these companies remain well positioned for long-term consumption growth trends and that valuations are inexpensive.
Among sectors, consumer staples contributed the most to the Fund’s performance, led byWuliangye Yibin Co. Ltd.andKweichow Moutai Co. Ltd.in China. Energy also contributed to performance, with strong results from Reliance Industries in India and from Gazprom,Rosneft Oil Co. PJSC,andLUKOIL PJSCin Russia. In contrast, communication services detracted the most from the Fund’s relative performance, led by several of the Fund’s Chinese Internet companies and by SK Telecom. Real estate also detracted from relative performance as a result of the Fund’s underweight allocation and stock selection.
The Fund used foreign currency exchange contracts to facilitate the purchase and sale of equities traded on international exchanges. The effect of these contracts on performance was immaterial.
Our positive long-term view on emerging market equities remains intact. Despite ongoing political and macroeconomic concerns, we believe that growth prospects for emerging economies remain favorable. We continue to believe that the Chinese economy will muddle through, supported by structural growth in consumption, improvement in living standards, and targeted policies from the government. In the near term, macro risks appear to dominate investor sentiment. However, we believe that these risks may be more manageable than the market appears to reflect.
Considering the varied macroeconomic backdrop that we see across emerging markets, we believe there are selective opportunities for long-term stock appreciation driven by structural demographic shifts, technology adoption, implementation of government policy,
2
Table of Contents
improvement in corporate governance, and industry consolidation. We have found that in markets where price action is heavily macro driven, investors can often misprice individual companies significantly.
Our investment approach remains centered on identifying individual companies that we believe possess sustainable franchises and favorable long-term growth prospects and that trade at significant discounts to their intrinsic value. We are
particularly focused on companies that we expect to benefit from long-term changes in how people in emerging markets live and work.
Among countries, we currently hold overweight positions in South Korea, Brazil, Russia, and Mexico. Conversely, we are currently underweight China, South Africa, Thailand, and Saudi Arabia. Sectors we currently favor include energy (largely due to the Fund’s holding, Reliance Industries), communication services, technology, and consumer staples. We have an underweight to financials.
3
Table of Contents
| Portfolio management review | ||
| Delaware Global Value Fund | December 10, 2019 (Unaudited) | |
Performance preview (for the year ended November 30, 2019) | ||||||||
Delaware Global Value Fund (Institutional Class shares) | 1-year return | +8.94% | ||||||
Delaware Global Value Fund (Class A shares)* | 1-year return | +8.55% | ||||||
MSCI World Index (net) | 1-year return | +14.53% | ||||||
MSCI World Index (gross) | 1-year return | +15.19% | ||||||
Past performance does not guarantee future results.
For complete, annualized performance for Delaware Global Value Fund, please see the table on page 17. Institutional Class shares are not subject to a sales charge and are offered for sale exclusively to certain eligible investors. In addition, Institutional Class shares pay no distribution and service fee.
The performance of Class A shares excludes the applicable sales charge. Both Institutional Class shares and Class A shares reflect the reinvestment of all distributions.
Please see page 19 for a description of the index. Index performance returns do not reflect any management fees, transaction costs, or expenses. Indices are unmanaged and one cannot invest directly in an index.
*Total return for the report period presented in the table differs from the return in “Financial highlights.” The total return presented in the above table is calculated based on the net asset value (NAV) at which shareholder transactions were processed. The total return presented in “Financial highlights” is calculated in the same manner, but also takes into account certain adjustments that are necessary under US generally accepted accounting principles (US GAAP) required in the annual report.
Effective March 1, 2019, the Fund’s portfolio managers changed. The new portfolio managers repositioned the Fund’s investment portfolio in accordance with its current investment process beginning after April 15, 2019. Because everyone’s tax situation is unique, you should consult your tax professional about federal, state, local, or foreign tax consequences before making an investment in the Fund. Please read the latest prospectus for more information concerning this event.
Economic developments and market performance
During the fourth quarter of 2018, there was a sharp decline in the valuation of risky assets. But early in 2019, equity prices began to recover. Admittedly, there were plenty of reasons for equity investors to be concerned, notably continuing disputes between the United States and several of its most important trading partners. The looming Brexit continued to create doubt about the United Kingdom’s economic and political outlook. Despite these uncertainties, equities generally performed quite well over the 12 months ended November 2019.
Throughout the fiscal year, the spot price of West Texas Intermediate (WTI) crude oil rose by around 8%, while the spot price of gold climbed nearly 20%. However, broader-based commodity indices showed weaker performance. The total return of the energy-intensive S&P GSCI® index was only a little above 1%, while the broad-based Thomson Reuters/CoreCommodity CRB Index declined by almost 1% over the period.
Risk-free interest rates continued to decline over the course of the year. The yields on US10-year Treasurys were around 3% at the end of November 2018 but fell well below 2% by the end of November 2019. In both Germany and Japan,10-year government bonds offered barely positive yields at the end of November 2018 and had dipped into negative territory by the end of November 2019. These declines in interest rates led to unusually high total returns for fixed income investors over the period, but it seems unlikely, in our view, that risk-free interest rates around the world can continue to decline significantly from current levels. The limited scope for further declines in interest rates may cause equities to look relatively more appealing for asset owners with longer investment horizons.
4
Table of Contents
Although some market observers believe that falling interest rates and weak commodity returns indicate an economic slowdown, equity investors appeared to shrug off these warning signals.
During the 12 months ended November 2019, growth equity indices tended to generate stronger returns than value equity indices, and the US equity market was among the strongest performers globally. Both were headwinds for Delaware Global Value Fund, which by design tends to be overweight in value stocks, and was underweight in US stocks. It is therefore not surprising to us that the Fund delivered disappointing active returns during the year relative to its benchmark, the MSCI World Index (net).
Within the Fund
For the fiscal year ended Nov. 30, 2019, Delaware Global Value Fund underperformed its benchmark, the MSCI World Index (net). The Fund’s Institutional Class shares gained 8.94%. The Fund’s Class A shares advanced 8.55% at net asset value and 2.31% at maximum offer price. These figures reflect all distributions reinvested. During the same period, the Fund’s benchmark gained 14.53%. For complete, annualized performance of Delaware Global Value Fund, please see the table on page 17.
We invest with the mindset of long-term business owners, and our research is therefore focused on how well a company can deploy its capital and redeploy retained earnings. Therefore, the Fund’s portfolio is built bottom up by selecting company stocks based on quantitative insights and qualitative assessments.
We use a multivariate risk model to analyze the various positive and negative contributors to the Fund’s performance against its benchmark. For the fiscal year ended November 2019, active country and region weights were generally helpful to performance, both before and after the changeover to a new management team.
By contrast, active sector weights detracted from performance during the first part of the period, but this turned around from April onward. In particular, the Fund’s underweights to energy and financials relative to its benchmark contributed to an overall positive sector effect from May to November 2019.
Over the full period, style effects were a headwind to active returns. The Fund’s underweight in growth and size, and its comparatively low beta (exposure to riskier assets) during a period of market appreciation, all tended to detract from its performance relative to its benchmark. Conversely, the Fund’s underweights in residual volatility and earnings variability were both helpful to its performance.
In terms of individual holdings, three of the largest positive contributors to active performance were German sportswear makeradidas AG,Japanese telecommunications firmKDDI Corp., and American packaged food manufacturer
Lamb Weston Holdings Inc., which all rose more than 15% in US dollar terms during the fiscal year ended November 2019. Adidas rose steadily from January through July, buoyed by positive earnings reports, and its price held roughly steady thereafter. KDDI declined in the first few months of 2019 because of investor worries about a possible price war in the Japanese telecommunications market. It showed an impressive recovery from early April onward as the situation became clearer. Lamb Weston Holdings drifted downward until the end of May, but then rose after analysts raised their expectations for full-year performance.
Conversely, three of the largest detractors from performance during the year were German healthcare firmFresenius Medical Care AG & Co. KGaA,Japanese power tool producerMakita Corp., and French media firmPublicis Groupe S.A.Although Fresenius Medical Care began the year strongly, it then declined from the end of April to the end of October as investors became concerned about possible changes in the
5
Table of Contents
Portfolio management review
Delaware Global Value Fund
structure of US healthcare payments to dialysis providers. Makita’s quarterly reports of operating income were below consensus estimates several times during the year, and its stock price suffered accordingly. In somewhat similar fashion, Publicis Groupe shares fell after the company reported
revenues that were lower than the market had expected. Nevertheless, all three companies remained in the Fund’s portfolio at the end of November 2019, as we believe their overall risk-reward profiles are still attractive over the medium to long term.
6
Table of Contents
| Portfolio management review | ||
| Delaware International Small Cap Fund | December 10, 2019 (Unaudited) | |
Performance preview (for the year ended November 30, 2019) | ||||||||
Delaware International Small Cap Fund (Institutional Class shares) | 1-year return | +6.45% | ||||||
Delaware International Small Cap Fund (Class A shares) | 1-year return | +6.16% | ||||||
MSCI ACWI (All Country World Index) ex USA Small Cap Index (net) | 1-year return | +10.32% | ||||||
MSCI ACWI (All Country World Index) ex USA Small Cap Index (gross) | 1-year return | +10.78% | ||||||
Past performance does not guarantee future results.
For complete, annualized performance for Delaware International Small Cap Fund, please see the table on page 21. Institutional Class shares are not subject to a sales charge and are offered for sale exclusively to certain eligible investors. In addition, Institutional Class shares pay no distribution and service fee.
The performance of Class A shares excludes the applicable sales charge. Both Institutional Class shares and Class A shares reflect the reinvestment of all distributions.
Please see page 23 for a description of the index. Index performance returns do not reflect any management fees, transaction costs, or expenses. Indices are unmanaged and one cannot invest directly in an index.
Market review
The Fund’s fiscal year that ended Nov. 30, 2019 was impacted by uncertainties and concerns related to weakening economic growth, particularly in Europe, and the intensifying tension between the United States and its major trading partners.
The ongoingUS-China trade dispute was particularly nettlesome. Investors were frustrated throughout the12-month period as both countries engaged in a repetitive dance that became all too familiar as the year progressed: A seeming easing of the dispute collapses when one side threatens further sanctions and the other side raises the stakes and the rhetoric, with talk of a truce following shortly thereafter.
Meanwhile, uncertainty over Brexit grew within the United Kingdom. That led to an election just after the end of the period that gave Boris Johnson’s Conservative Party an apparent mandate.
Throughout all of this, global central bank policy exerted an ever-greater influence on markets. At the beginning of the fiscal year, the US Federal Reserve was committed to monetary tightening. In December 2018, however, investors reacted nervously to signs of further slowing of global economic growth. Fed Chairman Jerome Powell pivoted early in 2019, indicating the US central
bank would be more likely to lower, rather than raise, rates throughout the remainder of 2019. Along with accommodative moves by other central banks – including the People’s Bank of China and the European Central Bank, which resumed quantitative easing – the Fed’s three rate cuts between late July and October sent a supportive message to investors and businesses.
This type of macro environment created challenges for investors in internationalsmall-cap stocks generally and for the Fund specifically. The increase in market volatility made it more difficult for our investment approach, which searches for positive change on astock-by-stock basis. During volatile periods, overall market activity can obscure individual company fundamentals. Additionally,small-cap stocks generally trailed large-caps internationally over the period.
In the United States, thelarge-cap S&P 500® Index gained 16.11% and thesmall-cap Russell 2000® Index advanced 7.51%. Among international equity markets, the MSCI EAFE (Europe, Australasia, Far East) Index (net) gained 12.44%, the MSCI Emerging Markets Index (net) advanced 7.28%, and the MSCI Emerging Markets Small Cap Index (net) gained 3.39% during the fiscal year. The Fund’s benchmark, the
7
Table of Contents
Portfolio management review
Delaware International Small Cap Fund
MSCI ACWI ex USA Small Cap Index (net), gained 10.32% for the period.
Source: Bloomberg.
Our team uses abottom-up(stock-by-stock) investment approach, seeking to invest in companies that are undergoing positive, fundamental change that we believe will drive earnings growth beyond what the market is expecting.
Within the Fund
For the fiscal year ended Nov. 30, 2019, Delaware International Small Cap Fund underperformed its benchmark, the MSCI ACWI ex USA Small Cap Index (net). The Fund’s Institutional Class shares gained 6.45%. The Fund’s Class A shares advanced 6.16% at net asset value and returned 0.00% at maximum offer price. These figures reflect all distributions reinvested. During the same period, the Fund’s benchmark gained 10.32%. For complete, annualized performance of Delaware International Small Cap Fund, please see the table on page 21.
Our individualstock-by-stock selection process drives the Fund’s positioning. As a result, sectors that detracted the most from performance during the fiscal year were real estate, healthcare, information technology, and consumer staples. Countries that detracted the most included the UK, India, and Germany. These largely reflected specific holdings that performed poorly relative to the overall market.
In India,Sterlite Technologies Ltd.provides transmission solutions for the telecommunications industry. Although the firm had reasonable financial results early in 2019, concerns grew about pricing weakness within the optical-fiber space and about growth in some of Sterlite’s less-profitable businesses. That led to a decline in earnings and in the company’s stock price. We exited the Fund’s position in the stock during the fiscal period.
Burford Capital Ltd.provides specialized finance to the legal market. While the company’s financial results and court-case results were positive, the stock underperformed after an investment report flagged Burford as a short-sell prospect based on questions over its business model. We also sold out of Burford during the fiscal year.
Leroy Seafood Group ASAis a Norwegian seafood production and distribution company. It had some weakness in expected earnings in 2019 after strong prior-year performance. The Fund reduced its exposure to the stock after some weaker-than-expected financial results. Because we continue to see positive demand dynamics in the salmon industry, we reduced but did not entirely sell the Fund’s position in Leroy Seafood Group.
Costa Group Holdings Ltd.is Australia’s largest grower, packer, and marketer of fresh fruit and vegetables. In addition to a profit warning, negative news about the company’s production and softness in pricing led us to sell the Fund’s position in Costa Group early in the fiscal year.
Sectors that contributed to the Fund’s relative performance included consumer discretionary and industrials. Countries that contributed to relative performance included Sweden, Brazil, and Australia, driven by specific stocks that performed well.
Evolution Gaming Group ABis a Swedish company that operates live online casino games. The company reported results throughout the year that were ahead of expectations. Evolution added live online games and expanded its customer base.
Afterpay Touch Group Ltd.is an Australian financial technology firm that providesbuy-now,pay-later payment services. It posted better-than-expected financial results with strong operating metrics throughout the year, including growth in revenue, customers, and merchants. Afterpay launched a presence in the US, adding some
8
Table of Contents
high-profile merchants, and had a successful UK launch.
SMS Co. Ltd.is a Japanese company that provides healthcare solutions. SMS benefited from growth opportunities related to Japan’s aging population. Its core strength is in nurse recruiting and it offers a software platform that makes it easier for nurses to review patient records and claim insurance rebates. SMS operated well, generating better-than-expected financial results throughout the year.
TechnoPro Holdings Inc.is a leading engineer staffing firm in Japan. Performance was boosted by robust demand driven by a rising number of engineers. The company also saw improvement in its balance sheet and strong free-cash-flow generation.
It appears that some economic data might be bottoming, which could provide a tailwind to certain holdings that have recently been held back. Having broadly accommodative central bank support is a plus for the stock market generally. But market risks and uncertainties remain, including volatility surrounding trade policy and the outcome of the 2020 US election,
which could have an indirect impact on investor sentiment globally.
As mentioned, the Fund’s positioning in terms of country and sector weights is driven primarily bybottom-up stock selection opportunities. As a result, at the end of the fiscal period, relative to the MSCI ACWI ex USA Small Cap Index, we were overweight the consumer staples and information technology sectors. From a country perspective, our largest overweight positions were in Norway and France. Conversely, our largest sector underweights were financials and materials while our largest relative underweight countries were Japan and Taiwan.
The Fund may use derivatives or structured products in certain limited situations. For example, the Fund may use equity-linked notes to gain local market access in situations where direct market participation is limited. Derivatives and structured products were not used by the Fund during the fiscal period. The Fund used foreign currency exchange contracts to facilitate the purchase and sale of equities traded on international exchanges. The effect of these contracts on performance was immaterial.
9
Table of Contents
| Portfolio management review | ||
| Delaware International Value Equity Fund | December 10, 2019 (Unaudited) | |
Performance preview (for the year ended November 30, 2019) | ||||||||
Delaware International Value Equity Fund (Institutional Class shares) | 1-year return | +11.29% | ||||||
Delaware International Value Equity Fund (Class A shares) | 1-year return | +10.94% | ||||||
MSCI EAFE (Europe, Australasia, Far East) Index (net) | 1-year return | +12.44% | ||||||
MSCI EAFE (Europe, Australasia, Far East) Index (gross) | 1-year return | +13.04% | ||||||
Past performance does not guarantee future results.
For complete, annualized performance for Delaware International Value Equity Fund, please see the table on page 25. Institutional Class shares are not subject to a sales charge and are offered for sale exclusively to certain eligible investors. In addition, Institutional Class shares pay no distribution and service fee.
The performance of Class A shares excludes the applicable sales charge. Both Institutional Class shares and Class A shares reflect the reinvestment of all distributions.
Please see page 27 for a description of the index. Index performance returns do not reflect any management fees, transaction costs, or expenses. Indices are unmanaged and one cannot invest directly in an index.
Effective March 1, 2019, the Fund’s portfolio managers changed. The new portfolio managers repositioned the Fund’s investment portfolio in accordance with its current investment process beginning after April 15, 2019. Because everyone’s tax situation is unique, you should consult your tax professional about federal, state, local, or foreign tax consequences before making an investment in the Fund. Please read the latest prospectus for more information concerning this event.
Economic developments and market performance
During the fourth quarter of 2018, there was a sharp decline in the valuation of risky assets. But early in 2019, equity prices began to recover. Admittedly, there were plenty of reasons for equity investors to be concerned, notably the continuing disputes between the United States and several of its most important trading partners. The looming Brexit continued to create doubt about the economic and political outlook for the United Kingdom. Despite these uncertainties, equities generally performed quite well over the 12 months ended November 2019.
Throughout the fiscal year, the spot price of West Texas Intermediate (WTI) crude oil rose by around 8%, while the spot price of gold climbed nearly 20%. However, broader-based commodity indices showed weaker performance. The total return of the energy-intensive S&P GSCI index was only a little above 1%, while the broad-based Thomson Reuters/CoreCommodity CRB Index declined by almost 1% over the period.
Risk-free interest rates continued to decline over the course of the year. The yields on US10-year Treasurys were around 3% at the end of November 2018 but fell well below 2% by the end of November 2019. In both Germany and Japan,10-year government bonds offered barely positive yields at the end of November 2018 and had dipped into negative territory by the end of November 2019. These declines in interest rates led to unusually high total returns for fixed income investors over the period, but it seems unlikely that risk-free interest rates around the world can continue to decline significantly from current levels. The limited scope for further declines in interest rates may cause equities to look relatively more appealing for asset owners with longer investment horizons.
Although some market observers believe that falling interest rates and weak commodity returns
10
Table of Contents
indicate an economic slowdown, equity investors appeared to shrug off these warning signals.
During the 12 months ended November 2019, growth equity indices tended to generate stronger returns than value equity indices. This was a headwind for Delaware International Value Equity Fund, which by design tends to be overweight in value and underweight in growth. It is, therefore, not surprising to us that the Fund delivered disappointing active returns during the year relative to its benchmark, the MSCI EAFE Index (net).
Within the Fund
For the fiscal year ended Nov. 30, 2019, Delaware International Value Equity Fund underperformed its benchmark, the MSCI EAFE Index (net). The Fund’s Institutional Class shares gained 11.29%. The Fund’s Class A shares advanced 10.94% at net asset value and 4.52% at maximum offer price. These figures reflect all distributions reinvested. During the same period, the Fund’s benchmark gained 12.44%. For complete, annualized performance of Delaware International Value Equity Fund, please see the table on page 25.
We invest with the mindset of long-term business owners, and our research is therefore focused on how well a company can deploy its capital and redeploy retained earnings. Therefore, the portfolio is built bottom up by selecting company stocks based on quantitative insights and qualitative assessments.
We use a multivariate risk model to analyze the various positive and negative contributors to the Fund’s performance against its benchmark. For the fiscal year ended November 2019, active country and region weights were generally helpful to performance, both before and after the changeover to a new management team. Similarly, active sector weights contributed to performance during both the first and second parts of the period. In particular, the Fund’s underweights to
energy and financials relative to its benchmark contributed to an overall positive sector effect for the 12 months ended November 2019.
Over the full period, style effects were a headwind to active returns. The Fund’s underweight in growth and size, and its comparatively low beta (exposure to riskier assets) during a period of market appreciation, all tended to detract from its performance relative to its benchmark. Conversely, the Fund’s underweights in residual volatility and earnings variability were both helpful to its performance.
In terms of individual holdings, three of the largest contributors to active performance were German sportswear makeradidas AG,Japanese telecommunications firmKDDI Corp., and Swiss pharmaceutical manufacturerRoche Holding AG,which all rose more than 15% in US dollar terms during the year ended November 2019. Adidas particularly delivered strong returns from the beginning of January to the end of July, buoyed by positive earnings reports. KDDI declined in the first few months of 2019 because of investor worries about a possible price war in the Japanese telecommunications market, but then showed an impressive recovery from April onward as the situation became clearer. Roche delivered better-than-expected earnings at the end of January and the end of July, which helped boost its full-year return.
Conversely, three of the largest detractors from performance during the year were German healthcare firmFresenius Medical Care AG & Co. KGaA,Japanese power tool producerMakita Corp., and French media firmPublicis Groupe S.A.Although Fresenius Medical Care began the year strongly, it then declined from April through October as investors became concerned about possible changes in the structure of US healthcare payments to dialysis providers. Makita’s quarterly reports of operating income were below consensus estimates several times during the year, and its stock price suffered
11
Table of Contents
Portfolio management review
Delaware International Value Equity Fund
accordingly. In somewhat similar fashion, Publicis Groupe shares fell after the company reported revenues that were lower than the market had expected. Nevertheless, all three companies
remained in the Fund’s portfolio at the end of November 2019, as we believe their overall risk-reward profiles are still attractive over the medium to long term.
12
Table of Contents
| Performance summaries | ||
| Delaware Emerging Markets Fund | November 30, 2019 (Unaudited) | |
The performance quoted represents past performance and does not guarantee future results. Investment return and principal value of an investment will fluctuate so that shares, when redeemed, may be worth more or less than their original cost. Current performance may be lower or higher than the performance quoted. Performance data current to the most recent month end may be obtained by calling 800523-1918 or visiting delawarefunds.com/performance.
| Fund and benchmark performance1,2 | Average annual total returns through November 30, 2019 | |||||||||||||||
| 1 year | 5 year | 10 year | Lifetime | |||||||||||||
Class A (Est. June 10, 1996) | ||||||||||||||||
Excluding sales charge | +9.50% | +4.67% | +5.05% | +7.57% | ||||||||||||
Including sales charge | +3.20% | +3.44% | +4.42% | +7.30% | ||||||||||||
Class C (Est. June 10, 1996) | ||||||||||||||||
Excluding sales charge | +8.67% | +3.89% | +4.25% | +6.78% | ||||||||||||
Including sales charge | +7.67% | +3.89% | +4.25% | +6.78% | ||||||||||||
Class R (Est. Aug. 31, 2009) | ||||||||||||||||
Excluding sales charge | +9.28% | +4.41% | +4.77% | +5.91% | ||||||||||||
Including sales charge | +9.28% | +4.41% | +4.77% | +5.91% | ||||||||||||
Institutional Class (Est. June 10, 1996) | ||||||||||||||||
Excluding sales charge | +9.79% | +4.93% | +5.31% | +7.86% | ||||||||||||
Including sales charge | +9.79% | +4.93% | +5.31% | +7.86% | ||||||||||||
Class R6 (Est. May 2, 2016) | ||||||||||||||||
Excluding sales charge | +9.84% | — | — | +11.51% | ||||||||||||
Including sales charge | +9.84% | — | — | +11.51% | ||||||||||||
MSCI Emerging Markets Index (net) | +7.28% | +3.12% | +3.33% | +5.59%* | ||||||||||||
MSCI Emerging Markets Index (gross) | +7.70% | +3.51% | +3.69% | +5.88%* | ||||||||||||
*The benchmark lifetime return is for Institutional Class share comparison only and is calculated using the last business day in the month of the Fund’s Institutional Class inception date.
1Returns reflect the reinvestment of all distributions and are presented both with and without the applicable sales charges described below. Returns do not reflect the deduction of taxes the shareholder would pay on Fund distributions or redemptions of Fund shares.
Expense limitations were in effect for certain classes during some or all of the periods shown in the “Fund and benchmark performance” table. Expenses for each class are listed on the “Fund expense ratios” table on page 14. Performance would have been lower had expense limitations not been in effect.
Institutional Class shares are not subject to a sales charge and are offered for sale exclusively to certain eligible investors. In addition, Institutional Class shares pay no distribution and service(12b-1) fee.
Class A shares are sold with a maximumfront-end sales charge of 5.75%, and have an annual12b-1 fee of 0.25% of average daily net assets. Performance for Class A shares, excluding sales charges, assumes that nofront-end sales charge applied.
Class C shares are sold with a contingent deferred sales charge of 1.00% if redeemed during the first
13
Table of Contents
Performance summaries
Delaware Emerging Markets Fund
12 months. They are also subject to an annual12b-1 fee of 1.00% of average daily net assets. Performance for Class C shares, excluding sales charges, assumes either that contingent deferred sales charges did not apply or that the investment was not redeemed.
Class R shares are available only for certain retirement plan products. They are sold without a sales charge and have an annual12b-1 fee of 0.50% of average daily net assets.
Class R6 shares are available only to certain investors. In addition, Class R6 shares do not pay any service fees,sub-accounting fees, and/orsub-transfer agency fees to any brokers, dealers,
or other financial intermediaries. Class R6 shares pay no12b-1 fee.
International investments entail risks not ordinarily associated with US investments including fluctuation in currency values, differences in accounting principles, or economic or political instability in other nations.
Investing in emerging markets can be riskier than investing in established foreign markets due to increased volatility and lower trading volume.
Investments in small and/ormedium-sized companies typically exhibit greater risk and higher volatility than larger, more established companies.
2The Fund’s expense ratios, as described in the most recent prospectus, are disclosed in the following “Fund expense ratios” table. Delaware Management Company has agreed to reimburse certain expenses and/or waive certain fees in order to prevent total annual fund operating expenses (excluding any12b-1 fees, acquired fund fees and expenses, taxes, interest, short sale and dividend and interest expenses, brokerage fees, certain insurance costs, and nonroutine expenses or costs, including, but not limited to, those relating to reorganizations, litigation, conducting shareholder meetings, and liquidations (collectively, nonroutine expenses)) from exceeding 1.37% of the Fund’s average daily net assets for all share classes other than Class R6, and 1.25% of the Fund’s Class R6 shares’ average daily net assets from Dec. 1, 2018 to Nov. 30, 2019.** Please see the most recent prospectus and any applicable supplement(s) for additional information on these fee waivers and/or reimbursements. Please see the “Financial highlights” section in this report for the most recent expense ratios.
| Institutional | ||||||||||
| Fund expense ratios | Class A | Class C | Class R | Class | Class R6 | |||||
Total annual operating expenses (without fee waivers) | 1.63% | 2.38% | 1.88% | 1.38% | 1.26% | |||||
Net expenses (including fee waivers, if any) | 1.62% | 2.37% | 1.87% | 1.37% | 1.25% | |||||
Type of waiver | Contractual | Contractual | Contractual | Contractual | Contractual |
**The aggregate contractual waiver period covering this report is from March 29, 2018 through March 29, 2020.
14
Table of Contents
Performance of a $10,000 investment1
Average annual total returns from Nov. 30, 2009 through Nov. 30, 2019
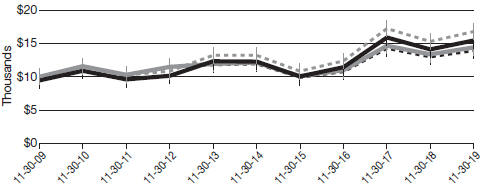
| For the period beginning Nov. 30, 2009 through Nov. 30, 2019 | Starting value | Ending value | ||||||||
| Delaware Emerging Markets Fund — Institutional Class shares | $10,000 | $16,772 | |||||||
| Delaware Emerging Markets Fund — Class A shares | $9,425 | $15,416 | |||||||
| MSCI Emerging Markets Index (gross) | $10,000 | $14,370 | |||||||
| MSCI Emerging Markets Index (net) | $10,000 | $13,881 | |||||||


1The “Performance of a $10,000 investment” graph assumes $10,000 invested in Institutional Class and Class A shares of the Fund on Nov. 30, 2009, and includes the effect of a 5.75%front-end sales charge (for Class A shares) and the reinvestment of all distributions. The graph does not reflect the deduction of taxes the shareholders would pay on Fund distributions or redemptions of Fund shares. Expense limitations were in effect for some or all of the periods shown. Performance would have been lower had expense limitations not been in effect. Expenses are listed in the “Fund expense ratios” table on page 14. Please note additional details on pages 13 through 16.
The graph also assumes $10,000 invested in the MSCI Emerging Markets Index as of Nov. 30, 2009. The MSCI Emerging Markets Index represents large- andmid-cap stocks across emerging market countries worldwide. The index covers approximately 85% of the free float-adjusted market capitalization in each
country. Index “net” return approximates the minimum possible dividend reinvestment, after deduction of withholding tax at the highest possible rate. Index “gross” return approximates the maximum possible dividend reinvestment.
Index performance returns do not reflect any management fees, transaction costs, or expenses. Indices are unmanaged and one cannot invest directly in an index.Past performance is not a guarantee of future results.
Performance of other Fund classes will vary due to different charges and expenses.
15
Table of Contents
Performance summaries
Delaware Emerging Markets Fund
| Nasdaq symbols | CUSIPs | |||||||||||
Class A | DEMAX | 245914841 | ||||||||||
Class C | DEMCX | 245914825 | ||||||||||
Class R | DEMRX | 245914569 | ||||||||||
Institutional Class | DEMIX | 245914817 | ||||||||||
Class R6 | DEMZX | 245914510 | ||||||||||
16
Table of Contents
| Performance summaries | ||
| Delaware Global Value Fund | November 30, 2019 (Unaudited) |
The performance quoted represents past performance and does not guarantee future results. Investment return and principal value of an investment will fluctuate so that shares, when redeemed, may be worth more or less than their original cost. Current performance may be lower or higher than the performance quoted. Performance data current to the most recent month end may be obtained by calling 800523-1918 or visiting delawarefunds.com/performance.
| Fund and benchmark performance1,2 | Average annual total returns through November 30, 2019 | |||||||||||||||
| 1 year | 5 year | 10 year | Lifetime | |||||||||||||
Class A (Est. Dec. 19, 1997) | ||||||||||||||||
Excluding sales charge | +8.55%* | +2.92% | +5.82% | +6.28% | ||||||||||||
Including sales charge | +2.31% | +1.72% | +5.19% | +5.99% | ||||||||||||
Class C (Est. Sept. 28, 2001) | ||||||||||||||||
Excluding sales charge | +7.78% | +2.14% | +5.02% | +6.21% | ||||||||||||
Including sales charge | +6.78% | +2.14% | +5.02% | +6.21% | ||||||||||||
Institutional Class (Est. Dec. 19, 1997) | ||||||||||||||||
Excluding sales charge | +8.94% | +3.17% | +6.08% | +6.51% | ||||||||||||
Including sales charge | +8.94% | +3.17% | +6.08% | +6.51% | ||||||||||||
MSCI World Index (net) | +14.53% | +7.75% | +9.34% | +6.07%** | ||||||||||||
MSCI World Index (gross) | +15.19% | +8.36% | +9.95% | +6.60%** | ||||||||||||
*Total return for the report period presented in the table differs from the return in “Financial highlights.” The total return presented in the above table is calculated based on the net asset value (NAV) at which shareholder transactions were processed. The total return presented in “Financial highlights” is calculated in the same manner, but also takes into account certain adjustments that are necessary under US generally accepted accounting principles (US GAAP) required in the annual report.
**The benchmark lifetime return is for Institutional Class share comparison only and is calculated using the last business day in the month of the Fund’s Institutional Class inception date.
1Returns reflect the reinvestment of all distributions and are presented both with and without the applicable sales charges described below. Returns do not reflect the deduction of taxes the shareholder would pay on Fund distributions or redemptions of Fund shares.
Expense limitations were in effect for certain classes during some or all of the periods shown in the “Fund and benchmark performance” table. Expenses for each class are listed on the “Fund expense ratios” table on page 18. Performance would have been lower had expense limitations not been in effect.
Institutional Class shares are not subject to a sales charge and are offered for sale exclusively to
certain eligible investors. In addition, Institutional Class shares pay no distribution and service(12b-1) fee.
Class A shares are sold with a maximumfront-end sales charge of 5.75%, and have an annual12b-1 fee of 0.25% of average daily net assets. Performance for Class A shares, excluding sales charges, assumes that nofront-end sales charge applied.
Class C shares are sold with a contingent deferred sales charge of 1.00% if redeemed during the first 12 months. They are also subject to an annual12b-1 fee of 1.00% of average daily net assets. Performance for Class C shares, excluding sales charges, assumes either that contingent deferred
17
Table of Contents
Performance summaries
Delaware Global Value Fund
sales charges did not apply or that the investment was not redeemed.
International investments entail risks not ordinarily associated with US investments including fluctuation in currency values, differences in accounting principles, or economic or political instability in other nations.
Investing in emerging markets can be riskier than investing in established foreign markets due to increased volatility and lower trading volume.
Investments in small and/ormedium-sized companies typically exhibit greater risk and higher volatility than larger, more established companies.
2The Fund’s expense ratios, as described in the most recent prospectus, are disclosed in the following “Fund expense ratios” table. Delaware Management Company has agreed to reimburse certain expenses and/or waive certain fees in order to prevent total annual fund operating expenses (excluding any12b-1 fees, acquired fund fees and expenses, taxes, interest, short sale and dividend and interest expenses, brokerage fees, certain insurance costs, and nonroutine expenses or costs, including, but not limited to, those relating to reorganizations, litigation, conducting shareholder meetings, and liquidations (collectively, nonroutine expenses)) from exceeding 1.15% of the Fund’s average daily net assets during the period from Dec. 1, 2018 to Nov. 30, 2019.*** Please see the most recent prospectus and any applicable supplement(s) for additional information on these fee waivers and/or reimbursements. Please see the “Financial highlights” section in this report for the most recent expense ratios.
| Fund expense ratios | Class A | Class C | Institutional Class | |||||||||
Total annual operating expenses (without fee waivers) | 2.25% | 3.00% | 2.00% | |||||||||
Net expenses (including fee waivers, if any) | 1.40% | | 2.15% | | 1.15% | |||||||
Type of waiver | Contractual | Contractual | Contractual | |||||||||
***The aggregate contractual waiver period covering this report is from March 29, 2018 through March 29, 2020.
18
Table of Contents
Performance of a $10,000 investment1
Average annual total returns from Nov. 30, 2009 through Nov. 30, 2019
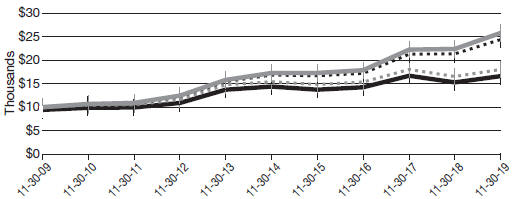
For the period beginning Nov. 30, 2009 through Nov. 30, 2019 | Starting value | Ending value | ||||||||
| MSCI World Index (gross) | $10,000 | $25,825 | |||||||
| MSCI World Index (net) | $10,000 | $24,424 | |||||||
| Delaware Global Value Fund — Institutional Class shares | $10,000 | $18,047 | |||||||
| Delaware Global Value Fund — Class A shares | $9,425 | $16,589 | |||||||


1The “Performance of a $10,000 investment” graph assumes $10,000 invested in Institutional Class and Class A shares of the Fund on Nov. 30, 2009, and includes the effect of a 5.75%front-end sales charge (for Class A shares) and the reinvestment of all distributions. The graph does not reflect the deduction of taxes the shareholders would pay on Fund distributions or redemptions of Fund shares. Expense limitations were in effect for some or all of the periods shown. Performance would have been lower had expense limitations not been in effect. Expenses are listed in the “Fund expense ratios” table on page 18. Please note additional details on pages 17 through 20.
The graph also assumes $10,000 invested in the MSCI World Index as of Nov. 30, 2009. The MSCI World Index represents large- andmid-cap stocks across 23 developed market countries worldwide. The index covers approximately 85% of the free float-adjusted market capitalization in each country. Index “net” return approximates the minimum possible dividend reinvestment, after
deduction of withholding tax at the highest possible rate. Index “gross” return approximates the maximum possible dividend reinvestment.
The S&P GSCI, formerly Goldman Sachs Commodity Index, mentioned on page 4, is a world production-weighted index composed of the principal physical commodities that are the subject of active, liquid futures markets.
The Thomson Reuters/CoreCommodity CRB Index, mentioned on page 4, is a widely recognized measure of global commodities markets. It is made up of 19 components considered to be significant commodities, including silver, sugar, wheat, aluminum, and soy beans.
Index performance returns do not reflect any management fees, transaction costs, or expenses. Indices are unmanaged and one cannot invest directly in an index.Past performance is not a guarantee of future results.
19
Table of Contents
Performance summaries
Delaware Global Value Fund
Performance of other Fund classes will vary due to different charges and expenses.
| Nasdaq symbols | CUSIPs | |||||||||||
Class A | DABAX | 245914718 | ||||||||||
Class C | DABCX | 245914684 | ||||||||||
Institutional Class | DABIX | 245914676 | ||||||||||
20
Table of Contents
| Performance summaries | ||
| Delaware International Small Cap Fund | November 30, 2019 (Unaudited) | |
The performance quoted represents past performance and does not guarantee future results. Investment return and principal value of an investment will fluctuate so that shares, when redeemed, may be worth more or less than their original cost. Current performance may be lower or higher than the performance quoted. Performance data current to the most recent month end may be obtained by calling 800523-1918 or visiting delawarefunds.com/performance.
| Fund and benchmark performance1,2 | Average annual total returns through November 30, 2019 | |||||||||||||||
| 1 year | 5 year | 10 year | Lifetime | |||||||||||||
Class A (Est. Dec. 29, 2008) | ||||||||||||||||
Excluding sales charge | +6.16% | +4.90% | +9.06% | +12.13% | ||||||||||||
Including sales charge | +0.00% | +3.67% | +8.42% | +11.53% | ||||||||||||
Class C (Est. Dec. 29, 2010) | ||||||||||||||||
Excluding sales charge | +5.35% | +4.11% | — | +6.34% | ||||||||||||
Including sales charge | +4.35% | +4.11% | — | +6.34% | ||||||||||||
Class R (Est. Dec. 29, 2010) | ||||||||||||||||
Excluding sales charge | +5.86% | +4.61% | — | +6.85% | ||||||||||||
Including sales charge | +5.86% | +4.61% | — | +6.85% | ||||||||||||
Institutional Class (Est. Dec. 29, 2008) | ||||||||||||||||
Excluding sales charge | +6.45% | +5.15% | +9.30% | +12.36% | ||||||||||||
Including sales charge | +6.45% | +5.15% | +9.30% | +12.36% | ||||||||||||
Class R6 (Est. June 30, 2017) | ||||||||||||||||
Excluding sales charge | +6.58% | — | — | +3.84% | ||||||||||||
Including sales charge | +6.58% | — | — | +3.84% | ||||||||||||
MSCI ACWI ex USA Small Cap Index (net) | +10.32% | +5.75% | +6.67% | +10.70%* | ||||||||||||
MSCI ACWI ex USA Small Cap Index (gross) | +10.78% | +6.15% | +7.05% | +11.09%* | ||||||||||||
*The benchmark lifetime return is for Class A share comparison only and is calculated using the last business day in the month of the Fund’s Institutional Class inception date.
1Returns reflect the reinvestment of all distributions and are presented both with and without the applicable sales charges described below. Returns do not reflect the deduction of taxes the shareholder would pay on Fund distributions or redemptions of Fund shares.
Expense limitations were in effect for certain classes during some or all of the periods shown in the “Fund and benchmark performance” table. Expenses for each class are listed on the “Fund expense ratios” table on page 22.
Performance would have been lower had expense limitations not been in effect.
Institutional Class shares are not subject to a sales charge and are offered for sale exclusively to certain eligible investors. In addition, Institutional Class shares pay no distribution and service(12b-1) fee.
Class A shares are sold with a maximumfront-end sales charge of 5.75%, and have an annual12b-1 fee of 0.25% of average daily net assets.
21
Table of Contents
Performance summaries
Delaware International Small Cap Fund
Performance for Class A shares, excluding sales charges, assumes that nofront-end sales charge applied.
Class C shares are sold with a contingent deferred sales charge of 1.00% if redeemed during the first 12 months. They are also subject to an annual12b-1 fee of 1.00% of average daily net assets. Performance for Class C shares, excluding sales charges, assumes either that contingent deferred sales charges did not apply or that the investment was not redeemed.
Class R shares are available only for certain retirement plan products. They are sold without a sales charge and have an annual12b-1 fee of 0.50% of average daily net assets.
Class R6 shares are available only to certain investors. In addition, Class R6 shares do not pay
any service fees,sub-accounting fees, and/orsub-transfer agency fees to any brokers, dealers, or other financial intermediaries. Class R6 shares pay no12b-1 fee.
International investments entail risks not ordinarily associated with US investments including fluctuation in currency values, differences in accounting principles, or economic or political instability in other nations.
Investing in emerging markets can be riskier than investing in established foreign markets due to increased volatility and lower trading volume.
Investments in small and/ormedium-sized companies typically exhibit greater risk and higher volatility than larger, more established companies.
2The Fund’s expense ratios, as described in the most recent prospectus, are disclosed in the following “Fund expense ratios” table. Delaware Management Company has agreed to reimburse certain expenses and/or waive certain fees in order to prevent total annual fund operating expenses (excluding any12b-1 fees, acquired fund fees and expenses, taxes, interest, short sale and dividend and interest expenses, brokerage fees, certain insurance costs, and nonroutine expenses or costs, including, but not limited to, those relating to reorganizations, litigation, conducting shareholder meetings, and liquidations (collectively, nonroutine expenses)) from exceeding 1.12% of the Fund’s average daily net assets for all share classes other than Class R6, and 1.00% of the Fund’s Class R6 shares’ average daily net assets from Dec. 1, 2018 to Nov. 30, 2019.** Please see the most recent prospectus and any applicable supplement(s) for additional information on these fee waivers and/or reimbursements. Please see the “Financial highlights” section in this report for the most recent expense ratios.
| Fund expense ratios | Class A | Class C | Class R | Institutional Class | Class R6 | |||||
Total annual operating expenses (without fee waivers) | 1.72% | 2.47% | 1.97% | 1.47% | 1.35% | |||||
Net expenses (including fee waivers, if any) | 1.37% | 2.12% | 1.62% | 1.12% | 1.00% | |||||
Type of waiver | Contractual | Contractual | Contractual | Contractual | Contractual |
**The aggregate contractual waiver period covering this report is from March 29, 2018 through March 29, 2020.
22
Table of Contents
Performance of a $10,000 investment1
Average annual total returns from Nov. 30, 2009 through Nov. 30, 2019
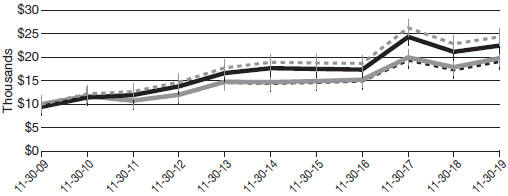
| For the period beginning Nov. 30, 2009 through Nov. 30, 2019 | Starting value | Ending value | ||||||||
 | Delaware International Small Cap Fund — Institutional Class shares | $10,000 | $24,343 | |||||||
 | Delaware International Small Cap Fund — Class A shares | $9,425 | $22,442 | |||||||
 | MSCI ACWI ex USA Small Cap Index (gross) | $10,000 | $19,766 | |||||||
 | MSCI ACWI ex USA Small Cap Index (net) | $10,000 | $19,074 | |||||||
1The “Performance of a $10,000 investment” graph assumes $10,000 invested in Institutional Class and Class A shares of the Fund on Nov. 30, 2009, and includes the effect of a 5.75%front-end sales charge (for Class A shares) and the reinvestment of all distributions. The graph does not reflect the deduction of taxes the shareholders would pay on Fund distributions or redemptions of Fund shares. Expense limitations were in effect for some or all of the periods shown. Performance would have been lower had expense limitations not been in effect. Expenses are listed in the “Fund expense ratios” table on page 22. Please note additional details on pages 21 through 24.
The graph also assumes $10,000 invested in the MSCI ACWI ex USA Small Cap Index as of Nov. 30, 2009. The MSCI ACWI ex USA Small Cap Index capturessmall-cap representation across 22 of 23 developed market countries (excluding the United States) and 26 emerging market
countries. The index covers approximately 14% of the global equity opportunity set outside the US.
The S&P 500 Index, mentioned on page 7, measures the performance of 500 mostlylarge-cap stocks weighted by market value, and is often used to represent performance of the US stock market.
The Russell 2000 Index, mentioned on page 7, measures the performance of thesmall-cap segment of the US equity universe.
The MSCI EAFE (Europe, Australasia, Far East) Index, mentioned on page 7, represents large- andmid-cap stocks across 21 developed markets, excluding the United States and Canada. The index covers approximately 85% of the free float-adjusted market capitalization in each country. Index “net” return approximates the minimum possible dividend reinvestment, after deduction of withholding tax at the highest possible rate.
23
Table of Contents
Performance summaries
Delaware International Small Cap Fund
The MSCI Emerging Markets Index, mentioned on page 7, represents large- andmid-cap stocks across emerging market countries worldwide. The index covers approximately 85% of the free float-adjusted market capitalization in each country. Index “net” return approximates the minimum possible dividend reinvestment, after deduction of withholding tax at the highest possible rate.
The MSCI Emerging Markets Small Cap Index, mentioned on page 7, representssmall-cap stocks across 26 emerging market countries. Thesmall-cap segment tends to capture more local economic and sector characteristics relative to larger emerging market capitalization segments.
The index covers approximately 14% of the free float-adjusted market capitalization in each country. Index “net” return approximates the minimum possible dividend reinvestment, after deduction of withholding tax at the highest possible rate.
Index performance returns do not reflect any management fees, transaction costs, or expenses. Indices are unmanaged and one cannot invest directly in an index.Past performance is not a guarantee of future results.
Performance of other Fund classes will vary due to different charges and expenses.
| Nasdaq symbols | CUSIPs | |||||||||||
Class A | DGGAX | 246118541 | ||||||||||
Class C | DGGCX | 246118533 | ||||||||||
Class R | DGGRX | 246118525 | ||||||||||
Institutional Class | DGGIX | 246118517 | ||||||||||
Class R6
| DGRRX | 245914486 | ||||||||||
24
Table of Contents
| Performance summaries | ||
| Delaware International Value Equity Fund | November 30, 2019 (Unaudited) |
The performance quoted represents past performance and does not guarantee future results. Investment return and principal value of an investment will fluctuate so that shares, when redeemed, may be worth more or less than their original cost. Current performance may be lower or higher than the performance quoted. Performance data current to the most recent month end may be obtained by calling 800523-1918 or visiting delawarefunds.com/performance.
| Fund and benchmark performance1,2 | Average annual total returns through November 30, 2019 | |||||||
| 1 year | 5 year | 10 year | Lifetime | |||||
Class A (Est. Oct. 31, 1991) | ||||||||
Excluding sales charge | +10.94% | +3.51% | +4.23% | +5.81% | ||||
Including sales charge | +4.52% | +2.28% | +3.62% | +5.59% | ||||
Class C (Est. Nov. 29, 1995) | ||||||||
Excluding sales charge | +10.18% | +2.74% | +3.47% | +4.58% | ||||
Including sales charge | +9.18% | +2.74% | +3.47% | +4.58% | ||||
Class R (Est. June 2, 2003) | ||||||||
Excluding sales charge | +10.72% | +3.25% | +3.98% | +5.53% | ||||
Including sales charge | +10.72% | +3.25% | +3.98% | +5.53% | ||||
Institutional Class (Est. Nov. 9, 1992) | ||||||||
Excluding sales charge | +11.29% | +3.78% | +4.52% | +6.52% | ||||
Including sales charge | +11.29% | +3.78% | +4.52% | +6.52% | ||||
Class R6 (Est. March 29, 2018) | ||||||||
Excluding sales charge | +11.36% | — | — | -0.84% | ||||
Including sales charge | +11.36% | — | — | -0.84% | ||||
MSCI EAFE Index (net) | +12.44% | +4.26% | +5.32% | 6.05%* | ||||
MSCI EAFE Index (gross) | +13.04% | +4.77% | +5.81% | 6.47%* | ||||
*The benchmark lifetime return is for Institutional Class share comparison only and is calculated using the last business day in the month of the Fund’s Institutional Class inception date.
1Returns reflect the reinvestment of all distributions and are presented both with and without the applicable sales charges described below. Returns do not reflect the deduction of taxes the shareholder would pay on Fund distributions or redemptions of Fund shares.
Expense limitations were in effect for certain classes during some or all of the periods shown in the “Fund and benchmark performance” table. Expenses for each class are listed on the “Fund expense ratios” table on page 26. Performance
would have been lower had expense limitations not been in effect.
Institutional Class shares are not subject to a sales charge and are offered for sale exclusively to certain eligible investors. In addition, Institutional Class shares pay no distribution and service(12b-1) fee.
Class A shares are sold with a maximumfront-end sales charge of 5.75%, and have an annual12b-1 fee of 0.25% of average daily net assets. Performance for Class A shares, excluding
25
Table of Contents
Performance summaries
Delaware International Value Equity Fund
sales charges, assumes that nofront-end sales charge applied.
Class C shares are sold with a contingent deferred sales charge of 1.00% if redeemed during the first 12 months. They are also subject to an annual12b-1 fee of 1.00% of average daily net assets. Performance for Class C shares, excluding sales charges, assumes either that contingent deferred sales charges did not apply or that the investment was not redeemed.
Class R shares are available only for certain retirement plan products. They are sold without a sales charge and have an annual12b-1 fee of 0.50% of average daily net assets.
Class R6 shares are available only to certain investors. In addition, Class R6 shares do not pay any service fees,sub-accounting fees, and/orsub-transfer agency fees to any brokers, dealers, or other financial intermediaries. Class R6 shares pay no12b-1 fee.
International investments entail risks not ordinarily associated with US investments including fluctuation in currency values, differences in accounting principles, or economic or political instability in other nations.
Investing in emerging markets can be riskier than investing in established foreign markets due to increased volatility and lower trading volume.
Investments in small and/ormedium-sized companies typically exhibit greater risk and higher volatility than larger, more established companies.
2The Fund’s expense ratios, as described in the most recent prospectus, are disclosed in the following “Fund expense ratios” table. Delaware Management Company has agreed to reimburse certain expenses and/or waive certain fees in order to prevent total annual fund operating expenses (excluding any12b-1 fees, acquired fund fees and expenses, taxes, interest, short sale and dividend and interest expenses, brokerage fees, certain insurance costs, and nonroutine expenses or costs, including, but not limited to, those relating to reorganizations, litigation, conducting shareholder meetings, and liquidations (collectively, nonroutine expenses)) from exceeding 1.09% of the Fund’s average daily net assets for all share classes other than Class R6, and 1.03% of the Fund’s Class R6 shares’ average daily net assets from Dec. 1, 2018 to Nov. 30, 2019.** Please see the most recent prospectus and any applicable supplement(s) for additional information on these fee waivers and/or reimbursements. Please see the “Financial highlights” section in this report for the most recent expense ratios.
| Fund expense ratios | Class A | Class C | Class R | Institutional Class | Class R6 | |||||||||||||||
Total annual operating expenses (without fee waivers) | 1.33% | 2.08% | 1.58% | 1.08% | 1.02% | |||||||||||||||
Net expenses (including fee waivers, if any) | 1.33% | 2.08% | 1.58% | 1.08% | 1.02% | |||||||||||||||
Type of waiver | Contractual | Contractual | Contractual | Contractual | Contractual | |||||||||||||||
**The aggregate contractual waiver period covering this report is from March 29, 2018 through March 29, 2020.
26
Table of Contents
Performance of a $10,000 investment1
Average annual total returns from Nov. 30, 2009 through Nov. 30, 2019
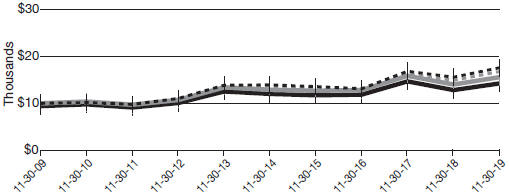
For the period beginning Nov. 30, 2009 through Nov. 30, 2019
|
Starting value
|
Ending value
| ||||||||
| MSCI EAFE Index (gross) | $10,000 | $17,584 | |||||||
| MSCI EAFE Index (net) | $10,000 | $16,785 | |||||||
| Delaware International Value Equity Fund — Institutional Class shares | $10,000 | $15,554 | |||||||
| Delaware International Value Equity Fund — Class A shares | $9,425 | $14,264 | |||||||


1The “Performance of a $10,000 investment” graph assumes $10,000 invested in Institutional Class and Class A shares of the Fund on Nov. 30, 2009, and includes the effect of a 5.75%front-end sales charge (for Class A shares) and the reinvestment of all distributions. The graph does not reflect the deduction of taxes the shareholders would pay on Fund distributions or redemptions of Fund shares. Expense limitations were in effect for some or all of the periods shown. Performance would have been lower had expense limitations not been in effect. Expenses are listed in the “Fund expense ratios” table on page 26. Please note additional details on pages 25 through 28.
The graph also assumes $10,000 invested in the MSCI EAFE Index as of Nov. 30, 2009. The MSCI EAFE (Europe, Australasia, Far East) Index represents large- andmid-cap stocks across 21 developed markets, excluding the United States and Canada. The index covers approximately 85%
of the free float-adjusted market capitalization in each country. Index “gross” return approximates the maximum possible dividend reinvestment. Index “net” return approximates the minimum possible dividend reinvestment, after deduction of withholding tax at the highest possible rate.
The S&P GSCI, formerly Goldman Sachs Commodity Index, mentioned on page 10, is a world production-weighted index composed of the principal physical commodities that are the subject of active, liquid futures markets.
The Thomson Reuters/CoreCommodity CRB Index, mentioned on page 10, is a widely recognized measure of global commodities markets. It is made up of 19 components considered to be significant commodities, including silver, sugar, wheat, aluminum, and soy beans.
27
Table of Contents
Performance summaries
Delaware International Value Equity Fund
Index performance returns do not reflect any management fees, transaction costs, or expenses. Indices are unmanaged and one cannot invest directly in an index.Past performance is not a guarantee of future results.
Performance of other Fund classes will vary due to different charges and expenses.
| Nasdaq symbols | CUSIPs | |||||||||
Class A | DEGIX | 245914106 | ||||||||
Class C | DEGCX | 245914858 | ||||||||
Class R | DIVRX | 245914577 | ||||||||
Institutional Class | DEQIX | 245914403 | ||||||||
Class R6 | DEQRX | 245914478 | ||||||||
28
Table of Contents
For thesix-month period from June 1, 2019 to November 30, 2019 (Unaudited)
As a shareholder of a Fund, you incur two types of costs: (1) transaction costs, including sales charges (loads) on purchase payments, reinvested dividends, or other distributions; redemption fees; and exchange fees; and (2) ongoing costs, including management fees; distribution and service(12b-1) fees; and other Fund expenses. The following examples are intended to help you understand your ongoing costs (in dollars) of investing in a Fund and to compare these costs with the ongoing costs of investing in other mutual funds.
The examples are based on an investment of $1,000 invested at the beginning of the period and held for the entiresix-month period from June 1, 2019 to Nov. 30, 2019.
Actual expenses
The first section of the tables shown, “Actual Fund return,” provides information about actual account values and actual expenses. You may use the information in this section of the table, together with the amount you invested, to estimate the expenses that you paid over the period. Simply divide your account value by $1,000 (for example, an $8,600 account value divided by $1,000 = 8.6), then multiply the result by the number in the first section under the heading entitled “Expenses Paid During Period” to estimate the expenses you paid on your account during this period.
Hypothetical example for comparison purposes
The second section of the tables shown, “Hypothetical 5% return,” provides information about hypothetical account values and hypothetical expenses based on the Funds’ actual expense ratios and an assumed rate of return of 5% per year before expenses, which is not the Funds’ actual return. The hypothetical account values and expenses may not be used to estimate the actual ending account balance or expenses you paid for the period. You may use this information to compare the ongoing costs of investing in each Fund and other funds. To do so, compare this 5% hypothetical example with the 5% hypothetical examples that appear in the shareholder reports of the other funds.
Please note that the expenses shown in the tables are meant to highlight your ongoing costs only and do not reflect any transactional costs, such as sales charges (loads), redemption fees, or exchange fees. Therefore, the second section of each table is useful in comparing ongoing costs only, and will not help you determine the relative total costs of owning different funds. In addition, if these transactional costs were included, your costs would have been higher. The Funds’ expenses shown in the tables reflect fee waivers in effect and assume reinvestment of all dividends and distributions.
29
Table of Contents
Disclosure of Fund expenses
For thesix-month period from June 1, 2019 to November 30, 2019 (Unaudited)
Delaware Emerging Markets Fund
Expense analysis of an investment of $1,000
Beginning
Account Value
6/1/19 | Ending
Account Value
11/30/19 | Annualized
Expense Ratio | Expenses
Paid During Period
6/1/19 to 11/30/19* | |||||||||||||
Actual Fund return† | ||||||||||||||||
Class A | $1,000.00 | $1,118.70 | 1.64% | $8.71 | ||||||||||||
Class C | 1,000.00 | 1,114.10 | 2.39% | 12.67 | ||||||||||||
Class R | 1,000.00 | 1,117.20 | 1.89% | 10.03 | ||||||||||||
Institutional Class | 1,000.00 | 1,119.70 | 1.39% | 7.39 | ||||||||||||
Class R6 | 1,000.00 | 1,120.30 | 1.27% | 6.75 | ||||||||||||
Hypothetical 5% return(5% return before expenses) |
| |||||||||||||||
Class A | $1,000.00 | $1,016.85 | 1.64% | $8.29 | ||||||||||||
Class C | 1,000.00 | 1,013.09 | 2.39% | 12.06 | ||||||||||||
Class R | 1,000.00 | 1,015.59 | 1.89% | 9.55 | ||||||||||||
Institutional Class | 1,000.00 | 1,018.10 | 1.39% | 7.03 | ||||||||||||
Class R6 | 1,000.00 | 1,018.70 | 1.27% | 6.43 | ||||||||||||
Delaware Global Value Fund Expense analysis of an investment of $1,000
| ||||||||||||||||
Beginning
Account Value
6/1/19 | Ending
Account Value
11/30/19 | Annualized
Expense Ratio | Expenses
Paid During Period
6/1/19 to 11/30/19* | |||||||||||||
Actual Fund return† | ||||||||||||||||
Class A | $1,000.00 | $1,069.50 | 1.38% | $7.16 | ||||||||||||
Class C | 1,000.00 | 1,065.00 | 2.13% | 11.03 | ||||||||||||
Institutional Class | 1,000.00 | 1,070.90 | 1.13% | 5.87 | ||||||||||||
Hypothetical 5% return(5% return before expenses) |
| |||||||||||||||
Class A | $1,000.00 | $1,018.15 | 1.38% | $6.98 | ||||||||||||
Class C | 1,000.00 | 1,014.39 | 2.13% | 10.76 | ||||||||||||
Institutional Class | 1,000.00 | 1,019.40 | 1.13% | 5.72 | ||||||||||||
30
Table of Contents
Delaware International Small Cap Fund
Expense analysis of an investment of $1,000
Beginning
Account Value
6/1/19 | Ending
Account Value
11/30/19 | Annualized
Expense Ratio | Expenses
Paid During Period
6/1/19 to 11/30/19* | |||||||||||||
Actual Fund return† | ||||||||||||||||
Class A | $1,000.00 | $1,072.80 | 1.34% | $6.96 | ||||||||||||
Class C | 1,000.00 | 1,068.70 | 2.09% | 10.84 | ||||||||||||
Class R | 1,000.00 | 1,070.50 | 1.59% | 8.25 | ||||||||||||
Institutional Class | 1,000.00 | 1,073.70 | 1.09% | 5.67 | ||||||||||||
Class R6 | 1,000.00 | 1,073.50 | 1.00% | 5.20 | ||||||||||||
Hypothetical 5% return(5% return before expenses) |
| |||||||||||||||
Class A | $1,000.00 | $1,018.35 | 1.34% | $6.78 | ||||||||||||
Class C | 1,000.00 | 1,014.59 | 2.09% | 10.56 | ||||||||||||
Class R | 1,000.00 | 1,017.10 | 1.59% | 8.04 | ||||||||||||
Institutional Class | 1,000.00 | 1,019.60 | 1.09% | 5.52 | ||||||||||||
Class R6 | 1,000.00 | 1,020.05 | 1.00% | 5.06 | ||||||||||||
Delaware International Value Equity Fund Expense analysis of an investment of $1,000
| ||||||||||||||||
Beginning
Account Value
6/1/19 | Ending
Account Value
11/30/19 | Annualized
Expense Ratio | Expenses
Paid During Period
6/1/19 to 11/30/19* | |||||||||||||
Actual Fund return† | ||||||||||||||||
Class A | $1,000.00 | $1,074.00 | 1.34% | $6.97 | ||||||||||||
Class C | 1,000.00 | 1,070.20 | 2.09% | 10.85 | ||||||||||||
Class R | 1,000.00 | 1,072.70 | 1.59% | 8.26 | ||||||||||||
Institutional Class | 1,000.00 | 1,075.90 | 1.09% | 5.67 | ||||||||||||
Class R6 | 1,000.00 | 1,075.90 | 1.04% | 5.41 | ||||||||||||
Hypothetical 5% return(5% return before expenses) |
| |||||||||||||||
Class A | $1,000.00 | $1,018.35 | 1.34% | $6.78 | ||||||||||||
Class C | 1,000.00 | 1,014.59 | 2.09% | 10.56 | ||||||||||||
Class R | 1,000.00 | 1,017.10 | 1.59% | 8.04 | ||||||||||||
Institutional Class | 1,000.00 | 1,019.60 | 1.09% | 5.52 | ||||||||||||
Class R6 | 1,000.00 | 1,019.85 | 1.04% | 5.27 | ||||||||||||
*“Expenses Paid During Period” are equal to the relevant Fund’s annualized expense ratio, multiplied by the average account value over the period, multiplied by 183/365 (to reflect theone-half year period).
†Because actual returns reflect only the most recentsix-month period, the returns shown may differ significantly from fiscal year returns.
31
Table of Contents
Disclosure of Fund expenses
For thesix-month period from June 1, 2019 to November 30, 2019 (Unaudited)
In addition to the Funds’ expenses reflected on the previous pages, each Fund also indirectly bears its portion of the fees and expenses of the investment companies (Underlying Funds) in which it invests, including exchange-traded funds. The tables on the previous pages do not reflect the expenses of the Underlying Funds.
32
Table of Contents
Security type / country and sector allocations
| Delaware Emerging Markets Fund | As of November 30, 2019 (Unaudited) |
Sector designations may be different than the sector designations presented in other Fund materials. The sector designations may represent the investment manager’s internal sector classifications, which may result in the sector designations for one fund being different than another fund’s sector designations.
| Security type / country | Percentage of net assets | |||||||
Common Stock by Country | 97.38 | % | ||||||
Argentina | 0.35 | % | ||||||
Bahrain | 0.02 | % | ||||||
Brazil | 10.28 | % | ||||||
Chile | 0.54 | % | ||||||
China | 30.10 | % | ||||||
Cyprus | 0.14 | % | ||||||
France | 0.01 | % | ||||||
India | 10.55 | % | ||||||
Indonesia | 0.64 | % | ||||||
Israel | 0.28 | % | ||||||
Japan | 0.74 | % | ||||||
Malaysia | 0.06 | % | ||||||
Mexico | 5.27 | % | ||||||
Peru | 0.92 | % | ||||||
Republic of Korea | 16.20 | % | ||||||
Russia | 7.47 | % | ||||||
South Africa | 0.68 | % | ||||||
Taiwan | 10.18 | % | ||||||
Turkey | 0.97 | % | ||||||
United Kingdom | 0.06 | % | ||||||
United States | 1.92 | % | ||||||
Preferred Stock | 2.69 | % | ||||||
Exchange-Traded Fund | 0.14 | % | ||||||
Participation Notes | 0.00 | % | ||||||
Total Value of Securities | 100.21 | % | ||||||
Liabilities Net of Receivables and Other Assets | (0.21 | %) | ||||||
Total Net Assets | 100.00 | % | ||||||
33
Table of Contents
Security type / country and sector allocations
Delaware Emerging Markets Fund
| Common stock, participation notes, and preferred stock | Percentage of net assets | |||||||
Communications Services | 19.83 | % | ||||||
Consumer Discretionary | 12.36 | % | ||||||
Consumer Staples | 13.92 | % | ||||||
Energy | 16.75 | % | ||||||
Financials | 7.27 | % | ||||||
Healthcare | 1.77 | % | ||||||
Industrials | 0.82 | % | ||||||
Information Technology | 23.20 | % | ||||||
Materials | 3.29 | % | ||||||
Real Estate | 0.42 | % | ||||||
Utilities | 0.44 | % | ||||||
Total | 100.07 | % | ||||||
34
Table of Contents
Security type / country and sector allocations
| Delaware Global Value Fund | As of November 30, 2019 (Unaudited) |
Sector designations may be different than the sector designations presented in other Fund materials. The sector designations may represent the investment manager’s internal sector classifications, which may result in the sector designations for one fund being different than another fund’s sector designations.
| Security type / country | Percentage of net assets | |||||||
Common Stock by Country | 98.66 | % | ||||||
Denmark | 4.49 | % | ||||||
France | 18.68 | % | ||||||
Germany | 4.49 | % | ||||||
Ireland | 1.07 | % | ||||||
Japan | 15.28 | % | ||||||
Netherlands | 5.19 | % | ||||||
Sweden | 2.68 | % | ||||||
Switzerland | 10.46 | % | ||||||
United Kingdom | 5.89 | % | ||||||
United States | 30.43 | % | ||||||
Exchange-Traded Fund | 1.31 | % | ||||||
Short-Term Investments | 0.03 | % | ||||||
Total Value of Securities | 100.00 | % | ||||||
Receivables and Other Assets Net of Liabilities | 0.00 | % | ||||||
Total Net Assets | 100.00 | % | ||||||
35
Table of Contents
Security type / country and sector allocations
Delaware Global Value Fund
| Common stock by sector² | Percentage of net assets | |||||||
Communication Services | 9.90 | % | ||||||
Consumer Discretionary | 7.53 | % | ||||||
Consumer Staples* | 49.23 | % | ||||||
Healthcare | 19.08 | % | ||||||
Industrials | 9.10 | % | ||||||
Materials | 3.82 | % | ||||||
Total | 98.66 | % | ||||||
| ² | Narrow industries are utilized for compliance purposes for diversification whereas broad sectors are used for financial reporting. |
| * | To monitor compliance with the Fund’s concentration guidelines as described in the Fund’s Prospectus and Statement of Additional Information, the Consumer Staples sector (as disclosed herein for financial reporting purposes) is subdivided into a variety of “industries” (in accordance with the requirements of the Investment Company Act of 1940, as amended). The Consumer Staples sector consisted of Beverages, Cosmetics/Personal Care, Dairy Products, Meat Products, Miscellaneous/Diversified, Household Products/Wares, and Retail. As of Nov. 30, 2019, such amounts, as a percentage of total net assets, were 5.33%, 0.95%, 5.45%, 2.55%, 17.45%, 7.26%, and 10.24%, respectively. The percentage in any such single industry will comply with the Fund’s concentration policy even if the percentage in the Consumer Staples sector for financial reporting purposes may exceed 25%. |
36
Table of Contents
| Security type / country and sector allocations | ||
| Delaware International Small Cap Fund | As of November 30, 2019 (Unaudited) | |
Sector designations may be different than the sector designations presented in other Fund materials. The sector designations may represent the investment manager’s internal sector classifications, which may result in the sector designations for one fund being different than another fund’s sector designations.
| Security type / country | Percentage of net assets | |||||||
Common Stock by Country | 96.15 | % | ||||||
Australia | 2.94 | % | ||||||
Austria | 2.55 | % | ||||||
Belgium | 1.26 | % | ||||||
Brazil | 4.99 | % | ||||||
Canada | 8.48 | % | ||||||
China | 2.49 | % | ||||||
Colombia | 1.23 | % | ||||||
Denmark | 1.99 | % | ||||||
Finland | 1.31 | % | ||||||
France | 5.98 | % | ||||||
Germany | 2.57 | % | ||||||
India | 3.09 | % | ||||||
Indonesia | 0.42 | % | ||||||
Ireland | 2.04 | % | ||||||
Israel | 2.64 | % | ||||||
Italy | 1.39 | % | ||||||
Ivory Coast | 1.00 | % | ||||||
Japan | 18.63 | % | ||||||
Netherlands | 0.58 | % | ||||||
Norway | 6.61 | % | ||||||
Poland | 0.99 | % | ||||||
Portugal | 0.60 | % | ||||||
Republic of Korea | 2.75 | % | ||||||
South Africa | 0.93 | % | ||||||
Spain | 0.35 | % | ||||||
Sweden | 3.61 | % | ||||||
Switzerland | 0.94 | % | ||||||
Taiwan | 0.77 | % | ||||||
United Kingdom | 13.02 | % | ||||||
Short-Term Investments | 2.78 | % | ||||||
Total Value of Securities | 98.93 | % | ||||||
Receivables and Other Assets Net of Liabilities | 1.07 | % | ||||||
Total Net Assets | 100.00 | % | ||||||
37
Table of Contents
Security type / country and sector allocations
Delaware International Small Cap Fund
| Common stock by sector | Percentage of net assets | |||||||
Communication Services | 6.26 | % | ||||||
Consumer Discretionary | 9.46 | % | ||||||
Consumer Staples | 14.34 | % | ||||||
Energy | 4.51 | % | ||||||
Financials | 4.39 | % | ||||||
Healthcare | 5.68 | % | ||||||
Industrials | 15.45 | % | ||||||
Information Technology | 18.82 | % | ||||||
Materials | 4.66 | % | ||||||
Real Estate | 9.43 | % | ||||||
Utilities | 3.15 | % | ||||||
Total | 96.15 | % | ||||||
38
Table of Contents
| Security type / country and sector allocations | ||
| Delaware International Value Equity Fund | As of November 30, 2019 (Unaudited) | |
Sector designations may be different than the sector designations presented in other Fund materials. The sector designations may represent the investment manager’s internal sector classifications, which may result in the sector designations for one fund being different than another fund’s sector designations.
| Security type / country | Percentage of net assets | |||||||
Common Stock by Country | 97.61 | % | ||||||
Denmark | 6.59 | % | ||||||
France | 25.59 | % | ||||||
Germany | 6.60 | % | ||||||
Ireland | 1.49 | % | ||||||
Japan | 21.55 | % | ||||||
Netherlands | 7.42 | % | ||||||
Sweden | 3.85 | % | ||||||
Switzerland | 14.93 | % | ||||||
United Kingdom | 9.59 | % | ||||||
Exchange-Traded Fund | 2.01 | % | ||||||
Securities Lending Collateral | 0.09 | % | ||||||
Total Value of Securities | 99.71 | % | ||||||
Obligation to Return Securities Lending Collateral | (0.09 | %) | ||||||
Receivables and Other Assets Net of Liabilities | 0.38 | % | ||||||
Total Net Assets | 100.00 | % | ||||||
39
Table of Contents
Security type / country and sector allocations
Delaware International Value Equity Fund
| Common stock by sector² | Percentage of net assets | |||||||
Communication Services | 13.50 | % | ||||||
Consumer Discretionary | 10.62 | % | ||||||
Consumer Staples* | 38.51 | % | ||||||
Healthcare | 17.95 | % | ||||||
Industrials | 11.59 | % | ||||||
Materials | 5.44 | % | ||||||
Total | 97.61 | % | ||||||
| ² | Narrow industries are utilized for compliance purposes for diversification whereas broad sectors are used for financial reporting. |
| * | To monitor compliance with the Fund’s concentration guidelines as described in the Fund’s Prospectus and Statement of Additional Information, the Consumer Staples sector (as disclosed herein for financial reporting purposes) is subdivided into a variety of “industries” (in accordance with the requirements of the Investment Company Act of 1940, as amended). The Consumer Staples sector consisted of Beverages, Cosmetics/Personal Care, Dairy Products, Miscellaneous/Diversified Food, and Retail. As of Nov. 30, 2019, such amounts, as a percentage of total net assets, were 8.58%, 1.70%, 6.58%, 7.04%, and 14.61%, respectively. The percentage in any such single industry will comply with the Fund’s concentration policy even if the percentage in the Consumer Staples sector for financial reporting purposes may exceed 25%. |
40
Table of Contents
| Schedules of investments | ||
| Delaware Emerging Markets Fund | November 30, 2019 |
| Number of shares | Value (US $) | |||||||
Common Stock – 97.38%D | ||||||||
Argentina – 0.35% | ||||||||
Cablevision Holding GDR † | 443,972 | $ | 1,741,035 | |||||
Cresud ADR † | 1,624,368 | 9,340,116 | ||||||
Grupo Clarin GDR Class B 144A #=† | 131,213 | 131,375 | ||||||
IRSA Inversiones y Representaciones ADR † | 1,184,728 | 6,598,935 | ||||||
IRSA Propiedades Comerciales ADR | 44,833 | 659,945 | ||||||
|
| |||||||
| 18,471,406 | ||||||||
|
| |||||||
Bahrain – 0.02% | ||||||||
Aluminum Bahrain GDR 144A #† | 221,400 | 1,236,032 | ||||||
|
| |||||||
| 1,236,032 | ||||||||
|
| |||||||
Brazil – 10.28% | ||||||||
AES Tiete Energia | 516,085 | 1,532,974 | ||||||
Arcos Dorados Holdings Class A | 3,423,853 | 26,363,668 | ||||||
Atacadao | 2,047,000 | 9,040,897 | ||||||
B2W Cia Digital † | 14,869,129 | 196,419,142 | ||||||
Banco Bradesco ADR | 4,944,000 | 38,810,400 | ||||||
Banco Santander Brasil ADR | 3,051,128 | 31,701,220 | ||||||
BRF ADR † | 6,850,000 | 58,636,000 | ||||||
Embraer ADR | 420,704 | 7,160,382 | ||||||
Itau Unibanco Holding ADR | 9,170,000 | 74,643,800 | ||||||
Rumo † | 1,905,351 | 10,905,701 | ||||||
Telefonica Brasil ADR | 2,500,000 | 32,875,000 | ||||||
TIM Participacoes ADR | 2,024,266 | 32,691,896 | ||||||
Vale ADR † | 2,500,000 | 29,400,000 | ||||||
|
| |||||||
| 550,181,080 | ||||||||
|
| |||||||
Chile – 0.54% | ||||||||
Cia Cervecerias Unidas ADR | 365,790 | 6,770,773 | ||||||
Latam Airlines Group ADR | 236,800 | 2,526,656 | ||||||
Sociedad Quimica y Minera de Chile ADR | 830,000 | 19,778,900 | ||||||
|
| |||||||
| 29,076,329 | ||||||||
|
| |||||||
China – 30.10% | ||||||||
58.com ADR † | 90,000 | 5,536,800 | ||||||
Alibaba Group Holding ADR † | 1,280,000 | 256,000,000 | ||||||
Baidu ADR † | 625,000 | 74,081,250 | ||||||
BeiGene † | 1,615,700 | 24,809,134 | ||||||
Bitauto Holdings ADR † | 454,200 | 6,749,412 | ||||||
China Mengniu Dairy † | 8,120,000 | 31,066,996 | ||||||
China Mobile | 13,698,500 | 103,245,572 | ||||||
China Petroleum & Chemical Class H | 30,000,000 | 16,824,113 | ||||||
CNOOC | 19,311,000 | 28,023,960 | ||||||
Genscript Biotech † | 3,072,000 | 7,417,020 | ||||||
Guangshen Railway Class H | 11,000,000 | 3,428,695 | ||||||
41
Table of Contents
Schedules of investments
Delaware Emerging Markets Fund
| Number of shares | Value (US $) | |||||||
Common StockD(continued) | ||||||||
China(continued) | ||||||||
JD.com ADR † | 2,910,000 | $ | 95,011,500 | |||||
Kunlun Energy | 21,000,000 | 17,786,039 | ||||||
Kweichow Moutai Class A | 969,961 | 155,850,846 | ||||||
PetroChina Class H | 31,688,000 | 14,613,305 | ||||||
Ping An Insurance Group Co. of China Class H | 4,000,000 | 45,324,187 | ||||||
Prosus † | 80,000 | 5,452,974 | ||||||
SINA † | 2,120,000 | 73,966,800 | ||||||
Sinofert Holdings † | 28,000,000 | 2,825,736 | ||||||
Sogou ADR † | 1,500,000 | 7,365,000 | ||||||
Sohu.com ADR † | 2,219,642 | 22,729,134 | ||||||
Tencent Holdings | 4,750,000 | 201,333,665 | ||||||
Tencent Music Entertainment Group ADR † | 1,217 | 15,127 | ||||||
Tianjin Development Holdings | 15,885,550 | 4,383,312 | ||||||
Tingyi Cayman Islands Holding | 23,086,000 | 37,572,019 | ||||||
Trip.com Group ADR † | 830,000 | 27,589,200 | ||||||
Tsingtao Brewery Class H | 12,958,073 | 80,118,386 | ||||||
Uni-President China Holdings | 37,019,000 | 37,595,704 | ||||||
Weibo ADR † | 560,000 | 23,973,600 | ||||||
Wuliangye Yibin Class A | 10,299,780 | 186,968,895 | ||||||
YY ADR † | 170,000 | 10,844,300 | ||||||
ZhongAn Online P&C Insurance Class H 144A #† | 739,600 | 2,555,704 | ||||||
|
| |||||||
| 1,611,058,385 | ||||||||
|
| |||||||
Cyprus – 0.14% | ||||||||
QIWI ADR | 385,284 | 7,636,329 | ||||||
|
| |||||||
| 7,636,329 | ||||||||
|
| |||||||
France – 0.01% | ||||||||
Vallourec † | 258,011 | 663,157 | ||||||
|
| |||||||
| 663,157 | ||||||||
|
| |||||||
India – 10.55% | ||||||||
Aurobindo Pharma | 1,500,000 | 9,407,214 | ||||||
Glenmark Pharmaceuticals | 1,167,988 | 5,491,721 | ||||||
Indiabulls Real Estate GDR † | 102,021 | 96,920 | ||||||
Lupin | 2,500,000 | 27,902,073 | ||||||
RattanIndia Infrastructure GDR † | 300,961 | 7,552 | ||||||
Reliance Industries | 13,880,731 | 300,137,249 | ||||||
Reliance Industries GDR 144A # | 3,775,184 | 163,087,949 | ||||||
Tata Chemicals | 1,866,909 | 17,615,762 | ||||||
Tata Motors † | 3,000,000 | 6,753,790 | ||||||
Tata Motors ADR † | 1,000,000 | 11,220,000 | ||||||
United Breweries | 484,517 | 8,493,864 | ||||||
42
Table of Contents
| Number of shares | Value (US $) | |||||||
Common StockD(continued) | ||||||||
India(continued) | ||||||||
Wockhardt † | 1,200,000 | $ | 4,311,553 | |||||
Zee Entertainment Enterprises | 2,530,000 | 10,335,132 | ||||||
|
| |||||||
| 564,860,779 | ||||||||
|
| |||||||
Indonesia – 0.64% | ||||||||
Astra Agro Lestari | 9,132,500 | 8,158,064 | ||||||
Astra International | 56,000,000 | 25,806,452 | ||||||
|
| |||||||
| 33,964,516 | ||||||||
|
| |||||||
Israel – 0.28% | ||||||||
Teva Pharmaceutical Industries ADR † | 1,450,000 | 15,109,000 | ||||||
|
| |||||||
| 15,109,000 | ||||||||
|
| |||||||
Japan – 0.74% | ||||||||
LINE ADR † | 848,000 | 39,771,200 | ||||||
|
| |||||||
| 39,771,200 | ||||||||
|
| |||||||
Malaysia – 0.06% | ||||||||
UEM Sunrise † | 17,000,000 | 2,889,980 | ||||||
|
| |||||||
| 2,889,980 | ||||||||
|
| |||||||
Mexico – 5.27% | ||||||||
America Movil ADR Class L | 1,500,000 | 22,935,000 | ||||||
Banco Santander Mexico Institucion de Banca Multiple Grupo Financiero Santander ADR | 8,042,900 | 50,750,699 | ||||||
Cemex ADR | 3,623,267 | 13,514,786 | ||||||
Coca-Cola Femsa ADR | 1,554,117 | 89,843,504 | ||||||
Fomento Economico Mexicano ADR | 154,722 | 14,068,871 | ||||||
Grupo Financiero Banorte Class O | 4,000,000 | 21,167,506 | ||||||
Grupo Lala | 3,900,027 | 3,781,458 | ||||||
Grupo Televisa ADR | 6,017,000 | 66,006,490 | ||||||
|
| |||||||
| 282,068,314 | ||||||||
|
| |||||||
Peru – 0.92% | ||||||||
Cia de Minas Buenaventura ADR | 3,217,400 | 49,451,438 | ||||||
|
| |||||||
| 49,451,438 | ||||||||
|
| |||||||
Republic of Korea – 16.20% | ||||||||
KB Financial Group ADR | 245,928 | 9,593,651 | ||||||
LG Display † | 1,000,000 | 12,445,498 | ||||||
LG Electronics | 70,000 | 4,142,573 | ||||||
LG Uplus | 2,403,542 | 27,267,885 | ||||||
Lotte | 433,093 | 13,071,807 | ||||||
Lotte Chilsung Beverage | 56,600 | 6,445,159 | ||||||
Lotte Confectionery | 77,164 | 9,799,433 | ||||||
Samsung Electronics | 6,375,000 | 271,483,300 | ||||||
Samsung Life Insurance | 360,939 | 21,879,721 | ||||||
Shinhan Financial Group | 300,000 | 11,061,254 | ||||||
SK Hynix | 3,490,000 | 239,039,072 | ||||||
43
Table of Contents
Schedules of investments
Delaware Emerging Markets Fund
| Number of shares | Value (US $) | |||||||
Common StockD(continued) | ||||||||
Republic of Korea(continued) | ||||||||
SK Telecom | 517,409 | $ | 107,761,600 | |||||
SK Telecom ADR | 5,800,000 | 132,936,000 | ||||||
|
| |||||||
| 866,926,953 | ||||||||
|
| |||||||
Russia – 7.47% | ||||||||
ENEL RUSSIA PJSC GDR | 21,161 | 15,048 | ||||||
Etalon Group GDR 144A # | 1,616,300 | 2,948,131 | ||||||
Gazprom PJSC ADR | 14,600,000 | 115,982,400 | ||||||
LUKOIL PJSC ADR | 610,000 | 58,169,600 | ||||||
Mail.Ru Group GDR † | 400,000 | 8,080,000 | ||||||
Mobile TeleSystems PJSC ADR | 1,200,000 | 11,328,000 | ||||||
Rosneft Oil PJSC GDR | 14,555,684 | 98,687,537 | ||||||
Sberbank of Russia PJSC | 12,000,000 | 43,639,416 | ||||||
Sberbank of Russia PJSC ADR | 800,000 | 11,704,000 | ||||||
Surgutneftegas PJSC ADR | 2,014,441 | 13,647,838 | ||||||
T Plus PJSC =† | 36,096 | 0 | ||||||
VEON ADR | 732,264 | 1,933,177 | ||||||
Yandex Class A † | 800,000 | 33,576,000 | ||||||
|
| |||||||
| 399,711,147 | ||||||||
|
| |||||||
South Africa – 0.68% | ||||||||
Impala Platinum Holdings † | 2,959,435 | 22,733,823 | ||||||
MultiChoice Group † | 80,000 | 661,591 | ||||||
Naspers Class N | 80,000 | 11,433,374 | ||||||
Sun International † | 364,166 | 983,830 | ||||||
Tongaat Hulett † | 838,307 | 697,368 | ||||||
|
| |||||||
| 36,509,986 | ||||||||
|
| |||||||
Taiwan – 10.18% | ||||||||
FIT Hon Teng 144A # | 20,213,000 | 6,326,205 | ||||||
Hon Hai Precision Industry | 36,000,000 | 104,423,067 | ||||||
MediaTek | 9,000,000 | 124,334,246 | ||||||
Taiwan Semiconductor Manufacturing | 31,000,000 | 309,893,315 | ||||||
|
| |||||||
| 544,976,833 | ||||||||
|
| |||||||
Turkey – 0.97% | ||||||||
Akbank T.A.S. † | 19,500,000 | 26,356,164 | ||||||
Turk Telekomunikasyon † | 951,192 | 1,118,514 | ||||||
Turkcell Iletisim Hizmetleri | 2,427,827 | 5,726,694 | ||||||
Turkcell Iletisim Hizmetleri ADR | 2,066,701 | 12,172,869 | ||||||
Turkiye Sise ve Cam Fabrikalari | 7,651,443 | 6,641,566 | ||||||
|
| |||||||
| 52,015,807 | ||||||||
|
| |||||||
United Kingdom – 0.06% | ||||||||
Griffin Mining † | 3,056,187 | 3,083,121 | ||||||
|
| |||||||
| 3,083,121 | ||||||||
|
| |||||||
44
Table of Contents
| Number of shares | Value (US $) | |||||||
Common StockD(continued) | ||||||||
United States – 1.92% | ||||||||
Micron Technology † | 2,163,400 | $ | 102,783,134 | |||||
|
| |||||||
| 102,783,134 | ||||||||
|
| |||||||
Total Common Stock (cost $4,866,808,391) | 5,212,444,926 | |||||||
| ||||||||
Preferred Stock – 2.69%D | ||||||||
| ||||||||
Brazil – 1.33% | ||||||||
Braskem Class A 2.91% | 1,470,000 | 9,724,855 | ||||||
Petroleo Brasileiro ADR 4.32% | 4,000,000 | 54,880,000 | ||||||
Usinas Siderurgicas de Minas Gerais Usiminas Class A 1.81% | 3,235,733 | 6,527,195 | ||||||
|
| |||||||
| 71,132,050 | ||||||||
|
| |||||||
Republic of Korea – 0.77% | ||||||||
Samsung Electronics 3.46% | 1,183,100 | 40,917,441 | ||||||
|
| |||||||
| 40,917,441 | ||||||||
|
| |||||||
Russia – 0.59% | ||||||||
Transneft PJSC 6.40% | 12,000 | 31,687,908 | ||||||
|
| |||||||
| 31,687,908 | ||||||||
|
| |||||||
Total Preferred Stock(cost $75,666,117) | 143,737,399 | |||||||
| ||||||||
Exchange-Traded Fund – 0.14% | ||||||||
| ||||||||
iShares MSCI Turkey ETF | 290,275 | 7,703,899 | ||||||
|
| |||||||
Total Exchange-Traded Fund(cost $13,207,352) | 7,703,899 | |||||||
| ||||||||
Participation Notes – 0.00% | ||||||||
| ||||||||
Lehman Indian Oil | ||||||||
CW 12 LEPO =† | 172,132 | 0 | ||||||
Lehman Oil & Natural Gas | ||||||||
CW 12 LEPO =† | 254,590 | 0 | ||||||
|
| |||||||
Total Participation Notes(cost $8,559,056) | 0 | |||||||
Total Value of Securities – 100.21% (cost $4,964,240,916) | $ | 5,363,886,224 | ||||||
|
| |||||||
| # | Security exempt from registration under Rule 144A of the Securities Act of 1933, as amended. At Nov. 30, 2019, the aggregate value of Rule 144A securities was $176,285,396, which represents 3.29% of the Fund’s net assets. See Note 11 in “Notes to financial statements.” |
| = | The value of this security was determined using significant unobservable inputs and is reported as a Level 3 security in the disclosure table located in Note 3 in “Notes to financial statements.” |
| D | Securities have been classified by country of origin. Aggregate classification by business sector has been presented on page 33 in “Security type / country and sector allocations.” |
45
Table of Contents
Schedules of investments
Delaware Emerging Markets Fund
| † | Non-income producing security. |
The following foreign currency exchange contracts were outstanding at Nov. 30, 2019:1
Foreign Currency Exchange Contracts
Counterparty | Contracts to Receive (Deliver) | In Exchange For | Settlement Date | Unrealized Appreciation | Unrealized Depreciation | |||||||||||||||||||||||
BNYM | HKD | (7,549,919) | USD | 964,552 | 12/2/19 | $ | 90 | $ | — | |||||||||||||||||||
BNYM | ZAR | (3,406,835) | USD | 230,796 | 12/2/19 | — | (1,528 | ) | ||||||||||||||||||||
BNYM | ZAR | (1,159,925) | USD | 78,534 | 12/3/19 | — | (553 | ) | ||||||||||||||||||||
|
|
|
| |||||||||||||||||||||||||
Total Foreign Currency Exchange Contracts |
| $ | 90 | $ | (2,081 | ) | ||||||||||||||||||||||
|
|
|
| |||||||||||||||||||||||||
The use of foreign currency exchange contracts involves elements of market risk and risks in excess of the amounts disclosed in the financial statements. The foreign currency exchange contracts presented above represents the Fund’s total exposure in such contracts, whereas only the net unrealized appreciation (depreciation) is reflected in the Fund’s net assets.
1See Note 8 in “Notes to financial statements.”
Summary of abbreviations:
ADR – American Depositary Receipt
BNYM – The Bank of New York Mellon
ETF – Exchange-Traded Fund
GDR – Global Depositary Receipt
HKD – Hong Kong Dollar
LEPO – Low Exercise Price Option
PJSC – Public Joint Stock Company
USD – US Dollar
ZAR – South African Rand
See accompanying notes, which are an integral part of the financial statements.
46
Table of Contents
Schedules of investments
| Delaware Global Value Fund | November 30, 2019 |
| Number of shares | Value (US $) | |||||||
Common Stock – 98.66%D |
| |||||||
Denmark – 4.49% | ||||||||
Novo Nordisk Class B | 10,560 | $ | 593,544 | |||||
|
| |||||||
| 593,544 | ||||||||
|
| |||||||
France – 18.68% | ||||||||
Air Liquide | 3,725 | 504,976 | ||||||
Danone | 8,760 | 721,116 | ||||||
Orange † | 22,630 | 373,972 | ||||||
Publicis Groupe | 10,190 | 448,379 | ||||||
Sodexo | 3,630 | 423,112 | ||||||
|
| |||||||
| 2,471,555 | ||||||||
|
| |||||||
Germany – 4.49% | ||||||||
adidas AG | 470 | 146,408 | ||||||
Fresenius Medical Care AG & Co. | 6,100 | 447,308 | ||||||
|
| |||||||
| 593,716 | ||||||||
|
| |||||||
Ireland – 1.07% | ||||||||
Kerry Group Class A | 1,100 | 141,062 | ||||||
|
| |||||||
| 141,062 | ||||||||
|
| |||||||
Japan – 15.28% | ||||||||
Asahi Group Holdings | 5,700 | 274,233 | ||||||
Kao | 1,600 | 125,889 | ||||||
KDDI | 17,000 | 487,534 | ||||||
Kirin Holdings | 5,100 | 112,898 | ||||||
Lawson | 3,700 | 201,471 | ||||||
Makita | 7,100 | 234,818 | ||||||
Secom | 1,400 | 119,042 | ||||||
Seven & i Holdings | 12,500 | 465,717 | ||||||
|
| |||||||
| 2,021,602 | ||||||||
|
| |||||||
Netherlands – 5.19% | ||||||||
Koninklijke Ahold Delhaize | 26,670 | 687,106 | ||||||
|
| |||||||
| 687,106 | ||||||||
|
| |||||||
Sweden – 2.68% | ||||||||
Securitas Class B | 21,350 | 353,970 | ||||||
|
| |||||||
| 353,970 | ||||||||
|
| |||||||
Switzerland – 10.46% | ||||||||
Nestle | 4,940 | 513,365 | ||||||
Roche Holding | 1,915 | 590,203 | ||||||
Swatch Group | 1,000 | 280,000 | ||||||
|
| |||||||
| 1,383,568 | ||||||||
|
| |||||||
United Kingdom – 5.89% | ||||||||
Diageo | 7,750 | 317,242 | ||||||
47
Table of Contents
Schedules of investments
Delaware Global Value Fund
| Number of shares | Value (US $) | |||||||
| ||||||||
Common StockD(continued) | ||||||||
| ||||||||
United Kingdom(continued) | ||||||||
G4S | 116,740 | $ | 315,711 | |||||
Next | 1,670 | 145,966 | ||||||
|
| |||||||
| 778,919 | ||||||||
|
| |||||||
United States – 30.43% | ||||||||
Clorox | 2,140 | 317,212 | ||||||
Conagra Brands | 15,000 | 433,050 | ||||||
General Mills | 11,720 | 624,910 | ||||||
Hormel Foods * | 7,580 | 337,537 | ||||||
Kimberly-Clark | 4,720 | 643,525 | ||||||
Lamb Weston Holdings | 5,120 | 429,978 | ||||||
Merck & Co. | 6,020 | 524,824 | ||||||
Mondelez International Class A | 3,170 | 166,552 | ||||||
Pfizer | 9,550 | 367,866 | ||||||
Waste Management | 1,600 | 180,656 | ||||||
|
| |||||||
| 4,026,110 | ||||||||
|
| |||||||
Total Common Stock(cost $12,579,883) | 13,051,152 | |||||||
| ||||||||
Exchange-Traded Fund – 1.31% | ||||||||
| ||||||||
Vanguard S&P 500 ETF | 600 | 173,190 | ||||||
Total Exchange-Traded Fund(cost $165,468) | 173,190 | |||||||
| ||||||||
Short-Term Investments – 0.03% | ||||||||
| ||||||||
Money Market Mutual Funds – 0.03% | ||||||||
BlackRock FedFund – Institutional Shares(seven-day effective yield 1.55%) | 790 | 790 | ||||||
Fidelity Investments Money Market Government Portfolio – Class I(seven-day effective yield 1.53%) | 790 | 790 | ||||||
GS Financial Square Government Fund – Institutional Shares(seven-day effective yield 1.54%) | 790 | 790 | ||||||
Morgan Stanley Government Portfolio – Institutional Share Class(seven-day effective yield 1.52%) | 790 | 790 | ||||||
State Street Institutional US Government Money Market Fund – Investor Class(seven-day effective yield 1.51%) | 790 | 789 | ||||||
|
| |||||||
Total Short-Term Investments(cost $3,949) | 3,949 | |||||||
Total Value of Securities – 100.00% (cost $12,749,300) | $ 13,228,291∎ | |||||||
| * | Fully or partially on loan. |
| ∎ | Includes $337,537 of securities loaned for which the counterparty pledged additionalnon-cash collateral valued at $347,270. |
48
Table of Contents
| D | Securities have been classified by country of origin. Aggregate classification by business sector has been presented on page 35 in “Security type / country and sector allocations.” |
| † | Non-income producing security. |
The following foreign currency exchange contracts were outstanding at Nov. 30, 2019:1
Foreign Currency Exchange Contracts
Counterparty | Contract to Receive (Deliver) | In Exchange For | Settlement Date | Unrealized Depreciation | ||||||||||||
BNYM | CHF | (4,115) | USD | 4,111 | 12/3/19 | $ | (5 | ) | ||||||||
BNYM | EUR | (2,214) | USD | 2,438 | 12/3/19 | (2 | ) | |||||||||
BNYM | JPY | (331,965) | USD | 3,030 | 12/2/19 | (3 | ) | |||||||||
|
| |||||||||||||||
Total Foreign Currency Exchange Contracts | $ | (10 | ) | |||||||||||||
|
| |||||||||||||||
The use of foreign currency exchange contracts involves elements of market risk and risks in excess of the amounts disclosed in the financial statements. The foreign currency exchange contracts presented above represent the Fund’s total exposure in such contracts, whereas only the net unrealized appreciation (depreciation) is reflected in the Fund’s net assets.
1See Note 8 in “Notes to financial statements.”
Summary of abbreviations:
AG – Aktiengesellschaft
BNYM – The Bank of New York Mellon
CHF – Swiss Franc
EUR – European Monetary Unit
ETF – Exchange-Traded Fund
GS – Goldman Sachs
JPY – Japanese Yen
S&P – Standard & Poor’s
USD – US Dollar
See accompanying notes, which are an integral part of the financial statements.
49
Table of Contents
Schedules of investments
| Delaware International Small Cap Fund | November 30, 2019 |
| Number of shares | Value (US $) | |||||||
Common Stock – 96.15%D |
| |||||||
Australia – 2.94% | ||||||||
Afterpay † | 98,684 | $ | 2,109,295 | |||||
Technology One | 184,389 | 1,146,183 | ||||||
Westgold Resources † | 545,186 | 737,528 | ||||||
Westgold Resources =† | 136,297 | 0 | ||||||
|
| |||||||
| 3,993,006 | ||||||||
|
| |||||||
Austria – 2.55% | ||||||||
CA Immobilien Anlagen | 60,414 | 2,479,289 | ||||||
Vienna Insurance Group AG Wiener Versicherung Gruppe | 35,887 | 992,371 | ||||||
|
| |||||||
| 3,471,660 | ||||||||
|
| |||||||
Belgium – 1.26% | ||||||||
Fagron | 83,984 | 1,714,491 | ||||||
|
| |||||||
| 1,714,491 | ||||||||
|
| |||||||
Brazil – 4.99% | ||||||||
Arezzo Industria e Comercio | 95,152 | 1,387,825 | ||||||
Construtora Tenda | 218,337 | 1,226,520 | ||||||
Cyrela Brazil Realty SA Empreendimentos e Participacoes | 180,446 | 1,138,404 | ||||||
Minerva † | 609,635 | 2,078,383 | ||||||
Rumo † | 166,524 | 953,137 | ||||||
|
| |||||||
| 6,784,269 | ||||||||
|
| |||||||
Canada – 8.48% | ||||||||
ATS Automation Tooling Systems † | 46,476 | 688,235 | ||||||
Capital Power | 87,043 | 2,182,136 | ||||||
Descartes Systems Group † | 37,161 | 1,595,492 | ||||||
Fortuna Silver Mines † | 164,680 | 540,544 | ||||||
Granite Real Estate Investment Trust | 30,494 | 1,573,714 | ||||||
Kinaxis † | 17,220 | 1,371,585 | ||||||
Quebecor Class B | 62,338 | 1,545,896 | ||||||
SSR Mining † | 131,222 | 2,040,990 | ||||||
|
| |||||||
| 11,538,592 | ||||||||
|
| |||||||
China – 2.49% | ||||||||
China Resources Cement Holdings | 1,388,000 | 1,661,405 | ||||||
Greentown Service Group | 1,286,000 | 1,407,888 | ||||||
Lonking Holdings | 1,129,000 | 321,622 | ||||||
|
| |||||||
| 3,390,915 | ||||||||
|
| |||||||
Colombia – 1.23% | ||||||||
Geopark | 92,684 | 1,673,873 | ||||||
|
| |||||||
| 1,673,873 | ||||||||
|
| |||||||
Denmark – 1.99% | ||||||||
Royal Unibrew | 30,081 | 2,707,339 | ||||||
|
| |||||||
| 2,707,339 | ||||||||
|
| |||||||
50
Table of Contents
| Number of shares | Value (US $) | |||||||
Common StockD(continued) |
| |||||||
Finland – 1.31% | ||||||||
Kojamo | 64,380 | $ | 1,062,493 | |||||
Valmet | 32,361 | 724,451 | ||||||
|
| |||||||
| 1,786,944 | ||||||||
|
| |||||||
France – 5.98% | ||||||||
Alten | 13,390 | 1,545,985 | ||||||
Gaztransport Et Technigaz | 13,600 | 1,201,646 | ||||||
Korian | 34,757 | 1,528,608 | ||||||
Remy Cointreau | 8,147 | 1,049,242 | ||||||
SOITEC † | 16,984 | 1,796,282 | ||||||
Solutions 30 † | 95,296 | 1,011,556 | ||||||
|
| |||||||
| 8,133,319 | ||||||||
|
| |||||||
Germany – 2.57% | ||||||||
Evotec † | 55,296 | 1,225,093 | ||||||
TAG Immobilien † | 94,453 | 2,272,646 | ||||||
|
| |||||||
| 3,497,739 | ||||||||
|
| |||||||
India – 3.09% | ||||||||
Info Edge India | 39,439 | 1,447,952 | ||||||
Varun Beverages | 143,062 | 1,442,236 | ||||||
Voltas | 135,058 | 1,318,998 | ||||||
|
| |||||||
| 4,209,186 | ||||||||
|
| |||||||
Indonesia – 0.42% | ||||||||
Ace Hardware Indonesia | 5,069,300 | 567,848 | ||||||
|
| |||||||
| 567,848 | ||||||||
|
| |||||||
Ireland – 2.04% | ||||||||
C&C Group | 206,897 | 1,043,602 | ||||||
Hibernia REIT | 609,658 | 979,281 | ||||||
Keywords Studios | 41,598 | 756,977 | ||||||
|
| |||||||
| 2,779,860 | ||||||||
|
| |||||||
Israel – 2.64% | ||||||||
Israel Discount Bank Class A | 781,315 | 3,596,749 | ||||||
|
| |||||||
| 3,596,749 | ||||||||
|
| |||||||
Italy – 1.39% | ||||||||
Reply | 24,180 | 1,894,040 | ||||||
|
| |||||||
| 1,894,040 | ||||||||
|
| |||||||
Ivory Coast – 1.00% | ||||||||
Endeavour Mining † | 71,191 | 1,359,720 | ||||||
|
| |||||||
| 1,359,720 | ||||||||
|
| |||||||
Japan – 18.63% | ||||||||
Anritsu | 143,500 | 2,728,276 | ||||||
Daifuku | 47,100 | 2,741,099 | ||||||
Fancl | 97,300 | 2,597,511 | ||||||
51
Table of Contents
Schedules of investments
Delaware International Small Cap Fund
| Number of shares | Value (US $) | |||||||
Common StockD(continued) |
| |||||||
Japan(continued) | ||||||||
Japan Elevator Service Holdings | 75,200 | $ | 2,001,349 | |||||
Katitas | 36,300 | 1,621,735 | ||||||
Kusuri no Aoki Holdings | 20,500 | 1,560,139 | ||||||
Matsumotokiyoshi Holdings | 57,400 | 2,192,061 | ||||||
NET One Systems | 67,900 | 1,907,565 | ||||||
SCREEN Holdings | 18,100 | 1,261,733 | ||||||
SMS | 84,800 | 2,296,352 | ||||||
Taiyo Yuden | 37,900 | 992,384 | ||||||
TechnoPro Holdings | 51,800 | 3,445,288 | ||||||
|
| |||||||
| 25,345,492 | ||||||||
|
| |||||||
Netherlands – 0.58% | ||||||||
IMCD | 9,539 | 793,438 | ||||||
|
| |||||||
| 793,438 | ||||||||
|
| |||||||
Norway – 6.61% | ||||||||
BW Offshore † | 266,975 | 1,769,015 | ||||||
Leroy Seafood Group | 135,622 | 858,172 | ||||||
Norway Royal Salmon | 40,244 | 1,047,432 | ||||||
Scatec Solar | 176,708 | 2,103,963 | ||||||
TGS NOPEC Geophysical | 52,397 | 1,492,833 | ||||||
Tomra Systems | 57,790 | 1,722,379 | ||||||
|
| |||||||
| 8,993,794 | ||||||||
|
| |||||||
Poland – 0.99% | ||||||||
Dino Polska † | 39,016 | 1,346,788 | ||||||
|
| |||||||
| 1,346,788 | ||||||||
|
| |||||||
Portugal – 0.60% | ||||||||
NOS SGPS | 149,026 | 808,432 | ||||||
|
| |||||||
| 808,432 | ||||||||
|
| |||||||
Republic of Korea – 2.75% | ||||||||
AfreecaTV | 17,074 | 980,076 | ||||||
Douzone Bizon | 25,809 | 1,560,143 | ||||||
WONIK IPS | 46,408 | 1,198,361 | ||||||
|
| |||||||
| 3,738,580 | ||||||||
|
| |||||||
South Africa – 0.93% | ||||||||
Clicks Group | 74,045 | 1,265,150 | ||||||
|
| |||||||
| 1,265,150 | ||||||||
|
| |||||||
Spain – 0.35% | ||||||||
CIE Automotive | 19,434 | 468,460 | ||||||
|
| |||||||
| 468,460 | ||||||||
|
| |||||||
Sweden – 3.61% | ||||||||
Embracer Group † | 217,418 | 1,539,017 | ||||||
52
Table of Contents
| Number of shares | Value (US $) | |||||||
Common StockD(continued) |
| |||||||
Sweden(continued) | ||||||||
Evolution Gaming Group | 102,143 | $ | 2,698,034 | |||||
MIPS | 35,888 | 676,683 | ||||||
|
| |||||||
| 4,913,734 | ||||||||
|
| |||||||
Switzerland – 0.94% | ||||||||
Logitech International | 29,324 | 1,281,752 | ||||||
|
| |||||||
| 1,281,752 | ||||||||
|
| |||||||
Taiwan – 0.77% | ||||||||
Kindom Development | 1,029,000 | 1,043,823 | ||||||
|
| |||||||
| 1,043,823 | ||||||||
|
| |||||||
United Kingdom – 13.02% | ||||||||
Abcam | 106,986 | 1,847,244 | ||||||
Beazley | 201,375 | 1,385,585 | ||||||
boohoo Group † | 812,515 | 3,314,432 | ||||||
Countryside Properties | 272,430 | 1,394,591 | ||||||
Dechra Pharmaceuticals | 38,463 | 1,409,805 | ||||||
Fevertree Drinks | 11,326 | 320,509 | ||||||
Future | 128,045 | 2,189,325 | ||||||
GB Group | 165,378 | 1,445,907 | ||||||
QinetiQ Group | 308,370 | 1,332,891 | ||||||
Rotork | 300,439 | 1,273,742 | ||||||
UNITE Group | 111,207 | 1,799,308 | ||||||
|
| |||||||
| 17,713,339 | ||||||||
|
| |||||||
Total Common Stock (cost $112,214,080) | 130,812,332 | |||||||
|
| |||||||
| ||||||||
Short-Term Investments – 2.78% | ||||||||
Money Market Mutual Funds – 2.78% | ||||||||
BlackRock FedFund – Institutional Shares(seven-day effective yield 1.55%) | 758,142 | 758,142 | ||||||
Fidelity Investments Money Market Government Portfolio – Class I(seven-day effective yield 1.53%) | 758,142 | 758,142 | ||||||
GS Financial Square Government Fund – Institutional Shares(seven-day effective yield 1.54%) | 758,142 | 758,142 | ||||||
Morgan Stanley Government Portfolio – Institutional Share Class(seven-day effective yield 1.52%) | 758,142 | 758,141 | ||||||
State Street Institutional US Government Money Market Fund – Investor Class(seven-day effective yield 1.51%) | 758,142 | 758,141 | ||||||
|
| |||||||
Total Short-Term Investments(cost $3,790,708) | 3,790,708 | |||||||
|
| |||||||
Total Value of Securities – 98.93% (cost $116,004,788) | $ | 134,603,040 | ||||||
|
| |||||||
53
Table of Contents
Schedules of investments
Delaware International Small Cap Fund
| = | The value of this security was determined using significant unobservable inputs and is reported as a Level 3 security in the disclosure table located in Note 3 in “Notes to financial statements.” |
| D | Securities have been classified by country of origin. Aggregate classification by business sector has been presented on page 37 in “Security type / country and sector allocations.” |
| † | Non-income producing security. |
The following foreign currency exchange contracts were outstanding at Nov. 30, 2019:1
| Foreign Currency Exchange Contracts | ||||||||||||||||||||||
Counterparty | Contracts to Receive (Deliver) | In Exchange For | Settlement | Unrealized Appreciation | Unrealized Depreciation | |||||||||||||||||
BNYM | GBP | (84,738) | USD | 109,251 | 12/2/19 | $ | — | $ | (355 | ) | ||||||||||||
BNYM | INR | (98,597) | USD | 1,378 | 12/2/19 | 4 | — | |||||||||||||||
BNYM | JPY | (371,682) | USD | 3,391 | 12/3/19 | — | (5 | ) | ||||||||||||||
|
|
|
| |||||||||||||||||||
Total Foreign Currency Exchange Contracts | $ | 4 | $ | (360 | ) | |||||||||||||||||
|
|
|
| |||||||||||||||||||
The use of foreign currency exchange contracts involves elements of market risk and risks in excess of the amounts disclosed in the financial statements. The foreign currency exchange contracts presented above represent the Fund’s total exposure in such contracts, whereas only the net unrealized appreciation (depreciation) is reflected in the Fund’s net assets.
1See Note 8 in “Notes to financial statements.”
Summary of abbreviations:
BNYM – The Bank of New York Mellon
GBP – British Pound Sterling
GS – Goldman Sachs
INR – Indian Rupee
JPY – Japanese Yen
REIT – Real Estate Investment Trust
USD – US Dollar
See accompanying notes, which are an integral part of the financial statements.
54
Table of Contents
Schedules of investments
| Delaware International Value Equity Fund | November 30, 2019 |
| Number of shares | Value (US $) | |||||
Common Stock – 97.61%D | ||||||
Denmark – 6.59% | ||||||
Novo Nordisk Class B | 358,420 | $ 20,145,634 | ||||
| ||||||
| 20,145,634 | ||||||
| ||||||
France – 25.59% | ||||||
Air Liquide | 122,700 | 16,633,726 | ||||
Danone | 244,515 | 20,128,236 | ||||
Orange † | 795,260 | 13,142,069 | ||||
Publicis Groupe | 333,630 | 14,680,353 | ||||
Sodexo * | 116,890 | 13,624,682 | ||||
| ||||||
| 78,209,066 | ||||||
| ||||||
Germany – 6.60% | ||||||
adidas AG | 15,610 | 4,862,604 | ||||
Fresenius Medical Care AG & Co. | 208,950 | 15,322,126 | ||||
| ||||||
| 20,184,730 | ||||||
| ||||||
Ireland – 1.49% | ||||||
Kerry Group Class A | 35,500 | 4,552,445 | ||||
| ||||||
| 4,552,445 | ||||||
| ||||||
Japan – 21.55% | ||||||
Asahi Group Holdings | 195,600 | 9,410,530 | ||||
Kao | 66,000 | 5,192,929 | ||||
KDDI | 468,900 | 13,447,326 | ||||
Kirin Holdings | 177,500 | 3,929,309 | ||||
Lawson | 122,000 | 6,643,095 | ||||
Makita | 234,000 | 7,739,071 | ||||
Secom | 49,400 | 4,200,501 | ||||
Seven & i Holdings | 410,800 | 15,305,307 | ||||
| ||||||
| 65,868,068 | ||||||
| ||||||
Netherlands – 7.42% | ||||||
Koninklijke Ahold Delhaize | 880,920 | 22,695,366 | ||||
| ||||||
| 22,695,366 | ||||||
| ||||||
Sweden – 3.85% | ||||||
Securitas Class B | 709,340 | 11,760,433 | ||||
| ||||||
| 11,760,433 | ||||||
| ||||||
Switzerland – 14.93% | ||||||
Nestle | 163,160 | 16,955,587 | ||||
Roche Holding | 62,980 | 19,410,436 | ||||
Swatch Group | 33,100 | 9,268,000 | ||||
| ||||||
| 45,634,023 | ||||||
| ||||||
United Kingdom – 9.59% | ||||||
Diageo | 314,780 | 12,885,371 | ||||
55
Table of Contents
Schedules of investments
Delaware International Value Equity Fund
| Number of shares | Value (US $) | |||||||
Common StockD(continued) |
| |||||||
United Kingdom(continued) | ||||||||
G4S | 4,337,140 | $ | 11,729,339 | |||||
Next | 53,770 | 4,699,745 | ||||||
|
| |||||||
| 29,314,455 | ||||||||
|
| |||||||
Total Common Stock(cost $290,986,991) | 298,364,220 | |||||||
| ||||||||
Exchange-Traded Fund – 2.01% | ||||||||
| ||||||||
Vanguard FTSE Developed Markets ETF* | 142,790 | 6,135,686 | ||||||
|
| |||||||
Total Exchange-Traded Fund(cost $5,844,834) | 6,135,686 | |||||||
Total Value of Securities Before Securities Lending Collateral – 99.62% | 304,499,906 | |||||||
| Principal amount° | ||||||||
| ||||||||
Security Lending Collateral – 0.09%** | ||||||||
| ||||||||
Repurchase Agreements – 0.09% | ||||||||
Bank of Montreal | 65,660 | 65,660 | ||||||
Bank of Nova Scotia | 65,660 | 65,660 | ||||||
BofA Securities | 65,660 | 65,660 | ||||||
Credit Agricole | 65,660 | 65,660 | ||||||
JP Morgan Securities | 18,967 | 18,967 | ||||||
|
| |||||||
Total Securities Lending Collateral(cost $281,607) | 281,607 | |||||||
56
Table of Contents
Total Value of Securities – 99.71% | $ | 304,781,513∎ | ||
|
|
| * | Fully or partially on loan. |
| ** | See Note 10 in “Notes to financial statements” for additional information on securities lending collateral. |
| ∎ | Includes $272,151 of securities loaned. |
| ° | Principal amount shown is stated in USD unless noted that the security is denominated in another currency. |
| D | Securities have been classified by country of origin. Aggregate classification by business sector has been presented on page 39 in “Security type / country and sector allocations.” |
| † | Non-income producing security. |
The following foreign currency exchange contracts were outstanding at Nov. 30, 2019:1
Foreign Currency Exchange Contracts
Counterparty | Contract to Receive (Deliver) | In Exchange For | Settlement Date | Unrealized Depreciation | ||||||||||||
BNYM | JPY | (5,458,456) | USD | 49,826 | 12/2/19 | $ | (51 | ) | ||||||||
The use of foreign currency exchange contracts involves elements of market risk and risks in excess of the amounts disclosed in the financial statements. The foreign currency exchange contracts presented above represent the Fund’s total exposure in such contracts, whereas only the net unrealized appreciation (depreciation) is reflected in the Fund’s net assets.
1See Note 8 in “Notes to financial statements.”
Summary of abbreviations:
AG – Aktiengesellschaft
BNYM – The Bank of New York Mellon
ETF – Exchange-Traded Fund
FTSE – Financial Times Stock Exchange 100 Index
JPY – Japanese Yen
USD – US Dollar
See accompanying notes, which are an integral part of the financial statements.
57
Table of Contents
Statements of assets and liabilities
November 30, 2019
Delaware Markets Fund | Delaware Value Fund | |||||||
Assets: | ||||||||
Investments, at value1,2 | $ | 5,363,886,224 | $ | 13,228,291 | ||||
Foreign currencies, at value3 | 1,826,521 | 10,942 | ||||||
Receivable for fund shares sold | 6,862,957 | 86 | ||||||
Dividends and interest receivable | 4,863,881 | 34,773 | ||||||
Receivable for securities sold | 1,384,116 | 6,556 | ||||||
Foreign tax reclaims receivable | 129,115 | 22,566 | ||||||
Securities lending income receivable | — | 46 | ||||||
Investment management fees receivable | — | 5,029 | ||||||
Unrealized appreciation on foreign currency exchange contracts | 90 | — | ||||||
|
|
|
| |||||
Total assets | 5,378,952,904 | 13,308,289 | ||||||
|
|
|
| |||||
Liabilities: | ||||||||
Cash due to custodian | 4,413,199 | 7,573 | ||||||
Payable for fund shares redeemed | 4,526,765 | 10,420 | ||||||
Capital gains tax payable | 8,349,651 | — | ||||||
Investment management fees payable to affiliates | 5,337,297 | — | ||||||
Custody fees payable | 2,179,559 | 12,544 | ||||||
Dividend disbursing and transfer agent fees and expenses payable | 808,491 | 8,538 | ||||||
Reports and statements to shareholders payable | 295,547 | 4,061 | ||||||
Distribution fees payable to affiliates | 203,187 | 3,148 | ||||||
Accounting and administration expenses payable | 183,069 | 14,535 | ||||||
Other accrued expenses | 42,056 | 2,730 | ||||||
Dividend disbursing and transfer agent fees and expenses payable to affiliates | 38,363 | 136 | ||||||
Legal fees payable to affiliates | 20,884 | 50 | ||||||
Registration fees payable | 19,206 | 9,236 | ||||||
Accounting and administration expenses payable to affiliates | 15,091 | 381 | ||||||
Audit and tax fees payable | 6,610 | 6,610 | ||||||
Unrealized depreciation on foreign currency exchange contracts | 2,081 | 10 | ||||||
Trustees’ fees and expenses payable | 80 | 1 | ||||||
Reports and statements to shareholders payable to affiliates | — | 8 | ||||||
Other liabilities | — | 4 | ||||||
|
|
|
| |||||
Total liabilities | 26,441,136 | 79,985 | ||||||
|
|
|
| |||||
Total Net Assets | $ | 5,352,511,768 | $ | 13,228,304 | ||||
|
|
|
| |||||
58
Table of Contents
Delaware Markets Fund | Delaware Value Fund | |||||||
Net Assets Consist of: | ||||||||
Paid-in capital | $ | 5,020,297,100 | $ | 9,823,808 | ||||
Total distributable earnings (loss) | 332,214,668 | 3,404,496 | ||||||
|
|
|
| |||||
Total Net Assets | $ | 5,352,511,768 | $ | 13,228,304 | ||||
|
|
|
| |||||
Net Asset Value | ||||||||
Class A: | ||||||||
Net assets | $ | 346,731,800 | $ | 10,694,888 | ||||
Shares of beneficial interest outstanding, unlimited authorization, no par | 18,128,968 | 867,859 | ||||||
Net asset value per share | $ | 19.13 | $ | 12.32 | ||||
Sales charge | 5.75 | % | 5.75 | % | ||||
Offering price per share, equal to net asset value per share / (1 – sales charge) | $ | 20.30 | $ | 13.07 | ||||
Class C: | ||||||||
Net assets | $ | 135,346,134 | $ | 1,111,122 | ||||
Shares of beneficial interest outstanding, unlimited authorization, no par | 7,659,497 | 91,649 | ||||||
Net asset value per share | $ | 17.67 | $ | 12.12 | ||||
Class R: | ||||||||
Net assets | $ | 43,962,403 | $ | — | ||||
Shares of beneficial interest outstanding, unlimited authorization, no par | 2,284,343 | — | ||||||
Net asset value per share | $ | 19.25 | $ | — | ||||
Institutional Class: | ||||||||
Net assets | $ | 3,826,271,798 | $ | 1,422,294 | ||||
Shares of beneficial interest outstanding, unlimited authorization, no par | 198,535,245 | 114,901 | ||||||
Net asset value per share | $ | 19.27 | $ | 12.38 | ||||
59
Table of Contents
Statements of assets and liabilities
Delaware Markets Fund | Delaware Value Fund | |||||||
Class R6: | ||||||||
Net assets | $ | 1,000,199,633 | $ | — | ||||
Shares of beneficial interest outstanding, unlimited authorization, no par | 51,864,502 | — | ||||||
Net asset value per share | $ | 19.28 | $ | — | ||||
| ||||||||
1Investments, at cost | $ | 4,964,240,916 | $ | 12,749,300 | ||||
2Including securities on loan | — | 337,537 | ||||||
3Foreign currencies, at cost | 1,846,951 | 10,892 | ||||||
See accompanying notes, which are an integral part of the financial statements.
60
Table of Contents
Delaware Fund | Delaware Fund | |||||||
Assets: | ||||||||
Investments, at value1,2 | $ | 134,603,040 | $ | 304,499,906 | ||||
Short-term investments held as collateral for loaned securities, at value3 | — | 281,607 | ||||||
Foreign currencies, at value4 | 1,083,748 | 719,209 | ||||||
Cash | 46,570 | — | ||||||
Receivable for fund shares sold | 256,376 | 148,288 | ||||||
Dividends and interest receivable | 113,169 | 290,021 | ||||||
Foreign tax reclaims receivable | 109,767 | 1,160,811 | ||||||
Receivable for securities sold | 94,672 | 166,310 | ||||||
Securities lending income receivable | — | 142 | ||||||
Unrealized appreciation on foreign currency exchange contracts | 4 | — | ||||||
|
|
|
| |||||
Total assets | 136,307,346 | 307,266,294 | ||||||
|
|
|
| |||||
Liabilities: | ||||||||
Cash due to custodian | — | 550,089 | ||||||
Payable for fund shares redeemed | 107,565 | 346,383 | ||||||
Obligation to return securities lending collateral | — | 280,376 | ||||||
Custody fees payable | 38,505 | 59,757 | ||||||
Investment management fees payable to affiliates | 24,647 | 213,717 | ||||||
Dividend disbursing and transfer agent fees and expenses payable | 18,800 | 44,695 | ||||||
Accounting and Administration expenses payable | 18,047 | 23,560 | ||||||
Registration fees payable | 13,194 | 16,496 | ||||||
Other accrued expenses | 9,016 | 12,610 | ||||||
Reports and statements to shareholders payable | 8,759 | 20,432 | ||||||
Audit and tax fees payable | 6,610 | — | ||||||
Distribution fees payable to affiliates | 5,161 | 21,340 | ||||||
Dividend disbursing and transfer agent fees and expenses payable to affiliates | 958 | 2,213 | ||||||
Accounting and administration expenses payable to affiliates | 697 | 1,180 | ||||||
Legal fees payable to affiliates | 236 | 553 | ||||||
Reports and statements to shareholders payable to affiliates | 78 | 175 | ||||||
Trustees’ fees and expenses payable | 2 | 5 | ||||||
Unrealized depreciation on foreign currency exchange contracts | 360 | 51 | ||||||
Other liabilities | — | 1,257 | ||||||
|
|
|
| |||||
Total liabilities | 252,635 | 1,594,889 | ||||||
|
|
|
| |||||
Total Net Assets | $ | 136,054,711 | $ | 305,671,405 | ||||
|
|
|
| |||||
61
Table of Contents
Statements of assets and liabilities
Delaware Fund | Delaware Fund | |||||||
Net Assets Consist of: | ||||||||
Paid-in capital | $ | 140,656,068 | $ | 290,188,405 | ||||
Total distributable earnings (loss) | (4,601,357 | ) | 15,483,000 | |||||
|
|
|
| |||||
Total Net Assets | $ | 136,054,711 | $ | 305,671,405 | ||||
|
|
|
| |||||
Net Asset Value | ||||||||
Class A: | ||||||||
Net assets | $ | 10,933,694 | $ | 62,035,181 | ||||
Shares of beneficial interest outstanding, unlimited authorization, no par | 1,546,983 | 4,230,645 | ||||||
Net asset value per share | $ | 7.07 | $ | 14.66 | ||||
Sales charge | 5.75 | % | 5.75 | % | ||||
Offering price per share, equal to net asset value per share / (1 – sales charge) | $ | 7.50 | $ | 15.55 | ||||
Class C: | ||||||||
Net assets | $ | 3,541,304 | $ | 8,562,201 | ||||
Shares of beneficial interest outstanding, unlimited authorization, no par | 599,383 | 591,386 | ||||||
Net asset value per share | $ | 5.91 | $ | 14.48 | ||||
Class R: | ||||||||
Net assets | $ | 98,234 | $ | 3,472,267 | ||||
Shares of beneficial interest outstanding, unlimited authorization, no par | 14,698 | 237,798 | ||||||
Net asset value per share | $ | 6.68 | $ | 14.60 | ||||
Institutional Class: | ||||||||
Net assets | $ | 117,701,502 | $ | 229,510,994 | ||||
Shares of beneficial interest outstanding, unlimited authorization, no par | 15,848,820 | 15,575,855 | ||||||
Net asset value per share | $ | 7.43 | $ | 14.74 | ||||
62
Table of Contents
Delaware Fund | Delaware Fund | |||||||
Class R6: | ||||||||
Net assets | $ | 3,779,977 | $ | 2,090,762 | ||||
Shares of beneficial interest outstanding, unlimited authorization, no par | 507,584 | 141,824 | ||||||
Net asset value per share | $ | 7.45 | $ | 14.74 | ||||
| ||||||||
1Investments, at cost | $ | 116,004,788 | $ | 296,831,825 | ||||
2Including securities on loan | — | 272,151 | ||||||
3Short-term investments held as collateral for loaned securities, at cost | — | 281,607 | ||||||
4Foreign currencies, at cost | 1,080,460 | 736,460 | ||||||
See accompanying notes, which are an integral part of the financial statements.
63
Table of Contents
| Statements of operations | ||
| Delaware International Funds | Year ended November 30, 2019 |
Delaware Fund | Delaware Fund | |||||||
Investment Income: | ||||||||
Dividends | $ | 134,765,709 | $ | 476,973 | ||||
Interest | 189,529 | 158 | ||||||
Securities lending income | — | 1,876 | ||||||
Foreign tax withheld | (15,907,148 | ) | (32,815 | ) | ||||
|
|
|
| |||||
| 119,048,090 | 446,192 | |||||||
|
|
|
| |||||
Expenses: | ||||||||
Management fees | 60,213,058 | 150,816 | ||||||
Distribution expenses – Class A | 864,245 | 27,689 | ||||||
Distribution expenses – Class C | 1,461,377 | 12,341 | ||||||
Distribution expenses – Class R | 230,544 | — | ||||||
Dividend disbursing and transfer agent fees and expenses | 6,632,282 | 33,209 | ||||||
Custodian fees | 2,868,559 | 15,203 | ||||||
Accounting and administration expenses | 967,349 | 42,918 | ||||||
Reports and statements to shareholders expenses | 672,015 | 20,375 | ||||||
Trustees’ fees and expenses | 301,785 | 1,074 | ||||||
Registration fees | 289,173 | 52,029 | ||||||
Legal fees | 236,990 | 7,958 | ||||||
Audit and tax fees | 44,830 | 39,136 | ||||||
Other | 181,006 | 17,057 | ||||||
|
|
|
| |||||
| 74,963,213 | 419,805 | |||||||
Less expenses waived | — | (168,839 | ) | |||||
Less expenses paid indirectly | (2,709 | ) | (349 | ) | ||||
|
|
|
| |||||
Total operating expenses | 74,960,504 | 250,617 | ||||||
|
|
|
| |||||
Net Investment Income | 44,087,586 | 195,575 | ||||||
|
|
|
| |||||
64
Table of Contents
Delaware Emerging Markets Fund | Delaware Value Fund | |||||||
Net Realized and Unrealized Gain (Loss): | ||||||||
Net realized gain (loss) on: | ||||||||
Investments1 | $ | (8,485,603 | ) | $ | 2,801,244 | |||
Foreign currencies | (1,387,996 | ) | 16,974 | |||||
Foreign currency exchange contracts | (927,198 | ) | (40,201 | ) | ||||
|
|
|
| |||||
Net realized gain (loss) | (10,800,797 | ) | 2,778,017 | |||||
|
|
|
| |||||
Net change in unrealized appreciation (depreciation) of: | ||||||||
Investments2 | 430,228,161 | (1,469,014 | ) | |||||
Foreign currencies | (188,087 | ) | (227 | ) | ||||
Foreign currency exchange contracts | (1,302 | ) | 55 | |||||
|
|
|
| |||||
Net change in unrealized appreciation (depreciation) | 430,038,772 | (1,469,186 | ) | |||||
|
|
|
| |||||
Net Realized and Unrealized Gain | 419,237,975 | 1,308,831 | ||||||
|
|
|
| |||||
Net Increase in Net Assets Resulting from Operations | $ | 463,325,561 | $ | 1,504,406 | ||||
|
|
|
| |||||
1Includes $358,022 capital gains taxes paid for Delaware Emerging Markets Fund.
2Includes $8,349,651 increase in capital gains tax accrued for Delaware Emerging Markets Fund.
See accompanying notes, which are an integral part of the financial statements.
65
Table of Contents
Statements of operations
Delaware International Funds
Delaware Fund | Delaware International Value Equity Fund | |||||||
Investment Income: | ||||||||
Dividends | $ | 1,655,180 | $ | 8,868,794 | ||||
Interest | 12,231 | 15,882 | ||||||
Securities lending income | — | 13,681 | ||||||
Foreign tax withheld | (143,428 | ) | (950,660 | ) | ||||
|
|
|
| |||||
| 1,523,983 | 7,947,697 | |||||||
|
|
|
| |||||
Expenses: | ||||||||
Management fees | 862,364 | 2,512,723 | ||||||
Distribution expenses – Class A | 28,474 | 156,217 | ||||||
Distribution expenses – Class C | 41,223 | 83,230 | ||||||
Distribution expenses – Class R | 463 | 18,061 | ||||||
Registration fees | 134,596 | 84,849 | ||||||
Dividend disbursing and transfer agent fees and expenses | 107,964 | 293,727 | ||||||
Accounting and administration expenses | 57,462 | 91,567 | ||||||
Custodian fees | 50,804 | 85,193 | ||||||
Audit and tax fees | 46,544 | 39,925 | ||||||
Reports and statements to shareholders expenses | 14,889 | 76,781 | ||||||
Trustees’ fees and expenses | 5,898 | 17,072 | ||||||
Legal fees | 3,098 | 19,564 | ||||||
Other | 35,563 | 30,165 | ||||||
|
|
|
| |||||
| 1,389,342 | 3,509,074 | |||||||
Less expenses waived | (219,297 | ) | (24,549 | ) | ||||
Less expenses paid indirectly | (121 | ) | (630 | ) | ||||
|
|
|
| |||||
Total operating expenses | 1,169,924 | 3,483,895 | ||||||
|
|
|
| |||||
Net Investment Income | 354,059 | 4,463,802 | ||||||
|
|
|
| |||||
66
Table of Contents
Delaware Fund | Delaware International Value Equity Fund | |||||||
Net Realized and Unrealized Gain (Loss): | ||||||||
Net realized gain (loss) on: | ||||||||
Investments | $ | (12,992,612 | ) | $ | 15,622,549 | |||
Foreign currencies | (28,266 | ) | 15,451 | |||||
Foreign currency exchange contracts | (253,716 | ) | (324,072 | ) | ||||
|
|
|
| |||||
Net realized gain (loss) | (13,274,594 | ) | 15,313,928 | |||||
|
|
|
| |||||
Net change in unrealized appreciation (depreciation) of: | ||||||||
Investments1 | 20,288,857 | 11,538,305 | ||||||
Foreign currencies | (1,585 | ) | (10,298 | ) | ||||
Foreign currency exchange contracts | 7,437 | 2,583 | ||||||
|
|
|
| |||||
Net change in unrealized appreciation (depreciation) | 20,294,709 | 11,530,590 | ||||||
|
|
|
| |||||
Net Realized and Unrealized Gain | 7,020,115 | 26,844,518 | ||||||
|
|
|
| |||||
Net Increase in Net Assets Resulting from Operations | $ | 7,374,174 | $ | 31,308,320 | ||||
|
|
|
| |||||
1Includes $1,976 increase in capital gains taxes accrued for Delaware International Small Cap Fund.
See accompanying notes, which are an integral part of the financial statements.
67
Table of Contents
Statements of changes in net assets
Delaware Emerging Markets Fund
| Year ended | ||||||||
| 11/30/19 | 11/30/18 | |||||||
Increase (Decrease) in Net Assets from Operations: | ||||||||
Net investment income | $ | 44,087,586 | $ | 28,742,424 | ||||
Net realized gain (loss) | (10,800,797 | ) | 42,378,112 | |||||
Net change in unrealized appreciation (depreciation) | 430,038,772 | (748,559,711 | ) | |||||
|
|
|
| |||||
Net increase (decrease) in net assets resulting from operations | 463,325,561 | (677,439,175 | ) | |||||
|
|
|
| |||||
Dividends and Distributions to Shareholders from: | ||||||||
Distributable earnings: | ||||||||
Class A | (1,109,027 | ) | (7,215,373 | ) | ||||
Class C | — | (2,019,144 | ) | |||||
Class R | (10,954 | ) | (825,273 | ) | ||||
Institutional Class | (25,204,329 | ) | (70,993,273 | ) | ||||
Class R6 | (2,783,290 | ) | (3,193,234 | ) | ||||
|
|
|
| |||||
| (29,107,600 | ) | (84,246,297 | ) | |||||
|
|
|
| |||||
Capital Share Transactions: | ||||||||
Proceeds from shares sold: | ||||||||
Class A | 83,503,938 | 158,835,777 | ||||||
Class C | 22,093,140 | 60,032,212 | ||||||
Class R | 10,181,248 | 19,070,928 | ||||||
Institutional Class | 1,561,977,435 | 2,551,509,956 | ||||||
Class R6 | 696,864,529 | 396,108,348 | ||||||
Net asset value of shares issued upon reinvestment of dividends and distributions: | ||||||||
Class A | 1,049,388 | 6,886,769 | ||||||
Class C | — | 1,977,233 | ||||||
Class R | 10,940 | 824,132 | ||||||
Institutional Class | 18,467,408 | 51,476,055 | ||||||
Class R6 | 2,496,709 | 1,783,576 | ||||||
|
|
|
| |||||
| 2,396,644,735 | 3,248,504,986 | |||||||
|
|
|
| |||||
68
Table of Contents
| Year ended | ||||||||
| 11/30/19 | 11/30/18 | |||||||
Capital Share Transactions (continued): | ||||||||
Cost of shares redeemed: | ||||||||
Class A | $ | (120,783,416 | ) | $ | (218,030,573 | ) | ||
Class C | (51,003,821 | ) | (72,479,514 | ) | ||||
Class R | (19,095,736 | ) | (24,769,737 | ) | ||||
Institutional Class | (2,286,709,979 | ) | (1,684,995,838 | ) | ||||
Class R6 | (136,520,130 | ) | (91,909,725 | ) | ||||
|
|
|
| |||||
| (2,614,113,082 | ) | (2,092,185,387 | ) | |||||
|
|
|
| |||||
Increase (decrease) in net assets derived from capital share transactions | (217,468,347 | ) | 1,156,319,599 | |||||
|
|
|
| |||||
Net Increase in Net Assets | 216,749,614 | 394,634,127 | ||||||
Net Assets: | ||||||||
Beginning of year | 5,135,762,154 | 4,741,128,027 | ||||||
|
|
|
| |||||
End of year | $ | 5,352,511,768 | $ | 5,135,762,154 | ||||
|
|
|
| |||||
See accompanying notes, which are an integral part of the financial statements.
69
Table of Contents
Statements of changes in net assets
Delaware Global Value Fund
| Year ended | ||||||||
| 11/30/19 | 11/30/18 | |||||||
Increase (Decrease) in Net Assets from Operations: | ||||||||
Net investment income | $ | 195,575 | $ | 195,831 | ||||
Net realized gain | 2,778,017 | 839,491 | ||||||
Net change in unrealized appreciation (depreciation) | (1,469,186 | ) | (2,427,626 | ) | ||||
|
|
|
| |||||
Net increase (decrease) in net assets resulting from operations | 1,504,406 | (1,392,304 | ) | |||||
|
|
|
| |||||
Dividends and Distributions to Shareholders from: | ||||||||
Distributable earnings: | ||||||||
Class A | (522,345 | ) | (154,249 | ) | ||||
Class C | (43,668 | ) | (21,765 | ) | ||||
Institutional Class | (70,601 | ) | (32,141 | ) | ||||
|
|
|
| |||||
| (636,614 | ) | (208,155 | ) | |||||
|
|
|
| |||||
Capital Share Transactions: | ||||||||
Proceeds from shares sold: | ||||||||
Class A | 578,108 | 2,429,817 | ||||||
Class C | 64,387 | 134,560 | ||||||
Institutional Class | 16,281,489 | 459,948 | ||||||
Net asset value of shares issued upon reinvestment of dividends and distributions: | ||||||||
Class A | 514,672 | 150,793 | ||||||
Class C | 43,655 | 21,614 | ||||||
Institutional Class | 69,056 | 29,145 | ||||||
|
|
|
| |||||
| 17,551,367 | 3,225,877 | |||||||
|
|
|
| |||||
70
Table of Contents
| Year ended | ||||||||
| 11/30/19 | 11/30/18 | |||||||
Capital Share Transactions (continued): | ||||||||
Cost of shares redeemed: | ||||||||
Class A | $ | (2,241,957 | ) | $ | (2,893,302 | ) | ||
Class C | (477,145 | ) | (2,720,379 | ) | ||||
Institutional Class | (16,870,095 | ) | (1,084,835 | ) | ||||
|
|
|
| |||||
| (19,589,197 | ) | (6,698,516 | ) | |||||
|
|
|
| |||||
Decrease in net assets derived from capital share transactions | (2,037,830 | ) | (3,472,639 | ) | ||||
|
|
|
| |||||
Net Decrease in Net Assets | (1,170,038 | ) | (5,073,098 | ) | ||||
Net Assets: | ||||||||
Beginning of year | 14,398,342 | 19,471,440 | ||||||
|
|
|
| |||||
End of year | $ | 13,228,304 | $ | 14,398,342 | ||||
|
|
|
| |||||
See accompanying notes, which are an integral part of the financial statements.
71
Table of Contents
Statements of changes in net assets
Delaware International Small Cap Fund
| Year ended | ||||||||
| 11/30/19 | 11/30/18 | |||||||
Increase (Decrease) in Net Assets from Operations: | ||||||||
Net investment income | $ | 354,059 | $ | 175,425 | ||||
Net realized loss | (13,274,594 | ) | (10,170,341 | ) | ||||
Net change in unrealized appreciation (depreciation) | 20,294,709 | (7,289,535 | ) | |||||
|
|
|
| |||||
Net increase (decrease) in net assets resulting from operations | 7,374,174 | (17,284,451 | ) | |||||
|
|
|
| |||||
Dividends and Distributions to Shareholders from: | ||||||||
Distributable earnings: | ||||||||
Class A | — | (490,469 | ) | |||||
Class C | — | (244,690 | ) | |||||
Class R | — | (3,896 | ) | |||||
Institutional Class | — | (556,829 | ) | |||||
Class R6 | — | (91 | ) | |||||
|
|
|
| |||||
| — | (1,295,975 | ) | ||||||
|
|
|
| |||||
Capital Share Transactions: | ||||||||
Proceeds from shares sold: | ||||||||
Class A | 4,112,907 | 6,491,912 | ||||||
Class C | 559,186 | 2,511,719 | ||||||
Class R | 30,765 | 22,376 | ||||||
Institutional Class | 105,141,789 | 115,392,556 | ||||||
Class R6 | 1,443,059 | 3,174,669 | ||||||
Net asset value of shares issued upon reinvestment of dividends and distributions: | ||||||||
Class A | — | 449,810 | ||||||
Class C | — | 244,369 | ||||||
Class R | — | 3,894 | ||||||
Institutional Class | — | 553,926 | ||||||
Class R6 | — | 91 | ||||||
|
|
|
| |||||
| 111,287,706 | 128,845,322 | |||||||
|
|
|
| |||||
72
Table of Contents
| Year ended | ||||||||
| 11/30/19 | 11/30/18 | |||||||
Capital Share Transactions (continued): | ||||||||
Cost of shares redeemed: | ||||||||
Class A | $ | (4,104,439 | ) | $ | (6,893,181 | ) | ||
Class C | (1,933,350 | ) | (2,134,434 | ) | ||||
Class R | (24,691 | ) | (14,613 | ) | ||||
Institutional Class | (53,598,786 | ) | (55,116,731 | ) | ||||
Class R6 | (685,119 | ) | (61,988 | ) | ||||
|
|
|
| |||||
| (60,346,385 | ) | (64,220,947 | ) | |||||
|
|
|
| |||||
Increase in net assets derived from capital share transactions | 50,941,321 | 64,624,375 | ||||||
|
|
|
| |||||
Net Increase in Net Assets | 58,315,495 | 46,043,949 | ||||||
Net Assets: | ||||||||
Beginning of year | 77,739,216 | 31,695,267 | ||||||
|
|
|
| |||||
End of year | $ | 136,054,711 | $ | 77,739,216 | ||||
|
|
|
| |||||
See accompanying notes, which are an integral part of the financial statements.
73
Table of Contents
Statements of changes in net assets
Delaware International Value Equity Fund
| Year ended | ||||||||
| 11/30/19 | 11/30/18 | |||||||
Increase (Decrease) in Net Assets from Operations: | ||||||||
Net investment income | $ | 4,463,802 | $ | 6,776,753 | ||||
Net realized gain | 15,313,928 | 7,434,109 | ||||||
Net change in unrealized appreciation (depreciation) | 11,530,590 | (56,992,992 | ) | |||||
|
|
|
| |||||
Net increase (decrease) in net assets resulting from operations | 31,308,320 | (42,782,130 | ) | |||||
|
|
|
| |||||
Dividends and Distributions to Shareholders from: | ||||||||
Distributable earnings: | ||||||||
Class A | (1,361,055 | ) | (1,011,407 | ) | ||||
Class C | (66,136 | ) | (173,964 | ) | ||||
Class R | (66,958 | ) | (43,727 | ) | ||||
Institutional Class | (5,128,519 | ) | (3,888,352 | ) | ||||
Class R6 | (44 | ) | — | |||||
|
|
|
| |||||
| (6,622,712 | ) | (5,117,450 | ) | |||||
|
|
|
| |||||
Capital Share Transactions: | ||||||||
Proceeds from shares sold: | ||||||||
Class A | 6,076,501 | 18,799,750 | ||||||
Class C | 2,077,524 | 2,110,748 | ||||||
Class R | 1,369,549 | 2,755,456 | ||||||
Institutional Class | 72,382,159 | 78,250,729 | ||||||
Class R6 | 2,025,243 | 2,000 | ||||||
Net asset value of shares issued upon reinvestment of dividends and distributions: | ||||||||
Class A | 1,331,759 | 988,979 | ||||||
Class C | 66,054 | 171,678 | ||||||
Class R | 66,958 | 43,727 | ||||||
Institutional Class | 5,060,972 | 3,869,082 | ||||||
Class R6 | 44 | — | ||||||
|
|
|
| |||||
| 90,456,763 | 106,992,149 | |||||||
|
|
|
| |||||
74
Table of Contents
| Year ended | ||||||||
| 11/30/19 | 11/30/18 | |||||||
Capital Share Transactions (continued): | ||||||||
Cost of shares redeemed: | ||||||||
Class A | $ | (14,120,481 | ) | $ | (14,584,318 | ) | ||
Class C | (3,086,120 | ) | (13,153,666 | ) | ||||
Class R | (1,772,685 | ) | (2,134,461 | ) | ||||
Institutional Class | (87,085,690 | ) | (52,625,635 | ) | ||||
Class R6 | (1,112 | ) | — | |||||
|
|
|
| |||||
| (106,066,088 | ) | (82,498,080 | ) | |||||
|
|
|
| |||||
Increase (decrease) in net assets derived from capital share transactions | (15,609,325 | ) | 24,494,069 | |||||
|
|
|
| |||||
Net Increase (Decrease) in Net Assets | 9,076,283 | (23,405,511 | ) | |||||
Net Assets: | ||||||||
Beginning of year | 296,595,122 | 320,000,633 | ||||||
|
|
|
| |||||
End of year | $ | 305,671,405 | $ | 296,595,122 | ||||
|
|
|
| |||||
See accompanying notes, which are an integral part of the financial statements.
75
Table of Contents
Delaware Emerging Markets Fund Class A
Selected data for each share of the Fund outstanding throughout each period were as follows:
|
Net asset value, beginning of period |
Income (loss) from investment operations: |
Net investment income (loss)1 |
Net realized and unrealized gain (loss) |
Total from investment operations |
Less dividends and distributions from: |
Net investment income |
Return of capital |
Net realized gain |
Total dividends and distributions |
Net asset value, end of period |
Total return3 |
Ratios and supplemental data: |
Net assets, end of period (000 omitted) |
Ratio of expenses to average net assets4 |
Ratio of expenses to average net assets prior to fees waived4 |
Ratio of net investment income (loss) to average net assets |
Ratio of net investment income (loss) to average net assets prior to fees waived |
Portfolio turnover |
|
| 1 | The average shares outstanding method has been applied for per share information. |
| 2 | For the year ended Nov. 30, 2016, net investment income distributions of $84,127 were made by the Fund’s Class A shares, which calculated to an amount of $0.004 per share. |
| 3 | Total return is based on the change in net asset value of a share during the period and assumes reinvestment of dividends and distributions at net asset value and does not reflect the impact of a sales charge. Total return during some of the periods shown reflects waivers by the manager and/or distributor. Performance would have been lower had the waivers not been in effect. |
| 4 | Expense ratios do not include expenses of the Underlying Funds in which the Fund invests. |
See accompanying notes, which are an integral part of the financial statements.
76
Table of Contents
| Year ended | ||||||||||||||||||||||||||||
|
| |||||||||||||||||||||||||||
| 11/30/19 | 11/30/18 | 11/30/17 | 11/30/16 | 11/30/15 | ||||||||||||||||||||||||
| ||||||||||||||||||||||||||||
| $ | 17.53 | $ | 20.10 | $ | 14.57 | $ | 12.80 | $ | 16.08 | |||||||||||||||||||
| 0.11 | 0.07 | 0.19 | 0.05 | (0.01 | ) | |||||||||||||||||||||||
| 1.55 | (2.32 | ) | 5.44 | 1.72 | (2.85 | ) | ||||||||||||||||||||||
|
|
|
|
|
|
|
|
|
| |||||||||||||||||||
| 1.66 | (2.25 | ) | 5.63 | 1.77 | (2.86 | ) | ||||||||||||||||||||||
|
|
|
|
|
|
|
|
|
| |||||||||||||||||||
| (0.06 | ) | (0.32 | ) | (0.10 | ) | — | 2 | (0.07 | ) | |||||||||||||||||||
| — | — | — | — | (0.02 | ) | |||||||||||||||||||||||
| — | — | — | — | (0.33 | ) | |||||||||||||||||||||||
|
|
|
|
|
|
|
|
|
| |||||||||||||||||||
| (0.06 | ) | (0.32 | ) | (0.10 | ) | — | (0.42 | ) | ||||||||||||||||||||
|
|
|
|
|
|
|
|
|
| |||||||||||||||||||
| $ | 19.13 | $ | 17.53 | $ | 20.10 | $ | 14.57 | $ | 12.80 | |||||||||||||||||||
|
|
|
|
|
|
|
|
|
| |||||||||||||||||||
| 9.50% | (11.40% | ) | 38.94% | 13.87% | (18.15% | ) | ||||||||||||||||||||||
| $ | 346,732 | $ | 353,094 | $ | 463,441 | $ | 461,124 | $ | 274,075 | |||||||||||||||||||
| 1.63% | 1.63% | 1.66% | 1.74% | 1.75% | ||||||||||||||||||||||||
| 1.63% | 1.63% | 1.66% | 1.78% | 1.75% | ||||||||||||||||||||||||
| 0.62% | 0.35% | 1.10% | 0.35% | (0.08% | ) | |||||||||||||||||||||||
| 0.62% | 0.35% | 1.10% | 0.31% | (0.08% | ) | |||||||||||||||||||||||
| 10% | 11% | 11% | 25% | 12% | ||||||||||||||||||||||||
| ||||||||||||||||||||||||||||
77
Table of Contents
Financial highlights
Delaware Emerging Markets Fund Class C
Selected data for each share of the Fund outstanding throughout each period were as follows:
|
Net asset value, beginning of period |
Income (loss) from investment operations: |
Net investment income (loss)1 |
Net realized and unrealized gain (loss) |
Total from investment operations |
Less dividends and distributions from: |
Net investment income |
Return of capital |
Net realized gain |
Total dividends and distributions |
Net asset value, end of period |
Total return2 |
Ratios and supplemental data: |
Net assets, end of period (000 omitted) |
Ratio of expenses to average net assets3 |
Ratio of expenses to average net assets prior to fees waived3 |
Ratio of net investment income (loss) to average net assets |
Ratio of net investment income (loss) to average net assets prior to fees waived |
Portfolio turnover |
|
| 1 | The average shares outstanding method has been applied for per share information. |
| 2 | Total return is based on the change in net asset value of a share during the period and assumes reinvestment of dividends and distributions at net asset value and does not reflect the impact of a sales charge. Total return during some of the periods shown reflects a waiver by the manager. Performance would have been lower had the waiver not been in effect. |
| 3 | Expense ratios do not include expenses of the Underlying Funds in which the Fund invests. |
See accompanying notes, which are an integral part of the financial statements.
78
Table of Contents
| Year ended | ||||||||||||||||||||||||||||
|
| |||||||||||||||||||||||||||
| 11/30/19 | 11/30/18 | 11/30/17 | 11/30/16 | 11/30/15 | ||||||||||||||||||||||||
| ||||||||||||||||||||||||||||
| $ | 16.26 | $ | 18.68 | $ | 13.56 | $ | 12.00 | $ | 15.14 | |||||||||||||||||||
| (0.02 | ) | (0.07 | ) | 0.06 | (0.05 | ) | (0.11 | ) | ||||||||||||||||||||
| 1.43 | (2.16 | ) | 5.07 | 1.61 | (2.68 | ) | ||||||||||||||||||||||
|
|
|
|
|
|
|
|
|
| |||||||||||||||||||
| 1.41 | (2.23 | ) | 5.13 | 1.56 | (2.79 | ) | ||||||||||||||||||||||
|
|
|
|
|
|
|
|
|
| |||||||||||||||||||
| — | (0.19 | ) | (0.01 | ) | — | — | ||||||||||||||||||||||
| — | — | — | — | (0.02 | ) | |||||||||||||||||||||||
| — | — | — | — | (0.33 | ) | |||||||||||||||||||||||
|
|
|
|
|
|
|
|
|
| |||||||||||||||||||
| — | (0.19 | ) | (0.01 | ) | — | (0.35 | ) | |||||||||||||||||||||
|
|
|
|
|
|
|
|
|
| |||||||||||||||||||
| $ | 17.67 | $ | 16.26 | $ | 18.68 | $ | 13.56 | $ | 12.00 | |||||||||||||||||||
|
|
|
|
|
|
|
|
|
| |||||||||||||||||||
| 8.67% | (12.05% | ) | 37.87% | 13.00% | (18.74% | ) | ||||||||||||||||||||||
| $ | 135,346 | $ | 152,857 | $ | 190,227 | $ | 120,306 | $ | 131,724 | |||||||||||||||||||
| 2.38% | 2.38% | 2.41% | 2.49% | 2.50% | ||||||||||||||||||||||||
| 2.38% | 2.38% | 2.41% | 2.53% | 2.50% | ||||||||||||||||||||||||
| (0.13% | ) | (0.40% | ) | 0.35% | (0.40% | ) | (0.83% | ) | ||||||||||||||||||||
| (0.13% | ) | (0.40% | ) | 0.35% | (0.44% | ) | (0.83% | ) | ||||||||||||||||||||
| 10% | 11% | 11% | 25% | 12% | ||||||||||||||||||||||||
| ||||||||||||||||||||||||||||
79
Table of Contents
Financial highlights
Delaware Emerging Markets Fund Class R
Selected data for each share of the Fund outstanding throughout each period were as follows:
|
Net asset value, beginning of period |
Income (loss) from investment operations: |
Net investment income (loss)1 |
Net realized and unrealized gain (loss) |
Total from investment operations |
Less dividends and distributions from: |
Net investment income |
Return of capital |
Net realized gain |
Total dividends and distributions |
Net asset value, end of period |
Total return3 |
Ratios and supplemental data: |
Net assets, end of period (000 omitted) |
Ratio of expenses to average net assets4 |
Ratio of expenses to average net assets prior to fees waived4 |
Ratio of net investment income (loss) to average net assets |
Ratio of net investment income (loss) to average net assets prior to fees waived |
Portfolio turnover |
|
| 1 | The average shares outstanding method has been applied for per share information. |
| 2 | For the year ended Nov. 30, 2019, net investment income distributions of $10,954, were made by the Fund’s Class R shares, which calculated to an amount of $0.004 per share. |
| 3 | Total return is based on the change in net asset value of a share during the period and assumes reinvestment of dividends and distributions at net asset value. Total return during some of the periods shown reflects waivers by the manager and/or distributor. Performance would have been lower had the waivers not been in effect. |
| 4 | Expense ratios do not include expenses of the Underlying Funds in which the Fund invests. |
See accompanying notes, which are an integral part of the financial statements.
80
Table of Contents
| Year ended | ||||||||||||||||||||||||||||
|
| |||||||||||||||||||||||||||
| 11/30/19 | 11/30/18 | 11/30/17 | 11/30/16 | 11/30/15 | ||||||||||||||||||||||||
| ||||||||||||||||||||||||||||
| $ | 17.62 | $ | 20.21 | $ | 14.66 | $ | 12.90 | $ | 16.20 | |||||||||||||||||||
| 0.07 | 0.02 | 0.15 | 0.02 | (0.05 | ) | |||||||||||||||||||||||
| 1.56 | (2.34 | ) | 5.47 | 1.74 | (2.88 | ) | ||||||||||||||||||||||
|
|
|
|
|
|
|
|
|
| |||||||||||||||||||
| 1.63 | (2.32 | ) | 5.62 | 1.76 | (2.93 | ) | ||||||||||||||||||||||
|
|
|
|
|
|
|
|
|
| |||||||||||||||||||
| — | 2 | (0.27 | ) | (0.07 | ) | — | (0.02 | ) | ||||||||||||||||||||
| — | — | — | — | (0.02 | ) | |||||||||||||||||||||||
| — | — | — | — | (0.33 | ) | |||||||||||||||||||||||
|
|
|
|
|
|
|
|
|
| |||||||||||||||||||
| — | (0.27 | ) | (0.07 | ) | — | (0.37 | ) | |||||||||||||||||||||
|
|
|
|
|
|
|
|
|
| |||||||||||||||||||
| $ | 19.25 | $ | 17.62 | $ | 20.21 | $ | 14.66 | $ | 12.90 | |||||||||||||||||||
|
|
|
|
|
|
|
|
|
| |||||||||||||||||||
| 9.28% | (11.64% | ) | 38.51% | 13.64% | (18.37% | ) | ||||||||||||||||||||||
| $ | 43,962 | $ | 48,875 | $ | 61,735 | $ | 36,591 | $ | 24,299 | |||||||||||||||||||
| 1.88% | 1.88% | 1.91% | 1.99% | 2.00% | ||||||||||||||||||||||||
| 1.88% | 1.88% | 1.91% | 2.03% | 2.00% | ||||||||||||||||||||||||
| 0.37% | 0.10% | 0.85% | 0.10% | (0.33% | ) | |||||||||||||||||||||||
| 0.37% | 0.10% | 0.85% | 0.06% | (0.33% | ) | |||||||||||||||||||||||
| 10% | 11% | 11% | 25% | 12% | ||||||||||||||||||||||||
| ||||||||||||||||||||||||||||
81
Table of Contents
Financial highlights
Delaware Emerging Markets Fund Institutional Class
Selected data for each share of the Fund outstanding throughout each period were as follows:
|
Net asset value, beginning of period |
Income (loss) from investment operations: |
Net investment income1 |
Net realized and unrealized gain (loss) |
Total from investment operations |
Less dividends and distributions from: |
Net investment income |
Return of capital |
Net realized gain |
Total dividends and distributions |
Net asset value, end of period |
Total return2 |
Ratios and supplemental data: |
Net assets, end of period (000 omitted) |
Ratio of expenses to average net assets3 |
Ratio of expenses to average net assets prior to fees waived3 |
Ratio of net investment income to average net assets |
Ratio of net investment income to average net assets prior to fees waived |
Portfolio turnover |
|
| 1 | The average shares outstanding method has been applied for per share information. |
| 2 | Total return is based on the change in net asset value of a share during the period and assumes reinvestment of dividends and distributions at net asset value. Total return during some of the periods shown reflects a waiver by the manager. Performance would have been lower had the waiver not been in effect. |
| 3 | Expense ratios do not include expenses of the Underlying Funds in which the Fund invests. |
See accompanying notes, which are an integral part of the financial statements.
82
Table of Contents
| Year ended | ||||||||||||||||||||||||||||
|
| |||||||||||||||||||||||||||
| 11/30/19 | 11/30/18 | 11/30/17 | 11/30/16 | 11/30/15 | ||||||||||||||||||||||||
| ||||||||||||||||||||||||||||
| $ | 17.67 | $ | 20.26 | $ | 14.69 | $ | 12.90 | $ | 16.21 | |||||||||||||||||||
| 0.16 | 0.12 | 0.25 | 0.08 | 0.02 | ||||||||||||||||||||||||
| 1.55 | (2.34 | ) | 5.46 | 1.75 | (2.87 | ) | ||||||||||||||||||||||
|
|
|
|
|
|
|
|
|
| |||||||||||||||||||
| 1.71 | (2.22 | ) | 5.71 | 1.83 | (2.85 | ) | ||||||||||||||||||||||
|
|
|
|
|
|
|
|
|
| |||||||||||||||||||
| (0.11 | ) | (0.37 | ) | (0.14 | ) | (0.04 | ) | (0.11 | ) | |||||||||||||||||||
| — | — | — | — | (0.02 | ) | |||||||||||||||||||||||
| — | — | — | — | (0.33 | ) | |||||||||||||||||||||||
|
|
|
|
|
|
|
|
|
| |||||||||||||||||||
| (0.11 | ) | (0.37 | ) | (0.14 | ) | (0.04 | ) | (0.46 | ) | |||||||||||||||||||
|
|
|
|
|
|
|
|
|
| |||||||||||||||||||
| $ | 19.27 | $ | 17.67 | $ | 20.26 | $ | 14.69 | $ | 12.90 | |||||||||||||||||||
|
|
|
|
|
|
|
|
|
| |||||||||||||||||||
| 9.79% | (11.21% | ) | 39.23% | 14.22% | (17.96% | ) | ||||||||||||||||||||||
| $ | 3,826,272 | $ | 4,189,528 | $ | 3,885,606 | $ | 1,346,361 | $ | 1,254,194 | |||||||||||||||||||
| 1.38% | 1.38% | 1.41% | 1.49% | 1.50% | ||||||||||||||||||||||||
| 1.38% | 1.38% | 1.41% | 1.53% | 1.50% | ||||||||||||||||||||||||
| 0.87% | 0.60% | 1.35% | 0.60% | 0.17% | ||||||||||||||||||||||||
| 0.87% | 0.60% | 1.35% | 0.56% | 0.17% | ||||||||||||||||||||||||
| 10% | 11% | 11% | 25% | 12% | ||||||||||||||||||||||||
| ||||||||||||||||||||||||||||
83
Table of Contents
Financial highlights
Delaware Emerging Markets Fund Class R6
Selected data for each share of the Fund outstanding throughout each period were as follows:
|
Net asset value, beginning of period |
Income (loss) from investment operations: |
Net investment income2 |
Net realized and unrealized gain (loss) |
Total from investment operations |
Less dividends and distributions from: |
Net investment income |
Total dividends and distributions |
Net asset value, end of period |
Total return3 |
Ratios and supplemental data: |
Net assets, end of period (000 omitted) |
Ratio of expenses to average net assets4 |
Ratio of expenses to average net assets prior to fees waived4 |
Ratio of net investment income to average net assets |
Ratio of net investment income to average net assets prior to fees waived |
Portfolio turnover |
|
| 1 | Date of commencement of operations; ratios have been annualized and total return has not been annualized. |
| 2 | The average shares outstanding method has been applied for per share information. |
| 3 | Total return is based on the change in net asset value of a share during the period and assumes reinvestment of dividends and distributions at net asset value. Total return during some of the periods shown reflects a waiver by the manager. Performance would have been lower had the waiver not been in effect. |
| 4 | Expense ratios do not include expenses of the Underlying Funds in which the Fund invests. |
| 5 | Portfolio turnover is representative of the Fund for the entire year ended Nov. 30, 2016. |
See accompanying notes, which are an integral part of the financial statements.
84
Table of Contents
| 5/2/161 | ||||||||||||||||||||||
| Year ended | to | |||||||||||||||||||||
|
| |||||||||||||||||||||
| 11/30/19 | 11/30/18 | 11/30/17 | 11/30/16 | |||||||||||||||||||
| ||||||||||||||||||||||
| $ | 17.69 | $ | 20.27 | $ | 14.69 | $ | 13.55 | |||||||||||||||
| 0.18 | 0.14 | 0.28 | 0.08 | |||||||||||||||||||
| 1.54 | (2.33 | ) | 5.45 | 1.06 | ||||||||||||||||||
|
|
|
|
|
|
|
| |||||||||||||||
| 1.72 | (2.19 | ) | 5.73 | 1.14 | ||||||||||||||||||
|
|
|
|
|
|
|
| |||||||||||||||
| (0.13 | ) | (0.39 | ) | (0.15 | ) | — | ||||||||||||||||
|
|
|
|
|
|
|
| |||||||||||||||
| (0.13 | ) | (0.39 | ) | (0.15 | ) | — | ||||||||||||||||
|
|
|
|
|
|
|
| |||||||||||||||
| $ | 19.28 | $ | 17.69 | $ | 20.27 | $ | 14.69 | |||||||||||||||
|
|
|
|
|
|
|
| |||||||||||||||
| 9.84% | (11.04% | ) | 39.43% | 8.41% | ||||||||||||||||||
| $ | 1,000,200 | $ | 391,408 | $ | 140,119 | $ | 268 | |||||||||||||||
| 1.26% | 1.26% | 1.28% | 1.32% | |||||||||||||||||||
| 1.26% | 1.26% | 1.28% | 1.37% | |||||||||||||||||||
| 0.99% | 0.72% | 1.47% | 0.85% | |||||||||||||||||||
| 0.99% | 0.72% | 1.47% | 0.80% | |||||||||||||||||||
| 10% | 11% | 11% | 25% | 5 | ||||||||||||||||||
| ||||||||||||||||||||||
85
Table of Contents
Financial highlights
Delaware Global Value Fund Class A
Selected data for each share of the Fund outstanding throughout each period were as follows:
|
Net asset value, beginning of period |
Income (loss) from investment operations: |
Net investment income1 |
Net realized and unrealized gain (loss) |
Total from investment operations |
Less dividends and distributions from: |
Net investment income |
Net realized gain |
Total dividends and distributions |
Net asset value, end of period |
Total return2 |
Ratios and supplemental data: |
Net assets, end of period (000 omitted) |
Ratio of expenses to average net assets3 |
Ratio of expenses to average net assets prior to fees waived3 |
Ratio of net investment income to average net assets |
Ratio of net investment income to average net assets prior to fees waived |
Portfolio turnover |
|
| 1 | The average shares outstanding method has been applied for per share information. |
| 2 | Total return is based on the change in net asset value of a share during the period and assumes reinvestment of dividends and distributions at net asset value and does not reflect the impact of a sales charge. Total return during all of the periods shown reflects waivers by the manager and/or distributor. Performance would have been lower had the waivers not been in effect. |
| 3 | Expense ratios do not include expenses of the Underlying Funds in which the Fund invests. |
| 4 | The Fund’s portfolio turnover rate increased substantially during the year ended Nov. 30, 2019 due to a change in the Fund’s portfolio managers and associated repositioning. |
See accompanying notes, which are an integral part of the financial statements.
86
Table of Contents
| Year ended | ||||||||||||||||||||||||||||
|
| |||||||||||||||||||||||||||
| 11/30/19 | 11/30/18 | 11/30/17 | 11/30/16 | 11/30/15 | ||||||||||||||||||||||||
| ||||||||||||||||||||||||||||
| $ | 11.95 | $ | 13.21 | $ | 11.46 | $ | 11.16 | $ | 11.71 | |||||||||||||||||||
| 0.13 | 0.16 | 0.14 | 0.11 | 0.08 | ||||||||||||||||||||||||
| 0.79 | (1.26 | ) | 1.81 | 0.27 | (0.58 | ) | ||||||||||||||||||||||
|
|
|
|
|
|
|
|
|
| |||||||||||||||||||
| 0.92 | (1.10 | ) | 1.95 | 0.38 | (0.50 | ) | ||||||||||||||||||||||
|
|
|
|
|
|
|
|
|
| |||||||||||||||||||
| (0.18 | ) | (0.16 | ) | (0.20 | ) | (0.08 | ) | (0.05 | ) | |||||||||||||||||||
| (0.37 | ) | — | — | — | — | |||||||||||||||||||||||
|
|
|
|
|
|
|
|
|
| |||||||||||||||||||
| (0.55 | ) | (0.16 | ) | (0.20 | ) | (0.08 | ) | (0.05 | ) | |||||||||||||||||||
|
|
|
|
|
|
|
|
|
| |||||||||||||||||||
| $ | 12.32 | $ | 11.95 | $ | 13.21 | $ | 11.46 | $ | 11.16 | |||||||||||||||||||
|
|
|
|
|
|
|
|
|
| |||||||||||||||||||
| 8.64% | (8.45% | ) | 17.24% | 3.45% | (4.27% | ) | ||||||||||||||||||||||
| $ | 10,695 | $ | 11,452 | $ | 12,977 | $ | 12,460 | $ | 14,457 | |||||||||||||||||||
| 1.44% | 1.55% | 1.55% | 1.55% | 1.64% | ||||||||||||||||||||||||
| 2.39% | 2.25% | 2.02% | 1.88% | 1.89% | ||||||||||||||||||||||||
| 1.07% | 1.22% | 1.16% | 1.01% | 0.71% | ||||||||||||||||||||||||
| 0.12% | 0.52% | 0.69% | 0.69% | 0.46% | ||||||||||||||||||||||||
| 202% | 4 | 19% | 12% | 12% | 14% | |||||||||||||||||||||||
| ||||||||||||||||||||||||||||
87
Table of Contents
Financial highlights
Delaware Global Value Fund Class C
Selected data for each share of the Fund outstanding throughout each period were as follows:
|
Net asset value, beginning of period |
Income (loss) from investment operations: |
Net investment income (loss)1 |
Net realized and unrealized gain (loss) |
Total from investment operations |
Less dividends and distributions from: |
Net investment income |
Net realized gain |
Total dividends and distributions |
Net asset value, end of period |
Total return3 |
Ratios and supplemental data: |
Net assets, end of period (000 omitted) |
Ratio of expenses to average net assets4 |
Ratio of expenses to average net assets prior to fees waived4 |
Ratio of net investment income (loss) to average net assets |
Ratio of net investment loss to average net assets prior to fees waived |
Portfolio turnover |
|
| 1 | The average shares outstanding method has been applied for per share information. |
| 2 | Amount is less than $(0.005) per share. |
| 3 | Total return is based on the change in net asset value of a share during the period and assumes reinvestment of dividends and distributions at net asset value and does not reflect the impact of a sales charge. Total return during all of the periods shown reflects a waiver by the manager. Performance would have been lower had the waiver not been in effect. |
| 4 | Expense ratios do not include expenses of the Underlying Funds in which the Fund invests. |
| 5 | The Fund’s portfolio turnover rate increased substantially during the year ended Nov. 30, 2019 due to a change in the Fund’s portfolio managers and associated repositioning. |
See accompanying notes, which are an integral part of the financial statements.
88
Table of Contents
| Year ended | ||||||||||||||||||||||||||||
|
| |||||||||||||||||||||||||||
| 11/30/19 | 11/30/18 | 11/30/17 | 11/30/16 | 11/30/15 | ||||||||||||||||||||||||
| ||||||||||||||||||||||||||||
| $ | 11.66 | $ | 12.90 | $ | 11.20 | $ | 10.90 | $ | 11.48 | |||||||||||||||||||
| 0.04 | 0.06 | 0.05 | 0.03 | — | 2 | |||||||||||||||||||||||
| 0.79 | (1.23 | ) | 1.77 | 0.27 | (0.58 | ) | ||||||||||||||||||||||
|
|
|
|
|
|
|
|
|
| |||||||||||||||||||
| 0.83 | (1.17 | ) | 1.82 | 0.30 | (0.58 | ) | ||||||||||||||||||||||
|
|
|
|
|
|
|
|
|
| |||||||||||||||||||
| — | (0.07 | ) | (0.12 | ) | — | — | ||||||||||||||||||||||
| (0.37 | ) | — | — | — | — | |||||||||||||||||||||||
|
|
|
|
|
|
|
|
|
| |||||||||||||||||||
| (0.37 | ) | �� | (0.07 | ) | (0.12 | ) | — | — | ||||||||||||||||||||
|
|
|
|
|
|
|
|
|
| |||||||||||||||||||
| $ | 12.12 | $ | 11.66 | $ | 12.90 | $ | 11.20 | $ | 10.90 | |||||||||||||||||||
|
|
|
|
|
|
|
|
|
| |||||||||||||||||||
| 7.78% | (9.14% | ) | 16.37% | 2.75% | (5.05% | ) | ||||||||||||||||||||||
| $ | 1,111 | $ | 1,437 | $ | 4,210 | $ | 4,116 | $ | 4,601 | |||||||||||||||||||
| 2.19% | 2.30% | 2.30% | 2.30% | 2.39% | ||||||||||||||||||||||||
| 3.14% | 3.00% | 2.77% | 2.63% | 2.64% | ||||||||||||||||||||||||
| 0.32% | 0.47% | 0.41% | 0.26% | (0.04% | ) | |||||||||||||||||||||||
| (0.63% | ) | (0.23% | ) | (0.06% | ) | (0.06% | ) | (0.29% | ) | |||||||||||||||||||
| 202% | 5 | 19% | 12% | 12% | 14% | |||||||||||||||||||||||
| ||||||||||||||||||||||||||||
89
Table of Contents
Financial highlights
Delaware Global Value Fund Institutional Class
Selected data for each share of the Fund outstanding throughout each period were as follows:
|
Net asset value, beginning of period |
Income (loss) from investment operations: |
Net investment income1 |
Net realized and unrealized gain (loss) |
Total from investment operations |
Less dividends and distributions from: |
Net investment income |
Net realized gain |
Total dividends and distributions |
Net asset value, end of period |
Total return2 |
Ratios and supplemental data: |
Net assets, end of period (000 omitted) |
Ratio of expenses to average net assets3 |
Ratio of expenses to average net assets prior to fees waived3 |
Ratio of net investment income to average net assets |
Ratio of net investment income to average net assets prior to fees waived |
Portfolio turnover |
|
| 1 | The average shares outstanding method has been applied for per share information. |
| 2 | Total return is based on the change in net asset value of a share during the period and assumes reinvestment of dividends and distributions at net asset value. Total return during all of the periods shown reflects a waiver by the manager. Performance would have been lower had the waiver not been in effect. |
| 3 | Expense ratios do not include expenses of the Underlying Funds in which the Fund invests. |
| 4 | The Fund’s portfolio turnover rate increased substantially during the year ended Nov. 30, 2019 due to a change in the Fund’s portfolio managers and associated repositioning. |
See accompanying notes, which are an integral part of the financial statements.
90
Table of Contents
| Year ended | ||||||||||||||||||||||||||||
|
| |||||||||||||||||||||||||||
| 11/30/19 | 11/30/18 | 11/30/17 | 11/30/16 | 11/30/15 | ||||||||||||||||||||||||
| ||||||||||||||||||||||||||||
| $ | 12.01 | $ | 13.27 | $ | 11.51 | �� | $ | 11.21 | $ | 11.77 | ||||||||||||||||||
| 0.16 | 0.19 | 0.18 | 0.14 | 0.11 | ||||||||||||||||||||||||
| 0.79 | (1.26 | ) | 1.81 | 0.27 | (0.59 | ) | ||||||||||||||||||||||
|
|
|
|
|
|
|
|
|
| |||||||||||||||||||
| 0.95 | (1.07 | ) | 1.99 | 0.41 | (0.48 | ) | ||||||||||||||||||||||
|
|
|
|
|
|
|
|
|
| |||||||||||||||||||
| (0.21 | ) | (0.19 | ) | (0.23 | ) | (0.11 | ) | (0.08 | ) | |||||||||||||||||||
| (0.37 | ) | — | — | — | — | |||||||||||||||||||||||
|
|
|
|
|
|
|
|
|
| |||||||||||||||||||
| (0.58 | ) | (0.19 | ) | (0.23 | ) | (0.11 | ) | (0.08 | ) | |||||||||||||||||||
|
|
|
|
|
|
|
|
|
| |||||||||||||||||||
| $ | 12.38 | $ | 12.01 | $ | 13.27 | $ | 11.51 | $ | 11.21 | |||||||||||||||||||
|
|
|
|
|
|
|
|
|
| |||||||||||||||||||
| 8.94% | (8.20% | ) | 17.53% | 3.71% | (4.09% | ) | ||||||||||||||||||||||
| $ | 1,422 | $ | 1,509 | $ | 2,284 | $ | 1,614 | $ | 2,042 | |||||||||||||||||||
| 1.19% | 1.30% | 1.30% | 1.30% | 1.39% | ||||||||||||||||||||||||
| 2.14% | 2.00% | 1.77% | 1.63% | 1.64% | ||||||||||||||||||||||||
| 1.32% | 1.47% | 1.41% | 1.26% | 0.96% | ||||||||||||||||||||||||
| 0.37% | 0.77% | 0.94% | 0.94% | 0.71% | ||||||||||||||||||||||||
| 202% | 4 | 19% | 12% | 12% | 14% | |||||||||||||||||||||||
| ||||||||||||||||||||||||||||
91
Table of Contents
Financial highlights
Delaware International Small Cap Fund Class A
Selected data for each share of the Fund outstanding throughout each period were as follows:
|
Net asset value, beginning of period |
Income (loss) from investment operations: |
Net investment income (loss)1 |
Net realized and unrealized gain (loss) |
Total from investment operations |
Less dividends and distributions from: |
Net investment income |
Net realized gain |
Total dividends and distributions |
Net asset value, end of period |
Total return2 |
Ratios and supplemental data: |
Net assets, end of period (000 omitted) |
Ratio of expenses to average net assets |
Ratio of expenses to average net assets prior to fees waived |
Ratio of net investment income (loss) to average net assets |
Ratio of net investment income (loss) to average net assets prior to fees waived |
Portfolio turnover |
|
| 1 | The average shares outstanding method has been applied for per share information. |
| 2 | Total return is based on the change in net asset value of a share during the period and assumes reinvestment of dividends and distributions at net asset value. Total return during some of the periods shown reflects waivers by the manager and/or distributor. Performance would have been lower had the waivers not been in effect. |
See accompanying notes, which are an integral part of the financial statements.
92
Table of Contents
| Year ended | ||||||||||||||||||||||||||||
|
| |||||||||||||||||||||||||||
| 11/30/19 | 11/30/18 | 11/30/17 | 11/30/16 | 11/30/15 | ||||||||||||||||||||||||
| ||||||||||||||||||||||||||||
| $ | 6.66 | $ | 7.99 | $ | 19.03 | $ | 19.78 | $ | 20.06 | |||||||||||||||||||
| 0.01 | 0.01 | (0.02 | ) | (0.02 | ) | (0.05 | ) | |||||||||||||||||||||
| 0.40 | (1.02 | ) | 1.86 | (0.06 | ) | (0.15 | ) | |||||||||||||||||||||
|
|
|
|
|
|
|
|
|
| |||||||||||||||||||
| 0.41 | (1.01 | ) | 1.84 | (0.08 | ) | (0.20 | ) | |||||||||||||||||||||
|
|
|
|
|
|
|
|
|
| |||||||||||||||||||
| — | — | — | — | (0.08 | ) | |||||||||||||||||||||||
| — | (0.32 | ) | (12.88 | ) | (0.67 | ) | — | |||||||||||||||||||||
|
|
|
|
|
|
|
|
|
| |||||||||||||||||||
| — | (0.32 | ) | (12.88 | ) | (0.67 | ) | (0.08 | ) | ||||||||||||||||||||
|
|
|
|
|
|
|
|
|
| |||||||||||||||||||
| $ | 7.07 | $ | 6.66 | $ | 7.99 | $ | 19.03 | $ | 19.78 | |||||||||||||||||||
|
|
|
|
|
|
|
|
|
| |||||||||||||||||||
| 6.16% | (13.19% | ) | 39.78% | (0.38% | ) | (1.02% | ) | |||||||||||||||||||||
| $ | 10,934 | $ | 10,154 | $ | 12,377 | $ | 15,158 | $ | 27,046 | |||||||||||||||||||
| 1.34% | 1.34% | 1.38% | 1.48% | 1.45% | ||||||||||||||||||||||||
| 1.55% | 1.72% | 2.48% | 1.51% | 1.45% | ||||||||||||||||||||||||
| 0.16% | 0.13% | (0.22% | ) | (0.09% | ) | (0.23% | ) | |||||||||||||||||||||
| (0.05% | ) | (0.25% | ) | (1.32% | ) | (0.12% | ) | (0.23% | ) | |||||||||||||||||||
| 97% | 106% | 142% | 66% | 41% | ||||||||||||||||||||||||
| ||||||||||||||||||||||||||||
93
Table of Contents
Financial highlights
Delaware International Small Cap Fund Class C
Selected data for each share of the Fund outstanding throughout each period were as follows:
|
Net asset value, beginning of period |
Income (loss) from investment operations: |
Net investment loss1 |
Net realized and unrealized gain (loss) |
Total from investment operations |
Less dividends and distributions from: |
Net realized gain |
Total dividends and distributions |
Net asset value, end of period |
Total return2 |
Ratios and supplemental data: |
Net assets, end of period (000 omitted) |
Ratio of expenses to average net assets |
Ratio of expenses to average net assets prior to fees waived |
Ratio of net investment loss to average net assets |
Ratio of net investment loss to average net assets prior to fees waived |
Portfolio turnover |
|
| 1 | The average shares outstanding method has been applied for per share information. |
| 2 | Total return is based on the change in net asset value of a share during the period and assumes reinvestment of dividends and distributions at net asset value and does not reflect the impact of a sales charge. Total return during some of the periods shown reflects a waiver by the manager. Performance would have been lower had the waiver not been in effect. |
See accompanying notes, which are an integral part of the financial statements.
94
Table of Contents
| Year ended | ||||||||||||||||||||||||||||
|
| |||||||||||||||||||||||||||
| 11/30/19 | 11/30/18 | 11/30/17 | 11/30/16 | 11/30/15 | ||||||||||||||||||||||||
| ||||||||||||||||||||||||||||
| $ | 5.61 | $ | 6.83 | $ | 18.24 | $ | 19.13 | $ | 19.47 | |||||||||||||||||||
| (0.03 | ) | (0.04 | ) | (0.06 | ) | (0.15 | ) | (0.19 | ) | |||||||||||||||||||
| 0.33 | (0.86 | ) | 1.53 | (0.07 | ) | (0.15 | ) | |||||||||||||||||||||
|
|
|
|
|
|
|
|
|
| |||||||||||||||||||
| 0.30 | (0.90 | ) | 1.47 | (0.22 | ) | (0.34 | ) | |||||||||||||||||||||
|
|
|
|
|
|
|
|
|
| |||||||||||||||||||
| — | (0.32 | ) | (12.88 | ) | (0.67 | ) | — | |||||||||||||||||||||
|
|
|
|
|
|
|
|
|
| |||||||||||||||||||
| — | (0.32 | ) | (12.88 | ) | (0.67 | ) | — | |||||||||||||||||||||
|
|
|
|
|
|
|
|
|
| |||||||||||||||||||
| $ | 5.91 | $ | 5.61 | $ | 6.83 | $ | 18.24 | $ | 19.13 | |||||||||||||||||||
|
|
|
|
|
|
|
|
|
| |||||||||||||||||||
| 5.35% | (13.86% | ) | 38.77% | (1.15% | ) | (1.75% | ) | |||||||||||||||||||||
| $ | 3,541 | $ | 4,698 | $ | 5,199 | $ | 4,417 | $ | 5,424 | |||||||||||||||||||
| 2.09% | 2.09% | 2.13% | 2.23% | 2.20% | ||||||||||||||||||||||||
| 2.30% | 2.47% | 3.23% | 2.26% | 2.20% | ||||||||||||||||||||||||
| (0.59% | ) | (0.62% | ) | (0.97% | ) | (0.84% | ) | (0.98% | ) | |||||||||||||||||||
| (0.80% | ) | (1.00% | ) | (2.07% | ) | (0.87% | ) | (0.98% | ) | |||||||||||||||||||
| 97% | 106% | 142% | 66% | 41% | ||||||||||||||||||||||||
| ||||||||||||||||||||||||||||
95
Table of Contents
Financial highlights
Delaware International Small Cap Fund Class R
Selected data for each share of the Fund outstanding throughout each period were as follows:
|
Net asset value, beginning of period |
Income (loss) from investment operations: |
Net investment loss1 |
Net realized and unrealized gain (loss) |
Total from investment operations |
Less dividends and distributions from: |
Net investment income |
Net realized gain |
Total dividends and distributions |
Net asset value, end of period |
Total return2 |
Ratios and supplemental data: |
Net assets, end of period (000 omitted) |
Ratio of expenses to average net assets |
Ratio of expenses to average net assets prior to fees waived |
Ratio of net investment loss to average net assets |
Ratio of net investment loss to average net assets prior to fees waived |
Portfolio turnover |
|
| 1 | The average shares outstanding method has been applied for per share information. |
| 2 | Total return is based on the change in net asset value of a share during the period and assumes reinvestment of dividends and distributions at net asset value. Total return during some of the periods shown reflects waivers by the manager and/or distributor. Performance would have been lower had the waivers not been in effect. |
See accompanying notes, which are an integral part of the financial statements.
96
Table of Contents
| Year ended | ||||||||||||||||||||||||||||
|
| |||||||||||||||||||||||||||
| 11/30/19 | 11/30/18 | 11/30/17 | 11/30/16 | 11/30/15 | ||||||||||||||||||||||||
| ||||||||||||||||||||||||||||
| $ | 6.31 | $ | 7.61 | $ | 18.77 | $ | 19.57 | $ | 19.85 | |||||||||||||||||||
| (0.01 | ) | (0.01 | ) | (0.03 | ) | (0.06 | ) | (0.09 | ) | |||||||||||||||||||
| 0.38 | (0.97 | ) | 1.75 | (0.07 | ) | (0.16 | ) | |||||||||||||||||||||
|
|
|
|
|
|
|
|
|
| |||||||||||||||||||
| 0.37 | (0.98 | ) | 1.72 | (0.13 | ) | (0.25 | ) | |||||||||||||||||||||
|
|
|
|
|
|
|
|
|
| |||||||||||||||||||
| — | — | — | — | (0.03 | ) | |||||||||||||||||||||||
| — | (0.32 | ) | (12.88 | ) | (0.67 | ) | — | |||||||||||||||||||||
|
|
|
|
|
|
|
|
|
| |||||||||||||||||||
| — | (0.32 | ) | (12.88 | ) | (0.67 | ) | (0.03 | ) | ||||||||||||||||||||
|
|
|
|
|
|
|
|
|
| |||||||||||||||||||
| $ | 6.68 | $ | 6.31 | $ | 7.61 | $ | 18.77 | $ | 19.57 | |||||||||||||||||||
|
|
|
|
|
|
|
|
|
| |||||||||||||||||||
| 5.86% | (13.47% | ) | 39.45% | (0.65% | ) | (1.27% | ) | |||||||||||||||||||||
| $ | 98 | $ | 87 | $ | 92 | $ | 51 | $ | 107 | |||||||||||||||||||
| 1.59% | 1.59% | 1.63% | 1.73% | 1.70% | ||||||||||||||||||||||||
| 1.80% | 1.97% | 2.73% | 1.76% | 1.70% | ||||||||||||||||||||||||
| (0.09% | ) | (0.12% | ) | (0.47% | ) | (0.34% | ) | (0.48% | ) | |||||||||||||||||||
| (0.30% | ) | (0.50% | ) | (1.57% | ) | (0.37% | ) | (0.48% | ) | |||||||||||||||||||
| 97% | 106% | 142% | 66% | 41% | ||||||||||||||||||||||||
| ||||||||||||||||||||||||||||
97
Table of Contents
Financial highlights
Delaware International Small Cap Fund Institutional Class
Selected data for each share of the Fund outstanding throughout each period were as follows:
|
Net asset value, beginning of period |
Income (loss) from investment operations: |
Net investment income1 |
Net realized and unrealized gain (loss) |
Total from investment operations |
Less dividends and distributions from: |
Net investment income |
Net realized gain |
Total dividends and distributions |
Net asset value, end of period |
Total return3 |
Ratios and supplemental data: |
Net assets, end of period (000 omitted) |
Ratio of expenses to average net assets |
Ratio of expenses to average net assets prior to fees waived |
Ratio of net investment income to average net assets |
Ratio of net investment income (loss) to average net assets prior to fees waived |
Portfolio turnover |
|
| 1 | The average shares outstanding method has been applied for per share information. |
| 2 | Amount is less than $0.005 per share. |
| 3 | Total return is based on the change in net asset value of a share during the period and assumes reinvestment of dividends and distributions at net asset value. Total return during some of the periods shown reflects a waiver by the manager. Performance would have been lower had the waiver not been in effect. |
See accompanying notes, which are an integral part of the financial statements.
98
Table of Contents
| Year ended | ||||||||||||||||||||||||||||
|
| |||||||||||||||||||||||||||
| 11/30/19 | 11/30/18 | 11/30/17 | 11/30/16 | 11/30/15 | ||||||||||||||||||||||||
| ||||||||||||||||||||||||||||
| $ | 6.98 | $ | 8.34 | $ | 19.27 | $ | 19.97 | $ | 20.25 | |||||||||||||||||||
| 0.03 | 0.03 | — | 2 | 0.03 | — | 2 | ||||||||||||||||||||||
| 0.42 | (1.07 | ) | 1.95 | (0.06 | ) | (0.16 | ) | |||||||||||||||||||||
|
|
|
|
|
|
|
|
|
| |||||||||||||||||||
| 0.45 | (1.04 | ) | 1.95 | (0.03 | ) | (0.16 | ) | |||||||||||||||||||||
|
|
|
|
|
|
|
|
|
| |||||||||||||||||||
| — | — | — | — | (0.12 | ) | |||||||||||||||||||||||
| — | (0.32 | ) | (12.88 | ) | (0.67 | ) | — | |||||||||||||||||||||
|
|
|
|
|
|
|
|
|
| |||||||||||||||||||
| — | (0.32 | ) | (12.88 | ) | (0.67 | ) | (0.12 | ) | ||||||||||||||||||||
|
|
|
|
|
|
|
|
|
| |||||||||||||||||||
| $ | 7.43 | $ | 6.98 | $ | 8.34 | $ | 19.27 | $ | 19.97 | |||||||||||||||||||
|
|
|
|
|
|
|
|
|
| |||||||||||||||||||
| 6.45% | (12.99% | ) | 40.06% | (0.12% | ) | (0.77% | ) | |||||||||||||||||||||
| $ | 117,702 | $ | 60,124 | $ | 14,025 | $ | 17,958 | $ | 94,047 | |||||||||||||||||||
| 1.09% | 1.09% | 1.13% | 1.23% | 1.20% | ||||||||||||||||||||||||
| 1.30% | 1.47% | 2.23% | 1.26% | 1.20% | ||||||||||||||||||||||||
| 0.41% | 0.38% | 0.03% | 0.16% | 0.02% | ||||||||||||||||||||||||
| 0.20% | 0.00% | (1.07% | ) | 0.13% | 0.02% | |||||||||||||||||||||||
| 97% | 106% | 142% | 66% | 41% | ||||||||||||||||||||||||
| ||||||||||||||||||||||||||||
99
Table of Contents
Financial highlights
Delaware International Small Cap Fund Class R6
Selected data for each share of the Fund outstanding throughout each period were as follows:
|
Net asset value, beginning of period |
Income (loss) from investment operations: |
Net investment income (loss)2 |
Net realized and unrealized gain (loss) |
Total from investment operations |
Less dividends and distributions from: |
Net realized gain |
Total dividends and distributions |
Net asset value, end of period |
Total return4 |
Ratios and supplemental data: |
Net assets, end of period (000 omitted) |
Ratio of expenses to average net assets |
Ratio of expenses to average net assets prior to fees waived |
Ratio of net investment income (loss) to average net assets |
Ratio of net investment income (loss) to average net assets prior to fees waived |
Portfolio turnover |
|
| 1 | Date of commencement of operations; ratios have been annualized and total return has not been annualized. |
| 2 | The average shares outstanding method has been applied for per share information. |
| 3 | Amount is less than $(0.005) per share. |
| 4 | Total return is based on the change in net asset value of a share during the period and assumes reinvestment of dividends and distributions at net asset value. Total return during all of the periods shown reflects a waiver by the manager. Performance would have been lower had the waiver not been in effect. |
| 5 | Portfolio turnover is representative of the Fund for the entire year ended Nov. 30, 2017. |
See accompanying notes, which are an integral part of the financial statements.
100
Table of Contents
| 6/30/171 | ||||||||||||||||||||||
| Year ended | to | |||||||||||||||||||||
| 11/30/19 | 11/30/18 | 11/30/17 | ||||||||||||||||||||
|
| |||||||||||||||||||||
| $ | 6.99 | $ | 8.35 | $ | 7.07 | |||||||||||||||||
| 0.04 | 0.04 | — | 3 | |||||||||||||||||||
| 0.42 | (1.08 | ) | 1.28 | |||||||||||||||||||
|
|
|
|
|
| |||||||||||||||||
| 0.46 | (1.04 | ) | 1.28 | |||||||||||||||||||
|
|
|
|
|
| |||||||||||||||||
| — | (0.32 | ) | — | |||||||||||||||||||
|
|
|
|
|
| |||||||||||||||||
| — | (0.32 | ) | — | |||||||||||||||||||
|
|
|
|
|
| |||||||||||||||||
| $ | 7.45 | $ | 6.99 | $ | 8.35 | |||||||||||||||||
|
|
|
|
|
| |||||||||||||||||
| 6.58% | (12.98% | ) | 18.11% | |||||||||||||||||||
| $ | 3,780 | $ | 2,676 | $ | 2 | |||||||||||||||||
| 1.00% | 1.00% | 1.00% | ||||||||||||||||||||
| 1.21% | 1.38% | 2.28% | ||||||||||||||||||||
| 0.50% | 0.47% | (0.08% | ) | |||||||||||||||||||
| 0.29% | 0.09% | (1.36% | ) | |||||||||||||||||||
| 97% | 106% | 142% | 5 | |||||||||||||||||||
|
| |||||||||||||||||||||
101
Table of Contents
Financial highlights
Delaware International Value Equity Fund Class A
Selected data for each share of the Fund outstanding throughout each period were as follows:
|
Net asset value, beginning of period |
Income (loss) from investment operations: |
Net investment income1 |
Net realized and unrealized gain (loss) |
Total from investment operations |
Less dividends and distributions from: |
Net investment income |
Total dividends and distributions |
Net asset value, end of period |
Total return2 |
Ratios and supplemental data: |
Net assets, end of period (000 omitted) |
Ratio of expenses to average net assets3 |
Ratio of expenses to average net assets prior to fees waived3 |
Ratio of net investment income to average net assets |
Ratio of net investment income to average net assets prior to fees waived |
Portfolio turnover |
|
| 1 | The average shares outstanding method has been applied for per share information. |
| 2 | Total return is based on the change in net asset value of a share during the period and assumes reinvestment of dividends and distributions at net asset value and does not reflect the impact of a sales charge. Total return during some of the periods shown reflects waivers by the manager and/or distributor. Performance would have been lower had the waivers not been in effect. |
| 3 | Expense ratios do not include expenses of the Underlying Funds in which the Fund invests. |
| 4 | The Fund’s portfolio turnover rate increased substantially during the year ended Nov. 30, 2019 due to a change in the Fund’s portfolio managers and associated repositioning. |
See accompanying notes, which are an integral part of the financial statements.
102
Table of Contents
| Year ended | ||||||||||||||||||||||||||||
|
| |||||||||||||||||||||||||||
| 11/30/19 | 11/30/18 | 11/30/17 | 11/30/16 | 11/30/15 | ||||||||||||||||||||||||
| ||||||||||||||||||||||||||||
| $ | 13.53 | $ | 15.66 | $ | 12.94 | $ | 12.96 | $ | 13.53 | |||||||||||||||||||
| 0.19 | 0.29 | 0.24 | 0.19 | 0.17 | ||||||||||||||||||||||||
| 1.23 | (2.19 | ) | 2.75 | (0.05 | ) | (0.47 | ) | |||||||||||||||||||||
|
|
|
|
|
|
|
|
|
| |||||||||||||||||||
| 1.42 | (1.90 | ) | 2.99 | 0.14 | (0.30 | ) | ||||||||||||||||||||||
|
|
|
|
|
|
|
|
|
| |||||||||||||||||||
| (0.29 | ) | (0.23 | ) | (0.27 | ) | (0.16 | ) | (0.27 | ) | |||||||||||||||||||
|
|
|
|
|
|
|
|
|
| |||||||||||||||||||
| (0.29 | ) | (0.23 | ) | (0.27 | ) | (0.16 | ) | (0.27 | ) | |||||||||||||||||||
|
|
|
|
|
|
|
|
|
| |||||||||||||||||||
| $ | 14.66 | $ | 13.53 | $ | 15.66 | $ | 12.94 | $ | 12.96 | |||||||||||||||||||
|
|
|
|
|
|
|
|
|
| |||||||||||||||||||
| 10.94% | (12.32% | ) | 23.53% | 1.15% | (2.23% | ) | ||||||||||||||||||||||
| $ | 62,035 | $ | 63,604 | $ | 68,412 | $ | 54,967 | $ | 66,785 | |||||||||||||||||||
| 1.34% | 1.33% | 1.35% | 1.36% | 1.40% | ||||||||||||||||||||||||
| 1.35% | 1.33% | 1.35% | 1.36% | 1.40% | ||||||||||||||||||||||||
| 1.35% | 1.93% | 1.65% | 1.50% | 1.24% | ||||||||||||||||||||||||
| 1.34% | 1.93% | 1.65% | 1.50% | 1.24% | ||||||||||||||||||||||||
| 143% | 4 | 13% | 15% | 13% | 13% | |||||||||||||||||||||||
| ||||||||||||||||||||||||||||
103
Table of Contents
Financial highlights
Delaware International Value Equity Fund Class C
Selected data for each share of the Fund outstanding throughout each period were as follows:
|
Net asset value, beginning of period |
Income (loss) from investment operations: |
Net investment income1 |
Net realized and unrealized gain (loss) |
Total from investment operations |
Less dividends and distributions from: |
Net investment income |
Total dividends and distributions |
Net asset value, end of period |
Total return2 |
Ratios and supplemental data: |
Net assets, end of period (000 omitted) |
Ratio of expenses to average net assets3 |
Ratio of expenses to average net assets prior to fees waived3 |
Ratio of net investment income to average net assets |
Ratio of net investment income to average net assets prior to fees waived |
Portfolio turnover |
|
| 1 | The average shares outstanding method has been applied for per share information. |
| 2 | Total return is based on the change in net asset value of a share during the period and assumes reinvestment of dividends and distributions at net asset value and does not reflect the impact of a sales charge. Total return during some of the periods shown reflects a waiver by the manager. Performance would have been lower had the waiver not been in effect. |
| 3 | Expense ratios do not include expenses of the Underlying Funds in which the Fund invests. |
| 4 | The Fund’s portfolio turnover rate increased substantially during the year ended Nov. 30, 2019 due to a change in the Fund’s portfolio managers and associated repositioning. |
See accompanying notes, which are an integral part of the financial statements.
104
Table of Contents
| Year ended | ||||||||||||||||||||||||||||
|
| |||||||||||||||||||||||||||
| 11/30/19 | 11/30/18 | 11/30/17 | 11/30/16 | 11/30/15 | ||||||||||||||||||||||||
| ||||||||||||||||||||||||||||
| $ | 13.25 | $ | 15.36 | $ | 12.69 | $ | 12.71 | $ | 13.27 | |||||||||||||||||||
| 0.08 | 0.16 | 0.13 | 0.09 | 0.06 | ||||||||||||||||||||||||
| 1.25 | (2.15 | ) | 2.72 | (0.04 | ) | (0.46 | ) | |||||||||||||||||||||
|
|
|
|
|
|
|
|
|
| |||||||||||||||||||
| 1.33 | (1.99 | ) | 2.85 | 0.05 | (0.40 | ) | ||||||||||||||||||||||
|
|
|
|
|
|
|
|
|
| |||||||||||||||||||
| (0.10 | ) | (0.12 | ) | (0.18 | ) | (0.07 | ) | (0.16 | ) | |||||||||||||||||||
|
|
|
|
|
|
|
|
|
| |||||||||||||||||||
| (0.10 | ) | (0.12 | ) | (0.18 | ) | (0.07 | ) | (0.16 | ) | |||||||||||||||||||
|
|
|
|
|
|
|
|
|
| |||||||||||||||||||
| $ | 14.48 | $ | 13.25 | $ | 15.36 | $ | 12.69 | $ | 12.71 | |||||||||||||||||||
|
|
|
|
|
|
|
|
|
| |||||||||||||||||||
| 10.18% | (13.04% | ) | 22.71% | 0.36% | (2.99% | ) | ||||||||||||||||||||||
| $ | 8,562 | $ | 8,734 | $ | 21,505 | $ | 21,672 | $ | 26,402 | |||||||||||||||||||
| 2.09% | 2.08% | 2.10% | 2.11% | 2.15% | ||||||||||||||||||||||||
| 2.10% | 2.08% | 2.10% | 2.11% | 2.15% | ||||||||||||||||||||||||
| 0.60% | 1.18% | 0.90% | 0.75% | 0.49% | ||||||||||||||||||||||||
| 0.59% | 1.18% | 0.90% | 0.75% | 0.49% | ||||||||||||||||||||||||
| 143% | 4 | 13% | 15% | 13% | 13% | |||||||||||||||||||||||
| ||||||||||||||||||||||||||||
105
Table of Contents
Financial highlights
Delaware International Value Equity Fund Class R
Selected data for each share of the Fund outstanding throughout each period were as follows:
|
Net asset value, beginning of period |
Income (loss) from investment operations: |
Net investment income1 |
Net realized and unrealized gain (loss) |
Total from investment operations |
Less dividends and distributions from: |
Net investment income |
Total dividends and distributions |
Net asset value, end of period |
Total return2 |
Ratios and supplemental data: |
Net assets, end of period (000 omitted) |
Ratio of expenses to average net assets3 |
Ratio of expenses to average net assets prior to fees waived3 |
Ratio of net investment income to average net assets |
Ratio of net investment income to average net assets prior to fees waived |
Portfolio turnover |
|
| 1 | The average shares outstanding method has been applied for per share information. |
| 2 | Total return is based on the change in net asset value of a share during the period and assumes reinvestment of dividends and distributions at net asset value. Total return during some of the periods shown reflects waivers by the manager and/or distributor. Performance would have been lower had the waivers not been in effect. |
| 3 | Expense ratios do not include expenses of the Underlying Funds in which the Fund invests. |
| 4 | The Fund’s portfolio turnover rate increased substantially during the year ended Nov. 30, 2019 due to a change in the Fund’s portfolio managers and associated repositioning. |
See accompanying notes, which are an integral part of the financial statements.
106
Table of Contents
| Year ended | ||||||||||||||||||||||||||||
|
| |||||||||||||||||||||||||||
| 11/30/19 | 11/30/18 | 11/30/17 | 11/30/16 | 11/30/15 | ||||||||||||||||||||||||
| ||||||||||||||||||||||||||||
| $ | 13.46 | $ | 15.59 | $ | 12.88 | $ | 12.90 | $ | 13.47 | |||||||||||||||||||
| 0.15 | 0.25 | 0.20 | 0.16 | 0.13 | ||||||||||||||||||||||||
| 1.24 | (2.19 | ) | 2.75 | (0.05 | ) | (0.47 | ) | |||||||||||||||||||||
|
|
|
|
|
|
|
|
|
| |||||||||||||||||||
| 1.39 | (1.94 | ) | 2.95 | 0.11 | (0.34 | ) | ||||||||||||||||||||||
|
|
|
|
|
|
|
|
|
| |||||||||||||||||||
| (0.25 | ) | (0.19 | ) | (0.24 | ) | (0.13 | ) | (0.23 | ) | |||||||||||||||||||
|
|
|
|
|
|
|
|
|
| |||||||||||||||||||
| (0.25 | ) | (0.19 | ) | (0.24 | ) | (0.13 | ) | (0.23 | ) | |||||||||||||||||||
|
|
|
|
|
|
|
|
|
| |||||||||||||||||||
| $ | 14.60 | $ | 13.46 | $ | 15.59 | $ | 12.88 | $ | 12.90 | |||||||||||||||||||
|
|
|
|
|
|
|
|
|
| |||||||||||||||||||
| 10.72% | (12.58% | ) | 23.26% | 0.88% | (2.50% | ) | ||||||||||||||||||||||
| $ | 3,472 | $ | 3,508 | $ | 3,440 | $ | 1,578 | $ | 1,449 | |||||||||||||||||||
| 1.59% | 1.58% | 1.60% | 1.61% | 1.65% | ||||||||||||||||||||||||
| 1.60% | 1.58% | 1.60% | 1.61% | 1.65% | ||||||||||||||||||||||||
| 1.10% | 1.68% | 1.40% | 1.25% | 0.99% | ||||||||||||||||||||||||
| 1.09% | 1.68% | 1.40% | 1.25% | 0.99% | ||||||||||||||||||||||||
| 143% | 4 | 13% | 15% | 13% | 13% | |||||||||||||||||||||||
| ||||||||||||||||||||||||||||
107
Table of Contents
Financial highlights
Delaware International Value Equity Fund Institutional Class
Selected data for each share of the Fund outstanding throughout each period were as follows:
|
Net asset value, beginning of period |
Income (loss) from investment operations: |
Net investment income1 |
Net realized and unrealized gain (loss) |
Total from investment operations |
Less dividends and distributions from: |
Net investment income |
Total dividends and distributions |
Net asset value, end of period |
Total return2 |
Ratios and supplemental data: |
Net assets, end of period (000 omitted) |
Ratio of expenses to average net assets3 |
Ratio of expenses to average net assets prior to fees waived3 |
Ratio of net investment income to average net assets |
Ratio of net investment income to average net assets prior to fees waived |
Portfolio turnover |
|
| 1 | The average shares outstanding method has been applied for per share information. |
| 2 | Total return is based on the change in net asset value of a share during the period and assumes reinvestment of dividends and distributions at net asset value. Total return during some of the periods shown reflects a waiver by the manager. Performance would have been lower had the waiver not been in effect. |
| 3 | Expense ratios do not include expenses of the Underlying Funds in which the Fund invests. |
| 4 | The Fund’s portfolio turnover rate increased substantially during the year ended Nov. 30, 2019 due to a change in the Fund’s portfolio managers and associated repositioning. |
See accompanying notes, which are an integral part of the financial statements.
108
Table of Contents
| Year ended | ||||||||||||||||||||||||||||
|
| |||||||||||||||||||||||||||
| 11/30/19 | 11/30/18 | 11/30/17 | 11/30/16 | 11/30/15 | ||||||||||||||||||||||||
| ||||||||||||||||||||||||||||
| $ | 13.60 | $ | 15.74 | $ | 13.00 | $ | 13.02 | $ | 13.60 | |||||||||||||||||||
| 0.22 | 0.33 | 0.28 | 0.22 | 0.20 | ||||||||||||||||||||||||
| 1.25 | (2.20 | ) | 2.76 | (0.04 | ) | (0.48 | ) | |||||||||||||||||||||
|
|
|
|
|
|
|
|
|
| |||||||||||||||||||
| 1.47 | (1.87 | ) | 3.04 | 0.18 | (0.28 | ) | ||||||||||||||||||||||
|
|
|
|
|
|
|
|
|
| |||||||||||||||||||
| (0.33 | ) | (0.27 | ) | (0.30 | ) | (0.20 | ) | (0.30 | ) | |||||||||||||||||||
|
|
|
|
|
|
|
|
|
| |||||||||||||||||||
| (0.33 | ) | (0.27 | ) | (0.30 | ) | (0.20 | ) | (0.30 | ) | |||||||||||||||||||
|
|
|
|
|
|
|
|
|
| |||||||||||||||||||
| $ | 14.74 | $ | 13.60 | $ | 15.74 | $ | 13.00 | $ | 13.02 | |||||||||||||||||||
|
|
|
|
|
|
|
|
|
| |||||||||||||||||||
| 11.29% | (12.11% | ) | 23.87% | 1.41% | (2.03% | ) | ||||||||||||||||||||||
| $ | 229,511 | $ | 220,747 | $ | 226,644 | $ | 165,361 | $ | 161,468 | |||||||||||||||||||
| 1.09% | 1.08% | 1.10% | 1.11% | 1.15% | ||||||||||||||||||||||||
| 1.10% | 1.08% | 1.10% | 1.11% | 1.15% | ||||||||||||||||||||||||
| 1.60% | 2.18% | 1.90% | 1.75% | 1.49% | ||||||||||||||||||||||||
| 1.59% | 2.18% | 1.90% | 1.75% | 1.49% | ||||||||||||||||||||||||
| 143% | 4 | 13% | 15% | 13% | 13% | |||||||||||||||||||||||
| ||||||||||||||||||||||||||||
109
Table of Contents
Financial highlights
Delaware International Value Equity Fund Class R6
Selected data for each share of the Fund outstanding throughout the period were as follows:
| 3/29/181 | ||||||||
| Year ended | to | |||||||
| 11/30/19 | 11/30/18 | |||||||
| ||||||||
Net asset value, beginning of period | $ | 13.60 | $ | 15.36 | ||||
Income (loss) from investment operations: | ||||||||
Net investment income2 | 0.24 | 0.25 | ||||||
Net realized and unrealized gain (loss) | 1.24 | (2.01 | ) | |||||
|
|
|
| |||||
Total from investment operations | 1.48 | (1.76 | ) | |||||
|
|
|
| |||||
Less dividends and distributions from: | ||||||||
Net investment income | (0.34 | ) | — | |||||
|
|
|
| |||||
Total dividends and distributions | (0.34 | ) | — | |||||
|
|
|
| |||||
Net asset value, end of period | $ | 14.74 | $ | 13.60 | ||||
|
|
|
| |||||
Total return3 | 11.36% | (11.46% | ) | |||||
Ratios and supplemental data: | ||||||||
Net assets, end of period (000 omitted) | $ | 2,091 | $ | 2 | ||||
Ratio of expenses to average net assets4 | 1.03% | 1.02% | ||||||
Ratio of net investment income to average net assets | 1.66% | 2.47% | ||||||
Portfolio turnover | 143% | 5 | 13% | 6 | ||||
| ||||||||
| 1 | Date of commencement of operations; ratios have been annualized and total return has not been annualized. |
| 2 | The average shares outstanding method has been applied for per share information. |
| 3 | Total return is based on the change in net asset value of a share during the period and assumes reinvestment of dividends and distributions at net asset value. |
| 4 | Expense ratios do not include expenses of the Underlying Funds in which the Fund invests. |
| 5 | The Fund’s portfolio turnover rate increased substantially during the year ended Nov. 30, 2019 due to a change in the Fund’s portfolio managers and associated repositioning. |
| 6 | Portfolio turnover is representative of the Fund for the entire year ended Nov. 30, 2018. |
See accompanying notes, which are an integral part of the financial statements.
110
Table of Contents
| Notes to financial statements | ||
| Delaware International Funds | November 30, 2019 |
Delaware Group® Global & International Funds (Trust) is organized as a Delaware statutory trust and offers four series: Delaware Emerging Markets Fund, Delaware Global Value Fund, Delaware International Small Cap Fund, and Delaware International Value Equity Fund. These financial statements and the related notes pertain to Delaware Emerging Markets Fund, Delaware Global Value Fund, Delaware International Small Cap Fund, and Delaware International Value Equity Fund (each, a Fund or collectively, the Funds). The Trust is anopen-end investment company. Each Fund is considered diversified under the Investment Company Act of 1940, as amended, and offers Class A, Class C, Class R, and Institutional Class shares. Delaware Emerging Markets Fund, Delaware International Small Cap Fund, and Delaware International Value Equity Fund also offer Class R6 shares. As of Nov. 30, 2019, Delaware Global Value Fund has not commenced operations of its Class R shares. Class A shares are sold with a maximumfront-end sales charge of 5.75%. Class A share purchases of $1,000,000 or more will incur a contingent deferred sales charge (CDSC) instead of afront-end sales charge of 1.00%, if redeemed during the first year, and 0.50% during the second year, provided that Delaware Distributors, L.P. (DDLP) paid a financial advisor a commission on the purchase of those shares. Class C shares are sold with a CDSC of 1.00%, which will be incurred if redeemed during the first 12 months. Class R, Institutional Class, and Class R6 shares are not subject to a sales charge and are offered for sale exclusively to certain eligible investors. In addition, Class R6 shares do not pay any service fees,sub-accounting fees, and/orsub-transfer agency fees to any brokers, dealers, or other financial intermediaries.
The investment objective of Delaware Emerging Markets Fund, Delaware Global Value Fund, and Delaware International Small Cap Fund is to seek long-term capital appreciation.
The investment objective of Delaware International Value Equity Fund is to seek long-term growth without undue risk to principal.
1. Significant Accounting Policies
Each Fund follows accounting and reporting guidance under Financial Accounting Standards Board (FASB) Accounting Standards Codification Topic 946, Financial Services – Investment Companies. The following accounting policies are in accordance with US generally accepted accounting principles (US GAAP) and are consistently followed by the Funds.
Security Valuation— Equity securities and exchange-traded funds (ETFs), except those traded on the Nasdaq Stock Market LLC (Nasdaq), are valued at the last quoted sales price as of the time of the regular close of the New York Stock Exchange on the valuation date. Equity securities and ETFs traded on the Nasdaq are valued in accordance with the Nasdaq Official Closing Price, which may not be the last sales price. If, on a particular day, an equity security or ETF does not trade, the mean between the bid and ask prices will be used, which approximates fair value. Equity securities listed on a foreign exchange are normally valued at the last quoted sales price on the valuation date. US government and agency securities are valued at the mean between the bid and ask prices, which approximates fair value. Investments in repurchase agreements are generally valued at par, which approximates fair value, each business day.Open-end investment company securities are valued at net asset value (NAV) per share, as reported by the underlying investment company. Foreign currency exchange contracts and foreign cross currency exchange contracts are valued at the mean between the bid and ask prices, which approximates fair value. Interpolated values are derived when the settlement date of the contract is an
111
Table of Contents
Notes to financial statements
Delaware International Funds
1. Significant Accounting Policies (continued)
interim date for which quotations are not available. Generally, other securities and assets for which market quotations are not readily available are valued at fair value as determined in good faith under the direction of the Trust’s Board of Trustees (Board). In determining whether market quotations are readily available or fair valuation will be used, various factors will be taken into consideration, such as market closures or suspension of trading in a security. The Funds may use fair value pricing more frequently for securities traded primarily innon-US markets because, among other things, most foreign markets close well before the Funds value their securities, generally as of 4:00pm Eastern time. The earlier close of these foreign markets gives rise to the possibility that significant events, including broad market moves, government actions or pronouncements, aftermarket trading, or news events may have occurred in the interim. Whenever such a significant event occurs, the Funds may value foreign securities using fair value prices based on third-party vendor modeling tools (international fair value pricing). Restricted securities are valued at fair value using methods approved by the Board.
Federal and Foreign Income Taxes— No provision for federal income taxes has been made as each Fund intends to continue to qualify for federal income tax purposes as a regulated investment company under Subchapter M of the Internal Revenue Code of 1986, as amended, and make the requisite distributions to shareholders. Each Fund evaluates tax positions taken or expected to be taken in the course of preparing each Fund’s tax returns to determine whether the tax positions are“more-likely-than-not” of being sustained by the applicable tax authority. Tax positions not deemed to meet the“more-likely-than-not” threshold are recorded as a tax benefit or expense in the current year. Management has analyzed each Fund’s tax positions taken or expected to be taken on each Fund’s federal income tax returns through the year ended Nov. 30, 2019 and for all open tax years (years ended Nov. 30, 2016–Nov. 30, 2018), and has concluded that no provision for federal income tax is required in each Fund’s financial statements. If applicable, the Funds recognize interest accrued on unrecognized tax benefits in interest expense and penalties in “Other” on the “Statements of operations.” In regard to foreign taxes only, each Fund has open tax years in certain foreign countries in which it invests that may date back to the inception of each Fund. During the year ended Nov. 30, 2019, the Funds did not incur any interest or tax penalties.
Class Accounting— Investment income, common expenses, and realized and unrealized gain (loss) on investments are allocated to the various classes of each Fund on the basis of daily net assets of each class. Distribution expenses relating to a specific class are charged directly to that class. Class R6 shares will not be allocated any expenses related to service fees,sub-accounting fees, and/orsub-transfer agency fees paid to brokers, dealers, or other financial intermediaries.
Underlying Funds— The Funds may invest in other investment companies (Underlying Funds) to the extent permitted by the 1940 Act. The Underlying Funds in which the Funds may invest include ETFs. A Fund will indirectly bear the investment management fees and other expenses of the Underlying Funds.
Repurchase Agreements— Each Fund may purchase certain US government securities subject to the counterparty’s agreement to repurchase them at an agreed upon date and price. The counterparty will be required on a daily basis to maintain the value of the collateral subject to the agreement at not less than the repurchase price (including accrued interest). The agreements are conditioned upon the collateral being deposited under the Federal Reserve book-entry system with each Fund’s custodian or a
112
Table of Contents
third-partysub-custodian. In the event of default or bankruptcy by the other party to the agreement, retention of the collateral may be subject to legal proceedings. At Nov. 29, 2019, Delaware Emerging Markets Fund, Delaware Global Value Fund, and Delaware International Small Cap Fund held no investments in repurchase agreements.
Foreign Currency Transactions— Transactions denominated in foreign currencies are recorded at the prevailing exchange rates on the valuation date in accordance with each Fund’s prospectus. The value of all assets and liabilities denominated in foreign currencies is translated daily into US dollars at the exchange rate of such currencies against the US dollar. Transaction gains or losses resulting from changes in exchange rates during the reporting period or upon settlement of the foreign currency transaction are reported in operations for the current period. The Funds generally do not bifurcate that portion of realized gains and losses on investments which is due to changes in foreign exchange rates from that which is due to changes in market prices. These gains and losses are included on the “Statements of operations” under “Net realized gain (loss) on investments.” Each Fund reports certain foreign currency related transactions as components of realized gains (losses) for financial reporting purposes, whereas such components are treated as ordinary income (loss) for federal income tax purposes.
Use of Estimates— The preparation of financial statements in conformity with US GAAP requires management to make estimates and assumptions that affect the fair value of investments, the reported amounts of assets and liabilities and disclosure of contingent assets and liabilities at the date of the financial statements, and the reported amounts of revenues and expenses during the reporting period. Actual results could differ from those estimates and the differences could be material.
Other— Expenses directly attributable to a Fund are charged directly to the Fund. Other expenses common to various funds within the Delaware Funds® by Macquarie (Delaware Funds) are generally allocated among such funds on the basis of average net assets. Management fees and certain other expenses are paid monthly. Security transactions are recorded on the date the securities are purchased or sold (trade date) for financial reporting purposes. Costs used in calculating realized gains and losses on the sale of investment securities are those of the specific securities sold. Dividend income is recorded on theex-dividend date and interest income is recorded on the accrual basis. Discounts and premiums on debt securities are accreted or amortized to interest income, respectively, over the lives of the respective securities using the effective interest method. Taxablenon-cash dividends are recorded as dividend income. Foreign dividends are also recorded on theex-dividend date or as soon after theex-dividend date that a Fund is aware of such dividends, net of all tax withholdings, a portion of which may be reclaimable. Withholding taxes and reclaims on foreign dividends have been recorded in accordance with each Fund’s understanding of the applicable country’s tax rules and rates. Each Fund may pay foreign capital gains taxes on certain foreign securities held, which are reported as components of realized losses for financial reporting purposes, whereas such components are treated as ordinary loss for federal income tax purposes. Each Fund will accrue such taxes as applicable based upon current interpretations of the tax rules and regulations that exist in the markets in which it invests. Each Fund declares and pays dividends from net investment income and distributions from net realized gain on investments, if any, annually. Each Fund may distribute more frequently, if necessary for tax purposes. Dividends and distributions, if any, are recorded on theex-dividend date.
113
Table of Contents
Notes to financial statements
Delaware International Funds
1. Significant Accounting Policies (continued)
Each Fund receives earnings credits from its custodian when positive cash balances are maintained, which may be used to offset custody fees. The expenses paid under this arrangement are included on the “Statements of operations” under “Custodian fees” with the corresponding expenses offset included under “Less expenses paid indirectly.” For the year ended Nov. 30, 2019, each Fund earned the following amounts under this arrangement:
| Delaware Emerging Markets Fund | Delaware Global Value Fund | Delaware International Value Equity Fund | ||
| $248 | $7 | $44 |
Delaware International Small Cap Fund did not receive any earnings credit from the custodian for the year ended Nov. 30, 2019.
Each Fund receives earnings credits from its transfer agent when positive cash balances are maintained, which may be used to offset transfer agent fees. If the amount earned is greater than $1, the expenses paid under this arrangement are included on the “Statements of operations” under “Dividend disbursing and transfer agent fees and expenses” with the corresponding expenses offset included under “Less expenses paid indirectly.” For the year ended Nov. 30, 2019, each Fund earned the following amounts under this arrangement:
| Delaware Emerging Markets Fund | Delaware Global Value Fund | Delaware International Small Cap Fund | Delaware International Value Equity Fund | |||
| $2,461 | $342 | $121 | $586 |
During the year ended Nov. 30, 2019, Delaware Emerging Markets Fund frequently maintained a negative cash balance with its custodian, which is considered a form of borrowing or leverage. If that Fund maintains a negative cash balance and the Fund’s investments decrease in value, the Fund’s losses will be greater than if the Fund did not maintain a negative cash balance. Each Fund is required to pay interest to the custodian on negative cash balances. During the year ended Nov. 30, 2019, Delaware Emerging Markets Fund had an average outstanding overdraft balance equal to 0.56% of its average net assets for which it was charged interest of $823,961, which is included on the “Statements of operations” under “Custodian fees.” The average borrowing rate charged on the overdraft was 2.76%.
2. Investment Management, Administration Agreements, and Other Transactions with Affiliates
In accordance with the terms of its respective investment management agreement, each Fund pays Delaware Management Company (DMC), a series of Macquarie Investment Management Business Trust and the investment manager, an annual fee which is calculated daily and paid monthly, based on each Fund’s average daily net assets as follows:
| Delaware Emerging Markets Fund | Delaware Global Value Fund | Delaware International Small Cap Fund | Delaware International Value Equity Fund | |||||
| On the first $500 million | 1.25% | 0.85% | 0.85% | 0.85% | ||||
| On the next $500 million | 1.20% | 0.80% | 0.80% | 0.80% | ||||
| On the next $1.5 billion | 1.15% | 0.75% | 0.75% | 0.75% | ||||
| In excess of $2.5 billion | 1.10% | 0.70% | 0.70% | 0.70% |
114
Table of Contents
DMC has contractually agreed to waive that portion, if any, of its management fee and/or pay/reimburse the Funds to the extent necessary to ensure that total annual operating expenses (excluding any distribution and service(12b-1) fees, acquired fund fees and expenses, taxes, interest, short sale dividend and interest expenses, brokerage fees, certain insurance costs, and nonroutine expenses or costs, including, but not limited to, those relating to reorganizations, litigation, conducting shareholder meetings, and liquidations), do not exceed the following specified percentages of average daily net assets of each Fund. The expense waivers were in effect from Dec. 1, 2018 through Nov. 30, 2019.* For purposes of these waivers and reimbursements, nonroutine expenses may also include such additional costs and expenses, as may be agreed upon from time to time by the Funds’ Board and DMC. These expense waivers and reimbursements apply to expenses paid directly by the Funds and may only be terminated by agreement of DMC and the Funds. The waivers and reimbursements are accrued daily and received monthly.
| Delaware Emerging Markets Fund | Delaware Global Value Fund | Delaware International Small Cap Fund | Delaware International Value Equity Fund | |||||
| Operating expense limitation as a percentage of average daily net assets (per annum) Nov. 30, 2018 – March 28, 2019 | 1.42%1 | 1.30% | 1.12%3 | 1.16%4 | ||||
| Operating expense limitation as a percentage of average daily net assets (per annum) March 29, 2019 – Nov. 30, 2019 | 1.37%2 | 1.15% | 1.12%3 | 1.09%5 |
1The expense limitation was 1.29% for Class R6 shares.
2The expense limitation is 1.25% for Class R6 shares.
3The expense limitation is 1.00% for Class R6 shares.
4The expense limitation is 1.09% for Class R6 shares.
5The expense limitation is 1.03% for Class R6 shares.
Effective May 30, 2019, DMC may permit its affiliates, Macquarie Investment Management Global Limited (MIMGL) and Macquarie Funds Management Hong Kong Limited (together, the “AffiliatedSub-Advisors”), to execute Fund equity security trades on behalf of the Manager. The Manager may also seek quantitative support from MIMGL. Although the AffiliatedSub-Advisors serve assub-advisors, DMC has ultimate responsibility for all investment advisory services. For these services, DMC, not the Fund, may pay each AffiliatedSub-Advisor a portion of its investment management fee.
115
Table of Contents
Notes to financial statements
Delaware International Funds
2. Investment Management, Administration Agreements, and Other Transactions with Affiliates (continued)
Delaware Investments Fund Services Company (DIFSC), an affiliate of DMC, provides fund accounting and financial administration oversight services to each Fund. For these services DIFSC’s fees are calculated daily and paid monthly based on the aggregate daily net assets of all funds within the Delaware Funds at the following annual rates: 0.00475% of the first $35 billion; 0.0040% of the next $10 billion; and 0.0025% of aggregate average daily net assets in excess of $45 billion (Total Fee). Each fund in the Delaware Funds pays a minimum of $4,000, which, in aggregate, is subtracted from the Total Fee. Each fund then pays its portion of the remainder of the Total Fee on a relative NAV basis. These amounts are included on the “Statements of operations” under “Accounting and administration expenses.”
For the year ended Nov. 30, 2019, each Fund was charged for these services as follows:
| Delaware Emerging Markets Fund | Delaware Global Value Fund | Delaware International Small Cap Fund | Delaware International Value Equity Fund | |||
| $200,375 | $4,654 | $7,737 | $14,962 |
DIFSC is also the transfer agent and dividend disbursing agent of the Fund. For these services, DIFSC’s fees are calculated daily and paid monthly based on the aggregate daily net assets of the retail funds within the Delaware Funds at the following annual rates: 0.014% of the first $20 billion; 0.011% of the next $5 billion; 0.007% of the next $5 billion; 0.005% of the next $20 billion; and 0.0025% of average daily net assets in excess of $50 billion. The fees payable to DIFSC under the shareholder services agreement described above are allocated among all retail funds in the Delaware Funds on a relative NAV basis. This amount is included on the “Statements of operations” under “Dividend disbursing and transfer agent fees and expenses.” For the year ended Nov. 30, 2019, each Fund was charged for these services as follows:
| Delaware Emerging Markets Fund | Delaware Global Value Fund | Delaware International Small Cap Fund | Delaware International Value Equity Fund | |||
| $514,146 | $1,712 | $9,781 | $28,703 |
Pursuant to asub-transfer agency agreement between DIFSC and BNY Mellon Investment Servicing (US) Inc. (BNYMIS), BNYMIS provides certainsub-transfer agency services to the Funds.Sub-transfer agency fees are paid by the Funds and are also included on the “Statements of operations” under “Dividend disbursing and transfer agent fees and expenses.” The fees that are calculated daily and paid as invoices are received on a monthly or quarterly basis.
Pursuant to a distribution agreement and distribution plan, each Fund pays DDLP, the distributor and an affiliate of DMC, an annual12b-1 fee of 0.25% of the average daily net assets of the Class A shares, 1.00% of the average daily net assets of the Class C shares, and 0.50% of the average daily net assets of the Class R shares. The fees are calculated daily and paid monthly. Institutional Class and Class R6 shares do not pay12b-1 fees.
As provided in the investment management agreement, each Fund bears a portion of the cost of certain resources shared with DMC, including the cost of internal personnel of DMC and/or its affiliates that
116
Table of Contents
provide legal, tax, and regulatory reporting services to the Funds. These amounts are included on the “Statements of operations” under “Legal fees.” For the year ended Nov. 30, 2019, each Fund was charged for internal legal, tax, and regulatory reporting services provided by DMC and/or its affiliates’ employees as follows:
| Delaware Emerging Markets Fund | Delaware Global Value Fund | Delaware International Small Cap Fund | Delaware International Value Equity Fund | |||
| $144,105 | $7,331 | $2,691 | $14,334 |
For the year ended Nov. 30, 2019, DDLP earned commissions on sales of Class A shares for each Fund as follows:
| Delaware Emerging Markets Fund | Delaware Global Value Fund | Delaware International Small Cap Fund | Delaware International Value Equity Fund | |||
| $47,589 | $1,412 | $1,710 | $4,441 |
For the year ended Nov. 30, 2019, DDLP received gross CDSC commissions on redemptions of each Fund’s Class A and Class C shares, and these commissions were entirely used to offset upfront commissions previously paid by DDLP to broker/dealers on sales of those shares. The amounts received were as follows:
| Delaware Emerging Markets Fund | Delaware Global Value Fund | Delaware International Small Cap Fund | Delaware International Value Equity Fund | |||||
| Class A | $17,645 | $705 | $ 698 | $310 | ||||
| Class C | 29,600 | 12 | 2,501 | 350 |
Trustees’ fees include expenses accrued by each Fund for each Trustee’s retainer and meeting fees. Certain officers of DMC, DIFSC, and DDLP are officers and/or Trustees of the Trusts. These officers and Trustees are paid no compensation by the Funds.
In addition to the management fees and other expenses of a Fund, a Fund indirectly bears the investment management fees and other expenses of the investment companies (Underlying Funds) in which it invests. The amount of these fees and expenses incurred indirectly by a Fund will vary based upon the expense and fee levels of the Underlying Funds and the number of shares that are owned of the Underlying Funds at different times.
*The aggregate contractual waiver period covering this report is from March 29, 2018 through March 29, 2020.
117
Table of Contents
Notes to financial statements
Delaware International Funds
3. Investments
For the year ended Nov. 30, 2019, each Fund made purchases and sales of investment securities other than short-term investments as follows:
| Delaware Emerging Markets Fund | Delaware Global Value Fund | Delaware International Small Cap Fund | Delaware International Value Equity Fund | |||||||||||||
Purchases | $550,186,551 | $35,273,278 | $143,139,662 | $417,855,449 | ||||||||||||
Sales | 749,549,740 | 37,662,973 | 94,157,803 | 434,164,017 | ||||||||||||
The tax cost of investments includes adjustments to net unrealized appreciation (depreciation) which may not necessarily be final tax cost basis adjustments, but approximates the tax basis unrealized gains and losses that may be realized and distributed to shareholders. At Nov. 30, 2019, the cost and unrealized appreciation (depreciation) of investments and derivatives for federal income tax purposes for each Fund were as follows:
| Delaware Emerging Markets Fund | Delaware Global Value Fund | Delaware International Small Cap Fund | Delaware International Value Equity Fund | |||||||||||||||||
Cost of investments and derivatives | $ | 5,023,813,158 | $ | 12,842,851 | $ | 119,129,611 | $ | 297,650,117 | ||||||||||||
|
|
|
|
|
|
|
| |||||||||||||
Aggregate unrealized appreciation of investments and derivatives | $ | 1,288,836,563 | $ | 753,642 | $ | 21,579,105 | $ | 19,458,697 | ||||||||||||
Aggregate unrealized depreciation of investments and derivatives | (957,115,139 | ) | (368,212 | ) | (6,106,032 | ) | (12,327,352 | ) | ||||||||||||
|
|
|
|
|
|
|
| |||||||||||||
Net unrealized appreciation of investments and derivatives | $ | 331,721,424 | $ | 385,430 | $ | 15,473,073 | $ | 7,131,345 | ||||||||||||
|
|
|
|
|
|
|
| |||||||||||||
US GAAP defines fair value as the price that each Fund would receive to sell an asset or pay to transfer a liability in an orderly transaction between market participants at the measurement date under current market conditions. A three-level hierarchy for fair value measurements has been established based upon the transparency of inputs to the valuation of an asset or liability. Inputs may be observable or unobservable and refer broadly to the assumptions that market participants would use in pricing the asset or liability. Observable inputs reflect the assumptions market participants would use in pricing the asset or liability based on market data obtained from sources independent of the reporting entity. Unobservable inputs reflect the reporting entity’s own assumptions about the assumptions that market participants would use in pricing the asset or liability based on the best information available under the circumstances. Each Fund’s investment in its entirety is assigned a level based upon the observability of the inputs which are significant to the overall valuation. The three-level hierarchy of inputs is summarized on the next page.
118
Table of Contents
| Level 1 – | Inputs are quoted prices in active markets for identical investments. (Examples: equity securities,open-end investment companies, futures contracts, and exchange-traded options contracts) | |
| Level 2 – | Other observable inputs, including, but not limited to: quoted prices for similar assets or liabilities in markets that are active, quoted prices for identical or similar assets or liabilities in markets that are not active, inputs other than quoted prices that are observable for the assets or liabilities (such as interest rates, yield curves, volatilities, prepayment speeds, loss severities, credit risks, and default rates) or other market-corroborated inputs. (Examples: debt securities, government securities, swap contracts, foreign currency exchange contracts, foreign securities utilizing international fair value pricing, broker-quoted securities, and fair valued securities) | |
| Level 3 – | Significant unobservable inputs, including each Fund’s own assumptions used to determine the fair value of investments. (Examples: broker-quoted securities and fair valued securities) | |
Level 3 investments are valued using significant unobservable inputs. Each Fund may also use an income-based valuation approach in which the anticipated future cash flows of the investment are discounted to calculate fair value. Discounts may also be applied due to the nature or duration of any restrictions on the disposition of the investments. Valuations may also be based upon current market prices of securities that are comparable in coupon, rating, maturity, and industry. The derived value of a Level 3 investment may not represent the value which is received upon disposition and this could impact the results of operations.
119
Table of Contents
Notes to financial statements
Delaware International Funds
3. Investments (continued)
The following tables summarize the valuation of each Fund’s investments by fair value hierarchy levels as of Nov. 30, 2019:
Delaware Emerging Markets Fund | ||||||||||||||||
Level 1 | Level 2 | Level 3 | Total | |||||||||||||
Securities | ||||||||||||||||
Assets: | ||||||||||||||||
Common Stock | ||||||||||||||||
Argentina | $ | 16,598,996 | $ | 1,741,035 | $ | 131,375 | $ | 18,471,406 | ||||||||
Bahrain | — | 1,236,032 | — | 1,236,032 | ||||||||||||
Brazil | 550,181,080 | — | — | 550,181,080 | ||||||||||||
Chile | 29,076,329 | — | — | 29,076,329 | ||||||||||||
China | 1,611,058,385 | — | — | 1,611,058,385 | ||||||||||||
Cyprus | 7,636,329 | — | — | 7,636,329 | ||||||||||||
France | 663,157 | — | — | 663,157 | ||||||||||||
India | 564,853,227 | 7,552 | — | 564,860,779 | ||||||||||||
Indonesia | 33,964,516 | — | — | 33,964,516 | ||||||||||||
Israel | 15,109,000 | — | — | 15,109,000 | ||||||||||||
Japan | 39,771,200 | — | — | 39,771,200 | ||||||||||||
Malaysia | 2,889,980 | — | — | 2,889,980 | ||||||||||||
Mexico | 282,068,314 | — | — | 282,068,314 | ||||||||||||
Peru | 49,451,438 | — | — | 49,451,438 | ||||||||||||
Republic of Korea | 866,926,953 | — | — | 866,926,953 | ||||||||||||
Russia | 353,108,552 | 46,602,595 | — | 399,711,147 | ||||||||||||
South Africa | 35,812,618 | 697,368 | — | 36,509,986 | ||||||||||||
Taiwan | 544,976,833 | — | — | 544,976,833 | ||||||||||||
Turkey | 52,015,807 | — | — | 52,015,807 | ||||||||||||
United Kingdom | 3,083,121 | — | — | 3,083,121 | ||||||||||||
United States | 102,783,134 | — | — | 102,783,134 | ||||||||||||
Preferred Stock1 | 112,049,491 | 31,687,908 | — | 143,737,399 | ||||||||||||
Exchange-Traded Funds | 7,703,899 | — | — | 7,703,899 | ||||||||||||
Participation Notes | — | — | — | — | ||||||||||||
|
|
|
|
|
|
|
| |||||||||
Total Value of Securities | $ | 5,281,782,359 | $ | 81,972,490 | $ | 131,375 | $ | 5,363,886,224 | ||||||||
|
|
|
|
|
|
|
| |||||||||
Derivatives2 | ||||||||||||||||
Assets: | ||||||||||||||||
Foreign Currency Exchange Contracts | $ | — | $ | 90 | $ | — | $ | 90 | ||||||||
Liabilities: | ||||||||||||||||
Foreign Currency Exchange Contracts | $ | — | $ | (2,081 | ) | $ | — | $ | (2,081 | ) | ||||||
1Security type is valued across multiple levels. The amounts attributed to Level 1 investments and Level 2 investments represent 77.95% and 22.05%, respectively, of the total market value of this security type. Level 1 investments represent exchange traded investments and Level 2 investments represent investments with observable inputs.
120
Table of Contents
2Foreign currency exchange contracts are valued at the unrealized appreciation (depreciation) on the instrument at the year end.
Delaware Global Value Fund | ||||||||||||
Level 1 | Level 2 | Total | ||||||||||
Assets: | ||||||||||||
Common Stock | $ | 13,051,152 | $ | — | $ | 13,051,152 | ||||||
Short-Term Investments | 3,949 | — | 3,949 | |||||||||
Exchange-Traded Fund | 173,190 | — | 173,190 | |||||||||
|
|
|
|
|
| |||||||
Total Value of Securities | $ | 13,228,291 | $ | — | $ | 13,228,291 | ||||||
|
|
|
|
|
| |||||||
Derivatives1 | ||||||||||||
Liabilities: | ||||||||||||
Foreign Currency Exchange Contracts | $ | — | $ | (10) | $ | (10 | ) | |||||
1Foreign currency exchange contracts are valued at the unrealized appreciation (depreciation) on the instrument at the year end.
121
Table of Contents
Notes to financial statements
Delaware International Funds
3. Investments (continued)
Delaware International Small Cap Fund | ||||||||||||||||
Level 1 | Level 2 | Level 3 | Total | |||||||||||||
Securities | ||||||||||||||||
Assets: | ||||||||||||||||
Common Stock | ||||||||||||||||
Australia | $ | 3,993,006 | $ | — | $ | — | $ | 3,993,006 | ||||||||
Austria | 3,471,660 | — | — | 3,471,660 | ||||||||||||
Belgium | 1,714,491 | — | — | 1,714,491 | ||||||||||||
Brazil | 6,784,269 | — | — | 6,784,269 | ||||||||||||
Canada | 11,538,592 | — | — | 11,538,592 | ||||||||||||
China | 3,390,915 | — | — | 3,390,915 | ||||||||||||
Colombia | 1,673,873 | — | — | 1,673,873 | ||||||||||||
Denmark | 2,707,339 | — | — | 2,707,339 | ||||||||||||
Finland | 1,786,944 | — | — | 1,786,944 | ||||||||||||
France | 8,133,319 | — | — | 8,133,319 | ||||||||||||
Germany | 3,497,739 | — | — | 3,497,739 | ||||||||||||
India | 4,209,186 | — | — | 4,209,186 | ||||||||||||
Indonesia | 567,848 | — | — | 567,848 | ||||||||||||
Ireland | 2,779,860 | — | — | 2,779,860 | ||||||||||||
Israel | 3,596,749 | — | — | 3,596,749 | ||||||||||||
Italy | 1,894,040 | — | — | 1,894,040 | ||||||||||||
Ivory Coast | 1,359,720 | — | — | 1,359,720 | ||||||||||||
Japan | 25,345,492 | — | — | 25,345,492 | ||||||||||||
Netherlands | 793,438 | — | — | 793,438 | ||||||||||||
Norway | 8,993,794 | — | — | 8,993,794 | ||||||||||||
Poland | 1,346,788 | — | — | 1,346,788 | ||||||||||||
Portugal | 808,432 | — | — | 808,432 | ||||||||||||
Republic of Korea | 3,738,580 | — | — | 3,738,580 | ||||||||||||
South Africa | 1,265,150 | — | — | 1,265,150 | ||||||||||||
Spain | 468,460 | — | — | 468,460 | ||||||||||||
Sweden | 4,913,734 | —�� | — | 4,913,734 | ||||||||||||
Switzerland | 1,281,752 | — | — | 1,281,752 | ||||||||||||
Taiwan | 1,043,823 | — | — | 1,043,823 | ||||||||||||
United Kingdom | 17,713,339 | — | — | 17,713,339 | ||||||||||||
Short-Term Investments | 3,790,708 | — | — | 3,790,708 | ||||||||||||
|
|
|
|
|
|
|
| |||||||||
Total Value of Securities | $ | 134,603,040 | $ | — | $ | — | $ | 134,603,040 | ||||||||
|
|
|
|
|
|
|
| |||||||||
Derivatives1 | ||||||||||||||||
Assets: | ||||||||||||||||
Foreign Currency Exchange Contracts | $ | — | $ | 4 | $ | — | $ | 4 | ||||||||
122
Table of Contents
Delaware International Small Cap Fund | ||||||||||||||||
Level 1 | Level 2 | Level 3 | Total | |||||||||||||
Liabilities: | ||||||||||||||||
Foreign Currency Exchange Contracts | $ | — | $ | (360) | $ | — | $ | (360 | ) | |||||||
1Foreign currency exchange contracts are valued at the unrealized appreciation (depreciation) on the instrument at the year end.
Delaware International Value Equity Fund | ||||||||||||
Level 1 | Level 2 | Total | ||||||||||
Securities | ||||||||||||
Assets: | ||||||||||||
Common Stock | ||||||||||||
Denmark | $ | 20,145,634 | $ | — | $ | 20,145,634 | ||||||
France | 78,209,066 | — | 78,209,066 | |||||||||
Germany | 20,184,730 | — | 20,184,730 | |||||||||
Ireland | 4,552,445 | — | 4,552,445 | |||||||||
Japan | 65,868,068 | — | 65,868,068 | |||||||||
Netherlands | 22,695,366 | — | 22,695,366 | |||||||||
Sweden | 11,760,433 | — | 11,760,433 | |||||||||
Switzerland | 45,634,023 | — | 45,634,023 | |||||||||
United Kingdom | 29,314,455 | — | 29,314,455 | |||||||||
Exchange-Traded Fund | 6,135,686 | — | 6,135,686 | |||||||||
Short-Term Investments | — | — | — | |||||||||
Securities Lending Collateral | — | 281,607 | 281,607 | |||||||||
|
|
|
|
|
| |||||||
Total Value of Securities | $ | 304,499,906 | $ | 281,607 | $ | 304,781,513 | ||||||
|
|
|
|
|
| |||||||
Derivatives1 | ||||||||||||
Liabilities: | ||||||||||||
Foreign Currency Exchange Contract | $ | — | $ | (51 | ) | $ | (51) | |||||
1Foreign currency exchange contracts are valued at the unrealized appreciation (depreciation) on the instrument at the year end.
The securities that have been valued at zero on the “Schedules of investments” are considered to be Level 3 investments in these tables.
During the year ended Nov. 30, 2019, there were no transfers between Level 1 investments, Level 2 investments, or Level 3 investments that had a significant impact to each Fund. This does not include transfers between Level 1 investments and Level 2 investments due to each Fund utilizing international fair value pricing during the year. In accordance with the fair valuation procedures described in Note 1, international fair value pricing of securities in each Fund occurs when market volatility exceeds an established rolling threshold. If the threshold is exceeded on a given date, then prices of international securities (those that traded on exchanges that close at a different time than the time that each Fund’s NAV is determined) are established using a separate pricing feed from a third-party vendor designed to establish a price for each such security as of the time that each Fund’s NAV is determined. Further,
123
Table of Contents
Notes to financial statements
Delaware International Funds
3. Investments (continued)
international fair value pricing uses other observable market-based inputs in place of the closing exchange price due to the events occurring after the close of the exchange or market on which the investment is principally traded, causing a change in classification between levels. International fair value pricing was not utilized at Nov. 30, 2019. Each Fund’s policy is to recognize transfers between levels based on fair value at the beginning of the reporting period.
A reconciliation of Level 3 investments is presented when a Fund has a significant amount of Level 3 investments at the beginning, interim, or end of the period in relation to the Fund’s net assets. Management has determined not to provide a reconciliation of Level 3 investments as the Level 3 investments were not considered significant to each Fund’s net assets at the beginning, interim, or end of the year. Management has determined not to provide additional disclosure on Level 3 inputs since the Level 3 investments are not considered significant to each Fund’s net assets at the end of the year.
During the year ended Nov. 30, 2019, Delaware Global Value Fund and Delaware International Value Equity Fund had no Level 3 investments.
4. Dividend and Distribution Information
Income and long-term capital gain distributions are determined in accordance with federal income tax regulations, which may differ from US GAAP. Additionally, distributions from net gains on foreign currency transactions and net short-term gains on sales of investment securities are treated as ordinary income for federal income tax purposes. The tax character of dividends and distributions paid during the years ended Nov. 30, 2019 and 2018 was as follows:
| Delaware Emerging Markets Fund | Delaware Global Value Fund | Delaware International Small Cap Fund | Delaware International Value Equity Fund | |||||||||||||||||
Year ended Nov. 30, 2019 | ||||||||||||||||||||
Ordinary income | $ | 29,107,600 | $ | 192,353 | $ | — | $ | 6,622,712 | ||||||||||||
Long-term capital gains | — | 444,261 | — | — | ||||||||||||||||
|
|
|
|
|
|
|
| |||||||||||||
Total | $ | 29,107,600 | $ | 636,614 | $ | — | $ | 6,622,712 | ||||||||||||
|
|
|
|
|
|
|
| |||||||||||||
Year ended Nov. 30, 2018 | ||||||||||||||||||||
Ordinary income | $ | 84,246,297 | $ | 208,155 | $ | 658,536 | $ | 5,117,450 | ||||||||||||
Long-term capital gains | — | — | 637,439 | — | ||||||||||||||||
|
|
|
|
|
|
|
| |||||||||||||
Total | $ | 84,246,297 | $ | 208,155 | $ | 1,295,975 | $ | 5,117,450 | ||||||||||||
|
|
|
|
|
|
|
| |||||||||||||
124
Table of Contents
5. Components of Net Assets on a Tax Basis
As of Nov. 30, 2019, the components of net assets on a tax basis were as follows:
| Delaware Emerging Markets Fund | Delaware Global Value Fund | Delaware International Small Cap Fund | Delaware International Value Equity Fund | |||||||||||||||||
Shares of beneficial interest | $ | 5,020,297,100 | $ | 9,823,808 | $ | 140,656,068 | $ | 290,188,405 | ||||||||||||
Undistributed ordinary income | 28,936,207 | 393,484 | 206,368 | 4,154,495 | ||||||||||||||||
Undistributed long-term capital gains | — | 2,625,582 | — | 4,197,160 | ||||||||||||||||
Capital loss carryforwards | (28,442,963 | ) | — | (20,280,798 | ) | — | ||||||||||||||
Unrealized appreciation (depreciation) of investments and foreign currencies | 331,721,424 | 385,430 | 15,473,073 | 7,131,345 | ||||||||||||||||
|
|
|
|
|
|
|
| |||||||||||||
Net assets | $ | 5,352,511,768 | $ | 13,228,304 | $ | 136,054,711 | $ | 305,671,405 | ||||||||||||
|
|
|
|
|
|
|
| |||||||||||||
The differences between book basis and tax basis components of net assets are primarily attributable to tax deferral of losses on wash sales, tax treatment of forward currency contracts, tax treatment of passive foreign investment companies (PFICs) and securities no longer considered PFICs.
For financial reporting purposes, capital accounts are adjusted to reflect the tax character of permanent book/tax differences. Reclassifications are primarily due to net operating losses. Results of operations and net assets were not affected by these reclassifications. For year ended Nov. 30, 2019, the Funds recorded the following reclassifications:
| Delaware International Small Cap Fund | |||||
Total distributable earnings (loss) | $ | (1,657 | ) | ||
Paid in capital | 1,657 | ||||
Delaware Emerging Markets Fund, Delaware Global Value Fund, and Delaware International Value Equity Fund had no reclassifications.
For federal income tax purposes, capital loss carryforwards may be carried forward and applied against future capital gains. At Nov. 30, 2019, Delaware International Value Equity Fund utilized $7,337,402 capital loss carryforwards.
Delaware Emerging Markets Fund, Delaware Global Value Fund, and Delaware International Small Cap Fund did not utilize capital loss carryforward for 2019.
125
Table of Contents
Notes to financial statements
Delaware International Funds
5. Components of Net Assets on a Tax Basis (continued)
At Nov. 30, 2019, capital loss carryforwards available to offset future realized capital gains, are as follows:
Loss carryforward character | ||||||||||||
| Short-term | Long-term | Total | ||||||||||
Delaware Emerging Markets Fund | $13,680,724 | $14,762,239 | $28,442,963 | |||||||||
Delaware International Small Cap Fund | 17,326,224 | 2,954,574 | 20,280,798 | |||||||||
Delaware Global Value Fund and Delaware International Value Equity Fund had no capital loss carryforwards.
126
Table of Contents
6. Capital Shares
Transactions in capital shares were as follows:
| Delaware Emerging Markets Fund | Delaware Global Value Fund | |||||||||||||||||||
| Year ended | Year ended | |||||||||||||||||||
| 11/30/19 | 11/30/18 | 11/30/19 | 11/30/18 | |||||||||||||||||
Shares sold: | ||||||||||||||||||||
Class A | 4,628,100 | 8,112,239 | 50,183 | 187,765 | ||||||||||||||||
Class C | 1,327,923 | 3,234,819 | 5,576 | 10,459 | ||||||||||||||||
Class R | 561,625 | 963,388 | — | — | ||||||||||||||||
Institutional Class | 86,297,403 | 131,145,527 | 1,356,375 | 34,927 | ||||||||||||||||
Class R6 | 37,121,334 | 19,988,356 | — | — | ||||||||||||||||
Shares issued upon reinvestment of dividends and distributions: |
| |||||||||||||||||||
Class A | 64,817 | 343,651 | 50,607 | 11,389 | ||||||||||||||||
Class C | — | 105,622 | 4,331 | 1,661 | ||||||||||||||||
Class R | 670 | 40,799 | — | — | ||||||||||||||||
Institutional Class | 1,134,362 | 2,553,380 | 6,777 | 2,195 | ||||||||||||||||
Class R6 | 153,454 | 88,515 | — | — | ||||||||||||||||
|
|
|
|
|
|
|
| |||||||||||||
| 131,289,688 | 166,576,296 | 1,473,849 | 248,396 | |||||||||||||||||
|
|
|
|
|
|
|
| |||||||||||||
Shares redeemed: | ||||||||||||||||||||
Class A | (6,709,466 | ) | (11,368,630 | ) | (190,877 | ) | (223,319 | ) | ||||||||||||
Class C | (3,069,577 | ) | (4,121,589 | ) | (41,496 | ) | (215,299 | ) | ||||||||||||
Class R | (1,051,161 | ) | (1,285,419 | ) | — | — | ||||||||||||||
Institutional Class | (125,934,388 | ) | (88,452,696 | ) | (1,373,898 | ) | (83,530 | ) | ||||||||||||
Class R6 | (7,542,476 | ) | (4,856,387 | ) | — | — | ||||||||||||||
|
|
|
|
|
|
|
| |||||||||||||
| (144,307,068 | ) | (110,084,721 | ) | (1,606,271 | ) | (522,148 | ) | |||||||||||||
|
|
|
|
|
|
|
| |||||||||||||
Net increase (decrease) | (13,017,380 | ) | 56,491,575 | (132,422 | ) | (273,752 | ) | |||||||||||||
|
|
|
|
|
|
|
| |||||||||||||
127
Table of Contents
Notes to financial statements
Delaware International Funds
6. Capital Shares (continued)
| Delaware International Small Cap Fund | Delaware International Value Equity Fund | |||||||||||||||
| Year ended | Year ended | |||||||||||||||
| 11/30/19 | 11/30/18 | 11/30/19 | 11/30/18 | |||||||||||||
Shares sold: | ||||||||||||||||
Class A | 644,483 | 800,917 | 440,276 | 1,248,179 | ||||||||||||
Class C | 106,620 | 368,089 | 154,073 | 143,866 | ||||||||||||
Class R | 4,882 | 3,007 | 98,490 | 179,220 | ||||||||||||
Institutional Class | 15,090,204 | 14,005,419 | 5,265,741 | 5,129,280 | ||||||||||||
Class R6 | 219,742 | 390,636 | 141,767 | 130 | ||||||||||||
Shares issued upon reinvestment of dividends and distributions: |
| |||||||||||||||
Class A | — | 57,668 | 109,160 | 63,518 | ||||||||||||
Class C | — | 36,914 | 5,445 | 11,177 | ||||||||||||
Class R | — | 524 | 5,497 | 2,816 | ||||||||||||
Institutional Class | — | 67,883 | 413,816 | 247,859 | ||||||||||||
Class R6 | — | 11 | 3 | — | ||||||||||||
|
|
|
|
|
|
|
| |||||||||
| 16,065,931 | 15,731,068 | 6,634,268 | 7,026,045 | |||||||||||||
|
|
|
|
|
|
|
| |||||||||
Shares redeemed: | ||||||||||||||||
Class A | (623,100 | ) | (881,532 | ) | (1,021,161 | ) | (977,084 | ) | ||||||||
Class C | (345,224 | ) | (328,098 | ) | (227,238 | ) | (896,233 | ) | ||||||||
Class R | (3,914 | ) | (1,914 | ) | (126,800 | ) | (142,021 | ) | ||||||||
Institutional Class | (7,859,160 | ) | (7,136,954 | ) | (6,337,525 | ) | (3,539,542 | ) | ||||||||
Class R6 | (94,971 | ) | (8,117 | ) | (76 | ) | — | |||||||||
|
|
|
|
|
|
|
| |||||||||
| (8,926,369 | ) | (8,356,615 | ) | (7,712,800 | ) | (5,554,880 | ) | |||||||||
|
|
|
|
|
|
|
| |||||||||
Net increase (decrease) | 7,139,562 | 7,374,453 | (1,078,532 | ) | 1,471,165 | |||||||||||
|
|
|
|
|
|
|
| |||||||||
128
Table of Contents
Certain shareholders may exchange shares of one class for shares of another class in the same Fund. These exchange transactions are included as subscriptions and redemptions in the tables on the previous pages and on the “Statements of changes in net assets.” For the years ended Nov. 30, 2019 and 2018, each Fund had the following exchange transactions:
Year ended 11/30/19 | ||||||||||||||||||||||||||||||||
| Exchange Redemptions | Exchange Subscriptions | |||||||||||||||||||||||||||||||
Class A | Class C | Institutional | Class R6 | Class A | Institutional | Class R6 | Value | |||||||||||||||||||||||||
Delaware Emerging Markets Fund | 40,931 | 48,190 | 25,591,605 | 35,182 | 11,859 | 106,957 | 25,582,130 | $ | 488,428,095 | |||||||||||||||||||||||
Delaware Global Value Fund | 1,411 | 2,724 | — | — | 2,687 | 1,408 | — | 48,200 | ||||||||||||||||||||||||
Delaware International Small Cap Fund | — | 3,973 | — | — | 1,790 | 1,470 | — | 22,721 | ||||||||||||||||||||||||
Delaware International Value Equity Fund | 4,996 | 6,843 | — | — | 6,783 | 4,979 | — | 162,558 | ||||||||||||||||||||||||
Year ended 11/30/18 | ||||||||||||||||||||||||||||||||
| Exchange Redemptions | Exchange Subscriptions | |||||||||||||||||||||||||||||||
Class A | Class C | Institutional | Class R6 | Class A | Institutional | Class R6 | Value | |||||||||||||||||||||||||
Delaware Emerging Markets Fund | 354,242 | 108,891 | 1,653,340 | 16,474 | 94,004 | 375,462 | 1,653,339 | $ | 40,425,826 | |||||||||||||||||||||||
Delaware Global Value Fund | — | 34,222 | — | — | 31,917 | 1,556 | — | 430,683 | ||||||||||||||||||||||||
Delaware International Small Cap Fund | 114 | 6,349 | — | — | 5,365 | 109 | — | 44,286 | ||||||||||||||||||||||||
Delaware International Value Equity Fund | 645 | 75,112 | — | — | 71,625 | 2,859 | — | 1,113,027 | ||||||||||||||||||||||||
7. Line of Credit
Each Fund, along with certain other funds in the Delaware Funds (Participants), was a participant in a $220,000,000 revolving line of credit intended to be used for temporary or emergency purposes as an additional source of liquidity to fund redemptions of investor shares. Under the agreement, the Participants were charged an annual commitment fee of 0.15%, which was allocated across the Participants based on a weighted average of the respective net assets of each Participant. The Participants were permitted to borrow up to a maximum ofone-third of their net assets under the agreement. Each Participant was individually, and not jointly, liable for its particular advances, if any, under the line of credit. The line of credit available under the agreement expired on Nov. 4, 2019.
On Nov. 4, 2019, each Fund, along with the other Participants entered into an amendment to the agreement for a $250,000,000 revolving line of credit. The revolving line of credit is to be used as
129
Table of Contents
Notes to financial statements
Delaware International Funds
7. Line of Credit (continued)
described above and operates in substantially the same manner as the original agreement. The line of credit available under the agreement expires on Nov. 2, 2020.
The Funds had no amounts outstanding as of Nov. 30, 2019, or at any time during the year then ended.
8. Derivatives
US GAAP requires disclosures that enable investors to understand: (1) how and why an entity uses derivatives; (2) how they are accounted for; and (3) how they affect an entity’s results of operations and financial position.
Foreign Currency Exchange Contracts— Each Fund may enter into foreign currency exchange contracts and foreign cross currency exchange contracts as a way of managing foreign exchange rate risk. Each Fund may enter into these contracts to fix the US dollar value of a security that it has agreed to buy or sell for the period between the date the trade was entered into and the date the security is delivered and paid for. Each Fund may also use these contracts to hedge the US dollar value of securities it already owns that are denominated in foreign currencies. In addition, each Fund may enter into these contracts to facilitate or expedite the settlement of portfolio transactions. The change in value is recorded as an unrealized gain or loss. When the contract is closed, a realized gain or loss is recorded equal to the difference between the value of the contract at the time it was opened and the value at the time it was closed.
The use of foreign currency exchange contracts and foreign cross currency exchange contracts does not eliminate fluctuations in the underlying prices of the securities, but does establish a rate of exchange that can be achieved in the future. Although foreign currency exchange contracts and foreign cross currency exchange contracts limit the risk of loss due to an unfavorable change in the value of the hedged currency, they also limit any potential gain that might result should the value of the currency change favorably. In addition, each Fund could be exposed to risks if the counterparties to the contracts are unable to meet the terms of their contracts. Each Fund’s maximum risk of loss from counterparty credit risk is the value of its currency exchanged with the counterparty. The risk is generally mitigated by having a netting arrangement between each Fund and the counterparty and by the posting of collateral by the counterparty to the Fund to cover each Fund’s exposure to the counterparty.
During the year ended Nov. 30, 2019, Delaware Emerging Markets Fund and Delaware International Small Cap Fund entered into foreign currency exchange contracts and foreign cross currency exchange contracts to facilitate or expedite the settlement of portfolio transactions. Delaware Global Value Fund and Delaware International Value Equity Fund entered into foreign currency exchange contracts and foreign cross currency contracts in order to fix the US dollar value of a security between the trade date and settlement date and to facilitate or expedite the settlement of portfolio transactions.
During the year ended Nov. 30, 2019, the Funds experienced net realized and unrealized gains or losses attributable to foreign currency holdings, which are disclosed on the “Statements of assets and liabilities” and “Statements of operations.”
130
Table of Contents
Derivatives Generally.The table below summarizes the average balance of derivative holdings by each Fund during the year ended Nov. 30, 2019:
Long Derivatives Volume | ||||||||
| Delaware Emerging Markets Fund | Delaware Global Value Fund | Delaware International Small Cap Fund | Delaware International Value Equity Fund | |||||
| Foreign currency exchange contracts (average cost) | $521,542 | $118,977 | $486,768 | $2,064,362 | ||||
Short Derivatives Volume | ||||||||
| Delaware Emerging Markets Fund | Delaware Global Value Fund | Delaware International Small Cap Fund | Delaware International Value Equity Fund | |||||
| Foreign currency exchange contracts (average cost) | $1,276,889 | $99,659 | $393,015 | $1,942,662 | ||||
9. Offsetting
Each Fund entered into an International Swaps and Derivatives Association, Inc. Master Agreement (ISDA Master Agreement) or a similar agreement with certain of their derivative contract counterparties in order to better define their contractual rights and to secure rights that will help each Fund mitigate its counterparty risk. An ISDA Master Agreement is a bilateral agreement between each Fund and a counterparty that governsover-the-counter (OTC) derivatives and foreign exchange contracts and typically contains, among other things, collateral posting items and netting provisions in the event of a default and/or termination event. Under an ISDA Master Agreement, each Fund may, under certain circumstances, offset with the counterparty certain derivative financial instruments’ payables and/or receivables with collateral held and/or posted and create one single net payment. The provisions of the ISDA Master Agreement typically permit a single net payment in the event of default(close-out), including the bankruptcy or insolvency of the counterparty. However, bankruptcy or insolvency laws of a particular jurisdiction may impose restrictions on or prohibitions against the right of offset in bankruptcy, insolvency, or other events.
For financial reporting purposes, the Funds do not offset derivative assets and derivative liabilities that are subject to netting arrangements on the “Statements of assets and liabilities.”
131
Table of Contents
Notes to financial statements
Delaware International Funds
9. Offsetting (continued)
At Nov. 30, 2019, the Funds had the following assets and liabilities subject to offsetting provisions:
Offsetting of Financial Assets and Liabilities and Derivative Assets and Liabilities
| Delaware Emerging Markets Fund | |||||||||||||||
Counterparty | Gross Value of Derivative Asset | Gross Value of Derivative Liability | Net Position | ||||||||||||
BNY Mellon | $ | 90 | $ | (2,081 | ) | $ | (1,991 | ) | |||||||
|
|
|
|
|
| ||||||||||
Counterparty | Net Position | Fair Value of Non-Cash | Cash Collateral Received(a) | Fair Value of Non-Cash | Cash Collateral | Net Exposure(b) | ||||||||||||||||||||||||
BNY Mellon | $ | (1,991 | ) | $ | — | $ | — | $ | — | $ | — | $ | (1,991 | ) | ||||||||||||||||
|
|
|
|
|
|
|
|
|
|
|
| |||||||||||||||||||
| Delaware Global Value Fund | |||||||||||||||
Counterparty | Gross Value of | Gross Value of | Net Position | ||||||||||||
BNY Mellon | $ | — | $ | (10 | ) | $ | (10 | ) | |||||||
|
|
|
|
|
| ||||||||||
Counterparty | Net Position | Fair Value of Non-Cash | Cash Collateral Received(a) | Fair Value of Non-Cash | Cash Collateral | Net Exposure(b) | ||||||||||||||||||||||||
BNY Mellon | $ | (10 | ) | $ | — | $ | — | $ | — | $ | — | $ | (10 | ) | ||||||||||||||||
|
|
|
|
|
|
|
|
|
|
|
| |||||||||||||||||||
| Delaware International Small Cap Fund | |||||||||||||||
Counterparty | Gross Value of | Gross Value of | Net Position | ||||||||||||
BNY Mellon | $ | 4 | $ | (360 | ) | $ | (356 | ) | |||||||
|
|
|
|
|
| ||||||||||
Counterparty | Net Position | Fair Value of Non-Cash | Cash Collateral Received(a) | Fair Value of Non-Cash | Cash Collateral | Net Exposure(b) | ||||||||||||||||||||||||
BNY Mellon | $ | (356 | ) | $ | — | $ | — | $ | — | $ | — | $ | (356 | ) | ||||||||||||||||
|
|
|
|
|
|
|
|
|
|
|
| |||||||||||||||||||
| Delaware International Value Equity Fund | |||||||||||||||
Counterparty | Gross Value of | Gross Value of | Net Position | ||||||||||||
BNY Mellon | $ | — | $ | (51 | ) | $ | (51 | ) | |||||||
|
|
|
|
|
| ||||||||||
Counterparty | Net Position | Fair Value of Non-Cash | Cash Collateral Received(a) | Fair Value of Non-Cash | Cash Collateral | Net Exposure(b) | ||||||||||||||||||||||||
BNY Mellon | $ | (51 | ) | $ | — | $ | — | $ | — | $ | — | $ | (51 | ) | ||||||||||||||||
|
|
|
|
|
|
|
|
|
|
|
| |||||||||||||||||||
132
Table of Contents
Securities Lending
Securities lending transactions are entered into by the Funds under master securities lending agreements (each, an MSLA) which provide the right, in the event of default (including bankruptcy or insolvency), for thenon-defaulting party to liquidate the collateral and calculate a net exposure to the defaulting party or request additional collateral. In the event that a borrower defaults, the Funds, as lender, would offset the market value of the collateral received against the market value of the securities loaned. When the value of the collateral is greater than that of the market value of the securities loaned, the lender is left with a net amount payable to the defaulting party. However, bankruptcy or insolvency laws of a particular jurisdiction may impose restrictions on or prohibitions against such a right of offset in the event of an MSLA counterparty’s bankruptcy or insolvency. Under the MSLA, the borrower can resell orre-pledge the loaned securities, and the Funds can reinvest cash collateral, or, upon an event of default, resell orre-pledge the collateral (see also Note 10).
As of Nov. 30, 2019, the following tables are a summary of the Funds’ securities lending agreements by counterparty which are subject to offset under an MSLA:
| Delaware Global Value Fund | ||||||||||||||||||||
Counterparty | Securities | Cash Collateral Received - Invested in Securities | Fair Value of | Net | ||||||||||||||||
BNY Mellon | $ | 337,537 | $ | — | $ | (337,537 | ) | $ | — | |||||||||||
| Delaware International Value Equity Fund | ||||||||||||||||||||
Counterparty | Securities at Value | Cash Collateral | Fair Value of | Net | ||||||||||||||||
BNY Mellon | $ | 272,151 | $ | (272,151 | ) | $ | — | $ | — | |||||||||||
(a)The value of the related collateral exceeded the value of the net position and securities lending transactions as of Nov. 30, 2019.
(b)Net exposure represents the receivable (payable) that would be due from (to) the counterparty in the event of default.
10. Securities Lending
Each Fund, along with other funds in the Delaware Funds, may lend its securities pursuant to a security lending agreement (Lending Agreement) with The Bank of New York Mellon (BNY Mellon). At the time a security is loaned, the borrower must post collateral equal to the required percentage of the market value of the loaned security, including any accrued interest. The required percentage is: (1) 102% with respect to US securities and foreign securities that are denominated and payable in US dollars; and (2) 105% with respect to foreign securities. With respect to each loan, if on any business day, the aggregate market value of securities collateral plus cash collateral held is less than the aggregate market value of the securities which are the subject of such loan, the borrower will be notified to provide additional collateral by the end of the following business day, which, together with the collateral already held, will be not less than the applicable initial collateral requirements for such security loan. If the aggregate market value of securities collateral and cash collateral held with respect to a security loan exceeds the
133
Table of Contents
Notes to financial statements
Delaware International Funds
10. Securities Lending (continued)
applicable initial collateral requirement, upon the request of the borrower, BNY Mellon must return enough collateral to the borrower by the end of the following business day to reduce the value of the remaining collateral to the applicable initial collateral requirement for such security loan. As a result of the foregoing, the value of the collateral held with respect to a loaned security on any particular day, may be more or less than the value of the security on loan. The collateral percentage with respect to the market value of the loaned security is determined by the security lending agent.
Cash collateral received by each fund of the Trust is generally invested in a series of individual separate accounts, each corresponding to a fund. The investment guidelines permit each separate account to hold certain securities that would be considered eligible securities for a money market fund. Cash collateral received is generally invested in government securities; certain obligations issued by government sponsored enterprises; repurchase agreements collateralized by US Treasury securities; obligations issued by the central government of any Organization for Economic Cooperation and Development (OECD) country or its agencies, instrumentalities, or establishments; obligations of supranational organizations; commercial paper, notes, bonds and other debt obligations; certificates of deposit, time deposits, and other bank obligations; and asset-backed securities as disclosed on the “Schedules of investments.” Securities purchased with cash collateral are valued at the market value. Each Fund can also accept US government securities and letters of credit(non-cash collateral) in connection with securities loans.
In the event of default or bankruptcy by the lending agent, realization and/or retention of the collateral may be subject to legal proceedings. In the event the borrower fails to return loaned securities and the collateral received is insufficient to cover the value of the loaned securities and provided such collateral shortfall is not the result of investment losses, the lending agent has agreed to pay the amount of the shortfall to each Fund or, at the discretion of the lending agent, replace the loaned securities. Each Fund continues to record dividends or interest, as applicable, on the securities loaned and are subject to changes in value of the securities loaned that may occur during the term of the loan. Each Fund has the right under the Lending Agreement to recover the securities from the borrower on demand. With respect to security loans collateralized bynon-cash collateral, each Fund receives loan premiums paid by the borrower. With respect to security loans collateralized by cash collateral, the earnings from the collateral investments are shared among each Fund, the security lending agent, and the borrower. Each Fund records security lending income net of allocations to the security lending agent and the borrower.
Each Fund may incur investment losses as a result of investing securities lending collateral. This could occur if an investment in the collateral investment account defaulted or became impaired. Under those circumstances, the value of each Fund’s cash collateral account may be less than the amount each Fund would be required to return to the borrowers of the securities and each Fund would be required to make up for this shortfall.
134
Table of Contents
The following table reflects a breakdown of transactions in security lending collateral accounted for as secured borrowings, the gross obligation by the type of collateral pledged, and the remaining contractual maturity of those transactions as of Nov. 30, 2019:
| Remaining Contractual Maturity of the Agreements as of Nov. 30, 2019 | |||||||||||||||||||||||||
Securities Lending Transactions | Overnight and Continuous | Under | Between 30 & 90 days | Over | Total | ||||||||||||||||||||
Delaware International Value Equity Fund | |||||||||||||||||||||||||
Repurchase Agreements | $ | 281,607 | $ | — | $ | — | $ | — | $ | 281,607 | |||||||||||||||
At Nov. 30, 2019, the values of securities on loan and the values of invested collateral for each Fund are presented below, for which cash collateral was received and invested in accordance with the MSLA. These investments are presented on the “Schedules of investments” under the caption “Securities Lending Collateral.”
| Delaware Global Value Fund | Delaware International Value Equity Fund | |||||||||
Values of securities on loan | $ | 337,537 | $ | 272,151 | ||||||
Values ofnon-cash collateral | 347,270 | — | ||||||||
Values of invested collateral | — | 281,607 | ||||||||
During the year ended Nov. 30, 2019, Delaware Emerging Markets Fund and Delaware International Small Cap Fund had no securities out on loan.
11. Credit and Market Risk
Delaware Emerging Markets Fund invests a significant portion of its assets in the greater China region, which consists of Hong Kong, the People’s Republic of China, and Taiwan, among other countries. As a result, the Fund’s investments in the region are particularly susceptible to risks in that region. Adverse events in any one country within the region may impact the other countries in the region or Asia as a whole. As a result, adverse events in the region will generally have a greater effect on the Fund than if the Fund were more geographically diversified, which could result in greater volatility in the Fund’s net asset value and losses. Markets in the greater China region can experience significant volatility due to social, economic, regulatory, and political uncertainties.
Some countries in which the Funds may invest require governmental approval for the repatriation of investment income, capital, or the proceeds of sales of securities by foreign investors. In addition, if there is deterioration in a country’s balance of payments or for other reasons, a country may impose temporary restrictions on foreign capital remittances abroad.
The securities exchanges of certain foreign markets are substantially smaller, less liquid, and more volatile than the major securities markets in the United States. Consequently, acquisition and disposition of securities by each Fund may be inhibited. In addition, a significant portion of the aggregate market
135
Table of Contents
Notes to financial statements
Delaware International Funds
11. Credit and Market Risk (continued)
value of equity securities listed on the major securities exchanges in emerging markets is held by a smaller number of investors. This may limit the number of shares available for acquisition or disposition by each Fund.
Each Fund may invest up to 15% of its net assets in illiquid securities, which may include securities with contractual restrictions on resale, securities exempt from registration under Rule 144A promulgated under the Securities Act of 1933, as amended, and other securities which may not be readily marketable. The relative illiquidity of these securities may impair each Fund from disposing of them in a timely manner and at a fair price when it is necessary or desirable to do so. While maintaining oversight, each Board has delegated to DMC theday-to-day functions of determining whether individual securities are liquid for purposes of each Fund’s limitation on investments in illiquid securities. Securities eligible for resale pursuant to Rule 144A, which are determined to be liquid, are not subject to each Fund’s 15% limit on investments in illiquid securities. Rule 144A securities have been identified on the “Schedules of investments.” Restricted securities are valued pursuant to the security valuation procedures described in Note 1.
12. Contractual Obligations
Each Fund enters into contracts in the normal course of business that contain a variety of indemnifications. Each Fund’s maximum exposure under these arrangements is unknown. However, each Fund has not had prior claims or losses pursuant to these contracts. Management has reviewed the Funds’ existing contracts and expects the risk of loss to be remote.
13. Recent Accounting Pronouncements
In August 2018, the FASB issued an Accounting Standards Update (ASU), ASU2018-13, which changes certain fair value measurement disclosure requirements. The ASU2018-13, in addition to other modifications and additions, removes the requirement to disclose the amount and reasons for transfers between Level 1 and Level 2 of the fair value hierarchy, the policy for the timing of transfers between levels and the valuation process for Level 3 fair value measurements. The ASU2018-13 is effective for fiscal years, and interim periods within those fiscal years, beginning after Dec. 15, 2019. At this time, management is evaluating the implications of these changes on the financial statements.
14. Subsequent Events
Management has determined that no material events or transactions occurred subsequent to Nov. 30, 2019, that would require recognition or disclosure in the Funds’ financial statements.
136
Table of Contents
registered public accounting firm
To the Board of Trustees of Delaware Group® Global & International Funds and Shareholders of Delaware Emerging Markets Fund, Delaware Global Value Fund, Delaware International Small Cap Fund and Delaware International Value Equity Fund
Opinions on the Financial Statements
We have audited the accompanying statements of assets and liabilities, including the schedules of investments, of Delaware Emerging Markets Fund, Delaware Global Value Fund, Delaware International Small Cap Fund and Delaware International Value Equity Fund (constituting Delaware Group® Global & International Funds, hereafter collectively referred to as the “Funds”) as of November 30, 2019, the related statements of operations for the year ended November 30, 2019, the statements of changes in net assets for each of the two years in the period ended November 30, 2019, including the related notes, and the financial highlights for each of the periods indicated therein (collectively referred to as the “financial statements”). In our opinion, the financial statements present fairly, in all material respects, the financial position of the Funds as of November 30, 2019, the results of each of their operations for the year then ended, the changes in each of their net assets for each of the two years in the period ended November 30, 2019 and each of the financial highlights for each of the periods indicated therein in conformity with accounting principles generally accepted in the United States of America.
Basis for Opinions
These financial statements are the responsibility of the Funds’ management. Our responsibility is to express an opinion on the Funds’ financial statements based on our audits. We are a public accounting firm registered with the Public Company Accounting Oversight Board (United States) (PCAOB) and are required to be independent with respect to the Funds in accordance with the U.S. federal securities laws and the applicable rules and regulations of the Securities and Exchange Commission and the PCAOB.
We conducted our audits of these financial statements in accordance with the standards of the PCAOB. Those standards require that we plan and perform the audit to obtain reasonable assurance about whether the financial statements are free of material misstatement, whether due to error or fraud.
Our audits included performing procedures to assess the risks of material misstatement of the financial statements, whether due to error or fraud, and performing procedures that respond to those risks. Such procedures included examining, on a test basis, evidence regarding the amounts and disclosures in the financial statements. Our audits also included evaluating the accounting principles used and significant estimates made by management, as well as evaluating the overall presentation of the financial statements. Our procedures included confirmation of securities owned as of November 30, 2019 by correspondence with the custodian, transfer agents and brokers. We believe that our audits provide a reasonable basis for our opinions.
/s/PricewaterhouseCoopers LLP
Philadelphia, Pennsylvania
January 22, 2020
We have served as the auditor of one or more investment companies in Delaware Funds® by Macquarie since 2010.
137
Table of Contents
Other Fund information (Unaudited)
Delaware International Funds
Tax Information
The information set forth below is for each Fund’s fiscal year as required by federal income tax laws. Shareholders, however, must report distributions on a calendar year basis for income tax purposes, which may include distributions for portions of two fiscal years of a fund. Accordingly, the information needed by shareholders for income tax purposes will be sent to them in January of each year. Please consult your tax advisor for proper treatment of this information.
All disclosures are based on financial information available as of the date of this annual report and, accordingly are subject to change. For any and all items requiring reporting, it is the intention of each Fund to report the maximum amount permitted under the Internal Revenue Code and the regulations thereunder.
For the fiscal year ended Nov. 30, 2019, each Fund reports distributions paid during the year as follows:
(A) Ordinary | (B) Long-Term Capital Gain | Total | (C) Qualifying | |||||||||||||||||
Delaware Emerging Markets Fund | 100.00 | % | — | 100.00 | % | 5.07 | % | |||||||||||||
Delaware Global Value Fund | 30.22 | % | 69.78 | % | 100.00 | % | 60.43 | % | ||||||||||||
Delaware International Small Cap Fund | — | — | — | — | ||||||||||||||||
| Delaware International Value Equity Fund | 100.00 | % | — | 100.00 | % | — | ||||||||||||||
(A) and (B) are based on a percentage of each Fund’s total distributions.
1Qualifying dividends represent dividends which qualify for the corporate dividends received deduction.
*For the fiscal year ended Nov. 30, 2019, certain dividends paid by each Fund may be subject to a maximum tax rate of 20%. The percentage of dividends paid by each Fund from ordinary income reported as dividend income is listed below. Complete information will be computed and reported in conjunction with your 2019 Form1099-DIV.
| Delaware Emerging Markets Fund | Delaware Global Value Fund | Delaware International Value Equity Fund | ||
| 100.00% | 100.00% | 100.00% |
There were no dividends paid by Delaware International Small Cap Fund.
138
Table of Contents
Each Fund intends to pass through foreign tax credits in the maximum amount as follows:
Delaware Emerging Markets Fund | Delaware Global Value Fund | Delaware International Small Cap Fund | Delaware International Value Equity Fund | |||
| $11,131,586 | $15,330 | $118,842 | $546,544 |
The gross foreign source income earned during the fiscal year 2019 by each Fund was as follows:
Delaware Emerging Markets Fund | Delaware Global Value Fund | Delaware International | Delaware International Value Equity Fund | |||
| $134,736,282 | $315,326 | $1,607,533 | $8,760,631 |
For the fiscal year ended Nov. 30, 2019, certain interest income paid by Delaware Global Value Fund have been determined to be Qualified Short-Term Capital Gains may be subject to relief from US withholding for foreign shareholders, as provided by the American Jobs Creation Act of 2004, and by the Tax Relief, Unemployment Insurance Reauthorization and Job Creations Act of 2010, and as extended by the American Taxpayer Relief Act of 2012. For the fiscal year ended Nov. 30, 2019, the Fund has reported maximum Qualified Short-Term Gains of $221,784.
Board consideration of advisory agreements for Delaware Emerging Markets Fund, Delaware Global Value Fund, Delaware International Small Cap Fund, and Delaware International Value Equity Fund at a meeting held August21-22, 2019
At a meeting held on Aug.21-22, 2019 (the “Annual Meeting”), the Board of Trustees (the “Board”), including a majority of disinterested or independent Trustees, approved the renewal of the Investment Advisory andSub-Advisory Agreements for each of Delaware Emerging Markets Fund, Delaware Global Value Fund, Delaware International Small Cap Fund, and Delaware International Value Equity Fund (each, a “Fund” and together, the “Funds”). In making its decision, the Board considered information furnished at regular quarterly Board meetings, including reports detailing Fund performance, investment strategies, and expenses, as well as information prepared specifically in connection with the renewal of the investment advisory andsub-advisory contracts. Information furnished specifically in connection with the renewal of the Investment Management Agreement with Delaware Management Company (“DMC”), a series of Macquarie Investment Management Business Trust (“MIMBT”), and theSub-Advisory Agreements with Macquarie Investment Management Global Limited (“MIMGL”) and Macquarie Funds Management Hong Kong Limited (“MFMHK”) included materials provided by DMC and its affiliates (collectively, “Macquarie Investment Management”), MIMGL, and MFMHK concerning, among other things, the nature, extent, and quality of services provided to the Funds; the costs of such services to the Funds; economies of scale; and the investment manager’s financial condition and profitability. In addition, in connection with the Annual Meeting, materials were provided to the Trustees in May 2019, including reports provided by Broadridge Financial Solutions (“Broadridge”). The Broadridge reports compared each Fund’s investment performance and expenses with those of other comparable mutual funds. The Independent Trustees reviewed and discussed the Broadridge reports with independent legal counsel to the Independent Trustees. In addition to the information noted above, the Board also requested and received information regarding DMC’s policy with respect to advisory fee levels and its breakpoint philosophy; the structure of portfolio manager compensation; comparative client fee
139
Table of Contents
Other Fund information (Unaudited)
Delaware International Funds
Board consideration of advisory agreements for Delaware Emerging Markets Fund, Delaware Global Value Fund, Delaware International Small Cap Fund, and Delaware International Value Equity Fund at a meeting held August 21-22, 2019 (continued)
information; and any constraints or limitations on the availability of securities for certain investment styles, which had in the past year inhibited, or which were likely in the future to inhibit, the investment manager’s ability to invest fully in accordance with Fund policies.
In considering information relating to the approval of each Fund’s investment advisory andsub-advisory agreements, the Independent Trustees received assistance and advice from and met separately with independent legal counsel to the Independent Trustees and also received assistance and advice from an experienced and knowledgeable independent fund consultant, JDL Consultants, LLC (“JDL”). Although the Board gave attention to all information furnished, the following discussion identifies, under separate headings, the primary factors taken into account by the Board during its contract renewal considerations.
Nature, extent, and quality of services.The Board considered the services provided by DMC to the Funds and their shareholders. In reviewing the nature, extent, and quality of services, the Board considered reports furnished to it throughout the year, which covered matters such as the relative performance of the Funds; compliance of portfolio managers with the investment policies, strategies, and restrictions for the Funds; compliance by DMC and Delaware Distributors, L.P. (together, “Management”) personnel with the Code of Ethics adopted throughout the Delaware Funds® by Macquarie (“Delaware Funds”); and adherence to fair value pricing procedures as established by the Board. The Board was pleased with the current staffing of DMC and the emphasis placed on research in the investment process. The Board recognized DMC’s receipt of certain favorable industry distinctions during the past several years. The Board gave favorable consideration to DMC’s efforts to control expenses while maintaining service levels committed to Fund matters. The Board also noted the benefits provided to Fund shareholders through (a) each shareholder’s ability to: (i) exchange an investment in one Delaware Fund for the same class of shares in another Delaware Fund without a sales charge, or (ii) reinvest Fund dividends into additional shares of the Fund or into additional shares of other Delaware Funds, and (b) the privilege to combine holdings in other Delaware Funds to obtain a reduced sales charge. The Board was satisfied with the nature, extent, and quality of the overall services provided by DMC.
Nature, extent, and quality of services.The Board considered the services provided by MIMGL to the Funds and their shareholders. In reviewing the nature, extent, and quality of services, the Board considered reports furnished to it throughout the year at regular Board Meetings covering matters such as relative performance of the Funds; compliance of portfolio managers with the investment policies, strategies, and restrictions for the Funds; the compliance of MIMGL personnel with its Code of Ethics and adherence to fair value pricing procedures as established by the Board. The Board was pleased with the current staffing of MIMGL and the emphasis placed on research in the investment process. The Board was satisfied with the nature, extent, and quality of the overall services provided by MIMGL.
Nature, extent, and quality of services.The Board considered the services provided by MFMHK to the Funds and their shareholders. In reviewing the nature, extent, and quality of services, the Board considered reports furnished to it throughout the year at regular Board Meetings covering matters such
140
Table of Contents
as relative performance of the Funds; compliance of portfolio managers with the investment policies, strategies, and restrictions for the Funds; the compliance of MFMHK personnel with its Code of Ethics; and adherence to fair value pricing procedures as established by the Board. The Board was pleased with the current staffing of MFMHK and the emphasis placed on research in the investment process. The Board was satisfied with the nature, extent, and quality of the overall services provided by MFMHK.
Investment performance.The Board placed significant emphasis on the investment performance of the Funds in view of the importance of investment performance to shareholders. Although the Board considered performance reports and discussions with portfolio managers at Investment Committee meetings throughout the year, the Board gave particular weight to the Broadridge reports furnished for the Annual Meeting. The Broadridge reports prepared for each Fund showed the investment performance of its Class A shares in comparison to a group of similar funds as selected by Broadridge (the “Performance Universe”). A fund with the best performance ranked first, and a fund with the poorest performance ranked last. The highest/best performing 25% of funds in the Performance Universe make up the first quartile; the next 25%, the second quartile; the next 25%, the third quartile; and the poorest/worst performing 25% of funds in the Performance Universe make up the fourth quartile. Comparative annualized performance for each Fund was shown for the past1-,3-,5-, and10-year periods, to the extent applicable, ended Jan. 31, 2019. The Board’s objective is that each Fund’s performance for the1-,3-, and5-year periods be at or above the median of its Performance Universe.
Delaware Emerging Markets Fund – The Performance Universe for the Fund consisted of the Fund and all retail and institutional emerging markets funds as selected by Broadridge. The Broadridge report comparison showed that the Fund’s total return for the1-year period was in the second quartile of its Performance Universe. The report further showed that the Fund’s total return for the3-,5-, and10-year periods was in the first quartile of its Performance Universe. The Board was very satisfied with performance.
Delaware Global Value Fund – The Performance Universe for the Fund consisted of the Fund and all retail and institutional globalmulti-cap value funds as selected by Broadridge. The Broadridge report comparison showed that the Fund’s total return for the1-,3-, and5-year periods was in the fourth quartile of its Performance Universe. The report further showed that the Fund’s total return for the10-year period was in the third quartile of its Performance Universe. The Board observed that the Fund’s performance results were not in line with the Board’s objective. In evaluating the Fund’s performance, the Board considered the performance attribution included in the meeting materials, as well as the numerous investment and performance reports delivered by Management personnel to the Board’s Investments Committee. The Board was satisfied that Management was taking action to improve Fund performance and to meet the Board’s performance objective.
Delaware International Small Cap Fund – The Performance Universe for the Fund consisted of the Fund and all retail and institutional internationalsmall-/mid-cap growth funds as selected by Broadridge. The Broadridge report comparison showed that the Fund’s total return for the1-year period was in the fourth quartile of its Performance Universe. The report further showed that the Fund’s total return for the3- and5-year periods was in the second quartile of its Performance Universe and the Fund’s total return for the10-year period was in the first quartile of its Performance Universe. The Board was satisfied with the Fund’s intermediate- and long-term performance.
141
Table of Contents
Other Fund information (Unaudited)
Delaware International Funds
Board consideration of advisory agreements for Delaware Emerging Markets Fund, Delaware Global Value Fund, Delaware International Small Cap Fund, and Delaware International Value Equity Fund at a meeting held August 21-22, 2019 (continued)
Delaware International Value Equity Fund – The Performance Universe for the Fund consisted of the Fund and all retail and institutional internationalmulti-cap value funds as selected by Broadridge. The Broadridge report comparison showed that the Fund’s total return for the1-,3-,5-, and10-year periods was in the second quartile of its Performance Universe. The Board was satisfied with performance.
Comparative expenses.The Board considered expense data for the Delaware Funds. Management provided the Board with information on pricing levels and fee structures for each Fund as of its most recently completed fiscal year. The Board also focused on the comparative analysis of effective management fees and total expense ratios of each Fund versus effective management fees and total expense ratios of a group of similar funds as selected by Broadridge (the “Expense Group”). In reviewing comparative costs, each Fund’s contractual management fee and the actual management fee incurred by the Fund were compared with the contractual management fees (assuming all funds in the Expense Group were similar in size to the Fund) and actual management fees (as reported by each fund) within the Expense Group, taking into account any applicable breakpoints and fee waivers. Each Fund’s total expenses were also compared with those of its Expense Group. The Broadridge total expenses, for comparative consistency, were shown by Broadridge for Class A shares and comparative total expenses including12b-1 andnon-12b-1 service fees. The Board’s objective is for each Fund’s total expense ratio to be competitive with those of the peer funds within its Expense Group.
Delaware Emerging Markets Fund – The expense comparisons for the Fund showed that its actual management fee and total expenses were in the quartile with the highest expenses of its Expense Group. The Board noted that the Fund’s management fee and total expenses were not in line with the Board’s objective. In evaluating total expenses, the Board considered fee waivers in place through March 2020 and various initiatives implemented by Management, such as the negotiation of lower fees for fund accounting, fund accounting oversight, and custody services, which had created an opportunity for a further reduction in expenses. The Board was satisfied with Management’s efforts to improve the Fund’s total expense ratio and to bring it in line with the Board’s objective.
Delaware Global Value Fund – The expense comparisons for the Fund showed that its actual management fee was in the quartile with the second lowest expenses of its Expense Group and its total expenses were in the quartile with the highest expenses of its Expense Group. The Board gave favorable consideration to the Fund’s management fee, but noted that the Fund’s total expenses were not in line with the Board’s objective. In evaluating total expenses, the Board considered fee waivers in place through March 2020 and various initiatives implemented by Management, such as the negotiation of lower fees for fund accounting, fund accounting oversight, and custody services, which had created an opportunity for a further reduction in expenses. The Board was satisfied with Management’s efforts to improve the Fund’s total expense ratio and to bring it in line with the Board’s objective.
Delaware International Small Cap Fund – The expense comparisons for the Fund showed that its actual management fee was in the quartile with the lowest expenses of its Expense Group and its total expenses were in the quartile with the second lowest expenses of its Expense Group. The Board was
142
Table of Contents
satisfied with the management fee and total expenses of the Fund in comparison to those of its Expense Group as shown in the Broadridge report.
Delaware International Value Equity Fund – The expense comparisons for the Fund showed that its actual management fee and total expenses were in the quartile with the second highest expenses of its Expense Group. The Board noted that the Fund’s management fee and total expenses were not in line with the Board’s objective. In evaluating total expenses, the Board considered fee waivers in place through March 2020 and various initiatives implemented by Management, such as the negotiation of lower fees for fund accounting, fund accounting oversight, and custody services, which had created an opportunity for a further reduction in expenses. The Board was satisfied with Management’s efforts to improve the Fund’s total expense ratio and to bring it in line with the Board’s objective.
Management profitability.The Board considered the level of profits realized by DMC in connection with the operation of the Funds. In this respect, the Board reviewed the Investment Management Profitability Analysis that addressed the overall profitability of DMC’s business in providing management and other services to each of the individual funds and the Delaware Funds as a whole. Specific attention was given to the methodology used by DMC in allocating costs for the purpose of determining profitability. Management stated that the level of profits of DMC, to a certain extent, reflects recent operational cost savings and efficiencies initiated by DMC. The Board considered DMC’s efforts to improve services provided to Fund shareholders and to meet additional regulatory and compliance requirements resulting from recent industry-wide Securities and Exchange Commission initiatives. The Board also considered the extent to which DMC might derive ancillary benefits from fund operations, including the potential for procuring additional business as a result of the prestige and visibility associated with its role as service provider to the Delaware Funds and the benefits from allocation of fund brokerage to improve trading efficiencies. As part of its work, the Board also reviewed a report prepared by JDL regarding MIMBT profitability as compared to certain peer fund complexes and the Independent Trustees discussed with JDL personnel regarding DMC’s profitability in such context. The Board found that the management fees were reasonable in light of the services rendered and the level of profitability of DMC.
Management profitability.Trustees were also given available information on profits being realized by MIMGL in relation to the services being provided to the Fund and in relation to MIMGL’s overall investment advisory business, but believed such information to be of limited relevance because thesub-advisory fees are paid by DMC out of its management fee, and changes in the level ofsub-advisory fees have no impact on Fund expenses. The Board was also provided information on potentialfall-out benefits derived or to be derived by MIMGL in connection with its relationship to the Fund, such as reputational enhancement, soft dollar arrangements, or commissions paid to affiliated broker/dealers, as applicable.
Management profitability.Trustees were also given available information on profits being realized by MFMHK in relation to the services being provided to the Fund and in relation to MFMHK’s overall investment advisory business, but believed such information to be of limited relevance because thesub-advisory fees are paid by DMC out of its management fee, and changes in the level ofsub-advisory fees have no impact on Fund expenses. The Board was also provided information on potentialfall-out
143
Table of Contents
Other Fund information (Unaudited)
Delaware International Funds
Board consideration of advisory agreements for Delaware Emerging Markets Fund, Delaware Global Value Fund, Delaware International Small Cap Fund, and Delaware International Value Equity Fund at a meeting held August 21-22, 2019 (continued)
benefits derived or to be derived by MFMHK in connection with its relationship to the Fund, such as reputational enhancement, soft dollar arrangements, or commissions paid to affiliated broker/dealers, as applicable.
Economies of scale.The Trustees considered whether economies of scale are realized by DMC as the Fund’s assets increase and the extent to which any economies of scale are reflected in the level of management fees charged. The Trustees reviewed the Fund’s advisory fee pricing and structure, approved by the Board and shareholders, which includes breakpoints, and which applies to most funds in the Delaware Funds complex. Breakpoints in the advisory fee occur when the advisory fee rate is reduced on assets in excess of specified levels. Breakpoints result in a lower advisory fee than would otherwise be the case in the absence of breakpoints, when the asset levels specified in the breakpoints are exceeded. The Board noted that, as of March 31, 2019, the Delaware Emerging Markets Fund’s assets exceeded the final breakpoint level. The Board believed that, given the extent to which economies of scale might be realized by DMC and its affiliates, the schedule of fees under the Investment Management Agreement provides a sharing of benefits with the Fund and its shareholders. The Board also noted that, although, as of March 31, 2019, each of the Delaware Global Value Fund, Delaware International Small Cap Fund, and Delaware International Value Equity Fund had not reached a size at which it could take advantage of any breakpoints in the applicable fee schedule, the Board recognized that the fee was structured so that, if the Fund increases sufficiently in size, then economies of scale may be shared.
144
Table of Contents
This page intentionally left blank.
Table of Contents
Board of trustees / directors and officers addendum
Delaware Funds®by Macquarie
A mutual fund is governed by a Board of Trustees/Directors (“Trustees”), which has oversight responsibility for the management of a fund’s business affairs. Trustees establish procedures and oversee and review the performance of the investment manager, the distributor, and others who perform services for the fund. The independent fund trustees, in particular, are advocates
Name, Address, and Birth Date | Position(s) Held with Fund(s) | Length of Time Served | ||
Interested Trustee
| ||||
| Shawn K. Lytle1 | President, | President and | ||
| 2005 Market Street | Chief Executive Officer, | Chief Executive Officer | ||
| Philadelphia, PA 19103 | and Trustee | since August 2015 | ||
| February 1970 | ||||
| Trustee since | ||||
| September 2015 | ||||
Independent Trustees
| ||||
| Thomas L. Bennett | Chair and Trustee | Trustee since | ||
| 2005 Market Street | March 2005 | |||
| Philadelphia, PA 19103 | ||||
| October 1947 | Chair since | |||
| March 2015 | ||||
| Jerome D. Abernathy | Trustee | Since January 2019 | ||
| 2005 Market Street | ||||
| Philadelphia, PA 19103 | ||||
| July 1959 | ||||
| Ann D. Borowiec | Trustee | Since March 2015 | ||
| 2005 Market Street | ||||
| Philadelphia, PA 19103 | ||||
| November 1958 | ||||
| 1 | Shawn K. Lytle is considered to be an “Interested Trustee” because he is an executive officer of the Fund’s(s’) investment advisor. |
146
Table of Contents
for shareholder interests. Each trustee has served in that capacity since he or she was elected to or appointed to the Board of Trustees, and will continue to serve until his or her retirement or the election of a new trustee in his or her place. The following is a list of the Trustees and Officers with certain background and related information.
Principal Occupation(s) During the Past Five Years | Number of Portfolios in Fund Complex Overseen by Trustee or Officer | Other Directorships Held by Trustee or Officer | ||
| ||||
| President — Macquarie | 95 | Trustee — UBS | ||
| Investment Management2 | Relationship Funds, | |||
| (June 2015–Present) | SMA Relationship | |||
| Trust, and UBS Funds | ||||
| Regional Head of | (May 2010–April 2015) | |||
| Americas — UBS Global | ||||
| Asset Management | ||||
| (April 2010–May 2015) | ||||
| ||||
| Private Investor | 95 | None | ||
| (March 2004–Present) | ||||
| Managing Member, | 95 | None | ||
| Stonebrook Capital | ||||
| Management, LLC (financial | ||||
| technology: macro factors | ||||
| and databases) | ||||
(January 1993–Present)
| ||||
Chief Executive Officer, |
95 |
Director — | ||
| Private Wealth Management | Banco Santander International | |||
| (2011–2013) and | (October 2016– | |||
| Market Manager, | December 2019) | |||
| New Jersey Private | ||||
| Bank (2005–2011) — | Director — | |||
| J.P. Morgan Chase & Co. | Santander Bank, N.A. | |||
| (December 2016– | ||||
December 2019)
|
| 2 | Macquarie Investment Management is the marketing name for Macquarie Management Holdings, Inc. and its subsidiaries, including the Fund’s(s’) investment advisor, principal underwriter, and its transfer agent. |
147
Table of Contents
Board of trustees / directors and officers addendum
Delaware Funds®by Macquarie
Name, Address, and Birth Date | Position(s) Held with Fund(s) | Length of Time Served | ||
Independent Trustees (continued)
| ||||
| Joseph W. Chow | Trustee | Since January 2013 | ||
| 2005 Market Street | ||||
| Philadelphia, PA 19103 | ||||
| January 1953 | ||||
| John A. Fry | Trustee | Since January 2001 | ||
| 2005 Market Street | ||||
| Philadelphia, PA 19103 | ||||
May 1960 | ||||
| Lucinda S. Landreth | Trustee | Since March 2005 | ||
| 2005 Market Street | ||||
| Philadelphia, PA 19103 | ||||
June 1947
| ||||
148
Table of Contents
Principal Occupation(s) During the Past Five Years | Number of Portfolios in Fund Complex Overseen by Trustee or Officer | Other Directorships Held by Trustee or Officer | ||
| ||||
| Private Investor | 95 | Director and Audit Committee | ||
| (April 2011–Present) | Member — Hercules | |||
| Technology Growth | ||||
| Capital, Inc. | ||||
(July 2004–July 2014)
| ||||
| President — | 95 | Director; Compensation | ||
| Drexel University | Committee and | |||
| (August 2010–Present) | Governance Committee | |||
| Member — Community | ||||
| President — | Health Systems | |||
| Franklin & Marshall College | (May 2004–Present) | |||
| (July 2002–June 2010) | ||||
| Director — Drexel | ||||
| Morgan & Co. | ||||
| (2015–Present) | ||||
| Director and Audit Committee | ||||
| Member — vTv | ||||
| Therapeutics Inc. | ||||
| (2017–Present) | ||||
| Director and Audit Committee | ||||
| Member — FS Credit Real | ||||
| Estate Income Trust, Inc. | ||||
| (2018–Present) | ||||
| Director — Federal Reserve | ||||
| Bank of Philadelphia | ||||
(January 2020–Present)
| ||||
| Private Investor | 95 | None | ||
| (2004–Present) | ||||
|
149
Table of Contents
Board of trustees / directors and officers addendum
Delaware Funds®by Macquarie
Name, Address, and Birth Date | Position(s) Held with Fund(s) | Length of Time Served | ||
Independent Trustees (continued)
| ||||
| Frances A. Sevilla-Sacasa | Trustee | Since September 2011 | ||
| 2005 Market Street | ||||
| Philadelphia, PA 19103 | ||||
| January 1956 | ||||
| Thomas K. Whitford | Trustee | Since January 2013 | ||
| 2005 Market Street | ||||
| Philadelphia, PA 19103 | ||||
| March 1956 | ||||
150
Table of Contents
Principal Occupation(s) During the Past Five Years | Number of Portfolios in Fund Complex Overseen by Trustee or Officer | Other Directorships Held by Trustee or Officer | ||
| ||||
| Private Investor | 95 | Trust Manager and | ||
| (January 2017–Present) | Audit Committee | |||
| Chair — Camden | ||||
| Chief Executive Officer — | Property Trust | |||
| Banco Itaú | (August 2011–Present) | |||
| International | ||||
| (April 2012–December 2016) | Director; Strategic | |||
| Planning and Reserves | ||||
| Executive Advisor to Dean | Committee and Nominating | |||
| (August 2011–March 2012) | and Governance | |||
| and Interim Dean | Committee Member — | |||
| (January 2011–July 2011) — | Callon Petroleum Company | |||
| University of Miami School of | (December 2019–Present) | |||
| Business Administration | ||||
| Director; Audit | ||||
| President — U.S. Trust, | Committee Member — | |||
| Bank of America Private | Carrizo Oil & Gas, Inc. | |||
| Wealth Management | (March 2018–December 2019) | |||
| (Private Banking) | ||||
(July 2007–December 2008)
| ||||
| Vice Chairman | 95 | Director — HSBC North | ||
| (2010–April 2013) — | America Holdings Inc. | |||
| PNC Financial | (December 2013–Present) | |||
| Services Group | ||||
| Director — HSBC USA Inc. | ||||
| (July 2014–Present) | ||||
| Director — | ||||
| HSBC Bank USA, | ||||
| National Association | ||||
| (July 2014–March 2017) | ||||
| Director — HSBC | ||||
| Finance Corporation | ||||
(December 2013–April 2018)
|
151
Table of Contents
Board of trustees / directors and officers addendum
Delaware Funds®by Macquarie
Name, Address, and Birth Date | Position(s) Held with Fund(s) | Length of Time Served | ||
Independent Trustees (continued)
| ||||
| Christianna Wood | Trustee | Since January 2019 | ||
| 2005 Market Street | ||||
| Philadelphia, PA 19103 | ||||
| August 1959 | ||||
152
Table of Contents
Principal Occupation(s) During the Past Five Years | Number of Portfolios in Fund Complex Overseen by Trustee or Officer | Other Directorships Held by Trustee or Officer | ||||
| ||||||
| Chief Executive Officer | 95 | Director; Finance Committee | ||||
| and President — | and Audit Committee | |||||
| Gore Creek | Member — H&R | |||||
| Capital, Ltd. | Block Corporation | |||||
| (August 2009–Present) | (July 2008–Present) | |||||
| Director; Chair of Investments | ||||||
| Committee and Audit | ||||||
| Committee Member — | ||||||
| Grange Insurance | ||||||
| (2013–Present) | ||||||
| Trustee; Chair of | ||||||
| Nominating and Governance | ||||||
| Committee and Audit | ||||||
| Committee Member — | ||||||
| The Merger Fund | ||||||
| (2013–Present), | ||||||
| The Merger Fund VL | ||||||
| (2013-Present), | ||||||
| WCM Alternatives: | ||||||
| Event-Driven Fund | ||||||
| (2013–Present), | ||||||
| and WCM Alternatives: | ||||||
| Credit Event Fund | ||||||
| (December 2017–Present) | ||||||
| Director; Chair of | ||||||
| Governance Committee | ||||||
| and Audit Committee | ||||||
| Member — International | ||||||
| Securities Exchange | ||||||
| (2010–2016) | ||||||
153
Table of Contents
Board of trustees / directors and officers addendum
Delaware Funds®by Macquarie
Name, Address, and Birth Date | Position(s) Held with Fund(s) | Length of Time Served | ||
Independent Trustees (continued)
| ||||
| Janet L. Yeomans | Trustee | Since April 1999 | ||
| 2005 Market Street | ||||
| Philadelphia, PA 19103 | ||||
| July 1948 | ||||
Officers
| ||||
| David F. Connor | Senior Vice President, | Senior Vice President since | ||
| 2005 Market Street | General Counsel, | May 2013; General | ||
| Philadelphia, PA 19103 | and Secretary | Counsel since May 2015; | ||
| December 1963 | Secretary since | |||
| October 2005 | ||||
| Daniel V. Geatens | Vice President | Vice President and | ||
| 2005 Market Street | and Treasurer | Treasurer since October 2007 | ||
| Philadelphia, PA 19103 | ||||
| October 1972 | ||||
| Richard Salus | Senior Vice President | Senior Vice President and | ||
| 2005 Market Street | and Chief Financial Officer | Chief Financial Officer | ||
| Philadelphia, PA 19103 | since November 2006 | |||
| October 1963 | ||||
The Statement of Additional Information for the Fund(s) includes additional information about the Trustees and Officers and is available, without charge, upon request by calling 800523-1918.
154
Table of Contents
Principal Occupation(s) During the Past Five Years | Number of Portfolios in Fund Complex Overseen by Trustee or Officer | Other Directorships Held by Trustee or Officer | ||
| ||||
| Vice President and Treasurer | 95 | Director; Personnel and | ||
| (January 2006–July 2012), | Compensation Committee | |||
| Vice President — | Chair; Member of Nominating, | |||
| Mergers & Acquisitions | Investments, and Audit | |||
| (January 2003–January 2006), | Committees for various | |||
| and Vice President | periods throughout | |||
| and Treasurer | directorship — | |||
| (July 1995–January 2003) — | Okabena Company | |||
| 3M Company | (2009–2017) | |||
| ||||
| David F. Connor has served | 95 | None3 | ||
| in various capacities at | ||||
| different times at | ||||
| Macquarie Investment | ||||
| Management. | ||||
| Daniel V. Geatens has served | 95 | None3 | ||
| in various capacities at | ||||
| different times at | ||||
| Macquarie Investment | ||||
| Management. | ||||
| Richard Salus has served | 95 | None | ||
| in various capacities | ||||
| at different times at | ||||
| Macquarie Investment | ||||
| Management. | ||||
| 3 | David F. Connor and Daniel V. Geatens serve in similar capacities for the six portfolios of the Optimum Fund Trust, which have the same investment advisor, principal underwriter, and transfer agent as the registrant. Mr. Geatens also serves as the Chief Financial Officer of the Optimum Fund Trust and he is the Chief Financial Officer and Treasurer for Macquarie Global Infrastructure Total Return Fund Inc. |
155
Table of Contents
| Board of trustees | ||||||
Shawn K. Lytle President and Chief Executive Officer Delaware Funds® by Macquarie Philadelphia, PA
Thomas L. Bennett Chairman of the Board Delaware Funds by Macquarie Private Investor Rosemont, PA
Jerome D. Abernathy Managing Member Stonebrook Capital Management, LLC Jersey City, NJ | Ann D. Borowiec Former Chief Executive Officer Private Wealth Management J.P. Morgan Chase & Co. New York, NY
Joseph W. Chow Former Executive Vice President State Street Corporation Boston, MA
John A. Fry President Drexel University Philadelphia, PA | Lucinda S. Landreth Former Chief Investment Officer Assurant, Inc. New York, NY
Frances A. Sevilla-Sacasa Former Chief Executive Officer Banco Itaú International Miami, FL | Thomas K. Whitford Former Vice Chairman PNC Financial Services Group Pittsburgh, PA
Christianna Wood Chief Executive Officer and President Gore Creek Capital, Ltd. Golden, CO
Janet L. Yeomans Former Vice President and Treasurer 3M Company St. Paul, MN | |||
| Affiliated officers | ||||||
| David F. Connor | Daniel V. Geatens | Richard Salus | ||||
Senior Vice President, General Counsel, and Secretary Delaware Funds by Macquarie Philadelphia, PA | Vice President and Treasurer Delaware Funds by Macquarie Philadelphia, PA | Senior Vice President and Chief Financial Officer Delaware Funds by Macquarie Philadelphia, PA | ||||
This annual report is for the information of Delaware Emerging Markets Fund, Delaware Global Value Fund, Delaware International Small Cap Fund, and Delaware International Value Equity Fund shareholders, but it may be used with prospective investors when preceded or accompanied by the Delaware Fund fact sheet for the most recently completed calendar quarter. These documents are available at delawarefunds.com/literature.
Each Fund files its complete schedule of portfolio holdings with the Securities and Exchange Commission (SEC) for the first and third quarters of each fiscal year on FormN-Q or FormN-PORT (available for filings after March 31, 2019). Each Fund’s FormsN-Q or FormsN-PORT, as well as a description of the policies and procedures that the Funds use to determine how to vote proxies (if any) relating to portfolio securities, are available without charge (i) upon request, by calling 800523-1918; and (ii) on the SEC’s website at sec.gov. In addition, a description of the policies and procedures that the Funds use to determine how to vote proxies (if any) relating to portfolio securities and the Schedules of Investments included in the Funds’ most recent FormN-Q or FormN-PORT are available without charge on the Funds’ website at delawarefunds.com/literature. Each Fund’s FormsN-Q and FormsN-PORT may be reviewed and copied at the SEC’s Public Reference Room in Washington, D.C.; information on the operation of the Public Reference Room may be obtained by calling 800SEC-0330.
Information (if any) regarding how the Funds voted proxies relating to portfolio securities during the most recently disclosed12-month period ended June 30 is available without charge (i) through the Funds’ website at delawarefunds.com/proxy; and (ii) on the SEC’s website at sec.gov.
156
Item 2. Code of Ethics
The registrant has adopted a code of ethics that applies to the registrant’s principal executive officer, principal financial officer, principal accounting officer or controller, or persons performing similar functions, regardless of whether these individuals are employed by the registrant or a third party. A copy of the registrant’s Code of Business Ethics has been posted on the Delaware Funds®by Macquarie Internet Web site atwww.delawarefunds.com. Any amendments to the Code of Business Ethics, and information on any waiver from its provisions granted by the registrant, will also be posted on this Web site within five business days of such amendment or waiver and will remain on the Web site for at least 12 months.
Item 3. Audit Committee Financial Expert
The registrant’s Board of Trustees has determined that certain members of the registrant’s Audit Committee are audit committee financial experts, as defined below. For purposes of this item, an “audit committee financial expert” is a person who has the following attributes:
a. An understanding of generally accepted accounting principles and financial statements;
b. The ability to assess the general application of such principles in connection with the accounting for estimates, accruals, and reserves;
c. Experience preparing, auditing, analyzing, or evaluating financial statements that present a breadth and level of complexity of accounting issues that are generally comparable to the breadth and complexity of issues that can reasonably be expected to be raised by the registrant’s financial statements, or experience actively supervising one or more persons engaged in such activities;
d. An understanding of internal controls and procedures for financial reporting; and
e. An understanding of audit committee functions.
An “audit committee financial expert” shall have acquired such attributes through:
a. Education and experience as a principal financial officer, principal accounting officer, controller, public accountant, or auditor or experience in one or more positions that involve the performance of similar functions;
b. Experience actively supervising a principal financial officer, principal accounting officer, controller, public accountant, auditor, or person performing similar functions;
c. Experience overseeing or assessing the performance of companies or public accountants with respect to the preparation, auditing, or evaluation of financial statements; or
d. Other relevant experience.
The registrant’s Board of Trustees has also determined that each member of the registrant’s Audit Committee is independent. In order to be “independent” for purposes of this item, the Audit Committee member may not: (i) other than in his or her capacity as a member of the Board of Trustees or any committee thereof, accept directly or indirectly any consulting, advisory or other compensatory fee from the issuer; or (ii) be an “interested person” of the registrant as defined in Section 2(a)(19) of the Investment Company Act of 1940.
The names of the audit committee financial experts on the registrant’s Audit Committee are set forth below:
Jerome D. Abernathy
John A. Fry
Thomas K. Whitford, Chair
Christianna Wood
Item 4. Principal Accountant Fees and Services
(a)Audit fees.
The aggregate fees billed for services provided to the registrant by its independent auditors for the audit of the registrant’s annual financial statements and for services normally provided by the independent auditors in connection with statutory and regulatory filings or engagements were $128,880 for the fiscal year ended November 30, 2019.
The aggregate fees billed for services provided to the registrant by its independent auditors for the audit of the registrant’s annual financial statements and for services normally provided by the independent auditors in connection with statutory and regulatory filings or engagements were $126,360 for the fiscal year ended November 30, 2018.
(b)Audit-related fees.
The aggregate fees billed by the registrant’s independent auditors for services relating to the performance of the audit of the registrant’s financial statements and not reported under paragraph (a) of this Item were $0 for the fiscal year ended November 30, 2019.
The aggregate fees billed by the registrant’s independent auditors for services relating to the performance of the audit of the financial statements of the registrant’s investment adviser and other service providers under common control with the adviser and that relate directly to the operations or financial reporting of the registrant were $909,000 for the registrant’s fiscal year ended November 30, 2019. The percentage of these fees relating to services approved by the registrant’s Audit Committee pursuant to thedeminimis exception from the pre-approval requirement in Rule 2-01(c)(7)(i)(C) of Regulation S-X was 0%. These audit-related services were as follows: year-end audit procedures; group reporting and subsidiary statutory audits.
The aggregate fees billed by the registrant’s independent auditors for services relating to the performance of the audit of the registrant’s financial statements and not reported under paragraph (a) of this Item were $0 for the fiscal year ended November 30, 2018.
The aggregate fees billed by the registrant’s independent auditors for services relating to the performance of the audit of the financial statements of the registrant’s investment adviser and other service providers under common control with the adviser and that relate directly to the operations or financial reporting of the registrant were $640,000 for the registrant’s fiscal year ended November 30, 2018. The percentage of these fees relating to services approved by the registrant’s Audit Committee pursuant to thedeminimis exception from the pre-approval requirement in Rule 2-01(c)(7)(i)(C) of Regulation S-X was 0%. These audit-related services were as follows: year-end audit procedures; group reporting and subsidiary statutory audits.
(c)Tax fees.
The aggregate fees billed by the registrant’s independent auditors for tax-related services provided to the registrant were $26,440 for the fiscal year ended November 30, 2019. The percentage of these fees relating to services approved by the registrant’s Audit Committee pursuant to thedeminimis exception from the pre-approval requirement in Rule 2-01(c)(7)(i)(C) of Regulation S-X was 0%. These tax-related services were as follows: review of income tax returns and review of annual excise distribution calculations.
The aggregate fees billed by the registrant’s independent auditors for tax-related services provided to the registrant’s investment adviser and other service providers under common control with the adviser and that relate directly to the operations or financial reporting of the registrant were $0 for the registrant’s fiscal year ended November 30, 2019.
The aggregate fees billed by the registrant’s independent auditors for tax-related services provided to the registrant were $26,253 for the fiscal year ended November 30, 2018. The percentage of these fees relating to services approved by the registrant’s Audit Committee pursuant to thedeminimis exception from the pre-approval requirement in Rule 2-01(c)(7)(i)(C) of Regulation S-X was 0%. These tax-related services were as follows: review of income tax returns and review of annual excise distribution calculations.
The aggregate fees billed by the registrant’s independent auditors for tax-related services provided to the registrant’s investment adviser and other service providers under common control with the adviser and that relate directly to the operations or financial reporting of the registrant were $0 for the registrant’s fiscal year ended November 30, 2018.
(d)All other fees.
The aggregate fees billed for all services provided by the independent auditors to the registrant other than those set forth in paragraphs (a), (b) and (c) of this Item were $0 for the fiscal year ended November 30, 2019.
The aggregate fees billed for all services other than those set forth in paragraphs (b) and (c) of this Item provided by the registrant’s independent auditors to the registrant’s adviser and other service providers under common control with the adviser and that relate directly to the operations or financial reporting of the registrant were $0 for the registrant’s fiscal year ended November 30, 2019. The percentage of these fees relating to services approved by the registrant’s Audit Committee pursuant to thedeminimis exception from the pre-approval requirement in Rule 2-01(c)(7)(i)(C) of Regulation S-X was 0%.
The aggregate fees billed for all services provided by the independent auditors to the registrant other than those set forth in paragraphs (a), (b) and (c) of this Item were $0 for the fiscal year ended November 30, 2018.
The aggregate fees billed for all services other than those set forth in paragraphs (b) and (c) of this Item provided by the registrant’s independent auditors to the registrant’s adviser and other service providers under common control with the adviser and that relate directly to the operations or financial reporting of the registrant were $0 for the registrant’s fiscal year ended November 30, 2018. The percentage of these fees relating to services approved by the registrant’s Audit Committee pursuant to thedeminimis exception from the pre-approval requirement in Rule 2-01(c)(7)(i)(C) of Regulation S-X was 0%.
(e) The registrant’s Audit Committee has established pre-approval policies and procedures as permitted by Rule 2-01(c)(7)(i)(B) of Regulation S-X (the “Pre-Approval Policy”) with respect to services provided by the registrant’s independent auditors. Pursuant to the Pre-Approval Policy, the Audit Committee has pre-approved the services set forth in the table below with respect to the registrant up to the specified fee limits. Certain fee limits are based on aggregate fees to the registrant and other registrants within the Delaware Funds®by Macquarie.
| Service | Range of Fees |
| Audit Services | |
| Statutory audits or financial audits for new Funds | up to $40,000 per Fund |
| Services associated with SEC registration statements (e.g., Form N-1A, Form N-14, etc.), periodic reports and other documents filed with the SEC or other documents issued in connection with securities offerings (e.g., comfort letters for closed-end Fund offerings, consents), and assistance in responding to SEC comment letters | up to $10,000 per Fund |
| Consultations by Fund management as to the accounting or disclosure treatment of transactions or events and/or the actual or potential impact of final or proposed rules, standards or interpretations by the SEC, FASB, or other regulatory or standard-setting bodies (Note: Under SEC rules, some consultations may be considered “audit-related services” rather than “audit services”) | up to $25,000 in the aggregate |
| Audit-Related Services | |
| Consultations by Fund management as to the accounting or disclosure treatment of transactions or events and /or the actual or potential impact of final or proposed rules, standards or interpretations by the SEC, FASB, or other regulatory or standard-setting bodies (Note: Under SEC rules, some consultations may be considered “audit services” rather than “audit-related services”) | up to $25,000 in the aggregate |
| Tax Services | |
| U.S. federal, state and local and international tax planning and advice (e.g., consulting on statutory, regulatory or administrative developments, evaluation of Funds’ tax compliance function, etc.) | up to $25,000 in the aggregate |
| U.S. federal, state and local tax compliance (e.g., excise distribution reviews, etc.) | up to $5,000 per Fund |
| Review of federal, state, local and international income, franchise and other tax returns | up to $5,000 per Fund |
Under the Pre-Approval Policy, the Audit Committee has also pre-approved the services set forth in the table below with respect to the registrant’s investment adviser and other entities controlling, controlled by or under common control with the investment adviser that provide ongoing services to the registrant (the “Control Affiliates”) up to the specified fee limit. This fee limit is based on aggregate fees to the investment adviser and its Control Affiliates.
| Service | Range of Fees |
| Non-Audit Services | |
| Services associated with periodic reports and other documents filed with the SEC and assistance in responding to SEC comment letters | up to $10,000 in the aggregate |
The Pre-Approval Policy requires the registrant’s independent auditors to report to the Audit Committee at each of its regular meetings regarding all services initiated since the last such report was rendered, including those services authorized by the Pre-Approval Policy.
(f) Not applicable.
(g) The aggregate non-audit fees billed by the registrant’s independent auditors for services rendered to the registrant and to its investment adviser and other service providers under common control with the adviser were $4,687,000 and $11,748,000 for the registrant’s fiscal years ended November 30, 2019 and November 30, 2018, respectively.
(h) In connection with its selection of the independent auditors, the registrant’s Audit Committee has considered the independent auditors’ provision of non-audit services to the registrant’s investment adviser and other service providers under common control with the adviser that were not required to be pre-approved pursuant to Rule 2-01(c)(7)(ii) of Regulation S-X. The Audit Committee has determined that the independent auditors’ provision of these services is compatible with maintaining the auditors’ independence.
Item 5. Audit Committee of Listed Registrants
Not applicable.
Item 6. Investments
(a) Included as part of report to shareholders filed under Item 1 of this Form N-CSR.
(b) Divestment of securities in accordance with Section 13(c) of the Investment Company Act of 1940.
Not applicable.
Item 7. Disclosure of Proxy Voting Policies and Procedures for Closed-End Management Investment Companies
Not applicable.
Item 8. Portfolio Managers of Closed-End Management Investment Companies
Not applicable.
Item 9. Purchases of Equity Securities by Closed-End Management Investment Companies and Affiliated Purchasers
Not applicable.
Item 10. Submission of Matters to a Vote of Security Holders
Not applicable.
Item 11. Controls and Procedures
The registrant’s principal executive officer and principal financial officer have evaluated the registrant’s disclosure controls and procedures within 90 days of the filing of this report and have concluded that they are effective in providing reasonable assurance that the information required to be disclosed by the registrant in its reports or statements filed under the Securities Exchange Act of 1934 is recorded, processed, summarized and reported within the time periods specified in the rules and forms of the Securities and Exchange Commission.
There were no significant changes in the registrant’s internal control over financial reporting that occurred during the period covered by the report to stockholders included herein that have materially affected, or are reasonably likely to materially affect, the registrant’s internal control over financial reporting.
Item 12. Disclosure of Securities Lending Activities for Closed-End Management Investment Companies
Not applicable.
Item 13. Exhibits
(a) (1) Code of Ethics
Not applicable.
(2) Certifications of Principal Executive Officer and Principal Financial Officer pursuant to Rule 30a-2 under the Investment Company Act of 1940 are attached hereto as Exhibit 99.CERT.
(3) Written solicitations to purchase securities pursuant to Rule 23c-1 under the Securities Exchange Act of 1934.
Not applicable.
(b) Certifications pursuant to Section 906 of the Sarbanes-Oxley Act of 2002 are furnished herewith as Exhibit 99.906CERT.
SIGNATURES
Pursuant to the requirements of the Securities Exchange Act of 1934 and the Investment Company Act of 1940, the registrant has duly caused this report to be signed on its behalf, by the undersigned, thereunto duly authorized.
DELAWARE GROUP®GLOBAL & INTERNATIONAL FUNDS
| SHAWN K. LYTLE | |
| By: | Shawn K. Lytle |
| Title: | President and Chief Executive Officer |
| Date: | February 3, 2020 |
Pursuant to the requirements of the Securities Exchange Act of 1934 and the Investment Company Act of 1940, this report has been signed below by the following persons on behalf of the registrant and in the capacities and on the dates indicated.
| SHAWN K. LYTLE | |
| By: | Shawn K. Lytle |
| Title: | President and Chief Executive Officer |
| Date: | February 3, 2020 |
| RICHARD SALUS | |
| By: | Richard Salus |
| Title: | Chief Financial Officer |
| Date: | February 3, 2020 |