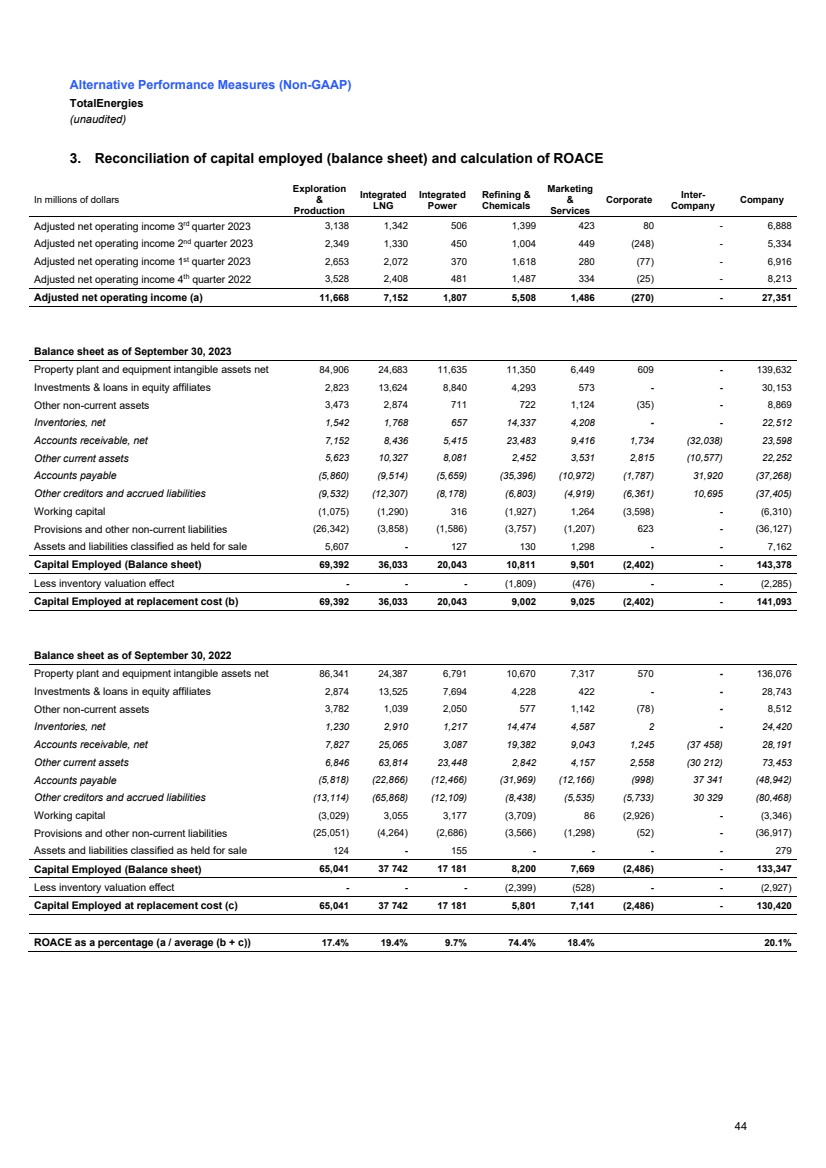
| Alternative Performance Measures (Non-GAAP) TotalEnergies (unaudited) 3. Reconciliation of capital employed (balance sheet) and calculation of ROACE In millions of dollars Exploration & Production Integrated LNG Integrated Power Refining & Chemicals Marketing & Services Corporate Inter-Company Company Adjusted net operating income 3rd quarter 2023 3,138 1,342 506 1,399 423 80 - 6,888 Adjusted net operating income 2nd quarter 2023 2,349 1,330 450 1,004 449 (248) - 5,334 Adjusted net operating income 1st quarter 2023 2,653 2,072 370 1,618 280 (77) - 6,916 Adjusted net operating income 4th quarter 2022 3,528 2,408 481 1,487 334 (25) - 8,213 Adjusted net operating income (a) 11,668 7,152 1,807 5,508 1,486 (270) - 27,351 Balance sheet as of September 30, 2023 Property plant and equipment intangible assets net 84,906 24,683 11,635 11,350 6,449 609 - 139,632 Investments & loans in equity affiliates 2,823 13,624 8,840 4,293 573 - - 30,153 Other non-current assets 3,473 2,874 711 722 1,124 (35) - 8,869 Inventories, net 1,542 1,768 657 14,337 4,208 - - 22,512 Accounts receivable, net 7,152 8,436 5,415 23,483 9,416 1,734 (32,038) 23,598 Other current assets 5,623 10,327 8,081 2,452 3,531 2,815 (10,577) 22,252 Accounts payable (5,860) (9,514) (5,659) (35,396) (10,972) (1,787) 31,920 (37,268) Other creditors and accrued liabilities (9,532) (12,307) (8,178) (6,803) (4,919) (6,361) 10,695 (37,405) Working capital (1,075) (1,290) 316 (1,927) 1,264 (3,598) - (6,310) Provisions and other non-current liabilities (26,342) (3,858) (1,586) (3,757) (1,207) 623 - (36,127) Assets and liabilities classified as held for sale 5,607 - 127 130 1,298 - - 7,162 Capital Employed (Balance sheet) 69,392 36,033 20,043 10,811 9,501 (2,402) - 143,378 Less inventory valuation effect - - - (1,809) (476) - - (2,285) Capital Employed at replacement cost (b) 69,392 36,033 20,043 9,002 9,025 (2,402) - 141,093 Balance sheet as of September 30, 2022 Property plant and equipment intangible assets net 86,341 24,387 6,791 10,670 7,317 570 - 136,076 Investments & loans in equity affiliates 2,874 13,525 7,694 4,228 422 - - 28,743 Other non-current assets 3,782 1,039 2,050 577 1,142 (78) - 8,512 Inventories, net 1,230 2,910 1,217 14,474 4,587 2 - 24,420 Accounts receivable, net 7,827 25,065 3,087 19,382 9,043 1,245 (37 458) 28,191 Other current assets 6,846 63,814 23,448 2,842 4,157 2,558 (30 212) 73,453 Accounts payable (5,818) (22,866) (12,466) (31,969) (12,166) (998) 37 341 (48,942) Other creditors and accrued liabilities (13,114) (65,868) (12,109) (8,438) (5,535) (5,733) 30 329 (80,468) Working capital (3,029) 3,055 3,177 (3,709) 86 (2,926) - (3,346) Provisions and other non-current liabilities (25,051) (4,264) (2,686) (3,566) (1,298) (52) - (36,917) Assets and liabilities classified as held for sale 124 - 155 - - - - 279 Capital Employed (Balance sheet) 65,041 37 742 17 181 8,200 7,669 (2,486) - 133,347 Less inventory valuation effect - - - (2,399) (528) - - (2,927) Capital Employed at replacement cost (c) 65,041 37 742 17 181 5,801 7,141 (2,486) - 130,420 ROACE as a percentage (a / average (b + c)) 17.4% 19.4% 9.7% 74.4% 18.4% 20.1% 44 |