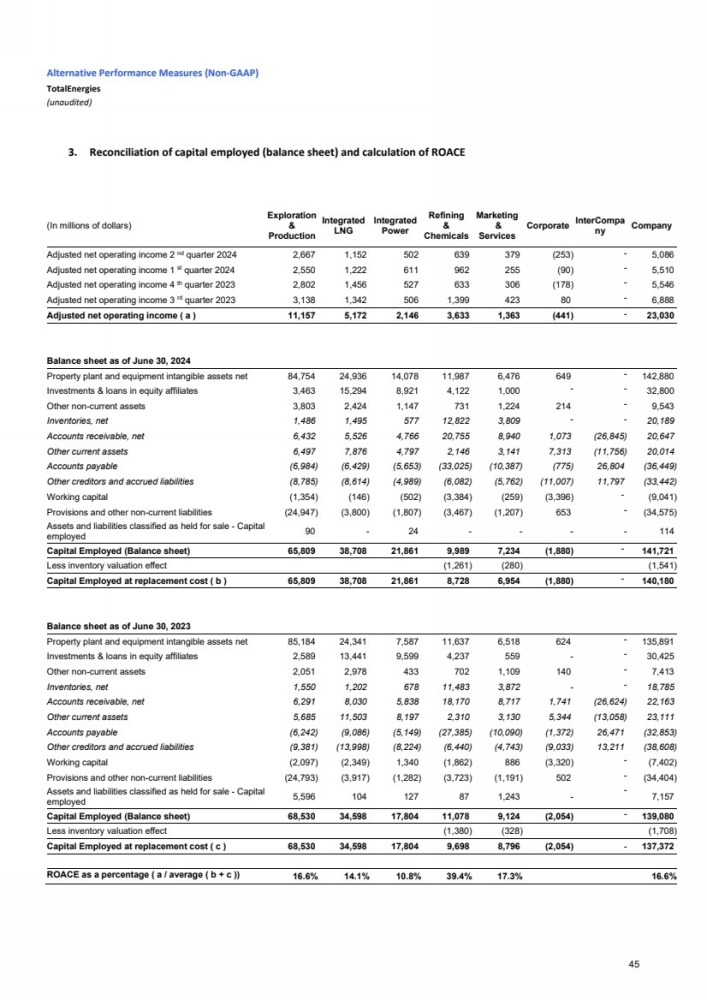
| Alternative Performance Measures (Non-GAAP) TotalEnergies (unaudited) 3. Reconciliation of capital employed (balance sheet) and calculation of ROACE (In millions of dollars) Exploration & Production Integrated LNG Integrated Power Refining & Chemicals Marketing & Services Corporate InterCompa ny Company Adjusted net operating income 2 nd quarter 2024 2,667 1,152 502 639 379 (253) - 5,086 Adjusted net operating income 1 st quarter 2024 2,550 1,222 611 962 255 (90) - 5,510 Adjusted net operating income 4 th quarter 2023 2,802 1,456 527 633 306 (178) - 5,546 Adjusted net operating income 3 rd quarter 2023 3,138 1,342 506 1,399 423 80 - 6,888 Adjusted net operating income ( a ) 11,157 5,172 2,146 3,633 1,363 (441) - 23,030 Balance sheet as of June 30, 2024 Property plant and equipment intangible assets net 84,754 24,936 14,078 11,987 6,476 649 - 142,880 Investments & loans in equity affiliates 3,463 15,294 8,921 4,122 1,000 - - 32,800 Other non-current assets 3,803 2,424 1,147 731 1,224 214 - 9,543 Inventories, net 1,486 1,495 577 12,822 3,809 - - 20,189 Accounts receivable, net 6,432 5,526 4,766 20,755 8,940 1,073 (26,845) 20,647 Other current assets 6,497 7,876 4,797 2,146 3,141 7,313 (11,756) 20,014 Accounts payable (6,984) (6,429) (5,653) (33,025) (10,387) (775) 26,804 (36,449) Other creditors and accrued liabilities (8,785) (8,614) (4,989) (6,082) (5,762) (11,007) 11,797 (33,442) Working capital (1,354) (146) (502) (3,384) (259) (3,396) - (9,041) Provisions and other non-current liabilities (24,947) (3,800) (1,807) (3,467) (1,207) 653 - (34,575) Assets and liabilities classified as held for sale - Capital employed 90 - 24 - - - - 114 Capital Employed (Balance sheet) 65,809 38,708 21,861 9,989 7,234 (1,880) - 141,721 Less inventory valuation effect (1,261) (280) (1,541) Capital Employed at replacement cost ( b ) 65,809 38,708 21,861 8,728 6,954 (1,880) - 140,180 Balance sheet as of June 30, 2023 Property plant and equipment intangible assets net 85,184 24,341 7,587 11,637 6,518 624 - 135,891 Investments & loans in equity affiliates 2,589 13,441 9,599 4,237 559 - - 30,425 Other non-current assets 2,051 2,978 433 702 1,109 140 - 7,413 Inventories, net 1,550 1,202 678 11,483 3,872 - - 18,785 Accounts receivable, net 6,291 8,030 5,838 18,170 8,717 1,741 (26,624) 22,163 Other current assets 5,685 11,503 8,197 2,310 3,130 5,344 (13,058) 23,111 Accounts payable (6,242) (9,086) (5,149) (27,385) (10,090) (1,372) 26,471 (32,853) Other creditors and accrued liabilities (9,381) (13,998) (8,224) (6,440) (4,743) (9,033) 13,211 (38,608) Working capital (2,097) (2,349) 1,340 (1,862) 886 (3,320) - (7,402) Provisions and other non-current liabilities (24,793) (3,917) (1,282) (3,723) (1,191) 502 - (34,404) Assets and liabilities classified as held for sale - Capital employed 5,596 104 127 87 1,243 - - 7,157 Capital Employed (Balance sheet) 68,530 34,598 17,804 11,078 9,124 (2,054) - 139,080 Less inventory valuation effect (1,380) (328) (1,708) Capital Employed at replacement cost ( c ) 68,530 34,598 17,804 9,698 8,796 (2,054) - 137,372 ROACE as a percentage ( a / average ( b + c )) 16.6% 14.1% 10.8% 39.4% 17.3% 16.6% 45 |