UNITED STATES SECURITIES AND EXCHANGE COMMISSION
Washington, D.C. 20549
FORM N-CSR
CERTIFIED SHAREHOLDER REPORT OF REGISTERED MANAGEMENT
INVESTMENT COMPANIES
| Investment Company Act file number: | 811-06569 | |
| Exact name of registrant as specified in charter: | Ivy Funds | |
| Address of principal executive offices: | 610 Market Street | |
| Philadelphia, PA 19106 | ||
| Name and address of agent for service: | David F. Connor, Esq. | |
| 610 Market Street | ||
| Philadelphia, PA 19106 | ||
| Registrant’s telephone number, including area code: | (800) 523-1918 | |
| Date of fiscal year end: | September 30 | |
| Date of reporting period: | September 30, 2022 |
Item 1. Reports to Stockholders
 |
Annual report
Ivy Funds
Delaware Ivy California Municipal High Income Fund
Delaware Ivy Corporate Bond Fund
Delaware Ivy Crossover Credit Fund
Delaware Ivy Emerging Markets Local Currency Debt Fund
Delaware Ivy Government Securities Fund
Delaware Ivy High Yield Fund
(formerly, Delaware Ivy PineBridge High Yield Fund)
Delaware Ivy International Small Cap Fund
Delaware Ivy Multi-Asset Income Fund
(formerly, Delaware Ivy Apollo Multi-Asset Income Fund)
Delaware Ivy Strategic Income Fund
(formerly, Delaware Ivy Apollo Strategic Income Fund)
Delaware Ivy Total Return Bond Fund
(formerly, Delaware Ivy Pictet Targeted Return Bond Fund)
September 30, 2022
Carefully consider the Funds’ investment objectives, risk factors, charges, and expenses before investing. This and other information can be found in the Funds’ prospectus and their summary prospectuses, which may be obtained by visiting delawarefunds.com/literature or calling 800 523-1918. Investors should read the prospectus and the summary prospectus carefully before investing.
You can obtain shareholder reports and prospectuses online instead of in the mail.
Visit delawarefunds.com/edelivery.
Experience Delaware Funds by Macquarie®
Macquarie Asset Management (MAM) is a global asset manager that aims to deliver positive impact for everyone. MAM Public Investments traces its roots to 1929 and partners with institutional and individual clients to deliver specialist active investment capabilities across global equities, fixed income, and multi-asset solutions using a conviction-based, long-term approach to investing. In the US, retail investors recognize our Delaware Funds by Macquarie family of funds as one of the oldest mutual fund families.
If you are interested in learning more about creating an investment plan, contact your financial advisor.
You can learn more about Delaware Funds or obtain a prospectus for the Funds at delawarefunds.com/literature.
Manage your account online
● Check your account balance and transactions
● View statements and tax forms
● Make purchases and redemptions
Visit delawarefunds.com/account-access.
Macquarie Asset Management (MAM) is the asset management division of Macquarie Group. MAM is a full-service asset manager offering a diverse range of products across public and private markets including fixed income, equities, multi-asset solutions, private credit, infrastructure, renewables, natural assets, real estate, and asset finance. The Public Investments business is a part of MAM and includes the following investment advisers: Macquarie Investment Management Business Trust (MIMBT), Macquarie Funds Management Hong Kong Limited, Macquarie Investment Management Austria Kapitalanlage AG, Macquarie Investment Management Global Limited, Macquarie Investment Management Europe Limited, and Macquarie Investment Management Europe S.A.
The Funds are distributed by Delaware Distributors, L.P. (DDLP), an affiliate of MIMBT and Macquarie Group Limited.
Other than Macquarie Bank Limited ABN 46 008 583 542 (“Macquarie Bank”), any Macquarie Group entity noted in this document is not an authorized deposit-taking institution for the purposes of the Banking Act 1959 (Commonwealth of Australia). The obligations of these other Macquarie Group entities do not represent deposits or other liabilities of Macquarie Bank. Macquarie Bank does not guarantee or otherwise provide assurance in respect of the obligations of these other Macquarie Group entities. In addition, if this document relates to an investment, (a) the investor is subject to investment risk including possible delays in repayment and loss of income and principal invested and (b) none of Macquarie Bank or any other Macquarie Group entity guarantees any particular rate of return on or the performance of the investment, nor do they guarantee repayment of capital in respect of the investment.
The Funds are governed by US laws and regulations.
Unless otherwise noted, views expressed herein are current as of September 30, 2022, and subject to change for events occurring after such date.
The Funds are not FDIC insured and are not guaranteed. It is possible to lose the principal amount invested.
Advisory services provided by Delaware Management Company, a series of MIMBT, a US registered investment advisor.
All third-party marks cited are the property of their respective owners.
© 2022 Macquarie Management Holdings, Inc.
Delaware Ivy California Municipal High Income Fund
September 30, 2022 (Unaudited)
Performance preview (for the year ended September 30, 2022)
| Delaware Ivy California Municipal High Income Fund (Class I shares) | 1-year return | -13.29% | ||
| Delaware Ivy California Municipal High Income Fund (Class A shares) | 1-year return | -13.46% | ||
| Bloomberg Municipal Bond Index (benchmark)* | 1-year return | -11.50% | ||
| Bloomberg Municipal High Yield Index (previous benchmark) | 1-year return | -15.05% |
Past performance does not guarantee future results.
*The Fund changed its primary broad-based securities index to the Bloomberg Municipal Bond Index as of November 15, 2021.The Fund elected to use the new index because it more closely reflects the Fund’s investment strategies.
For complete, annualized performance for Delaware Ivy California Municipal High Income Fund, please see the table on page 24.
Class I shares are not subject to a sales charge and are offered for sale exclusively to certain eligible investors. In addition, Class I shares pay no distribution and service fee. The performance of Class A shares excludes the applicable sales charge. The performance of both Class I shares and Class A shares reflects the reinvestment of all distributions. Please see page 26 for a description of the indices. Index performance returns do not reflect any management fees, transaction costs, or expenses. Indices are unmanaged and one cannot invest directly in an index.
Investment objective
The Fund seeks to provide a high level of current income that is not subject to Federal and California income tax.
On September 13, 2021, the Board of Trustees (Board) of the Ivy Funds approved the portfolio manager team of Gregory A. Gizzi, Stephen J. Czepiel, and Jake van Roden of Delaware Management Company (DMC) as Fund portfolio managers. In connection with this change, the Board approved applicable revisions to the Fund’s investment strategies. All changes took effect on or about November 15, 2021. The Fund performance discussed in this commentary pertains to the measurement period of November 15, 2021 to September 30, 2022.
Market review
As the fiscal year ended September 30, 2022, progressed, investors’ initial optimism about US economic growth gradually gave way to concern that new COVID-19 variants – first Delta, then Omicron – would delay the country’s emergence from the pandemic. Over time, however, as it became evident that Omicron infections were milder for many people, day-to-day concerns about COVID-19 appeared to ease, and economic and health restrictions were gradually lifted.
An ultimately more worrisome development for policymakers and investors alike, however, was the sharp rise in US inflation. Much higher energy prices, exacerbated by Russia’s February 2022 invasion of Ukraine, combined with supply chain challenges triggered an across-the-board increase in prices. In August 2022, the US Consumer Price Index (CPI) rose an annualized 8.3%, still very high historically but an improvement from the June 2022 peak of 9.1%, which was the largest such 12-month increase in 40 years.
As the US Federal Reserve became increasingly concerned about inflation’s threat to the US economy, the central bank sought to slow the cycle of rising prices by moving aggressively to raise short-term interest rates. The Fed initiated several rate hikes between March and August 2022. At the end of this fiscal year, the federal funds rate stood at 3.00%, up from 0.00% in January. The Fed is widely expected to continue raising rates later in 2022 and in 2023.
Against this backdrop, the US economy began the Fund’s fiscal year on a strong upswing but finished on a downward path. In the third quarter of 2021, US gross domestic product (GDP) – a measure of all goods and services produced by the nation in a year – grew by an annualized 2.3%. This was followed by a fourth-quarter 2021 increase of 6.9%. As economic challenges mounted, however, US GDP turned negative, contracting by 1.6% in the first quarter of 2022 and an estimated 0.6% in the year’s second quarter.
Despite the deteriorating economic environment, US employment trends continued to improve throughout most of the fiscal year. At the start of the 12-month time frame, the country’s jobless rate was 5.2%, well below the pandemic-era peak of 14.7% in April 2020. By the end of the fiscal year, the rate was 3.7%, near an all-time low.
Overall, the municipal bond market, as measured by the Bloomberg Municipal Bond Index, returned -11.50% for the fiscal year ended September 30, 2022.
An unfavorable technical backdrop for municipal bonds weighed significantly on the asset class, especially in the first seven months of 2022. After three months of positive investment flows into municipal bond mutual funds at the end of 2021, market conditions dramatically shifted in 2022. As rates rose sharply and investors feared that significantly higher inflation would eventually lead to additional Fed rate hikes, municipal fund inflows turned to substantial outflows, pushing down bond values.
Against this backdrop, bonds with longer maturities and higher durations (meaning greater interest rate sensitivity) tended to underperform their intermediate- and shorter-dated counterparts.
1
Portfolio management reviews
Delaware Ivy California Municipal High Income Fund
Meanwhile, bonds with lower-investment-grade credit ratings generally lagged higher-quality issues. High yield municipal debt (bonds with credit ratings below BBB) also struggled, though they modestly outperformed their lower-investment-grade counterparts, perhaps due to the volatility-dampening effect of their higher income.
Within the Fund
For the fiscal year ended September 30, 2022, Delaware Ivy California Municipal High Income Fund declined, underperforming its benchmark, the Bloomberg Municipal Bond Index, which also declined. The Fund’s Class I shares returned -13.29%. The Fund’s Class A shares returned -13.46% at net asset value and -17.33% at maximum offer price. These figures reflect all distributions reinvested. During the same period, the benchmark returned -11.50%. For complete, annualized performance of Delaware Ivy California Municipal High Income Fund, please see the table on page 24.
Long bond (22+ years) exposure detracted from performance for the measurement period. This was the weakest-performing segment of the curve within the index, returning -20.18%. The Fund was overweight the benchmark in this part of the curve and consequently underperformed the benchmark here. From a credit perspective, BBB-rated bonds were a drag on performance. BBB-rated bonds tend to underperform in outflow cycles as mutual funds are the natural buyers of this part of the market. As evident by the index returns, the BBB tranche performed the weakest for the period, returning -14.81%. The Fund was overweight and underperformed in this credit segment. The Fund’s out-of-benchmark allocation to below investment grade also underperformed the index return.
The third quarter was another difficult period for municipal bonds, as the Fed’s aggressive rate hikes and its rhetoric that hikes would continue caused municipal investors to set a record for tax-exempt bond fund redemptions. A record $91.5 billion was redeemed from tax-exempt bond funds during this time. We expect this outflow trend to continue until the US Treasury market stabilizes.
This selloff has left investors with attractive yields, in our view, but the macroeconomic environment has kept retail investors at bay thus far. The quarter ended with mutual funds spending some of their cash as yields may have proved too enticing, particularly for investors with a longer time horizon. We believe levels are likely to reward investors who enter the markets at current yields and spreads.
We anticipate that once US Treasury market rates exhibit lasting stability, the municipal market will likely find a bottom and municipal bond funds should become net buyers once again, which we think should improve municipal credit’s performance. As always, we continue to closely monitor the Fund’s credits as we seek to improve the income distribution for our clients.
2
Portfolio management reviews
Delaware Ivy Corporate Bond Fund
September 30, 2022 (Unaudited)
Performance preview (for the year ended September 30, 2022)
| Delaware Ivy Corporate Bond Fund (Class I shares) | 1-year return | -18.98% | ||
| Delaware Ivy Corporate Bond Fund (Class A shares) | 1-year return | -19.22% | ||
| Bloomberg US Corporate Investment Grade Index (benchmark)* | 1-year return | -18.53% | ||
| Bloomberg US Credit Index (previous benchmark) | 1-year return | -17.89% |
Past performance does not guarantee future results.
*The Fund changed its primary broad-based securities index to the Bloomberg US Corporate Investment Grade Index as of November 15, 2021. The Fund elected to use the new index because it more closely reflects the Fund’s investment strategies.
For complete, annualized performance for Delaware Ivy Corporate Bond Fund, please see the table on page 27.
Class I shares are not subject to a sales charge and are offered for sale exclusively to certain eligible investors. In addition, Class I shares pay no distribution and service fee. The performance of Class A shares excludes the applicable sales charge. The performance of both Class I shares and Class A shares reflects the reinvestment of all distributions. Please see page 29 for a description of the indices. Index performance returns do not reflect any management fees, transaction costs, or expenses. Indices are unmanaged and one cannot invest directly in an index.
Investment objective
The Fund seeks to provide current income consistent with preservation of capital.
On September 13, 2021, the Board of Trustees (Board) of the Ivy Funds approved the appointment of the portfolio manager team of Michael G. Wildstein, Wayne A. Anglace, and Kashif Ishaq of Delaware Management Company (DMC) as new Fund portfolio managers. In connection with this change, the Board approved applicable revisions to the Fund’s investment strategies and benchmark. All changes took effect on or about November 15, 2021. The Fund performance discussed in this commentary pertains to the measurement period of November 15, 2021 to September 30, 2022.
Market review
The first few months of the Fund’s fiscal year ended
September 30, 2022 – November 15 through December 31, 2021 – can best be described as calm, with little movement in rates. Although the overall economic environment was slowing after the superheated recovery that characterized the latter half of the previous fiscal period, economic fundamentals were still sound. The one concern that many investors shared was inflation.
However, as the fiscal year began, it became apparent to all that inflation had shifted from being real but transitory to becoming severe and sticky, owing to a combination of labor shortages, low unemployment, high consumer demand, and supply chain shortages.
As did many investors, we foresaw that the Fed would react by raising rates. What we did not anticipate was just how fast, steep, and tenacious those increases would be. Many investors expected that rates would rise gradually and were surprised by the Fed’s pace of hikes that began with a 0.25 percentage-point increase in mid-March. This was followed by a 0.50 percentage-point hike in early May and increases of 0.75 percentage points in June, July, and September. That said, we believe the Fed appears to have made the right call. Though the Fed was initially constrained by the need to reduce its balance sheet, by the time it acted, a more aggressive approach seemed necessary.
The Russia-Ukraine war and China’s economic lockdowns to prevent the spread of COVID-19 also surprised investors. Both caused severe disruptions of the global supply chain, putting significant pressure on inflation. The world learned an expensive lesson on just how important Ukraine is to the global supply of agricultural and energy products. While less surprising, the disruption in the supply of Russian energy was also painful, particularly to European economies that have relied on cheap Russian natural gas. The problems in China were unexpected as the spread of the virus began to increase despite the onset of warmer weather. Rather than take a more moderate approach to managing the virus as many observers had predicted, China reacted with a broad swath of shutdowns that sharply curtailed industrial output.
All three events – the Fed’s aggressive response to inflation, the Russia-Ukraine war, and China’s zero-COVID policy – had a dramatic effect on bond markets in the latter half of the Fund’s fiscal year. Driven primarily by rates and inflation, the first nine months of 2022 was the corporate bond market’s worst opening nine months of any calendar year on record. This was attributable mainly to duration, a measure of a portfolio’s sensitivity to higher interest rates. The longer the duration of a portfolio, the more sensitive it is to higher rates.
As 2022 progressed, we saw significant rate volatility. When the Fed began raising rates aggressively, and investors began talking of an imminent recession, spreads reacted negatively and began to widen. The 10-year Treasury yield rose from 1.51% on December 31, 2021 to 3.83% at the end of September 2022, an increase of 232 basis points (or 2.32 percentage points), which sharply stung long-duration credits. While spreads in the investment grade market
3
Portfolio management reviews
Delaware Ivy Corporate Bond Fund
increased only about 67 basis points, the combination of rising rates and widening spreads was both unusual and painful to investors.
Looking at the relative performance of investment grade versus high yield securities, duration was the key differentiator. High yield performed much better than investment grade, with most of the damage in the investment grade market resulting more from duration than from widening spreads. Because high yield tends to be a shorter-duration asset class, it held up better. Given the perception that the corporate finance world is in good shape, with solid credit metrics and profit margins, investment grade credits tend to be longer duration. The result was an 18.53% decline for investment grade bonds, as measured by the Bloomberg US Corporate Investment Grade Index, for the fiscal year. High yield bonds, as measured by the Bloomberg US Corporate High-Yield Index, declined 14.14%, about three quarters of investment grade’s loss.
Issuance in 2021 was very strong, the second highest annual total behind only the record pace set in 2020. While tapering off somewhat in 2022, it remained stronger than we would have expected. At September 30, 2022, year-to-date issuance was running about 16% below the previous year’s torrid pace. With rate hikes looming, however, many companies rushed to obtain financing before rates could rise even higher. So even though issuance was down, it was generally higher than anticipated. Some sectors, notably banking, unexpectedly flooded the market with new issuance.
As difficult as 2022 has been, there was some good news for bond investors. Throughout the Fund’s fiscal year, corporate profitability was never higher, with record-setting margins and healthy cash flows. From a fundamental standpoint, the corporate bond market was extremely healthy. Companies are entering this uncertain macro environment with strong balance sheets and liquidity. However, management guidance issued as part of second-quarter earnings reports pointed toward the beginning of a more challenged environment driven by inflationary cost pressures, further supply chain constraints, and rising interest rates. We expect credit fundamentals to weaken over the next several quarters with the highest risks in industries most exposed to consumer demand and interest rates. The ultimate impact on balance sheets will depend on the extent of earnings deceleration.
Within the Fund
For the fiscal year ended September 30, 2022, Delaware Ivy Corporate Bond Fund underperformed its benchmark, the Bloomberg US Corporate Investment Grade Index. The Fund’s Class I shares returned -18.98%. The Fund’s Class A shares returned -19.22% at net asset value and -22.87% at maximum offer price. These figures reflect all distributions reinvested. During the same period, the benchmark returned -18.53%. For complete, annualized performance of Delaware Ivy Corporate Bond Fund, please see the table on page 27.
Yield curve positioning was the primary factor in the relatively neutral performance of the Delaware Ivy Corporate Bond Fund. The Fund’s underweight to spread duration in the long end of the curve benefited performance as higher interest rates drove the price of credits held in the benchmark sharply lower. Conversely, the Fund’s underweight to the front end of the curve was detrimental to performance as these securities outperformed on a relative basis for the same reason; the shorter a bond’s duration, the less affected it was by rising rates. The Fund benefited from out-of-benchmark investments in high yield securities, which generally outperformed their investment grade counterparts for the fiscal year by virtue of their lower-duration nature. The Delaware Ivy Corporate Bond Fund is allowed to invest up to 20% of its assets in high yield securities. The Fund maintained a portfolio allocation that varied throughout the fiscal year, as described below.
The fiscal year was an unusual period for the Fund, in our view. Although we believe most of the relative performance was attributable to rising rates, we acknowledge credit spreads widened meaningfully as well. It is rare to see rates rise and spreads widen at the same time. Usually spreads increase in the face of a potential recession and consequently weigh on issuers’ earnings. But this year, rates and spreads moved in the same direction, resulting in the corporate bond market’s worst start to a calendar year in its history.
On a sector basis, consumer cyclicals were a leading detractor from performance, driven by an underweight to shorter-dated issues in the auto and retailer subsectors. An overweight to long-end spread duration within autos also detracted amid rising rates, slowing economic growth, consumer confidence, and chip supply shortages. This weighed on auto manufacturers and parts suppliers, including Aptiv PLC, a vehicle component manufacturer.
The Fund also held bonds issued by companies in the electric utility sector. These were typically long duration and given the Fund’s overweight positions to longer-dated issues, it detracted from performance during the fiscal year. Fund holdings included power production and distributor Entergy Corp. and regulated utility operator Exelon Corp.
The Fund benefited from an overweight to higher-beta (more volatile) and shorter-dated issues within the technology sector, including some below-investment-grade bonds. Holdings included Equinix Inc., a data center operator, and Fiserv Inc., an e-commerce systems provider.
4
At the end of the fiscal year, approximately 2% of the Fund was invested in high yield credits, down from a peak exposure of about 4% earlier in the period. The remainder of the Fund was invested in investment grade securities.
5
Portfolio management reviews
Delaware Ivy Crossover Credit Fund
September 30, 2022 (Unaudited)
Performance preview (for the year ended September 30, 2022)
| Delaware Ivy Crossover Credit Fund (Class I shares) | 1-year return | -20.05% | ||
| Delaware Ivy Crossover Credit Fund (Class A shares) | 1-year return | -20.27% | ||
| Bloomberg US Corporate Bond Index (benchmark) | 1-year return | -18.53% |
Past performance does not guarantee future results.
For complete, annualized performance for Delaware Ivy Crossover Credit Fund, please see the table on page 30. Class I shares are not subject to a sales charge and are offered for sale exclusively to certain eligible investors. In addition, Class I shares pay no distribution and service fee. The performance of Class A shares excludes the applicable sales charge. The performance of both Class I shares and Class A shares reflects the reinvestment of all distributions. Please see page 31 for a description of the index. Index performance returns do not reflect any management fees, transaction costs, or expenses. Indices are unmanaged and one cannot invest directly in an index
Investment objective
The Fund seeks to provide total return through a combination of high current income and capital appreciation.
On September 13, 2021, the Board of Trustees (Board) of the Ivy Funds approved the appointment of the portfolio manager team of Michael G. Wildstein, Wayne A. Anglace, and Kashif Ishaq of Delaware Management Company (DMC) as new Fund portfolio managers. In connection with this change, the Board approved applicable revisions to the Fund’s investment strategies and benchmark. All changes took effect on or about November 15, 2021. The Fund performance discussed in this commentary pertains to the measurement period of November 15, 2021 to September 30, 2022.
Market review
The first few months of the Funds’ fiscal year ended September 30, 2022 – November 15 through December 31, 2021 – can best be described as calm, with little movement in rates. Although the overall economic environment was slowing after the superheated recovery that characterized the latter half of the previous fiscal period, economic fundamentals were still sound. The one concern that many investors shared was inflation.
However, as the fiscal year began, it became apparent to all that inflation had shifted from being real but transitory to becoming severe and sticky, owing to a combination of labor shortages, low unemployment, high consumer demand, and supply chain shortages.
As did many investors, we foresaw that the Fed would react by raising rates. What we did not anticipate was just how fast, steep, and tenacious those increases would be. Many investors expected that rates would rise gradually and were surprised by the Fed’s pace of hikes that began with a 0.25-percentage-point increase in mid-March. This was followed by a 0.50 percentage-point hike in early May and increases of 0.75 percentage points in June, July, and September. That said, we believe the Fed appears to have made the right call. Though the Fed was initially constrained by the need to reduce its balance sheet, by the time it acted, a more aggressive approach seemed necessary.
The Russia-Ukraine war and China’s economic lockdowns to prevent the spread of COVID-19 also surprised investors. Both caused severe disruptions of the global supply chain, putting significant pressure on inflation. The world learned an expensive lesson on just how important Ukraine is to the global supply of agricultural and energy products. While less surprising, the disruption in the supply of Russian energy was also painful, particularly to European economies that relied on cheap Russian natural gas. The problems in China were unexpected as the spread of the virus began to increase despite the onset of warmer weather. Rather than take a more moderate approach to managing the virus as many observers had predicted, China reacted with a broad swath of shutdowns that sharply curtailed industrial output.
All three events – the Fed’s aggressive response to inflation, the Russia-Ukraine war, and China’s zero-COVID-19 policy – had a dramatic effect on bond markets in the latter half of the Fund’s fiscal year. Driven primarily by rates and inflation, the first nine months of 2022 was the corporate bond market’s worst opening nine months of any calendar year on record. This was attributable mainly to duration, a measure of a portfolio’s sensitivity to higher interest rates. The longer the duration of a portfolio, the more sensitive it is to higher rates.
As 2022 progressed, we saw significant rate volatility. When the Fed began raising rates aggressively, and investors began talking of an imminent recession, spreads reacted negatively and began to widen. The 10-year Treasury yield rose from 1.51% on December 31, 2021 to 3.83% at the end of September 2022, an increase of 232 basis points (or 2.32 percentage points), which sharply stung long-duration credits. While spreads in the investment grade market increased only about 67 basis points, the combination of rising rates and widening spreads was both unusual and painful to investors.
Looking at the relative performance of investment grade versus high yield securities, duration was the key differentiator. High yield performed much better than investment grade, with most of the damage in the investment grade market resulting more from duration than from widening spreads. Because high yield tends to be a shorter-duration asset class, it held up better. Given the perception
6
that the corporate finance world is in good shape, with solid credit metrics and profit margins, investment grade credits tend to be longer duration. The result was an 18.53% decline for investment grade bonds, as measured by the Bloomberg US Corporate Bond Index, for the fiscal year. High yield bonds, as measured by the Bloomberg US Corporate High-Yield Index, declined 14.14%, about three quarters of investment grade’s loss.
Issuance in 2021 was very strong, the second highest annual total behind only the record pace set in 2020. While tapering off somewhat in 2022, it remained stronger than we would have expected. On September 30, 2022, year-to-date issuance was running about 16% below the previous year’s torrid pace. With rate hikes looming, however, many companies rushed to obtain financing before rates could rise even higher. So even though issuance was down, it was generally higher than anticipated. Some sectors, notably banking, unexpectedly flooded the market with new issuance.
As difficult as 2022 was, there was some good news for bond investors. Throughout the Fund’s fiscal year, corporate profitability was never higher, with record-setting margins and healthy cash flows. From a fundamental standpoint, the corporate bond market was extremely healthy. Companies are entering this uncertain macro environment with strong balance sheets and liquidity. However, management guidance issued as part of second-quarter earnings reports pointed toward the beginning of a more challenged environment driven by inflationary cost pressures, further supply chain constraints, and rising interest rates. We expect credit fundamentals to weaken over the next several quarters with the highest risks in industries most exposed to consumer demand and interest rates. The ultimate impact on balance sheets will depend on the extent of earnings deceleration.
Within the Fund
For the fiscal year ended September 30, 2022, Delaware Ivy Crossover Credit Fund underperformed its benchmark, the Bloomberg US Corporate Bond Index. The Fund’s Class I shares returned -20.05%. The Fund’s Class A shares returned -20.27% at net asset value and -23.84% at maximum offer price. These figures reflect all distributions reinvested. During the same period, the benchmark returned 18.53%. For complete, annualized performance of Delaware Ivy Crossover Credit Fund, please see the table on page 30.
Duration was the chief factor in the underperformance of the Delaware Ivy Crossover Credit Fund. Given the overweight to BBB spread duration of the Fund’s holdings, higher interest rates drove the price of credits held in the portfolio sharply lower. The Fund benefited from out-of-benchmark investments in high yield securities, which generally outperformed their investment grade counterparts for the fiscal year by virtue of their lower-duration nature. The Delaware Ivy Crossover Credit Fund can invest up to 35% of its assets in high yield securities. The portfolio allocation varied throughout the fiscal year, as described later.
The fiscal year was an unusual period for the Fund, in our view. Although we believe most of the relative performance was attributable to rising rates and higher duration, we acknowledge credit spreads widened meaningfully as well. It is rare to see rates rise and spreads widen at the same time. Usually spreads increase in the face of a potential recession and consequently weigh on issuers’ earnings. But this year, rates and spreads moved in the same direction, resulting in the corporate bond market’s worst start to a calendar year in its history.
We knew that valuations were rich coming into 2022 yet at the same time, credit fundamentals and credit metrics were still extremely strong, and we wanted the Fund to own bonds that exhibited higher yields or had higher spreads than the overall benchmark. We still believed there was a long runway before the Fed would become aggressive in raising rates. And of course, we did not anticipate the Russia-Ukraine war. So, we began 2022 with the assumption that the best way to add performance in this environment was through higher yield, given that we did not expect further price appreciation or spread compression, either of which would also have contributed to performance, if available. We purchased credits that had higher spreads and higher yields, believing the strong economic backdrop would afford us some time for the Fund to benefit from this strategy.
When sentiment turned, however, the Fund’s positions were affected more than those in the benchmark, which contained higher-quality credits with less income, less spread, and less yield, the types of credits that we would not have gravitated toward unless the economy was signaling problems ahead. We received no such signals in January and February. Our attempt to achieve a higher yield and carry higher spreads than the benchmark was the source of a large part of the Fund’s under performance.
On a more granular level, the banking sector detracted the most from the Fund’s performance. Ironically, the credit quality in the banking industry has generally been pristine, much stronger today than it was during the recession of 2008-2009. The Fund underperformed due to a combination of security selection and underweight to the sector. In an effort to add yield, we invested in subordinated instruments while maintaining the Fund’s underweight to the front end of the curve where yields were less attractive, under the assumption that fundamentals were strong, and valuations (in our view) were attractive relative to other sectors. As the year progressed, however, the impact of higher rates proved detrimental for such a strategy. Additionally, given the sector’s shorter duration profile, it outperformed the broader index (Bloomberg US Corporate Bond Index) and as a result, the Fund’s underweight also partially
7
Portfolio management reviews
Delaware Ivy Crossover Credit Fund
contributed to the underperformance. Banking credits that the Fund owned included Goldman Sachs and Bank of America Corp.
Aside from banking, other areas within financials detracted from performance for the fiscal year, primarily the brokerage/asset manager/exchange subsector. Although the category outperformed over the period, the Fund’s overweight to long-end spread duration in a quest to add yield proved detrimental once rates began surging. Real estate investment trusts (REITs) also lagged mainly due to rate volatility. Fund holdings in the sector included private equity group KKR Holdings and asset management company Brookfield Asset Management.
Among contributors to performance during the period, security selection within the technology sector benefited performance. The Fund’s overweight to higher-beta (more volatile) and shorter-dated issues, including some below-investment-grade bonds, contributed to performance amid the rising rate backdrop. Microchip Technology Inc., a semiconductor manufacturer, and Seagate Technology Holdings PLC, a hard disk drive manufacturer, were among the Fund’s holdings in the sector.
The Fund likewise benefited from both security selection and an underweight to consumer non-cyclicals as the sector underperformed given its longer duration profile and the surge in rates over the period. The Fund’s underweight to longer-dated issues, especially in the healthcare and food/beverage subsectors, given the lack of relative value in this defensive sector, benefited performance over the period. HCA Healthcare Inc., a hospital operator, and The Kraft Heinz Co., a food and beverage company, were among the Fund’s holdings in the sector.
In addition, the Fund’s out-of-benchmark allocation to risk-free assets, including Treasurys, and short-duration sectors, such as asset-backed securities (auto loans), contributed to performance during the fiscal year.
Once higher rates and wider spreads had done material damage to the asset class, we sought to increase the Fund’s credit quality. With prices at historic lows, we began buying lower-priced bonds. The asset class experienced some of the lowest US dollar prices on securities in the past 30 to 40 years. Consequently, the decision to buy bonds of high-quality issuers at historically low prices appears to us to be an attractive opportunity.
At fiscal year end, the Fund was positioned with 98% of its assets in investment grade securities and the balance in high yield. Earlier in the fiscal year, the Fund had as much as 12% in high yield. We also reduced the Fund’s BBB-rated allocation within investment grade, having moved up in quality within the asset class.
8
Portfolio management reviews
Delaware Ivy Emerging Markets Local Currency Debt Fund
September 30, 2022 (Unaudited)
Performance preview (for the year ended September 30, 2022)
| Delaware Ivy Emerging Markets Local Currency Debt Fund (Class I shares) | 1-year return | -21.86% | ||
| Delaware Ivy Emerging Markets Local Currency Debt Fund (Class A shares) | 1-year return | -22.18% | ||
| J.P. Morgan Government Bond Index-Emerging Markets (GBI-EM) Global Diversified Index (benchmark) | 1-year return | -20.63% |
Past performance does not guarantee future results.
For complete, annualized performance for Delaware Ivy Emerging Markets Local Currency Debt Fund, please see the table on page 33. Class I shares are not subject to a sales charge and are offered for sale exclusively to certain eligible investors. In addition, Class I shares pay no distribution and service fee. The performance of Class A shares excludes the applicable sales charge. The performance of both Class I shares and Class A shares reflects the reinvestment of all distributions. Please see page 35 for a description of the index. Index performance returns do not reflect any management fees, transaction costs, or expenses. Indices are unmanaged and one cannot invest directly in an index.
Investment objective
The Fund seeks to provide total return through a combination of current income and capital appreciation.
On September 13, 2021, the Board of Trustees (Board) of the Ivy Funds approved the Fund name change to “Delaware Ivy Emerging Markets Local Currency Debt Fund” and the appointment of the portfolio manager team of Alex Kozhemiakin and Mansur Z. Rasul of DMC as new Fund portfolio managers. In addition, the Board approved appointing Macquarie Investment Management Austria Kapitalanlage AG, Macquarie Investment Management Europe Limited, and Macquarie Investment Management Global Limited to provide discretionary investment management services in a sub-advisory capacity. The Board also approved the termination of the Fund’s current sub-advisor. All changes took effect on November 15, 2021. The Fund performance discussed in this commentary pertains to the measurement period of November 15, 2021 to September 30, 2022.
Market review
The US dollar, already strong when the fiscal period began, continued to gain on other global currencies throughout the first nine months of 2022. That created a significant headwind for all non-US-dollar-denominated assets, especially those issued by emerging market countries.
The US dollar’s notable strength against the euro – advancing above parity for the first time in 20 years – largely resulted from the impact of the Russia-Ukraine war. The euro and many other emerging market currencies came under pressure as Russian energy exports were sharply curtailed because of the conflict.
Higher interest rates also benefited the US dollar. The US Federal Reserve hiked rates five times in 2022, an aggressive effort to tamp down inflation. That led to higher yields on US fixed-income securities, attracting significant investment in the US dollar and US government bonds, which offered a risk-free return in a turbulent economic environment. Although other countries raised rates as well, investors turned to the US for safe-haven investments.
The impact of the Russia-Ukraine war, higher energy costs, inflation, and the strong US dollar was greatest in European emerging countries, namely Poland, Hungary, and the Czech Republic.
Within the Fund
For the fiscal year ending September 30, 2022, Delaware Ivy Emerging Markets Local Currency Debt Fund posted negative performance and underperformed its benchmark, the J.P. Morgan GBI-EM Global Diversified Index, which also declined. The Fund’s Class I shares declined 21.86%. The Fund’s Class A shares declined 22.18% at net asset value and 25.65% at maximum offer price. Both figures reflect all distributions reinvested. For the same period, the benchmark declined 20.63%. For complete, annualized performance of Delaware Ivy Emerging Markets Local Currency Debt Fund, please see the table on page 33.
The Fund’s performance was affected by its actively managed currency exposures and duration (the Fund’s sensitivity to interest rate changes). A critical development for the relative performance of the Fund’s holdings during the period was the impact of widespread sanctions imposed on Russia in response to its invasion of Ukraine. Before the Russia-Ukraine War began, the Fund swapped its Russian local currency bonds into bonds issued by supranationals (institutions involving the governments of two or more countries) that were not sanctioned. That timely move allowed the Fund to exit Russia before any assets were frozen and put the Fund in a favorable position relative to its peers that still held ruble-denominated bonds.
Strategic decisions to manage duration were also critical to Fund performance. The Fund benefited throughout the period from its short duration relative to the benchmark. This was particularly significant in Poland, which felt the full economic effect of the Russia-Ukraine conflict, given its proximity to the war. The Fund’s relatively short-duration position in Poland significantly contributed to returns. Although we didn’t own bonds in Poland, we did have a significant currency position there with a duration of zero versus the benchmark’s three-to-four-year duration.
9
Portfolio management reviews
Delaware Ivy Emerging Markets Local Currency Debt Fund
The Fund’s large underweight allocation to China’s currency contributed to Fund performance as did the Fund’s allocation to Brazil. Latin America overall had minimal exposure to the Russia-Ukraine War and the ensuing energy crisis. As a commodity exporter, Brazil, in particular, benefited from rising commodities prices, which made the Fund’s overweight to Brazil beneficial to relative performance.
On the negative side, Fund performance was hurt by its overweight allocations to Indonesia and Colombia, and a modest underweight to South Africa, which performed well.
For the fiscal period, we consistently had less duration than the benchmark in all three emerging market regions: Central and Eastern Europe, Middle East, and Africa (CEMEA), Latin America, and Asia.
During the period, CEMEA was the weakest-performing region because of its proximity to the Russia-Ukraine war and its vulnerability to or reliance on Russian natural gas exports. The energy and inflation crisis that gripped the world was felt most intensely within Europe. In contrast, Asia was the least-affected region. In Latin America, we employed more bottom-up analysis, paying particular attention to country-specific political issues.
As for overall country weights, it was beneficial to be underweight CEMEA, overweight Asia, and selective in Latin America, trading around each country’s election cycle in the region.
At the end of the fiscal period, the Fund was positioned for additional rate hikes, given that the Fed has indicated it will continue raising rates until inflation abates. That will be a pivotal point, after which we would expect duration to decline as interest rates recede. When that happens, emerging market currencies may likely benefit, including the particularly hard-hit emerging market countries within CEMEA.
Because emerging market central banks began to raise interest rates earlier and more aggressively than the Fed, these countries have substantial room to cut interest rates once the economic environment improves. We expect that would have a dramatic impact on duration and that the Fund’s overall performance would benefit from a weaker US dollar if that occurs during the course of 2023. Although the global supply chain is clearly short of crystal balls, investors nonetheless widely anticipate that happening sometime in 2023.
A note about derivatives:
The Fund used foreign exchange forwards for active position-taking and as a hedge to reduce exposure to a currency. Overall, the use of derivatives was beneficial to performance.
10
Portfolio management reviews
Delaware Ivy Government Securities Fund
September 30, 2022 (Unaudited)
Performance preview (for the year ended September 30, 2022)
| Delaware Ivy Government Securities Fund (Class I shares) | 1-year return | -13.45% | ||
| Delaware Ivy Government Securities Fund (Class A shares) | 1-year return | -13.67% | ||
| Bloomberg US Government/Mortgage-Backed Securities Index (benchmark) | 1-year return | -13.28% |
Past performance does not guarantee future results.
For complete, annualized performance for Delaware Ivy Government Securities Fund, please see the table on page 37. Class I shares are not subject to a sales charge and are offered for sale exclusively to certain eligible investors. In addition, Class I shares pay no distribution and service fee. The performance of Class A shares excludes the applicable sales charge. The performance of both Class I shares and Class A shares reflects the reinvestment of all distributions. Please see page 39 for a description of the index. Index performance returns do not reflect any management fees, transaction costs, or expenses. Indices are unmanaged and one cannot invest directly in an index
Investment objective
The Fund seeks to provide current income consistent with preservation of capital.
On September 13, 2021, the Board of Trustees (Board) of the Ivy Funds approved the appointment of the portfolio manager team of Brian M. Scotto and Eric Frei of Delaware Management Company (DMC) as new Fund portfolio managers. In connection with this change, the Board approved applicable revisions to the Fund’s investment strategies. All changes took effect on or about November 15, 2021. The Fund performance discussed in this commentary pertains to the measurement period of November 15, 2021 to September 30, 2022.
Market review
The fiscal year ended September 30, 2022, was a time of significant change in the financial markets. The fixed-income markets began the period contemplating when the US Federal Reserve would begin tapering its purchases of Treasury and mortgage-backed securities. Once the tapering schedule was released, the markets could focus on when the Fed would begin reducing the balance sheet in what is known as quantitative tightening, and the growing likelihood that the Fed would also begin to increase the federal funds rate. At the time, it was understood that the combination of these events would increase volatility and reduce liquidity in the financial markets.
Geopolitical events added to the uncertainty as the invasion of Ukraine increased volatility and ignited fears of higher inflation. By the middle of the fiscal year, it was no longer a question of whether the Fed might hike. The situation turned to how high would the Fed need to hike to calm inflation. Federal funds futures went from pricing one 25-basis-point (0.25-percentage-point) rate increase to pricing in six or seven rate increases. The Fed began with a 25-basis-point increase in March, but as inflation continued to be stronger than anticipated, the rate increases accelerated, with 50 basis points in May, and 75 basis points in June, July, and September.
Volatility remained high at period end as uncertainty regarding the Fed’s terminal rate (peak rate after its series of rate hikes) was paramount in financial markets. As inflation has recently begun to slow, albeit at a slower rate than hoped, we are reminded that the effects of rate increases and quantitative tightening are lagged, and we will not know if the Fed has done enough or too much until many months later.
Within the Fund
For the fiscal year ended September 30, 2022, Delaware Ivy Government Securities Fund underperformed its benchmark, the Bloomberg US Government/Mortgage-Backed Securities Index, which also declined. The Fund’s Class I shares returned -13.45%. The Fund’s Class A shares returned -13.67% at net asset value and -17.49% at maximum offer price. These figures reflect all distributions reinvested. During the same period, the benchmark returned -13.28%. For complete, annualized performance of Delaware Ivy Government Securities Fund, please see the table on page 37.
Due to the recent uptick in inflation and volatility, the Fund’s positioning changed quite a bit during the year. We reduced the Fund’s overall duration to be lower than the benchmark. Duration was reduced in all three of the main sectors where the Fund invests, specifically Treasurys, mortgage-backed securities (MBS), and government agencies. Reducing duration added to the Fund’s performance versus its benchmark.
Treasury holdings were repositioned to significantly reduce exposure to the 20-year Treasury and reflect the potential for curve-flattening. We also sold exposure to out-of-benchmark government agencies, which detracted from performance along with 20-year Treasurys. Repositioning for additional curve flattening and reducing overall duration added to the Fund’s performance.
The mortgage-backed holdings were also repositioned during the fiscal year to better reflect the potential for MBS to widen versus Treasurys as the Fed increased short-term interest rates and reduced the balance sheet. The Fund was positioned to have a sizable underweight to MBS and specifically to sell MBS securities which were not in the benchmark. The Fund’s underweight to the sector contributed significantly to performance.
11
Portfolio management reviews
Delaware Ivy Government Securities Fund
As Treasury rates continued to move higher, we began adding duration back at what we consider to be attractive levels. We reduced our underweight to overall duration as we purchased Treasurys and MBS at levels we have not seen since before the great financial crisis.
12
Portfolio management reviews
Delaware Ivy High Yield Fund
September 30, 2022 (Unaudited)
Performance preview (for the year ended September 30, 2022)
| Delaware Ivy High Yield Fund (Class I shares) | 1-year return | -15.51% | ||
| Delaware Ivy High Yield Fund (Class A shares) | 1-year return | -15.64% | ||
| ICE BofA US High Yield Constrained Index (benchmark)* | 1-year return | -14.06% | ||
| Bloomberg US Corporate High-Yield Index (benchmark) | 1-year return | -14.14% |
Past performance does not guarantee future results.
*The Fund changed its primary broad-based securities index to the ICE BofA US High Yield Constrained Index as of November 15, 2021. The Fund elected to use the new index because it more closely reflects the Fund’s investment strategies.
For complete, annualized performance for Delaware Ivy High Yield Fund, please see the table on page 40. Class I shares are not subject to a sales charge and are offered for sale exclusively to certain eligible investors. In addition, Class I shares pay no distribution and service fee. The performance of Class A shares excludes the applicable sales charge. The performance of both Class I shares and Class A shares reflects the reinvestment of all distributions. Please see page 41 for a description of the indices. Index performance returns do not reflect any management fees, transaction costs, or expenses. Indices are unmanaged and one cannot invest directly in an index.
Investment objective
The Fund seeks to provide total return through a combination of high current income and capital appreciation.
On September 13, 2021, the Board of Trustees (Board) of the Ivy Funds approved the appointment of the portfolio manager team of Adam H. Brown and John P. McCarthy of Delaware Management Company (DMC) as new Fund portfolio managers. In connection with this change, the Board approved applicable revisions to the Fund’s investment strategies and benchmark. All changes took effect on or about November 15, 2021. The Fund performance discussed in this commentary pertains to the measurement period of November 15, 2021 to September 30, 2022.
Market review
US high yield bonds, as measured by the ICE BofA US Cash Pay High Yield Index, returned -13.98% for the fiscal year.
Despite a healthy earnings environment in the opening months of the fiscal period, investors dialed back on risk amid concerns about the Omicron variant, supply-chain disruptions, inflation, and the future pace of interest rate hikes. As a result, higher quality BB-rated and B-rated bonds returned 0.72% and 0.82% in the first three months of the fiscal year, outpacing CCC-rated bonds, which returned 0.25%.
During the first quarter of 2022, the high yield market faced its first significant bout of volatility since March 2020, as high yield bonds declined 4.53%, the worst quarterly return in nearly two years. BB-rated bonds produced their second-worst quarterly returns since the recession of 2008-2009. Negative sentiment for risk assets resulted in a significant quarterly outflow of $22.3 billion in the high yield market. When all was said and done, in the first quarter 2022, BB-rated bonds returned -5.37%, CCC-rated bonds returned -3.79%, and B-rated bonds returned -3.46%.
The volatility experienced in the first quarter of 2022 escalated in the second quarter. Market headwinds driven by an extremely hawkish US Federal Reserve, persistent inflation, heightened geopolitical risks, weakening outlooks for corporate profits, and waning consumer sentiment pushed high yield down 9.92%. In a highly volatile market, investors found no safe havens as negative returns were non-discriminating. BB-, B-, and CCC-rated bonds returned -8.7%, -10.6%, and -13.6%, respectively.
Throughout the final quarter of the fiscal year, volatility continued to be the persistent theme within high yield as investors set and reset expectations for economic data and Fed policy. Although macro conditions did not change, high yield spreads were resilient during the quarter and high yield returned -0.69%. Again, market participants found no safe haven in a volatile market as BB-, B-, and CCC-rated bonds returned -0.89%, -0.59%, and -0.19%, respectively.
The Fed’s hawkish approach to reigning in inflation set the table for risk aversion within the high yield market. As volatility took its toll on corporate profits and consumer sentiment, investors are now debating the likelihood and severity of a potential recession. High yield bonds are now yielding more than 9%, while spreads have increased to more than the historical average of about 525 basis points (a basis point equals one hundredth of a percentage point). Despite these headwinds, corporate balance sheets remain healthy, debt maturity walls are manageable, and default rate outlooks are expected to remain at or below historical averages. Given this backdrop, we believe valuations have become more appropriate and a disciplined approach to adding risk is best with the understanding that short- to intermediate-term volatility will persist.
Within the Fund
For the fiscal year ended September 30, 2022, Delaware Ivy High Yield Fund posted a negative return and underperformed its benchmark, the ICE BofA US High Yield Constrained Index. The Fund’s Class I shares declined 15.51%. The Fund’s Class A shares
13
Portfolio management reviews
Delaware Ivy High Yield Fund
declined 15.64% at net asset value and 19.42% at maximum offer price. Both figures reflect all distributions reinvested. For the same period, the Fund’s benchmark declined 14.06%. For complete, annualized performance of Delaware Ivy High Yield Fund, please see the table on page 40.
The Fund benefited during the reporting period from both a relative underweight allocation and stronger security selection within the healthcare sector. Advantageous security selection also contributed to performance in the automotive, banking, and financial services sectors.
Security selection detracted from performance during the period in the industrial, energy, and leisure sectors. In the media sector, both a relative overweight allocation and poor security selection detracted from performance.
14
Portfolio management reviews
Delaware Ivy International Small Cap Fund
September 30, 2022 (Unaudited)
Performance preview (for the year ended September 30, 2022)
| Delaware Ivy International Small Cap Fund (Class I shares) | 1-year return | -36.81% | ||
| Delaware Ivy International Small Cap Fund (Class A shares) | 1-year return | -37.01% | ||
| MSCI ACWI (All Country World Index) ex USA Small Cap Index (net) (benchmark)* | 1-year return | -28.93% | ||
| MSCI EAFE (Europe, Australasia, Far East) Small Cap Index (net) (benchmark) | 1-year return | -32.06% |
Past performance does not guarantee future results.
*The Fund changed its primary broad-based securities index to the MSCI ACWI ex USA Small Cap Index as of November 15, 2021. The Fund elected to use the new index because it more closely reflects the Fund’s investment strategies.
For complete, annualized performance for Delaware Ivy International Small Cap Fund, please see the table on page 43.
Class I shares are not subject to a sales charge and are offered for sale exclusively to certain eligible investors. In addition, Class I shares pay no distribution and service fee. The performance of Class A shares excludes the applicable sales charge. The performance of both Class I shares and Class A shares reflects the reinvestment of all distributions. Please see page 45 for a description of the indices. Index performance returns do not reflect any management fees, transaction costs, or expenses. Indices are unmanaged and one cannot invest directly in an index.
Investment objective
The Fund seeks to provide capital growth and appreciation.
On September 13, 2021, the Board of Trustees (Board) of the Ivy Funds approved the appointment of the portfolio manager team of Joseph Devine, Stephan Maikkula, CFA, CMT, and Gabriel Wallach of Delaware Management Company (DMC) as new Fund portfolio managers. In addition, the Board approved appointing Macquarie Funds Management Hong Kong Limited and Macquarie Investment Management Global Limited to provide discretionary investment management services in a sub-advisory capacity. The Board also approved the termination of the Fund’s current sub-advisor. In connection with these changes, the Board approved applicable revisions to the Fund’s investment strategies and benchmark. All changes took effect on or about November 15, 2021. The Fund performance discussed in this commentary pertains to the measurement period of November 15, 2021 to September 30, 2022.
Market review
Although it was not immediately apparent, as 2021 drew to a close, global economies and markets were nearing the end of the post-pandemic euphoria that characterized the year. The initial pandemic-induced market selloff in March 2020 and subsequent economic lockdowns led to extraordinary and much-needed counter measures, including extremely loose fiscal and monetary policy. But as the initial shock abated, central banks assessed overheated asset prices, tight labor markets, supply-chain disruptions, and inflation.
While inflation was initially dismissed as transitory, it wasn’t long before central banks, investors, and consumers viewed inflation as a significant, possibly long-term problem. Bucking the commonly held view that governance and policy standards are generally higher in developed markets, emerging market central banks were first to react, tightening monetary policy to tamp down inflation. With only some exceptions, notably Turkey, emerging market countries were quicker to initiate rate hikes than developed market countries. That said, the US Federal Reserve and the European Central Bank were not far behind.
The Fed began raising interest rates in mid-March 2022 with a 0.25 percentage-point increase. That was followed in early May with a 0.50 percentage-point increase and then three 0.75 increases in June, July, and September. The Fed’s unexpectedly aggressive response took the wind out of the sails of all risk assets.
In addition to the tragic loss of life and property, the outbreak of the Russia-Ukraine war in late February had a significant negative effect on global markets. The conflict led to immediate shortages and higher prices of commodities, adding to inflation and supply-chain problems. In particular, the war led to severe food shortages and higher prices in food-importing countries throughout the Middle East, Asia, and Africa. Energy supplies were also curtailed, leading to higher prices and shortages, most notably in Europe.
Equity markets worldwide traded sharply lower during the final three months of the Fund’s fiscal year ended September 30, 2022, as inflationary pressures persisted and central banks grew increasingly resolute in their determination to bring consumer prices under control. Global bond markets sold off as well, with US and eurozone rates rising sharply and projected to go higher by year end. Reflecting the relative strength of the US economy and the effects of the Russia-Ukraine war, equity market weakness was concentrated in Europe and international small caps.
Meanwhile, the US dollar soared against virtually all major currencies, driven higher by interest rate differentials, a healthier US economy, and the US dollar’s status as a safe-haven asset in times of economic and geopolitical stress. As the period ended, the Bank of England intervened in the gilt (UK government bonds) market after
15
Portfolio management reviews
Delaware Ivy International Small Cap Fund
an unfunded fiscal stimulus package proposed by new Prime Minister Liz Truss roiled faith in British government finances.
The following factors also affected global markets:
● The British pound fell to an all-time low against the US dollar
● Eurozone inflation hit a record 10% annualized rate in September
● The Bank of Japan emerged as an outlier in the global assault on inflation.
Within the Fund
For the fiscal year ended September 30, 2022, Delaware Ivy International Small Cap Fund posted a negative return and underperformed its benchmark, the MSCI ACWI ex-USA Small Cap Index (net), which also posted a negative return. The Fund’s Class I shares were down 36.81%. The Fund’s Class A shares lost 37.01% at net asset value and returned -40.62% at maximum offer price. These figures reflect all distributions reinvested. During the same period, the Fund’s benchmark fell 28.93%. For complete, annualized performance of Delaware Ivy International Small Cap Fund, please see the table on page 43.
Our individual stock-by-stock selection process drives the Fund’s positioning. As a result, sectors that detracted the most from performance during the fiscal year were industrials, real estate, and communication services. Countries that detracted the most included the Netherlands, Japan, and the UK. These largely reflected specific holdings that performed poorly relative to the overall market.
Vivoryon Therapeutics NV, a Dutch biotechnology company, underperformed for the period. The company focuses on Alzheimer’s disease and oncology. The firm’s share price declined along with other growth companies during the first two quarters of 2022 as global yields increased and investors rotated into more value-oriented stocks.
Future PLC is a specialist media publisher. While the UK-based firm’s activities are predominantly business-to-consumer online and print magazine publishing, it also includes events, video production, and email marketing. The group has more than 240 brands across 18 specialist verticals with market-leading positions in 23 areas. While Future reported continued trading momentum with digital advertising growth during the period, the shares suffered as growth companies underperformed across regions.
ASM International NV develops and manufactures machines used to produce semiconductors. The Dutch company underperformed the broader market despite seeing its earnings estimates increase over the period. The shares declined sharply in both the first and second calendar quarters of 2022, as growth stocks sold off globally.
Sansan Inc. is a Japanese company that provides mobile application software solutions, focusing on business-card management services. After strong 2021 performance, the company’s share price underperformed during the period. Sansan’s earnings estimates declined on concern about a deceleration in revenue growth on its core platform. COVID-19 headwinds also adversely affected its performance.
Sectors that contributed to the Fund’s relative performance included energy, consumer staples, and materials. Countries that contributed to relative performance included Canada, Sweden, and France, driven by specific stocks that performed well.
Varun Beverages Ltd. is one of the largest franchisees of PepsiCo in the world. The company manufactures and distributes PepsiCo’s beverages in India as well as select international markets. Varun Beverages outperformed as it benefited from strong demand across its markets with in-home demand continuing and out of home demand returning. Price hikes and improved product mix partially offset higher input costs. The company continued to expand its geographic presence by enhancing its distribution network, which currently reaches more than 3 million outlets.
K+S AG is a leading global producer of potash fertilizer, and a leading distributor of agricultural chemicals. The share price outperformed for the period on the back of strong financial results. The agriculture segment remained the stand-out performer, as K+S continued to make the most of commodity prices and delivered a strong increase in average sales price. The upgrades over the last year have primarily been due to stronger pricing in the agricultural segment, which remained supply constrained. Constraints on Russian and Ukrainian agricultural exports during the period also boosted prices for soft commodities.
Enerplus Corp. is a Canadian-based independent oil and gas exploration and production company. Its operational focus consists of Bakken oil in the Williston Basin (North Dakota/Montana), shale gas in the Marcellus (Pennsylvania), and several water/polymer floods in western Canada (Alberta/British Columbia/Saskatchewan). The shares outperformed during the period as the company continued to successfully grow its production, both organically and through acquisitions, and benefited from the robust upward trajectory in commodity prices since late 2020.
Vermilion Energy Inc. is Canadian-based independent oil and gas exploration and production company, with operations in North America, Europe, and Australia. Its diverse international exposure makes it unique among its Canadian peers, and as a result, Vermillion has benefited from higher commodity prices, better cash flow visibility, and accretive merger and acquisition opportunities. The company outperformed on the back of strong production and higher pricing.
16
Uncertainty surrounding the outlook for inflation, central bank activity, and global economic growth continues. Volatility across asset classes remains pronounced; sharp moves in various currencies and yields globally has contributed to negative investor sentiment. Regardless of the economic environment, however, we adhere to our investment philosophy and process and continue to identify investment candidates around the globe.
As mentioned, the Fund’s positioning in terms of country and sector weights is driven primarily by bottom-up stock selection opportunities. As a result, at the end of the fiscal period, relative to the MSCI ACWI ex USA Small Cap Index, we were overweight the industrials and financials sectors. From a country perspective, our largest overweight positions were in Japan and Canada. Conversely, our largest sector underweights were materials and real estate while our largest relative underweight countries were Australia and Taiwan.
The Fund may use derivatives or structured products in certain limited situations. For example, the Fund may use equity-linked notes to gain local market access in situations where direct market participation is limited. Derivatives and structured products were not used by the Fund during the fiscal period. The Fund used foreign currency exchange contracts to facilitate the purchase and sale of equities traded on international exchanges. The effect of these contracts on performance was immaterial.
17
Portfolio management reviews
Delaware Ivy Multi-Asset Income Fund
September 30, 2022 (Unaudited)
Performance preview (for the year ended September 30, 2022)
| Delaware Ivy Multi-Asset Income Fund (Class I shares) | 1-year return | -16.64% | ||
| Delaware Ivy Multi-Asset Income Fund (Class A shares) | 1-year return | -16.99% | ||
| 50% MSCI ACWI (All Country World Index) Index (Net) + 50% Ice BofA US High Yield Index (benchmark) | 1-year return | -20.61% | ||
| MSCI ACWI Index (benchmark) (Net) | 1-year return | -20.66% | ||
| MSCI ACWI Index (benchmark) (Gross) | 1-year return | -20.29% | ||
| ICE BofA US High Yield Index (benchmark) | 1-year return | -14.06% | ||
| 50% FTSE All-World High Dividend Yield Index + 50% ICE BofA US High Yield Index (previous benchmark) | 1-year return | -13.98% | ||
| FTSE All-World High Dividend Yield Index (previous benchmark) | 1-year return | -13.77% |
Past performance does not guarantee future results.
*The Fund changed its primary broad-based securities index to the 50% MSCI ACWI (All Country World Index) + 50% ICE BofA US High Yield Index as of November 15, 2021. The Fund elected to use the new index because it more closely reflects the Fund’s investment strategies.
For complete, annualized performance for Delaware Ivy Multi-Asset Income Fund, please see the table on page 46. Class I shares are not subject to a sales charge and are offered for sale exclusively to certain eligible investors. In addition, Class I shares pay no distribution and service fee. The performance of Class A shares excludes the applicable sales charge. The performance of both Class I shares and Class A shares reflects the reinvestment of all distributions. Please see page 48 for a description of the indices. Index performance returns do not reflect any management fees, transaction costs, or expenses. Indices are unmanaged and one cannot invest directly in an index.
Investment objective
The Fund seeks to provide a high level of current income. Capital appreciation is a secondary objective.
On September 13, 2021, the Board of Trustees (Board) of the Ivy Funds approved the Fund name change to “Delaware Ivy Multi-Asset Income Fund” (formerly, Delaware Ivy Apollo Multi-Asset Income Fund, and before that, Ivy Apollo Multi-Asset Income Fund) and the appointment of the Macquarie Investment Management Austria Kapitalanlage AG (MIMAK) as a sub-advisor. The Board approved the portfolio manager team of Stefan Löwenthal and Jürgen Wurzer of MIMAK and Aaron D. Young of Delaware Management Company (DMC) as new Fund portfolio managers. In addition, the Board approved appointing Macquarie Investment Management Europe Limited, Macquarie Funds Management Hong Kong Limited, and Macquarie Investment Management Global Limited to provide discretionary investment management services in a sub-advisory capacity. The Board also approved the termination of the Fund’s current sub-advisors. In connection with these changes, the Board approved applicable revisions to the Fund’s investment strategies and benchmarks. All changes took effect on or about November 15, 2021. The Fund performance discussed in this commentary pertains to the measurement period of November 15, 2021 to September 30, 2022.
Market review
The fiscal year began as equity markets continued to advance with some US stock indices reaching new highs. Globally, inflation was increasing to long-term highs as well. Central banks responded by tightening monetary policy. The US Federal Reserve sharply stepped on the brakes, scaling back its bond purchases and hinting at several interest rate hikes in 2022. Bond yields were relatively stable in the fourth quarter of 2021, despite continuous increases in short-term US yields. The US dollar appreciated against major currencies. Oil prices also rose further, while gas markets eased somewhat at the end of the year following dramatic increases in Europe.
In January, persistently high inflation led to frequent and serious discussions at the Fed about implementing interest rate hikes. Investors reacted by pushing bond yields higher and equity prices lower. Financial markets also reacted negatively as Russia built up its troops along the Ukraine border. Russia’s invasion in February prompted unprecedented sanctions – including a freeze on Russian central bank reserves, an oil embargo, and a trading ban on Russian financial stocks – and equities sold off globally while commodity prices soared. Government bonds were briefly in demand as a short-term safe haven, but quickly resumed their downward trend.
Tighter central bank monetary policy characterized the rest of the fiscal year with the Fed leading the way. From March through September, it raised the federal funds rate five times, including three 75 basis point (a basis point equals one hundredth of a percentage point) increases at the June, July, and September meetings of the Federal Open Market Committee (FOMC). As a result, the target short-term rate rose from a range of 0% to 0.25% in January to 3.0% to 3.25% by fiscal year end, an aggressive attempt to bring inflation under control.
Other central banks, including the Bank of England and the European Central Bank, also took repeated steps to tighten monetary policy in
18
their jurisdictions. Meanwhile, equities and bonds posted historically poor performance throughout the period in the face of brutal headwinds and unrelenting negative news. This included soaring inflation, consequent aggressive monetary tightening, ongoing supply-chain problems, China’s zero-COVID-19 lockdowns, the Russia-Ukraine war, and soaring energy prices. The higher prices and disruptions in supply of oil and gas hit Europe hardest as Russia cut off gas to several European Union (EU) countries. In turn, the Group of Seven (G-7) and later the EU implemented an oil embargo.
Among major central banks, only the Bank of Japan maintained ultra-loose monetary policy as it attempted to keep Japanese yields stable by buying bonds. That led to a weakening of the Japanese yen, however, which fell to a 20-year low.
Markets rallied briefly in July, when a near-term turnaround in inflation seemed possible. Despite investors’ concern about economic growth slowing, stocks appreciated along with other risk asset classes, including corporate, high-yield, convertible and emerging market bonds. A key reason was the decline in yields on US and eurozone government bonds, leading to significant price gains. However, the tide turned again in mid-August and the bear market returned for most asset classes as hope for a slowdown of inflation was dashed. Central banks reaffirmed their intention to continue aggressively tightening monetary policy. Recession fears mounted and the energy crisis worsened as Russia announced it was shutting down a gas pipeline for maintenance. German yields rose sharply, and the euro fell below parity with the US dollar for the first time in 20 years.
The picture worsened further in September, with heavy losses among virtually all asset classes. Energy prices continued to fall while the European inflation rate reached double-digits and central banks planned further interest rate hikes. As the period ended, the new UK government’s announcement of massive tax cuts caused massive distortions in bonds and currency. Meanwhile, the formal annexation of four Ukrainian regions by Russia caused additional concern.
Source: Bloomberg, unless otherwise noted.
Within the Fund
For the fiscal year ended September 30, 2022, Delaware Ivy Multi-Asset Income Fund posted a negative return that outperformed its blended benchmark, the 50% MSCI ACWI NR / 50% ICE BofA US High Yield TR Index. The Fund’s Class I shares declined 16.64%. The Fund’s Class A shares declined 16.99% at net asset value and 21.78% at maximum offer price. Both figures reflect all distributions reinvested. For the same period the Fund’s benchmark declined 20.61%. For complete annualized performance of the Delaware Ivy Multi-Asset Income Fund, please see the table on page 46.
Within the equity space, the Fund’s allocation to global natural resources and global listed infrastructure contributed to relative performance, while the allocation to real estate equities detracted. Stock selection from equities also had a positive effect. While high yield fixed income in the portfolio virtually performed in line with the benchmark, there was a positive selection effect from investments in global multi-sector fixed income securities.
During the fiscal year, the allocation to equities ranged from about 50% to 57%. The Fund ended the year with approximately 51% of its portfolio allocated to equities. Within that allocation, investments were partially shifted from broad global equities to global infrastructure and natural resources equities over the course of the period. The allocation to high yield corporate bonds increased to about 36% during the fiscal year while multi sector fixed-income assets were nearly halved to about 10%.
19
Portfolio management reviews
Delaware Ivy Strategic Income Fund
September 30, 2022 (Unaudited)
Performance preview (for the year ended September 30, 2022)
| Delaware Ivy Strategic Income Fund (Class I shares) | 1-year return | -13.36% | ||
| Delaware Ivy Strategic Income Fund (Class A shares) | 1-year return | -13.81% | ||
| Bloomberg US Aggregate Index (benchmark)* | 1-year return | -14.60% | ||
| 50% Bloomberg US Universal Index + 50% ICE BofA US High Yield Index (previous benchmark) | 1-year return | -14.49% | ||
| Bloomberg US Universal Index (previous benchmark) | 1-year return | -14.92% | ||
| ICE BofA US High Yield Index (previous benchmark) | 1-year return | -14.06% |
Past performance does not guarantee future results.
*The Fund changed its primary broad-based securities index to the Bloomberg US Aggregate Index as of November 15, 2021. The Fund elected to use the new index because it more closely reflects the Fund’s investment strategies.
For complete, annualized performance for Delaware Ivy Strategic Income Fund, please see the table on page 50.
Class I shares are not subject to a sales charge and are offered for sale exclusively to certain eligible investors. In addition, Class I shares pay no distribution and service fee. The performance of Class A shares excludes the applicable sales charge. The performance of both Class I shares and Class A shares reflects the reinvestment of all distributions. Please see page 52 for a description of the indices. Index performance returns do not reflect any management fees, transaction costs, or expenses. Indices are unmanaged and one cannot invest directly in an index.
Investment objective
The Fund seeks to provide a high level of current income. Capital appreciation is a secondary objective.
On September 13, 2021, the Board of Trustees (Board) of the Ivy Funds approved the Fund name change to “Delaware Ivy Strategic Income Fund” (formally, Delaware Ivy Apollo Strategic Income Fund, and before that, Ivy Apollo Strategic Income Fund) and the appointment of the portfolio manager team of J. David Hillmeyer, CFA, and Daniela Mardarovici, CFA, of Delaware Management Company (DMC) as new Fund portfolio managers. In addition, the Board approved appointing Macquarie Investment Management Austria Kapitalanlage AG, Macquarie Investment Management Europe Limited, Macquarie Funds Management Hong Kong Limited, and Macquarie Investment Management Global Limited, to provide discretionary investment management services in a sub-advisory capacity. The Board also approved the termination of the Fund’s current sub-advisor. In connection with these changes, the Board approved applicable revisions to the Fund’s investment strategies and benchmark. All changes took effect on or about November 15, 2021. The Fund performance discussed in this commentary pertains to the measurement period of November 15, 2021 to September 30, 2022.
Market review
Investors’ concern with inflation and tighter monetary policy dominated the Fund’s fiscal year ended September 30, 2022. As inflation persisted, central banks including the US Federal Reserve abruptly shifted from low interest rates and quantitative easing to higher rates and tightening in an effort to slow consumer price increases. Geopolitical issues also contributed to economic concerns as both Russia’s invasion of Ukraine and China’s zero-COVID-19 policy, which curtailed economic production, added to supply-chain issues and higher prices.
The strength of the US consumer and labor market, while generally supportive of economic growth and overall resilience, could further add to persistent inflationary pressures. That could result in the need for the Fed to raise interest rates above the level currently priced into financial markets.
Within the Fund
For the fiscal year ended September 30, 2022, the Delaware Ivy Strategic Income Fund posted a negative return that outperformed its benchmark, the Bloomberg US Aggregate Index. The Fund’s Class I shares declined 13.36%. The Fund’s Class A shares declined 13.81% at net asset value and 17.68% at maximum offer price (both figures reflect all distributions reinvested). For the same period, the benchmark declined 14.60%. For complete, annualized performance of Delaware Ivy Strategic Income Fund, please see the table on page 50.
The core components of the portfolio comprise three distinct asset classes: corporate bonds, emerging market debt, and securitized credit. In addition, the Fund has a small allocation to tactical assets, including convertible bonds, bank loans, agency mortgage-backed securities, and non-US dollar assets.
During the Fund’s fiscal year, its duration (a measure of a portfolio’s sensitivity to changing interest rates) was shorter than that of the broad US bond market benchmark and contributed favorably to the Fund’s performance. Relative to the broad benchmark, the Fund is exposed to much greater credit risk and is generally less sensitive to interest rates.
20
At fiscal year end, the Fund’s largest positions included a roughly 30% allocation to emerging markets debt, 23% to high yield corporate bonds, and 12% to investment grade corporate credit. Other asset class exposure included US Treasurys, bank loans, and convertible securities.
We adjusted risk in various sectors throughout the fiscal year. Exposure to CCC-rated bonds migrated lower to about 9% at fiscal year end. Having some liquid assets readily available in US Treasury bonds and cash allowed the Fund to remain agile and well positioned for this period of heightened volatility, in our view.
The Fund’s exposure to high yield and emerging market bonds detracted from performance as higher beta (riskier) assets underperformed, combined with negative returns from non-agency residential mortgage-backed securities.
Within emerging markets, Digicel Holdings Ltd., an international mobile phone network provider based in the Caribbean, was a significant detractor amid persistent concern about refinancing its capital structure.
High yield detractors included Carnival Corp. and Royal Caribbean Cruises Ltd. in the leisure sector. We recently added to our position in Carnival based on its geographic and end-market leadership. In our view, its large fixed-asset base provides decent collateral coverage. Additionally, Carnival remains committed to restoring its bond ratings to investment grade. Its bonds were downgraded to high yield early in the pandemic and the company has since been shoring up liquidity. Windstream Holdings Inc., a provider of voice and data network communications, also detracted from performance.
Yield curve management was a primary contributor to the Fund’s performance relative to the benchmark as the Fund was less exposed to the detrimental impact of rising interest rates during the fiscal year.
During the period we actively addressed risk in the portfolio. The market volatility induced by the war in Ukraine, combined with persistent inflation, required a reduction in beta and maintaining shorter duration relative to the benchmark.
We have seen a significant increase in absolute yields in calendar year 2022. Interest rates and credit spreads have both moved higher. As a result, we believe income should once again be a significant source of return within fixed income. As we move deeper into the rate-hiking cycle, we will continue to explore opportunities to allocate additional capital to higher yielding assets on price weakness. The Fund’s higher-beta nature (exposure to market volatility) should potentially perform well if credit spreads tighten, and we believe its income component could cushion some of the downside associated with risk premiums increasing due to macroeconomic issues, geopolitical concerns, or central bank policy mistakes.
The Fund used interest rate futures, options on foreign currencies, credit default swaps, and currency hedges. Overall, the Fund’s use of derivatives during the fiscal year detracted from performance.
21
Portfolio management reviews
Delaware Ivy Total Return Bond Fund
September 30, 2022 (Unaudited)
Performance preview (for the year ended September 30, 2022)
| Delaware Ivy Total Return Bond Fund (Class I shares) | 1-year return | -14.28% | ||
| Delaware Ivy Total Return Bond Fund (Class A shares) | 1-year return | -14.50% | ||
| Bloomberg Global Aggregate 1-10 Year Index, Hedged to USD (benchmark)* | 1-year return | -8.77% | ||
| Bloomberg US Treasury Bills 1-3 Month Index (previous benchmark) | 1-year return | +0.64% |
Past performance does not guarantee future results.
*The Fund changed its primary broad-based securities index to the Bloomberg Global Aggregate 1-10 Year Index, Hedged to USD as of November 15, 2021. The Fund elected to use the new index because it more closely reflects the Fund’s investment strategies.
For complete, annualized performance for Delaware Ivy Total Return Bond Fund, please see the table on page 54.
Class I shares are not subject to a sales charge and are offered for sale exclusively to certain eligible investors. In addition, Class I shares pay no distribution and service fee. The performance of Class A shares excludes the applicable sales charge. The performance of both Class I shares and Class A shares reflects the reinvestment of all distributions. Please see page 56 for a description of the indices. Index performance returns do not reflect any management fees, transaction costs, or expenses. Indices are unmanaged and one cannot invest directly in an index.
Investment objective
The Fund seeks to provide total return through a combination of current income and capital appreciation.
On September 13, 2021, the Board of Trustees (Board) of the Ivy Funds approved the Fund name change to “Delaware Ivy Total Return Bond Fund” and the appointment of the portfolio manager team of Andrew Vonthethoff, CFA of Delaware Management Company and Matthew Mulcahy of Macquarie Investment Management Global Limited as new Fund portfolio managers. In addition, the Board approved appointing Macquarie Investment Management Austria Kapitalanlage AG, Macquarie Investment Management Europe Limited, and Macquarie Investment Management Global Limited to provide discretionary investment management services in a sub-advisory capacity. The Board also approved the termination of the Fund’s current sub-advisor. In connection with these changes, the Board approved applicable revisions to the Fund’s investment strategies and benchmark. All changes took effect on November 15, 2021. The Fund performance discussed in this commentary pertains to the measurement period of November 15, 2021 to September 30, 2022.
Market review
Fixed-income markets traded in negative territory for much of the fiscal year ended September 30, 2022, with bonds sustaining historic losses in the first nine months of 2022. While performance of the asset class was driven in part by geopolitics and concern about slowing growth, the key driver of bond market repricing was inflation and central banks’ hawkish response. For the nine months ended September 30, 2022, the Bloomberg US Corporate Investment Grade Index declined 18.72%, the worst showing of any comparable period in at least 40 years and almost as bad as the broad equity market, an exceedingly rare outcome in a period of economic weakness.
Inflation continues to be the single most important macroeconomic factor for fixed-income markets, both in the US and globally. In the US, the Consumer Price Index (CPI) appears to have peaked but remains stubbornly elevated. At period end, the headline CPI year-on-year was still above 8%. Initially driven mainly by a combination of high post-COVID-19 demand and supply-chain disruptions, higher prices for energy, services, and housing also contributed to inflation as the fiscal period progressed.
Outside the US, inflation was more severe as energy prices and weak currencies pushed CPI measures in the UK and Europe to 10%, with further increases expected. That has necessitated an aggressive central bank response both in the US and abroad. The US Federal Reserve, in a series of five increases totaling 3 percentage points, raised the federal funds rate to a range of 3.0% to 3.25%. In Europe, the European Central Bank (ECB) increased its deposit rate above 0% for the first time in nearly a decade. Both banks also committed to balance-sheet reductions.
Combined, these actions drove a repricing of all asset classes. While government bond markets were affected most directly, credit and equity markets also declined as the reality of less supportive central bank policy and a weaker economic outlook developed. The yield on US 10-year Treasurys, near 1.3% in late 2021, exceeded 4% in September 2022. That weakness has flowed to other asset classes, most notably foreign exchange markets and non-US developed market sovereigns. For example, the Japanese yen fell more than 25% in the first nine months of 2022 and government bond markets in the UK recently experienced historic volatility, both evidencing high uncertainty and lack of market liquidity.
Geopolitics also played a significant role during the period, with Russia’s invasion of Ukraine affecting European security and up-ending energy supplies. Apart from the clear direct human costs, the invasion has made many issues worse, including higher energy
22
costs, supply-chain disruptions that affect European industrial activity, and significantly greater uncertainty overall.
Economic data showed a slowdown in global growth, with both the first and second quarters recording negative gross domestic product (GDP) growth in the US, and positive but clearly slowing GDP growth in Europe. Key survey indicators for manufacturing and services have also slowed as consumer sentiment waned. Nonetheless, consumer spending remains strong, and the employment market has been resilient, with low unemployment, labor scarcity, and wage inflation prevalent in most economies.
Within the Fund
For the fiscal year ended September 30, 2022, Delaware Ivy Total Return Bond Fund underperformed its benchmark, the Bloomberg Global Aggregate 1-10 Year Index, Hedged to USD. The Fund’s Class I shares declined 14.28%. The Fund’s Class A shares declined 14.50% at net asset value and 18.35% at maximum offer price (both figures reflect all distributions reinvested). For the same period, the Bloomberg Global Aggregate 1-10 Year Index, Hedged to USD declined 8.77%. For complete, annualized performance of Delaware Ivy Total Return Bond Fund, please see the table on page 54.
The Fund’s positioning evolved during the period to reflect both the changing market environment and the Fund’s new investment strategy. Beginning November 15, 2021, the Fund pursued a dynamic global bond strategy.
Chief among the portfolio changes was a gradual increase in interest rate duration, reflecting the availability of more attractive global bond yields, and a reduction in higher beta (greater risk) credit exposures, which typically have higher downside exposure in an environment of lower growth and higher volatility.
Duration in the Fund gradually increased throughout 2022, as yields became increasingly attractive. That reflected our view that materially higher bond yields are not sustainable in the long term as the level of debt in the global economy (at government, corporate, and household levels) cannot afford significantly higher servicing costs. Further, the impact of higher costs may eventually slow inflation and global growth. The Fund’s overall duration rose from approximately 3.25 years at the start of 2022, to about 4.85 years at the end of September via material increases in US dollar-denominated government bond exposures. We think US dollar duration is attractive as it carries some of the highest yields in developed markets. Additionally, the Fed was one of the first central banks to tighten policy. The strong US dollar may also provide some offset to inflationary forces. Australian dollar-denominated duration was also added to the portfolio. We expect the Australian economy to react more quickly to rate hikes, reflecting high household debt and floating rate mortgages in that market. We think high bond yields in this market represent an opportunity.
Among credit sectors, the Fund gradually added to investment-grade allocations as spreads became more attractive. Investment-grade corporates entered the period generally in good shape, with manageable leverage levels and extended debt maturity profiles. That was a result of the supportive market and economic environment that followed the pandemic. Within investment-grade credit, the focus was on reducing more cyclical exposures and higher beta structures, such as hybrid securities, given they are likely to be more heavily impacted in times of weakness. The Fund also added modestly to emerging-markets exposures given that yields are becoming more attractive, in our view, and many emerging markets entered the tightening phase well ahead of developed markets. Offsetting these changes, the Fund cut high-yield exposures by about half (from 10% to just above 5%) over the year. We believe high yield securities are more likely to be heavily exposed to a material “tail” of negative outcomes if a significant growth slowdown does occur. The reduction in our high-yield exposure included US issuers, but our reduction was more drastic to European financials and industrials, given their weaker growth outlook.
The Fund entered a position in agency mortgage-backed securities (MBS) in September. This sector of the market has been heavily impacted by the housing market slowdown and Treasury market volatility, making it one of the weakest (risk-adjusted) performers in the fiscal year. With spreads near post-financial crisis highs, we think this is an attractive entry point to begin adding exposures from a material underweight starting point.
Use of derivatives
The Fund used derivatives to gain and hedge exposures to specific risk factors, and in an effort to efficiently implement portfolio strategy. Over the period, the key derivatives employed included foreign exchange (FX) forward currency contracts, chiefly to hedge exposure of foreign currency risk back to the US dollar; bond futures to hedge and gain exposure to US and non-US government bonds; and options, though a small exposure. The options strategies included adding credit protection to the portfolio, using a limited downside structure, to benefit in the case of widening credit spreads. FX options were also used, adding exposure to specific currencies as an offset to existing risk positions in the portfolio.
23
Delaware Ivy California Municipal High Income Fund
September 30, 2022 (Unaudited)
The performance quoted represents past performance and does not guarantee future results. Investment return and principal value of an investment will fluctuate so that shares, when redeemed, may be worth more or less than their original cost. Current performance may be lower or higher than the performance quoted. Performance data current to the most recent month end may be obtained by calling 800 523-1918 or visiting delawarefunds.com/performance.
| Fund and benchmark performance1,2 | Average annual total returns through September 30, 2022 | ||||||
| 1 year | 5 year | Lifetime | |||||
| Class A (Est. October 3, 2016) | |||||||
| Excluding sales charge | -13.46% | -0.06% | +0.63% | ||||
| Including sales charge | -17.33% | -0.92% | -0.09% | ||||
| Class C (Est. October 3, 2016) | |||||||
| Excluding sales charge | -14.28% | -0.95% | -0.22% | ||||
| Including sales charge | -15.12% | -0.95% | -0.22% | ||||
| Class I (Est. October 3, 2016) | |||||||
| Excluding sales charge | -13.29% | +0.14% | +0.82% | ||||
| Including sales charge | -13.29% | +0.14% | +0.82% | ||||
| Class Y (Est. October 3, 2016) | |||||||
| Excluding sales charge | -13.48% | -0.06% | +0.62% | ||||
| Including sales charge | -13.48% | -0.06% | +0.62% | ||||
| Bloomberg Municipal Bond Index | -11.50% | +0.59% | +0.65%* | ||||
| Bloomberg Municipal High Yield Index | -15.05% | +2.31% | +2.15%* | ||||
*The benchmark lifetime returns are calculated using the Fund’s inception date.
1Returns reflect the reinvestment of all distributions and are presented both with and without the applicable sales charges described below. Returns do not reflect the deduction of taxes the shareholder would pay on Fund distributions or redemptions of Fund shares.
Expense limitations were in effect for certain classes during some or all of the periods shown in the “Fund and benchmark performance” table. Expenses for each class are listed on the “Fund expense ratios” table on page 25. Performance would have been lower had expense limitations not been in effect.
Class I shares are not subject to a sales charge and are offered for sale exclusively to certain eligible investors. In addition, Class I shares pay no distribution and service (12b-1) fee.
Class A shares are sold with a maximum front-end sales charge of 4.50%, and have an annual 12b-1 fee of 0.25% of average daily net assets. Performance for Class A shares, excluding sales charges, assumes that no front-end sales charge applied. Effective July 1, 2021, the maximum sales charge (load) imposed on purchases (as a % of offering price) for Class A shares changed from 4.25% to 4.50%.
Class C shares are sold with a contingent deferred sales charge (CDSC) of 1.00% if redeemed during the first 12 months. They are also subject to an annual 12b-1 fee of 1.00% of average daily net assets. Performance for Class C shares, excluding sales charges, assumes either that CDSCs did not apply or that the investment was not redeemed.
Class Y shares are available only to certain investors. Class Y shares have an annual 12b-1 fee of 0.25% of average daily net assets.
Fixed income securities and bond funds can lose value, and investors can lose principal as interest rates rise. They also may be affected by economic conditions that hinder an issuer’s ability to make interest and principal payments on its debt. This includes prepayment risk, the risk that the principal of a bond that is held by a portfolio will be prepaid prior to maturity at the time when interest rates are lower than what the bond was paying. A portfolio may then have to reinvest that money at a lower interest rate.
High yielding, non-investment-grade bonds (junk bonds) involve higher risk than investment grade bonds. The high yield secondary market is particularly susceptible to liquidity problems when institutional investors, such as mutual funds and certain other financial institutions, temporarily stop buying bonds for regulatory, financial, or other reasons. In addition, a less liquid secondary market makes it more difficult to obtain precise valuations of the high yield securities.
24
Substantially all dividend income derived from tax-free funds is exempt from federal income tax. Some income may be subject to state or local and/or the federal alternative minimum tax (AMT) that applies to certain investors. Capital gains, if any, are taxable.
Investments primarily in one state may be more susceptible to the economic, regulatory, regional, and other factors of that state than geographically diversified investments.
Duration number will change as market conditions change. Therefore, duration should not be solely relied upon to indicate a municipal bond fund’s potential volatility.
IBOR risk is the risk that changes related to the use of the London interbank offered rate (LIBOR) or similar rates (such as EONIA) could have adverse impacts on financial instruments that reference these rates. The abandonment of these rates and transition to alternative rates could affect the value and liquidity of instruments that reference them and could affect investment strategy performance.
The disruptions caused by natural disasters, pandemics, or similar events could prevent the Fund from executing advantageous investment decisions in a timely manner and could negatively impact the Fund’s ability to achieve its investment objective and the value of the Fund’s investments.
2The Fund’s expense ratios, as described in the most recent prospectus, are disclosed in the following “Fund expense ratios” table. The expense ratios below may differ from the expense ratios in the “Financial highlights” since they are based on different time periods and the expense ratios in the prospectus include acquired fund fees and expenses, if any. See Note 2 in “Notes to financial statements” for additional details. Please see the most recent prospectus and any applicable supplement(s) for additional information on these fee waivers and/or reimbursements. Please see the “Financial highlights” section in this report for the most recent expense ratios.
| Fund expense ratios | Class A | Class C | Class I | Class Y | |||||
| Total annual operating expenses (without fee waivers) | 1.33% | 2.10% | 1.21% | 1.45% | |||||
| Net expenses (including fee waivers, if any) | 0.80% | 1.65% | 0.60% | 0.80% | |||||
| Type of waiver | Contractual | Contractual | Contractual | Contractual |
25
Performance summaries
Delaware Ivy California Municipal High Income Fund
Performance of a $10,000 investment1
Class I and A shares
For the period October 3, 2016 (Fund’s inception) through September 30, 2022
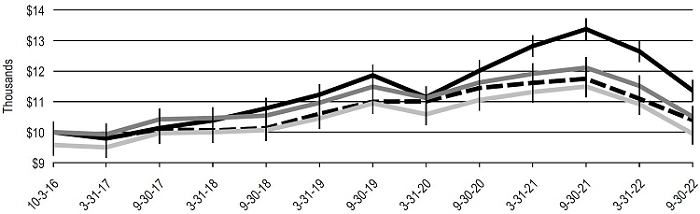
| Starting value | Ending value | |||||||||
 | Bloomberg Municipal High Yield Index | $ | 10,000 | $ | 11,360 | |||||
 | Delaware Ivy California Municipal High Income Fund — Class I shares | $ | 10,000 | $ | 10,504 | |||||
 | Bloomberg Municipal Bond Index | $ | 10,000 | $ | 10,397 | |||||
 | Delaware Ivy California Municipal High Income Fund — Class A shares | $ | 9,575 | $ | 9,948 | |||||
1The “Performance of a $10,000 investment” graph assumes $10,000 invested in Class I and Class A shares of the Fund on October 3, 2016, and includes the effect of a 4.25% front-end sales charge (for Class A shares) (the front-end sales charge in effect for Class A shares at the beginning of the period) and the reinvestment of all distributions. Effective July 1, 2021, the maximum front-end sales charge imposed on purchases for Class A shares changed from 4.25% to 4.50%. The graph does not reflect the deduction of taxes the shareholders would pay on Fund distributions or redemptions of Fund shares. Expense limitations were in effect for some or all of the periods shown. Performance would have been lower had expense limitations not been in effect. Expenses are listed in the “Fund expense ratios” table on page 25. Please note additional details on pages 24 through 26.
The graph also assumes $10,000 invested in the Bloomberg Municipal Bond Index and Bloomberg Municipal High Yield Index as of October 3, 2016. The Bloomberg Municipal Bond Index measures the total return performance of the long-term, investment grade tax-exempt bond market. The Bloomberg High-Yield Municipal Bond Index measures the total return performance of the long-term, non-investment-grade tax-exempt bond market.
Index performance returns do not reflect any management fees, transaction costs, or expenses. Indices are unmanaged and one cannot invest directly in an index. Past performance does not guarantee future results.
Performance of other Fund classes will vary due to different charges and expenses.
| Nasdaq symbols | CUSIPs | |||
| Class A | IMHAX | 465899144 | ||
| Class C | IMHCX | 465899136 | ||
| Class I | IMHIX | 465899128 | ||
| Class Y | IMHYX | 465899110 |
26
Performance summaries
Delaware Ivy Corporate Bond Fund
September 30, 2022 (Unaudited)
The performance quoted represents past performance and does not guarantee future results. Investment return and principal value of an investment will fluctuate so that shares, when redeemed, may be worth more or less than their original cost. Current performance may be lower or higher than the performance quoted. Performance data current to the most recent month end may be obtained by calling 800 523-1918 or visiting delawarefunds.com/performance.
| Fund and benchmark performance1,2 | Average annual total returns through September 30, 2022 | ||||||||
| 1 year | 5 year | 10 year | Lifetime | ||||||
| Class A (Est. March 30, 1964) | |||||||||
| Excluding sales charge | -19.22% | -0.57% | +0.60% | +5.90% | |||||
| Including sales charge | -22.87% | -1.74% | — | +5.80% | |||||
| Class C (Est. September 9, 1999) | |||||||||
| Excluding sales charge | -20.01% | -1.47% | -0.13% | +3.00% | |||||
| Including sales charge | -20.78% | -1.47% | -0.13% | +3.00% | |||||
| Class I (Est. June 19, 1995) | |||||||||
| Excluding sales charge | -18.98% | -0.27% | +0.88% | +4.04% | |||||
| Including sales charge | -18.98% | -0.27% | +0.88% | +4.04% | |||||
| Class Y (Est. October 16, 1999) | |||||||||
| Excluding sales charge | -19.18% | — | — | -0.59% | |||||
| Including sales charge | -19.18% | — | — | -0.59% | |||||
| Bloomberg US Corporate Investment Grade Index | -18.53% | -0.03% | +1.70% | —* | |||||
| Bloomberg US Credit Index | -17.89% | -0.05% | +1.58% | —* | |||||
*The benchmark lifetime return is for Class I share comparison only. Benchmark performance as of the Fund’s Class I inception date is not available.
1Returns reflect the reinvestment of all distributions and are presented both with and without the applicable sales charges described below. Returns do not reflect the deduction of taxes the shareholder would pay on Fund distributions or redemptions of Fund shares.
Expenses for each class are listed on the “Fund expense ratios” table on page 28. Performance would have been lower had expense limitations not been in effect.
Class I shares are not subject to a sales charge and are offered for sale exclusively to certain eligible investors. In addition, Class I shares pay no distribution and service (12b-1) fee.
Class A shares are sold with a maximum front-end sales charge of 4.50%, and have an annual 12b-1 fee of 0.25% of average daily net assets. Performance for Class A shares, excluding sales charges, assumes that no front-end sales charge applied. Effective July 1, 2021, the maximum sales charge (load) imposed on purchases (as a % of offering price) for Class A shares changed from 5.75% to 4.50%.
Class C shares are sold with a contingent deferred sales charge (CDSC) of 1.00% if redeemed during the first 12 months. They are also subject to an annual 12b-1 fee of 1.00% of average daily net assets. Performance for Class C shares, excluding sales charges, assumes either that CDSCs did not apply or that the investment was not redeemed.
Class Y shares are available only to certain investors. Class Y shares have an annual 12b-1 fee of 0.25% of average daily net assets.
Fixed income securities and bond funds can lose value, and investors can lose principal as interest rates rise. They also may be affected by economic conditions that hinder an issuer’s ability to make interest and principal payments on its debt. This includes prepayment risk, the risk that the principal of a bond that is held by a portfolio will be prepaid prior to maturity at the time when interest rates are lower than what the bond was paying. A portfolio may then have to reinvest that money at a lower interest rate.
High yielding, non-investment-grade bonds (junk bonds) involve higher risk than investment grade bonds. The high yield secondary market is particularly susceptible to liquidity problems when institutional investors, such as mutual funds and certain other financial institutions, temporarily stop buying bonds for regulatory, financial, or other reasons. In addition, a less liquid secondary market makes it more difficult to obtain precise valuations of the high yield securities.
27
Performance summaries
Delaware Ivy Corporate Bond Fund
The Fund may invest in derivatives, which may involve additional expenses and are subject to risk, including the risk that an underlying security or securities index moves in the opposite direction from what the portfolio manager anticipated. A derivatives transaction depends upon the counterparties’ ability to fulfil their contractual obligations.
International investments entail risks including fluctuation in currency values, differences in accounting principles, or economic or political instability. Investing in emerging markets can be riskier than investing in established foreign markets due to increased volatility, lower trading volume, and higher risk of market closures. In many emerging markets, there is substantially less publicly available information and the available information may be incomplete or misleading. Legal claims are generally more difficult to pursue.
IBOR risk is the risk that changes related to the use of the London interbank offered rate (LIBOR) or similar rates (such as EONIA) could have adverse impacts on financial instruments that reference these rates. The abandonment of these rates and transition to alternative rates could affect the value and liquidity of instruments that reference them and could affect investment strategy performance.
The disruptions caused by natural disasters, pandemics, or similar events could prevent the Fund from executing advantageous investment decisions in a timely manner and could negatively impact the Fund’s ability to achieve its investment objective and the value of the Fund’s investments.
2The Fund’s expense ratios, as described in the most recent prospectus, are disclosed in the following “Fund expense ratios” table. The expense ratios below may differ from the expense ratios in the “Financial highlights” since they are based on different time periods and the expense ratios in the prospectus include acquired fund fees and expenses, if any. See Note 2 in “Notes to financial statements” for additional details. Please see the most recent prospectus and any applicable supplement(s) for additional information on these fee waivers and/or reimbursements. Please see the “Financial highlights” section in this report for the most recent expense ratios.
| Fund expense ratios | Class A | Class C | Class I | Class Y | |||||
| Total annual operating expenses (without fee waivers) | 0.96% | 1.84% | 0.70% | 0.95% | |||||
| Net expenses (including fee waivers, if any) | 0.96% | 1.84% | 0.70% | 0.95% | |||||
| Type of waiver | N/a | N/a | N/a | N/a | |||||
Performance of a $10,000 investment1
Class I and Class A shares
For the period September 30, 2012 through September 30, 2022

| Starting value | Ending value | |||||||||
| Bloomberg US Corporate Investment Grade Index | $ | 10,000 | $ | 11,837 | |||||
| Bloomberg US Credit Index | $ | 10,000 | $ | 11,695 | |||||
| Delaware Ivy Corporate Bond Fund — Class I shares | $ | 10,000 | $ | 10,921 | |||||
| Delaware Ivy Corporate Bond Fund — Class A shares | $ | 9,425 | $ | 10,003 | |||||
28
1The “Performance of a $10,000 investment” graph assumes $10,000 invested in Class I and Class A shares of the Fund on September 30, 2012, and includes the effect of a 5.75% front-end sales charge (for Class A shares) (the front-end sales charge in effect for Class A shares at the beginning of the period) and the reinvestment of all distributions. Effective July 1, 2021, the maximum front-end sales charge imposed on purchases for Class A shares changed from 5.75% to 4.50%. The graph does not reflect the deduction of taxes the shareholders would pay on Fund distributions or redemptions of Fund shares. Expenses are listed in the “Fund expense ratios” table on page 28. Please note additional details on pages 27 through 29.
The graph also assumes $10,000 invested in the Bloomberg US Corporate Investment Grade Index and the Bloomberg US Credit Index as of September 30, 2012. The Bloomberg US Corporate Investment Grade Index is composed of US dollar-denominated, investment grade corporate bonds that are US Securities and Exchange Commission (SEC)-registered or 144A with registration rights, and issued by industrial, utility, and financial companies. All bonds in the index have at least one year to maturity. The Bloomberg US Credit Index measures the total return performance of non-convertible, investment grade domestic corporate bonds and SEC-registered foreign issues. All bonds in the index have at least one year to maturity.
Index performance returns do not reflect any management fees, transaction costs, or expenses. Indices are unmanaged and one cannot invest directly in an index. Past performance does not guarantee future results.
Performance of other Fund classes will vary due to different charges and expenses.
| Nasdaq symbols | CUSIPs | |||
| Class A | IBJAX | 46600G101 | ||
| Class C | IBJCX | 46600G309 | ||
| Class I | IBJIX | 46600G507 | ||
| Class Y | IBJYX | 46600G804 |
29
Performance summaries
Delaware Ivy Crossover Credit Fund
September 30, 2022 (Unaudited)
The performance quoted represents past performance and does not guarantee future results. Investment return and principal value of an investment will fluctuate so that shares, when redeemed, may be worth more or less than their original cost. Current performance may be lower or higher than the performance quoted. Performance data current to the most recent month end may be obtained by calling 800 523-1918 or visiting delawarefunds.com/performance.
| Fund and benchmark performance1,2 | Average annual total returns through September 30, 2022 | ||||||
| 1 year | 5 year | Lifetime | |||||
| Class A (Est. April 3, 2017) | |||||||
| Excluding sales charge | -20.27% | +0.32% | +0.92% | ||||
| Including sales charge | -23.84% | -0.87% | -0.16% | ||||
| Class I (Est. April 3, 2017) | |||||||
| Excluding sales charge | -20.05% | +0.55% | +1.17% | ||||
| Including sales charge | -20.05% | +0.55% | +1.17% | ||||
| Class Y (Est. April 3, 2017) | |||||||
| Excluding sales charge | -20.35% | +0.30% | +0.90% | ||||
| Including sales charge | -20.35% | +0.30% | +0.90% | ||||
| Bloomberg US Corporate Bond Index | -18.53% | -0.03% | +0.62%* | ||||
*The benchmark lifetime return is calculated using the Fund’s inception date.
1Returns reflect the reinvestment of all distributions and are presented both with and without the applicable sales charges described below. Returns do not reflect the deduction of taxes the shareholder would pay on Fund distributions or redemptions of Fund shares.
Expense limitations were in effect for certain classes during some or all of the periods shown in the “Fund and benchmark performance” table. Expenses for each class are listed on the “Fund expense ratios” table on page 31. Performance would have been lower had expense limitations not been in effect.
Class I shares are not subject to a sales charge and are offered for sale exclusively to certain eligible investors. In addition, Class I shares pay no distribution and service (12b-1) fee.
Class A shares are sold with a maximum front-end sales charge of 4.50%, and have an annual 12b-1 fee of 0.25% of average daily net assets. Performance for Class A shares, excluding sales charges, assumes that no front-end sales charge applied. Effective July 1, 2021, the maximum sales charge (load) imposed on purchases (as a % of offering price) for Class A shares changed from 5.75% to 4.50%.
Class Y shares are available only to certain investors. Class Y shares have an annual 12b-1 fee of 0.25% of average daily net assets.
Fixed income securities and bond funds can lose value, and investors can lose principal as interest rates rise. They also may be affected by economic conditions that hinder an issuer’s ability to make interest and principal payments on its debt. This includes prepayment risk, the risk that the principal of a bond that is held by a portfolio will be prepaid prior to maturity at the time when interest rates are lower than what the bond was paying. A portfolio may then have to reinvest that money at a lower interest rate.
High yielding, non-investment-grade bonds (junk bonds) involve higher risk than investment grade bonds. The high yield secondary market is particularly susceptible to liquidity problems when institutional investors, such as mutual funds and certain other financial institutions, temporarily stop buying bonds for regulatory, financial, or other reasons. In addition, a less liquid secondary market makes it more difficult to obtain precise valuations of the high yield securities.
International investments entail risks including fluctuation in currency values, differences in accounting principles, or economic or political instability. Investing in emerging markets can be riskier than investing in established foreign markets due to increased volatility, lower trading volume, and higher risk of market closures. In many emerging markets, there is substantially less publicly available information and the available information may be incomplete or misleading. Legal claims are generally more difficult to pursue.
Risk is increased in a concentrated portfolio since it holds a limited number of securities with each investment having a greater effect on the overall performance.
IBOR risk is the risk that changes related to the use of the London interbank offered rate (LIBOR) or similar rates (such as EONIA) could have adverse impacts on financial instruments that reference these rates. The abandonment of these rates and transition to alternative
30
rates could affect the value and liquidity of instruments that reference them and could affect investment strategy performance.
The disruptions caused by natural disasters, pandemics, or similar events could prevent the Fund from executing advantageous investment decisions in a timely manner and could negatively impact the Fund’s ability to achieve its investment objective and the value of the Fund’s investments.
2 The Fund’s expense ratios, as described in the most recent prospectus, are disclosed in the following “Fund expense ratios” table. The expense ratios below may differ from the expense ratios in the “Financial highlights” since they are based on different time periods and the expense ratios in the prospectus include acquired fund fees and expenses, if any. See Note 2 in “Notes to financial statements” for additional details. Please see the most recent prospectus and any applicable supplement(s) for additional information on these fee waivers and/or reimbursements. Please see the “Financial highlights” section in this report for the most recent expense ratios.
| Fund expense ratios | Class A | Class I | Class Y | ||||
| Total annual operating expenses (without fee waivers) | 1.23% | 1.03% | 1.26% | ||||
| Net expenses (including fee waivers, if any) | 0.90% | 0.65% | 0.90% | ||||
| Type of waiver | Contractual | Contractual | Contractual | ||||
Performance of a $10,000 investment1
Class I and Class A shares
For the period April 3, 2017 (Fund’s inception) through September 30, 2022

| Starting value | Ending value | |||||||||
| Delaware Ivy Crossover Credit Fund — Class I shares | $ | 10,000 | $ | 10,662 | |||||
| Bloomberg US Corporate Bond Index | $ | 10,000 | $ | 10,343 | |||||
| Delaware Ivy Crossover Credit Fund — Class A shares | $ | 9,425 | $ | 9,911 | |||||
1The “Performance of a $10,000 investment” graph assumes $10,000 invested in Class I and Class A shares of the Fund on April 3, 2017, and includes the effect of a 5.75% front-end sales charge (for Class A shares) (the front-end sales charge in effect for Class A shares at the beginning of the period) and the reinvestment of all distributions. Effective July 1, 2021, the maximum front-end sales charge imposed on purchases for Class A shares changed from 5.75% to 4.50%.
The graph does not reflect the deduction of taxes the shareholders would pay on Fund distributions or redemptions of Fund shares.
Expense limitations were in effect for some or all of the periods shown. Performance would have been lower had expense limitations not been in effect. Expenses are listed in the “Fund expense ratios” table on page 31. Please note additional details on pages 30 through 32.
The graph also assumes $10,000 invested in the Bloomberg US Corporate Bond Index as of April 3, 2017. The Bloomberg US Corporate Bond Index is composed of US dollar-denominated, investment grade corporate bonds that are US Securities and Exchange Commission (SEC)-registered or 144A with registration
31
Performance summaries
Delaware Ivy Crossover Credit Fund
rights, and issued by industrial, utility, and financial companies. All bonds in the index have at least one year to maturity.
Index performance returns do not reflect any management fees, transaction costs, or expenses. Indices are unmanaged and one cannot invest directly in an index. Past performance does not guarantee future results.
Performance of other Fund classes will vary due to different charges and expenses.
| Nasdaq symbols | CUSIPs | |||
| Class A | ICKAX | 46600B730 | ||
| Class I | ICKIX | 46600B714 | ||
| Class Y | ICKYX | 46600B664 |
32
Performance summaries
Delaware Ivy Emerging Markets Local Currency Debt Fund
September 30, 2022 (Unaudited)
The performance quoted represents past performance and does not guarantee future results. Investment return and principal value of an investment will fluctuate so that shares, when redeemed, may be worth more or less than their original cost. Current performance may be lower or higher than the performance quoted. Performance data current to the most recent month end may be obtained by calling 800 523-1918 or visiting delawarefunds.com/performance.
| Fund and benchmark performance1,2 | Average annual total returns through September 30, 2022 | ||||||
| 1 year | 5 year | Lifetime | |||||
| Class A (Est. April 30, 2014) | |||||||
| Excluding sales charge | -22.18%* | -5.57% | -3.77% | ||||
| Including sales charge | -25.65% | -6.69% | -4.45% | ||||
| Class C (Est. April 30, 2014) | |||||||
| Excluding sales charge | -22.82%* | -6.16% | -4.42% | ||||
| Including sales charge | -23.60% | -6.16% | -4.42% | ||||
| Class I (Est. April 30, 2014) | |||||||
| Excluding sales charge | -21.86%* | -5.17% | -3.43% | ||||
| Including sales charge | -21.86% | -5.17% | -3.43% | ||||
| Class R6 (Est. January 30, 2015) | |||||||
| Excluding sales charge | -21.89%* | -5.20% | -2.80% | ||||
| Including sales charge | -21.89% | -5.20% | -2.80% | ||||
| Class Y (Est. April 30, 2014) | |||||||
| Excluding sales charge | -22.27%* | -5.59% | -3.77% | ||||
| Including sales charge | -22.27% | -5.59% | -3.77% | ||||
| J.P. Morgan Government Bond Index-Emerging Markets (GBI-EM) Global Diversified Index | -20.63% | -3.92% | -1.77%** | ||||
*Total return for the report period presented in the table differs from the return in “Financial highlights.” The total return presented in the above table is calculated based on the net asset value (NAV) at which shareholder transactions were processed. The total return presented in “Financial highlights” is calculated in the same manner but also takes into account certain adjustments that are necessary under US generally accepted accounting principles required in the annual report.
**The benchmark lifetime return is calculated using the Fund’s Class I inception date.
1 Returns reflect the reinvestment of all distributions and are presented both with and without the applicable sales charges described below. Returns do not reflect the deduction of taxes the shareholder would pay on Fund distributions or redemptions of Fund shares.
Expense limitations were in effect for certain classes during some or all of the periods shown in the “Fund and benchmark performance” table. Expenses for each class are listed on the “Fund expense ratios” table on page 35. Performance would have been lower had expense limitations not been in effect.
Class I shares are not subject to a sales charge and are offered for sale exclusively to certain eligible investors. In addition, Class I shares pay no distribution and service (12b-1) fee.
Class A shares are sold with a maximum front-end sales charge of 4.50%, and have an annual 12b-1 fee of 0.25% of average daily net assets. Performance for Class A shares, excluding sales charges, assumes that no front-end sales charge applied. Effective July 1, 2021, the maximum sales charge (load) imposed on purchases (as a % of offering price) for Class A shares changed from 5.75% to 4.50%.
Class C shares are sold with a contingent deferred sales charge (CDSC) of 1.00% if redeemed during the first 12 months. They are also subject to an annual 12b-1 fee of 1.00% of average daily net assets. Performance for Class C shares, excluding sales charges, assumes either that CDSCs did not apply or that the investment was not redeemed.
Effective July 1, 2021, Class N shares were renamed Class R6 shares. Class R6 shares are available only to certain investors. In addition, Class R6 shares do not pay any service fees, sub-accounting fees, and/or sub-transfer agency fees to any brokers, dealers, or other financial intermediaries. Class R6 shares pay no 12b-1 fee.
Class Y shares are available only to certain investors. Class Y shares have an annual 12b-1 fee of 0.25% of average daily net assets.
33
Performance summaries
Delaware Ivy Emerging Markets Local Currency Debt Fund
The Fund may be unable to repatriate capital from its investments, in whole or in part, which may have an adverse effect on the cash flows and/or performance of the fund. Capital repatriation involves the transfer of corporate money or property from a foreign country back to its home country. The repatriation of capital with regard to investments made in certain securities or countries may be restricted during certain times from the date of such investments or even indefinitely.
The value of a credit-linked note may be impacted by its underlying reference obligation. Risks associated with underlying reference obligations, include but are not limited to market risk, interest rate risk, credit risk, default risk and foreign currency risk. The buyer of a credit-linked note assumes the risk of default by the issuer and the underlying reference asset or entity. If the underlying investment defaults, the payments and principal received by the Fund will be reduced or eliminated. Also, in the event the issuer defaults or there is a credit event that relates to the reference asset, the recovery rate generally is less than a fund’s initial investment, and a fund may lose money.
The Fund may invest in derivatives, which may involve additional expenses and are subject to risk, including the risk that an underlying security or securities index moves in the opposite direction from what the portfolio manager anticipated. A derivatives transaction depends upon the counterparties’ ability to fulfill their contractual obligations.
Longer-duration debt securities are more likely to decline in price than shorter duration debt securities in a rising interest rate environment. Duration is a measure of the price sensitivity of a debt security or portfolio to interest rate changes.
International investments entail risks including fluctuation in currency values, differences in accounting principles, or economic or political instability. Investing in emerging markets can be riskier than investing in established foreign markets due to increased volatility, lower trading volume, and higher risk of market closures. In many emerging markets, there is substantially less publicly available information and the available information may be incomplete or misleading. Legal claims are generally more difficult to pursue.
Fixed income securities and bond funds can lose value, and investors can lose principal, as interest rates rise. They also may be affected by economic conditions that hinder an issuer’s ability to make interest and principal payments on its debt.
The Fund may also be subject to prepayment risk, the risk that the principal of a bond that is held by a portfolio will be prepaid prior to maturity, at the time when interest rates are lower than what the bond was paying. A portfolio may then have to reinvest that money at a lower interest rate.
Currency risk is the risk that fluctuations in exchange rates between the US dollar and foreign currencies and between various foreign currencies may cause the value of the fund’s investments to decline. The market for some (or all) currencies may from time to time have low trading volume and become illiquid, which may prevent the fund from effecting positions or from promptly liquidating unfavorable positions in such markets, thus subjecting the fund to substantial losses.
If and when the Fund invests in forward foreign currency contracts or uses other investments to hedge against currency risks, the Fund will be subject to special risks, including counterparty risk.
The market values of bonds and other debt securities are affected by changes in interest rates. In general, when interest rates rise, the market value of a debt security declines, and when interest rates decline, the market value of a debt security increases. Generally, the longer the maturity and duration of a debt security, the greater its sensitivity to interest rates. The yields received by the Fund on its investments will generally decline as interest rates decline.
High yielding, non-investment-grade bonds (junk bonds) involve higher risk than investment grade bonds.
“Non-diversified” portfolios may allocate more of their net assets to investments in single securities than “diversified” portfolios. Resulting adverse effects may subject these portfolios to greater risks and volatility.
Portfolio turnover is a measure of how frequently the managers buy and sell assets within a fund over a particular period. It is usually reported for a 12-month time period.
IBOR risk is the risk that changes related to the use of the London interbank offered rate (LIBOR) or similar rates (such as EONIA) could have adverse impacts on financial instruments that reference these rates. The abandonment of these rates and transition to alternative rates could affect the value and liquidity of instruments that reference them and could affect investment strategy performance.
The disruptions caused by natural disasters, pandemics, or similar events could prevent the Fund from executing advantageous investment decisions in a timely manner and could negatively impact the Fund’s ability to achieve its investment objective and the value of the Fund’s investments
34
2 The Fund’s expense ratios, as described in the most recent prospectus, are disclosed in the following “Fund expense ratios” table. The expense ratios below may differ from the expense ratios in the “Financial highlights” since they are based on different time periods and the expense ratios in the prospectus include acquired fund fees and expenses, if any. See Note 2 in “Notes to financial statements” for additional details. Please see the most recent prospectus and any applicable supplement(s) for additional information on these fee waivers and/or reimbursements. Please see the “Financial highlights” section in this report for the most recent expense ratios.
| Fund expense ratios | Class A | Class C | Class I | Class R6 | Class Y | ||||||
| Total annual operating expenses (without fee waivers) | 1.64% | 2.25% | 1.43% | 1.22% | 1.61% | ||||||
| Net expenses (including fee waivers, if any) | 1.24% | 1.85% | 0.81% | 0.81% | 1.21% | ||||||
| Type of waiver | Contractual | Contractual | Contractual | Contractual | Contractual | ||||||
Performance of a $10,000 investment1
Class I and Class A shares
For the period April 30, 2014 (Fund’s inception) through September 30, 2022

| Starting value | Ending value | |||||||||
| J.P. Morgan Government Bond Index-Emerging Markets (GBI-EM) Global Diversified Index | $ | 10,000 | $ | 8,027 | |||||
| Delaware Ivy Emerging Markets Local Currency Debt Fund — Class I shares | $ | 9,425 | $ | 7,456 | |||||
| Delaware Ivy Emerging Markets Local Currency Debt Fund — Class A shares | $ | 10,000 | $ | 6,819 | |||||
1The “Performance of a $10,000 investment” graph assumes $10,000 invested in Class I and Class A shares of the Fund on April 30, 2014, and includes the effect of a 5.75% front-end sales charge (for Class A shares) (the front-end sales charge in effect for Class A shares at the beginning of the period) and the reinvestment of all distributions. Effective July 1, 2021, the maximum front-end sales charge imposed on purchases for Class A shares changed from 5.75% to 4.50%. The graph also assumes $10,000 invested in the J.P. Morgan Government Bond Index–Emerging Markets (GBI-EM) Global Diversified Index as of April 30, 2014.
The graph does not reflect the deduction of taxes the shareholders would pay on Fund distributions or redemptions of Fund shares. Expense limitations were in effect for some or all of the periods shown. Performance would have been lower had expense limitations not been in effect. Expenses are listed in the “Fund expense ratios” table on page 35. Please note additional details on pages 33 through 36.
The J.P. Morgan Government Bond Index–Emerging Markets (GBI-EM) Global Diversified Index tracks local currency government bonds issued by emerging markets, limiting the weights of the index countries by only including a specified portion of those countries’ eligible current face amounts of debt outstanding.
Index performance returns do not reflect any management fees, transaction costs, or expenses. Indices are unmanaged and one cannot invest directly in an index. Past performance does not guarantee future results.
35
Performance summaries
Delaware Ivy Emerging Markets Local Currency Debt Fund
Performance of other Fund classes will vary due to different charges and expenses.
| Nasdaq symbols | CUSIPs | |||
| Class A | IECAX | 465899227 | ||
| Class C | IECCX | 465899219 | ||
| Class I | IECIX | 465899185 | ||
| Class R6 | IMMCX | 465899151 | ||
| Class Y | IECYX | 465899169 |
36
Performance summaries
Delaware Ivy Government Securities Fund
September 30, 2022 (Unaudited)
The performance quoted represents past performance and does not guarantee future results. Investment return and principal value of an investment will fluctuate so that shares, when redeemed, may be worth more or less than their original cost. Current performance may be lower or higher than the performance quoted. Performance data current to the most recent month end may be obtained by calling 800 523-1918 or visiting delawarefunds.com/performance.
| Fund and benchmark performance1,2 | Average annual total returns through September 30, 2022 | ||||||||
| 1 year | 5 year | 10 year | Lifetime | ||||||
| Class A (Est. April 10, 1984) | |||||||||
| Excluding sales charge | -13.67% | -1.22% | -0.56% | +5.08% | |||||
| Including sales charge | -17.49% | -2.08% | -0.99% | +4.96% | |||||
| Class C (Est. October 8, 1999) | |||||||||
| Excluding sales charge | -14.44% | -2.07% | -1.24% | +2.27% | |||||
| Including sales charge | -15.29% | -2.07% | -1.24% | +2.27% | |||||
| Class I (Est. June 19, 1995) | |||||||||
| Excluding sales charge | -13.45% | -0.97% | -0.28% | +3.34% | |||||
| Including sales charge | -13.45% | -0.97% | -0.28% | +3.34% | |||||
| Class R6 (Est. October 16, 2017) | |||||||||
| Excluding sales charge | -13.36% | — | — | -0.85% | |||||
| Including sales charge | -13.36% | — | — | -0.85% | |||||
| Bloomberg US Government/Mortgage-Backed Securities Index | -13.28% | -0.47% | +0.53% | -0.50%* | |||||
*The benchmark lifetime return is calculated using the Fund’s Class I inception date.
1Returns reflect the reinvestment of all distributions and are presented both with and without the applicable sales charges described below. Returns do not reflect the deduction of taxes the shareholder would pay on Fund distributions or redemptions of Fund shares.
Expense limitations were in effect for certain classes during some or all of the periods shown in the “Fund and benchmark performance” table. Expenses for each class are listed on the “Fund expense ratios” table on page 38. Performance would have been lower had expense limitations not been in effect.
Class I shares are not subject to a sales charge and are offered for sale exclusively to certain eligible investors. In addition, Class I shares pay no distribution and service (12b-1) fee.
Class A shares are sold with a maximum front-end sales charge of 4.50%, and have an annual 12b-1 fee of 0.25% of average daily net assets. Performance for Class A shares, excluding sales charges, assumes that no front-end sales charge applied. Effective July 1, 2021, the maximum sales charge (load) imposed on purchases (as a % of offering price) for Class A shares changed from 4.25% to 4.50%.
Class C shares are sold with a contingent deferred sales charge (CDSC) of 1.00% if redeemed during the first 12 months. They are also subject to an annual 12b-1 fee of 1.00% of average daily net assets. Performance for Class C shares, excluding sales charges, assumes either that CDSCs did not apply or that the investment was not redeemed.
Effective July 1, 2021, Class N shares were renamed Class R6 shares. Class R6 shares are available only to certain investors. In addition, Class R6 shares do not pay any service fees, sub-accounting fees, and/or sub-transfer agency fees to any brokers, dealers, or other financial intermediaries. Class R6 shares pay no 12b-1 fee.
Fixed income securities and bond funds can lose value, and investors can lose principal as interest rates rise. They also may be affected by economic conditions that hinder an issuer’s ability to make interest and principal payments on its debt. This includes prepayment risk, the risk that the principal of a bond that is held by a portfolio will be prepaid prior to maturity at the time when interest rates are lower than what the bond was paying. A portfolio may then have to reinvest that money at a lower interest rate.
The Fund may also be subject to prepayment risk, the risk that the principal of a bond that is held by a portfolio will be prepaid prior to maturity, at the time when interest rates are lower than what the bond was paying. A portfolio may then have to reinvest that money at a lower interest rate.
IBOR risk is the risk that changes related to the use of the London interbank offered rate (LIBOR) or similar rates (such as EONIA) could
37
Performance summaries
Delaware Ivy Government Securities Fund
have adverse impacts on financial instruments that reference these rates. The abandonment of these rates and transition to alternative rates could affect the value and liquidity of instruments that reference them and could affect investment strategy performance.
The disruptions caused by natural disasters, pandemics, or similar events could prevent the Fund from executing advantageous investment decisions in a timely manner and could negatively impact the Fund’s ability to achieve its investment objective and the value of the Fund’s investments.
2The Fund’s expense ratios, as described in the most recent prospectus, are disclosed in the following “Fund expense ratios” table. The expense ratios below may differ from the expense ratios in the “Financial highlights” since they are based on different time periods and the expense ratios in the prospectus include acquired fund fees and expenses, if any. See Note 2 in “Notes to financial statements” for additional details. Please see the most recent prospectus and any applicable supplement(s) for additional information on these fee waivers and/or reimbursements. Please see the “Financial highlights” section in this report for the most recent expense ratios.
| Fund expense ratios | Class A | Class C | Class I | Class R6 | |||||
| Total annual operating expenses (without fee waivers) | 1.00% | 1.82% | 0.76% | 0.60% | |||||
| Net expenses (including fee waivers, if any) | 0.97% | 1.82% | 0.72% | 0.60% | |||||
| Type of waiver | Contractual | Contractual | Contractual | Contractual | |||||
Performance of a $10,000 investment1
Class I and Class A shares
For the period September 30, 2012 through September 30, 2022
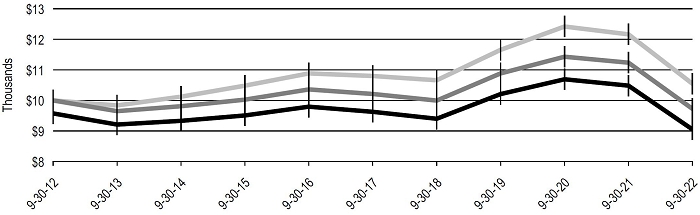
| Starting value | Ending value | |||||||||
| Bloomberg US Government/Mortgage-Backed Securities Index | $ | 10,000 | $ | 10,547 | |||||
| Delaware Ivy Government Securities Fund — Class I shares | $ | 10,000 | $ | 9,726 | |||||
| Delaware Ivy Government Securities Fund — Class A shares | $ | 9,575 | $ | 9,052 | |||||
1The “Performance of a $10,000 investment” graph assumes $10,000 invested in Class I and Class A shares of the Fund on September 30, 2012, and includes the effect of a 4.25% front-end sales charge (for Class A shares) (the front-end sales charge in effect for Class A shares at the beginning of the period) and the reinvestment of all distributions. Effective July 1, 2021, the maximum front-end sales charge imposed on purchases for Class A shares changed from 4.25% to 4.50%. The graph also assumes $10,000 invested in the Bloomberg US Government/Mortgage-Backed Securities Index as of September 30, 2012.
The graph does not reflect the deduction of taxes the shareholders would pay on Fund distributions or redemptions of Fund shares. Expense limitations were in effect for some or all of the periods shown. Performance would have been lower had expense limitations
38
not been in effect. Expenses are listed in the “Fund expense ratios” table on page 38. Please note additional details on pages 37 through 39.
The Bloomberg US Government/Mortgage-Backed Securities Index measures the performance of US government bonds and mortgage-related securities.
Index performance returns do not reflect any management fees, transaction costs, or expenses. Indices are unmanaged and one cannot invest directly in an index. Past performance does not guarantee future results.
Performance of other Fund classes will vary due to different charges and expenses.
| Nasdaq symbols | CUSIPs | |||
| Class A | IGJAX | 46600B227 | ||
| Class C | IGJCX | 46600B193 | ||
| Class I | IGJIX | 46600B177 | ||
| Class R6 | IGJNX | 46600B169 |
39
Performance summaries
Delaware Ivy High Yield Fund
September 30, 2022 (Unaudited)
The performance quoted represents past performance and does not guarantee future results. Investment return and principal value of an investment will fluctuate so that shares, when redeemed, may be worth more or less than their original cost. Current performance may be lower or higher than the performance quoted. Performance data current to the most recent month end may be obtained by calling 800 523-1918 or visiting delawarefunds.com/performance.
| Fund and benchmark performance1,2 | Average annual total returns through September 30, 2022 | ||||||
| 1 year | 5 year | Lifetime | |||||
| Class A (Est. May 18, 2017) | |||||||
| Excluding sales charge | -15.64% | +0.82% | +1.26% | ||||
| Including sales charge | -19.42% | -0.37% | +0.14% | ||||
| Class I (Est. May 18, 2017) | |||||||
| Excluding sales charge | -15.51% | +1.09% | +1.52% | ||||
| Including sales charge | -15.51% | +1.09% | +1.52% | ||||
| Class R6 (Est. May 18, 2017) | |||||||
| Excluding sales charge | -15.56% | +1.06% | +1.50% | ||||
| Including sales charge | -15.56% | +1.06% | +1.50% | ||||
| ICE BofA US High Yield Constrained Index | -14.06% | +1.39% | +1.82%* | ||||
| Bloomberg US Corporate High-Yield Bond Index | -14.14% | +1.57% | +1.98%* | ||||
*The benchmark lifetime returns are calculated using the Fund’s inception date.
1 Returns reflect the reinvestment of all distributions and are presented both with and without the applicable sales charges described below. Returns do not reflect the deduction of taxes the shareholder would pay on Fund distributions or redemptions of Fund shares.
Expense limitations were in effect for certain classes during some or all of the periods shown in the “Fund and benchmark performance” table. Expenses for each class are listed on the “Fund expense ratios” table on page 41. Performance would have been lower had expense limitations not been in effect.
Class A shares are sold with a maximum front-end sales charge of 4.50%, and have an annual 12b-1 fee of 0.25% of average daily net assets. Performance for Class A shares, excluding sales charges, assumes that no front-end sales charge applied. Effective July 1, 2021, the maximum front-end sales charge imposed on purchases for Class A shares (as a % of offering price) changed from 5.75% to 4.50%.
Class I shares are not subject to a sales charge and are offered for sale exclusively to certain eligible investors. In addition, Class I shares pay no distribution and service (12b-1) fee.
Effective July 1, 2021, Class N shares were renamed Class R6 shares. Class R6 shares are available only to certain investors. In addition, Class R6 shares do not pay any service fees, sub-accounting fees, and/or sub-transfer agency fees to any brokers, dealers, or other financial intermediaries. Class R6 shares pay no 12b-1 fee.
Fixed income securities and bond funds can lose value, and investors can lose principal as interest rates rise. They also may be affected by economic conditions that hinder an issuer’s ability to make interest and principal payments on its debt. This includes prepayment risk, the risk that the principal of a bond that is held by a portfolio will be prepaid prior to maturity at the time when interest rates are lower than what the bond was paying. A portfolio may then have to reinvest that money at a lower interest rate.
High yielding, non-investment-grade bonds (junk bonds) involve higher risk than investment grade bonds.
IBOR risk is the risk that changes related to the use of the London interbank offered rate (LIBOR) or similar rates (such as EONIA) could have adverse impacts on financial instruments that reference these rates. The abandonment of these rates and transition to alternative rates could affect the value and liquidity of instruments that reference them and could affect investment strategy performance.
The disruptions caused by natural disasters, pandemics, or similar events could prevent the Fund from executing advantageous investment decisions in a timely manner and could negatively impact the Fund’s ability to achieve its investment objective and the value of the Fund’s investments.
40
2 The Fund’s expense ratios, as described in the most recent prospectus, are disclosed in the following “Fund expense ratios” table. The expense ratios below may differ from the expense ratios in the “Financial highlights” since they are based on different time periods and the expense ratios in the prospectus include acquired fund fees and expenses, if any. See Note 2 in “Notes to financial statements” for additional details. Please see the most recent prospectus and any applicable supplement(s) for additional information on these fee waivers and/or reimbursements. Please see the “Financial highlights” section in this report for the most recent expense ratios.
| Fund expense ratios | Class A | Class I | Class R6 | ||||
| Total annual operating expenses (without fee waivers) | 1.13% | 0.97% | 0.80% | ||||
| Net expenses (including fee waivers, if any) | 0.99% | 0.72% | 0.72% | ||||
| Type of waiver | Contractual | Contractual | Contractual | ||||
Performance of a $10,000 investment1
Class I and Class A shares
For the period May 18, 2017 (Fund’s inception) through September 30, 2022

| Starting value | Ending value | |||||||||
| Bloomberg US Corporate High-Yield Bond Index | $ | 10,000 | $ | 11,109 | |||||
| ICE BofA US High Yield Constrained Index | $ | 10,000 | $ | 11,018 | |||||
| Delaware Ivy High Yield Fund — Class I shares | $ | 10,000 | $ | 10,846 | |||||
| Delaware Ivy High Yield Fund — Class A shares | $ | 9,425 | $ | 10,078 | |||||
1The “Performance of a $10,000 investment” graph assumes $10,000 invested in Class I and Class A shares of the Fund on May 18, 2017, and includes the effect of a 5.75% front-end sales charge (for Class A shares) (the front-end sales charge in effect for Class A shares at the beginning of the period) and the reinvestment of all distributions. Effective July 1, 2021, the maximum front-end sales charge imposed on purchases for Class A shares changed from 5.75% to 4.50%. The graph does not reflect the deduction of taxes the shareholders would pay on Fund distributions or redemptions of Fund shares. Expense limitations were in effect for some or all of the periods shown. Performance would have been lower had expense limitations not been in effect. Expenses are listed in the “Fund expense ratios” table on page 41. Please note additional details on pages 40 through 42.
The graph also assumes $10,000 invested in in the ICE BofA US High Yield Constrained Index and Bloomberg US Corporate High-Yield Index as of May 18, 2017. The ICE BofA US High Yield Constrained Index tracks the performance of US dollar-denominated high yield corporate debt publicly issued in the US domestic market, but caps individual issuer exposure at 2% of the benchmark. The Bloomberg US Corporate High-Yield Bond Index is composed of US dollar-denominated, non-investment grade corporate bonds for which the middle rating among Moody’s Investors Service, Inc., Fitch, Inc., and Standard & Poor’s is Ba1/BB+/BB+ or below.
Index performance returns do not reflect any management fees, transaction costs, or expenses. Indices are unmanaged and one cannot invest directly in an index. Past performance does not guarantee future results.
41
Performance summaries
Delaware Ivy High Yield Fund
Performance of other Fund classes will vary due to different charges and expenses.
| Nasdaq symbols | CUSIPs | |||
| Class A | IPNAX | 46600A310 | ||
| Class I | IPNIX | 46600A294 | ||
| Class R6 | IPNNX | 46600A286 |
42
Performance summaries
Delaware Ivy International Small Cap Fund
September 30, 2022 (Unaudited)
The performance quoted represents past performance and does not guarantee future results. Investment return and principal value of an investment will fluctuate so that shares, when redeemed, may be worth more or less than their original cost. Current performance may be lower or higher than the performance quoted. Performance data current to the most recent month end may be obtained by calling 800 523-1918 or visiting delawarefunds.com/performance.
| Fund and benchmark performance1,2 | Average annual total returns through September 30, 2022 | ||||||
| 1 year | 5 year | Lifetime | |||||
| Class A (Est. January 10, 2017) | |||||||
| Excluding sales charge | -37.01%* | -2.70% | +0.89% | ||||
| Including sales charge | -40.62% | -3.85% | -0.15% | ||||
| Class C (Est. January 10, 2017) | |||||||
| Excluding sales charge | -37.56% | -3.46% | +0.11% | ||||
| Including sales charge | -38.09% | -3.46% | +0.11% | ||||
| Class I (Est. January 10, 2017) | |||||||
| Excluding sales charge | -36.81% | -2.35% | +1.25% | ||||
| Including sales charge | -36.81% | -2.35% | +1.25% | ||||
| Class R6 (Est. January 10, 2017) | |||||||
| Excluding sales charge | -36.80%* | -2.34% | +1.25% | ||||
| Including sales charge | -36.80% | -2.34% | +1.25% | ||||
| Class Y (Est. January 10, 2017) | |||||||
| Excluding sales charge | -37.08% | -2.72% | +0.87% | ||||
| Including sales charge | -37.08% | -2.72% | +0.87% | ||||
| MSCI ACWI Ex USA Small Cap Index (net) | -28.93% | -0.56% | +2.91%** | ||||
| MSCI EAFE Small Cap Index (net) | -32.06% | -1.79% | +2.09%** | ||||
*Total return for the report period presented in the table differs from the return in “Financial highlights.” The total return presented in the above table is calculated based on the net asset value (NAV) at which shareholder transactions were processed. The total return presented in “Financial highlights” is calculated in the same manner but also takes into account certain adjustments that are necessary under US generally accepted accounting principles required in the annual report.
**The benchmark lifetime returns are calculated using the Fund’s inception date.
1Returns reflect the reinvestment of all distributions and are presented both with and without the applicable sales charges described below. Returns do not reflect the deduction of taxes the shareholder would pay on Fund distributions or redemptions of Fund shares.
Expense limitations were in effect for certain classes during some or all of the periods shown in the “Fund and benchmark performance” table. Expenses for each class are listed on the “Fund expense ratios” table on page 44. Performance would have been lower had expense limitations not been in effect.
Class A shares are sold with a maximum front-end sales charge of 5.75%, and have an annual 12b-1 fee of 0.25% of average daily net assets. Performance for Class A shares, excluding sales charges, assumes that no front-end sales charge applied.
Class C shares are sold with a contingent deferred sales charge (CDSC) of 1.00% if redeemed during the first 12 months. They are also subject to an annual 12b-1 fee of 1.00% of average daily net assets. Performance for Class C shares, excluding sales charges assumes either that CDSCs did not apply or that the investment was not redeemed.
Class I shares are not subject to a sales charge and are offered for sale exclusively to certain eligible investors. In addition, Class I shares pay no distribution and service (12b-1) fee.
Effective July 1, 2021, Class N shares were renamed Class R6 shares. Class R6 shares are available only to certain investors. In addition, Class R6 shares do not pay any service fees, sub-accounting fees, and/or sub-transfer agency fees to any brokers, dealers, or other financial intermediaries. Class R6 shares pay no 12b-1 fee.
43
Performance summaries
Delaware Ivy International Small Cap Fund
Class Y shares are available only to certain investors. Class Y shares have an annual 12b-1 fee of 0.25% of average daily net assets.
International investments entail risks including fluctuation in currency values, differences in accounting principles, or economic or political instability. Investing in emerging markets can be riskier than investing in established foreign markets due to increased volatility, lower trading volume, and higher risk of market closures. In many emerging markets, there is substantially less publicly available information and the available information may be incomplete or misleading. Legal claims are generally more difficult to pursue.
Investments in small and/or medium-sized companies typically exhibit greater risk and higher volatility than larger, more established companies.
The disruptions caused by natural disasters, pandemics, or similar events could prevent the Fund from executing advantageous investment decisions in a timely manner and could negatively impact the Fund’s ability to achieve its investment objective and the value of the Fund’s investments.
2The Fund’s expense ratios, as described in the most recent prospectus, are disclosed in the following “Fund expense ratios” table. The expense ratios below may differ from the expense ratios in the “Financial highlights” since they are based on different time periods and the expense ratios in the prospectus include acquired fund fees and expenses, if any. See Note 2 in “Notes to financial statements” for additional details. Please see the “Financial highlights” section in this report for the most recent expense ratios.
| Fund expense ratios | Class A | Class C | Class I | Class R6 | Class Y | ||||||
| Total annual operating expenses (without fee waivers) | 1.59% | 2.34% | 1.40% | 1.22% | 1.63% | ||||||
| Net expenses (including fee waivers, if any) | 1.37% | 2.12% | 0.99% | 0.99% | 1.37% | ||||||
| Type of waiver | Contractual | Contractual | Contractual | Contractual | Contractual | ||||||
Performance of a $10,000 investment1
Class I and Class A shares
For the period January 10, 2017 (Fund’s inception) through September 30, 2022

| Starting value | Ending value | |||||||||
| MSCI ACWI Ex USA Small Cap Index (net) | $ | 10,000 | $ | 11,785 | |||||
| MSCI EAFE Small Cap Index (net) | $ | 10,000 | $ | 11,255 | |||||
| Delaware Ivy International Small Cap Fund — Class I shares | $ | 10,000 | $ | 10,735 | |||||
| Delaware Ivy International Small Cap Fund — Class A shares | $ | 9,425 | $ | 9,914 | |||||
44
1The “Performance of a $10,000 investment” graph assumes $10,000 invested in Class I and Class A shares of the Fund on January 10, 2017, and includes the effect of a 5.75% front-end sales charge (for Class A shares) and the reinvestment of all distributions. The graph does not reflect the deduction of taxes the shareholders would pay on Fund distributions or redemptions of Fund shares. Expense limitations were in effect for some or all of the periods shown. Performance would have been lower had expense limitations not been in effect. Expenses are listed in the “Fund expense ratios” table on page 44. Please note additional details on pages 43 through 45.
The graph also assumes $10,000 invested in the MSCI ACWI Ex USA Small Cap Index and MSCI EAFE Small Cap Index as of January 10, 2017. The MSCI ACWI (All Country World Index) ex USA Small Cap Index represents small-cap stocks across 22 of 23 developed market countries (excluding the United States) and 27 emerging market countries. The index covers approximately 14% of the global equity opportunity set outside the US. The MSCI EAFE (Europe, Australasia, Far East) Small Cap Index represents small-cap stocks across developed market countries around the world, excluding the United States and Canada. The index covers approximately 14% of the free float-adjusted market capitalization in each country.
Index performance returns do not reflect any management fees, transaction costs, or expenses. Indices are unmanaged and one cannot invest directly in an index. Past performance does not guarantee future results.
Performance of other Fund classes will vary due to different charges and expenses.
| Nasdaq symbols | CUSIPs | |||
| Class A | IVJAX | 46600A682 | ||
| Class C | IVJCX | 46600A674 | ||
| Class I | IVJIX | 46600A666 | ||
| Class R6 | IVJRX | 46600A690 | ||
| Class Y | IVJYX | 46600A658 |
45
Performance summaries
Delaware Ivy Multi-Asset Income Fund
September 30, 2022 (Unaudited)
The performance quoted represents past performance and does not guarantee future results. Investment return and principal value of an investment will fluctuate so that shares, when redeemed, may be worth more or less than their original cost. Current performance may be lower or higher than the performance quoted. Performance data current to the most recent month end may be obtained by calling 800 523-1918 or visiting delawarefunds.com/performance.
| Fund and benchmark performance1,2 | Average annual total returns through September 30, 2022 | ||||||
| 1 year | 5 year | Lifetime | |||||
| Class A (Est. October 1, 2015) | |||||||
| Excluding sales charge | -16.99% | +0.93% | +2.83% | ||||
| Including sales charge | -21.78% | -0.26% | +1.97% | ||||
| Class C (Est. October 1, 2015) | |||||||
| Excluding sales charge | -17.64%* | +0.15% | +2.06% | ||||
| Including sales charge | -18.43% | +0.15% | +2.06% | ||||
| Class I (Est. October 1, 2015) | |||||||
| Excluding sales charge | -16.64% | +1.34% | +3.22% | ||||
| Including sales charge | -16.64% | +1.34% | +3.22% | ||||
| Class R6 (Est. October 1, 2015) | |||||||
| Excluding sales charge | -16.60% | +1.38% | +3.28% | ||||
| Including sales charge | -16.60% | +1.38% | +3.28% | ||||
| Class Y (Est. October 1, 2015) | |||||||
| Excluding sales charge | -16.94% | +0.96% | +2.88% | ||||
| Including sales charge | -16.94% | +0.96% | +2.88% | ||||
| 50% MSCI ACWI (All Country World Index) Index (Net) + 50% ICE BofA US High Yield Index | -20.61% | +0.28% | +3.51%** | ||||
| MSCI ACWI Index (Net) | -20.66% | +4.44% | +7.42%** | ||||
| MSCI ACWI Index (Gross) | -20.29% | +4.96% | +7.98%** | ||||
| ICE BofA US High Yield Index | -14.06% | +1.41% | +4.04** | ||||
| 50% FTSE All-World High Dividend Yield Index + 50% ICE BofA US High Yield Index | -10.79% | +2.47% | +5.35%** | ||||
| FTSE All-World High Dividend Yield Index | -9.53% | +2.88% | +6.13%** | ||||
*Total return for the report period presented in the table differs from the return in “Financial highlights.” The total return presented in the above table is calculated based on the net asset value (NAV) at which shareholder transactions were processed. The total return presented in “Financial highlights” is calculated in the same manner but also takes into account certain adjustments that are necessary under US generally accepted accounting principles required in the annual report.
**The benchmark lifetime return is calculated using the Fund’s inception date.
1Returns reflect the reinvestment of all distributions and are presented both with and without the applicable sales charges described below. Returns do not reflect the deduction of taxes the shareholder would pay on Fund distributions or redemptions of Fund shares.
Expense limitations were in effect for certain classes during some or all of the periods shown in the “Fund and benchmark performance” table. Expenses for each class are listed on the “Fund expense ratios” table on page 47. Performance would have been lower had expense limitations not been in effect.
Class A shares are sold with a maximum front-end sales charge of 5.75%, and have an annual 12b-1 fee of 0.25% of average daily net assets. Performance for Class A shares, excluding sales charges, assumes that no front-end sales charge applied.
Class C shares are sold with a contingent deferred sales charge (CDSC) of 1.00% if redeemed during the first 12 months. They are also subject to an annual 12b-1 fee of 1.00% of average daily net assets. Performance for Class C shares, excluding sales charges, assumes either that CDSCs did not apply or that the investment was not redeemed.
46
Class I shares are not subject to a sales charge and are offered for sale exclusively to certain eligible investors. In addition, Class I shares pay no distribution and service (12b-1) fee.
Effective July 1, 2021, Class N shares were renamed Class R6 shares. Class R6 shares are available only to certain investors. In addition, Class R6 shares do not pay any service fees, sub-accounting fees, and/or sub-transfer agency fees to any brokers, dealers, or other financial intermediaries. Class R6 shares pay no 12b-1 fee.
Class Y shares are available only to certain investors. Class Y shares have an annual 12b-1 fee of 0.25% of average daily net assets.
Fixed income securities and bond funds can lose value, and investors can lose principal as interest rates rise. They also may be affected by economic conditions that hinder an issuer’s ability to make interest and principal payments on its debt. This includes prepayment risk, the risk that the principal of a bond that is held by a portfolio will be prepaid prior to maturity at the time when interest rates are lower than what the bond was paying. A portfolio may then have to reinvest that money at a lower interest rate.
Risk controls and asset allocation models do not promise any level of performance or guarantee against loss of principal.
International investments entail risks including fluctuation in currency values, differences in accounting principles, or economic or political instability. Investing in emerging markets can be riskier than investing in established foreign markets due to increased volatility, lower trading volume, and higher risk of market closures. In many emerging markets, there is substantially less publicly available information and the available information may be incomplete or misleading. Legal claims are generally more difficult to pursue.
Investing in the real estate industry includes risks such as declines in real estate value, lack of availability of mortgage funds, overbuilding, extended vacancies, increases in property taxes, changes in zoning laws, costs from cleanup of environmental problems, uninsured damages, variations in rents, and changes in interest rates.
IBOR risk is the risk that changes related to the use of the London interbank offered rate (LIBOR) or similar rates (such as EONIA) could have adverse impacts on financial instruments that reference these rates. The abandonment of these rates and transition to alternative rates could affect the value and liquidity of instruments that reference them and could affect investment strategy performance.
The disruptions caused by natural disasters, pandemics, or similar events could prevent the Fund from executing advantageous investment decisions in a timely manner and could negatively impact the Fund’s ability to achieve its investment objective and the value of the Fund’s investments.
2 The Fund’s expense ratios, as described in the most recent prospectus, are disclosed in the following “Fund expense ratios” table. The expense ratios below may differ from the expense ratios in the “Financial highlights” since they are based on different time periods and the expense ratios in the prospectus include acquired fund fees and expenses, if any. See Note 2 in “Notes to financial statements” for additional details. Please see the most recent prospectus and any applicable supplement(s) for additional information on these fee waivers and/or reimbursements. Please see the “Financial highlights” section in this report for the most recent expense ratios.
| Fund expense ratios | Class A | Class C | Class I | Class R6 | Class Y | ||||||
| Total annual operating expenses (without fee waivers) | 1.24% | 2.02% | 0.99% | 0.84% | 1.22% | ||||||
| Net expenses (including fee waivers, if any) | 1.17% | 1.95% | 0.75% | 0.75% | 1.15% | ||||||
| Type of waiver | Contractual | Contractual | Contractual | Contractual | Contractual | ||||||
47
Performance summaries
Delaware Ivy Multi-Asset Income Fund
Performance of a $10,000 investment1
Class I and Class A shares
For the period October 1, 2015 (Fund’s inception) through September 30, 2022
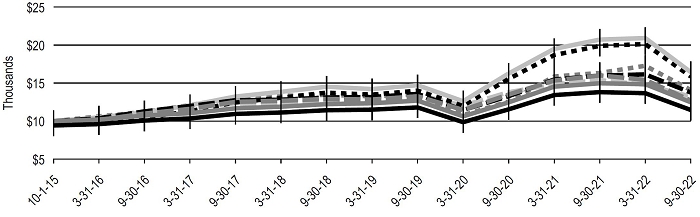
| Starting value | Ending value | |||||||||
| MSCI ACWI (All Country World Index) Index (Net) | $ | 10,000 | $ | 16,439 | |||||
 | MSCI ACWI (All Country World Index) Index (Gross) | $ | 10,000 | $ | 15,862 | |||||
 | FTSE All-World High Dividend Yield Index | $ | 10,000 | $ | 14,081 | |||||
| 50% FTSE All-World High Dividend Yield Index + 50% ICE BofA US High Yield Index | $ | 10,000 | $ | 13,758 | |||||
 | ICE BofA US High Yield Index | $ | 10,000 | $ | 13,221 | |||||
 | 50% MSCI ACWI (All Country World Index) + 50% ICE BofA US High Yield Index | $ | 10,000 | $ | 12,701 | |||||
| Delaware Ivy Multi-Asset Income Fund — Class I shares | $ | 10,000 | $ | 12,482 | |||||
| Delaware Ivy Multi-Asset Income Fund — Class A shares | $ | 9,425 | $ | 11,461 | |||||
1The “Performance of a $10,000 investment” graph assumes $10,000 invested in Class I and Class A shares of the Fund on October 1, 2015, and includes the effect of a 5.75% front-end sales charge (for Class A shares) and the reinvestment of all distributions.
The graph does not reflect the deduction of taxes the shareholders would pay on Fund distributions or redemptions of Fund shares. Expense limitations were in effect for some or all of the periods shown. Performance would have been lower had expense limitations not been in effect. Expenses are listed in the “Fund expense ratios” table on page 47. Please note additional details on pages 46 through 49.
The graph also assumes $10,000 invested in 50% MSCI ACWI Index + 50% ICE BofA US High Yield Index, 50% FTSE All-World High Dividend Yield Index + 50% ICE BofA US High Yield Index, MSCI ACWI Index (Net), MSCI ACWI Index (Gross), FTSE All-World High Dividend Yield Index and ICE BofA US High Yield Index as of October 1, 2015. The ICE BofA US High Yield Index tracks the performance of US dollar-denominated below-investment-grade corporate debt publicly issued in the US domestic market. Qualifying securities must have a below-investment-grade rating (based on an average of Moody’s, S&P, and Fitch), at least 18 months to final maturity at the time of issuance, at least one year remaining term to final maturity as of the rebalancing date, a fixed coupon schedule, and a minimum amount outstanding of $250 million. The MSCI ACWI (All Country World Index) represents large- and mid-cap stocks across developed and emerging markets worldwide. The index covers approximately 85% of the global investable equity opportunity set. Index “net” return approximates the minimum possible dividend reinvestment, after deduction of withholding tax at the highest possible rate. Index “gross” return approximates the maximum possible dividend reinvestment. The FTSE All-World High Dividend Yield Index represents the performance of companies after implementing a forecast dividend yield ranking process. The index comprises stocks that are characterized by higher-than-average dividend yield based on the FTSE All-World Index, which is part of the FTSE Global Equity Index Series.
Index performance returns do not reflect any management fees, transaction costs, or expenses. Indices are unmanaged and one cannot invest directly in an index. Past performance does not guarantee future results.
48
Performance of other Fund classes will vary due to different charges and expenses.
| Nasdaq symbols | CUSIPs | |||
| Class A | IMAAX | 46600B847 | ||
| Class C | IMACX | 46600B839 | ||
| Class I | IMAIX | 46600B821 | ||
| Class R6 | IMURX | 46600B813 | ||
| Class Y | IMAYX | 46600B797 |
49
Performance summaries
Delaware Ivy Strategic Income Fund
September 30, 2022 (Unaudited)
The performance quoted represents past performance and does not guarantee future results. Investment return and principal value of an investment will fluctuate so that shares, when redeemed, may be worth more or less than their original cost. Current performance may be lower or higher than the performance quoted. Performance data current to the most recent month end may be obtained by calling 800 523-1918 or visiting delawarefunds.com/performance.
| Fund and benchmark performance1,2 | Average annual total returns through September 30, 2022 | ||||||
| 1 year | 5 year | Lifetime | |||||
| Class A (Est. October 1, 2015) | |||||||
| Excluding sales charge | -13.81% | +0.55% | +1.76% | ||||
| Including sales charge | -17.68% | -0.64% | +0.90% | ||||
| Class C (Est. October 1, 2015) | |||||||
| Excluding sales charge | -14.43% | -0.22% | +1.01% | ||||
| Including sales charge | -15.26% | -0.22% | +1.01% | ||||
| Class I (Est. October 1, 2015) | |||||||
| Excluding sales charge | -13.36% | +0.95% | +2.13% | ||||
| Including sales charge | -13.36% | +0.95% | +2.13% | ||||
| Class R6 (Est. October 1, 2015) | |||||||
| Excluding sales charge | -13.44% | +0.94% | +2.15% | ||||
| Including sales charge | -13.44% | +0.94% | +2.15% | ||||
| Class Y (Est. October 1, 2015) | |||||||
| Excluding sales charge | -13.80% | +0.56% | +1.79% | ||||
| Including sales charge | -13.80% | +0.56% | +1.79% | ||||
| Bloomberg US Aggregate Index | -14.61% | -0.27% | +0.53%* | ||||
| 50% Bloomberg US Universal Index + 50% ICE BofA US High Yield Index | -14.49% | +0.65% | +2.48%** | ||||
| Bloomberg US Universal Index | -14.90% | -0.05% | +0.94%* | ||||
| ICE BofA US High Yield Index | -14.06% | +1.41% | +4.04%* | ||||
*The benchmark lifetime return is calculated using the Fund’s inception date.
**The benchmark lifetime return is calculated using the Fund’s month-end prior inception date.
1Returns reflect the reinvestment of all distributions and are presented both with and without the applicable sales charges described below. Returns do not reflect the deduction of taxes the shareholder would pay on Fund distributions or redemptions of Fund shares.
Expense limitations were in effect for certain classes during some or all of the periods shown in the “Fund and benchmark performance” table. Expenses for each class are listed on the “Fund expense ratios” table on page 51. Performance would have been lower had expense limitations not been in effect.
Class I shares are not subject to a sales charge and are offered for sale exclusively to certain eligible investors. In addition, Class I shares pay no distribution and service (12b-1) fee.
Class A shares are sold with a maximum front-end sales charge of 4.50%, and have an annual 12b-1 fee of 0.25% of average daily net assets. Performance for Class A shares, excluding sales charges, assumes that no front-end sales charge applied. Effective July 1, 2021, the maximum sales charge (load) imposed on purchases (as a % of offering price) for Class A shares changed from 5.75% to 4.50%.
Class C shares are sold with a contingent deferred sales charge (CDSC) of 1.00% if redeemed during the first 12 months. They are also subject to an annual 12b-1 fee of 1.00% of average daily net assets. Performance for Class C shares, excluding sales charges, assumes either that CDSCs did not apply or that the investment was not redeemed.
Effective July 1, 2021, Class N shares were renamed Class R6 shares. Class R6 shares are available only to certain investors. In addition, Class R6 shares do not pay any service fees, sub-accounting fees, and/or sub-transfer agency fees to any brokers, dealers, or other financial intermediaries. Class R6 shares pay no 12b-1 fee.
50
Class Y shares are available only to certain investors. Class Y shares have an annual 12b-1 fee of 0.25% of average daily net assets.
Fixed income securities and bond funds can lose value, and investors can lose principal as interest rates rise. They also may be affected by economic conditions that hinder an issuer’s ability to make interest and principal payments on its debt. This includes prepayment risk, the risk that the principal of a bond that is held by a portfolio will be prepaid prior to maturity at the time when interest rates are lower than what the bond was paying. A portfolio may then have to reinvest that money at a lower interest rate.
High yielding, non-investment-grade bonds (junk bonds) involve higher risk than investment grade bonds. The high yield secondary market is particularly susceptible to liquidity problems when institutional investors, such as mutual funds and certain other financial institutions, temporarily stop buying bonds for regulatory, financial, or other reasons. In addition, a less liquid secondary market makes it more difficult to obtain precise valuations of the high yield securities.
The Fund may invest in derivatives, which may involve additional expenses and are subject to risk, including the risk that an underlying security or securities index moves in the opposite direction from what the portfolio manager anticipated. A derivatives transaction depends upon the counterparties’ ability to fulfil their contractual obligations.
International investments entail risks including fluctuation in currency values, differences in accounting principles, or economic or political instability. Investing in emerging markets can be riskier than investing in established foreign markets due to increased volatility, lower trading volume, and higher risk of market closures. In many emerging markets, there is substantially less publicly available information and the available information may be incomplete or misleading. Legal claims are generally more difficult to pursue.
IBOR risk is the risk that changes related to the use of the London interbank offered rate (LIBOR) or similar rates (such as EONIA) could have adverse impacts on financial instruments that reference these rates. The abandonment of these rates and transition to alternative rates could affect the value and liquidity of instruments that reference them and could affect investment strategy performance.
The disruptions caused by natural disasters, pandemics, or similar events could prevent the Fund from executing advantageous investment decisions in a timely manner and could negatively impact the Fund’s ability to achieve its investment objective and the value of the Fund’s investments.
2The Fund’s expense ratios, as described in the most recent prospectus, are disclosed in the following “Fund expense ratios” table. The expense ratios below may differ from the expense ratios in the “Financial highlights” since they are based on different time periods and the expense ratios in the prospectus include acquired fund fees and expenses, if any. See Note 2 in “Notes to financial statements” for additional details. Please see the most recent prospectus and any applicable supplement(s) for additional information on these fee waivers and/or reimbursements. Please see the “Financial highlights” section in this report for the most recent expense ratios.
| Fund expense ratios | Class A | Class C | Class I | Class R6 | Class Y | ||||||
| Total annual operating expenses (without fee waivers) | 1.19% | 2.05% | 0.98% | 0.84% | 1.21% | ||||||
| Net expenses (including fee waivers, if any) | 1.05% | 1.83% | 0.68% | 0.68% | 1.05% | ||||||
| Type of waiver | Contractual | Contractual | Contractual | Contractual | Contractual |
51
Performance summaries
Delaware Ivy Strategic Income Fund
Performance of a $10,000 investment1
Class I and Class A shares
For the period October 1, 2015 (Fund’s inception) through September 30, 2022

| Starting value | Ending value | |||||||||
| ICE BofA US High Yield Index | $ | 10,000 | $ | 13,221 | |||||
| 50% Bloomberg US Universal Index + 50% ICE BofA US High Yield Index | $ | 10,000 | $ | 11,876 | |||||
| Delaware Ivy Strategic Income Fund — Class I shares | $ | 10,000 | $ | 11,594 | |||||
| Bloomberg US Universal Index | $ | 10,000 | $ | 10,681 | |||||
| Delaware Ivy Strategic Income Fund — Class A shares | $ | 9,425 | $ | 10,651 | |||||
| Bloomberg US Aggregate Index | $ | 10,000 | $ | 10,379 | |||||
1The “Performance of a $10,000 investment” graph assumes $10,000 invested in Class I and Class A shares of the Fund on October 1, 2015, and includes the effect of a 5.75% front-end sales charge (for Class A shares) (the front-end sales charge in effect for Class A shares at the beginning of the period) and the reinvestment of all distributions. Effective July 1, 2021, the maximum front-end sales charge imposed on purchases for Class A shares changed from 5.75% to 4.50%. The graph does not reflect the deduction of taxes the shareholders would pay on Fund distributions or redemptions of Fund shares. Expense limitations may have been in effect for some or all of the periods shown. Performance would have been lower had expense limitations not been in effect. Expenses are listed in the “Fund expense ratios” table on page 51. Please note additional details on pages 50 through 53.
The graph also assumes $10,000 invested in 50% Bloomberg US Universal Index + 50% ICE BofA US High Yield Index, Bloomberg US Universal Index, ICE BofA US High Yield Index, and Bloomberg US Aggregate Index as of October 1, 2015. The Bloomberg US Aggregate Index is a broad-based benchmark that measures the investment grade, US dollar-denominated, fixed-rate taxable bond market. The Bloomberg US Universal Index represents the union of the US Aggregate Index, US Corporate High Yield Index, Investment Grade 144A Index, Eurodollar Index, US Emerging Markets Index, and the non-ERISA eligible portion of the CMBS Index. The index covers US dollar-denominated, taxable bonds that are rated either investment grade or high-yield. The ICE BofA US High Yield Index tracks the performance of US dollar-denominated below-investment-grade corporate debt publicly issued in the US domestic market. Qualifying securities must have a below-investment-grade rating (based on an average of Moody’s, S&P, and Fitch), at least 18 months to final maturity at the time of issuance, at least one year remaining term to final maturity as of the rebalancing date, a fixed coupon schedule, and a minimum amount outstanding of $250 million.
Index performance returns do not reflect any management fees, transaction costs, or expenses. Indices are unmanaged and one cannot invest directly in an index. Past performance does not guarantee future results.
52
Performance of other Fund classes will vary due to different charges and expenses.
| Nasdaq symbols | CUSIPs | |||
| Class A | IAPOX | 46600B805 | ||
| Class C | ICPOX | 46600B888 | ||
| Class I | IIPOX | 46600B870 | ||
| Class R6 | IRPOX | 46600B862 | ||
| Class Y | IYPOX | 46600B854 |
53
Performance summaries
Delaware Ivy Total Return Bond Fund
September 30, 2022 (Unaudited)
The performance quoted represents past performance and does not guarantee future results. Investment return and principal value of an investment will fluctuate so that shares, when redeemed, may be worth more or less than their original cost. Current performance may be lower or higher than the performance quoted. Performance data current to the most recent month end may be obtained by calling 800 523-1918 or visiting delawarefunds.com/performance.
| Fund and benchmark performance1,2 | Average annual total returns through September 30, 2022 | ||||||
| 1 year | 5 year | Lifetime | |||||
| Class A (Est. January 4, 2016) | |||||||
| Excluding sales charge | -14.50%* | -1.22% | -0.42% | ||||
| Including sales charge | -18.35% | -2.38% | -1.29% | ||||
| Class C (Est. January 4, 2016) | |||||||
| Excluding sales charge | -15.17%* | -1.92% | -1.13% | ||||
| Including sales charge | -16.00% | -1.92% | -1.13% | ||||
| Class I (Est. January 4, 2016) | |||||||
| Excluding sales charge | -14.28%* | -0.99% | -0.19% | ||||
| Including sales charge | -14.28% | -0.99% | -0.19% | ||||
| Class R6 (Est. January 4, 2016) | |||||||
| Excluding sales charge | -14.20%* | -0.84% | -0.06% | ||||
| Including sales charge | -14.20% | -0.84% | -0.06% | ||||
| Bloomberg Global Aggregate 1-10 Year Index, Hedged to USD | -8.77% | +0.54% | +1.06%** | ||||
| Bloomberg US Treasury Bills 1-3 Month Index | +0.64% | +1.10% | +0.94%** | ||||
*Total return for the report period presented in the table differs from the return in “Financial highlights.” The total return presented in the above table is calculated based on the net asset value (NAV) at which shareholder transactions were processed. The total return presented in “Financial highlights” is calculated in the same manner but also takes into account certain adjustments that are necessary under US generally accepted accounting principles required in the annual report.
**The benchmark lifetime return is calculated using the Fund’s inception date.
1Returns reflect the reinvestment of all distributions and are presented both with and without the applicable sales charges described below. Returns do not reflect the deduction of taxes the shareholder would pay on Fund distributions or redemptions of Fund shares.
Expense limitations were in effect for certain classes during some or all of the periods shown in the “Fund and benchmark performance” table. Expenses for each class are listed on the “Fund expense ratios” table on page 55. Performance would have been lower had expense limitations not been in effect.
Class I shares are not subject to a sales charge and are offered for sale exclusively to certain eligible investors. In addition, Class I shares pay no distribution and service (12b-1) fee.
Class A shares are sold with a maximum front-end sales charge of 4.50%, and have an annual 12b-1 fee of 0.25% of average daily net assets. Performance for Class A shares, excluding sales charges, assumes that no front-end sales charge applied. Effective July 1, 2021, the maximum sales charge (load) imposed on purchases (as a % of offering price) for Class A shares changed from 5.75% to 4.50%.
Class C shares are sold with a contingent deferred sales charge (CDSC) of 1.00% if redeemed during the first 12 months. They are also subject to an annual 12b-1 fee of 1.00% of average daily net assets. Performance for Class C shares, excluding sales charges, assumes either that CDSCs did not apply or that the investment was not redeemed.
Effective July 1, 2021, Class N shares were renamed Class R6 shares. Class R6 shares are available only to certain investors. In addition, Class R6 shares do not pay any service fees, sub-accounting fees, and/or sub-transfer agency fees to any brokers, dealers, or other financial intermediaries. Class R6 shares pay no 12b-1 fee.
Fixed income securities and bond funds can lose value, and investors can lose principal as interest rates rise. They also may be affected by economic conditions that hinder an issuer’s ability to make interest and principal payments on its debt. This includes
54
prepayment risk, the risk that the principal of a bond that is held by a portfolio will be prepaid prior to maturity at the time when interest rates are lower than what the bond was paying. A portfolio may then have to reinvest that money at a lower interest rate.
High yielding, non-investment-grade bonds (junk bonds) involve higher risk than investment grade bonds. The high yield secondary market is particularly susceptible to liquidity problems when institutional investors, such as mutual funds and certain other financial institutions, temporarily stop buying bonds for regulatory, financial, or other reasons. In addition, a less liquid secondary market makes it more difficult to obtain precise valuations of the high yield securities.
The Fund may invest in derivatives, which may involve additional expenses and are subject to risk, including the risk that an underlying security or securities index moves in the opposite direction from what the portfolio manager anticipated. A derivatives transaction depends upon the counterparties’ ability to fulfil their contractual obligations.
International investments entail risks including fluctuation in currency values, differences in accounting principles, or economic or political instability. Investing in emerging markets can be riskier than investing in established foreign markets due to increased volatility, lower trading volume, and higher risk of market closures. In many emerging markets, there is substantially less publicly available information and the available information may be incomplete or misleading. Legal claims are generally more difficult to pursue.
IBOR risk is the risk that changes related to the use of the London interbank offered rate (LIBOR) or similar rates (such as EONIA) could have adverse impacts on financial instruments that reference these rates. The abandonment of these rates and transition to alternative rates could affect the value and liquidity of instruments that reference them and could affect investment strategy performance.
The disruptions caused by natural disasters, pandemics, or similar events could prevent the Fund from executing advantageous investment decisions in a timely manner and could negatively impact the Fund’s ability to achieve its investment objective and the value of the Fund’s investments.
2 The Fund’s expense ratios, as described in the most recent prospectus, are disclosed in the following “Fund expense ratios” table. The expense ratios below may differ from the expense ratios in the “Financial highlights” since they are based on different time periods and the expense ratios in the prospectus include acquired fund fees and expenses, if any. See Note 2 in “Notes to financial statements” for additional details. Please see the most recent prospectus and any applicable supplement(s) for additional information on these fee waivers and/or reimbursements. Please see the “Financial highlights” section in this report for the most recent expense ratios.
| Fund expense ratios | Class A | Class C | Class I | Class R6 | |||||
| Total annual operating expenses (without fee waivers) | 1.42% | 2.13% | 1.23% | 1.06% | |||||
| Net expenses (including fee waivers, if any) | 1.24% | 1.95% | 1.00% | 0.87% | |||||
| Type of waiver | Contractual | Contractual | Contractual | Contractual | |||||
55
Performance summaries
Delaware Ivy Total Return Bond Fund
Performance of a $10,000 investment1
Class I and Class A shares
For the period January 4, 2016 (Fund’s inception) through September 30, 2022

| Starting value | Ending value | |||||||||
| Bloomberg Global Aggregate 1-10 Year Index, Hedged to USD | $ | 10,000 | $ | 11,771 | |||||
| Bloomberg US Treasury Bills 1-3 Month Index | $ | 10,000 | $ | 10,648 | |||||
| Delaware Ivy Total Return Bond Fund — Class I shares | $ | 10,000 | $ | 9,872 | |||||
| Delaware Ivy Total Return Bond Fund — Class A shares | $ | 9,425 | $ | 9,161 | |||||
1The “Performance of a $10,000 investment” graph assumes $10,000 invested in Class I and Class A shares of the Fund on January 4, 2016, and includes the effect of a 5.75% front-end sales charge (for Class A shares) (the front-end sales charge in effect for Class A shares at the beginning of the period) and the reinvestment of all distributions. Effective July 1, 2021, the maximum front-end sales charge imposed on purchases for Class A shares changed from 5.75% to 4.50%. The graph does not reflect the deduction of taxes the shareholders would pay on Fund distributions or redemptions of Fund shares. Expense limitations may have been in effect for some or all of the periods shown. Performance would have been lower had expense limitations not been in effect. Expenses are listed in the “Fund expense ratios” table on page 55. Please note additional details on pages 54 through 56.
The graph also assumes $10,000 invested in the Bloomberg Global Aggregate 1-10 Year Index Hedged to USD and the Bloomberg US Treasury Bills 1-3 Month Index as of January 4, 2016. The Bloomberg Global Aggregate 1-10 Year Index, Hedged to USD, provides a broad-based measure of the global investment grade fixed-rate debt market with a maturity greater of than 1 year and less than 10 years. The Bloomberg US Treasury Bills 1-3 Month Index measures the performance of US Treasury bills that have a remaining maturity of greater than or equal to one month and less than three months.
Index performance returns do not reflect any management fees, transaction costs, or expenses. Indices are unmanaged and one cannot invest directly in an index. Past performance does not guarantee future results.
Performance of other Fund classes will vary due to different charges and expenses.
| Nasdaq symbols | CUSIPs | |||
| Class A | IRBAX | 46600B789 | ||
| Class C | IRBCX | 46600B771 | ||
| Class I | IRBIX | 46600B763 | ||
| Class R6 | IRBRX | 46600B755 |
56
For the six-month period from April 1, 2022 to September 30, 2022 (Unaudited)
As a shareholder of a Fund, you incur two types of costs:
(1) transaction costs, including sales charges (loads) on purchase payments, reinvested dividends, or other distributions; redemption fees; and exchange fees; and (2) ongoing costs, including management fees; distribution and service (12b-1) fees; and other Fund expenses. The following examples are intended to help you understand your ongoing costs (in dollars) of investing in a Fund and to compare these costs with the ongoing costs of investing in other mutual funds.
The examples are based on an investment of $1,000 invested at the beginning of the period and held for the entire six-month period from April 1, 2022 to September 30, 2022.
Actual expenses
The first section of the tables shown, “Actual Fund return,” provides information about actual account values and actual expenses. You may use the information in this section of the table, together with the amount you invested, to estimate the expenses that you paid over the period. Simply divide your account value by $1,000 (for example, an $8,600 account value divided by $1,000 = 8.6), then multiply the result by the number in the first section under the heading entitled “Expenses Paid During Period” to estimate the expenses you paid on your account during this period.
Hypothetical example for comparison purposes
The second section of the tables shown, “Hypothetical 5% return,” provides information about hypothetical account values and hypothetical expenses based on a Fund’s actual expense ratio and an assumed rate of return of 5% per year before expenses, which is not the Funds’ actual return. The hypothetical account values and expenses may not be used to estimate the actual ending account balance or expenses you paid for the period. You may use this information to compare the ongoing costs of investing in each Fund and other funds. To do so, compare this 5% hypothetical example with the 5% hypothetical examples that appear in the shareholder reports of the other funds.
Please note that the expenses shown in the tables are meant to highlight your ongoing costs only and do not reflect any transactional costs, such as sales charges (loads), redemption fees, or exchange fees. Therefore, the second section of each table is useful in comparing ongoing costs only, and will not help you determine the relative total costs of owning different funds. In addition, if these transactional costs were included, your costs would have been higher. The Funds’ expenses shown in the tables reflect fee waivers in effect and assume reinvestment of all dividends and distributions.
Delaware Ivy California Municipal High Income Fund
Expense analysis of an investment of $1,000
| Beginning Account Value 4/1/22 | Ending Account Value 9/30/22 | Annualized Expense Ratio | Expenses Paid During Period 4/1/22 to 9/30/22* | |||||||||||||
| Actual Fund return† | ||||||||||||||||
| Class A | $ | 1,000.00 | $ | 910.80 | 0.80% | $ | 3.83 | |||||||||
| Class C | 1,000.00 | 906.20 | 1.75% | 8.36 | ||||||||||||
| Class I | 1,000.00 | 911.70 | 0.60% | 2.88 | ||||||||||||
| Class Y | 1,000.00 | 910.80 | 0.80% | 3.83 | ||||||||||||
| Hypothetical 5% return (5% return before expenses) | ||||||||||||||||
| Class A | $ | 1,000.00 | $ | 1,021.06 | 0.80% | $ | 4.05 | |||||||||
| Class C | 1,000.00 | 1,016.29 | 1.75% | 8.85 | ||||||||||||
| Class I | 1,000.00 | 1,022.06 | 0.60% | 3.04 | ||||||||||||
| Class Y | 1,000.00 | 1,021.06 | 0.80% | 4.05 | ||||||||||||
Delaware Ivy Corporate Bond Fund
Expense analysis of an investment of $1,000
| Beginning Account Value 4/1/22 | Ending Account Value 9/30/22 | Annualized Expense Ratio | Expenses Paid During Period 4/1/22 to 9/30/22* | |||||||||||||
| Actual Fund return† | ||||||||||||||||
| Class A | $ | 1,000.00 | $ | 873.20 | 1.06% | $ | 4.98 | |||||||||
| Class C | 1,000.00 | 868.60 | 2.16% | 10.12 | ||||||||||||
| Class I | 1,000.00 | 874.90 | 0.74% | 3.48 | ||||||||||||
| Class Y | 1,000.00 | 873.70 | 0.98% | 4.60 | ||||||||||||
| Hypothetical 5% return (5% return before expenses) | ||||||||||||||||
| Class A | $ | 1,000.00 | $ | 1,019.75 | 1.06% | $ | 5.37 | |||||||||
| Class C | 1,000.00 | 1,014.24 | 2.16% | 10.91 | ||||||||||||
| Class I | 1,000.00 | 1,021.36 | 0.74% | 3.75 | ||||||||||||
| Class Y | 1,000.00 | 1,020.16 | 0.98% | 4.96 | ||||||||||||
57
Disclosure of Fund expenses
Delaware Ivy Crossover Credit Fund
Expense analysis of an investment of $1,000
| Beginning Account Value 4/1/22 | Ending Account Value 9/30/22 | Annualized Expense Ratio | Expenses Paid During Period 4/1/22 to 9/30/22* | |||||||||||||
| Actual Fund return† | ||||||||||||||||
| Class A | $ | 1,000.00 | $ | 865.20 | 0.90% | $ | 4.21 | |||||||||
| Class I | 1,000.00 | 866.50 | 0.65% | 3.04 | ||||||||||||
| Class Y | 1,000.00 | 864.50 | 0.90% | 4.21 | ||||||||||||
| Hypothetical 5% return (5% return before expenses) | ||||||||||||||||
| Class A | $ | 1,000.00 | $ | 1,020.56 | 0.90% | $ | 4.56 | |||||||||
| Class I | 1,000.00 | 1,021.81 | 0.65% | 3.29 | ||||||||||||
| Class Y | 1,000.00 | 1,020.56 | 0.90% | 4.56 | ||||||||||||
Delaware Ivy Emerging Markets Local Currency Debt Fund
Expense analysis of an investment of $1,000
| Beginning Account Value 4/1/22 | Ending Account Value 9/30/22 | Annualized Expense Ratio | Expenses Paid During Period 4/1/22 to 9/30/22* | |||||||||||||
| Actual Fund return† | ||||||||||||||||
| Class A | $ | 1,000.00 | $ | 855.00 | 1.23% | $ | 5.72 | |||||||||
| Class C | 1,000.00 | 851.90 | 2.00% | 9.28 | ||||||||||||
| Class I | 1,000.00 | 857.30 | 0.80% | 3.72 | ||||||||||||
| Class R6 | 1,000.00 | 856.10 | 0.80% | 3.72 | ||||||||||||
| Class Y | 1,000.00 | 855.00 | 1.25% | 5.81 | ||||||||||||
| Hypothetical 5% return (5% return before expenses) | ||||||||||||||||
| Class A | $ | 1,000.00 | $ | 1,018.90 | 1.23% | $ | 6.23 | |||||||||
| Class C | 1,000.00 | 1,015.04 | 2.00% | 10.10 | ||||||||||||
| Class I | 1,000.00 | 1,021.06 | 0.80% | 4.05 | ||||||||||||
| Class R6 | 1,000.00 | 1,021.06 | 0.80% | 4.05 | ||||||||||||
| Class Y | 1,000.00 | 1,018.80 | 1.25% | 6.33 | ||||||||||||
Delaware Ivy Government Securities Fund
Expense analysis of an investment of $1,000
| Beginning Account Value 4/1/22 | Ending Account Value 9/30/22 | Annualized Expense Ratio | Expenses Paid During Period 4/1/22 to 9/30/22* | |||||||||||||
| Actual Fund return† | ||||||||||||||||
| Class A | $ | 1,000.00 | $ | 916.90 | 0.97% | $ | 4.66 | |||||||||
| Class C | 1,000.00 | 914.30 | 1.82% | 8.73 | ||||||||||||
| Class I | 1,000.00 | 918.10 | 0.72% | 3.46 | ||||||||||||
| Class R6 | 1,000.00 | 918.70 | 0.61% | 2.93 | ||||||||||||
| Hypothetical 5% return (5% return before expenses) | ||||||||||||||||
| Class A | $ | 1,000.00 | $ | 1,020.21 | 0.97% | $ | 4.91 | |||||||||
| Class C | 1,000.00 | 1,015.94 | 1.82% | 9.20 | ||||||||||||
| Class I | 1,000.00 | 1,021.46 | 0.72% | 3.65 | ||||||||||||
| Class R6 | 1,000.00 | 1,022.01 | 0.61% | 3.09 | ||||||||||||
Delaware Ivy High Yield Fund
Expense analysis of an investment of $1,000
| Beginning Account Value 4/1/22 | Ending Account Value 9/30/22 | Annualized Expense Ratio | Expenses Paid During Period 4/1/22 to 9/30/22* | |||||||||||||
| Actual Fund return† | ||||||||||||||||
| Class A | $ | 1,000.00 | $ | 879.20 | 0.99% | $ | 4.66 | |||||||||
| Class I | 1,000.00 | 879.50 | 0.72% | 3.39 | ||||||||||||
| Class R6 | 1,000.00 | 878.90 | 0.72% | 3.39 | ||||||||||||
| Hypothetical 5% return (5% return before expenses) | ||||||||||||||||
| Class A | $ | 1,000.00 | $ | 1,020.10 | 0.99% | $ | 5.01 | |||||||||
| Class I | 1,000.00 | 1,021.46 | 0.72% | 3.65 | ||||||||||||
| Class R6 | 1,000.00 | 1,021.46 | 0.72% | 3.65 | ||||||||||||
58
Delaware Ivy International Small Cap Fund
Expense analysis of an investment of $1,000
| Beginning Account Value 4/1/22 | Ending Account Value 9/30/22 | Annualized Expense Ratio | Expenses Paid During Period 4/1/22 to 9/30/22* | |||||||||||||
| Actual Fund return† | ||||||||||||||||
| Class A | $ | 1,000.00 | $ | 722.50 | 1.37% | $ | 5.92 | |||||||||
| Class C | 1,000.00 | 719.80 | 2.12% | 9.14 | ||||||||||||
| Class I | 1,000.00 | 723.70 | 0.99% | 4.28 | ||||||||||||
| Class R6 | 1,000.00 | 723.50 | 0.99% | 4.28 | ||||||||||||
| Class Y | 1,000.00 | 722.50 | 1.33% | 5.74 | ||||||||||||
| Hypothetical 5% return (5% return before expenses) | ||||||||||||||||
| Class A | $ | 1,000.00 | $ | 1,018.20 | 1.37% | $ | 6.93 | |||||||||
| Class C | 1,000.00 | 1,014.44 | 2.12% | 10.71 | ||||||||||||
| Class I | 1,000.00 | 1,020.10 | 0.99% | 5.01 | ||||||||||||
| Class R6 | 1,000.00 | 1,020.10 | 0.99% | 5.01 | ||||||||||||
| Class Y | 1,000.00 | 1,018.40 | 1.33% | 6.73 | ||||||||||||
Delaware Ivy Multi-Asset Income Fund
Expense analysis of an investment of $1,000
| Beginning Account Value 4/1/22 | Ending Account Value 9/30/22 | Annualized Expense Ratio | Expenses Paid During Period 4/1/22 to 9/30/22* | |||||||||||||
| Actual Fund return† | ||||||||||||||||
| Class A | $ | 1,000.00 | $ | 838.40 | 1.17% | $ | 5.39 | |||||||||
| Class C | 1,000.00 | 835.80 | 1.97% | 9.07 | ||||||||||||
| Class I | 1,000.00 | 840.10 | 0.75% | 3.46 | ||||||||||||
| Class R6 | 1,000.00 | 839.70 | 0.75% | 3.46 | ||||||||||||
| Class Y | 1,000.00 | 838.50 | 1.15% | 5.30 | ||||||||||||
| Hypothetical 5% return (5% return before expenses) | ||||||||||||||||
| Class A | $ | 1,000.00 | $ | 1,019.20 | 1.17% | $ | 5.92 | |||||||||
| Class C | 1,000.00 | 1,015.19 | 1.97% | 9.95 | ||||||||||||
| Class I | 1,000.00 | 1,021.31 | 0.75% | 3.80 | ||||||||||||
| Class R6 | 1,000.00 | 1,021.31 | 0.75% | 3.80 | ||||||||||||
| Class Y | 1,000.00 | 1,019.30 | 1.15% | 5.82 | ||||||||||||
Delaware Ivy Strategic Income Fund
Expense analysis of an investment of $1,000
| Beginning Account Value 4/1/22 | Ending Account Value 9/30/22 | Annualized Expense Ratio | Expenses Paid During Period 4/1/22 to 9/30/22* | |||||||||||||
| Actual Fund return† | ||||||||||||||||
| Class A | $ | 1,000.00 | $ | 900.50 | 1.04% | $ | 4.95 | |||||||||
| Class C | 1,000.00 | 897.50 | 1.82% | 8.66 | ||||||||||||
| Class I | 1,000.00 | 903.30 | 0.67% | 3.20 | ||||||||||||
| Class R6 | 1,000.00 | 903.50 | 0.67% | 3.20 | ||||||||||||
| Class Y | 1,000.00 | 901.50 | 1.05% | 5.01 | ||||||||||||
| Hypothetical 5% return (5% return before expenses) | ||||||||||||||||
| Class A | $ | 1,000.00 | $ | 1,019.85 | 1.04% | $ | 5.27 | |||||||||
| Class C | 1,000.00 | 1,015.94 | 1.82% | 9.20 | ||||||||||||
| Class I | 1,000.00 | 1,021.71 | 0.67% | 3.40 | ||||||||||||
| Class R6 | 1,000.00 | 1,021.71 | 0.67% | 3.40 | ||||||||||||
| Class Y | 1,000.00 | 1,019.80 | 1.05% | 5.32 | ||||||||||||
Delaware Ivy Total Return Bond Fund
Expense analysis of an investment of $1,000
| Beginning Account Value 4/1/22 | Ending Account Value 9/30/22 | Annualized Expense Ratio | Expenses Paid During Period 4/1/22 to 9/30/22* | |||||||||||||
| Actual Fund return† | ||||||||||||||||
| Class A | $ | 1,000.00 | $ | 910.00 | 1.35% | $ | 6.46 | |||||||||
| Class C | 1,000.00 | 906.40 | 2.08% | 9.94 | ||||||||||||
| Class I | 1,000.00 | 911.40 | 1.00% | 4.79 | ||||||||||||
| Class R6 | 1,000.00 | 911.70 | 0.87% | 4.17 | ||||||||||||
| Hypothetical 5% return (5% return before expenses) | ||||||||||||||||
| Class A | $ | 1,000.00 | $ | 1,018.30 | 1.35% | $ | 6.83 | |||||||||
| Class C | 1,000.00 | 1,014.64 | 2.08% | 10.50 | ||||||||||||
| Class I | 1,000.00 | 1,020.05 | 1.00% | 5.06 | ||||||||||||
| Class R6 | 1,000.00 | 1,020.71 | 0.87% | 4.41 | ||||||||||||
*“Expenses Paid During Period” are equal to the relevant Fund’s annualized expense ratio, multiplied by the average account value over the period, multiplied by 183/365 (to reflect the one-half year period).
†Because actual returns reflect only the most recent six-month period, the returns shown may differ significantly from fiscal year returns.
In addition to the Funds’ expenses reflected above and on the previous pages, each Fund also indirectly bears its portion of the fees and expenses of any investment companies (Underlying Funds),
59
Disclosure of Fund expenses
including exchange-traded funds, in which it invests. The tables above and on the previous pages do not reflect the expenses of any applicable Underlying Funds.
60
Security type / sector / state / territory allocations
Delaware Ivy California Municipal High Income Fund
As of September 30, 2022 (Unaudited)
Sector designations may be different from the sector designations presented in other Fund materials. The sector designations may represent the investment manager’s internal sector classifications, which may result in the sector designations for one fund being different from another fund’s sector designations.
| Security type / sector | Percentage of net assets | ||||
| Municipal Bonds* | 96.45 | % | |||
| Corporate Revenue Bonds | 10.80 | % | |||
| Education Revenue Bonds | 21.77 | % | |||
| Electric Revenue Bonds | 5.05 | % | |||
| Healthcare Revenue Bonds | 9.77 | % | |||
| Housing Revenue Bond | 2.55 | % | |||
| Lease Revenue Bonds | 1.85 | % | |||
| Local General Obligation Bond | 1.56 | % | |||
| Pre-Refunded Bonds | 2.98 | % | |||
| Special Tax Revenue Bonds | 26.93 | % | |||
| State General Obligation Bonds | 2.12 | % | |||
| Transportation Revenue Bonds | 9.74 | % | |||
| Water & Sewer Revenue Bond | 1.33 | % | |||
| Short-Term Investments | 2.72 | % | |||
| Total Value of Securities | 99.17 | % | |||
| Receivables and Other Assets Net of Liabilities | 0.83 | % | |||
| Total Net Assets | 100.00 | % | |||
*As of the date of this report, Delaware Ivy California Municipal High Income Fund held bonds issued by or on behalf of territories and the states of the US as follows:
| State / territory | Percentage of net assets | ||||
| California | 87.03 | % | |||
| Puerto Rico | 12.14 | % | |||
| Total Value of Securities | 99.17 | % | |||
61
Security type / sector allocations
Delaware Ivy Corporate Bond Fund
As of September 30, 2022 (Unaudited)
Sector designations may be different from the sector designations presented in other Fund materials. The sector designations may represent the investment manager’s internal sector classifications, which may result in the sector designations for one fund being different from another fund’s sector designations.
| Security type / sector | Percentage of net assets | ||||
| Convertible Bond | 0.13 | % | |||
| Corporate Bonds | 94.77 | % | |||
| Banking | 24.97 | % | |||
| Basic Industry | 0.97 | % | |||
| Brokerage | 2.22 | % | |||
| Capital Goods | 3.86 | % | |||
| Communications | 9.35 | % | |||
| Consumer Cyclical | 7.80 | % | |||
| Consumer Non-Cyclical | 6.21 | % | |||
| Electric | 5.14 | % | |||
| Energy | 3.92 | % | |||
| Finance Companies | 1.72 | % | |||
| Industrials | 0.37 | % | |||
| Insurance | 4.52 | % | |||
| Natural Gas | 1.65 | % | |||
| Real Estate Investment Trusts | 2.18 | % | |||
| Technology | 16.30 | % | |||
| Transportation | 2.66 | % | |||
| Utilities | 0.93 | % | |||
| Municipal Bonds | 1.26 | % | |||
| Non-Agency Asset-Backed Securities | 1.28 | % | |||
| Sovereign Bonds | 0.42 | % | |||
| US Treasury Obligations | 0.93 | % | |||
| Short-Term Investments | 0.34 | % | |||
| Securities Lending Collateral | 0.42 | % | |||
| Total Value of Securities | 99.55 | % | |||
| Obligation to Return Securities Lending Collateral | (0.42 | %) | |||
| Receivables and Other Assets Net of Liabilities | 0.87 | % | |||
| Total Net Assets | 100.00 | % | |||
62
Security type / sector allocations
Delaware Ivy Crossover Credit Fund
As of September 30, 2022 (Unaudited)
Sector designations may be different from the sector designations presented in other Fund materials. The sector designations may represent the investment manager’s internal sector classifications, which may result in the sector designations for one fund being different from another fund’s sector designations.
| Security type / sector | Percentage of net assets | ||||
| Convertible Bond | 0.16 | % | |||
| Corporate Bonds | 93.65 | % | |||
| Banking | 14.56 | % | |||
| Basic Industry | 0.33 | % | |||
| Brokerage | 3.15 | % | |||
| Capital Goods | 1.18 | % | |||
| Communications | 13.35 | % | |||
| Consumer Cyclical | 9.24 | % | |||
| Consumer Non-Cyclical | 5.94 | % | |||
| Electric | 2.80 | % | |||
| Energy | 4.96 | % | |||
| Finance Companies | 4.11 | % | |||
| Insurance | 6.53 | % | |||
| Natural Gas | 0.87 | % | |||
| Real Estate Investment Trusts | 4.02 | % | |||
| Technology | 22.17 | % | |||
| Transportation | 0.44 | % | |||
| Municipal Bonds | 0.65 | % | |||
| Non-Agency Asset-Backed Securities | 0.79 | % | |||
| US Treasury Obligation | 0.12 | % | |||
| Short-Term Investments | 4.74 | % | |||
| Securities Lending Collateral | 0.61 | % | |||
| Total Value of Securities | 100.72 | % | |||
| Obligation to Return Securities Lending Collateral | (0.61 | %) | |||
| Liabilities Net of Receivables and Other Assets | (0.11 | %) | |||
| Total Net Assets | 100.00 | % | |||
63
Security type / country allocations
Delaware Ivy Emerging Markets Local Currency Debt Fund
As of September 30, 2022 (Unaudited)
Sector designations may be different from the sector designations presented in other Fund materials. The sector designations may represent the investment manager’s internal sector classifications, which may result in the sector designations for one fund being different from another fund’s sector designations.
| Security type / country | Percentage of net assets | ||||
| Sovereign Bonds | 88.37 | % | |||
| Brazil | 11.31 | % | |||
| Chile | 2.14 | % | |||
| Colombia | 4.76 | % | |||
| Czech Republic | 6.99 | % | |||
| Dominican Republic | 0.65 | % | |||
| Hungary | 3.24 | % | |||
| Indonesia | 15.39 | % | |||
| Malaysia | 9.16 | % | |||
| Mexico | 6.48 | % | |||
| Peru | 4.27 | % | |||
| Poland | 0.20 | % | |||
| Romania | 4.58 | % | |||
| South Africa | 9.95 | % | |||
| Thailand | 7.58 | % | |||
| Turkey | 0.97 | % | |||
| Ukraine | 0.44 | % | |||
| Uruguay | 0.26 | % | |||
| Supranational Banks | 4.36 | % | |||
| Short-Term Investments | 3.66 | % | |||
| Securities Lending Collateral | 2.02 | % | |||
| Total Value of Securities | 98.41 | % | |||
| Obligation to Return Securities Lending Collateral | (2.02 | %) | |||
| Receivables and Other Assets Net of Liabilities | 3.61 | % | |||
| Total Net Assets | 100.00 | % | |||
64
Security type / sector allocations
Delaware Ivy Government Securities Fund
As of September 30, 2022 (Unaudited)
Sector designations may be different from the sector designations presented in other Fund materials. The sector designations may represent the investment manager’s internal sector classifications, which may result in the sector designations for one fund being different from another fund’s sector designations.
| Security type / sector | Percentage of net assets | ||||
| Agency Collateralized Mortgage Obligations | 2.64 | % | |||
| Agency Commercial Mortgage-Backed Securities | 16.33 | % | |||
| Agency Mortgage-Backed Securities | 19.80 | % | |||
| Agency Obligations | 2.31 | % | |||
| US Treasury Obligations | 58.74 | % | |||
| Securities Lending Collateral | 5.14 | % | |||
| Total Value of Securities | 104.96 | % | |||
| Obligation to Return Securities Lending Collateral | (5.14 | %) | |||
| Receivables and Other Assets Net of Liabilities | 0.18 | % | |||
| Total Net Assets | 100.00 | % | |||
65
Security type / sector allocations
Delaware Ivy High Yield Fund
As of September 30, 2022 (Unaudited)
Sector designations may be different from the sector designations presented in other Fund materials. The sector designations may represent the investment manager’s internal sector classifications, which may result in the sector designations for one fund being different from another fund’s sector designations.
| Security type / sector | Percentage of net assets | ||||
| Convertible Bond | 0.18 | % | |||
| Corporate Bonds | 95.24 | % | |||
| Automotive | 1.10 | % | |||
| Basic Industry | 9.01 | % | |||
| Capital Goods | 2.91 | % | |||
| Communications | 5.90 | % | |||
| Consumer Goods | 1.24 | % | |||
| Energy | 13.81 | % | |||
| Financial Services | 3.50 | % | |||
| Healthcare | 8.30 | % | |||
| Insurance | 1.57 | % | |||
| Leisure | 8.37 | % | |||
| Media | 13.44 | % | |||
| Real Estate | 4.84 | % | |||
| Retail | 4.28 | % | |||
| Services | 5.65 | % | |||
| Technology & Electronics | 5.34 | % | |||
| Transportation | 3.29 | % | |||
| Utilities | 2.69 | % | |||
| Municipal Bonds | 0.72 | % | |||
| Short-Term Investments | 2.66 | % | |||
| Securities Lending Collateral | 2.19 | % | |||
| Total Value of Securities | 100.99 | % | |||
| Obligation to Return Securities Lending Collateral | (2.19 | %) | |||
| Receivables and Other Assets Net of Liabilities | 1.20 | % | |||
| Total Net Assets | 100.00 | % | |||
66
Security type / country and sector allocations
Delaware Ivy International Small Cap Fund
As of September 30, 2022 (Unaudited)
Sector designations may be different from the sector designations presented in other Fund materials. The sector designations may represent the investment manager’s internal sector classifications, which may result in the sector designations for one fund being different from another fund’s sector designations.
| Security type / country | Percentage of net assets | ||||
| Common Stocks by Country | 96.51 | % | |||
| Argentina | 0.97 | % | |||
| Australia | 2.62 | % | |||
| Austria | 0.52 | % | |||
| Brazil | 4.31 | % | |||
| Canada | 11.96 | % | |||
| China | 1.85 | % | |||
| Denmark | 2.99 | % | |||
| Finland | 0.70 | % | |||
| France | 2.55 | % | |||
| Germany | 2.70 | % | |||
| Hong Kong | 0.63 | % | |||
| India | 5.64 | % | |||
| Ireland | 0.93 | % | |||
| Israel | 1.03 | % | |||
| Italy | 2.19 | % | |||
| Japan | 26.65 | % | |||
| Malaysia | 0.20 | % | |||
| Mexico | 3.42 | % | |||
| Norway | 4.07 | % | |||
| Republic of Korea | 2.19 | % | |||
| Singapore | 0.90 | % | |||
| South Africa | 2.73 | % | |||
| Spain | 1.83 | % | |||
| Sweden | 1.70 | % | |||
| Taiwan | 1.81 | % | |||
| Thailand | 0.65 | % | |||
| United Kingdom | 8.77 | % | |||
| Short-Term Investments | 3.29 | % | |||
| Securities Lending Collateral | 5.34 | % | |||
| Total Value of Securities | 105.14 | % | |||
| Obligation to Return Securities Lending Collateral | (5.34 | %) | |||
| Receivables and Other Assets Net of Liabilities | 0.20 | % | |||
| Total Net Assets | 100.00 | % | |||
| Common stocks by sector | Percentage of net assets | ||||
| Communication Services | 2.16 | % | |||
| Consumer Discretionary | 11.08 | % | |||
| Consumer Staples | 8.19 | % | |||
| Energy | 6.51 | % | |||
| Financials | 14.32 | % | |||
| Healthcare | 6.17 | % | |||
| Industrials | 24.66 | % | |||
| Information Technology | 10.07 | % | |||
| Materials | 5.28 | % | |||
| Real Estate | 5.76 | % | |||
| Utilities | 2.31 | % | |||
| Total | 96.51 | % | |||
67
Security type / sector allocations and top 10 equity holdings
Delaware Ivy Multi-Asset Income Fund
As of September 30, 2022 (Unaudited)
Sector designations may be different from the sector designations presented in other Fund materials. The sector designations may represent the investment manager’s internal sector classifications, which may result in the sector designations for one fund being different from another fund’s sector designations.
| Security type / sector | Percentage of net assets | ||||
| Agency Mortgage-Backed Securities | 3.58 | % | |||
| Corporate Bonds | 31.54 | % | |||
| Banking | 1.91 | % | |||
| Basic Industry | 0.92 | % | |||
| Brokerage | 0.98 | % | |||
| Capital Goods | 2.33 | % | |||
| Communications | 6.21 | % | |||
| Consumer Cyclical | 4.38 | % | |||
| Consumer Non-Cyclical | 3.04 | % | |||
| Electric | 1.50 | % | |||
| Energy | 4.96 | % | |||
| Finance Companies | 0.11 | % | |||
| Financial Services | 0.49 | % | |||
| Insurance | 0.98 | % | |||
| Natural Gas | 0.07 | % | |||
| Real Estate Investment Trusts | 0.06 | % | |||
| Services | 0.34 | % | |||
| Technology | 3.11 | % | |||
| Transportation | 0.15 | % | |||
| Municipal Bonds | 0.03 | % | |||
| Non-Agency Commercial Mortgage-Backed Securities | 0.48 | % | |||
| Loan Agreements | 6.02 | % | |||
| US Treasury Obligations | 4.33 | % | |||
| Common Stocks | 47.08 | % | |||
| Basic Industry | 0.77 | % | |||
| Capital Goods | 0.52 | % | |||
| Communication Services | 0.63 | % | |||
| Communications | 0.44 | % | |||
| Consumer Cyclical | 2.67 | % | |||
| Consumer Discretionary | 0.29 | % | |||
| Consumer Non-Cyclical | 15.52 | % | |||
| Consumer Staples | 0.49 | % | |||
| Energy | 4.78 | % | |||
| Financial Services | 0.00 | % | |||
| Industrials | 3.35 | % | |||
| Materials | 3.26 | % | |||
| Real Estate | 0.94 | % | |||
| REIT Diversified | 1.01 | % | |||
| REIT Healthcare | 0.44 | % | |||
| REIT Hotel | 0.40 | % | |||
| REIT Industrial | 1.40 | % | |||
| REIT Lodging | 0.06 | % | |||
| REIT Mall | 0.24 | % | |||
| REIT Manufactured Housing | 0.24 | % | |||
| REIT Multifamily | 1.45 | % | |||
| REIT Office | 0.73 | % | |||
| REIT Retail | 0.19 | % | |||
| REIT Self-Storage | 0.78 | % | |||
| REIT Shopping Center | 0.34 | % | |||
| REIT Single Tenant | 0.20 | % | |||
| REIT Specialty | 0.47 | % | |||
| Services | 0.04 | % | |||
| Technology | 2.42 | % | |||
| Utilities | 3.01 | % | |||
| Preferred Stock | 0.01 | % | |||
| Exchange-Traded Funds | 4.16 | % | |||
| Master Limited Partnerships | 0.37 | % | |||
| Rights | 0.11 | % | |||
| Warrant | 0.01 | % | |||
| Short-Term Investments | 0.29 | % | |||
| Securities Lending Collateral | 3.64 | % | |||
| Total Value of Securities | 101.65 | % | |||
| Obligation to Return Securities Lending Collateral | (3.64 | %) | |||
| Receivables and Other Assets Net of Liabilities | 1.99 | % | |||
| Total Net Assets | 100.00 | % | |||
68
Holdings are for informational purposes only and are subject to change at any time. They are not a recommendation to buy, sell, or hold any security.
| Top 10 equity holdings | Percentage of net assets | ||||
| Merck & Co. | 1.06 | % | |||
| Nestle | 1.03 | % | |||
| Lamb Weston Holdings | 1.01 | % | |||
| Amadeus IT Group | 0.90 | % | |||
| Henry Schein | 0.89 | % | |||
| Clorox | 0.84 | % | |||
| Koninklijke Ahold Delhaize | 0.84 | % | |||
| Novo Nordisk Class B | 0.84 | % | |||
| Smith & Nephew | 0.84 | % | |||
| Diageo | 0.83 | % | |||
69
Security type / sector allocation
Delaware Ivy Strategic Income Fund
As of September 30, 2022 (Unaudited)
Sector designations may be different from the sector designations presented in other Fund materials. The sector designations may represent the investment manager’s internal sector classifications, which may result in the sector designations for one fund being different from another fund’s sector designations.
| Security type / sector | Percentage of net assets | ||||
| Agency Collateralized Mortgage Obligations | 6.23 | % | |||
| Convertible Bonds | 0.71 | % | |||
| Corporate Bonds | 59.09 | % | |||
| Banking | 10.28 | % | |||
| Basic Industry | 2.07 | % | |||
| Brokerage | 2.30 | % | |||
| Capital Goods | 2.64 | % | |||
| Communications | 6.22 | % | |||
| Consumer Cyclical | 8.46 | % | |||
| Consumer Non-Cyclical | 5.51 | % | |||
| Electric | 3.51 | % | |||
| Energy | 8.42 | % | |||
| Financials | 1.23 | % | |||
| Industrials | 0.69 | % | |||
| Insurance | 1.67 | % | |||
| Real Estate Investment Trusts | 0.36 | % | |||
| Technology | 3.21 | % | |||
| Transportation | 2.52 | % | |||
| Municipal Bonds | 0.96 | % | |||
| Non-Agency Collateralized Mortgage Obligations | 3.17 | % | |||
| Non-Agency Commercial Mortgage-Backed Securities | 0.50 | % | |||
| Loan Agreements | 6.39 | % | |||
| Sovereign Bonds | 5.43 | % | |||
| Brazil | 0.14 | ||||
| Chile | 0.43 | ||||
| Colombia | 0.27 | ||||
| Costa Rica | 0.12 | ||||
| Dominican Republic | 0.09 | ||||
| Indonesia | 1.85 | ||||
| Mexico | 0.61 | ||||
| Morocco | 0.24 | ||||
| Panama | 0.50 | ||||
| Peru | 1.03 | ||||
| Serbia | 0.15 | ||||
| Supranational Banks | 0.61 | % | |||
| US Treasury Obligations | 10.08 | % | |||
| Common Stocks | 0.70 | % | |||
| Preferred Stock | 0.01 | % | |||
| Warrant | 0.01 | % | |||
| Short-Term Investments | 3.93 | % | |||
| Securities Lending Collateral | 1.85 | % | |||
| Total Value of Securities | 99.67 | % | |||
| Obligation to Return Securities Lending Collateral | (1.85 | %) | |||
| Receivables and Other Assets Net of Liabilities | 2.18 | % | |||
| Total Net Assets | 100.00 | % | |||
70
Security type / sector allocations
Delaware Ivy Total Return Bond Fund
As of September 30, 2022 (Unaudited)
Sector designations may be different from the sector designations presented in other Fund materials. The sector designations may represent the investment manager’s internal sector classifications, which may result in the sector designations for one fund being different from another fund’s sector designations.
| Security type / sector | Percentage of net assets | ||||
| Agency Mortgage-Backed Securities | 2.98 | % | |||
| Corporate Bonds | 46.00 | % | |||
| Banking | 20.87 | % | |||
| Basic Industry | 2.19 | % | |||
| Capital Goods | 1.45 | % | |||
| Communications | 2.42 | % | |||
| Consumer Cyclical | 2.15 | % | |||
| Consumer Non-Cyclical | 1.54 | % | |||
| Electric | 3.05 | % | |||
| Energy | 3.18 | % | |||
| Financials | 0.79 | % | |||
| Insurance | 1.42 | % | |||
| Natural Gas | 1.08 | % | |||
| Real Estate Investment Trusts | 0.33 | % | |||
| Technology | 1.97 | % | |||
| Transportation | 2.82 | % | |||
| Utilities | 0.74 | % | |||
| Sovereign Bonds | 29.65 | % | |||
| Albania | 0.18 | ||||
| Angola | 0.37 | ||||
| Armenia | 0.17 | ||||
| Bermuda | 0.49 | ||||
| Canada | 5.20 | ||||
| Chile | 0.89 | ||||
| Colombia | 1.21 | ||||
| Dominican Republic | 0.85 | ||||
| Egypt | 0.20 | ||||
| Finland | 1.18 | ||||
| Georgia | 0.21 | ||||
| Germany | 2.52 | ||||
| Honduras | 0.18 | ||||
| Indonesia | 0.91 | ||||
| Italy | 4.81 | ||||
| Ivory Coast | 0.64 | ||||
| Kazakhstan | 0.19 | ||||
| Morocco | 0.70 | ||||
| Netherlands | 0.44 | ||||
| Norway | 1.39 | ||||
| Pakistan | 0.09 | ||||
| Paraguay | 0.95 | ||||
| Peru | 1.05 | ||||
| Philippines | 0.34 | ||||
| Republic of North Macedonia | 0.24 | ||||
| Senegal | 0.19 | ||||
| South Africa | 1.01 | ||||
| Spain | 0.67 | ||||
| United Kingdom | 1.28 | ||||
| Uzbekistan | 1.10 | ||||
| Supranational Banks | 2.02 | % | |||
| US Treasury Obligations | 14.64 | % | |||
| Options Purchased | 0.19 | % | |||
| Securities Lending Collateral | 3.51 | % | |||
| Total Value of Securities Before Options Written | 98.99 | % | |||
| Options Written | (0.08 | %) | |||
| Obligation to Return Securities Lending Collateral | (3.51 | %) | |||
| Receivables and Other Assets Net of Liabilities | 4.60 | % | |||
| Total Net Assets | 100.00 | % | |||
71
Delaware Ivy California Municipal High Income Fund
September 30, 2022
| Principal amount° | Value (US $) | ||||||
| Municipal Bonds — 96.45% | |||||||
| Corporate Revenue Bonds — 10.80% | |||||||
| California County Tobacco Securitization Agency Series D 0.00% 6/1/55 ^ | 1,000,000 | $ | 55,250 | ||||
| (Gold Country Settlement Funding Corporation) Series 1 4.00% 6/1/49 | 145,000 | 142,268 | |||||
| (Merced County Tobacco Funding Corporation) 5.00% 6/1/50 | 250,000 | 231,320 | |||||
| (Sonoma County Securitization Corporation) 0.00% 6/1/55 ^ | 250,000 | 41,040 | |||||
| California Municipal Finance Authority | |||||||
| (United Airlines, Los Angeles International Airport Project) 4.00% 7/15/29 (AMT) | 250,000 | 230,063 | |||||
| California Pollution Control Financing Authority | |||||||
| (Waste Management Project) Series A1 3.375% 7/1/25 (AMT) | 300,000 | 294,552 | |||||
| Long Beach Bond Finance Authority Series A 5.50% 11/15/37 | 165,000 | 172,768 | |||||
| M-S-R Energy Authority California Gas Revenue Series C 7.00% 11/1/34 | 300,000 | 355,131 | |||||
| Southern California Public Power Authority | |||||||
| (Natural Gas Project) 5.00% 11/1/33 | 295,000 | 300,399 | |||||
| Tobacco Securitization Authority of Southern California | |||||||
| (Capital Appreciation - Restructured) Third Subordinate Series D 0.03% 6/1/46 ^ | 305,000 | 33,629 | |||||
| 1,856,420 | |||||||
| Education Revenue Bonds — 21.77% | |||||||
| California Educational Facilities Authority Revenue Series A 5.00% 12/1/48 | 250,000 | 241,163 | |||||
| (Loma Linda University) Series A 5.00% 4/1/47 | 300,000 | 308,403 | |||||
| California Municipal Finance Authority | |||||||
| (California Baptist University) Series A 144A 5.00% 11/1/46 # | 500,000 | 500,160 | |||||
| (California Lutheran University) 5.00% 10/1/27 | 250,000 | 257,957 | |||||
| (CHF-Davis I - West Village Student Housing Project) 4.00% 5/15/48 (BAM) | 300,000 | 248,988 | |||||
| (The Learning Choice Academy) Series A 4.00% 7/1/31 | 95,000 | 90,792 | |||||
| (The Palmdale Aerospace Academy Project) Series A 144A 5.00% 7/1/49 # | 300,000 | 267,936 | |||||
| California School Finance Authority | |||||||
| (Aspire Public School) 144A 5.00% 8/1/41 # | 225,000 | 224,584 | |||||
| (Classical Academies Project) Series A 144A 5.00% 10/1/50 # | 250,000 | 233,720 | |||||
| (Green Dot Public Schools California Projects) Series A 144A 5.00% 8/1/48 # | 250,000 | 237,490 | |||||
| (HTH Learning Project) Series A 144A 5.00% 7/1/49 # | 300,000 | 267,561 | |||||
| (Larchmont Charter School Project) Series A 144A 5.00% 6/1/43 # | 250,000 | 240,937 | |||||
| (Rocketship Public Schools - Obligated Group) | |||||||
| Series G 144A 5.00% 6/1/30 # | 310,000 | 310,360 | |||||
| Series G 144A 5.00% 6/1/37 # | 330,000 | 311,612 | |||||
| 3,741,663 | |||||||
| Electric Revenue Bonds — 5.05% | |||||||
| Puerto Rico Electric Power Authority Series TT 5.00% 7/1/37 † | 1,165,000 | 867,925 | |||||
| 867,925 | |||||||
| Healthcare Revenue Bonds — 9.77% | |||||||
| California Municipal Finance Authority Series A 5.00% 11/15/32 | 425,000 | 471,894 | |||||
72
| Principal amount° | Value (US $) | ||||||
| Municipal Bonds (continued) | |||||||
| Healthcare Revenue Bonds (continued) | |||||||
| California Municipal Finance Authority (Eisenhower Medical Center) | |||||||
| Series B 5.00% 7/1/37 | 250,000 | $ | 250,395 | ||||
| Series B 5.00% 7/1/42 | 250,000 | 246,605 | |||||
| California Statewide Communities Development Authority (Loma Linda University Medical Center) | |||||||
| Series A 5.25% 12/1/44 | 250,000 | 250,790 | |||||
| Series A 144A 5.25% 12/1/56 # | 250,000 | 231,593 | |||||
| Washington Township Health Care District Series A 3.75% 7/1/31 | 255,000 | 228,154 | |||||
| 1,679,431 | |||||||
| Housing Revenue Bond — 2.55% | |||||||
| CSCDA Community Improvement Authority Essential Housing Revenue | |||||||
| (Parallel - Anaheim) Series A 144A 4.00% 8/1/56 # | 300,000 | 224,259 | |||||
| Los Angeles Housing Authority | |||||||
| (Union Portfolio Project) Series A 3.25% 6/1/35 | 250,000 | 213,655 | |||||
| 437,914 | |||||||
| Lease Revenue Bonds — 1.85% | |||||||
| California State Public Works Board | |||||||
| (Riverside Campus Projects) Series H 5.00% 4/1/26 | 300,000 | 317,985 | |||||
| 317,985 | |||||||
| Local General Obligation Bond — 1.56% | |||||||
| Oro Grande Elementary School District | |||||||
| (San Bernardino County,California) 4.00% 9/15/32 | 300,000 | 268,194 | |||||
| 268,194 | |||||||
| Pre-Refunded Bonds — 2.98% | |||||||
| California School Finance Authority 144A 5.00% 8/1/41-25 #, § | 25,000 | 26,198 | |||||
| Golden State, California Tobacco Securitization Corporate Settlement Revenue Series A-1 5.00% 6/1/29-27 § | 450,000 | 485,784 | |||||
| 511,982 | |||||||
| Special Tax Revenue Bonds — 26.93% | |||||||
| Chino Community Facilities District 5.00% 9/1/47 | 150,000 | 150,440 | |||||
| Chino Public Financing Authority Series A 3.50% 9/1/43 | 250,000 | 187,117 | |||||
| GDB Debt Recovery Authority of Puerto Rico 7.50% 8/20/40 | 541,627 | 476,632 | |||||
| Jurupa Community Services District (Eastvale Area) | |||||||
| Series A 4.125% 9/1/42 | 200,000 | 174,214 | |||||
| Series A 4.25% 9/1/47 | 300,000 | 256,806 | |||||
| Lammersville Joint Unified School District 5.00% 9/1/33 | 500,000 | 515,660 | |||||
| Murrieta CA Community Facilities District | |||||||
| (Golden City) Series A 5.00% 9/1/46 | 300,000 | 302,919 | |||||
| Ontario CA Community Facilities District No 28 (New Haven Facilities - Area A) | |||||||
| 5.00% 9/1/42 | 130,000 | 131,689 | |||||
| 5.00% 9/1/47 | 230,000 | 231,706 | |||||
| Ontario CA Community Facilities District No 31 | |||||||
| (Carriage House / Amberly Lane) 5.00% 9/1/47 | 135,000 | 135,944 | |||||
| Poway Unified School District | |||||||
| (DEL SUR East) Series C 5.00% 9/1/46 | 250,000 | 251,625 | |||||
| Puerto Rico Sales Tax Financing Revenue (Capital Appreciation - Restructured) | |||||||
| Series A-1 0.000% 7/1/51 ^ | 279,000 | 45,767 | |||||
| Series A-1 10.156% 7/1/46 ^ | 720,000 | 163,217 | |||||
| Roseville | |||||||
| (Fiddyment Ranch Community Facilities) Series A 5.00% 9/1/35 | 250,000 | 256,747 | |||||
| Sacramento | |||||||
| (Natomas Central Community Facilities) 5.00% 9/1/41 | 250,000 | 254,740 | |||||
| San Bernardino County | |||||||
| (Lyte Creek North) 4.00% 9/1/42 | 250,000 | 214,467 | |||||
| South San Francisco 4.00% 9/1/44 | 100,000 | 81,921 | |||||
73
Schedules of investments
Delaware Ivy California Municipal High Income Fund
| Principal amount° | Value (US $) | ||||||
| Municipal Bonds (continued) | |||||||
| Special Tax Revenue Bonds (continued) | |||||||
| Tulare Redevelopment Agency Successor Agency Series A 4.00% 8/1/40 (BAM) | 250,000 | $ | 228,310 | ||||
| Western Riverside Water & Wastewater Financing Authority | |||||||
| (Local Agency Revenue Bonds) Series A 5.00% 9/1/29 | 250,000 | 265,220 | |||||
| William S Hart Union High School District 5.00% 9/1/47 | 300,000 | 301,917 | |||||
| 4,627,058 | |||||||
| State General Obligation Bonds — 2.12% | |||||||
| Commonwealth of Puerto Rico | |||||||
| Series A-1 4.00% 7/1/46 | 16,000 | 12,025 | |||||
| Series A-1 4.364% 7/1/33 ^ | 23,502 | 12,995 | |||||
| Series C 2.637% 11/1/43 ● | 676,070 | 338,880 | |||||
| 363,900 | |||||||
| Transportation Revenue Bonds — 9.74% | |||||||
| California Municipal Finance Authority | |||||||
| (LINXS APM Project) | |||||||
| Series A 4.00% 12/31/47 (AMT) | 250,000 | 203,025 | |||||
| Series A 5.00% 12/31/47 (AMT) | 250,000 | 240,037 | |||||
| Foothill-Eastern Transportation Corridor Agency, California Series B-1 3.95% 1/15/53 | 300,000 | 243,348 | |||||
| Los Angeles Department of Airports Series B 5.00% 5/15/46 (AMT) | 300,000 | 300,237 | |||||
| Norman Y Mineta San Jose International Airport SJC Series A 5.00% 3/1/47 (AMT) | 200,000 | 200,012 | |||||
| Puerto Rico Highway & Transportation Authority | |||||||
| Series CC 5.25% 7/1/32 (AGM) | 120,000 | 118,818 | |||||
| Series CC 5.25% 7/1/33 (AGM) | 50,000 | 49,359 | |||||
| San Diego Association of Governments South Bay Expressway Revenue Series A 5.00% 7/1/27 | 100,000 | 106,625 | |||||
| San Francisco City & County Airport Comm-San Francisco International Airport Series A 4.00% 5/1/49 (AMT) | 250,000 | 212,205 | |||||
| 1,673,666 | |||||||
| Water & Sewer Revenue Bond — 1.33% | |||||||
| California Pollution Control Financing Authority | |||||||
| (San Diego County Water Authority Desalination Project Pipeline) 144A 5.00% 11/21/45 # | 250,000 | 227,940 | |||||
| 227,940 | |||||||
| Total Municipal Bonds (cost $18,286,722) | 16,574,078 | ||||||
| Number of shares | |||||||
| Short-Term Investments — 2.72% | |||||||
| Money Market Mutual Funds — 0.07% | |||||||
| State Street Institutional US Government Money Market Fund – Premier Class (seven-day effective yield 2.86%) | 12,713 | 12,713 | |||||
| 12,713 | |||||||
| Principal amount° | |||||||
| Variable Rate Demand Notes — 2.65%¤ | |||||||
| Los Angeles Department of Water & Power (Power System) Series A-1 2.45% 7/1/50 (SPA - Royal Bank of Canada) | 175,000 | 175,000 | |||||
| Subordinate Series A-7 2.60% 7/1/35 (SPA - Bank of America N.A.) | 280,000 | 280,000 | |||||
| 455,000 | |||||||
| Total Short-Term Investments (cost $467,713) | 467,713 | ||||||
| Total Value of Securities—99.17% (cost $18,754,435) | $ | 17,041,791 | |||||
| ° | Principal amount shown is stated in USD unless noted that the security is denominated in another currency. |
| ^ | Zero-coupon security. The rate shown is the effective yield at the time of purchase. |
| # | Security exempt from registration under Rule 144A of the Securities Act of 1933, as amended. At September 30, 2022, the aggregate value of Rule 144A securities was $3,304,350, which represents 19.23% of the Fund’s net assets. See Note 12 in “Notes to financial statements.” |
74
| † | Non-income producing security. Security is currently in default. |
| § | Pre-refunded bonds. Municipal bonds that are generally backed or secured by US Treasury bonds. For pre-refunded bonds, the stated maturity is followed by the year in which the bond will be pre-refunded. See Note 12 in “Notes to financial statements.” |
| ● | Variable rate investment. Rates reset periodically. Rate shown reflects the rate in effect at September 30, 2022. For securities based on a published reference rate and spread, the reference rate and spread are indicated in their descriptions. The reference rate descriptions (i.e. LIBOR03M, LIBOR06M, etc.) used in this report are identical for different securities, but the underlying reference rates may differ due to the timing of the reset period. Certain variable rate securities are not based on a published reference rate and spread but are determined by the issuer or agent and are based on current market conditions, or for mortgage-backed securities, are impacted by the individual mortgages which are paying off over time. These securities do not indicate a reference rate and spread in their descriptions. |
| ¤ | Tax-exempt obligations that contain a floating or variable interest rate adjustment formula and an unconditional right of demand to receive payment of the unpaid principal balance plus accrued interest upon a short notice period (generally up to 30 days) prior to specified dates either from the issuer or by drawing on a bank letter of credit, a guarantee, or insurance issued with respect to such instrument. Each rate shown is as of September 30, 2022. |
Summary of abbreviations:
AGM – Insured by Assured Guaranty Municipal Corporation
AMT – Subject to Alternative Minimum Tax
BAM – Insured by Build America Mutual Assurance
ICE – Intercontinental Exchange, Inc.
LIBOR – London Interbank Offered Rate
LIBOR03M – ICE LIBOR USD 3 Month
LIBOR06M – ICE LIBOR USD 6 Month
N.A. – National Association
SPA �� Stand-by Purchase Agreement
USD – US Dollar
See accompanying notes, which are an integral part of the financial statements.
75
Schedules of investments
Delaware Ivy Corporate Bond Fund
September 30, 2022
| Principal amount° | Value (US $) | ||||||
| Convertible Bond — 0.13% | |||||||
| Spirit Airlines 1.00% exercise price $49.07, maturity date 5/15/26 | 626,000 | $ | 536,169 | ||||
| Total Convertible Bond (cost $556,199) | 536,169 | ||||||
| Corporate Bonds — 94.77% | |||||||
| Banking — 24.97% | |||||||
| Bank of America | |||||||
| 1.898% 7/23/31 μ | 3,425,000 | 2,556,129 | |||||
| 2.299% 7/21/32 μ | 4,775,000 | 3,574,653 | |||||
| 2.482% 9/21/36 μ | 1,255,000 | 908,362 | |||||
| 2.496% 2/13/31 μ | 3,000,000 | 2,370,556 | |||||
| 2.592% 4/29/31 μ | 5,325,000 | 4,228,395 | |||||
| 4.20% 8/26/24 | 6,000,000 | 5,906,822 | |||||
| 6.125% 4/27/27 *, μ, Ψ | 2,140,000 | 2,027,650 | |||||
| Bank of New York Mellon | |||||||
| 4.596% 7/26/30 μ | 1,415,000 | 1,342,661 | |||||
| 4.70% 9/20/25 μ, Ψ | 1,935,000 | 1,857,600 | |||||
| Barclays | |||||||
| 5.501% 8/9/28 μ | 368,000 | 345,360 | |||||
| 8.00% 3/15/29 μ, Ψ | 1,575,000 | 1,382,377 | |||||
| Citigroup | |||||||
| 2.572% 6/3/31 μ | 5,725,000 | 4,511,085 | |||||
| 3.50% 5/15/23 | 1,390,000 | 1,380,595 | |||||
| 3.52% 10/27/28 μ | 3,250,000 | 2,905,280 | |||||
| 4.412% 3/31/31 μ | 3,690,000 | 3,315,799 | |||||
| 5.61% 9/29/26 μ | 850,000 | 845,901 | |||||
| Credit Suisse Group 144A 6.442% 8/11/28 #, μ | 1,700,000 | 1,583,081 | |||||
| Fifth Third Bancorp 4.337% 4/25/33 μ | 1,210,000 | 1,074,306 | |||||
| Goldman Sachs Group | |||||||
| 2.383% 7/21/32 μ | 2,325,000 | 1,755,712 | |||||
| 3.50% 11/16/26 | 1,000,000 | 925,294 | |||||
| 3.80% 3/15/30 | 7,550,000 | 6,556,867 | |||||
| 4.25% 10/21/25 | 2,500,000 | 2,415,646 | |||||
| Huntington National Bank 4.552% 5/17/28 μ | 895,000 | 862,569 | |||||
| JPMorgan Chase & Co. | |||||||
| 1.764% 11/19/31 μ | 1,660,000 | 1,215,011 | |||||
| 2.522% 4/22/31 μ | 4,165,000 | 3,297,837 | |||||
| 3.22% 3/1/25 μ | 5,000,000 | 4,841,545 | |||||
| 3.875% 9/10/24 | 1,964,000 | 1,922,399 | |||||
| KeyCorp 4.789% 6/1/33 μ | 1,130,000 | 1,037,702 | |||||
| Morgan Stanley | |||||||
| 1.794% 2/13/32 μ | 4,475,000 | 3,275,916 | |||||
| 3.875% 1/27/26 | 4,150,000 | 3,961,098 | |||||
| 4.875% 11/1/22 | 6,167,000 | 6,168,454 | |||||
| PNC Financial Services Group 6.00% 5/15/27 *, μ, Ψ | 910,000 | 846,300 | |||||
| PNC Financial Services Group 6.20% 9/15/27 μ, Ψ | 1,090,000 | 1,032,775 | |||||
| State Street 4.164% 8/4/33 μ | 2,325,000 | 2,101,251 | |||||
| SVB Financial Group | |||||||
| 4.00% 5/15/26 μ, Ψ | 1,670,000 | 1,269,978 | |||||
| 4.57% 4/29/33 *, μ | 1,810,000 | 1,588,998 | |||||
| Toronto-Dominion Bank 4.108% 6/8/27 * | 1,955,000 | 1,845,739 | |||||
| Truist Financial | |||||||
| 4.916% 7/28/33 μ | 2,195,000 | 1,986,703 | |||||
| 4.95% 9/1/25 μ, Ψ | 1,955,000 | 1,883,232 | |||||
| UBS Group 144A 4.703% 8/5/27 #, μ | 1,120,000 | 1,062,915 | |||||
| US Bancorp | |||||||
| 2.491% 11/3/36 μ | 2,550,000 | 1,920,570 | |||||
| 4.548% 7/22/28 μ | 1,155,000 | 1,114,047 | |||||
| Wells Fargo & Co. | |||||||
| 2.879% 10/30/30 μ | 4,808,000 | 3,956,642 | |||||
| 4.808% 7/25/28 μ | 2,745,000 | 2,620,812 | |||||
| 103,582,624 | |||||||
| Basic Industry — 0.97% | |||||||
| Celanese US Holdings | |||||||
| 6.05% 3/15/25 | 725,000 | 708,905 | |||||
| 6.165% 7/15/27 | 550,000 | 521,222 | |||||
| Graphic Packaging International 144A 0.821% 4/15/24 # | 3,020,000 | 2,806,688 | |||||
| 4,036,815 | |||||||
| Brokerage — 2.22% | |||||||
| Blackstone Holdings Finance | |||||||
| 144A 1.60% 3/30/31 # | 1,250,000 | 918,674 | |||||
| 144A 2.00% 1/30/32 # | 4,240,000 | 3,145,501 | |||||
| Intercontinental Exchange 2.10% 6/15/30 | 1,795,000 | 1,431,742 | |||||
| Jefferies Group 2.625% 10/15/31 | 1,530,000 | 1,112,273 | |||||
| KKR Group Finance VIII 144A 3.50% 8/25/50 # | 3,750,000 | 2,583,750 | |||||
| 9,191,940 | |||||||
| Capital Goods — 3.86% | |||||||
| Ashtead Capital 144A 2.45% 8/12/31 # | 625,000 | 460,287 | |||||
| Boeing 3.75% 2/1/50 | 3,105,000 | 2,029,906 | |||||
| Eaton 4.15% 3/15/33 | 1,585,000 | 1,434,324 | |||||
| Masco 1.50% 2/15/28 | 2,775,000 | 2,242,367 | |||||
| Parker-Hannifin 4.25% 9/15/27 | 295,000 | 281,445 | |||||
| Republic Services | |||||||
| 2.30% 3/1/30 | 4,114,000 | 3,383,366 | |||||
| 2.375% 3/15/33 * | 2,350,000 | 1,805,392 | |||||
| Waste Connections 3.50% 5/1/29 | 3,300,000 | 2,963,224 | |||||
76
| Principal amount° | Value (US $) | ||||||
| Corporate Bonds (continued) | |||||||
| Capital Goods (continued) | |||||||
| Waste Connections 4.20% 1/15/33 | 1,540,000 | $ | 1,396,207 | ||||
| 15,996,518 | |||||||
| Communications — 9.35% | |||||||
| AMC Networks 4.25% 2/15/29 * | 870,000 | 645,249 | |||||
| AT&T | |||||||
| 3.50% 6/1/41 | 3,000,000 | 2,167,109 | |||||
| 3.50% 9/15/53 | 1,905,000 | 1,272,481 | |||||
| 3.55% 9/15/55 | 1,000,000 | 658,949 | |||||
| 3.65% 6/1/51 | 5,400,000 | 3,662,830 | |||||
| CCO Holdings 144A 4.75% 2/1/32 #, * | 1,200,000 | 936,510 | |||||
| Charter Communications Operating | |||||||
| 3.85% 4/1/61 | 4,215,000 | 2,471,571 | |||||
| 3.90% 6/1/52 | 1,385,000 | 860,759 | |||||
| 4.50% 2/1/24 | 3,942,000 | 3,899,127 | |||||
| Comcast | |||||||
| 2.887% 11/1/51 | 2,410,000 | 1,513,219 | |||||
| 3.25% 11/1/39 | 3,125,000 | 2,302,812 | |||||
| 3.90% 3/1/38 | 1,000,000 | 817,632 | |||||
| Crown Castle 1.05% 7/15/26 | 3,000,000 | 2,537,701 | |||||
| Directv Financing 144A 5.875% 8/15/27 # | 1,050,000 | 907,594 | |||||
| Discovery Communications 4.00% 9/15/55 | 1,895,000 | 1,121,431 | |||||
| Paramount Global 4.75% 5/15/25 | 1,332,000 | 1,311,099 | |||||
| T-Mobile USA | |||||||
| 3.30% 2/15/51 | 575,000 | 375,666 | |||||
| 3.50% 4/15/25 * | 2,350,000 | 2,248,182 | |||||
| 4.375% 4/15/40 | 925,000 | 755,539 | |||||
| Verizon Communications | |||||||
| 2.875% 11/20/50 | 1,690,000 | 1,038,015 | |||||
| 4.329% 9/21/28 | 2,500,000 | 2,354,098 | |||||
| 4.50% 8/10/33 | 3,175,000 | 2,866,298 | |||||
| VZ Secured Financing 144A 5.00% 1/15/32 # | 800,000 | 599,153 | |||||
| Warnermedia Holdings 144A 5.141% 3/15/52 # | 2,000,000 | 1,457,456 | |||||
| 38,780,480 | |||||||
| Consumer Cyclical — 7.80% | |||||||
| ADT Security 144A 4.875% 7/15/32 # | 998,000 | 806,821 | |||||
| Amazon.com | |||||||
| 2.50% 6/3/50 | 3,190,000 | 2,001,476 | |||||
| 3.875% 8/22/37 | 7,500,000 | 6,532,177 | |||||
| Aptiv 3.10% 12/1/51 | 2,306,000 | 1,295,911 | |||||
| DR Horton 2.60% 10/15/25 | 3,620,000 | 3,327,363 | |||||
| General Motors Financial 1.25% 1/8/26 | 1,375,000 | 1,183,209 | |||||
| General Motors Financial 2.40% 10/15/28 | 1,580,000 | 1,250,156 | |||||
| Home Depot 4.20% 4/1/43 | 4,700,000 | 3,954,287 | |||||
| Levi Strauss & Co. 144A 3.50% 3/1/31 #, * | 170,000 | 132,836 | |||||
| Lowe’s 4.40% 9/8/25 | 2,755,000 | 2,714,974 | |||||
| NVR 3.00% 5/15/30 | 5,313,000 | 4,345,436 | |||||
| Target 4.50% 9/15/32 | 2,910,000 | 2,776,987 | |||||
| VICI Properties 4.95% 2/15/30 * | 2,225,000 | 2,015,483 | |||||
| 32,337,116 | |||||||
| Consumer Non-Cyclical — 6.21% | |||||||
| Amgen 2.80% 8/15/41 | 2,250,000 | 1,541,291 | |||||
| Boston Scientific 1.90% 6/1/25 | 1,000,000 | 920,212 | |||||
| Clorox 3.90% 5/15/28 | 5,512,000 | 5,190,030 | |||||
| CVS Health 2.70% 8/21/40 | 1,594,000 | 1,050,062 | |||||
| JBS USA LUX 144A 3.00% 2/2/29 # | 1,778,000 | 1,456,993 | |||||
| McCormick & Co. 0.90% 2/15/26 | 5,095,000 | 4,423,633 | |||||
| Merck & Co. | |||||||
| 2.35% 6/24/40 | 2,675,000 | 1,803,324 | |||||
| 2.75% 12/10/51 | 2,000,000 | 1,308,754 | |||||
| Royalty Pharma | |||||||
| 1.20% 9/2/25 | 3,750,000 | 3,318,626 | |||||
| 3.30% 9/2/40 | 425,000 | 286,062 | |||||
| 3.35% 9/2/51 | 1,057,000 | 639,658 | |||||
| 3.55% 9/2/50 | 447,000 | 279,669 | |||||
| Tenet Healthcare 144A 4.25% 6/1/29 # | 690,000 | 572,317 | |||||
| Universal Health Services 144A 1.65% 9/1/26 # | 2,965,000 | 2,488,247 | |||||
| US Foods 144A 4.75% 2/15/29 # | 550,000 | 471,955 | |||||
| 25,750,833 | |||||||
| Electric — 5.14% | |||||||
| Appalachian Power 4.50% 8/1/32 | 925,000 | 833,675 | |||||
| Baltimore Gas and Electric 4.25% 9/15/48 | 1,500,000 | 1,253,039 | |||||
| Black Hills 1.037% 8/23/24 | 1,850,000 | 1,710,123 | |||||
| Commonwealth Edison 3.65% 6/15/46 | 2,500,000 | 1,882,726 | |||||
| Duke Energy Carolinas 3.95% 11/15/28 | 429,000 | 402,385 | |||||
| Entergy 3.75% 6/15/50 | 4,280,000 | 3,041,411 | |||||
| Fells Point Funding Trust 144A 3.046% 1/31/27 # | 1,370,000 | 1,222,354 | |||||
| ITC Holdings 144A 4.95% 9/22/27 # | 785,000 | 767,102 | |||||
| MidAmerican Energy 3.95% 8/1/47 | 1,000,000 | 795,444 | |||||
77
Schedules of investments
Delaware Ivy Corporate Bond Fund
| Principal amount° | Value (US $) | ||||||
| Corporate Bonds (continued) | |||||||
| Electric (continued) | |||||||
| National Rural Utilities Cooperative Finance 4.15% 12/15/32 | 2,025,000 | $ | 1,856,455 | ||||
| Oglethorpe Power 144A 4.50% 4/1/47 # | 1,530,000 | 1,199,471 | |||||
| Pacific Gas and Electric 3.00% 6/15/28 | 2,075,000 | 1,713,063 | |||||
| Southern California Edison | |||||||
| 3.45% 2/1/52 | 915,000 | 617,663 | |||||
| 4.125% 3/1/48 | 1,725,000 | 1,286,747 | |||||
| Vistra Operations 144A 5.125% 5/13/25 # | 2,145,000 | 2,079,535 | |||||
| WEC Energy Group 5.15% 10/1/27 * | 665,000 | 659,775 | |||||
| 21,320,968 | |||||||
| Energy — 3.92% | |||||||
| BP Capital Markets America 2.939% 6/4/51 | 3,465,000 | 2,207,758 | |||||
| Colorado Interstate Gas 144A 4.15% 8/15/26 # | 6,000,000 | 5,680,654 | |||||
| Diamondback Energy 4.25% 3/15/52 | 1,725,000 | 1,263,622 | |||||
| Energy Transfer | |||||||
| 4.90% 3/15/35 | 750,000 | 631,596 | |||||
| 5.30% 4/15/47 | 1,450,000 | 1,160,668 | |||||
| Kinder Morgan 5.45% 8/1/52 | 1,605,000 | 1,394,330 | |||||
| NuStar Logistics 5.625% 4/28/27 | 170,000 | 148,464 | |||||
| Targa Resources Partners 5.00% 1/15/28 | 960,000 | 890,069 | |||||
| Williams Cos. 4.85% 3/1/48 | 3,500,000 | 2,906,206 | |||||
| 16,283,367 | |||||||
| Finance Companies — 1.72% | |||||||
| AerCap Ireland Capital DAC | |||||||
| 1.75% 1/30/26 | 975,000 | 834,834 | |||||
| 3.00% 10/29/28 | 3,260,000 | 2,617,305 | |||||
| Air Lease | |||||||
| 2.875% 1/15/32 * | 2,125,000 | 1,604,648 | |||||
| 4.125% 12/15/26 μ, Ψ | 1,454,000 | 1,001,395 | |||||
| Aviation Capital Group 144A 3.50% 11/1/27 # | 355,000 | 295,319 | |||||
| Avolon Holdings Funding 144A 3.25% 2/15/27 # | 960,000 | 805,173 | |||||
| 7,158,674 | |||||||
| Industrials — 0.37% | |||||||
| University of Southern California 3.028% 10/1/39 | 2,000,000 | 1,544,964 | |||||
| 1,544,964 | |||||||
| Insurance — 4.52% | |||||||
| Aon | |||||||
| 2.80% 5/15/30 | 4,950,000 | 4,111,440 | |||||
| 5.00% 9/12/32 | 1,065,000 | 1,021,743 | |||||
| Athene Global Funding 144A 1.985% 8/19/28 # | 2,750,000 | 2,171,118 | |||||
| Berkshire Hathaway Finance 3.85% 3/15/52 | 2,330,000 | 1,788,723 | |||||
| Brighthouse Financial 3.85% 12/22/51 | 718,000 | 436,153 | |||||
| First American Financial 2.40% 8/15/31 | 2,400,000 | 1,717,615 | |||||
| Principal Life Global Funding II 144A 3.00% 4/18/26 # | 4,000,000 | 3,691,180 | |||||
| UnitedHealth Group 3.05% 5/15/41 | 5,240,000 | 3,818,866 | |||||
| 18,756,838 | |||||||
| Natural Gas — 1.65% | |||||||
| Atmos Energy 5.75% 10/15/52 | 1,480,000 | 1,480,428 | |||||
| Sempra Energy 4.875% 10/15/25 μ, Ψ | 1,315,000 | 1,226,236 | |||||
| Southern California Gas 4.30% 1/15/49 | 3,830,000 | 3,099,288 | |||||
| Southern Co. Gas Capital 5.15% 9/15/32 | 1,085,000 | 1,038,623 | |||||
| 6,844,575 | |||||||
| Real Estate Investment Trusts — 2.18% | |||||||
| American Homes 4 Rent 3.625% 4/15/32 | 945,000 | 780,444 | |||||
| American Tower Trust #1 144A 3.07% 3/15/48 # | 3,000,000 | 2,979,180 | |||||
| Digital Realty Trust 5.55% 1/15/28 | 1,520,000 | 1,509,242 | |||||
| Extra Space Storage | |||||||
| 2.35% 3/15/32 | 785,000 | 579,666 | |||||
| 2.55% 6/1/31 | 4,140,000 | 3,189,428 | |||||
| 9,037,960 | |||||||
| Technology — 16.30% | |||||||
| Adobe 2.30% 2/1/30 | 5,890,000 | 4,901,982 | |||||
| Alphabet 2.05% 8/15/50 | 2,646,000 | 1,562,717 | |||||
| Apple | |||||||
| 2.65% 5/11/50 | 825,000 | 545,691 | |||||
| 2.65% 2/8/51 | 825,000 | 544,164 | |||||
| 2.70% 8/5/51 | 575,000 | 380,737 | |||||
| Autodesk | |||||||
| 2.40% 12/15/31 * | 530,000 | 413,135 | |||||
| 2.85% 1/15/30 | 4,616,000 | 3,879,099 | |||||
| Broadcom 144A 3.469% 4/15/34 # | 2,195,000 | 1,650,817 | |||||
78
| Principal amount° | Value (US $) | ||||||
| Corporate Bonds (continued) | |||||||
| Technology (continued) | |||||||
| CDW 3.276% 12/1/28 | 4,095,000 | $ | 3,425,038 | ||||
| CoStar Group 144A 2.80% 7/15/30 # | 2,817,000 | 2,227,674 | |||||
| Entegris Escrow | |||||||
| 144A 4.75% 4/15/29 # | 1,795,000 | 1,585,119 | |||||
| 144A 5.95% 6/15/30 # | 730,000 | 667,906 | |||||
| Equinix 2.625% 11/18/24 | 5,715,000 | 5,413,805 | |||||
| Fidelity National Information Services 1.65% 3/1/28 * | 2,775,000 | 2,282,034 | |||||
| Fiserv 3.85% 6/1/25 | 5,500,000 | 5,286,574 | |||||
| Global Payments 2.65% 2/15/25 | 4,195,000 | 3,925,020 | |||||
| KLA 4.95% 7/15/52 | 1,915,000 | 1,744,310 | |||||
| Microchip Technology 0.983% 9/1/24 | 4,476,000 | 4,123,724 | |||||
| Microsoft 2.921% 3/17/52 | 3,500,000 | 2,476,383 | |||||
| NXP 3.875% 6/18/26 | 2,200,000 | 2,055,922 | |||||
| PayPal Holdings | |||||||
| 2.30% 6/1/30 * | 890,000 | 724,956 | |||||
| 3.25% 6/1/50 | 1,463,000 | 992,472 | |||||
| 4.40% 6/1/32 | 430,000 | 401,181 | |||||
| Sensata Technologies 144A 3.75% 2/15/31 # | 805,000 | 635,805 | |||||
| ServiceNow 1.40% 9/1/30 | 3,977,000 | 2,933,934 | |||||
| Texas Instruments 3.875% 3/15/39 | 3,933,000 | 3,403,921 | |||||
| Thomson Reuters 3.35% 5/15/26 | 2,450,000 | 2,298,353 | |||||
| Visa 2.70% 4/15/40 | 5,065,000 | 3,674,460 | |||||
| VMware 4.50% 5/15/25 | 2,850,000 | 2,786,744 | |||||
| Workday | |||||||
| 3.50% 4/1/27 * | 295,000 | 273,304 | |||||
| 3.70% 4/1/29 | 455,000 | 408,621 | |||||
| 67,625,602 | |||||||
| Transportation — 2.66% | |||||||
| Air Canada 2015-2 Class AA Pass Through Trust 144A 3.75% 6/15/29 #, ◆ | 2,842,688 | 2,544,193 | |||||
| Burlington Northern Santa Fe | |||||||
| 2.875% 6/15/52 | 1,445,000 | 947,545 | |||||
| 4.55% 9/1/44 | 2,000,000 | 1,749,856 | |||||
| Delta Air Lines 2020-1 Class AA Pass Through Trust 2.00% 12/10/29 ◆ | 1,738,814 | 1,477,052 | |||||
| Penske Truck Leasing 144A 4.40% 7/1/27 # | 1,200,000 | 1,127,393 | |||||
| United Airlines 2016-1 Class AA Pass Through Trust 3.10% 1/7/30 ◆ | 3,745,626 | 3,174,711 | |||||
| 11,020,750 | |||||||
| Utilities — 0.93% | |||||||
| American Water Capital | |||||||
| 4.15% 6/1/49 | 3,800,000 | 3,052,163 | |||||
| 4.45% 6/1/32 | 855,000 | 794,811 | |||||
| 3,846,974 | |||||||
| Total Corporate Bonds (cost $473,273,998) | 393,116,998 | ||||||
| Municipal Bonds — 1.26% | |||||||
| Commonwealth of Puerto Rico | |||||||
| Series A-1 2.986% 7/1/24 ^ | 19,099 | 17,563 | |||||
| Series A-1 4.00% 7/1/33 | 57,400 | 50,605 | |||||
| Series A-1 4.00% 7/1/35 | 41,688 | 35,739 | |||||
| Series A-1 4.00% 7/1/37 | 44,282 | 36,452 | |||||
| Series A-1 4.364% 7/1/33 ^ | 73,868 | 40,843 | |||||
| Series A-1 5.625% 7/1/29 | 48,273 | 49,456 | |||||
| GDB Debt Recovery Authority of Puerto Rico 7.50% 8/20/40 | 1,885,739 | 1,659,451 | |||||
| New York City Industrial Development Agency 144A 11.00% 3/1/29 # | 2,837,000 | 3,334,525 | |||||
| Total Municipal Bonds (cost $4,889,943) | 5,224,634 | ||||||
| Non-Agency Asset-Backed Securities — 1.28% | |||||||
| Enterprise Fleet Financing Series 2022-2 A2 144A 4.65% 5/21/29 # | 1,450,000 | 1,438,150 | |||||
| Ford Credit Floorplan Master Owner Trust Series 2019-2 A 3.06% 4/15/26 | 1,350,000 | 1,311,953 | |||||
| Toyota Auto Loan Extended Note Trust Series 2022-1A A 144A 3.82% 4/25/35 # | 1,450,000 | 1,389,890 | |||||
| Volkswagen Auto Lease Trust Series 2022-A A3 3.44% 7/21/25 | 1,200,000 | 1,177,002 | |||||
| Total Non-Agency Asset-Backed Securities (cost $5,443,152) | 5,316,995 | ||||||
| Sovereign Bonds — 0.42%Δ | |||||||
| Colombia — 0.18% | |||||||
| Colombia Government International Bonds 3.25% 4/22/32 | 1,075,000 | 729,243 | |||||
| 729,243 | |||||||
79
Schedules of investments
Delaware Ivy Corporate Bond Fund
| Principal amount° | Value (US $) | ||||||
| Sovereign Bonds Δ (continued) | |||||||
| Mexico — 0.24% | |||||||
| Mexico Government International Bond 3.75% 4/19/71 * | 1,750,000 | $ | 1,019,454 | ||||
| 1,019,454 | |||||||
| Total Sovereign Bonds (cost $2,793,185) | 1,748,697 | ||||||
| US Treasury Obligations — 0.93% | |||||||
| US Treasury Bonds 3.00% 8/15/52 | 1,005,000 | 867,598 | |||||
| US Treasury Notes 2.75% 8/15/32 * | 3,270,000 | 2,990,517 | |||||
| Total US Treasury Obligations (cost $3,964,990) | 3,858,115 | ||||||
| Number of shares | |||||||
| Short-Term Investments — 0.34% | |||||||
| Money Market Mutual Funds — 0.34% | |||||||
| BlackRock Liquidity FedFund – Institutional Shares (seven-day effective yield 2.76%) | 349,685 | 349,685 | |||||
| Fidelity Investments Money Market Government Portfolio – Class I (seven-day effective yield 2.74%) | 349,685 | 349,685 | |||||
| Goldman Sachs Financial Square Government Fund – Institutional Shares (seven-day effective yield 2.98%) | 349,686 | 349,686 | |||||
| Morgan Stanley Institutional Liquidity Funds Government Portfolio – Institutional Class (seven-day effective yield 2.80%) | 349,685 | 349,685 | |||||
| Total Short-Term Investments (cost $1,398,741) | 1,398,741 | ||||||
| Total Value of Securities Before Securities Lending Collateral—99.13% (cost $492,320,208) | 411,200,349 | ||||||
| Securities Lending Collateral** — 0.42% | |||||||
| Money Market Mutual Fund — 0.42% Dreyfus Institutional Preference Government Money Market Fund - Institutional Shares (seven-day effective yield 2.98%) | 1,749,532 | 1,749,532 | |||||
| Total Securities Lending Collateral (cost $1,749,532) | 1,749,532 | ||||||
| Total Value of Securities—99.55% (cost $494,069,740) | $ | 412,949,881■ | |||||
| ° | Principal amount shown is stated in USD unless noted that the security is denominated in another currency. |
| µ | Fixed to variable rate investment. The rate shown reflects the fixed rate in effect at September 30, 2022. Rate will reset at a future date. |
| * | Fully or partially on loan. |
| Ψ | Perpetual security. Maturity date represents next call date. |
| # | Security exempt from registration under Rule 144A of the Securities Act of 1933, as amended. At September 30, 2022, the aggregate value of Rule 144A securities was $59,883,336, which represents 14.44% of the Fund’s net assets. See Note 12 in “Notes to financial statements.” |
| ◆ | Pass Through Agreement. Security represents the contractual right to receive a proportionate amount of underlying payments due to the counterparty pursuant to various agreements related to the rescheduling of obligations and the exchange of certain notes. |
| ^ | Zero-coupon security. The rate shown is the effective yield at the time of purchase. |
| ∆ | Securities have been classified by country of risk. |
| ** | See Note 11 in “Notes to financial statements” for additional information on securities lending collateral. |
| ■ | Includes $20,187,804 of securities loaned for which the counterparty pledged additional non-cash collateral valued at $19,082,467. |
Summary of abbreviations:
DAC – Designated Activity Company
USD – US Dollar
See accompanying notes, which are an integral part of the financial statements.
80
Delaware Ivy Crossover Credit Fund
September 30, 2022
| Principal amount° | Value (US $) | ||||||
| Convertible Bond — 0.16% | |||||||
| Spirit Airlines 1.00% exercise price $49.07, maturity date 5/15/26 | 32,000 | $ | 27,408 | ||||
| Total Convertible Bond (cost $28,451) | 27,408 | ||||||
| Corporate Bonds — 93.65% | |||||||
| Banking — 14.56% | |||||||
| Bank of America | |||||||
| 1.898% 7/23/31 μ | 500,000 | 373,157 | |||||
| 2.482% 9/21/36 μ | 40,000 | 28,952 | |||||
| 4.948% 7/22/28 μ | 50,000 | 48,094 | |||||
| 6.125% 4/27/27 *, μ, Ψ | 15,000 | 14,212 | |||||
| Citigroup 5.61% 9/29/26 μ | 125,000 | 124,397 | |||||
| Fifth Third Bancorp 4.337% 4/25/33 μ | 35,000 | 31,075 | |||||
| Goldman Sachs Group 2.383% 7/21/32 μ | 1,000,000 | 755,145 | |||||
| JPMorgan Chase & Co. 2.522% 4/22/31 μ | 500,000 | 395,899 | |||||
| KeyCorp 4.789% 6/1/33 μ | 60,000 | 55,099 | |||||
| PNC Financial Services Group 6.20% 9/15/27 μ, Ψ | 60,000 | 56,850 | |||||
| State Street 4.164% 8/4/33 μ | 95,000 | 85,858 | |||||
| SVB Financial Group | |||||||
| 4.00% 5/15/26 μ, Ψ | 55,000 | 41,826 | |||||
| 4.57% 4/29/33 *, μ | 50,000 | 43,895 | |||||
| Toronto-Dominion Bank 4.108% 6/8/27 * | 35,000 | 33,044 | |||||
| Truist Financial | |||||||
| 4.916% 7/28/33 μ | 48,000 | 43,445 | |||||
| 4.95% 9/1/25 μ, Ψ | 45,000 | 43,348 | |||||
| US Bancorp 2.491% 11/3/36 μ | 150,000 | 112,975 | |||||
| Wells Fargo & Co. | |||||||
| 4.54% 8/15/26 μ | 195,000 | 188,753 | |||||
| 4.808% 7/25/28 *, μ | 45,000 | 42,964 | |||||
| 2,518,988 | |||||||
| Basic Industry — 0.33% | |||||||
| Celanese US Holdings | |||||||
| 6.05% 3/15/25 | 35,000 | 34,223 | |||||
| 6.165% 7/15/27 | 25,000 | 23,692 | |||||
| 57,915 | |||||||
| Brokerage — 3.15% | |||||||
| Jefferies Group 2.625% 10/15/31 | 750,000 | 545,232 | |||||
| 545,232 | |||||||
| Capital Goods — 1.18% | |||||||
| Boeing 3.75% 2/1/50 | 100,000 | 65,375 | |||||
| Eaton 4.15% 3/15/33 | 45,000 | 40,722 | |||||
| Parker-Hannifin 4.25% 9/15/27 | 15,000 | 14,311 | |||||
| Republic Services 2.375% 3/15/33 * | 110,000 | 84,508 | |||||
| 204,916 | |||||||
| Communications — 13.35% | |||||||
| AMC Networks 4.25% 2/15/29 * | 30,000 | 22,250 | |||||
| AT&T | |||||||
| 3.50% 6/1/41 | 500,000 | 361,185 | |||||
| 3.50% 9/15/53 | 40,000 | 26,719 | |||||
| 3.65% 6/1/51 | 500,000 | 339,151 | |||||
| CCO Holdings 144A 4.75% 2/1/32 #, * | 40,000 | 31,217 | |||||
| Charter Communications Operating | |||||||
| 3.85% 4/1/61 | 140,000 | 82,092 | |||||
| 3.90% 6/1/52 | 750,000 | 466,115 | |||||
| Crown Castle 1.05% 7/15/26 | 500,000 | 422,950 | |||||
| Directv Financing 144A 5.875% 8/15/27 # | 55,000 | 47,541 | |||||
| T-Mobile USA 2.875% 2/15/31 * | 105,000 | 84,756 | |||||
| Verizon Communications | |||||||
| 2.65% 11/20/40 | 500,000 | 327,049 | |||||
| 2.875% 11/20/50 | 90,000 | 55,279 | |||||
| Warnermedia Holdings 144A 5.141% 3/15/52 # | 60,000 | 43,724 | |||||
| 2,310,028 | |||||||
| Consumer Cyclical — 9.24% | |||||||
| ADT Security 144A 4.875% 7/15/32 # | 49,000 | 39,613 | |||||
| Amazon.com 2.50% 6/3/50 | 105,000 | 65,879 | |||||
| Aptiv 3.10% 12/1/51 | 112,000 | 62,941 | |||||
| General Motors Financial 1.25% 1/8/26 | 500,000 | 430,258 | |||||
| Levi Strauss & Co. 144A 3.50% 3/1/31 #, * | 5,000 | 3,907 | |||||
| Lowe’s 4.40% 9/8/25 | 60,000 | 59,128 | |||||
| NVR 3.00% 5/15/30 | 1,000,000 | 817,888 | |||||
| Target 4.50% 9/15/32 | 45,000 | 42,943 | |||||
| VICI Properties 4.95% 2/15/30 * | 85,000 | 76,996 | |||||
| 1,599,553 | |||||||
| Consumer Non-Cyclical — 5.94% | |||||||
| CVS Health | |||||||
| 2.70% 8/21/40 | 5,000 | 3,294 | |||||
| 4.78% 3/25/38 | 40,000 | 35,146 | |||||
| JBS USA LUX 144A 3.00% 2/2/29 # | 34,000 | 27,862 | |||||
| Royalty Pharma | |||||||
| 3.30% 9/2/40 | 700,000 | 471,160 | |||||
| 3.35% 9/2/51 | 55,000 | 33,284 | |||||
81
Schedules of investments
Delaware Ivy Crossover Credit Fund
| Principal amount° | Value (US $) | ||||||
| Corporate Bonds (continued) | |||||||
| Consumer Non-Cyclical (continued) | |||||||
| Tenet Healthcare 144A 4.25% 6/1/29 # | 25,000 | $ | 20,736 | ||||
| Universal Health Services 144A 1.65% 9/1/26 # | 500,000 | 419,603 | |||||
| US Foods 144A 4.75% 2/15/29 # | 20,000 | 17,162 | |||||
| 1,028,247 | |||||||
| Electric — 2.80% | |||||||
| Appalachian Power 4.50% 8/1/32 | 45,000 | 40,557 | |||||
| Duke Energy Carolinas 3.95% 11/15/28 | 25,000 | 23,449 | |||||
| Fells Point Funding Trust 144A 3.046% 1/31/27 # | 100,000 | 89,223 | |||||
| ITC Holdings 144A 4.95% 9/22/27 # | 35,000 | 34,202 | |||||
| National Rural Utilities Cooperative Finance 4.15% 12/15/32 | 95,000 | 87,093 | |||||
| Oglethorpe Power 144A 4.50% 4/1/47 # | 40,000 | 31,359 | |||||
| Southern California Edison 3.45% 2/1/52 | 55,000 | 37,128 | |||||
| Vistra Operations 144A 5.125% 5/13/25 # | 115,000 | 111,490 | |||||
| WEC Energy Group 5.15% 10/1/27 * | 30,000 | 29,764 | |||||
| 484,265 | |||||||
| Energy — 4.96% | |||||||
| Diamondback Energy 4.25% 3/15/52 | 60,000 | 43,952 | |||||
| Energy Transfer | |||||||
| 5.30% 4/15/47 | 250,000 | 200,115 | |||||
| 6.25% 4/15/49 | 45,000 | 40,054 | |||||
| EQT 6.125% 2/1/25 ● | 65,000 | 65,178 | |||||
| Kinder Morgan 5.45% 8/1/52 | 60,000 | 52,125 | |||||
| Targa Resources Partners 5.00% 1/15/28 | 45,000 | 41,722 | |||||
| Williams Cos. 4.85% 3/1/48 | 500,000 | 415,172 | |||||
| 858,318 | |||||||
| Finance Companies — 4.11% | |||||||
| AerCap Ireland Capital DAC 3.00% 10/29/28 | 240,000 | 192,685 | |||||
| Air Lease | |||||||
| 2.875% 1/15/32 * | 70,000 | 52,859 | |||||
| 4.125% 12/15/26 μ, Ψ | 67,000 | 46,144 | |||||
| Avolon Holdings Funding 144A 3.25% 2/15/27 # | 500,000 | 419,361 | |||||
| 711,049 | |||||||
| Insurance — 6.53% | |||||||
| Aon | |||||||
| 2.80% 5/15/30 | 500,000 | 415,297 | |||||
| Aon | |||||||
| 5.00% 9/12/32 | 50,000 | 47,969 | |||||
| Athene Global Funding 144A 1.985% 8/19/28 # | 20,000 | 15,790 | |||||
| Brighthouse Financial 3.85% 12/22/51 | 40,000 | 24,298 | |||||
| Centene 2.45% 7/15/28 | 110,000 | 89,745 | |||||
| First American Financial 2.40% 8/15/31 | 750,000 | 536,755 | |||||
| 1,129,854 | |||||||
| Natural Gas — 0.87% | |||||||
| Atmos Energy 5.75% 10/15/52 | 60,000 | 60,017 | |||||
| Sempra Energy 4.875% 10/15/25 μ, Ψ | 45,000 | 41,963 | |||||
| Southern Co. Gas Capital 5.15% 9/15/32 | 50,000 | 47,863 | |||||
| 149,843 | |||||||
| Real Estate Investment Trusts — 4.02% | |||||||
| American Homes 4 Rent 3.625% 4/15/32 | 50,000 | 41,293 | |||||
| Digital Realty Trust 5.55% 1/15/28 | 40,000 | 39,717 | |||||
| Extra Space Storage | |||||||
| 2.35% 3/15/32 | 75,000 | 55,382 | |||||
| 2.55% 6/1/31 | 725,000 | 558,535 | |||||
| 694,927 | |||||||
| Technology — 22.17% | |||||||
| Alphabet 2.05% 8/15/50 | 90,000 | 53,154 | |||||
| Autodesk 2.85% 1/15/30 | 750,000 | 630,269 | |||||
| Broadcom 144A 3.419% 4/15/33 # | 500,000 | 382,547 | |||||
| CDW 3.276% 12/1/28 | 60,000 | 50,184 | |||||
| CoStar Group 144A 2.80% 7/15/30 # | 1,000,000 | 790,797 | |||||
| Entegris Escrow | |||||||
| 144A 4.75% 4/15/29 # | 95,000 | 83,892 | |||||
| 144A 5.95% 6/15/30 # | 35,000 | 32,023 | |||||
| KLA 4.95% 7/15/52 | 60,000 | 54,652 | |||||
| Microchip Technology 0.983% 9/1/24 | 750,000 | 690,972 | |||||
| Sensata Technologies 144A 3.75% 2/15/31 # | 30,000 | 23,694 | |||||
| ServiceNow 1.40% 9/1/30 | 750,000 | 553,294 | |||||
| Thomson Reuters 3.35% 5/15/26 | 500,000 | 469,052 | |||||
| Workday 3.70% 4/1/29 * | 25,000 | 22,452 | |||||
| 3,836,982 | |||||||
| Transportation — 0.44% | |||||||
| Burlington Northern Santa Fe 2.875% 6/15/52 | 65,000 | 42,623 | |||||
82
| Principal amount° | Value (US $) | ||||||
| Corporate Bonds (continued) | |||||||
| Transportation (continued) | |||||||
| Penske Truck Leasing 144A 4.40% 7/1/27 # | 35,000 | $ | 32,882 | ||||
| 75,505 | |||||||
| Total Corporate Bonds (cost $20,295,112) | 16,205,622 | ||||||
| Municipal Bonds — 0.65% | |||||||
| Commonwealth of Puerto Rico (Restructured) | |||||||
| Series A-1 2.986% 7/1/24 ^ | 1,232 | 1,133 | |||||
| Series A-1 4.00% 7/1/33 | 3,703 | 3,265 | |||||
| Series A-1 4.00% 7/1/35 | 2,689 | 2,305 | |||||
| Series A-1 4.00% 7/1/37 | 2,856 | 2,351 | |||||
| Series A-1 4.364% 7/1/33 ^ | 4,765 | 2,635 | |||||
| Series A-1 5.625% 7/1/29 | 3,114 | 3,190 | |||||
| GDB Debt Recovery Authority of Puerto Rico 7.50% 8/20/40 | 110,385 | 97,139 | |||||
| Total Municipal Bonds (cost $121,775) | 112,018 | ||||||
| Non-Agency Asset-Backed Securities — 0.79% | |||||||
| Enterprise Fleet Financing Series 2022-2 A2 144A 4.65% 5/21/29 # | 70,000 | 69,428 | |||||
| Ford Credit Floorplan Master Owner Trust Series 2019-2 A 3.06% 4/15/26 | 70,000 | 68,027 | |||||
| Total Non-Agency Asset-Backed Securities (cost $139,680) | 137,455 | ||||||
| US Treasury Obligation — 0.12% | |||||||
| US Treasury Bonds 3.00% 8/15/52 | 25,000 | 21,582 | |||||
| Total US Treasury Obligation (cost $22,173) | 21,582 | ||||||
| Number of shares | |||||||
| Short-Term Investments — 4.74% | |||||||
| Money Market Mutual Funds — 4.74% | |||||||
| BlackRock Liquidity FedFund – Institutional Shares (seven-day effective yield 2.76%) | 204,956 | 204,956 | |||||
| Fidelity Investments Money Market Government Portfolio – Class I (seven-day effective yield 2.74%) | 204,956 | 204,956 | |||||
| Goldman Sachs Financial Square Government Fund – Institutional Shares (seven-day effective yield 2.98%) | 204,956 | 204,956 | |||||
| Morgan Stanley Institutional Liquidity Funds Government Portfolio – Institutional Class (seven-day effective yield 2.80%) | 204,955 | 204,955 | |||||
| Total Short-Term Investments (cost $819,823) | 819,823 | ||||||
| Total Value of Securities Before Securities Lending Collateral—100.11% (cost $21,427,014) | 17,323,908 | ||||||
| Securities Lending Collateral** — 0.61% | |||||||
| Money Market Mutual Fund — 0.61% | |||||||
| Dreyfus Institutional Preference Government Money Market Fund - Institutional Shares (seven-day effective yield 2.98%) | 105,650 | 105,650 | |||||
| Total Securities Lending Collateral (cost $105,650) | 105,650 | ||||||
| Total Value of Securities—100.72% (cost $21,532,664) | $ | 17,429,558■ | |||||
| ° | Principal amount shown is stated in USD unless noted that the security is denominated in another currency. |
| µ | Fixed to variable rate investment. The rate shown reflects the fixed rate in effect at September 30, 2022. Rate will reset at a future date. |
| * | Fully or partially on loan. |
| Ψ | Perpetual security. Maturity date represents next call date. |
| # | Security exempt from registration under Rule 144A of the Securities Act of 1933, as amended. At September 30, 2022, the aggregate value of Rule 144A securities was $2,768,053, which represents 16.00% of the Fund’s net assets. See Note 12 in “Notes to financial statements.” |
83
Schedules of investments
Delaware Ivy Crossover Credit Fund
| ● | Variable rate investment. Rates reset periodically. Rate shown reflects the rate in effect at September 30, 2022. For securities based on a published reference rate and spread, the reference rate and spread are indicated in their descriptions. The reference rate descriptions (i.e. LIBOR03M, LIBOR06M, etc.) used in this report are identical for different securities, but the underlying reference rates may differ due to the timing of the reset period. Certain variable rate securities are not based on a published reference rate and spread but are determined by the issuer or agent and are based on current market conditions, or for mortgage-backed securities, are impacted by the individual mortgages which are paying off over time. These securities do not indicate a reference rate and spread in their descriptions. |
| ^ | Zero-coupon security. The rate shown is the effective yield at the time of purchase. |
| ** | See Note 11 in “Notes to financial statements” for additional information on securities lending collateral. |
| ■ | Includes $542,102 of securities loaned for which the counterparty pledged additional non-cash collateral valued at $451,164. |
Summary of abbreviations:
DAC – Designated Activity Company
USD – US Dollar
Summary of abbreviations:
DAC – Designated Activity Company
USD – US Dollar
See accompanying notes, which are an integral part of the financial statements.
84
Delaware Ivy Emerging Markets Local Currency Debt Fund
September 30, 2022
| Principal amount° | Value (US $) | |||||||||
| Sovereign Bonds — 88.37%∆ | ||||||||||
| Brazil — 11.31% | ||||||||||
| Brazil Letras do Tesouro Nacional | ||||||||||
| 7.194% 7/1/24 ^ | BRL | 1,258,000 | $ | 191,320 | ||||||
| 7.221% 1/1/24 ^ | BRL | 7,300,000 | 1,165,123 | |||||||
| Brazil Notas do Tesouro Nacional | ||||||||||
| Series F 10.00% 1/1/27 | BRL | 6,045,000 | 1,058,329 | |||||||
| Series F 10.00% 1/1/31 | BRL | 672,000 | 112,502 | |||||||
| 2,527,274 | ||||||||||
| Chile — 2.14% | ||||||||||
| Bonos de la Tesoreria de la Republica en pesos | ||||||||||
| 144A 2.30% 10/1/28 # | CLP | 100,000,000 | 76,323 | |||||||
| 144A 2.80% 10/1/33 # | CLP | 115,000,000 | 82,885 | |||||||
| 4.50% 3/1/26 | CLP | 90,000,000 | 84,745 | |||||||
| 144A 4.70% 9/1/30 # | CLP | 40,000,000 | 35,809 | |||||||
| 144A 5.00% 10/1/28 # | CLP | 80,000,000 | 73,390 | |||||||
| 5.00% 3/1/35 | CLP | 70,000,000 | 61,050 | |||||||
| 6.00% 1/1/43 | CLP | 70,000,000 | 65,188 | |||||||
| 479,390 | ||||||||||
| Colombia — 4.76% | ||||||||||
| Colombian TES | ||||||||||
| 5.75% 11/3/27 | COP | 1,420,600,000 | 232,905 | |||||||
| 6.00% 4/28/28 | COP | 1,141,600,000 | 184,955 | |||||||
| 6.25% 7/9/36 | COP | 320,300,000 | 40,678 | |||||||
| 7.00% 3/26/31 | COP | 778,500,000 | 120,183 | |||||||
| 7.00% 6/30/32 | COP | 1,042,100,000 | 155,482 | |||||||
| 7.25% 10/18/34 | COP | 885,100,000 | 128,813 | |||||||
| 7.25% 10/26/50 | COP | 421,700,000 | 53,049 | |||||||
| 7.75% 9/18/30 | COP | 896,000,000 | 147,566 | |||||||
| 1,063,631 | ||||||||||
| Czech Republic — 6.99% | ||||||||||
| Czech Republic Government Bonds | ||||||||||
| 0.25% 2/10/27 | CZK | 1,580,000 | 50,489 | |||||||
| 0.95% 5/15/30 | CZK | 8,230,000 | 240,005 | |||||||
| 1.25% 2/14/25 | CZK | 3,010,000 | 107,759 | |||||||
| 1.50% 4/24/40 | CZK | 1,700,000 | 38,673 | |||||||
| 1.75% 6/23/32 | CZK | 12,900,000 | 378,571 | |||||||
| 2.00% 10/13/33 | CZK | 4,250,000 | 124,137 | |||||||
| 2.40% 9/17/25 | CZK | 4,400,000 | 160,415 | |||||||
| 2.50% 8/25/28 | CZK | 4,860,000 | 166,297 | |||||||
| 2.75% 7/23/29 | CZK | 4,470,000 | 152,235 | |||||||
| 5.008% 12/12/24 ^ | CZK | 4,060,000 | 143,413 | |||||||
| 1,561,994 | ||||||||||
| Dominican Republic — 0.65% | ||||||||||
| Dominican Republic International Bond 9.75% 6/5/26 | DOP | 8,000,000 | 144,741 | |||||||
| 144,741 | ||||||||||
| Hungary — 3.24% | ||||||||||
| Hungary Government Bonds | ||||||||||
| 1.00% 11/26/25 | HUF | 50,000,000 | 84,525 | |||||||
| 1.50% 4/22/26 | HUF | 65,000,000 | 108,885 | |||||||
| 1.50% 8/26/26 | HUF | 29,820,000 | 48,825 | |||||||
| 2.50% 10/24/24 | HUF | 58,900,000 | 112,123 | |||||||
| 2.75% 12/22/26 | HUF | 55,000,000 | 93,478 | |||||||
| 3.00% 10/27/38 | HUF | 8,510,000 | 9,411 | |||||||
| 4.00% 4/28/51 | HUF | 95,680,000 | 104,521 | |||||||
| 6.00% 11/24/23 | HUF | 42,520,000 | 91,101 | |||||||
| 6.75% 10/22/28 | HUF | 36,100,000 | 71,399 | |||||||
| 724,268 | ||||||||||
| Indonesia — 15.39% | ||||||||||
| Indonesia Treasury Bonds | ||||||||||
| 6.125% 5/15/28 | IDR | 23,841,000,000 | 1,493,337 | |||||||
| 6.625% 5/15/33 | IDR | 4,980,000,000 | 306,809 | |||||||
| 7.125% 6/15/42 | IDR | 2,270,000,000 | 145,414 | |||||||
| 7.50% 8/15/32 | IDR | 1,105,000,000 | 72,954 | |||||||
| 7.50% 6/15/35 | IDR | 5,300,000,000 | 348,740 | |||||||
| 7.75% 4/15/31 | IDR | 979,000,000 | 66,852 | |||||||
| 8.25% 5/15/29 | IDR | 2,683,000,000 | 184,960 | |||||||
| 8.375% 9/15/26 | IDR | 570,000,000 | 39,334 | |||||||
| 8.75% 5/15/31 | IDR | 5,042,000,000 | 357,197 | |||||||
| 8.75% 2/15/44 | IDR | 1,353,000,000 | 100,654 | |||||||
| 9.00% 3/15/29 | IDR | 2,800,000,000 | 199,800 | |||||||
| 9.50% 7/15/31 | IDR | 290,000,000 | 21,586 | |||||||
| 9.50% 5/15/41 | IDR | 1,307,000,000 | 100,752 | |||||||
| 3,438,389 | ||||||||||
| Malaysia — 9.16% | ||||||||||
| Malaysia Government Bonds | ||||||||||
| 2.632% 4/15/31 | MYR | 675,000 | 126,198 | |||||||
| 3.733% 6/15/28 | MYR | 1,820,000 | 380,758 | |||||||
| 3.757% 4/20/23 | MYR | 3,338,000 | 723,042 | |||||||
| 3.757% 5/22/40 | MYR | 3,149,000 | 588,125 | |||||||
| 3.828% 7/5/34 | MYR | 200,000 | 39,689 | |||||||
| 4.232% 6/30/31 | MYR | 650,000 | 137,245 | |||||||
| 4.392% 4/15/26 | MYR | 236,000 | 51,570 | |||||||
| 2,046,627 | ||||||||||
| Mexico — 6.48% | ||||||||||
| Mexican Bonos 5.50% 3/4/27 | MXN | 9,600,000 | 404,004 | |||||||
85
Schedules of investments
Delaware Ivy Emerging Markets Local Currency Debt Fund
| Principal amount° | Value (US $) | |||||||||||
| Sovereign Bonds∆ (continued) | ||||||||||||
| Mexico (continued) | ||||||||||||
| Mexican Bonos | ||||||||||||
| 6.75% 3/9/23 | MXN | 5,052,200 | $ | 247,089 | ||||||||
| 7.75% 5/29/31 | MXN | 2,740,000 | 120,849 | |||||||||
| 7.75% 11/23/34 | MXN | 4,510,000 | 193,285 | |||||||||
| 7.75% 11/13/42 | MXN | 1,500,000 | 61,840 | |||||||||
| 8.00% 11/7/47 | MXN | 600,000 | 25,145 | |||||||||
| 8.50% 11/18/38 | MXN | 5,128,100 | 229,889 | |||||||||
| 10.00% 11/20/36 | MXN | 3,270,000 | 166,575 | |||||||||
| 1,448,676 | ||||||||||||
| Peru — 4.27% | ||||||||||||
| Peru Government Bonds | ||||||||||||
| 5.35% 8/12/40 | PEN | 190,000 | 32,667 | |||||||||
| 5.40% 8/12/34 * | PEN | 496,000 | 93,005 | |||||||||
| 5.94% 2/12/29 * | PEN | 782,000 | 171,942 | |||||||||
| 6.15% 8/12/32 | PEN | 1,128,000 | 233,931 | |||||||||
| Peruvian Government International Bonds | ||||||||||||
| 6.35% 8/12/28 | PEN | 1,000,000 | 228,484 | |||||||||
| 6.90% 8/12/37 | PEN | 300,000 | 62,663 | |||||||||
| 6.95% 8/12/31 | PEN | 586,000 | 131,033 | |||||||||
| 953,725 | ||||||||||||
| Poland — 0.20% | ||||||||||||
| Republic of Poland Government Bond 2.50% 7/25/27 | PLN | 272,000 | 44,381 | |||||||||
| 44,381 | ||||||||||||
| Romania — 4.58% | ||||||||||||
| Romania Government Bonds | ||||||||||||
| 3.25% 4/29/24 | RON | 580,000 | 106,850 | |||||||||
| 3.25% 6/24/26 | RON | 180,000 | 29,843 | |||||||||
| 3.70% 11/25/24 | RON | 185,000 | 33,472 | |||||||||
| 4.00% 10/25/23 * | RON | 700,000 | 133,522 | |||||||||
| 4.15% 1/26/28 | RON | 500,000 | 80,737 | |||||||||
| 4.15% 10/24/30 | RON | 205,000 | 30,439 | |||||||||
| 4.40% 9/25/23 | RON | 1,400,000 | 269,005 | |||||||||
| 4.85% 4/22/26 | RON | 900,000 | 158,689 | |||||||||
| 5.00% 2/12/29 | RON | 505,000 | 82,719 | |||||||||
| 5.80% 7/26/27 | RON | 560,000 | 98,937 | |||||||||
| 1,024,213 | ||||||||||||
| South Africa — 9.95% | ||||||||||||
| Republic of South Africa Government Bonds | ||||||||||||
| 6.50% 2/28/41 | ZAR | 1,840,021 | 61,529 | |||||||||
| 7.00% 2/28/31 | ZAR | 8,697,600 | 371,858 | |||||||||
| 8.25% 3/31/32 | ZAR | 6,500,000 | 295,642 | |||||||||
| 8.50% 1/31/37 | ZAR | 4,897,009 | 209,016 | |||||||||
| 8.75% 1/31/44 | ZAR | 4,580,705 | 192,023 | |||||||||
| Republic of South Africa Government Bonds | ||||||||||||
| 8.75% 2/28/48 | ZAR | 9,704,755 | 405,401 | |||||||||
| 8.875% 2/28/35 | ZAR | 5,713,558 | 258,278 | |||||||||
| 9.00% 1/31/40 | ZAR | 4,310,342 | 187,905 | |||||||||
| 10.50% 12/21/26 | ZAR | 4,244,000 | 242,805 | |||||||||
| 2,224,457 | ||||||||||||
| Thailand — 7.58% | ||||||||||||
| Thailand Government Bonds | ||||||||||||
| 1.60% 12/17/29 | THB | 5,655,000 | 135,953 | |||||||||
| 1.60% 6/17/35 | THB | 839,000 | 17,739 | |||||||||
| 2.00% 12/17/31 | THB | 8,812,000 | 214,052 | |||||||||
| 2.875% 12/17/28 | THB | 32,821,000 | 868,839 | |||||||||
| 2.875% 6/17/46 | THB | 5,000,000 | 108,075 | |||||||||
| 3.30% 6/17/38 | THB | 10,220,000 | 252,571 | |||||||||
| 3.40% 6/17/36 | THB | 2,440,000 | 62,138 | |||||||||
| 3.775% 6/25/32 | THB | 1,286,000 | 35,834 | |||||||||
| 1,695,201 | ||||||||||||
| Turkey — 0.97% | ||||||||||||
| Turkey Government Bonds | ||||||||||||
| 9.00% 7/24/24 | TRY | 900,000 | 46,824 | |||||||||
| 10.40% 3/20/24 | TRY | 450,000 | 23,923 | |||||||||
| 10.60% 2/11/26 | TRY | 856,637 | 44,661 | |||||||||
| 12.40% 3/8/28 | TRY | 130,848 | 7,745 | |||||||||
| 12.60% 10/1/25 | TRY | 1,700,000 | 93,640 | |||||||||
| 216,793 | ||||||||||||
| Ukraine — 0.44% | ||||||||||||
| Ukraine Government International Bond 11.67% 11/22/23 | UAH | 5,394,000 | 98,170 | |||||||||
| 98,170 | ||||||||||||
| Uruguay — 0.26% | ||||||||||||
| Uruguay Government International Bonds | ||||||||||||
| 8.25% 5/21/31 | UYU | 1,109,152 | 22,241 | |||||||||
| 8.50% 3/15/28 | UYU | 1,637,000 | 34,911 | |||||||||
| 57,152 | ||||||||||||
| Total Sovereign Bonds (cost $24,726,727) | 19,749,082 | |||||||||||
| Supranational Banks — 4.36% | ||||||||||||
| European Investment Bank | ||||||||||||
| 8.50% 8/24/23 | EGP | 7,000,000 | 349,887 | |||||||||
| 13.943% 10/18/32 ^ | ZAR | 10,260,000 | 213,476 | |||||||||
86
| Principal amount° | Value (US $) | |||||||||||
| Supranational Banks (continued) | ||||||||||||
| International Finance 7.00% 7/20/27 | MXN | 9,270,000 | $ | 410,763 | ||||||||
| Total Supranational Banks (cost $1,066,973) | 974,126 | |||||||||||
| Number of shares | ||||||||||||
| Short-Term Investments — 3.66% | ||||||||||||
| Money Market Mutual Funds — 3.66% | ||||||||||||
| BlackRock Liquidity FedFund – Institutional Shares (seven-day effective yield 2.76%) | 204,785 | 204,785 | ||||||||||
| Fidelity Investments Money Market Government Portfolio – Class I (seven-day effective yield 2.74%) | 204,784 | 204,784 | ||||||||||
| Goldman Sachs Financial Square Government Fund – Institutional Shares (seven-day effective yield 2.98%) | 204,785 | 204,785 | ||||||||||
| Morgan Stanley Institutional Liquidity Funds Government Portfolio – Institutional Class (seven-day effective yield 2.80%) | 204,784 | 204,784 | ||||||||||
| Total Short-Term Investments (cost $819,138) | 819,138 | |||||||||||
| Total Value of Securities Before Securities Lending Collateral—96.39% (cost $26,612,838) | 21,542,346 | |||||||||||
| Securities Lending Collateral** — 2.02% | ||||||||||||
| Money Market Mutual Fund — 2.02% | ||||||||||||
| Dreyfus Institutional Preference Government Money Market Fund - Institutional Shares (seven-day effective yield 2.98%) | 450,886 | 450,886 | ||||||||||
| Total Securities Lending Collateral (cost $450,886) | 450,886 | |||||||||||
| Total Value of Securities—98.41% (cost $27,063,724) | $ | 21,993,232■ | ||||||||||
| ° | Principal amount shown is stated in USD unless noted that the security is denominated in another currency. |
| D | Securities have been classified by country of risk. |
| ^ | Zero-coupon security. The rate shown is the effective yield at the time of purchase. |
| # | Security exempt from registration under Rule 144A of the Securities Act of 1933, as amended. At September 30, 2022, the aggregate value of Rule 144A securities was $268,407, which represents 1.20% of the Fund’s net assets. See Note 12 in “Notes to financial statements.” |
| * | Fully or partially on loan. |
| ** | See Note 11 in “Notes to financial statements” for additional information on securities lending collateral. |
| ■ | Includes $393,866 of securities loaned. |
87
Schedules of investments
Delaware Ivy Emerging Markets Local Currency Debt Fund
The following foreign currency exchange contracts were outstanding at September 30, 2022:1
Foreign Currency Exchange Contracts
| Counterparty | Currency to Receive (Deliver) | In Exchange For | Settlement Date | Unrealized Appreciation | Unrealized Depreciation | ||||||||||||||||||||
| JPMCB | CNH | 10,421,467 | USD | (1,507,502 | ) | 11/18/22 | $ | – | $ | (46,533 | ) | ||||||||||||||
| JPMCB | CZK | (12,783,980 | ) | USD | 517,184 | 11/18/22 | 10,374 | – | |||||||||||||||||
| JPMCB | IDR | (16,250,445,000 | ) | USD | 1,090,999 | 11/18/22 | 31,999 | – | |||||||||||||||||
| JPMCB | MXN | (5,199,708 | ) | USD | 254,066 | 11/18/22 | – | (1,732 | ) | ||||||||||||||||
| JPMCB | PLN | 6,184,031 | USD | (1,296,198 | ) | 11/18/22 | – | (58,528 | ) | ||||||||||||||||
| JPMCB | ZAR | (5,992,096 | ) | USD | 350,238 | 11/18/22 | 20,651 | – | |||||||||||||||||
| Total Foreign Currency Exchange Contracts | $ | 63,024 | $ | (106,793 | ) | ||||||||||||||||||||
The use of foreign currency exchange contracts involve elements of market risk and risks in excess of the amounts disclosed in these financial statements. The foreign currency exchange contracts presented above represent the Fund’s total exposure in such contracts, whereas only the net unrealized appreciation (depreciation) is reflected in the Fund’s net assets.
1 See Note 9 in “Notes to financial statements”.
Summary of abbreviations:
JPMCB – JPMorgan Chase Bank
Summary of currencies:
BRL – Brazilian Real
CLP – Chilean Peso
CNH – Chinese Yuan Renminbi
COP – Colombian Peso
CZK – Czech Koruna
DOP – Dominican Peso
EGP – Egypt Pound
HUF – Hungarian Forint
IDR – Indonesian Rupiah
MXN – Mexican Peso
MYR – Malaysian Ringgit
PEN – Peruvian Sol
PLN – Polish Zloty
RON – Romania Leu
THB – Thai Baht
TRY – Turkish Lira
UAH – Ukrainian Hryvna
USD – US Dollar
UYU – Uruguayan Peso
ZAR – South African Rand
See accompanying notes, which are an integral part of the financial statements.
88
Delaware Ivy Government Securities Fund
September 30, 2022
| Principal amount° | Value (US $) | ||||||
| Agency Collateralized Mortgage Obligations — 2.64% | |||||||
| Freddie Mac REMICs | |||||||
| Series 2611 HD 5.00% 5/15/23 | 40,731 | $ | 40,721 | ||||
| Series 4568 DA 3.00% 4/15/46 | 929,680 | 856,568 | |||||
| Series 4764 PA 3.00% 10/15/45 | 396,802 | 379,440 | |||||
| Series 4798 BA 4.00% 5/15/44 | 329,854 | 327,893 | |||||
| Series 4922 PA 2.50% 7/25/49 | 822,294 | 727,394 | |||||
| Series 4953 PC 2.00% 8/25/49 | 1,816,754 | 1,567,243 | |||||
| GNMA | |||||||
| Series 2004-31 ZB 5.00% 4/20/34 | 1,010,147 | 1,015,809 | |||||
| Total Agency Collateralized Mortgage Obligations (cost $5,545,752) | 4,915,068 | ||||||
| Agency Commercial Mortgage-Backed Securities — 16.33% | |||||||
| Fannie Mae - Aces | |||||||
| Series 2016-M11 A2 2.369% 7/25/26 ● | 5,675,000 | 5,229,383 | |||||
| Series 2016-M6 A2 2.488% 5/25/26 | 1,774,278 | 1,651,398 | |||||
| Freddie Mac Multifamily Structured Pass Through Certificates | |||||||
| Series K047 A2 3.329% 5/25/25 ◆ , ● | 2,443,605 | 2,365,010 | |||||
| Series K048 A2 3.284% 6/25/25 ◆ , ● | 3,890,000 | 3,759,278 | |||||
| Series K068 X1 0.557% 8/25/27 ◆ , ● | 65,428,516 | 1,150,358 | |||||
| Series K076 A2 3.90% 4/25/28 ◆ | 4,000,000 | 3,872,531 | |||||
| Series K729 A2 3.136% 10/25/24 ◆ | 1,000,000 | 972,438 | |||||
| Series KIR3 A2 3.281% 8/25/27 ◆ | 5,460,000 | 5,151,488 | |||||
| Series KSMC A2 2.615% 1/25/23 ◆ | 5,555,000 | 5,521,514 | |||||
| Series KW02 A1 2.896% 4/25/26 ◆ | 764,875 | 744,843 | |||||
| Total Agency Commercial Mortgage-Backed Securities (cost $33,653,975) | 30,418,241 | ||||||
| Agency Mortgage-Backed Securities — 19.80% | |||||||
| Freddie Mac S.F. 30 yr | |||||||
| 2.50% 5/1/52 | 237,180 | 199,240 | |||||
| 3.00% 2/1/50 | 839,691 | 738,979 | |||||
| Freddie Mac S.F. 30 yr | |||||||
| 3.50% 6/1/47 | 1,056,366 | 965,462 | |||||
| 3.50% 7/1/49 | 1,364,201 | 1,250,560 | |||||
| 4.00% 10/1/44 | 640,820 | 609,521 | |||||
| 4.00% 8/1/52 | 473,932 | 441,003 | |||||
| 4.00% 9/1/52 | 1,042,000 | 968,319 | |||||
| 4.00% 9/1/52 | 885,000 | 823,068 | |||||
| 4.50% 9/1/52 | 935,000 | 893,930 | |||||
| 4.50% 9/1/52 | 1,468,000 | 1,409,087 | |||||
| 4.50% 9/1/52 | 1,510,000 | 1,442,565 | |||||
| 5.50% 9/1/52 | 1,692,000 | 1,701,209 | |||||
| 5.50% 9/1/52 | 371,000 | 375,290 | |||||
| 5.50% 11/1/52 | 1,892,000 | 1,882,777 | |||||
| Fannie Mae S.F. 20 yr | |||||||
| 4.00% 12/1/31 | 513,500 | 489,909 | |||||
| 4.00% 8/1/42 | 193,036 | 181,254 | |||||
| 4.00% 9/1/42 | 475,343 | 446,329 | |||||
| Fannie Mae S.F. 30 yr | |||||||
| 2.00% 3/1/52 | 1,190,335 | 966,635 | |||||
| 2.50% 11/1/51 | 941,877 | 793,357 | |||||
| 2.50% 1/1/52 | 1,385,672 | 1,166,044 | |||||
| 2.50% 2/1/52 | 1,043,896 | 879,079 | |||||
| 3.00% 8/1/49 | 1,833,750 | 1,622,330 | |||||
| 3.00% 9/1/49 | 1,412,334 | 1,249,711 | |||||
| 3.00% 10/1/49 | 621,468 | 545,865 | |||||
| 3.00% 1/1/50 | 1,669,408 | 1,471,899 | |||||
| 3.50% 5/1/49 | 958,843 | 873,738 | |||||
| 3.50% 2/1/50 | 1,448,515 | 1,328,355 | |||||
| 4.50% 2/1/48 | 946,337 | 929,063 | |||||
| 4.50% 9/1/49 | 997,698 | 968,337 | |||||
| 5.00% 6/1/52 | 1,917,025 | 1,869,966 | |||||
| 5.00% 9/1/52 | 4,065,110 | 3,964,256 | |||||
| 6.00% 4/1/39 | 96,780 | 98,507 | |||||
| Fannie Mae S.F. 30 yr TBA | |||||||
| 5.50% 10/1/52 | 3,372,000 | 3,351,452 | |||||
| Total Agency Mortgage-Backed Securities (cost $39,211,815) | 36,897,096 | ||||||
| Agency Obligations — 2.31% | |||||||
| Federal Home Loan Mortgage | |||||||
| 4.00% 2/28/25 | 980,000 | 969,097 | |||||
| 4.20% 8/28/25 | 980,000 | 969,258 | |||||
| Tennessee Valley Authority | |||||||
| 2.875% 2/1/27 * | 2,500,000 | 2,376,342 | |||||
| Total Agency Obligations (cost $4,459,082) | 4,314,697 | ||||||
| US Treasury Obligations — 58.74% | |||||||
| US Treasury Bonds | |||||||
| 1.375% 11/15/40 | 3,920,000 | 2,536,439 | |||||
| 1.375% 8/15/50 | 3,175,000 | 1,840,260 | |||||
89
Schedules of investments
Delaware Ivy Government Securities Fund
| Principal amount° | Value (US $) | ||||||
| US Treasury Obligations (continued) | |||||||
| US Treasury Bonds | |||||||
| 1.875% 2/15/41 | 4,555,000 | $ | 3,228,801 | ||||
| 1.875% 11/15/51 | 1,120,000 | 741,169 | |||||
| 2.50% 2/15/45 | 3,265,000 | 2,492,113 | |||||
| 2.875% 5/15/52 | 9,795,000 | 8,217,087 | |||||
| 3.00% 8/15/52 | 2,325,000 | 2,007,129 | |||||
| US Treasury Notes | |||||||
| 0.75% 3/31/26 | 2,850,000 | 2,531,268 | |||||
| 0.875% 1/31/24 | 2,560,000 | 2,445,900 | |||||
| 1.125% 2/15/31 | 6,580,000 | 5,330,057 | |||||
| 1.50% 9/30/24 * | 2,075,000 | 1,967,481 | |||||
| 1.625% 2/15/26 | 3,165,000 | 2,907,473 | |||||
| 1.875% 8/31/24 | 2,055,000 | 1,965,575 | |||||
| 2.125% 7/31/24 | 3,055,000 | 2,939,841 | |||||
| 2.25% 11/15/25 | 12,120,000 | 11,416,946 | |||||
| 2.50% 5/31/24 | 6,100,000 | 5,924,268 | |||||
| 2.625% 7/31/29 | 17,930,000 | 16,480,191 | |||||
| 2.75% 8/15/32 * | 1,210,000 | 1,106,583 | |||||
| 2.875% 8/15/28 | 10,005,000 | 9,389,067 | |||||
| 2.875% 5/15/32 | 8,390,000 | 7,758,783 | |||||
| 3.125% 8/31/27 * | 9,840,000 | 9,440,250 | |||||
| 3.125% 8/31/29 | 7,130,000 | 6,768,487 | |||||
| Total US Treasury Obligations (cost $118,368,075) | 109,435,168 | ||||||
| Total Value of Securities Before Securities Lending Collateral—99.82% (cost $201,238,699) | 185,980,270 | ||||||
| Number of shares | |||||||
| Securities Lending Collateral** — 5.14% | |||||||
| Money Market Mutual Fund — 5.14% | |||||||
| Dreyfus Institutional Preference Government Money Market Fund - Institutional Shares (seven-day effective yield 2.98%) | 9,577,154 | 9,577,154 | |||||
| Total Securities Lending Collateral (cost $9,577,154) | 9,577,154 | ||||||
| Total Value of Securities—104.96% (cost $210,815,853) | $ | 195,557,424■ | |||||
| ° | Principal amount shown is stated in USD unless noted that the security is denominated in another currency. |
| ● | Variable rate investment. Rates reset periodically. Rate shown reflects the rate in effect at September 30, 2022. For securities based on a published reference rate and spread, the reference rate and spread are indicated in their descriptions. The reference rate descriptions (i.e. LIBOR03M, LIBOR06M, etc.) used in this report are identical for different securities, but the underlying reference rates may differ due to the timing of the reset period. Certain variable rate securities are not based on a published reference rate and spread but are determined by the issuer or agent and are based on current market conditions, or for mortgage-backed securities, are impacted by the individual mortgages which are paying off over time. These securities do not indicate a reference rate and spread in their descriptions. |
| ◆ | Pass Through Agreement. Security represents the contractual right to receive a proportionate amount of underlying payments due to the counterparty pursuant to various agreements related to the rescheduling of obligations and the exchange of certain notes. |
| * | Fully or partially on loan. |
| ** | See Note 11 in “Notes to financial statements” for additional information on securities lending collateral. |
| ■ | Includes $12,401,276 of securities loaned for which the counterparty pledged additional non-cash collateral valued at $3,147,895. |
Summary of abbreviations:
GNMA – Government National Mortgage Association
ICE – Intercontinental Exchange, Inc.
LIBOR – London Interbank Offered Rate
LIBOR03M – ICE LIBOR USD 3 Month
LIBOR06M – ICE LIBOR USD 6 Month
S.F. – Single Family
TBA – To be announced
USD – US Dollar
yr – Year
See accompanying notes, which are an integral part of the financial statements.
90
Delaware Ivy High Yield Fund
September 30, 2022
| Principal amount° | Value (US $) | |||||||
| Convertible Bond — 0.18% | ||||||||
| Spirit Airlines 1.00% exercise price $49.07, maturity date 5/15/26 | 90,000 | $ | 77,085 | |||||
| Total Convertible Bond (cost $79,440) | 77,085 | |||||||
| Corporate Bonds — 95.24% | ||||||||
| Automotive — 1.10% | ||||||||
| Ford Motor 6.625% 10/1/28 | 227,000 | 221,110 | ||||||
| Goodyear Tire & Rubber 5.25% 7/15/31 | 315,000 | 252,386 | ||||||
| 473,496 | ||||||||
| Basic Industry — 9.01% | ||||||||
| ATI | ||||||||
| 4.875% 10/1/29 | 160,000 | 133,254 | ||||||
| 5.125% 10/1/31 | 312,000 | 255,448 | ||||||
| Cerdia Finanz 144A 10.50% 2/15/27 # | 340,000 | 280,999 | ||||||
| Chemours 144A 5.75% 11/15/28 # | 310,000 | 254,265 | ||||||
| Clearwater Paper 144A 4.75% 8/15/28 # | 288,000 | 252,785 | ||||||
| FMG Resources August 2006 | ||||||||
| 144A 5.875% 4/15/30 # | 220,000 | 191,683 | ||||||
| 144A 6.125% 4/15/32 # | 95,000 | 81,772 | ||||||
| Glatfelter 144A 4.75% 11/15/29 # | 353,000 | 203,674 | ||||||
| Hudbay Minerals 144A 6.125% 4/1/29 # | 620,000 | 500,948 | ||||||
| Minerals Technologies 144A 5.00% 7/1/28 # | 343,000 | 299,297 | ||||||
| Novelis 144A 4.75% 1/30/30 # | 420,000 | 345,463 | ||||||
| Standard Industries 144A 5.00% 2/15/27 # | 420,000 | 372,653 | ||||||
| Sylvamo 144A 7.00% 9/1/29 #, * | 560,000 | 479,147 | ||||||
| Vibrantz Technologies 144A 9.00% 2/15/30 # | 330,000 | 215,449 | ||||||
| 3,866,837 | ||||||||
| Capital Goods — 2.91% | ||||||||
| Bombardier 144A 6.00% 2/15/28 # | 91,000 | 76,273 | ||||||
| Clydesdale Acquisition Holdings 144A 6.625% 4/15/29 # | 50,000 | 45,600 | ||||||
| LABL 144A 5.875% 11/1/28 # | 395,000 | 320,651 | ||||||
| Sealed Air 144A 5.00% 4/15/29 # | 140,000 | 125,137 | ||||||
| Spirit AeroSystems 144A 7.50% 4/15/25 # | 345,000 | 325,547 | ||||||
| TransDigm 4.625% 1/15/29 | 442,000 | 356,922 | ||||||
| 1,250,130 | ||||||||
| Communications — 5.90% | ||||||||
| Altice Financing 144A 5.00% 1/15/28 # | 505,000 | 390,082 | ||||||
| Altice France 144A 5.50% 10/15/29 # | 775,000 | 585,051 | ||||||
| Connect Finco 144A 6.75% 10/1/26 # | 380,000 | 332,839 | ||||||
| Consolidated Communications 144A 6.50% 10/1/28 # | 155,000 | 116,250 | ||||||
| Frontier Communications Holdings | ||||||||
| 144A 5.875% 10/15/27 # | 335,000 | 301,001 | ||||||
| 144A 8.75% 5/15/30 # | 70,000 | 70,159 | ||||||
| Hughes Satellite Systems 6.625% 8/1/26 | 415,000 | 377,252 | ||||||
| Northwest Fiber 144A 4.75% 4/30/27 # | 165,000 | 143,924 | ||||||
| Telesat Canada | ||||||||
| 144A 4.875% 6/1/27 # | 236,000 | 111,289 | ||||||
| 144A 6.50% 10/15/27 # | 280,000 | 104,140 | ||||||
| 2,531,987 | ||||||||
| Consumer Goods — 1.24% | ||||||||
| Pilgrim’s Pride 144A 4.25% 4/15/31 # | 315,000 | 252,090 | ||||||
| Scotts Miracle-Gro 4.00% 4/1/31 | 10,000 | 7,062 | ||||||
| Simmons Foods 144A 4.625% 3/1/29 # | 331,000 | 271,340 | ||||||
| 530,492 | ||||||||
| Energy — 13.81% | ||||||||
| Apache 4.75% 4/15/43 * | 286,000 | 213,901 | ||||||
| Callon Petroleum | ||||||||
| 144A 7.50% 6/15/30 # | 125,000 | 109,681 | ||||||
| 144A 8.00% 8/1/28 # | 405,000 | 374,412 | ||||||
| CNX Resources 144A 6.00% 1/15/29 # | 420,000 | 384,205 | ||||||
| Crestwood Midstream Partners 144A 6.00% 2/1/29 # | 30,000 | 26,891 | ||||||
| Endeavor Energy Resources 144A 5.75% 1/30/28 # | 232,000 | 221,178 | ||||||
| EQM Midstream Partners 144A 4.75% 1/15/31 # | 569,000 | 452,981 | ||||||
| Genesis Energy | ||||||||
| 7.75% 2/1/28 | 275,000 | 239,577 | ||||||
| 8.00% 1/15/27 | 429,000 | 376,971 | ||||||
| Hilcorp Energy I | ||||||||
| 144A 6.00% 4/15/30 # | 350,000 | 305,817 | ||||||
| 144A 6.00% 2/1/31 # | 30,000 | 26,104 | ||||||
| 144A 6.25% 4/15/32 # | 138,000 | 122,443 | ||||||
| Murphy Oil 6.375% 7/15/28 | 558,000 | 528,116 | ||||||
| NuStar Logistics | ||||||||
| 5.75% 10/1/25 | 185,000 | 171,707 | ||||||
| 6.00% 6/1/26 | 277,000 | 254,148 | ||||||
| 6.375% 10/1/30 | 279,000 | 239,346 | ||||||
| Occidental Petroleum | ||||||||
| 4.20% 3/15/48 | 15,000 | 12,032 | ||||||
| 4.40% 4/15/46 | 63,000 | 51,913 | ||||||
91
Schedules of investments
Delaware Ivy High Yield Fund
| Principal amount° | Value (US $) | ||||||
| Corporate Bonds (continued) | |||||||
| Energy (continued) | |||||||
| Occidental Petroleum | |||||||
| 4.40% 8/15/49 | 125,000 | $ | 102,570 | ||||
| 4.50% 7/15/44 | 65,000 | 54,461 | |||||
| 6.45% 9/15/36 | 150,000 | 150,369 | |||||
| 6.60% 3/15/46 | 120,000 | 123,877 | |||||
| Southwestern Energy | |||||||
| 5.375% 2/1/29 | 458,000 | 416,281 | |||||
| 5.375% 3/15/30 | 269,000 | 242,962 | |||||
| USA Compression Partners 6.875% 4/1/26 | 346,000 | 318,865 | |||||
| Weatherford International | |||||||
| 144A 6.50% 9/15/28 # | 256,000 | 230,758 | |||||
| 144A 8.625% 4/30/30 # | 200,000 | 174,630 | |||||
| 5,926,196 | |||||||
| Financial Services — 3.50% | |||||||
| AerCap Global Aviation Trust 144A 6.50% 6/15/45 #, µ | 570,000 | 520,966 | |||||
| Air Lease 4.65% 6/15/26 µ, Ψ | 80,000 | 66,990 | |||||
| Castlelake Aviation Finance DAC 144A 5.00% 4/15/27 #, * | 230,000 | 195,906 | |||||
| Medline Borrower | |||||||
| 144A 3.875% 4/1/29 # | 323,000 | 259,480 | |||||
| 144A 5.25% 10/1/29 # | 118,000 | 89,318 | |||||
| Metis Merger Sub 144A 6.50% 5/15/29 # | 475,000 | 371,172 | |||||
| 1,503,832 | |||||||
| Healthcare — 8.30% | |||||||
| Acadia Healthcare 144A 5.50% 7/1/28 # | 310,000 | 283,278 | |||||
| Avantor Funding 144A 3.875% 11/1/29 # | 670,000 | 545,491 | |||||
| Bausch Health 144A 6.125% 2/1/27 # | 335,000 | 232,758 | |||||
| Cheplapharm Arzneimittel 144A 5.50% 1/15/28 # | 240,000 | 198,538 | |||||
| Consensus Cloud Solutions | |||||||
| 144A 6.00% 10/15/26 # | 110,000 | 97,533 | |||||
| 144A 6.50% 10/15/28 # | 175,000 | 148,882 | |||||
| DaVita 144A 4.625% 6/1/30 # | 700,000 | 543,343 | |||||
| Encompass Health | |||||||
| 4.625% 4/1/31 | 90,000 | 71,303 | |||||
| 4.75% 2/1/30 | 65,000 | 53,577 | |||||
| HCA 3.50% 9/1/30 | 270,000 | 223,532 | |||||
| ModivCare Escrow Issuer 144A 5.00% 10/1/29 # | 300,000 | 244,342 | |||||
| Organon & Co. 144A 5.125% 4/30/31 # | 450,000 | 369,373 | |||||
| Tenet Healthcare 144A 4.375% 1/15/30 # | 365,000 | 305,454 | |||||
| Tenet Healthcare 144A 6.125% 10/1/28 #, * | 280,000 | 245,757 | |||||
| 3,563,161 | |||||||
| Insurance — 1.57% | |||||||
| HUB International 144A 5.625% 12/1/29 # | 380,000 | 318,050 | |||||
| NFP | |||||||
| 144A 6.875% 8/15/28 # | 320,000 | 250,130 | |||||
| 144A 7.50% 10/1/30 # | 110,000 | 104,521 | |||||
| 672,701 | |||||||
| Leisure — 8.37% | |||||||
| Boyd Gaming 144A 4.75% 6/15/31 # | 450,000 | 365,076 | |||||
| Caesars Entertainment 144A 6.25% 7/1/25 # | 430,000 | 415,131 | |||||
| Carnival | |||||||
| 144A 5.75% 3/1/27 # | 717,000 | 503,890 | |||||
| 144A 6.00% 5/1/29 # | 121,000 | 79,652 | |||||
| 144A 7.625% 3/1/26 #, * | 153,000 | 116,512 | |||||
| Hilton Grand Vacations Borrower Escrow 144A 5.00% 6/1/29 # | 600,000 | 485,145 | |||||
| Royal Caribbean Cruises | |||||||
| 144A 5.375% 7/15/27 # | 613,000 | 451,763 | |||||
| 144A 5.50% 8/31/26 # | 30,000 | 22,988 | |||||
| 144A 5.50% 4/1/28 # | 338,000 | 237,553 | |||||
| Scientific Games Holdings 144A 6.625% 3/1/30 # | 340,000 | 273,093 | |||||
| Scientific Games International 144A 7.25% 11/15/29 # | 275,000 | 256,300 | |||||
| Travel + Leisure 6.00% 4/1/27 | 428,000 | 386,597 | |||||
| 3,593,700 | |||||||
| Media — 13.44% | |||||||
| AMC Networks 4.25% 2/15/29 * | 290,000 | 215,083 | |||||
| Arches Buyer 144A 6.125% 12/1/28 # | 315,000 | 244,427 | |||||
| Belo | |||||||
| 7.25% 9/15/27 | 217,000 | 212,585 | |||||
| 7.75% 6/1/27 | 352,000 | 347,894 | |||||
| Block Communications 144A 4.875% 3/1/28 # | 455,000 | 394,974 | |||||
| CCO Holdings | |||||||
| 144A 4.50% 8/15/30 # | 680,000 | 539,447 | |||||
| 144A 5.00% 2/1/28 # | 235,000 | 203,032 | |||||
| 144A 5.375% 6/1/29 #, * | 235,000 | 206,212 | |||||
| CMG Media 144A 8.875% 12/15/27 # | 300,000 | 229,590 | |||||
| CSC Holdings | |||||||
| 144A 4.625% 12/1/30 # | 710,000 | 484,096 | |||||
| 144A 5.375% 2/1/28 # | 175,000 | 153,074 | |||||
92
Principal | Value (US $) | ||||||
| Corporate Bonds (continued) | |||||||
| Media (continued) | |||||||
| Cumulus Media New Holdings 144A 6.75% 7/1/26 #, * | 265,000 | $ | 223,836 | ||||
| Directv Financing 144A 5.875% 8/15/27 # | 395,000 | 341,428 | |||||
| DISH DBS 144A 5.75% 12/1/28 # | 310,000 | 234,861 | |||||
| Gray Television 144A 4.75% 10/15/30 # | 465,000 | 349,177 | |||||
| LABL 144A 8.25% 11/1/29 # | 71,000 | 51,741 | |||||
| Nielsen Finance | |||||||
| 144A 5.625% 10/1/28 # | 145,000 | 144,230 | |||||
| 144A 5.875% 10/1/30 # | 503,000 | 502,044 | |||||
| Sirius XM Radio 144A 4.125% 7/1/30 # | 570,000 | 464,550 | |||||
| VZ Secured Financing 144A 5.00% 1/15/32 # | 305,000 | 228,427 | |||||
| 5,770,708 | |||||||
| Real Estate — 4.84% | |||||||
| CTR Partnership 144A 3.875% 6/30/28 # | 223,000 | 183,874 | |||||
| Cushman & Wakefield US Borrower 144A 6.75% 5/15/28 # | 370,000 | 344,015 | |||||
| HAT Holdings I | |||||||
| 144A 3.375% 6/15/26 # | 185,000 | 148,691 | |||||
| 144A 6.00% 4/15/25 # | 353,000 | 332,842 | |||||
| Kennedy-Wilson 4.75% 2/1/30 | 235,000 | 174,840 | |||||
| Ladder Capital Finance Holdings | |||||||
| 144A 4.25% 2/1/27 # | 633,000 | 510,671 | |||||
| 144A 4.75% 6/15/29 # | 85,000 | 63,775 | |||||
| MPT Operating Partnership 3.50% 3/15/31 | 455,000 | 317,752 | |||||
| 2,076,460 | |||||||
| Retail — 4.28% | |||||||
| Asbury Automotive Group | |||||||
| 144A 4.625% 11/15/29 # | 245,000 | 196,464 | |||||
| 4.75% 3/1/30 | 215,000 | 168,256 | |||||
| Gap | |||||||
| 144A 3.625% 10/1/29 # | 220,000 | 143,349 | |||||
| 144A 3.875% 10/1/31 # | 110,000 | 70,176 | |||||
| GrubHub Holdings 144A 5.50% 7/1/27 # | 300,000 | 207,619 | |||||
| LSF9 Atlantis Holdings 144A 7.75% 2/15/26 # | �� | 374,000 | 334,268 | ||||
| Murphy Oil USA | |||||||
| 144A 3.75% 2/15/31 # | 75,000 | 60,430 | |||||
| 4.75% 9/15/29 | 400,000 | 354,860 | |||||
| PetSmart 144A 7.75% 2/15/29 # | 335,000 | 300,006 | |||||
| 1,835,428 | |||||||
| Services — 5.65% | |||||||
| Ahern Rentals 144A 7.375% 5/15/23 # | 145,000 | 98,404 | |||||
| APX Group 144A 5.75% 7/15/29 #, * | 475,000 | 376,552 | |||||
| Clarivate Science Holdings | |||||||
| 144A 3.875% 7/1/28 # | 95,000 | 78,570 | |||||
| 144A 4.875% 7/1/29 # | 279,000 | 218,906 | |||||
| Korn Ferry 144A 4.625% 12/15/27 # | 310,000 | 274,443 | |||||
| NESCO Holdings II 144A 5.50% 4/15/29 # | 300,000 | 250,431 | |||||
| Prime Security Services Borrower | |||||||
| 144A 3.375% 8/31/27 # | 270,000 | 227,418 | |||||
| 144A 5.75% 4/15/26 # | 185,000 | 174,334 | |||||
| Sotheby’s 144A 5.875% 6/1/29 # | 195,000 | 161,455 | |||||
| TriNet Group 144A 3.50% 3/1/29 # | 465,000 | 379,719 | |||||
| White Cap Buyer 144A 6.875% 10/15/28 # | 223,000 | 182,406 | |||||
| White Cap Parent 144A PIK 8.25% 3/15/26 #, « | 2,000 | 1,698 | |||||
| 2,424,336 | |||||||
| Technology & Electronics — 5.34% | |||||||
| AthenaHealth Group 144A 6.50% 2/15/30 # | 305,000 | 241,697 | |||||
| Bread Financial Holdings 144A 4.75% 12/15/24 # | 445,000 | 389,093 | |||||
| Entegris Escrow | |||||||
| 144A 4.75% 4/15/29 # | 11,000 | 9,714 | |||||
| 144A 5.95% 6/15/30 # | 365,000 | 333,953 | |||||
| ION Trading Technologies 144A 5.75% 5/15/28 # | 575,000 | 469,672 | |||||
| NCR 144A 5.125% 4/15/29 # | 454,000 | 341,426 | |||||
| Sensata Technologies 144A 4.00% 4/15/29 # | 160,000 | 132,751 | |||||
| TTM Technologies 144A 4.00% 3/1/29 # | 463,000 | 373,826 | |||||
| 2,292,132 | |||||||
| Transportation — 3.29% | |||||||
| American Airlines 144A 5.75% 4/20/29 # | 45,000 | 39,342 | |||||
| Grupo Aeromexico 144A 8.50% 3/17/27 # | 255,000 | 224,362 | |||||
| Laredo Petroleum 144A 7.75% 7/31/29 #, * | 280,000 | 258,542 | |||||
| Seaspan 144A 5.50% 8/1/29 # | 475,000 | 366,919 | |||||
| VistaJet Malta Finance 144A 6.375% 2/1/30 #, * | 636,000 | 521,504 | |||||
| 1,410,669 | |||||||
93
Schedules of investments
Delaware Ivy High Yield Fund
| Principal amount° | Value (US $) | ||||||
| Corporate Bonds (continued) | |||||||
| Utilities — 2.69% | |||||||
| Calpine | |||||||
| 144A 3.75% 3/1/31 # | 307,000 | $ | 240,725 | ||||
| 144A 4.625% 2/1/29 # | 50,000 | 40,840 | |||||
| 144A 5.125% 3/15/28 #, * | 275,000 | 236,759 | |||||
| Vistra | |||||||
| 144A 7.00% 12/15/26 #, µ, Ψ | 455,000 | 398,241 | |||||
| 144A 8.00% 10/15/26 #, µ, Ψ | 260,000 | 239,497 | |||||
| 1,156,062 | |||||||
| Total Corporate Bonds (cost $48,153,495) | 40,878,327 | ||||||
| Municipal Bonds — 0.72% | |||||||
| Commonwealth of Puerto Rico (Restructured) | |||||||
| Series A-1 2.986% 7/1/24 ^ | 6,469 | 5,949 | |||||
| Series A-1 4.00% 7/1/33 | 19,441 | 17,140 | |||||
| Series A-1 4.00% 7/1/35 | 14,120 | 12,105 | |||||
| Series A-1 4.00% 7/1/37 | 14,998 | 12,346 | |||||
| Series A-1 4.364% 7/1/33 ^ | 25,019 | 13,833 | |||||
| Series A-1 5.625% 7/1/29 | 16,350 | 16,751 | |||||
| GDB Debt Recovery Authority of Puerto Rico 7.50% 8/20/40 | 259,521 | 228,378 | |||||
| Total Municipal Bonds (cost $335,764) | 306,502 | ||||||
| Number of shares | |||||||
| Short-Term Investments — 2.66% | |||||||
| Money Market Mutual Funds — 2.66% | |||||||
| BlackRock Liquidity FedFund – Institutional Shares (seven-day effective yield 2.76%) | 285,666 | 285,666 | |||||
| Fidelity Investments Money Market Government Portfolio – Class I (seven-day effective yield 2.74%) | 285,666 | 285,666 | |||||
| Goldman Sachs Financial Square Government Fund – Institutional Shares (seven-day effective yield 2.98%) | 285,666 | 285,666 | |||||
| Morgan Stanley Institutional Liquidity Funds Government Portfolio – Institutional Class (seven-day effective yield 2.80%) | 285,667 | 285,667 | |||||
| Total Short-Term Investments (cost $1,142,665) | 1,142,665 | ||||||
| Total Value of Securities Before Securities Lending Collateral—98.80% (cost $49,711,364) | 42,404,579 | ||||||
| Securities Lending Collateral** — 2.19% | |||||||
| Money Market Mutual Fund — 2.19% | |||||||
| Dreyfus Institutional Preference Government Money Market Fund - Institutional Shares (seven-day effective yield 2.98%) | 939,990 | 939,990 | |||||
| Total Securities Lending Collateral (cost $939,990) | 939,990 | ||||||
| Total Value of Securities—100.99% (cost $50,651,354) | $ | 43,344,569■ | |||||
| ° | Principal amount shown is stated in USD unless noted that the security is denominated in another currency. |
| # | Security exempt from registration under Rule 144A of the Securities Act of 1933, as amended. At September 30, 2022, the aggregate value of Rule 144A securities was $33,184,528, which represents 77.32% of the Fund’s net assets. See Note 12 in “Notes to financial statements.” |
| * | Fully or partially on loan. |
| µ | Fixed to variable rate investment. The rate shown reflects the fixed rate in effect at September 30, 2022. Rate will reset at a future date. |
| Ψ | Perpetual security. Maturity date represents next call date. |
| « | PIK. The first payment of cash and/or principal will be made after September 30, 2022. |
| ^ | Zero-coupon security. The rate shown is the effective yield at the time of purchase. |
| ** | See Note 11 in “Notes to financial statements” for additional information on securities lending collateral. |
| ■ | Includes $2,965,614 of securities loaned for which the counterparty pledged additional non-cash collateral valued at $2,136,433. |
94
Summary of abbreviations:
DAC – Designated Activity Company
PIK – Payment-in-kind
USD – US Dollar
See accompanying notes, which are an integral part of the financial statements.
95
Schedules of investments
Delaware Ivy International Small Cap Fund
September 30, 2022
| Number of shares | Value (US $) | ||||||
| Common Stocks – 96.51%∆ | |||||||
| Argentina – 0.97% | |||||||
| Arcos Dorados Holdings Class A | 48,995 | $ | 357,174 | ||||
| 357,174 | |||||||
| Australia – 2.62% | |||||||
| HUB24 * | 27,942 | 373,179 | |||||
| IPH | 27,375 | 166,571 | |||||
| Pro Medicus * | 13,495 | 430,921 | |||||
| 970,671 | |||||||
| Austria – 0.52% | |||||||
| Vienna Insurance Group AG Wiener Versicherung Gruppe | 9,524 | 193,854 | |||||
| 193,854 | |||||||
| Brazil – 4.31% | |||||||
| Arezzo Industria e Comercio | 11,453 | 209,703 | |||||
| Cielo | 236,811 | 237,059 | |||||
| Iguatemi | 46,936 | 177,413 | |||||
| Inter & Co. BDR | 32,414 | 106,357 | |||||
| JHSF Participacoes | 228,257 | 311,855 | |||||
| Petro Rio † | 72,078 | 368,250 | |||||
| SLC Agricola | 22,966 | 184,048 | |||||
| 1,594,685 | |||||||
| Canada – 11.96% | |||||||
| Aritzia † | 14,153 | 465,056 | |||||
| ATS Automation Tooling Systems † | 41,975 | 1,107,908 | |||||
| Capital Power * | 25,206 | 855,801 | |||||
| Enerplus | 21,142 | 299,372 | |||||
| Granite Real Estate Investment Trust * | 5,882 | 283,891 | |||||
| Jamieson Wellness | 15,469 | 375,261 | |||||
| Major Drilling Group International † | 52,237 | 314,250 | |||||
| SunOpta † | 43,684 | 398,148 | |||||
| Vermilion Energy | 15,136 | 324,010 | |||||
| 4,423,697 | |||||||
| China – 1.85% | |||||||
| Chindata Group Holdings ADR † | 34,428 | 278,178 | |||||
| CIMC Enric Holdings | 122,000 | 129,566 | |||||
| Xtep International Holdings * | 262,000 | 275,768 | |||||
| 683,512 | |||||||
| Denmark – 2.99% | |||||||
| Drilling Co of 1972 A/S † | 8,377 | 408,112 | |||||
| Jyske Bank † | 13,437 | 699,294 | |||||
| 1,107,406 | |||||||
| Finland – 0.70% | |||||||
| Valmet | 12,789 | 258,545 | |||||
| 258,545 | |||||||
| France – 2.55% | |||||||
| IPSOS | 9,217 | 411,900 | |||||
| Rothschild & Co. | 7,842 | 256,339 | |||||
| SOITEC † | 2,404 | 274,498 | |||||
| 942,737 | |||||||
| Germany – 2.70% | |||||||
| Befesa | 2,546 | 77,264 | |||||
| HUGO BOSS | 8,212 | 382,358 | |||||
| K+S | 20,300 | 384,421 | |||||
| Salzgitter * | 5,958 | 112,824 | |||||
| Steico | 946 | 40,298 | |||||
| 997,165 | |||||||
| Hong Kong – 0.63% | |||||||
| MGM China Holdings *, † | 422,800 | 232,383 | |||||
| 232,383 | |||||||
| India – 5.64% | |||||||
| Affle India † | 13,599 | 208,079 | |||||
| Federal Bank | 312,885 | 452,744 | |||||
| Varun Beverages | 88,408 | 1,130,004 | |||||
| Voltas | 26,749 | 296,483 | |||||
| 2,087,310 | |||||||
| Ireland – 0.93% | |||||||
| Glenveagh Properties † | 394,272 | 343,070 | |||||
| 343,070 | |||||||
| Israel – 1.03% | |||||||
| Inmode † | 13,148 | 382,738 | |||||
| 382,738 | |||||||
| Italy – 2.19% | |||||||
| Azimut Holding | 16,463 | 234,817 | |||||
| Reply | 3,782 | 393,929 | |||||
| Tinexta | 9,821 | 181,759 | |||||
| 810,505 | |||||||
| Japan – 26.65% | |||||||
| Amvis Holdings | 36,600 | 615,726 | |||||
| Asics | 45,500 | 724,635 | |||||
| BayCurrent Consulting | 1,600 | 415,094 | |||||
| dip | 16,700 | 424,232 | |||||
| DMG Mori | 41,200 | 470,549 | |||||
| Fujimi * | 14,500 | 605,276 | |||||
| Fukuoka Financial Group * | 43,000 | 765,795 | |||||
| IHI | 27,700 | 592,456 | |||||
| Insource | 23,500 | 425,737 | |||||
| JCR Pharmaceuticals * | 12,000 | 178,980 | |||||
| JMDC | 10,400 | 340,533 | |||||
| Katitas * | 15,800 | 351,775 | |||||
| Kissei Pharmaceutical | 10,900 | 193,633 | |||||
| Mebuki Financial Group | 373,000 | 728,605 | |||||
| Mitsui High-Tec * | 6,200 | 291,784 | |||||
| SHO-BOND Holdings | 13,300 | 574,670 | |||||
96
| Number of shares | Value (US $) | ||||||
| Common Stocks∆ (continued) | |||||||
| Japan (continued) | |||||||
| SMS | 21,500 | $ | 434,354 | ||||
| TechnoPro Holdings | 35,000 | 745,552 | |||||
| Toho Titanium * | 32,500 | 531,483 | |||||
| Tokyo Seimitsu | 15,300 | 450,084 | |||||
| 9,860,953 | |||||||
| Malaysia – 0.20% | |||||||
| Alliance Bank Malaysia | 99,200 | 75,361 | |||||
| 75,361 | |||||||
| Mexico – 3.42% | |||||||
| Banco del Bajio | 128,609 | 325,617 | |||||
| Corp Inmobiliaria Vesta SAB de CV | 177,153 | 330,565 | |||||
| Grupo Aeroportuario del Centro Norte | 97,101 | 610,826 | |||||
| 1,267,008 | |||||||
| Norway – 4.07% | |||||||
| Aker Solutions | 204,735 | 711,818 | |||||
| Golar LNG † | 11,901 | 296,573 | |||||
| TOMRA Systems | 28,128 | 496,275 | |||||
| 1,504,666 | |||||||
| Republic of Korea – 2.19% | |||||||
| CJ CheilJedang | 974 | 277,879 | |||||
| Hite Jinro | 10,843 | 199,637 | |||||
| LEENO Industrial | 2,156 | 185,481 | |||||
| Samyang Foods | 1,996 | 147,031 | |||||
| 810,028 | |||||||
| Singapore – 0.90% | |||||||
| SATS † | 159,200 | 332,640 | |||||
| 332,640 | |||||||
| South Africa – 2.73% | |||||||
| Clicks Group | 20,032 | 315,930 | |||||
| Motus Holdings | 55,122 | 349,522 | |||||
| Transaction Capital | 170,375 | 346,022 | |||||
| 1,011,474 | |||||||
| Spain – 1.83% | |||||||
| Banco de Sabadell | 528,621 | 352,518 | |||||
| Melia Hotels International † | 70,210 | 324,229 | |||||
| 676,747 | |||||||
| Sweden – 1.70% | |||||||
| Catena | 10,168 | 301,702 | |||||
| Fortnox | 85,600 | 328,987 | |||||
| 630,689 | |||||||
| Taiwan – 1.81% | |||||||
| Lotes | 18,000 | 431,183 | |||||
| Wafer Works | 195,000 | 239,416 | |||||
| 670,599 | |||||||
| Thailand – 0.65% | |||||||
| Land & Houses | 1,015,900 | 239,701 | |||||
| 239,701 | |||||||
| United Kingdom – 8.77% | |||||||
| Beazley | 63,195 | 393,933 | |||||
| Dechra Pharmaceuticals | 5,101 | 148,138 | |||||
| Future | 12,332 | 178,283 | |||||
| Grafton Group | 13,130 | 97,467 | |||||
| Inchcape | 56,841 | 430,401 | |||||
| Keywords Studios | 24,042 | 613,305 | |||||
| Pagegroup | 53,844 | 221,253 | |||||
| RS GROUP | 96,225 | 1,027,191 | |||||
| Savills | 15,416 | 135,323 | |||||
| 3,245,294 | |||||||
| Total Common Stocks (cost $42,667,022) | 35,710,612 | ||||||
| Short-Term Investments – 3.29% | |||||||
| Money Market Mutual Funds – 3.29% | |||||||
| BlackRock Liquidity FedFund – Institutional Shares (seven-day effective yield 2.76%) | 304,593 | 304,593 | |||||
| Fidelity Investments Money Market Government Portfolio – Class I (seven-day effective yield 2.74%) | 304,593 | 304,593 | |||||
| Goldman Sachs Financial Square Government Fund – Institutional Shares (seven-day effective yield 2.98%) | 304,594 | 304,594 | |||||
| Morgan Stanley Institutional Liquidity Funds Government Portfolio – Institutional Class (seven-day effective yield 2.80%) | 304,593 | 304,593 | |||||
| Total Short-Term Investments (cost $1,218,373) | 1,218,373 | ||||||
| Total Value of Securities Before Securities Lending Collateral-99.80% (cost $43,885,395) | 36,928,985 | ||||||
97
Schedules of investments
Delaware Ivy International Small Cap Fund
| Number of shares | Value (US $) | ||||||
| Securities Lending Collateral** – 5.34% | |||||||
| Money Market Mutual Fund – 5.34% | |||||||
| Dreyfus Institutional Preference Government Money Market Fund - Institutional Shares (seven-day effective yield 2.98%) | 1,975,383 | $ | 1,975,383 | ||||
| Total Securities Lending Collateral (cost $1,975,383) | 1,975,383 | ||||||
| Total Value of Securities–105.14% (cost $45,860,778) | $ | 38,904,368■ | |||||
| ∆ | Securities have been classified by country of risk. |
| * | Fully or partially on loan. |
| † | Non-income producing security. |
| ** | See Note 11 in “Notes to financial statements” for additional information on securities lending collateral. |
| ■ | Includes $3,581,957 of securities loaned for which the counterparty pledged additional non-cash collateral valued at $1,809,073. |
The following foreign currency exchange contracts were outstanding at September 30, 2022:1
Foreign Currency Exchange Contracts
| Counterparty | Currency to Receive (Deliver) | In Exchange For | Settlement Date | Unrealized Appreciation | Unrealized Depreciation | |||||||||||||||
| BNYM | AUD | 259,391 | USD | (168,417 | ) | 10/4/22 | $ | — | $ | (1,636 | ) | |||||||||
| BNYM | AUD | (1,544 | ) | USD | 1,002 | 10/4/22 | 10 | — | ||||||||||||
| BNYM | CAD | 253,876 | USD | (185,792 | ) | 10/3/22 | — | (2,005 | ) | |||||||||||
| BNYM | CAD | 183,375 | USD | (133,881 | ) | 10/4/22 | — | (425 | ) | |||||||||||
| BNYM | EUR | (133,257 | ) | USD | 129,817 | 10/4/22 | — | (764 | ) | |||||||||||
| BNYM | GBP | (344,488 | ) | USD | 380,188 | 10/4/22 | — | (4,397 | ) | |||||||||||
| BNYM | JPY | (1,469,520 | ) | USD | 10,151 | 10/3/22 | — | (4 | ) | |||||||||||
| BNYM | JPY | 11,338,297 | USD | (78,515 | ) | 10/4/22 | — | (154 | ) | |||||||||||
| BNYM | KRW | 14,217,128 | USD | (9,963 | ) | 10/4/22 | — | (51 | ) | |||||||||||
| BNYM | TWD | (120,133 | ) | USD | 3,775 | 10/3/22 | — | (4 | ) | |||||||||||
| BNYM | ZAR | 880,764 | USD | (49,388 | ) | 10/3/22 | — | (742 | ) | |||||||||||
| Total Foreign Currency Exchange Contracts | $ | 10 | $ | (10,182 | ) | |||||||||||||||
The use of foreign currency exchange contracts involves elements of market risk and risks in excess of the amounts disclosed in the financial statements. The foreign currency exchange contracts presented above represent the Fund’s total exposure in such contracts, whereas only the net unrealized appreciation (depreciation) is reflected in the Fund’s net assets.
1See Note 9 in “Notes to financial statements.”
Summary of abbreviations:
ADR – American Depositary Receipt
AG – Aktiengesellschaft
BDR – Brazilian Depositary Receipt
BNYM – Bank of New York Mellon
Summary of currencies:
CAD – Canadian Dollar
EUR – European Monetary Unit
GBP – British Pound Sterling
JPY – Japanese Yen
KRW – South Korean Won
TWD – New Taiwan Dollar
USD – US Dollar
ZAR – South African Rand
See accompanying notes, which are an integral part of the financial statements.
98
Delaware Ivy Multi-Asset Income Fund
September 30, 2022
| Principal amount° | Value (US $) | ||||||
| Agency Mortgage-Backed Securities — 3.58% | |||||||
| Fannie Mae S.F. 15 yr 2.50% 8/1/35 | 371,440 | $ | 337,456 | ||||
| Fannie Mae S.F. 20 yr 4.00% 9/1/42 | 65,360 | 61,370 | |||||
| Fannie Mae S.F. 30 yr | |||||||
| 2.00% 5/1/51 | 372,241 | 302,919 | |||||
| 3.00% 1/1/50 | 576,976 | 506,613 | |||||
| 3.50% 8/1/49 | 316,422 | 287,881 | |||||
| 3.50% 6/1/51 | 618,621 | 559,384 | |||||
| 4.50% 1/1/50 | 301,121 | 295,035 | |||||
| 5.00% 6/1/52 | 139,632 | 136,204 | |||||
| 5.00% 9/1/52 | 160,989 | 156,995 | |||||
| 5.50% 8/1/52 | 143,766 | 143,485 | |||||
| 5.50% 10/1/52 | 97,000 | 96,631 | |||||
| Freddie Mac S.F. 20 yr 3.00% 5/1/40 | 542,373 | 483,500 | |||||
| Freddie Mac S.F. 30 yr | |||||||
| 2.00% 1/1/52 | 406,511 | 330,150 | |||||
| 2.50% 7/1/50 | 1,242,923 | 1,050,325 | |||||
| 4.00% 8/1/52 | 174,138 | 162,039 | |||||
| 5.00% 7/1/52 | 734,134 | 716,938 | |||||
| 5.50% 9/1/52 | 31,000 | 31,358 | |||||
| 5.50% 10/1/52 | 86,000 | 85,753 | |||||
| Total Agency Mortgage-Backed Securities (cost $6,481,153) | 5,744,036 | ||||||
| Corporate Bonds — 31.54% | |||||||
| Banking — 1.91% | |||||||
| Ally Financial 8.00% 11/1/31 | 705,000 | 740,168 | |||||
| Bank of America | |||||||
| 2.551% 2/4/28 µ | 320,000 | 278,712 | |||||
| 2.972% 2/4/33 µ | 20,000 | 15,660 | |||||
| 4.375% 1/27/27 µ, Ψ | 15,000 | 12,075 | |||||
| 4.948% 7/22/28 µ | 90,000 | 86,568 | |||||
| 6.125% 4/27/27 *, µ, Ψ | 40,000 | 37,900 | |||||
| Citigroup | |||||||
| 3.07% 2/24/28 µ | 150,000 | 133,861 | |||||
| 5.61% 9/29/26 µ | 115,000 | 114,446 | |||||
| Fifth Third Bancorp 4.337% 4/25/33 µ | 50,000 | 44,393 | |||||
| Goldman Sachs Group | |||||||
| 1.542% 9/10/27 µ | 180,000 | 152,254 | |||||
| 3.102% 2/24/33 µ | 10,000 | 7,955 | |||||
| 3.615% 3/15/28 µ | 70,000 | 63,775 | |||||
| Huntington National Bank 4.552% 5/17/28 µ | 250,000 | 240,941 | |||||
| JPMorgan Chase & Co. | |||||||
| 1.953% 2/4/32 µ | 285,000 | 211,219 | |||||
| 4.586% 4/26/33 µ | 40,000 | 36,051 | |||||
| 4.851% 7/25/28 µ | 115,000 | 110,540 | |||||
| KeyCorp 4.789% 6/1/33 µ | 65,000 | 59,691 | |||||
| Morgan Stanley 2.475% 1/21/28 µ | 20,000 | 17,502 | |||||
| PNC Financial Services Group 6.00% 5/15/27 *, µ, Ψ | 55,000 | 51,150 | |||||
| State Street 2.203% 2/7/28 µ | 75,000 | 65,838 | |||||
| SVB Financial Group 4.57% 4/29/33 *, µ | 100,000 | 87,790 | |||||
| Toronto-Dominion Bank 4.108% 6/8/27 * | 180,000 | 169,940 | |||||
| Truist Financial 4.916% 7/28/33 µ | 80,000 | 72,408 | |||||
| US Bancorp | |||||||
| 2.215% 1/27/28 *, µ | 20,000 | 17,644 | |||||
| 2.677% 1/27/33 *, µ | 95,000 | 76,478 | |||||
| Wells Fargo & Co. | |||||||
| 4.611% 4/25/53 µ | 85,000 | 69,185 | |||||
| 4.808% 7/25/28 µ | 85,000 | 81,155 | |||||
| 3,055,299 | |||||||
| Basic Industry — 0.92% | |||||||
| Celanese US Holdings 6.05% 3/15/25 | 55,000 | 53,779 | |||||
| Chemours 144A 5.75% 11/15/28 # | 455,000 | 373,195 | |||||
| First Quantum Minerals 144A 6.875% 10/15/27 # | 200,000 | 180,446 | |||||
| FMG Resources August 2006 144A 5.875% 4/15/30 # | 400,000 | 348,514 | |||||
| Newmont 2.60% 7/15/32 * | 15,000 | 11,456 | |||||
| Novelis 144A 4.75% 1/30/30 # | 620,000 | 509,969 | |||||
| 1,477,359 | |||||||
| Brokerage — 0.98% | |||||||
| Compass Group Diversified Holdings 144A 5.25% 4/15/29 # | 360,000 | 283,001 | |||||
| LPL Holdings 144A 4.00% 3/15/29 # | 86,000 | 73,944 | |||||
| NFP | |||||||
| 144A 6.875% 8/15/28 # | 709,000 | 554,193 | |||||
| 144A 7.50% 10/1/30 # | 155,000 | 147,280 | |||||
| StoneX Group 144A 8.625% 6/15/25 # | 499,000 | 505,036 | |||||
| 1,563,454 | |||||||
99
Schedules of investments
Delaware Ivy Multi-Asset Income Fund
| Principal amount° | Value (US $) | ||||||
| Corporate Bonds (continued) | |||||||
| Capital Goods — 2.33% | |||||||
| Ahern Rentals 144A 7.375% 5/15/23 # | 475,000 | $ | 322,358 | ||||
| ARD Finance 144A PIK 6.50% 6/30/27 #, > | 320,000 | 219,753 | |||||
| Canpack 144A 3.875% 11/15/29 # | 154,000 | 120,628 | |||||
| CP Atlas Buyer 144A 7.00% 12/1/28 # | 395,000 | 294,753 | |||||
| Eaton 4.15% 3/15/33 | 120,000 | 108,592 | |||||
| GFL Environmental 144A 5.125% 12/15/26 # | 78,000 | 72,735 | |||||
| Lockheed Martin | |||||||
| 3.90% 6/15/32 | 75,000 | 69,628 | |||||
| 4.15% 6/15/53 | 65,000 | 54,562 | |||||
| Madison IAQ 144A 4.125% 6/30/28 # | 38,000 | 30,578 | |||||
| NESCO Holdings II 144A 5.50% 4/15/29 # | 519,000 | 433,246 | |||||
| Parker-Hannifin 4.25% 9/15/27 | 210,000 | 200,351 | |||||
| Sealed Air 144A 5.00% 4/15/29 # | 220,000 | 196,644 | |||||
| Standard Industries | |||||||
| 144A 4.375% 7/15/30 # | 40,000 | 30,696 | |||||
| 144A 4.75% 1/15/28 # | 38,000 | 32,196 | |||||
| TransDigm | |||||||
| 4.625% 1/15/29 | 177,000 | 142,930 | |||||
| 5.50% 11/15/27 | 551,000 | 480,453 | |||||
| Wesco Aircraft Holdings | |||||||
| 144A 8.50% 11/15/24 # | 748,000 | 392,700 | |||||
| 144A 9.00% 11/15/26 #, * | 820,000 | 494,706 | |||||
| 144A 13.125% 11/15/27 # | 128,000 | 38,720 | |||||
| 3,736,229 | |||||||
| Communications — 6.21% | |||||||
| Advantage Sales & Marketing 144A 6.50% 11/15/28 # | 806,000 | 639,960 | |||||
| Altice Financing 144A 5.75% 8/15/29 # | 600,000 | 460,566 | |||||
| Altice France 144A 5.125% 7/15/29 # | 254,000 | 190,366 | |||||
| AMC Networks 4.25% 2/15/29 * | 415,000 | 307,791 | |||||
| AT&T 3.50% 9/15/53 | 540,000 | 360,703 | |||||
| CCO Holdings | |||||||
| 144A 4.25% 2/1/31 # | 43,000 | 33,056 | |||||
| 144A 4.50% 8/15/30 # | 696,000 | 552,140 | |||||
| 144A 5.375% 6/1/29 #, * | 890,000 | 780,975 | |||||
| Charter Communications Operating 3.85% 4/1/61 | 10,000 | 5,864 | |||||
| Consolidated Communications | |||||||
| 144A 5.00% 10/1/28 # | 122,000 | 85,078 | |||||
| 144A 6.50% 10/1/28 # | 620,000 | 465,000 | |||||
| CSC Holdings | |||||||
| 144A 5.00% 11/15/31 # | 254,000 | 168,251 | |||||
| 144A 5.375% 2/1/28 # | 285,000 | 249,292 | |||||
| 144A 5.75% 1/15/30 # | 202,000 | 143,945 | |||||
| Cumulus Media New Holdings 144A 6.75% 7/1/26 # | 420,000 | 354,759 | |||||
| Digicel Group Holdings 144A PIK | |||||||
| 7.00% 10/21/22 #, Ψ, >> | 98,676 | 17,268 | |||||
| 144A PIK 8.00% 4/1/25 #, >>> | 203,982 | 80,779 | |||||
| Digicel International Finance | |||||||
| 144A 8.00% 12/31/26 # | 181,919 | 111,552 | |||||
| 144A 8.75% 5/25/24 # | 411,000 | 376,858 | |||||
| Directv Financing 144A 5.875% 8/15/27 # | 338,000 | 292,159 | |||||
| Frontier Communications Holdings | |||||||
| 144A 5.00% 5/1/28 # | 186,000 | 159,936 | |||||
| 144A 5.875% 10/15/27 # | 359,000 | 322,565 | |||||
| 5.875% 11/1/29 | 310,847 | 247,441 | |||||
| 144A 6.00% 1/15/30 # | 200,000 | 157,540 | |||||
| 144A 6.75% 5/1/29 #, * | 174,000 | 143,949 | |||||
| LCPR Senior Secured Financing DAC 144A 5.125% 7/15/29 # | 200,000 | 150,890 | |||||
| Ligado Networks 144A PIK 15.50% 11/1/23 #, >> | 953,508 | 443,381 | |||||
| Matterhorn Telecom 3.125% 9/15/26 | EUR | 69,000 | 59,255 | ||||
| Northwest Fiber | |||||||
| 144A 6.00% 2/15/28 # | 187,000 | 145,318 | |||||
| 144A 10.75% 6/1/28 # | 168,000 | 156,688 | |||||
| Sirius XM Radio 144A 4.125% 7/1/30 # | 815,000 | 664,225 | |||||
| Stagwell Global 144A 5.625% 8/15/29 # | 444,000 | 366,023 | |||||
| Telesat Canada | |||||||
| 144A 5.625% 12/6/26 # | 678,000 | 325,338 | |||||
| 144A 6.50% 10/15/27 # | 118,000 | 43,888 | |||||
| T-Mobile USA 3.50% 4/15/31 | 64,000 | 53,883 | |||||
| Uniti Group 144A 4.75% 4/15/28 # | 43,000 | 34,070 | |||||
100
| Principal amount° | Value (US $) | ||||||
| Corporate Bonds (continued) | |||||||
| Communications (continued) | |||||||
| Verizon Communications 3.875% 3/1/52 | 75,000 | $ | 56,000 | ||||
| VTR Comunicaciones 144A 4.375% 4/15/29 # | 346,000 | 215,273 | |||||
| Warnermedia Holdings | |||||||
| 144A 3.755% 3/15/27 # | 235,000 | 210,548 | |||||
| 144A 4.054% 3/15/29 # | 20,000 | 17,298 | |||||
| 144A 4.279% 3/15/32 #, * | 20,000 | 16,479 | |||||
| 144A 5.141% 3/15/52 # | 90,000 | 65,586 | |||||
| Windstream Escrow 144A 7.75% 8/15/28 # | 268,000 | 222,453 | |||||
| 9,954,389 | |||||||
| Consumer Cyclical — 4.38% | |||||||
| Allison Transmission 144A 5.875% 6/1/29 # | 440,000 | 398,886 | |||||
| Amazon.com | |||||||
| 2.50% 6/3/50 | 105,000 | 65,879 | |||||
| 3.60% 4/13/32 | 85,000 | 77,373 | |||||
| Aptiv 3.25% 3/1/32 | 175,000 | 139,546 | |||||
| Arches Buyer | |||||||
| 144A 4.25% 6/1/28 # | 543,000 | 424,727 | |||||
| 144A 6.125% 12/1/28 # | 409,000 | 317,368 | |||||
| Asbury Automotive Group | |||||||
| 4.50% 3/1/28 | 344,830 | 292,173 | |||||
| 144A 4.625% 11/15/29 # | 8,000 | 6,415 | |||||
| 4.75% 3/1/30 | 345,830 | 270,642 | |||||
| 144A 5.00% 2/15/32 # | 8,000 | 6,174 | |||||
| AutoNation 3.85% 3/1/32 | 45,000 | 35,621 | |||||
| Boyd Gaming | |||||||
| 4.75% 12/1/27 | 680,000 | 603,160 | |||||
| 144A 4.75% 6/15/31 # | 15,000 | 12,169 | |||||
| Carnival | |||||||
| 144A 5.75% 3/1/27 # | 266,000 | 186,938 | |||||
| 144A 7.625% 3/1/26 #, * | 476,000 | 362,481 | |||||
| 144A 9.875% 8/1/27 # | 190,000 | 186,550 | |||||
| 144A 10.50% 2/1/26 # | 44,000 | 43,602 | |||||
| Cars.com 144A 6.375% 11/1/28 # | 270,000 | 230,685 | |||||
| General Motors | |||||||
| 5.40% 10/15/29 | 180,000 | 166,201 | |||||
| 5.60% 10/15/32 | 30,000 | 26,818 | |||||
| Lithia Motors | |||||||
| 144A 3.875% 6/1/29 # | 199,000 | 160,029 | |||||
| 144A 4.375% 1/15/31 # | 149,000 | 122,206 | |||||
| 144A 4.625% 12/15/27 # | 15,000 | 13,052 | |||||
| LSF9 Atlantis Holdings 144A 7.75% 2/15/26 # | 526,000 | 470,120 | |||||
| Michaels | |||||||
| 144A 5.25% 5/1/28 #, * | 298,000 | 209,826 | |||||
| 144A 7.875% 5/1/29 # | 722,000 | 417,933 | |||||
| PetSmart 144A 7.75% 2/15/29 # | 650,000 | 582,101 | |||||
| Royal Caribbean Cruises 144A 5.50% 4/1/28 # | 339,000 | 238,256 | |||||
| Staples | |||||||
| 144A 7.50% 4/15/26 # | 59,000 | 49,622 | |||||
| 144A 10.75% 4/15/27 # | 1,117,000 | 829,423 | |||||
| VICI Properties 4.95% 2/15/30 * | 75,000 | 67,938 | |||||
| 7,013,914 | |||||||
| Consumer Non-Cyclical — 3.04% | |||||||
| American Greetings 144A 8.75% 4/15/25 # | 119,000 | 114,470 | |||||
| Bristol-Myers Squibb 3.70% 3/15/52 | 245,000 | 188,428 | |||||
| CSL Finance | |||||||
| 144A 4.05% 4/27/29 # | 40,000 | 36,892 | |||||
| 144A 4.75% 4/27/52 # | 50,000 | 43,195 | |||||
| CVS Health 2.70% 8/21/40 | 170,000 | 111,989 | |||||
| Encompass Health 4.625% 4/1/31 | 151,000 | 119,630 | |||||
| Endo Luxembourg Finance I 144A 6.125% 4/1/29 #, † | 38,000 | 30,056 | |||||
| Grifols Escrow Issuer 144A 4.75% 10/15/28 #, * | 133,000 | 103,030 | |||||
| Hadrian Merger Sub 144A 8.50% 5/1/26 # | 347,000 | 318,751 | |||||
| HCA 144A 3.125% 3/15/27 # | 310,000 | 274,872 | |||||
| JBS USA LUX 144A 3.00% 2/2/29 # | 120,000 | 98,335 | |||||
| Kronos Acquisition Holdings 144A 5.00% 12/31/26 # | 270,000 | 237,269 | |||||
| MajorDrive Holdings IV 144A 6.375% 6/1/29 # | 669,000 | 462,112 | |||||
| Medline Borrower | |||||||
| 144A 3.875% 4/1/29 # | 504,000 | 404,886 | |||||
| 144A 5.25% 10/1/29 # | 89,000 | 67,367 | |||||
| ModivCare Escrow Issuer 144A 5.00% 10/1/29 # | 478,000 | 389,319 | |||||
| P&L Development 144A 7.75% 11/15/25 # | 520,000 | 390,936 | |||||
| Par Pharmaceutical 144A 7.50% 4/1/27 #, † | 454,000 | 359,740 | |||||
| Performance Food Group 144A 4.25% 8/1/29 # | 228,000 | 190,282 | |||||
| Pilgrim’s Pride 144A 4.25% 4/15/31 # | 406,000 | 324,916 | |||||
| Simmons Foods 144A 4.625% 3/1/29 # | 176,000 | 144,278 | |||||
101
Schedules of investments
Delaware Ivy Multi-Asset Income Fund
| Principal amount° | Value (US $) | ||||||
| Corporate Bonds (continued) | |||||||
| Consumer Non-Cyclical (continued) | |||||||
| US Renal Care 144A 10.625% 7/15/27 # | 986,000 | $ | 459,532 | ||||
| 4,870,285 | |||||||
| Electric — 1.50% | |||||||
| Calpine | |||||||
| 144A 5.00% 2/1/31 # | 250,000 | 199,002 | |||||
| 144A 5.125% 3/15/28 #, * | 710,000 | 611,268 | |||||
| Eversource Energy 2.90% 3/1/27 | 70,000 | 63,621 | |||||
| Fells Point Funding Trust 144A 3.046% 1/31/27 # | 100,000 | 89,223 | |||||
| NextEra Energy Capital Holdings 3.00% 1/15/52 | 40,000 | 25,622 | |||||
| PG&E 5.25% 7/1/30 * | 285,000 | 243,171 | |||||
| TerraForm Power Operating 144A 5.00% 1/31/28 # | 106,000 | 93,533 | |||||
| Vistra 144A 7.00% 12/15/26 #, µ, Ψ | 855,000 | 748,343 | |||||
| Vistra Operations | |||||||
| 144A 4.30% 7/15/29 # | 109,000 | 93,020 | |||||
| 144A 4.375% 5/1/29 # | 163,000 | 135,940 | |||||
| 144A 5.00% 7/31/27 # | 117,000 | 105,942 | |||||
| 2,408,685 | |||||||
| Energy — 4.96% | |||||||
| Ascent Resources Utica Holdings | |||||||
| 144A 5.875% 6/30/29 # | 84,000 | 74,911 | |||||
| 144A 7.00% 11/1/26 # | 214,000 | 206,548 | |||||
| 144A 8.25% 12/31/28 # | 18,000 | 17,330 | |||||
| Bellatrix Exploration | |||||||
| 8.50% 9/11/23 = | 177,000 | 0 | |||||
| 12.50% 12/15/23 = | 193,000 | 0 | |||||
| BP Capital Markets America 2.721% 1/12/32 * | 155,000 | 126,061 | |||||
| Callon Petroleum | |||||||
| 144A 7.50% 6/15/30 # | 145,000 | 127,230 | |||||
| 144A 8.00% 8/1/28 # | 465,000 | 429,881 | |||||
| CNX Resources 144A 6.00% 1/15/29 # | 540,000 | 493,978 | |||||
| ConocoPhillips 3.80% 3/15/52 | 205,000 | 157,313 | |||||
| Crestwood Midstream Partners | |||||||
| 144A 5.625% 5/1/27 # | 172,000 | 156,029 | |||||
| 144A 6.00% 2/1/29 # | 36,000 | 32,269 | |||||
| Diamondback Energy 4.25% 3/15/52 | 20,000 | 14,651 | |||||
| Energy Transfer 6.50% 11/15/26 *, µ, Ψ | 262,000 | 228,884 | |||||
| Ferrellgas 144A 5.375% 4/1/26 # | 160,000 | 140,985 | |||||
| Genesis Energy | |||||||
| 7.75% 2/1/28 | 300,000 | 261,357 | |||||
| 8.00% 1/15/27 | 519,000 | 456,056 | |||||
| Hilcorp Energy I | |||||||
| 144A 6.00% 2/1/31 # | 225,000 | 195,781 | |||||
| 144A 6.25% 4/15/32 # | 520,000 | 461,380 | |||||
| Laredo Petroleum 10.125% 1/15/28 | 440,000 | 423,463 | |||||
| Mesquite Energy 144A 7.25% 2/15/23 † | 111,000 | 1,110 | |||||
| Moss Creek Resources Holdings | |||||||
| 144A 7.50% 1/15/26 # | 466,000 | 407,198 | |||||
| 144A 10.50% 5/15/27 # | 32,000 | 29,840 | |||||
| Murphy Oil 6.375% 7/15/28 | 885,000 | 837,604 | |||||
| NuStar Logistics | |||||||
| 6.00% 6/1/26 | 441,000 | 404,617 | |||||
| 6.375% 10/1/30 | 445,000 | 381,753 | |||||
| Occidental Petroleum | |||||||
| 6.45% 9/15/36 | 200,000 | 200,492 | |||||
| 6.60% 3/15/46 | 625,000 | 645,191 | |||||
| 6.625% 9/1/30 | 245,000 | 249,262 | |||||
| Southwestern Energy 5.375% 3/15/30 | 870,000 | 785,788 | |||||
| 7,946,962 | |||||||
| Finance Companies — 0.11% | |||||||
| Air Lease | |||||||
| 2.875% 1/15/32 * | 35,000 | 26,430 | |||||
| 4.65% 6/15/26 µ, Ψ | 183,000 | 153,240 | |||||
| 179,670 | |||||||
| Financial Services — 0.49% | |||||||
| Highlands Holdings Bond Issuer 144A PIK 7.625% 10/15/25 #, > | 475,095 | 448,960 | |||||
| New Cotai 5.00% 2/2/27 <<, = | 340,864 | 340,012 | |||||
| 788,972 | |||||||
| Insurance — 0.98% | |||||||
| Ardonagh Midco 2 144A PIK 11.50% 1/15/27 #, >> | 1,047,744 | 1,068,698 | |||||
| Brown & Brown | |||||||
| 2.375% 3/15/31 | 14,000 | 10,475 | |||||
| 4.95% 3/17/52 * | 51,000 | 41,480 | |||||
102
| Principal amount° | Value (US $) | ||||||
| Corporate Bonds (continued) | |||||||
| Insurance (continued) | |||||||
| HUB International 144A 5.625% 12/1/29 # | 530,000 | $ | 443,597 | ||||
| 1,564,250 | |||||||
| Natural Gas — 0.07% | |||||||
| Southern Co. Gas Capital 5.15% 9/15/32 | 115,000 | 110,084 | |||||
| 110,084 | |||||||
| Real Estate Investment Trusts — 0.06% | |||||||
| American Homes 4 Rent 3.625% 4/15/32 | 45,000 | 37,164 | |||||
| HAT Holdings I 144A 3.375% 6/15/26 # | 73,000 | 58,673 | |||||
| 95,837 | |||||||
| Services — 0.34% | |||||||
| Adtalem Global Education 144A 5.50% 3/1/28 # | 548,000 | 494,375 | |||||
| Booz Allen Hamilton 144A 3.875% 9/1/28 # | 67,000 | 57,771 | |||||
| 552,146 | |||||||
| Technology — 3.11% | |||||||
| Autodesk 2.40% 12/15/31 * | 35,000 | 27,282 | |||||
| CDW 3.276% 12/1/28 | 45,000 | 37,638 | |||||
| Consensus Cloud Solutions | |||||||
| 144A 6.00% 10/15/26 # | 85,000 | 75,366 | |||||
| 144A 6.50% 10/15/28 # | 203,000 | 172,703 | |||||
| Entegris Escrow | |||||||
| 144A 4.75% 4/15/29 # | 90,000 | 79,477 | |||||
| 144A 5.95% 6/15/30 # | 525,000 | 480,343 | |||||
| Fidelity National Information Services 4.70% 7/15/27 * | 30,000 | 28,922 | |||||
| Iron Mountain 144A 5.25% 7/15/30 # | 1,150,000 | 954,109 | |||||
| NCR | |||||||
| 144A 5.00% 10/1/28 # | 318,000 | 250,816 | |||||
| 144A 5.125% 4/15/29 # | 928,000 | 697,893 | |||||
| 144A 5.25% 10/1/30 # | 106,000 | 80,194 | |||||
| 144A 5.75% 9/1/27 # | 113,000 | 102,659 | |||||
| 144A 6.125% 9/1/29 # | 144,000 | 124,229 | |||||
| Nielsen Finance | |||||||
| 144A 5.625% 10/1/28 # | 283,000 | 281,497 | |||||
| 144A 5.875% 10/1/30 # | 236,000 | 235,552 | |||||
| PayPal Holdings | |||||||
| 3.90% 6/1/27 * | 20,000 | 19,183 | |||||
| 4.40% 6/1/32 | 55,000 | 51,314 | |||||
| Sabre GLBL | |||||||
| 144A 7.375% 9/1/25 # | 42,000 | 37,673 | |||||
| 144A 9.25% 4/15/25 # | 103,000 | 98,753 | |||||
| Sensata Technologies 144A 4.00% 4/15/29 # | 360,000 | 298,690 | |||||
| SS&C Technologies 144A 5.50% 9/30/27 # | 875,000 | 799,998 | |||||
| Workday | |||||||
| 3.50% 4/1/27 * | 10,000 | 9,264 | |||||
| 3.70% 4/1/29 | 20,000 | 17,961 | |||||
| 3.80% 4/1/32 * | 20,000 | 17,383 | |||||
| 4,978,899 | |||||||
| Transportation — 0.15% | |||||||
| American Airlines 144A 5.75% 4/20/29 # | 65,000 | 56,828 | |||||
| Burlington Northern Santa Fe | |||||||
| 2.875% 6/15/52 | 55,000 | 36,066 | |||||
| 4.45% 1/15/53 | 65,000 | 56,565 | |||||
| Lima Metro Line 2 Finance 144A 5.875% 7/5/34 # | 96,012 | 91,227 | |||||
| 240,686 | |||||||
| Total Corporate Bonds (cost $60,548,421) | 50,537,120 | ||||||
| Municipal Bonds — 0.03% | |||||||
| Commonwealth of Puerto Rico(Restructured) | |||||||
| Series A-1 3.045% 7/1/24^ | 4,490 | 4,129 | |||||
| Series A-1 4.00% 7/1/33 | 13,494 | 11,897 | |||||
| Series A-1 4.00% 7/1/35 | 9,800 | 8,401 | |||||
| Series A-1 4.00% 7/1/37 | 10,410 | 8,569 | |||||
| Series A-1 4.38% 7/1/33^ | 17,366 | 9,602 | |||||
| Series A-1 5.625% 7/1/29 | 11,348 | 11,626 | |||||
| Total Municipal Bonds (cost $62,580) | 54,224 | ||||||
| Non-Agency Commercial Mortgage-Backed Securities — 0.48% | |||||||
| BANK | |||||||
| Series 2020-BN26 A4 2.403% 3/15/63 | 220,000 | 181,261 | |||||
| Series 2021-BN32 A5 2.643% 4/15/54 | 250,000 | 205,714 | |||||
| Benchmark Mortgage Trust | |||||||
| Series 2020-B17 A5 2.289% 3/15/53 | 225,000 | 183,528 | |||||
| Series 2022-B33 A5 3.458% 3/15/55 | 225,000 | 196,674 | |||||
| Total Non-Agency Commercial Mortgage-Backed Securities (cost $767,144) | 767,177 | ||||||
103
Schedules of investments
Delaware Ivy Multi-Asset Income Fund
| Principal amount° | Value (US $) | ||||||
| Loan Agreements — 6.02% | |||||||
| Advantage Sales & Marketing Tranche B-1 7.053% (LIBOR01M + 4.50%) 10/28/27 ● | 1,025,844 | $ | 920,054 | ||||
| Amynta Agency Borrower Tranche B 1st Lien 7.615% (LIBOR01M + 4.50%) 2/28/25 ● | 990,130 | 962,488 | |||||
| Applied Systems 2nd Lien 8.462% (LIBOR03M + 5.50%) 9/19/25 ● | 454,649 | 448,966 | |||||
| Ascent Resources Utica Holdings 2nd Lien 11.455% (LIBOR03M + 9.00%) 11/1/25 ● | 133,000 | 139,650 | |||||
| CNT Holdings I 2nd Lien 9.498% (SOFR01M + 6.75%) 11/6/28 ● | 243,000 | 231,457 | |||||
| Consolidated Communications Tranche B-1 6.063% (LIBOR01M + 3.50%) 10/2/27 ● | 178,501 | 155,519 | |||||
| CP Atlas Buyer Tranche B 6.615% (LIBOR01M + 3.50%) 11/23/27 ● | 555,260 | 486,470 | |||||
| Edelman Financial Engines Center 2nd Lien 9.865% (LIBOR01M + 6.75%) 7/20/26 ● | 3,924 | 3,493 | |||||
| Electron Bidco 5.819% (LIBOR01M + 3.00%) 11/1/28 ● | 248,750 | 236,364 | |||||
| Endo Luxembourg Finance I 12.25% (LIBOR03M + 6.00%) 3/27/28 ● | 246,250 | 209,928 | |||||
| Ensemble RCM 6.556% (LIBOR03M + 3.75%) 8/3/26 ● | 245,570 | 240,198 | |||||
| Foresight Energy Operating Tranche A 11.674% (LIBOR03M + 8.00%) 6/30/27 ● | 212,963 | 210,833 | |||||
| Form Technologies Tranche B 7.48% (LIBOR03M + 4.50%) 7/22/25 ● | 1,321,828 | 1,173,122 | |||||
| Frontier Communications Tranche B 7.438% (LIBOR03M + 3.75%) 5/1/28 ● | 246,250 | 230,244 | |||||
| Jones DesLauriers Insurance Management 1st Lien 6.063% (CDOR03M + 4.25%) 3/27/28 ● | 551,797 | 383,483 | |||||
| 7.748% (CDOR03M + 4.25%) 3/27/28 ● | 125,682 | 87,801 | |||||
| Jones DesLauriers Insurance Management 2nd Lien 10.998% (CDOR03M + 7.50%) 3/26/29 ● | 281,669 | 195,752 | |||||
| 10.998% (CDOR03M + 7.50%) 3/26/29 ● | 28,331 | 19,792 | |||||
| Lealand Finance 6.115% (LIBOR01M + 3.00%) 6/30/24 ● | 15,843 | 9,902 | |||||
| LSF11 A5 HoldCo 6.359% (SOFR01M + 3.61%) 10/15/28 ● | 248,750 | 233,359 | |||||
| Madison Iaq 6.815% (LIBOR03M + 3.25%) 6/21/28 ● | 246,875 | 228,668 | |||||
| Medline Borrower 6.365% (LIBOR01M + 3.25%) 10/23/28 ● | 248,750 | 229,299 | |||||
| Mileage Plus Holdings 8.777% (LIBOR03M + 5.25%) 6/21/27 ● | 167,975 | 168,905 | |||||
| MLN US HoldCo Tranche B 1st Lien 8.252% (LIBOR03M + 4.50%) 11/30/25 ● | 927,107 | 574,227 | |||||
| MLN US HoldCo Tranche B 2nd Lien 12.502% (LIBOR03M + 8.75%) 11/30/26 ● | 470,000 | 176,250 | |||||
| Peraton Tranche B 1st Lien 6.865% (LIBOR01M + 3.75%) 2/1/28 ● | 251,660 | 239,172 | |||||
| Polaris Newco 1st Lien 7.098% (LIBOR03M + 4.00%) 6/2/28 ● | 247,500 | 229,030 | |||||
| Sovos Compliance 1st Lien 7.615% (LIBOR01M + 4.50%) 8/11/28 ● | 248,309 | 237,756 | |||||
| Swf Holdings I 7.602% (LIBOR03M + 4.00%) 10/6/28 ● | 168,155 | 132,002 | |||||
| Trident TPI Holdings 1st Lien Tranche B-3 | 216,755 | 217,161 | |||||
| 7.674% (LIBOR03M + 4.00%) 9/15/28 ● | |||||||
| 7.674% (LIBOR03M + 4.00%) 9/15/28 ● | 19,325 | 18,382 | |||||
104
| Principal amount° | Value (US $) | ||||||
| Loan Agreements (continued) | |||||||
| U.S. Renal Care Tranche B 1st Lien 7.563% (LIBOR01M + 5.00%) 6/26/26 ● | 359,597 | $ | 259,629 | ||||
| United Airlines Tranche B 6.533% (LIBOR03M + 3.75%) 4/21/28 ● | 246,250 | 236,054 | |||||
| United PF Holdings 1st Lien 12.174% (LIBOR03M + 8.50%) 12/30/26 ● | 133,280 | 127,949 | |||||
| Total Loan Agreements (cost $10,949,679) | 9,653,359 | ||||||
| US Treasury Obligations — 4.33% | |||||||
| US Treasury Bonds 2.875% 5/15/52 | 200,000 | 167,781 | |||||
| US Treasury Floating Rate Note 3.405% (USBMMY3M + 0.04%) 7/31/24 ● | 525,000 | 524,404 | |||||
| US Treasury Notes | |||||||
| 0.125% 4/30/23 | 4,900,000 | 4,790,459 | |||||
| 2.625% 4/15/25 | 720,000 | 691,566 | |||||
| 2.75% 5/15/25 | 695,000 | 668,910 | |||||
| 2.75% 8/15/32 * | 105,000 | 96,026 | |||||
| Total US Treasury Obligations (cost $7,032,530) | 6,939,146 | ||||||
| Number of shares | |||||||
| Common Stocks — 47.08% | |||||||
| Basic Industry — 0.77% | |||||||
| Air Liquide | 10,670 | 1,219,571 | |||||
| Westmoreland Coal =, † | 7,276 | 18,372 | |||||
| 1,237,943 | |||||||
| Capital Goods — 0.52% | |||||||
| Otis Worldwide | 6,260 | 399,388 | |||||
| Parker-Hannifin | 1,770 | 428,889 | |||||
| 828,277 | |||||||
| Communication Services — 0.63% | |||||||
| Cellnex Telecom 144A # | 15,458 | 476,826 | |||||
| Vantage Towers | 20,442 | 528,835 | |||||
| 1,005,661 | |||||||
| Communications — 0.44% | |||||||
| Orange | 77,910 | 704,660 | |||||
| 704,660 | |||||||
| Consumer Cyclical — 2.67% | |||||||
| adidas AG | 7,550 | 867,957 | |||||
| H & M Hennes & Mauritz Class B * | 57,870 | 535,014 | |||||
| Knorr-Bremse | 13,620 | 584,887 | |||||
| Securitas Class B * | 102,280 | 710,032 | |||||
| Seven & i Holdings | 8,000 | 321,360 | |||||
| Sodexo | 13,470 | 1,011,602 | |||||
| Studio City International Holdings ADR *, † | 35,484 | 77,710 | |||||
| Studio City International Holdings ADR | 60,131 | 131,687 | |||||
| True Religion Apparel =, † | 2 | 45,804 | |||||
| 4,286,053 | |||||||
| Consumer Discretionary — 0.29% | |||||||
| Archaea Energy † | 25,756 | 463,866 | |||||
| 463,866 | |||||||
| Consumer Non-Cyclical — 15.52% | |||||||
| Asahi Group Holdings | 18,800 | 586,110 | |||||
| Clorox | 10,550 | 1,354,514 | |||||
| Conagra Brands | 31,990 | 1,043,834 | |||||
| Danone | 21,490 | 1,016,162 | |||||
| Diageo | 31,680 | 1,333,523 | |||||
| Essity Class B | 39,510 | 780,591 | |||||
| Fresenius Medical Care AG & Co. | 21,570 | 607,692 | |||||
| Henry Schein † | 21,680 | 1,425,894 | |||||
| Ingredion | 13,490 | 1,086,215 | |||||
| Kao | 25,300 | 1,029,466 | |||||
| Kimberly-Clark | 11,550 | 1,299,837 | |||||
| Koninklijke Ahold Delhaize | 52,740 | 1,343,364 | |||||
| Lamb Weston Holdings | 20,890 | 1,616,468 | |||||
| Merck & Co. | 19,690 | 1,695,703 | |||||
| Nestle | 15,310 | 1,655,889 | |||||
| Novo Nordisk Class B | 13,470 | 1,341,852 | |||||
| Pfizer | 26,720 | 1,169,267 | |||||
| Roche Holding | 3,190 | 1,038,449 | |||||
| Smith & Nephew | 116,180 | 1,341,041 | |||||
| Swatch Group | 4,210 | 945,560 | |||||
| Unilever | 26,440 | 1,161,770 | |||||
| 24,873,201 | |||||||
| Consumer Staples — 0.49% | |||||||
| Archer-Daniels-Midland | 4,471 | 359,692 | |||||
| Bunge | 5,146 | 424,905 | |||||
| 784,597 | |||||||
| Energy — 4.78% | |||||||
| Aker BP * | 1 | 19 | |||||
| Chesapeake Energy * | 7,551 | 711,380 | |||||
| Chord Energy | 1,054 | 144,156 | |||||
| Enbridge | 13,027 | 483,037 | |||||
105
Schedules of investments
Delaware Ivy Multi-Asset Income Fund
| Number of shares | Value (US $) | ||||||
| Common Stocks (continued) | |||||||
| Energy (continued) | |||||||
| Enviva | 10,161 | $ | 610,270 | ||||
| EOG Resources | 7,035 | 786,020 | |||||
| EQT | 8,292 | 337,899 | |||||
| Foresight Energy =, † | 31,163 | 463,708 | |||||
| KCA Deutag International = | 7,610 | 525,090 | |||||
| Kimbell Royalty Partners * | 39,203 | 665,667 | |||||
| Occidental Petroleum | 6,323 | 388,548 | |||||
| Parex Resources | 26,638 | 388,959 | |||||
| Schlumberger | 10,928 | 392,315 | |||||
| Shell | 26,347 | 653,615 | |||||
| TC Energy * | 11,152 | 449,196 | |||||
| Valero Energy | 6,099 | 651,678 | |||||
| 7,651,557 | |||||||
| Financial Services — 0.00% | |||||||
| New Cotai <<, = | 318,315 | 0 | |||||
| Riverbed Holdings =, † | 31,305 | 7,826 | |||||
| 7,826 | |||||||
| Industrials — 3.35% | |||||||
| Aena SME 144A #, † | 4,613 | 478,735 | |||||
| ALEATICA † | 682,694 | 576,270 | |||||
| Atlas Arteria | 101,816 | 405,437 | |||||
| CCR | 198,206 | 461,495 | |||||
| East Japan Railway | 9,000 | 461,561 | |||||
| Enav 144A #, † | 141,969 | 516,602 | |||||
| Intertek Group | 14,630 | 600,255 | |||||
| Makita | 21,300 | 413,334 | |||||
| Sacyr | 247,901 | 541,855 | |||||
| Transurban Group | 57,172 | 451,511 | |||||
| Vinci | 5,763 | 466,001 | |||||
| 5,373,056 | |||||||
| Materials — 3.26% | |||||||
| Alcoa | 4,284 | 144,200 | |||||
| Anglo American | 16,780 | 503,833 | |||||
| BHP Group | 41,205 | 1,024,279 | |||||
| CF Industries Holdings | 3,439 | 331,004 | |||||
| ERO Copper † | 32,582 | 360,175 | |||||
| Hudbay Minerals | 56,639 | 228,255 | |||||
| Kinross Gold | 79,119 | 297,488 | |||||
| Newmont | 10,165 | 427,235 | |||||
| Nutrien * | 9,806 | 817,624 | |||||
| Pan American Silver | 11,047 | 175,620 | |||||
| Vale ADR | 43,820 | 583,682 | |||||
| Wheaton Precious Metals | 10,237 | 331,269 | |||||
| 5,224,664 | |||||||
| Real Estate — 0.94% | |||||||
| Mitsubishi Estate | 22,200 | 292,511 | |||||
| Mitsui Fudosan | 16,200 | 308,610 | |||||
| Nyfosa | 6,220 | 35,914 | |||||
| Tokyo Tatemono | 15,000 | 213,426 | |||||
| Weyerhaeuser | 22,961 | 655,766 | |||||
| 1,506,227 | |||||||
| REIT Diversified — 1.01% | |||||||
| Abacus Property Group | 2,760 | 4,407 | |||||
| Activia Properties | 20 | 58,657 | |||||
| Ascendas Real Estate Investment Trust | 52,800 | 98,490 | |||||
| Azrieli Group | 1,580 | 107,832 | |||||
| Capitaland Investment | 67,200 | 161,674 | |||||
| CK Asset Holdings | 55,500 | 333,188 | |||||
| Dios Fastigheter | 3,740 | 23,593 | |||||
| Fastighets Balder † | 4,660 | 18,601 | |||||
| Hang Lung Properties | 16,000 | 26,274 | |||||
| Ingenia Communities Group | 62,160 | 148,055 | |||||
| Inmobiliaria Colonial Socimi | 3,170 | 15,305 | |||||
| Intershop Holding | 30 | 18,881 | |||||
| Mapletree Logistics Trust | 154,800 | 167,261 | |||||
| New World Development | 20,000 | 56,802 | |||||
| NIPPON REIT Investment | 65 | 165,681 | |||||
| Samhallsbyggnadsbolaget i Norden * | 27,860 | 30,328 | |||||
| Sun Hung Kai Properties | 13,000 | 143,472 | |||||
| TAG Immobilien | 4,130 | 32,960 | |||||
| 1,611,461 | |||||||
| REIT Healthcare — 0.44% | |||||||
| Alexandria Real Estate Equities | 1,800 | 252,342 | |||||
| Assura | 112,150 | 67,118 | |||||
| CareTrust REIT | 2,310 | 41,834 | |||||
| Healthpeak Properties | 3,240 | 74,261 | |||||
| Impact Healthcare Reit | 15,590 | 17,860 | |||||
| Sabra Health Care REIT | 2,510 | 32,931 | |||||
| Universal Health Realty Income Trust | 1,620 | 70,000 | |||||
| Welltower | 2,300 | 147,936 | |||||
| 704,282 | |||||||
| REIT Hotel — 0.40% | |||||||
| Gaming and Leisure Properties | 6,220 | 275,173 | |||||
| VICI Properties | 12,130 | 362,080 | |||||
| 637,253 | |||||||
| REIT Industrial — 1.40% | |||||||
| AIMS APAC REIT | 8,900 | 7,912 | |||||
| Duke Realty | 7,930 | 382,226 | |||||
| GLP J-Reit | 50 | 55,452 | |||||
| Granite Real Estate Investment Trust | 3,280 | 158,307 | |||||
106
| Number of shares | Value (US $) | ||||||
| Common Stocks (continued) | |||||||
| REIT Industrial (continued) | 95 | $ | 107,648 | ||||
| Industrial & Infrastructure Fund Investment | |||||||
| Mapletree Industrial Trust | 58,100 | 96,144 | |||||
| Prologis | 8,500 | 863,600 | |||||
| Rexford Industrial Realty | 4,590 | 238,680 | |||||
| Segro | 16,550 | 138,091 | |||||
| Sirius Real Estate | 105,370 | 83,179 | |||||
| Tritax Big Box REIT | 78,300 | 118,161 | |||||
| 2,249,400 | |||||||
| REIT Lodging — 0.06% | |||||||
| Apple Hospitality REIT | 5,190 | 72,972 | |||||
| Pandox † | 1,800 | 19,057 | |||||
| 92,029 | |||||||
| REIT Mall — 0.24% | |||||||
| Simon Property Group | 4,300 | 385,925 | |||||
| 385,925 | |||||||
| REIT Manufactured Housing — 0.24% | |||||||
| Equity LifeStyle Properties | 4,740 | 297,862 | |||||
| Sun Communities | 600 | 81,198 | |||||
| 379,060 | |||||||
| REIT Multifamily — 1.45% | |||||||
| Apartment Income REIT | 4,000 | 154,480 | |||||
| AvalonBay Communities | 2,210 | 407,060 | |||||
| Camden Property Trust | 2,430 | 290,264 | |||||
| Canadian Apartment Properties REIT | 2,700 | 82,289 | |||||
| Daiwa Securities Living Investments | 200 | 158,532 | |||||
| Equity Residential | 4,890 | 328,706 | |||||
| Essex Property Trust | 1,380 | 334,277 | |||||
| Grainger | 33,930 | 86,907 | |||||
| Killam Apartment Real Estate Investment Trust | 9,020 | 99,580 | |||||
| Kojamo | 10,050 | 129,434 | |||||
| UDR | 2,080 | 86,757 | |||||
| Vonovia | 7,980 | 172,223 | |||||
| 2,330,509 | |||||||
| REIT Office — 0.73% | |||||||
| Allied Properties Real Estate Investment Trust | 5,340 | 105,768 | |||||
| Boston Properties | 630 | 47,231 | |||||
| Castellum * | 7,780 | 87,172 | |||||
| Cousins Properties | 3,310 | 77,288 | |||||
| Daiwa Office Investment | 16 | 74,426 | |||||
| Equity Commonwealth | 2,290 | 55,784 | |||||
| Highwoods Properties | 4,430 | 119,433 | |||||
| Hudson Pacific Properties | 2,410 | 26,390 | |||||
| Kilroy Realty | 4,710 | 198,338 | |||||
| Nomura Real Estate Holdings | 7,100 | 160,348 | |||||
| Piedmont Office Realty Trust Class A | 11,980 | 126,509 | |||||
| Wihlborgs Fastigheter | 14,580 | 87,596 | |||||
| 1,166,283 | |||||||
| REIT Retail — 0.19% | |||||||
| CapitaLand Integrated Commercial Trust | 4,600 | 6,119 | |||||
| Deutsche EuroShop | 820 | 18,460 | |||||
| Japan Metropolitan Fund Invest | 70 | 52,557 | |||||
| Lendlease Global Commercial REIT | 23,900 | 12,664 | |||||
| Link REIT | 31,523 | 220,046 | |||||
| 309,846 | |||||||
| REIT Self-Storage — 0.78% | |||||||
| Extra Space Storage | 2,700 | 466,317 | |||||
| Life Storage | 2,550 | 282,438 | |||||
| Public Storage | 1,170 | 342,588 | |||||
| Safestore Holdings | 16,360 | 152,258 | |||||
| 1,243,601 | |||||||
| REIT Shopping Center — 0.34% | |||||||
| Federal Realty Investment Trust | 470 | 42,356 | |||||
| First Capital Real Estate Investment Trust | 10,110 | 110,662 | |||||
| Regency Centers | 1,200 | 64,620 | |||||
| Retail Opportunity Investments | 8,890 | 122,326 | |||||
| Shopping Centres Australasia Property Group | 87,130 | 131,380 | |||||
| SITE Centers | 7,470 | 80,004 | |||||
| 551,348 | |||||||
| REIT Single Tenant — 0.20% | |||||||
| Four Corners Property Trust | 2,580 | 62,410 | |||||
| Orion Office REIT | 2,400 | 21,000 | |||||
| Realty Income | 2,570 | 149,574 | |||||
| Spirit Realty Capital | 2,230 | 80,637 | |||||
| 313,621 | |||||||
| REIT Specialty — 0.47% | |||||||
| Civitas Social Housing | 43,150 | 31,509 | |||||
| Essential Properties Realty Trust | 2,380 | 46,291 | |||||
107
Schedules of investments
Delaware Ivy Multi-Asset Income Fund
| Number of shares | Value (US $) | ||||||
| Common Stocks (continued) | |||||||
| REIT Specialty (continued) | |||||||
| Innovative Industrial Properties | 980 | $ | 86,730 | ||||
| Invitation Homes | 11,970 | 404,227 | |||||
| Waypoint REIT | 118,640 | 180,062 | |||||
| 748,819 | |||||||
| Services — 0.04% | |||||||
| Laureate Education | 5,687 | 59,998 | |||||
| 59,998 | |||||||
| Technology — 2.42% | |||||||
| Amadeus IT Group † | 31,050 | 1,439,560 | |||||
| Digital Realty Trust | 1,440 | 142,819 | |||||
| Equinix | 580 | 329,927 | |||||
| SAP | 14,740 | 1,201,239 | |||||
| Visa Class A * | 4,280 | 760,342 | |||||
| 3,873,887 | |||||||
| Utilities — 3.01% | |||||||
| APA Group | 36,517 | 224,687 | |||||
| Enel | 111,628 | 457,812 | |||||
| Hydro One 144A # | 19,244 | 470,599 | |||||
| National Grid | 45,964 | 473,159 | |||||
| Orsted 144A # | 5,771 | 459,953 | |||||
| PPL | 17,443 | 442,180 | |||||
| Severn Trent | 17,718 | 463,177 | |||||
| Snam | 115,353 | 466,249 | |||||
| SSE | 27,228 | 459,772 | |||||
| Terna - Rete Elettrica Nazionale | 76,543 | 466,187 | |||||
| United Utilities Group | 44,955 | 443,893 | |||||
| 4,827,668 | |||||||
| Total Common Stocks (cost $95,174,423) | 75,432,578 | ||||||
| Preferred Stock — 0.01% | |||||||
| True Religion Apparel 0.000% =, ω | 2 | 10,280 | |||||
| Total Preferred Stock (cost $33,831) | 10,280 | ||||||
| Exchange-Traded Funds — 4.16% | |||||||
| SPDR S&P Global Natural Resources ETF | 17,878 | 884,246 | |||||
| Vanguard Global ex- U.S. Real Estate ETF | 310 | 11,829 | |||||
| Vanguard High Dividend Yield ETF | 34,973 | 3,318,238 | |||||
| Vanguard International High Dividend Yield ETF | 44,867 | 2,334,879 | |||||
| Vanguard Real Estate ETF | 110 | 8,819 | |||||
| Vanguard S&P 500 ETF | 340 | 111,622 | |||||
| Total Exchange-Traded Funds (cost $7,862,656) | 6,669,633 | ||||||
| Master Limited Partnerships — 0.37% | |||||||
| Black Stone Minerals | 37,650 | 589,223 | |||||
| Total Master Limited Partnerships (cost $408,028) | 589,223 | ||||||
| Rights — 0.11% | |||||||
| Securitas † | 421,720 | 175,944 | |||||
| Total Rights (cost $240,335) | 175,944 | ||||||
| Warrant — 0.01% | |||||||
| California Resources † | 1,167 | 12,137 | |||||
| Total Warrant (cost $101,593) | 12,137 | ||||||
| Short-Term Investments — 0.29% | |||||||
| Money Market Mutual Funds — 0.29% | 117,972 | 117,972 | |||||
| BlackRock Liquidity FedFund – Institutional Shares (seven-day effective yield 2.76%) | |||||||
| Fidelity Investments Money Market Government Portfolio – Class I (seven-day effective yield 2.74%) | 117,972 | 117,972 | |||||
| Goldman Sachs Financial Square Government Fund – Institutional Shares (seven-day effective yield 2.98%) | 117,972 | 117,972 | |||||
| Morgan Stanley Institutional Liquidity Funds Government Portfolio – Institutional Class (seven-day effective yield 2.80%) | 117,972 | 117,972 | |||||
| Total Short-Term Investments (cost $471,888) | 471,888 | ||||||
| Total Value of Securities Before Securities Lending Collateral—98.01% (cost $190,134,261) | 157,056,745 | ||||||
108
| Number of shares | Value (US $) | |||||||
| Securities Lending Collateral** — 3.64% | ||||||||
| Money Market Mutual Fund — 3.64% | ||||||||
| Dreyfus Institutional Preference Government Money Market Fund - Institutional Shares (seven-day effective yield 2.98%) | 5,826,401 | $ | 5,826,401 | |||||
| Total Securities Lending Collateral (cost $5,826,401) | 5,826,401 | |||||||
| Total Value of Securities—101.65% (cost $195,960,662) | $ | 162,883,146■ | ||||||
| ° | Principal amount shown is stated in USD unless noted that the security is denominated in another currency. |
| ω | Perpetual security with no stated maturity date. |
| † | Non-income producing security. |
| ● | Variable rate investment. Rates reset periodically. Rate shown reflects the rate in effect at September 30, 2022. For securities based on a published reference rate and spread, the reference rate and spread are indicated in their descriptions. The reference rate descriptions (i.e. LIBOR03M, LIBOR06M, etc.) used in this report are identical for different securities, but the underlying reference rates may differ due to the timing of the reset period. Certain variable rate securities are not based on a published reference rate and spread but are determined by the issuer or agent and are based on current market conditions, or for mortgage-backed securities, are impacted by the individual mortgages which are paying off over time. These securities do not indicate a reference rate and spread in their descriptions. |
| ^ | Zero-coupon security. The rate shown is the effective yield at the time of purchase. |
| << | Affiliated company. See Note 2 in “Notes to financial statements.” |
| = | The value of this security was determined using significant unobservable inputs and is reported as a Level 3 security in the disclosure table located in Note 3 in “Notes to financial statements.” |
| ** | See Note 11 in “Notes to financial statements” for additional information on securities lending collateral. |
| † | Non-income producing security. Security is currently in default. |
| >> | PIK. 100% of the income received was in the form of principal. |
| > | PIK. 100% of the income received was in the form of cash. |
| # | Security exempt from registration under Rule 144A of the Securities Act of 1933, as amended. At September 30, 2022, the aggregate value of Rule 144A securities was $38,979,971, which represents 24.33% of the Fund’s net assets. See Note 12 in “Notes to financial statements.” |
| * | Fully or partially on loan. |
| Ψ | Perpetual security. Maturity date represents next call date. |
| µ | Fixed to variable rate investment. The rate shown reflects the fixed rate in effect at September 30, 2022. Rate will reset at a future date. |
| >>> | PIK. 62.50% of the income received was in cash and 37.50% was in principal. |
| ■ | Includes $11,251,357 of securities loaned for which the counterparty pledged additional non-cash collateral valued at $5,805,287. |
The following foreign currency exchange contracts and futures contracts were outstanding at September 30, 2022:1
Foreign Currency Exchange Contracts
| Counterparty | Currency to Receive (Deliver) | In Exchange For | Settlement Date | Unrealized Appreciation | Unrealized Depreciation | |||||||||||||||||
| BNYM | AUD | (3,971) | USD | 2,551 | 10/4/22 | $ | — | $ | (2 | ) | ||||||||||||
| BNYM | CAD | (5,040) | USD | 3,673 | 10/3/22 | 24 | — | |||||||||||||||
| BNYM | CAD | (4,570) | USD | 3,324 | 10/4/22 | — | (2 | ) | ||||||||||||||
| BNYM | CHF | (20,144) | USD | 20,414 | 10/4/22 | — | (59 | ) | ||||||||||||||
| BNYM | DKK | (144,704) | USD | 19,051 | 10/3/22 | — | (27 | ) | ||||||||||||||
| BNYM | EUR | (40,282) | USD | 39,418 | 10/3/22 | — | (68 | ) | ||||||||||||||
| BNYM | EUR | (80,139) | USD | 78,573 | 10/4/22 | 14 | — | |||||||||||||||
| BNYM | GBP | (34,310) | USD | 37,906 | 10/3/22 | — | (405 | ) | ||||||||||||||
| BNYM | GBP | (43,624) | USD | 48,732 | 10/4/22 | 31 | — | |||||||||||||||
| BNYM | HKD | (61,192) | USD | 7,791 | 10/5/22 | — | (5 | ) | ||||||||||||||
| BNYM | ILS | (12,605) | USD | 3,586 | 10/3/22 | 51 | — | |||||||||||||||
| BNYM | JPY | (7,402,108) | USD | 51,163 | 10/3/22 | 5 | — | |||||||||||||||
| BNYM | JPY | (776,260) | USD | 5,359 | 10/4/22 | — | (5 | ) | ||||||||||||||
| BNYM | SGD | (12,593) | USD | 8,770 | 10/4/22 | 2 | — | |||||||||||||||
109
Schedules of investments
Delaware Ivy Multi-Asset Income Fund
Foreign Currency Exchange Contracts
| Counterparty | Currency to Receive (Deliver) | In Exchange For | Settlement Date | Unrealized Appreciation | Unrealized Depreciation | ||||||||||||||||
| TD | CAD | (1,010,000) | USD | 783,260 | 11/18/22 | $ | 52,098 | $ | — | ||||||||||||
| Total Foreign Currency Exchange Contracts | $ | 52,225 | $ | (573 | ) | ||||||||||||||||
Futures Contracts
Exchange-Traded
| Contracts to Buy (Sell) | Notional Amount | Notional Cost (Proceeds) | Expiration Date | Value/ Unrealized Depreciation | Variation Margin Due from (Due to) Brokers | |||||||||||
| 4 | US Treasury 2 yr Notes | $ | 821,563 | $ | 834,957 | 12/30/22 | $ | (13,394) | $ | (594) | ||||||
| 2 | US Treasury 10 yr Notes | 224,125 | 235,724 | 12/20/22 | (11,599) | (781) | ||||||||||
| 2 | US Treasury Long Bonds | 252,812 | 274,505 | 12/20/22 | (21,693) | (1,313) | ||||||||||
| Total Futures Contracts | $ | 1,345,186 | $ | (46,686) | $ | (2,688) | ||||||||||
The use of foreign exchange contracts and futures contracts involves elements of market risk and risks in excess of the amounts disclosed in the financial statements. The foreign currency exchange contracts and notional amounts presented above represent the Fund’s total exposure in such contracts, whereas only the net unrealized appreciation (depreciation) and variation margin are reflected in the Fund’s net assets.
1See Note 9 in “Notes to financial statements.”
110
Summary of abbreviations:
ADR – American Depositary Receipt
AG – Aktiengesellschaft
BNYM – Bank of New York Mellon
CDOR03M – 3 Month Canadian Dollar Offered Rate
DAC – Designated Activity Company
ETF – Exchange-Traded Fund
ICE – Intercontinental Exchange, Inc.
LIBOR – London Interbank Offered Rate
LIBOR01M – ICE LIBOR USD 1 Month
LIBOR03M – ICE LIBOR USD 3 Month
LIBOR06M – ICE LIBOR USD 6 Month
PIK – Payment-in-kind
REIT – Real Estate Investment Trust
S&P – Standard & Poor’s Financial Services LLC
S.F. – Single Family
SOFR – Secured Overnight Financing Rate
SOFR01M – Secured Overnight Financing Rate 1 Month
SPDR – Standard & Poor’s Depositary Receipt
TD – TD Bank
USBMMY3M – US Treasury 3 Month Bill Money Market Yield
yr – Year
Summary of currencies:
AUD – Australian Dollar
CAD – Canadian Dollar
CHF – Swiss Franc
DKK – Danish Krone
EUR – European Monetary Unit
GBP – British Pound Sterling
HKD – Hong Kong Dollar
ILS – Israeli New Shekel
JPY – Japanese Yen
SGD – Singapore Dollar
USD – US Dollar
See accompanying notes, which are an integral part of the financial statements.
111
Schedules of investments
Delaware Ivy Strategic Income Fund
September 30, 2022
| Principal amount° | Value (US $) | ||||||
| Agency Collateralized Mortgage Obligations — 6.23% | |||||||
| Fannie Mae REMIC Series 2014-34 MA 3.00% 2/25/44 | 63,576 | $ | 60,832 | ||||
| Freddie Mac REMIC Series 4348 ME 2.50% 6/15/39 | 11,169 | 11,153 | |||||
| Freddie Mac Structured Agency Credit Risk Debt Notes Series 2022-DNA2 M2 144A 6.031% (SOFR + 3.75%) 2/25/42 #, ● | 3,000,000 | 2,741,254 | |||||
| Freddie Mac Structured Agency Credit Risk REMICs Trust | |||||||
| Series 2021-DNA5 M2 144A 3.931% (SOFR + 1.65%) 1/25/34 #, ● | 2,604,993 | 2,540,282 | |||||
| Series 2021-HQA1 M2 144A 4.531% (SOFR + 2.25%) 8/25/33 #, ● | 3,000,000 | 2,748,913 | |||||
| Series 2022-DNA1 M2 144A 4.781% (SOFR + 2.50%) 1/25/42 #, ● | 3,000,000 | 2,617,495 | |||||
| GNMA Series 2015-151 KC 3.50% 4/20/34 | 24,278 | 23,659 | |||||
| Total Agency Collateralized Mortgage Obligations (cost $11,747,270) | 10,743,588 | ||||||
| Convertible Bonds — 0.71% | |||||||
| Paratek Pharmaceuticals 4.75% exercise price $15.90, maturity date 5/1/24 | 875,000 | 782,775 | |||||
| Spirit Airlines 1.00% exercise price $49.07, maturity date 5/15/26 | 518,000 | 443,667 | |||||
| Total Convertible Bonds (cost $1,285,581) | 1,226,442 | ||||||
| Corporate Bonds — 59.09% | |||||||
| Banking — 10.28% | |||||||
| Australia & New Zealand Banking Group 144A 4.50% 3/19/24 # | 1,100,000 | 1,085,681 | |||||
| Banco BBVA Peru 5.25% 9/22/29 µ | 125,000 | 119,612 | |||||
| Banco de Credito del Peru 144A 4.25% 4/1/23 # | 550,000 | 548,045 | |||||
| Banco del Estado de Chile 144A 2.704% 1/9/25 # | 1,300,000 | 1,218,540 | |||||
| Banco General 144A 5.25% 5/7/31 #, µ, Ψ | 200,000 | 171,259 | |||||
| Banco Internacional del Peru 144A 3.25% 10/4/26 # | 1,500,000 | 1,360,385 | |||||
| Banco Santander Mexico | |||||||
| 144A 4.125% 11/9/22 # | 1,150,000 | 1,149,120 | |||||
| 144A 5.95% 10/1/28 #, µ | 350,000 | 338,683 | |||||
| Bank of America | |||||||
| 3.593% 7/21/28 µ | 700,000 | 632,900 | |||||
| 4.375% 1/27/27 µ, Ψ | 115,000 | 92,575 | |||||
| 4.571% 4/27/33 µ | 120,000 | 107,644 | |||||
| 6.125% 4/27/27 µ, Ψ | 145,000 | 137,387 | |||||
| BBVA Bancomer | |||||||
| 144A 1.875% 9/18/25 # | 600,000 | 538,171 | |||||
| 144A 5.875% 9/13/34 #, µ | 600,000 | 514,584 | |||||
| 5.875% 9/13/34 µ | 200,000 | 171,528 | |||||
| Citigroup 5.61% 9/29/26 µ | 540,000 | 537,396 | |||||
| Corp. Financiera de Desarrollo 144A 2.40% 9/28/27 # | 500,000 | 415,557 | |||||
| Credit Suisse Group 144A 6.442% 8/11/28 #, µ | 625,000 | 582,015 | |||||
| Deutsche Bank 3.742% 1/7/33 µ | 603,000 | 391,823 | |||||
| Fifth Third Bancorp 4.337% 4/25/33 µ | 145,000 | 128,739 | |||||
| Goldman Sachs Group 3.814% 4/23/29 µ | 700,000 | 621,598 | |||||
| Hana Bank 144A 3.50% 10/19/26 #, µ, Ψ | 200,000 | 180,537 | |||||
| ICICI Bank 144A 4.00% 3/18/26 # | 1,200,000 | 1,144,270 | |||||
| Itau Unibanco Holding 144A 3.25% 1/24/25 # | 470,000 | 445,325 | |||||
| JPMorgan Chase & Co. | |||||||
| 3.54% 5/1/28 µ | 600,000 | 543,754 | |||||
| 4.00% 4/1/25 µ, Ψ | 400,000 | 330,000 | |||||
| 4.586% 4/26/33 *, µ | 95,000 | 85,622 | |||||
| KeyCorp 4.789% 6/1/33 µ | 211,000 | 193,766 | |||||
| NBK SPC 144A 1.625% 9/15/27 #, µ | 1,800,000 | 1,549,282 | |||||
| NBK Tier 1 144A 3.625% 8/24/26 #, µ, Ψ | 206,000 | 175,790 | |||||
112
| Principal amount° | Value (US $) | ||||||
| Corporate Bonds (continued) | |||||||
| Banking (continued) | |||||||
| NBK Tier 1 Financing 2 144A 4.50% 8/27/25 #, µ, Ψ | 300,000 | $ | 268,993 | ||||
| PNC Financial Services Group 6.00% 5/15/27 *, µ, Ψ | 110,000 | 102,300 | |||||
| Power Finance 3.90% 9/16/29 | 1,100,000 | 934,882 | |||||
| SVB Financial Group 4.57% 4/29/33 µ | 210,000 | 184,359 | |||||
| US Bancorp | |||||||
| 2.215% 1/27/28 *, µ | 130,000 | 114,684 | |||||
| 2.677% 1/27/33 *, µ | 135,000 | 108,680 | |||||
| Wells Fargo & Co. | |||||||
| 4.611% 4/25/53 µ | 190,000 | 154,648 | |||||
| 4.808% 7/25/28 *, µ | 380,000 | 362,808 | |||||
| 17,742,942 | |||||||
| Basic Industry — 2.07% | |||||||
| AngloGold Ashanti Holdings | |||||||
| 3.75% 10/1/30 | 350,000 | 271,987 | |||||
| 6.50% 4/15/40 | 120,000 | 105,433 | |||||
| First Quantum Minerals 144A 6.875% 10/15/27 # | 305,000 | 275,180 | |||||
| GUSAP III 144A 4.25% 1/21/30 # | 900,000 | 790,934 | |||||
| Industrias Penoles 144A 4.15% 9/12/29 # | 700,000 | 606,666 | |||||
| Suzano Austria 2.50% 9/15/28 | 1,000,000 | 783,500 | |||||
| Westlake 1.625% 7/17/29 | EUR | 1,000,000 | 738,101 | ||||
| 3,571,801 | |||||||
| Brokerage — 2.30% | |||||||
| Citadel Finance 144A 3.375% 3/9/26 # | 800,000 | 706,543 | |||||
| Compass Group Diversified Holdings 144A 5.25% 4/15/29 # | 754,000 | 592,731 | |||||
| LPL Holdings 144A 4.00% 3/15/29 # | 102,000 | 87,701 | |||||
| NFP 144A 6.875% 8/15/28 # | 1,687,000 | 1,318,652 | |||||
| StoneX Group 144A 8.625% 6/15/25 # | 478,000 | 483,781 | |||||
| XP 144A 3.25% 7/1/26 # | 900,000 | 779,130 | |||||
| 3,968,538 | |||||||
| Capital Goods — 2.64% | |||||||
| Ahern Rentals 144A 7.375% 5/15/23 # | 455,000 | 308,785 | |||||
| BAE Systems Holdings 144A 3.80% 10/7/24 # | 500,000 | 486,228 | |||||
| Canpack 144A 3.875% 11/15/29 # | 170,000 | 133,161 | |||||
| CP Atlas Buyer 144A 7.00% 12/1/28 # | 140,000 | 104,469 | |||||
| DAE Funding 144A 1.55% 8/1/24 # | 300,000 | 274,323 | |||||
| GFL Environmental 144A 5.125% 12/15/26 # | 76,000 | 70,870 | |||||
| Madison IAQ 144A 4.125% 6/30/28 # | 42,000 | 33,797 | |||||
| NESCO Holdings II 144A 5.50% 4/15/29 # | 612,000 | 510,879 | |||||
| SAN Miguel Industrias Pet 144A 3.50% 8/2/28 # | 450,000 | 364,459 | |||||
| Standard Industries | |||||||
| 144A 4.375% 7/15/30 # | 1,392,000 | 1,068,235 | |||||
| 144A 4.75% 1/15/28 # | 38,000 | 32,196 | |||||
| Turkiye Sise ve Cam Fabrikalari 144A 6.95% 3/14/26 # | 200,000 | 184,509 | |||||
| Wesco Aircraft Holdings | |||||||
| 144A 8.50% 11/15/24 # | 807,000 | 423,675 | |||||
| 144A 9.00% 11/15/26 #, * | 876,000 | 528,491 | |||||
| 144A 13.125% 11/15/27 # | 131,000 | 39,627 | |||||
| 4,563,704 | |||||||
| Communications — 6.22% | |||||||
| Advantage Sales & Marketing 144A 6.50% 11/15/28 # | 881,000 | 699,510 | |||||
| Altice Financing 144A 5.75% 8/15/29 # | 535,000 | 410,671 | |||||
| ATP Tower Holdings 144A 4.05% 4/27/26 # | 300,000 | 238,813 | |||||
| CCO Holdings | |||||||
| 144A 4.25% 2/1/31 # | 41,000 | 31,518 | |||||
| 144A 4.50% 8/15/30 # | 530,000 | 420,452 | |||||
| Colombia Telecomunicaciones 144A 4.95% 7/17/30 # | 200,000 | 152,409 | |||||
| Consolidated Communications | |||||||
| 144A 5.00% 10/1/28 # | 146,000 | 101,815 | |||||
| 144A 6.50% 10/1/28 # | 307,000 | 230,250 | |||||
| Crown Castle International 3.70% 6/15/26 | 800,000 | 752,117 | |||||
| CSC Holdings | |||||||
| 144A 5.375% 2/1/28 # | 343,000 | 300,026 | |||||
| 144A 5.75% 1/15/30 # | 248,000 | 176,725 | |||||
113
Schedules of investments
Delaware Ivy Strategic Income Fund
| Principal amount° | Value (US $) | ||||||
| Corporate Bonds (continued) | |||||||
| Communications (continued) | |||||||
| Digicel Group Holdings 144A PIK 7.00% 10/21/22 #, Ψ, >> | 114,555 | $ | 20,047 | ||||
| 144A PIK 8.00% 4/1/25 #, >>> | 248,560 | 98,432 | |||||
| Digicel International Finance | |||||||
| 144A 8.00% 12/31/26 # | 210,426 | 129,032 | |||||
| 144A 8.75% 5/25/24 # | 1,132,000 | 1,037,965 | |||||
| Directv Financing 144A 5.875% 8/15/27 # | 390,000 | 337,106 | |||||
| Frontier Communications Holdings | |||||||
| 144A 5.00% 5/1/28 # | 203,000 | 174,554 | |||||
| 144A 5.875% 10/15/27 # | 336,000 | 301,899 | |||||
| 5.875% 11/1/29 | 338,226 | 269,235 | |||||
| 144A 6.00% 1/15/30 # | 216,000 | 170,143 | |||||
| 144A 6.75% 5/1/29 #, * | 219,000 | 181,178 | |||||
| Globo Comunicacao e Participacoes 144A 4.875% 1/22/30 # | 200,000 | 150,784 | |||||
| IHS Holding 144A 5.625% 11/29/26 # | 200,000 | 159,250 | |||||
| Ligado Networks 144A PIK 15.50% 11/1/23 #, >> | 1,131,932 | 526,348 | |||||
| Matterhorn Telecom 3.125% 9/15/26 | EUR | 69,000 | 59,255 | ||||
| Millicom International Cellular 144A 4.50% 4/27/31 # | 200,000 | 143,044 | |||||
| Network i2i 144A 5.65% 1/15/25 #, µ, Ψ | 250,000 | 228,636 | |||||
| Northwest Fiber | |||||||
| 144A 6.00% 2/15/28 # | 197,000 | 153,089 | |||||
| 144A 10.75% 6/1/28 # | 159,000 | 148,294 | |||||
| SK Telecom 144A 3.75% 4/16/23 # | 500,000 | 496,097 | |||||
| Stagwell Global 144A 5.625% 8/15/29 # | 339,000 | 279,463 | |||||
| Summit Digitel Infrastructure 144A 2.875% 8/12/31 # | 700,000 | 508,854 | |||||
| Telesat Canada | |||||||
| 144A 5.625% 12/6/26 # | 743,000 | 356,529 | |||||
| 144A 6.50% 10/15/27 # | 145,000 | 53,930 | |||||
| Uniti Group 144A 4.75% 4/15/28 # | 60,000 | 47,539 | |||||
| VTR Comunicaciones 144A 4.375% 4/15/29 # | 295,000 | 183,542 | |||||
| Warnermedia Holdings | |||||||
| 144A 3.755% 3/15/27 # | 370,000 | 331,501 | |||||
| 144A 4.054% 3/15/29 # | 55,000 | 47,569 | |||||
| 144A 4.279% 3/15/32 # | 60,000 | 49,438 | |||||
| 144A 5.141% 3/15/52 # | 235,000 | 171,251 | |||||
| Windstream Escrow 144A 7.75% 8/15/28 #, * | 482,000 | 400,084 | |||||
| 10,728,394 | |||||||
| Consumer Cyclical — 8.46% | |||||||
| Alibaba Group Holding 3.40% 12/6/27 | 1,000,000 | 901,188 | |||||
| Alsea 144A 7.75% 12/14/26 # | 1,570,000 | 1,462,165 | |||||
| Aptiv 3.25% 3/1/32 | 55,000 | 43,857 | |||||
| Arches Buyer | |||||||
| 144A 4.25% 6/1/28 # | 621,000 | 485,737 | |||||
| 144A 6.125% 12/1/28 # | 463,000 | 359,269 | |||||
| Arcos Dorados 144A 6.125% 5/27/29 # | 845,000 | 767,121 | |||||
| B2W Digital 144A 4.375% 12/20/30 # | 200,000 | 136,392 | |||||
| BorgWarner 1.00% 5/19/31 | EUR | 1,000,000 | 701,463 | ||||
| Carnival | |||||||
| 144A 5.75% 3/1/27 # | 291,000 | 204,508 | |||||
| 144A 7.625% 3/1/26 # | 963,000 | 733,339 | |||||
| 144A 9.875% 8/1/27 # | 203,000 | 199,313 | |||||
| 144A 10.50% 2/1/26 # | 446,000 | 441,966 | |||||
| Cars.com 144A 6.375% 11/1/28 # | 294,000 | 251,191 | |||||
| DR Horton 2.60% 10/15/25 | 800,000 | 735,329 | |||||
| Falabella 144A 3.75% 10/30/27 # | 500,000 | 451,655 | |||||
| General Motors 5.40% 10/15/29 | 60,000 | 55,400 | |||||
| Hyundai Capital Services 144A 3.75% 3/5/23 # | 900,000 | 893,890 | |||||
| JSM Global 144A 4.75% 10/20/30 # | 1,000,000 | 704,775 | |||||
| Kia 144A 1.75% 10/16/26 # | 200,000 | 172,704 | |||||
| Lithia Motors | |||||||
| 144A 3.875% 6/1/29 # | 222,000 | 178,525 | |||||
| 144A 4.375% 1/15/31 # | 162,000 | 132,868 | |||||
| 144A 4.625% 12/15/27 # | 17,000 | 14,792 | |||||
| LSF9 Atlantis Holdings 144A 7.75% 2/15/26 # | 478,000 | 427,220 | |||||
| Michaels | |||||||
| 144A 5.25% 5/1/28 #, * | 351,000 | 247,144 | |||||
| 144A 7.875% 5/1/29 # | 852,000 | 493,184 | |||||
| PetSmart 144A 7.75% 2/15/29 # | 590,000 | 528,369 | |||||
114
| Principal amount° | Value (US $) | ||||||
| Corporate Bonds (continued) | |||||||
| Consumer Cyclical (continued) | |||||||
| Royal Caribbean Cruises 144A 5.50% 4/1/28 # | 360,000 | $ | 253,015 | ||||
| Sands China 5.625% 8/8/25 | �� | 600,000 | 544,512 | ||||
| Staples | |||||||
| 144A 7.50% 4/15/26 # | 1,435,000 | 1,206,914 | |||||
| 144A 10.75% 4/15/27 # | 1,000,000 | 742,545 | |||||
| VICI Properties | |||||||
| 4.95% 2/15/30 | 50,000 | 45,292 | |||||
| 5.125% 5/15/32 | 95,000 | 84,418 | |||||
| 14,600,060 | |||||||
| Consumer Non-Cyclical — 5.51% | |||||||
| American Greetings 144A 8.75% 4/15/25 # | 118,000 | 113,508 | |||||
| Anheuser-Busch InBev Worldwide 4.00% 4/13/28 | 850,000 | 808,783 | |||||
| Bacardi 144A 4.45% 5/15/25 # | 1,100,000 | 1,055,729 | |||||
| Bayer US Finance II 144A 2.85% 4/15/25 # | 1,000,000 | 935,016 | |||||
| CSL Finance | |||||||
| 144A 4.05% 4/27/29 # | 75,000 | 69,174 | |||||
| 144A 4.75% 4/27/52 # | 120,000 | 103,669 | |||||
| DP World 4.70% 9/30/49 | 200,000 | 151,980 | |||||
| DP World Crescent 3.875% 7/18/29 | 600,000 | 544,259 | |||||
| Encompass Health 4.625% 4/1/31 | 155,000 | 122,799 | |||||
| Endo Luxembourg Finance I 144A 6.125% 4/1/29 #, † | 42,000 | 33,220 | |||||
| Grifols Escrow Issuer 144A 4.75% 10/15/28 # | 147,000 | 113,875 | |||||
| Hadrian Merger Sub 144A 8.50% 5/1/26 # | 239,000 | 219,543 | |||||
| JBS USA LUX | |||||||
| 144A 3.00% 2/2/29 # | 268,000 | 219,614 | |||||
| 144A 3.625% 1/15/32 # | 400,000 | 313,310 | |||||
| Kronos Acquisition Holdings 144A 5.00% 12/31/26 # | 306,000 | 268,905 | |||||
| MajorDrive Holdings IV 144A 6.375% 6/1/29 # | 743,000 | 513,227 | |||||
| MARB BondCo 144A 3.95% 1/29/31 # | 200,000 | 145,063 | |||||
| Medline Borrower | |||||||
| 144A 3.875% 4/1/29 # | 579,000 | 465,137 | |||||
| 144A 5.25% 10/1/29 #, * | 103,000 | 77,964 | |||||
| ModivCare Escrow Issuer 144A 5.00% 10/1/29 #, * | 402,000 | 327,419 | |||||
| P&L Development 144A 7.75% 11/15/25 # | 580,000 | 436,044 | |||||
| Par Pharmaceutical 144A 7.50% 4/1/27 #, † | 342,000 | 270,994 | |||||
| Performance Food Group 144A 4.25% 8/1/29 # | 190,000 | 158,568 | |||||
| Pilgrim’s Pride 144A 4.25% 4/15/31 # | 433,000 | 346,523 | |||||
| Reynolds American 4.45% 6/12/25 | 800,000 | 773,838 | |||||
| Simmons Foods 144A 4.625% 3/1/29 # | 187,000 | 153,295 | |||||
| Teva Pharmaceutical Finance Netherlands III 6.75% 3/1/28 | 400,000 | 368,036 | |||||
| US Renal Care 144A 10.625% 7/15/27 # | 851,000 | 396,615 | |||||
| 9,506,107 | |||||||
| Electric — 3.51% | |||||||
| Adani Electricity Mumbai 144A 3.949% 2/12/30 # | 620,000 | 469,403 | |||||
| Adani Transmission 4.25% 5/21/36 | 175,000 | 142,503 | |||||
| Colbun 144A 4.50% 7/10/24 # | 1,700,000 | 1,670,250 | |||||
| Comision Federal de Electricidad 144A 3.875% 7/26/33 # | 750,000 | 524,621 | |||||
| Enel Chile 4.875% 6/12/28 | 840,000 | 778,611 | |||||
| Fells Point Funding Trust 144A 3.046% 1/31/27 # | 155,000 | 138,296 | |||||
| Grupo Energia Bogota 144A 4.875% 5/15/30 # | 200,000 | 171,910 | |||||
| Kallpa Generacion 144A 4.875% 5/24/26 # | 1,000,000 | 927,120 | |||||
| Minejesa Capital 5.625% 8/10/37 | 200,000 | 143,275 | |||||
| Perusahaan Listrik Negara 144A 5.45% 5/21/28 # | 700,000 | 668,349 | |||||
| TerraForm Power Operating 144A 5.00% 1/31/28 # | 115,000 | 101,474 | |||||
| Vistra Operations | |||||||
| 144A 4.30% 7/15/29 # | 52,000 | 44,377 | |||||
| 144A 4.375% 5/1/29 # | 182,000 | 151,786 | |||||
| 144A 5.00% 7/31/27 # | 132,000 | 119,524 | |||||
| 6,051,499 | |||||||
| Energy — 8.42% | |||||||
| Aker BP 144A 3.75% 1/15/30 # | 700,000 | 596,032 | |||||
115
Schedules of investments
Delaware Ivy Strategic Income Fund
| Principal amount° | Value (US $) | ||||||
| Corporate Bonds (continued) | |||||||
| Energy (continued) | |||||||
| Ascent Resources Utica Holdings | |||||||
| 144A 5.875% 6/30/29 # | 96,000 | $ | 85,613 | ||||
| 144A 7.00% 11/1/26 # | 236,000 | 227,782 | |||||
| 144A 8.25% 12/31/28 # | 25,000 | 24,070 | |||||
| Bellatrix Exploration | |||||||
| 8.50% 9/11/23 = | 228,000 | 0 | |||||
| 12.50% 12/15/23 = | 249,000 | 0 | |||||
| BP Capital Markets America 2.721% 1/12/32 | 285,000 | 231,789 | |||||
| Callon Petroleum | |||||||
| 144A 7.50% 6/15/30 # | 1,605,000 | 1,408,307 | |||||
| 144A 8.00% 8/1/28 # | 75,000 | 69,336 | |||||
| Cosan 144A 5.50% 9/20/29 # | 700,000 | 632,793 | |||||
| Crestwood Midstream Partners | |||||||
| 144A 5.625% 5/1/27 # | 210,000 | 190,500 | |||||
| 144A 6.00% 2/1/29 # | 49,000 | 43,922 | |||||
| Ecopetrol 6.875% 4/29/30 | 49,000 | 41,266 | |||||
| Energy Transfer 6.50% 11/15/26 µ, Ψ | 267,000 | 233,252 | |||||
| EQM Midstream Partners 144A 4.75% 1/15/31 # | 2,475,000 | 1,970,347 | |||||
| Ferrellgas 144A 5.375% 4/1/26 # | 187,000 | 164,776 | |||||
| Genesis Energy | |||||||
| 7.75% 2/1/28 | 345,000 | 300,561 | |||||
| 8.00% 1/15/27 | 590,000 | 518,445 | |||||
| Geopark 144A 5.50% 1/17/27 # | 600,000 | 469,264 | |||||
| Inversiones Latin America Power 144A 5.125% 6/15/33 # | 391,780 | 191,975 | |||||
| Laredo Petroleum 10.125% 1/15/28 | 351,000 | 337,808 | |||||
| Mesquite Energy 144A 7.25% 2/15/23 #, † | 122,000 | 1,220 | |||||
| Moss Creek Resources Holdings | |||||||
| 144A 7.50% 1/15/26 # | 601,000 | 525,163 | |||||
| 144A 10.50% 5/15/27 #, * | 33,000 | 30,773 | |||||
| Murphy Oil 6.375% 7/15/28 | 2,427,000 | 2,297,022 | |||||
| NuStar Logistics | |||||||
| 6.00% 6/1/26 | 1,210,000 | 1,110,175 | |||||
| 6.375% 10/1/30 | 1,225,000 | 1,050,892 | |||||
| Petrobras Global Finance 5.60% 1/3/31 * | 500,000 | 455,673 | |||||
| Petroleos Mexicanos 6.70% 2/16/32 | 237,000 | 166,647 | |||||
| Petronas Capital 144A 3.50% 4/21/30 # | 350,000 | 319,742 | |||||
| TransCanada PipeLines 4.25% 5/15/28 | 900,000 | 834,739 | |||||
| 14,529,884 | |||||||
| Financials — 1.23% | |||||||
| Aircastle 4.40% 9/25/23 | 800,000 | 785,689 | |||||
| Corp Inmobiliaria Vesta 144A 3.625% 5/13/31 # | 400,000 | 301,234 | |||||
| Country Garden Holdings 7.25% 4/8/26 | 200,000 | 74,500 | |||||
| First Abu Dhabi Bank 4.50% 4/5/26 µ, Ψ | 200,000 | 187,319 | |||||
| Greenko Mauritius 144A 6.25% 2/21/23 # | 450,000 | 444,375 | |||||
| Highlands Holdings Bond Issuer 144A PIK 7.625% 10/15/25 #, > | 320,897 | 303,244 | |||||
| Logan Group 5.75% 1/14/25 | 200,000 | 32,800 | |||||
| 2,129,161 | |||||||
| Industrials — 0.69% | |||||||
| Adtalem Global Education 144A 5.50% 3/1/28 # | 653,000 | 589,101 | |||||
| Booz Allen Hamilton 144A 3.875% 9/1/28 # | 74,000 | 63,807 | |||||
| InRetail Shopping Malls 144A 5.75% 4/3/28 # | 600,000 | 536,577 | |||||
| 1,189,485 | |||||||
| Insurance — 1.67% | |||||||
| AIA Group 144A 3.375% 4/7/30 # | 200,000 | 177,928 | |||||
| Ardonagh Midco 2 144A PIK 11.50% 1/15/27 #, >> | 850,984 | 868,004 | |||||
| Brown & Brown | |||||||
| 2.375% 3/15/31 * | 34,000 | 25,439 | |||||
| 4.95% 3/17/52 | 121,000 | 98,414 | |||||
| MetLife 10.75% 8/1/69 | 530,000 | 692,358 | |||||
| Sagicor Financial 144A 5.30% 5/13/28 # | 1,100,000 | 1,030,480 | |||||
| 2,892,623 | |||||||
| Real Estate Investment Trusts — 0.36% | |||||||
| American Homes 4 Rent 3.625% 4/15/32 | 105,000 | 86,716 | |||||
| HAT Holdings I 144A 3.375% 6/15/26 # | 87,000 | 69,925 | |||||
| Trust Fibra Uno 144A 4.869% 1/15/30 # | 600,000 | 458,940 | |||||
| 615,581 | |||||||
116
| Principal amount° | Value (US $) | ||||||
| Corporate Bonds (continued) | |||||||
| Technology — 3.21% | |||||||
| Autodesk 2.40% 12/15/31 | 225,000 | $ | 175,387 | ||||
| CDW 3.276% 12/1/28 | 95,000 | 79,458 | |||||
| Consensus Cloud Solutions | |||||||
| 144A 6.00% 10/15/26 # | 97,000 | 86,006 | |||||
| 144A 6.50% 10/15/28 # | 233,000 | 198,225 | |||||
| Entegris Escrow 144A 4.75% 4/15/29 # | 215,000 | 189,861 | |||||
| HCL America 144A 1.375% 3/10/26 # | 750,000 | 657,326 | |||||
| Iron Mountain 144A 5.25% 7/15/30 # | 348,000 | 288,722 | |||||
| Iron Mountain Information Management Services 144A 5.00% 7/15/32 # | 1,065,000 | 825,895 | |||||
| NCR | |||||||
| 144A 5.00% 10/1/28 # | 314,000 | 247,661 | |||||
| 144A 5.125% 4/15/29 # | 1,118,000 | 840,781 | |||||
| 144A 5.25% 10/1/30 # | 106,000 | 80,194 | |||||
| 144A 5.75% 9/1/27 # | 107,000 | 97,208 | |||||
| 144A 6.125% 9/1/29 # | 141,000 | 121,641 | |||||
| Nielsen Finance | |||||||
| 144A 5.625% 10/1/28 # | 285,000 | 283,486 | |||||
| 144A 5.875% 10/1/30 # | 240,000 | 239,544 | |||||
| Sabre GLBL | |||||||
| 144A 7.375% 9/1/25 # | 40,000 | 35,879 | |||||
| 144A 9.25% 4/15/25 # | 102,000 | 97,794 | |||||
| Tencent Holdings 144A 2.985% 1/19/23 # | 1,000,000 | 996,829 | |||||
| 5,541,897 | |||||||
| Transportation — 2.52% | |||||||
| Abertis Infraestructuras Finance 3.248% 11/24/25 µ, Ψ | EUR | 800,000 | 638,390 | ||||
| Adani International Container Terminal 144A 3.00% 2/16/31 # | 192,000 | 147,777 | |||||
| Azul Investments 144A 7.25% 6/15/26 # | 200,000 | 123,613 | |||||
| Babcock International Group 1.375% 9/13/27 | EUR | 1,250,000 | 1,006,811 | ||||
| Burlington Northern Santa Fe | |||||||
| 2.875% 6/15/52 | 180,000 | 118,033 | |||||
| 4.45% 1/15/53 | 65,000 | 56,565 | |||||
| Empresa de Transporte de Pasajeros Metro 144A 3.65% 5/7/30 #, * | 600,000 | 517,355 | |||||
| ENA Master Trust 144A 4.00% 5/19/48 # | 200,000 | 149,381 | |||||
| Grupo Aeromexico 144A 8.50% 3/17/27 # | 1,500,000 | 1,319,774 | |||||
| Lima Metro Line 2 Finance 144A 5.875% 7/5/34 # | 96,012 | 91,227 | |||||
| Rumo Luxembourg 144A 5.25% 1/10/28 # | 200,000 | 181,952 | |||||
| 4,350,878 | |||||||
| Total Corporate Bonds (cost $120,052,687) | 101,982,554 | ||||||
| Municipal Bonds — 0.96% | |||||||
| Commonwealth of Puerto Rico(Restructured) Series A-1 2.986% 7/1/24^ | 31,434 | 28,906 | |||||
| Series A-1 4.00% 7/1/33 | 94,473 | 83,290 | |||||
| Series A-1 4.00% 7/1/35 | 68,614 | 58,822 | |||||
| Series A-1 4.00% 7/1/37 | 72,882 | 59,995 | |||||
| Series A-1 4.362% 7/1/33^ | 121,579 | 67,224 | |||||
| Series A-1 5.625% 7/1/29 | 79,450 | 81,397 | |||||
| GDB Debt Recovery Authority of Puerto Rico 7.50% 8/20/40 | 1,457,999 | 1,283,039 | |||||
| Total Municipal Bonds (cost $1,819,636) | 1,662,673 | ||||||
| Non-Agency Collateralized Mortgage Obligations — 3.17% | |||||||
| Connecticut Avenue Securities Trust Series 2022-R01 1M2 144A 4.181% (SOFR + 1.90%) 12/25/41 #, ● | 3,000,000 | 2,731,889 | |||||
| Series 2022-R02 2M2 144A 5.281% (SOFR + 3.00%) 1/25/42 #, ● | 3,000,000 | 2,738,965 | |||||
| Total Non-Agency Collateralized Mortgage Obligations (cost $6,000,000) | 5,470,854 | ||||||
| Non-Agency Commercial Mortgage-Backed Securities — 0.50% | |||||||
| BANK Series 2022-BNK39 B 3.348% 2/15/55 ● | 600,000 | 477,460 | |||||
| Benchmark Mortgage Trust Series 2020-B21 C 3.458% 12/17/53 ● | 500,000 | 388,589 | |||||
| Total Non-Agency Commercial Mortgage- Backed Securities (cost $956,124) | 866,049 |
117
Schedules of investments
Delaware Ivy Strategic Income Fund
| Principal amount° | Value (US $) | ||||||
| Loan Agreements — 6.39% | |||||||
| Advantage Sales & Marketing Tranche B- 1 7.053% (LIBOR01M + 4.50%) 10/28/27 ● | 1,084,250 | $ | 972,437 | ||||
| Amynta Agency Borrower Tranche B 1st Lien 7.615% (LIBOR01M + 4.50%) 2/28/25 ● | 887,123 | 862,357 | |||||
| Applied Systems 2nd Lien 8.462% (LIBOR03M + 5.50%) 9/19/25 ● | 539,334 | 532,592 | |||||
| Ascent Resources Utica Holdings 2nd Lien 11.455% (LIBOR03M + 9.00%) 11/1/25 ● | 179,000 | 187,950 | |||||
| CNT Holdings I 2nd Lien 9.498% (LIBOR01M + 6.75%) 11/6/28 ● | 375,000 | 357,187 | |||||
| CP Atlas Buyer Tranche B 6.615% (LIBOR01M + 3.75%) 11/23/27 ● | 790,140 | 692,251 | |||||
| Edelman Financial Engines Center 2nd Lien 9.865% (LIBOR01M + 6.75%) 7/20/26 ● | 5,123 | 4,560 | |||||
| Electron Bidco 5.819% (LIBOR01M + 3.00%) 11/1/28 ● | 248,750 | 236,364 | |||||
| Endo Luxembourg Finance I 12.25% (LIBOR03M + 5.00%) 3/27/28 ● | 246,250 | 209,928 | |||||
| Ensemble RCM 6.556% (LIBOR03M + 3.75%) 8/3/26 ● | 245,570 | 240,198 | |||||
| Foresight Energy Tranche A 11.674% (LIBOR03M + 8.00%) 6/30/27 ● | 288,869 | 285,980 | |||||
| Form Technologies Tranche B 7.48% (LIBOR03M + 4.75%) 7/22/25 ● | 1,874,875 | 1,663,952 | |||||
| Frontier Communications Tranche B 7.438% (LIBOR03M + 3.75%) 5/1/28 ● | 246,250 | 230,244 | |||||
| Jones DesLauriers Insurance Management 1st Lien 7.748% (CDOR03M + 4.25%) 3/27/28 ● | 178,419 | 124,642 | |||||
| Jones DesLauriers Insurance Management 1st Lien TBD 3/27/28 X | 783,335 | 544,396 | |||||
| Jones DesLauriers Insurance Management 2nd Lien 10.998% (CDOR03M + 7.50%) 3/26/29 ● | 399,788 | 277,842 | |||||
| Jones DesLauriers Insurance Management 2nd Lien 10.998% (CDOR03M + 7.50%) 3/26/29 ● | 40,212 | 28,091 | |||||
| Lealand Finance Company 6.115% (LIBOR01M + 9.00%) 6/28/24 ● | 17,660 | 11,038 | |||||
| Madison Iaq 6.815% (LIBOR03M + 3.25%) 6/21/28 ● | 246,875 | 228,668 | |||||
| Medline Borrower 6.365% (LIBOR01M + 3.25%) 10/23/28 ● | 248,750 | 229,299 | |||||
| Mileage Plus Holdings 8.777% (LIBOR03M + 5.25%) 6/21/27 ● | 167,975 | 168,905 | |||||
| MLN US HoldCo Tranche B 1st Lien 8.252% (LIBOR03M + 4.50%) 11/30/25 ● | 1,504,128 | 931,619 | |||||
| MLN US HoldCo Tranche B 2nd Lien 12.502% (LIBOR03M + 8.75%) 11/30/26 ● | 534,000 | 200,250 | |||||
| Peraton Tranche B 1st Lien 6.865% (LIBOR01M + 3.75%) 2/1/28 ● | 251,660 | 239,172 | |||||
| Polaris Newco 1st Lien 7.098% (LIBOR03M + 4.00%) 6/2/28 ● | 247,500 | 229,030 | |||||
| Sovos Compliance 1st Lien 7.615% (LIBOR01M + 4.50%) 8/11/28 ● | 248,309 | 237,756 | |||||
| U.S. Renal Care Tranche B 1st Lien 7.563% (LIBOR01M + 5.00%) 6/26/26 ● | 648,310 | 468,079 | |||||
| United Airlines Tranche B 6.533% (LIBOR03M + 3.75%) 4/21/28 ● | 246,250 | 236,054 | |||||
| United PF Holdings 1st Lien 12.174% (LIBOR03M + 8.50%) 12/30/26 ● | 170,520 | 163,699 | |||||
| Verscend Holding Tranche B 7.115% (LIBOR01M + 4.00%) 8/27/25 ● | 246,855 | 240,890 | |||||
| Total Loan Agreements (cost $12,557,917) | 11,035,430 | ||||||
118
| Principal amount° | Value (US $) | ||||||
| Sovereign Bonds — 5.43%D | |||||||
| Brazil — 0.14% | |||||||
| Brazilian Government International Bond 3.75% 9/12/31 * | 300,000 | $ | 242,922 | ||||
| 242,922 | |||||||
| Chile — 0.43% | |||||||
| Chile Government International Bond 2.55% 7/27/33 | 1,000,000 | 750,834 | |||||
| 750,834 | |||||||
| Colombia — 0.27% | |||||||
| Colombia Government International Bonds | |||||||
| 3.125% 4/15/31 | 200,000 | 139,033 | |||||
| 4.50% 3/15/29 | 400,000 | 329,480 | |||||
| 468,513 | |||||||
| Costa Rica — 0.12% | |||||||
| Costa Rica Government International Bond 144A 4.25% 1/26/23 # | 200,000 | 199,979 | |||||
| 199,979 | |||||||
| Dominican Republic — 0.09% | |||||||
| Dominican Republic International Bond 144A 4.875% 9/23/32 # | 200,000 | 151,112 | |||||
| 151,112 | |||||||
| Indonesia — 1.85% | |||||||
| Indonesia Government International Bonds | |||||||
| 2.95% 1/11/23 | 2,400,000 | 2,391,141 | |||||
| 3.85% 10/15/30 * | 900,000 | 809,872 | |||||
| 3,201,013 | |||||||
| Mexico — 0.61% | |||||||
| Mexico Government International Bonds | |||||||
| 3.25% 4/16/30 | 654,000 | 546,913 | |||||
| 3.50% 2/12/34 | 670,000 | 510,783 | |||||
| 1,057,696 | |||||||
| Morocco — 0.24% | |||||||
| Morocco Government International Bond 144A 2.375% 12/15/27 # | 500,000 | 412,040 | |||||
| 412,040 | |||||||
| Panama — 0.50% | |||||||
| Panama Notas del Tesoro 3.75% 4/17/26 | 900,000 | 856,575 | |||||
| 856,575 | |||||||
| Peru — 1.03% | |||||||
| Corp Financiera DE Desarrollo 5.25% 7/15/29 | 200,000 | 189,343 | |||||
| Peruvian Government International Bonds | |||||||
| 2.392% 1/23/26 | 1,000,000 | 908,826 | |||||
| 2.783% 1/23/31 | 850,000 | 675,145 | |||||
| 1,773,314 | |||||||
| Serbia — 0.15% | |||||||
| Serbia International Bond 144A 2.125% 12/1/30 # | 400,000 | 263,144 | |||||
| 263,144 | |||||||
| Total Sovereign Bonds (cost $10,769,851) | 9,377,142 | ||||||
| Supranational Banks — 0.61% | |||||||
| Banco Latinoamericano de Comercio Exterior 144A 2.375% 9/14/25 # | 800,000 | 729,100 | |||||
| Corp Andina de Fomento 2.375% 5/12/23 | 320,000 | 315,948 | |||||
| Total Supranational Banks (cost $1,117,503) | 1,045,048 | ||||||
| US Treasury Obligations — 10.08% | |||||||
| US Treasury Bond 2.875% 5/15/52 | 2,400,000 | 2,013,375 | |||||
| US Treasury Notes | |||||||
| 0.125% 10/31/22 | 1,045,000 | 1,042,900 | |||||
| 2.625% 7/31/29 | 315,000 | 289,529 | |||||
| 2.75% 8/15/32 | 2,975,000 | 2,720,731 | |||||
| 2.875% 5/15/32 | 11,265,000 | 10,417,485 | |||||
| 3.125% 8/31/27 * | 960,000 | 921,000 | |||||
| Total US Treasury Obligations (cost $18,146,354) | 17,405,020 | ||||||
| Number of shares | |||||||
| Common Stocks — 0.70% | |||||||
| Basic Industry — 0.01% | |||||||
| Westmoreland Coal =, † | 7,276 | 18,372 | |||||
| 18,372 | |||||||
| Consumer Cyclical — 0.11% | |||||||
| Studio City International ADR † | 19,076 | 41,776 | |||||
| Studio City International Holdings ADR *, † | 46,303 | 101,404 | |||||
119
Schedules of investments
Delaware Ivy Strategic Income Fund
| Number of shares | Value (US $) | ||||||
| Common Stocks (continued) | |||||||
| Consumer Cyclical (continued) | |||||||
| True Religion Apparel =, † | 2 | $ | 50,940 | ||||
| 194,120 | |||||||
| Energy — 0.57% | |||||||
| Foresight Energy =, † | 42,271 | 628,986 | |||||
| KCA Deutag International = | 5,140 | 354,660 | |||||
| 983,646 | |||||||
| Financials — 0.01% | |||||||
| New Cotai =, † | 414,307 | 0 | |||||
| Riverbed Holdings =, † | 32,302 | 8,075 | |||||
| 8,075 | |||||||
| Total Common Stocks (cost $6,298,072) | 1,204,213 | ||||||
| Preferred Stock — 0.01% | |||||||
| True Religion Apparel 0.000% =, ω | 2 | 11,435 | |||||
| Total Preferred Stock (cost $37,635) | 11,435 | ||||||
| Warrant — 0.01% | |||||||
| California Resources † | 1,368 | 14,227 | |||||
| Total Warrant (cost $119,109) | 14,227 | ||||||
| Short-Term Investments — 3.93% | |||||||
| Money Market Mutual Funds — 3.93% | |||||||
| BlackRock Liquidity FedFund – Institutional Shares (seven-day effective yield 2.76%) | 1,696,092 | 1,696,092 | |||||
| Fidelity Investments Money Market Government Portfolio – Class I (seven-day effective yield 2.74%) | 1,696,092 | 1,696,092 | |||||
| Goldman Sachs Financial Square Government Fund – Institutional Shares (seven-day effective yield 2.98%) | 1,696,092 | 1,696,092 | |||||
| Morgan Stanley Institutional Liquidity Funds Government Portfolio – Institutional Class (seven-day effective yield 2.80%) | 1,696,092 | 1,696,092 | |||||
| Total Short-Term Investments (cost $6,784,368) | 6,784,368 | ||||||
| Total Value of Securities Before Securities Lending Collateral—97.82% (cost $197,692,107) | 168,829,043 | ||||||
| Securities Lending Collateral** — 1.85% | |||||||
| Money Market Mutual Fund — 1.85% | |||||||
| Dreyfus Institutional Preference Government Money Market Fund - Institutional Shares (seven-day effective yield 2.98%) | 3,190,372 | 3,190,372 | |||||
| Total Securities Lending Collateral (cost $3,190,372) | 3,190,372 | ||||||
| Total Value of Securities—99.67% (cost $200,882,479) | $ | 172,019,415■ | |||||
| ° | Principal amount shown is stated in USD unless noted that the security is denominated in another currency. |
| ω | Perpetual security with no stated maturity date. |
| † | Non-income producing security. |
| D | Securities have been classified by country of risk. |
| x | This loan will settle after September 30, 2022, at which time the interest rate, based on the LIBOR and the agreed upon spread on trade date, will be reflected. |
| ^ | Zero-coupon security. The rate shown is the effective yield at the time of purchase. |
| > | PIK. 100% of the income received was in the form of cash. |
| = | The value of this security was determined using significant unobservable inputs and is reported as a Level 3 security in the disclosure table located in Note 3 in “Notes to financial statements.” |
| † | Non-income producing security. Security is currently in default. |
| >>> | PIK. 62.50% of the income received was in cash and 37.50% was in principal. |
| >> | PIK. 100% of the income received was in the form of principal. |
| * | Fully or partially on loan. |
| Ψ | Perpetual security. Maturity date represents next call date. |
| µ | Fixed to variable rate investment. The rate shown reflects the fixed rate in effect at September 30, 2022. Rate will reset at a future date. |
120
| ● | Variable rate investment. Rates reset periodically. Rate shown reflects the rate in effect at September 30, 2022. For securities based on a published reference rate and spread, the reference rate and spread are indicated in their descriptions. The reference rate descriptions (i.e. LIBOR03M, LIBOR06M, etc.) used in this report are identical for different securities, but the underlying reference rates may differ due to the timing of the reset period. Certain variable rate securities are not based on a published reference rate and spread but are determined by the issuer or agent and are based on current market conditions, or for mortgage-backed securities, are impacted by the individual mortgages which are paying off over time. These securities do not indicate a reference rate and spread in their descriptions. |
| # | Security exempt from registration under Rule 144A of the Securities Act of 1933, as amended. At September 30, 2022, the aggregate value of Rule 144A securities was $92,238,703, which represents 53.44% of the Fund’s net assets. See Note 12 in “Notes to financial statements.” |
| ** | See Note 11 in “Notes to financial statements” for additional information on securities lending collateral. |
| ■ | Includes $4,078,638 of securities loaned for which the counterparty pledged additional non-cash collateral valued at $1,064,090. |
The following foreign currency exchange contracts and futures contracts were outstanding at September 30, 2022:1
Foreign Currency Exchange Contracts
| Counterparty | Currency to Receive (Deliver) | In Exchange For | Settlement Date | Unrealized Appreciation | ||||||||||||||
| GSC | EUR | (1,762,784) | USD | 1,802,622 | 11/18/22 | $ | 69,670 | |||||||||||
| TD | CAD | (1,445,000) | USD | 1,120,604 | 11/18/22 | 74,537 | ||||||||||||
| TD | EUR | (1,762,784) | USD | 1,800,940 | 11/18/22 | 67,987 | ||||||||||||
| Total Foreign Currency Exchange Contracts | $ | 212,194 | ||||||||||||||||
Futures Contracts
Exchange-Traded
| Contracts to Buy (Sell) | Notional Amount | Notional Cost (Proceeds) | Expiration Date | Value/ Unrealized Depreciation | Variation Margin Due from (Due to) Brokers | |||||||||||||||
| 106 | US Treasury 5 yr Notes | $ | 11,395,827 | $ | 11,789,132 | 12/30/22 | $ | (393,305 | ) | $ | (28,157 | ) | ||||||||
| 37 | US Treasury 10 yr Ultra Notes | 4,383,922 | 4,640,990 | 12/20/22 | (257,068 | ) | (18,500 | ) | ||||||||||||
| 8 | US Treasury Long Bonds | 1,011,250 | 1,098,020 | 12/20/22 | (86,770 | ) | (5,250 | ) | ||||||||||||
| Total Futures Contracts | $ | 17,528,142 | $ | (737,143 | ) | $ | (51,907 | ) | ||||||||||||
The use of foreign currency exchange contracts and futures contracts involves elements of market risk and risks in excess of the amounts disclosed in the financial statements. The foreign currency exchange contracts and notional amounts presented above represent the Fund’s total exposure in such contracts, whereas only the net unrealized appreciation (depreciation) and variation margin are reflected in the Fund’s net assets.
| 1 | See Note 9 in “Notes to financial statements.” |
Summary of abbreviations:
ADR – American Depositary Receipt
CDOR03M – 3 Month Canadian Dollar Offered Rate
GNMA – Government National Mortgage Association
GSC – Goldman Sachs Bank USA
ICE – Intercontinental Exchange, Inc.
LIBOR – London Interbank Offered Rate
LIBOR01M – ICE LIBOR USD 1 Month
LIBOR03M – ICE LIBOR USD 3 Month
LIBOR06M – ICE LIBOR USD 6 Month
PIK – Payment-in-kind
REMIC – Real Estate Mortgage Investment Conduit
SOFR – Secured Overnight Financing Rate
TBD – To be determined
TD – TD Bank
121
Schedules of investments
Delaware Ivy Strategic Income Fund
Summary of abbreviations: (continued)
yr – Year
Summary of currencies:
CAD – Canadian Dollar
EUR – European Monetary Unit
USD – US Dollar
See accompanying notes, which are an integral part of the financial statements.
122
Delaware Ivy Total Return Bond Fund
September 30, 2022
| Principal amount° | Value (US $) | ||||||
| Agency Mortgage-Backed Securities — 2.98% | |||||||
| Fannie Mae S.F. 20 yr 4.00% 8/1/42 | 113,261 | $ | 106,348 | ||||
| Fannie Mae S.F. 30 yr | |||||||
| 3.50%1/1/52 | 494,661 | 446,404 | |||||
| 5.00%9/1/52 | 608,181 | 593,093 | |||||
| 5.50%10/1/52 | 150,000 | 149,430 | |||||
| Freddie Mac S.F. 15 yr 4.50% 9/1/37 | 193,344 | 190,315 | |||||
| Freddie Mac S.F. 30 yr | |||||||
| 4.00%8/1/52 | 249,334 | 232,010 | |||||
| 4.50%9/1/52 | 312,000 | 298,295 | |||||
| 5.00%7/1/52 | 367,067 | 358,469 | |||||
| Total Agency Mortgage-Backed Securities (cost $2,469,670) | 2,374,364 | ||||||
| Corporate Bonds — 46.00% | |||||||
| Banking — 20.87% | |||||||
| ABN AMRO Bank 2.875% 1/18/28 µ | EUR | 1,300,000 | 1,270,587 | ||||
| Banco Bradesco 144A 4.375% 3/18/27 # | 200,000 | 187,500 | |||||
| Bank of America | |||||||
| 2.551% 2/4/28 µ | 325,000 | 283,067 | |||||
| 2.972% 2/4/33 µ | 240,000 | 187,919 | |||||
| 4.948% 7/22/28 µ | 620,000 | 596,360 | |||||
| 6.125% 4/27/27 *, µ, Ψ | 275,000 | 260,563 | |||||
| Barclays | |||||||
| 2.00% 2/7/28 µ | EUR | 900,000 | 868,700 | ||||
| 5.501% 8/9/28 µ | 360,000 | 337,852 | |||||
| BNP Paribas 2.625% 10/14/27 µ | EUR | 2,200,000 | 2,156,453 | ||||
| BPCE 2.75% 11/30/27 µ | EUR | 500,000 | 489,786 | ||||
| Citigroup 5.61% 9/29/26 µ | 415,000 | 412,999 | |||||
| DBS Group Holdings 1.50% 4/11/28 µ | EUR | 400,000 | 386,122 | ||||
| Deutsche Bank 5.625% 5/19/31 µ | EUR | 400,000 | 373,803 | ||||
| Development Bank of Kazakhstan 144A 10.95% 5/6/26 # | KZT | 100,000,000 | 171,594 | ||||
| Fifth Third Bancorp 4.337% 4/25/33 µ | 270,000 | 239,721 | |||||
| Goldman Sachs Group | |||||||
| 1.542% 9/10/27 µ | 180,000 | 152,254 | |||||
| 3.102% 2/24/33 µ | 125,000 | 99,434 | |||||
| 3.615% 3/15/28 µ | 430,000 | 391,761 | |||||
| Huntington National Bank 4.552% 5/17/28 µ | 250,000 | 240,941 | |||||
| ING Groep | |||||||
| 2.125% 5/26/31 *, µ | EUR | 500,000 | 436,432 | ||||
| 3.00% 4/11/28 µ | EUR | 2,200,000 | 2,138,850 | ||||
| JPMorgan Chase & Co. | |||||||
| 1.953% 2/4/32 µ | 435,000 | 322,387 | |||||
| 4.851% 7/25/28 µ | 360,000 | 346,037 | |||||
| 4.912% 7/25/33 µ | 180,000 | 166,227 | |||||
| KeyCorp 4.789% 6/1/33 µ | 245,000 | 224,989 | |||||
| Morgan Stanley | |||||||
| 2.475% 1/21/28 µ | 240,000 | 210,018 | |||||
| 2.95% 5/7/32 µ | EUR | 500,000 | 433,474 | ||||
| PNC Financial Services Group | |||||||
| 6.00% 5/15/27 *, µ, Ψ | 205,000 | 190,650 | |||||
| 6.20% 9/15/27 µ, Ψ | 645,000 | 611,138 | |||||
| State Street 2.203% 2/7/28 µ | 435,000 | 381,861 | |||||
| SVB Financial Group 4.57% 4/29/33 *, µ | 355,000 | 311,654 | |||||
| Truist Financial 4.916% 7/28/33 µ | 840,000 | 760,287 | |||||
| UBS Group 144A 4.751% 5/12/28 #, µ | 200,000 | 187,989 | |||||
| US Bancorp | |||||||
| 2.215% 1/27/28 *, µ | 260,000 | 229,367 | |||||
| 2.677% 1/27/33 *, µ | 275,000 | 221,385 | |||||
| Wells Fargo & Co. 4.808% 7/25/28 µ | 370,000 | 353,261 | |||||
| 16,633,422 | |||||||
| Basic Industry — 2.19% | |||||||
| Antofagasta 144A 5.625% 5/13/32 # | 200,000 | 185,000 | |||||
| Celanese US Holdings | |||||||
| 6.05% 3/15/25 | 205,000 | 200,449 | |||||
| 6.165% 7/15/27 | 75,000 | 71,076 | |||||
| ELM for Firmenich International 3.75% 9/3/25 µ, Ψ | EUR | 500,000 | 450,982 | ||||
| ICL Group 144A 6.375% 5/31/38 #, * | 333,000 | 319,137 | |||||
| PPG Industries 2.75% 6/1/29 | EUR | 300,000 | 267,129 | ||||
| Westlake 1.625% 7/17/29 | EUR | 344,000 | 253,907 | ||||
| 1,747,680 | |||||||
| Capital Goods — 1.45% | |||||||
| Holcim Finance Luxembourg 0.50% 4/23/31 | EUR | 600,000 | 415,504 | ||||
| Leonardo 2.375% 1/8/26 | EUR | 450,000 | 406,854 | ||||
| Raytheon Technologies 2.15% 5/18/30 | EUR | 150,000 | 128,597 | ||||
123
Schedules of investments
Delaware Ivy Total Return Bond Fund
| Principal amount° | Value (US $) | ||||||
| Corporate Bonds (continued) | |||||||
| Capital Goods (continued) | |||||||
| Verallia 1.875% 11/10/31 | EUR | 300,000 | $ | 201,871 | |||
| 1,152,826 | |||||||
| Communications — 2.42% | |||||||
| Altice France 5.875% 2/1/27 | EUR | 363,000 | 308,564 | ||||
| AT&T 4.25% 6/1/43 | GBP | 176,000 | 146,460 | ||||
| Charter Communications Operating 3.85% 4/1/61 | 75,000 | 43,978 | |||||
| CK Hutchison Group Telecom Finance 1.50% 10/17/31 | EUR | 200,000 | 146,093 | ||||
| CT Trust 144A 5.125% 2/3/32 # | 200,000 | 150,917 | |||||
| Discovery Communications | |||||||
| 4.00%9/15/55 | 130,000 | 76,932 | |||||
| 5.30%5/15/49 | 184,000 | 137,716 | |||||
| Fox 5.576% 1/25/49 | 372,000 | 319,306 | |||||
| Telefonica Emisiones 7.045% 6/20/36 | 145,000 | 142,909 | |||||
| Warnermedia Holdings | |||||||
| 144A 3.755% 3/15/27 # | 295,000 | 264,305 | |||||
| 144A 4.054% 3/15/29 # | 110,000 | 95,137 | |||||
| 144A 4.279% 3/15/32 #, * | 115,000 | 94,756 | |||||
| 1,927,073 | |||||||
| Consumer Cyclical — 2.15% | |||||||
| B2W Digital 144A 4.375% 12/20/30 # | 200,000 | 136,392 | |||||
| BorgWarner 1.00% 5/19/31 | EUR | 600,000 | 420,878 | ||||
| Ford Motor Credit | |||||||
| 2.30% 2/10/25* | 200,000 | 177,483 | |||||
| 2.90% +2/10/29 | 200,000 | 151,844 | |||||
| IHO Verwaltungs PIK 3.875% 5/15/27 > | EUR | 300,000 | 226,625 | ||||
| PVH 3.125% 12/15/27 * | EUR | 340,000 | 294,095 | ||||
| VICI Properties 4.95% 2/15/30 * | 335,000 | 303,455 | |||||
| 1,710,772 | |||||||
| Consumer Non-Cyclical — 1.54% | |||||||
| Anheuser-Busch InBev Worldwide 5.80% 1/23/59 | 365,000 | 349,884 | |||||
| Central American Bottling 144A 5.25% 4/27/29 # | 200,000 | 173,767 | |||||
| CVS Health 5.05% 3/25/48 | 244,000 | 215,453 | |||||
| HCA 5.25% 6/15/49 | 320,000 | 260,981 | |||||
| Picard Groupe 144A 3.875% 7/1/26 # | EUR | 278,000 | 229,215 | ||||
| 1,229,300 | |||||||
| Electric — 3.05% | |||||||
| Duke Energy 2.55% 6/15/31 | 61,000 | 47,924 | |||||
| Enel 1.875% 6/8/30 µ, Ψ | EUR | 600,000 | 388,622 | ||||
| Eversource Energy 2.90% 3/1/27 | 315,000 | 286,294 | |||||
| Fells Point Funding Trust 144A 3.046% 1/31/27 # | 305,000 | 272,130 | |||||
| Iberdrola International 1.874% 1/28/26 µ, Ψ | EUR | 600,000 | 501,894 | ||||
| Southern 1.875% 9/15/81 µ | EUR | 500,000 | 344,400 | ||||
| Vistra Operations | |||||||
| 144A 5.00% 7/31/27 # | 580,000 | 525,181 | |||||
| 144A 5.625% 2/15/27 # | 68,000 | 63,803 | |||||
| 2,430,248 | |||||||
| Energy — 3.18% | |||||||
| BP Capital Markets America 2.721% 1/12/32 * | 550,000 | 447,312 | |||||
| Energean Israel Finance 144A 4.875% 3/30/26 # | 200,000 | 177,500 | |||||
| Energo-Pro 144A 8.50% 2/4/27 # | 200,000 | 186,639 | |||||
| Galaxy Pipeline Assets Bidco | |||||||
| 144A 2.16% 3/31/34 # | 192,172 | 158,400 | |||||
| 2.16%3/31/34 | 192,172 | 158,400 | |||||
| KazTransGas JSC 144A 4.375% 9/26/27 # | 235,000 | 199,750 | |||||
| Raizen Fuels Finance 144A 5.30% 1/20/27 # | 389,000 | 370,077 | |||||
| Thaioil Treasury Center 144A 2.50% 6/18/30 # | 200,000 | 156,683 | |||||
| TotalEnergies 2.708% 5/5/23 µ, Ψ | EUR | 700,000 | 675,296 | ||||
| 2,530,057 | |||||||
| Financials — 0.79% | |||||||
| Aroundtown | |||||||
| 1.45% 7/9/28 * | EUR | 400,000 | 295,115 | ||||
| 1.625% 1/31/28 * | EUR | 200,000 | 153,996 | ||||
| Vonovia Finance 1.125% 9/14/34 | EUR | 300,000 | 181,990 | ||||
| 631,101 | |||||||
| Insurance — 1.42% | |||||||
| Allianz 2.625% 10/30/30 µ, Ψ | EUR | 400,000 | 252,255 | ||||
| Aon 5.00% 9/12/32 | 200,000 | 191,877 | |||||
| AXA 5.125% 7/4/43 *, µ | EUR | 500,000 | 495,002 | ||||
| Sagicor Financial 144A 5.30% 5/13/28 # | 200,000 | 187,360 | |||||
| 1,126,494 | |||||||
124
| Principal amount° | Value (US $) | ||||||
| Corporate Bonds (continued) | |||||||
| Natural Gas — 1.08% | |||||||
| ENN Energy Holdings 144A 4.625% 5/17/27 # | 200,000 | $ | 195,046 | ||||
| Southern Co. Gas Capital 5.15% 9/15/32 | 698,000 | 668,165 | |||||
| 863,211 | |||||||
| Real Estate Investment Trusts — 0.33% | |||||||
| Digital Stout Holding 3.75% 10/17/30 | GBP | 300,000 | 265,634 | ||||
| 265,634 | |||||||
| Technology — 1.97% | |||||||
| Apple 1.125% 5/11/25 | 489,000 | 449,068 | |||||
| Autodesk 2.40% 12/15/31 * | 190,000 | 148,105 | |||||
| CDW 3.276% 12/1/28 | 180,000 | 150,551 | |||||
| Entegris Escrow 144A 4.75% 4/15/29 # | 405,000 | 357,645 | |||||
| PayPal Holdings 4.40% 6/1/32 | 300,000 | 279,894 | |||||
| Workday | |||||||
| 3.70% 4/1/29 | 105,000 | 94,297 | |||||
| 3.80% 4/1/32* | 105,000 | 91,260 | |||||
| 1,570,820 | |||||||
| Transportation — 2.82% | |||||||
| Abertis Infraestructuras 1.875% 3/26/32 | EUR | 300,000 | 228,928 | ||||
| Abertis Infraestructuras Finance 3.248% 11/24/25 µ, Ψ | EUR | 200,000 | 159,597 | ||||
| Autostrade per l’Italia 2.00% 12/4/28 | EUR | 450,000 | 342,308 | ||||
| Babcock International Group 1.375% 9/13/27 | EUR | 300,000 | 241,635 | ||||
| International Consolidated Airlines Group 3.75% 3/25/29 | EUR | 500,000 | 330,767 | ||||
| Mileage Plus Holdings 144A 6.50% 6/20/27 # | 266,000 | 260,850 | |||||
| Rutas 2 and 7 Finance 144A 4.346% 9/30/36 #, ^ | 372,167 | 225,544 | |||||
| Wizz Air Finance 1.35% 1/19/24 | EUR | 500,000 | 457,022 | ||||
| 2,246,651 | |||||||
| Utilities — 0.74% | |||||||
| Duke Energy 3.10% 6/15/28 | EUR | 300,000 | 275,793 | ||||
| Greenko Power II 144A 4.30% 12/13/28 # | 195,500 | 154,201 | |||||
| Sociedad de Transmision Austral 144A 4.00% 1/27/32 # | 200,000 | 162,513 | |||||
| 592,507 | |||||||
| Total Corporate Bonds (cost $44,612,525) | 36,657,796 | ||||||
| Sovereign Bonds — 29.65%D | |||||||
| Albania — 0.18% | |||||||
| Albania Government International Bond 144A 3.50% 11/23/31 # | EUR | 200,000 | 144,114 | ||||
| 144,114 | |||||||
| Angola — 0.37% | |||||||
| Angolan Government International Bond 144A 8.75% 4/14/32 # | 400,000 | 297,660 | |||||
| 297,660 | |||||||
| Armenia — 0.17% | |||||||
| Republic of Armenia International Bond 144A 3.60% 2/2/31 # | 200,000 | 136,220 | |||||
| 136,220 | |||||||
| Bermuda — 0.49% | |||||||
| Bermuda Government International Bonds | |||||||
| 144A 2.375% 8/20/30 # | 250,000 | 200,122 | |||||
| 144A 5.00% 7/15/32 # | 200,000 | 190,400 | |||||
| 390,522 | |||||||
| Canada — 5.20% | |||||||
| Canadian Government Bond 1.00% 6/1/27 | CAD | 6,350,000 | 4,144,061 | ||||
| 4,144,061 | |||||||
| Chile — 0.89% | |||||||
| Chile Government International Bonds | |||||||
| 3.10% 5/7/41 | 282,000 | 191,775 | |||||
| 4.34% 3/7/42 | 647,000 | 513,951 | |||||
| 705,726 | |||||||
| Colombia — 1.21% | |||||||
| Colombia Government International Bonds | |||||||
| 4.125%2/22/42 | 334,000 | 190,735 | |||||
| 4.50%1/28/26 | 400,000 | 367,183 | |||||
| 6.125%1/18/41 | 553,000 | 408,293 | |||||
| 966,211 | |||||||
125
Schedules of investments
Delaware Ivy Total Return Bond Fund
| Principal amount° | Value (US $) | ||||||
| Sovereign BondsD (continued) | |||||||
| Dominican Republic — 0.85% | |||||||
| Dominican Republic International Bonds | |||||||
| 144A 4.50% 1/30/30 # | 400,000 | $ | 316,346 | ||||
| 144A 4.875% 9/23/32 # | 267,000 | 201,735 | |||||
| 6.50% 2/15/48 * | 210,000 | 155,713 | |||||
| 673,794 | |||||||
| Egypt — 0.20% | |||||||
| Egypt Government International Bond 5.25% 10/6/25 | 200,000 | 156,292 | |||||
| 156,292 | |||||||
| Finland — 1.18% | |||||||
| Finland Government Bond 144A 1.375% 4/15/27 # | EUR | 1,000,000 | 939,041 | ||||
| 939,041 | |||||||
| Georgia — 0.21% | |||||||
| Georgia Government International Bond 144A 2.75% 4/22/26 # | 200,000 | 171,021 | |||||
| 171,021 | |||||||
| Germany — 2.52% | |||||||
| Bundesrepublik Deutschland Bundesanleihe | |||||||
| 0.434% 8/15/50 ^ | EUR | 1,450,000 | 798,242 | ||||
| 1.293% 2/15/32 ^ | EUR | 1,500,000 | 1,211,839 | ||||
| 2,010,081 | |||||||
| Honduras — 0.18% | |||||||
| Honduras Government International Bond 144A 5.625% 6/24/30 # | 200,000 | 145,454 | |||||
| 145,454 | |||||||
| Indonesia — 0.91% | |||||||
| Indonesia Government International Bonds | |||||||
| 1.40% 10/30/31 | EUR | 219,000 | 160,356 | ||||
| 3.85% 10/15/30 * | 416,000 | 374,341 | |||||
| 4.65% 9/20/32 | 200,000 | 188,086 | |||||
| 722,783 | |||||||
| Italy — 4.81% | |||||||
| Italy Buoni Poliennali Del Tesoro | |||||||
| 0.35% 2/1/25 | EUR | 2,000,000 | 1,841,240 | ||||
| 144A 0.60% 8/1/31 # | EUR | 2,200,000 | 1,572,612 | ||||
| 0.95% 6/1/32 | EUR | 580,000 | 415,954 | ||||
| 3,829,806 | |||||||
| Ivory Coast — 0.64% | |||||||
| Ivory Coast Government International Bonds | |||||||
| 4.875% 1/30/32 | EUR | 390,000 | 257,331 | ||||
| 5.875% 10/17/31 | EUR | 350,000 | 249,087 | ||||
| 506,418 | |||||||
| Kazakhstan — 0.19% | |||||||
| Kazakhstan Government International Bond 4.875%10/14/44 | 200,000 | 155,267 | |||||
| 155,267 | |||||||
| Morocco — 0.70% | |||||||
| Morocco Government International Bonds | |||||||
| 4.00%12/15/50 | 590,000 | 339,126 | |||||
| 5.50%12/11/42 | 300,000 | 222,000 | |||||
| 561,126 | |||||||
| Netherlands — 0.44% | |||||||
| Netherlands Government Bond 144A 0.50% 7/15/32 # | EUR | 430,000 | 351,340 | ||||
| 351,340 | |||||||
| Norway — 1.39% | |||||||
| Norway Government Bond 144A 3.50% 10/6/42 # | NOK | 11,870,000 | 1,109,109 | ||||
| 1,109,109 | |||||||
| Pakistan — 0.09% | |||||||
| Pakistan Water & Power Development Authority 7.50% 6/4/31 | 200,000 | 71,026 | |||||
| 71,026 | |||||||
| Paraguay — 0.95% | |||||||
| Paraguay Government International Bonds | |||||||
| 144A 2.739% 1/29/33 # | 278,000 | 200,997 | |||||
| 144A 4.95% 4/28/31 # | 625,000 | 558,402 | |||||
| 759,399 | |||||||
| Peru — 1.05% | |||||||
| Peruvian Government International Bond 2.392% 1/23/26 | 919,000 | 835,211 | |||||
| 835,211 | |||||||
| Philippines — 0.34% | |||||||
| Philippine Government International Bond 0.25% 4/28/25 | EUR | 304,000 | 273,376 | ||||
| 273,376 | |||||||
126
| Principal amount° | Value (US $) | ||||||
| Sovereign BondsD (continued) | |||||||
| Republic of North Macedonia — 0.24% | |||||||
| North Macedonia Government International Bond 144A 1.625% 3/10/28 # | EUR | 262,000 | $ | 191,848 | |||
| 191,848 | |||||||
| Senegal — 0.19% | |||||||
| Senegal Government International Bond 6.25% 5/23/33 | 200,000 | 150,907 | |||||
| 150,907 | |||||||
| South Africa — 1.01% | |||||||
| Republic of South Africa Government International Bonds | |||||||
| 5.75%9/30/49 | 310,000 | 200,245 | |||||
| 5.875%6/22/30 | 700,000 | 604,625 | |||||
| 804,870 | |||||||
| Spain — 0.67% | |||||||
| Spain Government Bonds | |||||||
| 144A 1.00% 10/31/50 # | EUR | 120,000 | 64,074 | ||||
| 144A 3.45% 7/30/43 # | EUR | 490,000 | 466,524 | ||||
| 530,598 | |||||||
| United Kingdom — 1.28% | |||||||
| United Kingdom Gilt | |||||||
| 0.25% 7/31/31 | GBP | 600,000 | 478,116 | ||||
| 1.50% 7/31/53 | GBP | 820,000 | 543,757 | ||||
| 1,021,873 | |||||||
| Uzbekistan — 1.10% | |||||||
| Republic of Uzbekistan International Bonds | |||||||
| 3.90%10/19/31 | 625,000 | 440,313 | |||||
| 5.375%2/20/29 | 519,000 | 436,552 | |||||
| 876,865 | |||||||
| Total Sovereign Bonds (cost $29,384,306) | 23,632,019 | ||||||
| Supranational Banks — 2.02% | |||||||
| Banque Ouest Africaine de Developpement | |||||||
| 4.70%10/22/31 | 200,000 | 161,720 | |||||
| 5.00%7/27/27 | 200,000 | 183,510 | |||||
| European Investment Bank 5.50% 1/23/23 | MXN | 5,356,000 | 259,217 | ||||
| European Union 1.00% 7/6/32 | EUR | 1,230,000 | 1,008,561 | ||||
| Total Supranational Banks (cost $1,835,550) | 1,613,008 | ||||||
| US Treasury Obligations — 14.64% | |||||||
| US Treasury Floating Rate Note 3.403% (USBMMY3M + 0.035%) 10/31/23 ● | 3,215,000 | 3,218,403 | |||||
| US Treasury Notes | |||||||
| 0.25%8/31/25 | 5,300,000 | 4,722,176 | |||||
| 2.875%5/15/32 | 4,030,000 | 3,726,805 | |||||
| Total US Treasury Obligations (cost $12,415,597) | 11,667,384 | ||||||
| Number of contracts | |||||||
| Options Purchased — 0.19% | |||||||
| Foreign Currency Put Option — 0.04% | |||||||
| EUR versus JPY , strike price $128 EUR, expiration date 5/23/23, notional amount $240,000,000 (JPMCB) | 1,875,000 | 29,432 | |||||
| Notional amount | |||||||
| Put Swaptions — 0.15% | |||||||
| CDX.NA.IG 38 5 yr strike price $85, expiration date 10/19/22 (JPMCB) | 17,800,000 | 122,191 | |||||
| Total Options Purchased (cost $84,492) | 151,623 | ||||||
| Total Value of Securities Before Securities Lending Collateral and Options Written—95.48% (cost $90,802,140) | 76,096,194■ | ||||||
| Number of shares | |||||||
| Securities Lending Collateral** — 3.51% | |||||||
| Money Market Mutual Fund — 3.51% | |||||||
| Dreyfus Institutional Preference Government Money Market Fund - Institutional Shares (seven-day effective yield 2.98%) | 2,792,984 | 2,792,984 | |||||
| Total Securities Lending Collateral (cost $2,792,984) | 2,792,984 | ||||||
127
Schedules of investments
Delaware Ivy Total Return Bond Fund
| Number of contracts | Value (US $) | |||||||
| Options Written — (0.08%) | ||||||||
| Foreign Currency Call Option — (0.02%) | ||||||||
| EUR versus JPY, strike price $118 EUR, expiration date 5/23/23, notional amount $(221,250,000) (JPMCB) | (1,875,000 | ) | $ | (13,226 | ) | |||
| Notional amount | ||||||||
| Call Swaptions — (0.06%) | ||||||||
| CDX.NA.IG 38 5 yr strike price $100, expiration date 10/19/22 (JPMCB) | (17,800,000 | ) | (48,166 | ) | ||||
| Total Options Written (premium received $40,830) | (61,392 | ) | ||||||
| ° | Principal amount shown is stated in USD unless noted that the security is denominated in another currency. |
| µ | Fixed to variable rate investment. The rate shown reflects the fixed rate in effect at September 30, 2022. Rate will reset at a future date. |
| # | Security exempt from registration under Rule 144A of the Securities Act of 1933, as amended. At September 30, 2022, the aggregate value of Rule 144A securities was $13,106,050, which represents 16.44% of the Fund’s net assets. See Note 12 in “Notes to financial statements.” |
| * | Fully or partially on loan. |
| Ψ | Perpetual security. Maturity date represents next call date. |
| > | PIK. 100% of the income received was in the form of cash. |
| ^ | Zero-coupon security. The rate shown is the effective yield at the time of purchase. |
| D | Securities have been classified by country of risk. |
| ● | Variable rate investment. Rates reset periodically. Rate shown reflects the rate in effect at September 30, 2022. For securities based on a published reference rate and spread, the reference rate and spread are indicated in their descriptions. The reference rate descriptions (i.e. LIBOR03M, LIBOR06M, etc.) used in this report are identical for different securities, but the underlying reference rates may differ due to the timing of the reset period. Certain variable rate securities are not based on a published reference rate and spread but are determined by the issuer or agent and are based on current market conditions, or for mortgage-backed securities, are impacted by the individual mortgages which are paying off over time. These securities do not indicate a reference rate and spread in their descriptions. |
| ■ | Includes $4,535,602 of securities loaned for which the counterparty pledged additional non-cash collateral valued at $2,117,668. |
| ** | See Note 11 in “Notes to financial statements” for additional information on securities lending collateral. |
128
The following foreign currency exchange contracts and futures contracts were outstanding at September 30, 2022:1
Foreign Currency Exchange Contracts
| Counterparty | Currency to Receive (Deliver) | In Exchange For | Settlement Date | Unrealized Appreciation | Unrealized Depreciation | |||||||||||||||||
| GSC | AUD | 1,320,000 | USD | (928,214 | ) | 11/18/22 | $ | — | $ | (78,929 | ) | |||||||||||
| GSC | EUR | (21,900,925 | ) | USD | 22,395,885 | 11/18/22 | 865,579 | — | ||||||||||||||
| JPMCB | CLP | 222,655,500 | USD | (246,303 | ) | 11/18/22 | — | (18,276 | ) | |||||||||||||
| JPMCB | EUR | (1,926,000 | ) | USD | 1,946,067 | 11/18/22 | 51,875 | — | ||||||||||||||
| JPMCB | GBP | (30,000 | ) | USD | 36,202 | 11/18/22 | 2,681 | — | ||||||||||||||
| JPMCB | MXN | (5,678,167 | ) | USD | 277,444 | 11/18/22 | — | (1,891 | ) | |||||||||||||
| TD | CAD | (5,876,083 | ) | USD | 4,556,931 | 11/18/22 | 303,104 | — | ||||||||||||||
| TD | EUR | (21,245,925 | ) | USD | 21,704,795 | 11/18/22 | 818,405 | — | ||||||||||||||
| TD | EUR | 1,848,000 | GBP | (1,879,508 | ) | 11/18/22 | — | (62,027 | ) | |||||||||||||
| TD | EUR | 9,970,066 | NOK | (10,129,587 | ) | 11/18/22 | — | (324,169 | ) | |||||||||||||
| TD | GBP | (425,802 | ) | USD | 515,107 | 11/18/22 | 39,434 | — | ||||||||||||||
| TD | GBP | (1,564,227 | ) | EUR | 1,879,508 | 11/18/22 | 131,678 | — | ||||||||||||||
| TD | JPY | 72,309,120 | USD | (541,684 | ) | 11/18/22 | — | (39,593 | ) | |||||||||||||
| TD | NOK | 98,777,582 | USD | (10,193,443 | ) | 11/18/22 | — | (1,113,836 | ) | |||||||||||||
| TD | NOK | (98,818,177 | ) | EUR | 10,129,587 | 11/18/22 | 1,046,250 | — | ||||||||||||||
| Total Foreign Currency Exchange Contracts | $ | 3,259,006 | $ | (1,638,721 | ) | |||||||||||||||||
Futures Contracts
Exchange-Traded
| Contracts to Buy (Sell) | Notional Amount | Notional Cost (Proceeds) | Expiration Date | Value/ Unrealized Appreciation | Value/ Unrealized Depreciation | Variation Margin Due from (Due to) Brokers | ||||||||||||||||||
| 45 | Australian Treasury 10 yr Bonds | $ | 3,371,110 | $ | 3,456,957 | 12/15/22 | $ | — | $ | (85,847 | ) | $ | 15,828 | |||||||||||
| 1 | Canadian Treasury 10yr Bonds | 89,470 | 90,638 | 12/19/22 | — | (1,168 | ) | 10 | ||||||||||||||||
| (51) | Euro-Bobl | (5,985,411 | ) | (6,157,256 | ) | 12/8/22 | 171,845 | — | (29,510 | ) | ||||||||||||||
| (35) | Euro-BTP | (3,841,110 | ) | (4,024,903 | ) | 12/8/22 | 183,793 | — | (39,470 | ) | ||||||||||||||
| 6 | Euro-Bund | 814,363 | 857,359 | 12/8/22 | — | (42,996 | ) | 5,826 | ||||||||||||||||
| (17) | Euro-Buxl | (2,443,147 | ) | (2,671,694 | ) | 12/8/22 | 228,547 | — | (18,685 | ) | ||||||||||||||
| (18) | Euro-Oat | (2,330,715 | ) | (2,452,757 | ) | 12/8/22 | 122,042 | — | (16,067 | ) | ||||||||||||||
| (83) | Euro-Schatz | (8,717,246 | ) | (8,806,112 | ) | 12/8/22 | 88,866 | — | (14,652 | ) | ||||||||||||||
| 21 | Long 10 yr Gilt | 2,260,344 | 2,578,794 | 12/28/22 | — | (318,450 | ) | (5,379 | ) | |||||||||||||||
| 23 | Short Euro-BTP | 2,374,034 | 2,406,085 | 12/8/22 | — | (32,051 | ) | 8,570 | ||||||||||||||||
| 10 | US Treasury 2 yr Notes | 2,053,906 | 2,086,195 | 12/30/22 | — | (32,289 | ) | (1,484 | ) | |||||||||||||||
| 12 | US Treasury 3 yr Notes | 2,505,188 | 2,565,122 | 12/30/22 | — | (59,934 | ) | (3,469 | ) | |||||||||||||||
| 31 | US Treasury 5 yr Notes | 3,332,742 | 3,406,105 | 12/30/22 | — | (73,363 | ) | (8,235 | ) | |||||||||||||||
| 101 | US Treasury 10 yr Notes | 11,318,313 | 11,805,501 | 12/20/22 | — | (487,188 | ) | (39,454 | ) | |||||||||||||||
| 27 | US Treasury 10 yr Ultra Notes | 3,199,078 | 3,298,066 | 12/20/22 | — | (98,988 | ) | (13,500 | ) | |||||||||||||||
| (27) | US Treasury Ultra Bonds | (3,699,000 | ) | (3,988,548 | ) | 12/20/22 | 289,548 | — | 43,875 | |||||||||||||||
| Total Futures Contracts | $ | 4,449,552 | $ | 1,084,641 | $ | (1,232,274 | ) | $ | (115,796 | ) | ||||||||||||||
129
Schedules of investments
Delaware Ivy Total Return Bond Fund
The use of foreign currency exchange contracts and futures contracts involves elements of market risk and risks in excess of the amounts disclosed in these financial statements. The foreign currency exchange contracts and notional amounts presented above represent the Fund’s total exposure in such contracts, whereas only the net unrealized appreciation (depreciation) and variation margin are reflected in the Fund’s net assets.
1See Note 9 in “Notes to financial statements.”
Summary of abbreviations:
BTP – Buoni del Tesoro Poliennali
CDX.NA.IG – Credit Default Swap Index North America Investment Grade
GSC – Goldman Sachs Bank USA
ICE – Intercontinental Exchange, Inc.
JPMCB – JPMorgan Chase Bank
JSC – Joint Stock Company
LIBOR – London Interbank Offered Rate
LIBOR03M – ICE LIBOR USD 3 Month
LIBOR06M – ICE LIBOR USD 6 Month
PIK – Payment-in-kind
S.F. – Single Family
TD – TD Bank
USBMMY3M – US Treasury 3 Month Bill Money Market Yield
yr – Year
Summary of currencies:
AUD – Australian Dollar
CAD – Canadian Dollar
CLP – Chilean Peso
EUR – European Monetary Unit
GBP – British Pound Sterling
JPY – Japanese Yen
KZT – Kazakhstani Tenge
MXN – Mexican Peso
NOK – Norwegian Krone
USD – US Dollar
See accompanying notes, which are an integral part of the financial statements.
130
Statements of assets and liabilities
Ivy Funds
September 30, 2022
| Delaware Ivy California Municipal High Income Fund | Delaware Ivy Corporate Bond FundΦ | Delaware Ivy Crossover Credit Fund | Delaware Ivy Emerging Markets Local Currency Debt Fund | |||||||||||||
| Assets: | ||||||||||||||||
| Investments, at value*,† | $ | 17,041,791 | $ | 411,200,349 | $ | 17,323,908 | $ | 21,542,346 | ||||||||
| Short-term investments held as collateral for loaned securities, at value= | — | 1,749,532 | 105,650 | 450,886 | ||||||||||||
| Cash | 512 | 94 | 1,905 | — | ||||||||||||
| Foreign currencies, at valueD | — | — | — | 480,622 | ||||||||||||
| Dividends and interest receivable | 199,974 | 3,867,066 | 158,964 | 363,759 | ||||||||||||
| Receivable for fund shares sold | 50,376 | 735,622 | 21,490 | 2,485 | ||||||||||||
| Receivable for securities sold | 36,070 | 2,560,154 | 21,634 | 3,203 | ||||||||||||
| Receivable from investment manager | 5,916 | — | 6,051 | 89,428 | ||||||||||||
| Prepaid expenses | 2,104 | 1,366 | 11,920 | 4,149 | ||||||||||||
| Foreign tax reclaims receivable | — | — | — | 36,945 | ||||||||||||
| Unrealized appreciation on foreign currency exchange contracts | — | — | — | 63,024 | ||||||||||||
| Securities lending income receivable | — | 1,998 | 212 | 35 | ||||||||||||
| Other assets | — | 13,368 | — | — | ||||||||||||
| Total Assets | 17,336,743 | 420,129,549 | 17,651,734 | 23,036,882 | ||||||||||||
| Liabilities: | ||||||||||||||||
| Due to custodian | — | — | — | 301 | ||||||||||||
| Payable for fund shares redeemed | 71,445 | 1,307,909 | 112,851 | 24,325 | ||||||||||||
| Other accrued expenses | 37,510 | 515,634 | 64,446 | 83,605 | ||||||||||||
| Payable for securities purchased | 34,343 | 1,473,873 | 59,752 | — | ||||||||||||
| Distribution payable | 4,135 | — | — | — | ||||||||||||
| Distribution fees payable to affiliates | 2,491 | 46,670 | 1,080 | 347 | ||||||||||||
| Administration expenses payable to affiliates | 1,954 | 63,415 | 3,585 | 5,358 | ||||||||||||
| Obligation to return securities lending collateral | — | 1,749,532 | 105,650 | 450,886 | ||||||||||||
| Investment management fees payable to affiliates | — | 171,329 | — | — | ||||||||||||
| Unrealized depreciation on foreign currency exchange contracts | — | — | — | 106,793 | ||||||||||||
| Cash collateral due to brokers | — | — | — | 16,786 | ||||||||||||
| Total Liabilities | 151,878 | 5,328,362 | 347,364 | 688,401 | ||||||||||||
| Total Net Assets | $ | 17,184,865 | $ | 414,801,187 | $ | 17,304,370 | $ | 22,348,481 | ||||||||
| Net Assets Consist of: | ||||||||||||||||
| Paid-in capital | $ | 18,737,978 | $ | 528,111,476 | $ | 24,264,973 | $ | 33,276,182 | ||||||||
| Total distributable earnings (loss) | (1,553,113 | ) | (113,310,289 | ) | (6,960,603 | ) | (10,927,701 | ) | ||||||||
| Total Net Assets | $ | 17,184,865 | $ | 414,801,187 | $ | 17,304,370 | $ | 22,348,481 | ||||||||
131
Statements of assets and liabilities
Ivy Funds
| Delaware Ivy California Municipal High Income Fund | Delaware Ivy Corporate Bond FundΦ | Delaware Ivy Crossover Credit Fund | Delaware Ivy Emerging Markets Local Currency Debt Fund | |||||||||||||
| Net Asset Value | ||||||||||||||||
| Class A: | ||||||||||||||||
| Net assets | $ | 9,572,407 | $ | 210,465,885 | $ | 3,923,925 | $ | 1,164,781 | ||||||||
| Shares of beneficial interest outstanding, unlimited authorization, no par | 1,075,210 | 14,001,723 | 484,936 | 170,352 | ||||||||||||
| Net asset value per share | $ | 8.90 | $ | 15.03 | $ | 8.09 | $ | 6.84 | ||||||||
| Sales charge | 4.50 | % | 4.50 | % | 4.50 | % | 4.50 | % | ||||||||
| Offering price per share, equal to net asset value per share / (1 - sales charge) | $ | 9.32 | $ | 15.74 | $ | 8.47 | $ | 7.16 | ||||||||
| Class C: | ||||||||||||||||
| Net assets | $ | 381,349 | $ | 1,271,431 | $ | — | $ | 61,357 | ||||||||
| Shares of beneficial interest outstanding, unlimited authorization, no par | 42,835 | 84,727 | — | 9,355 | ||||||||||||
| Net asset value per share | $ | 8.90 | $ | 15.01 | $ | — | $ | 6.56 | ||||||||
| Class I: | ||||||||||||||||
| Net assets | $ | 7,154,375 | $ | 202,864,434 | $ | 12,426,981 | $ | 7,251,573 | ||||||||
| Shares of beneficial interest outstanding, unlimited authorization, no par | 803,757 | 13,485,688 | 1,536,624 | 1,040,806 | ||||||||||||
| Net asset value per share | $ | 8.90 | $ | 15.04 | $ | 8.09 | $ | 6.97 | ||||||||
| Class R6: | ||||||||||||||||
| Net assets | $ | — | $ | — | $ | — | $ | 13,672,503 | ||||||||
| Shares of beneficial interest outstanding, unlimited authorization, no par | — | — | — | 1,963,387 | ||||||||||||
| Net asset value per share | $ | — | $ | — | $ | — | $ | 6.96 | ||||||||
| Class Y: | ||||||||||||||||
| Net assets | $ | 76,734 | $ | 199,437 | $ | 953,464 | $ | 198,267 | ||||||||
| Shares of beneficial interest outstanding, unlimited authorization, no par | 8,618 | 13,270 | 117,934 | 28,973 | ||||||||||||
| Net asset value per share | $ | 8.90 | $ | 15.03 | $ | 8.08 | $ | 6.84 | ||||||||
| *Investments, at cost | $ | 18,754,435 | $ | 492,320,208 | $ | 21,427,014 | $ | 26,612,838 | ||||||||
| †Including securities on loan | — | 20,187,804 | 542,102 | 393,866 | ||||||||||||
| =Short-term investments held as collateral for loaned securities, at cost | — | 1,749,532 | 105,650 | 450,886 | ||||||||||||
| DForeign currencies, at cost | — | — | — | 462,093 | ||||||||||||
ΦOn September 9, 2022, the Fund declared a 3 for 1 reverse stock split. The shares of beneficial interest outstanding, net asset value per share and offering price per shares have reflected the reverse stock split.
See accompanying notes, which are an integral part of the financial statements.
132
| Delaware Ivy Government Securities Fund | Delaware Ivy High Yield Fund | Delaware Ivy International Small Cap Fund | Delaware Ivy Multi-Asset Income Fund | |||||||||||||
| Assets: | ||||||||||||||||
| Investments, at value*,† | $ | 185,980,270 | $ | 42,404,579 | $ | 36,928,985 | $ | 156,716,733 | ||||||||
| Investments of affiliated issuers, at value** | — | — | — | 340,012 | ||||||||||||
| Short-term investments held as collateral for loaned securities, at value= | 9,577,154 | 939,990 | 1,975,383 | 5,826,401 | ||||||||||||
| Cash | 4,679,842 | 1,290 | 34,978 | 177,948 | ||||||||||||
| Cash collateral due from brokers | — | — | — | 17,380 | ||||||||||||
| Foreign currencies, at valueD | — | — | 337,730 | 66,529 | ||||||||||||
| Dividends and interest receivable | 881,486 | 776,924 | 116,511 | 1,703,349 | ||||||||||||
| Receivable for securities sold | 557,775 | 90,746 | 519,024 | 1,777,998 | ||||||||||||
| Receivable for fund shares sold | 260,289 | 45,864 | 30,319 | 222,364 | ||||||||||||
| Securities lending income receivable | 5,583 | — | — | 13,178 | ||||||||||||
| Prepaid expenses | 1,718 | 996 | 1,264 | 4,905 | ||||||||||||
| Foreign tax reclaims receivable | — | — | 97,294 | 140,050 | ||||||||||||
| Unrealized appreciation on foreign currency exchange contracts | — | — | 10 | 52,225 | ||||||||||||
| Other assets | 10,194 | — | — | — | ||||||||||||
| Total Assets | 201,954,311 | 44,260,389 | 40,041,498 | 167,059,072 | ||||||||||||
| Liabilities: | ||||||||||||||||
| Obligation to return securities lending collateral | 9,577,154 | 939,990 | 1,975,383 | 5,826,401 | ||||||||||||
| Payable for securities purchased | 5,239,889 | 144,781 | 694,293 | 47,581 | ||||||||||||
| Payable for fund shares redeemed | 468,986 | 161,318 | 124,817 | 645,307 | ||||||||||||
| Other accrued expenses | 247,841 | 70,783 | 113,453 | 186,809 | ||||||||||||
| Investment management fees payable to affiliates | 68,897 | 12,671 | 9,913 | 75,331 | ||||||||||||
| Administration expenses payable to affiliates | 26,581 | 9,101 | 9,438 | 20,350 | ||||||||||||
| Distribution fees payable to affiliates | 12,238 | 2,156 | 1,008 | 16,874 | ||||||||||||
| Distribution payable | 458 | — | — | — | ||||||||||||
| Unrealized depreciation on foreign currency exchange contracts | — | — | 10,182 | 573 | ||||||||||||
| Variation margin due to broker on futures contracts | — | — | — | 2,688 | ||||||||||||
| Capital gains tax payable | — | — | 102,320 | — | ||||||||||||
| Total Liabilities | 15,642,044 | 1,340,800 | 3,040,807 | 6,821,914 | ||||||||||||
| Total Net Assets | $ | 186,312,267 | $ | 42,919,589 | $ | 37,000,691 | $ | 160,237,158 | ||||||||
| Net Assets Consist of: | ||||||||||||||||
| Paid-in capital | $ | 227,244,533 | $ | 55,549,914 | $ | 42,382,594 | $ | 183,808,545 | ||||||||
| Total distributable earnings (loss) | (40,932,266 | ) | (12,630,325 | ) | (5,381,903 | ) | (23,571,387 | ) | ||||||||
| Total Net Assets | $ | 186,312,267 | $ | 42,919,589 | $ | 37,000,691 | $ | 160,237,158 | ||||||||
133
Statements of assets and liabilities
Ivy Funds
| Delaware Ivy Government Securities Fund | Delaware Ivy High Yield Fund | Delaware Ivy International Small Cap Fund | Delaware Ivy Multi-Asset Income Fund | |||||||||||||
| Net Asset Value | ||||||||||||||||
| Class A: | ||||||||||||||||
| Net assets | $ | 55,335,576 | $ | 9,968,490 | $ | 3,285,162 | $ | 56,948,525 | ||||||||
| Shares of beneficial interest outstanding, unlimited authorization, no par | 11,527,529 | 1,252,827 | 386,776 | 6,398,778 | ||||||||||||
| Net asset value per share | $ | 4.80 | $ | 7.96 | $ | 8.49 | $ | 8.90 | ||||||||
| Sales charge | 4.50 | % | 4.50 | % | 5.75 | % | 5.75 | % | ||||||||
| Offering price per share, equal to net asset value per share / (1 - sales charge) | $ | 5.03 | $ | 8.34 | $ | 9.01 | $ | 9.44 | ||||||||
| Class C: | ||||||||||||||||
| Net assets | $ | 753,863 | $ | — | $ | 217,089 | $ | 4,909,278 | ||||||||
| Shares of beneficial interest outstanding, unlimited authorization, no par | 157,014 | — | 25,997 | 551,291 | ||||||||||||
| Net asset value per share | $ | 4.80 | $ | — | $ | 8.35 | $ | 8.91 | ||||||||
| Class I: | ||||||||||||||||
| Net assets | $ | 101,424,481 | $ | 32,937,612 | $ | 12,837,914 | $ | 97,267,580 | ||||||||
| Shares of beneficial interest outstanding, unlimited authorization, no par | 21,129,077 | 4,136,800 | 1,503,389 | 10,926,306 | ||||||||||||
| Net asset value per share | $ | 4.80 | $ | 7.96 | $ | 8.54 | $ | 8.90 | ||||||||
| Class R6: | ||||||||||||||||
| Net assets | $ | 28,798,347 | $ | 13,487 | $ | 20,650,491 | $ | 1,023,799 | ||||||||
| Shares of beneficial interest outstanding, unlimited authorization, no par | 5,998,930 | 1,683 | 2,419,725 | 115,000 | ||||||||||||
| Net asset value per share | $ | 4.80 | $ | 8.01 | $ | 8.53 | $ | 8.90 | ||||||||
| Class Y: | ||||||||||||||||
| Net assets | $ | — | $ | — | $ | 10,035 | $ | 87,976 | ||||||||
| Shares of beneficial interest outstanding, unlimited authorization, no par | — | — | 1,182 | 9,883 | ||||||||||||
| Net asset value per share | $ | — | $ | — | $ | 8.49 | $ | 8.90 | ||||||||
| *Investments, at cost | $ | 201,238,699 | $ | 49,711,364 | $ | 43,885,395 | $ | 187,014,457 | ||||||||
| **Investments of affiliated issuers, at cost | — | — | — | 3,119,804 | ||||||||||||
| †Including securities on loan | 12,401,276 | 2,965,614 | 3,581,957 | 11,251,357 | ||||||||||||
| =Short-term investments held as collateral for loaned securities, at cost | 9,577,154 | 939,990 | 1,975,383 | 5,826,401 | ||||||||||||
| DForeign currencies, at cost | — | — | 338,792 | 61,825 | ||||||||||||
See accompanying notes, which are an integral part of the financial statements.
134
| Delaware Ivy Strategic Income Fund | Delaware Ivy Total Return Bond Fund | |||||||
| Assets: | ||||||||
| Investments, at value*,† | $ | 168,829,043 | $ | 76,096,194 | ||||
| Short-term investments held as collateral for loaned securities, at value= | 3,190,372 | 2,792,984 | ||||||
| Cash | 285,286 | 2,426,776 | ||||||
| Cash collateral due from brokers | 320,265 | 984,947 | ||||||
| Foreign currencies, at valueD | 74,063 | 1,103,778 | ||||||
| Dividends and interest receivable | 2,574,645 | 751,768 | ||||||
| Receivable for securities sold | 1,473,520 | 106,472 | ||||||
| Unrealized appreciation on foreign currency exchange contracts | 212,194 | 3,259,006 | ||||||
| Receivable for fund shares sold | 94,961 | 64,281 | ||||||
| Securities lending income receivable | 10,616 | 1,755 | ||||||
| Foreign tax reclaims receivable | 1,069 | — | ||||||
| Prepaid expenses | 464 | 23,888 | ||||||
| Receivable from investment manager | — | 86,089 | ||||||
| Total Assets | 177,066,498 | 87,697,938 | ||||||
| Liabilities: | ||||||||
| Options written, at value∑ | — | 61,392 | ||||||
| Obligation to return securities lending collateral | 3,190,372 | 2,792,984 | ||||||
| Payable for fund shares redeemed | 909,600 | 216,215 | ||||||
| Other accrued expenses | 215,667 | 47,270 | ||||||
| Investment management fees payable to affiliates | 69,820 | — | ||||||
| Variation margin due to broker on futures contracts | 51,907 | 115,796 | ||||||
| Administration expenses payable to affiliates | 26,653 | 14,603 | ||||||
| Distribution fees payable to affiliates | 14,244 | 1,826 | ||||||
| Payable for securities purchased | — | 1,078,024 | ||||||
| Unrealized depreciation on foreign currency exchange contracts | — | 1,638,721 | ||||||
| Cash collateral due to brokers | — | 2,032,922 | ||||||
| Total Liabilities | 4,478,263 | 7,999,753 | ||||||
| Total Net Assets | $ | 172,588,235 | $ | 79,698,185 | ||||
| Net Assets Consist of: | ||||||||
| Paid-in capital | $ | 216,696,871 | $ | 97,054,775 | ||||
| Total distributable earnings (loss) | (44,108,636 | ) | (17,356,590 | ) | ||||
| Total Net Assets | $ | 172,588,235 | $ | 79,698,185 | ||||
135
Statements of assets and liabilities
Ivy Funds
| Delaware Ivy Strategic Income Fund | Delaware Ivy Total Return Bond Fund | |||||||
| Net Asset Value | ||||||||
| Class A: | ||||||||
| Net assets | $ | 54,644,582 | $ | 7,125,180 | ||||
| Shares of beneficial interest outstanding, unlimited authorization, no par | 6,478,700 | 839,463 | ||||||
| Net asset value per share | $ | 8.43 | $ | 8.49 | ||||
| Sales charge | 4.50 | % | 4.50 | % | ||||
| Offering price per share, equal to net asset value per share / (1 - sales charge) | $ | 8.83 | $ | 8.89 | ||||
| Class C: | ||||||||
| Net assets | $ | 2,646,724 | $ | 348,078 | ||||
| Shares of beneficial interest outstanding, unlimited authorization, no par | 313,836 | 41,786 | ||||||
| Net asset value per share | $ | 8.43 | $ | 8.33 | ||||
| Class I: | ||||||||
| Net assets | $ | 114,410,413 | $ | 37,651,044 | ||||
| Shares of beneficial interest outstanding, unlimited authorization, no par | 13,561,153 | 4,406,941 | ||||||
| Net asset value per share | $ | 8.44 | $ | 8.54 | ||||
| Class R6: | ||||||||
| Net assets | $ | 796,289 | $ | 34,573,883 | ||||
| Shares of beneficial interest outstanding, unlimited authorization, no par | 94,379 | 4,033,587 | ||||||
| Net asset value per share | $ | 8.44 | $ | 8.57 | ||||
| Class Y: | ||||||||
| Net assets | $ | 90,227 | $ | — | ||||
| Shares of beneficial interest outstanding, unlimited authorization, no par | 10,699 | — | ||||||
| Net asset value per share | $ | 8.43 | $ | — | ||||
| *Investments, at cost | $ | 197,692,107 | $ | 90,802,140 | ||||
| †Including securities on loan | 4,078,638 | 4,535,602 | ||||||
| =Short-term investments held as collateral for loaned securities, at cost | 3,190,372 | 2,792,984 | ||||||
| DForeign currencies, at cost | 79,014 | 1,149,608 | ||||||
| ∑Options written, premium received | — | (40,830 | ) | |||||
See accompanying notes, which are an integral part of the financial statements.
136
Ivy Funds
Year ended September 30, 2022
| Delaware Ivy California Municipal High Income Fund | Delaware Ivy Corporate Bond Fund | Delaware Ivy Crossover Credit Fund | Delaware Ivy Emerging Markets Local Currency Debt Fund | |||||||||||||||||
| Investment Income: | ||||||||||||||||||||
| Interest | $ | 799,907 | $ | 19,053,651 | $ | 1,038,353 | $ | 1,864,910 | ||||||||||||
| Dividends | 511 | 13,772 | 5,153 | 6,971 | ||||||||||||||||
| Securities lending income | — | 14,102 | 1,093 | 679 | ||||||||||||||||
| Foreign tax withheld | — | — | — | (28,416 | ) | |||||||||||||||
| 800,418 | 19,081,525 | 1,044,599 | 1,844,144 | |||||||||||||||||
| Expenses: | ||||||||||||||||||||
| Investment advisory fees | 109,727 | 2,981,698 | 167,368 | 261,476 | ||||||||||||||||
| Distribution expenses — Class A | 29,037 | 693,569 | 14,293 | 4,156 | ||||||||||||||||
| Distribution expenses — Class B | — | 97 | — | — | ||||||||||||||||
| Distribution expenses — Class C | 5,866 | 18,296 | — | 733 | ||||||||||||||||
| Distribution expenses — Class Y | 633 | 579 | 2,810 | 573 | ||||||||||||||||
| Registration fees | 61,926 | 147,784 | 97,812 | 69,338 | ||||||||||||||||
| Audit and tax fees | 41,134 | 45,418 | 47,970 | 48,806 | ||||||||||||||||
| Accounting and administration expenses | 24,912 | 124,788 | 32,242 | 35,042 | ||||||||||||||||
| Reports and statements to shareholders servicing expenses | 24,530 | 512,901 | 47,511 | 38,717 | ||||||||||||||||
| Dividend disbursing and transfer agent fees and expenses | 7,068 | 665,739 | 22,317 | 37,604 | ||||||||||||||||
| Custodian fees | 1,317 | 11,005 | 2,525 | 61,466 | ||||||||||||||||
| Trustees’ fees and expenses | 1,184 | 74,942 | 1,998 | 3,363 | ||||||||||||||||
| Legal fees | 507 | 11,059 | 898 | 2,191 | ||||||||||||||||
| Other | 6,991 | 28,549 | 6,333 | 19,356 | ||||||||||||||||
| 314,832 | 5,316,424 | 444,077 | 582,821 | |||||||||||||||||
| Less expenses waived | (135,289 | ) | — | (159,562 | ) | (265,673 | ) | |||||||||||||
| Less waived distribution expenses — Class A | (10,703 | ) | — | (14,114 | ) | (4,156 | ) | |||||||||||||
| Less waived distribution expenses — Class C | (33 | ) | — | — | (291 | ) | ||||||||||||||
| Less waived distribution expenses — Class Y | (155 | ) | — | (27 | ) | (3 | ) | |||||||||||||
| Less expenses paid indirectly | (6 | ) | (365 | ) | (19 | ) | (75 | ) | ||||||||||||
| Less waived shareholder servicing expenses | (13,048 | ) | — | (36,398 | ) | (24,457 | ) | |||||||||||||
| Total operating expenses | 155,598 | 5,316,059 | 233,957 | 288,166 | ||||||||||||||||
| Net Investment Income (Loss) | 644,820 | 13,765,466 | 810,642 | 1,555,978 | ||||||||||||||||
137
Statements of operations
Ivy Funds
| Delaware Ivy California Municipal High Income Fund | Delaware Ivy Corporate Bond Fund | Delaware Ivy Crossover Credit Fund | Delaware Ivy Emerging Markets Local Currency Debt Fund | |||||||||||||||||
| Net Realized and Unrealized Gain (Loss): | ||||||||||||||||||||
| Net realized gain (loss) on: | ||||||||||||||||||||
| Investments | $ | 75,266 | $ | (32,556,330 | ) | $ | (2,819,328 | ) | $ | (2,411,039 | ) | |||||||||
| Foreign currencies | — | — | — | (1,549,613 | ) | |||||||||||||||
| Foreign currency exchange contracts | — | — | — | (742,241 | ) | |||||||||||||||
| Futures contracts | — | 371,092 | 13,720 | 55,898 | ||||||||||||||||
| Options purchased | — | — | — | 57,350 | ||||||||||||||||
| Options written | — | — | — | (1,906 | ) | |||||||||||||||
| Swap contracts | — | — | — | 163,467 | ||||||||||||||||
| Net realized gain (loss) | 75,266 | (32,185,238 | ) | (2,805,608 | ) | (4,428,084 | ) | |||||||||||||
| Net change in unrealized appreciation (depreciation) on: | ||||||||||||||||||||
| Investments | (3,529,781 | ) | (105,670,549 | ) | (4,799,073 | ) | (4,384,840 | ) | ||||||||||||
| Foreign currencies | — | — | — | (843,796 | ) | |||||||||||||||
| Foreign currency exchange contracts | — | — | — | 190,817 | ||||||||||||||||
| Futures contracts | — | (54,162 | ) | (12,854 | ) | (54,296 | ) | |||||||||||||
| Options purchased | — | — | — | (4,718 | ) | |||||||||||||||
| Options written | — | — | — | (3,729 | ) | |||||||||||||||
| Swap contracts | — | — | — | 42,296 | ||||||||||||||||
| Net change in unrealized appreciation (depreciation) | (3,529,781 | ) | (105,724,711 | ) | (4,811,927 | ) | (5,058,266 | ) | ||||||||||||
| Net Realized and Unrealized Gain (Loss) | (3,454,515 | ) | (137,909,949 | ) | (7,617,535 | ) | (9,486,350 | ) | ||||||||||||
| Net Increase (Decrease) in Net Assets Resulting from Operations | $ | (2,809,695 | ) | $ | (124,144,483 | ) | $ | (6,806,893 | ) | $ | (7,930,372 | ) | ||||||||
See accompanying notes, which are an integral part of the financial statements.
138
| Delaware Ivy Government Securities Fund | Delaware Ivy High Yield Fund | Delaware Ivy International Small Cap Fund | Delaware Ivy Multi-Asset Income Fund | |||||||||||||||||
| Investment Income: | ||||||||||||||||||||
| Interest | $ | 4,506,269 | $ | 5,220,020 | $ | — | $ | 6,620,940 | ||||||||||||
| Securities lending income | 26,065 | 13,900 | 37,254 | 112,977 | ||||||||||||||||
| Dividends | 20,526 | 12,549 | 1,150,262 | 4,153,463 | ||||||||||||||||
| Interest - affiliated | — | — | — | 11,824 | ||||||||||||||||
| Foreign tax withheld | — | — | (104,312 | ) | (210,921 | ) | ||||||||||||||
| 4,552,860 | 5,246,469 | 1,083,204 | 10,688,283 | |||||||||||||||||
| Expenses: | ||||||||||||||||||||
| Investment advisory fees | 1,410,392 | 550,788 | 719,723 | 1,713,632 | ||||||||||||||||
| Distribution expenses — Class A | 166,675 | 31,109 | 13,221 | 188,877 | ||||||||||||||||
| Distribution expenses — Class B | 33 | — | — | — | ||||||||||||||||
| Distribution expenses — Class C | 8,230 | — | 3,176 | 68,204 | ||||||||||||||||
| Distribution expenses — Class Y | — | — | 218 | 277 | ||||||||||||||||
| Reports and statements to shareholders servicing expenses | 195,698 | 93,366 | 59,943 | 260,215 | ||||||||||||||||
| Dividend disbursing and transfer agent fees and expenses | 189,785 | 29,082 | 34,191 | 211,685 | ||||||||||||||||
| Registration fees | 124,887 | 75,568 | 125,701 | 137,687 | ||||||||||||||||
| Accounting and administration expenses | 92,385 | 51,046 | 57,441 | 94,552 | ||||||||||||||||
| Audit and tax fees | 46,919 | 41,702 | 34,490 | 45,719 | ||||||||||||||||
| Trustees’ fees and expenses | 27,893 | 4,966 | 5,341 | 14,678 | ||||||||||||||||
| Legal fees | 10,126 | 5,732 | 1,600 | 19,369 | ||||||||||||||||
| Custodian fees | 6,813 | 4,933 | 51,597 | 50,419 | ||||||||||||||||
| Other | 44,873 | 15,285 | 31,857 | 71,494 | ||||||||||||||||
| 2,324,709 | 903,577 | 1,138,499 | 2,876,808 | |||||||||||||||||
| Less expenses waived | (42,356 | ) | (143,336 | ) | (345,775 | ) | (356,806 | ) | ||||||||||||
| Less waived distribution expenses — Class A | (95,783 | ) | (15,433 | ) | (7,873 | ) | (22,187 | ) | ||||||||||||
| Less waived distribution expenses — Class C | (1,726 | ) | — | (776 | ) | (4,032 | ) | |||||||||||||
| Less waived distribution expenses — Class Y | — | — | (1 | ) | — | |||||||||||||||
| Less expenses paid indirectly | (122 | ) | (68 | ) | (76 | ) | (161 | ) | ||||||||||||
| Less waived shareholder servicing expenses | (82,240 | ) | (77,102 | ) | (48,626 | ) | (240,811 | ) | ||||||||||||
| Total operating expenses | 2,102,482 | 667,638 | 735,372 | 2,252,811 | ||||||||||||||||
| Net Investment Income (Loss) | 2,450,378 | 4,578,831 | 347,832 | 8,435,472 | ||||||||||||||||
139
Statements of operations
Ivy Funds
| Delaware Ivy Government Securities Fund | Delaware Ivy High Yield Fund | Delaware Ivy International Small Cap Fund | Delaware Ivy Multi-Asset Income Fund | |||||||||||||||||
| Net Realized and Unrealized Gain (Loss): | ||||||||||||||||||||
| Net realized gain (loss) on: | ||||||||||||||||||||
| Investments | $ | (21,252,144 | ) | $ | (5,297,682 | ) | $ | 16,631,364 | $ | 22,084,695 | ||||||||||
| Foreign currencies | — | — | (89,819 | ) | (494,619 | ) | ||||||||||||||
| Foreign currency exchange contracts | — | — | (121,005 | ) | 141,423 | |||||||||||||||
| Futures contracts | (354,474 | ) | — | — | (513 | ) | ||||||||||||||
| Options purchased | 31,252 | — | — | — | ||||||||||||||||
| Options written | — | — | — | 870 | ||||||||||||||||
| Net realized gain (loss) | (21,575,366 | ) | (5,297,682 | ) | 16,420,540 | 21,731,856 | ||||||||||||||
| Net change in unrealized appreciation (depreciation) on: | ||||||||||||||||||||
| Investments | (19,961,522 | ) | (11,010,810 | ) | (45,802,920 | ) | (66,152,891 | ) | ||||||||||||
| Affiliated investments | — | — | — | (672,523 | ) | |||||||||||||||
| Foreign currencies | — | — | (15,560 | ) | 38,792 | |||||||||||||||
| Foreign currency exchange contracts | — | — | (10,172 | ) | (93,389 | ) | ||||||||||||||
| Futures contracts | — | — | — | (50,950 | ) | |||||||||||||||
| Net change in unrealized appreciation (depreciation) | (19,961,522 | ) | (11,010,810 | ) | (45,828,652 | ) | (66,930,961 | ) | ||||||||||||
| Net Realized and Unrealized Gain (Loss) | (41,536,888 | ) | (16,308,492 | ) | (29,408,112 | ) | (45,199,105 | ) | ||||||||||||
| Net Increase (Decrease) in Net Assets Resulting from Operations | $ | (39,086,510 | ) | $ | (11,729,661 | ) | $ | (29,060,280 | ) | $ | (36,763,633 | ) | ||||||||
See accompanying notes, which are an integral part of the financial statements.
140
| Delaware Ivy Strategic Income Fund | Delaware Ivy Total Return Bond Fund | |||||||||
| Investment Income: | ||||||||||
| Interest | $ | 12,490,824 | $ | 2,557,250 | ||||||
| Dividends | 287,324 | 1,163 | ||||||||
| Securities lending income | 111,807 | 20,595 | ||||||||
| Foreign tax withheld | — | (2,876 | ) | |||||||
| 12,889,955 | 2,576,132 | |||||||||
| Expenses: | ||||||||||
| Investment advisory fees | 1,721,872 | 1,076,073 | ||||||||
| Distribution expenses — Class A | 181,658 | 24,004 | ||||||||
| Distribution expenses — Class C | 36,743 | 4,814 | ||||||||
| Distribution expenses — Class Y | 350 | — | ||||||||
| Reports and statements to shareholders servicing expenses | 277,260 | 117,891 | ||||||||
| Dividend disbursing and transfer agent fees and expenses | 174,187 | 27,785 | ||||||||
| Registration fees | 130,937 | 68,306 | ||||||||
| Accounting and administration expenses | 89,965 | 52,802 | ||||||||
| Audit and tax fees | 52,083 | 52,702 | ||||||||
| Legal fees | 42,864 | 1,743 | ||||||||
| Custodian fees | 25,159 | 30,648 | ||||||||
| Trustees’ fees and expenses | 14,553 | 9,045 | ||||||||
| Other | 44,128 | 53,866 | ||||||||
| 2,791,759 | 1,519,679 | |||||||||
| Less expenses waived | (465,068 | ) | (300,913 | ) | ||||||
| Less waived distribution expenses — Class A | (29,511 | ) | (346 | ) | ||||||
| Less waived distribution expenses — Class C | (9,256 | ) | (1,187 | ) | ||||||
| Less waived distribution expenses — Class Y | (189 | ) | — | |||||||
| Less expenses paid indirectly | (157 | ) | (90 | ) | ||||||
| Less waived shareholder servicing expenses | (263,615 | ) | (21,069 | ) | ||||||
| Total operating expenses | 2,023,963 | 1,196,074 | ||||||||
| Net Investment Income (Loss) | 10,865,992 | 1,380,058 | ||||||||
141
Statements of operations
Ivy Funds
| Delaware Ivy Strategic Income Fund | Delaware Ivy Total Return Bond Fund | |||||||||
| Net Realized and Unrealized Gain (Loss): | ||||||||||
| Net realized gain (loss) on: | ||||||||||
| Investments | $ | (10,957,474 | ) | $ | (9,910,612 | ) | ||||
| Foreign currencies | (634,573 | ) | (3,311,378 | ) | ||||||
| Foreign currency exchange contracts | 575,077 | 8,483,172 | ||||||||
| Futures contracts | (886,960 | ) | 3,875,076 | |||||||
| Options purchased | (152,712 | ) | (1,020,218 | ) | ||||||
| Options written | 77,384 | 648,748 | ||||||||
| Swap contracts | 46,308 | (178,713 | ) | |||||||
| Net realized gain (loss) | (11,932,950 | ) | (1,413,925 | ) | ||||||
| Net change in unrealized appreciation (depreciation) on: | ||||||||||
| Investments | (35,214,583 | ) | (16,276,539 | ) | ||||||
| Affiliated investments | 2,742,038 | — | ||||||||
| Foreign currencies | 75,365 | (492,597 | ) | |||||||
| Foreign currency exchange contracts | 51,994 | 329,866 | ||||||||
| Futures contracts | (744,123 | ) | (1,299,627 | ) | ||||||
| Options purchased | — | 398,904 | ||||||||
| Options written | — | (69,369 | ) | |||||||
| Swap contracts | — | 318,269 | ||||||||
| Net change in unrealized appreciation (depreciation) | (33,089,309 | ) | (17,091,093 | ) | ||||||
| Net Realized and Unrealized Gain (Loss) | (45,022,259 | ) | (18,505,018 | ) | ||||||
| Net Increase (Decrease) in Net Assets Resulting from Operations | $ | (34,156,267 | ) | $ | (17,124,960 | ) | ||||
See accompanying notes, which are an integral part of the financial statements.
142
Statements of changes in net assets
Ivy Funds
| Delaware Ivy California Municipal High Income Fund | Delaware Ivy Corporate Bond Fund | |||||||||||||||
| Year ended | Year ended | |||||||||||||||
| 9/30/22 | 9/30/21 | 9/30/22 | 9/30/21 | |||||||||||||
| Increase (Decrease) in Net Assets from Operations: | ||||||||||||||||
| Net investment income (loss) | $ | 644,820 | $ | 633,510 | $ | 13,765,466 | $ | 17,638,126 | ||||||||
| Net realized gain (loss) | 75,266 | 253,723 | (32,185,238 | ) | 26,476,741 | |||||||||||
| Net change in unrealized appreciation (depreciation) | (3,529,781 | ) | 482,553 | (105,724,711 | ) | (29,361,101 | ) | |||||||||
| Net increase (decrease) in net assets resulting from operations | (2,809,695 | ) | 1,369,786 | (124,144,483 | ) | 14,753,766 | ||||||||||
| Dividends and Distributions to Shareholders from: | ||||||||||||||||
| Distributable earnings: | ||||||||||||||||
| Class A | (437,916 | ) | (345,502 | ) | (15,880,323 | ) | (24,482,355 | ) | ||||||||
| Class B | — | — | — | (9,810 | ) | |||||||||||
| Class C | (14,595 | ) | (18,991 | ) | (87,488 | ) | (239,579 | ) | ||||||||
| Class I | (336,405 | ) | (257,299 | ) | (20,399,993 | ) | (32,612,723 | ) | ||||||||
| Class R61 | — | — | (1,574,023 | ) | (3,996,685 | ) | ||||||||||
| Class Y | (7,314 | ) | (26,706 | ) | (13,108 | ) | (18,702 | ) | ||||||||
| (796,230 | ) | (648,498 | ) | (37,954,935 | ) | (61,359,854 | ) | |||||||||
| Capital Share Transactions: | ||||||||||||||||
| Proceeds from shares sold: | ||||||||||||||||
| Class A | 819,986 | 1,075,956 | 16,105,405 | 44,122,509 | ||||||||||||
| Class B2 | — | — | 5 | 569 | ||||||||||||
| Class C | 11,882 | 14,641 | 296,440 | 1,026,241 | ||||||||||||
| Class I | 4,365,370 | 2,688,383 | 43,638,479 | 82,872,533 | ||||||||||||
| Class R61 | — | — | 2,893,526 | 11,156,147 | ||||||||||||
| Class Y | 218 | — | — | 37 | ||||||||||||
| Net asset value of shares issued upon reinvestment of dividends and distributions: | ||||||||||||||||
| Class A | 369,801 | 195,332 | 15,832,747 | 23,885,851 | ||||||||||||
| Class B2 | — | — | — | 9,072 | ||||||||||||
| Class C | 12,324 | 6,588 | 87,488 | 235,545 | ||||||||||||
| Class I | 329,346 | 202,373 | 20,269,987 | 32,192,321 | ||||||||||||
| Class R61 | — | — | 1,574,023 | 3,996,685 | ||||||||||||
| Class Y | 2,488 | 4,570 | — | — | ||||||||||||
| 5,911,415 | 4,187,843 | 100,698,100 | 199,497,510 | |||||||||||||
| Cost of shares redeemed: | ||||||||||||||||
| Class A | (5,078,671 | ) | (4,511,058 | ) | (81,875,467 | ) | (70,913,698 | ) | ||||||||
| Class B2 | — | — | (21,579 | ) | (210,274 | ) | ||||||||||
| Class C | (1,101,152 | ) | (297,066 | ) | (960,393 | ) | (2,918,688 | ) | ||||||||
| Class I | (4,907,564 | ) | (7,386,632 | ) | (217,782,912 | ) | (108,092,160 | ) | ||||||||
| Class R61 | — | — | (38,717,423 | ) | (32,851,218 | ) | ||||||||||
| Class Y | (1,089,953 | ) | (175,803 | ) | — | — | ||||||||||
| (12,177,340 | ) | (12,370,559 | ) | (339,357,774 | ) | (214,986,038 | ) | |||||||||
| Decrease in net assets derived from capital share transactions | (6,265,925 | ) | (8,182,716 | ) | (238,659,674 | ) | (15,488,528 | ) | ||||||||
| Net Decrease in Net Assets | (9,871,850 | ) | (7,461,428 | ) | (400,759,092 | ) | (62,094,616 | ) | ||||||||
| Net Assets: | ||||||||||||||||
| Beginning of year | 27,056,715 | 34,518,143 | 815,560,279 | 877,654,895 | ||||||||||||
| End of year | $ | 17,184,865 | $ | 27,056,715 | $ | 414,801,187 | $ | 815,560,279 | ||||||||
143
Statements of changes in net assets
Ivy Funds
| 1 | Effective July 1, 2021, Class N shares were renamed Class R6 shares. |
| 2 | On December 10, 2021, all Class B shares were converted into Class A shares. These transactions are included as subscriptions of Class A shares and redemptions of Class B shares in the tables above and on the previous pages. |
See accompanying notes, which are an integral part of the financial statements.
144
| Delaware Ivy Crossover Credit Fund | Delaware Ivy Emerging Markets Local Currency Debt Fund | |||||||||||||||
| Year ended | Year ended | |||||||||||||||
| 9/30/22 | 9/30/21 | 9/30/22 | 9/30/21 | |||||||||||||
| Increase (Decrease) in Net Assets from Operations: | ||||||||||||||||
| Net investment income (loss) | $ | 810,642 | $ | 1,177,273 | $ | 1,555,978 | $ | 2,261,594 | ||||||||
| Net realized gain (loss) | (2,805,608 | ) | 2,091,849 | (4,428,084 | ) | (618,456 | ) | |||||||||
| Net change in unrealized appreciation (depreciation) | (4,811,927 | ) | (805,880 | ) | (5,058,266 | ) | (264,961 | ) | ||||||||
| Net increase (decrease) in net assets resulting from operations | (6,806,893 | ) | 2,463,242 | (7,930,372 | ) | 1,378,177 | ||||||||||
| Dividends and Distributions to Shareholders from: | ||||||||||||||||
| Distributable earnings: | ||||||||||||||||
| Class A | (435,802 | ) | (1,471,240 | ) | — | (5,102 | ) | |||||||||
| Class I | (1,992,355 | ) | (3,146,169 | ) | — | (106,671 | ) | |||||||||
| Class R61 | (358,625 | ) | (247,273 | ) | — | (82,540 | ) | |||||||||
| Class Y | (82,061 | ) | (95,553 | ) | — | (243 | ) | |||||||||
| (2,868,843 | ) | (4,960,235 | ) | — | (194,556 | ) | ||||||||||
| Capital Share Transactions: | ||||||||||||||||
| Proceeds from shares sold: | ||||||||||||||||
| Class A | 704,434 | 3,572,674 | 91,257 | 592,052 | ||||||||||||
| Class C | — | — | 593 | — | ||||||||||||
| Class I | 9,822,946 | 17,473,351 | 1,673,252 | 10,978,661 | ||||||||||||
| Class R61 | 690,846 | 4,847,518 | 2,885,006 | 15,305,886 | ||||||||||||
| Class Y | 105,176 | 193,411 | 9 | 3,854 | ||||||||||||
| Net asset value of shares issued upon reinvestment of dividends and distributions: | ||||||||||||||||
| Class A | 432,820 | 588,495 | — | 2,640 | ||||||||||||
| Class I | 1,992,348 | 2,365,620 | — | 105,601 | ||||||||||||
| Class R61 | 358,625 | 202,448 | — | 82,540 | ||||||||||||
| Class Y | 10,801 | 1,413 | — | — | ||||||||||||
| 14,117,996 | 29,244,930 | 4,650,117 | 27,071,234 | |||||||||||||
| Cost of shares redeemed: | ||||||||||||||||
| Class A | (2,951,222 | ) | (13,338,181 | ) | (1,212,158 | ) | (6,213,616 | ) | ||||||||
| Class C | — | — | (15,430 | ) | (1,782,183 | ) | ||||||||||
| Class I | (22,523,248 | ) | (27,979,620 | ) | (18,770,346 | ) | (12,197,032 | ) | ||||||||
| Class R61 | (5,897,342 | ) | (1,235,090 | ) | (6,378,476 | ) | (14,024,248 | ) | ||||||||
| Class Y | (70,626 | ) | (47,289 | ) | (470 | ) | (2,435,963 | ) | ||||||||
| (31,442,438 | ) | (42,600,180 | ) | (26,376,880 | ) | (36,653,042 | ) | |||||||||
| Decrease in net assets derived from capital share transactions | (17,324,442 | ) | (13,355,250 | ) | (21,726,763 | ) | (9,581,808 | ) | ||||||||
| Net Decrease in Net Assets | (27,000,178 | ) | (15,852,243 | ) | (29,657,135 | ) | (8,398,187 | ) | ||||||||
| Net Assets: | ||||||||||||||||
| Beginning of year | 44,304,548 | 60,156,791 | 52,005,616 | 60,403,803 | ||||||||||||
| End of year | $ | 17,304,370 | $ | 44,304,548 | $ | 22,348,481 | $ | 52,005,616 | ||||||||
| 1 | Effective July 1, 2021, Class N shares were renamed Class R6 shares. |
See accompanying notes, which are an integral part of the financial statements.
145
Statements of changes in net assets
Ivy Funds
| Delaware Ivy Government Securities Fund | Delaware Ivy High Yield Fund | |||||||||||||||
| Year ended | Year ended | |||||||||||||||
| 9/30/22 | 9/30/21 | 9/30/22 | 9/30/21 | |||||||||||||
| Increase (Decrease) in Net Assets from Operations: | ||||||||||||||||
| Net investment income (loss) | $ | 2,450,378 | $ | 3,180,466 | $ | 4,578,831 | $ | 6,689,563 | ||||||||
| Net realized gain (loss) | (21,575,366 | ) | 1,708,855 | (5,297,682 | ) | 5,723,441 | ||||||||||
| Net change in unrealized appreciation (depreciation) | (19,961,522 | ) | (11,906,391 | ) | (11,010,810 | ) | 2,080,522 | |||||||||
| Net increase (decrease) in net assets resulting from operations | (39,086,510 | ) | (7,017,070 | ) | (11,729,661 | ) | 14,493,526 | |||||||||
| Dividends and Distributions to Shareholders from: | ||||||||||||||||
| Distributable earnings: | ||||||||||||||||
| Class A | (588,347 | ) | (917,702 | ) | (1,063,272 | ) | (793,716 | ) | ||||||||
| Class C | (378 | ) | (3,093 | ) | — | — | ||||||||||
| Class I | (1,277,007 | ) | (1,783,642 | ) | (4,984,513 | ) | (4,156,741 | ) | ||||||||
| Class R61 | (1,189,521 | ) | (2,154,930 | ) | (1,898,457 | ) | (1,924,874 | ) | ||||||||
| (3,055,253 | ) | (4,859,367 | ) | (7,946,242 | ) | (6,875,331 | ) | |||||||||
| Capital Share Transactions: | ||||||||||||||||
| Proceeds from shares sold: | ||||||||||||||||
| Class A | 6,165,836 | 12,562,138 | 2,918,308 | 6,107,387 | ||||||||||||
| Class C | 220,005 | 806,427 | — | — | ||||||||||||
| Class I | 58,154,785 | 31,669,165 | 14,011,810 | 24,790,467 | ||||||||||||
| Class R61 | 29,480,422 | 34,697,394 | 131,510 | 3,767,045 | ||||||||||||
| Net asset value of shares issued upon reinvestment of dividends and distributions: | ||||||||||||||||
| Class A | 594,917 | 884,243 | 1,062,455 | 518,604 | ||||||||||||
| Class B2 | — | 8 | — | — | ||||||||||||
| Class C | 597 | 2,626 | — | — | ||||||||||||
| Class I | 1,298,536 | 1,753,718 | 4,984,606 | 4,064,512 | ||||||||||||
| Class R61 | 1,212,166 | 2,153,034 | 1,898,457 | 1,924,874 | ||||||||||||
| 97,127,264 | 84,528,753 | 25,007,146 | 41,172,889 | |||||||||||||
| Cost of shares redeemed: | ||||||||||||||||
| Class A | (20,444,518 | ) | (27,962,021 | ) | (4,950,550 | ) | (8,817,300 | ) | ||||||||
| Class B2 | (22,641 | ) | (137,534 | ) | — | — | ||||||||||
| Class C | (635,701 | ) | (1,527,910 | ) | — | — | ||||||||||
| Class I | (70,104,153 | ) | (39,109,333 | ) | (58,445,870 | ) | (35,605,574 | ) | ||||||||
| Class R61 | (125,457,686 | ) | (66,024,093 | ) | (32,689,570 | ) | (12,310,405 | ) | ||||||||
| (216,664,699 | ) | (134,760,891 | ) | (96,085,990 | ) | (56,733,279 | ) | |||||||||
| Decrease in net assets derived from capital share transactions | (119,537,435 | ) | (50,232,138 | ) | (71,078,844 | ) | (15,560,390 | ) | ||||||||
| Net Decrease in Net Assets | (161,679,198 | ) | (62,108,575 | ) | (90,754,747 | ) | (7,942,195 | ) | ||||||||
| Net Assets: | ||||||||||||||||
| Beginning of year | 347,991,465 | 410,100,040 | 133,674,336 | 141,616,531 | ||||||||||||
| End of year | $ | 186,312,267 | $ | 347,991,465 | $ | 42,919,589 | $ | 133,674,336 | ||||||||
| 1 | Effective July 1, 2021, Class N shares were renamed Class R6 shares. |
| 2 | On December 10, 2021, all Class B shares were converted into Class A shares. These transactions are included as subscriptions of Class A shares and redemptions of Class B shares in the tables above and on the previous pages. |
See accompanying notes, which are an integral part of the financial statements.
146
| Delaware Ivy International Small Cap Fund | Delaware Ivy Multi-Asset Income Fund | |||||||||||||||
| Year ended | Year ended | |||||||||||||||
| 9/30/22 | 9/30/21 | 9/30/22 | 9/30/21 | |||||||||||||
| Increase (Decrease) in Net Assets from Operations: | ||||||||||||||||
| Net investment income (loss) | $ | 347,832 | $ | 1,234,399 | $ | 8,435,472 | $ | 11,986,059 | ||||||||
| Net realized gain (loss) | 16,420,540 | 25,181,441 | 21,731,856 | 12,514,993 | ||||||||||||
| Net change in unrealized appreciation (depreciation) | (45,828,652 | ) | 11,087,666 | (66,930,961 | ) | 35,395,286 | ||||||||||
| Net increase (decrease) in net assets resulting from operations | (29,060,280 | ) | 37,503,506 | (36,763,633 | ) | 59,896,338 | ||||||||||
| Dividends and Distributions to Shareholders from: | ||||||||||||||||
| Distributable earnings: | ||||||||||||||||
| Class A | (1,036,290 | ) | (50,516 | ) | (3,852,612 | ) | (3,489,508 | ) | ||||||||
| Class C | (60,730 | ) | — | (297,376 | ) | (302,787 | ) | |||||||||
| Class I | (7,303,050 | ) | (339,252 | ) | (8,976,790 | ) | (9,689,238 | ) | ||||||||
| Class R61 | (7,790,687 | ) | (349,577 | ) | (70,658 | ) | (119,410 | ) | ||||||||
| Class Y | (14,316 | ) | (1,093 | ) | (5,729 | ) | (92,067 | ) | ||||||||
| (16,205,073 | ) | (740,438 | ) | (13,203,165 | ) | (13,693,010 | ) | |||||||||
| Capital Share Transactions: | ||||||||||||||||
| Proceeds from shares sold: | ||||||||||||||||
| Class A | 492,404 | 2,151,022 | 6,665,626 | 7,629,9892 | ||||||||||||
| Class C | 74,322 | 65,650 | 425,965 | 902,1062 | ||||||||||||
| Class I | 4,590,035 | 11,200,328 | 15,102,649 | 29,090,9112 | ||||||||||||
| Class R61 | 5,932,670 | 1,398,118 | 165,002 | 632,0262 | ||||||||||||
| Class Y | 481,816 | 1,421,417 | 4,366 | 6772 | ||||||||||||
| Net asset value of shares issued upon reinvestment of dividends and distributions: | ||||||||||||||||
| Class A | 1,034,791 | 19,789 | 3,821,297 | 3,430,704 | ||||||||||||
| Class C | 59,484 | — | 291,596 | 294,319 | ||||||||||||
| Class I | 7,301,071 | 338,269 | 8,928,446 | 9,536,894 | ||||||||||||
| Class R61 | 7,790,687 | 349,577 | 70,658 | 58,148 | ||||||||||||
| Class Y | 14,316 | 210 | 5,729 | 5,530 | ||||||||||||
| 27,771,596 | 16,944,380 | 35,481,334 | 51,581,304 | |||||||||||||
| Cost of shares redeemed: | ||||||||||||||||
| Class A | (2,671,873 | ) | (14,596,753 | ) | (24,588,526 | ) | (23,785,947 | ) | ||||||||
| Class C | (131,818 | ) | (1,637,398 | ) | (2,509,562 | ) | (4,264,997 | ) | ||||||||
| Class I | (39,850,541 | ) | (46,037,972 | ) | (105,567,503 | ) | (79,452,900 | ) | ||||||||
| Class R61 | (22,577,066 | ) | (34,080,867 | ) | (359,224 | ) | (2,928,595 | ) | ||||||||
| Class Y | (612,604 | ) | (1,978,694 | ) | (18,620 | ) | (3,573,147 | ) | ||||||||
| (65,843,902 | ) | (98,331,684 | ) | (133,043,435 | ) | (114,005,586 | ) | |||||||||
| Decrease in net assets derived from capital share transactions | (38,072,306 | ) | (81,387,304 | ) | (97,562,101 | ) | (62,424,282 | ) | ||||||||
| Net Decrease in Net Assets | (83,337,659 | ) | (44,624,236 | ) | (147,528,899 | ) | (16,220,954 | ) | ||||||||
| Net Assets: | ||||||||||||||||
| Beginning of year | 120,338,350 | 164,962,586 | 307,766,057 | 323,987,011 | ||||||||||||
| End of year | $ | 37,000,691 | $ | 120,338,350 | $ | 160,237,158 | $ | 307,766,057 | ||||||||
| 1 | Effective July 1, 2021, Class N shares were renamed Class R6 shares. |
| 2 | Included payments from affiliates. |
See accompanying notes, which are an integral part of the financial statements.
147
Statements of changes in net assets
Ivy Funds
| Delaware Ivy Strategic Income Fund | Delaware Ivy Total Return Bond Fund | |||||||||||||||
| Year ended | Year ended | |||||||||||||||
| 9/30/22 | 9/30/21 | 9/30/22 | 9/30/21 | |||||||||||||
| Increase (Decrease) in Net Assets from Operations: | ||||||||||||||||
| Net investment income (loss) | $ | 10,865,992 | $ | 15,499,181 | $ | 1,380,058 | $ | 2,308,406 | ||||||||
| Net realized gain (loss) | (11,932,950 | ) | 6,303,280 | (1,413,925 | ) | 3,402,844 | ||||||||||
| Net change in unrealized appreciation (depreciation) | (33,089,309 | ) | 6,663,566 | (17,091,093 | ) | (3,992,929 | ) | |||||||||
| Net increase (decrease) in net assets resulting from operations | (34,156,267 | ) | 28,466,027 | (17,124,960 | ) | 1,718,321 | ||||||||||
| Dividends and Distributions to Shareholders from: | ||||||||||||||||
| Distributable earnings: | ||||||||||||||||
| Class A | (3,015,633 | ) | (4,600,138 | ) | (276,561 | ) | (250,720 | ) | ||||||||
| Class C | (122,545 | ) | (195,959 | ) | (13,264 | ) | (24,536 | ) | ||||||||
| Class I | (7,986,695 | ) | (12,428,973 | ) | (2,253,223 | ) | (1,556,281 | ) | ||||||||
| Class R61 | (45,685 | ) | (129,596 | ) | (1,408,771 | ) | (1,021,796 | ) | ||||||||
| Class Y | (5,869 | ) | (91,090 | ) | (1 | ) | (3,176 | ) | ||||||||
| (11,176,427 | ) | (17,445,756 | ) | (3,951,820 | ) | (2,856,509 | ) | |||||||||
| Capital Share Transactions: | ||||||||||||||||
| Proceeds from shares sold: | ||||||||||||||||
| Class A | 9,534,878 | 2 | 15,990,235 | 837,399 | 3,167,508 | |||||||||||
| Class C | 656,382 | 2 | 1,272,820 | 38,513 | 172,526 | |||||||||||
| Class I | 30,435,003 | 2 | 47,897,470 | 6,347,278 | 32,460,342 | |||||||||||
| Class R61 | 340,656 | 2 | 447,130 | 1,417,122 | 15,235,441 | |||||||||||
| Class Y | 24,862 | 2 | 49,877 | — | — | |||||||||||
| Net asset value of shares issued upon reinvestment of dividends and distributions: | ||||||||||||||||
| Class A | 2,994,432 | 3,687,345 | 276,089 | 181,671 | ||||||||||||
| Class C | 121,569 | 188,462 | 13,264 | 5,535 | ||||||||||||
| Class I | 7,961,689 | 12,210,687 | 2,248,668 | 1,540,608 | ||||||||||||
| Class R61 | 45,685 | 129,596 | 1,408,771 | 1,021,796 | ||||||||||||
| Class Y | 5,706 | 80,771 | — | 86 | ||||||||||||
| 52,120,862 | 81,954,393 | 12,587,104 | 53,785,513 | |||||||||||||
| Cost of shares redeemed: | ||||||||||||||||
| Class A | (31,678,540 | ) | (47,314,688 | ) | (4,938,497 | ) | (13,687,263 | ) | ||||||||
| Class C | (1,992,721 | ) | (2,522,462 | ) | (246,828 | ) | (4,048,257 | ) | ||||||||
| Class I | (133,548,730 | ) | (83,239,030 | ) | (58,274,370 | ) | (37,257,823 | ) | ||||||||
| Class R61 | (534,175 | ) | (21,449,285 | ) | (20,143,529 | ) | (12,442,132 | ) | ||||||||
| Class Y | (63,610 | ) | (6,704,622 | ) | (30 | ) | (3,617,902 | ) | ||||||||
| (167,817,776 | ) | (161,230,087 | ) | (83,603,254 | ) | (71,053,377 | ) | |||||||||
| Decrease in net assets derived from capital share transactions | (115,696,914 | ) | (79,275,694 | ) | (71,016,150 | ) | (17,267,864 | ) | ||||||||
| Net Decrease in Net Assets | (161,029,608 | ) | (68,255,423 | ) | (92,092,930 | ) | (18,406,052 | ) | ||||||||
| Net Assets: | ||||||||||||||||
| Beginning of year | 333,617,843 | 401,873,266 | 171,791,115 | 190,197,167 | ||||||||||||
| End of year | $ | 172,588,235 | $ | 333,617,843 | $ | 79,698,185 | $ | 171,791,115 | ||||||||
| 1 | Effective July 1, 2021, Class N shares were renamed Class R6 shares. |
| 2 | Included payments from affiliates. |
See accompanying notes, which are an integral part of the financial statements.
148
Delaware Ivy California Municipal High Income Fund Class A
Selected data for each share of the Fund outstanding throughout each period were as follows:
| Year ended | ||||||||||||||||||||
| 9/30/22 | 9/30/21 | 9/30/20 | 9/30/19 | 9/30/18 | ||||||||||||||||
| Net asset value, beginning of period | $ | 10.68 | $ | 10.48 | $ | 10.58 | $ | 9.98 | $ | 10.16 | ||||||||||
| Income (loss) from investment operations: | ||||||||||||||||||||
| Net investment income1 | 0.30 | 0.21 | 0.21 | 0.26 | 0.26 | |||||||||||||||
| Net realized and unrealized gain (loss) | (1.70 | ) | 0.20 | (0.11 | ) | 0.60 | (0.16 | ) | ||||||||||||
| Total from investment operations | (1.40 | ) | 0.41 | 0.10 | 0.86 | 0.10 | ||||||||||||||
| Less dividends and distributions from: | ||||||||||||||||||||
| Net investment income | (0.27 | ) | (0.21 | ) | (0.20 | ) | (0.26 | ) | (0.26 | ) | ||||||||||
| Net realized gain | (0.11 | ) | — | — | — | (0.02 | ) | |||||||||||||
| Total dividends and distributions | (0.38 | ) | (0.21 | ) | (0.20 | ) | (0.26 | ) | (0.28 | ) | ||||||||||
| Net asset value, end of period | $ | 8.90 | $ | 10.68 | $ | 10.48 | $ | 10.58 | $ | 9.98 | ||||||||||
| Total return2 | (13.46% | ) | 3.97% | 1.01% | 8.73% | 0.89% | ||||||||||||||
| Ratios and supplemental data: | ||||||||||||||||||||
| Net assets, end of period (000 omitted) | $ | 9,573 | $ | 15 | 3 | $ | 19 | 3 | $ | 17 | 3 | $ | 14 | 3 | ||||||
| Ratio of expenses to average net assets4 | 0.80% | 0.80% | 0.80% | 0.80% | 0.78% | |||||||||||||||
| Ratio of expenses to average net assets prior to fees waived4 | 1.52% | 1.33% | 1.23% | 1.29% | 1.32% | |||||||||||||||
| Ratio of net investment income to average net assets | 3.03% | 1.94% | 2.03% | 2.54% | 2.56% | |||||||||||||||
| Ratio of net investment income to average net assets prior to fees waived | 2.31% | 1.41% | 1.60% | 2.05% | 2.02% | |||||||||||||||
| Portfolio turnover | 28% | 16% | 9% | 10% | 10% | |||||||||||||||
| 1 | Calculated using average shares outstanding. |
| 2 | Total return is based on the change in net asset value of a share during the period and assumes reinvestment of dividends and distributions at net asset value and does not reflect the impact of a sales charge. Total return during the period reflects waivers by the manager and/or distributor. Performance would have been lower had the waivers not been in effect. |
| 3 | Net assets reported in millions. |
| 4 | Expense ratios do not include expenses of any investment companies in which the Fund invests. |
See accompanying notes, which are an integral part of the financial statements.
149
Financial highlights
Delaware Ivy California Municipal High Income Fund Class C
Selected data for each share of the Fund outstanding throughout each period were as follows:
| Year ended | ||||||||||||||||||||
| 9/30/22 | 9/30/21 | 9/30/20 | 9/30/19 | 9/30/18 | ||||||||||||||||
| Net asset value, beginning of period | $ | 10.68 | $ | 10.48 | $ | 10.58 | $ | 9.98 | $ | 10.16 | ||||||||||
| Income (loss) from investment operations: | ||||||||||||||||||||
| Net investment income1 | 0.19 | 0.12 | 0.12 | 0.17 | 0.17 | |||||||||||||||
| Net realized and unrealized gain (loss) | (1.68 | ) | 0.20 | (0.11 | ) | 0.60 | (0.17 | ) | ||||||||||||
| Total from investment operations | (1.49 | ) | 0.32 | 0.01 | 0.77 | — | 2 | |||||||||||||
| Less dividends and distributions from: | ||||||||||||||||||||
| Net investment income | (0.18 | ) | (0.12 | ) | (0.11 | ) | (0.17 | ) | (0.16 | ) | ||||||||||
| Net realized gain | (0.11 | ) | — | — | — | (0.02 | ) | |||||||||||||
| Total dividends and distributions | (0.29 | ) | (0.12 | ) | (0.11 | ) | (0.17 | ) | (0.18 | ) | ||||||||||
| Net asset value, end of period | $ | 8.90 | $ | 10.68 | $ | 10.48 | $ | 10.58 | $ | 9.98 | ||||||||||
| Total return3 | (14.28% | ) | 3.09% | 0.13% | 7.81% | (0.07% | ) | |||||||||||||
| Ratios and supplemental data: | ||||||||||||||||||||
| Net assets, end of period (000 omitted) | $ | 381 | $ | 2 | 4 | $ | 2 | 4 | $ | 2 | 4 | $ | 2 | 4 | ||||||
| Ratio of expenses to average net assets5 | 1.70% | 1.65% | 1.67% | 1.66% | 1.63% | |||||||||||||||
| Ratio of expenses to average net assets prior to fees waived5 | 2.20% | 2.10% | 2.02% | 2.06% | 2.08% | |||||||||||||||
| Ratio of net investment income to average net assets | 1.92% | 1.09% | 1.16% | 1.69% | 1.70% | |||||||||||||||
| Ratio of net investment income to average net assets prior to fees waived | 1.42% | 0.64% | 0.81% | 1.29% | 1.25% | |||||||||||||||
| Portfolio turnover | 28% | 16% | 9% | 10% | 10% | |||||||||||||||
| 1 | Calculated using average shares outstanding. |
| 2 | Amount is less than $0.005 per share. |
| 3 | Total return is based on the change in net asset value of a share during the period and assumes reinvestment of dividends and distributions at net asset value and does not reflect the impact of a sales charge. Total return during the period reflects waivers by the manager and/or distributor. Performance would have been lower had the waivers not been in effect. |
| 4 | Net assets reported in millions. |
| 5 | Expense ratios do not include expenses of any investment companies in which the Fund invests. |
See accompanying notes, which are an integral part of the financial statements.
150
Delaware Ivy California Municipal High Income Fund Class I
Selected data for each share of the Fund outstanding throughout each period were as follows:
| Year ended | ||||||||||||||||||||
| 9/30/22 | 9/30/21 | 9/30/20 | 9/30/19 | 9/30/18 | ||||||||||||||||
| Net asset value, beginning of period | $ | 10.68 | $ | 10.48 | $ | 10.58 | $ | 9.98 | $ | 10.16 | ||||||||||
| Income (loss) from investment operations: | ||||||||||||||||||||
| Net investment income1 | 0.33 | 0.23 | 0.23 | 0.28 | 0.28 | |||||||||||||||
| Net realized and unrealized gain (loss) | (1.71 | ) | 0.21 | (0.10 | ) | 0.60 | (0.16 | ) | ||||||||||||
| Total from investment operations | (1.38 | ) | 0.44 | 0.13 | 0.88 | 0.12 | ||||||||||||||
| Less dividends and distributions from: | ||||||||||||||||||||
| Net investment income | (0.29 | ) | (0.24 | ) | (0.23 | ) | (0.28 | ) | (0.28 | ) | ||||||||||
| Net realized gain | (0.11 | ) | — | — | — | (0.02 | ) | |||||||||||||
| Total dividends and distributions | (0.40 | ) | (0.24 | ) | (0.23 | ) | (0.28 | ) | (0.30 | ) | ||||||||||
| Net asset value, end of period | $ | 8.90 | $ | 10.68 | $ | 10.48 | $ | 10.58 | $ | 9.98 | ||||||||||
| Total return2 | (13.29% | ) | 4.18% | 1.21% | 8.95% | 1.10% | ||||||||||||||
| Ratios and supplemental data: | ||||||||||||||||||||
| Net assets, end of period (000 omitted) | $ | 7,154 | $ | 9 | 3 | $ | 13 | 3 | $ | 13 | 3 | $ | 11 | 3 | ||||||
| Ratio of expenses to average net assets4 | 0.60% | 0.60% | 0.60% | 0.60% | 0.58% | |||||||||||||||
| Ratio of expenses to average net assets prior to fees waived4 | 1.45% | 1.21% | 1.12% | 1.16% | 1.20% | |||||||||||||||
| Ratio of net investment income to average net assets | 3.27% | 2.12% | 2.23% | 2.75% | 2.74% | |||||||||||||||
| Ratio of net investment income to average net assets prior to fees waived | 2.42% | 1.51% | 1.71% | 2.19% | 2.12% | |||||||||||||||
| Portfolio turnover | 28% | 16% | 9% | 10% | 10% | |||||||||||||||
| 1 | Calculated using average shares outstanding. |
| 2 | Total return is based on the change in net asset value of a share during the period and assumes reinvestment of dividends and distributions at net asset value. Total return during the period reflects waivers by the manager and/or distributor. Performance would have been lower had the waivers not been in effect. |
| 3 | Net assets reported in millions. |
| 4 | Expense ratios do not include expenses of any investment companies in which the Fund invests. |
See accompanying notes, which are an integral part of the financial statements.
151
Financial highlights
Delaware Ivy California Municipal High Income Fund Class Y
Selected data for each share of the Fund outstanding throughout each period were as follows:
| Year ended | ||||||||||||||||||||
| 9/30/22 | 9/30/21 | 9/30/20 | 9/30/19 | 9/30/18 | ||||||||||||||||
| Net asset value, beginning of period | $ | 10.68 | $ | 10.48 | $ | 10.58 | $ | 9.98 | $ | 10.16 | ||||||||||
| Income (loss) from investment operations: | ||||||||||||||||||||
| Net investment income1 | 0.26 | 0.21 | 0.21 | 0.26 | 0.25 | |||||||||||||||
| Net realized and unrealized gain (loss) | (1.66 | ) | 0.20 | (0.11 | ) | 0.60 | (0.15 | ) | ||||||||||||
| Total from investment operations | (1.40 | ) | 0.41 | 0.10 | 0.86 | 0.10 | ||||||||||||||
| Less dividends and distributions from: | ||||||||||||||||||||
| Net investment income | (0.27 | ) | (0.21 | ) | (0.20 | ) | (0.26 | ) | (0.26 | ) | ||||||||||
| Net realized gain | (0.11 | ) | — | — | — | (0.02 | ) | |||||||||||||
| Total dividends and distributions | (0.38 | ) | (0.21 | ) | (0.20 | ) | (0.26 | ) | (0.28 | ) | ||||||||||
| Net asset value, end of period | $ | 8.90 | $ | 10.68 | $ | 10.48 | $ | 10.58 | $ | 9.98 | ||||||||||
| Total return2 | (13.48% | ) | 3.97% | 1.01% | 8.73% | 0.93% | ||||||||||||||
| Ratios and supplemental data: | ||||||||||||||||||||
| Net assets, end of period (000 omitted) | $ | 77 | $ | 1 | 3 | $ | 1 | 3 | $ | 1 | 3 | $ | 1 | 3 | ||||||
| Ratio of expenses to average net assets4 | 0.80% | 0.80% | 0.80% | 0.80% | 0.78% | |||||||||||||||
| Ratio of expenses to average net assets prior to fees waived4 | 1.26% | 1.45% | 1.35% | 1.40% | 1.44% | |||||||||||||||
| Ratio of net investment income to average net assets | 2.51% | 1.96% | 2.03% | 2.55% | 2.56% | |||||||||||||||
| Ratio of net investment income to average net assets prior to fees waived | 2.05% | 1.31% | 1.48% | 1.95% | 1.90% | |||||||||||||||
| Portfolio turnover | 28% | 16% | 9% | 10% | 10% | |||||||||||||||
| 1 | Calculated using average shares outstanding. |
| 2 | Total return is based on the change in net asset value of a share during the period and assumes reinvestment of dividends and distributions at net asset value. Total return during the period reflects waivers by the manager and/or distributor. Performance would have been lower had the waivers not been in effect. |
| 3 | Net assets reported in millions. |
| 4 | Expense ratios do not include expenses of any investment companies in which the Fund invests. |
See accompanying notes, which are an integral part of the financial statements.
152
Delaware Ivy Corporate Bond Fund Class A
Selected data for each share of the Fund outstanding throughout each period were as follows:
| Year ended | ||||||||||||||||||||
| 9/30/221 | 9/30/211 | 9/30/201 | 9/30/191 | 9/30/181 | ||||||||||||||||
| Net asset value, beginning of period | $ | 19.62 | $ | 20.70 | $ | 19.62 | $ | 18.06 | $ | 18.81 | ||||||||||
| Income (loss) from investment operations: | ||||||||||||||||||||
| Net investment income2 | 0.36 | 0.39 | 0.45 | 0.48 | 0.45 | |||||||||||||||
| Net realized and unrealized gain (loss) | (3.97 | ) | (0.03 | ) | 1.11 | 1.56 | (0.78 | ) | ||||||||||||
| Total from investment operations | (3.61 | ) | 0.36 | 1.56 | 2.04 | (0.33 | ) | |||||||||||||
| Less dividends and distributions from: | ||||||||||||||||||||
| Net investment income | (0.39 | ) | (0.42 | ) | (0.48 | ) | (0.48 | ) | (0.42 | ) | ||||||||||
| Net realized gain | (0.59 | ) | (1.02 | ) | — | — | — | |||||||||||||
| Total dividends and distributions | (0.98 | ) | (1.44 | ) | (0.48 | ) | (0.48 | ) | (0.42 | ) | ||||||||||
| Net asset value, end of period | $ | 15.03 | $ | 19.62 | $ | 20.70 | $ | 19.62 | $ | 18.06 | ||||||||||
| Total return3 | (19.22% | ) | 1.59% | 8.07% | 11.48% | (1.72% | ) | |||||||||||||
| Ratios and supplemental data: | ||||||||||||||||||||
| Net assets, end of period (000 omitted) | $ | 210,466 | $ | 333 | 4 | $ | 355 | 4 | $ | 348 | 4 | $ | 364 | 4 | ||||||
| Ratio of expenses to average net assets5 | 1.01% | 0.96% | 1.00% | 1.02% | 1.05% | |||||||||||||||
| Ratio of net investment income to average net assets | 2.05% | 1.89% | 2.26% | 2.54% | 2.41% | |||||||||||||||
| Portfolio turnover | 52% | 72% | 84% | 63% | 29% | |||||||||||||||
| 1 | On September 9, 2022, the Fund declared a 3 for 1 reverse stock split. The net asset values and per share information listed have been revised to reflect the reverse stock split. |
| 2 | Calculated using average shares outstanding. |
| 3 | Total return is based on the change in net asset value of a share during the period and assumes reinvestment of dividends and distributions at net asset value and does not reflect the impact of a sales charge. |
| 4 | Net assets reported in millions. |
| 5 | Expense ratios do not include expenses of any investment companies in which the Fund invests. |
See accompanying notes, which are an integral part of the financial statements.
153
Financial highlights
Delaware Ivy Corporate Bond Fund Class C
Selected data for each share of the Fund outstanding throughout each period were as follows:
| Year ended | ||||||||||||||||||||
| 9/30/221 | 9/30/211 | 9/30/201 | 9/30/191 | 9/30/181 | ||||||||||||||||
| Net asset value, beginning of period | $ | 19.59 | $ | 20.67 | $ | 19.59 | $ | 18.03 | $ | 18.78 | ||||||||||
| Income (loss) from investment operations: | ||||||||||||||||||||
| Net investment income2 | 0.18 | 0.21 | 0.27 | 0.30 | 0.27 | |||||||||||||||
| Net realized and unrealized gain (loss) | (3.96 | ) | (0.03 | ) | 1.11 | 1.56 | (0.75 | ) | ||||||||||||
| Total from investment operations | (3.78 | ) | 0.18 | 1.38 | 1.86 | (0.48 | ) | |||||||||||||
| Less dividends and distributions from: | ||||||||||||||||||||
| Net investment income | (0.21 | ) | (0.24 | ) | (0.30 | ) | (0.30 | ) | (0.27 | ) | ||||||||||
| Net realized gain | (0.59 | ) | (1.02 | ) | — | — | — | |||||||||||||
| Total dividends and distributions | (0.80 | ) | (1.26 | ) | (0.30 | ) | (0.30 | ) | (0.27 | ) | ||||||||||
| Net asset value, end of period | $ | 15.01 | $ | 19.59 | $ | 20.67 | $ | 19.59 | $ | 18.03 | ||||||||||
| Total return3 | (20.01% | ) | 0.68% | 7.13% | 10.52% | (2.63% | ) | |||||||||||||
| Ratios and supplemental data: | ||||||||||||||||||||
| Net assets, end of period (000 omitted) | $ | 1,271 | $ | 2 | 4 | $ | 4 | 4 | $ | 4 | 4 | $ | 4 | 4 | ||||||
| Ratio of expenses to average net assets5 | 2.05% | 1.84% | 1.89% | 1.92% | 1.94% | |||||||||||||||
| Ratio of net investment income to average net assets | 1.01% | 1.02% | 1.37% | 1.64% | 1.48% | |||||||||||||||
| Portfolio turnover | 52% | 72% | 84% | 63% | 29% | |||||||||||||||
| 1 | On September 9, 2022, the Fund declared a 3 for 1 reverse stock split. The net asset values and per share information listed have been restated to reflect the reverse stock split. |
| 2 | Calculated using average shares outstanding. |
| 3 | Total return is based on the change in net asset value of a share during the period and assumes reinvestment of dividends and distributions at net asset value and does not reflect the impact of a sales charge. |
| 4 | Net assets reported in millions. |
| 5 | Expense ratios do not include expenses of any investment companies in which the Fund invests. |
See accompanying notes, which are an integral part of the financial statements.
154
Delaware Ivy Corporate Bond Fund Class I
Selected data for each share of the Fund outstanding throughout each period were as follows:
| Year ended | ||||||||||||||||||||
| 9/30/221 | 9/30/211 | 9/30/201 | 9/30/191 | 9/30/181 | ||||||||||||||||
| Net asset value, beginning of period | $ | 19.62 | $ | 20.70 | $ | 19.62 | $ | 18.06 | $ | 18.81 | ||||||||||
| Income (loss) from investment operations: | ||||||||||||||||||||
| Net investment income2 | 0.41 | 0.42 | 0.51 | 0.54 | 0.51 | |||||||||||||||
| Net realized and unrealized gain (loss) | (3.97 | ) | (0.03 | ) | 1.11 | 1.56 | (0.78 | ) | ||||||||||||
| Total from investment operations | (3.56 | ) | 0.39 | 1.62 | 2.10 | (0.27 | ) | |||||||||||||
| Less dividends and distributions from: | ||||||||||||||||||||
| Net investment income | (0.43 | ) | (0.45 | ) | (0.54 | ) | (0.54 | ) | (0.48 | ) | ||||||||||
| Net realized gain | (0.59 | ) | (1.02 | ) | — | — | — | |||||||||||||
| Total dividends and distributions | (1.02 | ) | (1.47 | ) | (0.54 | ) | (0.54 | ) | (0.48 | ) | ||||||||||
| Net asset value, end of period | $ | 15.04 | $ | 19.62 | $ | 20.70 | $ | 19.62 | $ | 18.06 | ||||||||||
| Total return3 | (18.98% | ) | 1.87% | 8.39% | 11.84% | (1.41% | ) | |||||||||||||
| Ratios and supplemental data: | ||||||||||||||||||||
| Net assets, end of period (000 omitted) | $ | 202,864 | $ | 442 | 4 | $ | 460 | 4 | $ | 523 | 4 | $ | 545 | 4 | ||||||
| Ratio of expenses to average net assets5 | 0.72% | 0.70% | 0.71% | 0.70% | 0.72% | |||||||||||||||
| Ratio of net investment income to average net assets | 2.31% | 2.15% | 2.55% | 2.86% | 2.74% | |||||||||||||||
| Portfolio turnover | 52% | 72% | 84% | 63% | 29% | |||||||||||||||
| 1 | On September 9, 2022, the Fund declared a 3 for 1 reverse stock split. The net asset values and per share information listed have been restated to reflect the reverse stock split. |
| 2 | Calculated using average shares outstanding. |
| 3 | Total return is based on the change in net asset value of a share during the period and assumes reinvestment of dividends and distributions at net asset value. |
| 4 | Net assets reported in millions. |
| 5 | Expense ratios do not include expenses of any investment companies in which the Fund invests. |
See accompanying notes, which are an integral part of the financial statements.
155
Financial highlights
Delaware Ivy Corporate Bond Fund Class Y
Selected data for each share of the Fund outstanding throughout each period were as follows:
| Year ended | 10/16/171 to | |||||||||||||||||||
| 9/30/222 | 9/30/212 | 9/30/202 | 9/30/192 | 9/30/182 | ||||||||||||||||
| Net asset value, beginning of period | $ | 19.62 | $ | 20.70 | $ | 19.59 | $ | 18.03 | $ | 18.84 | ||||||||||
| Income (loss) from investment operations: | ||||||||||||||||||||
| Net investment income3 | 0.37 | 0.39 | 0.45 | 0.48 | 0.45 | |||||||||||||||
| Net realized and unrealized gain (loss) | (3.97 | ) | (0.06 | ) | 1.14 | 1.59 | (0.87 | ) | ||||||||||||
| Total from investment operations | (3.60 | ) | 0.33 | 1.59 | 2.07 | (0.42 | ) | |||||||||||||
| Less dividends and distributions from: | ||||||||||||||||||||
| Net investment income | (0.40 | ) | (0.39 | ) | (0.48 | ) | (0.51 | ) | (0.39 | ) | ||||||||||
| Net realized gain | (0.59 | ) | (1.02 | ) | — | — | — | |||||||||||||
| Total dividends and distributions | (0.99 | ) | (1.41 | ) | (0.48 | ) | (0.51 | ) | (0.39 | ) | ||||||||||
| Net asset value, end of period | $ | 15.03 | $ | 19.62 | $ | 20.70 | $ | 19.59 | $ | 18.03 | ||||||||||
| Total return4 | (19.18% | ) | 1.58% | 8.29% | 11.62% | (2.16% | ) | |||||||||||||
| Ratios and supplemental data: | ||||||||||||||||||||
| Net assets, end of period (000 omitted) | $ | 200 | $ | — | 5,6 | $ | — | 5,6 | $ | — | 5,6 | $ | — | 5,6 | ||||||
| Ratio of expenses to average net assets7 | 0.95% | 0.95% | 0.94% | 0.93% | 1.00% | |||||||||||||||
| Ratio of net investment income to average net assets | 2.13% | 1.90% | 2.32% | 2.62% | 2.62% | |||||||||||||||
| Portfolio turnover | 52% | 72% | 84% | 63% | 29% | 8 | ||||||||||||||
| 1 | Date of commencement of operations; ratios have been annualized and total return has not been annualized. |
| 2 | On September 9, 2022, the Fund declared a 3 for 1 reverse stock split. The net asset values and per share information listed have been restated to reflect the reverse stock split. |
| 3 | Calculated using average shares outstanding. |
| 4 | Total return is based on the change in net asset value of a share during the period and assumes reinvestment of dividends and distributions at net asset value. |
| 5 | Net assets reported in millions. |
| 6 | Rounds to less than $500 thousands. |
| 7 | Expense ratios do not include expenses of any investment companies in which the Fund invests. |
| 8 | Portfolio turnover is representative of the Fund for the period ended September 30, 2018. |
See accompanying notes, which are an integral part of the financial statements.
156
Delaware Ivy Crossover Credit Fund Class A
Selected data for each share of the Fund outstanding throughout each period were as follows:
| Year ended | ||||||||||||||||||||
| 9/30/22 | 9/30/21 | 9/30/20 | 9/30/19 | 9/30/18 | ||||||||||||||||
| Net asset value, beginning of period | $ | 10.88 | $ | 11.28 | $ | 10.51 | $ | 9.64 | $ | 10.26 | ||||||||||
| Income (loss) from investment operations: | ||||||||||||||||||||
| Net investment income1 | 0.22 | 0.21 | 0.28 | 0.32 | 0.30 | |||||||||||||||
| Net realized and unrealized gain (loss) | (2.30 | ) | 0.33 | 0.77 | 0.90 | (0.56 | ) | |||||||||||||
| Total from investment operations | (2.08 | ) | 0.54 | 1.05 | 1.22 | (0.26 | ) | |||||||||||||
| Less dividends and distributions from: | ||||||||||||||||||||
| Net investment income | (0.23 | ) | (0.22 | ) | (0.28 | ) | (0.35 | ) | (0.27 | ) | ||||||||||
| Net realized gain | (0.48 | ) | (0.72 | ) | — | — | (0.09 | ) | ||||||||||||
| Total dividends and distributions | (0.71 | ) | (0.94 | ) | (0.28 | ) | (0.35 | ) | (0.36 | ) | ||||||||||
| Net asset value, end of period | $ | 8.09 | $ | 10.88 | $ | 11.28 | $ | 10.51 | $ | 9.64 | ||||||||||
| Total return2 | (20.27% | ) | 4.93% | 10.18% | 13.10% | (2.56% | ) | |||||||||||||
| Ratios and supplemental data: | ||||||||||||||||||||
| Net assets, end of period (000 omitted) | $ | 3,924 | $ | 7 | 3 | $ | 18 | 3 | $ | 12 | 3 | $ | 12 | 3 | ||||||
| Ratio of expenses to average net assets4 | 0.90% | 0.90% | 0.90% | 0.90% | 0.90% | |||||||||||||||
| Ratio of expenses to average net assets prior to fees waived4 | 1.69% | 1.23% | 1.21% | 1.25% | 1.19% | |||||||||||||||
| Ratio of net investment income to average net assets | 2.26% | 1.92% | 2.64% | 3.23% | 3.07% | |||||||||||||||
| Ratio of net investment income to average net assets prior to fees waived | 1.47% | 1.59% | 2.33% | 2.88% | 2.78% | |||||||||||||||
| Portfolio turnover | 60% | 135% | 165% | 94% | 85% | |||||||||||||||
| 1 | Calculated using average shares outstanding. |
| 2 | Total return is based on the change in net asset value of a share during the period and assumes reinvestment of dividends and distributions at net asset value and does not reflect the impact of a sales charge. Total return during the period reflects waivers by the manager and/or distributor. Performance would have been lower had the waivers not been in effect. |
| 3 | Net assets reported in millions. |
| 4 | Expense ratios do not include expenses of any investment companies in which the Fund invests. |
See accompanying notes, which are an integral part of the financial statements.
157
Financial highlights
Delaware Ivy Crossover Credit Fund Class I
Selected data for each share of the Fund outstanding throughout each period were as follows:
| Year ended | ||||||||||||||||||||
| 9/30/22 | 9/30/21 | 9/30/20 | 9/30/19 | 9/30/18 | ||||||||||||||||
| Net asset value, beginning of period | $ | 10.88 | $ | 11.28 | $ | 10.51 | $ | 9.64 | $ | 10.26 | ||||||||||
| Income (loss) from investment operations: | ||||||||||||||||||||
| Net investment income1 | 0.24 | 0.24 | 0.31 | 0.34 | 0.33 | |||||||||||||||
| Net realized and unrealized gain (loss) | (2.29 | ) | 0.33 | 0.77 | 0.90 | (0.56 | ) | |||||||||||||
| Total from investment operations | (2.05 | ) | 0.57 | 1.08 | 1.24 | (0.23 | ) | |||||||||||||
| Less dividends and distributions from: | ||||||||||||||||||||
| Net investment income | (0.26 | ) | (0.25 | ) | (0.31 | ) | (0.37 | ) | (0.30 | ) | ||||||||||
| Net realized gain | (0.48 | ) | (0.72 | ) | — | — | (0.09 | ) | ||||||||||||
| Total dividends and distributions | (0.74 | ) | (0.97 | ) | (0.31 | ) | (0.37 | ) | (0.39 | ) | ||||||||||
| Net asset value, end of period | $ | 8.09 | $ | 10.88 | $ | 11.28 | $ | 10.51 | $ | 9.64 | ||||||||||
| Total return2 | (20.05% | ) | 5.19% | 10.46% | 13.39% | (2.41% | ) | |||||||||||||
| Ratios and supplemental data: | ||||||||||||||||||||
| Net assets, end of period (000 omitted) | $ | 12,427 | $ | 30 | 3 | $ | 39 | 3 | $ | 27 | 3 | $ | 23 | 3 | ||||||
| Ratio of expenses to average net assets4 | 0.65% | 0.65% | 0.65% | 0.65% | 0.65% | |||||||||||||||
| Ratio of expenses to average net assets prior to fees waived4 | 1.27% | 1.03% | 1.06% | 1.13% | 1.06% | |||||||||||||||
| Ratio of net investment income to average net assets | 2.48% | 2.18% | 2.89% | 3.47% | 3.33% | |||||||||||||||
| Ratio of net investment income to average net assets prior to fees waived | 1.86% | 1.80% | 2.48% | 2.99% | 2.92% | |||||||||||||||
| Portfolio turnover | 60% | 135% | 165% | 94% | 85% | |||||||||||||||
| 1 | Calculated using average shares outstanding. |
| 2 | Total return is based on the change in net asset value of a share during the period and assumes reinvestment of dividends and distributions at net asset value. Total return during the period reflects waivers by the manager and/or distributor. Performance would have been lower had the waivers not been in effect. |
| 3 | Net assets reported in millions. |
| 4 | Expense ratios do not include expenses of any investment companies in which the Fund invests. |
See accompanying notes, which are an integral part of the financial statements.
158
Delaware Ivy Crossover Credit Fund Class Y
Selected data for each share of the Fund outstanding throughout each period were as follows:
| Year ended | ||||||||||||||||||||
| 9/30/22 | 9/30/21 | 9/30/20 | 9/30/19 | 9/30/18 | ||||||||||||||||
| Net asset value, beginning of period | $ | 10.88 | $ | 11.28 | $ | 10.51 | $ | 9.64 | $ | 10.26 | ||||||||||
| Income (loss) from investment operations: | ||||||||||||||||||||
| Net investment income1 | 0.22 | 0.21 | 0.28 | 0.32 | 0.30 | |||||||||||||||
| Net realized and unrealized gain (loss) | (2.31 | ) | 0.33 | 0.77 | 0.90 | (0.56 | ) | |||||||||||||
| Total from investment operations | (2.09 | ) | 0.54 | 1.05 | 1.22 | (0.26 | ) | |||||||||||||
| Less dividends and distributions from: | ||||||||||||||||||||
| Net investment income | (0.23 | ) | (0.22 | ) | (0.28 | ) | (0.35 | ) | (0.27 | ) | ||||||||||
| Net realized gain | (0.48 | ) | (0.72 | ) | — | — | (0.09 | ) | ||||||||||||
| Total dividends and distributions | (0.71 | ) | (0.94 | ) | (0.28 | ) | (0.35 | ) | (0.36 | ) | ||||||||||
| Net asset value, end of period | $ | 8.08 | $ | 10.88 | $ | 11.28 | $ | 10.51 | $ | 9.64 | ||||||||||
| Total return2 | (20.35% | ) | 4.93% | 10.18% | 13.10% | (2.56% | ) | |||||||||||||
| Ratios and supplemental data: | ||||||||||||||||||||
| Net assets, end of period (000 omitted) | $ | 953 | $ | 1 | 3 | $ | 1 | 3 | $ | 1 | 3 | $ | 1 | 3 | ||||||
| Ratio of expenses to average net assets4 | 0.90% | 0.90% | 0.90% | 0.90% | 0.90% | |||||||||||||||
| Ratio of expenses to average net assets prior to fees waived4 | 1.57% | 1.26% | 1.30% | 1.37% | 1.29% | |||||||||||||||
| Ratio of net investment income to average net assets | 2.29% | 1.93% | 2.65% | 3.23% | 3.06% | |||||||||||||||
| Ratio of net investment income to average net assets prior to fees waived | 1.62% | 1.57% | 2.25% | 2.76% | 2.67% | |||||||||||||||
| Portfolio turnover | 60% | 135% | 165% | 94% | 85% | |||||||||||||||
| 1 | Calculated using average shares outstanding. |
| 2 | Total return is based on the change in net asset value of a share during the period and assumes reinvestment of dividends and distributions at net asset value. Total return during the period reflects waivers by the manager and/or distributor. Performance would have been lower had the waivers not been in effect. |
| 3 | Net assets reported in millions. |
| 4 | Expense ratios do not include expenses of any investment companies in which the Fund invests. |
See accompanying notes, which are an integral part of the financial statements.
159
Financial highlights
Delaware Ivy Emerging Markets Local Currency Debt Fund Class A
Selected data for each share of the Fund outstanding throughout each period were as follows:
| Year ended | ||||||||||||||||||||
| 9/30/22 | 9/30/21 | 9/30/20 | 9/30/19 | 9/30/18 | ||||||||||||||||
| Net asset value, beginning of period | $ | 8.74 | $ | 8.46 | $ | 8.68 | $ | 8.22 | $ | 9.47 | ||||||||||
| Income (loss) from investment operations: | ||||||||||||||||||||
| Net investment income1 | 0.33 | 0.29 | 0.31 | 0.42 | 0.39 | |||||||||||||||
| Net realized and unrealized gain (loss) | (2.23 | ) | — | (0.43 | ) | 0.04 | (1.40 | ) | ||||||||||||
| Total from investment operations | (1.90 | ) | 0.29 | (0.12 | ) | 0.46 | (1.01 | ) | ||||||||||||
| Less dividends and distributions from: | ||||||||||||||||||||
| Net investment income | — | (0.01 | ) | (0.10 | ) | — | (0.24 | ) | ||||||||||||
| Total dividends and distributions | — | (0.01 | ) | (0.10 | ) | — | (0.24 | ) | ||||||||||||
| Net asset value, end of period | $ | 6.84 | $ | 8.74 | $ | 8.46 | $ | 8.68 | $ | 8.22 | ||||||||||
| Total return2 | (21.74% | ) | 3.40% | (1.39% | ) | 5.73% | (11.01% | ) | ||||||||||||
| Ratios and supplemental data: | ||||||||||||||||||||
| Net assets, end of period (000 omitted) | $ | 1,165 | $ | 3 | 3 | $ | 8 | 3 | $ | 9 | 3 | $ | 12 | 3 | ||||||
| Ratio of expenses to average net assets4 | 1.23% | 1.23% | 1.19% | 1.21% | 1.21% | |||||||||||||||
| Ratio of expenses to average net assets prior to fees waived4 | 2.53% | 1.63% | 1.50% | 1.44% | 1.45% | |||||||||||||||
| Ratio of net investment income to average net assets | 4.08% | 3.21% | 3.63% | 4.94% | 4.28% | |||||||||||||||
| Ratio of net investment income to average net assets prior to fees waived | 2.78% | 2.81% | 3.32% | 4.71% | 4.04% | |||||||||||||||
| Portfolio turnover | 63% | 120% | 121% | 111% | 90% | |||||||||||||||
| 1 | Calculated using average shares outstanding. |
| 2 | Total return is based on the change in net asset value of a share during the period and assumes reinvestment of dividends and distributions at net asset value and does not reflect the impact of a sales charge. Total return during the period reflects waivers by the manager and/or distributor. Performance would have been lower had the waivers not been in effect. |
| 3 | Net assets reported in millions. |
| 4 | Expense ratios do not include expenses of any investment companies in which the Fund invests. |
See accompanying notes, which are an integral part of the financial statements.
160
Delaware Ivy Emerging Markets Local Currency Debt Fund Class C
Selected data for each share of the Fund outstanding throughout each period were as follows:
| Year ended | ||||||||||||||||||||
| 9/30/22 | 9/30/21 | 9/30/20 | 9/30/19 | 9/30/18 | ||||||||||||||||
| Net asset value, beginning of period | $ | 8.45 | $ | 8.20 | $ | 8.47 | $ | 8.06 | $ | 9.28 | ||||||||||
| Income (loss) from investment operations: | ||||||||||||||||||||
| Net investment income1 | 0.25 | 0.23 | 0.25 | 0.36 | 0.31 | |||||||||||||||
| Net realized and unrealized gain (loss) | (2.14 | ) | 0.02 | (0.43 | ) | 0.05 | (1.37 | ) | ||||||||||||
| Total from investment operations | (1.89 | ) | 0.25 | (0.18 | ) | 0.41 | (1.06 | ) | ||||||||||||
| Less dividends and distributions from: | ||||||||||||||||||||
| Net investment income | — | — | (0.09 | ) | — | (0.16 | ) | |||||||||||||
| Total dividends and distributions | — | — | (0.09 | ) | — | (0.16 | ) | |||||||||||||
| Net asset value, end of period | $ | 6.56 | $ | 8.45 | $ | 8.20 | $ | 8.47 | $ | 8.06 | ||||||||||
| Total return2 | (22.37% | ) | 3.05% | (2.14% | ) | 5.09% | (11.56% | ) | ||||||||||||
| Ratios and supplemental data: | ||||||||||||||||||||
| Net assets, end of period (000 omitted) | $ | 61 | $ | — | 3,4 | $ | 2 | 3 | $ | 2 | 3 | $ | 2 | 3 | ||||||
| Ratio of expenses to average net assets5 | 2.00% | 1.84% | 1.83% | 1.85% | 1.86% | |||||||||||||||
| Ratio of expenses to average net assets prior to fees waived5 | 3.13% | 2.24% | 2.14% | 2.08% | 2.10% | |||||||||||||||
| Ratio of net investment income to average net assets | 3.31% | 2.66% | 3.02% | 4.36% | 3.54% | |||||||||||||||
| Ratio of net investment income to average net assets prior to fees waived | 2.18% | 2.24% | 2.71% | 4.13% | 3.30% | |||||||||||||||
| Portfolio turnover | 63% | 120% | 121% | 111% | 90% | |||||||||||||||
| 1 | Calculated using average shares outstanding. |
| 2 | Total return is based on the change in net asset value of a share during the period and assumes reinvestment of dividends and distributions at net asset value and does not reflect the impact of a sales charge. Total return during the period reflects waivers by the manager and/or distributor. Performance would have been lower had the waivers not been in effect. |
| 3 | Net assets reported in millions. |
| 4 | Rounds to less than $500 thousands. |
| 5 | Expense ratios do not include expenses of any investment companies in which the Fund invests. |
See accompanying notes, which are an integral part of the financial statements.
161
Financial highlights
Delaware Ivy Emerging Markets Local Currency Debt Fund Class I
Selected data for each share of the Fund outstanding throughout each period were as follows:
| Year ended | ||||||||||||||||||||
| 9/30/22 | 9/30/21 | 9/30/20 | 9/30/19 | 9/30/18 | ||||||||||||||||
| Net asset value, beginning of period | $ | 8.87 | $ | 8.57 | $ | 8.77 | $ | 8.28 | $ | 9.54 | ||||||||||
| Income (loss) from investment operations: | ||||||||||||||||||||
| Net investment income1 | 0.37 | 0.33 | 0.35 | 0.47 | 0.43 | |||||||||||||||
| Net realized and unrealized gain (loss) | (2.27 | ) | — | (0.44 | ) | 0.04 | (1.41 | ) | ||||||||||||
| Total from investment operations | (1.90 | ) | 0.33 | (0.09 | ) | 0.51 | (0.98 | ) | ||||||||||||
| Less dividends and distributions from: | ||||||||||||||||||||
| Net investment income | — | (0.03 | ) | (0.11 | ) | (0.02 | ) | (0.28 | ) | |||||||||||
| Total dividends and distributions | — | (0.03 | ) | (0.11 | ) | (0.02 | ) | (0.28 | ) | |||||||||||
| Net asset value, end of period | $ | 6.97 | $ | 8.87 | $ | 8.57 | $ | 8.77 | $ | 8.28 | ||||||||||
| Total return2 | (21.42% | ) | 3.88% | (1.07% | ) | 6.17% | (10.56% | ) | ||||||||||||
| Ratios and supplemental data: | ||||||||||||||||||||
| Net assets, end of period (000 omitted) | $ | 7,252 | $ | 28 | 3 | $ | 28 | 3 | $ | 77 | 3 | $ | 80 | 3 | ||||||
| Ratio of expenses to average net assets4 | 0.80% | 0.80% | 0.80% | 0.80% | 0.80% | |||||||||||||||
| Ratio of expenses to average net assets prior to fees waived4 | 1.73% | 1.42% | 1.29% | 1.21% | 1.23% | |||||||||||||||
| Ratio of net investment income to average net assets | 4.49% | 3.64% | 4.07% | 5.43% | 4.80% | |||||||||||||||
| Ratio of net investment income to average net assets prior to fees waived | 3.56% | 3.02% | 3.58% | 5.02% | 4.37% | |||||||||||||||
| Portfolio turnover | 63% | 120% | 121% | 111% | 90% | |||||||||||||||
| 1 | Calculated using average shares outstanding. |
| 2 | Total return is based on the change in net asset value of a share during the period and assumes reinvestment of dividends and distributions at net asset value. Total return during the period reflects waivers by the manager and/or distributor. Performance would have been lower had the waivers not been in effect. |
| 3 | Net assets reported in millions. |
| 4 | Expense ratios do not include expenses of any investment companies in which the Fund invests. |
See accompanying notes, which are an integral part of the financial statements.
162
Delaware Ivy Emerging Markets Local Currency Debt Fund Class R6
Selected data for each share of the Fund outstanding throughout each period were as follows:
| Year ended | ||||||||||||||||||||
| 9/30/22 | 9/30/21 | 9/30/20 | 9/30/19 | 9/30/18 | ||||||||||||||||
| Net asset value, beginning of period | $ | 8.86 | $ | 8.57 | $ | 8.77 | $ | 8.28 | $ | 9.54 | ||||||||||
| Income (loss) from investment operations: | ||||||||||||||||||||
| Net investment income1 | 0.36 | 0.32 | 0.36 | 0.46 | 0.44 | |||||||||||||||
| Net realized and unrealized gain (loss) | (2.26 | ) | — | (0.45 | ) | 0.05 | (1.42 | ) | ||||||||||||
| Total from investment operations | (1.90 | ) | 0.32 | (0.09 | ) | 0.51 | (0.98 | ) | ||||||||||||
| Less dividends and distributions from: | ||||||||||||||||||||
| Net investment income | — | (0.03 | ) | (0.11 | ) | (0.02 | ) | (0.28 | ) | |||||||||||
| Total dividends and distributions | — | (0.03 | ) | (0.11 | ) | (0.02 | ) | (0.28 | ) | |||||||||||
| Net asset value, end of period | $ | 6.96 | $ | 8.86 | $ | 8.57 | $ | 8.77 | $ | 8.28 | ||||||||||
| Total return2 | (21.45% | ) | 3.76% | (1.07% | ) | 6.17% | (10.56% | ) | ||||||||||||
| Ratios and supplemental data: | ||||||||||||||||||||
| Net assets, end of period (000 omitted) | $ | 13,672 | $ | 21 | 3 | $ | 20 | 3 | $ | 34 | 3 | $ | 41 | 3 | ||||||
| Ratio of expenses to average net assets4 | 0.80% | 0.80% | 0.80% | 0.80% | 0.80% | |||||||||||||||
| Ratio of expenses to average net assets prior to fees waived4 | 1.54% | 1.21% | 1.12% | 1.04% | 1.05% | |||||||||||||||
| Ratio of net investment income to average net assets | 4.50% | 3.57% | 4.12% | 5.36% | 4.83% | |||||||||||||||
| Ratio of net investment income to average net assets prior to fees waived | 3.76% | 3.16% | 3.80% | 5.12% | 4.58% | |||||||||||||||
| Portfolio turnover | 63% | 120% | 121% | 111% | 90% | |||||||||||||||
| 1 | Calculated using average shares outstanding. |
| 2 | Total return is based on the change in net asset value of a share during the period and assumes reinvestment of dividends and distributions at net asset value. Total return during the period reflects waivers by the manager and/or distributor. Performance would have been lower had the waivers not been in effect. |
| 3 | Net assets reported in millions. |
| 4 | Expense ratios do not include expenses of any investment companies in which the Fund invests. |
See accompanying notes, which are an integral part of the financial statements.
163
Financial highlights
Delaware Ivy Emerging Markets Local Currency Debt Fund Class Y
Selected data for each share of the Fund outstanding throughout each period were as follows:
| Year ended | ||||||||||||||||||||
| 9/30/22 | 9/30/21 | 9/30/20 | 9/30/19 | 9/30/18 | ||||||||||||||||
| Net asset value, beginning of period | $ | 8.75 | $ | 8.46 | $ | 8.69 | $ | 8.22 | $ | 9.48 | ||||||||||
| Income (loss) from investment operations: | ||||||||||||||||||||
| Net investment income1 | 0.32 | 0.27 | 0.31 | 0.43 | 0.37 | |||||||||||||||
| Net realized and unrealized gain (loss) | (2.23 | ) | 0.03 | (0.44 | ) | 0.04 | (1.39 | ) | ||||||||||||
| Total from investment operations | (1.91 | ) | 0.30 | (0.13 | ) | 0.47 | (1.02 | ) | ||||||||||||
| Less dividends and distributions from: | ||||||||||||||||||||
| Net investment income | — | (0.01 | ) | (0.10 | ) | — | (0.24 | ) | ||||||||||||
| Total dividends and distributions | — | (0.01 | ) | (0.10 | ) | — | (0.24 | ) | ||||||||||||
| Net asset value, end of period | $ | 6.84 | $ | 8.75 | $ | 8.46 | $ | 8.69 | $ | 8.22 | ||||||||||
| Total return2 | (21.83% | ) | 3.52% | (1.51% | ) | 5.72% | (11.00% | ) | ||||||||||||
| Ratios and supplemental data: | ||||||||||||||||||||
| Net assets, end of period (000 omitted) | $ | 198 | $ | — | 3,4 | $ | 2 | 3 | $ | 3 | 3 | $ | 3 | 3 | ||||||
| Ratio of expenses to average net assets5 | 1.25% | 1.20% | 1.19% | 1.21% | 1.21% | |||||||||||||||
| Ratio of expenses to average net assets prior to fees waived5 | 2.01% | 1.60% | 1.51% | 1.44% | 1.45% | |||||||||||||||
| Ratio of net investment income to average net assets | 4.07% | 3.04% | 3.65% | 4.99% | 4.11% | |||||||||||||||
| Ratio of net investment income to average net assets prior to fees waived | 3.31% | 2.64% | 3.33% | 4.76% | 3.87% | |||||||||||||||
| Portfolio turnover | 63% | 120% | 121% | 111% | 90% | |||||||||||||||
| 1 | Calculated using average shares outstanding. |
| 2 | Total return is based on the change in net asset value of a share during the period and assumes reinvestment of dividends and distributions at net asset value. Total return during the period reflects waivers by the manager and/or distributor. Performance would have been lower had the waivers not been in effect. |
| 3 | Net assets reported in millions. |
| 4 | Rounds to less than $500 thousands. |
| 5 | Expense ratios do not include expenses of any investment companies in which the Fund invests. |
See accompanying notes, which are an integral part of the financial statements.
164
Delaware Ivy Government Securities Fund Class A
Selected data for each share of the Fund outstanding throughout each period were as follows:
| Year ended | ||||||||||||||||||||
| 9/30/22 | 9/30/21 | 9/30/20 | 9/30/19 | 9/30/18 | ||||||||||||||||
| Net asset value, beginning of period | $ | 5.61 | $ | 5.78 | $ | 5.59 | $ | 5.23 | $ | 5.43 | ||||||||||
| Income (loss) from investment operations: | ||||||||||||||||||||
| Net investment income1 | 0.04 | 0.03 | 0.06 | 0.08 | 0.06 | |||||||||||||||
| Net realized and unrealized gain (loss) | (0.80 | ) | (0.14 | ) | 0.20 | 0.37 | (0.19 | ) | ||||||||||||
| Total from investment operations | (0.76 | ) | (0.11 | ) | 0.26 | 0.45 | (0.13 | ) | ||||||||||||
| Less dividends and distributions from: | ||||||||||||||||||||
| Net investment income | (0.05 | ) | (0.06 | ) | (0.07 | ) | (0.09 | ) | (0.07 | ) | ||||||||||
| Total dividends and distributions | (0.05 | ) | (0.06 | ) | (0.07 | ) | (0.09 | ) | (0.07 | ) | ||||||||||
| Net asset value, end of period | $ | 4.80 | $ | 5.61 | $ | 5.78 | $ | 5.59 | $ | 5.23 | ||||||||||
| Total return2 | (13.67% | ) | (1.94% | ) | 4.75% | 8.59% | (2.35% | ) | ||||||||||||
| Ratios and supplemental data: | ||||||||||||||||||||
| Net assets, end of period (000 omitted) | $ | 55,336 | $ | 79 | 3 | $ | 96 | 3 | $ | 68 | 3 | $ | 71 | 3 | ||||||
| Ratio of expenses to average net assets4 | 0.97% | 0.97% | 0.98% | 1.00% | 1.04% | |||||||||||||||
| Ratio of expenses to average net assets prior to fees waived4 | 1.13% | 1.00% | 1.05% | 1.13% | 1.16% | |||||||||||||||
| Ratio of net investment income to average net assets | 0.67% | 0.59% | 1.07% | 1.47% | 1.19% | |||||||||||||||
| Ratio of net investment income to average net assets prior to fees waived | 0.51% | 0.56% | 1.00% | 1.34% | 1.07% | |||||||||||||||
| Portfolio turnover | 148% | 5 | 31% | 43% | 12% | 42% | ||||||||||||||
| 1 | Calculated using average shares outstanding. |
| 2 | Total return is based on the change in net asset value of a share during the period and assumes reinvestment of dividends and distributions at net asset value and does not reflect the impact of a sales charge. Total return during the period reflects waivers by the manager and/or distributor. Performance would have been lower had the waivers not been in effect. |
| 3 | Net assets reported in millions. |
| 4 | Expense ratios do not include expenses of any investment companies in which the Fund invests. |
| 5 | The Fund’s portfolio turnover rate increased substantially during the year ended September 30, 2022 due to a change in the Fund’s portfolio managers and associated repositioning. |
See accompanying notes, which are an integral part of the financial statements.
165
Financial highlights
Delaware Ivy Government Securities Fund Class C
Selected data for each share of the Fund outstanding throughout each period were as follows:
| Year ended | |||||||||||||||||||||
| 9/30/22 | 9/30/21 | 9/30/20 | 9/30/19 | 9/30/18 | |||||||||||||||||
| Net asset value, beginning of period | $ | 5.61 | $ | 5.78 | $ | 5.59 | $ | 5.23 | $ | 5.43 | |||||||||||
| Income (loss) from investment operations: | |||||||||||||||||||||
| Net investment income (loss)1 | (0.01 | ) | 2 | (0.01 | ) | 0.01 | 0.03 | 0.01 | |||||||||||||
| Net realized and unrealized gain (loss) | (0.80 | ) | (0.15 | ) | 0.20 | 0.37 | (0.18 | ) | |||||||||||||
| Total from investment operations | (0.81 | ) | (0.16 | ) | 0.21 | 0.40 | (0.17 | ) | |||||||||||||
| Less dividends and distributions from: | |||||||||||||||||||||
| Net investment income | — | 3 | (0.01 | ) | (0.02 | ) | (0.04 | ) | (0.03 | ) | |||||||||||
| Total dividends and distributions | — | 3 | (0.01 | ) | (0.02 | ) | (0.04 | ) | (0.03 | ) | |||||||||||
| Net asset value, end of period | $ | 4.80 | $ | 5.61 | $ | 5.78 | $ | 5.59 | $ | 5.23 | |||||||||||
| Total return4 | (14.44% | ) | 5 | (2.75% | ) | 3.83% | 7.61% | (3.14% | ) | ||||||||||||
| Ratios and supplemental data: | |||||||||||||||||||||
| Net assets, end of period (000 omitted) | $ | 754 | $ | 1 | 6 | $ | 2 | 6 | $ | 1 | 6 | $ | 1 | 6 | |||||||
| Ratio of expenses to average net assets7 | 1.83% | 1.82% | 1.86% | 1.88% | 1.88% | ||||||||||||||||
| Ratio of expenses to average net assets prior to fees waived7 | 2.06% | 1.82% | 1.90% | 1.95% | 2.16% | ||||||||||||||||
| Ratio of net investment income (loss) to average net assets | (0.19% | ) | (0.26% | ) | 0.18% | 0.59% | 0.24% | ||||||||||||||
| Ratio of net investment income (loss) to average net assets prior to fees waived | (0.42% | ) | (0.26% | ) | 0.14% | 0.52% | (0.04% | ) | |||||||||||||
| Portfolio turnover | 148% | 8 | 31% | 43% | 12% | 42% | |||||||||||||||
| 1 | Calculated using average shares outstanding. |
| 2 | The per share amount of net investment income (loss) does not directly correlate to the amounts reported in the Statements of operations due to class specific expenses. |
| 3 | Amount is less than $0.005 per share. |
| 4 | Total return is based on the change in net asset value of a share during the period and assumes reinvestment of dividends and distributions at net asset value and does not reflect the impact of a sales charge. |
| 5 | Total return during the period reflects waivers by the manager and/or distributor. Performance would have been lower had the waivers not been in effect. |
| 6 | Net assets reported in millions. |
| 7 | Expense ratios do not include expenses of any investment companies in which the Fund invests. |
| 8 | The Fund’s portfolio turnover rate increased substantially during the year ended September 30, 2022 due to a change in the Fund’s portfolio managers and associated repositioning. |
See accompanying notes, which are an integral part of the financial statements.
166
Delaware Ivy Government Securities Fund Class I
Selected data for each share of the Fund outstanding throughout each period were as follows:
| Year ended | ||||||||||||||||||||
| 9/30/22 | 9/30/21 | 9/30/20 | 9/30/19 | 9/30/18 | ||||||||||||||||
| Net asset value, beginning of period | $ | 5.61 | $ | 5.78 | $ | 5.59 | $ | 5.23 | $ | 5.43 | ||||||||||
| Income (loss) from investment operations: | ||||||||||||||||||||
| Net investment income1 | 0.05 | 0.05 | 0.08 | 0.09 | 0.08 | |||||||||||||||
| Net realized and unrealized gain (loss) | (0.80 | ) | (0.15 | ) | 0.20 | 0.37 | (0.19 | ) | ||||||||||||
| Total from investment operations | (0.75 | ) | (0.10 | ) | 0.28 | 0.46 | (0.11 | ) | ||||||||||||
| Less dividends and distributions from: | ||||||||||||||||||||
| Net investment income | (0.06 | ) | (0.07 | ) | (0.09 | ) | (0.10 | ) | (0.09 | ) | ||||||||||
| Total dividends and distributions | (0.06 | ) | (0.07 | ) | (0.09 | ) | (0.10 | ) | (0.09 | ) | ||||||||||
| Net asset value, end of period | $ | 4.80 | $ | 5.61 | $ | 5.78 | $ | 5.59 | $ | 5.23 | ||||||||||
| Total return2 | (13.45% | ) | (1.69% | ) | 5.01% | 8.89% | (2.10% | ) | ||||||||||||
| Ratios and supplemental data: | ||||||||||||||||||||
| Net assets, end of period (000 omitted) | $ | 101,424 | $ | 130 | 3 | $ | 140 | 3 | $ | 93 | 3 | $ | 124 | 3 | ||||||
| Ratio of expenses to average net assets4 | 0.72% | 0.72% | 0.72% | 0.72% | 0.78% | |||||||||||||||
| Ratio of expenses to average net assets prior to fees waived4 | 0.80% | 0.76% | 0.77% | 0.77% | 0.82% | |||||||||||||||
| Ratio of net investment income to average net assets | 0.91% | 0.84% | 1.32% | 1.75% | 1.46% | |||||||||||||||
| Ratio of net investment income to average net assets prior to fees waived | 0.83% | 0.80% | 1.27% | 1.70% | 1.42% | |||||||||||||||
| Portfolio turnover | 148% | 5 | 31% | 43% | 12% | 42% | ||||||||||||||
| 1 | Calculated using average shares outstanding. |
| 2 | Total return is based on the change in net asset value of a share during the period and assumes reinvestment of dividends and distributions at net asset value. Total return during the period reflects waivers by the manager and/or distributor. Performance would have been lower had the waivers not been in effect. |
| 3 | Net assets reported in millions. |
| 4 | Expense ratios do not include expenses of any investment companies in which the Fund invests. |
| 5 | The Fund’s portfolio turnover rate increased substantially during the year ended September 30, 2022 due to a change in the Fund’s portfolio managers and associated repositioning. |
See accompanying notes, which are an integral part of the financial statements.
167
Financial highlights
Delaware Ivy Government Securities Fund Class R6
Selected data for each share of the Fund outstanding throughout each period were as follows:
| Year ended | 10/16/171 to | ||||||||||||||||||||
| 9/30/22 | 9/30/21 | 9/30/20 | 9/30/19 | 9/30/18 | |||||||||||||||||
| Net asset value, beginning of period | $ | 5.61 | $ | 5.78 | $ | 5.59 | $ | 5.23 | $ | 5.43 | |||||||||||
| Income (loss) from investment operations: | |||||||||||||||||||||
| Net investment income2 | 0.05 | 0.05 | 0.08 | 0.10 | 0.08 | ||||||||||||||||
| Net realized and unrealized gain (loss) | (0.79 | ) | (0.14 | ) | 0.20 | 0.37 | (0.19 | ) | |||||||||||||
| Total from investment operations | (0.74 | ) | (0.09 | ) | 0.28 | 0.47 | (0.11 | ) | |||||||||||||
| Less dividends and distributions from: | |||||||||||||||||||||
| Net investment income | (0.07 | ) | (0.08 | ) | (0.09 | ) | (0.11 | ) | (0.09 | ) | |||||||||||
| Total dividends and distributions | (0.07 | ) | (0.08 | ) | (0.09 | ) | (0.11 | ) | (0.09 | ) | |||||||||||
| Net asset value, end of period | $ | 4.80 | $ | 5.61 | $ | 5.78 | $ | 5.59 | $ | 5.23 | |||||||||||
| Total return3 | (13.36% | ) | 4 | (1.57% | ) | 5.13% | 9.01% | (1.99% | ) | ||||||||||||
| Ratios and supplemental data: | |||||||||||||||||||||
| Net assets, end of period (000 omitted) | $ | 28,798 | $ | 138 | 5 | $ | 172 | 5 | $ | 120 | 5 | $ | 179 | 5 | |||||||
| Ratio of expenses to average net assets6 | 0.62% | 0.60% | 0.61% | 0.61% | 0.63% | ||||||||||||||||
| Ratio of expenses to average net assets prior to fees waived6 | 0.63% | 0.60% | 0.61% | 0.61% | 0.63% | ||||||||||||||||
| Ratio of net investment income to average net assets | 0.96% | 0.96% | 1.44% | 1.86% | 1.74% | ||||||||||||||||
| Ratio of net investment income to average net assets prior to fees waived | 0.95% | 0.96% | 1.44% | 1.86% | 1.74% | ||||||||||||||||
| Portfolio turnover | 148% | 7 | 31% | 43% | 12% | 42% | 8 | ||||||||||||||
| 1 | Date of commencement of operations; ratios have been annualized and total return has not been annualized. |
| 2 | Calculated using average shares outstanding. |
| 3 | Total return is based on the change in net asset value of a share during the period and assumes reinvestment of dividends and distributions at net asset value. |
| 4 | Total return during the period reflects waivers by the manager and/or distributor. Performance would have been lower had the waivers not been in effect. |
| 5 | Net assets reported in millions. |
| 6 | Expense ratios do not include expenses of any investment companies in which the Fund invests. |
| 7 | The Fund’s portfolio turnover rate increased substantially during the year ended September 30, 2022 due to a change in the Fund’s portfolio managers and associated repositioning. |
| 8 | Portfolio turnover is representative of the Fund for the period ended September 30, 2018. |
See accompanying notes, which are an integral part of the financial statements.
168
Delaware Ivy High Yield Fund Class A
Selected data for each share of the Fund outstanding throughout each period were as follows:
| Year ended | ||||||||||||||||||||
| 9/30/22 | 9/30/21 | 9/30/20 | 9/30/19 | 9/30/18 | ||||||||||||||||
| Net asset value, beginning of period | $ | 10.24 | $ | 9.72 | $ | 9.88 | $ | 9.81 | $ | 10.15 | ||||||||||
| Income (loss) from investment operations: | ||||||||||||||||||||
| Net investment income1 | 0.47 | 0.47 | 0.48 | 0.52 | 0.48 | |||||||||||||||
| Net realized and unrealized gain (loss) | (1.98 | ) | 0.54 | (0.16 | ) | 0.06 | (0.30 | ) | ||||||||||||
| Total from investment operations | (1.51 | ) | 1.01 | 0.32 | 0.58 | 0.18 | ||||||||||||||
| Less dividends and distributions from: | ||||||||||||||||||||
| Net investment income | (0.50 | ) | (0.49 | ) | (0.48 | ) | (0.51 | ) | (0.49 | ) | ||||||||||
| Net realized gain | (0.27 | ) | — | — | — | (0.03 | ) | |||||||||||||
| Total dividends and distributions | (0.77 | ) | (0.49 | ) | (0.48 | ) | (0.51 | ) | (0.52 | ) | ||||||||||
| Net asset value, end of period | $ | 7.96 | $ | 10.24 | $ | 9.72 | $ | 9.88 | $ | 9.81 | ||||||||||
| Total return2 | (15.64% | ) | 10.50% | 3.40% | 6.27% | 1.71% | ||||||||||||||
| Ratios and supplemental data: | ||||||||||||||||||||
| Net assets, end of period (000 omitted) | $ | 9,968 | $ | 14 | 3 | $ | 15 | 3 | $ | 10 | 3 | $ | 8 | 3 | ||||||
| Ratio of expenses to average net assets4 | 0.99% | 0.99% | 0.99% | 1.00% | 1.00% | |||||||||||||||
| Ratio of expenses to average net assets prior to fees waived4 | 1.28% | 1.13% | 1.16% | 1.15% | 1.11% | |||||||||||||||
| Ratio of net investment income to average net assets | 5.05% | 4.64% | 5.02% | 5.32% | 4.83% | |||||||||||||||
| Ratio of net investment income to average net assets prior to fees waived | 4.76% | 4.50% | 4.85% | 5.17% | 4.72% | |||||||||||||||
| Portfolio turnover | 47% | 83% | 80% | 69% | 81% | |||||||||||||||
| 1 | Calculated using average shares outstanding. |
| 2 | Total return is based on the change in net asset value of a share during the period and assumes reinvestment of dividends and distributions at net asset value and does not reflect the impact of a sales charge. Total return during the period reflects waivers by the manager and/or distributor. Performance would have been lower had the waivers not been in effect. |
| 3 | Net assets reported in millions. |
| 4 | Expense ratios do not include expenses of any investment companies in which the Fund invests. |
See accompanying notes, which are an integral part of the financial statements.
169
Financial highlights
Delaware Ivy High Yield Fund Class I
Selected data for each share of the Fund outstanding throughout each period were as follows:
| Year ended | ||||||||||||||||||||
| 9/30/22 | 9/30/21 | 9/30/20 | 9/30/19 | 9/30/18 | ||||||||||||||||
| Net asset value, beginning of period | $ | 10.25 | $ | 9.72 | $ | 9.88 | $ | 9.81 | $ | 10.15 | ||||||||||
| Income (loss) from investment operations: | ||||||||||||||||||||
| Net investment income1 | 0.49 | 0.50 | 0.51 | 0.54 | 0.51 | |||||||||||||||
| Net realized and unrealized gain (loss) | (1.98 | ) | 0.54 | (0.17 | ) | 0.07 | (0.31 | ) | ||||||||||||
| Total from investment operations | (1.49 | ) | 1.04 | 0.34 | 0.61 | 0.20 | ||||||||||||||
| Less dividends and distributions from: | ||||||||||||||||||||
| Net investment income | (0.53 | ) | (0.51 | ) | (0.50 | ) | (0.54 | ) | (0.51 | ) | ||||||||||
| Net realized gain | (0.27 | ) | — | — | — | (0.03 | ) | |||||||||||||
| Total dividends and distributions | (0.80 | ) | (0.51 | ) | (0.50 | ) | (0.54 | ) | (0.54 | ) | ||||||||||
| Net asset value, end of period | $ | 7.96 | $ | 10.25 | $ | 9.72 | $ | 9.88 | $ | 9.81 | ||||||||||
| Total return2 | (15.51% | ) | 10.91% | 3.68% | 6.44% | 2.10% | ||||||||||||||
| Ratios and supplemental data: | ||||||||||||||||||||
| Net assets, end of period (000 omitted) | $ | 32,938 | $ | 85 | 3 | $ | 87 | 3 | $ | 54 | 3 | $ | 46 | 3 | ||||||
| Ratio of expenses to average net assets4 | 0.72% | 0.72% | 0.72% | 0.72% | 0.72% | |||||||||||||||
| Ratio of expenses to average net assets prior to fees waived4 | 1.03% | 0.97% | 1.01% | 1.02% | 1.00% | |||||||||||||||
| Ratio of net investment income to average net assets | 5.23% | 4.90% | 5.30% | 5.60% | 5.14% | |||||||||||||||
| Ratio of net investment income to average net assets prior to fees waived | 4.92% | 4.65% | 5.01% | 5.30% | 4.86% | |||||||||||||||
| Portfolio turnover | 47% | 83% | 80% | 69% | 81% | |||||||||||||||
| 1 | Calculated using average shares outstanding. |
| 2 | Total return is based on the change in net asset value of a share during the period and assumes reinvestment of dividends and distributions at net asset value. Total return during the period reflects waivers by the manager and/or distributor. Performance would have been lower had the waivers not been in effect. |
| 3 | Net assets reported in millions. |
| 4 | Expense ratios do not include expenses of any investment companies in which the Fund invests. |
See accompanying notes, which are an integral part of the financial statements.
170
Delaware Ivy High Yield Fund Class R6
Selected data for each share of the Fund outstanding throughout each period were as follows:
| Year ended | ||||||||||||||||||||
| 9/30/22 | 9/30/21 | 9/30/20 | 9/30/19 | 9/30/18 | ||||||||||||||||
| Net asset value, beginning of period | $ | 10.24 | $ | 9.71 | $ | 9.88 | $ | 9.80 | $ | 10.15 | ||||||||||
| Income (loss) from investment operations: | ||||||||||||||||||||
| Net investment income1 | 0.49 | 0.50 | 0.51 | 0.54 | 0.51 | |||||||||||||||
| Net realized and unrealized gain (loss) | (1.99 | ) | 0.54 | (0.18 | ) | 0.08 | (0.32 | ) | ||||||||||||
| Total from investment operations | (1.50 | ) | 1.04 | 0.33 | 0.62 | 0.19 | ||||||||||||||
| Less dividends and distributions from: | ||||||||||||||||||||
| Net investment income | (0.46 | ) | (0.51 | ) | (0.50 | ) | (0.54 | ) | (0.51 | ) | ||||||||||
| Net realized gain | (0.27 | ) | — | — | — | (0.03 | ) | |||||||||||||
| Total dividends and distributions | (0.73 | ) | (0.51 | ) | (0.50 | ) | (0.54 | ) | (0.54 | ) | ||||||||||
| Net asset value, end of period | $ | 8.01 | $ | 10.24 | $ | 9.71 | $ | 9.88 | $ | 9.80 | ||||||||||
| Total return2 | (15.56% | ) | 10.92% | 3.58% | 6.55% | 2.00% | ||||||||||||||
| Ratios and supplemental data: | ||||||||||||||||||||
| Net assets, end of period (000 omitted) | $ | 14 | $ | 35 | 3 | $ | 40 | 3 | $ | 38 | 3 | $ | 32 | 3 | ||||||
| Ratio of expenses to average net assets4 | 0.72% | 0.72% | 0.72% | 0.72% | 0.72% | |||||||||||||||
| Ratio of expenses to average net assets prior to fees waived4 | 0.87% | 0.80% | 0.83% | 0.84% | 0.83% | |||||||||||||||
| Ratio of net investment income to average net assets | 5.20% | 4.91% | 5.29% | 5.59% | 5.10% | |||||||||||||||
| Ratio of net investment income to average net assets prior to fees waived | 5.05% | 4.83% | 5.18% | 5.47% | 4.99% | |||||||||||||||
| Portfolio turnover | 47% | 83% | 80% | 69% | 81% | |||||||||||||||
| 1 | Calculated using average shares outstanding. |
| 2 | Total return is based on the change in net asset value of a share during the period and assumes reinvestment of dividends and distributions at net asset value. Total return during the period reflects waivers by the manager and/or distributor. Performance would have been lower had the waivers not been in effect. |
| 3 | Net assets reported in millions. |
| 4 | Expense ratios do not include expenses of any investment companies in which the Fund invests. |
See accompanying notes, which are an integral part of the financial statements.
171
Financial highlights
Delaware Ivy International Small Cap Fund Class A
Selected data for each share of the Fund outstanding throughout each period were as follows:
| Year ended | ||||||||||||||||||||
| 9/30/22 | 9/30/21 | 9/30/20 | 9/30/19 | 9/30/18 | ||||||||||||||||
| Net asset value, beginning of period | $ | 16.09 | $ | 12.42 | $ | 11.38 | $ | 12.28 | $ | 12.06 | ||||||||||
| Income (loss) from investment operations: | ||||||||||||||||||||
| Net investment income1 | 0.03 | 0.07 | 0.06 | 0.11 | 0.10 | |||||||||||||||
| Net realized and unrealized gain (loss) | (5.18 | ) | 3.64 | 1.19 | (0.85 | ) | 0.14 | |||||||||||||
| Total from investment operations | (5.15 | ) | 3.71 | 1.25 | (0.74 | ) | 0.24 | |||||||||||||
| Less dividends and distributions from: | ||||||||||||||||||||
| Net investment income | (0.84 | ) | (0.04 | ) | (0.21 | ) | (0.14 | ) | (0.02 | ) | ||||||||||
| Net realized gain | (1.61 | ) | — | — | (0.02 | ) | — | |||||||||||||
| Total dividends and distributions | (2.45 | ) | (0.04 | ) | (0.21 | ) | (0.16 | ) | (0.02 | ) | ||||||||||
| Net asset value, end of period | $ | 8.49 | $ | 16.09 | $ | 12.42 | $ | 11.38 | $ | 12.28 | ||||||||||
| Total return2 | (37.08% | ) | 29.97% | 11.04% | (5.92% | ) | 1.98% | |||||||||||||
| Ratios and supplemental data: | ||||||||||||||||||||
| Net assets, end of period (000 omitted) | $ | 3,285 | $ | 8 | 3 | $ | 16 | 3 | $ | 16 | 3 | $ | 18 | 3 | ||||||
| Ratio of expenses to average net assets4 | 1.37% | 1.37% | 1.37% | 1.39% | 1.45% | |||||||||||||||
| Ratio of expenses to average net assets prior to fees waived4 | 2.03% | 1.59% | 1.57% | 1.58% | 1.54% | |||||||||||||||
| Ratio of net investment income to average net assets | 0.23% | 0.48% | 0.50% | 1.02% | 0.79% | |||||||||||||||
| Ratio of net investment income (loss) to average net assets prior to fees waived | (0.43% | ) | 0.26% | 0.30% | 0.83% | 0.70% | ||||||||||||||
| Portfolio turnover | 132% | 5 | 47% | 75% | 73% | 60% | ||||||||||||||
| 1 | Calculated using average shares outstanding. |
| 2 | Total return is based on the change in net asset value of a share during the period and assumes reinvestment of dividends and distributions at net asset value and does not reflect the impact of a sales charge. Total return during the period reflects waivers by the manager and/or distributor. Performance would have been lower had the waivers not been in effect. |
| 3 | Net assets reported in millions. |
| 4 | Expense ratios do not include expenses of any investment companies in which the Fund invests. |
| 5 | The Fund’s portfolio turnover rate increased substantially during the year ended September 30, 2022 due to a change in the Fund’s portfolio managers and associated repositioning. |
See accompanying notes, which are an integral part of the financial statements.
172
Delaware Ivy International Small Cap Fund Class C
Selected data for each share of the Fund outstanding throughout each period were as follows:
| Year ended | |||||||||||||||||||||
| 9/30/22 | 9/30/21 | 9/30/20 | 9/30/19 | 9/30/18 | |||||||||||||||||
| Net asset value, beginning of period | $ | 15.85 | $ | 12.29 | $ | 11.27 | $ | 12.14 | $ | 12.00 | |||||||||||
| Income (loss) from investment operations: | |||||||||||||||||||||
| Net investment income (loss)1 | (0.06 | ) | 2 | (0.05 | ) | (0.03 | ) | 0.03 | 0.01 | ||||||||||||
| Net realized and unrealized gain (loss) | (5.10 | ) | 3.61 | 1.18 | (0.84 | ) | 0.13 | ||||||||||||||
| Total from investment operations | (5.16 | ) | 3.56 | 1.15 | (0.81 | ) | 0.14 | ||||||||||||||
| Less dividends and distributions from: | |||||||||||||||||||||
| Net investment income | (0.73 | ) | — | (0.13 | ) | (0.04 | ) | — | |||||||||||||
| Net realized gain | (1.61 | ) | — | — | (0.02 | ) | — | ||||||||||||||
| Total dividends and distributions | (2.34 | ) | — | (0.13 | ) | (0.06 | ) | — | |||||||||||||
| Net asset value, end of period | $ | 8.35 | $ | 15.85 | $ | 12.29 | $ | 11.27 | $ | 12.14 | |||||||||||
| Total return3 | (37.56% | ) | 28.97% | 10.22% | (6.62% | ) | 1.17% | ||||||||||||||
| Ratios and supplemental data: | |||||||||||||||||||||
| Net assets, end of period (000 omitted) | $ | 217 | $ | — | 4,5 | $ | 2 | 4 | $ | 2 | 4 | $ | 2 | 4 | |||||||
| Ratio of expenses to average net assets6 | 2.12% | 2.12% | 2.13% | 2.14% | 2.22% | ||||||||||||||||
| Ratio of expenses to average net assets prior to fees waived6 | 2.87% | 2.34% | 2.33% | 2.33% | 2.27% | ||||||||||||||||
| Ratio of net investment income (loss) to average net assets | (0.50% | ) | (0.33% | ) | (0.31% | ) | 0.25% | 0.11% | |||||||||||||
| Ratio of net investment income (loss) to average net assets prior to fees waived | (1.25% | ) | (0.55% | ) | (0.51% | ) | 0.06% | 0.06% | |||||||||||||
| Portfolio turnover | 132% | 7 | 47% | 75% | 73% | 60% | |||||||||||||||
| 1 | Calculated using average shares outstanding. |
| 2 | The per share amount of net investment income (loss) does not directly correlate to the amounts reported in the Statements of operations due to class specific expenses. |
| 3 | Total return is based on the change in net asset value of a share during the period and assumes reinvestment of dividends and distributions at net asset value and does not reflect the impact of a sales charge. Total return during the period reflects waivers by the manager and/or distributor. Performance would have been lower had the waivers not been in effect. |
| 4 | Net assets reported in millions. |
| 5 | Rounds to less than $500 thousands. |
| 6 | Expense ratios do not include expenses of any investment companies in which the Fund invests. |
| 7 | The Fund’s portfolio turnover rate increased substantially during the year ended September 30, 2022 due to a change in the Fund’s portfolio managers and associated repositioning. |
See accompanying notes, which are an integral part of the financial statements.
173
Financial highlights
Delaware Ivy International Small Cap Fund Class I
Selected data for each share of the Fund outstanding throughout each period were as follows:
| Year ended | ||||||||||||||||||||
| 9/30/22 | 9/30/21 | 9/30/20 | 9/30/19 | 9/30/18 | ||||||||||||||||
| Net asset value, beginning of period | $ | 16.17 | $ | 12.47 | $ | 11.42 | $ | 12.33 | $ | 12.08 | ||||||||||
| Income (loss) from investment operations: | ||||||||||||||||||||
| Net investment income1 | 0.05 | 0.14 | 0.10 | 0.16 | 0.16 | |||||||||||||||
| Net realized and unrealized gain (loss) | (5.17 | ) | 3.64 | 1.21 | (0.87 | ) | 0.13 | |||||||||||||
| Total from investment operations | (5.12 | ) | 3.78 | 1.31 | (0.71 | ) | 0.29 | |||||||||||||
| Less dividends and distributions from: | ||||||||||||||||||||
| Net investment income | (0.90 | ) | (0.08 | ) | (0.26 | ) | (0.18 | ) | (0.04 | ) | ||||||||||
| Net realized gain | (1.61 | ) | — | — | (0.02 | ) | — | |||||||||||||
| Total dividends and distributions | (2.51 | ) | (0.08 | ) | (0.26 | ) | (0.20 | ) | (0.04 | ) | ||||||||||
| Net asset value, end of period | $ | 8.54 | $ | 16.17 | $ | 12.47 | $ | 11.42 | $ | 12.33 | ||||||||||
| Total return2 | (36.81% | ) | 30.45% | 11.54% | (5.64% | ) | 2.33% | |||||||||||||
| Ratios and supplemental data: | ||||||||||||||||||||
| Net assets, end of period (000 omitted) | $ | 12,838 | $ | 60 | 3 | $ | 77 | 3 | $ | 72 | 3 | $ | 66 | 3 | ||||||
| Ratio of expenses to average net assets4 | 0.99% | 0.99% | 0.99% | 0.99% | 1.12% | |||||||||||||||
| Ratio of expenses to average net assets prior to fees waived4 | 1.62% | 1.40% | 1.38% | 1.37% | 1.34% | |||||||||||||||
| Ratio of net investment income to average net assets | 0.43% | 0.96% | 0.91% | 1.47% | 1.28% | |||||||||||||||
| Ratio of net investment income (loss) to average net assets prior to fees waived | (0.20% | ) | 0.55% | 0.52% | 1.09% | 1.06% | ||||||||||||||
| Portfolio turnover | 132% | 5 | 47% | 75% | 73% | 60% | ||||||||||||||
| 1 | Calculated using average shares outstanding. |
| 2 | Total return is based on the change in net asset value of a share during the period and assumes reinvestment of dividends and distributions at net asset value. Total return during the period reflects waivers by the manager and/or distributor. Performance would have been lower had the waivers not been in effect. |
| 3 | Net assets reported in millions. |
| 4 | Expense ratios do not include expenses of any investment companies in which the Fund invests. |
| 5 | The Fund’s portfolio turnover rate increased substantially during the year ended September 30, 2022 due to a change in the Fund’s portfolio managers and associated repositioning. |
See accompanying notes, which are an integral part of the financial statements.
174
Delaware Ivy International Small Cap Fund Class R6
Selected data for each share of the Fund outstanding throughout each period were as follows:
| Year ended | ||||||||||||||||||||
| 9/30/22 | 9/30/21 | 9/30/20 | 9/30/19 | 9/30/18 | ||||||||||||||||
| Net asset value, beginning of period | $ | 16.17 | $ | 12.46 | $ | 11.42 | $ | 12.32 | $ | 12.09 | ||||||||||
| Income (loss) from investment operations: | ||||||||||||||||||||
| Net investment income1 | 0.07 | 0.14 | 0.10 | 0.15 | 0.16 | |||||||||||||||
| Net realized and unrealized gain (loss) | (5.20 | ) | 3.65 | 1.20 | (0.85 | ) | 0.11 | |||||||||||||
| Total from investment operations | (5.13 | ) | 3.79 | 1.30 | (0.70 | ) | 0.27 | |||||||||||||
| Less dividends and distributions from: | ||||||||||||||||||||
| Net investment income | (0.90 | ) | (0.08 | ) | (0.26 | ) | (0.18 | ) | (0.04 | ) | ||||||||||
| Net realized gain | (1.61 | ) | — | — | (0.02 | ) | — | |||||||||||||
| Total dividends and distributions | (2.51 | ) | (0.08 | ) | (0.26 | ) | (0.20 | ) | (0.04 | ) | ||||||||||
| Net asset value, end of period | $ | 8.53 | $ | 16.17 | $ | 12.46 | $ | 11.42 | $ | 12.32 | ||||||||||
| Total return2 | (36.87% | ) | 30.55% | 11.45% | (5.57% | ) | 2.28% | |||||||||||||
| Ratios and supplemental data: | ||||||||||||||||||||
| Net assets, end of period (000 omitted) | $ | 20,651 | $ | 52 | 3 | $ | 69 | 3 | $ | 73 | 3 | $ | 82 | 3 | ||||||
| Ratio of expenses to average net assets4 | 0.99% | 0.99% | 0.99% | 0.99% | 1.13% | |||||||||||||||
| Ratio of expenses to average net assets prior to fees waived4 | 1.48% | 1.22% | 1.20% | 1.20% | 1.18% | |||||||||||||||
| Ratio of net investment income to average net assets | 0.58% | 0.92% | 0.89% | 1.40% | 1.25% | |||||||||||||||
| Ratio of net investment income to average net assets prior to fees waived | 0.09% | 0.69% | 0.68% | 1.19% | 1.20% | |||||||||||||||
| Portfolio turnover | 132% | 5 | 47% | 75% | 73% | 60% | ||||||||||||||
| 1 | Calculated using average shares outstanding. |
| 2 | Total return is based on the change in net asset value of a share during the period and assumes reinvestment of dividends and distributions at net asset value. Total return during the period reflects waivers by the manager and/or distributor. Performance would have been lower had the waivers not been in effect. |
| 3 | Net assets reported in millions. |
| 4 | Expense ratios do not include expenses of any investment companies in which the Fund invests. |
| 5 | The Fund’s portfolio turnover rate increased substantially during the year ended September 30, 2022 due to a change in the Fund’s portfolio managers and associated repositioning. |
See accompanying notes, which are an integral part of the financial statements.
175
Financial highlights
Delaware Ivy International Small Cap Fund Class Y
Selected data for each share of the Fund outstanding throughout each period were as follows:
| Year ended | ||||||||||||||||||||
| 9/30/22 | 9/30/21 | 9/30/20 | 9/30/19 | 9/30/18 | ||||||||||||||||
| Net asset value, beginning of period | $ | 16.09 | $ | 12.42 | $ | 11.37 | $ | 12.28 | $ | 12.06 | ||||||||||
| Income (loss) from investment operations: | ||||||||||||||||||||
| Net investment income1 | 0.04 | 0.07 | 0.03 | 0.08 | 0.14 | |||||||||||||||
| Net realized and unrealized gain (loss) | (5.19 | ) | 3.64 | 1.23 | (0.83 | ) | 0.10 | |||||||||||||
| Total from investment operations | (5.15 | ) | 3.71 | 1.26 | (0.75 | ) | 0.24 | |||||||||||||
| Less dividends and distributions from: | ||||||||||||||||||||
| Net investment income | (0.84 | ) | (0.04 | ) | (0.21 | ) | (0.14 | ) | (0.02 | ) | ||||||||||
| Net realized gain | (1.61 | ) | — | — | (0.02 | ) | — | |||||||||||||
| Total dividends and distributions | (2.45 | ) | (0.04 | ) | (0.21 | ) | (0.16 | ) | (0.02 | ) | ||||||||||
| Net asset value, end of period | $ | 8.49 | $ | 16.09 | $ | 12.42 | $ | 11.37 | $ | 12.28 | ||||||||||
| Total return2 | (37.08% | ) | 29.97% | 11.14% | (6.00% | ) | 1.98% | |||||||||||||
| Ratios and supplemental data: | ||||||||||||||||||||
| Net assets, end of period (000 omitted) | $ | 10 | $ | — | 3,4 | $ | 1 | 3 | $ | 1 | 3 | $ | 5 | 3 | ||||||
| Ratio of expenses to average net assets5 | 1.35% | 1.37% | 1.37% | 1.39% | 1.45% | |||||||||||||||
| Ratio of expenses to average net assets prior to fees waived5 | 1.94% | 1.63% | 1.59% | 1.63% | 1.59% | |||||||||||||||
| Ratio of net investment income to average net assets | 0.34% | 0.50% | 0.27% | 0.71% | 1.10% | |||||||||||||||
| Ratio of net investment income (loss) to average net assets prior to fees waived | (0.25% | ) | 0.24% | 0.05% | 0.47% | 0.96% | ||||||||||||||
| Portfolio turnover | 132% | 6 | 47% | 75% | 73% | 60% | ||||||||||||||
| 1 | Calculated using average shares outstanding. |
| 2 | Total return is based on the change in net asset value of a share during the period and assumes reinvestment of dividends and distributions at net asset value. Total return during the period reflects waivers by the manager and/or distributor. Performance would have been lower had the waivers not been in effect. |
| 3 | Net assets reported in millions. |
| 4 | Rounds to less than $500 thousands. |
| 5 | Expense ratios do not include expenses of any investment companies in which the Fund invests. |
| 6 | The Fund’s portfolio turnover rate increased substantially during the year ended September 30, 2022 due to a change in the Fund’s portfolio managers and associated repositioning. |
See accompanying notes, which are an integral part of the financial statements.
176
Delaware Ivy Multi-Asset Income Fund Class A
Selected data for each share of the Fund outstanding throughout each period were as follows:
| Year ended | ||||||||||||||||||||||
| 9/30/22 | 9/30/21 | 9/30/20 | 9/30/19 | 9/30/18 | ||||||||||||||||||
| Net asset value, beginning of period | $ | 11.28 | $ | 9.81 | $ | 10.58 | $ | 11.07 | $ | 11.02 | ||||||||||||
| Income (loss) from investment operations: | ||||||||||||||||||||||
| Net investment income1 | 0.34 | 0.37 | 0.39 | 0.43 | 0.42 | |||||||||||||||||
| Net realized and unrealized gain (loss) | (2.18 | ) | 1.53 | (0.61 | ) | (0.13 | ) | 0.05 | ||||||||||||||
| Total from investment operations | (1.84 | ) | 1.90 | (0.22 | ) | 0.30 | 0.47 | |||||||||||||||
| Less dividends and distributions from: | ||||||||||||||||||||||
| Net investment income | (0.54 | ) | (0.43 | ) | (0.42 | ) | (0.45 | ) | (0.41 | ) | ||||||||||||
| Net realized gain | — | — | (0.13 | ) | (0.34 | ) | (0.01 | ) | ||||||||||||||
| Total dividends and distributions | (0.54 | ) | (0.43 | ) | (0.55 | ) | (0.79 | ) | (0.42 | ) | ||||||||||||
| Net asset value, end of period | $ | 8.90 | $ | 11.28 | $ | 9.81 | $ | 10.58 | $ | 11.07 | ||||||||||||
| Total return2 | (16.99% | ) | 3 | 19.57% | 3,4 | (2.10% | ) | 3 | 3.22% | 3 | 4.41% | |||||||||||
| Ratios and supplemental data: | ||||||||||||||||||||||
| Net assets, end of period (000 omitted) | $ | 56,948 | $ | 87 | 5 | $ | 88 | 5 | $ | 119 | 5 | $ | 131 | 5 | ||||||||
| Ratio of expenses to average net assets6 | 1.19% | 1.17% | 1.20% | 1.20% | 1.24% | |||||||||||||||||
| Ratio of expenses to average net assets prior to fees waived6 | 1.36% | 1.24% | 1.27% | 1.24% | 1.24% | |||||||||||||||||
| Ratio of net investment income to average net assets | 3.21% | 3.38% | 3.89% | 4.06% | 3.77% | |||||||||||||||||
| Ratio of net investment income to average net assets prior to fees waived | 3.04% | 3.31% | 3.82% | 4.02% | 3.77% | |||||||||||||||||
| Portfolio turnover | 127% | 7 | 57% | 71% | 54% | 59% | ||||||||||||||||
| 1 | Calculated using average shares outstanding. |
| 2 | Total return is based on the change in net asset value of a share during the period and assumes reinvestment of dividends and distributions at net asset value and does not reflect the impact of a sales charge. |
| 3 | Total return during the period reflects waivers by the manager and/or distributor. Performance would have been lower had the waivers not been in effect. |
| 4 | Payments from affiliates had no impact on net asset value and total return. |
| 5 | Net assets reported in millions. |
| 6 | Expense ratios do not include expenses of any investment companies in which the Fund invests. |
| 7 | The Fund’s portfolio turnover rate increased substantially during the year ended September 30, 2022 due to a change in the Fund’s portfolio managers and associated repositioning. |
See accompanying notes, which are an integral part of the financial statements.
177
Financial highlights
Delaware Ivy Multi-Asset Income Fund Class C
Selected data for each share of the Fund outstanding throughout each period were as follows:
| Year ended | ||||||||||||||||||||||
| 9/30/22 | 9/30/21 | 9/30/20 | 9/30/19 | 9/30/18 | ||||||||||||||||||
| Net asset value, beginning of period | $ | 11.27 | $ | 9.81 | $ | 10.58 | $ | 11.07 | $ | 11.02 | ||||||||||||
| Income (loss) from investment operations: | ||||||||||||||||||||||
| Net investment income1 | 0.26 | 0.29 | 0.32 | 0.35 | 0.33 | |||||||||||||||||
| Net realized and unrealized gain (loss) | (2.17 | ) | 1.51 | (0.61 | ) | (0.12 | ) | 0.06 | ||||||||||||||
| Total from investment operations | (1.91 | ) | 1.80 | (0.29 | ) | 0.23 | 0.39 | |||||||||||||||
| Less dividends and distributions from: | ||||||||||||||||||||||
| Net investment income | (0.45 | ) | (0.34 | ) | (0.35 | ) | (0.38 | ) | (0.33 | ) | ||||||||||||
| Net realized gain | — | — | (0.13 | ) | (0.34 | ) | (0.01 | ) | ||||||||||||||
| Total dividends and distributions | (0.45 | ) | (0.34 | ) | (0.48 | ) | (0.72 | ) | (0.34 | ) | ||||||||||||
| Net asset value, end of period | $ | 8.91 | $ | 11.27 | $ | 9.81 | $ | 10.58 | $ | 11.07 | ||||||||||||
| Total return2 | (17.54% | ) | 3 | 18.56% | 3,4 | (2.85% | ) | 3 | 2.46% | 3 | 3.64% | |||||||||||
| Ratios and supplemental data: | ||||||||||||||||||||||
| Net assets, end of period (000 omitted) | $ | 4,909 | $ | 8 | 5 | $ | 10 | 5 | $ | 14 | 5 | $ | 16 | 5 | ||||||||
| Ratio of expenses to average net assets6 | 1.99% | 1.95% | 1.96% | 1.94% | 1.98% | |||||||||||||||||
| Ratio of expenses to average net assets prior to fees waived6 | 2.18% | 2.02% | 2.03% | 1.98% | 1.98% | |||||||||||||||||
| Ratio of net investment income to average net assets | 2.40% | 2.61% | 3.13% | 3.31% | 3.01% | |||||||||||||||||
| Ratio of net investment income to average net assets prior to fees waived | 2.21% | 2.54% | 3.06% | 3.27% | 3.01% | |||||||||||||||||
| Portfolio turnover | 127% | 7 | 57% | 71% | 54% | 59% | ||||||||||||||||
| 1 | Calculated using average shares outstanding. |
| 2 | Total return is based on the change in net asset value of a share during the period and assumes reinvestment of dividends and distributions at net asset value and does not reflect the impact of a sales charge. |
| 3 | Total return during the period reflects waivers by the manager and/or distributor. Performance would have been lower had the waivers not been in effect. |
| 4 | Payments from affiliates had no impact on net asset value and total return. |
| 5 | Net assets reported in millions. |
| 6 | Expense ratios do not include expenses of any investment companies in which the Fund invests. |
| 7 | The Fund’s portfolio turnover rate increased substantially during the year ended September 30, 2022 due to a change in the Fund’s portfolio managers and associated repositioning. |
See accompanying notes, which are an integral part of the financial statements.
178
Delaware Ivy Multi-Asset Income Fund Class I
Selected data for each share of the Fund outstanding throughout each period were as follows:
| Year ended | ||||||||||||||||||||
| 9/30/22 | 9/30/21 | 9/30/20 | 9/30/19 | 9/30/18 | ||||||||||||||||
| Net asset value, beginning of period | $ | 11.28 | $ | 9.81 | $ | 10.59 | $ | 11.07 | $ | 11.02 | ||||||||||
| Income (loss) from investment operations: | ||||||||||||||||||||
| Net investment income1 | 0.39 | 0.42 | 0.43 | 0.47 | 0.45 | |||||||||||||||
| Net realized and unrealized gain (loss) | (2.18 | ) | 1.53 | (0.61 | ) | (0.11 | ) | 0.06 | ||||||||||||
| Total from investment operations | (1.79 | ) | 1.95 | (0.18 | ) | 0.36 | 0.51 | |||||||||||||
| Less dividends and distributions from: | ||||||||||||||||||||
| Net investment income | (0.59 | ) | (0.48 | ) | (0.47 | ) | (0.50 | ) | (0.45 | ) | ||||||||||
| Net realized gain | — | — | (0.13 | ) | (0.34 | ) | (0.01 | ) | ||||||||||||
| Total dividends and distributions | (0.59 | ) | (0.48 | ) | (0.60 | ) | (0.84 | ) | (0.46 | ) | ||||||||||
| Net asset value, end of period | $ | 8.90 | $ | 11.28 | $ | 9.81 | $ | 10.59 | $ | 11.07 | ||||||||||
| Total return2 | (16.64% | ) | 20.08% | 3 | (1.76% | ) | 3.77% | 4.71% | ||||||||||||
| Ratios and supplemental data: | ||||||||||||||||||||
| Net assets, end of period (000 omitted) | $ | 97,268 | $ | 211 | 4 | $ | 220 | 4 | $ | 320 | 4 | $ | 354 | 4 | ||||||
| Ratio of expenses to average net assets5 | 0.75% | 0.75% | 0.75% | 0.75% | 0.93% | |||||||||||||||
| Ratio of expenses to average net assets prior to fees waived5 | 1.05% | 0.99% | 0.99% | 0.97% | 0.96% | |||||||||||||||
| Ratio of net investment income to average net assets | 3.60% | 3.81% | 4.32% | 4.51% | 4.07% | |||||||||||||||
| Ratio of net investment income to average net assets prior to fees waived | 3.30% | 3.57% | 4.08% | 4.29% | 4.04% | |||||||||||||||
| Portfolio turnover | 127% | 6 | 57% | 71% | 54% | 59% | ||||||||||||||
| 1 | Calculated using average shares outstanding. |
| 2 | Total return is based on the change in net asset value of a share during the period and assumes reinvestment of dividends and distributions at net asset value. Total return during the period reflects waivers by the manager and/or distributor. Performance would have been lower had the waivers not been in effect. |
| 3 | Payments from affiliates had no impact on net asset value and total return. |
| 4 | Net assets reported in millions. |
| 5 | Expense ratios do not include expenses of any investment companies in which the Fund invests. |
| 6 | The Fund’s portfolio turnover rate increased substantially during the year ended September 30, 2022 due to a change in the Fund’s portfolio managers and associated repositioning. |
See accompanying notes, which are an integral part of the financial statements.
179
Financial highlights
Delaware Ivy Multi-Asset Income Fund Class R6
Selected data for each share of the Fund outstanding throughout each period were as follows:
| Year ended | ||||||||||||||||||||
| 9/30/22 | 9/30/21 | 9/30/20 | 9/30/19 | 9/30/18 | ||||||||||||||||
| Net asset value, beginning of period | $ | 11.28 | $ | 9.82 | $ | 10.59 | $ | 11.08 | $ | 11.03 | ||||||||||
| Income (loss) from investment operations: | ||||||||||||||||||||
| Net investment income1 | 0.39 | 0.43 | 0.44 | 0.47 | 0.47 | |||||||||||||||
| Net realized and unrealized gain (loss) | (2.18 | ) | 1.51 | (0.61 | ) | (0.12 | ) | 0.05 | ||||||||||||
| Total from investment operations | (1.79 | ) | 1.94 | (0.17 | ) | 0.35 | 0.52 | |||||||||||||
| Less dividends and distributions from: | ||||||||||||||||||||
| Net investment income | (0.59 | ) | (0.48 | ) | (0.47 | ) | (0.50 | ) | (0.46 | ) | ||||||||||
| Net realized gain | — | — | (0.13 | ) | (0.34 | ) | (0.01 | ) | ||||||||||||
| Total dividends and distributions | (0.59 | ) | (0.48 | ) | (0.60 | ) | (0.84 | ) | (0.47 | ) | ||||||||||
| Net asset value, end of period | $ | 8.90 | $ | 11.28 | $ | 9.82 | $ | 10.59 | $ | 11.08 | ||||||||||
| Total return2 | (16.60% | ) | 19.95% | 3 | (1.66% | ) | 3.69% | 4.96% | ||||||||||||
| Ratios and supplemental data: | ||||||||||||||||||||
| Net assets, end of period (000 omitted) | $ | 1,024 | $ | 2 | 4 | $ | 3 | 4 | $ | 4 | 4 | $ | 4 | 4 | ||||||
| Ratio of expenses to average net assets5 | 0.75% | 0.75% | 0.75% | 0.75% | 0.79% | |||||||||||||||
| Ratio of expenses to average net assets prior to fees waived5 | 0.92% | 0.84% | 0.84% | 0.92% | 0.80% | |||||||||||||||
| Ratio of net investment income to average net assets | 3.66% | 3.91% | 4.34% | 4.50% | 4.23% | |||||||||||||||
| Ratio of net investment income to average net assets prior to fees waived | 3.49% | 3.82% | 4.25% | 4.33% | 4.22% | |||||||||||||||
| Portfolio turnover | 127% | 6 | 57% | 71% | 54% | 59% | ||||||||||||||
| 1 | Calculated using average shares outstanding. |
| 2 | Total return is based on the change in net asset value of a share during the period and assumes reinvestment of dividends and distributions at net asset value. Total return during the period reflects waivers by the manager and/or distributor. Performance would have been lower had the waivers not been in effect. |
| 3 | Payments from affiliates had no impact on net asset value and total return. |
| 4 | Net assets reported in millions. |
| 5 | Expense ratios do not include expenses of any investment companies in which the Fund invests. |
| 6 | The Fund’s portfolio turnover rate increased substantially during the year ended September 30, 2022 due to a change in the Fund’s portfolio managers and associated repositioning. |
See accompanying notes, which are an integral part of the financial statements.
180
Delaware Ivy Multi-Asset Income Fund Class Y
Selected data for each share of the Fund outstanding throughout each period were as follows:
| Year ended | ||||||||||||||||||||||
| 9/30/22 | 9/30/21 | 9/30/20 | 9/30/19 | 9/30/18 | ||||||||||||||||||
| Net asset value, beginning of period | $ | 11.28 | $ | 9.82 | $ | 10.59 | $ | 11.07 | $ | 11.02 | ||||||||||||
| Income (loss) from investment operations: | ||||||||||||||||||||||
| Net investment income1 | 0.34 | 0.39 | 0.40 | 0.42 | 0.42 | |||||||||||||||||
| Net realized and unrealized gain (loss) | (2.17 | ) | 1.50 | (0.61 | ) | (0.10 | ) | 0.06 | ||||||||||||||
| Total from investment operations | (1.83 | ) | 1.89 | (0.21 | ) | 0.32 | 0.48 | |||||||||||||||
| Less dividends and distributions from: | ||||||||||||||||||||||
| Net investment income | (0.55 | ) | (0.43 | ) | (0.43 | ) | (0.46 | ) | (0.42 | ) | ||||||||||||
| Net realized gain | — | — | (0.13 | ) | (0.34 | ) | (0.01 | ) | ||||||||||||||
| Total dividends and distributions | (0.55 | ) | (0.43 | ) | (0.56 | ) | (0.80 | ) | (0.43 | ) | ||||||||||||
| Net asset value, end of period | $ | 8.90 | $ | 11.28 | $ | 9.82 | $ | 10.59 | $ | 11.07 | ||||||||||||
| Total return2 | (16.94% | ) | 3 | 19.50% | 3,4 | (2.06% | ) | 3 | 3.33% | 3 | 4.45% | |||||||||||
| Ratios and supplemental data: | ||||||||||||||||||||||
| Net assets, end of period (000 omitted) | $ | 88 | $ | — | 5,6 | $ | 3 | 5 | $ | 4 | 5 | $ | 6 | 5 | ||||||||
| Ratio of expenses to average net assets7 | 1.16% | 1.15% | 1.15% | 1.17% | 1.19% | |||||||||||||||||
| Ratio of expenses to average net assets prior to fees waived7 | 1.33% | 1.22% | 1.22% | 1.21% | 1.19% | |||||||||||||||||
| Ratio of net investment income to average net assets | 3.23% | 3.61% | 3.95% | 4.06% | 3.82% | |||||||||||||||||
| Ratio of net investment income to average net assets prior to fees waived | 3.06% | 3.54% | 3.88% | 4.02% | 3.82% | |||||||||||||||||
| Portfolio turnover | 127% | 8 | 57% | 71% | 54% | 59% | ||||||||||||||||
| 1 | Calculated using average shares outstanding. |
| 2 | Total return is based on the change in net asset value of a share during the period and assumes reinvestment of dividends and distributions at net asset value. |
| 3 | Total return during the period reflects waivers by the manager and/or distributor. Performance would have been lower had the waivers not been in effect. |
| 4 | Payments from affiliates had no impact on net asset value and total return. |
| 5 | Net assets reported in millions. |
| 6 | Rounds to less than $500 thousands. |
| 7 | Expense ratios do not include expenses of any investment companies in which the Fund invests. |
| 8 | The Fund’s portfolio turnover rate increased substantially during the year ended September 30, 2022 due to a change in the Fund’s portfolio managers and associated repositioning. |
See accompanying notes, which are an integral part of the financial statements.
181
Financial highlights
Delaware Ivy Strategic Income Fund Class A
Selected data for each share of the Fund outstanding throughout each period were as follows:
| Year ended | ||||||||||||||||||||
| 9/30/22 | 9/30/21 | 9/30/20 | 9/30/19 | 9/30/18 | ||||||||||||||||
| Net asset value, beginning of period | $ | 10.20 | $ | 9.92 | $ | 9.99 | $ | 9.97 | $ | 10.27 | ||||||||||
| Income (loss) from investment operations: | ||||||||||||||||||||
| Net investment income1 | 0.38 | 0.41 | 0.42 | 0.44 | 0.42 | |||||||||||||||
| Net realized and unrealized gain (loss) | (1.75 | ) | 0.33 | (0.05 | ) | 0.06 | (0.27 | ) | ||||||||||||
| Total from investment operations | (1.37 | ) | 0.74 | 0.37 | 0.50 | 0.15 | ||||||||||||||
| Less dividends and distributions from: | ||||||||||||||||||||
| Net investment income | (0.40 | ) | (0.46 | ) | (0.44 | ) | (0.45 | ) | (0.40 | ) | ||||||||||
| Net realized gain | — | — | — | (0.03 | ) | (0.05 | ) | |||||||||||||
| Total dividends and distributions | (0.40 | ) | (0.46 | ) | (0.44 | ) | (0.48 | ) | (0.45 | ) | ||||||||||
| Net asset value, end of period | $ | 8.43 | $ | 10.20 | $ | 9.92 | $ | 9.99 | $ | 9.97 | ||||||||||
| Total return2 | (13.81% | ) | 7.59% | 3 | 3.84% | 5.13% | 1.53% | |||||||||||||
| Ratios and supplemental data: | ||||||||||||||||||||
| Net assets, end of period (000 omitted) | $ | 54,645 | $ | 87 | 4 | $ | 111 | 4 | $ | 120 | 4 | $ | 117 | 4 | ||||||
| Ratio of expenses to average net assets5 | 1.06% | 1.04% | 1.05% | 1.05% | 1.15% | |||||||||||||||
| Ratio of expenses to average net assets prior to fees waived5 | 1.28% | 1.19% | 1.17% | 1.15% | 1.16% | |||||||||||||||
| Ratio of net investment income to average net assets | 4.04% | 4.01% | 4.35% | 4.45% | 4.14% | |||||||||||||||
| Ratio of net investment income to average net assets prior to fees waived | 3.82% | 3.86% | 4.23% | 4.35% | 4.13% | |||||||||||||||
| Portfolio turnover | 57% | 62% | 59% | 45% | 48% | |||||||||||||||
| 1 | Calculated using average shares outstanding. |
| 2 | Total return is based on the change in net asset value of a share during the period and assumes reinvestment of dividends and distributions at net asset value and does not reflect the impact of a sales charge. Total return during the period reflects waivers by the manager and/or distributor. Performance would have been lower had the waivers not been in effect. |
| 3 | Payments from affiliates had no impact on net asset value and total return. |
| 4 | Net assets reported in millions. |
| 5 | Expense ratios do not include expenses of any investment companies in which the Fund invests. |
See accompanying notes, which are an integral part of the financial statements.
182
Delaware Ivy Strategic Income Fund Class C
Selected data for each share of the Fund outstanding throughout each period were as follows:
| Year ended | ||||||||||||||||||||
| 9/30/22 | 9/30/21 | 9/30/20 | 9/30/19 | 9/30/18 | ||||||||||||||||
| Net asset value, beginning of period | $ | 10.19 | $ | 9.91 | $ | 9.98 | $ | 9.97 | $ | 10.27 | ||||||||||
| Income (loss) from investment operations: | ||||||||||||||||||||
| Net investment income1 | 0.31 | 0.33 | 0.35 | 0.36 | 0.35 | |||||||||||||||
| Net realized and unrealized gain (loss) | (1.75 | ) | 0.33 | (0.06 | ) | 0.05 | (0.27 | ) | ||||||||||||
| Total from investment operations | (1.44 | ) | 0.66 | 0.29 | 0.41 | 0.08 | ||||||||||||||
| Less dividends and distributions from: | ||||||||||||||||||||
| Net investment income | (0.32 | ) | (0.38 | ) | (0.36 | ) | (0.37 | ) | (0.33 | ) | ||||||||||
| Net realized gain | — | — | — | (0.03 | ) | (0.05 | ) | |||||||||||||
| Total dividends and distributions | (0.32 | ) | (0.38 | ) | (0.36 | ) | (0.40 | ) | (0.38 | ) | ||||||||||
| Net asset value, end of period | $ | 8.43 | $ | 10.19 | $ | 9.91 | $ | 9.98 | $ | 9.97 | ||||||||||
| Total return2 | (14.43% | ) | 6.77% | 3 | 3.03% | 4.21% | 0.82% | |||||||||||||
| Ratios and supplemental data: | ||||||||||||||||||||
| Net assets, end of period (000 omitted) | $ | 2,647 | $ | 5 | 4 | $ | 5 | 4 | $ | 5 | 4 | $ | 6 | 4 | ||||||
| Ratio of expenses to average net assets5 | 1.82% | 1.82% | 1.83% | 1.85% | 1.85% | |||||||||||||||
| Ratio of expenses to average net assets prior to fees waived5 | 2.25% | 2.05% | 2.08% | 2.04% | 2.02% | |||||||||||||||
| Ratio of net investment income to average net assets | 3.27% | 3.22% | 3.57% | 3.65% | 3.43% | |||||||||||||||
| Ratio of net investment income to average net assets prior to fees waived | 2.84% | 2.99% | 3.32% | 3.46% | 3.26% | |||||||||||||||
| Portfolio turnover | 57% | 62% | 59% | 45% | 48% | |||||||||||||||
| 1 | Calculated using average shares outstanding. |
| 2 | Total return is based on the change in net asset value of a share during the period and assumes reinvestment of dividends and distributions at net asset value and does not reflect the impact of a sales charge. Total return during the period reflects waivers by the manager and/or distributor. Performance would have been lower had the waivers not been in effect. |
| 3 | Payments from affiliates had no impact on net asset value and total return. |
| 4 | Net assets reported in millions. |
| 5 | Expense ratios do not include expenses of any investment companies in which the Fund invests. |
See accompanying notes, which are an integral part of the financial statements.
183
Financial highlights
Delaware Ivy Strategic Income Fund Class I
Selected data for each share of the Fund outstanding throughout each period were as follows:
| Year ended | ||||||||||||||||||||
| 9/30/22 | 9/30/21 | 9/30/20 | 9/30/19 | 9/30/18 | ||||||||||||||||
| Net asset value, beginning of period | $ | 10.20 | $ | 9.92 | $ | 9.99 | $ | 9.98 | $ | 10.28 | ||||||||||
| Income (loss) from investment operations: | ||||||||||||||||||||
| Net investment income1 | 0.42 | 0.45 | 0.46 | 0.48 | 0.45 | |||||||||||||||
| Net realized and unrealized gain (loss) | (1.75 | ) | 0.33 | (0.06 | ) | 0.05 | (0.27 | ) | ||||||||||||
| Total from investment operations | (1.33 | ) | 0.78 | 0.40 | 0.53 | 0.18 | ||||||||||||||
| Less dividends and distributions from: | ||||||||||||||||||||
| Net investment income | (0.43 | ) | (0.50 | ) | (0.47 | ) | (0.49 | ) | (0.43 | ) | ||||||||||
| Net realized gain | — | — | — | (0.03 | ) | (0.05 | ) | |||||||||||||
| Total dividends and distributions | (0.43 | ) | (0.50 | ) | (0.47 | ) | (0.52 | ) | (0.48 | ) | ||||||||||
| Net asset value, end of period | $ | 8.44 | $ | 10.20 | $ | 9.92 | $ | 9.99 | $ | 9.98 | ||||||||||
| Total return2 | (13.36% | ) | 7.99% | 3 | 4.23% | 5.43% | 1.95% | |||||||||||||
| Ratios and supplemental data: | ||||||||||||||||||||
| Net assets, end of period (000 omitted) | $ | 114,410 | $ | 241 | 4 | $ | 257 | 4 | $ | 315 | 4 | $ | 315 | 4 | ||||||
| Ratio of expenses to average net assets5 | 0.67% | 0.67% | 0.67% | 0.67% | 0.82% | |||||||||||||||
| Ratio of expenses to average net assets prior to fees waived5 | 1.00% | 0.98% | 0.96% | 0.93% | 0.93% | |||||||||||||||
| Ratio of net investment income to average net assets | 4.41% | 4.36% | 4.73% | 4.83% | 4.46% | |||||||||||||||
| Ratio of net investment income to average net assets prior to fees waived | 4.08% | 4.05% | 4.44% | 4.57% | 4.35% | |||||||||||||||
| Portfolio turnover | 57% | 62% | 59% | 45% | 48% | |||||||||||||||
| 1 | Calculated using average shares outstanding. |
| 2 | Total return is based on the change in net asset value of a share during the period and assumes reinvestment of dividends and distributions at net asset value. Total return during the period reflects waivers by the manager and/or distributor. Performance would have been lower had the waivers not been in effect. |
| 3 | Payments from affiliates had no impact on net asset value and total return. |
| 4 | Net assets reported in millions. |
| 5 | Expense ratios do not include expenses of any investment companies in which the Fund invests. |
See accompanying notes, which are an integral part of the financial statements.
184
Delaware Ivy Strategic Income Fund Class R6
Selected data for each share of the Fund outstanding throughout each period were as follows:
| Year ended | ||||||||||||||||||||
| 9/30/22 | 9/30/21 | 9/30/20 | 9/30/19 | 9/30/18 | ||||||||||||||||
| Net asset value, beginning of period | $ | 10.21 | $ | 9.92 | $ | 9.99 | $ | 9.98 | $ | 10.28 | ||||||||||
| Income (loss) from investment operations: | ||||||||||||||||||||
| Net investment income1 | 0.42 | 0.45 | 0.46 | 0.48 | 0.46 | |||||||||||||||
| Net realized and unrealized gain (loss) | (1.75 | ) | 0.34 | (0.06 | ) | 0.05 | (0.27 | ) | ||||||||||||
| Total from investment operations | (1.33 | ) | 0.79 | 0.40 | 0.53 | 0.19 | ||||||||||||||
| Less dividends and distributions from: | ||||||||||||||||||||
| Net investment income | (0.44 | ) | (0.50 | ) | (0.47 | ) | (0.49 | ) | (0.44 | ) | ||||||||||
| Net realized gain | — | — | — | (0.03 | ) | (0.05 | ) | |||||||||||||
| Total dividends and distributions | (0.44 | ) | (0.50 | ) | (0.47 | ) | (0.52 | ) | (0.49 | ) | ||||||||||
| Net asset value, end of period | $ | 8.44 | $ | 10.21 | $ | 9.92 | $ | 9.99 | $ | 9.98 | ||||||||||
| Total return2 | (13.44% | ) | 8.09% | 3 | 4.23% | 5.43% | 1.92% | |||||||||||||
| Ratios and supplemental data: | ||||||||||||||||||||
| Net assets, end of period (000 omitted) | $ | 796 | $ | 1 | 4 | $ | 22 | 4 | $ | 48 | 4 | $ | 53 | 4 | ||||||
| Ratio of expenses to average net assets5 | 0.67% | 0.67% | 0.67% | 0.67% | 0.77% | |||||||||||||||
| Ratio of expenses to average net assets prior to fees waived5 | 0.88% | 0.84% | 0.80% | 0.78% | 0.78% | |||||||||||||||
| Ratio of net investment income to average net assets | 4.45% | 4.72% | 4.71% | 4.83% | 4.52% | |||||||||||||||
| Ratio of net investment income to average net assets prior to fees waived | 4.24% | 4.55% | 4.58% | 4.72% | 4.51% | |||||||||||||||
| Portfolio turnover | 57% | 62% | 59% | 45% | 48% | |||||||||||||||
| 1 | Calculated using average shares outstanding. |
| 2 | Total return is based on the change in net asset value of a share during the period and assumes reinvestment of dividends and distributions at net asset value. Total return during the period reflects waivers by the manager and/or distributor. Performance would have been lower had the waivers not been in effect. |
| 3 | Payments from affiliates had no impact on net asset value and total return. |
| 4 | Net assets reported in millions. |
| 5 | Expense ratios do not include expenses of any investment companies in which the Fund invests. |
See accompanying notes, which are an integral part of the financial statements.
185
Financial highlights
Delaware Ivy Strategic Income Fund Class Y
Selected data for each share of the Fund outstanding throughout each period were as follows:
| Year ended | ||||||||||||||||||||
| 9/30/22 | 9/30/21 | 9/30/20 | 9/30/19 | 9/30/18 | ||||||||||||||||
| Net asset value, beginning of period | $ | 10.20 | $ | 9.92 | $ | 9.99 | $ | 9.97 | $ | 10.27 | ||||||||||
| Income (loss) from investment operations: | ||||||||||||||||||||
| Net investment income1 | 0.39 | 0.44 | 0.42 | 0.44 | 0.42 | |||||||||||||||
| Net realized and unrealized gain (loss) | (1.76 | ) | 0.30 | (0.05 | ) | 0.06 | (0.27 | ) | ||||||||||||
| Total from investment operations | (1.37 | ) | 0.74 | 0.37 | 0.50 | 0.15 | ||||||||||||||
| Less dividends and distributions from: | ||||||||||||||||||||
| Net investment income | (0.40 | ) | (0.46 | ) | (0.44 | ) | (0.45 | ) | (0.40 | ) | ||||||||||
| Net realized gain | — | — | — | (0.03 | ) | (0.05 | ) | |||||||||||||
| Total dividends and distributions | (0.40 | ) | (0.46 | ) | (0.44 | ) | (0.48 | ) | (0.45 | ) | ||||||||||
| Net asset value, end of period | $ | 8.43 | $ | 10.20 | $ | 9.92 | $ | 9.99 | $ | 9.97 | ||||||||||
| Total return2 | (13.80% | ) | 7.59% | 3 | 3.85% | 5.13% | 1.58% | |||||||||||||
| Ratios and supplemental data: | ||||||||||||||||||||
| Net assets, end of period (000 omitted) | $ | 90 | $ | — | 4,5 | $ | 7 | 4 | $ | 7 | 4 | $ | 8 | 4 | ||||||
| Ratio of expenses to average net assets6 | 1.06% | 1.04% | 1.05% | 1.05% | 1.10% | |||||||||||||||
| Ratio of expenses to average net assets prior to fees waived6 | 1.55% | 1.21% | 1.20% | 1.18% | 1.17% | |||||||||||||||
| Ratio of net investment income to average net assets | 4.06% | 4.32% | 4.35% | 4.46% | 4.18% | |||||||||||||||
| Ratio of net investment income to average net assets prior to fees waived | 3.57% | 4.15% | 4.20% | 4.33% | 4.11% | |||||||||||||||
| Portfolio turnover | 57% | 62% | 59% | 45% | 48% | |||||||||||||||
| 1 | Calculated using average shares outstanding. |
| 2 | Total return is based on the change in net asset value of a share during the period and assumes reinvestment of dividends and distributions at net asset value. Total return during the period reflects waivers by the manager and/or distributor. Performance would have been lower had the waivers not been in effect. |
| 3 | Payments from affiliates had no impact on net asset value and total return. |
| 4 | Net assets reported in millions. |
| 5 | Rounds to less than $500 thousands. |
| 6 | Expense ratios do not include expenses of any investment companies in which the Fund invests. |
See accompanying notes, which are an integral part of the financial statements.
186
Delaware Ivy Total Return Bond Fund Class A
Selected data for each share of the Fund outstanding throughout each period were as follows:
| Year ended | ||||||||||||||||||||
| 9/30/22 | 9/30/21 | 9/30/20 | 9/30/19 | 9/30/18 | ||||||||||||||||
| Net asset value, beginning of period | $ | 10.16 | $ | 10.22 | $ | 10.22 | $ | 10.02 | $ | 10.11 | ||||||||||
| Income (loss) from investment operations: | ||||||||||||||||||||
| Net investment income1 | 0.08 | 0.10 | 0.09 | 0.17 | 0.16 | |||||||||||||||
| Net realized and unrealized gain (loss) | (1.50 | ) | (0.04 | ) | 0.10 | 0.52 | (0.18 | ) | ||||||||||||
| Total from investment operations | (1.42 | ) | 0.06 | 0.19 | 0.69 | (0.02 | ) | |||||||||||||
| Less dividends and distributions from: | ||||||||||||||||||||
| Net investment income | (0.09 | ) | (0.02 | ) | (0.16 | ) | (0.49 | ) | (0.07 | ) | ||||||||||
| Net realized gain | (0.16 | ) | (0.10 | ) | (0.03 | ) | — | — | ||||||||||||
| Total dividends and distributions | (0.25 | ) | (0.12 | ) | (0.19 | ) | (0.49 | ) | (0.07 | ) | ||||||||||
| Net asset value, end of period | $ | 8.49 | $ | 10.16 | $ | 10.22 | $ | 10.22 | $ | 10.02 | ||||||||||
| Total return2 | (14.25% | ) | 0.77% | 2.07% | 7.23% | (0.22% | ) | |||||||||||||
| Ratios and supplemental data: | ||||||||||||||||||||
| Net assets, end of period (000 omitted) | $ | 7,125 | $ | 13 | 3 | $ | 23 | 3 | $ | 23 | 3 | $ | 21 | 3 | ||||||
| Ratio of expenses to average net assets4 | 1.33% | 1.24% | 1.22% | 1.22% | 1.22% | |||||||||||||||
| Ratio of expenses to average net assets prior to fees waived4 | 1.59% | 1.42% | 1.41% | 1.40% | 1.39% | |||||||||||||||
| Ratio of net investment income to average net assets | 0.81% | 0.95% | 0.90% | 1.74% | 1.56% | |||||||||||||||
| Ratio of net investment income to average net assets prior to fees waived | 0.55% | 0.77% | 0.71% | 1.56% | 1.39% | |||||||||||||||
| Portfolio turnover | 105% | 119% | 112% | 121% | 152% | |||||||||||||||
| 1 | Calculated using average shares outstanding. |
| 2 | Total return is based on the change in net asset value of a share during the period and assumes reinvestment of dividends and distributions at net asset value and does not reflect the impact of a sales charge. Total return during the period reflects waivers by the manager and/or distributor. Performance would have been lower had the waivers not been in effect. |
| 3 | Net assets reported in millions. |
| 4 | Expense ratios do not include expenses of any investment companies in which the Fund invests. |
See accompanying notes, which are an integral part of the financial statements.
187
Financial highlights
Delaware Ivy Total Return Bond Fund Class C
Selected data for each share of the Fund outstanding throughout each period were as follows:
| Year ended | ||||||||||||||||||||
| 9/30/22 | 9/30/21 | 9/30/20 | 9/30/19 | 9/30/18 | ||||||||||||||||
| Net asset value, beginning of period | $ | 10.03 | $ | 10.10 | $ | 10.10 | $ | 9.91 | $ | 10.05 | ||||||||||
| Income (loss) from investment operations: | ||||||||||||||||||||
| Net investment income1 | — | 2 | 0.02 | 0.02 | 0.10 | 0.09 | ||||||||||||||
| Net realized and unrealized gain (loss) | (1.47 | ) | (0.03 | ) | 0.10 | 0.51 | (0.17 | ) | ||||||||||||
| Total from investment operations | (1.47 | ) | (0.01 | ) | 0.12 | 0.61 | (0.08 | ) | ||||||||||||
| Less dividends and distributions from: | ||||||||||||||||||||
| Net investment income | (0.07 | ) | (0.01 | ) | (0.10 | ) | (0.42 | ) | (0.06 | ) | ||||||||||
| Net realized gain | (0.16 | ) | (0.05 | ) | (0.02 | ) | — | — | ||||||||||||
| Total dividends and distributions | (0.23 | ) | (0.06 | ) | (0.12 | ) | (0.42 | ) | (0.06 | ) | ||||||||||
| Net asset value, end of period | $ | 8.33 | $ | 10.03 | $ | 10.10 | $ | 10.10 | $ | 9.91 | ||||||||||
| Total return3 | (14.92% | ) | (0.17% | ) | 1.32% | 6.45% | (0.85% | ) | ||||||||||||
| Ratios and supplemental data: | ||||||||||||||||||||
| Net assets, end of period (000 omitted) | $ | 348 | $ | 1 | 4 | $ | 5 | 4 | $ | 4 | 4 | $ | 4 | 4 | ||||||
| Ratio of expenses to average net assets5 | 2.08% | 1.95% | 1.92% | 1.92% | 1.92% | |||||||||||||||
| Ratio of expenses to average net assets prior to fees waived5 | 2.58% | 2.13% | 2.11% | 2.10% | 2.09% | |||||||||||||||
| Ratio of net investment income to average net assets | 0.05% | 0.22% | 0.20% | 1.05% | 0.86% | |||||||||||||||
| Ratio of net investment income (loss) to average net assets prior to fees waived | (0.45% | ) | 0.04% | 0.01% | 0.87% | 0.69% | ||||||||||||||
| Portfolio turnover | 105% | 119% | 112% | 121% | 152% | |||||||||||||||
| 1 | Calculated using average shares outstanding. |
| 2 | Amount is less than $0.005 per share. |
| 3 | Total return is based on the change in net asset value of a share during the period and assumes reinvestment of dividends and distributions at net asset value and does not reflect the impact of a sales charge. Total return during the period reflects waivers by the manager and/or distributor. Performance would have been lower had the waivers not been in effect. |
| 4 | Net assets reported in millions. |
| 5 | Expense ratios do not include expenses of any investment companies in which the Fund invests. |
See accompanying notes, which are an integral part of the financial statements.
188
Delaware Ivy Total Return Bond Fund Class I
Selected data for each share of the Fund outstanding throughout each period were as follows:
| Year ended | ||||||||||||||||||||
| 9/30/22 | 9/30/21 | 9/30/20 | 9/30/19 | 9/30/18 | ||||||||||||||||
| Net asset value, beginning of period | $ | 10.20 | $ | 10.25 | $ | 10.26 | $ | 10.06 | $ | 10.13 | ||||||||||
| Income (loss) from investment operations: | ||||||||||||||||||||
| Net investment income1 | 0.10 | 0.12 | 0.11 | 0.20 | 0.18 | |||||||||||||||
| Net realized and unrealized gain (loss) | (1.50 | ) | (0.02 | ) | 0.09 | 0.51 | (0.18 | ) | ||||||||||||
| Total from investment operations | (1.40 | ) | 0.10 | 0.20 | 0.71 | — | 2 | |||||||||||||
| Less dividends and distributions from: | ||||||||||||||||||||
| Net investment income | (0.10 | ) | (0.03 | ) | (0.18 | ) | (0.51 | ) | (0.07 | ) | ||||||||||
| Net realized gain | (0.16 | ) | (0.12 | ) | (0.03 | ) | — | — | ||||||||||||
| Total dividends and distributions | (0.26 | ) | (0.15 | ) | (0.21 | ) | (0.51 | ) | (0.07 | ) | ||||||||||
| Net asset value, end of period | $ | 8.54 | $ | 10.20 | $ | 10.25 | $ | 10.26 | $ | 10.06 | ||||||||||
| Total return3 | (14.03% | ) | 0.96% | 2.19% | 7.45% | 0.03% | ||||||||||||||
| Ratios and supplemental data: | ||||||||||||||||||||
| Net assets, end of period (000 omitted) | $ | 37,651 | $ | 99 | 4 | $ | 102 | 4 | $ | 120 | 4 | $ | 123 | 4 | ||||||
| Ratio of expenses to average net assets5 | 1.00% | 1.00% | 1.00% | 1.00% | 1.00% | |||||||||||||||
| Ratio of expenses to average net assets prior to fees waived5 | 1.27% | 1.23% | 1.24% | 1.23% | 1.21% | |||||||||||||||
| Ratio of net investment income to average net assets | 1.10% | 1.20% | 1.12% | 1.98% | 1.79% | |||||||||||||||
| Ratio of net investment income to average net assets prior to fees waived | 0.83% | 0.98% | 0.88% | 1.75% | 1.58% | |||||||||||||||
| Portfolio turnover | 105% | 119% | 112% | 121% | 152% | |||||||||||||||
| 1 | Calculated using average shares outstanding. |
| 2 | Amount is less than $0.005 per share. |
| 3 | Total return is based on the change in net asset value of a share during the period and assumes reinvestment of dividends and distributions at net asset value. Total return during the period reflects waivers by the manager and/or distributor. Performance would have been lower had the waivers not been in effect. |
| 4 | Net assets reported in millions. |
| 5 | Expense ratios do not include expenses of any investment companies in which the Fund invests. |
See accompanying notes, which are an integral part of the financial statements.
189
Financial highlights
Delaware Ivy Total Return Bond Fund Class R6
Selected data for each share of the Fund outstanding throughout each period were as follows:
| Year ended | ||||||||||||||||||||
| 9/30/22 | 9/30/21 | 9/30/20 | 9/30/19 | 9/30/18 | ||||||||||||||||
| Net asset value, beginning of period | $ | 10.23 | $ | 10.28 | $ | 10.28 | $ | 10.08 | $ | 10.13 | ||||||||||
| Income (loss) from investment operations: | ||||||||||||||||||||
| Net investment income1 | 0.12 | 0.14 | 0.13 | 0.21 | 0.18 | |||||||||||||||
| Net realized and unrealized gain (loss) | (1.51 | ) | (0.03 | ) | 0.09 | 0.51 | (0.15 | ) | ||||||||||||
| Total from investment operations | (1.39 | ) | 0.11 | 0.22 | 0.72 | 0.03 | ||||||||||||||
| Less dividends and distributions from: | ||||||||||||||||||||
| Net investment income | (0.11 | ) | (0.03 | ) | (0.19 | ) | (0.52 | ) | (0.08 | ) | ||||||||||
| Net realized gain | (0.16 | ) | (0.13 | ) | (0.03 | ) | — | — | ||||||||||||
| Total dividends and distributions | (0.27 | ) | (0.16 | ) | (0.22 | ) | (0.52 | ) | (0.08 | ) | ||||||||||
| Net asset value, end of period | $ | 8.57 | $ | 10.23 | $ | 10.28 | $ | 10.28 | $ | 10.08 | ||||||||||
| Total return2 | (13.95% | ) | 1.08% | 2.41% | 7.57% | 0.25% | ||||||||||||||
| Ratios and supplemental data: | ||||||||||||||||||||
| Net assets, end of period (000 omitted) | $ | 34,574 | $ | 60 | 3 | $ | 56 | 3 | $ | 70 | 3 | $ | 89 | 3 | ||||||
| Ratio of expenses to average net assets4 | 0.87% | 0.87% | 0.87% | 0.87% | 0.87% | |||||||||||||||
| Ratio of expenses to average net assets prior to fees waived4 | 1.13% | 1.06% | 1.07% | 1.06% | 1.05% | |||||||||||||||
| Ratio of net investment income to average net assets | 1.26% | 1.33% | 1.24% | 2.11% | 1.79% | |||||||||||||||
| Ratio of net investment income to average net assets prior to fees waived | 1.00% | 1.14% | 1.04% | 1.92% | 1.61% | |||||||||||||||
| Portfolio turnover | 105% | 119% | 112% | 121% | 152% | |||||||||||||||
| 1 | Calculated using average shares outstanding. |
| 2 | Total return is based on the change in net asset value of a share during the period and assumes reinvestment of dividends and distributions at net asset value. Total return during the period reflects waivers by the manager and/or distributor. Performance would have been lower had the waivers not been in effect. |
| 3 | Net assets reported in millions. |
| 4 | Expense ratios do not include expenses of any investment companies in which the Fund invests. |
See accompanying notes, which are an integral part of the financial statements.
190
Ivy Funds
September 30, 2022
Ivy Funds (Trust) is organized as a Delaware statutory trust and offers 39 series. These financial statements and the related notes pertain to 10 funds: Delaware Ivy California Municipal High Income Fund, Delaware Ivy Corporate Bond Fund, Delaware Ivy Crossover Credit Fund, Delaware Ivy Emerging Markets Local Currency Debt Fund, Delaware Ivy Government Securities Fund, Delaware Ivy High Yield Fund (formerly, Delaware Ivy PineBridge High Yield Fund), Delaware Ivy International Small Cap Fund, Delaware Ivy Multi-Asset Income Fund (formerly, Delaware Ivy Apollo Multi-Asset Income Fund), Delaware Ivy Strategic Income Fund (formerly, Delaware Ivy Apollo Strategic Income Fund), and Delaware Ivy Total Return Bond Fund (formerly, Delaware Ivy Pictet Targeted Return Bond Fund), (each a Fund, or collectively, the Funds). The Trust is an open-end investment company. The Funds, except for Delaware Ivy Emerging Markets Local Currency Debt Fund are considered diversified under the Investment Company Act of 1940, as amended (1940 Act). Delaware Ivy Emerging Markets Local Currency Debt Fund is considered nondiversified.
Each Fund currently offers Class A shares. Each Fund (other than Delaware Ivy Crossover Credit Fund and Delaware Ivy High Yield Fund) offers Class C shares, and each Fund (other than Delaware Ivy Government Securities Fund, Delaware Ivy High Yield Fund and Delaware Ivy Total Return Bond Fund) offers Class Y shares. On December 17, 2021, Delaware Ivy Total Return Bond Fund’s Class Y share class liquidated. In addition, each Fund (other than Delaware Ivy California Municipal High Income Fund, Delaware Ivy Corporate Bond Fund and Delaware Ivy Crossover Credit Fund which does not offer Class R6 shares) offers Class I and Class R6 shares. On May 18, 2022, Class R6 share class liquidated for Delaware Ivy Corporate Bond Fund and Delaware Ivy Crossover Credit Fund. Class A shares are subject to an initial sales charge. There is no front-end sales charge when you purchase $1 million or more ($250,000 or more for Delaware Ivy California Municipal High Income Fund) of Class A shares. However, if Delaware Distributors, L.P. (DDLP) or a predecessor distributor paid your financial intermediary a commission on your purchase that received an net asset value (NAV) breakpoint of Class A shares, for shares of the Funds purchased prior to July 1, 2021, you will have to pay a limited contingent deferred sales charge (Limited CDSC) of 1.00% if you redeem these shares within the first year after your purchase; or if DDLP paid your financial intermediary a commission on your purchase of $1 million ($250,000 or more for Delaware Ivy California Municipal High Income Fund) or more of Class A shares that received an NAV breakpoint, for shares purchased on or after July 1, 2021 that are subject to a contingent deferred sales charge (CDSC), you will have to pay a Limited CDSC of 1.00% if you redeem these shares within the first 18 months after your purchase, unless a specific waiver of the Limited CDSC applies. Effective December 10, 2021, all remaining shares of Class B were converted to Class A shares. Class C shares are sold with a CDSC of 1.00%, which will be incurred if redeemed during the first 12 months. Class I shares, Class R6 shares and Class Y shares are not subject to a sales charge and are offered for sale exclusively to certain eligible investors. In addition, Class R6 shares do not pay any service fees, sub-accounting fees, and/or sub-transfer agency fees to any brokers, dealers, or other financial intermediaries.
1. Significant Accounting Policies
Each Fund follows accounting and reporting guidance under Financial Accounting Standards Board (FASB) Accounting Standards Codification Topic 946, Financial Services — Investment Companies. The following accounting policies are in accordance with US generally accepted accounting principles (US GAAP) and are consistently followed by the Funds.
Security Valuation — Equity securities and exchange-traded funds (ETFs), except those traded on the Nasdaq Stock Market LLC (Nasdaq), are valued at the last quoted sales price as of the time of the regular close of the New York Stock Exchange on the valuation date. Equity securities and ETFs traded on the Nasdaq are valued in accordance with the Nasdaq Official Closing Price, which may not be the last sales price. If, on a particular day, an equity security or ETF does not trade, the mean between the bid and the ask prices will be used, which approximates fair value. Equity securities listed on a foreign exchange are normally valued at the last quoted sales price on the valuation date. US government and agency securities are valued at the mean between the bid and the ask prices, which approximates fair value. Other debt securities, credit default swap (CDS) contracts, interest rate swap (IRS) contracts, CDS and interest rate swap options contracts (swaptions) are valued based upon valuations provided by an independent pricing service or broker/counterparty and reviewed by management. To the extent current market prices are not available, the pricing service may take into account developments related to the specific security, as well as transactions in comparable securities. Valuations for fixed income securities utilize matrix systems, which reflect such factors as security prices, yields, maturities, and ratings, and are supplemented by dealer and exchange quotations. For asset-backed securities, collateralized mortgage obligations (CMOs), commercial mortgage securities, and US government agency mortgage securities, pricing vendors utilize matrix pricing which considers prepayment speed, attributes of the collateral, yield or price of bonds of comparable quality, coupon, maturity, and type as well as broker/dealer-supplied prices. Swap prices are derived using daily swap curves and models that incorporate a number of market data factors, such as discounted cash flows, trades, and values of the underlying reference instruments. Foreign currency exchange contracts and foreign cross currency exchange contracts are valued at the mean between the bid and the ask prices, which approximates fair value.
191
Notes to financial statements
Ivy Funds
1. Significant Accounting Policies (continued)
Interpolated values are derived when the settlement date of the contract is an interim date for which quotations are not available. Futures contracts and options on futures contracts are valued at the daily quoted settlement prices. Exchange-traded options are valued at the last reported sale price or, if no sales are reported, at the mean between the last reported bid and the ask prices, which approximates fair value. Open-end investment companies are valued at their published NAV. Generally, other securities and assets for which market quotations are not readily available are valued at fair value as determined in good faith by each Fund’s valuation designee, Delaware Management Company (DMC). Subject to the oversight of each Fund’s Board of Trustees (Board), DMC, as valuation designee, has adopted policies and procedures to fair value securities that are not readily available consistent with the requirements of Rule 2a-5 under the 1940 Act. In determining whether market quotations are readily available or fair valuation will be used, various factors will be taken into consideration, such as market closures or suspension of trading in a security. Restricted securities and private placements are valued at fair value.
Federal and Foreign Income Taxes — No provision for federal income taxes has been made as each Fund intends to continue to qualify for federal income tax purposes as a regulated investment company under Subchapter M of the Internal Revenue Code of 1986, as amended, and make the requisite distributions to shareholders. Each Fund evaluates tax positions taken or expected to be taken in the course of preparing each Fund’s tax returns to determine whether the tax positions are “more-likely-than-not” of being sustained by the applicable tax authority. Tax positions not deemed to meet the “more-likely-than-not” threshold are recorded as a tax benefit or expense in the current year. Management has analyzed each Fund’s tax positions taken or expected to be taken on each Fund’s federal income tax returns through the year ended September 30, 2022, and for all open tax years (years ended September 30, 2019-September 30, 2021), and has concluded that no provision for federal income tax is required in each Fund’s financial statements. In regard to foreign taxes only, each Fund has open tax years in certain foreign countries in which it invests in that may date back to the inception of each Fund. If applicable, each Fund recognizes interest accrued on unrecognized tax benefits in interest expense and penalties in “Other” on the “Statements of operations.” During the year ended September 30, 2022, the Funds did not incur any interest or tax penalties.
Class Accounting — Investment income, common expenses, and realized and unrealized gain (loss) on investments are allocated to the various classes of each Fund on the basis of daily net assets of each class. Distribution expenses relating to a specific class are charged directly to that class. Class R6 shares will not be allocated any expenses related to service fees, sub-accounting fees, and/or sub-transfer agency fees paid to brokers, dealers, or other financial intermediaries.
Foreign Currency Transactions — Transactions denominated in foreign currencies are recorded at the prevailing exchange rates on the valuation date. The value of all assets and liabilities denominated in foreign currencies is translated daily into US dollars at the exchange rate of such currencies against the US dollar. Transaction gains or losses resulting from changes in exchange rates during the reporting period or upon settlement of the foreign currency transaction are reported in operations for the current period. The Funds generally bifurcate that portion of realized gains and losses on investments in debt securities which is due to changes in foreign exchange rates from that which is due to changes in market prices of debt securities. That portion of gains (losses), which is due to changes in foreign exchange rates, is included on the “Statements of operations” under “Net realized gain (loss) on foreign currencies.” For foreign equity securities, the realized gains and losses are included on the “Statements of operations” under “Net realized gain (loss) on investments.” The Funds report certain foreign currency related transactions as components of realized gains (losses) for financial reporting purposes, whereas such components are treated as ordinary income (loss) for federal income tax purposes.
Derivative Financial Instruments — The Funds may invest in various derivative financial instruments. These instruments are used to obtain exposure to a security, commodity, index, market, and/or other assets without owning or taking physical custody of securities, commodities and/ or other referenced assets or to manage market, equity, credit, interest rate, foreign currency exchange rate, commodity and/or other risks. Derivative financial instruments may give rise to a form of economic leverage and involve risks, including the imperfect correlation between the value of a derivative financial instrument and the underlying asset, possible default of the counterparty to the transaction or illiquidity of the instrument. Pursuant to Rule 18f-4 under the 1940 Act, among other things, the Funds must either use derivative financial instruments with embedded leverage in a limited manner or comply with an outer limit on fund leverage risk based on value-at-risk. The Funds’ successful use of a derivative financial instrument depends on the investment adviser’s ability to predict pertinent market movements accurately, which cannot be assured. The use of these instruments may result in losses greater than if they had not been used, may limit the amount of appreciation the Funds can realize on an investment and/or may result in lower distributions paid to shareholders. Each Fund’s investments in these instruments, if any, are discussed in detail in the Notes to Financial Statements.
192
Segregation and Collateralizations — In certain cases, based on requirements and agreements with certain exchanges and third-party broker-dealers, the Funds may deliver collateral in connection with certain investments (e.g., futures contracts, foreign currency exchange contracts, options written, securities with extended settlement periods, and swaps). Certain countries require that cash reserves be held while investing in companies incorporated in that country. These cash reserves and cash collateral that has been pledged/received to cover obligations of the Funds under derivative contracts, if any, will be reported separately on the “Statements of assets and liabilities” as cash collateral due to/from broker. Securities collateral pledged for the same purpose, if any, is noted on the “Schedules of investments.”
Use of Estimates — The preparation of financial statements in conformity with US GAAP requires management to make estimates and assumptions that affect the fair value of investments, the reported amounts of assets and liabilities and disclosure of contingent assets and liabilities at the date of the financial statements, and the reported amounts of revenues and expenses during the reporting period. Actual results could differ from those estimates and the differences could be material.
Other — Expenses directly attributable to a Fund are charged directly to that Fund. Other expenses common to various funds within the Delaware Funds by Macquarie® (Delaware Funds) are generally allocated among such funds on the basis of average net assets. Management fees and certain other expenses are paid monthly. Security transactions are recorded on the date the securities are purchased or sold (trade date) for financial reporting purposes. Costs used in calculating realized gains and losses on the sale of investment securities are those of the specific securities sold. Dividend income is recorded on the ex-dividend date and interest income is recorded on the accrual basis. Income and capital gain distributions from any investment companies (Underlying Funds) in which the Fund invests are recorded on the ex-dividend date. Discounts and premiums on debt securities are accreted or amortized to interest income, respectively, over the lives of the respective securities using the effective interest method. Premiums on callable debt securities are amortized to interest income to the earliest call date using the effective interest method. Realized gains (losses) on paydowns of asset- and mortgage-backed securities are classified as interest income. Distributions received from investments in real estate investment trusts (REITs) are recorded as dividend income on the ex-dividend date, subject to reclassification upon notice of the character of such distributions by the issuer. Foreign dividends are also recorded on the ex-dividend date or as soon after the ex-dividend date that the Funds are aware of such dividends, net of all tax withholdings, a portion of which may be reclaimable. Withholding taxes and reclaims on foreign dividends and interest have been recorded in accordance with the Funds’ understanding of the applicable country’s tax rules and rates. Each Fund may pay foreign capital gains taxes on certain foreign securities held, which are reported as components of realized losses for financial reporting purposes, whereas such components are treated as ordinary loss for federal income tax purposes. Delaware Ivy California Municipal High Income Fund and Delaware Ivy Government Securities Fund declare dividends daily and pay monthly. Delaware Ivy Corporate Bond Fund, Delaware Ivy Crossover Credit Fund, Delaware Ivy High Yield Fund, and Delaware Ivy Strategic Income Fund declare and pay dividends monthly. Delaware Ivy Emerging Markets Local Currency Debt Fund, Delaware Ivy Multi-Asset Fund, and Delaware Ivy Total Return Bond Fund declare and pay dividends quarterly. Delaware Ivy International Small Cap Fund declares and pays dividends annually. Each Fund declares and pays distributions from net realized gain on investments, if any, annually. Each Fund may distribute more frequently, if necessary for tax purposes. Dividends and distributions, if any, are recorded on the ex-dividend date.
Each Fund receives earnings credits from its transfer agent when positive cash balances are maintained, which may be used to offset transfer agent fees. If the amount earned is greater than $1, the expenses paid under this arrangement are included on the “Statements of operations” under “Dividend disbursing and transfer agent fees and expenses” with the corresponding expenses offset included under “Less expenses paid indirectly.”
193
Notes to financial statements
Ivy Funds
2. Investment Management, Administration Agreements, and Other Transactions with Affiliates
In accordance with the terms of its respective investment management agreement, each Fund pays DMC, a series of Macquarie Investment Management Business Trust and the investment manager, an annual fee which is calculated daily and paid monthly, based on each Fund’s average daily net assets as follows:
| Fund | Management Fee (annual rate as a percentage of average daily net assets) | |
| Delaware Ivy California Municipal High Income Fund | 0.525% of net assets up to $500 million; | |
| 0.50% of net assets over $500 million and up to $1 billion; | ||
| 0.45% of net assets over $1 billion and up to $1.5 billion; | ||
| 0.40% of net assets over $1.5 billion and up to $5 billion; | ||
| 0.395% of net assets over $5 billion and up to $10 billion; | ||
| 0.39% of net assets over $10 billion and up to $15 billion; | ||
| 0.385% of net assets over $15 billion. | ||
| Delaware Ivy Corporate Bond Fund | 0.475% of net assets up to $1 billion; | |
| 0.45% of net assets over $1 billion and up to $1.5 billion; | ||
| 0.40% of net assets over $1.5 billion. | ||
| Delaware Ivy Crossover Credit Fund | 0.50% of net assets up to $500 million; | |
| 0.45% of net assets over $500 million and up to $1 billion; | ||
| 0.425% of net assets over $1 billion and up to $2.5 billion; | ||
| 0.40% of net assets over $2.5 billion and up to $5 billion; | ||
| 0.375% of net assets over $5 billion. | ||
| Delaware Ivy Emerging Markets Local Currency Debt Fund | 0.75% of net assets up to $1 billion; | |
| 0.725% of net assets over $1 billion and up to $2 billion; | ||
| 0.70% of net assets over $2 billion and up to $5 billion; | ||
| 0.675% of net assets over $5 billion and up to $10 billion; | ||
| 0.65% of net assets over $10 billion. | ||
| Delaware Ivy Government Securities Fund | 0.50% of net assets up to $500 million; | |
| 0.45% of net assets over $500 million and up to $1 billion; | ||
| 0.40% of net assets over $1 billion and up to $1.5 billion; | ||
| 0.35% of net assets over $1.5 billion. | ||
| Delaware Ivy High Yield Fund | 0.625% of net assets up to $500 million; | |
| 0.60% of net assets over $500 million and up to $1 billion; | ||
| 0.55% of net assets over $1 billion and up to $1.5 billion; | ||
| 0.50% of net assets over $1.5 billion and up to $10 billion; | ||
| 0.49% of net assets over $10 billion and up to $20 billion; | ||
| 0.48% of net assets over $20 billion. | ||
| Delaware Ivy International Small Cap Fund | 1.00% of net assets up to $1 billion; | |
| 0.95% of net assets over $1 billion and up to $2 billion; | ||
| 0.90% of net assets over $2 billion and up to $5 billion; | ||
| 0.85% of net assets over $5 billion. | ||
| Delaware Ivy Multi-Asset Income Fund | 0.70% of net assets up to $1 billion; | |
| 0.65% of net assets over $1 billion and up to $2 billion; | ||
| 0.61% of net assets over $2 billion and up to $3 billion; | ||
| 0.58% of net assets over $3 billion. |
194
| Fund | Management Fee (annual rate as a percentage of average daily net assets) | |
| Delaware Ivy Strategic Income Fund | 0.68% of net assets up to $1 billion; | |
| 0.62% of net assets over $1 billion and up to $2 billion; | ||
| 0.58% of net assets over $2 billion and up to $3 billion; | ||
| 0.57% of net assets over $3 billion. | ||
| Delaware Ivy Total Return Bond Fund | 0.90% of net assets up to $1 billion; | |
| 0.85% of net assets over $1 billion and up to $2 billion; | ||
| 0.80% of net assets over $2 billion and up to $5 billion; | ||
| 0.75% of net assets over $5 billion. |
DMC has entered into sub-advisory agreements with the following entities on behalf of Delaware Ivy Corporate Bond, Delaware Ivy Crossover Credit, Delaware Ivy Emerging Markets Local Currency Debt, Delaware Ivy Government Securities, Delaware Ivy High Yield, Delaware Ivy Multi-Asset Income Fund and Delaware Ivy Total Return Funds:
Macquarie Investment Management Austria Kapitalanlage AG (MIMAK), Macquarie Investment Management Europe Limited (MIMEL) and Macquarie Investment Management Global Limited (MIMGL), each of which is an affiliate of DMC (the Affiliated Sub-Advisors).
MIMAK is a part of Macquarie Asset Management (MAM). MAM is the marketing name for certain companies comprising the asset management division of Macquarie Group Limited. With respect to the Funds for which MIMAK serves as a sub-advisor, DMC has principal responsibility for all investment advisory services and may seek investment advice and recommendations from MIMAK and DMC may also permit MIMAK to execute Fund security trades on behalf of DMC and exercise investment discretion for securities in certain markets where DMC believes it will be beneficial to utilize MIMAK’s specialized market knowledge.
In addition and with respect only to Delaware Ivy Multi-Asset Income Fund, MIMAK is responsible for the day-to-day management of the Fund.
DMC may seek investment advice and recommendations from MIMEL and DMC may also permit MIMEL to execute Fund security trades on behalf of DMC and exercise investment discretion for securities in certain markets where DMC believes it will be beneficial to utilize MIMEL’s specialized market knowledge.
With respect to the Funds for which MIMGL serves as sub-advisor, DMC has principal responsibility for each Fund, and may seek investment advice and recommendations from MIMGL and DMC may also permit MIMGL to execute Fund security trades on behalf of DMC and exercise investment discretion for securities in certain markets where DMC believes it will be beneficial to utilize MIMGL’s specialized market knowledge.
In addition and with respect only to Delaware Ivy Total Return Bond Fund, MIMGL along with DMC is responsible for the day-to-day management of the Fund.
MIMGL and Macquarie Funds Management Hong Kong Limited (MFMHKL, also an affiliate of DMC) each serve as sub-advisor to Delaware Ivy International Small Cap Fund, executing security trades on behalf of DMC.
Pursuant to the terms of the relevant sub-advisory agreement, DMC pays each Affiliated Sub-Advisor and MFMHKL a sub-advisory fee.
Prior to October 18, 2021 (for Delaware Ivy Emerging Markets Local Currency Debt Fund and Delaware Ivy Total Return Bond Fund), January 31, 2022 (for Delaware Ivy Corporate Bond Fund, Delaware Ivy Government Securities Fund, Delaware Ivy High Yield Fund, Delaware Ivy Multi-Asset Income Fund, and Delaware Ivy Strategic Income Fund), and February 28, 2022 (for Delaware Ivy California Municipal High Income Fund, Delaware Ivy Crossover Credit Fund and Delaware Ivy International Small Cap Fund), the Funds had an Accounting and Administrative Services Agreement with Waddell & Reed Services Company (WRSCO), doing business as WI Services Company (WISC). Under the agreement, WISC acted as the agent in providing bookkeeping and accounting services and assistance to each Fund, including maintenance of Fund records, pricing of Fund shares and preparation of certain shareholder reports. For these services, each Fund paid WISC a monthly fee of one-twelfth of the annual fee based on the average net asset levels shown in the following table:
| (M - Millions) | Annual Fee Rate | ||
| $0 to $10M | $ | 0 | |
195
Notes to financial statements
Ivy Funds
2. Investment Management, Administration Agreements, and Other Transactions with Affiliates (continued)
| $10 to $25M | 11,496 | ||
| $25 to $50M | 23,100 | ||
| $50 to $100M | 35,496 | ||
| $100 to $200M | 48,396 | ||
| $200 to $350M | 63,204 | ||
| $350 to $550M | 82,500 | ||
| $550 to $750M | 96,300 | ||
| $750 to $1,000M | 121,596 | ||
| Over $1,000M | 148,500 |
In addition, for each class of shares in excess of one, each Fund paid WISC a monthly per-class fee equal to 2.50% of the monthly accounting services base fee. Each Fund also paid WISC a monthly administrative fee at the annual rate of 0.01%, or one basis point, for the first $1 billion of net assets with no fee charged for net assets in excess of $1 billion. This fee was voluntarily waived by WISC until each Fund’s net assets were at least $10 million and is included in “Accounting and administration expenses” on the “Statements of operations.”
Effective October 18, 2021 (for Delaware Ivy Emerging Markets Local Currency Debt Fund and Delaware Ivy Total Return Bond Fund), January 31, 2022 (for Delaware Ivy Corporate Bond Fund, Delaware Ivy Government Securities Fund, Delaware Ivy High Yield Fund, Delaware Ivy Multi-Asset Income Fund, and Delaware Ivy Strategic Income Fund), and February 28, 2022 (for Delaware Ivy California Municipal High Income Fund, Delaware Ivy Crossover Credit Fund and Delaware Ivy International Small Cap Fund), Delaware Investments Fund Services Company (DIFSC), an affiliate of DMC, provides fund accounting and financial administrative oversight services to each Fund. For these services, DIFSC’s fees are calculated daily and paid monthly, based on the aggregate daily net assets of all funds within the Delaware Funds at the following annual rates: 0.00475% of the first $35 billion; 0.0040% of the next $10 billion; 0.0025% of the next $45 billion; and 0.0015% of aggregate average daily net assets in excess of $90 billion (Total Fee). Each fund in the Delaware Funds pays a minimum of $4,000, which, in aggregate, is subtracted from the Total Fee. Each fund then pays its portion of the remainder of the Total Fee on a relative NAV basis. These amounts are included on the “Statements of operations” under “Accounting and administration expenses.” From the effective dates mentioned above to September 30, 2022, each Fund paid for these services as follows:
| Fund | Fees | ||
| Delaware Ivy California Municipal High Income Fund | $ | 3,274 | |
| Delaware Ivy Corporate Bond Fund | 16,045 | ||
| Delaware Ivy Crossover Credit Fund | 3,464 | ||
| Delaware Ivy Emerging Markets Local Currency Debt Fund | 6,441 | ||
| Delaware Ivy Government Securities Fund | 8,934 | ||
| Delaware Ivy High Yield Fund | 7,512 | ||
| Delaware Ivy International Small Cap Fund | 4,008 | ||
| Delaware Ivy Multi-Asset Income Fund | 16,353 | ||
| Delaware Ivy Strategic Income Fund | 15,515 | ||
| Delaware Ivy Total Return Bond Fund | 8,716 | ||
Effective June 27, 2022, DIFSC is also the transfer agent and dividend disbursing agent of each Fund. For these services, DIFSC’s fees are calculated daily and paid monthly, based on the aggregate daily net assets of the retail funds within the Delaware Funds at the following annual rates: 0.014% of the first $20 billion; 0.011% of the next $5 billion; 0.007% of the next $5 billion; 0.004% of the next $20 billion; 0.002% of the next $25 billion; and 0.0015% of average daily net assets in excess of $75 billion. The fees payable to DIFSC under the shareholder services agreement described above are allocated among all retail funds in the Delaware Funds on a relative NAV basis. This amount is included on the “Statements of operations” under “Dividend disbursing and transfer agent fees and expenses.” For the period June 27, 2022 through September 30, 2022, each Fund paid for these services as follows:
| Fund | Fees | ||
| Delaware Ivy California Municipal High Income Fund | $ | 720 | |
| Delaware Ivy Corporate Bond Fund | 56,509 | ||
| Delaware Ivy Crossover Credit Fund | 1,949 | ||
196
| Fund | Fees | ||
| Delaware Ivy Emerging Markets Local Currency Debt Fund | $ | 1,006 | |
| Delaware Ivy Government Securities Fund | 14,759 | ||
| Delaware Ivy High Yield Fund | 2,260 | ||
| Delaware Ivy International Small Cap Fund | 1,926 | ||
| Delaware Ivy Multi-Asset Income Fund | 16,941 | ||
| Delaware Ivy Strategic Income Fund | 14,809 | ||
| Delaware Ivy Total Return Bond Fund | 2,937 | ||
Pursuant to a sub-transfer agency agreement between DIFSC and BNY Mellon Investment Servicing (US) Inc. (BNYMIS), effective June 27, 2022, BNYMIS provides certain sub-transfer agency services to each Fund. Sub-transfer agency fees are paid by each Fund and are also included on the “Statements of operations” under “Dividend disbursing and transfer agent fees and expenses.” The fees are calculated daily and paid as invoices are received on a monthly or quarterly basis.
Under the Shareholder Servicing Agreement between the Trust and WISC (that was in effect until June 27, 2022), with respect to Class A and Class C shares, for each shareholder account that was in existence at any time during the prior month, each Fund paid a monthly fee that ranged from $1.5042 to $1.6958 per account; however, WISC had agreed to reduce that fee if the number of total shareholder accounts within the Complex (InvestEd Portfolios and Ivy Funds) reached certain levels. For Class I and Class Y shares, each Fund paid a monthly fee equal to one-twelfth of 0.15 of 1.00% of the average daily net assets of the class for the preceding month. For Class R6 shares, each Fund paid WISC a monthly fee equal to one-twelfth of 0.01 of 1.00% of the average daily net assets of the class for the preceding month. Each Fund also reimbursed WISC for certain out-of-pocket costs for all classes.
For certain networked accounts (that is, those accounts whose Fund shares were purchased through certain financial intermediaries), WISC had agreed to reduce its per account fees charged to the Funds to $0.50 per month per shareholder account. Additional fees may have been paid by the Funds to those intermediaries. The Fund would reimburse WISC for such costs if the annual rate of the third-party per account charged for a Fund were less than or equal to $12.00 per account or an annual fee of 0.14 of 1.00% that is based on average daily net assets.
Certain broker-dealers that maintained shareholder accounts with each Fund through an omnibus account provided transfer agent and other shareholder-related services that would otherwise have been provided by WISC if the individual accounts that comprised the omnibus account were opened by their beneficial owners directly. Each Fund could pay such broker-dealers a per account fee for each open account within the omnibus account (up to $18.00 per account), or a fixed rate fee (up to an annual fee of 0.20 of 1% that is based on average daily net assets), based on the average daily NAV of the omnibus account (or a combination thereof).
Pursuant to a distribution agreement and distribution plan, each Fund pays DDLP, the distributor and an affiliate of DMC, an annual distribution and service (12b-1) fee of 0.25%, 1.00%, and 0.25% of the average daily net assets of the Class A, Class C, and Class Y shares, respectively. The fees are calculated daily and paid monthly. Class I and Class R6 shares do not pay 12b-1 fees.
From January 28, 2022, DMC and DDLP (through January 28, 2023), WISC (until June 27, 2022) and DIFSC (effective June 27, 2022 through January 28, 2023), each Fund’s transfer agent, have contractually agreed to reimburse sufficient management fees, 12b-1 fees and/or shareholder servicing fees to cap the total annual ordinary fund operating expenses (which would exclude interest, taxes, brokerage commissions, acquired fund fees and expenses and extraordinary expenses, if any) as follows:
| Fund | Operating expense limitation as a percentage of average daily net assets Class A | Operating expense limitation as a percentage of average daily net assets Class C | Operating expense limitation as a percentage of average daily net assets Class I | Operating expense limitation as a percentage of average daily net assets Class R6 | Operating expense limitation as a percentage of average daily net assets Class Y | |||||
| Delaware Ivy California Municipal High Income Fund | 0.80% | 1.65% | 0.60% | n/a | 0.80% |
197
Notes to financial statements
Ivy Funds
2. Investment Management, Administration Agreements, and Other Transactions with Affiliates (continued)
| Fund | Operating expense limitation as a percentage of average daily net assets Class A | Operating expense limitation as a percentage of average daily net assets Class C | Operating expense limitation as a percentage of average daily net assets Class I | Operating expense limitation as a percentage of average daily net assets Class R6 | Operating expense limitation as a percentage of average daily net assets Class Y | |||||||||||||||
| Delaware Ivy Corporate Bond Fund | n/a | n/a | n/a | n/a | n/a | |||||||||||||||
| Delaware Ivy Crossover Credit Fund | 0.90 | % | n/a | 0.65 | % | n/a | 0.90 | % | ||||||||||||
| Delaware Ivy Emerging Markets Local Currency Debt Fund | 1.23 | % | 1.84 | % | 0.80 | % | 0.80 | % | 1.20 | % | ||||||||||
| Delaware Ivy Government Securities Fund | 0.97 | % | 1.82 | % | 0.72 | % | 0.60 | % | n/a | |||||||||||
| Delaware Ivy High Yield Fund | 0.99 | % | n/a | 0.72 | % | 0.72 | % | n/a | ||||||||||||
| Delaware Ivy International Small Cap Fund | 1.37 | % | 2.12 | % | 0.99 | % | 0.99 | % | 1.37 | % | ||||||||||
| Delaware Ivy Multi-Asset Income Fund | 1.17 | % | 1.95 | % | 0.75 | % | 0.75 | % | 1.15 | % | ||||||||||
| Delaware Ivy Strategic Income Fund | 1.04 | % | 1.82 | % | 0.67 | % | 0.67 | % | 1.04 | % | ||||||||||
| Delaware Ivy Total Return Bond Fund | 1.24 | % | 1.95 | % | 1.00 | % | 0.87 | % | n/a | |||||||||||
Prior to Janurary 28, 2022, DMC, DDLP, the Funds’ distributor, and/or WRSCO, doing business as WISC, the Funds’ prior transfer agent, contractually agreed to reimburse sufficient management fees, 12b-1 fees and/or shareholder servicing fees to cap the total annual ordinary fund operating expenses (which would exclude interest, taxes, brokerage commissions, acquired fund fees and expenses, and extraordinary expenses, if any) as follows:
| Fund | Operating expense limitation as a percentage of average daily net assets Class A | Operating expense limitation as a percentage of average daily net assets Class C | Operating expense limitation as a percentage of average daily net assets Class I | Operating expense limitation as a percentage of average daily net assets Class R6 | Operating expense limitation as a percentage of average daily net assets Class Y | |||||||||||||||
| Delaware Ivy California Municipal High Income Fund | 0.80 | % | n/a | 0.60 | % | n/a | 0.80 | % | ||||||||||||
| Delaware Ivy Corporate Bond Fund | n/a | n/a | n/a | n/a | n/a | |||||||||||||||
198
| Fund | Operating expense limitation as a percentage of average daily net assets Class A | Operating expense limitation as a percentage of average daily net assets Class C | Operating expense limitation as a percentage of average daily net assets Class I | Operating expense limitation as a percentage of average daily net assets Class R6 | Operating expense limitation as a percentage of average daily net assets Class Y | |||||||||||||||
| Delaware Ivy Crossover Credit Fund | 0.90 | % | n/a | 0.65 | % | 0.65 | % | 0.90 | % | |||||||||||
| Delaware Ivy Emerging Markets Local Currency Debt Fund | 1.23 | % | 2.00 | % | 0.80 | % | 0.80 | % | 1.25 | % | ||||||||||
| Delaware Ivy Government Securities Fund | 0.97 | % | 1.85 | % | 0.72 | % | 0.72 | % | n/a | |||||||||||
| Delaware Ivy High Yield Fund | 0.99 | % | n/a | 0.72 | % | 0.72 | % | n/a | ||||||||||||
| Delaware Ivy International Small Cap Fund | 1.44 | % | n/a | 0.99 | % | 0.99 | % | 1.44 | % | |||||||||||
| Delaware Ivy Multi-Asset Income Fund | 1.28 | % | 2.16 | % | 0.75 | % | 0.75 | % | 1.28 | % | ||||||||||
| Delaware Ivy Strategic Income Fund | 1.14 | % | 1.82 | % | 0.67 | % | 0.67 | % | 1.10 | % | ||||||||||
| Delaware Ivy Total Return Bond Fund | 1.37 | % | 2.08 | % | 1.00 | % | 0.87 | % | 1.25 | % | ||||||||||
As provided in the investment management agreement, each Fund bears a portion of the cost of certain resources shared with DMC, including the cost of internal personnel of DMC and/or its affiliates that provide legal and regulatory reporting services to the Funds. These amounts are included on the “Statements of operations” under “Legal fees.” For the year ended September 30, 2022, each Fund paid for internal legal and regulatory reporting services provided by DMC and/or its affiliates’ employees as follows:
| Fund | Fees | |||
| Delaware Ivy California Municipal High Income Fund | $ | 126 | ||
| Delaware Ivy Corporate Bond Fund | 6,062 | |||
| Delaware Ivy Crossover Credit Fund | 181 | |||
| Delaware Ivy Emerging Markets Local Currency Debt Fund | 267 | |||
| Delaware Ivy Government Securities Fund | 2,410 | |||
| Delaware Ivy High Yield Fund | 670 | |||
| Delaware Ivy International Small Cap Fund | 5,761 | |||
| Delaware Ivy Multi-Asset Income Fund | 5,821 | |||
| Delaware Ivy Strategic Income Fund | 5,857 | |||
| Delaware Ivy Total Return Bond Fund | 676 | |||
For the year ended September 30, 2022, DDLP earned commissions on sales of Class A shares for each Fund as follows:
| Fund | Class A | |||
| Delaware Ivy California Municipal High Income Fund | $ | 341 | ||
199
Notes to financial statements
Ivy Funds
2. Investment Management, Administration Agreements, and Other Transactions with Affiliates (continued)
| Fund | Class A | |||
| Delaware Ivy Corporate Bond Fund | $ | 11,894 | ||
| Delaware Ivy Crossover Credit Fund | 542 | |||
| Delaware Ivy Emerging Markets Local Currency Debt Fund | 156 | |||
| Delaware Ivy Government Securities Fund | 2,252 | |||
| Delaware Ivy High Yield Fund | 610 | |||
| Delaware Ivy International Small Cap Fund | 763 | |||
| Delaware Ivy Multi-Asset Income Fund | 6,101 | |||
| Delaware Ivy Strategic Income Fund | 4,946 | |||
| Delaware Ivy Total Return Bond Fund | 431 | |||
For the year ended September 30, 2022, DDLP received gross CDSC commissions on redemptions of each Fund’s Class A and Class C shares, and these commissions were entirely used to offset upfront commissions previously paid by DDLP to broker/dealers on sales of those shares. The amounts received were as follows:
| Fund | Class A | Class C | ||||||
| Delaware Ivy California Municipal High Income Fund | $ | 8 | $ | — | ||||
| Delaware Ivy Corporate Bond Fund | 760 | 146 | ||||||
| Delaware Ivy Crossover Credit Fund | — | — | ||||||
| Delaware Ivy Emerging Markets Local Currency Debt Fund | — | — | ||||||
| Delaware Ivy Government Securities Fund | 141 | — | ||||||
| Delaware Ivy High Yield Fund | — | — | ||||||
| Delaware Ivy International Small Cap Fund | — | 55 | ||||||
| Delaware Ivy Multi-Asset Income Fund | 248 | 248 | ||||||
| Delaware Ivy Strategic Income Fund | 631 | 385 | ||||||
| Delaware Ivy Total Return Bond Fund | — | 135 | ||||||
Trustees’ fees include expenses accrued by each Fund for each Trustee’s retainer and meeting fees. Certain officers of DMC, DIFSC, and DDLP are officers and/or Trustees of the Trust. These officers and Trustees are paid no compensation by the Funds.
In addition to the management fees and other expenses of a Fund, a Fund indirectly bears the investment management fees and other expenses of any Underlying Funds including ETF in which it invests. The amount of these fees and expenses incurred indirectly by a Fund will vary based upon the expense and fee levels of any Underlying Funds and the number of shares that are owned of any Underlying Funds at different times.
During the year ended September 30, 2021, Waddell & Reed Services Company (WRSCO) reimbursed $28,737, $2,948, $71,627, $836 and $677 to Delaware Ivy Multi-Asset Income Fund Class A, Class C, Class I, Class R6 and Class Y shares, respectively, for losses. WRSCO also reimbursed $15,992, $814, $39,959, $464 and $265 to Delaware Ivy Strategic Income Fund Class A, Class C, Class I, Class R6 and Class Y shares, respectively, for losses. These amounts are included as subscriptions on the “Statements of changes in net assets.”
Cross trades for the year ended September 30, 2022, were executed by the Funds pursuant to procedures adopted by the Board designed to ensure compliance with Rule 17a-7 under the 1940 Act. Cross trading is the buying or selling of portfolio securities between funds of investment companies, or between a fund of an investment company and another entity, that are or could be considered affiliates by virtue of having a common investment advisor (or affiliated investment advisors), common directors/trustees and/or common officers. At its regularly scheduled meetings, the Board reviews a report related to the Funds’ compliance with the procedures adopted by the Board. Pursuant to these procedures, for the year ended September 30, 2022, the following Funds engaged in Rule 17a-7 securities purchases and securities sales, which resulted in net gains or losses as follows:
| Purchases | Sales | Net realized gain (loss) | ||||||||||
| Delaware Ivy California Municipal High Income Fund | $3,050,364 | $5,211,544 | $(29,858 | ) | ||||||||
| Delaware Ivy Multi-Asset Income Fund | — | 137,717 | 108 | |||||||||
| Delaware Ivy Strategic Income Fund | — | 137,717 | 108 | |||||||||
200
A summary of the transactions in affiliated companies during the year ended September 30, 2022 was as follows:
| Value, beginning of period | Gross additions | Gross reductions | Net realized gain (loss) on affiliated securities | Net change in unrealized appreciation (depreciation) on affiliated securities | Value, end of period | Shares | Interest income | |||||||||||||||||||||||||||||||||
| Delaware Ivy Multi-Asset Income Fund | ||||||||||||||||||||||||||||||||||||||||
| Corporate Bonds—0.2% | ||||||||||||||||||||||||||||||||||||||||
| New Cotai 5.00% 2/2/27= | $ | — | $ | 328,635 | $— | $— | $ | 11,377 | $ | 340,012 | 340,864 | $ | 11,824 | |||||||||||||||||||||||||||
| Common Stock—0.00% | ||||||||||||||||||||||||||||||||||||||||
| New Cotai=,† | 683,900 | — | — | (683,900 | ) | — | 318,315 | — | ||||||||||||||||||||||||||||||||
| $ | 683,900 | $ | 328,635 | $— | $— | $ | (672,523 | ) | $ | 340,012 | $ | 11,824 | ||||||||||||||||||||||||||||
| Value, beginning of period | Gross additions | Gross reductions | Net realized gain (loss) on affiliated securities | Net change in unrealized appreciation (depreciation) on affiliated securities | Value, end of period | Shares | ||||||||
| Delaware Ivy Strategic Income Fund | ||||||||||||||
| Common Stock—0.00% | ||||||||||||||
| New Cotai=,†,* | $890,319 | $— | $— | $— | $2,742,038 | $— | — | |||||||
| * | Issuer is not an affiliated investment of the Fund at September 30, 2022. |
| = | The value of this security was determined using significant unobservable inputs and is reported as a Level 3 security in the disclosure table located in Note 3. |
| † | Non-income producing security. |
3. Investments
For the year ended September 30, 2022, the Funds made purchases and sales of investment securities other than short-term investments as follows:
| Fund | Purchases other than US government securities | Purchases of US government securities | Sales other than US government securities | Sales of US government securities | ||||||||||||
| Delaware Ivy California Municipal High Income Fund | $ | 5,739,091 | $ | — | $ | 12,391,784 | $ | — | ||||||||
| Delaware Ivy Corporate Bond Fund | 296,686,440 | 28,023,847 | 533,296,366 | 42,528,044 | ||||||||||||
| Delaware Ivy Crossover Credit Fund | 17,318,232 | 2,280,152 | 34,747,544 | 2,273,091 | ||||||||||||
| Delaware Ivy Emerging Markets Local Currency Debt Fund | 16,704,352 | — | 31,538,101 | — | ||||||||||||
| Delaware Ivy Government Securities Fund | 1,960,000 | 414,021,186 | 39,273,443 | 489,670,614 | ||||||||||||
| Delaware Ivy High Yield Fund | 39,873,674 | — | 113,429,053 | — | ||||||||||||
| Delaware Ivy International Small Cap Fund | 93,298,820 | — | 146,934,630 | — | ||||||||||||
| Delaware Ivy Multi-Asset Income Fund | 266,807,196 | 26,282,081 | 375,587,832 | 17,253,747 | ||||||||||||
| Delaware Ivy Strategic Income Fund | 82,123,163 | 53,813,576 | 201,434,347 | 45,483,441 | ||||||||||||
| Delaware Ivy Total Return Bond Fund | 88,185,771 | 29,837,012 | 114,983,594 | 48,402,057 | ||||||||||||
201
Notes to financial statements
Ivy Funds
3. Investments (continued)
The tax cost of investments and derivatives includes adjustments to net unrealized appreciation (depreciation) which may not necessarily be the final tax cost basis adjustments but which approximate the tax basis unrealized gains and losses that may be realized and distributed to shareholders. At September 30, 2022, the cost and unrealized appreciation (depreciation) of investments and derivatives for federal income tax purposes for each Fund were as follows:
| Fund | Cost of investments and derivatives | Aggregate unrealized appreciation of investments and derivatives | Aggregate unrealized depreciation of investments and derivatives | Net unrealized appreciation (depreciation) of investments and derivatives | ||||||||||||
| Delaware Ivy California Municipal High Income Fund | $ | 18,632,028 | $ | 124,464 | $ | (1,714,701 | ) | $ | (1,590,237 | ) | ||||||
| Delaware Ivy Corporate Bond Fund | 494,206,425 | 557,326 | (81,813,870 | ) | (81,256,544 | ) | ||||||||||
| Delaware Ivy Crossover Credit Fund | 21,546,028 | 444 | (4,116,914 | ) | (4,116,470 | ) | ||||||||||
| Delaware Ivy Emerging Markets Local Currency Debt Fund | 27,488,059 | 283,135 | (5,821,731 | ) | (5,538,596 | ) | ||||||||||
| Delaware Ivy Government Securities Fund | 211,046,712 | 11,937 | (15,501,225 | ) | (15,489,288 | ) | ||||||||||
| Delaware Ivy High Yield Fund | 50,755,404 | 817,325 | (8,228,160 | ) | (7,410,835 | ) | ||||||||||
| Delaware Ivy International Small Cap Fund | 46,520,255 | 2,172,168 | (9,798,227 | ) | (7,626,059 | ) | ||||||||||
| Delaware Ivy Multi-Asset Income Fund | 195,851,156 | 3,918,086 | (36,881,130 | ) | (32,963,044 | ) | ||||||||||
| Delaware Ivy Strategic Income Fund | 200,073,860 | 1,009,130 | (29,588,523 | ) | (28,579,393 | ) | ||||||||||
| Delaware Ivy Total Return Bond Fund | 95,171,048 | 1,924,256 | (16,794,866 | ) | (14,870,610 | ) | ||||||||||
US GAAP defines fair value as the price that each Fund would receive to sell an asset or pay to transfer a liability in an orderly transaction between market participants at the measurement date under current market conditions. A three-level hierarchy for fair value measurements has been established based upon the transparency of inputs to the valuation of an asset or liability. Inputs may be observable or unobservable and refer broadly to the assumptions that market participants would use in pricing the asset or liability. Observable inputs reflect the assumptions market participants would use in pricing the asset or liability based on market data obtained from sources independent of the reporting entity. Unobservable inputs reflect the reporting entity’s own assumptions about the assumptions that market participants would use in pricing the asset or liability based on the best information available under the circumstances. Each Fund’s investment in its entirety is assigned a level based upon the observability of the inputs which are significant to the overall valuation. The three-level hierarchy of inputs is summarized as follows:
| Level 1 – | Inputs are quoted prices in active markets for identical investments. (Examples: equity securities, open-end investment companies, futures contracts, and exchange-traded options contracts) |
| Level 2 – | Other observable inputs, including, but not limited to: quoted prices for similar assets or liabilities in markets that are active, quoted prices for identical or similar assets or liabilities in markets that are not active, inputs other than quoted prices that are observable for the assets or liabilities (such as interest rates, yield curves, volatilities, prepayment speeds, loss severities, credit risks, and default rates) or other market-corroborated inputs. (Examples: debt securities, government securities, swap contracts, foreign currency exchange contracts, foreign securities utilizing international fair value pricing, broker-quoted securities, and fair valued securities) |
| Level 3 – | Significant unobservable inputs, including each Fund’s own assumptions used to determine the fair value of investments. (Examples: broker-quoted securities and fair valued securities) |
Level 3 investments are valued using significant unobservable inputs. Each Fund may also use an income-based valuation approach in which the anticipated future cash flows of the investment are discounted to calculate fair value. Discounts may also be applied due to the nature or duration of any restrictions on the disposition of the investments. Valuations may also be based upon current market prices of securities that are comparable in coupon, rating, maturity, and industry. The derived value of a Level 3 investment may not represent the value which is received upon disposition and this could impact the results of operations.
The following tables summarize the valuation of each Fund’s investments by fair value hierarchy levels as of September 30, 2022:
202
| Delaware Ivy California Municipal High Income Fund | |||||||||||||||
| Level 1 | Level 2 | Total | |||||||||||||
| Securities | |||||||||||||||
| Assets: | |||||||||||||||
| Municipal Bonds | $ | — | $ | 16,574,078 | $ | 16,574,078 | |||||||||
| Short-Term Investments1 | 12,713 | 455,000 | 467,713 | ||||||||||||
| Total Value of Securities | $ | 12,713 | $ | 17,029,078 | $ | 17,041,791 | |||||||||
1 Security type is valued across multiple levels. Level 1 investments represent exchange-traded investments, Level 2 investments represent investments with observable inputs or matrix-priced investments, and Level 3 investments represent investments without observable inputs. The amounts attributed to Level 1 investments, Level 2 investments, and Level 3 investments represent the following percentages of the total market value of these security types:
| Level 1 | Level 2 | Total | |||||||||||||
| Short-Term Investments | 2.72% | 97.28% | 100.00% | ||||||||||||
| Delaware Ivy Corporate Bond Fund | |||||||||||||||
| Level 1 | Level 2 | Total | |||||||||||||
| Securities | |||||||||||||||
| Assets: | |||||||||||||||
| Convertible Bond | $ | — | $ | 536,169 | $ | 536,169 | |||||||||
| Corporate Bonds | — | 393,116,998 | 393,116,998 | ||||||||||||
| Municipal Bonds | — | 5,224,634 | 5,224,634 | ||||||||||||
| Non-Agency Asset-Backed Securities | — | 5,316,995 | 5,316,995 | ||||||||||||
| Sovereign Bonds | — | 1,748,697 | 1,748,697 | ||||||||||||
| US Treasury Obligations | — | 3,858,115 | 3,858,115 | ||||||||||||
| Short-Term Investments | 1,398,741 | — | 1,398,741 | ||||||||||||
| Securities Lending Collateral | 1,749,532 | — | 1,749,532 | ||||||||||||
| Total Value of Securities | $ | 3,148,273 | $ | 409,801,608 | $ | 412,949,881 | |||||||||
| Delaware Ivy Crossover Credit Fund | |||||||||||||||
| Level 1 | Level 2 | Total | |||||||||||||
| Securities | |||||||||||||||
| Assets: | |||||||||||||||
| Convertible Bond | $ | — | $ | 27,408 | $ | 27,408 | |||||||||
| Corporate Bonds | — | 16,205,622 | 16,205,622 | ||||||||||||
| Municipal Bonds | — | 112,018 | 112,018 | ||||||||||||
| Non-Agency Asset-Backed Securities | — | 137,455 | 137,455 | ||||||||||||
| US Treasury Obligation | — | 21,582 | 21,582 | ||||||||||||
| Short-Term Investments | 819,823 | — | 819,823 | ||||||||||||
| Securities Lending Collateral | 105,650 | — | 105,650 | ||||||||||||
| Total Value of Securities | $ | 925,473 | $ | 16,504,085 | $ | 17,429,558 | |||||||||
| Delaware Ivy Emerging Markets Local Currency Debt Fund | |||||||||||||||
| Level 1 | Level 2 | Total | |||||||||||||
| Securities | |||||||||||||||
| Assets: | |||||||||||||||
| Sovereign Bonds | $ | — | $ | 19,749,082 | $ | 19,749,082 | |||||||||
| Supranational Banks | — | 974,126 | 974,126 | ||||||||||||
203
Notes to financial statements
Ivy Funds
3. Investments (continued)
| Delaware Ivy Emerging Markets Local Currency Debt Fund | |||||||||||||||
| Level 1 | Level 2 | Total | |||||||||||||
| Short-Term Investments | $ | 819,138 | $ | — | $ | 819,138 | |||||||||
| Securities Lending Collateral | 450,886 | — | 450,886 | ||||||||||||
| Total Value of Securities | $ | 1,270,024 | $ | 20,723,208 | $ | 21,993,232 | |||||||||
| Derivatives1 | |||||||||||||||
| Assets: | |||||||||||||||
| Foreign Currency Exchange Contracts | $ | — | $ | 63,024 | $ | 63,024 | |||||||||
| Liabilities: | |||||||||||||||
| Foreign Currency Exchange Contracts | $ | — | $ | (106,793 | ) | $ | (106,793 | ) | |||||||
1 Foreign currency exchange contracts are valued at the unrealized appreciation (depreciation) on the instrument at the year end.
| Delaware Ivy Government Securities Fund | |||||||||||||||
| Level 1 | Level 2 | Total | |||||||||||||
| Securities | |||||||||||||||
| Assets: | |||||||||||||||
| Agency Collateralized Mortgage Obligations | $ | — | $ | 4,915,068 | $ | 4,915,068 | |||||||||
| Agency Commercial Mortgage-Backed Securities | — | 30,418,241 | 30,418,241 | ||||||||||||
| Agency Mortgage-Backed Securities | — | 36,897,096 | 36,897,096 | ||||||||||||
| Agency Obligations | — | 4,314,697 | 4,314,697 | ||||||||||||
| US Treasury Obligations | — | 109,435,168 | 109,435,168 | ||||||||||||
| Securities Lending Collateral | 9,577,154 | — | 9,577,154 | ||||||||||||
| Total Value of Securities | $ | 9,577,154 | $ | 185,980,270 | $ | 195,557,424 | |||||||||
| Delaware Ivy High Yield Fund | |||||||||||||||
| Level 1 | Level 2 | Total | |||||||||||||
| Securities | |||||||||||||||
| Assets: | |||||||||||||||
| Convertible Bond | $ | — | $ | 77,085 | $ | 77,085 | |||||||||
| Corporate Bonds | — | 40,878,327 | 40,878,327 | ||||||||||||
| Municipal Bonds | — | 306,502 | 306,502 | ||||||||||||
| Short-Term Investments | 1,142,665 | — | 1,142,665 | ||||||||||||
| Securities Lending Collateral | 939,990 | — | 939,990 | ||||||||||||
| Total Value of Securities | $ | 2,082,655 | $ | 41,261,914 | $ | 43,344,569 | |||||||||
204
| Delaware Ivy International Small Cap Fund | |||||||||||||||
| Level 1 | Level 2 | Total | |||||||||||||
| Securities | |||||||||||||||
| Assets: | |||||||||||||||
| Common Stocks | |||||||||||||||
| Argentina | $ | 357,174 | $ | — | $ | 357,174 | |||||||||
| Australia | — | 970,671 | 970,671 | ||||||||||||
| Austria | — | 193,854 | 193,854 | ||||||||||||
| Brazil | 1,594,685 | — | 1,594,685 | ||||||||||||
| Canada | 4,423,697 | — | 4,423,697 | ||||||||||||
| China | 278,178 | 405,334 | 683,512 | ||||||||||||
| Denmark | — | 1,107,406 | 1,107,406 | ||||||||||||
| Finland | — | 258,545 | 258,545 | ||||||||||||
| France | — | 942,737 | 942,737 | ||||||||||||
| Germany | — | 997,165 | 997,165 | ||||||||||||
| Hong Kong | — | 232,383 | 232,383 | ||||||||||||
| India | — | 2,087,310 | 2,087,310 | ||||||||||||
| Ireland | — | 343,070 | 343,070 | ||||||||||||
| Israel | 382,738 | — | 382,738 | ||||||||||||
| Italy | — | 810,505 | 810,505 | ||||||||||||
| Japan | — | 9,860,953 | 9,860,953 | ||||||||||||
| Malaysia | — | 75,361 | 75,361 | ||||||||||||
| Mexico | 1,267,008 | — | 1,267,008 | ||||||||||||
| Norway | 296,573 | 1,208,093 | 1,504,666 | ||||||||||||
| Republic of Korea | — | 810,028 | 810,028 | ||||||||||||
| Singapore | — | 332,640 | 332,640 | ||||||||||||
| South Africa | 1,011,474 | — | 1,011,474 | ||||||||||||
| Spain | — | 676,747 | 676,747 | ||||||||||||
| Sweden | — | 630,689 | 630,689 | ||||||||||||
| Taiwan | — | 670,599 | 670,599 | ||||||||||||
| Thailand | 239,701 | — | 239,701 | ||||||||||||
| United Kingdom | — | 3,245,294 | 3,245,294 | ||||||||||||
| Short-Term Investments | 1,218,373 | — | 1,218,373 | ||||||||||||
| Securities Lending Collateral | 1,975,383 | — | 1,975,383 | ||||||||||||
| Total Value of Securities | $ | 13,044,984 | $ | 25,859,384 | $ | 38,904,368 | |||||||||
| Derivatives1 | |||||||||||||||
| Assets: | |||||||||||||||
| Foreign Currency Exchange Contracts | $— | $10 | $10 | ||||||||||||
| Derivatives | |||||||||||||||
| Liabilities: | |||||||||||||||
| Foreign Currency Exchange Contracts | $— | $(10,182) | $(10,182) | ||||||||||||
1Foreign currency exchange contracts are valued at the unrealized appreciation (depreciation) on the instrument at the year end.
205
Notes to financial statements
Ivy Funds
3. Investments (continued)
| Delaware Ivy Multi-Asset Income Fund | ||||||||||||||||||||
| Level 1 | Level 2 | Level 3 | Total | |||||||||||||||||
| Securities | ||||||||||||||||||||
| Assets: | ||||||||||||||||||||
| Agency Mortgage-Backed Securities | $ | — | $ | 5,744,036 | $ | — | $ | 5,744,036 | ||||||||||||
| Common Stocks | ||||||||||||||||||||
| Basic Industry | — | 1,219,571 | 18,372 | 1,237,943 | ||||||||||||||||
| Capital Goods | 828,277 | — | — | 828,277 | ||||||||||||||||
| Communication Services | — | 1,005,661 | — | 1,005,661 | ||||||||||||||||
| Communications | — | 704,660 | — | 704,660 | ||||||||||||||||
| Consumer Cyclical | 209,397 | 4,030,852 | 45,804 | 4,286,053 | ||||||||||||||||
| Consumer Discretionary | 463,866 | — | — | 463,866 | ||||||||||||||||
| Consumer Non-Cyclical | 10,691,732 | 14,181,469 | — | 24,873,201 | ||||||||||||||||
| Consumer Staples | 784,597 | — | — | 784,597 | ||||||||||||||||
| Energy | 6,009,125 | 653,634 | 988,798 | 7,651,557 | ||||||||||||||||
| Financial Services | — | — | 7,8261 | 7,826 | ||||||||||||||||
| Industrials | 1,037,765 | 4,335,291 | — | 5,373,056 | ||||||||||||||||
| Materials | 3,696,552 | 1,528,112 | — | 5,224,664 | ||||||||||||||||
| Real Estate | 655,766 | 850,461 | — | 1,506,227 | ||||||||||||||||
| REIT Diversified | 18,881 | 1,592,580 | — | 1,611,461 | ||||||||||||||||
| REIT Healthcare | 704,282 | — | — | 704,282 | ||||||||||||||||
| REIT Hotel | 637,253 | — | — | 637,253 | ||||||||||||||||
| REIT Industrial | 1,725,992 | 523,408 | — | 2,249,400 | ||||||||||||||||
| REIT Lodging | 72,972 | 19,057 | — | 92,029 | ||||||||||||||||
| REIT Mall | 385,925 | — | — | 385,925 | ||||||||||||||||
| REIT Manufactured Housing | 379,060 | — | — | 379,060 | ||||||||||||||||
| REIT Multifamily | 1,870,320 | 460,189 | — | 2,330,509 | ||||||||||||||||
| REIT Office | 756,741 | 409,542 | — | 1,166,283 | ||||||||||||||||
| REIT Retail | — | 309,846 | — | 309,846 | ||||||||||||||||
| REIT Self-Storage | 1,091,343 | 152,258 | — | 1,243,601 | ||||||||||||||||
| REIT Shopping Center | 419,968 | 131,380 | — | 551,348 | ||||||||||||||||
| REIT Single Tenant | 313,621 | — | — | 313,621 | ||||||||||||||||
| REIT Specialty | 568,757 | 180,062 | — | 748,819 | ||||||||||||||||
| Services | 59,998 | — | — | 59,998 | ||||||||||||||||
| Technology | 1,233,088 | 2,640,799 | — | 3,873,887 | ||||||||||||||||
| Utilities | 912,779 | 3,914,889 | — | 4,827,668 | ||||||||||||||||
| Corporate Bonds2 | — | 50,197,108 | 340,0121 | 50,537,120 | ||||||||||||||||
| Exchange-Traded Funds | 6,669,633 | — | — | 6,669,633 | ||||||||||||||||
| Loan Agreements | — | 9,653,359 | — | 9,653,359 | ||||||||||||||||
| Master Limited Partnerships | 589,223 | — | — | 589,223 | ||||||||||||||||
| Municipal Bonds | — | 54,224 | — | 54,224 | ||||||||||||||||
| Non-Agency Commercial Mortgage-Backed Securities | — | 767,177 | — | 767,177 | ||||||||||||||||
| Preferred Stock | — | — | 10,280 | 10,280 | ||||||||||||||||
| Rights | 175,944 | — | — | 175,944 | ||||||||||||||||
| US Treasury Obligations | — | 6,939,146 | — | 6,939,146 | ||||||||||||||||
| Warrant | 12,137 | — | — | 12,137 | ||||||||||||||||
206
| Delaware Ivy Multi-Asset Income Fund | ||||||||||||||||||||
| Level 1 | Level 2 | Level 3 | Total | |||||||||||||||||
| Short-Term Investments | $ | 471,888 | $ | — | $ | — | $ | 471,888 | ||||||||||||
| Securities Lending Collateral | 5,826,401 | — | — | 5,826,401 | ||||||||||||||||
| Total Value of Securities | $ | 49,273,283 | $ | 112,198,771 | $ | 1,411,092 | $ | 162,883,146 | ||||||||||||
| Derivatives3 | ||||||||||||||||||||
| Assets: | ||||||||||||||||||||
| Foreign Currency Exchange Contracts | $ | — | $ | 52,225 | $ | — | $ | 52,225 | ||||||||||||
| Liabilities: | ||||||||||||||||||||
| Foreign Currency Exchange Contracts | $ | — | $ | (573 | ) | $ | — | $ | (573 | ) | ||||||||||
| Futures Contracts | (46,686 | ) | — | — | (46,686 | ) | ||||||||||||||
1 The security that has been valued at zero on the “Schedules of investments” is considered to be Level 3 investments in this table.
2 Security type is valued across multiple levels. Level 1 investments represent exchange-traded investments, Level 2 investments represent investments with observable inputs or matrix-priced investments, and Level 3 investments represent investments without observable inputs. The amounts attributed to Level 1 investments, Level 2 investments, and Level 3 investments represent the following percentages of the total market value of these security types:
3 Foreign currency exchange contracts and futures contracts are valued at the unrealized appreciation (depreciation) on the instrument at the year end.
| Level 1 | Level 2 | Level 3 | Total | |||||||||||||||||
| Corporate Bonds | — | 99.33% | 0.67% | 100.00% | ||||||||||||||||
| Delaware Ivy Strategic Income Fund | ||||||||||||||||||||
| Level 1 | Level 2 | Level 3 | Total | |||||||||||||||||
| Securities | ||||||||||||||||||||
| Assets: | ||||||||||||||||||||
| Agency Collateralized Mortgage Obligations | $ | — | $ | 10,743,588 | $ | — | $ | 10,743,588 | ||||||||||||
| Common Stocks | ||||||||||||||||||||
| Basic Industry | — | — | 18,372 | 18,372 | ||||||||||||||||
| Consumer Cyclical | 143,180 | — | 50,940 | 194,120 | ||||||||||||||||
| Energy | — | — | 983,646 | 983,646 | ||||||||||||||||
| Financials | — | — | 8,075 | 1 | 8,075 | |||||||||||||||
| Convertible Bonds | — | 1,226,442 | — | 1,226,442 | ||||||||||||||||
| Corporate Bonds | — | 101,982,554 | — | 1 | 101,982,554 | |||||||||||||||
| Loan Agreements | — | 11,035,430 | — | 11,035,430 | ||||||||||||||||
| Municipal Bonds | — | 1,662,673 | — | 1,662,673 | ||||||||||||||||
| Non-Agency Collateralized Mortgage Obligations | — | 5,470,854 | — | 5,470,854 | ||||||||||||||||
| Non-Agency Commercial Mortgage-Backed Securities | — | 866,049 | — | 866,049 | ||||||||||||||||
| Preferred Stock | — | — | 11,435 | 11,435 | ||||||||||||||||
| Sovereign Bonds | — | 9,377,142 | — | 9,377,142 | ||||||||||||||||
| Supranational Banks | — | 1,045,048 | — | 1,045,048 | ||||||||||||||||
| US Treasury Obligations | — | 17,405,020 | — | 17,405,020 | ||||||||||||||||
| Warrant | 14,227 | — | — | 14,227 | ||||||||||||||||
207
Notes to financial statements
Ivy Funds
3. Investments (continued)
| Delaware Ivy Strategic Income Fund | ||||||||||||||||||||
| Level 1 | Level 2 | Level 3 | Total | |||||||||||||||||
| Short-Term Investments | $ | 6,784,368 | $ | — | $ | — | $ | 6,784,368 | ||||||||||||
| Securities Lending Collateral | 3,190,372 | — | — | 3,190,372 | ||||||||||||||||
| Total Value of Securities | $ | 10,132,147 | $ | 160,814,800 | $ | 1,072,468 | $ | 172,019,415 | ||||||||||||
| Derivatives2 | ||||||||||||||||||||
| Assets: | ||||||||||||||||||||
| Foreign Currency Exchange Contracts | $ | — | $ | 212,194 | $ | — | $ | 212,194 | ||||||||||||
| Liabilities: | ||||||||||||||||||||
| Futures Contracts | $ | (737,143 | ) | $ | — | $ | — | $ | (737,143 | ) | ||||||||||
1 The security that has been valued at zero on the “Schedules of investments” is considered to be Level 3 investments in this table.
2 Foreign currency exchange contracts and futures contracts are valued at the unrealized appreciation (depreciation) on the instrument at the year end.
| Delaware Ivy Total Return Bond Fund | |||||||||||||||
| Level 1 | Level 2 | Total | |||||||||||||
| Securities | |||||||||||||||
| Assets: | |||||||||||||||
| Agency Mortgage-Backed Securities | $ | — | $ | 2,374,364 | $ | 2,374,364 | |||||||||
| Corporate Bonds | — | 36,657,796 | 36,657,796 | ||||||||||||
| Sovereign Bonds | — | 23,632,019 | 23,632,019 | ||||||||||||
| Supranational Banks | — | 1,613,008 | 1,613,008 | ||||||||||||
| US Treasury Obligations | — | 11,667,384 | 11,667,384 | ||||||||||||
| Options Purchased | — | 151,623 | 151,623 | ||||||||||||
| Securities Lending Collateral | 2,792,984 | — | 2,792,984 | ||||||||||||
| Total Value of Securities Before Options Written | $ | 2,792,984 | $ | 76,096,194 | $ | 78,889,178 | |||||||||
| Liabilities: | |||||||||||||||
| Options Written | $ | — | $ | (61,392 | ) | $ | (61,392 | ) | |||||||
| Derivatives 1 | |||||||||||||||
| Assets: | |||||||||||||||
| Foreign Currency Exchange Contracts | $ | — | $ | 3,259,006 | $ | 3,259,006 | |||||||||
| Futures Contracts | 1,084,641 | — | 1,084,641 | ||||||||||||
| Liabilities: | |||||||||||||||
| Futures Contracts | $ | (1,232,274 | ) | $ | — | $ | (1,232,274 | ) | |||||||
| Foreign Currency Exchange Contracts | — | (1,638,721 | ) | (1,638,721 | ) | ||||||||||
1 Foreign currency exchange contracts and futures contracts are valued at the unrealized appreciation (depreciation) on the instrument at the year end.
During the year ended September 30, 2022, for all funds except Delaware Ivy Multi-Asset Income Fund and Delaware Ivy Strategic Income Fund, there were no transfers into or out of Level 3 investments. Each Fund’s policy is to recognize transfers into or out of Level 3 investments based on fair value at the beginning of the reporting period.
208
A reconciliation of Level 3 investments is presented when a Fund has a significant amount of Level 3 investments at the beginning or end of the period in relation to each Fund’s net assets. Management has determined not to provide a reconciliation of Level 3 investments as the Level 3 investments were not considered significant to the Delaware Ivy Emerging Markets Local Currency Debt Fund and Delaware Ivy High Yield Fund’s net assets at the beginning or end of the period. Management has determined not to provide additional disclosure on Level 3 inputs since the Level 3 investments were not considered significant to each Fund’s net assets at the end of the year. Delaware Ivy California Municipal High Income Fund, Delaware Ivy Corporate Bond Fund, Delaware Ivy Crossover Credit Fund, Delaware Ivy Government Securities Fund, Delaware Ivy International Small Cap Fund and Delaware Ivy Total Return Bond Fund had no Level 3 investments at September 30, 2022.
The following is a reconciliation of investments in which significant unobservable inputs (Level 3) were used in determining fair value for the Fund:
Delaware Ivy Multi-Asset Income Fund
| Common Stocks | Corporate Bonds | Preferred Stock | Loan Agreements | |||||||||||||
| Balance as of 9/30/21 | $ | 1,387,296 | $ | — | $ | — | $ | 3,859,816 | ||||||||
| Net change in unrealized appreciation (depreciation) | (1,268,876 | ) | 11,377 | (23,551 | ) | (1,447,758 | ) | |||||||||
| Transfers in | 942,380 | 328,635 | 33,831 | — | ||||||||||||
| Transfers out | — | — | — | (2,412,058 | ) | |||||||||||
| Balance as of 9/30/22 | $ | 1,060,800 | $ | 340,012 | $ | 10,280 | $ | — | ||||||||
| Net change in unrealized appreciation (depreciation) from Level 3 investments still held as of 9/30/22 | $ | (1,268,876 | ) | $ | 11,377 | $ | (23,551 | ) | $ | (1,447,758 | ) | |||||
Delaware Ivy Strategic Income Fund
| Common Stocks | Preferred Stock | Loan Agreements | ||||||||||
| Balance as of 9/30/21 | $ | 1,833,347 | $ | — | $ | 4,732,087 | ||||||
| Net change in unrealized appreciation (depreciation) | (1,633,507 | ) | (26,200 | ) | (4,191,030 | ) | ||||||
| Transfers in | 861,193 | 37,635 | 1,905,232 | |||||||||
| Transfers out | — | — | (2,446,289 | ) | ||||||||
| Balance as of 9/30/22 | $ | 1,061,033 | $ | 11,435 | $ | — | ||||||
| Net change in unrealized appreciation (depreciation) from Level 3 investments still held as of 9/30/22 | $ | (1,633,507 | ) | $ | (26,200 | ) | $ | (4,191,030 | ) | |||
209
Notes to financial statements
Ivy Funds
3. Investments (continued)
A significant change to the inputs may result in a significant change to the valuation. Quantitative information about Level 3 fair value measurements for the Fund is as follows:
Delaware Ivy Multi-Asset Income Fund
| Assets | Value | Valuation Techniques | Unobservable Inputs | Input Value | ||||
| Common Stocks | $532,916 | Market approach | Broker quotes | N/A | ||||
| Common Stocks | 463,708 | Market approach | Discount for lack of marketability | 30% | ||||
| Common Stocks | 45,804 | Market approach | EV/EBITDA multiple | 2.82x | ||||
| EV/Revenue multiple | 0.45x | |||||||
| Common Stocks | 18,372 | Market approach | Financials | N/A | ||||
| Corporate Bonds | 340,012 | Market approach | Financials | N/A | ||||
| Preferred Stock | 10,280 | Market approach | EV/EBITDA multiple | 2.82x | ||||
| EV/Revenue multiple | 0.45x |
Delaware Ivy Strategic Income Fund
| Assets | Value | Valuation Techniques | Unobservable Inputs | Input Value | ||||
| Common Stocks | $362,735 | Market approach | Broker quotes | N/A | ||||
| Common Stocks | 628,986 | Market approach | Discount for lack of marketability | 30% | ||||
| Common Stocks | 50,940 | Market approach | EV/EBITDA multiple | 2.82x | ||||
| EV/Revenue multiple | 0.45x | |||||||
| Common Stocks | 18,372 | Market approach | Financials | N/A | ||||
| Preferred Stock | 11,435 | Market approach | EV/EBITDA multiple | 2.82x | ||||
| EV/Revenue multiple | 0.45x |
210
4. Dividend and Distribution Information
Income and long-term capital gain distributions are determined in accordance with federal income tax regulations, which may differ from US GAAP. Additionally, distributions from net gains on foreign currency transactions and net short-term gains on sales of investment securities are treated as ordinary income for federal income tax purposes. The tax character of dividends and distributions paid during the years ended September 30, 2022 and 2021 were as follows:
| Tax-exempt income | Ordinary income | Long-term capital gains | Total | ||||||||||||
| Year ended September 30, 2022: | |||||||||||||||
| Delaware Ivy California Municipal High Income Fund | $ | 553,777 | $ | 70 | $ | 242,383 | $ | 796,230 | |||||||
| Delaware Ivy Corporate Bond Fund | — | 20,766,102 | 17,188,833 | 37,954,935 | |||||||||||
| Delaware Ivy Crossover Credit Fund | — | 1,856,852 | 1,011,991 | 2,868,843 | |||||||||||
| Delaware Ivy Emerging Markets Local Currency Debt Fund | — | — | — | — | |||||||||||
| Delaware Ivy Government Securities Fund | — | 3,055,253 | — | 3,055,253 | |||||||||||
| Delaware Ivy High Yield Fund | — | 7,821,058 | 125,184 | 7,946,242 | |||||||||||
| Delaware Ivy International Small Cap Fund | — | 7,631,415 | 8,573,658 | 16,205,073 | |||||||||||
| Delaware Ivy Multi-Asset Income Fund | — | 13,203,165 | — | 13,203,165 | |||||||||||
| Delaware Ivy Strategic Income Fund | — | 11,176,427 | — | 11,176,427 | |||||||||||
| Delaware Ivy Total Return Bond Fund | — | 2,477,070 | 1,474,750 | 3,951,820 | |||||||||||
| Year ended September 30, 2021: | |||||||||||||||
| Delaware Ivy California Municipal High Income Fund | — | 648,498 | — | 648,498 | |||||||||||
| Delaware Ivy Corporate Bond Fund | — | 43,162,216 | 18,197,638 | 61,359,854 | |||||||||||
| Delaware Ivy Crossover Credit Fund | — | 4,039,184 | 921,051 | 4,960,235 | |||||||||||
| Delaware Ivy Emerging Markets Local Currency Debt Fund | — | 194,556 | — | 194,556 | |||||||||||
| Delaware Ivy Government Securities Fund | — | 4,859,367 | — | 4,859,367 | |||||||||||
| Delaware Ivy High Yield Fund | — | 6,875,331 | — | 6,875,331 | |||||||||||
| Delaware Ivy International Small Cap Fund | — | 740,438 | — | 740,438 | |||||||||||
| Delaware Ivy Multi-Asset Income Fund | — | 13,693,010 | — | 13,693,010 | |||||||||||
| Delaware Ivy Strategic Income Fund | — | 17,445,756 | — | 17,445,756 | |||||||||||
| Delaware Ivy Total Return Bond Fund | — | 2,856,509 | — | 2,856,509 | |||||||||||
5. Components of Net Assets on a Tax Basis
As of September 30, 2022, the components of net assets on a tax basis were as follows:
| Delaware Ivy California Municipal High Income Fund | Delaware Ivy Corporate Bond Fund | Delaware Ivy Crossover Credit Fund | Delaware Ivy Emerging Markets Local Currency Debt Fund | |||||||||||||||||
| Shares of beneficial interest | $ | 18,737,978 | $ | 528,111,476 | $ | 24,264,973 | $ | 33,276,182 | ||||||||||||
| Undistributed ordinary income | — | 468,875 | 23,889 | — | ||||||||||||||||
| Undistributed long-term capital gains | 41,772 | — | — | — | ||||||||||||||||
| Qualified late year loss deferrals | — | — | — | (2,011,672 | ) | |||||||||||||||
| Distributions payable | (4,135 | ) | — | — | — | |||||||||||||||
| Capital loss carryforwards | — | (32,310,257 | ) | (2,867,301 | ) | (3,348,658 | ) | |||||||||||||
| Other temporary differences | (513 | ) | (212,363 | ) | (721 | ) | (28,775 | ) | ||||||||||||
| Unrealized appreciation (depreciation) of investments and foreign currencies | (1,590,237 | ) | (81,256,544 | ) | (4,116,470 | ) | (5,538,596 | ) | ||||||||||||
| Net assets | $ | 17,184,865 | $ | 414,801,187 | $ | 17,304,370 | $ | 22,348,481 | ||||||||||||
211
Notes to financial statements
Ivy Funds
5. Components of Net Assets on a Tax Basis (continued)
| Delaware Ivy Government Securities Fund | Delaware Ivy High Yield Fund | Delaware Ivy International Small Cap Fund | Delaware Ivy Multi-Asset Income Fund | |||||||||||||||||
| Shares of beneficial interest | $ | 227,244,533 | $ | 55,549,914 | $ | 42,382,594 | $ | 183,808,545 | ||||||||||||
| Undistributed ordinary income | 114,147 | 108,807 | — | — | ||||||||||||||||
| Undistributed long-term capital gains | — | — | 3,906,428 | 9,477,452 | ||||||||||||||||
| Qualified late year loss deferrals | — | (5,326,643 | ) | (1,659,774 | ) | (63,260 | ) | |||||||||||||
| Distributions payable | (458 | ) | — | — | — | |||||||||||||||
| Capital loss carryforwards | (25,486,566 | ) | — | — | — | |||||||||||||||
| Other temporary differences | (70,101 | ) | (1,654 | ) | (2,498 | ) | (22,535 | ) | ||||||||||||
| Unrealized appreciation (depreciation) of investments and foreign currencies | (15,489,288 | ) | (7,410,835 | ) | (7,626,059 | ) | (32,963,044 | ) | ||||||||||||
| Net assets | $ | 186,312,267 | $ | 42,919,589 | $ | 37,000,691 | $ | 160,237,158 | ||||||||||||
| Delaware Ivy Strategic Income Fund | Delaware Ivy Total Return Bond Fund | |||||||||||||||||||
| Shares of beneficial interest | $ | 216,696,871 | $ | 97,054,775 | ||||||||||||||||
| Undistributed ordinary income | 294,204 | 6,010,286 | ||||||||||||||||||
| Capital loss carryforwards | (15,800,613 | ) | (8,478,508 | ) | ||||||||||||||||
| Other temporary differences | (22,834 | ) | (17,758 | ) | ||||||||||||||||
| Unrealized appreciation (depreciation) of investments and foreign currencies | (28,579,393 | ) | (14,870,610 | ) | ||||||||||||||||
| Net assets | $ | 172,588,235 | $ | 79,698,185 | ||||||||||||||||
The differences between book basis and tax basis components of net assets are primarily attributable to tax deferral of losses on wash sales, tax deferral of losses on straddles, mark-to-market of foreign currency exchange contracts, mark-to-market of futures contracts, tax recognition of unrealized gain on passive foreign investment companies, tax treatment of swap contracts, amortization of premium on convertible securities, trust preferred securities, tax deferral of losses on straddles, market premium and discount on debt instruments, paydown gains and losses, and partnership interest.
Qualified late year ordinary and capital losses (including currency and specified gain/loss items) represent losses realized from January 1, 2022 through September 30, 2022 and November 1, 2021 through September 30, 2022, respectively, that, in accordance with federal income tax regulations, the Funds have elected to defer and treat as having arisen in the following fiscal year.
For financial reporting purposes, capital accounts are adjusted to reflect the tax character of permanent book/tax differences. Reclassifications are primarily due to tax treatment of partnership non-deductible expenses, gain (loss) on foreign currency transactions, tax treatment of partnerships, amortization of premium on convertible securities, swap contracts, passive foreign investment secuities (PFICs) and securities no longer deemed to be PFICs, CFC reclass, paydown gains (losses) of asset- and mortgage-backed securities and earnings and profits distributed to shareholders on the redemption of shares. Results of operations and net assets were not affected by these reclassifications. For the year ended September 30, 2022, the Funds recorded the following reclassifications:
| Delaware Ivy Corporate Bond Fund | Delaware Ivy International Small Cap Fund | Delaware Ivy Multi-Asset Income Fund | Delaware Ivy Strategic Income Fund | |||||||||||||
| Paid-in capital | $ | (2 | ) | $ | 3,259,294 | $ | 6,979,472 | $ | (76 | ) | ||||||
| Total distributable earnings (loss) | 2 | (3,259,294 | ) | (6,979,472 | ) | 76 | ||||||||||
212
For federal income tax purposes, capital loss carryforwards may be carried forward and applied against future capital gains. At September 30, 2022, the Funds utilized the following capital loss carryforwards:
| Delaware Ivy Multi-Asset Income Fund | $1,495,295 |
At September 30, 2022, capital loss carryforwards available to offset future realized capital gains are as follows:
| Loss carryforward character | |||||||||||
| Short-term | Long-term | Total | |||||||||
| Delaware Ivy Corporate Bond Fund | $ | 16,377,601 | $ | 15,932,656 | $ | 32,310,257 | |||||
| Delaware Ivy Crossover Credit Fund | 1,625,545 | 1,241,756 | 2,867,301 | ||||||||
| Delaware Ivy Emerging Markets Local Currency Debt Fund | 1,381,809 | 1,966,849 | 3,348,658 | ||||||||
| Delaware Ivy Government Securities Fund | 12,417,195 | 13,069,371 | 25,486,566 | ||||||||
| Delaware Ivy Strategic Income Fund | 5,778,693 | 10,021,920 | 15,800,613 | ||||||||
| Delaware Ivy Total Return Bond Fund | 4,853,881 | 3,624,627 | 8,478,508 | ||||||||
213
Notes to financial statements
Ivy Funds
6. Capital Shares
Transactions in capital shares were as follows:
| Delaware Ivy California Municipal High Income Fund | Delaware Ivy Corporate Bond Fund | Delaware Ivy Crossover Credit Fund | ||||||||||||||||||||||
| Year ended | Year ended | Year ended | ||||||||||||||||||||||
| 9/30/22 | 9/30/21 | 9/30/22 | 9/30/21 | 9/30/22 | 9/30/21 | |||||||||||||||||||
| Shares sold: | ||||||||||||||||||||||||
| Class A | 83,321 | 101,533 | 2,618,451 | 6,618,077 | 69,948 | 323,652 | ||||||||||||||||||
| Class B1 | — | — | — | 84 | — | — | ||||||||||||||||||
| Class C | 1,176 | 1,379 | 48,522 | 153,073 | — | — | ||||||||||||||||||
| Class I | 442,675 | 253,708 | 7,318,249 | 12,564,928 | 979,757 | 1,594,463 | ||||||||||||||||||
| Class R62 | — | — | 469,044 | 1,677,943 | 69,216 | 445,832 | ||||||||||||||||||
| Class Y | 3 | — | — | — | 10,072 | 17,800 | ||||||||||||||||||
| Shares issued upon reinvestment of dividends and distributions: | ||||||||||||||||||||||||
| Class A | 36,682 | 18,245 | 2,525,682 | 3,596,963 | 43,100 | 54,155 | ||||||||||||||||||
| Class B1 | — | — | — | 1,364 | — | — | ||||||||||||||||||
| Class C | 1,217 | 616 | 13,932 | 35,474 | — | — | ||||||||||||||||||
| Class I | 32,766 | 18,917 | 3,238,627 | 4,848,715 | 197,627 | 217,664 | ||||||||||||||||||
| Class R62 | — | — | 251,005 | 601,842 | 35,136 | 18,651 | ||||||||||||||||||
| Class Y | 246 | 427 | — | — | 1,088 | 130 | ||||||||||||||||||
| 598,086 | 394,825 | 16,483,512 | 30,098,463 | 1,405,944 | 2,672,347 | |||||||||||||||||||
| Shares from reverse stock split:3 | ||||||||||||||||||||||||
| Class A | — | — | (28,476,964 | ) | — | — | — | |||||||||||||||||
| Class C | — | — | (187,486 | ) | — | — | — | |||||||||||||||||
| Class I | — | — | (27,887,847 | ) | — | — | — | |||||||||||||||||
| Class Y | — | — | (26,539 | ) | — | — | — | |||||||||||||||||
| Shares redeemed: | ||||||||||||||||||||||||
| Class A | (490,585 | ) | (421,510 | ) | (13,559,439 | ) | (10,763,191 | ) | (307,372 | ) | (1,245,815 | ) | ||||||||||||
| Class B1 | — | — | (3,382 | ) | (31,893 | ) | — | — | ||||||||||||||||
| Class C | (103,128 | ) | (27,822 | ) | (146,095 | ) | (441,126 | ) | — | — | ||||||||||||||
| Class I | (504,238 | ) | (690,872 | ) | (36,736,275 | ) | (16,341,457 | ) | (2,369,868 | ) | (2,568,581 | ) | ||||||||||||
| Class R62 | — | — | (6,601,449 | ) | (4,953,373 | ) | (652,932 | ) | (114,525 | ) | ||||||||||||||
| Class Y | (102,064 | ) | (16,265 | ) | — | — | (7,106 | ) | (4,303 | ) | ||||||||||||||
| (1,200,015 | ) | (1,156,469 | ) | (113,625,476 | ) | (32,531,040 | ) | (3,337,278 | ) | (3,933,224 | ) | |||||||||||||
| Net decrease | (601,929 | ) | (761,644 | ) | (97,141,964 | ) | (2,432,577 | ) | (1,931,334 | ) | (1,260,877 | ) | ||||||||||||
214
| Delaware Ivy Emerging Markets Local Currency Debt Fund | Delaware Ivy Government Securities Fund | Delaware Ivy High Yield Fund | ||||||||||||||||||||||
| Year ended | Year ended | Year ended | ||||||||||||||||||||||
| 9/30/22 | 9/30/21 | 9/30/22 | 9/30/21 | 9/30/22 | 9/30/21 | |||||||||||||||||||
| Shares sold: | ||||||||||||||||||||||||
| Class A | 13,084 | 61,492 | 1,181,789 | 2,201,386 | 300,722 | 605,518 | ||||||||||||||||||
| Class C | 87 | — | 44,278 | 140,843 | — | — | ||||||||||||||||||
| Class I | 203,037 | 1,162,549 | 11,024,208 | 5,567,140 | 1,523,281 | 2,441,532 | ||||||||||||||||||
| Class R62 | 351,222 | 1,608,534 | 5,583,841 | 6,113,431 | 15,102 | 371,746 | ||||||||||||||||||
| Class Y | 1 | 3 | — | — | — | — | ||||||||||||||||||
| Shares issued upon reinvestment of dividends and distributions: | ||||||||||||||||||||||||
| Class A | — | 283 | 113,295 | 155,991 | 113,168 | 51,086 | ||||||||||||||||||
| Class B1 | — | — | — | 1 | — | — | ||||||||||||||||||
| Class C | — | — | 107 | 464 | — | — | ||||||||||||||||||
| Class I | — | 11,198 | 247,464 | 309,496 | 524,409 | 400,735 | ||||||||||||||||||
| Class R62 | — | 8,753 | 227,162 | 379,783 | 199,551 | 190,165 | ||||||||||||||||||
| 567,431 | 2,852,812 | 18,422,144 | 14,868,535 | 2,676,233 | 4,060,782 | |||||||||||||||||||
| Shares redeemed: | ||||||||||||||||||||||||
| Class A | (146,908 | ) | (686,487 | ) | (3,866,427 | ) | (4,942,094 | ) | (527,243 | ) | (860,689 | ) | ||||||||||||
| Class B1 | — | — | (4,056 | ) | (24,223 | ) | — | — | ||||||||||||||||
| Class C | (926 | ) | (200,859 | ) | (117,526 | ) | (268,999 | ) | — | — | ||||||||||||||
| Class I | (2,279,871 | ) | (1,341,441 | ) | (13,277,747 | ) | (6,898,426 | ) | (6,178,495 | ) | (3,512,975 | ) | ||||||||||||
| Class R62 | (798,250 | ) | (1,556,786 | ) | (24,421,944 | ) | (11,607,144 | ) | (3,625,930 | ) | (1,211,894 | ) | ||||||||||||
| Class Y | — | (271,568 | ) | — | — | — | — | |||||||||||||||||
| (3,225,955 | ) | (4,057,141 | ) | (41,687,700 | ) | (23,740,886 | ) | (10,331,668 | ) | (5,585,558 | ) | |||||||||||||
| Net decrease | (2,658,524 | ) | (1,204,329 | ) | (23,265,556 | ) | (8,872,351 | ) | (7,655,435 | ) | (1,524,776 | ) | ||||||||||||
215
Notes to financial statements
Ivy Funds
6. Capital Shares (continued)
| Delaware Ivy International Small Cap Fund | Delaware Ivy Multi-Asset Income Fund | Delaware Ivy Strategic Income Fund | ||||||||||||||||||||||
| Year ended | Year ended | Year ended | ||||||||||||||||||||||
| 9/30/22 | 9/30/21 | 9/30/22 | 9/30/21 | 9/30/22 | 9/30/21 | |||||||||||||||||||
| Shares sold: | ||||||||||||||||||||||||
| Class A | 39,545 | 145,543 | 619,676 | 692,122 | 984,411 | 1,563,575 | ||||||||||||||||||
| Class C | 7,261 | 4,390 | 40,737 | 82,060 | 69,100 | 124,307 | ||||||||||||||||||
| Class I | 379,066 | 738,404 | 1,405,194 | 2,641,490 | 3,149,670 | 4,678,865 | ||||||||||||||||||
| Class R62 | 514,078 | 102,074 | 15,911 | 58,159 | 36,179 | 42,983 | ||||||||||||||||||
| Class Y | 49,640 | 90,781 | 440 | — | 2,541 | 4,856 | ||||||||||||||||||
| Shares issued upon reinvestment of dividends and distributions: | ||||||||||||||||||||||||
| Class A | 81,160 | 1,462 | 358,300 | 314,957 | 316,484 | 361,706 | ||||||||||||||||||
| Class C | 4,717 | — | 27,126 | 27,241 | 12,841 | 18,498 | ||||||||||||||||||
| Class I | 571,289 | 24,928 | 833,423 | 875,050 | 837,138 | 1,197,875 | ||||||||||||||||||
| Class R62 | 610,077 | 25,761 | 6,644 | 5,332 | 4,833 | 12,893 | ||||||||||||||||||
| Class Y | 1,124 | 15 | 538 | 509 | 605 | 7,974 | ||||||||||||||||||
| 2,257,957 | 1,133,358 | 3,307,989 | 4,696,920 | 5,413,802 | 8,013,532 | |||||||||||||||||||
| Shares redeemed: | ||||||||||||||||||||||||
| Class A | (213,596 | ) | (955,969 | ) | (2,321,429 | ) | (2,197,480 | ) | (3,352,000 | ) | (4,616,891 | ) | ||||||||||||
| Class C | (12,081 | ) | (104,661 | ) | (237,668 | ) | (391,136 | ) | (211,579 | ) | (246,746 | ) | ||||||||||||
| Class I | (3,149,611 | ) | (3,321,442 | ) | (9,982,150 | ) | (7,282,383 | ) | (14,006,841 | ) | (8,151,291 | ) | ||||||||||||
| Class R62 | (1,930,562 | ) | (2,414,469 | ) | (33,783 | ) | (257,963 | ) | (57,614 | ) | (2,162,539 | ) | ||||||||||||
| Class Y | (59,198 | ) | (131,005 | ) | (1,725 | ) | (311,051 | ) | (7,050 | ) | (660,256 | ) | ||||||||||||
| (5,365,048 | ) | (6,927,546 | ) | (12,576,755 | ) | (10,440,013 | ) | (17,635,084 | ) | (15,837,723 | ) | |||||||||||||
| Net decrease | (3,107,091 | ) | (5,794,188 | ) | (9,268,766 | ) | (5,743,093 | ) | (12,221,282 | ) | (7,824,191 | ) | ||||||||||||
216
| Delaware Ivy Total Return Bond Fund | ||||||||
| Year ended | ||||||||
| 9/30/22 | 9/30/21 | |||||||
| Shares sold: | ||||||||
| Class A | 89,758 | 310,415 | ||||||
| Class C | 4,467 | 16,969 | ||||||
| Class I | 671,920 | 3,159,674 | ||||||
| Class R62 | 158,026 | 1,476,211 | ||||||
| Shares issued upon reinvestment of dividends and distributions: | ||||||||
| Class A | 28,317 | 17,672 | ||||||
| Class C | 1,378 | 542 | ||||||
| Class I | 229,690 | 149,719 | ||||||
| Class R62 | 143,606 | 99,107 | ||||||
| Class Y | — | 8 | ||||||
| 1,327,162 | 5,230,317 | |||||||
| Shares redeemed: | ||||||||
| Class A | (522,452 | ) | (1,340,986 | ) | ||||
| Class C | (26,901 | ) | (402,955 | ) | ||||
| Class I | (6,169,250 | ) | (3,633,008 | ) | ||||
| Class R62 | (2,126,484 | ) | (1,208,933 | ) | ||||
| Class Y | (3 | ) | (350,678 | ) | ||||
| (8,845,090 | ) | (6,936,560 | ) | |||||
| Net decrease | (7,517,928 | ) | (1,706,243 | ) | ||||
| 1 | On December 10, 2021, all Class B shares were converted into Class A shares. These transactions are included as subscriptions of Class A shares and redemptions of Class B shares in the tables above and on the previous pages. |
| 2 | Effective July 1, 2021, Class N shares were renamed Class R6 shares. |
| 3 | On September 9, 2022, the Fund declared a 3 for 1 reverse stock split. The shares of beneficial interest outstanding, net asset value per share and offering price per shares have reflected the reverse stock split. |
Certain shareholders may exchange shares of one class for shares of another class in the same Fund. These exchange transactions are included as subscriptions and redemptions in the tables above and on the previous pages and on the “Statements of changes in net assets.” For the year ended September 30, 2022, each Fund had the following exchange transactions:
| Exchange Redemptions | Exchange Subscriptions | Value | ||||||||||
| Delaware Ivy California Municipal High Income Fund | $ | 321,052 | ||||||||||
| Class A | 31,420 | 208 | ||||||||||
| Class C | 693 | — | ||||||||||
| Class I | — | 31,905 | ||||||||||
| Delaware Ivy Corporate Bond Fund | $ | 4,906,817 | ||||||||||
| Class A | 761,707 | 63,875 | ||||||||||
| Class B | 5,194 | — | ||||||||||
| Class C | 29,831 | — | ||||||||||
| Class I | 29,978 | 762,319 | ||||||||||
217
Notes to financial statements
Ivy Funds
6. Capital Shares (continued)
| Exchange Redemptions | Exchange Subscriptions | Value | ||||||||||
| Delaware Ivy Crossover Credit Fund | $ | 76,648 | ||||||||||
| Class A | 7,060 | 533 | ||||||||||
| Class I | 533 | 7,059 | ||||||||||
| Delaware Ivy Emerging Markets Local Currency Debt Fund | $ | 46,666 | ||||||||||
| Class A | 4,427 | 1,277 | ||||||||||
| Class I | 1,257 | 4,357 | ||||||||||
| Delaware Ivy Government Securities Fund | $ | 799,769 | ||||||||||
| Class A | 99,340 | 48,447 | ||||||||||
| Class B | 2,624 | — | ||||||||||
| Class C | 40,149 | — | ||||||||||
| Class I | 6,639 | 100,299 | ||||||||||
| Delaware Ivy High Yield Fund | $ | 1,165,268 | ||||||||||
| Class A | 114,721 | 4,122 | ||||||||||
| Class I | 4,118 | 114,698 | ||||||||||
| Delaware Ivy International Small Cap Fund | $ | 244,487 | ||||||||||
| Class A | 11,392 | 3,138 | ||||||||||
| Class C | 1,205 | — | ||||||||||
| Class I | 3,112 | 14,603 | ||||||||||
| Class Y | 2,103 | — | ||||||||||
| Delaware Ivy Multi-Asset Income Fund | $ | 4,415,461 | ||||||||||
| Class A | 294,024 | 101,214 | ||||||||||
| Class C | 100,877 | — | ||||||||||
| Class I | 8,567 | 296,306 | ||||||||||
| Class R6 | — | 5,842 | ||||||||||
| Delaware Ivy Strategic Income Fund | $ | 5,096,100 | ||||||||||
| Class A | 435,821 | 68,241 | ||||||||||
| Class C | 73,857 | — | ||||||||||
| Class I | 6,534 | 443,364 | ||||||||||
| Class R6 | — | 4,474 | ||||||||||
| Delaware Ivy Total Return Bond Fund | $ | 304,442 | ||||||||||
| Class A | 14,787 | 14,610 | ||||||||||
| Class C | 10,720 | — | ||||||||||
| Class I | 6,529 | 17,215 | ||||||||||
There were no exchange transactions for the year ended September 30, 2021.
7. Line of Credit
On November 1, 2021, the Funds were added (by way of amendment) as additional participants to a $355,000,000 revolving line of credit (Agreement). The Agreement also includes certain other funds in the Delaware Funds (together with the Funds, the Participants) and is intended to be used for temporary or emergency purposes as an additional source of liquidity to fund redemptions of investor shares. Under the amendment to the Agreement, the Participants are charged an annual commitment fee of 0.15%, which is allocated across the Participants based on a weighted average of the respective net assets of each Participant. The Participants are permitted to borrow up to a maximum of one-third of their net assets under the Agreement. Each Participant is individually, and not jointly, liable for its particular advances, if any, under the line of credit. The line of credit available under the Agreement expires on October 31, 2022.
Each Fund had no amounts outstanding as of September 30, 2022, or at any time during the period then ended.
218
8. Interfund Lending Program
Pursuant to an exemptive order issued by the SEC (Order), the Ivy Funds and Ivy Variable Insurance Portfolios (collectively, the Funds only for purposes of this Note 8) have the ability to lend money to, and borrow money from, each other pursuant to a master interfund lending agreement (Interfund Lending Program). Under the Interfund Lending Program, the Funds may lend or borrow money for temporary purposes directly to or from one another (each, an Interfund Loan), subject to meeting the conditions of the Order. The interest rate to be charged on an Interfund Loan is the average of the overnight repurchase agreement rate and the short-term bank loan rate. This program is in existence but is not currently in use. The Funds made no Interfund Loans under the Interfund Lending Program during the year ended September 30, 2022.
9. Derivatives
US GAAP requires disclosures that enable investors to understand: (1) how and why an entity uses derivatives; (2) how they are accounted for; and (3) how they affect an entity’s results of operations and financial position.
Foreign Currency Exchange Contracts — Each Fund may enter into foreign currency exchange contracts and foreign cross currency exchange contracts as a way of managing foreign exchange rate risk. Each Fund may enter into these contracts to fix the US dollar value of a security that it has agreed to buy or sell for the period between the date the trade was entered into and the date the security is delivered and paid for. Each Fund may also enter into these contracts to hedge the US dollar value of securities it already owns that are denominated in foreign currencies. In addition, each Fund may enter into these contracts to facilitate or expedite the settlement of portfolio transactions. The change in value is recorded as an unrealized gain or loss. When the contract is closed, a realized gain or loss is recorded equal to the difference between the value of the contract at the time it was opened and the value at the time it was closed.
The use of foreign currency exchange contracts and foreign cross currency exchange contracts does not eliminate fluctuations in the underlying prices of the securities, but does establish a rate of exchange that can be achieved in the future. Although foreign currency exchange contracts and foreign cross currency exchange contracts limit the risk of loss due to an unfavorable change in the value of the hedged currency, they also limit any potential gain that might result should the value of the currency change favorably. In addition, each Fund could be exposed to risks if the counterparties to the contracts are unable to meet the terms of their contracts. Each Fund’s maximum risk of loss from counterparty credit risk is the value of its currency exchanged with the counterparty. The risk is generally mitigated by having a netting arrangement between each Fund and the counterparty and by the posting of collateral by the counterparty to the Funds to cover the Funds’ exposure to the counterparty.
At September 30, 2022, the Delaware Ivy Total Return Bond Fund received $2,020,000 in cash as collateral for open foreign currency exchange contracts, which is included in “Cash collateral due to brokers” on the “Statements of assets and liabilities.”
During the year ended September 30, 2022, Delaware Ivy Emerging Markets Local Currency Debt Fund, Delaware Ivy Multi-Asset Income Fund, Delaware Ivy Strategic Income Fund and Delaware Ivy Total Return Bond Fund used foreign currency exchange contracts to hedge the US dollar value of securities it already owns that are denominated in foreign currencies to increase/decrease exposure to foreign currencies. During the year ended September 30, 2022, Delaware Ivy International Small Cap Fund, Delaware Ivy Multi-Asset Income Fund and Delaware Ivy Total Return Bond Fund used foreign currency exchange contracts to facilitate or expedite the settlement of portfolio transactions.
Futures Contracts — A futures contract is an agreement in which the writer (or seller) of the contract agrees to deliver to the buyer an amount of cash or securities equal to a specific dollar amount times the difference between the value of a specific security or index at the close of the last trading day of the contract and the price at which the agreement is made. The Funds may use futures in the normal course of pursuing its investment objective. The Funds may invest in futures contracts to hedge its existing portfolio securities against fluctuations in fair value caused by changes in prevailing market interest rates. Upon entering into a futures contract, the Funds deposit cash or pledge US government securities to a broker, equal to the minimum “initial margin” requirements of the exchange on which the contract is traded. Subsequent payments are received from the broker or paid to the broker each day, based on the daily fluctuation in the market value of the contract. These receipts or payments are known as “variation margin” and are recorded daily by the Funds as unrealized gains or losses until the contracts are closed. When the contracts are closed, the Funds record a realized gain or loss equal to the difference between the value of the contract at the time it was opened and the value at the time it was closed. Risks of entering into futures contracts include potential imperfect correlation between the futures contracts and the underlying securities and the possibility of an illiquid secondary market for these instruments. When investing in futures, there is reduced counterparty credit risk to the Funds because futures are exchange-traded and the exchange’s clearinghouse, as counterparty to all exchange-traded futures, guarantees against default. Delaware Ivy Multi-Asset Income Fund posted $17,380, Delaware Ivy Strategic Income Fund posted $320,265 and Delaware Ivy Total Return Bond Fund posted $984,947 cash collateral as
219
Notes to financial statements
Ivy Funds
9. Derivatives (continued)
margin for open futures contracts, which is presented as “Cash collateral due from brokers” on the “Statements of assets and liabilities.” Open futures contracts, if any, are disclosed on the “Schedules of investments.”
During the year ended September 30, 2022, Delaware Ivy Corporate Bond Fund, Delaware Ivy Crossover Credit Fund, Delaware Ivy Emerging Markets Local Currency Debt Fund, Delaware Ivy Government Securities Fund and Delaware Ivy Strategic Income Fund invested in futures contracts to hedge the Fund’s existing portfolio securities against fluctuations in value caused by changes in interest rates or market conditions. During the year ended September 30, 2022 Delaware Ivy Multi-Asset Income Fund invested in futures contracts to hedge the Fund’s existing portfolio securities against fluctuations in value caused by changes in interest rates or market conditions as a cash management tool. During the year ended September 30, 2022, Delaware Ivy Total Return Bond Fund invested in futures contracts to hedge the Fund’s existing portfolio securities against fluctuations in value caused by changes in interest rates or market conditions and to reduce transaction costs.
Options Contracts — Each Fund may buy or write options contracts for any number of reasons, including without limitation: to manage each Fund’s exposure to changes in securities prices caused by interest rates or market conditions and foreign currencies; as an efficient means of adjusting each Fund’s overall exposure to certain markets; to protect the value of portfolio securities; and as a cash management tool. Each Fund may buy or write call or put options on securities, futures, swaps, swaptions, financial indices, and foreign currencies. When each Fund buys an option, a premium is paid and an asset is recorded and adjusted on a daily basis to reflect the current market value of the option purchased. When each Fund writes an option, a premium is received and a liability is recorded and adjusted on a daily basis to reflect the current market value of the option written. Premiums received from writing options that expire unexercised are treated by each Fund on the expiration date as realized gains. The difference between the premium received and the amount paid on effecting a closing purchase transaction, including brokerage commissions, is treated as realized gain or loss. If a call option is exercised, the premium is added to the proceeds from the sale of the underlying security in determining whether each Fund has a realized gain or loss. If a put option is exercised, the premium reduces the cost basis of the securities purchased by each Fund. Each Fund, as writer of an option, bears the market risk of an unfavorable change in the price of the security underlying the written option. When writing options, each Fund is subject to minimal counterparty risk because the counterparty is only obligated to pay premiums and does not bear the market risk of an unfavorable market change.
During the year ended September 30, 2022, Delaware Ivy Emerging Markets Local Currency Debt Fund, Delaware Ivy Government Securities Fund, Delaware Ivy Multi-Asset Income Fund, Delaware Ivy Strategic Income Fund and Delaware Ivy Total Return Bond Fund used options contracts to manage the Funds’ exposure to changes in securities prices caused by interest rates or market conditions. In addition, Delaware Ivy Total Return Bond Fund used options contracts to adjust the Fund’s overall exposure to certain markets. In addition, Delaware Ivy Strategic Income Fund and Delaware Ivy Total Return Bond used options contracts to manage the Fund’s exposure to changes in foreign currencies.
Swap Contracts — Certain Funds enter into CDS contracts in the normal course of pursuing its investment objective. Delaware Ivy Emerging Markets Local Currency Debt Fund and Delaware Ivy Total Return Bond Fund entered into CDS contracts in order to hedge against a credit event. The Fund will not be permitted to enter into any swap transactions unless, at the time of entering into such transactions, the unsecured long-term debt of the actual counterparty, combined with any credit enhancements, is rated at least BBB- by Standard & Poor’s Financial Services LLC (S&P) or Baa3 by Moody’s Investors Service, Inc. (Moody’s) or is determined to be of equivalent credit quality by DMC.
Currency Swaps. A currency swap is an agreement to exchange cash flows on a notional amount of two or more currencies based on the relative value differential among them.
During the year ended September 30, 2022, Delaware Ivy Emerging Markets Local Currency Debt Fund used currency swaps to protect against currency fluctuations.
Inflation Swaps. Inflation swap agreements involve commitments to pay a regular stream of inflation-indexed cash payments in exchange for receiving a stream of nominal interest payments (or vice versa), where both payment streams are based on notional amounts. The nominal interest payments may be based on either a fixed interest rate or variable interest rate such as the London Interbank Offered Rate (LIBOR). The change in value of swap contracts outstanding, if any, is recorded as unrealized appreciation or depreciation. A realized gain or loss is recorded on maturity or termination of the swap contract. The Fund’s maximum risk of loss from counterparty credit risk is the discounted net value of the cash flows to be received from/paid to the counterparty over the swap contract’s remaining life, to the extent that the amount is positive. This risk is mitigated, for bilateral swap contracts, by having a netting arrangement between the Fund and the counterparty and by the posting of collateral by the counterparty to the Fund to cover the Fund’s exposure to the counterparty.
220
During the year ended September 30, 2022, Delawarare Emerging Markets Local Currency Debt Fund used inflation swaps to hedge the inflation risk in nominal bonds (i.e., non-inflation-protected bonds) thereby creating “synthetic” inflation-indexed bonds.
Interest Rate Swaps. An interest rate swap contract is an exchange of interest rates between counterparties. In one instance, an interest rate swap involves payments received by a Fund from another party based on a variable or floating interest rate, in return for making payments based on a fixed interest rate. An interest rate swap can also work in reverse with the Fund receiving payments based on a fixed interest rate and making payments based on a variable or floating interest rate. Interest rate swaps may be used to adjust the Fund’s sensitivity to interest rates or to hedge against changes in interest rates. Periodic payments on such contracts are accrued daily and recorded as unrealized appreciation (depreciation) on swap contracts. Upon periodic payment (receipt) or termination of the contract, such amounts are recorded as realized gains or losses on swap contracts. The Fund’s maximum risk of loss from counterparty credit risk is the discounted net value of the cash flows to be received from/paid to the counterparty over the interest rate swap contract’s remaining life, to the extent that the amount is positive. This risk is mitigated by (1) for bilateral swap contracts, having a netting arrangement between the Fund and the counterparty and by the posting of collateral by the counterparty to the Fund to cover the Fund’s exposure to the counterparty and (2) for cleared swaps, trading these instruments through a central counterparty.
During the year ended September 30, 2022, Delaware Ivy Emerging Markets Local Currency Debt Fund and Delaware Ivy Total Return Bond Fund used interest rate swap contracts to manage the Fund’s sensitivity to interest rates or to hedge against changes in interest rates.
Credit Default Swaps. A CDS contract is a risk-transfer instrument through which one party (purchaser of protection) transfers to another party (seller of protection) the financial risk of a credit event (as defined in the CDS agreement), as it relates to a particular reference security or basket of securities (such as an index). In exchange for the protection offered by the seller of protection, the purchaser of protection agrees to pay the seller of protection a periodic amount at a stated rate that is applied to the notional amount of the CDS contract. In addition, an upfront payment may be made or received by the Fund in connection with an unwinding or assignment of a CDS contract. In addition, an upfront payment may be made or received by the Fund in connection with an unwinding or assignment of a CDS contract. Upon the occurrence of a credit event, the seller of protection would pay the par (or other agreed-upon) value of the reference security (or basket of securities) to the counterparty. Credit events generally include, among others, bankruptcy, failure to pay, and obligation default.
During the year ended September 30, 2022, Delaware Ivy Emerging Markets Local Currency Debt Fund and Delaware Ivy Total Return Bond Fund entered into CDS contracts as a purchaser and seller of protection, as a hedge against credit events. Periodic payments (receipts) on such contracts are accrued daily and recorded as unrealized losses (gains) on swap contracts. Upon payment (receipt), such amounts are recorded as realized losses (gains) on swap contracts. Upfront payments made or received in connection with CDS contracts are amortized over the expected life of the CDS contracts as unrealized losses (gains) on swap contracts. The change in value of CDS contracts is recorded daily as unrealized appreciation or depreciation. A realized gain or loss is recorded upon a credit event (as defined in the CDS agreement) or the maturity or termination of the agreement. Initial margin and variation margin are posted to central counterparties for centrally cleared CDS basket trades, as determined by the applicable central counterparty.
CDS contracts may involve greater risks than if the Fund had invested in the reference obligation directly. CDS contracts are subject to general market risk, liquidity risk, counterparty risk, and credit risk. The Fund’s maximum risk of loss from counterparty credit risk, either as the seller of protection or the buyer of protection, is the fair value of the contract. This risk is mitigated by (1) for bilateral swap contracts, having a netting arrangement between the Fund and the counterparty and by the posting of collateral by the counterparty to the Fund to cover the Fund’s exposure to the counterparty, and (2) for cleared swaps, trading these instruments through a central counterparty.
During the year ended September 30, 2022, Delaware Ivy Emerging Markets Local Currency Debt Fund and Delaware Ivy Total Return Bond Fund used CDS contracts to hedge against credit events. During the year ended September 30, 2022, Delaware Ivy Strategic Income Fund used CDS contracts to gain exposure to certain securities or markets.
Swaps Generally. For centrally cleared swaps, payments are received from the broker or paid to the broker each day, based on the daily fluctuation in the market value of the contract. These receipts or payments are known as “variation margin” and are recorded by the Fund as unrealized gains or losses until the contracts are closed. When the contracts are closed, the Fund records a realized gain or loss equal to the difference between the value of the contract at the time it was opened and the value at the time it was closed. The value of open swaps may differ from that which would be realized in the event the Fund terminated its position in the contract on a given day. Risks of entering into these contracts include the potential inability of the counterparty to meet the terms of the contracts. This type of risk is generally limited to the amount
221
Notes to financial statements
Ivy Funds
9. Derivatives (continued)
of favorable movement in the value of the underlying security, instrument or basket of instruments, if any, at the day of default. Risks also arise from potential losses from adverse market movements and such losses could exceed the unrealized amounts shown on the “Schedules of investments.”
Fair values of derivative instruments as of September 30, 2022 were as follows:
| Delaware Ivy Emerging Markets Local Currency Debt Fund Asset Derivatives Fair Value | ||||||||
| Statement of Assets and Liabilities Location | Currency Contracts | Total | ||||||
| Unrealized appreciation on foreign currency exchange contracts | $63,024 | $63,024 | ||||||
| Delaware Ivy Emerging Markets Local Currency Debt Fund Liability Derivatives Fair Value | ||||||||
| Statement of Assets and Liabilities Location | Currency Contracts | Total | ||||||
| Unrealized depreciation on foreign currency exchange contracts | $ | (106,793 | ) | $ | (106,793 | ) | ||
| Delaware Ivy Multi-Asset Income Fund Asset Derivatives Fair Value | ||||||||
| Statement of Assets and Liabilities Location | Currency Contracts | Total | ||||||
| Unrealized appreciation on foreign currency exchange contracts | $ | 52,225 | $ | 52,225 | ||||
| Delaware Ivy Multi-Asset Income Fund Liability Derivatives Fair Value | |||||||||||||||
| Statement of Assets and Liabilities Location | Currency Contracts | Interest Rate Contracts | Total | ||||||||||||
| Unrealized depreciation on foreign currency exchange contracts | $ | (573 | ) | $ | — | $ | (573 | ) | |||||||
| Variation margin due to broker on futures contracts* | — | (46,686 | ) | (46,686 | ) | ||||||||||
| Total | $ | (573 | ) | $ | (46,686 | ) | $ | (47,259 | ) | ||||||
| Delaware Ivy Strategic Income Fund Asset Derivatives Fair Value | ||||||||
| Statement of Assets and Liabilities Location | Currency Contracts | Total | ||||||
| Unrealized appreciation on foreign currency exchange contracts | $ | 212,194 | $ | 212,194 | ||||
| Delaware Ivy Strategic Income Fund Liability Derivatives Fair Value | ||||||||
| Statement of Assets and Liabilities Location | Interest Rate Contracts | Total | ||||||
| Variation margin due to broker on futures contracts* | $ | (737,143 | ) | $ | (737,143 | ) | ||
222
| Delaware Ivy Total Return Bond Fund Asset Derivatives Fair Value | ||||||||||||||||
| Statements of Assets and Liabilities Location | Currency Contracts | Credit Contracts | Interest Rate Contracts | Total | ||||||||||||
| Unrealized appreciation on foreign currency exchange contracts | $ | 3,259,006 | $ | — | $ | — | $ | 3,259,006 | ||||||||
| Variation margin due from broker on futures contracts* | — | — | 1,084,641 | 1,084,641 | ||||||||||||
| Options purchased** | 29,432 | 122,191 | — | 151,623 | ||||||||||||
| Total | $ | 3,288,438 | $ | 122,191 | $ | 1,084,641 | $ | 4,495,270 | ||||||||
| Delaware Ivy Total Return Bond Fund Liability Derivatives Fair Value | ||||||||||||||||
| Statements of Assets and Liabilities Location | Currency Contracts | Credit Contracts | Interest Rate Contracts | Total | ||||||||||||
| Unrealized depreciation on foreign currency exchange contracts | $ | (1,638,721 | ) | $ | — | $ | — | $ | (1,638,721 | ) | ||||||
| Variation margin due to broker on futures contracts* | — | — | (1,232,274 | ) | (1,232,274 | ) | ||||||||||
| Options written, at value | (13,226 | ) | (48,166 | ) | — | (61,392 | ) | |||||||||
| Total | $ | (1,651,947 | ) | $ | (48,166 | ) | $ | (1,232,274 | ) | $ | (2,932,387 | ) | ||||
* Includes cumulative appreciation (depreciation) of futures contracts from the date the contracts were opened through September 30, 2022. Only current day variation margin is reported on the Fund’s “Statements of assets and liabilities.”
** Included with “Investments, at value.”
The effect of derivative instruments on the “Statements of operations” for the year ended September 30, 2022 was as follows:
| Delaware Ivy Emerging Markets Local Currency Debt Fund Net Realized Gain (Loss) on: | ||||||||||||||||||||||||||||||
| Foreign Currency Exchange Contracts | Futures Contracts | Options Purchased | Options Written | Swap Contracts | Total | |||||||||||||||||||||||||
| Currency contracts | $ | (742,241 | ) | $ | 25,269 | $ | — | $ | — | $ | — | $ | (716,972 | ) | ||||||||||||||||
| Interest rate contracts | — | 30,629 | 57,350 | (1,906 | ) | 168,759 | 254,832 | |||||||||||||||||||||||
| Credit contracts | — | — | — | — | (5,292 | ) | (5,292 | ) | ||||||||||||||||||||||
| Total | $ | (742,241 | ) | $ | 55,898 | $ | 57,350 | $ | (1,906 | ) | $ | 163,467 | $ | (467,432 | ) | |||||||||||||||
| Net Change in Unrealized Appreciation (Depreciation) on: | ||||||||||||||||||||||||||||||
| Foreign Currency Exchange Contracts | Futures Contracts | Options Purchased | Options Written | Swap Contracts | Total | |||||||||||||||||||||||||
| Currency contracts | $ | 190,817 | $ | — | $ | — | $ | — | $ | — | $ | 190,817 | ||||||||||||||||||
| Interest rate contracts | — | (54,296 | ) | (4,718 | ) | (3,729 | ) | 43,529 | (19,214 | ) | ||||||||||||||||||||
| Credit contracts | — | — | — | — | (1,233 | ) | (1,233 | ) | ||||||||||||||||||||||
| Total | $ | 190,817 | $ | (54,296 | ) | $ | (4,718 | ) | $ | (3,729 | ) | $ | 42,296 | $ | 170,370 | |||||||||||||||
223
Notes to financial statements
Ivy Funds
9. Derivatives (continued)
| Delaware Ivy Government Securities Fund Net Realized Gain (Loss) on: | |||||||||||||||
| Futures Contracts | Options Purchased | Total | |||||||||||||
| Interest rate contracts | $ | (354,474 | ) | $ | 31,252 | $ | (323,222 | ) | |||||||
| Total | $ | (354,474 | ) | $ | 31,252 | $ | (323,222 | ) | |||||||
| Delaware Ivy Multi-Asset Income Fund Net Realized Gain (Loss) on: | ||||||||||||||||||||
| Foreign Currency Exchange Contracts | Futures Contracts | Options Written | Total | |||||||||||||||||
| Currency contracts | $ | 141,423 | $ | 761 | $ | — | $ | 142,184 | ||||||||||||
| Interest rate contracts | — | (1,274 | ) | 870 | (404 | ) | ||||||||||||||
| Total | $ | 141,423 | $ | (513 | ) | $ | 870 | $ | 141,780 | |||||||||||
| Net Change in Unrealized Appreciation (Depreciation) on: | |||||||||||||||
| Foreign Currency Exchange Contracts | Futures Contracts | Total | |||||||||||||
| Currency contracts | $ | (93,389 | ) | $ | — | $ | (93,389 | ) | |||||||
| Interest rate contracts | — | (50,950 | ) | (50,950 | ) | ||||||||||
| Total | $ | (93,389 | ) | $ | (50,950 | ) | $ | (144,339 | ) | ||||||
| Delaware Ivy Strategic Income Fund Net Realized Gain (Loss) on: | ||||||||||||||||||||||||||||||
| Foreign Currency Exchange Contracts | Futures Contracts | Options Purchased | Options Written | Swap Contracts | Total | |||||||||||||||||||||||||
| Currency contracts | $ | 575,077 | $ | (732 | ) | $ | (152,712 | ) | $ | 56,292 | $ | — | $ | 477,925 | ||||||||||||||||
| Interest rate contracts | — | (886,228 | ) | — | 21,092 | — | (865,136 | ) | ||||||||||||||||||||||
| Credit contracts | — | — | — | — | 46,308 | 46,308 | ||||||||||||||||||||||||
| Total | $ | 575,077 | $ | (886,960 | ) | $ | (152,712 | ) | $ | 77,384 | $ | 46,308 | $ | (340,903 | ) | |||||||||||||||
224
| Net Change in Unrealized Appreciation (Depreciation) on: | |||||||||||||||
| Foreign Currency Exchange Contracts | Futures Contracts | Total | |||||||||||||
| Currency contracts | $ | 51,994 | $ | — | $ | 51,994 | |||||||||
| Interest rate contracts | — | (744,123 | ) | (744,123 | ) | ||||||||||
| Total | $ | 51,994 | $ | (744,123 | ) | $ | (692,129 | ) | |||||||
| Delaware Ivy Total Return Bond Fund Net Realized Gain (Loss) on: | ||||||||||||||||||||||||||||||
| Foreign Currency Exchange Contracts | Futures Contracts | Options Purchased | Options Written | Swap Contracts | Total | |||||||||||||||||||||||||
| Currency contracts | $ | 8,483,172 | $ | — | $ | (371,159 | ) | $ | 336,215 | $ | — | $ | 8,448,228 | |||||||||||||||||
| Interest rate contracts | — | 3,875,076 | (649,059 | ) | 312,533 | (64,749 | ) | 3,473,801 | ||||||||||||||||||||||
| Credit contracts | — | — | — | — | (113,964 | ) | (113,964 | ) | ||||||||||||||||||||||
| Total | $ | 8,483,172 | $ | 3,875,076 | $ | (1,020,218 | ) | $ | 648,748 | $ | (178,713 | ) | $ | 11,808,065 | ||||||||||||||||
| Net Change in Unrealized Appreciation (Depreciation) on: | ||||||||||||||||||||||||||||||
| Foreign Currency Exchange Contracts | Futures Contracts | Options Purchased | Options Written | Swap Contracts | Total | |||||||||||||||||||||||||
| Currency contracts | $ | 329,866 | $ | — | $ | — | $ | — | $ | — | $ | 329,866 | ||||||||||||||||||
| Interest rate contracts | — | (1,299,627 | ) | 398,904 | (69,369 | ) | — | (970,092 | ) | |||||||||||||||||||||
| Credit contracts | — | — | — | — | 318,269 | 318,269 | ||||||||||||||||||||||||
| Total | $ | 329,866 | $ | (1,299,627 | ) | $ | 398,904 | $ | (69,369 | ) | $ | 318,269 | $ | (321,957 | ) | |||||||||||||||
During the year ended September 30, 2022, Delaware Ivy International Small Cap Fund experienced net realized and unrealized gains or losses attributable to foreign currency exchange contracts, which are disclosed on the “Statements of assets and liabilities” and/or “Statements of operations.”
During the year ended September 30, 2022, Delaware Ivy Corporate Bond Fund and Delaware Ivy Crossover Credit Fund experienced net realized and unrealized gains or losses attributable to futures contracts, which are disclosed on the “Statements of assets and liabilities” and/or “Statements of operations.”
225
Notes to financial statements
Ivy Funds
9. Derivatives (continued)
The table below summarizes the average daily balance of derivative holdings by certain Funds during the year ended September 30, 2022:
| Long Derivative Volume | ||||||||||||||
| Delaware Ivy Corporate Bond Fund | Delaware Ivy Emerging Markets Local Currency Debt Fund | Delaware Ivy Government Securities Fund | ||||||||||||
| Foreign currency exchange contracts (average notional value) | $ | — | USD | $ | 11,754,948 | $ | — | |||||||
| Futures contracts (average notional value) | 2,101,688 | 441,872 | 5,202,819 | |||||||||||
| Options contracts (average notional value)* | — | 14,463 | — | |||||||||||
| CDS contracts (average notional value)** | — | 12,065 | — | |||||||||||
| Interest rate swap contracts (average notional value)*** | — | BRL | 1,426,868 | — | ||||||||||
| — | IDR | 275,035 | — | |||||||||||
| — | MXN | 1,355,417 | — | |||||||||||
| — | PLN | 318,059 | — | |||||||||||
| — | RUB | 645,219 | — | |||||||||||
| — | TRY | 491,580 | — | |||||||||||
| — | ZAR | 144,473 | — | |||||||||||
| Long Derivative Volume | ||||||||||||
| Delaware Ivy International Small Cap Fund | Delaware Ivy Multi-Asset Income Fund | Delaware Ivy Strategic Income Fund | ||||||||||
| Foreign currency exchange contracts (average notional value) | $ | 281,132 | $ | 164,174 | $ | 1,372,681 | ||||||
| Futures contracts (average notional value) | — | 699,400 | 13,302,740 | |||||||||
| Options contracts (average notional value)* | — | — | 51,724 | |||||||||
| Long Derivative Volume | ||||||
| Delaware Ivy Total Return Bond Fund | ||||||
| Foreign currency exchange contracts (average notional value) | USD | $ | 17,305,311 | |||
| Futures contracts (average notional value) | 32,454,301 | |||||
| Options contracts (average notional value)* | 101,781 | |||||
| CDS contracts (average notional value)** | 272,600 | |||||
| Interest rate swap contracts (average notional value)*** | BRL | 1,406,624 | ||||
| CZK | 1,540,618 | |||||
| KRW | 2,087,592 | |||||
| MXN | 1,623,163 | |||||
| PLN | 1,484,725 | |||||
| SEK | 1,744,763 | |||||
| THB | 2,197,259 | |||||
| USD | 664,345 | |||||
| Short Derivative Volume | ||||||||
| Delaware Ivy Corporate Bond Fund | Delaware Ivy Crossover Credit Fund | |||||||
| Futures contracts (average notional value) | $ | 6,316,727 | $ | 236,897 | ||||
226
| Short Derivative Volume | ||||||
| Delaware Ivy Emerging Markets Local Currency Debt Fund | ||||||
| Foreign currency exchange contracts (average notional value) | USD | $ | 8,718,670 | |||
| Futures contracts (average notional value) | 890,711 | |||||
| Options contracts (average notional value)* | 2,241 | |||||
| Interest rate swap contracts (average notional value)*** | CNY | 79,975 | ||||
| COP | 927,101 | |||||
| IDR | 193,985 | |||||
| MXN | 101,712 | |||||
| MYR | 508,872 | |||||
| PLN | 655,676 | |||||
| THB | 50,832 | |||||
| TRY | 168,319 | |||||
| USD | 740,000 | |||||
| ZAR | 378,960 | |||||
| Short Derivative Volume | ||||||||||||
| Delaware Ivy International Small Cap Fund | Delaware Ivy Multi-Asset Income Fund | Delaware Ivy Strategic Income Fund | ||||||||||
| Foreign currency exchange contracts (average notional value) | $ | 410,992 | $ | 3,777,386 | $ | 8,083,825 | ||||||
| Futures contracts (average notional value) | — | 31,844 | 676,003 | |||||||||
| Options contracts (average notional value)* | — | 163 | 21,049 | |||||||||
| CDS contracts (average notional value)** | — | — | 14,523 | |||||||||
| Short Derivative Volume | ||||||
| Delaware Ivy Total Return Bond Fund | ||||||
| Foreign currency exchange contracts (average notional value) | USD | $ | 85,863,371 | |||
| Futures contracts (average notional value) | 58,556,930 | |||||
| Options contracts (average notional value)* | 101,111 | |||||
| CDS contracts (average notional value)** | 265,400 | |||||
| Interest rate swap contracts (average notional value)*** | CNY | 1,024,096 | ||||
| KRW | 280,590 | |||||
| MXN | 911,790 | |||||
| THB | 940,451 | |||||
* Long represents purchased options and short represents written options.
** Long represents buying protection and short represents selling protection.
***Long represents receiving fixed interest payments and short represents paying fixed interest payments.
10. Offsetting
Each Fund entered into an International Swaps and Derivatives Association, Inc. Master Agreement (ISDA Master Agreement) or a similar agreement with certain of its derivative contract counterparties in order to better define its contractual rights and to secure rights that will help each Fund mitigate its counterparty risk. An ISDA Master Agreement is a bilateral agreement between each Fund and a counterparty that
227
Notes to financial statements
Ivy Funds
10. Offsetting (continued)
governs over-the-counter (OTC) derivatives and foreign exchange contracts and typically contains, among other things, collateral posting items and netting provisions in the event of a default and/or termination event. Under an ISDA Master Agreement, each Fund may, under certain circumstances, offset with the counterparty certain derivative financial instruments’ payables and/or receivables with collateral held and/or posted and create one single net payment. The provisions of the ISDA Master Agreement typically permit a single net payment in the event of default (close-out), including the bankruptcy or insolvency of the counterparty. However, bankruptcy or insolvency laws of a particular jurisdiction may impose restrictions on or prohibitions against the right of offset in bankruptcy, insolvency, or other events.
For financial reporting purposes, each Fund does not offset derivative assets and derivative liabilities that are subject to netting arrangements on the “Statements of assets and liabilities.”
At September 30, 2022, each Fund had the following assets and liabilities subject to offsetting provisions:
Offsetting of Financial Assets and Liabilities and Derivative Assets and Liabilities
Delaware Ivy Emerging Markets Local Currency Debt Fund
| Counterparty | Gross Value of Derivative Asset | Gross Value of Derivative Liability | Net Position | ||||||||||||
| JPMorgan Chase Bank | $ | 63,024 | $ | (106,793 | ) | $ | (43,769 | ) | |||||||
| Counterparty | Net Position | Fair Value of Non-Cash Collateral Received | Cash Collateral Received | Fair Value of Non-Cash Collateral Pledged | Cash Collateral Pledged | Net Exposure(a) | ||||||||||||||||||||||||
| JPMorgan Chase Bank | $ | (43,769 | ) | $ | — | $ | — | $ | — | $ | — | $ | (43,769 | ) | ||||||||||||||||
Delaware Ivy International Small Cap Fund
| Counterparty | Gross Value of Derivative Asset | Gross Value of Derivative Liability | Net Position | ||||||||||||
| Bank of New York Mellon | $ | 10 | $ | (10,182 | ) | $ | (10,172 | ) | |||||||
| Counterparty | Net Position | Fair Value of Non-Cash Collateral Received | Cash Collateral Received | Fair Value of Non-Cash Collateral Pledged | Cash Collateral Pledged | Net Exposure(a) | ||||||||||||||||||||||||
| Bank of New York Mellon | $ | (10,172 | ) | $ | — | $ | — | $ | — | $ | — | $ | (10,172 | ) | ||||||||||||||||
Delaware Ivy Multi-Asset Income Fund
| Counterparty | Gross Value of Derivative Asset | Gross Value of Derivative Liability | Net Position | ||||||||||||
| Bank of New York Mellon | $ | 127 | $ | (573 | ) | $ | (446 | ) | |||||||
| TD Bank | 52,098 | — | 52,098 | ||||||||||||
| Total | $ | 52,225 | $ | (573 | ) | $ | 51,652 | ||||||||
| Counterparty | Net Position | Fair Value of Non-Cash Collateral Received | Cash Collateral Received | Fair Value of Non-Cash Collateral Pledged | Cash Collateral Pledged | Net Exposure(a) | ||||||||||||||||||||||||
| Bank of New York Mellon | $ | (446 | ) | $ | — | $ | — | $ | — | $ | — | $ | (446 | ) | ||||||||||||||||
| TD Bank | 52,098 | — | — | — | — | 52,098 | ||||||||||||||||||||||||
| Total | $ | 51,652 | $ | — | $ | — | $ | — | $ | — | $ | 51,652 | ||||||||||||||||||
228
Delaware Ivy Strategic Income Fund
| Counterparty | Gross Value of Derivative Asset | Gross Value of Derivative Liability | Net Position | ||||||||||||
| Goldman Sachs Bank USA | $ | 69,670 | $ | — | $ | 69,670 | |||||||||
| TD Bank | 142,524 | — | 142,524 | ||||||||||||
| Total | $ | 212,194 | $ | — | $ | 212,194 | |||||||||
| Counterparty | Net Position | Fair Value of Non-Cash Collateral Received | Cash Collateral Received | Fair Value of Non-Cash Collateral Pledged | Cash Collateral Pledged | Net Exposure(a) | ||||||||||||||||||||||||
| Goldman Sachs Bank USA | $ | 69,670 | $ | — | $ | — | $ | — | $ | — | $ | 69,670 | ||||||||||||||||||
| TD Bank | 142,524 | — | — | — | — | 142,524 | ||||||||||||||||||||||||
| Total | $ | 212,194 | $ | — | $ | — | $ | — | $ | — | $ | 212,194 | ||||||||||||||||||
Delaware Ivy Total Return Bond Fund
| Counterparty | Gross Value of Derivative Asset | Gross Value of Derivative Liability | Net Position | ||||||||||||
| Goldman Sachs Bank USA | $ | 865,579 | $ | (78,929 | ) | $ | 786,650 | ||||||||
| JPMorgan Chase Bank | 138,972 | (58,014 | ) | 80,958 | |||||||||||
| TD Bank | 2,338,871 | (1,539,625 | ) | 799,246 | |||||||||||
| Total | $ | 3,343,422 | $ | (1,676,568 | ) | $ | 1,666,854 | ||||||||
| Counterparty | Net Position | Fair Value of Non-Cash Collateral Received | Cash Collateral Received(b) | Fair Value of Non-Cash Collateral Pledged | Cash Collateral Pledged | Net Exposure(a) | ||||||||||||||||||||||||
| Goldman Sachs Bank USA | $ | 786,650 | $ | — | $ | (786,650 | ) | $ | — | $ | — | $ | — | |||||||||||||||||
| JPMorgan Chase Bank | 80,958 | — | — | — | — | 80,958 | ||||||||||||||||||||||||
| TD Bank | 799,246 | — | (799,246 | ) | — | — | — | |||||||||||||||||||||||
| Total | $ | 1,666,854 | $ | — | $ | (1,585,896 | ) | $ | — | $ | — | $ | 80,958 | |||||||||||||||||
Securities Lending
Securities lending transactions are entered into by the Funds under master securities lending agreements (each, an MSLA) which provide the right, in the event of default (including bankruptcy or insolvency), for the non-defaulting party to liquidate the collateral and calculate a net exposure to the defaulting party or request additional collateral. In the event that a borrower defaults, the Funds, as lender, would offset the market value of the collateral received against the market value of the securities loaned. When the value of the collateral is greater than that of the market value of the securities loaned, the lender is left with a net amount payable to the defaulting party. However, bankruptcy or insolvency laws of a particular jurisdiction may impose restrictions on or prohibitions against such a right of offset in the event of an MSLA counterparty’s bankruptcy or insolvency. Under the MSLA, the borrower can resell or re-pledge the loaned securities, and the Funds can reinvest cash collateral, or, upon an event of default, resell or re-pledge the collateral (see also Note 12).
As of September 30, 2022, the following table is a summary of the Funds’ securities lending agreements by counterparty which are subject to offset under an MSLA:
Delaware Ivy Corporate Bond Fund
| Counterparty | Securities Loaned at Value | Cash Collateral Received(b) | Fair Value of Non-Cash Collateral Received | Net Collateral Received | Net Exposure(a) | |||||||||||||||
| Bank of New York Mellon | $ | 20,187,804 | $ | (1,105,337 | ) | $ | (19,082,467 | ) | $ | (20,187,804 | ) | $— | ||||||||
229
Notes to financial statements
Ivy Funds
10. Offsetting (continued)
Delaware Ivy Crossover Credit Fund
| Counterparty | Securities Loaned at Value | Cash Collateral Received(b) | Fair Value of Non-Cash Collateral Received | Net Collateral Received | Net Exposure(a) | |||||||||||||||
| Bank of New York Mellon | $ | 542,102 | $ | (90,938 | ) | $ | (451,164 | ) | $ | (542,102 | ) | $— | ||||||||
Delaware Ivy Emerging Markets Local Currency Debt Fund
| Counterparty | Securities Loaned at Value | Cash Collateral Received(b) | Fair Value of Non-Cash Collateral Received | Net Collateral Received | Net Exposure(a) | |||||||||||||||
| Bank of New York Mellon | $ | 393,866 | $ | (393,866 | ) | $— | $ | (393,866 | ) | $— | ||||||||||
Delaware Ivy Government Securities Fund
| Counterparty | Securities Loaned at Value | Cash Collateral Received(b) | Fair Value of Non-Cash Collateral Received | Net Collateral Received | Net Exposure(a) | |||||||||||||||
| Bank of New York Mellon | $ | 12,401,276 | $ | (9,253,381 | ) | $ | (3,147,895 | ) | $ | (12,401,276 | ) | $— | ||||||||
Delaware Ivy High Yield Fund
| Counterparty | Securities Loaned at Value | Cash Collateral Received(b) | Fair Value of Non-Cash Collateral Received | Net Collateral Received | Net Exposure(a) | |||||||||||||||
| Bank of New York Mellon | $ | 2,965,614 | $ | (829,181 | ) | $ | (2,136,433 | ) | $ | (2,965,614 | ) | $— | ||||||||
Delaware Ivy International Small Cap Fund
| Counterparty | Securities Loaned at Value | Cash Collateral Received(b) | Fair Value of Non-Cash Collateral Received | Net Collateral Received | Net Exposure(a) | |||||||||||||||
| Bank of New York Mellon | $ | 3,581,957 | $ | (1,772,884 | ) | $ | (1,809,073 | ) | $ | (3,581,957 | ) | $— | ||||||||
Delaware Ivy Multi-Asset Income Fund
| Counterparty | Securities Loaned at Value | Cash Collateral Received(b) | Fair Value of Non-Cash Collateral Received | Net Collateral Received | Net Exposure(a) | |||||||||||||||
| Bank of New York Mellon | $ | 11,251,357 | $ | (5,446,070 | ) | $ | (5,805,287 | ) | $ | (11,251,357 | ) | $— | ||||||||
Delaware Ivy Strategic Income Fund
| Counterparty | Securities Loaned at Value | Cash Collateral Received(b) | Fair Value of Non-Cash Collateral Received | Net Collateral Received | Net Exposure(a) | |||||||||||||||
| Bank of New York Mellon | $ | 4,078,638 | $ | (3,014,548 | ) | $ | (1,064,090 | ) | $ | (4,078,638 | ) | $— | ||||||||
230
Delaware Ivy Total Return Bond Fund
| Counterparty | Securities Loaned at Value | Cash Collateral Received(b) | Fair Value of Non-Cash Collateral Received | Net Collateral Received | Net Exposure(a) | |||||||||||||||
| Bank of New York Mellon | $ | 4,535,602 | $ | (2,417,934 | ) | $ | (2,117,668 | ) | $ | (4,535,602 | ) | $— | ||||||||
(a)Net exposure represents the receivable (payable) that would be due from (to) the counterparty in the event of default.
(b)The value of the related collateral exceeded the value of the derivatives and securities lending transactions as of September 30, 2022, as applicable.
11. Securities Lending
Each Fund, along with other funds in the Delaware Funds, may lend its securities pursuant to a security lending agreement (Lending Agreement) with The Bank of New York Mellon (BNY Mellon). At the time a security is loaned, the borrower must post collateral equal to the required percentage of the market value of the loaned security, including any accrued interest. The required percentage is: (1) 102% with respect to US securities and foreign securities that are denominated and payable in US dollars; and (2) 105% with respect to foreign securities. With respect to each loan, if on any business day the aggregate market value of securities collateral plus cash collateral held is less than the aggregate market value of the securities which are the subject of such loan, the borrower will be notified to provide additional collateral by the end of the following business day, which, together with the collateral already held, will be not less than the applicable initial collateral requirements for such security loan. If the aggregate market value of securities collateral and cash collateral held with respect to a security loan exceeds the applicable initial collateral requirement, upon the request of the borrower, BNY Mellon must return enough collateral to the borrower by the end of the following business day to reduce the value of the remaining collateral to the applicable initial collateral requirement for such security loan. As a result of the foregoing, the value of the collateral held with respect to a loaned security on any particular day, may be more or less than the value of the security on loan. The collateral percentage with respect to the market value of the loaned security is determined by the security lending agent.
Cash collateral received by each fund of the Trust is generally invested in a series of individual separate accounts, each corresponding to a Fund. The investment guidelines permit each separate account to hold certain securities that would be considered eligible securities for a money market fund. Cash collateral received is generally invested in government securities; certain obligations issued by government sponsored enterprises; repurchase agreements collateralized by US Treasury securities; obligations issued by the central government of any Organization for Economic Cooperation and Development (OECD) country or its agencies, instrumentalities, or establishments; obligations of supranational organizations; commercial paper, notes, bonds, and other debt obligations; certificates of deposit, time deposits, and other bank obligations; certain money market funds; and asset-backed securities. Each Fund can also accept US government securities and letters of credit (non-cash collateral) in connection with securities loans.
In the event of default or bankruptcy by the lending agent, realization and/or retention of the collateral may be subject to legal proceedings. In the event the borrower fails to return loaned securities and the collateral received is insufficient to cover the value of the loaned securities and provided such collateral shortfall is not the result of investment losses, the lending agent has agreed to pay the amount of the shortfall to each Fund or, at the discretion of the lending agent, replace the loaned securities. Each Fund continues to record dividends or interest, as applicable, on the securities loaned and is subject to changes in value of the securities loaned that may occur during the term of the loan. Each Fund has the right under the Lending Agreement to recover the securities from the borrower on demand. With respect to security loans collateralized by non-cash collateral, each Fund receives loan premiums paid by the borrower. With respect to security loans collateralized by cash collateral, the earnings from the collateral investments are shared among each Fund, the security lending agent, and the borrower. Each Fund records security lending income net of allocations to the security lending agent and the borrower.
Each Fund may incur investment losses as a result of investing securities lending collateral. This could occur if an investment in each collateral investment account defaulted or became impaired. Under those circumstances, the value of each Fund’s cash collateral account may be less than the amount each Fund would be required to return to the borrowers of the securities and each Fund would be required to make up for this shortfall.
231
Notes to financial statements
Ivy Funds
11. Securities Lending (continued)
The following table reflects a breakdown of transactions accounted for as secured borrowings, the gross obligation by the type of collateral pledged, and the remaining contractual maturity of those transactions as of September 30, 2022:
| Securities Lending Transactions | Overnight and continuous | Under 30 days | Between 30 & 90 days | Over 90 Days | Total | |||||
| Delaware Ivy Corporate Bond Fund | ||||||||||
| Money Market Mutual Fund | $1,749,532 | $— | $— | $— | $1,749,532 | |||||
| Delaware Ivy Crossover Credit Fund | ||||||||||
| Money Market Mutual Fund | 105,650 | — | — | — | 105,650 | |||||
| Delaware Ivy Emerging Markets Local Currency Debt Fund | ||||||||||
| Money Market Mutual Fund | 450,886 | — | — | — | 450,886 | |||||
| Delaware Ivy Government Securities Fund | ||||||||||
| Money Market Mutual Fund | 9,577,154 | — | — | — | 9,577,154 | |||||
| Delaware Ivy High Yield Fund | ||||||||||
| Money Market Mutual Fund | 939,990 | — | — | — | 939,990 | |||||
| Delaware Ivy International Small Cap Fund | ||||||||||
| Money Market Mutual Fund | 1,975,383 | — | — | — | 1,975,383 | |||||
| Delaware Ivy Multi-Asset Income Fund | ||||||||||
| Money Market Mutual Fund | 5,826,401 | — | — | — | 5,826,401 | |||||
| Delaware Ivy Strategic Income Fund | ||||||||||
| Money Market Mutual Fund | 3,190,372 | — | — | — | 3,190,372 | |||||
| Delaware Ivy Total Return Bond Fund | ||||||||||
| Money Market Mutual Fund | 2,792,984 | — | — | — | 2,792,984 |
The following is a summary of each Fund’s securities lending positions and related cash and non-cash collateral received as of September 30, 2022:
| Values of securities on loan | Values of non- cash collateral | Values of invested collateral | ||||||||||
| Delaware Ivy Corporate Bond Fund | $20,187,804 | $19,082,467 | $1,749,532 | |||||||||
| Delaware Ivy Crossover Credit Fund | 542,102 | 451,164 | 105,650 | |||||||||
| Delaware Ivy Emerging Markets Local Currency Debt Fund | 393,866 | — | 450,886 | |||||||||
| Delaware Ivy Government Securities Fund | 12,401,276 | 3,147,895 | 9,577,154 | |||||||||
| Delaware Ivy High Yield Fund | 2,965,614 | 2,136,433 | 939,990 | |||||||||
| Delaware Ivy International Small Cap Fund | 3,581,957 | 1,809,073 | 1,975,383 | |||||||||
| Delaware Ivy Multi-Asset Income Fund | 11,251,357 | 5,805,287 | 5,826,401 | |||||||||
| Delaware Ivy Strategic Income Fund | 4,078,638 | 1,064,090 | 3,190,372 | |||||||||
| Delaware Ivy Total Return Bond Fund | 4,535,602 | 2,117,668 | 2,792,984 | |||||||||
Investments purchased with cash collateral are presented on the “Schedules of investments” under the caption “Securities Lending Collateral.”
12. Credit and Market Risk
An outbreak of infectious respiratory illness caused by a novel coronavirus known as COVID-19 was first detected in China in December 2019 and has now been detected globally. This coronavirus has resulted in travel restrictions, closed international borders, enhanced health screenings at ports of entry and elsewhere, disruption of and delays in healthcare service preparation and delivery, prolonged quarantines, cancellations, supply chain disruptions, and lower consumer demand, as well as general concern and uncertainty. The impact of COVID-19, and other infectious illness outbreaks that may arise in the future, could adversely affect the economies of many nations or the entire global economy, individual issuers and capital markets in ways that cannot necessarily be foreseen. In addition, the impact of infectious illnesses in emerging market countries may be greater due to generally less established healthcare systems. Public health crises caused by the COVID-
232
19 outbreak may exacerbate other pre-existing political, social and economic risks in certain countries or globally. The duration of the COVID-19 outbreak and its effects cannot be determined with certainty.
Beginning in late February 2022, global financial markets have experienced and may continue to experience significant volatility related to military action by Russia in Ukraine. As a result of this military action, the US and many other countries have imposed sanctions on Russia and certain Russian individuals, banks and corporations. The ongoing hostilities and resulting sanctions are expected to have a severe adverse effect on the region’s economies and more globally, including significant negative impact on markets for certain securities and commodities, such as oil and natural gas. Any cessation of trading on the Russian securities markets will impact the value and liquidity of certain portfolio holdings. The extent and duration of military action, sanctions, and resulting market disruptions are impossible to predict, but could be substantial and prolonged and impact the Funds’ performance.
When interest rates rise, fixed income securities (i.e. debt obligations) generally will decline in value. These declines in value are greater for fixed income securities with longer maturities or durations.
IBOR is the risk that changes related to the use of the London interbank offered rate (LIBOR) and other interbank offered rate (collectively, IBORs) could have adverse impacts on financial instruments that reference LIBOR (or the corresponding IBOR). The abandonment of LIBOR could affect the value and liquidity of instruments that reference LIBOR. The use of alternative reference rate products may impact investment strategy performance. These risks may also apply with respect to changes in connection with other IBORs, such as the euro overnight index average (EONIA), which are also the subject of recent reform.
Investments in equity securities in general are subject to market risks that may cause their prices to fluctuate over time. Fluctuations in the value of equity securities in which the Funds invest will cause the NAV of the Funds to fluctuate.
Some countries in which the Funds may invest require governmental approval for the repatriation of investment income, capital, or the proceeds of sales of securities by foreign investors. In addition, if there is deterioration in a country’s balance of payments or for other reasons, a country may impose temporary restrictions on foreign capital remittances abroad.
The securities exchanges of certain foreign markets are substantially smaller, less liquid, and more volatile than the major securities markets in the United States. Consequently, acquisition and disposition of securities by the Funds may be inhibited. In addition, a significant portion of the aggregate market value of securities listed on the major securities exchanges in emerging markets is held by a smaller number of investors. This may limit the number of shares available for acquisition or disposition by the Funds.
Certain Funds invest a portion of its assets in high yield fixed income securities, which are securities rated lower than BBB- by S&P and lower than Baa3 by Moody’s, or similarly rated by another nationally recognized statistical rating organization. Investments in these higher yielding securities are generally accompanied by a greater degree of credit risk than higher-rated securities. Additionally, lower-rated securities may be more susceptible to adverse economic and competitive industry conditions than investment grade securities.
Certain Funds invest in fixed income securities whose value is derived from an underlying pool of mortgages or consumer loans. The value of these securities is sensitive to changes in economic conditions, including delinquencies and/or defaults, and may be adversely affected by shifts in the market’s perception of the issuers and changes in interest rates. Investors receive principal and interest payments as the underlying mortgages and consumer loans are paid back. Some of these securities are CMOs. CMOs are debt securities issued by US government agencies or by financial institutions and other mortgage lenders, which are collateralized by a pool of mortgages held under an indenture. Prepayment of mortgages may shorten the stated maturity of the obligations and can result in a loss of premium, if any has been paid. Certain of these securities may be stripped (securities which provide only the principal or interest feature of the underlying security). The yield to maturity on an interest-only CMO is extremely sensitive not only to changes in prevailing interest rates, but also to the rate of principal payments (including prepayments) on the related underlying mortgage assets. A rapid rate of principal payments may have a material adverse effect on a Fund’s yield to maturity. If the underlying mortgage assets experience greater than anticipated prepayments of principal, a Fund may fail to fully recoup its initial investment in these securities even if the securities are rated in the highest rating categories.
Certain Funds invest in bank loans and other securities that may subject them to direct indebtedness risk, the risk that the Funds will not receive payment of principal, interest, and other amounts due in connection with these investments and will depend primarily on the financial condition of the borrower. Loans that are fully secured offer the Fund more protection than unsecured loans in the event of nonpayment of scheduled interest or principal, although there is no assurance that the liquidation of collateral from a secured loan would satisfy the corporate borrower’s
233
Notes to financial statements
Ivy Funds
12. Credit and Market Risk (continued)
obligation, or that the collateral can be liquidated. Some loans or claims may be in default at the time of purchase. Certain of the loans and the other direct indebtedness acquired by the Fund may involve revolving credit facilities or other standby financing commitments that obligate the Fund to pay additional cash on a certain date or on demand. These commitments may require each Fund to increase its investment in a company at a time when the Fund might not otherwise decide to do so (including at a time when the company’s financial condition makes it unlikely that such amounts will be repaid). To the extent that each Fund is committed to advance additional funds, it will at all times hold and maintain cash or other high grade debt obligations in an amount sufficient to meet such commitments. When a loan agreement is purchased, the Fund may pay an assignment fee. On an ongoing basis, the Fund may receive a commitment fee based on the undrawn portion of the underlying line of credit portion of a loan agreement. Prepayment penalty fees are received upon the prepayment of a loan agreement by the borrower. Prepayment penalty, facility, commitment, consent, and amendment fees are recorded to income as earned or paid.
As the Fund may be required to rely upon another lending institution to collect and pass on to the Fund amounts payable with respect to the loan and to enforce the Fund’s rights under the loan and other direct indebtedness, an insolvency, bankruptcy, or reorganization of the lending institution may delay or prevent the Fund from receiving such amounts. The highly leveraged nature of many loans may make them especially vulnerable to adverse changes in economic or market conditions. Investments in such loans and other direct indebtedness may involve additional risk to the Fund.
Certain Funds invest in certain obligations that may have liquidity protection designed to ensure that the receipt of payments due on the underlying security is timely. Such protection may be provided through guarantees, insurance policies, or letters of credit obtained by the issuer or sponsor through third parties, through various means of structuring the transaction, or through a combination of such approaches. The Funds will not pay any additional fees for such credit support, although the existence of credit support may increase the price of a security.
Certain Funds may invest in REITs and are subject to the risks associated with that industry. If a Fund holds real estate directly or receives rental income directly from real estate holdings, its tax status as a regulated investment company may be jeopardized. There were no direct real estate holdings during the year ended September 30, 2022. The Funds’ REIT holdings are also affected by interest rate changes, particularly if the REITs they hold use floating rate debt to finance their ongoing operations. The Funds also invest in real estate acquired as a result of ownership of securities or other instruments, including issuers that invest, deal, or otherwise engage in transactions in real estate or interests therein. These instruments may include interests in private equity limited partnerships or limited liability companies that hold real estate investments (Real Estate Limited Partnerships). The Funds will limit their investments in Real Estate Limited Partnerships to 5% of their total assets at the time of purchase.
Bonds are considered “pre-refunded” when the refunding issuer’s proceeds are escrowed only until a permitted call date or dates on the refunded issue with the refunded issue being redeemed at the time, including any required premium. Bonds become “defeased” when the rights and interests of the bondholders and of their lien on the pledged revenues or other security under the terms of the bond contract are substituted with an alternative source of revenues (the escrow securities) sufficient to meet payments of principal and interest to maturity or to the first call dates. Escrowed secured bonds will often receive a rating of AAA from Moody’s, S&P, and/or Fitch Ratings due to the strong credit quality of the escrow securities and the irrevocable nature of the escrow deposit agreement.
Each Fund may invest up to 15% of its net assets in illiquid securities, which may include securities with contractual restrictions on resale, securities exempt from registration under Rule 144A promulgated under the Securities Act of 1933, as amended (1933 Act), and other securities which may not be readily marketable. The Funds may also invest in securities exempt from registration under Section 4(a)(2) of the 1933 Act, which exempts from registration transactions by an issuer not involving any public offering. The relative illiquidity of these securities may impair each Fund from disposing of them in a timely manner and at a fair price when it is necessary or desirable to do so. While maintaining oversight, the Board has delegated to DMC, the day-to-day functions of determining whether individual securities are liquid for purposes of the Funds’ limitation on investments in illiquid securities. Securities eligible for resale pursuant to Rule 144A, which are determined to be liquid, are not subject to the Funds’ 15% limit on investments in illiquid securities. Rule 144A and 4(a)(2) securities have been identified on the “Schedules of investments.”
234
13. Contractual Obligations
Each Fund enters into contracts in the normal course of business that contain a variety of indemnifications. Each Fund’s maximum exposure under these arrangements is unknown. However, each Fund has not had prior claims or losses pursuant to these contracts. Management has reviewed each Fund’s existing contracts and expects the risk of loss to be remote.
14. Recent Accounting Pronouncements
In March 2020, FASB issued an Accounting Standards Update (ASU), ASU 2020-04, Reference Rate Reform (Topic 848) – Facilitation of the Effects of Reference Rate Reform on Financial Reporting. The amendments in ASU 2020-04 provide optional temporary financial reporting relief from the effect of certain types of contract modifications due to the planned discontinuation of LIBOR and other interbank-offered based reference rates as of the end of 2021. In March 2021, the administrator for LIBOR announced the extension of the publication of a majority of the USD LIBOR settings to June 30, 2023. ASU 2020-04 is effective for certain reference rate-related contract modifications that occur during the period March 12, 2020 through December 31, 2022. As of the financial reporting period, Management is evaluating the impact of applying this ASU.
15. Subsequent Events
On October 31, 2022, each Fund, along with the other Participants, entered into an amendment to the agreement for a $355,000,000 revolving line of credit to be used as described in Note 7 and to be operated in substantially the same manner as the agreement described in Note 7. Under the amendment to the agreement, the Participants are charged an annual commitment fee of 0.15%, which is allocated across the Participants based on a weighted average of the respective net assets of each Participant. The line of credit available under the agreement expires on October 30, 2023.
Management has determined that no other material events or transactions occurred subsequent to September 30, 2022, that would require recognition or disclosure in the Funds’ financial statements.
235
Report of independent
registered public accounting firm
To the Board of Trustees of Ivy Funds and Shareholders of Delaware Ivy California Municipal High Income Fund, Delaware Ivy Corporate Bond Fund, Delaware Ivy Crossover Credit Fund, Delaware Ivy Emerging Markets Local Currency Debt Fund, Delaware Ivy Government Securities Fund, Delaware Ivy High Yield Fund, Delaware Ivy International Small Cap Fund, Delaware Ivy Multi-Asset Income Fund, Delaware Ivy Strategic Income Fund and Delaware Ivy Total Return Bond Fund
Opinions on the Financial Statements
We have audited the accompanying statements of assets and liabilities, including the schedules of investments, of Delaware Ivy California Municipal High Income Fund, Delaware Ivy Corporate Bond Fund, Delaware Ivy Crossover Credit Fund, Delaware Ivy Emerging Markets Local Currency Debt Fund, Delaware Ivy Government Securities Fund, Delaware Ivy High Yield Fund, Delaware Ivy International Small Cap Fund, Delaware Ivy Multi-Asset Income Fund, Delaware Ivy Strategic Income Fund and Delaware Ivy Total Return Bond Fund (ten of the funds constituting Ivy Funds, hereafter collectively referred to as the “Funds”) as of September 30, 2022, the related statements of operations for the year ended September 30, 2022, the statements of changes in net assets for each of the two years in the period ended September 30, 2022, including the related notes, and the financial highlights for each of the two years in the period ended September 30, 2022 (collectively referred to as the “financial statements”). In our opinion, the financial statements present fairly, in all material respects, the financial position of each of the Funds as of September 30, 2022, the results of each of their operations for the year then ended, the changes in each of their net assets for each of the two years in the period ended September 30, 2022 and each of the financial highlights for each of the two years in the period ended September 30, 2022 in conformity with accounting principles generally accepted in the United States of America.
The financial statements of the Funds as of and for the year ended September 30, 2020 and the financial highlights for each of the periods ended on or prior to September 30, 2020 (not presented herein, other than the financial highlights) were audited by other auditors whose report dated November 24, 2020 expressed an unqualified opinion on those financial statements and financial highlights.
Basis for Opinions
These financial statements are the responsibility of the Funds’ management. Our responsibility is to express an opinion on the Funds’ financial statements based on our audits. We are a public accounting firm registered with the Public Company Accounting Oversight Board (United States) (PCAOB) and are required to be independent with respect to the Funds in accordance with the U.S. federal securities laws and the applicable rules and regulations of the Securities and Exchange Commission and the PCAOB.
We conducted our audits of these financial statements in accordance with the standards of the PCAOB. Those standards require that we plan and perform the audit to obtain reasonable assurance about whether the financial statements are free of material misstatement, whether due to error or fraud.
Our audits included performing procedures to assess the risks of material misstatement of the financial statements, whether due to error or fraud, and performing procedures that respond to those risks. Such procedures included examining, on a test basis, evidence regarding the amounts and disclosures in the financial statements. Our audits also included evaluating the accounting principles used and significant estimates made by management, as well as evaluating the overall presentation of the financial statements. Our procedures included confirmation of securities owned as of September 30, 2022, by correspondence with the custodian, transfer agents, agent banks, brokers and portfolio company investees; when replies were not received from agent banks or brokers, we performed other auditing procedures. We believe that our audits provide a reasonable basis for our opinions.
/s/PricewaterhouseCoopers LLP
Philadelphia, Pennsylvania
November 30, 2022
We have served as the auditor of one or more investment companies in Delaware Funds by Macquarie® since 2010.
236
Other Fund information (Unaudited)
Ivy Funds
Liquidity Risk Management Program
The Securities and Exchange Commission (the “SEC”) has adopted Rule 22e-4 under the Investment Company Act of 1940 (the “Liquidity Rule”), which requires all open-end funds (other than money market funds) to adopt and implement a program reasonably designed to assess and manage the fund’s “liquidity risk,” defined as the risk that the fund could not meet requests to redeem shares issued by the fund without significant dilution of remaining investors’ interests in the fund.
The Funds have adopted and implemented a liquidity risk management program in accordance with the Liquidity Rule (the “Program”). The Board has designated a member of the US Operational Risk Group of Macquarie Asset Management as the Program Administrator for each Fund in the Trust.
As required by the Liquidity Rule, the Program includes policies and procedures that provide for: (1) assessment, management, and review (no less frequently than annually) of each Fund’s liquidity risk; (2) classification of each of the Fund’s portfolio holdings into one of four liquidity categories (Highly Liquid, Moderately Liquid, Less Liquid, and Illiquid); (3) for funds that do not primarily hold assets that are Highly Liquid, establishing and maintaining a minimum percentage of each Fund’s net assets in Highly Liquid investments (called a “Highly Liquid Investment Minimum” or “HLIM”); and (4) prohibiting each Fund’s acquisition of Illiquid investments if, immediately after the acquisition, each Fund would hold more than 15% of its net assets in Illiquid assets. The Program also requires reporting to the SEC (on a non-public basis) and to the Board if each Fund’s holdings of Illiquid assets exceed 15% of each Fund’s net assets. Funds with HLIMs must have procedures for addressing HLIM shortfalls, including reporting to the Board and, with respect to HLIM shortfalls lasting more than seven consecutive calendar days, reporting to the SEC (on a non-public basis).
In assessing and managing each Fund’s liquidity risk, the Program Administrator considers, as relevant, a variety of factors, including: (1) each Fund’s investment strategy and liquidity of portfolio investments during both normal and reasonably foreseeable stressed conditions; (2) short-term and long-term cash flow projections for the Funds during both normal and reasonably foreseeable stressed conditions; and (3) each Fund’s holdings of cash and cash equivalents and any borrowing arrangements. Classification of each Fund’s portfolio holdings in the four liquidity categories is based on the number of days it is reasonably expected to take to convert the investment to cash (for Highly Liquid and Moderately Liquid holdings) or to sell or dispose of the investment (for Less Liquid and Illiquid investments), in current market conditions without significantly changing the investment’s market value. Each Fund primarily holds assets that are classified as Highly Liquid, and therefore is not required to establish an HLIM.
At a meeting of the Board held on May 17-19, 2022, the Program Administrator provided the required written annual report to the Board addressing the Program’s operation and assessing the adequacy and effectiveness of its implementation for the period from April 1, 2021 through March 31, 2022. The report concluded that the Program is appropriately designed and effectively implemented and that it meets the requirements of Rule 22e-4 and each Fund’s liquidity needs. Each Fund’s HLIM is set at an appropriate level and the Funds complied with their HLIM at all times during the reporting period.
237
Other Fund information (Unaudited)
Ivy Funds
Tax Information
The information set forth below is for the Fund’s fiscal year as required by federal income tax laws. Shareholders, however, must report distributions on a calendar year basis for income tax purposes, which may include distributions for portions of two fiscal years of each Fund. Accordingly, the information needed by shareholders for income tax purposes will be sent to them in January of each year. Please consult your tax advisor for proper treatment of this information.
All disclosures are based on financial information available as of the date of this annual report and, accordingly are subject to change. For any and all items requiring reporting, it is the intention of each Fund to report the maximum amount permitted under the Internal Revenue Code and the regulations thereunder.
For the fiscal year ended September 30, 2022, each Fund reports distributions paid during the year as follows:
| (A) Long-Term Capital Gains Distributions (Tax Basis) | (B) Ordinary Income Distributions (Tax Basis) | (C) | Total Distributions (Tax Basis) | (D) Qualifying Dividends1 | ||||||||||||||||
| Delaware Ivy California Municipal High Income Fund | 30.44 | % | 0.01 | % | 69.55 | % | 100.00 | % | — | |||||||||||
| Delaware Ivy Corporate Bond Fund | 45.29 | % | 54.71 | % | — | 100.00 | % | — | ||||||||||||
| Delaware Ivy Crossover Credit Fund | 35.28 | % | 64.72 | % | — | 100.00 | % | — | ||||||||||||
| Delaware Ivy Emerging Markets Local Currency Debt Fund | — | — | — | — | — | |||||||||||||||
| Delaware Ivy Government Securities Fund | — | 100.00 | % | — | 100.00 | % | — | |||||||||||||
| Delaware Ivy High Yield Fund | 1.58 | % | 98.42 | % | — | 100.00 | % | — | ||||||||||||
| Delaware Ivy International Small Cap Fund | 52.91 | % | 47.09 | % | — | 100.00 | % | — | ||||||||||||
| Delaware Ivy Multi-Asset Income Fund | — | 100.00 | % | — | 100.00 | % | 4.55% | |||||||||||||
| Delaware Ivy Strategic Income Fund | — | 100.00 | % | — | 100.00 | % | — | |||||||||||||
| Delaware Ivy Total Return Bond Fund | 37.32 | % | 62.68 | % | — | 100.00 | % | — | ||||||||||||
(A) and (B) are based on a percentage of each Fund’s total distributions.
(C) is based on the Fund’s ordinary income distributions.
1Qualified dividends represent dividends which qualify for the corporate dividends received deduction.
*For the fiscal year ended September 30, 2022, certain dividends paid by the Funds may be subject to a maximum tax rate of 20%. The percentage of dividends paid by the Funds from ordinary income reported as qualified income are as reported in the following table. Complete information will be computed and reported in conjunction with your 2022 Form 1099-DIV.
| Percentage | |||
| Delaware Ivy California Municipal High Income Fund | —% | ||
| Delaware Ivy Corporate Bond Fund | —% | ||
| Delaware Ivy Crossover Credit Fund | —% | ||
| Delaware Ivy Emerging Markets Local Currency Debt Fund | —% | ||
| Delaware Ivy Government Securities Fund | —% | ||
| Delaware Ivy High Yield Fund | —% | ||
| Delaware Ivy International Small Cap Fund | 10.05% | ||
| Delaware Ivy Multi-Asset Income Fund | 15.70% | ||
| Delaware Ivy Strategic Income Fund | —% | ||
| Delaware Ivy Total Return Bond Fund | —% | ||
For the fiscal year ended September 30, 2022, certain distributions paid by the Funds, determined to be Qualified Interest Income may be subject to relief from US tax withholding for foreign shareholders, as provided by the American Jobs Creation Act of 2004; the Tax Relief Unemployment Insurance Reauthorization, and Job Creations Act of 2010; and as extended by the American Taxpayer Relief Act of 2012. For the fiscal year ended September 30, 2022, the Funds have reported maximum distributions of Qualified Interest Income as follows:
238
| Qualified Interest Income | |||
| Delaware Ivy Corporate Bond Fund | $13,761,541 | ||
| Delaware Ivy Government Securities Fund | 2,696,061 | ||
The percentage of the ordinary dividends reported is treated as a Section 163(j) interest dividend and thus is eligible to be treated as interest income for purposes of Section 163(j) and the regulations thereunder is as follows:
| Percentage | |||
| Delaware Ivy Corporate Bond Fund | 66.34% | ||
| Delaware Ivy Crossover Credit Fund | 43.38% | ||
| Delaware Ivy Government Securities Fund | 88.35% | ||
| Delaware Ivy High Yield Fund | 58.41% | ||
| Delaware Ivy Multi-Asset Income Fund | 39.93% | ||
| Delaware Ivy Strategic Income Fund | 94.56% | ||
Board Consideration of Investment Management Agreement and Sub-Advisory Agreements at a meeting held August 9-11, 2022
Delaware Ivy California Municipal High Income Fund
Delaware Ivy Corporate Bond Fund
Delaware Ivy Crossover Credit Fund
Delaware Ivy Emerging Markets Local Currency Debt Fund
Delaware Ivy Government Securities Fund
Delaware Ivy High Yield Fund
Delaware Ivy International Small Cap Fund
Delaware Ivy Multi-Asset Income Fund
Delaware Ivy Strategic Income Fund
Delaware Ivy Total Return Bond Fund
At a meeting held on August 9-11, 2022 (the “Annual Contract Renewal Meeting”), the Board of Trustees (the “Board”), including a majority of Trustees each of whom is not an “interested person” as defined under the Investment Company Act of 1940 (the “Independent Trustees”), approved the renewal of Delaware Ivy California Municipal High Income Fund, Delaware Ivy Corporate Bond Fund, Delaware Ivy Crossover Credit Fund, Delaware Ivy Emerging Markets Local Currency Debt Fund, Delaware Ivy Government Securities Fund, Delaware Ivy High Yield Fund, Delaware Ivy International Small Cap Fund, Delaware Ivy Multi-Asset Income Fund, Delaware Ivy Strategic Income Fund and Delaware Ivy Total Return Bond Fund (each, a “Fund” and together, the “Funds”) Investment Management Agreements with Delaware Management Company (“DMC”) and the Sub-Advisory Agreements with Macquarie Investment Management Global Limited (“MIMGL”), Macquarie Investment Management Austria Kapitalanlage AG (“MIMAK”), Macquarie Investment Management Europe Limited (“MIMEL”) and Macquarie Funds Management Hong Kong Limited (“MFMHKL” and together with MIMGL, MIMAK and MIMEL, the “Affiliated Sub-Advisers”).
Prior to the Meeting, including at a Board meeting held in May 2022, the Trustees conferred extensively among themselves and with representatives of DMC about these matters. Also, the Board was assisted by the applicable Investment Committee, with each Investment Committee assisting the full Board in the discharge of its duties in reviewing investment performance and other matters throughout the year. The Independent Trustees were assisted in their evaluation of the Investment Management Agreement and the Sub-Advisory Agreements by independent legal counsel, from whom they received separate legal advice and with whom they met separately.
In providing information to the Board, DMC was guided by a detailed set of requests for information submitted to them by independent legal counsel on behalf of the Independent Trustees at the start of the Board’s annual contract renewal process earlier in 2022. In considering and approving the Investment Management Agreement and the Sub-Advisory Agreements, the Trustees considered the information they believed relevant, including but not limited to the information discussed below. The Board considered not only the specific information presented in connection with the Meeting, but also the knowledge gained over time through interaction with DMC about various topics. In this regard, the Board reviewed reports of DMC at each of its quarterly meetings, which included information about, among other things, Fund performance, investment strategies, and expenses. In addition, the Investment Committees confer with portfolio managers at various times throughout the
239
Other Fund information (Unaudited)
Ivy Funds
Board Consideration of Investment Management Agreement and Sub-Advisory Agreements at a meeting held August 9-11, 2022 (continued)
year. In considering information relating to the approval of the Funds’ Investment Management Agreement and the Sub-Advisory Agreements, the Independent Trustees also received information from an independent fund consultant, JDL Consultants, LLC (“JDL”).
The Board did not identify any particular information or consideration that was all-important or controlling, and each individual Trustee may have attributed different weights to various factors.
After its deliberations, the Board unanimously approved the continuation of the Investment Management Agreement and the Sub-Advisory Agreements for a one-year term. The following summarizes a number of important, but not necessarily all, factors considered by the Board in support of its approval.
Nature, extent, and quality of services. The Board received and considered various information regarding the nature, extent, and quality of the advisory services provided to the Funds by DMC under its Investment Management Agreement, and the experience of the officers and employees of DMC who provide these services, include the Funds’ portfolio managers. The Board’s review included consideration of DMC’s investment process and oversight and research and analysis capabilities, and its ability to attract and retain qualified investment professionals. The Board considered information regarding DMC’s programs for risk management, including investment, operational, liquidity, valuation, and compliance risks. The Board received information with respect to the cybersecurity program and business continuity plans of DMC and its affiliates. The Board also considered non-advisory services that DMC and its affiliates provide to the Delaware Funds, including third party oversight, transfer agent, internal audit, valuation, portfolio trading, and legal and compliance. The Board took into account the benefits to shareholders of investing in a Fund that is part of a family of funds managed by an affiliate of Macquarie Group Ltd. (“Macquarie”), the parent company of DMC, and the resources available to DMC as part of Macquarie’s global asset management business.
The Board received and considered various information with respect to the services provided by the Affiliated Sub-Advisers under the Sub-Advisory Agreements and the credentials and experience of the officers and employees of the Affiliated Sub-Advisers who provide these services, including the Fund’s portfolio managers. The Board considered the division of responsibilities among DMC and the Affiliated Sub-Advisers and the oversight provided by DMC. The Board noted the expertise of the Affiliated Sub-Advisers with respect to certain asset classes and/or investment styles. The Affiliated Sub-Advisers are part of Macquarie’s global investment platform that has offices and personnel that are located around the world. As a result, the Board noted that the Affiliated Sub-Advisers can provide research, investment and trading analysis on the markets and economies of various countries in which the Funds may invest, make recommendations regarding securities and assist with security trades, as applicable. The Board took into account that the Sub-Advisory Agreements may benefit the Funds and their shareholders by permitting DMC to use the resources and talents of the Affiliated Sub-Advisers in managing the Funds.
The Board concluded that, overall, it was satisfied with the nature, extent and quality of services provided (and expected to be provided) to the Funds by DMC and the Affiliated Sub-Advisers.
Investment performance. The Board received and considered information with respect to the investment performance of the Funds, including performance reports and discussions with portfolio managers at meetings of the Board’s Investment Committees throughout the year as well as reports provided by Broadridge Financial Solutions, an independent investment company data provider (“Broadridge”), furnished for the Annual Contract Renewal Meeting. The Broadridge reports prepared for each Fund showed its investment performance in comparison to a group of similar funds (the “Performance Universe”). The Board received a description of the methodology used by Broadridge to select the funds in the Performance Universe. Comparative annualized performance for each Fund was shown for the past 1-, 3-, 5-, 10-year periods and since inception, as applicable, ended December 31, 2021. The Board considered that the Funds were managed by Ivy Investment Management Company prior to the acquisition of its parent company, Waddell & Reed Financial, Inc. and its subsidiaries (the “Transaction”), and that each Fund’s performance prior to the closing of the Transaction on April 30, 2021 is that of its predecessor manager.
Delaware Ivy California Municipal High Income Fund – The Performance Universe for the Fund consisted of the Fund and all retail and institutional California municipal debt funds, regardless of asset size or primary channel of distribution. The Board noted that the Broadridge report comparison showed that the Fund’s total return for the 1- and 3-year periods was in the second quartile and for the 5-year period was in the first quartile of its Performance Universe. The Broadridge report comparison showed that the Fund’s total return for the 1-, 3- and 5-year periods was above the median of its Performance Universe. The Board also noted that the Fund outperformed its benchmark for the 1-, 3- and
240
5-year periods. The Board noted that the Fund is generally performing in line with its Performance Universe and benchmark during the periods under review. The Board, however, noted that the investment performance of the current portfolio management team only began as of November 2021.
Delaware Ivy Corporate Bond Fund – The Performance Universe for the Fund consisted of the Fund and all retail and institutional BBB-rated corporate debt funds, regardless of asset size or primary channel of distribution. The Board noted that the Broadridge report comparison showed that the Fund’s total return for the 1-year period was in the second quartile and for the 3- and 5-year periods was in the third quartile of its Performance Universe. The Broadridge report comparison showed that the Fund’s total return for the 1-year period was above the median and for the 3- and 5-year periods was below the median of its Performance Universe. The Board also noted that the Fund underperformed its benchmark for the 1-, 3- and 5-year periods. The Board, however, noted that the investment performance of the current portfolio management team only began as of November 2021.
Delaware Ivy Crossover Credit Fund – The Performance Universe for the Fund consisted of the Fund and all retail and institutional BBB-rated corporate debt funds, regardless of asset size or primary channel of distribution. The Board noted that the Broadridge report comparison showed that the Fund’s total return for the 1-year, 3-year and since inception periods was in the first quartile of its Performance Universe. The Broadridge report comparison showed that the Fund’s total return for the 1-year, 3-year and since inception periods was above the median of its Performance Universe. The Board also noted that the Fund outperformed its benchmark for the 1-, 3- and since inception periods. The Board noted that the Fund is generally performing in line with its Performance Universe and benchmark during the periods under review. The Board, however, noted that the investment performance of the current portfolio management team only began as of November 2021.
Delaware Ivy Emerging Markets Local Currency Debt Fund – The Performance Universe for the Fund consisted of the Fund and all retail and institutional emerging markets local currency debt funds, regardless of asset size or primary channel of distribution. The Board noted that the Broadridge report comparison showed that the Fund’s total return for the 1- and 3-year periods was in the third quartile and for the 5-year period was in the fourth quartile of its Performance Universe. The Broadridge report comparison showed that the Fund’s total return for the 1-, 3- and 5-year periods was below the median of its Performance Universe. The Board also noted that the Fund underperformed its benchmark for the 1-, 3- and 5-year periods. The Board, however, noted that the investment performance of the current portfolio management team only began as of November 2021. The Board noted the explanations from the DMC concerning the reasons for the Fund’s relative performance versus its Performance Group and benchmark for the various periods.
Delaware Ivy Government Securities Fund – The Performance Universe for the Fund consisted of the Fund all retail and institutional general US government funds, regardless of asset size or primary channel of distribution, as selected by Broadridge. The Board noted that the Broadridge report comparison showed that the Fund’s total return for the 1-year was in the second quartile, for the 3- and 5-year periods was in the third quartile of its Performance Universe. The Broadridge report comparison showed that the Fund’s total return for the 1-year period was above the median and for the 3- and 5-year periods was slightly below the median of its Performance Universe. The Board also noted that the Fund underperformed its benchmark for the 1-, 3- and 5-year periods. The Board, however, noted that the investment performance of the current portfolio management team only began as of November 2021. The Board noted the explanations from the DMC and Affiliated Sub-Advisers concerning the reasons for the Fund’s relative performance versus its Performance Group and benchmark for the various periods.
Delaware Ivy High Yield Fund – The Performance Universe for the Fund consisted of the Fund and all retail and institutional high yield funds, regardless of asset size or primary channel of distribution. The Board noted that the Broadridge report comparison showed that the Fund’s total return for the 1-year period was in the second quartile and for the 3- year and since inception periods was in the first quartile of its Performance Universe. The Broadridge report comparison showed that the Fund’s total return for the 1-, 3- and since inception periods was above the median of its Performance Universe. The Board also noted that the Fund outperformed its benchmark for the 1-, 3-year and since inception periods. The Board noted that the Fund is generally performing in line with its Performance Universe and benchmark during the periods under review. The Board, however, noted that the investment performance of the current portfolio management team only began as of November 2021.
Delaware Ivy International Small Cap Fund – The Performance Universe for the Fund consisted of the Fund and all retail and institutional international small-/mid-cap growth funds, regardless of asset size or primary channel of distribution. The Board noted that the Broadridge report comparison showed that the Fund’s total return for the 1-year, 3- year and since inception periods was in the third quartile of its Performance Universe. The Broadridge report comparison showed that the Fund’s total return for the 1- year, 3-year and since inception periods was below the median of its Performance Universe. The Board also noted that the Fund underperformed its benchmark for the 1-year and since
241
Other Fund information (Unaudited)
Ivy Funds
Board Consideration of Investment Management Agreement and Sub-Advisory Agreements at a meeting held August 9-11, 2022 (continued)
inception periods and slightly outperformed its benchmark for the 3-year period. The Board, however, noted that the investment performance of the current portfolio management team only began as of November 2021. The Board noted the explanations from the DMC and Affiliated Sub-Advisers concerning the reasons for the Fund’s relative performance versus its Performance Universe and benchmark for the various periods.
Delaware Ivy Multi-Asset Income Fund – The Performance Universe for the Fund consisted of the Fund and all retail and institutional mixed-asset target allocation moderate funds, regardless of asset size or primary channel of distribution. The Board noted that the Broadridge report comparison showed that the Fund’s total return for the 1-year was in the second quartile and the 3- and 5- year periods was in the fourth quartile of its Performance Universe. The Broadridge report comparison showed that the Fund’s total return for the 1-year period was above the median and for the 3- and 5-year periods was below the median of its Performance Universe. The Board also noted that the Fund outperformed its benchmark for the 1-year period and underperformed its benchmark for the 3- and 5-year periods. The Board, however, noted that the investment performance of the current portfolio management team only began as of November 2021. The Board noted the explanations from the DMC and Affiliated Sub-Advisers concerning the reasons for the Fund’s relative performance versus its Performance Universe and benchmark for the various periods.
Delaware Ivy Strategic Income Fund – The Performance Universe for the Fund consisted of the Fund and all retail and institutional multi-sector income funds, regardless of asset size or primary channel of distribution. The Board noted that the Broadridge report comparison showed that the Fund’s total return for the 1-, 3- , and 5- year periods was in the second quartile of its Performance Universe. The Broadridge report comparison showed that the Fund’s total return for the 1-, 3- and 5-year periods was above the median of its Performance Universe. The Board also noted that the Fund outperformed its benchmark for the 1-, 3- and 5-year periods. The Board noted that the Fund is generally performing in line with its Performance Universe and benchmark during the periods under review. The Board, however, noted that the investment performance of the current portfolio management team only began as of November 2021.
Delaware Ivy Total Return Bond Fund – The Performance Universe for the Fund consisted of the Fund and all retail and institutional alternative credit focus funds, regardless of asset size or primary channel of distribution. The Board noted that the Broadridge report comparison showed that the Fund’s total return for the 1-year period was in the fourth quartile and for the 3- and 5- year periods was in the third quartile of its Performance Universe. The Broadridge report comparison showed that the Fund’s total return for the 1-, 3- and 5-year periods was below the median of its Performance Universe. The Board also noted that the Fund underperformed its benchmark for the 1-, 3- and 5-year periods. The Board, however, noted that the investment performance of the current portfolio management team only began as of November 2021. The Board noted the explanations from the DMC and Affiliated Sub-Adviser concerning the reasons for the Fund’s relative performance versus the peer group and benchmark for the various periods.
Comparative expenses. The Board received and considered expense data for the Funds. Management provided the Board with information on pricing levels and fee structures for each Fund as of its most recently completed fiscal year. The Board also considered on the comparative analysis of contractual management fees and actual total expense ratios of each Fund versus contractual management fees and actual total expense ratios of a group of similar funds as selected by Broadridge (the “Expense Group”). In reviewing comparative costs, each Fund’s contractual management fee and the actual management fee incurred by each Fund were compared with the contractual management fees (assuming all funds were similar in size to each Fund) and actual management fees, taking into account any applicable breakpoints and fee waivers, with a Fund’s expense universe, which is comprised of the Fund, its Expense Group and all other similar institutional funds, excluding outliers (the “Expense Universe”). Each Fund’s total expenses were also compared with those of its Expense Universe. The Broadridge total expenses, for comparative consistency, were shown by Broadridge for Institutional Class shares and comparative total expenses including 12b-1 and non-12b-1 service fees.
Delaware Ivy California Municipal High Income Fund – The expense comparisons for the Fund showed that its actual management fee was above the median of its Expense Universe and its actual total expenses were above the Expense Group average.
Delaware Ivy Corporate Bond Fund – The expense comparisons for the Fund showed that its actual management fee was above the median of its Expense Universe and its actual total expenses were above the Expense Group average.
Delaware Ivy Crossover Credit Fund – The expense comparisons for the Fund showed that its actual management fee was below the median of its Expense Universe and its actual total expenses were above the Expense Group average.
242
Delaware Ivy Emerging Markets Local Currency Debt Fund – The expense comparisons for the Fund showed that its actual management fee was below the median of its Expense Universe and its actual total expenses were below the Expense Group average.
Delaware Ivy Government Securities Fund – The expense comparisons for the Fund showed that its actual management fee was above the median of its Expense Universe and its actual total expenses were above the Expense Group average.
Delaware Ivy High Yield Fund – The expense comparisons for the Fund showed that its actual management fee was below the median of its Expense Universe and its actual total expenses were below the Expense Group average.
Delaware Ivy International Small Cap Fund – The expense comparisons for the Fund showed that its actual management fee was below the median of its Expense Universe and its actual total expenses were below the Expense Group average.
Delaware Ivy Multi-Asset Income Fund – The expense comparisons for the Fund showed that its actual management fee was above the median of its Expense Universe and its actual total expenses were below its Expense Group average.
Delaware Ivy Strategic Income Fund – The expense comparisons for the Fund showed that its actual management fee was above the median of its Expense Universe and its actual total expenses were above the Expense Group average.
Delaware Ivy Total Return Bond Fund – The expense comparisons for the Fund showed that its actual management fee was above the median of its Expense Universe and its actual total expenses were above the Expense Group average.
The Board also received and considered information about the nature and extent of services offered and fee rates charged by DMC to other types of clients with investment strategies similar to those of the Funds. In this regard, the Board received information about the significantly greater scope of services, and compliance, reporting and other legal burdens and risks of managing registered investment companies compared with those associated with managing assets of other types of clients, including third-party sub-advised fund clients, unregistered funds and separately managed accounts.
The Board noted that DMC, and not the Funds, pays the sub-advisory fees to the Affiliated Sub-Advisers and, accordingly, that the retention of the Affiliated Sub-Advisers do not increase the fees and expenses incurred by the Funds.
Based on its consideration of the factors and information it deemed relevant, including those described here, the Board determined that the compensation payable to DMC under the Investment Management Agreement and to the Affiliated Sub-Advisers under the Sub-Advisory Agreements was reasonable.
Economies of scale. The Board received and considered information about the potential for DMC to realize economies of scale in the provision of management services to the Fund, the difficulties of calculating economies of scale at an individual Fund level, and the extent to which potential scale benefits are shared with shareholders, including the extent to which any economies of scale are reflected in the level of management fees charged. DMC discussed its advisory fee pricing and structure for the Delaware Funds complex. The Board noted that each Fund may also benefit from economies of scale through initial fee setting, fee waivers and expense reimbursements, as well as DMC’s investment in its business, including investments in business infrastructure, technology and cybersecurity.
Management profitability. The Board received and considered the Investment Management Profitability Analysis that addressed the overall profitability of DMC’s business in providing management and other services to each Fund and the Delaware Funds as a whole, including the methodology used by DMC in allocating costs for the purpose of determining profitability. The Board also reviewed a report prepared by JDL regarding DMC’s profitability as compared to certain peer fund complexes and the Independent Trustees discussed DMC’s profitability in such context with representatives from JDL. Based on its review, the Board determined that DMC’s profitability was not excessive in light of the nature, extent and quality of the services provided to each Fund.
Ancillary benefits. The Board received and considered information regarding the extent to which DMC and its affiliates might derive ancillary benefits from fund operations, including the potential for procuring additional business as a result of the prestige and visibility associated with its role as investment manager to the Delaware Funds; the benefits from allocation of fund brokerage to improve trading efficiencies; and the fees that various affiliates received for serving as transfer agent and for overseeing fund accounting and financial administration services to the
243
Other Fund information (Unaudited)
Ivy Funds
Board Consideration of Investment Management Agreement and Sub-Advisory Agreements at a meeting held August 9-11, 2022 (continued)
Delaware Funds. The Board received information from DMC regarding its view of the performance of its affiliates in providing transfer agent and fund accounting and financial administration oversight services and the organizational structure employed to provide these services pursuant to their contracts with the Funds.
Based on its consideration of the factors and information it deemed relevant, including the costs of providing investment management and other services to the Funds and the ongoing commitment of DMC and its affiliates to the Funds, the Board did not find that any ancillary benefits received by DMC and its affiliates were unreasonable.
Conclusion. Based on its review, consideration and evaluation of all factors it believed relevant, including the above-described factors and conclusions, the Board, including all of the Independent Trustees, approved the continuation of DMC’s Investment Management Agreement and of the Affiliated Sub-Advisers’ Sub-Advisory Agreements for an additional one-year period.
244
Board of trustees and officers addendum
Delaware Funds by Macquarie®
A mutual fund is governed by a Board of Trustees/Directors (“Trustees”), which has oversight responsibility for the management of a fund’s business affairs. Trustees establish procedures and oversee and review the performance of the investment manager, the distributor, and others who perform services for the fund. The independent fund trustees, in particular, are advocates for shareholder interests. Each trustee has served in that capacity since he or she was elected to or appointed to the Board of Trustees, and will continue to serve until his or her retirement or the election of a new trustee in his or her place. The following is a list of the Trustees and Officers with certain background and related information.
| Name, Address, and Birth Date | Position(s) Held with the Trust | Length of Time Served1 | Number of Funds in Fund Complex Overseen by Trustee | Principal Occupation(s) During the Past Five Years | Other Directorships Held by Trustee During the Past Five Years | |||||||
| Interested Trustee | ||||||||||||
| Shawn K. Lytle2 100 Independence 610 Market Street Philadelphia, PA 19106-2354 February 1970 | President, Chief Executive Officer, and Trustee | President and Chief Executive Officer since August 2015
Trustee since September 2015 | 128 | Macquarie Asset Management3 (2015–Present) -Global Head of Macquarie Asset Management Public Investments (2019–Present) -Head of Americas of Macquarie Group (2017–Present) -Deputy Global Head of Macquarie Asset Management (2017–2019) -Head of Macquarie Asset Management Americas (2015–2017) | None | |||||||
| Independent Trustees | ||||||||||||
| Jerome D. Abernathy 100 Independence 610 Market Street Philadelphia, PA 19106-2354 July 1959 | Trustee | Since January 2019 | 128 | Stonebrook Capital Management, LLC (financial technology: macro factors and databases) -Managing Member (1993-Present) | None | |||||||
| Thomas L. Bennett 100 Independence 610 Market Street Philadelphia, PA 19106-2354 October 1947 | Trustee | Trustee since March 2005 Chair from March 2015 to August 2022 | 128 | Private Investor (2004–Present) | None | |||||||
Ann D. Borowiec 610 Market Street | Trustee | Since March 2015 | 128 | J.P. Morgan Chase & Co. (1987-2013) -Chief Executive Officer, Private Wealth Management (2011–2013) | Banco Santander International (2016–2019) Santander Bank, N.A. (2016-2019) | |||||||
Joseph W. Chow 610 Market Street Philadelphia, PA | Trustee | Since January 2013 | 128 | Private Investor (2011–Present) | None | |||||||
245
Board of trustees and officers addendum
Delaware Funds by Macquarie®
| Name, Address, and Birth Date | Position(s) Held with the Trust | Length of Time Served1 | Number of Funds in Fund Complex Overseen by Trustee | Principal Occupation(s) During the Past Five Years | Other Directorships Held by Trustee During the Past Five Years | |||||||
| H. Jeffrey Dobbs 100 Independence 610 Market Street Philadelphia, PA 19106-2354 May 1955 | Trustee | Since April 20194 | 128 | KPMG LLP (2002-2015) -Global Sector Chairman, Industrial Manufacturing (2010-2015) | TechAccel LLC (2015–Present) | |||||||
| John A. Fry 100 Independence 610 Market Street Philadelphia, PA 19106-2354 May 1960 | Trustee | Since January 2001 | 128 | Drexel University -President (2010–Present) | Federal Reserve Bank of Philadelphia (2020–Present) FS Credit Real Estate Income Trust, Inc. (2018–Present) vTv Therapeutics Inc. (2017–Present) Community Health Systems (2004–Present) Drexel Morgan & Co. (2015–2019) | |||||||
| Joseph Harroz, Jr. 100 Independence 610 Market Street Philadelphia, PA 19106-2354 January 1967 | Trustee | Since November 19984 | 128 | University of Oklahoma -President (2020–Present) -Interim President (2019–2020) -Vice President and Dean, College of Law (2010–2019) Brookhaven Investments LLC (commercial enterprises) -Managing Member (2019–Present) St. Clair, LLC (commercial enterprises) -Managing Member (2019–Present) | OU Medicine, Inc. (2020–Present) Big 12 Athletic Conference (2019-Present) Valliance Bank (2007–Present) Ivy Funds Complex (1998-2021) |
246
| Name, Address, and Birth Date | Position(s) Held with the Trust | Length of Time Served1 | Number of Funds in Fund Complex Overseen by Trustee | Principal Occupation(s) During the Past Five Years | Other Directorships Held by Trustee During the Past Five Years | |||||||
Sandra A.J. Lawrence | Trustee | Since April 20194 | 128 | Children’s Mercy Hospitals and Clinics (2005–2019) -Chief Administrative Officer (2016–2019) | Brixmor Property Group Inc. (2021-Present) Sera Prognostics Inc. (biotechnology) (2021-Present) Recology (resource recovery) (2021-Present) Evergy, Inc., Kansas City Power & Light Company, KCP&L Greater Missouri Operations Company, Westar Energy, Inc. and Kansas Gas and Electric Company (related utility companies) (2018-Present) National Association of Corporate Directors (2017-Present) Ivy Funds Complex (2019-2021) American Shared Hospital Services (medical device) (2017-2021) Westar Energy (utility) (2004-2018) | |||||||
| Frances A. Sevilla-Sacasa 100 Independence 610 Market Street Philadelphia, PA 19106-2354 January 1956 | Trustee | Since September 2011 | 128 | Banco Itaú International -Chief Executive Officer (2012–2016) | Florida Chapter of National Association of Corporate Directors (2021-Present) Callon Petroleum Company (2019-Present) Camden Property Trust (2011-Present) New Senior Investment Group Inc. (2021) Carrizo Oil & Gas, Inc. (2018-2019) | |||||||
| Thomas K. Whitford 100 Independence 610 Market Street Philadelphia, PA 19106-2354 March 1956 | Chair and Trustee | Since January 2013 Chair since August 2022 | 128 | PNC Financial Services Group (1983–2013) -Vice Chairman (2009- 2013) | HSBC USA Inc. | |||||||
| Christianna Wood 100 Independence 610 Market Street Philadelphia, PA 19106-2354 August 1959 | Trustee | Since January 2019 | 128 | Gore Creek Capital, Ltd. -Chief Executive Officer and President (2009–Present) | The Merger Fund (2013–2021), The Merger Fund VL (2013–2021), WCM Alternatives: Event-Driven Fund (2013–2021), and WCM Alternatives: Credit Event Fund (2017–2021) Grange Insurance (2013–Present) H&R Block Corporation (2008–Present) |
247
Board of trustees and officers addendum
Delaware Funds by Macquarie®
| Name, Address, and Birth Date | Position(s) Held with the Trust | Length of Time Served1 | Number of Funds in Fund Complex Overseen by Trustee | Principal Occupation(s) During the Past Five Years | Other Directorships Held by Trustee During the Past Five Years | |||||||
| Janet L. Yeomans 100 Independence 610 Market Street Philadelphia, PA 19106-2354 July 1948 | Trustee | Since April 1999 | 128 | 3M Company (1995-2012) -Vice President and Treasurer (2006–2012) | Okabena Company (2009–2017) | |||||||
| Officers | ||||||||||||
David F. Connor December 1963 | Senior Vice President, General Counsel, and Secretary | Senior Vice President, since May 2013; General Counsel since May 2015; Secretary since October 2005 | 128 | David F. Connor has served in various capacities at different times at Macquarie Asset Management. | None5 | |||||||
Daniel V. Geatens 100 Independence | Senior Vice President and Treasurer | Senior Vice President and Treasurer since October 2007 | 128 | Daniel V. Geatens has served in various capacities at different times at Macquarie Asset Management. | None5 | |||||||
Richard Salus 100 Independence Philadelphia, PA | Senior Vice President and Chief Financial Officer | Senior Vice President and Chief Financial Officer since November 2006 | 128 | Richard Salus has served in various capacities at different times at Macquarie Asset Management. | None | |||||||
1 “Length of Time Served” refers to the time since the Trustee or officer began serving one or more of the Trusts in the Delaware Funds complex.
2 Shawn K. Lytle is considered to be an “Interested Trustee” because he is an executive officer of the Funds investment advisor.
3 Macquarie Asset Management is the marketing name for certain companies comprising the asset management division of Macquarie Group, including the Funds’ investment advisor, principal underwriter, and transfer agent.
4 Includes time served on the Board of Ivy Funds prior to the date when Ivy Funds joined the Delaware Funds complex.
5 David F. Connor serves as Senior Vice President and Secretary, and Daniel V. Geatens serves as Senior Vice President, Treasurer, and Chief Financial Officer, for the six portfolios of the Optimum Fund Trust, which have the same investment manager, principal underwriter, and transfer agent as the Funds. Mr. Geatens also serves as the Chief Financial Officer and Treasurer for Macquarie Global Infrastructure Total Return Fund Inc., which has the same investment manager as the Funds.
The Statement of Additional Information for the Fund(s) includes additional information about the Trustees and Officers and is available, without charge, upon request by calling 800 523-1918.
248
Board of directors/trustees Shawn K. Lytle President and Delaware Funds by Macquarie® Jerome D. Abernathy Managing Member, Thomas L. Bennett Private Investor Ann D. Borowiec Former Chief Executive Officer Joseph W. Chow Private Investor John A. Fry President Frances A. Sevilla-Sacasa Former Chief Executive Officer Thomas K. Whitford Chairman of the Board | Christianna Wood Chief Executive Officer and President Janet L. Yeomans Former Vice President and Treasurer Affiliated officers David F. Connor Senior Vice President, Daniel V. Geatens Senior Vice President and Treasurer Richard Salus Senior Vice President and This annual report is for the information of Delaware Ivy California Municipal High Income Fund, Delaware Ivy Corporate Bond Fund, Delaware Ivy Crossover Credit Fund, Delaware Ivy Emerging Markets Local Currency Debt Fund, Delaware Ivy Government Securities Fund, Delaware Ivy High Yield Fund, Delaware Ivy International Small Cap Fund, Delaware Ivy Multi-Asset Income Fund, Delaware Ivy Strategic Income Fund, and Delaware Ivy Total Return Bond Fund shareholders, but it may be used with prospective investors when preceded or accompanied by the Delaware Fund fact sheet for the most recently completed calendar quarter. These documents are available at delawarefunds.com/literature. | Each Fund files its complete schedule of portfolio holdings with the Securities and Exchange Commission (SEC) for the first and third quarters of each fiscal year on Form N-PORT. Each Fund’s Forms N-PORT, as well as a description of the policies and procedures that the Funds use to determine how to vote proxies (if any) relating to portfolio securities, are available without charge (i) upon request, by calling 800 523-1918; and (ii) on the SEC’s website at sec.gov. In addition, a description of the policies and procedures that the Funds use to determine how to vote proxies (if any) relating to portfolio securities and the Schedules of Investments included in the Funds’ most recent Forms N-PORT are available without charge on the Funds’ website at delawarefunds.com/literature. Information (if any) regarding how the Funds voted proxies relating to portfolio securities during the most recently disclosed 12-month period ended June 30 is available without charge (i) through the Funds’ website at delawarefunds.com/proxy; and (ii) on the SEC’s website at sec.gov. |
249
 |
Annual report
Delaware Sustainable Equity Income Fund
(formerly, Delaware Ivy S&P 500 Dividend Aristocrats Index Fund)
September 30, 2022
Carefully consider the Fund’s investment objectives, risk factors, charges, and expenses before investing. This and other information can be found in the Fund’s prospectus and its summary prospectus, which may be obtained by visiting delawarefunds.com/literature or calling 800 523-1918. Investors should read the prospectus and the summary prospectus carefully before investing.
You can obtain shareholder reports and prospectuses online instead of in the mail.
Visit delawarefunds.com/edelivery.
Experience Delaware Funds by Macquarie®
Macquarie Asset Management (MAM) is a global asset manager that aims to deliver positive impact for everyone. MAM Public Investments traces its roots to 1929 and partners with institutional and individual clients to deliver specialist active investment capabilities across global equities, fixed income, and multi-asset solutions using a conviction-based, long-term approach to investing. In the US, retail investors recognize our Delaware Funds by Macquarie family of funds as one of the oldest mutual fund families.
If you are interested in learning more about creating an investment plan, contact your financial advisor.
You can learn more about Delaware Funds or obtain a prospectus for Delaware Sustainable Equity Income Fund at delawarefunds.com/literature.
Manage your account online
| ● | Check your account balance and transactions |
| ● | View statements and tax forms |
| ● | Make purchases and redemptions |
Visit delawarefunds.com/account-access.
Macquarie Asset Management (MAM) is the asset management division of Macquarie Group. MAM is a full-service asset manager offering a diverse range of products across public and private markets including fixed income, equities, multi-asset solutions, private credit, infrastructure, renewables, natural assets, real estate, and asset finance. The Public Investments business is a part of MAM and includes the following investment advisers: Macquarie Investment Management Business Trust (MIMBT), Macquarie Funds Management Hong Kong Limited, Macquarie Investment Management Austria Kapitalanlage AG, Macquarie Investment Management Global Limited, Macquarie Investment Management Europe Limited, and Macquarie Investment Management Europe S.A.
The Fund is distributed by Delaware Distributors, L.P. (DDLP), an affiliate of MIMBT and Macquarie Group Limited.
Other than Macquarie Bank Limited ABN 46 008 583 542 (“Macquarie Bank”), any Macquarie Group entity noted in this document is not an authorized deposit-taking institution for the purposes of the Banking Act 1959 (Commonwealth of Australia). The obligations of these other Macquarie Group entities do not represent deposits or other liabilities of Macquarie Bank. Macquarie Bank does not guarantee or otherwise provide assurance in respect of the obligations of these other Macquarie Group entities. In addition, if this document relates to an investment, (a) the investor is subject to investment risk including possible delays in repayment and loss of income and principal invested and (b) none of Macquarie Bank or any other Macquarie Group entity guarantees any particular rate of return on or the performance of the investment, nor do they guarantee repayment of capital in respect of the investment.
The Fund is governed by US laws and regulations.
Unless otherwise noted, views expressed herein are current as of September 30, 2022, and subject to change for events occurring after such date.
The Fund is not FDIC insured and is not guaranteed. It is possible to lose the principal amount invested.
Advisory services provided by Delaware Management Company, a series of MIMBT, a US registered investment advisor.
All third-party marks cited are the property of their respective owners.
© 2022 Macquarie Management Holdings, Inc.
| Portfolio management review | |
| Delaware Sustainable Equity Income Fund | September 30, 2022 (Unaudited) |
| Performance preview (for the year ended September 30, 2022) | |||||
| Delaware Sustainable Equity Income Fund (Class I shares) | 1-year return | -7.18% | |||
| Delaware Sustainable Equity Income Fund (Class A shares) | 1-year return | -7.48% | |||
| Russell 1000® Value Index (benchmark) | 1-year return | -11.36% | |||
| S&P 500® Dividend Aristocrats® Total Return Index (benchmark) | 1-year return | -7.69% |
Past performance does not guarantee future results.
For complete, annualized performance for Delaware Sustainable Equity Income Fund, please see the table on page 4.
Class I shares are not subject to a sales charge and are offered for sale exclusively to certain eligible investors. In addition, Class I shares pay no distribution and service fee.
The performance of Class A shares excludes the applicable sales charge. The performance of both Class I shares and Class A shares reflects the reinvestment of all distributions.
Please see page 6 for a description of the indices. Index performance returns do not reflect any management fees, transaction costs, or expenses. Indices are unmanaged and one cannot invest directly in an index.
Investment objective
The Fund seeks long-term growth of capital and current income.
Effective on August 1, 2022, the Fund’s name changed to Delaware Sustainable Equity Income Fund (formerly, Delaware Ivy S&P 500 Dividend Aristocrats Index Fund), and the Fund’s investment objective, investment strategies, and benchmark also changed. In connection with these changes, the Fund now seeks to invest its assets in equity securities of companies that meet the Fund’s sustainable investment criteria. These changes may result in higher portfolio turnover in the near term as the portfolio management team purchases and sells securities to reflect the Fund’s repositioning. A higher portfolio turnover is likely to cause the Fund to realize capital gains and incur transaction costs. You should consult your financial advisor about the changes that will result from the repositioning.
Effective August 1, 2022, the Russell 1000 Value Index replaced the S&P 500 Dividend Aristocrats Total Return Index, the Fund’s prior benchmark index, due to the repositioning of the Fund as an actively managed, sustainable large-cap focused,
| ● | On August 1, 2022, Delaware Ivy S&P 500 Dividend Aristocrats Index Fund was repositioned as Delaware Sustainable Equity Income Fund. |
1
Portfolio management review
Delaware Sustainable Equity Income Fund
equity income fund. The Russell 1000 Value Index, the Fund’s new index, measures the performance of the large-cap value segment of the U.S. equity universe. The S&P 500 Dividend Aristocrats Total Return Index, the Fund’s former index, targets companies that are currently members of the S&P 500 Index, have increased dividend payments each year for at least 25 years and meet certain market capitalization and liquidity requirements.
Market review
While markets initially rebounded at the beginning of the third quarter of 2022, stocks declined overall, with the major indices posting losses at quarter end. Leadership in the market shifted from the prior quarter as growth stocks outpaced value stocks and small-capitalization stocks performed better than larger-capitalization stocks. Higher-dividend-yielding stocks on average lagged the overall market, with the S&P 500® High Dividend Index declining more than 10% for the quarter.
The US Federal Reserve’s plan to raise interest rates and normalize monetary policy in an effort to combat inflation remained among the biggest market concerns. Despite strong rhetoric from the Fed and aggressive rate hikes, inflation remained persistent, with US Consumer Price Index (CPI) readings for August exceeding expectations. Current forecasts from market participants indicate that the federal funds rate may exceed 4% during this rate hiking cycle, which is more than 100 basis points (a basis point equals one hundredth of a percentage point) higher than second quarter. In the US, gross domestic product growth dropped for the second consecutive quarter, meeting the technical definition of an economic recession.
Within the Fund
On August 1, 2022, Delaware Ivy S&P 500 Dividend Aristocrats Index Fund was repositioned as Delaware Sustainable Equity Income Fund.
Prior to August 1, 2022, Delaware Ivy S&P 500 Dividend Aristocrats Index Fund utilized a dividend emphasizing, passive index tracking investment strategy. The Fund would seek investment results, before fees and expenses, that tracked the performance of the S&P 500 Dividend Aristocrats Total Return Index, its benchmark for this time period.
As of August 1, 2022, the repositioned Fund, Delaware Sustainable Equity Income Fund, is focused on identifying and investing in companies with products, services or practices that align with the United Nations’ Sustainable Development Goals. It seeks long-term growth of capital and current income. Its benchmark is the Russell 1000 Value Index.
The Fund performance discussed in this commentary is broken into two measurement periods. The first is October 1, 2021 to July 31, 2022 and the second is August 1, 2022 to September 30, 2022. For the first measurement period (October 1, 2021 to July 31, 2022), the Fund tracked its S&P 500 Dividend Aristocrats Total Return Index benchmark as expected, but slightly underperformed its benchmark for the period. The Fund’s Institutional Class shares rose 3.89%. The Fund Class A shares increased 3.56% at net asset value and 0.98% at maximum offering price. These figures reflect all distributions reinvested. During the same period, the Fund’s benchmark rose 4.58%.
The leading detractors for the Fund and index for the period were the consumer discretionary and financials sectors. The leading contributors for both the Fund and index
2
for the period were the energy and utilities sectors.
For the second measurement period (August 1, 2022 to September 30, 2022), the Fund declined, although it slightly outperformed its benchmark, the Russell 1000 Value Index. The Fund’s Institutional Class shares declined 10.66%. The Fund Class A shares fell 10.66% at net asset value and 12.92% at maximum offering price. These figures reflect all distributions reinvested.
During the same period, the Fund’s benchmark declined 11.49%. For complete, annualized performance of Delaware Sustainable Equity Income Fund, please see the table on page 4.
All sectors within the Fund and index posted negative returns for the second measurement period. A mixed bag of overweight and underweight positions as well as the Fund’s cash position led to the Fund’s slight outperformance versus the benchmark.
3
| Performance summary | |
| Delaware Sustainable Equity Income Fund | September 30, 2022 (Unaudited) |
The performance quoted represents past performance and does not guarantee future results. Investment return and principal value of an investment will fluctuate so that shares, when redeemed, may be worth more or less than their original cost. Current performance may be lower or higher than the performance quoted. Performance data current to the most recent month end may be obtained by calling 800 523-1918 or visiting delawarefunds.com/performance.
| Fund and benchmark performance1,2 | Average annual total returns through September 30, 2022 | |||||||
| 1 year | 5 year | 10 year | Lifetime | |||||
| Class A (Est. April 20, 2017) | ||||||||
| Excluding sales charge | -7.48% | +8.17% | — | +8.70% | ||||
| Including sales charge | -9.79% | +7.63% | — | +8.19% | ||||
| Class I (Est. April 20, 2017) | ||||||||
| Excluding sales charge | -7.18% | +8.43% | — | +8.97% | ||||
| Including sales charge | -7.18% | +8.43% | — | +8.97% | ||||
| Class R (Est. April 20, 2017) | ||||||||
| Excluding sales charge | -7.87% | +7.61% | — | +8.16% | ||||
| Including sales charge | -7.87% | +7.61% | — | +8.16% | ||||
| Class R6 (Est. April 20, 2017) | ||||||||
| Excluding sales charge | -7.29%* | +8.43% | — | +8.96% | ||||
| Including sales charge | -7.29% | +8.43% | — | +8.96% | ||||
| Russell 1000 Value Index | -11.36% | +5.29% | — | +5.82%** | ||||
| S&P 500 Dividend Aristocrats Total Return Index | -7.69% | +8.81% | — | +9.37%** | ||||
*Total return for the report period presented in the table differs from the return in “Financial highlights.” The total return presented in the above table is calculated based on the net asset value (NAV) at which shareholder transactions were processed. The total return presented in “Financial highlights” is calculated in the same manner but also takes into account certain adjustments that are necessary under US generally accepted accounting principles required in the annual report.
**The benchmark lifetime returns are calculated using the Fund’s inception date.
1Returns reflect the reinvestment of all distributions and are presented both with and without the applicable sales charges described below. Returns do not reflect the deduction of taxes the shareholder would pay on Fund distributions or redemptions of Fund shares.
Expense limitations were in effect for certain classes during some or all of the periods shown in the “Fund and benchmark performance” table. Expenses for each class are listed on the “Fund expense ratios” table on page 5. Performance would have been lower had expense limitations not been in effect.
Class A shares are sold with a maximum front-end sales charge of 2.50%, and have an
4
annual 12b-1 fee of 0.25% of average daily net assets. Performance for Class A shares, excluding sales charges, assumes that no front-end sales charge applied.
Class I shares are not subject to a sales charge and are offered for sale exclusively to certain eligible investors. In addition, Class I shares pay no distribution and service (12b-1) fee.
Effective July 1, 2021, Class N shares were renamed Class R6 shares. Class R6 shares are available only to certain investors. In addition, Class R6 shares do not pay any service fees, sub-accounting fees, and/or sub-transfer agency fees to any brokers, dealers, or other financial intermediaries. Class R6 shares pay no 12b-1 fee.
Class R shares are available only for certain retirement plan products. They are sold without a sales charge and have an annual 12b-1 fee of 0.50% of average daily net assets.
Investing with a focus on companies that exhibit a commitment to sustainable practices may result in the Fund investing in certain types of companies, industries or sectors that the market may not favor.
Equity securities are subject to price fluctuation and possible loss of principal. There is no guarantee that dividend-paying stocks will continue to pay dividends.
The disruptions caused by natural disasters, pandemics, or similar events could prevent the Fund from executing advantageous investment decisions in a timely manner and could negatively impact the Fund’s ability to achieve its investment objective and the value of the Fund’s investments.
2The Fund’s expense ratios, as described in the most recent prospectus, are disclosed in the following “Fund expense ratios” table. The expense ratios below may differ from the expense ratios in the “Financial highlights” since they are based on different time periods and the expense ratios in the prospectus include acquired fund fees and expenses, if any. See Note 2 in “Notes to financial statements” for additional details. Please see the “Financial highlights” section in this report for the most recent expense ratios.
| Fund expense ratios | Class A | Class I | Class R | Class R6 | ||||
| Total annual operating expenses (without fee waivers) | 0.88% | 0.64% | 1.24% | 0.48% | ||||
| Net expenses (including fee waivers, if any) | 0.74% | 0.50% | 1.22% | 0.48% | ||||
| Type of waiver | Contractual | Contractual | Contractual | Contractual |
5
Performance summary
Delaware Sustainable Equity Income Fund
Performance of a $10,000 investment1
For the period April 20, 2017 (Fund’s inception) through September 30, 2022

| Starting value | Ending value | ||||||||
| S&P 500 Dividend Aristocrats Total Return Index | $ | 10,000 | $ | 16,289 | ||||
 | Delaware Sustainable Equity Income Fund — Class I shares | $ | 10,000 | $ | 15,965 | ||||
 | Delaware Sustainable Equity Income Fund — Class A shares | $9,750 | $ | 15,357 | |||||
 | Russell 1000 Value Index | $ | 10,000 | $ | 13,609 | ||||

1The “Performance of a $10,000 investment” graph assumes $10,000 invested in Class I and Class A shares of the Fund on April 20, 2017, and includes the effect of a 2.50% front-end sales charge (for Class A shares) and the reinvestment of all distributions. The graph does not reflect the deduction of taxes the shareholders would pay on Fund distributions or redemptions of Fund shares. Expense limitations were in effect for some or all of the periods shown. Performance would have been lower had expense limitations not been in effect. Expenses are listed in the “Fund expense ratios” table on page 5. Please note additional details on pages 4 through 7.
The graph also assumes $10,000 invested in the Russell 1000 Value Index and S&P 500 Dividend Aristocrats Total Return Index as of April 20, 2017.
The Russell 1000 Value Index measures the performance of the large-cap value segment of the US equity universe. It includes those Russell 1000 companies with lower price-to-book ratios and lower forecasted growth values.
Frank Russell Company is the source and owner of the trademarks, service marks, and copyrights related to the Russell Indexes. Russell® is a trademark of Frank Russell Company.
The S&P 500 Dividend Aristocrats Total Return Index measures the performance of S&P 500 companies that have increased dividends every year for the last 25 consecutive years.
6
The index treats each constituent as a distinct investment opportunity without regard to its size by equally weighting each company.
The S&P 500 High Dividend Index measures the performance of 80 high yield companies within the S&P 500 and is equally weighted to best represent the performance of this group, regardless of constituent size.
Index performance returns do not reflect any management fees, transaction costs, or expenses. Indices are unmanaged and one cannot invest directly in an index. Past performance does not guarantee future results.
Performance of other Fund classes will vary due to different charges and expenses.
| Nasdaq symbols | CUSIPs | |||
| Class A | IDAAX | 46600A641 | ||
| Class I | IDAIX | 46600A617 | ||
| Class R | IDARX | 46600A583 | ||
| Class R6 | IDANX | 46600A591 |
7
Disclosure of Fund expenses
For the six-month period from April 1, 2022 to September 30, 2022 (Unaudited)
As a shareholder of the Fund, you incur two types of costs: (1) transaction costs, including sales charges (loads) on purchase payments, reinvested dividends, or other distributions; redemption fees; and exchange fees; and (2) ongoing costs, including management fees; distribution and service (12b-1) fees; and other Fund expenses. This example is intended to help you understand your ongoing costs (in dollars) of investing in the Fund and to compare these costs with the ongoing costs of investing in other mutual funds.
The example is based on an investment of $1,000 invested at the beginning of the period and held for the entire six-month period from April 1, 2022 to September 30, 2022.
Actual expenses
The first section of the table shown, “Actual Fund return,” provides information about actual account values and actual expenses. You may use the information in this section of the table, together with the amount you invested, to estimate the expenses that you paid over the period. Simply divide your account value by $1,000 (for example, an $8,600 account value divided by $1,000 = 8.6), then multiply the result by the number in the first section under the heading entitled “Expenses Paid During Period” to estimate the expenses you paid on your account during this period.
Hypothetical example for comparison purposes
The second section of the table shown, “Hypothetical 5% return,” provides information about hypothetical account values and hypothetical expenses based on the Fund’s actual expense ratio and an assumed rate of return of 5% per year before expenses, which is not the Fund’s actual return. The hypothetical account values and expenses may not be used to estimate the actual ending account balance or expenses you paid for the period. You may use this information to compare the ongoing costs of investing in the Fund and other funds. To do so, compare this 5% hypothetical example with the 5% hypothetical examples that appear in the shareholder reports of the other funds.
Please note that the expenses shown in the table are meant to highlight your ongoing costs only and do not reflect any transactional costs, such as sales charges (loads), redemption fees, or exchange fees. Therefore, the second section of the table is useful in comparing ongoing costs only, and will not help you determine the relative total costs of owning different funds. In addition, if these transactional costs were included, your costs would have been higher. The Fund’s expenses shown in the table reflect fee waivers in effect and assume reinvestment of all dividends and distributions.
8
Delaware Sustainable Equity Income Fund
Expense analysis of an investment of $1,000
| Beginning Account Value 4/1/22 | Ending Account Value 9/30/22 | Annualized Expense Ratio | Expenses Paid During Period 4/1/22 to 9/30/22* | |||||||||||||
| Actual Fund return† | ||||||||||||||||
| Class A | $ | 1,000.00 | $857.90 | 0.74 | % | $ | 3.45 | |||||||||
| Class I | 1,000.00 | 859.20 | 0.50 | % | 2.33 | |||||||||||
| Class R | 1,000.00 | 855.80 | 1.22 | % | 5.68 | |||||||||||
| Class R6 | 1,000.00 | 859.40 | 0.48 | % | 2.24 | |||||||||||
| Hypothetical 5% return (5% return before expenses) | ||||||||||||||||
| Class A | $ | 1,000.00 | $1,021.36 | 0.74 | % | $ | 3.75 | |||||||||
| Class I | 1,000.00 | 1,022.56 | 0.50 | % | 2.54 | |||||||||||
| Class R | 1,000.00 | 1,018.95 | 1.22 | % | 6.17 | |||||||||||
| Class R6 | 1,000.00 | 1,022.66 | 0.48 | % | 2.43 | |||||||||||
*“Expenses Paid During Period” are equal to the Fund’s annualized expense ratio, multiplied by the average account value over the period, multiplied by 183/365 (to reflect the one-half year period).
†Because actual returns reflect only the most recent six-month period, the returns shown may differ significantly from fiscal year returns.
In addition to the Fund’s expenses reflected above, the Fund also indirectly bears its portion of the fees and expenses of any investment companies (Underlying Funds) in which it invests. The table above does not reflect the expenses of any Underlying Funds.
9
| Security type / sector allocations and top 10 equity holdings | |
| Delaware Sustainable Equity Income Fund | As of September 30, 2022 (Unaudited) |
Sector designations may be different from the sector designations presented in other Fund materials.
| Security type / sector | Percentage of net assets | |||
| Common Stocks | 100.10 | % | ||
| Communication Services | 8.23 | % | ||
| Consumer Discretionary | 6.13 | % | ||
| Consumer Staples | 7.53 | % | ||
| Energy | 6.73 | % | ||
| Financials | 18.76 | % | ||
| Healthcare | 18.23 | % | ||
| Industrials | 10.66 | % | ||
| Information Technology | 8.72 | % | ||
| Materials | 3.93 | % | ||
| REIT Diversified | 0.75 | % | ||
| REIT Healthcare | 0.46 | % | ||
| REIT Industrial | 0.60 | % | ||
| REIT Mall | 0.39 | % | ||
| REIT Multifamily | 0.80 | % | ||
| REIT Office | 0.79 | % | ||
| REIT Shopping Center | 1.13 | % | ||
| Utilities | 6.26 | % | ||
| Securities Lending Collateral | 0.58 | % | ||
| Total Value of Securities | 100.68 | % | ||
| Obligation to Return Securities Lending Collateral | (0.58 | %) | ||
| Liabilities Net of Receivables and Other Assets | (0.10 | %) | ||
| Total Net Assets | 100.00 | % | ||
Holdings are for informational purposes only and are subject to change at any time. They are not a recommendation to buy, sell, or hold any security.
| Top 10 equity holdings | Percentage of net assets | |||
| Johnson & Johnson | 2.91 | % | ||
| JPMorgan Chase & Co. | 2.29 | % | ||
| Pioneer Natural Resources | 2.27 | % | ||
| Hess | 2.16 | % | ||
| Pfizer | 1.63 | % | ||
| Bank of America | 1.62 | % | ||
| Medtronic | 1.61 | % | ||
| Cisco Systems | 1.53 | % | ||
| Abbott Laboratories | 1.49 | % | ||
| Raytheon Technologies | 1.46 | % | ||
10
| Schedule of investments | |
| Delaware Sustainable Equity Income Fund | September 30, 2022 |
| Number of shares | Value (US $) | |||||||
| Common Stocks – 100.10% | ||||||||
| Communication Services – 8.23% | ||||||||
| Alphabet Class A † | 7,570 | $ | 724,071 | |||||
| Alphabet Class C † | 7,820 | 751,893 | ||||||
| AT&T | 83,050 | 1,273,987 | ||||||
| Interpublic Group of Companies | 47,330 | 1,211,648 | ||||||
| Meta Platforms Class A † | 9,550 | 1,295,744 | ||||||
| Netflix † | 2,980 | 701,611 | ||||||
| Omnicom Group | 12,770 | 805,659 | ||||||
| Paramount Global Class B * | 19,270 | 366,901 | ||||||
| T-Mobile US † | 4,560 | 611,815 | ||||||
| Verizon Communications | 38,360 | 1,456,529 | ||||||
| Walt Disney † | 17,980 | 1,696,054 | ||||||
| 10,895,912 | ||||||||
| Consumer Discretionary – 6.13% | ||||||||
| Aptiv † | 4,630 | 362,112 | ||||||
| Best Buy | 6,020 | 381,307 | ||||||
| eBay | 13,180 | 485,156 | ||||||
| Ford Motor | 44,650 | 500,080 | ||||||
| General Motors | 19,640 | 630,248 | ||||||
| Hanesbrands | 59,720 | 415,651 | ||||||
| Hilton Worldwide Holdings | 4,550 | 548,821 | ||||||
| Home Depot | 3,890 | 1,073,407 | ||||||
| McDonald’s | 7,810 | 1,802,079 | ||||||
| Starbucks | 8,560 | 721,266 | ||||||
| Target | 3,960 | 587,624 | ||||||
| Whirlpool | 4,520 | 609,341 | ||||||
| 8,117,092 | ||||||||
| Consumer Staples – 7.53% | ||||||||
| Archer-Daniels-Midland | 5,100 | 410,295 | ||||||
| Coca-Cola | 14,670 | 821,813 | ||||||
| General Mills | 9,800 | 750,778 | ||||||
| Kellogg | 13,330 | 928,568 | ||||||
| Keurig Dr Pepper | 11,790 | 422,318 | ||||||
| Kimberly-Clark | 6,100 | 686,494 | ||||||
| Kraft Heinz | 12,860 | 428,881 | ||||||
| PepsiCo | 10,550 | 1,722,393 | ||||||
| Procter & Gamble | 14,960 | 1,888,700 | ||||||
| Walmart | 14,680 | 1,903,996 | ||||||
| 9,964,236 | ||||||||
11
Schedule of investments
Delaware Sustainable Equity Income Fund
| Number of shares | Value (US $) | |||||||
| Common Stocks (continued) | ||||||||
| Energy – 6.73% | ||||||||
| Baker Hughes | 68,350 | $ | 1,432,616 | |||||
| Hess | 26,270 | 2,863,167 | ||||||
| Pioneer Natural Resources | 13,870 | 3,003,271 | ||||||
| Schlumberger | 44,890 | 1,611,551 | ||||||
| 8,910,605 | ||||||||
| Financials – 18.76% | ||||||||
| Aflac | 16,970 | 953,714 | ||||||
| American Express | 6,730 | 907,944 | ||||||
| American International Group | 12,620 | 599,198 | ||||||
| Bank of America | 70,850 | 2,139,670 | ||||||
| Bank of New York Mellon | 16,550 | 637,506 | ||||||
| BlackRock | 2,090 | 1,150,085 | ||||||
| Capital One Financial | 6,500 | 599,105 | ||||||
| Chubb | 8,540 | 1,553,255 | ||||||
| Citigroup | 21,900 | 912,573 | ||||||
| Fifth Third Bancorp | 35,520 | 1,135,219 | ||||||
| Goldman Sachs Group | 2,990 | 876,220 | ||||||
| JPMorgan Chase & Co. | 28,970 | 3,027,365 | ||||||
| Lazard Class A * | 12,010 | 382,278 | ||||||
| MetLife | 9,100 | 553,098 | ||||||
| Moody’s | 2,120 | 515,393 | ||||||
| Morgan Stanley | 13,730 | 1,084,807 | ||||||
| Northern Trust | 6,090 | 521,060 | ||||||
| Popular | 12,990 | 936,060 | ||||||
| Prudential Financial | 6,990 | 599,602 | ||||||
| S&P Global | 5,420 | 1,654,997 | ||||||
| State Street | 8,470 | 515,061 | ||||||
| T Rowe Price Group * | 16,790 | 1,763,118 | ||||||
| US Bancorp | 29,420 | 1,186,215 | ||||||
| Voya Financial | 10,260 | 620,730 | ||||||
| 24,824,273 | ||||||||
| Healthcare – 18.23% | ||||||||
| Abbott Laboratories | 20,410 | 1,974,872 | ||||||
| AbbVie | 5,920 | 794,523 | ||||||
| AmerisourceBergen | 4,080 | 552,146 | ||||||
| Becton Dickinson and Co. | 1,770 | 394,409 | ||||||
| Boston Scientific † | 10,810 | 418,671 | ||||||
| Bristol-Myers Squibb | 21,810 | 1,550,473 | ||||||
| Centene † | 8,450 | 657,495 | ||||||
| Cigna | 3,610 | 1,001,667 | ||||||
12
| Number of shares | Value (US $) | |||||||
| Common Stocks (continued) | ||||||||
| Healthcare (continued) | ||||||||
| CVS Health | 17,360 | $ | 1,655,623 | |||||
| Danaher | 2,120 | 547,575 | ||||||
| Elevance Health | 890 | 404,274 | ||||||
| Eli Lilly & Co. | 1,400 | 452,690 | ||||||
| Gilead Sciences | 9,690 | 597,776 | ||||||
| Johnson & Johnson | 23,560 | 3,848,762 | ||||||
| McKesson | 1,860 | 632,158 | ||||||
| Medtronic | 26,340 | 2,126,955 | ||||||
| Merck & Co. | 15,270 | 1,315,052 | ||||||
| Moderna † | 3,480 | 411,510 | ||||||
| Pfizer | 49,230 | 2,154,305 | ||||||
| Regeneron Pharmaceuticals † | 620 | 427,099 | ||||||
| Thermo Fisher Scientific | 3,070 | 1,557,073 | ||||||
| Viatris | 77,400 | 659,448 | ||||||
| 24,134,556 | ||||||||
| Industrials – 10.66% | ||||||||
| 3M | 5,040 | 556,920 | ||||||
| AECOM | 8,270 | 565,420 | ||||||
| Boeing † | 3,070 | 371,716 | ||||||
| Carrier Global | 14,840 | 527,710 | ||||||
| CSX | 20,860 | 555,710 | ||||||
| Dover | 8,780 | 1,023,572 | ||||||
| Eaton | 4,100 | 546,776 | ||||||
| Emerson Electric | 7,080 | 518,398 | ||||||
| Fortive | 9,090 | 529,947 | ||||||
| Honeywell International | 3,810 | 636,156 | ||||||
| Ingersoll Rand | 11,840 | 512,198 | ||||||
| Johnson Controls International | 10,710 | 527,146 | ||||||
| ManpowerGroup | 6,580 | 425,660 | ||||||
| Nielsen Holdings | 28,400 | 787,248 | ||||||
| Norfolk Southern | 3,820 | 800,863 | ||||||
| Northrop Grumman | 910 | 427,991 | ||||||
| Otis Worldwide | 7,720 | 492,536 | ||||||
| Owens Corning | 6,960 | 547,126 | ||||||
| PACCAR | 7,820 | 654,456 | ||||||
| Parker-Hannifin | 2,270 | 550,044 | ||||||
| Raytheon Technologies | 23,600 | 1,931,896 | ||||||
| Uber Technologies † | 23,440 | 621,160 | ||||||
| 14,110,649 | ||||||||
13
Schedule of investments
Delaware Sustainable Equity Income Fund
| Number of shares | Value (US $) | |||||||
| Common Stocks (continued) | ||||||||
| Information Technology – 8.72% | ||||||||
| Advanced Micro Devices † | 6,590 | $ | 417,542 | |||||
| Akamai Technologies † | 6,510 | 522,883 | ||||||
| Amdocs | 7,240 | 575,218 | ||||||
| Analog Devices | 5,970 | 831,860 | ||||||
| Cisco Systems | 50,830 | 2,033,200 | ||||||
| Cognizant Technology Solutions Class A | 8,980 | 515,811 | ||||||
| GoDaddy Class A † | 7,620 | 540,106 | ||||||
| Hewlett Packard Enterprise | 36,450 | 436,671 | ||||||
| Intel | 40,650 | 1,047,550 | ||||||
| International Business Machines | 8,690 | 1,032,459 | ||||||
| Juniper Networks | 16,300 | 425,756 | ||||||
| Marvell Technology | 9,650 | 414,082 | ||||||
| Micron Technology | 12,110 | 606,711 | ||||||
| PayPal Holdings † | 9,250 | 796,147 | ||||||
| Salesforce † | 9,390 | 1,350,658 | ||||||
| 11,546,654 | ||||||||
| Materials – 3.93% | ||||||||
| Albemarle | 1,500 | 396,660 | ||||||
| Amcor | 37,860 | 406,238 | ||||||
| Dow | 13,710 | 602,280 | ||||||
| Ecolab | 5,060 | 730,765 | ||||||
| FMC | 5,470 | 578,179 | ||||||
| Freeport-McMoRan | 21,680 | 592,514 | ||||||
| International Flavors & Fragrances | 5,190 | 471,408 | ||||||
| LyondellBasell Industries Class A | 5,710 | 429,849 | ||||||
| Mosaic | 8,630 | 417,088 | ||||||
| Newmont | 13,660 | 574,130 | ||||||
| 5,199,111 | ||||||||
| REIT Diversified – 0.75% | ||||||||
| Digital Realty Trust | 4,010 | 397,712 | ||||||
| Weyerhaeuser | 20,940 | 598,046 | ||||||
| 995,758 | ||||||||
| REIT Healthcare – 0.46% | ||||||||
| Welltower | 9,440 | 607,181 | ||||||
| 607,181 | ||||||||
| REIT Industrial – 0.60% | ||||||||
| Prologis | 7,770 | 789,432 | ||||||
| 789,432 | ||||||||
14
| Number of shares | Value (US $) | |||||||
| Common Stocks (continued) | ||||||||
| REIT Mall – 0.39% | ||||||||
| Simon Property Group | 5,730 | $ | 514,268 | |||||
| 514,268 | ||||||||
| REIT Multifamily – 0.80% | ||||||||
| AvalonBay Communities | 2,900 | 534,151 | ||||||
| UDR | 12,510 | 521,792 | ||||||
| 1,055,943 | ||||||||
| REIT Office – 0.79% | ||||||||
| Boston Properties | 7,090 | 531,537 | ||||||
| Vornado Realty Trust * | 22,030 | 510,215 | ||||||
| 1,041,752 | ||||||||
| REIT Shopping Center – 1.13% | ||||||||
| Brixmor Property Group | 27,030 | 499,244 | ||||||
| Kimco Realty | 27,020 | 497,438 | ||||||
| Regency Centers | 9,340 | 502,959 | ||||||
| 1,499,641 | ||||||||
| Utilities – 6.26% | ||||||||
| AES | 25,030 | 565,678 | ||||||
| American Electric Power | 6,160 | 532,532 | ||||||
| American Water Works | 3,840 | 499,814 | ||||||
| Constellation Energy | 6,080 | 505,795 | ||||||
| Dominion Energy | 9,310 | 643,414 | ||||||
| Edison International | 6,510 | 368,336 | ||||||
| Entergy | 5,090 | 512,207 | ||||||
| Exelon | 15,110 | 566,021 | ||||||
| NextEra Energy | 18,230 | 1,429,414 | ||||||
| Public Service Enterprise Group | 6,680 | 375,616 | ||||||
| Sempra Energy | 4,560 | 683,727 | ||||||
| Southern | 14,260 | 969,680 | ||||||
| Vistra | 30,230 | 634,830 | ||||||
| 8,287,064 | ||||||||
| Total Common Stocks (cost $137,044,971) | 132,494,127 | |||||||
| Total Value of Securities Before Securities Lending Collateral–100.10% (cost $137,044,971) | 132,494,127 | |||||||
15
Schedule of investments
Delaware Sustainable Equity Income Fund
| Number of shares | Value (US $) | |||||||
| Securities Lending Collateral** – 0.58% | ||||||||
| Money Market Mutual Fund – 0.58% | ||||||||
| Dreyfus Institutional Preference Government Money Market Fund - Institutional Shares (seven-day effective yield 2.98%) | 766,090 | $ | 766,090 | |||||
| Total Securities Lending Collateral (cost $766,090) | 766,090 | |||||||
| Total Value of Securities–100.68% (cost $137,811,061) | $ | 133,260,217■ | ||||||
| † | Non-income producing security. |
| * | Fully or partially on loan. |
| ** | See Note 9 in “Notes to financial statements” for additional information on securities lending collateral. |
| ■ | Includes $3,022,512 of securities loaned for which the counterparty pledged additional non-cash collateral valued at $2,358,258. |
Summary of abbreviations:
REIT – Real Estate Investment Trust
S&P – Standard & Poor’s Financial Services LLC
See accompanying notes, which are an integral part of the financial statements.
16
| Statement of assets and liabilities | |
| Delaware Sustainable Equity Income Fund | September 30, 2022 |
| Assets: | ||||
| Investments, at value*,† | $ | 132,494,127 | ||
| Short-term investments held as collateral for loaned securities, at value= | 766,090 | |||
| Receivable for securities sold | 946,035 | |||
| Receivable for fund shares sold | 324,028 | |||
| Dividends receivable | 176,806 | |||
| Other assets | 192 | |||
| Total Assets | 134,707,278 | |||
| Liabilities: | ||||
| Due to custodian | 538,562 | |||
| Obligation to return securities lending collateral | 766,090 | |||
| Payable for fund shares redeemed | 762,811 | |||
| Other accrued expenses | 225,370 | |||
| Administration expenses payable to affiliates | 32,492 | |||
| Investment management fees payable to affiliates | 26,313 | |||
| Distribution fees payable to affiliates | 1,951 | |||
| Total Liabilities | 2,353,589 | |||
| Total Net Assets | $ | 132,353,689 | ||
| Net Assets Consist of: | ||||
| Paid-in capital | $ | 69,956,430 | ||
| Total distributable earnings (loss) | 62,397,259 | |||
| Total Net Assets | $ | 132,353,689 | ||
17
Statement of assets and liabilities
Delaware Sustainable Equity Income Fund
| Net Asset Value | |||||
| Class A: | |||||
| Net assets | $ | 9,035,053 | |||
| Shares of beneficial interest outstanding, unlimited authorization, no par | 714,885 | ||||
| Net asset value per share | $ | 12.64 | |||
| Sales charge | 2.50 | % | |||
| Offering price per share, equal to net asset value per share / (1 - sales charge) | $ | 12.96 | |||
| Class I: | |||||
| Net assets | $ | 123,163,490 | |||
| Shares of beneficial interest outstanding, unlimited authorization, no par | 9,731,390 | ||||
| Net asset value per share | $ | 12.66 | |||
| Class R: | |||||
| Net assets | $ | 46,291 | |||
| Shares of beneficial interest outstanding, unlimited authorization, no par | 3,663 | ||||
| Net asset value per share | $ | 12.64 | |||
| Class R6: | |||||
| Net assets | $ | 108,855 | |||
| Shares of beneficial interest outstanding, unlimited authorization, no par | 8,514 | ||||
| Net asset value per share | $ | 12.79 | |||
| *Investments, at cost | $ | 137,044,971 | |||
| †Including securities on loan | 3,022,512 | ||||
| =Short-term investments held as collateral for loaned securities, at cost | 766,090 | ||||
See accompanying notes, which are an integral part of the financial statements.
18
| Statement of operations | |
| Delaware Sustainable Equity Income Fund | Year ended September 30, 2022 |
| Investment Income: | ||||
| Dividends | $ | 7,782,706 | ||
| Securities lending income | 1,664 | |||
| Foreign tax withheld | (724 | ) | ||
| 7,783,646 | ||||
| Expenses: | ||||
| Investment advisory fees | 1,160,741 | |||
| Distribution expenses – Class A | 16,180 | |||
| Distribution expenses – Class E | 4,288 | |||
| Distribution expenses – Class R | 262 | |||
| Reports and statements to shareholders expenses | 426,603 | |||
| Registration fees | 111,869 | |||
| Accounting and administration expenses | 106,627 | |||
| Dividend disbursing and transfer agent fees and expenses | 59,523 | |||
| Audit and tax fees | 27,973 | |||
| Custodian fees | 20,956 | |||
| Trustees’ fees and expenses | 15,478 | |||
| Legal fees | 7,256 | |||
| Other | 242,740 | |||
| 2,200,496 | ||||
| Less expenses waived | (125,718 | ) | ||
| Less waived distribution expenses – Class A | (8,360 | ) | ||
| Less waived distribution expenses – Class E | (4,288 | ) | ||
| Less expenses paid indirectly | (145 | ) | ||
| Less waived shareholder servicing expenses | (396,689 | ) | ||
| Total operating expenses | 1,665,296 | |||
| Net Investment Income (Loss) | 6,118,350 | |||
| Net Realized and Unrealized Gain (Loss): | ||||
| Net realized gain (loss) on investments | 116,746,018 | |||
| Net change in unrealized appreciation (depreciation) on investments | (117,677,669 | ) | ||
| Net Realized and Unrealized Gain (Loss) | (931,651 | ) | ||
| Net Increase (Decrease) in Net Assets Resulting from Operations | $ | 5,186,699 | ||
See accompanying notes, which are an integral part of the financial statements.
19
Statements of changes in net assets
Delaware Sustainable Equity Income Fund
| Year ended | ||||||||
| 9/30/22 | 9/30/21 | |||||||
| Increase (Decrease) in Net Assets from Operations: | ||||||||
| Net investment income (loss) | $ | 6,118,350 | $ | 8,256,221 | ||||
| Net realized gain (loss) | 116,746,018 | 24,284,684 | ||||||
| Net change in unrealized appreciation (depreciation) | (117,677,669 | ) | 58,832,227 | |||||
| Net increase (decrease) in net assets resulting from operations | 5,186,699 | 91,373,132 | ||||||
| Dividends and Distributions to Shareholders from: | ||||||||
| Distributable earnings: | ||||||||
| Class A | (435,365 | ) | (251,004 | ) | ||||
| Class E | (182,805 | ) | (182,289 | ) | ||||
| Class I | (25,107,296 | ) | (19,825,279 | ) | ||||
| Class R | (4,192 | ) | (58,516 | ) | ||||
| Class R61 | (5,027,098 | ) | (5,081,446 | ) | ||||
| (30,756,756 | ) | (25,398,534 | ) | |||||
| Capital Share Transactions: | ||||||||
| Proceeds from shares sold: | ||||||||
| Class A | 9,437,218 | 1,818,285 | ||||||
| Class E | 392,321 | 678,123 | ||||||
| Class I | 46,963,582 | 77,478,398 | ||||||
| Class R | 148 | 2,905 | ||||||
| Class R61 | 2,775,318 | 1,178,549 | ||||||
| Net asset value of shares issued upon reinvestment of dividends and distributions: | ||||||||
| Class A | 426,511 | 156,665 | ||||||
| Class E | 182,737 | 123,009 | ||||||
| Class I | 24,830,139 | 18,380,463 | ||||||
| Class R | 4,192 | 2,358 | ||||||
| Class R61 | 5,027,098 | 5,081,446 | ||||||
| 90,039,264 | 104,900,201 | |||||||
20
| Year ended | ||||||||
| 9/30/22 | 9/30/21 | |||||||
| Capital Share Transactions (continued): | ||||||||
| Cost of shares redeemed: | ||||||||
| Class A | $ | (3,499,513 | ) | $ | (2,341,994 | ) | ||
| Class E | (2,637,454 | ) | (1,744,694 | ) | ||||
| Class I | (259,742,713 | ) | (110,924,401 | ) | ||||
| Class R | (140 | ) | (1,245,068 | ) | ||||
| Class R61 | (76,041,869 | ) | (29,924,074 | ) | ||||
| (341,921,689 | ) | (146,180,231 | ) | |||||
| Decrease in net assets derived from capital share transactions | (251,882,425 | ) | (41,280,030 | ) | ||||
| Net Increase (Decrease) in Net Assets | (277,452,482 | ) | 24,694,568 | |||||
| Net Assets: | ||||||||
| Beginning of year | 409,806,171 | 385,111,603 | ||||||
| End of year | $ | 132,353,689 | $ | 409,806,171 | ||||
| 1 | Effective July 1, 2021, Class N shares were renamed Class R6 shares. |
See accompanying notes, which are an integral part of the financial statements.
21
Delaware Sustainable Equity Income Fund Class A
Selected data for each share of the Fund outstanding throughout each period were as follows:
| Net asset value, beginning of period |
| Income (loss) from investment operations: |
| Net investment income1 |
| Net realized and unrealized gain (loss) |
| Total from investment operations |
| Less dividends and distributions from: |
| Net investment income |
| Net realized gain |
| Total dividends and distributions |
| Net asset value, end of period |
| Total return3 |
| Ratios and supplemental data: |
| Net assets, end of period (000 omitted) |
| Ratio of expenses to average net assets5 |
| Ratio of expenses to average net assets prior to fees waived5 |
| Ratio of net investment income to average net assets |
| Ratio of net investment income to average net assets prior to fees waived |
| Portfolio turnover |
| 1 | Calculated using average shares outstanding. |
| 2 | Amount is less than $(0.005) per share. |
| 3 | Total return is based on the change in net asset value of a share during the period and assumes reinvestment of dividends and distributions at net asset value and does not reflect the impact of a sales charge. Total return during the period reflects waivers by the manager and/or distributor. Performance would have been lower had the waivers not been in effect. |
| 4 | Net assets reported in millions. |
| 5 | Expense ratios do not include expenses of any investment companies in which the Fund invests. |
| 6 | The Fund’s portfolio turnover rate increased substantially during the year ended September 30, 2022 due to the repositioning of the Fund. |
See accompanying notes, which are an integral part of the financial statements.
22
| Year ended | |||||||||||||||||||
| 9/30/22 | 9/30/21 | 9/30/20 | 9/30/19 | 9/30/18 | |||||||||||||||
| $ | 14.84 | $ | 12.63 | $ | 12.66 | $ | 11.96 | $ | 10.62 | ||||||||||
| 0.25 | 0.25 | 0.24 | 0.21 | 0.21 | |||||||||||||||
| (1.17 | ) | 2.80 | 0.11 | 0.83 | 1.30 | ||||||||||||||
| (0.92 | ) | 3.05 | 0.35 | 1.04 | 1.51 | ||||||||||||||
| (0.37 | ) | (0.26 | ) | (0.23 | ) | (0.22 | ) | (0.17 | ) | ||||||||||
| (0.91 | ) | (0.58 | ) | (0.15 | ) | (0.12 | ) | — | 2 | ||||||||||
| (1.28 | ) | (0.84 | ) | (0.38 | ) | (0.34 | ) | (0.17 | ) | ||||||||||
| $ | 12.64 | $ | 14.84 | $ | 12.63 | $ | 12.66 | $ | 11.96 | ||||||||||
| (7.48% | ) | 24.85% | 2.88% | 9.04% | 14.29% | ||||||||||||||
| $ | 9,035 | $ | 4 | 4 | $ | 4 | 4 | $ | 3 | 4 | $ | 2 | 4 | ||||||
| 0.74% | 0.74% | 0.74% | 0.75% | 0.75% | |||||||||||||||
| 0.93% | 0.88% | 0.84% | 0.89% | 0.81% | |||||||||||||||
| 1.73% | 1.75% | 2.01% | 1.79% | 1.87% | |||||||||||||||
| 1.54% | 1.61% | 1.91% | 1.65% | 1.81% | |||||||||||||||
| 94% | 6 | 29% | 40% | 28% | 27% | ||||||||||||||
23
Financial highlights
Delaware Sustainable Equity Income Fund Class I
Selected data for each share of the Fund outstanding throughout each period were as follows:
| Net asset value, beginning of period |
| Income (loss) from investment operations: |
| Net investment income1 |
| Net realized and unrealized gain (loss) |
| Total from investment operations |
| Less dividends and distributions from: |
| Net investment income |
| Net realized gain |
| Total dividends and distributions |
| Net asset value, end of period |
| Total return3 |
| Ratios and supplemental data: |
| Net assets, end of period (000 omitted) |
| Ratio of expenses to average net assets5 |
| Ratio of expenses to average net assets prior to fees waived5 |
| Ratio of net investment income to average net assets |
| Ratio of net investment income to average net assets prior to fees waived |
| Portfolio turnover |
| 1 | Calculated using average shares outstanding. |
| 2 | Amount is less than $(0.005) per share. |
| 3 | Total return is based on the change in net asset value of a share during the period and assumes reinvestment of dividends and distributions at net asset value. Total return during the period reflects waivers by the manager and/or distributor. Performance would have been lower had the waivers not been in effect. |
| 4 | Net assets reported in millions. |
| 5 | Expense ratios do not include expenses of any investment companies in which the Fund invests. |
| 6 | The Fund’s portfolio turnover rate increased substantially during the year ended September 30, 2022 due to the repositioning of the Fund. |
See accompanying notes, which are an integral part of the financial statements.
24
| Year ended | |||||||||||||||||||
| 9/30/22 | 9/30/21 | 9/30/20 | 9/30/19 | 9/30/18 | |||||||||||||||
| $ | 14.83 | $ | 12.63 | $ | 12.67 | $ | 11.96 | $ | 10.62 | ||||||||||
| 0.27 | 0.29 | 0.27 | 0.24 | 0.24 | |||||||||||||||
| (1.15 | ) | 2.78 | 0.10 | 0.84 | 1.30 | ||||||||||||||
| (0.88 | ) | 3.07 | 0.37 | 1.08 | 1.54 | ||||||||||||||
| (0.38 | ) | (0.29 | ) | (0.26 | ) | (0.25 | ) | (0.20 | ) | ||||||||||
| (0.91 | ) | (0.58 | ) | (0.15 | ) | (0.12 | ) | — | 2 | ||||||||||
| (1.29 | ) | (0.87 | ) | (0.41 | ) | (0.37 | ) | (0.20 | ) | ||||||||||
| $ | 12.66 | $ | 14.83 | $ | 12.63 | $ | 12.67 | $ | 11.96 | ||||||||||
| (7.18% | ) | 25.05% | 3.07% | 9.39% | 14.56% | ||||||||||||||
| $ | 123,164 | $ | 334 | 4 | $ | 297 | 4 | $ | 301 | 4 | $ | 282 | 4 | ||||||
| 0.50% | 0.50% | 0.50% | 0.50% | 0.50% | |||||||||||||||
| 0.68% | 0.64% | 0.64% | 0.69% | 0.65% | |||||||||||||||
| 1.85% | 2.00% | 2.21% | 2.04% | 2.14% | |||||||||||||||
| 1.67% | 1.86% | 2.07% | 1.85% | 1.99% | |||||||||||||||
| 94% | 6 | 29% | 40% | 28% | 27% | ||||||||||||||
25
Financial highlights
Delaware Sustainable Equity Income Fund Class R
Selected data for each share of the Fund outstanding throughout each period were as follows:
| Net asset value, beginning of period |
| Income (loss) from investment operations: |
| Net investment income1 |
| Net realized and unrealized gain (loss) |
| Total from investment operations |
| Less dividends and distributions from: |
| Net investment income |
| Net realized gain |
| Total dividends and distributions |
| Net asset value, end of period |
| Total return3 |
| Ratios and supplemental data: |
| Net assets, end of period (000 omitted) |
| Ratio of expenses to average net assets7 |
| Ratio of expenses to average net assets prior to fees waived7 |
| Ratio of net investment income to average net assets |
| Ratio of net investment income to average net assets prior to fees waived |
| Portfolio turnover |
| 1 | Calculated using average shares outstanding. |
| 2 | Amount is less than $(0.005) per share. |
| 3 | Total return is based on the change in net asset value of a share during the period and assumes reinvestment of dividends and distributions at net asset value. |
| 4 | Total return during the period reflects waivers by the manager and/or distributor. Performance would have been lower had the waivers not been in effect. |
| 5 | Net assets reported in millions. |
| 6 | Rounds to less than $500 thousands. |
| 7 | Expense ratios do not include expenses of any investment companies in which the Fund invests. |
| 8 | The Fund’s portfolio turnover rate increased substantially during the year ended September 30, 2022 due to the repositioning of the Fund. |
See accompanying notes, which are an integral part of the financial statements.
26
| Year ended | |||||||||||||||||||
| 9/30/22 | 9/30/21 | 9/30/20 | 9/30/19 | 9/30/18 | |||||||||||||||
| $ | 14.85 | $ | 12.62 | $ | 12.65 | $ | 11.95 | $ | 10.62 | ||||||||||
| 0.17 | 0.17 | 0.19 | 0.15 | 0.15 | |||||||||||||||
| (1.15 | ) | 2.79 | 0.10 | 0.83 | 1.29 | ||||||||||||||
| (0.98 | ) | 2.96 | 0.29 | 0.98 | 1.44 | ||||||||||||||
| (0.32 | ) | (0.15 | ) | (0.17 | ) | (0.16 | ) | (0.11 | ) | ||||||||||
| (0.91 | ) | (0.58 | ) | (0.15 | ) | (0.12 | ) | — | 2 | ||||||||||
| (1.23 | ) | (0.73 | ) | (0.32 | ) | (0.28 | ) | (0.11 | ) | ||||||||||
| $ | 12.64 | $ | 14.85 | $ | 12.62 | $ | 12.65 | $ | 11.95 | ||||||||||
| (7.87% | )4 | 24.14% | 2.37% | 8.50% | 4 | 13.61% | |||||||||||||
| $ | 46 | $ | — | 5,6 | $ | 1 | 5 | $ | 1 | 5 | $ | 1 | 5 | ||||||
| 1.22% | 1.24% | 1.19% | 1.26% | 1.26% | |||||||||||||||
| 1.28% | 1.24% | 1.19% | 1.28% | 1.26% | |||||||||||||||
| 1.18% | 1.22% | 1.53% | 1.28% | 1.35% | |||||||||||||||
| 1.12% | 1.22% | 1.53% | 1.26% | 1.35% | |||||||||||||||
| 94% | 8 | 29% | 40% | 28% | 27% | ||||||||||||||
27
Financial highlights
Delaware Sustainable Equity Income Fund Class R6
Selected data for each share of the Fund outstanding throughout each period were as follows:
| Net asset value, beginning of period |
| Income (loss) from investment operations: |
| Net investment income1 |
| Net realized and unrealized gain (loss) |
| Total from investment operations |
| Less dividends and distributions from: |
| Net investment income |
| Net realized gain |
| Total dividends and distributions |
| Net asset value, end of period |
| Total return3 |
| Ratios and supplemental data: |
| Net assets, end of period (000 omitted) |
| Ratio of expenses to average net assets6 |
| Ratio of expenses to average net assets prior to fees waived6 |
| Ratio of net investment income to average net assets |
| Ratio of net investment income to average net assets prior to fees waived |
| Portfolio turnover |
| 1 | Calculated using average shares outstanding. |
| 2 | Amount is less than $(0.005) per share. |
| 3 | Total return is based on the change in net asset value of a share during the period and assumes reinvestment of dividends and distributions at net asset value. |
| 4 | Total return during the period reflects waivers by the manager and/or distributor. Performance would have been lower had the waivers not been in effect. |
| 5 | Net assets reported in millions. |
| 6 | Expense ratios do not include expenses of any investment companies in which the Fund invests. |
| 7 | The Fund’s portfolio turnover rate increased substantially during the year ended September 30, 2022 due to the repositioning of the Fund. |
See accompanying notes, which are an integral part of the financial statements.
28
| Year ended | |||||||||||||||||||
| 9/30/22 | 9/30/21 | 9/30/20 | 9/30/19 | 9/30/18 | |||||||||||||||
| $ | 14.84 | $ | 12.63 | $ | 12.67 | $ | 11.96 | $ | 10.62 | ||||||||||
| 0.28 | 0.29 | 0.27 | 0.24 | 0.25 | |||||||||||||||
| (1.17 | ) | 2.79 | 0.10 | 0.84 | 1.29 | ||||||||||||||
| (0.89 | ) | 3.08 | 0.37 | 1.08 | 1.54 | ||||||||||||||
| (0.25 | ) | (0.29 | ) | (0.26 | ) | (0.25 | ) | (0.20 | ) | ||||||||||
| (0.91 | ) | (0.58 | ) | (0.15 | ) | (0.12 | ) | — | 2 | ||||||||||
| (1.16 | ) | (0.87 | ) | (0.41 | ) | (0.37 | ) | (0.20 | ) | ||||||||||
| $ | 12.79 | $ | 14.84 | $ | 12.63 | $ | 12.67 | $ | 11.96 | ||||||||||
| (7.21% | )4 | 25.16% | 3.07% | 9.40% | 4 | 14.56% | |||||||||||||
| $ | 109 | $ | 70 | 5 | $ | 80 | 5 | $ | 86 | 5 | $ | 93 | 5 | ||||||
| 0.48% | 0.48% | 0.50% | 0.50% | 0.49% | |||||||||||||||
| 0.52% | 0.48% | 0.50% | 0.53% | 0.49% | |||||||||||||||
| 1.86% | 2.02% | 2.24% | 2.03% | 2.17% | |||||||||||||||
| 1.82% | 2.02% | 2.24% | 2.00% | 2.17% | |||||||||||||||
| 94% | 7 | 29% | 40% | 28% | 27% | ||||||||||||||
29
| Notes to financial statements | |
| Delaware Sustainable Equity Income Fund | September 30, 2022 |
Ivy Funds (Trust) is organized as a Delaware statutory trust and offers 39 series. These financial statements and the related notes pertain to Delaware Sustainable Equity Income Fund (formerly, Delaware Ivy S&P 500 Dividend Aristocrats Index Fund). The Trust is an open-end investment company. The Fund is considered diversified under the Investment Company Act of 1940, as amended (1940 Act). The Fund offers Class A, Class I, Class R and Class R6 shares. On June 13, 2022, all Class E shares were liquidated. Class A shares are subject to an initial sales charge. You will have to pay a limited contingent deferred sales charge (Limited CDSC) of 1.00% if you redeem Class A shares purchased after July 1, 2021 that are subject to a CDSC, within the first 12 months after your purchase, unless a specific waiver of the Limited CDSC applies. Class I shares, Class R shares and Class R6 shares are not subject to a sales charge and are offered for sale exclusively to certain eligible investors. In addition, Class R6 shares do not pay any service fees, sub-accounting fees, and/or sub-transfer agency fees to any brokers, dealers, or other financial intermediaries.
1. Significant Accounting Policies
The Fund follows accounting and reporting guidance under Financial Accounting Standards Board (FASB) Accounting Standards Codification Topic 946, Financial Services — Investment Companies. The following accounting policies are in accordance with US generally accepted accounting principles (US GAAP) and are consistently followed by the Fund.
Security Valuation — Equity securities, except those traded on the Nasdaq Stock Market LLC (Nasdaq), are valued at the last quoted sales price as of the time of the regular close of the New York Stock Exchange on the valuation date. Equity securities traded on the Nasdaq are valued in accordance with the Nasdaq Official Closing Price, which may not be the last sales price. If, on a particular day, an equity security does not trade, the mean between the bid and the ask prices will be used, which approximates fair value. Equity securities listed on a foreign exchange are normally valued at the last quoted sales price on the valuation date. Open-end investment companies are valued at their published net asset value (NAV). Generally, other securities and assets for which market quotations are not readily available are valued at fair value as determined in good faith by the Fund’s valuation designee, Delaware Management Company (DMC). Subject to the oversight of the Fund’s Board of Trustees (Board), DMC, as valuation designee, has adopted policies and procedures to fair value securities that are not readily available consistent with the requirements of Rule 2a-5 under the 1940 Act. In determining whether market quotations are readily available or fair valuation will be used, various factors will be taken into consideration, such as market closures or suspension of trading in a security. Restricted securities and private placements are valued at fair value.
Federal Income Taxes — No provision for federal income taxes has been made as the Fund intends to continue to qualify for federal income tax purposes as a regulated investment company under Subchapter M of the Internal Revenue Code of 1986, as amended, and make the requisite distributions to shareholders. The Fund evaluates tax positions taken or expected to be taken in the course of preparing the Fund’s tax returns to determine whether the tax positions are “more-likely-than-not” of being sustained by the applicable tax authority. Tax positions not
30
deemed to meet the “more-likely-than-not” threshold are recorded as a tax benefit or expense in the current year. Management has analyzed the Fund’s tax positions taken or expected to be taken on the Fund’s federal income tax returns through the year ended September 30, 2022, and for all open tax years (years ended September 30, 2019-September 30, 2021), and has concluded that no provision for federal income tax is required in the Fund’s financial statements. If applicable, the Fund recognizes interest accrued on unrecognized tax benefits in interest expense and penalties in “Other” on the “Statement of operations.” During the year ended September 30, 2022, the Fund did not incur any interest or tax penalties.
Class Accounting — Investment income, common expenses, and realized and unrealized gain (loss) on investments are allocated to the various classes of the Fund on the basis of daily net assets of each class. Distribution expenses relating to a specific class are charged directly to that class. Class R6 shares will not be allocated any expenses related to service fees, sub-accounting fees, and/or sub-transfer agency fees paid to brokers, dealers, or other financial intermediaries.
Use of Estimates — The preparation of financial statements in conformity with US GAAP requires management to make estimates and assumptions that affect the fair value of investments, the reported amounts of assets and liabilities and disclosure of contingent assets and liabilities at the date of the financial statements, and the reported amounts of revenues and expenses during the reporting period. Actual results could differ from those estimates and the differences could be material.
Other — Expenses directly attributable to the Fund are charged directly to the Fund. Other expenses common to various funds within the Delaware Funds by Macquarie® (Delaware Funds) are generally allocated among such fund on the basis of average net assets. Management fees and certain other expenses are paid monthly. Security transactions are recorded on the date the securities are purchased or sold (trade date) for financial reporting purposes. Costs used in calculating realized gains and losses on the sale of investment securities are those of the specific securities sold. Dividend income is recorded on the ex-dividend date and interest income is recorded on the accrual basis. Income and capital gain distributions from any investment companies (Underlying Funds) in which the Fund invests are recorded on the ex-dividend date. Distributions received from investments in real estate investment trusts (REITs) are recorded as dividend income on the ex-dividend date, subject to reclassification upon notice of the character of such distributions by the issuer, which are estimated. Foreign dividends are also recorded on the ex-dividend date or as soon after the ex-dividend date that the Fund is aware of such dividends, net of all tax withholdings, a portion of which may be reclaimable. Withholding taxes and reclaims on foreign dividends have been recorded in accordance with the Fund’s understanding of the applicable country’s tax rules and rates. The Fund declares and pays dividends from net investment income and distributions from net realized gain on investments, if any, annually. The Fund may distribute more frequently, if necessary for tax purposes. Dividends and distributions, if any, are recorded on the ex-dividend date.
31
Notes to financial statements
Delaware Sustainable Equity Income Fund
2. Investment Management, Administration Agreements, and Other Transactions with Affiliates
In accordance with the terms of its investment management agreement, the Fund pays Delaware Management Company (DMC), a series of Macquarie Investment Management Business Trust and the investment manager, an annual fee which is calculated daily and paid monthly at the rates of 0.35% of net assets up to $1 billion, 0.33% of net assets over $1 billion and up to $2 billion, 0.31% of net assets over $2 billion and up to $5 billion, and 0.30% of net assets over $5 billion.
DMC has also entered into sub-advisory agreements on behalf of the Fund, as described below, with Macquarie Investment Management Global Limited (MIMGL) and Macquarie Funds Management Hong Kong Limited (MFMHKL), each of which is an affiliate of DMC (the “Affiliated Sub-Advisors”).
MIMGL and MFMHK are a part of Macquarie Asset Management (MAM). Although DMC has principal responsibility for DMC’s portion of the Fund, DMC may seek investment advice and recommendations from MIMGL and DMC may also permit MIMGL to execute Fund security trades on behalf of DMC and exercise investment discretion for securities in certain markets where DMC believes it will be beneficial to utilize MIMGL’s specialized market knowledge. Also, DMC may permit MFMHKL to execute Fund security trades on behalf of DMC.
Pursuant to the terms of the relevant sub-advisory agreement, the investment sub-advisory fee is paid by DMC to each Affiliated Sub-Advisor based on the extent to which an Affiliated Sub-Advisor provides services to the Fund.
Prior to January 18, 2022, the Fund had an Accounting and Administrative Services Agreement with Waddell & Reed Services Company (WRSCO), doing business as WI Services Company (WISC). Under the agreement, WISC acted as the agent in providing bookkeeping and accounting services and assistance to the Fund, including maintenance of Fund records, pricing of Fund shares and preparation of certain shareholder reports. For these services, the Fund paid WISC a monthly fee of one-twelfth of the annual fee based on the average net asset levels shown in the following table:
| (M - Millions) | Annual Fee Rate | ||
| $0 to $10M | $ | 0 | |
| $10 to $25M | 11,496 | ||
| $25 to $50M | 23,100 | ||
| $50 to $100M | 35,496 | ||
| $100 to $200M | 48,396 | ||
| $200 to $350M | 63,204 | ||
| $350 to $550M | 82,500 | ||
| $550 to $750M | 96,300 | ||
| $750 to $1,000M | 121,596 | ||
| Over $1,000M | 148,500 | ||
32
In addition, for each class of shares in excess of one, the Fund paid WISC a monthly per-class fee equal to 2.50% of the monthly accounting services base fee. The Fund also paid WISC a monthly administrative fee at the annual rate of 0.01%, or one basis point, for the first $1 billion of net assets with no fee charged for net assets in excess of $1 billion. This fee was voluntarily waived by WISC until the Fund’s net assets were at least $10 million and is included in “Accounting and administration expenses” on the “Statement of operations.”
Effective January 18, 2022, Delaware Investments Fund Services Company (DIFSC), an affiliate of DMC, provides fund accounting and financial administrative oversight services to the Fund. For these services, DIFSC’s fees are calculated daily and paid monthly, based on the aggregate daily net assets of all funds within the Delaware Funds at the following annual rates: 0.00475% of the first $35 billion; 0.0040% of the next $10 billion; 0.0025% of the next $45 billion; and 0.0015% of aggregate average daily net assets in excess of $90 billion (Total Fee). Each Fund in the Delaware Funds pays a minimum of $4,000, which, in aggregate, is subtracted from the Total Fee. Each Fund then pays its portion of the remainder of the Total Fee on a relative NAV basis. This amount is included on the “Statement of operations” under “Accounting and administration expenses.” From January 18, 2022 through September 30, 2022, the Fund paid $7,506 for these services.
Effective June 27, 2022, DIFSC is also the transfer agent and dividend disbursing agent of the Fund. For these services, DIFSC’s fees are calculated daily and paid monthly, based on the aggregate daily net assets of the retail funds within the Delaware Funds at the following annual rates: 0.014% of the first $20 billion; 0.011% of the next $5 billion; 0.007% of the next $5 billion; 0.004% of the next $20 billion; 0.002% of the next $25 billion; and 0.0015% of average daily net assets in excess of $75 billion. The fees payable to DIFSC under the shareholder services agreement described above are allocated among all retail funds in the Delaware Funds on a relative NAV basis. This amount is included on the “Statement of operations” under “Dividend disbursing and transfer agent fees and expenses.” From June 27, 2022 through September 30, 2022, the Fund paid $3,502 for these services
Pursuant to a sub-transfer agency agreement between DIFSC and BNY Mellon Investment Servicing (US) Inc. (BNYMIS), BNYMIS provides certain sub-transfer agency services to the Fund. Sub-transfer agency fees are paid by the Fund and are also included on the “Statement of operations” under “Dividend disbursing and transfer agent fees and expenses.” These fees are calculated daily and paid as invoices are received on a monthly or quarterly basis.
Under the Shareholder Servicing Agreement between the Trust and WISC (that was in effect until June 27, 2022), with respect to Class A shares, for each shareholder account that was in existence at any time during the prior month, the Fund paid a monthly fee that ranged from $1.5042 to $1.6958 per account; however, WISC had agreed to reduce that fee if the number of total shareholder accounts within the Complex (InvestEd Portfolios and Ivy Funds) reached certain levels. For Class R shares, the Fund paid a monthly fee equal to one-twelfth of 0.25 of 1% of the average daily net assets of the class for the preceding month. For Class I shares, the Fund paid a monthly fee equal to one-twelfth of 0.15 of 1% of the average daily net assets of the
33
Notes to financial statements
Delaware Sustainable Equity Income Fund
2. Investment Management, Administration Agreements, and Other Transactions with Affiliates (continued)
class for the preceding month. For Class R6 shares, the Fund paid WISC a monthly fee equal to one-twelfth of 0.01 of 1% of the average daily net assets of the class for the preceding month. The Fund also reimbursed WISC for certain out-of-pocket costs for all classes.
For certain networked accounts (that is, those accounts whose Fund shares were purchased through certain financial intermediaries), WISC had agreed to reduce its per account fees charged to the Funds to $0.50 per month per shareholder account. Additional fees may have been paid by the Funds to those intermediaries. The Fund would reimburse WISC for such costs if the annual rate of the third-party per account charged for a Fund were less than or equal to $12.00 per account or an annual fee of 0.14 of 1% that is based on average daily net assets.
The Funds may incur costs relating to their initial and ongoing listing on an exchange. Additionally, the Fund may enter into a license agreement for the right to use an Index and its Trademark(s) and to receive data related to the index from the index provider.
Certain broker/dealers that maintained shareholder accounts with the Fund through an omnibus account provided transfer agent and other shareholder-related services that would otherwise have been provided by WISC if the individual accounts that comprised the omnibus account were opened by their beneficial owners directly. The Fund could pay such broker-dealers a per account fee for each open account within the omnibus account (up to $18.00 per account), or a fixed rate fee (up to an annual fee of 0.20 of 1% that is based on average daily net assets), based on the average daily NAV of the omnibus account (or a combination thereof).
Pursuant to a distribution agreement and distribution plan, the Fund pays Delaware Distributors, L.P. (DDLP), the distributor and an affiliate of DMC, annual distribution and service (12b-1) fee of 0.25% and 0.50% of the average daily net assets of the Class A and Class R shares, respectively. The fees are calculated daily and paid monthly. Class I shares and Class R6 shares do not pay 12b-1 fees.
As provided in the investment management agreement, the Fund bears a portion of the cost of certain resources shared with DMC, including the cost of internal personnel of DMC and/or its affiliates that provide legal and regulatory reporting services to the Fund. For the year ended September 30, 2022, the Fund paid $18,463 for internal legal and regulatory reporting services provided by DMC and/or its affiliates’ employees. This amount is included on the “Statement of operations” under “Legal fees.”
From October 1, 2021, DMC and DDLP (through August 1, 2023), WISC (until June 27, 2022) and DIFSC (effective June 27, 2022 through August 1, 2023) have contractually agreed to reimburse sufficient management fees, 12b-1 fees and/or shareholder servicing fees to cap the total annual ordinary fund operating expenses (which would exclude interest, taxes, brokerage commissions, acquired fund fees and expenses and extraordinary expenses, if any) as follows: 0.74% for Class A shares; 0.50% for Class I shares; 1.22% for Class R shares; and
34
0.48% for Class R6 shares. Prior to August 1, 2023, the expense limitation may not be terminated without the consent of the Board. The waivers and reimbursements are accrued daily and received monthly.
For the year ended September 30, 2022, DDLP earned $1,251 for commissions on sales of the Fund’s Class A shares.
Trustees’ fees include expenses accrued by the Fund for each Trustee’s retainer and meeting fees. Certain officers of DMC, DIFSC, and DDLP are officers and/or Trustees of the Trust. These officers and Trustees are paid no compensation by the Fund.
In addition to the management fees and other expenses of the Fund, the Fund indirectly bears the investment management fees and other expenses of any Underlying Funds in which it invests. The amount of these fees and expenses incurred indirectly by the Fund will vary based upon the expense and fee levels of any Underlying Funds and the number of shares that are owned of any Underlying Funds at different times.
3. Investments
For the year ended September 30, 2022, the Fund made purchases and sales of investment securities other than short-term investments as follows:
| Purchases | $ | 307,423,738 | |
| Sales | 582,969,985 |
The tax cost of investments includes adjustments to net unrealized appreciation (depreciation) which may not necessarily be the final tax cost basis adjustments, but approximates the tax basis unrealized gains and losses that may be realized and distributed to shareholders. At September 30, 2022, the cost and unrealized appreciation (depreciation) of investments for federal income tax purposes for the Fund were as follows:
| Cost of investments | $ | 139,356,817 | ||
| Aggregate unrealized appreciation of investments | $ | 9,016,013 | ||
| Aggregate unrealized depreciation of investments | (15,112,613 | ) | ||
| Net unrealized appreciation of investments | $ | (6,096,600 | ) |
US GAAP defines fair value as the price that the Fund would receive to sell an asset or pay to transfer a liability in an orderly transaction between market participants at the measurement date under current market conditions. A three-level hierarchy for fair value measurements has been established based upon the transparency of inputs to the valuation of an asset or liability. Inputs may be observable or unobservable and refer broadly to the assumptions that market participants would use in pricing the asset or liability. Observable inputs reflect the assumptions market participants would use in pricing the asset or liability based on market data obtained from sources independent of the reporting entity. Unobservable inputs reflect the reporting entity’s own assumptions about the assumptions that market participants would use in pricing the asset or liability based on the best information available under the circumstances. The Fund’s
35
Notes to financial statements
Delaware Sustainable Equity Income Fund
3. Investments (continued)
investment in its entirety is assigned a level based upon the observability of the inputs which are significant to the overall valuation. The three-level hierarchy of inputs is summarized as follows:
| Level 1 | — | Inputs are quoted prices in active markets for identical investments. (Examples: equity securities, open-end investment companies, futures contracts, and exchange-traded options contracts) |
| Level 2 | — | Other observable inputs, including, but not limited to: quoted prices for similar assets or liabilities in markets that are active, quoted prices for identical or similar assets or liabilities in markets that are not active, inputs other than quoted prices that are observable for the assets or liabilities (such as interest rates, yield curves, volatilities, prepayment speeds, loss severities, credit risks, and default rates) or other market-corroborated inputs. (Examples: debt securities, government securities, swap contracts, foreign currency exchange contracts, foreign securities utilizing international fair value pricing, broker-quoted securities, and fair valued securities) |
| Level 3 | — | Significant unobservable inputs, including the Fund’s own assumptions used to determine the fair value of investments. (Examples: broker-quoted securities and fair valued securities) |
Level 3 investments are valued using significant unobservable inputs. The Fund may also use an income-based valuation approach in which the anticipated future cash flows of the investment are discounted to calculate fair value. Discounts may also be applied due to the nature or duration of any restrictions on the disposition of the investments. Valuations may also be based upon current market prices of securities that are comparable in coupon, rating, maturity, and industry. The derived value of a Level 3 investment may not represent the value which is received upon disposition and this could impact the results of operations.
The following table summarizes the valuation of the Fund’s investments by fair value hierarchy levels as of September 30, 2022:
| Level 1 | |||
| Securities | |||
| Assets: | |||
| Common Stocks | $ | 132,494,127 | |
| Securities Lending Collateral | 766,090 | ||
| Total Value of Securities | $ | 133,260,217 | |
During the year ended September 30, 2022, there were no transfers into or out of Level 3 investments. The Fund’s policy is to recognize transfers into or out of Level 3 investments based on fair value at the beginning of the reporting period.
A reconciliation of Level 3 investments is presented when the Fund has a significant amount of Level 3 investments at the beginning or end of the year in relation to the Fund’s net assets. During the year ended September 30, 2022, there were no Level 3 investments.
36
4. Dividend and Distribution Information
Income and long-term capital gain distributions are determined in accordance with federal income tax regulations, which may differ from US GAAP. Additionally, distributions from net short-term gains on sales of investment securities are treated as ordinary income for federal income tax purposes. The tax character of dividends and distributions paid during the years ended September 30, 2022 and 2021 were as follows:
| Year ended | |||||||
| 9/30/22 | 9/30/21 | ||||||
| Ordinary income | $ | 16,929,646 | $ | 9,924,398 | |||
| Long-term capital gains | 13,827,110 | 15,474,136 | |||||
| Total | $ | 30,756,756 | $ | 25,398,534 | |||
5. Components of Net Assets on a Tax Basis
As of September 30, 2022, the components of net assets on a tax basis were as follows:
| Shares of beneficial interest | 69,956,430 | |||
| Undistributed ordinary income | 1,349,368 | |||
| Undistributed long-term capital gains | 67,150,294 | |||
| Other temporary differences | (5,803 | ) | ||
| Unrealized appreciation (depreciation) of investments | (6,096,600 | ) | ||
| Net assets | $ | 132,353,689 |
The differences between book basis and tax basis components of net assets are primarily attributable to tax deferral of losses on wash sales.
For financial reporting purposes, capital accounts are adjusted to reflect the tax character of permanent book/tax differences. Reclassifications are primarily due to earnings and profits distributed to shareholders on the redemption of shares. Results of operations and net assets were not affected by these reclassifications. For the year ended September 30, 2022, the adjustments were to decrease total distributable earnings and increase paid-in capital in excess of par by $37,828,346.
37
Notes to financial statements
Delaware Sustainable Equity Income Fund
6. Capital Shares
Transactions in capital shares were as follows:
| Year ended | ||||||||
| 9/30/22 | 9/30/21 | |||||||
| Shares sold: | ||||||||
| Class A | 653,211 | 122,636 | ||||||
| Class E | 26,018 | 47,024 | ||||||
| Class I | 3,146,378 | 5,223,400 | ||||||
| Class R | 10 | 244 | ||||||
| Class R61 | 196,466 | 82,983 | ||||||
| Shares issued upon reinvestment of dividends and distributions: | ||||||||
| Class A | 28,797 | 11,460 | ||||||
| Class E | 12,046 | 9,033 | ||||||
| Class I | 1,643,925 | 1,351,076 | ||||||
| Class R | 279 | 176 | ||||||
| Class R61 | 330,874 | 374,556 | ||||||
| 6,038,004 | 7,222,588 | |||||||
| Shares redeemed: | ||||||||
| Class A | (243,777 | ) | (152,274 | ) | ||||
| Class E | (190,157 | ) | (113,797 | ) | ||||
| Class I | (17,550,558 | ) | (7,692,127 | ) | ||||
| Class R | (9 | ) | (80,246 | ) | ||||
| Class R61 | (5,218,928 | ) | (2,055,600 | ) | ||||
| (23,203,429 | ) | (10,094,044 | ) | |||||
| Net decrease | (17,165,425 | ) | (2,871,456 | ) | ||||
| 1 | Effective July 1, 2021, Class N shares were renamed Class R6 shares. |
Certain shareholders may exchange shares of one class for shares of another class in the same Fund. These exchange transactions are included as subscriptions and redemptions in the table above and on the “Statements of changes in net assets.” For the year ended September 30, 2022, the Fund had the following exchange transactions:
| Exchange Redemptions | Exchange Subscriptions | |||||||||||||||||||
| Class A Shares | Class I Shares | Class A Shares | Class I Shares | Value | ||||||||||||||||
| Year ended | ||||||||||||||||||||
| 9/30/22 | 4,701 | 3,610 | 3,610 | 4,701 | $122,319 | |||||||||||||||
There were no exchange transactions for the year ended September 30, 2021.
38
7. Line of Credit
On November 1, 2021, the Fund was added (by way of amendment) as additional participant to a $355,000,000 revolving line of credit (Agreement). The Agreement also includes certain other funds in the Delaware Funds (Participants) and is intended to be used for temporary or emergency purposes as an additional source of liquidity to fund redemptions of investor shares. Under the amendment to the Agreement, the Participants are charged an annual commitment fee of 0.15%, which is allocated across the Participants based on a weighted average of the respective net assets of each Participant. The Participants are permitted to borrow up to a maximum of one-third of their net assets under the Agreement. Each Participant is individually, and not jointly, liable for its particular advances, if any, under the line of credit. The line of credit available under the Agreement expires on October 31, 2022.
The Fund had no amounts outstanding as of September 30, 2022, or at any time during the period then ended.
8. Interfund Lending Program
Pursuant to an exemptive order issued by the SEC (Order), the Ivy Funds and Ivy Variable Insurance Portfolios (collectively, the Funds only for purposes of this Note 8) have the ability to lend money to, and borrow money from, each other pursuant to a master interfund lending agreement (Interfund Lending Program). Under the Interfund Lending Program, the Funds may lend or borrow money for temporary purposes directly to or from one another (each, an Interfund Loan), subject to meeting the conditions of the Order. The interest rate to be charged on an Interfund Loan is the average of the overnight repurchase agreement rate and the short-term bank loan rate. This program is in existence but is not currently in use. The Funds made no Interfund Loans under the Interfund Lending Program during the year ended September 30, 2022.
9. Securities Lending
The Fund, along with other funds in the Delaware Funds, may lend its securities pursuant to a security lending agreement (Lending Agreement) with The Bank of New York Mellon (BNY Mellon). At the time a security is loaned, the borrower must post collateral equal to the required percentage of the market value of the loaned security, including any accrued interest. The required percentage is: (1) 102% with respect to US securities and foreign securities that are denominated and payable in US dollars; and (2) 105% with respect to foreign securities. With respect to each loan, if on any business day the aggregate market value of securities collateral plus cash collateral held is less than the aggregate market value of the securities which are the subject of such loan, the borrower will be notified to provide additional collateral by the end of the following business day, which, together with the collateral already held, will be not less than the applicable initial collateral requirements for such security loan. If the aggregate market value of securities collateral and cash collateral held with respect to a security loan exceeds the applicable initial collateral requirement, upon the request of the borrower, BNY Mellon must
39
Notes to financial statements
Delaware Sustainable Equity Income Fund
9. Securities Lending (continued)
return enough collateral to the borrower by the end of the following business day to reduce the value of the remaining collateral to the applicable initial collateral requirement for such security loan. As a result of the foregoing, the value of the collateral held with respect to a loaned security on any particular day, may be more or less than the value of the security on loan. The collateral percentage with respect to the market value of the loaned security is determined by the security lending agent.
Cash collateral received by each fund of the Trust is generally invested in a series of individual separate accounts, each corresponding to a Fund. The investment guidelines permit each separate account to hold certain securities that would be considered eligible securities for a money market fund. Cash collateral received is generally invested in government securities; certain obligations issued by government sponsored enterprises; repurchase agreements collateralized by US Treasury securities; obligations issued by the central government of any Organization for Economic Cooperation and Development (OECD) country or its agencies, instrumentalities, or establishments; obligations of supranational organizations; commercial paper, notes, bonds, and other debt obligations; certificates of deposit, time deposits, and other bank obligations; certain money market funds; and asset-backed securities. The Fund can also accept US government securities and letters of credit (non-cash collateral) in connection with securities loans.
In the event of default or bankruptcy by the lending agent, realization and/or retention of the collateral may be subject to legal proceedings. In the event the borrower fails to return loaned securities and the collateral received is insufficient to cover the value of the loaned securities and provided such collateral shortfall is not the result of investment losses, the lending agent has agreed to pay the amount of the shortfall to the Fund or, at the discretion of the lending agent, replace the loaned securities. The Fund continues to record dividends or interest, as applicable, on the securities loaned and is subject to changes in value of the securities loaned that may occur during the term of the loan. The Fund has the right under the Lending Agreement to recover the securities from the borrower on demand. With respect to security loans collateralized by non-cash collateral, the Fund receives loan premiums paid by the borrower. With respect to security loans collateralized by cash collateral, the earnings from the collateral investments are shared among the Fund, the security lending agent, and the borrower. The Fund records security lending income net of allocations to the security lending agent and the borrower.
The Fund may incur investment losses as a result of investing securities lending collateral. This could occur if an investment in the collateral investment account defaulted or became impaired. Under those circumstances, the value of the Fund’s cash collateral account may be less than the amount the Fund would be required to return to the borrowers of the securities and the Fund would be required to make up for this shortfall.
40
The following table reflects a breakdown of transactions accounted for as secured borrowings, the gross obligation by the type of collateral pledged, and the remaining contractual maturity of those transactions as of September 30, 2022:
| Securities Lending Transactions | Overnight and continuous | Under 30 days | Between 30 & 90 days | Over 90 Days | Total | |||||||||||||||
| Money Market Mutual Fund | $766,090 | $— | $— | $— | $766,090 | |||||||||||||||
At September 30, 2022, the value of securities on loan was $3,022,512, for which the Fund received non-cash collateral of $2,358,258. At September 30, 2022, the value of invested collateral was $766,090. Investments purchased with cash collateral are presented on the “Schedule of investments” under the caption “Securities Lending Collateral.”
10. Credit and Market Risk
An outbreak of infectious respiratory illness caused by a novel coronavirus known as COVID-19 was first detected in China in December 2019 and has now been detected globally. This coronavirus has resulted in travel restrictions, closed international borders, enhanced health screenings at ports of entry and elsewhere, disruption of and delays in healthcare service preparation and delivery, prolonged quarantines, cancellations, supply chain disruptions, and lower consumer demand, as well as general concern and uncertainty. The impact of COVID-19, and other infectious illness outbreaks that may arise in the future, could adversely affect the economies of many nations or the entire global economy, individual issuers and capital markets in ways that cannot necessarily be foreseen. In addition, the impact of infectious illnesses in emerging market countries may be greater due to generally less established healthcare systems. Public health crises caused by the COVID-19 outbreak may exacerbate other pre-existing political, social and economic risks in certain countries or globally. The duration of the COVID-19 outbreak and its effects cannot be determined with certainty.
Investments in equity securities in general are subject to market risks that may cause their prices to fluctuate over time. Fluctuations in the value of equity securities in which the Fund invests will cause the NAV of the Fund to fluctuate.
The Fund may invest up to 15% of its net assets in illiquid securities, which may include securities with contractual restrictions on resale, securities exempt from registration under Rule 144A promulgated under the Securities Act of 1933, as amended, and other securities which may not be readily marketable. The relative illiquidity of these securities may impair the Fund from disposing of them in a timely manner and at a fair price when it is necessary or desirable to do so. While maintaining oversight, the Board has delegated to DMC, the day-to-day functions of determining whether individual securities are liquid for purposes of the Fund’s limitation on investments in illiquid securities. Securities eligible for resale pursuant to Rule 144A, which are determined to be liquid, are not subject to the Fund’s 15% limit on investments in illiquid securities. As of September 30, 2022, there were no Rule 144A securities held by the Fund.
41
Notes to financial statements
Delaware Sustainable Equity Income Fund
11. Contractual Obligations
The Fund enters into contracts in the normal course of business that contain a variety of indemnifications. The Fund’s maximum exposure under these arrangements is unknown. However, the Fund has not had prior claims or losses pursuant to these contracts. Management has reviewed the Fund’s existing contracts and expects the risk of loss to be remote.
12. Subsequent Events
On October 31, 2022, the Fund, along with the other Participants, entered into an amendment to the agreement for a $355,000,000 revolving line of credit to be used as described in Note 7 and to be operated in substantially the same manner as the agreement described in Note 7. Under the amendment to the agreement, the Participants are charged an annual commitment fee of 0.15%, which is allocated across the Participants based on a weighted average of the respective net assets of each Participant. The line of credit available under the agreement expires on October 30, 2023.
Management has determined that no other material events or transactions occurred subsequent to September 30, 2022, that would require recognition or disclosure in the Fund’s financial statements.
42
Report of independent registered public accounting firm
To the Board of Trustees of Ivy Funds and Shareholders of Delaware Sustainable Equity Income Fund
Opinion on the Financial Statements
We have audited the accompanying statement of assets and liabilities, including the schedule of investments, of Delaware Sustainable Equity Income Fund (one of the funds constituting Ivy Funds, referred to hereafter as the “Fund”) as of September 30, 2022, the related statement of operations for the year ended September 30, 2022, the statements of changes in net assets for each of the two years in the period ended September 30, 2022, including the related notes, and the financial highlights for each of the two years in the period ended September 30, 2022 (collectively referred to as the “financial statements”). In our opinion, the financial statements present fairly, in all material respects, the financial position of the Fund as of September 30, 2022, the results of its operations for the year then ended, the changes in its net assets for each of the two years in the period ended September 30, 2022 and the financial highlights for each of the two years in the period ended September 30, 2022 in conformity with accounting principles generally accepted in the United States of America.
The financial statements of the Fund as of and for the year ended September 30, 2020 and the financial highlights for each of the periods ended on or prior to September 30, 2020 (not presented herein, other than the financial highlights) were audited by other auditors, whose report dated November 24, 2020, expressed an unqualified opinion on those financial statements and financial highlights.
Basis for Opinion
These financial statements are the responsibility of the Fund’s management. Our responsibility is to express an opinion on the Fund’s financial statements based on our audits. We are a public accounting firm registered with the Public Company Accounting Oversight Board (United States) (PCAOB) and are required to be independent with respect to the Fund in accordance with the U.S. federal securities laws and the applicable rules and regulations of the Securities and Exchange Commission and the PCAOB.
We conducted our audits of these financial statements in accordance with the standards of the PCAOB. Those standards require that we plan and perform the audit to obtain reasonable assurance about whether the financial statements are free of material misstatement, whether due to error or fraud.
Our audits included performing procedures to assess the risks of material misstatement of the financial statements, whether due to error or fraud, and performing procedures that respond to those risks. Such procedures included examining, on a test basis, evidence regarding the amounts and disclosures in the financial statements. Our audits also included evaluating the accounting principles used and significant estimates made by management, as well as evaluating the overall presentation of the financial statements. Our procedures included confirmation of securities owned as of September 30, 2022 by correspondence with the custodian, transfer agents and brokers. We believe that our audits provide a reasonable basis for our opinion.
/s/PricewaterhouseCoopers LLP
Philadelphia, Pennsylvania
November 30, 2022
We have served as the auditor of one or more investment companies in Delaware Funds by Macquarie® since 2010.
43
Other Fund information (Unaudited)
Delaware Sustainable Equity Income Fund
Liquidity Risk Management Program
The Securities and Exchange Commission (the “SEC”) has adopted Rule 22e-4 under the Investment Company Act of 1940 (the “Liquidity Rule”), which requires all open-end funds (other than money market funds) to adopt and implement a program reasonably designed to assess and manage the fund’s “liquidity risk,” defined as the risk that the fund could not meet requests to redeem shares issued by the fund without significant dilution of remaining investors’ interests in the fund.
The Fund has adopted and implemented a liquidity risk management program in accordance with the Liquidity Rule (the “Program”). The Board has designated a member of the US Operational Risk Group of Macquarie Asset Management as the Program Administrator for each Fund in the Trust.
As required by the Liquidity Rule, the Program includes policies and procedures that provide for: (1) assessment, management, and review (no less frequently than annually) of the Fund’s liquidity risk; (2) classification of each of the Fund’s portfolio holdings into one of four liquidity categories (Highly Liquid, Moderately Liquid, Less Liquid, and Illiquid); (3) for funds that do not primarily hold assets that are Highly Liquid, establishing and maintaining a minimum percentage of the Fund’s net assets in Highly Liquid investments (called a “Highly Liquid Investment Minimum” or “HLIM”); and (4) prohibiting the Fund’s acquisition of Illiquid investments if, immediately after the acquisition, the Fund would hold more than 15% of its net assets in Illiquid assets. The Program also requires reporting to the SEC (on a non-public basis) and to the Board if the Fund’s holdings of Illiquid assets exceed 15% of the Fund’s net assets. Funds with HLIMs must have procedures for addressing HLIM shortfalls, including reporting to the Board and, with respect to HLIM shortfalls lasting more than seven consecutive calendar days, reporting to the SEC (on a non-public basis).
In assessing and managing the Fund’s liquidity risk, the Program Administrator considers, as relevant, a variety of factors, including: (1) the Fund’s investment strategy and liquidity of portfolio investments during both normal and reasonably foreseeable stressed conditions; (2) short-term and long-term cash flow projections for the Fund during both normal and reasonably foreseeable stressed conditions; and (3) the Fund’s holdings of cash and cash equivalents and any borrowing arrangements. Classification of the Fund’s portfolio holdings in the four liquidity categories is based on the number of days it is reasonably expected to take to convert the investment to cash (for Highly Liquid and Moderately Liquid holdings) or to sell or dispose of the investment (for Less Liquid and Illiquid investments), in current market conditions without significantly changing the investment’s market value. The Fund primarily holds assets that are classified as Highly Liquid, and therefore is not required to establish an HLIM.
At a meeting of the Board held on May 17-19, 2022, the Program Administrator provided the required written annual report to the Board addressing the Program’s operation and assessing the adequacy and effectiveness of its implementation for the period from April 1, 2021 through March 31, 2022. The report concluded that the Program is appropriately designed and effectively implemented and that it meets the requirements of Rule 22e-4 and the Fund’s liquidity needs. The Fund’s HLIM is set at an appropriate level and the Fund complied with its HLIM at all times during the reporting period.
44
Tax Information
The information set forth below is for the Fund’s fiscal year as required by federal income tax laws. Shareholders, however, must report distributions on a calendar year basis for income tax purposes, which may include distributions for portions of two fiscal years of the Fund.
Accordingly, the information needed by shareholders for income tax purposes will be sent to them in January of each year. Please consult your tax advisor for proper treatment of this information. All disclosures are based on financial information available as of the date of this annual report and, accordingly are subject to change. For any and all items requiring reporting, it is the intention of the Fund to report the maximum amount permitted under the Internal Revenue Code and the regulations thereunder.
For the year ended September 30, 2022, the Fund reports distributions paid during the year as follows:
| (A) Long-Term Capital Gains Distributions (Tax Basis) | 44.96 | % | ||
| (B) Ordinary Income Distributions (Tax Basis)* | 55.04 | % | ||
| Total Distributions (Tax Basis) | 100.00 | % | ||
| (C) Qualifying Dividends1 | 40.15 | % |
(A) and (B) are based on a percentage of the Fund’s total distributions.
(C) is based on the Fund’s ordinary income distributions.
1 Qualified dividends represent dividends which qualify for the corporate dividends received deduction.
* For the fiscal year ended September 30, 2022, certain dividends paid by the Fund may be subject to a maximum tax rate of 20%. The percentage of dividends paid by the Fund from ordinary income reported as qualified income is 42.33%. Complete information will be computed and reported in conjunction with your 2022 Form 1099-DIV.
Board Consideration of Investment Management Agreement and Sub-Advisory Agreements at a Meeting Held August 9-11, 2022
Delaware Sustainable Equity Income Fund
At a meeting held on August 9-11, 2022 (the “Annual Contract Renewal Meeting”), the Board of Trustees (the “Board”), including a majority of Trustees each of whom is not an “interested person” as defined under the Investment Company Act of 1940 (the “Independent Trustees”), approved the renewal of the Delaware Sustainable Equity Income Fund, formerly Delaware Ivy S&P 500 Dividend Aristocrats Index Fund (the “Fund”), Investment Management Agreement with Delaware Management Company (“DMC”) and the Sub-Advisory Agreements with Macquarie Investment Management Global Limited (“MIMGL”) and Macquarie Funds Management Hong Kong Limited (“MFMHKL” and together with MIMGL, the “Affiliated Sub-Advisers”).
Prior to the Meeting, including at a Board meeting held in May 2022, the Trustees conferred extensively among themselves and with representatives of DMC about these matters. Also, the Board was assisted by the applicable Investment Committee, with each Investment Committee assisting the full Board in the discharge of its duties in reviewing investment performance and other matters throughout the year. The Independent Trustees were assisted in their evaluation of
45
Other Fund information (Unaudited)
Delaware Sustainable Equity Income Fund
Board Consideration of Investment Management Agreement and Sub-Advisory Agreements at a Meeting Held August 9-11, 2022
Delaware Sustainable Equity Income Fund (continued)
the Investment Management Agreement and the Sub-Advisory Agreements by independent legal counsel, from whom they received separate legal advice and with whom they met separately.
In providing information to the Board, DMC was guided by a detailed set of requests for information submitted to them by independent legal counsel on behalf of the Independent Trustees at the start of the Board’s annual contract renewal process earlier in 2022. In considering and approving the Investment Management Agreement and the Sub-Advisory Agreements, the Trustees considered the information they believed relevant, including but not limited to the information discussed below. The Board considered not only the specific information presented in connection with the Meeting, but also the knowledge gained over time through interaction with DMC about various topics. In this regard, the Board reviewed reports of DMC at each of its quarterly meetings, which included information about, among other things, Fund performance, investment strategies, and expenses. In addition, the Investment Committees confer with portfolio managers at various times throughout the year. In considering information relating to the approval of the Fund’s Investment Management Agreement and the Sub-Advisory Agreements, the Independent Trustees also received information from an independent fund consultant, JDL Consultants, LLC (“JDL”).
The Board did not identify any particular information or consideration that was all-important or controlling, and each individual Trustee may have attributed different weights to various factors.
After its deliberations, the Board unanimously approved the continuation of the Investment Management Agreement and the Sub-Advisory Agreements for a one-year term. The following summarizes a number of important, but not necessarily all, factors considered by the Board in support of its approval.
Nature, extent, and quality of services. The Board received and considered various information regarding the nature, extent, and quality of the advisory services provided to the Fund by DMC under its Investment Management Agreement, and the experience of the officers and employees of DMC who provide these services, including the Fund’s portfolio managers. The Board’s review included consideration of DMC’s investment process and oversight and research and analysis capabilities, and its ability to attract and retain qualified investment professionals. The Board considered information regarding DMC’s programs for risk management, including investment, operational, liquidity, valuation, and compliance risks. The Board received information with respect to the cybersecurity program and business continuity plans of DMC and its affiliates. The Board also considered non-advisory services that DMC and its affiliates provide to the Delaware Funds, including third party oversight, transfer agent, internal audit, valuation, portfolio trading, and legal and compliance. The Board took into account the benefits to shareholders of investing in a Fund that is part of a family of funds managed by an affiliate of Macquarie Group Ltd. (“Macquarie”), the parent company of DMC, and the resources available to DMC as part of Macquarie’s global asset management business.
46
The Board received and considered various information with respect to the services provided by the Affiliated Sub-Advisers under the Sub-Advisory Agreement and the credentials and experience of the officers and employees of the Affiliated Sub-Advisers who provide these services. The Board considered the division of responsibilities between DMC and the Affiliated Sub-Advisers and the oversight provided by DMC. The Board noted the expertise of the Affiliated Sub-Advisers with respect to certain asset classes and/or investment styles. The Affiliated Sub-Advisers are part of Macquarie’s global investment platform that has offices and personnel that are located around the world. As a result, the Board noted that the Affiliated Sub-Advisers can provide research, investment and trading analysis on the markets and economies of various countries in which the Fund may invest, make recommendations regarding securities and assist with security trades, as applicable. The Board took into account that the Sub-Advisory Agreements may benefit the Fund and its shareholders by permitting DMC to use the resources and talents of the Affiliated Sub-Advisers in managing the Fund.
The Board concluded that, overall, it was satisfied with the nature, extent and quality of services provided (and expected to be provided) to the Fund by DMC and the Affiliated Sub-Advisers.
Investment performance. The Board received and considered information with respect to the investment performance of the Fund, including performance reports and discussions with portfolio managers at meetings of the Board’s Investment Committees throughout the year as well as reports provided by Broadridge Financial Solutions, an independent investment company data provider (“Broadridge”), furnished for the Annual Contract Renewal Meeting. The Broadridge reports prepared for the Fund showed its investment performance in comparison to a group of similar funds (the “Performance Universe”). The Board received a description of the methodology used by Broadridge to select the funds in the Performance Universe. Comparative annualized performance for the Fund was shown for the past 1-, 3-, 5-, 10-year periods and since inception, as applicable, ended December 31, 2021. The Board considered that the Fund was managed by Ivy Investment Management Company prior to the acquisition of its parent company, Waddell & Reed Financial, Inc. and its subsidiaries (the “Transaction”), and that the Fund’s performance prior to the closing of the Transaction on April 30, 2021 is that of its predecessor manager.
The Performance Universe for the Fund consisted of the Fund and all retail and institutional multi-cap value funds, regardless of asset size or primary channel of distribution. The Board noted that the Broadridge report comparison showed that the Fund’s total return for the 1-year period was in the third quartile, for the 3-year period was in the second quartile and for the since inception period was in the first quartile of its Performance Universe. The Fund was below the median for the 1-year period and above the median for the 3-year and since inception periods compared to its Performance Universe. The Board also noted that the Fund slightly underperformed its benchmark index for the 1-, 3- and 5-year periods. The Board noted that the Fund had recently repositioned from an index fund to an actively managed fund and that the investment performance of the current portfolio management team only began as of July 2022.
Comparative expenses. The Board received and considered expense data for the Fund. Management provided the Board with information on pricing levels and fee structures for the Fund as of its most recently completed fiscal year. The Board also considered on the comparative analysis of contractual management fees and actual total expense ratios of the
47
Other Fund information (Unaudited)
Delaware Sustainable Equity Income Fund
Board Consideration of Investment Management Agreement and Sub-Advisory Agreements at a Meeting Held August 9-11, 2022
Delaware Sustainable Equity Income Fund (continued)
Fund versus contractual management fees and actual total expense ratios of a group of similar funds as selected by Broadridge (the “Expense Group”). In reviewing comparative costs, the Fund’s contractual management fee and the actual management fee incurred by the Fund were compared with the contractual management fees (assuming all funds were similar in size to the Fund) and actual management fees, taking into account any applicable breakpoints and fee waivers, with the Fund’s expense universe, which is comprised of the Fund, its Expense Group and all other similar institutional funds, excluding outliers (the “Expense Universe”). The Fund’s total expenses were also compared with those of its Expense Universe. The Broadridge total expenses, for comparative consistency, were shown by Broadridge for Institutional Class shares and comparative total expenses including 12b 1 and non-12b 1 service fees.
The expense comparisons for the Fund showed that its actual management fee was above the median of its Expense Universe and its actual total expenses were above the Expense Group average.
The Board also received and considered information about the nature and extent of services offered and fee rates charged by DMC to other types of clients with investment strategies similar to those of the Fund. In this regard, the Board received information about the significantly greater scope of services, and compliance, reporting and other legal burdens and risks of managing registered investment companies compared with those associated with managing assets of other types of clients, including third-party sub-advised fund clients, unregistered funds and separately managed accounts.
The Board noted that DMC, and not the Fund, pays the sub-advisory fees to the Affiliated Sub-Advisers and, accordingly, that the retention of the Affiliated Sub-Advisers does not increase the fees and expenses incurred by the Fund.
Based on its consideration of the factors and information it deemed relevant, including those described here, the Board determined that the compensation payable to DMC under the Investment Management Agreement and to the Affiliated Sub-Advisers under the Sub-Advisory Agreements was reasonable.
Economies of scale. The Board received and considered information about the potential for DMC to realize economies of scale in the provision of management services to the Fund, the difficulties of calculating economies of scale at an individual Fund level, and the extent to which potential scale benefits are shared with shareholders, including the extent to which any economies of scale are reflected in the level of management fees charged. DMC discussed its advisory fee pricing and structure for the Delaware Funds complex. The Board noted that the Fund may also benefit from economies of scale through initial fee setting, fee waivers and expense reimbursements, as well as DMC’s investment in its business, including investments in business infrastructure, technology and cybersecurity.
48
Management profitability. The Board received and considered the Investment Management Profitability Analysis that addressed the overall profitability of DMC’s business in providing management and other services to the Fund and the Delaware Funds as a whole, including the methodology used by DMC in allocating costs for the purpose of determining profitability. The Board also reviewed a report prepared by JDL regarding DMC’s profitability as compared to certain peer fund complexes and the Independent Trustees discussed DMC’s profitability in such context with representatives from JDL. Based on its review, the Board determined that DMC’s profitability was not excessive in light of the nature, extent and quality of the services provided to the Fund.
Ancillary benefits. The Board received and considered information regarding the extent to which DMC and its affiliates might derive ancillary benefits from fund operations, including the potential for procuring additional business as a result of the prestige and visibility associated with its role as investment manager to the Delaware Funds; the benefits from allocation of fund brokerage to improve trading efficiencies; and the fees that various affiliates received for serving as transfer agent and for overseeing fund accounting and financial administration services to the Delaware Funds. The Board received information from DMC regarding its view of the performance of its affiliates in providing transfer agent and fund accounting and financial administration oversight services and the organizational structure employed to provide these services pursuant to their contracts with the Fund.
Based on its consideration of the factors and information it deemed relevant, including the costs of providing investment management and other services to the Fund and the ongoing commitment of DMC and its affiliates to the Fund, the Board did not find that any ancillary benefits received by DMC and its affiliates were unreasonable.
Conclusion. Based on its review, consideration and evaluation of all factors it believed relevant, including the above-described factors and conclusions, the Board, including all of the Independent Trustees, approved the continuation of DMC’s Investment Management Agreement and the Affiliated Sub-Advisers’ Sub-Advisory Agreements for an additional one-year period.
49
Board of trustees and officers addendum
Delaware Funds by Macquarie®
A mutual fund is governed by a Board of Trustees/Directors (“Trustees”), which has oversight responsibility for the management of a fund’s business affairs. Trustees establish procedures and oversee and review the performance of the investment manager, the distributor, and others who perform services for the fund. The independent fund trustees, in particular, are advocates for shareholder interests. Each trustee has served in that capacity since he or she was elected to or appointed to the Board of Trustees, and will continue to serve until his or her retirement or the election of a new trustee in his or her place. The following is a list of the Trustees and Officers with certain background and related information.
| Name, Address, and Birth Date | Position(s) Held with the Trust | Length of Time Served1 | Number of Funds in Fund Complex Overseen by Trustee | Principal Occupation(s) During the Past Five Years | Other Directorships Held by Trustee During the Past Five Years | |||||
| Interested Trustee | ||||||||||
| Shawn K. Lytle2 100 Independence 610 Market Street Philadelphia, PA 19106-2354 February 1970 | President, Chief Executive Officer, and Trustee | President and Chief Executive Officer since August 2015 Trustee since September 2015 | 128 | Macquarie Asset Management3 (2015–Present) -Global Head of Macquarie Asset Management Public Investments (2019–Present) -Head of Americas of Macquarie Group (2017–Present) -Deputy Global Head of Macquarie Asset Management (2017–2019) -Head of Macquarie Asset Management Americas (2015–2017) | None |
50
| Name, Address, and Birth Date | Position(s) Held with the Trust | Length of Time Served1 | Number of Funds in Fund Complex Overseen by Trustee | Principal Occupation(s) During the Past Five Years | Other Directorships Held by Trustee During the Past Five Years | |||||
| Independent Trustees | ||||||||||
| Jerome D. Abernathy 100 Independence 610 Market Street Philadelphia, PA 19106-2354 July 1959 | Trustee | Since January 2019 | 128 | Stonebrook Capital Management, LLC (financial technology: macro factors and databases) -Managing Member (1993-Present) | None | |||||
| Thomas L. Bennett 100 Independence 610 Market Street Philadelphia, PA 19106-2354 October 1947 | Trustee | Trustee since March 2005 Chair from March 2015 to August 2022 | 128 | Private Investor (2004–Present) | None | |||||
| Ann D. Borowiec 100 Independence 610 Market Street Philadelphia, PA 19106-2354 November 1958 | Trustee | Since March 2015 | 128 | J.P. Morgan Chase & Co. (1987-2013) -Chief Executive Officer, Private Wealth Management (2011–2013) | Banco Santander International (2016–2019) Santander Bank, N.A. (2016-2019) | |||||
51
Board of trustees and officers addendum
Delaware Funds by Macquarie®
| Name, Address, and Birth Date | Position(s) Held with the Trust | Length of Time Served1 | Number of Funds in Fund Complex Overseen by Trustee | Principal Occupation(s) During the Past Five Years | Other Directorships Held by Trustee During the Past Five Years | |||||
| Joseph W. Chow 100 Independence 610 Market Street Philadelphia, PA 19106-2354 January 1953 | Trustee | Since January 2013 | 128 | Private Investor (2011–Present) | None | |||||
| H. Jeffrey Dobbs 100 Independence 610 Market Street Philadelphia, PA 19106-2354 May 1955 | Trustee | Since April 20194 | 128 | KPMG LLP (2002-2015) -Global Sector Chairman, Industrial Manufacturing (2010-2015) | TechAccel LLC (2015–Present) PatientsVoices, Inc. (2018–Present) Valparaiso University Board (2012-Present) Ivy Funds Complex (2019-2021) |
52
| Name, Address, and Birth Date | Position(s) Held with the Trust | Length of Time Served1 | Number of Funds in Fund Complex Overseen by Trustee | Principal Occupation(s) During the Past Five Years | Other Directorships Held by Trustee During the Past Five Years | |||||
| John A. Fry 100 Independence 610 Market Street Philadelphia, PA 19106-2354 May 1960 | Trustee | Since January 2001 | 128 | Drexel University -President (2010–Present) | Federal Reserve Bank of Philadelphia (2020–Present) FS Credit Real Estate Income Trust, Inc. (2018–Present) vTv Therapeutics Inc. (2017–Present) Community Health Systems (2004–Present) Drexel Morgan & Co. (2015–2019) |
53
Board of trustees and officers addendum
Delaware Funds by Macquarie®
| Name, Address, and Birth Date | Position(s) Held with the Trust | Length of Time Served1 | Number of Funds in Fund Complex Overseen by Trustee | Principal Occupation(s) During the Past Five Years | Other Directorships Held by Trustee During the Past Five Years | |||||
| Joseph Harroz, Jr. 100 Independence 610 Market Street Philadelphia, PA 19106-2354 January 1967 | Trustee | Since November 19984 | 128 | University of Oklahoma -President (2020–Present) -Interim President (2019–2020) -Vice President and Dean, College of Law (2010–2019) Brookhaven Investments LLC (commercial enterprises) -Managing Member (2019–Present) St. Clair, LLC (commercial enterprises) -Managing Member (2019–Present) | OU Medicine, Inc. (2020–Present) Big 12 Athletic Conference (2019-Present) Valliance Bank (2007–Present) Ivy Funds Complex (1998-2021) |
54
| Name, Address, and Birth Date | Position(s) Held with the Trust | Length of Time Served1 | Number of Funds in Fund Complex Overseen by Trustee | Principal Occupation(s) During the Past Five Years | Other Directorships Held by Trustee During the Past Five Years | |||||
| Sandra A.J. Lawrence 100 Independence 610 Market Street Philadelphia, PA 19106-2354 September 1957 | Trustee | Since April 20194 | 128 | Children’s Mercy Hospitals and Clinics (2005–2019) -Chief Administrative Officer (2016–2019) | Brixmor Property Group Inc. (2021-Present) Sera Prognostics Inc. (biotechnology) (2021-Present) Recology (resource recovery) (2021-Present) Evergy, Inc., Kansas City Power & Light Company, KCP&L Greater Missouri Operations Company, Westar Energy, Inc. and Kansas Gas and Electric Company (related utility companies) (2018-Present) National Association of Corporate Directors (2017-Present) Ivy Funds Complex (2019-2021) American Shared Hospital Services (medical device) (2017-2021) Westar Energy (utility) (2004-2018) |
55
Board of trustees and officers addendum
Delaware Funds by Macquarie®
| Name, Address, and Birth Date | Position(s) Held with the Trust | Length of Time Served1 | Number of Funds in Fund Complex Overseen by Trustee | Principal Occupation(s) During the Past Five Years | Other Directorships Held by Trustee During the Past Five Years | |||||
| Frances A. Sevilla-Sacasa 100 Independence 610 Market Street Philadelphia, PA 19106-2354 January 1956 | Trustee | Since September 2011 | 128 | Banco Itaú International -Chief Executive Officer (2012–2016) | Florida Chapter of National Association of Corporate Directors (2021-Present) Callon Petroleum Company (2019-Present) Camden Property Trust (2011-Present) New Senior Investment Group Inc. (2021) Carrizo Oil & Gas, Inc. (2018-2019) | |||||
| Thomas K. Whitford 100 Independence 610 Market Street Philadelphia, PA 19106-2354 March 1956 | Chair and Trustee | Since January 2013 Chair since August 2022 | 128 | PNC Financial Services Group (1983–2013) -Vice Chairman (2009-2013) | HSBC USA Inc. (2014–2022) HSBC North America Holdings Inc. (2013–2022) HSBC Finance Corporation (2013–2018) |
56
| Name, Address, and Birth Date | Position(s) Held with the Trust | Length of Time Served1 | Number of Funds in Fund Complex Overseen by Trustee | Principal Occupation(s) During the Past Five Years | Other Directorships Held by Trustee During the Past Five Years | |||||
| Christianna Wood 100 Independence 610 Market Street Philadelphia, PA 19106-2354 August 1959 | Trustee | Since January 2019 | 128 | Gore Creek Capital, Ltd. -Chief Executive Officer and President (2009–Present) | The Merger Fund (2013–2021), The Merger Fund VL (2013–2021), WCM Alternatives: Event-Driven Fund (2013–2021), and WCM Alternatives: Credit Event Fund (2017–2021) Grange Insurance (2013–Present) H&R Block Corporation (2008–Present) |
57
Board of trustees and officers addendum
Delaware Funds by Macquarie®
| Name, Address, and Birth Date | Position(s) Held with the Trust | Length of Time Served1 | Number of Funds in Fund Complex Overseen by Trustee | Principal Occupation(s) During the Past Five Years | Other Directorships Held by Trustee During the Past Five Years | |||||
| Janet L. Yeomans 100 Independence 610 Market Street Philadelphia, PA 19106-2354 July 1948 | Trustee | Since April 1999 | 128 | 3M Company (1995-2012) -Vice President and Treasurer (2006–2012) | Okabena Company (2009–2017) | |||||
| Officers | ||||||||||
| David F. Connor 100 Independence 610 Market Street Philadelphia, PA 19106-2354 December 1963 | Senior Vice President, General Counsel, and Secretary | Senior Vice President, since May 2013; General Counsel since May 2015; Secretary since October 2005 | 128 | David F. Connor has served in various capacities at different times at Macquarie Asset Management. | None5 | |||||
| Daniel V. Geatens 100 Independence 610 Market Street Philadelphia, PA 19106-2354 October 1972 | Senior Vice President and Treasurer | Senior Vice President and Treasurer since October 2007 | 128 | Daniel V. Geatens has served in various capacities at different times at Macquarie Asset Management. | None5 |
58
| Name, Address, and Birth Date | Position(s) Held with the Trust | Length of Time Served1 | Number of Funds in Fund Complex Overseen by Trustee | Principal Occupation(s) During the Past Five Years | Other Directorships Held by Trustee During the Past Five Years | |||||
| Richard Salus 100 Independence 610 Market Street Philadelphia, PA 19106-2354 October 1963 | Senior Vice President and Chief Financial Officer | Senior Vice President and Chief Financial Officer since November 2006 | 128 | Richard Salus has served in various capacities at different times at Macquarie Asset Management. | None |
1 “Length of Time Served” refers to the time since the Trustee or officer began serving one or more of the Trusts in the Delaware Funds complex.
2 Shawn K. Lytle is considered to be an “Interested Trustee” because he is an executive officer of the Funds investment advisor.
3 Macquarie Asset Management is the marketing name for certain companies comprising the asset management division of Macquarie Group, including the Funds’ investment advisor, principal underwriter, and transfer agent.
4 Includes time served on the Board of Ivy Funds prior to the date when Ivy Funds joined the Delaware Funds complex.
5 David F. Connor serves as Senior Vice President and Secretary, and Daniel V. Geatens serves as Senior Vice President, Treasurer, and Chief Financial Officer, for the six portfolios of the Optimum Fund Trust, which have the same investment manager, principal underwriter, and transfer agent as the Funds. Mr. Geatens also serves as the Chief Financial Officer and Treasurer for Macquarie Global Infrastructure Total Return Fund Inc., which has the same investment manager as the Funds.
The Statement of Additional Information for the Fund(s) includes additional information about the Trustees and Officers and is available, without charge, upon request by calling 800 523-1918.
59
Board of trustees
| Shawn K. Lytle President and Chief Executive Officer Delaware Funds by Macquarie® Jerome D. Abernathy Managing Member Stonebrook Capital Management, LLC Thomas L. Bennett Private Investor | Ann D. Borowiec Former Chief Executive Officer Private Wealth Management J.P. Morgan Chase & Co. Joseph W. Chow Private Investor H. Jeffrey Dobbs Former Global Sector Chairman Industrial Manufacturing, KPMG, LLP | John A. Fry President Drexel University Joseph Harroz, Jr. President University of Oklahoma Sandra A.J. Lawrence Former Chief Administrative Officer Children’s Mercy Hospitals and Clinics | Frances A. Sevilla-Sacasa Former Chief Executive Officer Banco Itaú International Thomas K. Whitford Chairman of the Board Delaware Funds by Macquarie Former Vice Chairman PNC Financial Services Group Christianna Wood Chief Executive Officer and President Gore Creek Capital, Ltd. Janet L. Yeomans Former Vice President and Treasurer 3M Company |
Affiliated officers
| David F. Connor Senior Vice President, General Counsel, and Secretary Delaware Funds by Macquarie | Daniel V. Geatens Senior Vice President and Treasurer Delaware Funds by Macquarie | Richard Salus Senior Vice President and Chief Financial Officer Delaware Funds by Macquarie |
This annual report is for the information of Delaware Sustainable Equity Income Fund shareholders, but it may be used with prospective investors when preceded or accompanied by the Delaware Fund fact sheet for the most recently completed calendar quarter. These documents are available at delawarefunds.com/literature.
The Fund files its complete schedule of portfolio holdings with the Securities and Exchange Commission (SEC) for the first and third quarters of each fiscal year on Form N-PORT. The Fund’s Form N-PORT, as well as a description of the policies and procedures that the Fund uses to determine how to vote proxies (if any) relating to portfolio securities, are available without charge (i) upon request, by calling 800 523-1918; and (ii) on the SEC’s website at sec.gov. In addition, a description of the policies and procedures that the Fund uses to determine how to vote proxies (if any) relating to portfolio securities and the Schedule of Investments included in the Fund’s most recent Form N-PORT are available without charge on the Fund’s website at delawarefunds.com/literature.
Information (if any) regarding how the Fund voted proxies relating to portfolio securities during the most recently disclosed 12-month period ended June 30 is available without charge (i) through the Fund’s website at delawarefunds.com/proxy; and (ii) on the SEC’s website at sec.gov.
60
Item 2. Code of Ethics
The registrant has adopted a code of ethics that applies to the registrant’s principal executive officer, principal financial officer, principal accounting officer or controller, or persons performing similar functions, regardless of whether these individuals are employed by the registrant or a third party. A copy of the registrant’s Code of Business Ethics has been posted on the Delaware Funds by Macquarie® Internet Web site at www.delawarefunds.com. Any amendments to the Code of Business Ethics, and information on any waiver from its provisions granted by the registrant, will also be posted on this Web site within five business days of such amendment or waiver and will remain on the Web site for at least 12 months.
Item 3. Audit Committee Financial Expert
The registrant’s Board of Trustees has determined that certain members of the registrant’s Audit Committee are audit committee financial experts, as defined below. For purposes of this item, an “audit committee financial expert” is a person who has the following attributes:
a. An understanding of generally accepted accounting principles and financial statements;
b. The ability to assess the general application of such principles in connection with the accounting for estimates, accruals, and reserves;
c. Experience preparing, auditing, analyzing, or evaluating financial statements that present a breadth and level of complexity of accounting issues that are generally comparable to the breadth and complexity of issues that can reasonably be expected to be raised by the registrant’s financial statements, or experience actively supervising one or more persons engaged in such activities;
d. An understanding of internal controls and procedures for financial reporting; and
e. An understanding of audit committee functions.
An “audit committee financial expert” shall have acquired such attributes through:
a. Education and experience as a principal financial officer, principal accounting officer, controller, public accountant, or auditor or experience in one or more positions that involve the performance of similar functions;
b. Experience actively supervising a principal financial officer, principal accounting officer, controller, public accountant, auditor, or person performing similar functions;
c. Experience overseeing or assessing the performance of companies or public accountants with respect to the preparation, auditing, or evaluation of financial statements; or
d. Other relevant experience.
The registrant’s Board of Trustees has also determined that each member of the registrant’s Audit Committee is independent. In order to be “independent” for purposes of this item, the Audit Committee member may not: (i) other than in his or her capacity as a member of the Board of Trustees or any committee thereof, accept directly or indirectly any consulting, advisory or other compensatory fee from the issuer; or (ii) be an “interested person” of the registrant as defined in Section 2(a)(19) of the Investment Company Act of 1940.
The names of the audit committee financial experts on the registrant’s Audit Committee are set forth below:
H. Jeffrey Dobbs
John A. Fry
Sandra A.J. Lawrence
Frances Sevilla-Sacasa, Chair
Item 4. Principal Accountant Fees and Services
(a) Audit fees.
The aggregate fees billed for services provided to the registrant by its independent auditors for the audit of the registrant’s annual financial statements and for services normally provided by the independent auditors in connection with statutory and regulatory filings or engagements were $432,945 for the fiscal year ended September 30, 2022.
The aggregate fees billed for services provided to the registrant by its independent auditors for the audit of the registrant’s annual financial statements and for services normally provided by the independent auditors in connection with statutory and regulatory filings or engagements were $509,697 for the fiscal year ended September 30, 2021.
(b) Audit-related fees.
The aggregate fees billed by the registrant’s independent auditors for services relating to the performance of the audit of the registrant’s financial statements and not reported under paragraph (a) of this Item were $0 for the fiscal year ended September 30, 2022.
The aggregate fees billed by the registrant’s independent auditors for services relating to the performance of the audit of the financial statements of the registrant’s investment adviser and other service providers under common control with the adviser and that relate directly to the operations or financial reporting of the registrant were $2,050,189 for the registrant’s fiscal year ended September 30, 2022. The percentage of these fees relating to services approved by the registrant’s Audit Committee pursuant to the de minimis exception from the pre-approval requirement in Rule 2-01(c)(7)(i)(C) of Regulation S-X was 0%. These audit-related services were as follows: year end audit procedures; group reporting and subsidiary statutory audits.
The aggregate fees billed by the registrant’s independent auditors for services relating to the performance of the audit of the registrant’s financial statements and not reported under paragraph (a) of this Item were $0 for the fiscal year ended September 30, 2021. These audit-related services were related to the review of Form N-1A.
(c) Tax fees.
The aggregate fees billed by the registrant’s independent auditors for tax-related services provided to the registrant were $72,161 for the fiscal year ended September 30, 2022. The percentage of these fees relating to services approved by the registrant’s Audit Committee pursuant to the de minimis exception from the pre-approval requirement in Rule 2-01(c)(7)(i)(C) of Regulation S-X was 0%. These tax-related services were as follows: review of income tax returns and review of annual excise distribution calculations.
The aggregate fees billed by the registrant’s independent auditors for tax-related services provided to the registrant’s investment adviser and other service providers under common control with the adviser and that relate directly to the operations or financial reporting of the registrant were $0 for the registrant’s fiscal year ended September 30, 2022.
The aggregate fees billed by the registrant’s independent auditors for tax-related services provided to the registrant were $90,080 for the fiscal year ended September 30, 2021. These tax-related services were related to the review of the registrant’s tax returns.
(d) All other fees.
The aggregate fees billed for all services provided by the independent auditors to the registrant other than those set forth in paragraphs (a), (b) and (c) of this Item were $0 for the fiscal year ended September 30, 2022.
The aggregate fees billed for all services other than those set forth in paragraphs (b) and (c) of this Item provided by the registrant’s independent auditors to the registrant’s adviser and other service providers under common control with the adviser and that relate directly to the operations or financial reporting of the registrant were $0 for the registrant’s fiscal year ended September 30, 2022. The percentage of these fees relating to services approved by the registrant’s Audit Committee pursuant to the de minimis exception from the pre-approval requirement in Rule 2-01(c)(7)(i)(C) of Regulation S-X was 0%.
The aggregate fees billed for all services provided by the independent auditors to the registrant other than those set forth in paragraphs (a), (b) and (c) of this Item were $8,224 for the fiscal year ended September 30, 2021.
(e) The registrant’s Audit Committee has established pre-approval policies and procedures as permitted by Rule 2-01(c)(7)(i)(B) of Regulation S-X (the “Pre-Approval Policy”) with respect to services provided by the registrant’s independent auditors. Pursuant to the Pre-Approval Policy, the Audit Committee has pre-approved the services set forth in the table below with respect to the registrant up to the specified fee limits. Certain fee limits are based on aggregate fees to the registrant and other registrants within the Delaware Funds by Macquarie®.
| Service | Range of Fees |
| Audit Services | |
| Statutory audits or financial audits for new Funds | up to $50,000 per Fund |
| Services associated with SEC registration statements (e.g., Form N-1A, Form N-14, etc.), periodic reports and other documents filed with the SEC or other documents issued in connection with securities offerings (e.g., comfort letters for closed-end Fund offerings, consents), and assistance in responding to SEC comment letters | up to $10,000 per Fund |
| Consultations by Fund management as to the accounting or disclosure treatment of transactions or events and/or the actual or potential impact of final or proposed rules, standards or interpretations by the SEC, FASB, or other regulatory or standard-setting bodies (Note: Under SEC rules, some consultations may be considered “audit-related services” rather than “audit services”) | up to $25,000 in the aggregate |
| Audit-Related Services | |
| Consultations by Fund management as to the accounting or disclosure treatment of transactions or events and /or the actual or potential impact of final or proposed rules, standards or interpretations by the SEC, FASB, or other regulatory or standard-setting bodies (Note: Under SEC rules, some consultations may be considered “audit services” rather than “audit-related services”) | up to $25,000 in the aggregate |
| Tax Services | |
| U.S. federal, state and local and international tax planning and advice (e.g., consulting on statutory, regulatory or administrative developments, evaluation of Funds’ tax compliance function, etc.) | up to $25,000 in the aggregate |
| U.S. federal, state and local tax compliance (e.g., excise distribution reviews, etc.) | up to $5,000 per Fund |
| Review of federal, state, local and international income, franchise and other tax returns | up to $5,000 per Fund |
Under the Pre-Approval Policy, the Audit Committee has also pre-approved the services set forth in the table below with respect to the registrant’s investment adviser and other entities controlling, controlled by or under common control with the investment adviser that provide ongoing services to the registrant (the “Control Affiliates”) up to the specified fee limit. This fee limit is based on aggregate fees to the investment adviser and its Control Affiliates.
| Service | Range of Fees |
| Non-Audit Services | |
| Services associated with periodic reports and other documents filed with the SEC and assistance in responding to SEC comment letters | up to $10,000 in the aggregate |
The Pre-Approval Policy requires the registrant’s independent auditors to report to the Audit Committee at each of its regular meetings regarding all services initiated since the last such report was rendered, including those services authorized by the Pre-Approval Policy.
(f) Not applicable.
(g) The aggregate non-audit fees billed by the registrant’s independent auditors for services rendered to the registrant and to its investment adviser and other service providers under common control with the adviser were $9,044,000 and $95,214 for the registrant’s fiscal years ended September 30, 2022 and September 30, 2021, respectively.
(h) In connection with its selection of the independent auditors, the registrant’s Audit Committee has considered the independent auditors’ provision of non-audit services to the registrant’s investment adviser and other service providers under common control with the adviser that were not required to be pre-approved pursuant to Rule 2-01(c)(7)(ii) of Regulation S-X. The Audit Committee has determined that the independent auditors’ provision of these services is compatible with maintaining the auditors’ independence.
Item 5. Audit Committee of Listed Registrants
Not applicable.
Item 6. Investments
(a) Included as part of report to shareholders filed under Item 1 of this Form N-CSR.
(b) Divestment of securities in accordance with Section 13(c) of the Investment Company Act of 1940.
Not applicable.
Item 7. Disclosure of Proxy Voting Policies and Procedures for Closed-End Management Investment Companies
Not applicable.
Item 8. Portfolio Managers of Closed-End Management Investment Companies
Not applicable.
Item 9. Purchases of Equity Securities by Closed-End Management Investment Companies and Affiliated Purchasers
Not applicable.
Item 10. Submission of Matters to a Vote of Security Holders
Not applicable.
Item 11. Controls and Procedures
The registrant’s principal executive officer and principal financial officers, or persons performing similar functions, have concluded that the registrant’s disclosure controls and procedures (as defined in Rule 30a-3(c) under the Investment Company Act of 1940, as amended (17 CFR 270.30a-3(c))) are effective, as of a date within 90 days of the filing of this report, based on their evaluation of these controls and procedures required by Rule 30a-3(b) under the Investment Company Act of 1940 (17 CFR 270.30a-3(b)) and Rules 13a-15(b) or 15d-15(b) under the Securities Exchange Act of 1934, as amended (17 CFR 240.13a-15(b) or 240.15d-15(b)) and provide reasonable assurance that the information required to be disclosed by the registrant in its reports or statements filed under the Securities Exchange Act of 1934 is recorded, processed, summarized and reported within the time periods specified in the rules and forms of the Securities and Exchange Commission.
There were no significant changes in the registrant’s internal control over financial reporting (as defined in Rule 30a-3(d) under the Investment Company Act of 1940 (17 CFR 270.30a-3(d)) that occurred during the period covered by the report to stockholders included herein that have materially affected, or are reasonably likely to materially affect, the registrant’s internal control over financial reporting.
Item 12. Disclosure of Securities Lending Activities for Closed-End Management Investment Companies
Not applicable.
Item 13. Exhibits
(a) (1) Code of Ethics
Not applicable.
(3) Written solicitations to purchase securities pursuant to Rule 23c-1 under the Securities Exchange Act of 1934.
Not applicable.
SIGNATURES
Pursuant to the requirements of the Securities Exchange Act of 1934 and the Investment Company Act of 1940, the registrant has duly caused this report to be signed on its behalf, by the undersigned, thereunto duly authorized.
IVY FUNDS
| /s/SHAWN K. LYTLE | |
| By: | Shawn K. Lytle |
| Title: | President and Chief Executive Officer |
| Date: | December 8, 2022 |
Pursuant to the requirements of the Securities Exchange Act of 1934 and the Investment Company Act of 1940, this report has been signed below by the following persons on behalf of the registrant and in the capacities and on the dates indicated.
| /s/SHAWN K. LYTLE | |
| By: | Shawn K. Lytle |
| Title: | President and Chief Executive Officer |
| Date: | December 8, 2022 |
| /s/RICHARD SALUS | |
| By: | Richard Salus |
| Title: | Chief Financial Officer |
| Date: | December 8, 2022 |